Analysis of Factors Controlling the Onset of Bacterial Biofilms
160
Analysis of Factors Controlling the Onset of Bacterial Biofilms A Dissertation presented to the UNIVERSITY OF PORTO for the degree of Doctor in Chemical and Biological Engineering by Joana M.R. Moreira Supervisor: Prof. Filipe J. Mergulhão Co-supervisors: Prof. Luís F. Melo and Prof. Manuel Simões LEPABE – Laboratory for Process Engineering, Environment, Biotechnology and Energy Department of Chemical Engineering Faculty of Engineering, University of Porto June, 2014
-
Upload
khangminh22 -
Category
Documents
-
view
1 -
download
0
Transcript of Analysis of Factors Controlling the Onset of Bacterial Biofilms

Analysis of Factors Controlling the Onset of Bacterial Biofilms
A Dissertation presented to the UNIVERSITY OF PORTO for the degree of Doctor in
Chemical and Biological Engineering by
Joana M.R. Moreira
Supervisor: Prof. Filipe J. Mergulhão Co-supervisors: Prof. Luís F. Melo and Prof. Manuel Simões
LEPABE – Laboratory for Process Engineering, Environment, Biotechnology and Energy Department of Chemical Engineering
Faculty of Engineering, University of Porto June, 2014


i
“Façamos da interrupção um caminho novo.
Da queda um passo de dança, do medo uma escada,
do sonho uma ponte, da procura um encontro.”
Fernando Sabino

ii

iii
Acknowledgements
First and foremost my thanks go to my supervisor Prof. Filipe Mergulhão for his
guidance, great support, patience and encouragement throughout my research. He was and
remains my best role model for a scientist, mentor, and teacher.
I am also very grateful to my co-supervisors Prof. Luís de Melo and Prof. Manuel
Simões who spared me a lot of their valuable time and gave me constructive suggestions.
I would like to thank all my colleagues from LabE107 and E108, with special thanks
to Carla Ferreira and Paula Araújo for the help and support in the situations of greatest
work and need both inside and outside the lab. Special thanks to Luciana Gomes for being
always available to help me and for her friendship and moral support.
I also would like to thank Paula Pinheiro, and Sílvia Faia for technical support.
To the CEFT group, my colleague Ponmozhi, thank you for all your work. I also
would like to acknowledge Dr. Manuel Alves, Dr. João Miranda and Dr. José Araújo for
the numerical simulations.
I would like to acknowledge the financial support provided by the Portuguese
Foundation for Science and Technology and European Community fund FEDER, trough
Program COMPETE (Project PTDC/EBB-BIO/104940/2008).
To all those in the Department of Chemical Engineering and LEPABE, I would like
to express my sincere thanks for providing excellent working facilities and possibilities to
develop this work.
To my family, António, Helena, Rolando, Né, Xi, Adelaide and Sabino I would like
to thank for the encouragement and motivation that you constantly gave me throughout my
studies and for being good listeners.
To all my friends for providing the support and friendship that I needed. Special
thanks to Cris for sticking by my side, even when I was irritable and depressed, for his
encouraging attitude and for helping me with autocad.
Thank you!
Joana M.R. Moreira

iv

v
Abstract Bacterial biofilms are often regarded as a problem in industrial and biomedical
settings since their formation entails high costs and health risks. However, they can also be used advantageously in engineered systems where they should form rapidly and be stable at the operating conditions. The first step in biofilm formation consists on cell attachment to a pre-conditioned surface. Besides intrinsic factors pertaining to the particular microorganism, the main external factors controlling adhesion are the surface properties and the hydrodynamics. The main goal of this thesis was to understand the effect of those external factors in biofilm formation in order to enable the development of biofilm control strategies to delay the onset of detrimental biofilms or to promote the formation of beneficial biofilms. The Gram-negative bacteria Escherichia coli was chosen as a model organism due to its medical and industrial relevance.
Several in vitro platforms are currently used for biofilms studies including 96-well microtiter plates and flow systems. The hydrodynamic conditions inside them are often poorly understood and therefore computational fluid dynamics (CFD) was used to determine shear stresses and flow velocities in a semi-circular flow cell, in a parallel plate flow chamber (PPFC) and in a 96-well microtiter plate. After this study, the effect of different surfaces (conditioned surfaces and polymeric surfaces) on bacterial adhesion and biofilm formation was evaluated under selected shear stress conditions. The results have shown that these systems are suitable in vitro platforms to simulate biofilm formation in relevant biomedical and industrial scenarios. It was also observed that the average wall shear stress may be a suitable scale-up parameter between different platforms. Additionally, it was demonstrated that high flow rates should be used during cleaning and disinfection cycles because the increase in shear stress will promote biofilm detachment and also because the effect of biocides and other cleaning agents may be enhanced due to the increased mass transfer from the bulk solution to the surface of the biofilm.
Regarding the effect of the surface properties, this work followed two approaches. First, polystyrene surfaces were conditioned with components of the culture medium and cellular components since cell lysis may occur. Secondly, different polymeric materials were tested in order to find if cell adhesion could be correlated with thermodynamic surface properties. Conditioning studies have shown that nutrients rich in nitrogen and components of the cell architecture may have an inhibitory effect on biofilm formation. A correlation between bacterial adhesion and the ratio between the apolar Lifshitz van der Waals components (ᵞLW) and electron donor components (ᵞ-) of the total surface energy was found. Bacterial adhesion was reduced in surfaces with lower γ LW /ᵞ- ratio and enhanced otherwise. However, it was observed that the effect of the surface properties is modulated by the shear stress. This finding may be helpful in the design of new coatings by controlling ᵞLW /ᵞ- or in the selection of existing materials according to the desired application taking into consideration the prevailing hydrodynamic conditions.

vi

vii
Resumo Os biofilmes bacterianos são muitas vezes vistos como um problema nos sectores
industrial e biomédico uma vez que a sua formação implica elevados custos e acarreta um aumento do risco de saúde. Contudo, o seu uso pode ser vantajoso em aplicações onde a sua formação deve ser rápida e estável dentro das condições operacionais. A primeira etapa no processo de formação do biofilme consiste na adesão das células a uma superficie pré- condicionada. Para além dos factores intrinsecos a cada microorganismo, as apropriedades da superficie e as condições hidrodinâmicas, são os principais factores que controlam a adesão. O principal objectivo desta tese é entender o efeito destes factores externos na formação do biofilme de forma a desenvolver estratégias de controlo para atrasar o aparecimento dos biofilmes prejudiciais ou promover a formação dos benéficos. A bacteria Gram negativa Escherichia coli foi escolhida como organismo modelo devido à sua relevância medica e industrial.
Diversas plataformas in vitro como as microplacas de 96 poços e as células de fluxo, são usadas normalmente para realizar estudos de biofilmes. Esses estudos normalmente ignoram as condições hidrodinamicas dentro destas plataformas. Neste trabalho, foi usada a dinâmica de fluidos computacional (CFD) para determinar as tensões de corte e velocidades do fluido numa celula de fluxo semi-circular, numa câmara de fluxo de pequenas dimensões e numa microplaca de 96 poços. Após este estudo, foi avaliado o efeito de diferentes superficies (superficies condicionadas e poliméricas) na adesão de bactérias e na formação de biofilme em condições definidas de tensão de corte. Através dos resultados obtidos foi possivel verificar que estes sistemas são plataformas in vitro adequadas para simular a formação de biofilme em cenários biomédicos e industriais relevantes. Foi também observado que a tensão de corte média é um parametro adequado para fazer um aumento de escala entre diferentes plataformas. Foi ainda demonstrado que durante os procedimentos de limpeza e ciclos de desinfecção, devem ser usados caudais elevados porque um aumento da tensão de corte irá promover o desprendimento de biofilme e também porque o efeito dos biocidas e outros agentes de limpeza poderá ser aumentado devido ao aumento da transferência de massa do líquido para a superficie do biofilme.
Relativamente ao efeito das propriedades de superficie, este trabalho teve duas vertentes. Primeiro, foram condicionadas superficies de poliestireno com componentes do meio de cultura e componentes celulares devido à possibilidade de ocorrência de lise celular. Depois, foram testadas differentes superficies poliméricas de forma a perceber se a adesão celular pode ser correlacionada com as propriedades termodinamicas da superficie. Os estudos de condicionamento mostraram que os nutrientes ricos em azoto e que os componentes da arquitectura celular podem ter um efeito inibitório na formação de biofilme. Foi ainda encontrada uma correlação entre a adesão bacteriana e o racio entre o componente apolar (ᵞLW) e a componente dadora de electrões (ᵞ-) da energia total da superficie. A adesão bacteriana foi reduzida em superficies com menor racio ᵞLW /ᵞ- e aumentada no caso contrário. Contudo, foi observado que o efeito das propriedades de superficie é modulado pela tensão de corte. Estes resultados podem ser uteis no design de novos revestimentos de superficie através do contro do racio γLW /ᵞ- ou até na selecção de materiais existentes de acordo com a aplicação desejada tendo em conta as condicções hidrodinamicas prevalecentes.

viii

ix
Table of Contents
Acknowledgements ............................................................................................................ iii
Abstract ................................................................................................................................ v
Resumo .............................................................................................................................. vii
List of Figures .................................................................................................................. xiii
List of Tables ................................................................................................................... xvii
List of Symbols and Acronyms......................................................................................... xix
Chapter 1 Introduction........................................................................................................ 1
1.1 Relevance and motivation ..................................................................................... 3
1.2 Objectives and outline ........................................................................................... 4
1.3 References ............................................................................................................. 6
Chapter 2 Literature Review .............................................................................................. 9
2.1 Microbial biofilms ................................................................................................... 11
2.2 Biofilm formation process ....................................................................................... 12
2.3 Biofilm control strategies ......................................................................................... 13
2.3.1 Surface properties ............................................................................................. 14
2.3.2 Hydrodynamics ................................................................................................. 20
2.4 In vitro platforms for biofilm studies ....................................................................... 24
2.5 References ................................................................................................................ 26
Chapter 3 Biofilm formation in a semi-circular flow cell: effect of hydrodynamics and mass transfer ...................................................................................................................... 35
3.1 Introduction .............................................................................................................. 37
3.2 Materials and methods ............................................................................................. 38
3.2.1 Mass transport estimation and flow conditions ................................................ 38
3.2.2 Flow cell system and culture conditions ........................................................... 39
3.2.3 Sampling and analysis....................................................................................... 39

x
3.3 Results ...................................................................................................................... 40
3.4 Discussion ................................................................................................................ 42
3.5 References ................................................................................................................ 44
Chapter 4 Cell adhesion in a PPFC: the combined influence of hydrodynamics and surface properties............................................................................................................................ 47
4.1 Introduction .............................................................................................................. 49
4.2 Materials and methods ............................................................................................. 50
4.2.1 Numerical simulations ...................................................................................... 50
4.2.2 Bacteria and culture conditions ......................................................................... 52
4.2.3 Surface preparation and flow chamber experiments ......................................... 52
4.2.4 Surface hydrophobicity and free energy of adhesion ....................................... 52
4.2.5 Data analysis ..................................................................................................... 54
4.2.6 Statistical analysis ............................................................................................. 54
4.3 Results ...................................................................................................................... 55
4.3.1 Numerical simulation of the flow ..................................................................... 55
4.3.2 Bacterial adhesion ............................................................................................. 59
4.4 Discussion ................................................................................................................ 61
4.5 References ................................................................................................................ 64
Chapter 5 Biofilm formation in agitated 96-well microtiter plates: hydrodynamic and nutrient concentration effects ............................................................................................. 69
5.1 Introduction .............................................................................................................. 71
5.2 Materials and methods ............................................................................................. 72
5.2.1 Numerical simulations ...................................................................................... 72
5.2.2 Bacteria and culture conditions ......................................................................... 73
5.2.3 Biofilm and glucose quantification ................................................................... 74
5.2.4 Statistical analysis ............................................................................................. 74
5.3 Results ...................................................................................................................... 75
5.3.1 Numerical simulation of the flow ..................................................................... 75
5.3.2 Biofilm formation ............................................................................................. 77
5.4 Discussion ................................................................................................................ 79
5.5 References ................................................................................................................ 82

xi
Chapter 6 The effect of surface conditioning on bacterial adhesion and biofilm formation ....... 87
6.1 Introduction .............................................................................................................. 89
6.2 Materials and methods ............................................................................................. 90
6.2.1 Numerical simulations ...................................................................................... 90
6.2.2 Bacteria and culture conditions ......................................................................... 91
6.2.3 Conditioning agents .......................................................................................... 91
6.2.4 Microtiter plate assay ........................................................................................ 92
6.2.5 Parallel plate flow chamber assay ..................................................................... 93
6.2.6 Statistical analysis ............................................................................................. 93
6.3 Results ...................................................................................................................... 94
6.3.1 Numerical simulation of the flow ..................................................................... 94
6.3.2 Bacterial adhesion and biofilm formation ......................................................... 95
6.4 Discussion ................................................................................................................ 99
6.5 References .............................................................................................................. 101
Chapter 7 Escherichia coli adhesion to surfaces – a thermodynamic assessment ......... 105
7.1 Introduction ............................................................................................................ 107
7.2 Materials and methods ........................................................................................... 108
7.2.1 Bacteria and culture conditions ....................................................................... 108
7.2.2 Surface preparation ......................................................................................... 108
7.2.3 Surface characterization .................................................................................. 109
7.2.4 Flow chamber experiments ............................................................................. 110
7.2.5 Statistical analysis ........................................................................................... 110
7.2.6 Re-ploted data ................................................................................................. 110
7.3 Results and discussion ........................................................................................... 111
7.4 References .............................................................................................................. 115
Chapter 8 Micro and macro flow systems to study E. coli adhesion on polymeric materials .. 119
8.1 Introduction ............................................................................................................ 121
8.2 Materials and methods ........................................................................................... 122
8.2.1 Numerical simulations .................................................................................... 122
8.2.2 Bacteria and culture conditions ....................................................................... 123

xii
8.2.3 Surface preparation ......................................................................................... 123
8.2.4 Surface characterization .................................................................................. 123
8.2.5 PPFC experiments ........................................................................................... 124
8.2.6 Microchannel experiments .............................................................................. 125
8.2.7 Data analysis ................................................................................................... 125
8.3 Results and Discussion .......................................................................................... 125
8.4 References .............................................................................................................. 129
Chapter 9 Conclusions and suggestions for future work ................................................ 133
9.1 Conclusions ............................................................................................................ 135
9.2 Suggestions for future work ................................................................................... 136
9.3 References .............................................................................................................. 137

xiii
List of Figures Chapter 2
Figure 2.1 Life and times of a biofilm (adapted from Monroe (2007)). ......................... 12
Figure 2.2 Flow systems: a) Semi-circular flow cell system, b) PPFC system,
c) Microchannel system ..................................................................................................... 25
Figure 2.3 Illustrative photograph of polystyrene microtiter plates used for biofilm
formation: a) 6-well microtiter plate, b) 12-well microtiter plate c) 24-well microtiter plate
and d) 96-well microtiter plate. .......................................................................................... 26
Chapter 3
Figure 3.1 Schematic representation of the biofilm producing system............................. 39
Figure 3.2 a) Calculated values using correlations for the Sherwood number (solid line)
and for the external mass transfer coefficient Km (dashed line). Values for the transition
zone (1000 ≤ Re ≤ 2100) were not represented due to the poor reliability of the results
generated by empiric correlations in this zone. b) Average wall shear stress (dashed line)
and maximum flow velocity (solid line) for Re ranging from 100 to 10000 predicted by
CFD. ................................................................................................................................... 40
Figure 3.3 Time-course evolution of: a) biofilm wet weight, b) optical density in the
recirculating tank, c) glucose consumption in the system. Closed symbols – higher flow
rate (Re = 6720), open symbols – lower flow rate (Re = 4350). Time points marked with x
are those for which a statistical difference was found between both conditions (confidence
level greater than 95%, P ˂ 0.05) ....................................................................................... 42
Chapter 4
Figure 4.1 Schematic representation of the PPFC. ........................................................... 50
Figure 4.2 Absolute velocity in the midplane of the cell. ................................................. 55
Figure 4.3 Axial velocity along the main axis of the cell. ................................................ 56
Figure 4.4 Velocity profiles in viewing region in a) z-direction and b) y-direction. ........ 57
Figure 4.5 Wall shear stress in the bottom wall of the cell. .............................................. 58
Figure 4.6 Wall shear stress along the axis of the bottom wall of the cell. ...................... 58
Figure 4.7 Adhesion of E. coli on PDMS (open symbols), on glass surfaces (closed
symbols) and the theoretical values predicted by the von Smoluchowski-Levich (SL)
approximate solution (line), during 30 min for each flow rate: a) 1 ml.s-1, b) 2 ml.s-1,

xiv
c) 4 ml.s-1, d) 6 ml.s-1, e) 8 ml.s-1, f) 10 ml.s-1. These results are an average of those obtained
from three independent experiments for each condition. Statistical analysis corresponding
to each time point is represented with an * for a confidence level greater than 95%
(P < 0.05). .......................................................................................................................... 60
Figure 4.8 Ratio between E. coli adhesion on PDMS and glass surfaces (circles) for
different flow rates (1, 2, 4, 6, 8, 10 ml.s-1). Average wall shear stress for each flow rate
determined by CFD (triangles). A solid line was drawn to highlight the points where E. coli
adhesion results are similar on both surfaces. These results are an average of those obtained
from three independent experiments for each surface and flow rate. ................................ 61
Chapter 5
Figure 5.1 Grid that was used for the numerical simulations. .......................................... 73
Figure 5.2 Free surface during a complete rotation (Dorb = 50 mm). ............................... 75
Figure 5.3 Average wall shear stress for both orbital diameters. ...................................... 75
Figure 5.4 Wall shear stress for Dorb of 25 mm (upper row) and 50 mm (lower row). Wall
shear stresses bellow 0.05 Pa are not represented.............................................................. 76
Figure 5.5 Velocity field in a cross section of the well for Dorb of 25 mm (upper row) and
50 mm (lower row). ........................................................................................................... 77
Figure 5.6 Time-course evolution of biofilm development and glucose concentration:
a) and c) 50 mm orbital shaking amplitude, b) and d) 25 mm orbital shaking amplitude. a)
and b) Biofilm development, c) and d) glucose concentration. Closed symbols – high
glucose concentration, (1 g.L-1), open symbols – low glucose concentration (0.25 g.L-1).
These results are an average of those obtained from three independent experiments for each
condition. Statistical analysis corresponding to each time point is represented with an * for
a confidence level greater than 95% (P < 0.05). Error bars represent the standard deviation
between the triplicates........................................................................................................ 78
Chapter 6
Figure 6.1 Wall shear stress in a PPFC (A and B2) and in a well of a 96-well microtiter
plate (B1). A flow rate of 11 ml.s-1 was used for the simulation in the PPFC. A: wall shear
stress in the bottom surface of the PPFC, the visualization plane is highlighted in the figure
for clarity. B2: detail of the wall shear stress in the visualization zone. A shaking frequency
of 150 rpm with an orbital shaking amplitude of 50 mm was used for the simulations in the

xv
well of a 96-well microtiter plate (B1). The well dimensions are indicated (D and H) as
well as the liquid level at stationary condicions (S). .......................................................... 95
Figure 6.2 Biofilm formation after 24 h in microtiter plates pre-conditioned with
a) glucose, b) yeast extract, c) peptone, d) mannose, e) palmitic acid and f) BSA at different
concentrations. Biofilm formed on unconditioned surface was used as control. The extent
of biofilm formation was estimated by the crystal violet assay. Presented values are mean
A570 nm ± standard deviation of three independent experiments with six replica wells per
plate. Statistically significant differences are indicated with an asterisk. (*, P < 0.05) .... 96
Figure 6.3 Biofilm formation after 24 h in microtiter plates pre-conditioned with a) cellular
fragments, b) cytoplasm with cellular debris and c) periplasm at different concentrations.
The extent of biofilm formation was estimated by the crystal violet assay. Presented values
are mean A570 nm ± standard deviation of three independent experiments with six replica
wells per plate. Biofilm formed on unconditioned surface was used as control. Statistically
significant differences are indicated with an asterisk. (*, P < 0.05). ................................. 97
Figure 6.4 Number of adhered cells per cm2 in the PPFC after a) 24 h and b) 30 min on
polystyrene pre-conditioned surface with peptone (PEP) at 2 g.L-1, yeast extract (YE) at
2 g.L-1, BSA at 0.3 g.L-1, palmitic acid (PA) at 0.025 g.L-1, cellular fragments (TCE)
corresponding to a cellular concentration of 24.3×10⁸ cell.ml-1, cytoplasm with cellular
debris (CCDE) corresponding to a cellular concentration of 24.3×10⁸ cell.ml-1 and
periplasm (PE) corresponding to a cellular concentration of 0.38×10⁸ cell.ml-1. Cells
adhered on unconditioned surface were used as control. Presented values are mean ±
standard deviation of three independent experiments. Statistically significant differences
are indicated with an asterisk. (*, P < 0.05)....................................................................... 98
Chapter 7
Figure 7.1 Surfaces used and ᵞLW /ᵞ- tested in different works attempting to find a correlation
between adhesion and thermodynamic properties. .......................................................... 113
Figure 7.2 Relationship between bacterial adhesion or protein adsorption and the ratio
between apolar Lifshitz van der Waals components (ᵞLW) and electron donor component
(ᵞ-). a) E. coli adhesion on polymeric and glass surfaces b) Vibrio (circle), Cobetia (triangle)
and P. fluorescens (square) adhesion on Ni – P coatings with TiO2 and PTFE and stainless
steel, re-plotted from Liu et al. (2011a), c) Vibrio adhesion at 0.21 (circle), 0.46 (triangle),
and 0.98 (square) mPa on Ni – P coatings with TiO2 and PTFE and stainless steel, re-plotted
from Liu et al. (2011a), d) S. epidermis adhesion at 5 (circle), 50 (triangle) and 200 s-1

xvi
(square) on helium plasma treated PET, re-plotted from Katsikogianni et al. (2008),
e) B. subtilis adhesion on soil minerals, re-plotted from Hong et al. (2012),
f) L. monocytogenes adhesion on synthetic surfaces, re-plotted from Cunliffe et al. (1999),
g) Bovine serum albumin adsorption on synthetic surfaces, re-plotted from Cunliffe et al.
(1999), h) Cytochrome c adsorption on synthetic surfaces, re-plotted from Cunliffe et al.
(1999). Whenever a correlation was reported by the original authors it was also represented
in this figure and the correlation factor (R2) is indicated (panels a, b and c). .................. 114
Chapter 8
Figure 8.1 Wall shear stress: a) in the bottom wall of the PPFC (xy plan); b) in the viewing regions
of the PPFC and microchannel; c) in the bottom wall of the microchannel (xy plan). ................ 126
Figure 8.2 Bacterial adhesion rates on PA, glass, PDMS, CA and PLLA obtained in the
microchannel (black bars) and in the PPFC (white bars). Error bars shown for each surface
represent the standard deviation from three independent experiments. ........................... 128

xvii
List of Tables Chapter 2
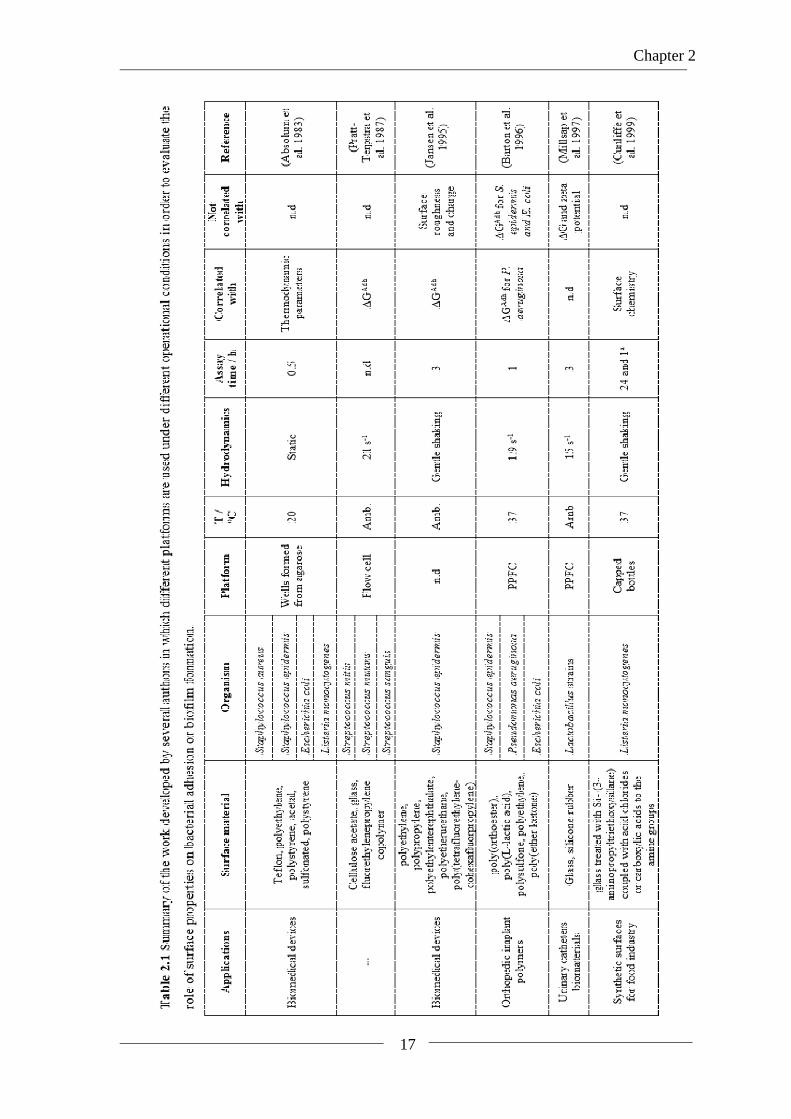
Table 2.1 Summary of the work developed by several authors in which different platforms
are used under different operational conditions in order to evaluate the role of surface
properties on bacterial adhesion or biofilm formation. ...................................................... 17
Table 2.2 Shear rate and shear stress in the human body, biomedical apparatus, industry
and others and the in vitro platforms which can be used to simulate the shear forces in each
of these places. ................................................................................................................... 22
Chapter 4
Table 4.1 Reynolds number at the inlet for each flow rate studied. .................................. 51
Table 4.2 The apolar ( LWγ ) and polar ( ABγ ) components, the surface tension parameters
( +γ and -γ ) and the hydrophobicity (∆G) of two surfaces (glass and PDMS) and E. coli
cells. ................................................................................................................................... 59
Table 4.3 Free energy of adhesion between E. coli and each surface, glass and PDMS.. 59
Chapter 7
Table 7.1 Surface thermodynamic properties and cell adhesion results. ........................ 111
Table 7.2 Summary of the work developed by other authors and in the present study. . 112
Chapter 8
Table 8.1 Microchannel and PPFC dimensions, operational data and numerical results. .... 127
Table 8.2 Contact angle measurements of each surface (bacteria, PLLA, PDMS, PA, CA,
glass) with the three liquids, water (θw), formamide (θform) and α-bromonaphtalene (θbr) and
hydrophobicity (∆G). ....................................................................................................... 127

xviii

xix
List of Symbols and Acronyms Re – Reynolds number (ρ v d µ-1 – dimensionless) Sh – Sherwood number (Km d D -1 – dimensionless) Sc – Schmidt number (µ ρ -1 D-1 – dimensionless) Km – external mass transfer coefficient (L T-1) D – diffusivity (L2 T-1) d – diameter (L) V – velocity (L T-1) ρ – density (M L-3) µ – viscosity (M L-1T-1) cb – bacterial concentration (M L-3)
rb – microbial radius (L) h0 – height of the rectangular PPFC (L) x – distance for which an average velocity variation below 15 % was determined (L) Dorb – orbital diameter (L) Q – flow rate (L3 T-1) ᵞLW – Lifshitz-van der Waals component of the surface energy (M T-2) ᵞAB – Lewis acid-base component of the surface energy (M T-2) ᵞ- – electron donor parameter (M T-2) ᵞ+ – electron acceptor parameter (M T-2)
ᵞTot – total surface energy (M T-2) ∆G – free energy of interaction (M T-2) ∆GAdh– free energy of adhesion (M T-2)
EPS – extracellular polymeric substance CFD – computational fluid dynamics PPFC – parallel plate flow chamber CIP – cleaning-in-place SL – Smoluchowski-Levich CV – crystal violet DNS – dinitrosalicylic colorimetric method OD – optical density BSA – bovine serum albumin CCDE – cytoplasm with cellular debris PE – periplasmic extract TCE – total cell extract PDMS – polydimethylsiloxane CA – cellulose acetate PA – polyamide PLLA – poly-L-lactide PS – polystyrene

xx

Chapter 1
1
Chapter 1 Introduction
In this chapter, the relevance and motivation of this work are summarized and the main objectives presented. The thesis outline is explained.

Chapter 1
2

Chapter 1
3
1.1 Relevance and motivation
Biofilms can be described as a structured community of cells enclosed in a self-produced polymeric matrix and adherent to a surface (Van Houdt et al. 2005). This community is often regarded as a problem that can cause infections or deterioration of medical devices functionality, representing a cost of $5 billion annually in the US (Pace et al. 2006), or they can also have deleterious effects when formed in industrial systems such as pipes, heat exchangers and membranes, representing up to 30% of the total plant operating costs (Melo et al. 2010). Biofilms can also be used for human benefit in wastewater treatment or in the production of commodities (Vinage et al. 2003; Qureshi et al. 2005).
The accepted model for biofilm formation includes a reversible cell attachment to a pre-conditioned surface with macromolecules from the surrounding medium, irreversible attachment and development of the biofilm architecture, maturation and dispersion of cells from the biofilm (Habimana et al. 2014). This process is controlled by intrinsic factors (i.e. those concerning the microbial species involved, their genetics, metabolism and physiology) and also external factors that pertain to the particular environment where the biofilm is formed (Nikolaev et al. 2007). The existing flow conditions in each situation (environmental, physiological or engineered) and the properties of the surface which will be the docking place for bacteria have a profound influence on biofilm formation (Harding et al. 2014).
The effects of the surface material on the onset of a biofilm are still not clear. Researchers have been trying to understand the relation between the physicochemical surface properties and the bacterial adhesion process and further biofilm development (Chen et al. 2005). Electrostatic forces, van der Waals forces and hydrophobic interactions are involved either in the adsorption of the molecules that will constitute the conditioning film as well as in the reversible bacterial adhesion (Renner et al. 2011). The first candidates for surface conditioning agents are the components of the culture medium, cellular components and other cell-produced metabolites. Complex media often contains sources of polysaccharides and protein extracts and since the molecular size of these compounds is much smaller than that of bacterial cells, their diffusion to the surface is faster (Bruinsma et al. 2001). Furthermore, cell lysis occurs in bacterial cultivation, thus it is likely that cell-synthesized compounds or cellular structures, which are smaller than a whole cell, reach the surface first and start the conditioning process. The rate at which these macromolecules and bacteria are delivered to the surface, the time they reside in close proximity to the surface, oxygen and nutrient transport and the mechanical shear forces at the surface-fluid interface are all affected by the fluid hydrodynamics (Robert et al. 2010).
In environmental and biomedical systems, mass transport and shear stress generated by the fluid flow are dependent on the existing hydrodynamic conditions and thus, these conditions cannot be changed but should be taken in count since they can affect biofilm development (Gomes et al. 2013). Regarding the industrial field, mass transport and shear forces have been used as an effective tool in cleaning in place procedures and in the control of biofilm growth and stability (Liu et al. 2002; Jensen et al. 2005).

Chapter 1
4
These external factors (surface properties and hydrodynamic conditions) often dictate the initial cell adhesion process and will also influence biofilm maturation and removal. Understanding the process of bacterial adhesion is key to control biofilm development either to inhibit or to delay the onset of detrimental biofilms or to promote beneficial biofilm development in engineered systems. Therefore, in order to develop more efficient control strategies and better understand the process of biofilm formation, in vitro biofilm simulation platforms are used. Among these, flow cells and 96-well microtiter plates are the most frequently used (Coenye et al. 2010). Microtiter plates have the advantage of enabling the simultaneous testing of many conditions in a high throughput fashion (Coenye et al. 2010). Flow cells have a lower throughput than 96-well microtiter plates, but they enable the use of coupons of different materials where biofilm formation is going to be simulated (Teodósio et al. 2011). Some flow cells also enable observation of this process in real time. However, the hydrodynamics and mass transfer features in such systems are still poorly understood, which is a drawback on the use of those systems in predicting biofilm behaviour at larger scales.
Although a solid body of evidence has accumulated regarding later stages of biofilm formation, information about early events is still scarce (Sauer et al. 2001; Simões et al. 2008). Since biofilm formation starts by reversible attachment to a pre-conditioned surface, one of the issues to be addressed is: what are the effects of the pre-conditioning phase on bacterial adhesion and biofilm development?
The effects of surface material on biofilm onset are also still not clear. The question to be answered is: what are the physicochemical surface properties that control the biofilm onset?
Since these surfaces are usually integrated into natural and engineered environments subjected to physiological, operational or environmental flow conditions, a question is raised: what is the importance of the hydrodynamic conditions on the biofilm onset and maturation?
1.2 Objectives and outline
The main objective of this work was to understand the processes entailed with biofilm formation in order to devise strategies to inhibit or delay detrimental biofilm formation or to obtain biofilms that are more resistant to operating conditions in biofilm reactors. In this thesis, the influence of initial external factors on the onset of bacterial biofilms and further development was assessed using the Gram-negative bacteria Escherichia coli as a model system due to the medical and industrial relevance of this organism.
The final purpose of this work was: i) To assess the effect of surface conditioning agents on cell adhesion and
biofilm development. ii) To assess the influence of several starting variables such as different
adhesion surfaces and different hydrodynamic conditions on bacterial adhesion and biofilm development.

Chapter 1
5
iii) To devise guidelines for conditioning treatments and operational procedures to better control the properties of mature biofilms.
This thesis is outlined as follows:
Chapter 2 is a brief literature review describing the state of the art pertaining to this thesis.
In the following three chapters, a detailed characterization of the hydrodynamic conditions in three commonly used biofilm formation platforms was made.
In Chapter 3, the flow hydrodynamics in a semi-circular flow cell were characterized. Average shear stresses and maximum flow velocities were determined by computational fluid dynamics (CFD). Additionally, correlations were used to characterize the mass transference in this system. The effects of two flow rates in the turbulent regime, which is often used in industrial settings, were assayed in a real semi-circular flow cell system in order to evaluate their effect on biofilm development.
In Chapter 4, the fluid hydrodynamics inside a parallel plate flow chamber (PPFC) were characterized. Shear stresses and flow velocities were determined by CFD. The effect of six flow rates in bacterial adhesion on two surfaces with different physicochemical properties was evaluated.
In Chapter 5, the fluid hydrodynamics inside the wells of a 96-well microtiter plate were characterized. Shear stresses and flow velocities were determined by CFD. The effect of two different hydrodynamic conditions on biofilm development in culture media with different glucose concentrations was assessed.
After this initial hydrodynamic characterization, the most suitable platforms were selected to conduct adhesion/biofilm assays in order to understand the factors which control biofilm development.
In Chapter 6, the effect of surface conditioning with medium components and cellular extracts on bacterial adhesion and further biofilm maturation was assessed. A 96-well microtiter plate was used for screening purposes due to its high throughput and selected conditions were tested in a PPFC at the same shear stress. A flow cell system was chosen since it can mimic biofilms formed in real systems with similar fluid topology. The PPFC was chosen due to its reduced dimensions which makes it easier to handle, and it allows operation with a low hold-up which is ideal to test cellular extracts that are difficult to obtain. In this chapter, the scalability of the results obtained in these systems and the possibility of application to industrial settings were also discussed.
In Chapter 7, the PPFC was selected again, since it enables real time observation, to study the effect of the physicochemical properties of polymers used in the biomedical field in bacterial adhesion. Additionally, this analysis was extended to published data from other authors which have studied bacterial adhesion or protein adsorption to different materials (soil minerals, synthetic materials, plasma treated surfaces and metallic materials) in different systems and operational conditions. The aim of this chapter was to find out a

Chapter 1
6
selection criteria to predict bacterial adhesion to materials used in the industrial and biomedical fields.
In Chapter 8, bacterial adhesion to the polymeric surfaces used in the previous chapter was evaluated in the PPFC and in a microfluidic system under physiological shear stress conditions. The microchannel was chosen as small scale platform and the PPFC as larger platform, since they enable testing of different surfaces and observation of bacterial adhesion in real time.
Finally, Chapter 9 contains the main conclusions of the work presented in this thesis and some suggestions for future research.
1.3 References
Alan B, Buehler K, Schmid A. 2012. Biofilms as living catalysts in continuous chemical syntheses. Trends in Biotechnology. 30:453-465.
Bruinsma GM, van der Mei HC, Busscher HJ. 2001. Bacterial adhesion to surface hydrophilic and hydrophobic contact lenses. Biomaterials. 22:3217-3224.
Chen G, Zhu H. 2005. Bacterial adhesion to silica sand as related to Gibbs energy variations. Colloids and Surfaces B: Biointerfaces. 44:41-48.
Coenye T, Nelis HJ. 2010. In vitro and in vivo model systems to study microbial biofilm formation. Journal of Microbiological Methods. 83:89-105.
Gomes LC, Moreira JMR, Miranda JM, Simões M, Melo LF, Mergulhão FJ. 2013. Macroscale versus microscale methods for physiological analysis of biofilms formed in 96-well microtiter plates. Journal of Microbiological Methods. 95:342-349.
Habimana O, Semião AJC, Casey E. 2014. The role of cell-surface interactions in bacterial initial adhesion and consequent biofilm formation on nanofiltration/reverse osmosis membranes. Journal of Membrane Science. 454:82-96.
Harding JL, Reynolds MM. 2014. Combating medical device fouling. Trends in Biotechnology. 32:140-146.
Jensen BBB, Friis A, Benezech T, Legentilhomme P, Lelievre C. 2005. Local wall shear stress variations predicted by computational fluid dynamics for hygienic design. Food and bioproducts processing 83:53-60.
Liu Y, Tay J. 2002. The essential role of hydrodynamic shear force in the formation of biofilm and granular sludge. Water Research. 36:1653-1665.
Melo L, Flemming H. 2010. The science and technology of industrial water treatment. Taylor and Francis Group.
Nikolaev Y, Plakunov V. 2007. Biofilm - “City of microbes” or an analogue of multicellular organisms? Microbiology. 76:125-138.
Pace JL, Rupp ME, Finch RG. 2006. Biofilms, Infection and Antimicrobial Therapy. Boca Raton: CRC pres Taylor and Francis group.
Qureshi N, Annous B, Ezeji T, Karcher P, Maddox I. 2005. Biofilm reactors for industrial bioconversion processes: employing potential of enhanced reaction rates. Microbial Cell Factories. 4:24.
Renner LD, Weibel DB. 2011. Physicochemical regulation of biofilm formation. MRS Bulletin. 36:347-355.
Robert JM, Salek MM. 2010. Numerical Simulations - examples and applications in computational fluid dynamics. Canada: InTech. Numerical simulation of fluid flow and hydrodynamic analysis in commonly used biomedical devices in biofilm studies.
Chapter 1
7
Sauer K, Camper AK. 2001. Characterization of phenotypic changes in Pseudomonas putida in response to surface-associated growth. Journal of Bacteriology. 183:6579-6589.
Simões M, Simões LC, Vieira MJ. 2008. Physiology and behavior of Pseudomonas fluorescens single and dual strain biofilms under diverse hydrodynamics stresses. International Journal of Food Microbiology. 128:309-316.
Teodósio JS, Simões M, Melo LF, Mergulhão FJ. 2011. Flow cell hydrodynamics and their effects on E. coli biofilm formation under different nutrient conditions and turbulent flow. Biofouling. 27:1-11.
Van Houdt R, Michiels CW. 2005. Role of bacterial cell surface structures in Escherichia coli biofilm formation. Research in Microbiology. 156:626-633.
Vinage I, Rohr P. 2003. Biological waste gas treatment with a modified rotating biological contactor. I.Control of biofilm growth and long-term performance. Bioprocess and Biosystems Engineering. 26:69-74.

Chapter 1
8

Chapter 2
9
Chapter 2 Literature Review
In this chapter, a literature review describing the state of the art of the subjects presented in this thesis is made. The biofilm concept is presented and the main advantages and disadvantages of its formation are discussed. A brief description of the biofilm development process and the main factors which control its formation are also presented. Special emphasis is given to surface properties and hydrodynamic conditions which are of particular relevance to this thesis. A description of the in vitro platforms that are currently used for biofilm studies is also presented including a detailed description of the ones used in this study.

Chapter 2
10

Chapter 2
11
2.1 Microbial biofilms
Biofilms are structured communities of microorganisms attached to surfaces surrounded by a matrix of extracellular polymeric substances (EPS) which confers many advantages to biofilm cells that can develop synergistic interactions (Dufour et al. 2010). This matrix is mainly constituted by water (97%), polysaccharides (1-2%), proteins (< 1-2%) and nucleic acids (<1-2%) and is responsible for biofilm morphology, functional integrity, cohesion and structure (Sutherland 2001; Branda et al. 2005). The biofilm mode of living confers protection against harmful environments (nutrient deprivation, pH changes, oxygen radicals, hydrodynamic conditions, biocides, and antimicrobial agents), enables genetic material transference and facilitates the colonization of favorable and hostile niches (Nikolaev et al. 2007). It is estimated that more than 90% of bacteria in natural environments exist within a biofilm (Petrova et al. 2012). In industry, biofilms have been used in the production of chemicals, (e.g. ethanol, lactic acid, vinegar), bioremediation processes, waste-water treatment or even removal of volatile compounds from waste streams (Vinage et al. 2003; Qureshi et al. 2005; Singh et al. 2006; Alan et al. 2012). The use of biofilms in these processes enables higher cell concentrations and thus higher reaction rates and an easier separation between the final product and microorganisms which can be used for longer operational times (Qureshi et al. 2005). On the other hand, biofilm development is a common problem faced by the industrial (Rochex et al. 2007; Florjanic et al. 2011), environmental (Azevedo et al. 2006; Mahfoud et al. 2009; Cooper et al. 2010) and biomedical areas (Koseoglu et al. 2006; Silverstein et al. 2006). In the food industry, biofilms can lead to food spoilage by bioconversion (Shi et al. 2009; Van Houdt et al. 2010; Dourou et al. 2011), in industries with water process lines, besides causing problems in cleaning and disinfection, biofilms can reduce heat transfer in heat exchangers, reduce flow through blocked tubes and may contribute to the corrosion of various materials (Shi et al. 2009; Melo et al. 2010). It has been estimated that biofilm development in industrial process lines may represent up to 30% of the plant operating costs (Melo et al. 2010). In aquatic environments, biofilms can grow in ship hulls leading to an increase in fuel consumption that can reach up to US$ 400 h-1 for a ship travelling at 48 km h-1 (Cooksey et al. 1995). In the biomedical field, cells in biofilms are responsible for infections since they are typically more resistant to antimicrobial agents than planktonic cells and have a decreased susceptibility to host defense systems (Shunmugaperumal 2010). It has been reported that 65% of the hospital acquired infections are caused by biofilms which can grow in indwelling and other percutaneous medical devices and can cost $5 billion annually in the US (Pace et al. 2006; Bryers 2008). The development of biofilms in catheters, wound dressings, medical implants and medical devices is problematic since these biofilms can be reservoirs of pathogenic organisms, a source of disease spread and can cause material biodegradation, changes in surface properties and deterioration of the medical device functionality (Missirlis et al. 2004; Kaali et al. 2011). When such biofilms form in medical devices, sometimes the only solution is their surgical removal. However, the costs associated with the replacement of infected implants during revision surgery may triple the cost of the primary implant procedure (Busscher et al. 2012). Moreover, secondary implants

Chapter 2
12
are further exposed to colonization by antibiotic resistant bacteria residing in the surrounding tissue which can proliferate and lead to new infections. (Busscher et al. 2012).
There is a need to better understand and control biofilms in order to promote the formation of beneficial biofilms or to facilitate the elimination or delay the onset of harmful biofilms.
2.2 Biofilm formation process
The currently accepted mechanism for biofilm development involves five stages (Figure 2.1) starting from reversible attachment of cells to a pre-conditioned surface, EPS production leading to irreversible attachment, early development of biofilm architecture, biofilm maturation and cell dispersion from the biofilm (Dunne 2002; Nikolaev et al. 2007; Goulter et al. 2009; Habimana et al. 2014)
A solid surface immersed in water is immediately covered by molecules (e.g. organic matter, proteins) from the liquid phase forming a conditioning film which may change the properties of this surface making it more or less suitable for bacterial anchorage. The formation of this layer of adsorbed molecules is the first stage, preceding the formation of a bacterial film. After planktonic cell transport from the bulk liquid to the substratum, cell adsorption at the surface followed by release or reversible adhesion takes place. Electrostatic forces, van der Waals forces and hydrophobic interactions are involved in the adsorption of the molecules that will constitute the conditioning film as well as in the reversible bacterial adhesion (Renner et al. 2011). The following stage begins when the cells become irreversibly attached to the surface. This step is mediated by stronger attractive forces such as covalent and hydrogen bonds and may be helped by cellular surface structures such as flagella and fimbriae (Renner et al. 2011). Then, the processes of cellular growth and EPS production begin. After biofilm maturation, biofilm growth and detachment/sloughing balance each other so that the total amount of biomass remains approximately constant in time (the steady-state is achieved).
Figure 2.1 Life and times of a biofilm (adapted from Monroe (2007)).

Chapter 2
13
Environmental factors and the properties of the cells affect the process of biofilm formation. The most important environmental factors are pH, salinity, temperature, osmolarity, oxygen partial pressure, accessibility to nutrient sources, surface properties (of both bacteria and substrate) and the force and type of liquid motion relative to this surface (Nikolaev et al. 2007). Biofilm cells differ from planktonic cells in gene expression, protein production and resistance to the immune system and antimicrobial agents (Petrova et al. 2012). This adaptive response depends on the surrounding fluid hydrodynamic conditions which will dictate shear forces and mass transference (oxygen, nutrients, cellular products, etc) (Purevdorj et al. 2002; Moreira et al. 2013). Thus, the biofilm architecture (thickness, porosity, etc) must adapt in order to resist to shear forces and to allow a better access to nutrients and oxygen.
2.3 Biofilm control strategies
Remedial approaches to eliminate biofilms usually consist in mechanical/chemical cleaning or material/equipment replacement in industry or medical device replacement and antibiotic treatment in the biomedical field (Simões et al. 2010; Van Houdt et al. 2010; Busscher et al. 2012). These processes have high costs and they are not always effective (Melo et al. 2010; Busscher et al. 2012). Moreover, it has been observed that bacteria have been developing resistance to antibiotics (Shunmugaperumal 2010). In many fields microorganisms are not a problem as long as they remain planktonic, and therefore the disinfection process would be facilitated if microorganism attachment could be prevented. This is because microorganisms embedded in a biofilm are 100–1000 times less sensitive to most antibiotics and biocides compared to planktonic cultures (Meyer 2003; Nikolaev et al. 2007). Therefore, a preventive strategy has been adopted to delay biofilm development by affecting bacterial adhesion (Van Houdt et al. 2010; Petrova et al. 2012; Campoccia et al. 2013a). Understanding the process of bacterial adhesion is key to control biofilm development either to inhibit the onset of detrimental biofilms or to promote beneficial biofilms in engineered systems. A number of studies has been performed to try to gain control over bacterial adhesion. Recently, with the increasing use of biodiesel as alternative to fossil fuels, some issues like the integrity of storage tanks which become compromised by the formation of biofilms is a concern. Restrepo-Flórez et al. (2014) studied the effect of biodiesel concentration on biofilm development on surfaces such as low-density polyethylene, cross-linked polyethylene, and a bilayer construction of linear-low density polyethylene and polyamide-11 under conditions similar to those found in an industrial fuel storage system. The authors verified that the composition of the biofilms developed is affected by the nature of the polymer and by the concentration of biodiesel used as a carbon source. These findings may be important in the design and management of efficient strategies to substitute diesel for biodiesel without comprising the integrity of the infrastructure. In the biomedical field, some diseases such as cancer have been the focus of research in this century. New strategies focused in the bacterial potential have been explored as alternatives to the conventional chemical treatments which have many detrimental side effects. Park et al. (2014) proposed a bacteria-based microrobot (bacteriobot) for theranostic activities against solid tumors. This bacteriobot acts as a
Chapter 2
14
combination of microsensor, microactuator, and therapeutic agent and it can be considered as a new type of active drug delivery system. This system is based in the ability of mobile bacteria such as E. coli or Salmonella typhimurium to adhere to designed microsurfaces and originate a bacteriorobot that can move on human cells and have a higher affinity to cancer cells. The key for the success of this new theranostic approach is the strong attachment of the bacteria to the microstructure which is very important for its motility and stability in living tissues. Previous studies have shown that hydrophobic interactions can be important in the immobilization of bacteria on the microstructures and thus the use of new materials or surface conditioning with proteins can be important in the bacteriorobot success (Behkam et al. 2008; Park et al. 2010).
It is known that beyond the influence of the surface properties on the bacterial adhesion process, the hydrodynamic forces can also be crucial (Missirlis et al. 2004). Fang et al. (2012) made a study where they used the hydrodynamic forces (22, 110, 795 s-1) to tune the Staphylococcus aureus capture ability and direct bacteria to target regions of a poly(ethylene glycol) polymer brush. They verified that at a lower shear, the extension of bacterial adhesion was higher. At a high shear bacteria could adhere only on relatively rare “hot spots” and so the rate of bacterial adhesion on these spots was small but adhesively selective. Therefore bacterial adhesion to the “stickiest” surface regions is most selective at high shear. These findings may be important in the development of sensors in the biomedical field where bacteria can be selectively directed to targeted surface regions.
The shear forces can also have an important role in further contaminations by cells detached from mature biofilms which may adhere in new locations and originate new biofilms for instance in water distribution systems. The processes used to control biofilms in these systems have demonstrated limited efficacy. Thus, studies have been made in order to understand the factors that control the biofilm onset. Florjanic et al. (2011) investigated the effect of water hydrodynamics on surface colonization, biofilm growth and bacterial detachment. The authors concluded that hydrodynamic conditions have a significant influence on biofilm development. At a constant flow velocity, biofilm colonization and development was delayed, and a low number of bacteria detached from biofilm into the water. Additionally, they also observed that the primary biofilm acts as a constant reservoir of cells that after detaching (due to the flow shear) are able to occupy new surfaces very quickly.
Surface properties and hydrodynamic conditions are the two main factors which can be used in order to control biofilm formation in engineered systems. The other factors (temperature, pH, salinity, etc) may be dependent on the physiological conditions in the case of the human body or may be set by specific operational conditions in industrial systems.
2.3.1 Surface properties
Bacterial adhesion to a surface (substrate), the first step in the biofilm formation process, consists on the attraction of bacteria to the surface (natural or artificial) followed by adsorption and attachment. When immersed in aquatic systems, molecules at the surfaces tend to interact with molecules in the solution through physicochemical

Chapter 2
15
interactions. The forces involved in this process are the Lifshitz van der Waals, electrostatic and Lewis acid-base interactions (Bos et al. 1999). The van der Waals forces have an electromagnetic nature and are usually attractive, the electrostatic elements originate from Coulomb interactions between the charged bacteria and the surface and the Lewis acid-base component is governed by the potential formation of covalent bonds between electron pairs (Perni et al. 2013). Thus, the surface energy is a measure of the interfacial attractive forces. A surface (from bacteria or substrate) can be classified into hydrophilic or hydrophobic (van Oss 1995). This classification is based in the interaction energy (∆G mJ.m-2) between molecules (from the surface) immersed in water. If the interaction between the two entities is stronger than the interaction of each entity with water, ∆G < 0 mJ.m-2, the material is considered hydrophobic, if ∆G > 0 mJ.m-2, the material is hydrophilic (van Oss 1995). Depending on the hydrophobicity of both bacteria and material surfaces, bacteria may adhere differently to materials with different hydrophobicities. Hydrophilic surfaces are usually more resistant to bacterial adhesion than hydrophobic surfaces due to a physical barrier known as hydration layer (An et al. 1998; Harding et al. 2014). This layer results from hydrogen bonding between functional groups at the surface and water molecules from the surrounding fluid which forms a type of scaffold that functions as a barrier (Harding et al. 2014).
Over the years, researchers have been trying to predict whether a bacteria will adhere to a surface through the variation of system (bacteria-substrate) Gibbs energy (Chen et al. 2005). Therefore, some theories concerning the forces involved in bacteria- substrate interactions were developed. In the thermodynamic approach the variation of the Gibbs energy of the system is based in the Lifshitz van der Waals forces and the Lewis acid-base interactions. In the DLVO theory, it is assumed that the energy of the system is the sum of the Lifshitz van der Waals forces and the electrostatic interactions, both depending on the separation distance between particles (Perni et al. 2013). However, since the Lewis acid-base interactions involved in bacterial adhesion process have been neglected by the DLVO approach (Azeredo et al. 1999; Bos et al. 1999; Perni et al. 2013), an extended DLVO (xDLVO) theory was developed taking into account the three interaction energies. Nowadays, both theories, the thermodynamic and xDLVO, have been applied to predict bacterial adhesion to different materials (Bos et al. 1999; Chen et al. 2005; Perni et al. 2013).
Researchers have been studying this interaction energies and they have been trying to find a relation between surface properties and bacterial adhesion (Liu et al. 2005). This knowledge would enable the manipulation of the surface energy and charge of the materials of process equipment and biomedical devices in order to promote or inhibit biofilm formation (Missirlis et al. 2004; Fernández et al. 2007). Intensive efforts have been focused in the fabrication of new surfaces, whether by new combinations of exiting materials (metal, glass, plastic) or by modification of their properties (Asan et al. 2013). Several surface modification techniques have been used in the construction of artificial surfaces and they can be categorized according to the surface coating or surface chemistry modifications (Asan et al. 2013). The most common techniques (Asan et al. 2013; Campoccia et al. 2013b; Alwiczek et al. 2014; Harding et al. 2014) are surface treatment with active gases and vapors (e.g. gas discharge, corona/ plasma discharge), solution

Chapter 2
16
deposition (e.g polymer coatings, surfactant deposition), chemical treatment (e.g oxidation, chlorination) and physical adsorption of molecules (e.g proteins, peptides).
Recently, smart materials inspired in natural systems which have anti-fouling properties (e.g. lotus leaves and shark skin) are being created (Gu et al. 2014). The development of this new materials is based in the concept of self-cleaning coating. Moreover, some of them can quickly change their physicochemical properties in response to environmental stimulus such as pH, temperature, surrounding media, etc. These smart materials been developed based on silica nanoparticles, polymers (e.g. water-soluble synthetic polymers) and carbon nanotubes (Gu et al. 2014; Halake et al. 2014).
Another important factor in the interaction between surfaces and bacteria is the adsorption of molecules from the liquid medium where the surface is inserted. Proteins present in tears, blood, saliva, or in the milk in the industrial sector, and organic matter in natural systems are examples of molecules that are present in the medium where surfaces are inserted and can be adsorbed thus affecting surface interaction with bacteria (Bakker et al. 2003a; Dat et al. 2010; Lorite et al. 2011). Therefore, when a new material is created one should take in consideration the medium where this surface will be inserted, since its surface properties can be changed due to the adsorption of liquid native molecules. Based on this idea, researchers are exploring, the surface conditioning strategy to control biofilm formation. Loskill et al. (2013) have characterized the adhesion of Streptococcus mutans, Streptococcus oralis, and Staphylococcus carnosus on smooth, high-density hydroxyapatite surfaces, pristine (this material mimics the teeth surface) and pre- conditioned with a fluoride solution. These authors have observed that bacterial species exhibited lower adhesion forces after fluoride treatment of the surfaces highlighting the importance of fluoride as an effective caries-preventive agent.
Table 2.1 lists several studies assessing the effect of surface properties on cell adhesion performed in the last 30 years. In these studies, different materials (polymeric materials, coatings, plasma treated surfaces, metallic surfaces, etc) with applications in several fields (biomedical, industrial, etc) were tested under different conditions (hydrodynamics, temperature, etc) and operated in various platforms. The most used platforms in these studies were the flow cells systems and agitated microtiter plates. This table lists 25 studies and it is possible to observe that in some of them it was not possible to find a correlation between surface physicochemical properties and bacterial adhesion. In others it was possible to establish a correlation only for some particular cases. For the remaining studies, where a correlation between biofilm formation and surface properties was found, a unique parameter was not identified to correlate all the results. However, the parameters most often used were surface hydrophobicity (∆G) and free energy of adhesion (∆GAdh). This compilation highlights the difficulty in controlling cell adhesion by manipulation of the surface properties. Additionally it is also possible to verify that around 90% of these studies are focused in the reduction of the biofilm formation, showing that the majority of these authors are looking for antibacterial surfaces.
Chapter 2
17

Chapter 2
18

Chapter 2
19

Chapter 2
20
2.3.2 Hydrodynamics
Since the designed materials are usually integrated in natural or engineered environments with particular hydrodynamic conditions, the interaction between bacteria and the surface materials is subjected to the physiological, operational or environmental conditions (Harding et al. 2014). The flow conditions of each system (natural, biomedical or industrial) where the surface material is integrated, have a profound influence on the biofilm onset. The rate at which macromolecules (specific for each type of fluid) and bacteria are delivered to the surface, the time they reside in close proximity to the surface and the mechanical shear forces at surface-fluid interface is dictated by the flow hydrodynamics (Robert et al. 2010). There is an optimum flow rate for bacterial adhesion reflecting the balance between rate of delivery and the force acting on adhered bacteria (Missirlis et al. 2004). The interaction between bacteria and the surface will determine the shear forces that adhered bacteria will be able to withstand (Missirlis et al. 2004).
Several works have reported the importance of shear forces on bacterial adhesion. Katsikogianni et al. (2010) used a PPFC to study the effect of glass modified surfaces (with methyl (CH3), amino (NH2) and hydroxyl (OH) terminal groups) on the adhesion of two Staphylococcus epidermidis strains under four different shear rates (50, 500, 1000 and 2000 s-1). The authors observed that adhesion was higher on CH3 followed by NH2 and minimal on OH-terminated glass for both strains. However, the number of adhered cells on each surface decreased with increasing shear rates. Azevedo et al. (2006) used a 6-well microtiter plate to evaluate the adhesion of Helicobacter pylori to stainless steel 304 and polypropylene when exposed to increasing shear stresses (0, 0.138 and 0.317 Pa corresponding to 0, 146 and 334 s-1). These authors observed that the number of adhered cells on each surface decreased with increasing shear stresses. Patel et al. (2003) used a rotating disc model to observe the adhesion of S. epidermis on implant materials with surface modifying endgroups (SMEs) under physiological relevant shear stresses (0-1.8 Pa). They observed that bacterial adhesion was enhanced on materials modified with fluorocarbon SMEs and reduced on materials with polydimethyllsiloxane (PDMS) and polyethylene SMEs. However, although this adhesion trend has been observed for all tested shear stresses, the number of adhered microorganisms on each surface decreased with increasing shear stress. The authors concluded that bacterial adhesion on those surfaces was mediated by surface properties and shear stress. Skovager et al. (2012) studied the effect of flow shear stress (0.1 and 1.12 Pa) on the adhesion of different strains of Listeria monocytogenes to fine-polished stainless steel in a parallel-plate perfusion chamber. The authors observed that the initial adhesion rate for all strains (except for one), was significantly greater when high shear stresses were applied. Their results demonstrated that initial adhesion rates were dependent on the shear stress and strain type. Li et al. (2000) studied the effect of physiologic levels of shear stress (between 0.1 and 1.5 Pa) on the adhesion kinetics of S. aureus to three types of collagen surfaces in a parallel-plate perfusion chamber. The authors observed that S. aureus adhesion rate increased for all surfaces until a shear stress maximum between 0.3-0.5 Pa was reached and after this a decrease in the adhesion rate was observed. They have verified that although different

Chapter 2
21
numbers of adhered cells were obtained on the different surfaces, the adhesion process was shear stress dependent. It has been observed that, additionally to the relevant role that flow hydrodynamics has on the bacterial adhesion step, it is also one of the most decisive factors in the maturation of a biofilm (Gjersing et al. 2005). The fluid surrounding a biofilm, provides the primary source of nutrients and is the vehicle for cell by-products removal (Gjersing et al. 2005). An increase in flow velocity promotes the flux (in and out) of molecules (nutrients, cells, biocides, antibiotics, cellular products, etc) by changing the molecule concentration in the biofilm interface with the liquid phase. It also regulates the physiological properties of the biofilm by changing the mechanical shear stresses at the fluid-biofilm interface (Robert et al. 2010). It has been observed that higher shear forces led to the formation of a thinner and denser biofilm (Liu et al. 2002). Although higher flow velocities enhance molecular transport (convection), shear forces lead to denser biofilms which in turn reduces the diffusivity of molecules inside biofilms. Additionally, a higher flow velocity promotes stronger shear forces that can promote biofilm sloughing or detachment (Liu et al. 2002). In the biomedical field, shear stress generated by the fluid flow is dependent on physiological conditions and thus these conditions cannot be changed but should be taken into account since they can affect biofilm development, morphology and susceptibility (Paramonova et al. 2009; Gomes et al. 2013). Kostenko et al. (2010) used a 6-well microtiter plate to investigate the impact of oscillatory surface physiological shear stresses (between 0.15 and 1.02 Pa) on S. aureus biofilm morphology and tolerance to antibiotics. These authors verified that local biofilm deposition and morphology correlate strongly with shear stress. Moreover, they observed a correlation between bacterial tolerance to antibiotics and the shear stress (in general, a higher tolerance was observed in high shear regions). Weaver et al. (2012) investigated a variety of clinical isolates of S. epidermis to determine the expression potential polysaccharide intracellular adhesin (PIA) in response to relevant fluid forces (mimicking wall shear stresses present in capillaries, venules and catheter lumens) experienced by S. epidermis during pathogenesis. Using a 96-well microtiter plate (in static conditions) and a microfluidic device (shear stresses between 0.065 and 1.14 Pa) they verified that bacteria that produced biofilms under static conditions increased their pathogenicity by secreting PIA due to the fluid shear. Additionally, in strains constitutively producing PIA the presence of fluid shear altered their metabolic profiles in the biofilm which led to a reduction of susceptibility to antimicrobial treatments enhancing the risk of infection. They concluded that catheter luminal design should consider physiological hydrodynamic conditions.
In the industrial field, shear forces have been used as an effective tool in cleaning in place procedures and in the control of biofilm growth and stability (Liu et al. 2002; Jensen et al. 2005b). Lelièvre et al. (2002) studied the effect of the wall shear stress (between 0.04 and 5.32 Pa) on Bacillus cereus removal from industrial equipment. They used stainless steel pipes with sudden and gradual expansion and contraction sites that represented complex equipment such as pumps or valves or even general pipes used in food processing lines. The authors observed that an increase in the flow rate induced a better cleaning of different zones as in sudden expansion pipes. However, in gradual contractions

Chapter 2
22
or expansions, some areas remained poorly cleanable despite this increase highlighting the importance of equipment design and flow configuration. Teodósio et al. (2013a) used a semi-circular flow cell to study the effect of two flow rates, with Reynolds numbers (Re) of 4350 and 6720 (corresponding to shear stresses of 0.183 and 0.511 Pa) on E. coli biofilm formation. Additionally, computational fluid dynamics (CFD) was used to assess whether the flow in pipe systems could be emulated by the semi-circular flow cells that were used to study biofilm formation. In this work the authors have shown that a semi-circular flow cell can efficiently emulate the flow in a pipe with circular section when Re is comprised between 10 to 1000 and 3500 to 10000. They observed that for the two tested Re (used in industrial settings) thinner biofilms were obtained at a higher flow rate and this information can be important for the prevention and control of biofouling in industrial settings. Pham et al. (2008) investigated the influence of shear rate (0.3 to 200 s-1) on the establishment, structure and performance of a biofilm in a microbial fuel cell using a culture from an anaerobic sludge, a soil sample and an effluent sample. They observed that the current and power produced at a shear rate of 120 s-1 was two to three times higher than for a lower shear (like 0.3 s-1). They verified that biofilm formed under high shear was thicker and the biomass density increased by a factor of 5. Their results have shown that applying high shear rates in a microbial fuel cell can result in a specific-electrochemically active biofilm that is thicker and denser and attaches better, and hence has a better performance.
Given the importance of shear forces in biofilm onset and development, table 2.2 compiles some of the shear stresses and shear rates that can be found in industrial, biomedical and natural systems. In this table it is possible to observe that in the human body, shear stresses in the range 0.1-15 Pa can be found. When biomedical apparatus are used, shear rates between 0.6 and 84.3 Pa can be achieved. Regarding industrial and others systems, shear rates between 10 and 125000 s-1 can be obtained. Additionally, a survey for platforms used for adhesion studies and biofilm formation and the respective shear stress or shear rate at which they were operated, was made from published works. From the collected data, the most widely used platforms were integrated in table 2.2. Each letter presented in the penultimate column corresponds to a platform that may be used at the same shear stress or shear rate of the correspondent real system. Some reference studies for the use of each platform at those specific hydrodynamic conditions are also indicated as footnotes.
In general, it was observed that flow systems as parallel plate flow chambers or microchannels and high throughput platforms as the microtiter plates are the most widely used platforms for biofilm studies.
Table 2.2 Shear rate and shear stress in the human body, biomedical apparatus, industry and others and the in vitro platforms which can be used to simulate the shear forces in each of these places.

Chapter 2
23

Chapter 2
24
2.4 In vitro platforms for biofilm studies
Several in vitro systems have been developed for studies of bacterial adhesion and biofilm behavior under controllable and reproducible conditions which resemble those found in natural environments (Teodósio et al. 2013b). There are different types of platforms, with different dimensions (from µm to m), and characteristics (high throughput, real time observation, etc) which can be used under different conditions (hydrodynamics, temperature, medium composition, oxygen concentration, etc). From the several works presented in this chapter it was possible to verify that flow cells and microtiter plates are the most used platforms for in vitro biofilm formation studies.
Flow cells are commonly used in biofilm studies since it is easy to manipulate the hydrodynamics of the flow surrounding the biofilms (Robert et al. 2010). These systems are custom-made and are typically composed by pumps and tubes required to circulate the growth medium and the cellular suspension to a chamber where the biofilms are formed and a vessel for waste collection (Coenye et al. 2010). They can be used as “open” systems in which growth medium with nutrients is continuously added and waste-products continuously removed. The semi-circular flow cells, the PPFC and the microchannels (Figure 2.2) are the typical flow systems used for biofilm studies (Table 2.1 and 2.2) and their selection is usually based in the particularities of each system which best fit the purpose of the work (Coenye et al. 2010).
The semi-circular flow cells (Figure 2.2a) have been used as platform to mimic industrial pipes or equipment since turbulent flows are usually generated (Teodósio et al. 2012). Additionally their dimensions (usually in m) are closer to the ones commonly found in industrial settings (Teodósio et al. 2011). The design of these flow cells, should allow for the flow to develop until steady flow conditions are reached. In the steady flow location, a number of individual ports is placed in a linear array along the flow cell. Coupons made of different materials can be placed on these ports enabling testing of different surfaces (Zhang et al. 2011). In these coupons biofilms will grow under defined hydrodynamic conditions. However, after biofilm growth (usually after several days), these coupons must be removed from the system for analysis (Zhang et al. 2011). To visualize biofilm formation and development in real time, a PPFC (Figure 2.2b) should be used (Busscher et al. 2006). This system is normally used to follow the first steps of biofilm formation (usually during some hours) in controlled conditions that mimic real environments. This system also enables testing of different surfaces which are placed in the zone of stabilized flow (Bakker et al. 2003b; Busscher et al. 2006). Their dimensions are usually in cm and thus are easier to handle and require lower volumes (usually in mL) than the large flow cells (usually in L) (Teodósio et al. 2013b). Due to their small dimensions and reduced cost, PPFC´s also can be used to conduct experiments in parallel under the same operational conditions which enables a higher throughput than large flow cells (Barros et al. 2013).

Chapter 2
25
Figure 2.2 Flow systems: a) Semi-circular flow cell system, b) PPFC system, c) Microchannel system
To mimic phenomena at the microscale, microchannels are often used (Figure 2.2c). This system also enables real-time visualization of bacterial adhesion/biofilm development in conditions which mimic in vivo environments (Kim et al. 2012). This system allows the control of the hydrodynamic conditions (e.g. shear stress), to test different materials and it can be used as a high-throughput platform (Situma et al. 2006) The main advantage of the microchannel is the low reagent and sample volume (usually in µL) which leads to a reduction of operational costs and, due to the small size, it is easy to handle (Aimee et al. 2013). However, this platform has as disadvantages, namely the fabrication process which is time-consuming, labor-intensive and expensive since microchannels cannot be reused as the other flow systems (Situma et al. 2006). However, the use of these flow systems is generally impractical when many concurrent (in the same conditions) tests over a range of operational conditions (composition of the growth medium, hydrodynamics, temperature, etc) are required (Robert et al. 2010). Therefore, high-throughput platforms are commonly used for biofilm studies when parallel tests are needed in a short time period (Robert et al. 2010). The most widely used high-throughput platforms are microtiter plates (Figure 2.3). In these systems, biofilm can grow directly in the bottom and in the walls (Gomes et al. 2014a) of the wells (most commonly a 96-well plate) or they can be grown on the surface

Chapter 2
26
of coupons placed in the wells of the plates (most commonly 6, 12, 24 well plates) (Coenye et al. 2010).
Figure 2.3 Illustrative photograph of polystyrene microtiter plates used for biofilm formation: a) 6-well microtiter plate, b) 12-well microtiter plate c) 24-well microtiter plate and d) 96-well microtiter plate.
Microtiter plates are closed systems, in which there is no flow going in or out of the reactor during the experiment and therefore the environment in the wells may change over time (Coenye et al. 2010). The main advantages of this platform is that it is fairly cheap as only small volumes of reagents (in µL) are required. Operation is generally less labor-intensive and does not require specialized equipment (Wouter 2007). This system is commonly used for screening purposes since it is easy to vary multiple parameters (composition of the growth medium, hydrodynamics, temperature, etc) (Coenye et al. 2010). However the hydrodynamics inside these devices are not well understood and thus they have been rarely used to study biofilms formation under controlled hydrodynamic conditions (Büchs 2001; Robert et al. 2010; Gomes et al. 2014b).
2.5 References
Absolum DR, Lamberti FV, Policova Z, Zingg W, Oss CJV, Neumann AW. 1983. Surface thermodynamics of bacterial adhesion. Applied and environmental microbiology 46:90-97.
Ahmed S, Seraji MT, Jahedi J, Hashib MA. 2011. CFD simulation of turbulence promoters in a tubular membrane channel. Desalination. 276:191-198.
Aimee KW, Laura H, Matthew RP, Marvin W. 2013. Going local: technologies for exploring bacterial microenvironments. Nature Reviews Microbiology. 11:337-348.
Alan B, Buehler K, Schmid A. 2012. Biofilms as living catalysts in continuous chemical syntheses. Trends in Biotechnology. 30:453-465.
Alwiczek M, Qu Y, Gardiner J, Strugnell RA, Lithgow T, McLean KM, Thissen H. 2014. Emerging rules for effective antimicrobial coatings. Trends in Biotechnology. 32:82-90.
An YH, Friedman RJ. 1998. Concise review of mechanisms of bacterial adhesion to biomaterial surfaces. Journal of Biomedical Materials Research. 43:338-348.
Asan J, Crawford RJ, Ivanova EP. 2013. Antibacterial surfaces: the quest for a new generation of biomaterials. Trends in Biotechnology. 31:295-304.
Ash SR. 2008. Advances in Tunneled Central Venous Catheters for Dialysis: Design and Performance. Seminars in Dialysis. 21:504-515.
Augst AD, Ariff B, McG. Thom SAG, Xu XY, Hughes AD. 2007. Analysis of complex flow and the relationship between blood pressure, wall shear stress, and intima-media thickness in the human carotid artery. American Journal of Physiology - Heart and Circulatory Physiology. 293:H1031-H1037.

Chapter 2
27
Azeredo J, Visser J, Oliveira R. 1999. Exopolymers in bacterial adhesion: interpretation in terms of DLVO and XDLVO theories. Colloids and Surfaces B: Biointerfaces. 14:141-148.
Azevedo NF, Pinto AR, Reis NM, Vieira MJ, Keevil CW. 2006. Shear stress, temperature, and inoculation concentration influence the adhesion of water-stressed Helicobacter pylori to stainless steel 304 and polypropylene. Appl. Environ. Microbiol. 72:2936-2941.
Bakker DP, Klijnstra JW, Busscher HJ, van der Mei HC. 2003a. The effect of dissolved organic carbon on bacterial adhesion to conditioning films adsorbed on glass from natural seawater collected during different seasons. Biofouling. 19:391-397.
Bakker DP, van der Plaats A, Verkerke GJ, Busscher HJ, van der Mei HC. 2003b. Comparison of velocity profiles for different flow chamber designs used in studies of microbial adhesion to surfaces. Appl. Environ. Microbiol. 69:6280-6287.
Barrett TA, Wu A, Zhang H, Levy MS, Lye GJ. 2010. Microwell engineering characterization for mammalian cell culture process development. Biotechnology and Bioengineering. 105:260-275.
Barros J, Grenho L, Manuel CM, Ferreira C, Melo LF, Nunes OC, Monteiro FJ, Ferraz MP. 2013. A modular reactor to simulate biofilm development in orthopedic materials. International Microbiology. 16:191-198.
Barton AJ, Sagers RD, Pitt WG. 1996. Bacterial adhesion to orthopedic implant polymers. Journal of biomedical materials research. 30:403-410.
Bayoudh S, Othmane A, Bettaieb F, Bakhrouf A, Ouada HB, Ponsonnet L. 2006. Quantification of the adhesion free energy between bacteria and hydrophobic and hydrophilic substrata. Materials Science and Engineering: C. 26:300-305.
Behkam B, Sitti M. 2008. Effect of quantity and configuration of attached bacteria on bacterial propulsion of microbeads. Applied Physics Letters. 93:-.
Boks NP, Norde W, van der Mei HC, Busscher HJ. 2008. Forces involved in bacterial adhesion to hydrophilic and hydrophobic surfaces. Microbiology. 154:3122-3133.
Bos R, van der Mei HC, Busscher HJ. 1995. A quantitative method to study co-adhesion of microorganisms in a parallel plate flow chamber. II: Analysis of the kinetics of co-adhesion. Journal of Microbiological Methods. 23:169-182.
Bos R, van der Mei HC, Busscher HJ. 1999. Physico-chemistry of initial microbial adhesive interactions – its mechanisms and methods for study. FEMS Microbiology Reviews. 23:179-230.
Branda SS, Vik Å, Friedman L, Kolter R. 2005. Biofilms: the matrix revisited. Trends in Microbiology. 13:20-26.
Bruinsma GM, van der Mei HC, Busscher HJ. 2001. Bacterial adhesion to surface hydrophilic and hydrophobic contact lenses. Biomaterials. 22:3217-3224.
Bryers JD. 2008. Medical biofilms. Biotechnology and Bioengineering. 100:1-18.
Büchs J. 2001. Introduction to advantages and problems of shaken cultures. Biochemical Engineering Journal. 7:91-98.
Buergers R, Rosentritt M, Handel G. 2007. Bacterial adhesion of Streptococcus mutans to provisional fixed prosthodontic material. The Journal of Prosthetic Dentistry. 98:461-469.
Busscher HJ, van der Mei HC. 2006. Microbial adhesion in flow displacement systems. Clinical Microbiology Reviews. 19:127-141.
Busscher HJ, van der Mei HC, Subbiahdoss G, Jutte PC, van den Dungen JJAM, Zaat SAJ, Schultz MJ, Grainger DW. 2012. Biomaterial-associated infection: locating the finish line in the race for the surface. Science Translational Medicine. 4:153rv110.

Chapter 2
28
Campoccia D, Montanaro L, Arciola CR. 2013a. A review of the clinical implications of anti-infective biomaterials and infection-resistant surfaces. Biomaterials. 34:8018-8029.
Campoccia D, Montanaro L, Arciola CR. 2013b. A review of the biomaterials technologies for infection-resistant surfaces. Biomaterials. 34:8533-8554.
Chen G, Zhu H. 2005. Bacterial adhesion to silica sand as related to Gibbs energy variations. Colloids and Surfaces B: Biointerfaces. 44:41-48.
Chesterton AKS, Moggridge GD, Sadd PA, Wilson DI. 2011. Modelling of shear rate distribution in two planetary mixtures for studying development of cake batter structure. Journal of Food Engineering. 105:343-350.
Coenye T, Nelis HJ. 2010. In vitro and in vivo model systems to study microbial biofilm formation. Journal of Microbiological Methods. 83:89-105.
Conant CG, Nevill JT, Zhou Z, Dong J-F, Schwartz MA, Ionescu-Zanetti C. 2011. Using well-plate microfluidic devices to conduct shear-based thrombosis assays. Journal of the Association for Laboratory Automation. 16:148-152.
Cooksey KE, Wigglesworth-Cooksey B. 1995. Adhesion of bacteria and diatoms to surfaces in the sea: A review. Aquatic Microbial Ecology 9:87-96.
Cooper IR, Hanlon GW. 2010. Resistance of Legionella pneumophila serotype 1 biofilms to chlorine-based disinfection. Journal of Hospital Infection. 74:152-159.
Cunliffe D, Smart CA, Alexander C, Vulfson EN. 1999. Bacterial adhesion at synthetic surfaces. Applied and Environmental Microbiology. 65:4995-5002.
Dat NM, Hamanaka D, Tanaka F, Uchino T. 2010. Surface conditioning of stainless steel coupons with skim milk solutions at different pH values and its effect on bacterial adherence. Food Control. 21:1769-1773.
Dourou D, Beauchamp CS, Yoon Y, Geornaras I, Belk KE, Smith GC, Nychas G-JE, Sofos JN. 2011. Attachment and biofilm formation by Escherichia coli O157:H7 at different temperatures, on various food-contact surfaces encountered in beef processing. International Journal of Food Microbiology. 149:262-268.
Dufour D, Leung V, Lévesque CM. 2010. Bacterial biofilm: structure, function, and antimicrobial resistance. Endodontic Topics. 22:2-16.
Dunne WM. 2002. Bacterial adhesion: seen any good biofilms lately? Clinical Microbiology Reviews. 15:155-166.
Fang B, Gon S, Park M-H, Kumar K-N, Rotello VM, Nüsslein K, Santore MM. 2012. Using flow to switch the valency of bacterial capture on engineered surfaces containing immobilized nanoparticles. Langmuir. 28:7803-7810.
Fernández ICS, van der Mei HC, Lochhead MJ, Grainger DW, Busscher HJ. 2007. The inhibition of the adhesion of clinically isolated bacterial strains on multi-component cross-linked poly(ethylene glycol)-based polymer coatings. Biomaterials. 28:4105-4112.
Florjanic M, Kristl J. 2011. The control of biofilm formation by hydrodynamics of purified water in industrial distribution system. International Journal of Pharmaceutics. 405:16-22.
Fonseca AP, Granja PL, Nogueira JA, Oliveira DR, Barbosa MA. 2001. Staphylococcus epidermidis RP62A adhesion to chemically modified cellulose derivatives. Journal of Materials Science: Materials in Medicine. 12:543-548.
Giddens D, Zarins C, Glagov S. 1993. The role of fluid mechanics in the localization and detection of atherosclerosis. J Biomech Eng. . 115:588-594.
Gjersing EL, Codd SL, Seymour JD, Stewart PS. 2005. Magnetic resonance microscopy analysis of advective transport in a biofilm reactor. Biotechnology and Bioengineering. 89:822-834.

Chapter 2
29
Gomes LC, Moreira JMR, Miranda JM, Simões M, Melo LF, Mergulhão FJ. 2013. Macroscale versus microscale methods for physiological analysis of biofilms formed in 96-well microtiter plates. Journal of Microbiological Methods. 95:342-349.
Gomes LC, Moreira JM, Simões M, Melo LF, Mergulhão FJ. 2014a. Biofilm localization in the vertical wall of shaking 96-well plates. Scientifica. Article ID231083.
Gomes LC, Moreira JMR, Teodósio JS, Araújo JDP, Miranda JM, Simões M, Melo LF, Mergulhão FJ. 2014b. 96-well microtiter plates for biofouling simulation in biomedical settings. Biofouling. 1-12.
Goulter RM, Gentle IR, Dykes GA. 2009. Issues in determining factors influencing bacterial attachment: a review using the attachment of Escherichia coli to abiotic surfaces as an example. Letters in Applied Microbiology. 49:1-7.
Graham MV, Mosier AP, Kiehl TR, Kaloyeros AE, Cady NC. 2013. Development of antifouling surfaces to reduce bacterial attachment. Soft Matter. 9:6235-6244.
Gu H, Ren D. 2014. Materials and surface engineering to control bacterial adhesion and biofilm formation: A review of recent advances. Frontiers of Chemical Science and Engineering. 8:20-33.
Habimana O, Semião AJC, Casey E. 2014. The role of cell-surface interactions in bacterial initial adhesion and consequent biofilm formation on nanofiltration/reverse osmosis membranes. Journal of Membrane Science. 454:82-96.
Halake K, Birajdar M, Kim BS, Bae H, Lee C, Kim YJ, Kim S, Kim HJ, Ahn S, An SY, Lee J. 2014. Recent application developments of water-soluble synthetic polymers. Journal of Industrial and Engineering Chemistry.
Harding JL, Reynolds MM. 2014. Combating medical device fouling. Trends in Biotechnology. 32:140-146.
Harker KS, Jivan E, McWhorter FY, Liu WF, Lodoen MB. 2014. Shear forces enhance Toxoplasma gondii Tachyzoite motility on vascular endothelium. mBio. 5.
Hong Z, Rong X, Cai P, Dai K, Liang W, Chen W, Huang Q. 2012. Initial adhesion of Bacillus subtilis on soil minerals as related to their surface properties. European Journal of Soil Science. 63:457-466.
Inauen W, Baumgartner HR, Bombeli T, Haeberli A, Straub PW. 1990. Dose- and shear rate-dependent effects of heparin on thrombogenesis induced by rabbit aorta subendothelium exposed to flowing human blood. Arteriosclerosis, Thrombosis, and Vascular Biology. 10:607-615.
Ista L, López G. 2013. Thermodynamic analysis of marine bacterial attachment to oligo(ethylene glycol)-terminated self-assembled monolayers. Biointerphases. 8:1-11.
Jansen B, Kohnen W. 1995. Prevention of biofilm formation by polymer modification. Journal of Industrial Microbiology. 15:391-396.
Jensen BBB, Friis A. 2005a. Predicting the cleanability of mix-proof valves by use of wall shear stress. Journal of Food Process Engineering. 28:89-106.
Jensen BBB, Friis A, Benezech T, Legentilhomme P, Lelievre C. 2005b. Local wall shear stress variations predicted by computational fluid dynamics for hygienic design. Food and bioproducts processing 83:53-60.
Kaali P, Strömberg E, Karlsson S. 2011. Biomedical engineering, trends in materials science. InTech. 22, Prevention of biofilm associated infections and degradation of polymeric materials used in biomedical applications.
Katsikogianni M, Amanatides E, Mataras D, Missirlis YF. 2008. Staphylococcus epidermidis adhesion to He, He/O2 plasma treated PET films and aged materials: Contributions of surface free energy and shear rate. Colloids and Surfaces B: Biointerfaces. 65:257-268.
Katsikogianni MG, Missirlis YF. 2010. Interactions of bacteria with specific biomaterial surface chemistries under flow conditions. Acta Biomaterialia. 6:1107-1118.
Chapter 2
30
Khan MMT, Chapman T, Cochran K, Schuler AJ. 2013. Attachment surface energy effects on nitrification and estrogen removal rates by biofilms for improved wastewater treatment. Water Research. 47:2190-2198.
Kim J, Hegde M, Kim SH, Wood TK, Jayaraman A. 2012. A microfluidic device for high throughput bacterial biofilm studies. Lab on a Chip. 12:1157-1163.
Kochkodan V, Tsarenko S, Potapchenko N, Kosinova V, Goncharuk V. 2008. Adhesion of microorganisms to polymer membranes: a photobactericidal effect of surface treatment with TiO2. Desalination. 220:380-385.
Konuklar G, Gunasekaran S. 2002. Rennet-induced milk coagulation by continuous steady shear stress. Journal of Colloid and Interface Science. 250:149-158.
Koseoglu H, Aslan G, Esen N, Sen BH, Coban H. 2006. Ultrastructural stages of biofilm development of Escherichia coli on urethral catheters and effects of antibiotics on biofilm formation. Urology. 68:942-946.
Kostenko V, Salek MM, Sattari P, Martinuzzi RJ. 2010. Staphylococcus aureus biofilm formation and tolerance to antibiotics in response to oscillatory shear stresses of physiological levels. FEMS Immunology & Medical Microbiology. 59:421-431.
Lecuyer S, Rusconi R, Shen Y, Forsyth A, Vlamakis H, Kolter R, Stone HA. 2011. Shear stress increases the residence time of adhesion of Pseudomonas aeruginosa. Biophysical Journal. 100:341-350.
Lelièvre C, Legentilhomme P, Gaucher C, Legrand J, Faille C, Bénézech T. 2002. Cleaning in place: effect of local wall shear stress variation on bacterial removal from stainless steel equipment. Chemical Engineering Science. 57:1287-1297.
Li B, Logan BE. 2004. Bacterial adhesion to glass and metal-oxide surfaces. Colloids and Surfaces B: Biointerfaces. 36:81-90.
Li ZJ, Mohamed N, Ross JM. 2000. Shear stress affects the kinetics of Staphylococcus aureus adhesion to collagen. Biotechnology Progress. 16:1086-1090.
Liu C, Zhao Q, Liu Y, Wang S, Abel EW. 2008. Reduction of bacterial adhesion on modified DLC coatings. Colloids and Surfaces B: Biointerfaces. 61:182-187.
Liu C, Zhao Q. 2011a. Influence of surface-energy components of Ni–P–TiO2–PTFE nanocomposite coatings on bacterial adhesion. Langmuir. 27:9512-9519.
Liu C, Zhao Q. 2011b. The CQ ratio of surface energy components influences adhesion and removal of fouling bacteria. Biofouling. 27:275-285.
Liu Y, Tay J. 2002. The essential role of hydrodynamic shear force in the formation of biofilm and granular sludge. Water Research. 36:1653-1665.
Liu Y, Zhao Q. 2005. Influence of surface energy of modified surfaces on bacterial adhesion. Biophysical Chemistry. 117:39-45.
Liu Z, Lin YE, Stout JE, Hwang CC, Vidic RD, Yu VL. 2006. Effect of flow regimes on the presence of Legionella within the biofilm of a model plumbing system. Journal of Applied Microbiology. 101:437-442.
Lorite GS, Rodrigues CM, Souza AAd, Kranz C, Mizaikoff B, Cotta MA. 2011. The role of conditioning film formation and surface chemical changes on Xylella fastidiosa adhesion and biofilm evolution. Journal of Colloid and Interface Science. 359:289-295.
Loskill P, Zeitz C, Grandthyll S, Thewes N, Müller F, Bischoff M, Herrmann M, Jacobs K. 2013. Reduced adhesion of oral bacteria on hydroxyapatite by fluoride treatment. Langmuir. 29:5528-5533.
Mahfoud C, Samrani A, Mouawad R, Hleihel W, Khatib R, Lartiges B, Ouaïni N. 2009. Disruption of biofilms from sewage pipes under physical and chemical conditioning. Journal of Environmental Sciences China. 1:120-126.
Mareels G. 2007. Experimetal and numerical modeling of flow and mass transport in a bioartificial liver. Civil Engineering, Ghent University.

Chapter 2
31
Mathieu L, Bertrand I, Abe Y, Angel E, Block JC, Skali-Lami S, Francius G. 2014. Drinking water biofilm cohesiveness changes under chlorination or hydrodynamic stress. Water Research. 55:174 - 184.
McClaine JW, Ford RM. 2002. Reversal of flagellar rotation is important in initial attachment of Escherichia coli to glass in a dynamic system with high- and low-ionic-strength buffers. Applied and Environmental Microbiology. 68:1280-1289.
Melo L, Flemming H. 2010. The science and technology of industrial water treatment. Taylor and Francis Group.
Meyer B. 2003. Approaches to prevention, removal and killing of biofilms. International Biodeterioration & Biodegradation. 51:249-253.
Michelson A. 2002. Platelets. 2nd. New york: Academic Press.
Millsap KW, Reid G, van der Mei HC, Busscher HJ. 1997. Adhesion of Lactobacillus species in urine and phosphate buffer to silicone rubber and glass under flow. Biomaterials. 18:87-91.
Missirlis YF, Katsikogianni M. 2004. Concise review of mechanisms of bacterial adhesion to biomaterials and of techniques used in estimating bacteria-material interactions. Cells and Materials. 8:37-57.
Mohamed N, Rainier TR, Ross JM. 2000. Novel experimental study of receptor-mediated bacterial adhesion under the influence of fluid shear. Biotechnology and Bioengineering. 68:628-636.
Monroe D. 2007. Looking for chinks in the armor of bacterial biofilms. PLoS Biol. 5:e307.
Moreira JMR, Teodósio JS, Silva FC, Simões M, Melo LF, Mergulhão FJ. 2013. Influence of flow rate variation on the development of Escherichia coli biofilms. Bioprocess and Biosystems Engineering. 36:1787-1796.
Morsi Y, Kogure M, Umezu M. 1999. Relative blood damage index of the jellyfish valve and the Bjork-Shiley tilting-disk valve. Journal of Artificial Organs. 2:163-169.
Munn LL, Melder RJ, Jain RK. 1994. Analysis of cell flux in the parallel plate flow chamber: implications for cell capture studies. Biophysical journal. 67:889-895.
Nauman EA, Risic KJ, Keaveny TM, Satcher RL. 1999. Quantitative assessment of steady and pulsatile flow fields in a parallel plate flow chamber. Annals of Biomedical Engineering. 27:194-199.
Nauman EA, Ott CM, Sander E, Tucker DL, Pierson D, Wilson JW, Nickerson CA. 2007. Novel quantitative biosystem for modeling physiological fluid shear stress on cells. Applied and Environmental Microbiology. 73:699-705.
Nicoud F, Vernhet H, Dauzat M. 2005. A numerical assessment of wall shear stress changes after endovascular stenting. Journal of Biomechanics. 38:2019-2027.
Nikolaev Y, Plakunov V. 2007. Biofilm - “City of microbes” or an analogue of multicellular organisms? Microbiology. 76:125-138.
O’Brien TP, Grace P, Walsh M, Burke P, McGloughlin T. 2005. Computational investigations of a new prosthetic femoral-popliteal bypass graft design. Journal of Vascular Surgery. 42:1169-1175.
Oliveira K, Oliveira T, Teixeira P, Azeredo J, Henriques M, Oliveira R. 2006. Comparison of the adhesion ability of different Salmonella Enteritidis Serotypes to materials used in kitchens. Journal of Food Protection. 69:2352-2356.
Pace JL, Rupp ME, Finch RG. 2006. Biofilms, Infection and Antimicrobial Therapy. Boca Raton: CRC pres Taylor and Francis group.
Paramonova E, Kalmykowa OJ, van der Mei HC, Busscher HJ, Sharma PK. 2009. Impact of hydrodynamics on oral biofilm strength. Journal of Dental Research. 88:922-926.

Chapter 2
32
Park SJ, Bae H, Kim J, Lim B, Park J, Park S. 2010. Motility enhancement of bacteria actuated microstructures using selective bacteria adhesion. Lab on a Chip. 10:1706-1711.
Park SJ, Park S-H, Cho S, Kim D-M, Lee Y, Ko SY, Hong Y, Choy HE, Min J-J, Park J-O, Park S. 2014. New paradigm for tumor theranostic methodology using bacteria-based microrobot. Sci Rep. 3.
Parnian B. 2009. Calcification of polyurethane heart valve prosthesis. College of Engineering. Department of Mechanical and Industrial Engineering.,
Patel JD, Ebert M, Stokes K, Ward R, Anderson JM. 2003. Inhibition of bacterial and leukocyte adhesion under shear stress conditions by material surface chemistry. Journal of Biomaterials Science Polymer. 14:279-295.
Perni S, Preedy EC, Prokopovich P. 2013. Success and failure of colloidal approaches in adhesion of microorganisms to surfaces. Advances in Colloid and Interface Science.
Petrova OE, Sauer K. 2012. Sticky situations - Key components that control bacterial surface attachment. Journal of Bacteriology. 194:2413–2425.
Peyton BM. 1996. Effects of shear stress and substrate loading rate on Pseudomonas aeruginosa biofilm thickness and density. Water Research. 30:29-36.
Pham HT, Boon N, Aelterman P, Clauwaert P, De Schamphelaire L, van Oostveldt P, Verbeken K, Rabaey K, Verstraete W. 2008. High shear enrichment improves the performance of the anodophilic microbial consortium in a microbial fuel cell. Microbial Biotechnology. 1:487-496.
Pratt-Terpstra IH, Weerkamp AH, Busscher HJ. 1987. Adhesion of oral Streptococci from a flowing suspension to uncoated and albumin-coated surfaces. Journal of General Microbiology. 133:3199-3206.
Purevdorj B, Costerton JW, Stoodley P. 2002. Influence of hydrodynamics and cell signaling on the structure and behavior of Pseudomonas aeruginosa biofilms. Applied and Environmental Microbiology. 68:4457-4464.
Qureshi N, Annous B, Ezeji T, Karcher P, Maddox I. 2005. Biofilm reactors for industrial bioconversion processes: employing potential of enhanced reaction rates. Microbial Cell Factories. 4:24.
Renner LD, Weibel DB. 2011. Physicochemical regulation of biofilm formation. MRS Bulletin. 36:347-355.
Restrepo-Flórez J-M, Bassi A, Rehmann L, Thompson MR. 2014. Investigation of biofilm formation on polyethylene in a diesel/biodiesel fuel storage environment. Fuel. 128:240-247.
Robert JM, Salek MM. 2010. Numerical Simulations - examples and applications in computational fluid dynamics. Canada: InTech. Numerical simulation of fluid flow and hydrodynamic analysis in commonly used biomedical devices in biofilm studies.
Rochex A, Lebeault JM. 2007. Effects of nutrients on biofilm formation and detachment of a Pseudomonas putida strain isolated from a paper machine. Water Research. 41:2885-2892.
Ronald LS. 2011. Analysis of pathoadaptive mutations in Escherichia coli. ProQuest, UMI dissertation publishing.
Roosjen A, Boks NP, van der Mei HC, Busscher HJ, Norde W. 2005. Influence of shear on microbial adhesion to PEO-brushes and glass by convective-diffusion and sedimentation in a parallel plate flow chamber. Colloids and Surfaces B: Biointerfaces. 46:1-6.
Ross JM, Alevriadou BR, McIntire LV. 1998. Thrombosis and Hemorrhage. Baltimore, MD: Williams & Wilkins. 17, Rheology.
Salek MM, Jones SM, Martinuzzi RJ. 2009. The influence of flow cell geometry related shear stresses on the distribution, structure and susceptibility of Pseudomonas aeruginosa 01 biofilms. Biofouling. 25:711-725.
Salek MM, Sattari P, Martinuzzi RJ. 2011. Analysis of fluid flow and wall shear stress patterns inside partially filled agitated culture well plates. Annals of Biomedical Engineering. 40:707-728.

Chapter 2
33
Shao W, Zhao Q. 2010. Effect of corrosion rate and surface energy of silver coatings on bacterial adhesion. Colloids and Surfaces B: Biointerfaces. 76:98-103.
Shi W, Benjamin MM. 2011. Effect of shear rate on fouling in a vibratory shear enhanced processing (VSEP) RO system. Journal of Membrane Science. 366:148-157.
Shi X, Zhu X. 2009. Biofilm formation and food safety in food industries. Trends in Food Science & Technology. 20:407-413.
Shive MS, Hasan SM, Anderson JM. 1999. Shear stress effects on bacterial adhesion, leukocyte adhesion, and leukocyte oxidative capacity on a polyetherurethane. Journal of Biomedical Materials Research. 46:511-519.
Shumi W, Kim SH, Lim J, Cho K-S, Han H, Park S. 2013. Shear stress tolerance of Streptococcus mutans aggregates determined by microfluidic funnel device (µFFD). Journal of Microbiological Methods. 93:85-89.
Shunmugaperumal T. 2010. Biofilm eradication and prevention: a pharmaceutical approach to medical device infections. New Jersey: Wiley.
Silverstein AD, Henry GD, Evans B, Pasmore M, Simmons CJ, Donatucci CF. 2006. Biofilm formation on clinically noninfected penile prostheses. The Journal of Urology. 176:1008-1011.
Simões LC, Simões M, Oliveira R, Vieira MJ. 2007. Potential of the adhesion of bacteria isolated from drinking water to materials. Journal of Basic Microbiology. 47:174-183.
Simões M, Simões LC, Vieira MJ. 2010. A review of current and emergent biofilm control strategies. LWT - Food Science and Technology. 43:573-583.
Singh PK, Marzo A, Howard B, Rufenacht DA, Bijlenga P, Frangi AF, Lawford PV, Coley SC, Hose DR, Patel UJ. 2010. Effects of smoking and hypertension on wall shear stress and oscillatory shear index at the site of intracranial aneurysm formation. Clinical Neurology and Neurosurgery. 112:306-313.
Singh R, Paul D, Jain RK. 2006. Biofilms: implications in bioremediation. Trends in Microbiology. 14:389-397.
Situma C, Hashimoto M, Soper SA. 2006. Merging microfluidics with microarray-based bioassays. Biomolecular Engineering. 23:213-231.
Skovager A, Whitehead K, Siegumfeldt H, Ingmer H, Verran J, Arneborg N. 2012. Influence of flow direction and flow rate on the initial adhesion of seven Listeria monocytogenes strains to fine polished stainless steel. International Journal of Food Microbiology. 157:174-181.
Sutherland IW. 2001. The biofilm matrix – an immobilized but dynamic microbial environment. Trends in Microbiology. 9:222-227.
Szlavik J, Paiva DS, Mørk N, van den Berg F, Verran J, Whitehead K, Knøchel S, Nielsen DS. 2012. Initial adhesion of Listeria monocytogenes to solid surfaces under liquid flow. International Journal of Food Microbiology. 152:181-188.
Teodósio JS, Simões M, Melo LF, Mergulhão FJ. 2011. Flow cell hydrodynamics and their effects on E. coli biofilm formation under different nutrient conditions and turbulent flow. Biofouling. 27:1-11.
Teodósio JS, Simões M, Alves MA, Melo L, Mergulhão F. 2012. Setup and validation of flow cell systems for biofouling simulation in industrial settings. The Scientific World Journal ID 361496.
Teodósio JS, Silva FC, Moreira JMR, Simões M, Melo L, Mergulhão FJ. 2013a. Flow cells as quasi Ideal systems for biofouling simulation of industrial piping systems. Biofouling. 29:953-966.
Teodósio JS, Simões M, Melo L, Mergulhão FJ. 2013b. Biofilms in bioengineering. Nova science publishers 3, Platforms for in vitro biofilm studies.

Chapter 2
34
Thomas WE, Trintchina E, Forero M, Vogel V, Sokurenko EV. 2002. Bacterial adhesion to target cells enhanced by shear force. Cell. 109:913-923.
Tran VB, Fleiszig SMJ, Evans DJ, Radke CJ. 2011. Dynamics of flagellum- and pilus-mediated association of Pseudomonas aeruginosa with contact lens surfaces. Applied and Environmental Microbiology. 77:3644-3652.
Treter J, Bonatto F, Krug C, Soares GV, Baumvol IJR, Macedo AJ. 2014. Washing-resistant surfactant coated surface is able to inhibit pathogenic bacteria adhesion. Applied Surface Science. 303:147-154.
van der Mei HC, van de Belt-Gritter B, Reid G, Bialkowska-Hobrzanska H, Busscher HJ. 1997. Adhesion of coagulase-negative staphylococci grouped according to physico-chemical surface properties. Microbiology. 143:3861-3870.
Van Houdt R, Michiels CW. 2010. Biofilm formation and the food industry, a focus on the bacterial outer surface. Journal of Applied Microbiology. 109:1117-1131.
van Oss CJ. 1995. Hydrophobicity of biosurfaces — Origin, quantitative determination and interaction energies. Colloids and Surfaces B: Biointerfaces. 5:91-110.
Velraeds MMC, van de Belt-Gritter B, Van der Mei HC, Reid G, Busscher HJ. 1998. Interface in initial adhesion of uropathogenic bacteria and yeasts to silicone rubber by a Lactobacillus acidophilos biosurfactant Journal of Medical Microbiology. 47:1081-1085.
Vinage I, Rohr P. 2003. Biological waste gas treatment with a modified rotating biological contactor. I.Control of biofilm growth and long-term performance. Bioprocess and Biosystems Engineering. 26:69-74.
Wang H, Sodagari M, Ju L-K, Zhang Newby B-m. 2013. Effects of shear on initial bacterial attachment in slow flowing systems. Colloids and Surfaces B: Biointerfaces. 109:32-39.
Weaver WM, Milisavljevic V, Miller JF, Di Carlo D. 2012. Fluid flow induces biofilm formation in Staphylococcus epidermidis polysaccharide intracellular adhesin-positive clinical isolates. Applied and Environmental Microbiology. 78:5890-5896.
Wouter AD. 2007. Microtiter plates as mini-bioreactors: miniaturization of fermentation methods. Trends in Microbiology. 15:469-475.
Yamamoto Y, Uno T, Joko T, Shiraishi A, Ohashi Y. 2010. Effect of anterior chamber depth on shear stress exerted on corneal endothelial cells by altered aqueous flow after laser iridotomy. Investigative Ophthalmology & Visual Science. 51:1956-1964.
Yataghene M, Pruvost J, Fayolle F, Legrand J. 2008. CFD analysis of the flow pattern and local shear rate in a scraped surface heat exchanger. Chemical Engineering and Processing: Process Intensification. 47:1550-1561.
Ymele-Leki P, Ross JM. 2007. Erosion from Staphylococcus aureus biofilms grown under physiologically relevant fluid shear forces yields bacterial cells with reduced avidity to collagen. Applied and Environmental Microbiology. 73:1834-1841.
Yu W, Qu H, Hu G, Zhang Q, Song K, Guan H, Liu T, Qin J. 2014. A microfluidic-based multi-shear device for investigating the effects of low fluid-induced stresses on osteoblasts. PLoS ONE. 9:e89966.
Zhang W, Sileika TS, Chen C, Liu Y, Lee J, Packman AI. 2011. A novel planar flow cell for studies of biofilm heterogeneity and flow–biofilm interactions. Biotechnology and Bioengineering. 108:2571-2582.

Chapter 3
35
Chapter 3 Biofilm formation in a semi-circular flow cell: effect of hydrodynamics and mass transfer
Several in vitro platforms are available for biofilm studies and flow cells are widely used. Large-scale flow cells are advantageous because they contain a large number of coupons enabling simultaneous testing of different surfaces or performing time-course assays to follow biofilm development. In a previous work, we have shown that semi-circular flow cells are almost ideal to simulate the hydrodynamic conditions found in industrial piping systems. In this chapter, the flow hydrodynamics in a semi-circular flow cell were characterized. The shear stress and maximum flow velocity were estimated by CFD for Re ranging from 100 to 10000. The numerical simulations were made by Dr. Manuel Alves from the Transport Phenomena Research Center (CEFT-FEUP). Additionally, the external mass transfer coefficients were calculated using empirical correlations for the same Re. The effect of two flow rates (corresponding to Re of 4350 and 6720) on the development of E. coli biofilms under turbulent flow conditions was then assessed in a real semi-circular flow cell. This work was made in collaboration with Joana Teodósio which was responsible for the experimental work. Results show that biofilm formation was favored at the lowest flow rate. Additionally, estimations of the shear stress and external mass transfer coefficient indicate that both parameters increase with increasing flow rates. Thus, it seems that biofilm formation was being controlled by the shear stress that promoted biofilm erosion/sloughing and not by mass transfer which would potentiate biofilm growth. These results indicate that high flow rates are preferred at all times to reduce the buildup of bacterial biofilms. For instance, high flow rates should be used during cleaning and disinfection cycles because the increase in shear stress will promote biofilm detachment and also potentiate the effect of biocides and other cleaning agents due to the increased mass transfer from the bulk solution to the surface of the biofilm.
This chapter was adapted from:
Moreira JMR, Simões M, Melo L, Mergulhão FJ. The combined effects of shear stress and mass transfer on the balance between biofilm and suspended cell dynamics. Desalin Water Treat. (in press).

Chapter 3
36
Chapter 3
37
3.1 Introduction
Water scarcity and the increasing costs of water supply and wastewater disposal underlie the growing concern on reducing water usage and wastewater discharge in industry. With technological improvements and the consequent legislation opening to the use of alternative water qualities (e.g. grey water utilization) and social acceptance of water reuse, water systems integration is being implemented in many industries in order to ensure an efficient use of the water resources (Casani et al. 2005; Cartwright 2013). This technology entails the integration of the wastewater generated by an industrial equipment/process after its treatment or directly in the industrial lines by continuous loops of water recirculation (Feng et al. 2007; Majamaa et al. 2010). The potential for water saving in industry is enormous since it has been estimated that the industrial sector is responsible for up to 25% of the total water consumption in the world (Levine et al. 2002). Some examples of water saving through reuse can be found on the textile industry where water savings can reach 52% per ton of product (Dvarioniene et al. 2007), or in the food industry where savings between 20 and 50% can be reached (Casani et al. 2005). For common industrial settings, it has been estimated that the maximum reuse fraction can reach up to 93% (Levine et al. 2002).
However, this water saving technology can promote biofilm formation since a concentration effect of bacteria and nutrients can occur after some reutilization cycles (Meesters et al. 2003). The buildup of biofilms in the wastewater recycling/reuse units starts with the transport of microorganisms and nutrients to the walls of the equipment/pipes and the consequent attachment and biofilm growth (Melo et al. 2010). Additionally, the increase in the system residence time will also facilitate biofilm growth. This accumulation process promotes a reduction of the flow area, the increase of the pressure drop until complete clogging of the equipment/pipe, pitting corrosion phenomena and heat transfer resistance (Tanji et al. 2007; Polman et al. 2013). Moreover, biofilms can serve as hosts for pathogenic microorganisms which become more resistant to disinfecting agents and promote the contamination of the fluids flowing through the pipes by erosion/sloughing from the biofilm (Shi et al. 2009; Melo et al. 2010). It has been estimated that biofilm development in industrial process lines may represent up to 30% of the plant operating costs (Melo et al. 2010). These include cleaning and disinfection costs, (since a decrease in chemical treatment efficiency implies a higher biocide consumption), costs associated with frequent production downtimes (to perform the cleaning), maintenance and repair costs (due to the earlier and faster equipment degradation by the biofilms) and the increased costs associated with wastewater treatment (which contains a higher concentration of the chemicals used in the cleaning/disinfection process).
In industry, chemical and mechanical actions are combined to remove the biofilms, however some limitations to an efficient disinfection process are observed (Simões et al. 2010; Van Houdt et al. 2010). The mechanical action of scrubbing and scraping may be abrasive and leave scratches that can eventually lodge some microorganisms and promote biofilm development. Some equipment contains crevices and dead spaces that are hard to reach during cleaning and will function as a niche for future biofilm development. Thus, biofilm-related problems do not solely arise from microorganisms which have suddenly

Chapter 3
38
invaded the system, but are sometimes a result of a set of several conditions, such as nutrient concentration (Moreira et al. 2013) and absence of inhibiting factors on biofilm development. Understanding the factors that control the onset and maturation of biofilms in closed loop water systems is key to reduce process downtimes that are necessary for system cleaning and reduce the probability of further contamination. It is known that one of the major determinants for biofilm development is the hydrodynamic conditions of the system (Beyenal et al. 2000; Chen et al. 2005). These conditions will dictate the shear stress on the surfaces where the biofilms form and also the mass transfer of nutrients/biocides and bacteria from the bulk medium to the biofilm.
In this work, CFD tools were used to simulate the hydrodynamics in a flow cell system that mimics industrial piping (Teodósio et al. 2011; Teodósio et al. 2012a). The maximum flow velocity and average wall shear stress were estimated for Re between 100 and 100000. Mass transfer coefficients were also calculated in order to assess the effects of nutrient transport on biofilm development. A flow cell system was then used to observe experimentally the effect of two distinct flow rates (Re = 4350 and 6720) on planktonic cell concentration and biofilm formation using E. coli JM109(DE3).
3.2 Materials and methods
3.2.1 Mass transport estimation and flow conditions
In this work the rate of nutrient transport from the bulk solution to the liquid-biofilm interface for Re ranging from 100 to 10000 was quantified by the external mass transfer coefficient (Km) obtained from the appropriate correlations (for laminar and turbulent flow regimes).
The Sherwood number (Sh) for a fully developed concentration profile in laminar flow conditions (Re between 100 and 1000) has a constant value of 3.66 (Perry et al. 1997). For turbulent flow, the Sherwood numbers were calculated by correlation (1) as a function of Re valid in the range between Re = 2100 and 35000 and Schmidt number (Sc) in the range between Sc = 0.6 and 3000 (Perry et al. 1997).
3183.0Re023.0 ScSh= (1)
From the Sherwood number, the external mass transfer coefficient can be calculated by:
( )dDShKm = (2)
The Fluent CFD commercial code (version 6.3.26, Fluent Inc.) was used for the numerical simulation of the flow field (for Re ranging from 100 to 10000) in the flow cell reactor as described in Teodósio et al. (2012a). These simulations enabled the determination of the wall shear stress and the maximum flow velocity in the flow cell at different Re.
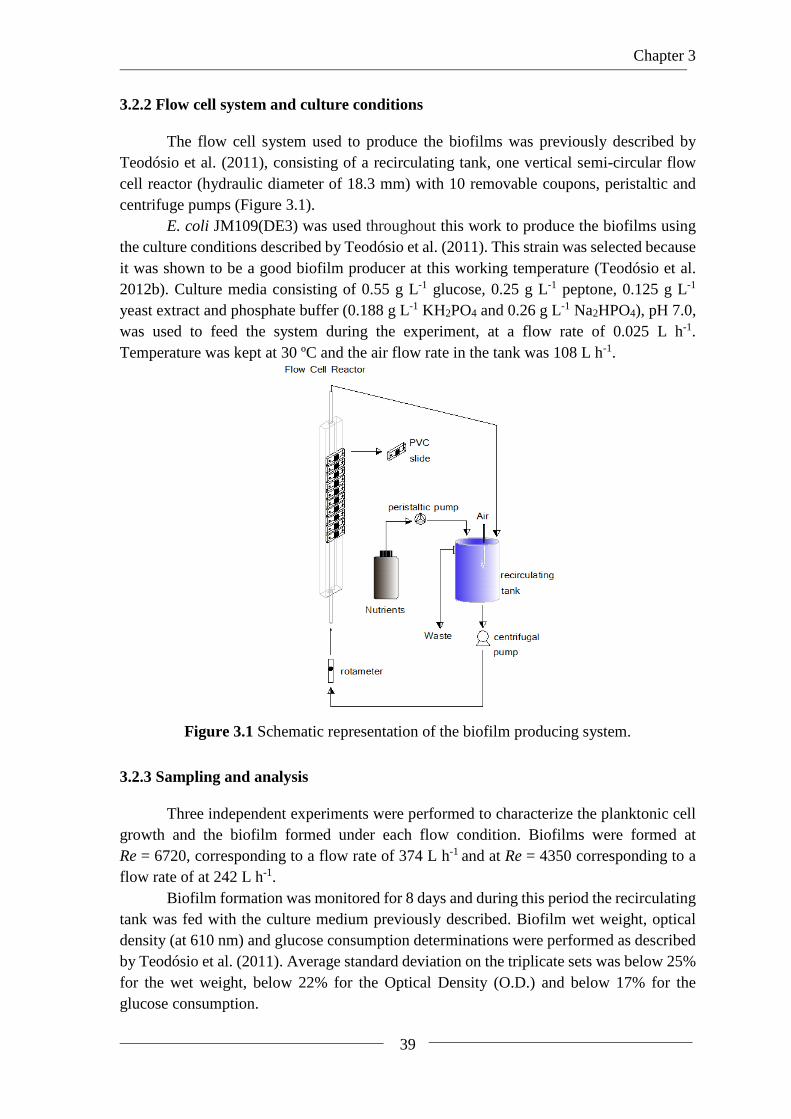
Chapter 3
39
3.2.2 Flow cell system and culture conditions
The flow cell system used to produce the biofilms was previously described by Teodósio et al. (2011), consisting of a recirculating tank, one vertical semi-circular flow cell reactor (hydraulic diameter of 18.3 mm) with 10 removable coupons, peristaltic and centrifuge pumps (Figure 3.1).
E. coli JM109(DE3) was used throughout this work to produce the biofilms using the culture conditions described by Teodósio et al. (2011). This strain was selected because it was shown to be a good biofilm producer at this working temperature (Teodósio et al. 2012b). Culture media consisting of 0.55 g L-1 glucose, 0.25 g L-1 peptone, 0.125 g L-1 yeast extract and phosphate buffer (0.188 g L-1 KH2PO4 and 0.26 g L-1 Na2HPO4), pH 7.0, was used to feed the system during the experiment, at a flow rate of 0.025 L h-1. Temperature was kept at 30 ºC and the air flow rate in the tank was 108 L h-1.
Figure 3.1 Schematic representation of the biofilm producing system.
3.2.3 Sampling and analysis
Three independent experiments were performed to characterize the planktonic cell growth and the biofilm formed under each flow condition. Biofilms were formed at Re = 6720, corresponding to a flow rate of 374 L h-1 and at Re = 4350 corresponding to a flow rate of at 242 L h-1.
Biofilm formation was monitored for 8 days and during this period the recirculating tank was fed with the culture medium previously described. Biofilm wet weight, optical density (at 610 nm) and glucose consumption determinations were performed as described by Teodósio et al. (2011). Average standard deviation on the triplicate sets was below 25% for the wet weight, below 22% for the Optical Density (O.D.) and below 17% for the glucose consumption.

Chapter 3
40
Experimental results are an average of those obtained from the three independent experiments for each flow condition. Each time point was evaluated individually using the three independent results obtained in one condition and the three individual results obtained on the other condition. Paired t-test analyses were performed to estimate whether or not there was a significant difference between these results. When a confidence level greater than 95% was obtained (P < 0.05), these time points were marked with an x.
3.3 Results
The hydrodynamic simulation of the flow cell reactor was made for both laminar and turbulent flow regimes (100 ≤ Re ≤ 10000) using CFD which enabled the determination of the wall shear stress and maximum flow velocity. Nutrient transport by the fluid flow was characterized through Sh and Km which were calculated by correlations.
In figure 3.2a it is possible to see the values obtained for Km and Sh. For laminar flow, Sh and Km values remain constant for Re between 100 and 1000. For the turbulent flow regime both parameters increase and raising Re from 5000 to 10000 (2.0-fold) increases the external mass transfer coefficient by a factor of 1.8 fold.
Figure 3.2 a) Calculated values using correlations for the Sherwood number (solid line) and for the external mass transfer coefficient Km (dashed line). Values for the transition zone (1000 ≤ Re ≤ 2100) were not represented due to the poor reliability of the results generated by empiric correlations in this zone. b) Average wall shear stress (dashed line) and maximum flow velocity (solid line) for Re ranging from 100 to 10000 predicted by CFD.

Chapter 3
41
Figure 3.2b shows that maximum flow velocities between 0.013 and 0.722 m.s-1 and average wall shear stress ranging from 0.002 to 1.19 Pa can be achieved for Re ranging from 100 to 10000 in this flow cell system. As expected, increasing Re increases the maximum flow velocity and the wall shear stress. For laminar flow, raising Re from 100 to 200 (2.0-fold) increases the maximum flow velocity by 1.8 fold and the wall shear stress by 2.1 fold. For the turbulent regime, raising Re from 5000 to 10000 (2.0-fold) increases the maximum flow velocity by 1.9 fold and the wall shear stress by 3.1 fold.
A flow cell reactor was used to assess the influence of two different flow rates on E. coli JM109(DE3) biofilm development under turbulent flow conditions (Re = 4350 and 6720). Figure 3.3 represents the average results obtained for biofilm wet weight, planktonic cell concentration and glucose consumption originating from three independent experiments for each hydrodynamic condition.
Regarding biofilm wet weight (Figure 3.3a), a slight increase was observed for the higher Re during the experimental time. On the other hand, for the lower Re, a marked increase in biofilm wet weight was obtained between days 3 and 7. The maximum biofilm wet weight was reached on day 7 for Re = 4350, and on day 8 for Re = 6720 (57% lower than the maximum value obtained for the less turbulent regime).
Planktonic cell concentration (Figure 3.3b), had a similar behavior (P > 0.05) for both flow conditions until day 4. Between days 4 and 5, a 84% increase in O.D. was obtained for the higher Re. For the lower Re, the planktonic cell concentration only started to increase one day later and at a slower rate. Between days 5 and 7 the planktonic cell concentration values became closer for the two tested hydrodynamic conditions, although higher cell concentrations were obtained with the higher Re (P < 0.05). At the end of experiment (day 8), the maximum value of O.D. reached for Re = 4350 was 44% lower than the maximum value obtained for Re = 6720.
In figure 3.3c it is possible to observe that glucose consumption in the whole system increased throughout the experiment and, with the exception of day 2, consumption profiles for both hydrodynamic conditions were statistically similar (P > 0.05).

Chapter 3
42
Figure 3.3 Time-course evolution of: a) biofilm wet weight, b) optical density in the recirculating tank, c) glucose consumption in the system. Closed symbols – higher flow rate (Re = 6720), open symbols – lower flow rate (Re = 4350). Time points marked with x are those for which a statistical difference was found between both conditions (confidence level greater than 95%, P ˂ 0.05)
3.4 Discussion
In most industrial settings the flow regime is turbulent (Melo et al. 1999; Melo et al. 2010) but even in these cases, certain zones within equipment may have laminar flow characteristics namely when crevices, depressions or dead-zones are found (Asteriadou et al. 2010).
In laminar flow conditions, the influence of the shear forces is less significant and therefore initial cell adhesion is facilitated in this case (Stoodley et al. 1998). Moreover, since the external mass transfer in laminar flows does not improve with higher flow

Chapter 3
43
velocities, some nutrient transport limitations can be anticipated. Thus, thicker biofilms are likely to be formed, with a more porous matrix in order to favour nutrient and oxygen delivery to the deeper layers (Stoodley et al. 1998). During cleaning-in-place (CIP) procedures, the transport of cleaning agents to the biofilm surface can be a limiting step in the disinfection process. Jensen et al. (2005) tried to predict the cleanability of closed food-process equipment based only on the critical wall shear stress obtained by CFD and observed that shear stress alone was insufficient to completely remove the contamination. They concluded that there are some effects such as mass transfer of the detergent solutions to the surface that are very likely to have a strong influence in the cleaning process. Thus, an improvement in the external mass transfer rate can result in a reduction of disinfectant consumption and increase the cleaning efficiency. Our results show that under laminar flow conditions, a variation of 2.0-fold on Re (from 100 to 200) promotes an increase of 2.1 fold in shear stress but with no effect on the external mass transfer coefficient. Under these flow conditions, the ratio between the convective and the diffusive mass transport is constant (since the Sh is unchanged). In turbulent flow conditions, to promote the same increase in the shear stress (2.1 fold), it would be necessary to increase Re only by 1.5 fold (instead of 2.0-fold) which would promote an increase of 1.4 fold in the external mass transfer coefficient. Thus, contrary to laminar flow conditions, a slight increase of Re in cleaning operations during turbulent flow besides improving the external mass transfer (which can be beneficial for the transport of cleaning products) promotes a strong increase in the shear forces and turbulent burst phenomena that have a determinant role on biofilm removal (Stoodley et al. 1998). Moreover, shear forces will promote biomass loss from the external biofilm layer where the cells that exhibit the highest growth rate and are responsible for biofilm growth are located (Gikas et al. 2006). This increase in shear stress can be achieved by a modest increase in the fluid velocity. Although this scenario entails a slightly higher water flow rate during cleaning, the same (or better) cleaning performance may be achieved within a shorter operating time, thus decreasing the overall consumption of water and chemicals.
Wall shear stress and nutrient transport are the most important parameters that influence biofilm formation (Moreira et al. 2013). In industrial settings, turbulent flow is the predominant regime, thus it is interesting to study the effect of increasing the flow rate on biofilm formation under turbulent flow conditions. For the flow rates used in this work (242 and 374 L h-1), an increase of 1.5 fold in the flow rate caused an improvement of 1.4 fold on the external mass transfer. Thus, if mass transfer effects were controlling biofilm growth, higher biofilm amounts would be expected at higher Re, since the transport of nutrients and cells is favored in these conditions. Instead, until day 3, similar amounts of biofilm were formed in both conditions, whereas from this day onwards a higher amount of biofilm was formed at the lower Re. It seems that in the first days a balance occurred between shear forces and external nutrient transport effects: although, nutrient transport to the biofilm surface is favoured at a higher Re, a lower shear stress (lower Re) tends to facilitate cell adhesion (Vieira et al. 1993). After the third day, the biofilm cohesion under a higher Re may have been affected by the stronger shear stress and turbulence intensity that promotes biomass detachment (Vieira et al. 1993). This hypothesis is supported by the higher planktonic cell concentration that was observed. Moreover, although a higher flow

Chapter 3
44
rate does not favour biofilm development, it favours planktonic cell growth since these cells are probably more sensitive to nutrient transport than to the shear stress. Another phenomenon associated with the increase of shear forces is the production of EPS (Liu et al. 2002). It has been shown that biofilm growth originates from initially attached cells (which will result in an active layer) and not from cell deposition from the bulk liquid (Melo et al. 1999). Biofilms formed under lower Re probably have a higher number of active cells, unlike the biofilms formed under higher velocities that are likely to have a higher EPS content (Liu et al. 2002). Since the new microbial cells originate from the active layer, this can explain the higher biofilm amount obtained from day 3 onwards under a lower Re. Under lower flow velocities, this new layer will resist to the weaker shear forces. On the other hand, the biofilm formed under higher fluid velocities, would be thinner and robust with a higher EPS content in order to withstand the strong shear forces (Chen et al. 2005).
Glucose consumption values in the whole system were similar for both flow conditions along the experimental time. Gikas et al. (1999) observed, in a three phase air lift bioreactor, that even if suspended biomass does not represent a significant fraction of the total biomass it can contribute significantly to the total substrate uptake. Thus, substrate consumption in the system results from a combined action of both, planktonic and biofilm cells. This in an indication that the total microbial load on the system might be similar in both cases. It is interesting to observe that despite this fact, the amounts of biofilm formed and the concentration of planktonic cells are different in both situations (higher Re induced less biofilm and more planktonic cells). For industrial scenarios, like the operation of heat exchangers in cooling water systems, a certain amount of microbial load can be tolerated as long as it is not in the form of a biofilm. This is because biofilms cells are more difficult to eliminate and planktonic cells are immediately purged from the system in CIP. Additionally, it is the biofilm buildup that causes the problems associated with increased pressure drop, corrosion and pitting and increased heat transfer resistance (Tanji et al. 2007; Polman et al. 2013). In these cases, if the operational conditions of a certain process are prone to stimulate microbial growth (for instance due to the high concentration of nutrients in recycle loops), it is wise to operate the system using conditions that reduce biofilm formation even if this means that planktonic concentrations may be increased.
The data presented on this work indicates that shear stress effects can be more important than mass transfer limitations on biofilm formation since biofilm growth was favored at lower Re. When higher fluid velocities are used, biofilm buildup is reduced and the transport of biocides and other cleaning agents during the cleaning in place procedures is favored. Additionally, since cell detachment from the biofilm also increases, the effectiveness of the chemical treatment may be enhanced at higher flow velocities, as suspended cells are likely to be much more susceptible to the disinfecting agents.
3.5 References
Asteriadou K, Hasting T, Bird M, Melrose J. 2010. Predicting cleaning of equipment using computational fluid dynamics. Journal of Food Process Engineering. 30:88-105.
Beyenal H, Lewandowski Z. 2000. Combined effect of substrate concentration and flow velocity on effective diffusivity in biofilms. Water Research. 34:528-538.

Chapter 3
45
Cartwright P. 2013. The role of membrane technologies in water reuse applications. Desalination and water treatment. 1-11.
Casani S, Rouhany M, Knøchel S. 2005. A discussion paper on challenges and limitations to water reuse and hygiene in the food industry. Water Research. 39:1134-1146.
Chen MJ, Zhang Z, Bott TR. 2005. Effects of operating conditions on the adhesive strength of Pseudomonas fluorescens biofilms in tubes. Colloids and Surfaces B: Biointerfaces. 43:61-71.
Dvarioniene J, Stasiskiene Z. 2007. Integrated water resource management model for process industry in Lithuania. Journal of Cleaner Production. 15:950-957.
Feng X, Bai J, Zheng X. 2007. On the use of graphical method to determine the targets of single-contaminant regeneration recycling water systems. Chemical Engineering Science. 62:2127-2138.
Gikas P, Livingston AG. 1999. Steady state behaviour of three phase air lift bioreactors – an integrated model and experimental verification. Journal of Chemical Technology & Biotechnology. 74:551-561.
Gikas P, Livingston AG. 2006. Investigation of biofilm growth and attrition in a three-phase airlift bioreactor using 35SO4
2− as a radiolabelled tracer. Journal of Chemical Technology & Biotechnology. 81:858-865.
Jensen BBB, Friis A. 2005. Predicting the cleanability of mix-proof valves by use of wall shear stress. Journal of Food Process Engineering. 28:89-106.
Levine A, Asano T. 2002. Water recycling and resource recovery in industry: analysis, technologies and implementation. IWA publishing. 2, Water reclamation, recycling and reuse in industry.
Liu Y, Tay J. 2002. The essential role of hydrodynamic shear force in the formation of biofilm and granular sludge. Water Research. 36:1653-1665.
Majamaa K, Aerts P, Groot C. 2010. Industrial water reuse with integrated membrane system increases the sustainability of the chemical manufacturing. Desalination and water treatment. 18:17-23.
Meesters KPH, Van Groenestijn JW, Gerritse J. 2003. Biofouling reduction in recirculating cooling systems through biofiltration of process water. Water Research. 37:525-532.
Melo L, Flemming H. 2010. The science and technology of industrial water treatment. Taylor and Francis Group.
Melo LF, Vieira MJ. 1999. Physical stability and biological activity of biofilms under turbulent flow and low substrate concentration. Bioprocess Engineering. 20:363-368.
Moreira JMR, Gomes LC, Araújo JDP, Miranda JM, Simões M, Melo LF, Mergulhão FJ. 2013. The effect of glucose concentration and shaking conditions on Escherichia coli biofilm formation in microtiter plates. Chemical Engineering Science. 94:192-199.
Perry RH, Green DW. 1997. Perry's Chemical Engineers' Handbook. 7th Edition. McGraw-Hill.
Polman H, Verhaart F, Bruijs M. 2013. Impact of biofouling in intake pipes on the hydraulics and efficiency of pumping capacity. Desalination and water treatment. 51:997-1003.
Shi X, Zhu X. 2009. Biofilm formation and food safety in food industries. Trends in Food Science & Technology. 20:407-413.
Simões M, Simões LC, Vieira MJ. 2010. A review of current and emergent biofilm control strategies. LWT - Food Science and Technology. 43:573-583.
Stoodley P, Dodds I, Boyle JD, Lappin-Scott HM. 1998. Influence of hydrodynamics and nutrients on biofilm structure. Journal of Applied Microbiology. 85:19S-28S.
Tanji Y, Nishihara T, Miyanaga K. 2007. Monitoring of biofilm in cooling water system by measuring lactic acid consumption rate. Biochemical Engineering Journal. 35:81-86.

Chapter 3
46
Teodósio JS, Simões M, Melo LF, Mergulhão FJ. 2011. Flow cell hydrodynamics and their effects on E. coli biofilm formation under different nutrient conditions and turbulent flow. Biofouling. 27:1-11.
Teodósio JS, Simões M, Alves MA, Melo L, Mergulhão F. 2012a. Setup and validation of flow cell systems for biofouling simulation in industrial settings. The Scientific World Journal ID 361496.
Teodósio JS, Simões M, Mergulhão FJ. 2012b. The influence of non-conjugative Escherichia coli plasmids on biofilm formation and resistance. Journal of Applied Microbiology. 113:373–382.
Van Houdt R, Michiels CW. 2010. Biofilm formation and the food industry, a focus on the bacterial outer surface. Journal of Applied Microbiology. 109:1117-1131.
Vieira MJ, Melo LF, Pinheiro MM. 1993. Biofilm formation: hydrodynamic effects on internal diffusion and structure. Biofouling. 7:67-80.

Chapter 4
47
Chapter 4 Cell adhesion in a PPFC: the combined influence of hydrodynamics and surface properties
PPFC´s are often used for biofilm studies. If correctly designed they enable operation under defined hydrodynamic conditions, testing of different surface materials and in some cases real-time observation of cell attachment and biofilm development when they are placed under a microscope. In this chapter, the adhesion of E. coli to glass and PDMS at different flow rates (between 1 and 10 ml.s-1) was visualized in a PPFC in order to understand the effect of the hydrodynamic conditions on adhesion in surfaces with different properties. CFD was used to assess the applicability of this flow chamber in the simulation of the hydrodynamics of relevant biomedical systems. Numerical simulations were conducted by Dr. João Miranda and Dr. José Araújo from the Transport Phenomena Research Center (CEFT-FEUP). Wall shear stresses between 0.005 and 0.07 Pa were obtained and these are similar to those found in the circulatory, reproductive and urinary systems. Results demonstrate that E. coli adhesion to hydrophobic PDMS and hydrophilic glass surfaces is modulated by shear stress with surface properties having a stronger effect at the lower and highest flow rates tested and with negligible effects at intermediate flow rates. These findings suggest that when expensive materials or coatings are selected to produce biomedical devices, this choice should take into account the physiological hydrodynamic conditions that will occur during the utilization of those devices.
This chapter was adapted from:
Moreira JMR, Araújo JDP, Miranda JM, Simões M, Melo LF, Mergulhão FJ. The effects of surface properties on Escherichia coli biofilm adhesion are modulated by shear stress. Colloids Surf B Biointerfaces. (Submitted)

Chapter 4
48

Chapter 4
49
4.1 Introduction
Bacteria often adhere to surfaces and form biological communities called biofilms (Kaali et al. 2011) that can develop in almost all types of biomedical devices (Ong et al. 1999; Donlan et al. 2002; Robert et al. 2010; Djeribi et al. 2012). These sessile cells are typically more resistant to antimicrobial agents than planktonic ones, have a decreased susceptibility to host defense systems and function as a source of resistant microorganisms responsible for many hospital-acquired infections (Shunmugaperumal 2010). Moreover, biofilm spreading on the surface upon prolonged use of the biomedical device can cause material biodegradation, changes in surface properties and deterioration of the medical functionality (Missirlis et al. 2004; Kaali et al. 2011).
Different polymers are commonly employed in biomedical devices. These materials should be biocompatible and have to be stable, resistant against different body fluids and display anti-adhesive properties towards microorganisms (Abbasi et al. 2001; Kaali et al. 2011). PDMS is a polymer that has been widely used in biomedical applications like contact lenses, breast implants, catheters, denture lines, blood pumps, pacemakers, tracheostomy tubes and used in correction of vesico-ureteric reflux in the bladder (Abbasi et al. 2001; Aubert 2010; Kaali et al. 2011). These medical devices are often colonized by single bacterial species like E. coli (Castonguay et al. 2006). E. coli is responsible for 80% of the urinary tract infections and it was observed that even after antibiotic therapy it can persist and re-emerge in the bladder and in associated urinary tract biomedical devices (eg urinary catheters) (Koseoglu et al. 2006; Shunmugaperumal 2010; Trautner et al. 2012). E. coli has also been found in breast implants, being responsible for 1.5% of associated infections, pacemakers and contact lenses (Wood 1999; Shunmugaperumal 2010). It has been reported that 60-70% of the hospital acquired infections are associated with indwelling and other percutaneous medical devices and cost $5 billion annually in the US (Pace et al. 2006; Bryers 2008). Additionally, the costs associated with the replacement of infected implants during revision surgery may triple the cost of the primary implant procedure (Busscher et al. 2012). Moreover, secondary implants and devices have a higher infection incidence because antibiotic resistant bacteria residing in the surrounding tissue can proliferate and colonize the recently implanted device (Busscher et al. 2012). Therefore, owing to the problems associated with the increasing use of indwelling medical devices a preventive strategy must be adopted (Shunmugaperumal 2010). Understanding the biofilm formation mechanisms and the factors that influence cell attachment to a surface is essential to prevent and to treat biofilm related diseases. The properties of microbial cells and environmental factors such as surface properties of the biomaterials as well as associated flow conditions affect the process of biofilm formation (Nikolaev et al. 2007).
In-vitro systems have been employed to test the effect of different surfaces on the biofilm formation process under different environmental conditions (Teodósio et al. 2013). Barton et al. (1996) have used a PPFC at a shear rate of 1.9 s-1 to observe the adhesion of S. epidermidis, Pseudomonas aeruginosa, and E. coli to orthopedic implant polymers (poly(orthoester), poly(L-lactic acid), polysulfone, polyethylene, and poly(ether ether ketone)). These authors verified that P. aeruginosa adhered more than S. epidermidis and that the estimated values of the free energy of adhesion correlated with the amount of

Chapter 4
50
adherent cells. Pratt-Terpstra et al. (1987) developed a flow cell system to study the adhesion of three strains of oral streptococci to glass, cellulose acetate and fluorethylenepropylene copolymer at a shear rate of 21 s-1. They verified that a linear correlation was found between the number of bacteria adhering to those surfaces and the free energy of adhesion. Bruinsma et al. (2001) used PPFC at a shear rate of 10 s-1 to study the adhesion of a hydrophobic P. aeruginosa and hydrophilic S. aureus to hydrophobic and hydrophilic hydrogel contact lenses (CL) with and without an adsorbed tear film. The authors observed that the adhesion of P. aeruginosa was more extensive than S. aureus although no difference between hydrophobic and hydrophilic CL was found. Millsap et al. (1997) studied the effect of a hydrophobic silicone rubber and a hydrophilic glass in the adhesion of six Lactobacillus strains using a PPFC at a shear rate of 15 s-1. These authors have also concluded that adhesion to the tested surfaces was not dependent on the hydrophobicity of the materials. These studies revealed that bacterial adhesion is not always correlated with surface properties. It is also apparent that studies performed under different hydrodynamic conditions have led to different conclusions. Thus, the effects of surface properties on bacterial adhesion should be evaluated in different hydrodynamic conditions according to the intended use of that surface.
In this study, the adhesion of E. coli to glass and PDMS under different flow rates was monitored in a PPFC in order to understand the combined effect of the hydrodynamic conditions and surface properties on initial bacterial adhesion. A better understanding of the factors affecting the initial bacterial adhesion is important in the development of strategies to delay the onset of bacterial biofilms in biomedical devices.
4.2 Materials and methods
4.2.1 Numerical simulations
The PPFC used in the present work is represented in figure 4.1. The chamber has a rectangular cross section of 0.8×1.6 cm and a length of 25.42 cm.
Figure 4.1 Schematic representation of the PPFC.

Chapter 4
51
The inlet and outlet tubes have a diameter (d) of 0.2 cm. Simulations were performed for six flow rates (Table 4.1). The Re, calculated using the diameter and the velocity (Vin) of the inlet, was used to define the flow regime:
���� =�����
Here ρ and µ are the density and viscosity of water, respectively. For Rein < 2000 the flow was considered laminar and for Rein > 3500 the flow was
considered turbulent.
Table 4.1 Reynolds number at the inlet for each flow rate studied.
Q / (ml.s-1) Rein
1 910
2 1822
4 3643
6 5455
8 7286
10 9108
Numerical simulations were made in Ansys Fluent CFD package (version 14.5). A
model of the PPFC was built in Design Modeller 14.5 and was discretized into a grid of 1,694,960 hexahedral cells by Meshing 14.5. The mesh was refined near the walls, where velocity gradients are higher. A refined cylindrical core was also introduced to improve the accuracy of the calculation of the jet stream that forms along the main axis. For the simulations, the initial velocity was set to zero and a uniform velocity was set in the inlet and the pressure was set to zero at the outlet. The properties of water (density and viscosity) at 37 ºC were used for the fluid.
Results in the laminar regime (Rein < 2000) were obtained by solving the Navier-Stokes equations. The velocity-pressure coupled equations were solved by the PISO algorithm (Issa 1986), the QUICK scheme (Leonard 1979) was used for the discretization of the momentum equations and the PRESTO! scheme was chosen for pressure discretization. The no slip boundary condition was considered for all the walls. Results for the turbulent regime (Rein > 3500) were obtained by solving the SSL k-ω model (Menter 1994) with low Reynolds corrections.
Simulations were made in transient mode, to assure convergence and to capture transient flow structures. For each case, 2 s of physical time were simulated with a fixed time step of 10-4 s. The primary numerical results are the velocity components and instantaneous pressure. The velocity components were used to determine the wall shear stress. Observation of the trajectories of tracer PVC particles circulating in the PPFC at different flow rates (as described in Teodósio et al. (2012a)) confirmed the flow pathlines predicted by CFD (not shown). A mesh independence analysis was performed by using a mesh with 690,475 cells and a 4.9% variation was obtained in the wall shear stress. Despite

Chapter 4
52
the small variation, the more refined mesh was used in the simulations to increase numerical accuracy.
4.2.2 Bacteria and culture conditions
E. coli JM109(DE3) was used since this strain had already demonstrated a good biofilm formation capacity (Teodósio et al. 2012b). A starter culture was obtained by inoculation of 500 µL of a glycerol stock (kept at -80 ºC) to a total volume of 0.2 L of inoculation media with 5.5 g L-1 glucose, 2.5 g L-1 peptone, 1.25 g L-1 yeast extract in phosphate buffer (1.88 g L-1 KH2PO4 and 2.60 g L-1 Na2HPO4) at pH = 7.0, as described by Teodósio et al. (2011). This culture was grown in a 1 L shake-flask, incubated overnight at 37 ºC with orbital agitation (120 rpm). A volume of 60 mL from the overnight grown culture was used to harvest cells by centrifugation (for 10 min at 3202 g). Cells were washed twice with citrate buffer 0.05 M (Simões et al. 2008), pH 5.0 and finally the pellet was resuspended and diluted in the same buffer in order to reach a cell concentration of 7.6x10⁷ cell.mL-1.
4.2.3 Surface preparation and flow chamber experiments
The PPFC was coupled to a jacketed tank connected to a centrifugal pump by a tubing system. The PPFC contained a bottom and a top opening for the introduction of the test surfaces of glass and PDMS (Figure 4.1). The glass slides were firstly washed with a commercial detergent (Sonasol Pril, Henkel Ibérica S A) and immersed in sodium hypochlorite (3%). After rinsing with distilled water, half of the slides were coated with PDMS. The PDMS (Sylgard 184 Part A, Dow Corning; viscosity = 1.1 cm2.s-1; specific density = 1.03) was submitted to a 30 min ultrasound treatment (Selecta Ultrasons) in order to eliminate all the bubbles. The curing agent (Sylgard 184 Part B, Dow Corning) was added to the PDMS (at a 1:10 ratio) and carefully stirred to homogenize the two components without re-introducing bubbles. The PDMS was then deposited as a thin layer on top of the glass slides by spin coating (Spin150 PolosTM) at 2000 rpm for 60 seconds.
The PPFC was mounted in a microscope (Nikon Eclipse LV100, Japan) to monitor cell attachment to each surface. The cellular suspension was circulated through the PPFC at 1, 2, 4, 6, 8 or 10 ml.s-1 for 30 min. Images were acquired every 60 s with a camera (Nikon digital sight DS-RI 1, Japan) connected to the microscope. The temperature was kept constant at 37 ºC using a recirculating water bath connected to the tank jacket. Three independent experiments were performed for each surface and flow rate.
4.2.4 Surface hydrophobicity and free energy of adhesion
Bacterial and surface hydrophobicity was evaluated considering the Lifshitz van der Waals acid base approach (van Oss 1994). The contact angles were determined automatically by the sessile drop method in a contact angle meter model (OCA 15 Plus; Dataphysics, Filderstadt, Germany) using water, formamide and α-bromonaphtalene (Sigma) as reference liquids. The surface tension components of the reference liquids were taken from literature (Janczuk et al. 1993). For each surface, at least 10 measurements with

Chapter 4
53
each liquid were performed at 25 ± 2 ºC, for PDMS and glass. One E. coli suspension was prepared in the same conditions as for the adhesion assay and its physicochemical properties were also determined by sessile drop contact angle measurement as described by Wang et al. (2013).
The model proposed by van Oss (1994) indicates that the total surface energy (γ Tot)
of a pure substance is the sum of the Lifshitz-van der Waals components of the surface free
energy ( LWγ ) and Lewis acid-base components (ABγ ):
ABLW γγγ +=Tot (1)
The polar AB component comprises the electron acceptor +γ and electron donor
−γ parameters, and is given by:
−+= γγγ 2AB (2)
The surface energy components of a solid or bacterial surface (s) are obtained by measuring the contact angles (θ) with the three different liquids (l) with known surface tension components, followed by the simultaneous resolution of three equations of the type:
( )
++=+ +−−+
lslsLWl
LWsl 2θcos1 γγγγγγγ (3)
The degree of hydrophobicity of a given surface (solid or bacterial surface) is expressed as the free energy of interaction (G∆ mJ.m-2) between two entities of that surface immersed in a polar liquid (such as water (w) as a model solvent). If the interaction between
the two entities is stronger than the interaction of each entity with water, G∆ < 0 mJ.m-2,
the material is considered hydrophobic, if G∆ > 0 mJ.m-2, the material is hydrophilic. G∆was calculated from the surface tension components of the interacting entities, using the equation:
−−++
−−=∆ −+−++−−+
wwsswsw
2LWw
LW 42G γγγγγγγγγγ ss ; (4)
When studying the interaction (free energy of adhesion) between surface (s) and
bacteria (b) that are immersed in water, the total interaction energy, AdhG∆ , can be expressed
as
−−
−++
−++−−=∆ +−−++++−−−−+
bsbsbb γγγγγγγγγγγγγγγ wswwswLWbw
LWsw
LWsb
Adh 2G (5)
Thermodynamically, if AdhG∆ < 0 mJ.m-2 adhesion is favoured, while adhesion is not
expected to occur if AdhG∆ > 0 mJ.m-2.

Chapter 4
54
4.2.5 Data analysis
The microscopy images acquired in real-time during the adhesion assays were analyzed with an image analysis software (ImageJ 1.46r) in order to obtain the number of adhered cells over time (30 min assay). This program was also used to calibrate the size of the field of view of each image so that pixels could be converted to square centimeters. The number of bacterial cells was then divided by the surface area of the field of view to obtain the number of cells per square centimeter. The ratio between the number of adhered cells on PDMS and glass was calculated for each time point and average values for the whole assay were determined for each flow rate.
The theoretical mass transport in a given flow displacement system can be calculated by solving the von Smoluchowski-Levich (SL) equation (approximate solution) which assumes that all microorganisms sufficiently close to the surface will adhere irreversibly (Busscher et al. 2006). Accordingly, a theoretical upper limit for the bacterial deposition rate (cells.m-2.min-1) can be calculated for the PPFC under the experimental conditions by:
� = 0.538 ����������� �
� �� (6)
where is the diffusion coefficient (approximately 4 x 10-13 m2.s-1 for microorganisms), Cb is the bacterial concentration (cell.m-3), Rb is the microbial radius (m), h0 is the height of the rectangular channel (m) and x is the distance for which an average velocity variation below 15 % was determined (m).
The equation includes the Péclet number (Pe) which represents the ratio between convective and diffusional mass transport, given for the parallel plate configuration as:
!� = �"#$��%
&'�� &⁄ )*� (7)
where +,"is the average flow velocity (m.s-1). Using eq. 6, the predicted number of adhered cells per surface area for each time point was calculated for each flow rate.
4.2.6 Statistical analysis
Paired t-test analyses were performed to evaluate if statistically significant differences were obtained with the two materials. Three independent experiments were performed for each surface and flow rate. Each time point was evaluated individually using the three independent results obtained with glass at one flow rate and the three individual results obtained with PDMS at the same flow rate. Results were considered statistically different for a confidence level greater than 95% (P < 0.05) and these time points were marked with an asterisk (*). Standard deviation between the 3 values obtained from the independent experiments was also calculated.

Chapter 4
55
4.3 Results
4.3.1 Numerical simulation of the flow
According to the Re calculated for the inlet conditions (Table 4.1), a laminar regime in the inlet was considered for the flow rates of 1 and 2 ml.s-1 (Rein < 2000), and a turbulent regime was assumed for the flow rates of 4, 6, 8 and 10 ml.s-1 (Rein > 3500).
Figure 4.2 Absolute velocity in the midplane of the cell.
Figure 4.2 shows the axial velocity (x component) in the midplane of the cell. For the laminar regimes, a laminar jet extends to a distance of about three quarters of the cell length (x = 0.19 m). The flow is transient, a result consistent with experimental observations (Todde et al. 2009). Transient vortices are formed along the cell between the jet and the wall. The jet may sometimes break into temporary vortices and recover its length again. However, the flow stabilizes as it approaches the viewing point where the conditions are of

Chapter 4
56
steady flow. Results for the turbulent regimes show a much shorter jet that slowly increases with increasing flow rate. The flow conditions in the viewing point are also stable. The highest flow velocity values were found in the inlet zone. This is also the zone where highest flow velocity variations are found.
Figure 4.3, representing the axial velocity (x component) along the main axis of the cell, corroborates this view. Laminar velocity breaks at half distance (x = 0.12 m) from the inlet indicating the position where the jet breaks. Some instabilities after this point indicate the formation of unstable vortices but a small velocity variation is achieved for x > 0.16 m. Turbulent jets stabilize at much shorter distance from the inlet (x = 0.05). The velocity values decrease after the inlet due to the expansion that occurs in the flow chamber.
Figure 4.3 Axial velocity along the main axis of the cell.
Figure 4.4 shows the velocity profiles in the viewing region and their spatial evolution was analysed in more detail in different directions. In figure 4.4a it is possible to observe that the shapes of the profiles obtained when monitoring in the z direction are different for the flow rates corresponding to laminar and turbulent inlet flow regimes. The velocity profiles are parabolic for the laminar flow regimes in the inlet which is characteristic for this type of flow (Bakker et al. 2003). For the flow rates corresponding to a turbulent flow regime in the inlet, the velocity profiles are flatter as expected. In figure 4.4b it is possible to verify that for each flow rate, the x component of the velocity is uniform in a large region around the axis (-0.005 < y < 0.005), assuring a constant shear stress along the y-axis direction.

Chapter 4
57
Figure 4.4 Velocity profiles in viewing region in a) z-direction and b) y-direction.
The flow patterns determine the distribution of wall shear stress along the cell, as shown in figure 4.5. For the laminar cases, wall shear stress peaks are obtained where the jet breaks, due to the formation of vortices. For the turbulent cases, since the jets break at a shorter distance, the wall shear stress is higher for x = 0.05 m. In all cases (laminar or turbulent), the wall shear stress at the viewing point is stable. The wall shear stress along the wall axis (Figure 4.6) shows two peaks half distance from the entry in the laminar case and peaks for x = 0.05 m in the turbulent case. Higher wall shear stresses in the visualization zone were achieved for the higher flow rates. Wall shear stresses between 0.005 and 0.07 Pa (corresponding to shear strain rates between 7 and 100 s-1, respectively) were obtained in the visualization zone in this PPFC for the flow rates studied.

Chapter 4
58
Figure 4.5 Wall shear stress in the bottom wall of the cell.
Figure 4.6 Wall shear stress along the axis of the bottom wall of the cell.

Chapter 4
59
4.3.2 Bacterial adhesion
A PPFC containing a glass or a PDMS surface was operated at six different flow rates in order to study the effect of the hydrodynamic conditions and surface properties on E. coli adhesion. Surface properties (Table 4.2) and free energy of adhesion (Table 4.3) between the surfaces and E. coli were calculated using eq. 4 and 5 after contact angle determination.
Table 4.2 The apolar ( LWγ ) and polar ( ABγ ) components, the surface tension parameters
( +γ and -γ ) and the hydrophobicity (∆G) of two surfaces (glass and PDMS) and E. coli
cells.
Surface LWγ / (mJ.m-2) +γ / (mJ.m-2) -γ / (mJ.m-2) ABγ / (mJ.m-2) ∆G/ (mJ.m-2)
Glass 32.59 2.590 52.42 23.29 28.00 PDMS 12.04 0.000 4.540 0.000 -61.82 E. coli 25.71 0.000 123.2 0.000 121.9
The results in table 4.2 show that glass and E. coli are both hydrophilic
(∆G > 0 mJ.m-2) and that PDMS is hydrophobic (∆G < 0 mJ.m-2). Additionally, it is possible to observe that glass has the highest attractive apolar component value and PDMS the
lowest. In what concerns the polar surface components (γ -, ᵞ+), results showed that PDMS and E. coli are monopolar surfaces, being electron donors and glass is a polar surface, being electron donor and acceptor.
Table 4.3 Free energy of adhesion between E. coli and each surface, glass and PDMS.
Bacteria Surface ∆GLW/ (mJ.m-2) ∆GAB/ (mJ.m-2) ∆GAdh / (mJ.m-2)
E. coli Glass -0.8345 63.76 62.93
PDMS 0.9619 31.62 32.58
Regarding the interaction energy between E. coli and the tested surfaces, it is
possible to verify that, from a thermodynamic point of view (Table 4.3), the adhesion of E.
coli to PDMS and glass is not expected to occur (∆GAdh> 0 mJ.m-2). Additionally, E. coli
adhesion to glass is less favourable than to PDMS (∆GAdh glass > ∆GAdh PDMS). Moreover, it was observed that Lewis acid-base interactions had a stronger contribution to the free interaction energy between E. coli and both surfaces although with a stronger effect in glass.
Figure 4.7 depicts the adhesion curves obtained for PDMS and glass surfaces for each flow rate tested. In this figure it is possible to observe that the number of adhered cells on each surface increased with time for all tested flow rates. In figure 4.7a it is possible to observe that adhesion on PDMS is higher than on glass for 72% of the points (P < 0.05). These values are on average 2.4 fold higher than the ones predicted by the SL solution. Regarding the adhesion on glass, the values obtained are on average 1.4 fold higher than predicted. For the flow rates of 2 and 4 ml.s-1 (Figures 4.7b and 4.7c), the number of adhered cells on PDMS and glass is similar during the experimental time (P > 0.05) and the results

Chapter 4
60
agree with those predicted by the SL solution. In figure 4.7d it is possible to observe that for a flow rate of 6 ml.s-1, the adhesion on PDMS is higher than on glass (although statistically significant differences were only obtained towards the end of the assay). The experimental results obtained for PDMS were on average 1.5 fold higher than predicted. Adhesion on glass was on average 1.4 fold higher than predicted by the SL solution for the first 17 min. However, after 17 min, the theoretical values were, on average, 1.2 fold higher than the experimental. With flow rates of 8 and 10 ml.s-1 (Figures 4.7e and 4.7f) the number of adhered cells on PDMS was higher than on glass, in the first case for 55% of the time points and in the second for 93% of the points (P < 0.05). For both flow rates, during the first 13 min, the number of adhered cells on both surfaces was successfully predicted by the SL solution. From 13 min onwards, the number of adhered cells on PDMS was on average 1.4 fold lower than predicted. Regarding the glass surface, the SL solution predicted twice the amount of adhered cells than what was experimentally observed.
Figure 4.7 Adhesion of E. coli on PDMS (open symbols), on glass surfaces (closed symbols) and the theoretical values predicted by the von Smoluchowski-Levich (SL) approximate solution (line), during 30 min for each flow rate: a) 1 ml.s-1, b) 2 ml.s-1, c) 4 ml.s-1, d) 6 ml.s-1, e) 8 ml.s-1, f) 10 ml.s-1. These results are an average of those obtained from three independent experiments for each condition. Statistical analysis corresponding to each time point is represented with an * for a confidence level greater than 95% (P < 0.05).

Chapter 4
61
Figure 4.8 shows the average wall shear stress and the ratio between the number of adhered cells on PDMS and glass for each flow rate. For the lower flow rate (corresponding to a shear stress of 0.005 Pa) the adhesion on PDMS was on average 1.7 fold higher than on glass (P < 0.05). Regarding the intermediate flow rates, 2 and 4 ml.s-1, similar adhesion values were obtained for both surfaces (P > 0.05). For the higher flow rates (6, 8 and 10 ml.s-1) a higher number of adhered cells were observed on PDMS than on glass (although with no statistical significant difference for the 6 ml.s-1). It was observed that for shear stresses higher than 0.03 Pa, until a maximum of 0.07 Pa (between 4 and 10 ml.s-1), an increase in shear stress amplifies the difference between the two surfaces.
Figure 4.8 Ratio between E. coli adhesion on PDMS and glass surfaces (circles) for different flow rates (1, 2, 4, 6, 8, 10 ml.s-1). Average wall shear stress for each flow rate determined by CFD (triangles). A solid line was drawn to highlight the points where E. coli adhesion results are similar on both surfaces. These results are an average of those obtained from three independent experiments for each surface and flow rate.
4.4 Discussion
In this work, a PPFC was used to assess the combined influence of six hydrodynamic conditions (flow rates between 1 and 10 ml.s-1) and two surfaces, one hydrophilic (glass) and another hydrophobic (PDMS), on the initial adhesion of E. coli. The numerical simulation showed that under these flow rates, shear stresses between 0.005 and 0.07 Pa can be attained in the PPFC. Since wall shear stresses lower than 0.1 Pa can be found in the urinary system (eg bladder and urethra) (Aprikian et al. 2011), circulatory system (eg veins) (Ross et al. 1998) and reproductive system (eg uterus) (Nauman et al. 2007), this platform can be used to simulate the hydrodynamic conditions found in different locations of the human body.
The process of bacterial adhesion can be affected by the hydrodynamic conditions but also by cell and surface properties (Wang et al. 2011). Under the tested flow conditions,

Chapter 4
62
it was observed that in general, E. coli adhesion was higher on PDMS than on glass and this is in agreement with the thermodynamic theory since adhesion on hydrophilic (glass) surfaces is less favorable. Fletcher et al. (1979) observed that the number of bacteria adhered on a surface is related to the surface charge and degree of hydrophobicity of the substratum. They verified that a higher number of marine Pseudomonas sp. cells adhered on hydrophobic surfaces than in hydrophilic materials. Cerca et al. (2005) studied the physicochemical interactions involved on the adhesion of 9 clinical isolates of S. epidermidis to different surfaces. They observed that adhesion to hydrophobic surfaces was favored for all strains when compared to hydrophilic surfaces.
With a flow rate of 1 ml.s-1, the number of adhered cells on PDMS was higher than on glass, and for both surfaces this number was higher than predicted by the SL solution. In the SL approximation, bacterial mass transport is governed by diffusion and convection in the absence of gravitational, colloidal and hydrodynamic interactions (Li et al. 2011). Moreover, this model assumes that bacteria arriving at the surface will adhere irreversibly (Busscher et al. 2006). Although this approximate solution could be considered as an upper limit for the cell transport in a given flow displacement system, experimental adhesion rates higher than those predicted by this model have been observed (Bakker et al. 2002; Wang et al. 2013). Adhesion efficiencies higher than 100% have been attributed to the presence of surface appendages, e.g. flagellum, which may have a positive effect on adhesion, a feature that is not considered in this model (Morisaki et al. 1999). These bacterial appendages will allow bacteria to swim thus enhancing the rate of arrival to the surface (Tran et al. 2011). When the cells are sufficiently close to the surface, the interacting forces between them and the surface may govern the adhesion since differences in the number of adhered cells between PDMS and glass were observed. Wang et al. (2013) observed that after cells are transported to the substrate surface, the initiation of adhesion was dependent on the interaction energy between the cells and that surface. Bayoudh et al. (2009) compared the adhesion of Pseudomonas stutzeri and S. epidermis on two different surfaces. They observed that P. stutzeri used its surface structures to adhere more strongly and irreversibly on both surfaces, while S. epidermis adhered reversibly and this was dependent on the surface energy barrier. However, both bacterial strains adhered in higher numbers to hydrophobic surfaces when compared to hydrophilic materials.
With flow rates of 2 and 4 ml.s-1, the number of adhered cells was similar for both surfaces and the values were successfully predicted by the SL solution. This theory considers that bacterial adhesion will increase with increasing flow velocities, due to the increased cell transport to the surface. However, the model does not account for the fact that a higher flow rate promotes higher shear stresses that may prevent cellular attachment (Bakker et al. 2003). This hindrance may be overcome by the bacterial appendages used in adhesion (McClaine et al. 2002). Moreover, since these structures have an extremely small size, they can help to overcome the energy barrier between the bacteria and the surface and facilitate the adhesion (Sjollema et al. 1990). Thus, under these conditions, with a stronger shear stress, the first interaction between cells and surface may be mediated directly by the cellular appendages (Aprikian et al. 2011; Wang et al. 2013). Therefore, a balance between the negative effect of the shear forces and the positive effect of the cellular appendages may be achieved. Although none of these factors is accounted for in the SL solution, they can

Chapter 4
63
cancel one another and therefore bacterial adhesion is successfully predicted by the model under these conditions.
Regarding the results obtained for a flow rate of 6 ml.s-1, it was possible to observe that a higher number of cells adhered on PDMS than on glass. The number of adhered cells on PDMS was slightly higher than predicted and the same was observed for glass for the first 17 min of the assay. However, after this initial period, the number of adhered cells on glass was lower than predicted by the SL solution indicating that some type of blockage may have occurred. Under a higher flow velocity, the number of cells arriving to the surface is higher and, cellular appendages may contribute to a higher productivity in adhesion (Sjollema et al. 1990; Bakker et al. 2003). However, since a stronger shear stress is promoted under this hydrodynamic condition and a lower contact time between the cells and the surface is expected, the gliding motion along the surface, which can happen during reversible adhesion, may be hampered (Bakker et al. 2003; Petrova et al. 2012). Thus, the adhesion step must be quicker in order to overcome this effect. In the first minutes, cells have all the surface free to adhere. However, after some minutes some areas become occupied by adhered cells thus reducing the free area available for attachment (Bakker et al. 2002). For a flow rate of 6 ml.s-1, it seems that this blockage effect starts at 17 min only for the glass surface. This effect was not observed for the PDMS surface, indicating that surface properties also have an important role in bacterial adhesion in this condition. Knowing that adhesion on glass is less favorable according to the thermodynamic theory it is possible that both factors (thermodynamic and the blockage effect) may inhibit adhesion to this surface.
At higher flow rates (8 and 10 ml.s-1), the blockage effect was not observed for the adhesion on glass since for the whole experimental time the number of adhered cells never exceed the critical value attained at 17 min for the flow rate of 6 ml.s-1. At these higher flow rates, although a higher adhesion was predicted by the model, a lower number of adhered cells was observed for both surfaces. This was probably due to the increased shear stress and the decreased contact time with the surface that may inhibit bacterial adhesion. Lecuyer et al. (2011) investigated the influence of the wall shear stress in the residence time of adhesion of P. aeruginosa. They verified that the number of binding events tended to decrease as the shear stress increased in a range of wall shear stresses between 0.05 and 10 Pa. Shive et al. (1999) studied the effect of shear stresses between 0 and 1.75 Pa in the adhesion of S. epidermidis and polymorphonuclear leukocytes to polyetherurethane for time periods of up to 6 h. They observed that bacterial adhesion decreased with increasing shear stress. In this work, with the two higher flow rates tested, it was also observed that bacterial adhesion was different between the two surfaces indicating that surface properties affected adhesion. A lower number of adhered cells was observed on glass than on PDMS and these values were lower than theoretically predicted. It seems that with these flow rates the stronger shear stresses had a higher inhibitory effect on cellular adhesion on glass, which is the surface that is theoretically less favorable for adhesion. Regarding the PDMS surface, it was observed that until 13 min, the SL solution was able to predict the number of adhered cells. After 13 min, the number of adhered cells on PDMS was lower than the values predicted by the SL solution indicating that a blockage effect may be occurring. When PDMS is used as substrate, since this surface is thermodynamically more favorable

Chapter 4
64
for adhesion, the inhibitory effect caused by the shear stress is only noticed after 13 min possibly due to the reduction of free area available for adhesion and the lower contact time between the cells and the surface, which may hamper the adhesion assistance effect provided by the cellular appendages (McClaine et al. 2002).
The use of modified materials or polymeric coatings with enhanced surface properties seems to be a promising strategy to inhibit bacterial colonization of surfaces in the biomedical sector (Tsibouklis et al. 1999; Kaali et al. 2011; Campoccia et al. 2013). Although some encouraging results have been obtained both in vitro and in vivo (Coenye et al. 2010), one has to bear in mind that these modified materials with enhanced properties are often much more expensive than the original materials from which they are derived. The results presented in this study demonstrate that E. coli adhesion to both hydrophilic and hydrophobic surfaces is modulated by shear stress. Depending on the prevailing hydrodynamic conditions, the effect of surface properties on bacterial adhesion is either more noticeable or less important than the effect of the shear forces. This suggests that when materials are selected to produce biomedical devices or when coatings are developed for surface protection against biofilm formation, the knowledge of the shear stress field that will exist during the in vivo use of these devices may be very important. Thus, depending on the hydrodynamic regime that is found in each particular application, the use of more expensive materials or polymeric coatings may be justified or not.
4.5 References
Abbasi F, Mirzadeh H, Katbab A-A. 2001. Modification of polysiloxane polymers for biomedical applications: a review. Polymer International. 50:1279-1287.
Aprikian P, Interlandi G, Kidd BA, Le Trong I, Tchesnokova V, Ykovenko O, Whitfield MJ, Bullitt E, Stenkamp RE, Thomas WE, Sokurenko E. 2011. The bacterial fimbrial tip acts as a mechanical force sensor. PLoS Biol. 9.
Aubert D. 2010. Vesico-ureteric reflux treatment by implant of polydimethylsiloxane (Macroplastique™): Review of the literature. Progrès en Urologie. 20:251-259.
Bakker DP, Busscher HJ, van der Mei HC. 2002. Bacterial deposition in a parallel plate and a stagnation point flow chamber: microbial adhesion mechanisms depend on the mass transport conditions. Microbiology. 148:597-603.
Bakker DP, van der Plaats A, Verkerke GJ, Busscher HJ, van der Mei HC. 2003. Comparison of velocity profiles for different flow chamber designs used in studies of microbial adhesion to surfaces. Appl. Environ. Microbiol. 69:6280-6287.
Barton AJ, Sagers RD, Pitt WG. 1996. Bacterial adhesion to orthopedic implant polymers. Journal of biomedical materials research. 30:403-410.
Bayoudh S, Othmane A, Mora L, Ben Ouada H. 2009. Assessing bacterial adhesion using DLVO and XDLVO theories and the jet impingement technique. Colloids and Surfaces B: Biointerfaces. 73:1-9.
Bruinsma GM, van der Mei HC, Busscher HJ. 2001. Bacterial adhesion to surface hydrophilic and hydrophobic contact lenses. Biomaterials. 22:3217-3224.
Bryers JD. 2008. Medical biofilms. Biotechnology and Bioengineering. 100:1-18.
Busscher HJ, van der Mei HC. 2006. Microbial adhesion in flow displacement systems. Clinical Microbiology Reviews. 19:127-141.

Chapter 4
65
Busscher HJ, van der Mei HC, Subbiahdoss G, Jutte PC, van den Dungen JJAM, Zaat SAJ, Schultz MJ, Grainger DW. 2012. Biomaterial-associated infection: locating the finish line in the race for the surface. Science Translational Medicine. 4:153rv110.
Campoccia D, Montanaro L, Arciola CR. 2013. A review of the biomaterials technologies for infection-resistant surfaces. Biomaterials. 34:8533-8554.
Castonguay MH, van der Schaaf S, Koester W, Krooneman J, van der Meer W, Harmsen H, Landini P. 2006. Biofilm formation by Escherichia coli is stimulated by synergistic interactions and co-adhesion mechanisms with adherence-proficient bacteria. Research in Microbiology. 157:471-478.
Cerca N, Pier GB, Vilanova M, Oliveira R, Azeredo J. 2005. Quantitative analysis of adhesion and biofilm formation on hydrophilic and hydrophobic surfaces of clinical isolates of Staphylococcus epidermidis. Research in Microbiology. 156:506-514.
Coenye T, Nelis HJ. 2010. In vitro and in vivo model systems to study microbial biofilm formation. Journal of Microbiological Methods. 83:89-105.
Djeribi R, Bouchloukh W, Jouenne T, Menaa B. 2012. Characterization of bacterial biofilms formed on urinary catheters. American Journal of Infection Control. 1-6.
Donlan RM, Costerton JW. 2002. Biofilms: survival mechanisms of clinically relevant microorganisms. Clin. Microbiol. Rev. 15:167-193.
Fletcher M, Loeb GI. 1979. Influence of substratum sharacteristics on the sttachment of a Marine Pseudomonas to solid surfaces. Appl Environ Microbiol. 31:67-72.
Issa RI. 1986. Solution of the implicitly discutised fluid flow equations by operating-splitting. J. Comput Phys. 62:40-65.
Janczuk B, Chibowski E, Bruque JM, Kerkeb ML, Gonzales-Caballero FJ. 1993. On the consistency of surface free energy components as calculated from contact angle of different liquids: an application to the cholesterol surfaces. J Colloid Interface Sci. 159:421-428.
Kaali P, Strömberg E, Karlsson S. 2011. Biomedical engineering, trends in materials science. InTech. 22, Prevention of biofilm associated infections and degradation of polymeric materials used in biomedical applications.
Koseoglu H, Aslan G, Esen N, Sen BH, Coban H. 2006. Ultrastructural stages of biofilm development of Escherichia coli on urethral catheters and effects of antibiotics on biofilm formation. Urology. 68:942-946.
Lecuyer S, Rusconi R, Shen Y, Forsyth A, Vlamakis H, Kolter R, Stone HA. 2011. Shear stress increases the residence time of adhesion of Pseudomonas aeruginosa. Biophysical Journal. 100:341-350.
Leonard BP. 1979. A stable and accurate convective modelling procedure based on quadratic upstream interpolation. Comput. Methods Appl. Mech. Eng. 19:59-98.
Li J, Busscher HJ, Norde W, Sjollema J. 2011. Analysis of the contribution of sedimentation to bacterial mass transport in a parallel plate flow chamber. Colloids and Surfaces B: Biointerfaces. 84:76-81.
McClaine JW, Ford RM. 2002. Characterizing the adhesion of motile and nonmotile Escherichia coli to a glass surface using a parallel-plate flow chamber. Biotechnology and Bioengineering. 78:179-189.
Menter FR. 1994. Two-equation eddy-viscosity turbulence models for engineering applications. AIAA Journal. 32:1598-1605.
Millsap KW, Reid G, van der Mei HC, Busscher HJ. 1997. Adhesion of Lactobacillus species in urine and phosphate buffer to silicone rubber and glass under flow. Biomaterials. 18:87-91.
Missirlis YF, Katsikogianni M. 2004. Concise review of mechanisms of bacterial adhesion to biomaterials and of techniques used in estimating bacteria-material interactions Cells and Materials. 8:37-57.
Chapter 4
66
Morisaki H, Nagai S, Ohshima H, Ikemoto E, Kogure K. 1999. The effect of motility and cell-surface polymers on bacterial attachment. Microbiology. 145:2797-2802.
Nauman EA, Ott CM, Sander E, Tucker DL, Pierson D, Wilson JW, Nickerson CA. 2007. Novel quantitative biosystem for modeling physiological fluid shear stress on cells. Applied and Environmental Microbiology. 73:699-705.
Nikolaev Y, Plakunov V. 2007. Biofilm - “City of microbes” or an analogue of multicellular organisms? Microbiology. 76:125-138.
Ong YL, Razatos A, Georgiou G, Sharma MM. 1999. Adhesion forces between E. coli bacteria and biomaterial surfaces. Langmuir. 15:2719-2725.
Pace JL, Rupp ME, Finch RG. 2006. Biofilms, Infection and Antimicrobial Therapy. Boca Raton: CRC pres Taylor and Francis group.
Petrova OE, Sauer K. 2012. Sticky situations - Key components that control bacterial surface attachment. Journal of Bacteriology. 194:2413–2425.
Pratt-Terpstra IH, Weerkamp AH, Busscher HJ. 1987. Adhesion of oral Streptococci from a flowing suspension to uncoated and albumin-coated surfaces. Journal of General Microbiology. 133:3199-3206.
Robert JM, Salek MM. 2010. Numerical Simulations - examples and applications in computational fluid dynamics. Canada: InTech. Numerical simulation of fluid flow and hydrodynamic analysis in commonly used biomedical devices in biofilm studies.
Ross JM, Alevriadou BR, McIntire LV. 1998. Thrombosis and Hemorrhage. Baltimore, MD: Williams & Wilkins. 17, Rheology.
Shive MS, Hasan SM, Anderson JM. 1999. Shear stress effects on bacterial adhesion, leukocyte adhesion, and leukocyte oxidative capacity on a polyetherurethane. Journal of Biomedical Materials Research. 46:511-519.
Shunmugaperumal T. 2010. Biofilm eradication and prevention: a pharmaceutical approach to medical device infections. New Jersey: Wiley.
Simões M, Simões LC, Cleto S, Pereira MO, Vieira MJ. 2008. The effects of a biocide and a surfactant on the detachment of Pseudomonas fluorescens from glass surfaces. International Journal of Food Microbiology. 121:335-341.
Sjollema J, Van Der Mei HC, Uyen HMW, Busscher HJ. 1990. The influence of collector and bacterial cell surface properties on the deposition of oral streptococci in a parallel plate flow cell. Journal of Adhesion Science and Technology. 4:765-777.
Teodósio JS, Simões M, Melo LF, Mergulhão FJ. 2011. Flow cell hydrodynamics and their effects on E. coli biofilm formation under different nutrient conditions and turbulent flow. Biofouling. 27:1-11.
Teodósio JS, Simões M, Alves MA, Melo L, Mergulhão F. 2012a. Setup and validation of flow cell systems for biofouling simulation in industrial settings. The Scientific World Journal ID 361496.
Teodósio JS, Simões M, Mergulhão FJ. 2012b. The influence of non-conjugative Escherichia coli plasmids on biofilm formation and resistance. Journal of Applied Microbiology. 113:373–382.
Teodósio JS, Simões M, Melo L, Mergulhão FJ. 2013. Biofilms in bioengineering. Nova science publishers 3, Platforms for in vitro biofilm studies.
Todde V, Spazzini P, Sandberg M. 2009. Experimental analysis of low-Reynolds number free jets. Experiments in Fluids. 47:279-294.
Tran VB, Fleiszig SMJ, Evans DJ, Radke CJ. 2011. Dynamics of flagellum- and pilus-mediated association of Pseudomonas aeruginosa with contact lens surfaces. Applied and Environmental Microbiology. 77:3644-3652.

Chapter 4
67
Trautner BW, Lopez AI, Kumar A, Siddiq DM, Liao KS, Li Y, Tweardy DJ, Cai C. 2012. Nanoscale surface modification favors benign biofilm formation and impedes adherence by pathogens. Nanomedicine: Nanotechnology, Biology and Medicine. 8:261-270.
Tsibouklis J, Stone M, Thorpe AA, Graham P, Peters V, Heerlien R, Smith JR, Green KL, Nevell TG. 1999. Preventing bacterial adhesion onto surfaces: the low-surface-energy approach. Biomaterials. 20:1229-1235.
van Oss C. 1994. Interfacial Forces in Aqueous Media. New York, USA: Marcel Dekker Inc.
Wang H, Sodagari M, Chen Y, He X, Newby B-mZ, Ju L-K. 2011. Initial bacterial attachment in slow flowing systems: Effects of cell and substrate surface properties. Colloids and Surfaces B: Biointerfaces. 87:415-422.
Wang H, Sodagari M, Ju L-K, Zhang Newby B-m. 2013. Effects of shear on initial bacterial attachment in slow flowing systems. Colloids and Surfaces B: Biointerfaces. 109:32-39.
Wood M. 1999. Conjunctivitis: Diagnosis and Management. Community Eye Health. 12:19-20.

Chapter 4
68

Chapter 5
69
Chapter 5 Biofilm formation in agitated 96-well microtiter plates: hydrodynamic and nutrient concentration effects
Microtiter plates are one of the most widely used platforms for biofilm studies. They enable high-throughput operation, have a small working volume, and can be used in static or agitated conditions. In this chapter, a study of the flow dynamics in a well of a 96-well microtiter plate and its influence on E. coli biofilm formation was made. Two different glucose concentrations (1 g L-1 and 0.25 g L-1) and two different shaking conditions were tested using incubators with orbital diameters of 50 and 25 mm. Biofilm growth was monitored for 60 h and the hydrodynamics were simulated by CFD. Numerical simulations were conducted by Dr. João Miranda and Dr. José Araújo from the Transport Phenomena Research Center (CEFT-FEUP). CFD simulations have shown that wall shear stress was higher near the air/liquid interface and average values of 0.070 and 0.034 Pa were obtained for the largest and smallest orbital diameter incubators (respectively). For the high glucose concentration, the maximum biofilm amount was attained at 24 h and similar values were obtained in both incubators. For the low glucose concentration, lower values were attained. Numerical simulations indicated that microtiter plates can adequately model biofilm formation in relevant biomedical systems.
This chapter was adapted from:
Moreira JMR, Gomes LC, Araújo JDP, Miranda JM, Simões M, Melo LF, Mergulhão FJ. 2013. The effect of glucose concentration and shaking conditions on Escherichia coli biofilm formation in microtiter plates. Chem Eng Sci. 94:192-199.

Chapter 5
70

Chapter 5
71
5.1 Introduction
Biofilms can be described as biological structures attached to surfaces, composed of microorganisms embedded in extracellular polymeric substances (Melo et al. 1999; Teodósio et al. 2011). In the medical field, biofilms are routinely formed in almost all types of devices (including urinary and cardiovascular catheters and prostheses) and are responsible for 65% of hospital acquired infections, which cost more than $1 billion/year for treatment in the US alone (Robert et al. 2010). Almost 90% of bloodstream infections in patients from intensive care units are catheter contamination related (Shunmugaperumal 2010). Clinical culture techniques are often unable to detect bacteria present in a biofilm which makes it more difficult to diagnose a patient with an infected device. In fact, it is known that micro-organisms that separate from a biofilm are not representative of those within the sessile community (Gristina et al. 1984; Brown et al. 1999) and that long-established methods of sampling from bone, blood, swabs or soft tissue samples may be thwarted by the presence of a biofilm (Gristina et al. 1985). Moreover, infection remains a major impediment to the long term use of many implanted or intravascular devices as biofilm development causes their failure and, in that case, the only solution is surgical removal of the device (Silverstein et al. 2006). E. coli is the most common microbial agent in urinary tract infections due to its ability to adhere onto several biomaterials (Koseoglu et al. 2006) and one of the most common bacteria diagnosed in patients with indwelling or implanted foreign polymer bodies (Missirlis et al. 2004).
Microbial adhesion depends on the species involved and on environmental factors, particularly the hydrodynamic conditions and the fluid nutrient composition (Beyenal et al. 2000; Chen et al. 2005). Understanding the factors affecting the adhesion process is key to control biofilm formation (Lorite et al. 2011). It has been demonstrated that nutrient concentration can have a considerable impact on biofilm growth. For instance, for P. aeruginosa, it is known that high nutrient loads promote biofilm formation (Peyton 1996). On the other hand, for Pseudomonas putida, it was observed that up to a certain limit of glucose the biofilm accumulation rate was reduced as a consequence of cell detachment (Rochex et al. 2007). For E. coli, some authors referred that the addition of glucose to the media inhibits biofilm formation (Jackson et al. 2002), while others demonstrated that higher glucose concentrations promote biofilm growth (Bühler et al. 1998). Teodósio et al. (2011) reported that before a critical biomass thickness is reached nutrient availability dictates E. coli biofilm architecture but when that thickness is exceeded the hydrodynamic conditions can become more important in biofilm development (for a Reynolds number of 6000). Additionally, it has been reported that for Pseudomonas species an increase in flow velocity or in nutrient concentrations is associated with an increase in cell attachment (Simões et al. 2010). Along with the nutrient load, one of the most decisive factors in biofilm formation under dynamic conditions are the shear forces near the surface (Liu et al. 2002).
Microtiter plates have been used extensively for biofilm studies addressing microbial adhesion (Rodrigues et al. 2009; Iyamba et al. 2011), biofilm inhibition (Carteau et al. 2010; Contreras-García et al. 2011; Klein et al. 2011; Lee et al. 2011) and screening of antimicrobial compounds (Shakeri et al. 2007; Jagani et al. 2009; Simões et al. 2010a).

Chapter 5
72
Since the hydrodynamic conditions are very important for biofilm formation, it is surprising how little is known about the flow inside the wells of these plates. Zhang et al. (2008) used CFD to provide a detailed characterization of fluid mixing, energy dissipation rate and mass transfer in single well bioreactors from deep square 24-well and 96-well microtiter plates. A similar engineering characterization was made by Barrett et al. (2010) for culture of mammalian cells in 24-well ultra-low attachment microtiter plates. Azevedo et al. (2006) used 6-well tissue culture plates to test the influence of shear stress, temperature and inoculation concentration on the adhesion of H. pylori to stainless steel and polypropylene. Kostenko et al. (2010) studied S. aureus deposition in 6-well microdishes filled with different volumes and at different agitation frequencies. The latter system was further analyzed with CFD by Salek et al. (2011) using a flow topology analysis to explain biofilm accumulation, morphology and orientation of endothelial cells. Since the 96-well format is currently one of the favorite platforms for biofilm studies, it is intriguing why such a lack of information exists for this system. For dynamic studies, the key operational parameters that influence fluid movement inside the wells are the shaking pattern (orbital or linear), the shaking frequency and amplitude, the liquid fill volume and the fluid properties (Hermann et al. 2003). It has been shown that the shaking diameter has a strong influence in the oxygen transfer rate (Duetz et al. 2004) and that the orbital shaking diameter generally has a greater impact on liquid motion than the shaking frequency (Zhang et al. 2008). Using standard polystyrene 96-well microtiter plates we tried to understand the influence of shaking conditions and glucose concentration on E. coli biofilm development. The hydrodynamics of these systems were simulated by numerical methods using CFD software.
5.2 Materials and methods
5.2.1 Numerical simulations
Numerical simulations were made in Ansys Fluent CFD package (version 13.0). The domain was discretized into a grid of finite volumes (cells). A three dimensional domain, representing a cylindrical well with a diameter of 6.6 mm and height of 11.7 mm, was built in Design Modeller 13.0 and a grid of 18,876 hexahedral cells was generated by Meshing 13.0 (Figure 5.1). For simulation, each well was initially filled with 200 mL of liquid and the remaining volume was filled with gas. The properties of water and air at 30 ºC were used for the liquid and gas phases, respectively. The surface tension was set equal to the surface tension of an air/water system.
To properly solve the flow, the VOF methodology (Hirt et al. 1981) was used to track the liquid/gas interface. In this method, a phase function a represents the fraction of liquid in each grid cell. The interface position is determined by solving an equation for the advection (Hirt et al. 1981) of the phase function. The precise locations of the interface were obtained by the Geo-Reconstruct method (Youngs 1982), which is based on a piecewise-linear approach. The phase function is advected by the velocity field which is determined by solving the time-dependent Navier–Stokes equations. Pressure and velocity fields are shared by both phases, and so, a single set of mass conservation and momentum

Chapter 5
73
equations are solved. The velocity–pressure coupled equations were solved by the PISO algorithm. The QUICK scheme was selected for the discretization of the momentum equations and the PRESTO! scheme was applied for pressure discretization. The surface tension model used in Ansys Fluent is the continuum surface force (Brackbill et al. 1992). The surface tension effects, along the gas–liquid interface, are accounted for through a source term in the momentum equation. The no slip boundary condition and a contact angle of 83º were considered for all walls (Simões et al. 2010b).
Figure 5.1 Grid that was used for the numerical simulations.
A non-inertial reference frame (White 1994) was adopted to account for the effect of the orbital shaker on the flow. A well in an orbital shaker follows a circular orbit that is best described in an accelerating reference frame (without rotation around itself), for which the walls of the well are stationary. The effect of the circular orbital motion was implemented in Fluent, through a user defined function, by introducing in the momentum equations a source term representing the effect of the acceleration of the well.
5.2.2 Bacteria and culture conditions
E. coli JM109(DE3) was used to produce the biofilms since this strain had already demonstrated a good biofilm formation capacity at 30 ºC in a similar culture medium (Teodósio et al. 2012a). The strain genotype is endA1, recA1, gyrA96, thi, hsdR17 (rk, mk
þ), relA1, supE44, l, D(lac-proAB), [F0, traD36, proAB, lacIqZDM15], l(DE3). A starter culture was obtained by inoculation of 500 mL of a glycerol stock (kept at - 80 ºC) to a total volume of 0.2 L of inoculation media, previously described by Teodósio et al. (2011). This culture was grown on a 1 L shake-flask, incubated overnight at 30 ºC with orbital agitation (120 rpm, d=50 mm). A volume of 10 mL from the overnight grown culture was used to harvest cells by centrifugation (for 10 min at 3202g) and the pellet was then resuspended in the same volume of sterile saline solution (NaCl 8.5 g L-1). Appropriate dilutions were performed to attain an optical density (OD) of 0.4 at 610 nm.

Chapter 5
74
Three independent experiments were performed to characterize the biofilms formed under different hydrodynamic conditions. Two recipes of culture media were used for biofilm formation containing 0.25 g L-1 peptone, 0.125 g L-1 yeast extract and phosphate buffer (0.188 g L-1 KH2PO4 and 0.26 g L-1 Na2HPO4), pH 7.0. These recipes were prepared maintaining the original medium composition described in Teodósio et al. (2011) for all the components except for glucose. In one recipe glucose was added to a final concentration of 1 g L-1 and in the other 0.25 g L-1. Six wells of sterile 96-well polystyrene microtiter plates (Orange Scientific, USA) were filled with 180 mL of each nutrient media and inoculated with 20 mL of the inoculum previously prepared. A total of 12 microtiter plates were used per experiment so that two plates were retrieved from the incubator for analysis at each time point. For time zero the plates were not introduced in the incubator at all. To promote biofilm formation, the plates were incubated at 30 ºC for a maximum of 60 h in two orbital shaking incubators (6 plates each) operating at the same agitation frequency (150 rpm). The diameter of the orbit described by the shaking platform was different in each incubator. Thus one incubator had an orbital diameter of 50 mm (CERTOMATs BS-1, Sartorius AG, Germany) whereas the other had a 25 mm orbit (AGITORB 200, Aralab, Portugal).
5.2.3 Biofilm and glucose quantification
During each experiment of 60 h, one microtiter plate was removed from each incubator every 12 h for biofilm quantification. The crystal violet (CV) assay described by Simões et al. (2010b) was applied to each microtiter plate but the 98% methanol was replaced by 96% ethanol (Shakeri et al. 2007) and the wash with sterile water was performed before ethanol addition. The OD was measured at 570 nm using a microtiter plate reader (SpectraMax M2E, Molecular Devices, USA) and biofilm amount was expressed as OD570nm values. Glucose quantification was performed by dinitrosalicylic colorimetric method (DNS) according to the method described by Teodósio et al. (2011).
5.2.4 Statistical analysis
Biofilm and glucose concentration results are averages from three independent experiments performed with the high and low glucose concentrations. Paired t-test analyses were performed to estimate whether or not there was a significant difference between the results. Each time point was evaluated individually using the three independent results (where each one resulted from an average of the values obtained from six different wells within one plate) obtained with one glucose concentration and the three individual results obtained with the other concentration. Results were considered statistically different when a confidence level greater than 95% was reached (P < 0.05) and these time points were marked with an asterisk (*). Standard deviation between the three values obtained from the independent experiments is also represented by error bars.

Chapter 5
75
5.3 Results
5.3.1 Numerical simulation of the flow
This system has an orbital motion with a period of 0.4 s which is imposed by the frequency of the shaker. The free surface location within a complete cycle is represented in Figure 5.2, showing that the water/air interface in the well slopes due to the orbital movement. After an initial transient period, the slope variation of the free surface stabilizes and the free surface rotates with a period equal to the period of the orbital shaker.
Figure 5.2 Free surface during a complete rotation (Dorb = 50 mm).
The average shear stress in the internal wall of the well is represented in Figure 5.3. A transient initial period can be identified, during which the average wall shear stress oscillates. The amplitude of the oscillation decreases until a steady state is reached, and the duration of the transient state is less than 1 s. The average shear stress during steady state is higher for the largest orbit diameter. Indeed, despite the fact that the angular velocity is maintained (because the shaking frequency is the same) the linear velocity, which is correlated with the shear stress, is dependent on the orbital diameter. An average wall shear stress of 0.034 Pa was obtained for the smaller diameter incubator and a value of 0.070 Pa was predicted for the larger orbital diameter which corresponds, respectively, to strain rates of 23.0 and 46.2 s-1.
Figure 5.3 Average wall shear stress for both orbital diameters.

Chapter 5
76
The wall shear stress is unevenly distributed in the cylindrical wall, as it is visible in figure 5.4. The shear stress is higher in the liquid side near the interface, and there are spots for which the wall shear stress has a relative maximum. These spots are associated with regions of unstable vortices near the wall that rotates as the free surface rotates. Shear stresses lower than 0.05 Pa were not represented in Figure 5.4, which includes the lower region of the well and the bottom wall.
Figure 5.4 Wall shear stress for Dorb of 25 mm (upper row) and 50 mm (lower row). Wall shear stresses bellow 0.05 Pa are not represented.
Figure 5.5 shows a cross section of the vessel where it is possible to see that as the free surface rotates it appears to be oscillating. Temporary recirculation zones are present, showing that the bulk of the liquid is being mixed by convection. Fluid velocities are higher for the incubator with 50 mm, indicating that mixing improves with the increase of the orbit diameter.

Chapter 5
77
Figure 5.5 Velocity field in a cross section of the well for Dorb of 25 mm (upper row) and 50 mm (lower row).
5.3.2 Biofilm formation
The CV staining method that was used enables the quantification of the biofilms formed on the walls of the well and also on the bottom of the plate. By direct observation of the stained wells it was possible to see that the vast majority of the biofilm formed on the vertical wall and not on the bottom.
Figure 5.6a shows that the initial biofilm production (until 12 h) was higher on the low glucose concentration (0.25 g L-1) for the higher amplitude incubator (50 mm) since a 58% increase in absorbance was obtained when compared to the high glucose condition (P = 0.04). However, for the lower amplitude incubator (Figure 5.6b), opposite results were obtained and the initial biofilm production was higher at the high glucose concentration (84% increase, P = 0.01). When the results obtained from the two incubators are compared (Figure 5.6a and b), the initial biofilm production was higher (45%) for the high glucose concentration on the smaller diameter incubator (P = 0.04).
The maximum amount of biofilm formed in both shaking conditions was greater for the high glucose condition. For the higher shaking amplitude, the maximum value was obtained at 24 h and this result was 46% higher than the maximum value obtained for the low glucose condition in the same incubator (Figure 5.6a). For the incubator with the smaller shaking diameter, the maximum value obtained for the high glucose concentration was 90% higher than for the low glucose condition and this value was also attained at 24 h.

Chapter 5
78
Figure 5.6 Time-course evolution of biofilm development and glucose concentration: a) and c) 50 mm orbital shaking amplitude, b) and d) 25 mm orbital shaking amplitude. a) and b) Biofilm development, c) and d) glucose concentration. Closed symbols – high glucose concentration, (1 g.L-1), open symbols – low glucose concentration (0.25 g.L-1). These results are an average of those obtained from three independent experiments for each condition. Statistical analysis corresponding to each time point is represented with an * for a confidence level greater than 95% (P < 0.05). Error bars represent the standard deviation between the triplicates.
For the larger diameter incubator and the low glucose condition (Figure 5.6a), after the maximum value is attained, the amount of biofilm decreased until the end of the experiment. Looking at figure 5.6c, it is possible to see that after the initial glucose consumption (until 12 h) the residual glucose concentration was constant until the end of the experiment, which may indicate that cells were entering a period of starvation.
For the high glucose concentration, after the maximum value was attained at 24 h (Figure 5.6a and b), the amount of biofilm decreased in both incubators and stabilized only at the end of the experiment. For the larger diameter incubator, this decrease was more

Chapter 5
79
pronounced and after this the amount of biofilm increased again (from 36 h) reaching similar values to those obtained with the smaller diameter incubator (P = 0.46).
Greater glucose consumption was observed when higher initial concentrations were used and this was verified until 36 h for the larger diameter incubator (Figure 5.6c) and 24 h for the smaller diameter (Figure 5.6d). Despite the cellular detachment that occurred at 24 h in the larger diameter incubator (for the high glucose concentration experiment), biofilm re-growth did not cause a decrease in the overall glucose concentration, which is an indication that planktonic cell deposition rather than biofilm growth may have occurred (Figure 5.6a). Additionally, glucose concentration values were similar in both incubators (P = 0.19, for high glucose, P = 0.25 for low glucose) and the maximum and final biofilm values were approximately the same (P = 0.46 at 24 h and after 48 h). Glucose concentration remained approximately constant when a lower initial concentration was used in both incubators (P = 0.50).
5.4 Discussion
Initial biofilm production was higher in the low glucose concentration condition for the higher amplitude incubator. Independent findings have shown that initial adhesion of Pseudomonas sp. can be favored by a low level of nutrients due to an increase in bacterial surface hydrophobicity (Chen et al. 2005). Furthermore, it has been reported that copiotrophic bacteria increased their adhesive properties in a medium with an extremely low carbon source concentration (Nikolaev et al. 2007). Conversely, for the lower amplitude incubator, the initial biofilm production was higher with the high glucose concentration, which is an indication that higher nutrient concentrations promoted biofilm formation (as it was verified for all remaining time points). Using a membrane system, Bühler et al. (1998) verified that increasing the nutrient concentration promotes E. coli biofilm growth and other groups obtained similar results with P. aeruginosa in annular reactors (Peyton 1996) and mixed-culture biofilms in flow cells (Stoodley et al. 1998). On the other hand, it was verified that increasing nutrient concentration can lead to cell detachment of P. putida in flow cells (Rochex et al. 2007). Teodósio et al. (2011) reported that E. coli JM109 produces biofilms when exposed to a Reynolds of 6000 in a flow channel, but at this flow regime no significant effect of the glucose concentration was detected and therefore the system hydrodynamics were probably controlling biofilm formation.
The higher biofilm production that was initially obtained for the high glucose condition on the small diameter incubator is probably related to the reduced shear stress experienced by the cells upon initial attachment (when compared to the larger diameter incubator). It has been demonstrated that cells from a mixed culture (including Pseudomonas, Klebsiella and Stenotrophomonas species) growing in a flow cell at a less turbulent regime were able to colonize glass surfaces at a higher rate than in high turbulent flow (Stoodley et al. 1998). This is an indication that, although a faster flow will bring more cells into contact with the surface, the adhesion efficiency may be reduced due to the higher shear (Stoodley et al. 1998).

Chapter 5
80
Since mass transfer between the liquid bulk and the biofilm is affected by the fluid velocity and the concentration gradient (Incropera et al. 1990), one could expect higher biofilm formation on the higher diameter incubator (the one with improved mixing according to our results) if fluid velocity was limiting mass transfer and biofilm growth in the lower diameter incubator. Indeed, the outgrowth of a biofilm is known to depend on nutrient transport and biomass specific growth rate (Vieira et al. 1999). Since we have shown that liquid velocity is lower when the smaller shaking amplitude is used, nutrient transport could be limited by the hydrodynamic conditions (Vieira et al. 1999; Zhang et al. 2008). However, the glucose concentration curves were similar in both incubators and the maximum and final biofilm values were approximately the same for each culture medium. This seems to indicate that glucose concentration and not flow dynamics was controlling biofilm development in these experiments. As far as oxygen transfer is concerned it has been shown that the oxygen transfer rate (gas to liquid) can be 70% lower with an incubator of 25 mm shaking amplitude when compared to one with 50 mm (Duetz et al. 2004). Due to the similarity of maximum and final biofilm values attained in both incubators it seems that oxygen transfer was not controlling biofilm development on the smaller diameter incubator.
For the high glucose concentration, after the maximum value was attained the amount of biofilm decreased in both incubators and stabilized at the end of the experiment. For the larger diameter incubator, this decrease was more pronounced probably as a result of the shear forces that may promote biofilm sloughing/detachment (Beyenal et al. 2002).
For both incubators, the maximum biofilm value was obtained at 24 h. A previous study showed that E. coli biofilm layers emerged on urethral catheters between 4 and 12 h after infection and these biofilms were completely developed in 24 h (Koseoglu et al. 2006), which correlates well with our data. In this work, biofilm formation was followed for 60 h but other research groups followed biofilm growth during different experimental intervals. Belik et al. (2008) studied regulation of biofilm formation of E. coli K12 in microtiter plates for 24 h and also verified that this is the optimal time for biofilm formation. The prolongation of this time also resulted in a decreased level of biofilm accumulation. On the other hand, Simões et al. (2010b) assessed the biofilm formation ability of several drinking water-isolated bacteria in microtiter plates for 24, 48 and 72 h and concluded that all these bacteria formed biofilms albeit at different times.
Our simulation results show that despite the small diameter of the wells, the shaking frequency that is used is sufficient to cause fluid mixing as also shown by other studies (Zhang et al. 2008) performed in similar conditions. Indeed, the simulations were performed taking into account surface tension effects including the interaction between the fluid and the wall of the well by using the appropriate contact angle. The results indicate that the wall shear stress changes periodically and is unevenly distributed in the cylindrical wall and that the shear stress is very low at the bottom of the wells. This is in good agreement with the fact that biofilms were formed predominantly on the walls and not on the bottom. In particular, it was seen that the shear stress is higher in the liquid side near the interface, and there are spots for which the wall shear stress has a relative maximum. It has been demonstrated that shear stress can induce cell adhesion (Mohamed et al. 2000; Donlan et al. 2002; Liu et al. 2006), influence cell proliferation and orientation (Dardik

Chapter 5
81
et al. 2005), and induce other physiological responses (Thomas et al. 2002). Some groups have even demonstrated that differences in the shear stress field can induce heterogeneity within a biofilm (Dieterich et al. 2000; Sakamoto et al. 2010; Salek et al. 2011) and that sometimes this heterogeneity is correlated to different antimicrobial susceptibilities (Salek et al. 2009; Kostenko et al. 2010). Since microtiter plates are often used for testing antibiotic susceptibility of various organisms (Salek et al. 2011), it is possible that the biofilms formed inside the 96-well plates are not homogeneous due to the uneven distribution of the shear stress. Besides microtiter plates, other platforms are also intensively used for biofilm simulation. For instance, flow cells with removable coupons are often preferred in order to attain higher shear stress values that are common in some industrial settings (Teodósio et al. 2011). One of the design rules for these flow cells is the requirement for constant velocity and shear stress fields in the area where biofilms are formed (Bakker et al. 2003; Stoodley et al. 2003). This is to ensure reproducibility between different coupons, which is essential for instance for time-course experiments (Teodósio et al. 2011; Teodósio et al. 2012b). This condition is not required on microtiter plates because, despite the uneven distribution of the wall shear stress that we have shown to exist within one well, identical hydrodynamic regimes are obtained in all of the wells of a plate thus allowing direct comparisons between them. It has been shown that biofilms in the human body are naturally heterogeneous (Potter et al. 2012) and this may be due to the natural variations in the shear stress field that occur in our bodies (Lantz et al. 2011). Additionally, it is known that for instance in our circulatory system the flow is predominantly laminar (Kostenko et al. 2010) and that a high degree of heterogeneity is commonly found in biofilms formed in laminar conditions (Zhang et al. 2011). Thus, it seems that as long as the shear stress field in the microtiter plates mimics the shear stress field that is found in the particular biomedical system that it is supposed to simulate, the uneven distribution of the shear stress in the wells may be a more accurate simulation of the actual system when compared to other biofilm platforms where the shear stress is constant, leading to the formation of more homogeneous biofilms.
The average strain rates obtained on the walls of the wells were of 23.0 and 46.2 s-1 (for the smaller and larger orbital diameters, respectively). The average strain rate found in urinary catheters is 15 s-1 (Velraeds et al. 1998; Bakker et al. 2003) and E. coli is the most predominant organism responsible for infections in these medical devices (Koseoglu et al. 2006). Additionally, within our circulatory system, strain rates between 20 and 200 s-1 are found in different veins (Inauen et al. 1990; Ross et al. 1998; Michelson 2002) Thus, the microtiter plate platform can be used to simulate the hydrodynamic conditions found in urinary catheters (with a lower shaking frequency, if necessary), and it can also reproduce the hydrodynamic conditions found on different parts of our circulatory system.
The results presented in this study demonstrate that the 96-well microtiter plate is a versatile platform for conducting dynamic biofilm studies. One of the most important requisites that any biofilm simulation platform must have is the ability to reproduce the hydrodynamic conditions that are found on the particular setting that is being simulated. We have shown that besides the high-throughput that is commonly referred to as one of the main advantages of microtiter plates (when compared to other biofilm reactors), when the

Chapter 5
82
agitation conditions are correctly set (orbital diameter and shaking frequency), they can adequately simulate different systems with biomedical interest. These are the cases of the urinary catheters where pathogenic strains of E. coli cause massive problems but also components of our circulatory system where E. coli and other organisms form unwanted biofilms.
5.5 References
Azevedo NF, Pinto AR, Reis NM, Vieira MJ, Keevil CW. 2006. Shear stress, temperature, and inoculation concentration influence the adhesion of water-stressed Helicobacter pylori to stainless steel 304 and polypropylene. Appl. Environ. Microbiol. 72:2936-2941.
Bakker DP, van der Plaats A, Verkerke GJ, Busscher HJ, van der Mei HC. 2003. Comparison of velocity profiles for different flow chamber designs used in studies of microbial adhesion to surfaces. Appl. Environ. Microbiol. 69:6280-6287.
Barrett TA, Wu A, Zhang H, Levy MS, Lye GJ. 2010. Microwell engineering characterization for mammalian cell culture process development. Biotechnology and Bioengineering. 105:260-275.
Belik AS, Tarasova NN, Khmel IA. 2008. Regulation of biofilm formation in Escherichia coli K12: Effect of mutations in the genes HNS, STRA, LON, and RPON. Molecular Genetics, Microbiology and Virology. 23:159-162.
Beyenal H, Lewandowski Z. 2000. Combined effect of substrate concentration and flow velocity on effective diffusivity in biofilms. Water Research. 34:528-538.
Beyenal H, Lewandowski Z. 2002. Internal and external mass transfer in biofilms grown at various flow velocities. Biotechnology Progress. 18:55-61.
Brackbill JU, Kothe DB, Zemach C. 1992. A continuum method for modeling surface tension. Journal of Computational Physics. 100:335-354.
Brown MRW, Barker J. 1999. Unexplored reservoirs of pathogenic bacteria: protozoa and biofilms. Trends in Microbiology. 7:46-50.
Bühler T, Ballestero S, Desai M, Brown MRW. 1998. Generation of a reproducible nutrient-depleted biofilm of Escherichia coli and Burkholderia cepacia. Journal of Applied Microbiology. 85:457-462.
Carteau D, Soum-Soutéra E, Fay F, Dufau C, Cérantola S, Vallée-Réhel K. 2010. Monohalogenated maleimides as potential agents for the inhibition of Pseudomonas aeruginosa biofilm. Biofouling. 26:379-385.
Chen MJ, Zhang Z, Bott TR. 2005. Effects of operating conditions on the adhesive strength of Pseudomonas fluorescens biofilms in tubes. Colloids and Surfaces B: Biointerfaces. 43:61-71.
Contreras-García A, Bucio E, Brackman G, Coenye T, Concheiro A, Alvarez-Lorenzo C. 2011. Biofilm inhibition and drug-eluting properties of novel DMAEMA-modified polyethylene and silicone rubber surfaces. Biofouling. 27:123-135.
Dardik A, Chen L, Frattini J, Asada H, Aziz F, Kudo FA, Sumpio BE. 2005. Differential effects of orbital and laminar shear stress on endothelial cells. Journal of Vascular Surgery. 41:869-880.
Dieterich P, Odenthal-Schnittler M, Mrowietz C, Krämer M, Sasse L, Oberleithner H, Schnittler H-J. 2000. Quantitative morphodynamics of endothelial cells within confluent cultures in response to fluid shear stress. Biophysical journal. 79:1285-1297.
Donlan RM, Costerton JW. 2002. Biofilms: survival mechanisms of clinically relevant microorganisms. Clin. Microbiol. Rev. 15:167-193.

Chapter 5
83
Duetz WA, Witholt B. 2004. Oxygen transfer by orbital shaking of square vessels and deepwell microtiter plates of various dimensions. Biochemical Engineering Journal. 17:181-185.
Gristina AG, Costerton JW. 1984. Bacterial adherence and the glycocalyx and their role in musculoskeletal infection. Orthopedic Clinics Of North America 15:517-535.
Gristina AG, Costerton JW. 1985. Bacterial adherence to biomaterials and tissue. The significance of its role in clinical sepsis. Journal of Bone and Joint Surgery-American Volume. 67:264-273.
Hermann R, Lehmann M, Buchs J. 2003. Characterization of gas–liquid mass transfer phenomena in microtiter plates. Biotechnology and Bioengineering. 81:178-186.
Hirt CW, Nichols BD. 1981. Volume of fluid (VOF) method for the dynamics of free boundaries. Journal of Computational Physics. 39:201-225.
Inauen W, Baumgartner HR, Bombeli T, Haeberli A, Straub PW. 1990. Dose- and shear rate-dependent effects of heparin on thrombogenesis induced by rabbit aorta subendothelium exposed to flowing human blood. Arteriosclerosis, Thrombosis, and Vascular Biology. 10:607-615.
Incropera I, DeWitt D. 1990. Fundamentals of heat and mass transfer. Singapore: Wiley.
Iyamba JL, Seil M, Devleeschouwer M, Kikuni NT, Dehaye J. 2011. Study of the formation of a biofilm by clinical strains of Staphylococcus aureus. Biofouling. 27:811-821.
Jackson DW, Simecka JW, Romeo T. 2002. Catabolite repression of Escherichia coli biofilm formation. J. Bacteriol. 184:3406-3410.
Jagani S, Chelikani R, Kim DS. 2009. Effects of phenol and natural phenolic compounds on biofilm formation by Pseudomonas aeruginosa. Biofouling. 25:321-324.
Klein GL, Soum-Soutéra E, Guede Z, Bazire A, Compère C, Dufour A. 2011. The anti-biofilm activity secreted by a marine Pseudoalteromonas strain Biofouling 27:931-940.
Koseoglu H, Aslan G, Esen N, Sen BH, Coban H. 2006. Ultrastructural stages of biofilm development of Escherichia coli on urethral catheters and effects of antibiotics on biofilm formation. Urology. 68:942-946.
Kostenko V, Salek MM, Sattari P, Martinuzzi RJ. 2010. Staphylococcus aureus biofilm formation and tolerance to antibiotics in response to oscillatory shear stresses of physiological levels. FEMS Immunology & Medical Microbiology. 59:421-431.
Lantz J, Renner J, Karlsson M. 2011. Wall shear stress in a subject specific human aorta - influence of fluid-structure interaction. International Journal of Applied Mechanics. 3:759-778.
Lee JH, Park JH, Kim JA, Neupane GP, Cho MH, Lee CS, Lee J. 2011. Low concentrations of honey reduce biofilm formation, quorum sensing, and virulence in Escherichia coli O157:H7. Biofouling. 27:1095-1104.
Liu Y, Tay J. 2002. The essential role of hydrodynamic shear force in the formation of biofilm and granular sludge. Water Research. 36:1653-1665.
Liu Z, Lin YE, Stout JE, Hwang CC, Vidic RD, Yu VL. 2006. Effect of flow regimes on the presence of Legionella within the biofilm of a model plumbing system. Journal of Applied Microbiology. 101:437-442.
Lorite GS, Rodrigues CM, Souza AAd, Kranz C, Mizaikoff B, Cotta MA. 2011. The role of conditioning film formation and surface chemical changes on Xylella fastidiosa adhesion and biofilm evolution. Journal of Colloid and Interface Science. 359:289-295.
Melo LF, Vieira MJ. 1999. Physical stability and biological activity of biofilms under turbulent flow and low substrate concentration. Bioprocess Engineering. 20:363-368.
Michelson A. 2002. Platelets. 2nd. New york: Academic Press.
Missirlis YF, Katsikogianni M. 2004. Concise review of mechanisms of bacterial adhesion to biomaterials and of techniques used in estimating bacteria-material interactions Cells and Materials. 8:37-57.

Chapter 5
84
Mohamed N, Rainier TR, Ross JM. 2000. Novel experimental study of receptor-mediated bacterial adhesion under the influence of fluid shear. Biotechnology and Bioengineering. 68:628-636.
Nikolaev Y, Plakunov V. 2007. Biofilm - “City of microbes” or an analogue of multicellular organisms? Microbiology. 76:125-138.
Peyton BM. 1996. Effects of shear stress and substrate loading rate on Pseudomonas aeruginosa biofilm thickness and density. Water Research. 30:29-36.
Potter CMF, Schobesberger S, Lundberg MH, Weinberg PD, Mitchell JA, Gorelik J. 2012. Shape and compliance of endothelial cells after shear stress in vitro or from different aortic regions: scanning ion conductance microscopy study. PLoS ONE. 7:e31228.
Robert JM, Salek MM. 2010. Numerical Simulations - examples and applications in computational fluid dynamics. Canada: InTech. Numerical simulation of fluid flow and hydrodynamic analysis in commonly used biomedical devices in biofilm studies.
Rochex A, Lebeault JM. 2007. Effects of nutrients on biofilm formation and detachment of a Pseudomonas putida strain isolated from a paper machine. Water Research. 41:2885-2892.
Rodrigues DF, Elimelech M. 2009. Role of type 1 fimbriae and mannose in the development of Escherichia coli K12 biofilm: from initial cell adhesion to biofilm formation. Biofouling. 25:401-411.
Ross JM, Alevriadou BR, McIntire LV. 1998. Thrombosis and Hemorrhage. Baltimore, MD: Williams & Wilkins. 17, Rheology.
Sakamoto N, Saito N, Han X, Ohashi T, Sato M. 2010. Effect of spatial gradient in fluid shear stress on morphological changes in endothelial cells in response to flow. Biochemical and Biophysical Research Communications. 395:264-269.
Salek MM, Jones SM, Martinuzzi RJ. 2009. The influence of flow cell geometry related shear stresses on the distribution, structure and susceptibility of Pseudomonas aeruginosa 01 biofilms. Biofouling. 25:711-725.
Salek MM, Sattari P, Martinuzzi RJ. 2011. Analysis of fluid flow and wall shear stress patterns inside partially filled agitated culture well plates. Annals of Biomedical Engineering. 40:707-728.
Shakeri S, Kermanshahi RK, Moghaddam MM, Emtiazi G. 2007. Assessment of biofilm cell removal and killing and biocide efficacy using the microtiter plate test. Biofouling. 23:79-86.
Shunmugaperumal T. 2010. Biofilm eradication and prevention: a pharmaceutical approach to medical device infections. New Jersey: Wiley.
Silverstein AD, Henry GD, Evans B, Pasmore M, Simmons CJ, Donatucci CF. 2006. Biofilm formation on clinically noninfected penile prostheses. The Journal of Urology. 176:1008-1011.
Simões LC, Simões M, Vieira MJ. 2010a. The influence of the diversity of bacterial isolates from drinking water on resistance of biofilms to disinfection. Applied and Environmental Microbiology 76:6673-6679.
Simões LC, Simões M, Vieira MJ. 2010b. Adhesion and biofilm formation on polystyrene by drinking water-isolated bacteria. Antonie van Leeuwenhoek. 98:317-329.
Simões M, Simões LC, Vieira MJ. 2010. A review of current and emergent biofilm control strategies. LWT - Food Science and Technology. 43:573-583.
Stoodley P, Dodds I, Boyle JD, Lappin-Scott HM. 1998. Influence of hydrodynamics and nutrients on biofilm structure. Journal of Applied Microbiology. 85:19S-28S.
Stoodley P, Warwood BK. 2003. Biofilms in medicine, industry and environmental biotechnology: characteristics, analyses and control. London (UK): IWA Publishing. Use of flow cells and annular reactors to study biofilms.
Teodósio JS, Simões M, Melo LF, Mergulhão FJ. 2011. Flow cell hydrodynamics and their effects on E. coli biofilm formation under different nutrient conditions and turbulent flow. Biofouling. 27:1-11.

Chapter 5
85
Teodósio JS, Simões M, Mergulhão FJ. 2012a. The influence of non-conjugative Escherichia coli plasmids on biofilm formation and resistance. Journal of Applied Microbiology. 113:373–382.
Teodósio JS, Simões M, Alves MA, Melo L, Mergulhão F. 2012b. Setup and validation of flow cell systems for biofouling simulation in industrial settings. The Scientific World Journal ID 361496.
Thomas WE, Trintchina E, Forero M, Vogel V, Sokurenko EV. 2002. Bacterial adhesion to target cells enhanced by shear force. Cell. 109:913-923.
Velraeds MMC, van de Belt-Gritter B, Van der Mei HC, Reid G, Busscher HJ. 1998. Interface in initial adhesion of uropathogenic bacteria and yeasts to silicone rubber by a Lactobacillus acidophilos biosurfactant Journal of Medical Microbiology. 47:1081-1085.
Vieira MJ, Melo LF. 1999. Intrinsic kinetics of biofilms formed under turbulent flow and low substrate concentrations. Bioprocess and Biosystems Engineering. 20:369-375.
White FM. 1994. Fluid Mechanics. 3rd. Singapore: McGraw-Hill.
Youngs DL. 1982. Numerical Methods for Fluid Dynamics. New York: Academic Press. Time-dependent multi-material flow with large fluid distortion.
Zhang H, Lamping SR, Pickering SCR, Lye GJ, Shamlou PA. 2008. Engineering characterisation of a single well from 24-well and 96-well microtitre plates. Biochemical Engineering Journal. 40:138-149.
Zhang W, Sileika TS, Chen C, Liu Y, Lee J, Packman AI. 2011. A novel planar flow cell for studies of biofilm heterogeneity and flow–biofilm interactions. Biotechnology and Bioengineering. 108:2571-2582.

Chapter 5
86
Chapter 6
87
Chapter 6 The effect of surface conditioning on bacterial adhesion and biofilm formation
In this chapter, the effect of surface conditioning with several agents on E. coli adhesion and biofilm formation was investigated. Three typical culture medium components (glucose, yeast extract and peptone), one protein (bovine serum albumin), two cell membrane components (mannose and palmitic acid) and extracts from cellular fractionation were tested as surface conditioning agents. The assays were conducted in agitated 96-well microtiter plates and in a PPFC, both operated at the same average wall shear stress as determined by CFD. Microtiter plates were chosen for the initial screening assays due to their high-throughput. A flow system was also used to assess the influence of flow topology on cell adhesion and biofilm formation. The PPFC was chosen over the semi-circular flow cell due to the lower working volume as some of the cell extracts that were tested are difficult to obtain in large quantities. Cell adhesion and biofilm formation were monitored in the PPFC but only biofilm formation assays were conducted in the 96-well plates. This is due to the relatively high detection limit of the staining method used for biomass quantitation in the microtiter plate format. Numerical simulations were conducted by Dr. José Araújo from the Transport Phenomena Research Center (CEFT-FEUP). Results showed that surface conditioning with the tested agents decreased biofilm formation by approximately 60% except for glucose and mannose. Additionally, similar results were obtained in both biofilm forming platforms indicating that the average wall shear stress may be a suitable scale-up parameter from 96-well microtiter plates to larger-scale flow cell systems. For the most part, biofilm inhibition caused by cell components could be explained by a reduction in the initial cell attachment. These results suggest that in systems where biofilm formation is not critical below a certain threshold, planktonic cellular lysis and subsequent adsorption of cell components to inert surfaces may reduce biofilm buildup and extend the operational time by increasing cleaning intervals.
This chapter was adapted from:
Moreira JMR, Araújo JDP, Simões M, Melo LF, Mergulhão FJ. Biofilm prevention using cellular components. Water Research. (Submitted).

Chapter 6
88

Chapter 6
89
6.1 Introduction
Microorganisms exist in nature mostly in the form of structured communities called biofilms (Nikolaev et al. 2007). The biofilm formation process is initiated with the transport of free floating cells and macromolecules from the water phase to a surface (Lorite et al. 2011). In the first step, a conditioning layer of adsorbed macromolecules such as nutrients and proteins from the aqueous environment is formed (Chmielewski et al. 2003). Planktonic cells adhere to this conditioning layer and, after an irreversible anchorage, exopolymeric substances are secreted by them (Shi et al. 2009). The polymeric matrix confers biofilm stability, protection, and acts as a source of nutrients and water that becomes trapped in the matrix (Chmielewski et al. 2003). As the biofilm matures, a balance between detachment and growth is achieved and thereafter, the amount of biomass remains approximately constant in time (Teodósio et al. 2011).
Industrial environments provide a variety of conditions that might favor biofilm formation. Since most industrial facilities use water to cool equipment or depend on pipes to transport fluids, there is a substantial risk of biofilm development on equipment and piping systems (Nithila et al. 2014). Biofilm formation contributes to reduced heat transfer in plate heat exchangers, reduced flow through blocked tubes and may also contribute to the corrosion of various materials since biofilms may secrete aggressive substances (Shi et al. 2009; Melo et al. 2010). Moreover, biofilms present in the process water lines in the food industry are also important because they can act as a source of recurrent contamination to the plant, product and personnel (Shi et al. 2009).
It has been estimated that the negative causes of biofilm development in industrial process lines can account for 30% of the plant operating costs (Melo et al. 2010). In the naval sector, costs associated with biofouling are estimated at 15 billion US$/year worldwide (Abdul Azis et al. 2001). Moreover, the total biofouling costs may represent 0.05% of the Gross National Product in developed countries (Simões et al. 2013)
In order to control biofilms, cleaning and disinfection methods have been applied in industrial plants (Cloete et al. 1998; Bremer et al. 2006) increasing production costs and process downtimes. However, biofilms are more tolerant to cleaning agents than planktonic cells (Simões et al. 2010) and therefore an integrated anti-biofouling strategy focused in keeping biofilm growth below a certain threshold is now being considered (Habimana et al. 2014). Studies have been made in order to gain a better understanding of bacterial adhesion and biofilm formation. Dat et al. (2010) investigated the influence of surface conditioning with milk at different pH values on Lactobacillus paracasei adhesion in order to elucidate about the process of bacterial contamination in the dairy industry. The authors observed that surfaces previously conditioned with acidic milk were less prone to bacterial adhesion in comparison with untreated surfaces. However, this effect was not sustained for long periods of bacterial exposure. Moreover the results indicated that attachment increased with exposure time (from 30 min to 12 h). On the other hand, de Kerchove et al. (2007) studied the effect of an alginate (representative of dissolved organic matter) as conditioning agent on the deposition of motile and non-motile P. aeruginosa. They observed that cell adhesion was enhanced in the presence of this conditioning film for both strains although to a lower extent for the motile bacteria. It is known that surface conditioning can affect

Chapter 6
90
the initial adhesion of bacterial cells but the identification of the key players in this process is still missing. Also, the impact of surface conditioning (which may affect initial adhesion) on biofilm maturation is poorly understood.
This study aims to evaluate the effect of surface conditioning with ingredients from the culture medium and cellular components on E. coli adhesion and biofilm formation. The conditioning effect provided by these agents may be important because culture medium ingredients are in contact with the surface even before initial adhesion and also cellular components originating from lysis may also be present at these earlier stages. A screening of the most relevant conditioning agents affecting E. coli biofilm formation was performed in agitated 96-well microtiter plates since this is a high throughput platform. Then, the effect of the most relevant conditioning agents was evaluated on bacterial adhesion and biofilm formation assays performed in a parallel plate flow chamber (PPFC) using the same average shear stress obtained in microtiter plates. The scalability of the results obtained in these small scale systems and the possibility of application to industrial settings are discussed.
6.2 Materials and methods
6.2.1 Numerical simulations
The commercial CFD package Ansys FLUENT (release 14.5) was used to simulate the flow in two distinct scenarios: inside a well of a microtiter plate (with a diameter of 6.6 mm and height of 11.7 mm) subjected to an orbital motion with an amplitude of 50 mm and a shaking frequency of 150 rpm (Moreira et al. 2013); in a PPFC unit (with a cross section of 8 × 16 mm and a length of 254.2 mm) at several inlet flow rate conditions. The three-dimensional geometries of the domains were built in Design Modeller 14.5 and discretized into grids by Meshing 14.5. These grids consisted on 18,876 and 1,694,960 hexahedral cells for the well and the PPFC, respectively. Particular care was taken in the PPFC mesh, where refinement was introduced near the walls (a region with higher velocity gradients) and in a central cylindrical core (where a jet flow forms along the axis).
In the simulation of the well, since two phases are present, it was necessary to apply an interface capturing technique. The option fell on the VOF methodology (Hirt et al. 1981) already implemented in Ansys FLUENT, along with the geometric reconstruction scheme (Youngs 1982). The surface tension model used was the continuum surface force (Brackbill et al. 1992). An accelerating reference frame was also applied, and the circular orbital motion was implemented. The simulation was initialized with the well filled with 200 µl of liquid (at rest conditions) and the remaining volume consisting on gas phase. The properties of water and air at 30 ºC were assumed for the liquid and gas phases, respectively, and the value of the surface tension in air/water system at the same temperature was also used. A contact angle of 83º and the no slip boundary condition were set for all walls (Simões et al. 2010a). The PISO (pressure-implicit with splitting of operators) was the chosen algorithm to solve the velocity-pressure coupled equations, the discretization of the momentum equations was made by the QUICK scheme, and the PRESTO! scheme was applied for

Chapter 6
91
pressure discretization. The simulation ran for a physical time of 5 s with a fixed time step of 2.5 × 10⁻⁴ s.
In the case of the PPFC, several simulations were performed with the purpose of determining the inlet flow rate that yields an average wall shear stress in the visualization zone similar to the one obtained inside the wells at the shaking conditions used in this work. The flow rate conditions of these simulations led to flow under turbulent regime (inlet Reynolds number higher than 3500), and so, the SSL k-ω model (Menter 1994) with low Reynolds corrections was applied. A zero velocity was set as initial condition, and the boundary conditions comprehended a uniform velocity profile at the inlet and a zero relative pressure at the outlet. The fluid was assumed to be water at 30 ºC. A no slip boundary condition was again considered in all walls. Similarly to the simulation of the well, the solution methods applied were PISO, QUICK and the PRESTO! scheme. Due to the unsteadiness related to the jet flow that forms at the inlet and to tackle possible convergence issues, the whole set of PPFC simulations was performed in transient state. In these simulations, a physical time of 2 s and a fixed time step of 10-4 s were used.
6.2.2 Bacteria and culture conditions
E. coli JM109(DE3) was used since this strain had already demonstrated a good biofilm formation capacity (Teodósio et al. 2012). A starter culture was obtained by inoculation of 500 µL of a glycerol stock (kept at -80 ºC) to a total volume of 0.2 L of inoculation media with 5.5 g L-1 glucose, 2.5 g L-1 peptone, 1.25 g L-1 yeast extract in phosphate buffer (1.88 g L-1 KH2PO4 and 2.60 g L-1 Na2HPO4) at pH = 7.0, as described by Teodósio et al. (2013). This culture was grown in a 1 L shake-flask, incubated overnight at 30 ºC with orbital agitation (120 rpm). A volume of 60 mL from the overnight grown culture was used to harvest cells by centrifugation (10 min, 3202 g). Cells were washed twice with citrate buffer 0.05 M (Simões et al. 2008), pH 5.0 and finally the pellet was resuspended and diluted in the same buffer in order to reach an optical density (OD) of 0.1 at 610 nm, corresponding to a cell density of 0.76×10⁸ cell.mL-1. This cell suspension was used for the adhesion and biofilm formation assays in the PPFC and microtiter plates.
6.2.3 Conditioning agents
Three medium components representing the carbon (C) and nitrogen (N) source (glucose, yeast extract and peptone), a standard protein (bovine serum albumin, BSA), two components representative of the cellular membrane (mannose and palmitic acid) (Gabriel 1987 and Oursel et al. 2007) and three types of cellular extracts: periplasmic extract (PE), cytoplasm with cellular debris (CCDE) and total cell extract (TCE) were tested as conditioning agents.
Glucose (40% C), peptone (13% N) and yeast extract (> 10% N) (obtained from Merck), were prepared at 0.3, 1, 2, 3, 5 g.L-1. In a previous work (Moreira et al. 2013), the effect of glucose concentration on biofilm formation was assayed (at 0.3 and 1 g.L-1) and biofilm formation was enhanced at the highest concentration. Thus, even higher concentrations were tested on this work.

Chapter 6
92
It has been shown that proteins can influence bacterial adhesion (Barnes et al. 1999; Tang et al. 2006), therefore BSA (Merck) was chosen as standard representative protein and prepared at 0.1, 0.2, 0.3, 1, 3 g.L-1. These concentrations were chosen based on dirty (3 g.L-1) and clean (0.3 g.L-1) conditions described for industrial settings (EN1276 1997).
The components of cellular membrane (Gabriel 1987 and Oursel et al. 2007) were represented by mannose (Fluka) and palmitic acid (Merck) at 0.5, 1, 5, 10, 100 g.L-1 and 2.5×10⁻⁴, 2.5×10⁻³, 2.5×10⁻², 0.25, 2.5 g.L-1 (bellow the micellar concentration), respectively.
Cell extracts were obtained from an overnight culture prepared as described before. Then, the cells were harvested by centrifugation (10 min, 3202 g) and washed twice with distilled water. The pellet was concentrated and resuspended in water in order to reach an OD (610 nm) of 4, corresponding to a cell density of 30.4×10⁸ cell.mL-1. This suspension was then divided in two parts, one part for the preparation of the PE and CCDE and another originating the TCE. The PE was obtained as described in Mergulhão et al. (2001). Briefly, the cells at an OD of 4 were centrifuged again (10 min, 4000 g) and resuspended in a 20% sucrose solution (20% sucrose, 0.3 M Tris-HCl and 1 mM EDTA, pH 8). After an incubation of 15 min at room temperature, the suspension was centrifuged (10 min, 6000 g) and the pellet resuspended in ice-cold water and incubated on ice for more 15 min. After a centrifugation at 12000 g during 7 min, the PE was obtained in the supernatant. The pellet was resuspended in ice cold water and sonicated (7 cycles of 30 s at 20 Hz) in order to obtain the CCDE. The TCE was obtained by subjecting the cellular suspension at an OD of 4 to four cycles of freezing (at – 80ºC) and thawing (at 30 ºC). The TCE, CCDE and periplasmic extracts that were obtained from a cell suspension with an OD (610 nm) of 4 (corresponding to a cell density of 30.4×10⁸ cell.mL-1) were further diluted in water to recreate cell suspensions with a cellular concentration of (0.38, 0.76, 3.04, 6.08, 12.2 and 24.3) × 108 cell.mL-1.
6.2.4 Microtiter plate assay
Six wells of sterile 96-well polystyrene microtiter plates (Orange Scientific) were filled with 200 µL of a solution containing the conditioning agent at each desired concentration. The plates were incubated at 30 ºC with agitation (150 rpm, 50 mm) for 1 h. After surface conditioning, each well was washed with 200 µL of citrate buffer, pH 5.0. The pre-conditioned microtiter plates were filled with 200 µL of the cellular suspension with an OD (610 nm) of 0.1 (prepared as described earlier). Biofilm formation on unconditioned surfaces was utilized as control. To promote biofilm formation, plates were incubated at 30 ºC with agitation (150 rpm, 50 mm) for 24 h.
The crystal violet assay was used for biofilm quantification (Moreira et al. 2013). To remove the non-adherent cells, wells were washed with sterile water (200 µL per well). Biofilms were fixed with 250 µL of 96% ethanol and, after 15 min, the content was emptied. Fixed bacteria were stained for 5 min with 200 µL of 1% (v/v) crystal violet (Merck) per well. After that, the plate was again emptied and the dye bound to adherent cells was resolubilized with 200 µL of 33% (v/v) acetic acid (VWR). The OD was measured at

Chapter 6
93
570 nm using a microtiter plate reader (SpectraMax M2E, Molecular Devices) and the biofilm amount was expressed as OD570 nm values.
6.2.5 Parallel plate flow chamber assay
The conditioning agents which have shown some effect on biofilm formation in the microtiter plate assay were chosen at the most effective concentration to be tested in a PPFC in order to observe their effect on bacterial adhesion (after 30 min) and biofilm formation (after 24 h). Biofilm adhesion assays were not conducted in the microtiter plates due to the detection limit of the crystal violet staining method.
The PPFC was coupled to a tank connected to a centrifugal pump and tubing system to conduct the adhesion assay. The PPFC contained a recess in the bottom for the introduction of polystyrene coupons. Coupons were washed with a commercial detergent (Sonasol Pril, Henkel Ibérica S A), immersed in sodium hypochlorite (3%) and before the assay they were washed with distilled water.
The PPFC was first conditioned for 1 h at the same average shear stress operated in the microtiter plates, which corresponds to a flow rate of 11 mL.s-1. The tested concentrations of each compound were: yeast extract 2 g.L-1, peptone 2 g.L-1, palmitic acid 0.025 g.L-1, BSA 0.3 g.L-1. Periplasmic extract corresponding to a cellular concentration of 0.38x10⁸ cell.mL-1 and CCDE and TCE corresponding to 24.3×10⁸ cell.mL-1 were also tested as they were the most effective in the screening assay. Temperature was kept constant at 30 ºC using a recirculating water bath and after surface conditioning, the PPFC was washed with citrate buffer, pH 5.0.
To assess the effect of each pre-conditioned surface on E. coli adhesion (after 30 min) and biofilm formation (after 24 h), the cellular suspension with an OD (610 nm) of 0.1 (prepared as described earlier) was circulated through the PPFC at a flow rate of 11 mL.s-1. Bacterial adhesion and biofilm formation on unconditioned polystyrene was utilized as control. In order to quantify the number of adhered cells at 30 min and 24 h, the coupons were retrieved from the PPFC at these time points, stained with 4,6-diamino-2-phenylindole DAPI (Sigma) at 0.5 mg mL-1 and left in the dark for 10 min. Cells were visualized under an epifluorescence microscope (Nikon Eclipse LV100, Japan) incorporating a camera (Nikon digital sight DS-RI 1, Japan). Images were acquired using a ×100 oil immersion fluorescence objective, and a filter sensitive to DAPI fluorescence (359-nm excitation filter in combination with a 461-nm emission filter). A total of 10 fields from each coupon were counted and used to calculate the total number of adhered cells per square centimeter.
6.2.6 Statistical analysis
Bacterial adhesion and biofilm quantification results are averages from three independent experiments performed with each conditioning agent and concentration. For the microtiter plates assays, six replicate wells were used per plate, in each independent experiment. Paired t-test analyses were performed to estimate whether or not there was a significant difference between the results and the control. Results were considered statistically different when a confidence level greater than 95% was reached (P < 0.05) and

Chapter 6
94
these time points were marked with an asterisk (*). Standard deviation between the 3 values obtained from the experiments is represented by error bars.
6.3 Results
6.3.1 Numerical simulation of the flow
The wall shear stress (τw) is a hydrodynamic feature with major impact in biofilm behavior. For this reason, the focus of the numerical data analysis was placed on the results obtained for that specific feature. Figure 6.1 compiles information about the wall shear stress field along the PPFC and in a well of a microtiter plate. In the bottom left of the figure (B1), a front view of the time averaged τw field in the wetted surface of the well (under a shaking frequency of 150 rpm with an orbital amplitude of 50 mm) is plotted. Only for reference purposes, the position (S) of the gas-liquid interface in a stationary well (without agitation) is also shown. The wall shear stress is unevenly distributed throughout the wetted surface, and higher values are concentrated in a region slightly below the gas-liquid interface. Furthermore, this region includes small areas with relative τw maxima that reveal the presence of unstable vortices in the vicinity of the walls. Based on the data presented in B1, an average τw value of 0.070 Pa was determined.
Regarding the PPFC numerical results, the data plotted in figure 6.1 concerns the case where the inlet flow rate was 11 mL.s-1. The entire τw field obtained for the bottom surface of the channel (width of 16 mm and length of 254.2 mm) is presented in panel A. Due to the jet flow originated at the inlet expansion, the higher values of τw occur for x < 50 mm. For x around 120 mm the wall shear stress seems to stabilize and in the visualization zone the flow is in fully developed state and the corresponding hydrodynamic features are stable.
The representation in panel B2 of figure 6.1 is obtained from zooming panel A to the dimensions of the visualization zone, and changing the color map to the one used in B1 to facilitate comparison. In this illustration, it is clear that τw is approximately constant in central regions of the plotted surface, but these values decrease considerably as the lateral edges are approached. This is mainly caused by a decrease in the velocity gradient in the corner regions (junction of two perpendicular walls). The average value of τw obtained for the visualization zone is around 0.074 Pa, which is similar to the one calculated in the well. This confirms that these two different environments induce a similar hydrodynamic influence on the biofilm despite the approximated volumetric scale-up of 100 fold.

Chapter 6
95
Figure 6.1 Wall shear stress in a PPFC (A and B2) and in a well of a 96-well microtiter plate (B1). A flow rate of 11 mL.s-1 was used for the simulation in the PPFC. A: wall shear stress in the bottom surface of the PPFC, the visualization plane is highlighted in the figure for clarity. B2: detail of the wall shear stress in the visualization zone. A shaking frequency of 150 rpm with an orbital shaking amplitude of 50 mm was used for the simulations in the well of a 96-well microtiter plate (B1). The well dimensions are indicated (D and H) as well as the liquid level at stationary condition (S).
6.3.2 Bacterial adhesion and biofilm formation
A 96-well microtiter plate and a PPFC were used in order to study the effect of culture medium components and cellular representatives as conditioning agents on bacterial adhesion and biofilm formation. The two platforms were operated in conditions that promoted a similar average shear stress (0.07 Pa) in the wetted surface of a well and in the visualization zone of the PPFC. Microtiter plates were used for screening due to their high throughput but given the detection limit of the staining method only biofilm formation assays (24 h) were performed on that system. The most relevant conditions originated from the screening were assayed in the PPFC for both initial adhesion (30 min) and biofilm formation (24 h) assays.

Chapter 6
96
The results obtained from the microtiter plates are plotted in figures 6.2 and 6.3.
Figure 6.2 Biofilm formation after 24 h in microtiter plates pre-conditioned with a) glucose, b) yeast extract, c) peptone, d) mannose, e) palmitic acid and f) BSA at different concentrations. Biofilm formed on unconditioned surface was used as control. The extent of biofilm formation was estimated by the crystal violet assay. Presented values are mean A570 nm ± standard deviation of three independent experiments with six replica wells per plate. Statistically significant differences are indicated with an asterisk. (*, P < 0.05)
Figure 6.2 shows 24 h biofilm quantification results when culture medium components, a protein and representatives of the cellular membrane compounds were tested as surface conditioning agents. It can be observed that, when glucose and mannose were tested as conditioning agents, the amount of biofilm formed in the conditioned wells was similar to the control for all tested concentrations (Figure 6.2a and Figure 6.2d, P > 0.05).
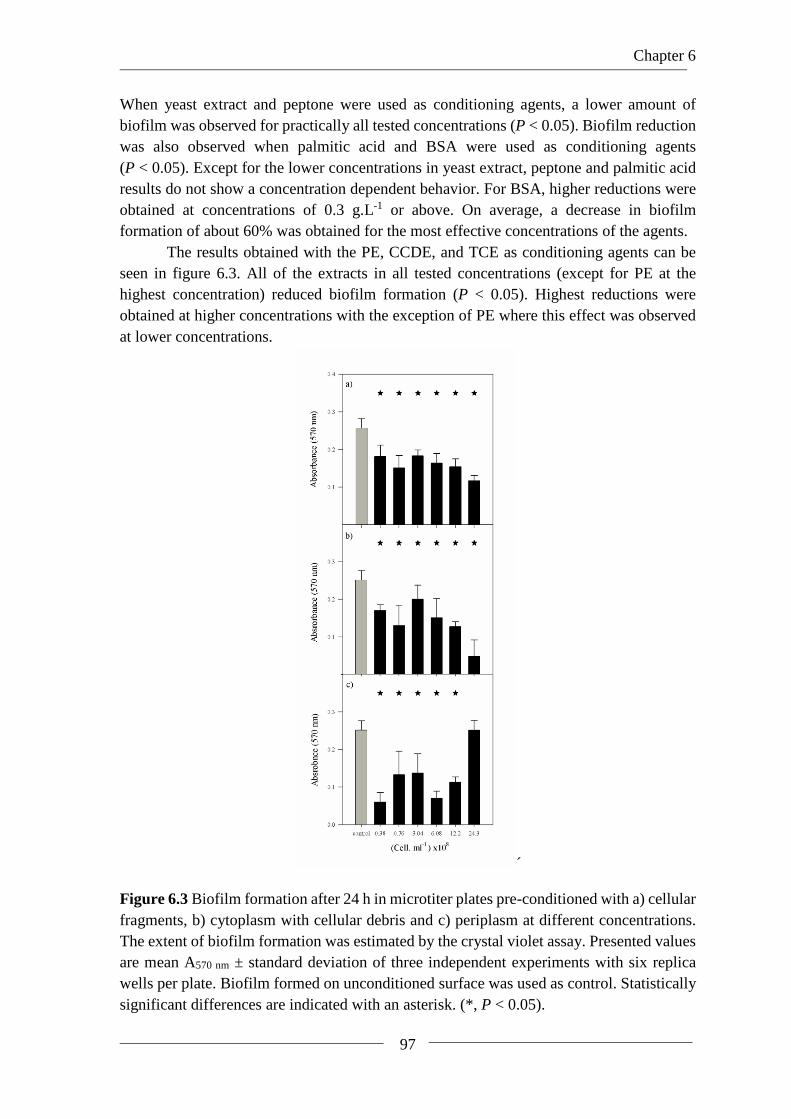
Chapter 6
97
When yeast extract and peptone were used as conditioning agents, a lower amount of biofilm was observed for practically all tested concentrations (P < 0.05). Biofilm reduction was also observed when palmitic acid and BSA were used as conditioning agents (P < 0.05). Except for the lower concentrations in yeast extract, peptone and palmitic acid results do not show a concentration dependent behavior. For BSA, higher reductions were obtained at concentrations of 0.3 g.L-1 or above. On average, a decrease in biofilm formation of about 60% was obtained for the most effective concentrations of the agents.
The results obtained with the PE, CCDE, and TCE as conditioning agents can be seen in figure 6.3. All of the extracts in all tested concentrations (except for PE at the highest concentration) reduced biofilm formation (P < 0.05). Highest reductions were obtained at higher concentrations with the exception of PE where this effect was observed at lower concentrations.
´
Figure 6.3 Biofilm formation after 24 h in microtiter plates pre-conditioned with a) cellular fragments, b) cytoplasm with cellular debris and c) periplasm at different concentrations. The extent of biofilm formation was estimated by the crystal violet assay. Presented values are mean A570 nm ± standard deviation of three independent experiments with six replica wells per plate. Biofilm formed on unconditioned surface was used as control. Statistically significant differences are indicated with an asterisk. (*, P < 0.05).

Chapter 6
98
After testing the conditioning agents in microtiter plates, the ones that were able to reduce biofilm formation were further tested using a PPFC to assay their effect in cell adhesion and biofilm formation (Figure 6.4). This test had two main objectives: i) to see if the results obtained in microtiter plates were scalable to a flow cell system and ii) to assess if biofilm reduction was due to a lower initial adhesion or by other events occurring at a later development stage. All three cell extracts (PE, CCDE and TCE) and yeast extract, peptone, palmitic acid and BSA were tested at the concentrations that caused the highest reduction in the microtiter plate assay (Figures 6.2 and 6.3).
Figure 6.4 Number of adhered cells per cm2 in the PPFC after a) 24 h and b) 30 min on polystyrene pre-conditioned surface with peptone (PEP) at 2 g.L-1, yeast extract (YE) at 2 g.L-1, BSA at 0.3 g.L-1, palmitic acid (PA) at 0.025 g.L-1, cellular fragments (TCE) corresponding to a cellular concentration of 24.3×10⁸ cell.mL-1, cytoplasm with cellular debris (CCDE) corresponding to a cellular concentration of 24.3×10⁸ cell.mL-1 and periplasm (PE) corresponding to a cellular concentration of 0.38×10⁸ cell.mL-1. Cells adhered on unconditioned surface were used as control. Presented values are mean ± standard deviation of three independent experiments. Statistically significant differences are indicated with an asterisk. (*, P < 0.05).
All the conditioning agents tested decreased biofilm formation in the PPFC. Biofilm reduction was on average 60% at the tested concentrations (Figure 6.4a). A decrease in initial adhesion was observed for BSA, palmitic acid, TCE and CCDE (Figure 6.4b,

Chapter 6
99
P > 0.05). Additionally, for BSA, palmitic acid and CCDE the same reduction values were obtained for initial adhesion and biofilm formation.
6.4 Discussion
The very first stage of biofilm formation is the surface conditioning with macromolecules (Chmielewski et al. 2003). Even before initial cell adhesion, components of the culture medium as well as cellular components originating from cell lysis may play an important role in this stage. The effect of surface conditioning with these agents on E. coli biofilm formation was therefore assayed in two different platforms. A screening assay of nine conditioning agents was conducted in agitated 96-well microtiter plates taking advantage of the high throughput of this platform. Seven inhibiting components were identified as well as their most effective concentrations. Since flow systems are common in industrial settings, the results obtained in microtiter plates were also verified in a PPFC. In order to maintain similar operational conditions, the same concentrations of the agents were used, the adhesion surface (polystyrene) was maintained and the flow cell was operated using a flow rate that yielded the same average wall shear stress in the visualization zone than the one obtained in the microtiter plates (as determined by CFD).
Similar biofilm reduction results were obtained for both platforms indicating that the average wall shear stress may be a good scale-up parameter from 96-well microtiter plates to the PPFC used in this work. Importantly, the scale-up factor was 100 and the flow topologies in the two platforms are not similar. Although it has been shown that flow topology affects biofilm formation by bacterial cells (Salek et al. 2011), the results from this work show that when average shear stress values are considered, they can capture the average biofilm formation behavior that is obtained in two very different platforms. This might be a good indication when trying to scale up results from high throughput platforms like microtiter plates, which are widely used for biofilm studies (Pitts et al. 2003; Bridier et al. 2010; Simões et al. 2010b; Szczepanski et al. 2014), to larger scale flow systems found in industrial or biomedical settings.
Taking into consideration the results from the culture medium components (glucose, yeast extract and peptone) it was observed that conditioning with glucose did not affect biofilm formation. The remaining medium components reduced biofilm formation in both platforms but this reduction occurred at a later stage of biofilm development and not during initial attachment. It seems that none of the culture medium components tested in this work was able to promote biofilm formation by surface conditioning. Chen et al. (2010) observed that when a conditioning film of organic molecules (eg. glucose) adsorbs to a surface, it can enhance bacterial adhesion since a relatively rich nutrient source becomes available for newly attaching microbial cells. However, in a report by Bakker et al. (2003) where the effect of glass surface conditioning with natural seawater was assessed regarding the initial deposition rates of Marinobacter hydrocarbonoclasticus, Psychrobacter sp. and Halomonas pacifica, similar results to those obtained in the present study were obtained. In fact, initial bacterial adhesion to glass conditioned with natural seawater (with a content of 45.4% of adsorbed carbon and 1.8% of adsorbed nitrogen) was reduced when compared with adhesion to glass exposed to artificial seawater (with a content of 26.3% of adsorbed

Chapter 6
100
carbon and without nitrogen). Thus it seems that surface conditioning with nutrients can have different effects on cell adhesion and biofilm formation.
Several cellular components were also tested regarding their conditioning effect as these may originate from cell lysis within a system. BSA was tested in this work as a protein representative since it is widely used in adhesion studies and is suggested as a soiling substance for industrial testing (EN1276 1997). Results indicate that surface conditioning with BSA can reduce biofilm formation in both tested platforms and that this decrease is achieved by reduction of initial cell adhesion. Pratt-Terpstra et al. (1987) also observed a similar effect when BSA adsorpted to glass, fluorethylenepropylene and cellulose acetate, reducing the adhesion of three strains of oral streptococci. Additionally, Hammond et al. (2010) verified that after adsorption of BSA on a plastic cover slip, P. aeruginosa biofilm formation was reduced both in static and flow conditions. When representatives of the cellular membrane were tested as conditioning agents, it was observed that mannose did not have any effect on biofilm formation and that palmitic acid lead to a lower bacterial adhesion and biofilm formation. Trautner et al. (2012) studied the effect of a modified silicone surface by covalently immobilization of mannose on biofilm formation by E. coli 83972. They observed that adhesion to mannose-modified silicone increased 4.4-fold compared to unmodified silicon surfaces. Rodrigues et al. (2009) observed that type 1 fimbriae are critical on E. coli K12 biofilm development since these appendages are able to recognize the mannose conditioning film pre-synthesized by E. coli. However, they suggested that this is not important on E. coli adhesion to glass since type 1 fimbriae were not required for the initial bacterial adhesion under the tested conditions. On the other hand, Pratt et al. (1998) observed that type I pili are required for E. coli attachment and that mannose reduced the adhesion to polyvinyl chloride. Taking into account the results from this work, and from other published studies, it seems that the effect of mannose conditioning is surface dependent. Regarding palmitic acid, its antimicrobial activity against oral bacteria at a concentration of 0.025 g.L-1 was already reported (Huang et al. 2010). Therefore it is likely that in this work some antimicrobial activity from the tested fatty acid may have reduced E. coli adhesion and subsequent biofilm formation.
Since cell lysis is a common event on bacterial systems, cellular extracts were prepared and analyzed regarding their surface conditioning effect. Three extracts were assayed corresponding to the periplasm (PE), cytoplasm with cellular debris (CCDE) not containing the periplasm and total cell lysate (TCE). All of these extracts reduced biofilm formation in both tested platforms at almost all concentrations tested. For CCDE similar reduction values (60%) were obtained for adhesion and biofilm formation in the PPFC. However, for TCE the reduction was lower in adhesion (44%) than in biofilm formation (60%).
It is known that several molecules and structures from E. coli have a determinant role on adhesion and biofilm formation. Structures such as flagella and fimbria usually are the first to interact with surfaces (Pratt et al. 1998; Van Houdt et al. 2005) and subsequent biofilm development is then dependent on the synthesis of proteins and polysaccharides that are secreted across the cytoplasmic and outer membrane of the cell (Danese et al. 2000; Abu-Lail et al. 2003; Van Houdt et al. 2005). In this work it was verified that these same

Chapter 6
101
components, when tested as extracts, are able to reduce biofilm formation by decreasing cell adhesion.
It was also verified that, for the majority of agents that reduced cell adhesion, the same reduction value was obtained for biofilm formation. Different studies have shown that decreasing initial cell attachment leads to a lower amount of mature biofilm (Cheng et al. 2007; Godoy-Gallardo et al. 2014) whereas others indicate that these initial events are not important when the biofilm reaches a certain age (Cerca et al. 2005; Bernstein et al. 2014). The results presented on this study show that initial adhesion can indeed affect the outcome of biofilm formation at least during 24 h. Although this time frame is small for some industrial activities, some food industries (like salad washing facilities and dairy processing plants) operate within this time frame between cleaning cycles.
Non-chemical treatments have been used in cooling water systems, wastewater treatment or potable water disinfection in order to reduce the environmental impact associated with the use of chemicals and to reduce water consumption (Broekman et al. 2010). Ultrasound technology has been also used to control planktonic bacteria and biofilms in water systems (2006). This technology promotes planktonic cell damage by lysis and enhances biofilm removal by shear forces (Broekman et al. 2010). However, bacterial cells that survive the previous ultrasonic treatment can adhere on clean surfaces and lead to new biofilm development (Broekman et al. 2010). The data presented in this work indicates that cellular fragments released after cell lysis can adsorb to surfaces and reduce bacterial adhesion and consequent biofilm formation. Therefore, these results suggest that in industrial water systems were bacterial lysis can be promoted (for instance by placing an ultrasound transducer on a recycle loop), biofilm formation may be reduced or delayed and the operational time in which biofilm remains below an acceptable threshold can be extended. Thus, using ultrasounds in a recycle loop can kill planktonic cells and therefore prevent their accumulation in a growing biofilm as well as the consequent release of cellular components may assist in reducing adhesion downstream of the transducer site.
The results presented in this work demonstrate that surface conditioning with nutrients rich in nitrogen can reduce biofilm formation but that this effect is not due to a reduction in cell adhesion. It was also shown that cellular components can have a surface conditioning effect that reduces cell adhesion and consequent biofilm formation. This suggests that in systems where biofilm formation is not critical below a certain threshold, planktonic cellular lysis and subsequent adsorption of cell components to surfaces can delay biofilm formation and extend the operational time. Additionally, it was observed that agitated 96-well microtiter plates are a suitable platform for biofilm screening assays and that some of the obtained results can be scaled-up to flow systems with different flow topologies operated at the same average shear stress.
6.5 References
2006. Microbial control: Treadline cooling system goes ultrasonic. Filtration & Separation. 43:38-39.
Abdul Azis PK, Al-Tisan I, Sasikumar N. 2001. Biofouling potential and environmental factors of seawater at a desalination plant intake. Desalination. 135:69-82.

Chapter 6
102
Abu-Lail NI, Camesano TA. 2003. Role of lipopolysaccharides in the adhesion, retention, and transport of Escherichia coli JM109. Environmental Science & Technology. 37:2173-2183.
Bakker DP, Klijnstra JW, Busscher HJ, van der Mei HC. 2003. The effect of dissolved organic carbon on bacterial adhesion to conditioning films adsorbed on glass from natural seawater collected during different seasons. Biofouling. 19:391-397.
Barnes LM, Lo MF, Adams MR, Chamberlain AHL. 1999. Effect of milk proteins on adhesion of bacteria to stainless steel surfaces. Applied and Environmental Microbiology. 65:4543-4548.
Bernstein R, Freger V, Lee J-H, Kim Y-G, Lee J, Herzberg M. 2014. ‘Should I stay or should I go?’ Bacterial attachment vs biofilm formation on surface-modified membranes. Biofouling. 30:367-376.
Brackbill JU, Kothe DB, Zemach C. 1992. A continuum method for modeling surface tension. Journal of Computational Physics. 100:335-354.
Bremer PJ, Fillery S, McQuillan AJ. 2006. Laboratory scale Clean-In-Place (CIP) studies on the effectiveness of different caustic and acid wash steps on the removal of dairy biofilms. International Journal of Food Microbiology. 106:254-262.
Bridier A, Dubois-Brissonnet F, Boubetra A, Thomas V, Briandet R. 2010. The biofilm architecture of sixty opportunistic pathogens deciphered using a high throughput CLSM method. Journal of Microbiological Methods. 82:64-70.
Broekman S, Pohlmann O, Beardwood ES, de Meulenaer EC. 2010. Ultrasonic treatment for microbiological control of water systems. Ultrasonics Sonochemistry. 17:1041-1048.
Cerca N, Pier GB, Vilanova M, Oliveira R, Azeredo J. 2005. Quantitative analysis of adhesion and biofilm formation on hydrophilic and hydrophobic surfaces of clinical isolates of Staphylococcus epidermidis. Research in Microbiology. 156:506-514.
Chen M-Y, Chen M-J, Lee P-F, Cheng L-H, Huang L-J, Lai C-H, Huang K-H. 2010. Towards real-time observation of conditioning film and early biofilm formation under laminar flow conditions using a quartz crystal microbalance. Biochemical Engineering Journal. 53:121-130.
Cheng G, Zhang Z, Chen S, Bryers JD, Jiang S. 2007. Inhibition of bacterial adhesion and biofilm formation on zwitterionic surfaces. Biomaterials. 28:4192-4199.
Chmielewski R, Frank J. 2003. Biofilm formation and control in food processing facilities. Comprehensive Reviews in Food Science and Food Safety. 2:22-32.
Cloete TE, Jacobs L, Brözel VS. 1998. The chemical control of biofouling in industrial water systems. Biodegradation. 9:23-37.
Danese PN, Pratt LA, Kolter R. 2000. Exopolysaccharide production is required for development of Escherichia coli K-12 biofilm architecture. Journal of Bacteriology. 182:3593-3596.
Dat NM, Hamanaka D, Tanaka F, Uchino T. 2010. Surface conditioning of stainless steel coupons with skim milk solutions at different pH values and its effect on bacterial adherence. Food Control. 21:1769-1773.
de Kerchove AJ, Elimelech M. 2007. Impact of alginate conditioning film on deposition kinetics of motile and nonmotile Pseudomonas aeruginosa strains. Applied and Environmental Microbiology. 73:5227-5234.
EN1276 (1997). European Committe for standardization.
Gabriel O. 1987. Escherichia coli and Salmonella: typhimurium cellular and molecular biology. Michigan: American Society for Microbiology. Biosynthesis of sugar residues for glycogen, peptidoglycan, lipopolysacharide, and related systems.
Godoy-Gallardo M, Mas-Moruno C, Fernández-Calderón MC, Pérez-Giraldo C, Manero JM, Albericio F, Gil FJ, Rodríguez D. 2014. Covalent immobilization of hLf1-11 peptide on a titanium surface reduces bacterial adhesion and biofilm formation. Acta Biomaterialia.

Chapter 6
103
Habimana O, Semião AJC, Casey E. 2014. The role of cell-surface interactions in bacterial initial adhesion and consequent biofilm formation on nanofiltration/reverse osmosis membranes. Journal of Membrane Science. 454:82-96.
Hammond A, Dertien J, Colmer-Hamood JA, Griswold JA, Hamood AN. 2010. Serum inhibits P. aeruginosa biofilm formation on plastic surfaces and intravenous catheters. Journal of Surgical Research. 159:735-746.
Hirt CW, Nichols BD. 1981. Volume of fluid (VOF) method for the dynamics of free boundaries. Journal of Computational Physics. 39:201-225.
Huang CB, George B, Ebersole JL. 2010. Antimicrobial activity of n-6, n-7 and n-9 fatty acids and their esters for oral microorganisms. Archives of Oral Biology. 55:555-560.
Lorite GS, Rodrigues CM, Souza AAd, Kranz C, Mizaikoff B, Cotta MA. 2011. The role of conditioning film formation and surface chemical changes on Xylella fastidiosa adhesion and biofilm evolution. Journal of Colloid and Interface Science. 359:289-295.
Melo L, Flemming H. 2010. The science and technology of industrial water treatment. Taylor and Francis Group.
Menter FR. 1994. Two-equation eddy-viscosity turbulence models for engineering applications. AIAA Journal. 32:1598-1605.
Mergulhão FJM, Monteiro GA, Cabral JMS, Taipa MA. 2001. A quantitative ELISA for monitoring the secretion of ZZ-fusion proteins using SpA domain as immunodetection reporter system. Molecular Biotechnology. 19:239-244.
Moreira JMR, Gomes LC, Araújo JDP, Miranda JM, Simões M, Melo LF, Mergulhão FJ. 2013. The effect of glucose concentration and shaking conditions on Escherichia coli biofilm formation in microtiter plates. Chemical Engineering Science. 94:192-199.
Nikolaev Y, Plakunov V. 2007. Biofilm - “City of microbes” or an analogue of multicellular organisms? Microbiology. 76:125-138.
Nithila SDR, Anandkumar B, Vanithakumari SC, George RP, Mudali UK, Dayal RK. 2014. Studies to control biofilm formation by coupling ultrasonication of natural waters and anodization of titanium. Ultrasonics Sonochemistry. 21:189-199.
Oursel D, Loutelier-Bourhis C, Orange N, Chevalier S, Norris V, Lange CM. 2007. Identification and relative quantification of fatty acids in Escherichia coli membranes by gas chromatography/mass spectrometry. Rapid Communications in Mass Spectrometry. 21:3229-3233.
Pitts B, Hamilton MA, Zelver N, Stewart PS. 2003. A microtiter-plate screening method for biofilm disinfection and removal. Journal of Microbiological Methods. 54:269-276.
Pratt-Terpstra IH, Weerkamp AH, Busscher HJ. 1987. Adhesion of oral Streptococci from a flowing suspension to uncoated and albumin-coated surfaces. Journal of General Microbiology. 133:3199-3206.
Pratt LA, Kolter R. 1998. Genetic analysis of Escherichia coli biofilm formation: roles of flagella, motility, chemotaxis and type I pili. Molecular Microbiology. 30:285-293.
Rodrigues DF, Elimelech M. 2009. Role of type 1 fimbriae and mannose in the development of Escherichia coli K12 biofilm: from initial cell adhesion to biofilm formation. Biofouling. 25:401-411.
Salek MM, Sattari P, Martinuzzi RJ. 2011. Analysis of fluid flow and wall shear stress patterns inside partially filled agitated culture well plates. Annals of Biomedical Engineering. 40:707-728.
Shi X, Zhu X. 2009. Biofilm formation and food safety in food industries. Trends in Food Science & Technology. 20:407-413.
Simões LC, Simões M, Vieira MJ. 2010a. Adhesion and biofilm formation on polystyrene by drinking water-isolated bacteria. Antonie van Leeuwenhoek. 98:317-329.

Chapter 6
104
Simões LC, Simões M, Vieira MJ. 2010b. The influence of the diversity of bacterial isolates from drinking water on resistance of biofilms to disinfection. Applied and Environmental Microbiology 76:6673-6679.
Simões M, Simões LC, Cleto S, Pereira MO, Vieira MJ. 2008. The effects of a biocide and a surfactant on the detachment of Pseudomonas fluorescens from glass surfaces. International Journal of Food Microbiology. 121:335-341.
Simões M, Simões LC, Vieira MJ. 2010. A review of current and emergent biofilm control strategies. LWT - Food Science and Technology. 43:573-583.
Simões M, Mergulhão FJ. 2013. Biofilms and Bioengineering. Nova publishers.
Szczepanski S, Lipski A. 2014. Essential oils show specific inhibiting effects on bacterial biofilm formation. Food Control. 36:224-229.
Tang H, Wang A, Liang X, Cao T, Salley SO, McAllister Iii JP, Ng KYS. 2006. Effect of surface proteins on Staphylococcus epidermidis adhesion and colonization on silicone. Colloids and Surfaces B: Biointerfaces. 51:16-24.
Teodósio JS, Simões M, Melo LF, Mergulhão FJ. 2011. Flow cell hydrodynamics and their effects on E. coli biofilm formation under different nutrient conditions and turbulent flow. Biofouling. 27:1-11.
Teodósio JS, Simões M, Mergulhão FJ. 2012. The influence of non-conjugative Escherichia coli plasmids on biofilm formation and resistance. Journal of Applied Microbiology. 113:373–382.
Teodósio JS, Silva FC, Moreira JMR, Simões M, Melo L, Mergulhão FJ. 2013. Flow cells as quasi Ideal systems for biofouling simulation of industrial piping systems. Biofouling. 29:953-966.
Trautner BW, Lopez AI, Kumar A, Siddiq DM, Liao KS, Li Y, Tweardy DJ, Cai C. 2012. Nanoscale surface modification favors benign biofilm formation and impedes adherence by pathogens. Nanomedicine: Nanotechnology, Biology and Medicine. 8:261-270.
Van Houdt R, Michiels CW. 2005. Role of bacterial cell surface structures in Escherichia coli biofilm formation. Research in Microbiology. 156:626-633.
Youngs DL. 1982. Numerical Methods for Fluid Dynamics. New York: Academic Press. Time-dependent multi-material flow with large fluid distortion.

Chapter 7
105
Chapter 7 Escherichia coli adhesion to surfaces – a thermodynamic assessment
Several studies have tried to correlate bacterial adhesion with the physicochemical properties of the surface with limited success. Most often, the obtained correlations seem to be only applicable to a particular set of experimental conditions making it difficult to obtain guidelines for the design of antibiofouling surfaces. The ratio between Lifshitz van der Waals apolar component and the electron donor component (γLW /ᵞ-) of the surface energy was recently shown to correlate with bacterial adhesion to the surfaces of ship hulls and heat exchangers. Thus, in this chapter, five materials with biomedical application (polystyrene, glass, poly-L-lactide, cellulose acetate and PDMS) were characterized and E. coli adhesion to those materials was correlated with the γ LW /ᵞ- ratio, further extending the application range tested on the original study. Additionally, published results from independent groups were also evaluated to confirm the applicability of this correlation to other surfaces, microorganisms and experimental conditions. The PPFC was selected for this study because it can be operated under physiological shear stress conditions and enables direct, real-time, observation of cell adhesion by microscopy. Results show that bacterial adhesion is reduced in surfaces with lower ᵞLW /ᵞ- and enhanced otherwise. This finding may be helpful in the design of new coatings by controlling ᵞLW /ᵞ-
or in the selection of existing materials according to the desired application. This chapter was adapted from:
Moreira JMR, Miranda JM, Simões M, Melo LF, Mergulhão FJ. Escherichia coli adhesion to surfaces – a thermodynamic assessment. Colloids Surf B Biointerfaces. (Submitted)

Chapter 7
106

Chapter 7
107
7.1 Introduction
Microorganisms have a natural tendency to adhere to surfaces and form biofilms (Nikolaev et al. 2007). Beneficial biofilms can be found in bioremediation processes, wastewater treatment and in the production of various chemicals (Qureshi et al. 2005; Singh et al. 2006). However, bacterial adhesion and subsequent biofilm growth is a common problem in industry since it can lead to food spoilage by bioconversion or efficiency loss in heat exchangers (Georgiadis et al. 1998; Shi et al. 2009). In the biomedical field, biofilms are responsible for many infections in humans (Bryers 2008) and can cause deterioration of the functionality of medical devices (Kaali et al. 2011). Therefore, in industry, inhibiting or delaying the onset of detrimental biofilms can represent a reduction in operational costs, since fewer stops are required for sanitation (Shi et al. 2009; Van Houdt et al. 2010). In the biomedical field, delaying the onset of biofilms in medical devices may reduce the need for antimicrobial treatment and the costs associated with the replacement of infected implants during revision surgery, which may triple the cost of the primary implant procedure (Busscher et al. 2012).
Researchers all over the world are trying to understand bacterial adhesion in order to inhibit or promote biofilm development (Missirlis et al. 2004; Goulter et al. 2009). Several strategies have been evaluated in order to control biofilm development (Simões et al. 2010b; Busscher et al. 2012; Campoccia et al. 2013a) and one of the most promising is to control bacterial adhesion (Chen et al. 2005; Van Houdt et al. 2010; Gallardo-Moreno et al. 2011; Petrova et al. 2012; Campoccia et al. 2013b).
Bacterial adhesion begins with the attraction between cells and surfaces, followed by adsorption and attachment (Ong et al. 1999). The physicochemical forces involved in the initial approach of cells to surfaces are primarily van der Waals, electrostatic, hydration and hydrophobic interactions (Ong et al. 1999). Therefore, the correct selection of materials to be used in industrial and biomedical settings can be determinant to the onset of bacterial biofilms on these surfaces.
Researchers are trying to define criteria for selection of new materials according to their surface properties (Chen et al. 2005; Gallardo-Moreno et al. 2011; Stoodley et al. 2013). This methodology has been used intensively since accessible and fast methods such as contact angle measurements are available enabling time and cost reduction in the laboratory (Absolum et al. 1983; Cerca et al. 2005; Soon et al. 2013). However, finding a correlation between surface properties and bacterial adhesion rates has been challenging (Oliveira et al. 2006; Buergers et al. 2007; Desrousseaux et al. 2013). Li et al. (2004) studied the contribution of surface charge and hydrophobicity on the adhesion of three E. coli strains, two P. aeruginosa strains and two Burkholderia cepacia strains on metal oxide-coated and uncoated glass surfaces. These authors observed that adhesion was not significantly correlated with bacterial charge and contact angle. Liu et al. (2011a) used the ratio between apolar Lifshitz van der Waals components (γLW) and electron donor components (ᵞ-) of modified stainless steel (Ni-P-TiO2-PTFE nanocomposite coatings) as a surface property parameter to correlate with Pseudomonas fluorescens, Cobetia marina and Vibrio alginolyticus adhesion under static and dynamic conditions. Their results demonstrated that coatings with the lowest ᵞLW /ᵞ- had the lowest bacterial adhesion values,

Chapter 7
108
and increasing ᵞLW /ᵞ- led to higher bacterial adhesion. That study was conducted with surfaces that may be used in ship hulls and heat exchangers but the authors suggested that their results are transferable to the biomedical field. This hypothesis was tested on this work by using four polymeric surfaces (polystyrene (PS), poly-L-lactide (PLLA), cellulose acetate (CA) and polydimethylsiloxane (PDMS)) which can be used in biomedical devices in the human body (Ong et al. 1999; Multanen et al. 2000; Aubert 2010; Grewe et al. 2011) and glass. Thermodynamic surface properties were evaluated in order to find if they could be correlated with bacterial adhesion. The hydrodynamic conditions used are similar to those found in the bladder, urinary tract and reproductive system (Nauman et al. 2007; Ronald 2011) where biomedical devices constructed with the selected materials are used (Multanen et al. 2000; Abbasi et al. 2001; Jacobsen et al. 2008; Grewe et al. 2011) and where E. coli is the major cause for infection (Koseoglu et al. 2006; Shunmugaperumal 2010). These surfaces were also selected due to their different γ LW /ᵞ- values which extend the range tested by Liu et al. (2011a). The applicability of this correlation was also tested using data from other authors studying bacterial adhesion or protein adsorption to different materials (soil minerals, synthetic materials, plasma treated surfaces and metallic materials) in different systems and operational conditions. Thus, the rationale for this work was to find out a selection/design criteria to predict bacterial adhesion to materials used in the industrial and biomedical fields.
7.2 Materials and methods
7.2.1 Bacteria and culture conditions
A starter culture of E. coli JM109(DE3) was obtained by inoculation of 500 µL of a glycerol stock (kept at -80 ºC) to a total volume of 0.2 L of inoculation media with 5.5 g L-1 glucose, 2.5 g L-1 peptone, 1.25 g L-1 yeast extract in phosphate buffer (1.88 g L-1 KH2PO4 and 2.60 g L-1 Na2HPO4) at pH 7.0 (Teodósio et al. 2013). This culture was grown in a 1 L shake-flask, incubated overnight at 37 ºC with orbital agitation (120 rpm). A volume of 60 mL from the overnight grown culture was used to harvest cells by centrifugation (10 min, 3202 g). Cells were washed twice with citrate buffer 0.05 M (Simões et al. 2008), pH 5.0 and the pellet was resuspended and diluted in the same buffer in order to reach a cell concentration of 7.6×10⁷ cell.mL-1.
7.2.2 Surface preparation
Five materials, PS, glass, PLLA, CA and PDMS were prepared for adhesion assays. PS surface and glass slides (VWR) were firstly washed with a commercial detergent (Sonasol Pril, Henkel Ibérica S A) and immersed in sodium hypochlorite (3%). After rinsing with distilled water, part of the glass slides were coated with the polymers. These were prepared by mixing the polymer in solid form with solvents. Dichloromethane was added to PLLA at 5% (w/w), acetone was added to CA at 8% (w/w) and a curing agent (Sylgard 184 Part B, Dow Corning) was added to PDMS (at a 1:10 ratio) (polymers from Sigma, solvents from Normapur). This mixture was carefully stirred to homogenize the two

Chapter 7
109
components without introducing bubbles. The polymers were then deposited as a thin layer on top of glass slides by spin coating (Spin150 PolosTM).
7.2.3 Surface characterization
The surface charge of bacteria and material surfaces was characterized by zeta potential and surface hydrophobicity using the contact angle method. One E. coli suspension was prepared as described before, and particle suspensions of each material (Simões et al. 2010a) were also prepared in order to measure the electrophoretic mobility, using a Nano Zetasizer (Malvern Instruments, UK). The hydrophobicity of bacteria and surfaces was evaluated considering the Lifshitz van der Waals acid base approach (van Oss 1994). Contact angles were determined automatically by the sessile drop method in a contact angle meter model (OCA 15 Plus; Dataphysics, Filderstadt, Germany) using water, formamide and α-bromonaphtalene (Sigma) as reference liquids with surface tension components taken from literature (Janczuk et al. 1993). For each surface (PLLA, PS, CA, PDMS and glass), at least 10 measurements with each liquid were performed at 25 ± 2 ºC. One E. coli suspension was prepared in the same conditions as for the adhesion assay and its physicochemical properties were also determined by sessile drop contact angle measurement as described by Wang et al. (2005).
According to van Oss (1994), the total surface energy (γ Tot) of a pure substance is the sum of the apolar Lifshitz-van der Waals components of the surface free energy (ᵞLW) and polar Lewis acid-base components (ᵞAB):
ABLW γγγ +=TOT (1)
The polar AB component comprises the electron acceptor ᵞ+ and electron donor ᵞ-
parameters, and is given by:
−+= γγγ 2AB (2)
The surface energy components of a solid or bacterial surface (s) are obtained by measuring the contact angles (θ) with the three different liquids (l) with known surface tension components, followed by the simultaneous resolution of three equations of the type:
( )
++=+ +−−+
lslsLWl
LWsl 2θcos1 γγγγγγγ (3)
The degree of hydrophobicity of a given surface (solid and bacterial surface) is expressed as the free energy of interaction (∆G mJ.m-2) between two entities of that surface immersed in polar liquid (such as water (w) as a model solvent).
If the interaction between the two entities is stronger than the interaction of each entity with water, ∆G < 0 mJ.m-2, the material is considered hydrophobic, if ∆G > 0 mJ.m-2, the material is hydrophilic. ∆G was calculated from the surface tension components of the interacting entities, using the equation:
−−++
−−=∆ −+−++−−+
wwsswsw
2LWw
LW 42G γγγγγγγγγγ ss ; (4)

Chapter 7
110
When studying the interaction (free energy of adhesion) between surface (s) and bacteria (b) that are immersed in water, the total interaction energy, ∆GAdh, can be expressed as:
−−
−++
−++−−=∆ +−−++++−−−−+
bsbsbb γγγγγγγγγγγγγγγ wswwswLWbw
LWsw
LWsb
Adh 2G (5)
Thermodynamically, if ∆GAdh < 0 mJ.m-2 adhesion is favoured, while adhesion is not expected to occur if ∆GAdh > 0 mJ.m-2.
7.2.4 Flow chamber experiments
A PPFC with dimensions of 25.4 × 1.6 × 0.8 cm was connected to a centrifugal pump by a tubing system. It contained a bottom and a top opening at the exit for the introduction of the test surfaces. The PPFC was mounted in a microscope (Nikon Eclipse LV100, Japan) to monitor E. coli attachment to each surface for 30 min. The cellular suspension was circulated at 2 mL.s-1 and images were acquired with a camera (Nikon digital sight DS-RI 1, Japan) connected to the microscope. The hydrodynamic conditions were simulated by computational fluid dynamics and the results have shown that in the viewing point, the conditions are of steady flow and the average shear stress was of 0.01 Pa (not shown). Approximate shear stresses can be found in the bladder, urinary tract and reproductive system (Nauman et al. 2007; Ronald 2011). Temperature was kept constant at 37 ºC using a recirculating water bath. All adhesion experiments were performed in triplicate for each surface.
The microscopy images recorded during the cell adhesion assays were analyzed with the program ImageJ (v1.46r). The number of adhered cells after 30 min was then divided by the surface area of the field of view to obtain the density of bacteria per square centimeter.
7.2.5 Statistical analysis
Paired t-test analyses were performed to estimate whether or not there was a significant difference between the results obtained on each surface. Results were evaluated individually using the three independent results obtained with one surface and the three individual results obtained with other surface. Results were considered statistically different when a confidence level greater than 95% was reached (P < 0.05). Standard deviation between the 3 values obtained from the independent experiments was also calculated.
7.2.6 Re-ploted data
Relevant works, where some authors had tried to find a correlation between surface properties of different materials and bacterial adhesion (as well as protein adsorption to those surfaces) were selected and data was re-ploted in this work in order to compare with the new data here presented. Bacterial adhesion and protein adsorption data were
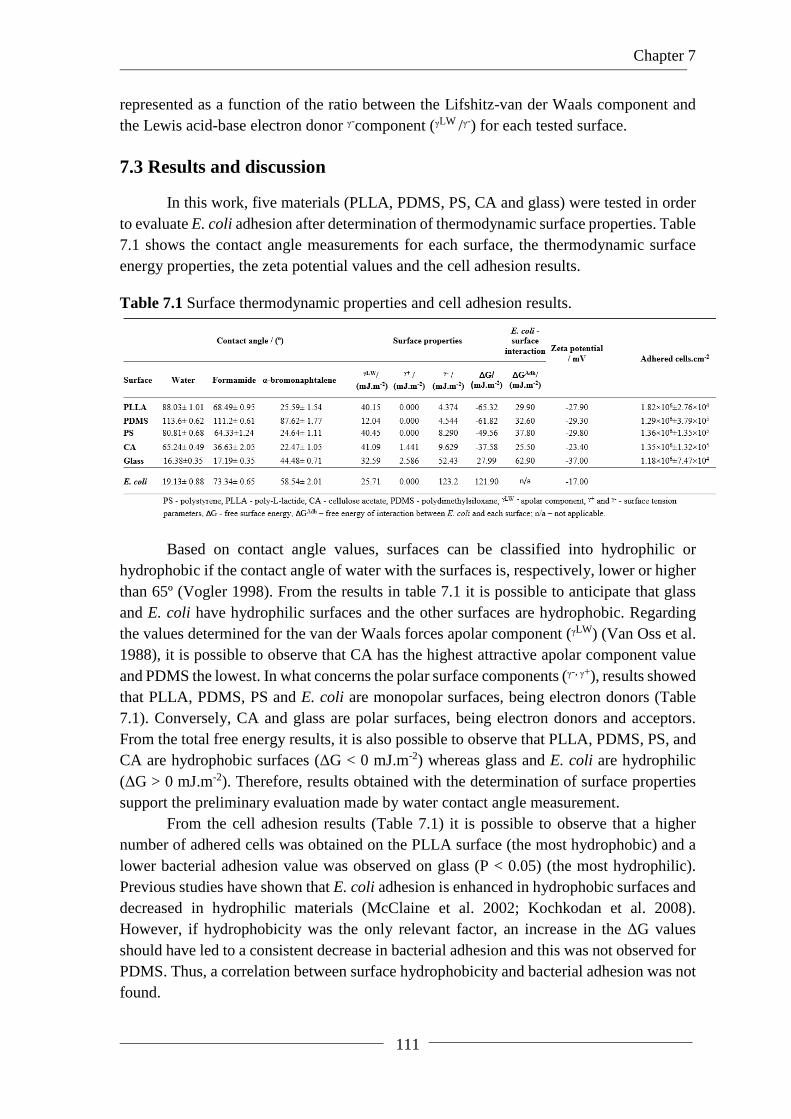
Chapter 7
111
represented as a function of the ratio between the Lifshitz-van der Waals component and the Lewis acid-base electron donor ᵞ-component (γLW /ᵞ-) for each tested surface.
7.3 Results and discussion
In this work, five materials (PLLA, PDMS, PS, CA and glass) were tested in order to evaluate E. coli adhesion after determination of thermodynamic surface properties. Table 7.1 shows the contact angle measurements for each surface, the thermodynamic surface energy properties, the zeta potential values and the cell adhesion results.
Table 7.1 Surface thermodynamic properties and cell adhesion results.
Based on contact angle values, surfaces can be classified into hydrophilic or hydrophobic if the contact angle of water with the surfaces is, respectively, lower or higher than 65º (Vogler 1998). From the results in table 7.1 it is possible to anticipate that glass and E. coli have hydrophilic surfaces and the other surfaces are hydrophobic. Regarding the values determined for the van der Waals forces apolar component (ᵞLW) (Van Oss et al. 1988), it is possible to observe that CA has the highest attractive apolar component value and PDMS the lowest. In what concerns the polar surface components (ᵞ-, ᵞ+), results showed that PLLA, PDMS, PS and E. coli are monopolar surfaces, being electron donors (Table 7.1). Conversely, CA and glass are polar surfaces, being electron donors and acceptors. From the total free energy results, it is also possible to observe that PLLA, PDMS, PS, and CA are hydrophobic surfaces (∆G < 0 mJ.m-2) whereas glass and E. coli are hydrophilic (∆G > 0 mJ.m-2). Therefore, results obtained with the determination of surface properties support the preliminary evaluation made by water contact angle measurement.
From the cell adhesion results (Table 7.1) it is possible to observe that a higher number of adhered cells was obtained on the PLLA surface (the most hydrophobic) and a lower bacterial adhesion value was observed on glass (P < 0.05) (the most hydrophilic). Previous studies have shown that E. coli adhesion is enhanced in hydrophobic surfaces and decreased in hydrophilic materials (McClaine et al. 2002; Kochkodan et al. 2008). However, if hydrophobicity was the only relevant factor, an increase in the ∆G values should have led to a consistent decrease in bacterial adhesion and this was not observed for PDMS. Thus, a correlation between surface hydrophobicity and bacterial adhesion was not found.

Chapter 7
112
The thermodynamic theory indicates that a system with a lower interacting energy (∆GAdh) usually leads to a higher affinity between bacteria and surfaces (Absolum et al. 1983). Therefore, based on the results in table 7.1 E. coli should have adhered more to CA and PLLA and have a lower affinity to glass. Thus, it seems that cell adhesion is also not directly correlated with ∆GAdh. Other authors have also tried to find a correlation between bacterial adhesion and surface hydrophobicity or surface free energy of adhesion without success. In a study by Oliveira et al. (2006), a correlation between the hydrophobicity of materials (polyethylene, polypropylene, and granite) used in kitchens and the adhesion of four Salmonella enteritidis strains was also not found. Barton et al. (1996) were also not successful in finding a correlation between the free energy of adhesion of orthopedic implant polymers (poly(orthoester), poly(L-lactic acid), polysulfone, polyethylene, and poly(ether-ether ketone)) and S. epidermidis or E. coli adhesion.
In this work, a correlation between electron donor character (γ-) and bacterial adhesion was also not observed particularly for glass which showed a very high value of ᵞ-
(52.43 mJ.m-2) compared to the other surfaces (Table 7.1). Additionally, for the zeta potential data, negative values indicate electrical repulsion between negative charged bacteria and surfaces (Poortinga et al. 2002) but a correlation was not found for this parameter either.
Several studies have been performed by other research groups in order to find a good correlation between bacterial adhesion (and adsorption of organic/inorganic particles) and some physicochemical parameter from the surface. A literature survey was performed in order to find such works where complete information about the thermodynamic properties was included or where these properties could be calculated from reported data (Table 7.2).
Table 7.2 Summary of the work developed by other authors and in the present study.

Chapter 7
113
Hong et al. (2012) studied the role of surface properties in the adhesion of Bacillus subtilis to soil minerals. These authors observed a significant correlation between adhesion capacity and the specific external surface area of the minerals, but they did not find a correlation between surface hydrophobicity (ranging from -32. 2 and 33.2 mJ.m-2) and adhesion. Katsikogianni et al. (2008) studied the role of the free energy of adhesion (from -10.5 to 17.2 mJ.m-2) in the attachment of S. epidermidis to plasma modified PET films under static (5 s-1) and dynamic conditions (50 and 200 s-1). A strong correlation between the thermodynamic predictions and the measured values of bacterial adhesion under static conditions was observed. Moreover, the authors reported that the polar acid–base interactions dominated the interactions of bacteria with the substrates in aqueous media. However, under flow conditions, the increase in the shear rate reduced the predictability of the thermodynamic models. Cunliffe et al. (1999) used synthetic materials with energies ranging from 15 to 42 mJ.m-2 for bacterial adhesion and adsorption of bovine serum albumin and cytochrome c. Protein adsorption and L. monocytogenes adhesion also showed some correlation with the chemistry of the surfaces. Liu et al. (2011a) have suggested a ratio between Lifshitz van der Waals apolar component and the electron donor component (ᵞLW /ᵞ-) as a good correlation factor for cell adhesion. These authors have used P. fluorescens, C. marina, and V. alginolyticus and Ni-P-TiO2-PTFE coatings in different hydrodynamic conditions (Table 7.2). This ratio was also tested for the adhesion values obtained in the present work as well as for the results reported by other groups comprising 29 different surfaces, 7 organisms, 2 proteins and different shear stress conditions (Table 7.2). The (γLW /ᵞ-) range covered in each study as well as the identification of the tested surfaces is provided in figure 7.1.
Figure 7.1 Surfaces used and ᵞLW /ᵞ- tested in different works attempting to find a correlation between adhesion and thermodynamic properties.
In the present work, surfaces with the highest ᵞLW /ᵞ- values had the highest bacterial adhesion (Figure 7.2a). This may be due to a lower surface electron donor component (ᵞ-, repulsive) or a high apolar component (ᵞLW, attractive). The highest adhesion value was observed for PLLA (P < 0.05) which has the lowest repulsive forces (lower γ -, Table 7.1) when compared with the adhesion values observed for PS, CA, and PDMS. Regarding PDMS, it is possible to note that a similar ᵞ- value was observed for this surface and PLLA. However, PDMS exhibited the lowest apolar attractive forces value (ᵞLW) and this may have led to a lower adhesion than observed for CA and PS (with higher γ-, Table 7.1). Glass, has the strongest repulsive force value (ᵞ-) which can explain the lowest adhesion.

Chapter 7
114
Figure 7.2 Relationship between bacterial adhesion or protein adsorption and the ratio
between apolar Lifshitz van der Waals components (ᵞLW) and electron donor component (ᵞ-). a) E. coli adhesion on polymeric and glass surfaces b) Vibrio (circle), Cobetia (triangle) and P. fluorescens (square) adhesion on Ni – P coatings with TiO2 and PTFE and stainless steel, re-plotted from Liu et al. (2011a), c) Vibrio adhesion at 0.21 (circle), 0.46 (triangle), and 0.98 (square) mPa on Ni – P coatings with TiO2 and PTFE and stainless steel, re-plotted from Liu et al. (2011a), d) S. epidermis adhesion at 5 (circle), 50 (triangle) and 200 s-1 (square) on helium plasma treated PET, re-plotted from Katsikogianni et al. (2008), e) B. subtilis adhesion on soil minerals, re-plotted from Hong et al. (2012), f) L. monocytogenes adhesion on synthetic surfaces, re-plotted from Cunliffe et al. (1999), g) Bovine serum albumin adsorption on synthetic surfaces, re-plotted from Cunliffe et al. (1999), h) Cytochrome c adsorption on synthetic surfaces, re-plotted from Cunliffe et al. (1999). Whenever a correlation was reported by the original authors it was also represented in this figure and the correlation factor (R2) is indicated (panels a, b and c).

Chapter 7
115
In the work of Liu et al. (2011a) the second order equation y = a + bx + cx2 was used to correlate experimental data and the obtained correlation coefficients varied between 0.8123 and 0.9247 (Figures 7.2b and c). In this work, the same equation was applied to the adhesion results and a correlation factor of 0.9917 was obtained (Figure 7.2a). Additionally, results from all these works from the literature survey (Table 7.2 and Figure 7.1) were re-ploted in figure 7.2, where it is possible to see that the γLW /ᵞ-parameter has a strong correlation with bacterial adhesion results from the work of Katsikogianni et al. (2008) (Figure 7.2d), Hong et al. (2012) (Figure 7.2e) and Cunliffe et al. (1999) (Figure 7.2f) and with the values obtained for protein adsorption by the same author (Figures 7.2g and h).
Liu et al. (2011a) were able to correlate cell adhesion to the γLW /ᵞ- ratio and their working range was between 1.21 and 6.74 (Figure 7.1). Although these authors have tested metallic surfaces that can be used in heat exchangers and ship hulls, they have suggested that their results could also be applied to biomedical surfaces. With the results obtained in the present work, this hypothesis was confirmed since a good correlation between E. coli adhesion to biomedical polymers and the ᵞLW /ᵞ-surface parameter was found for an extended ᵞLW /ᵞ- range. Additionally, and considering data obtained from other works, it was possible to observe the validity of this correlation under diversified conditions.
Therefore, the available data seem to indicate that the γ LW /ᵞ- ratio can be a good parameter for rapid material selection that can be used either to promote (higher ᵞLW /ᵞ-
values) or to decrease bacterial adhesion (lower ᵞLW /ᵞ- values). These results may also be helpful in the design of new materials by controlling the ratio ᵞLW /ᵞ- according to the desired application.
7.4 References
Abbasi F, Mirzadeh H, Katbab A-A. 2001. Modification of polysiloxane polymers for biomedical applications: a review. Polymer International. 50:1279-1287.
Absolum DR, Lamberti FV, Policova Z, Zingg W, Oss CJV, Neumann AW. 1983. Surface thermodynamics of bacterial adhesion. Applied and environmental microbiology 46:90-97.
Aubert D. 2010. Vesico-ureteric reflux treatment by implant of polydimethylsiloxane (Macroplastique™): Review of the literature. Progrès en Urologie. 20:251-259.
Barton AJ, Sagers RD, Pitt WG. 1996. Bacterial adhesion to orthopedic implant polymers. Journal of biomedical materials research. 30:403-410.
Bryers JD. 2008. Medical biofilms. Biotechnology and Bioengineering. 100:1-18.
Buergers R, Rosentritt M, Handel G. 2007. Bacterial adhesion of Streptococcus mutans to provisional fixed prosthodontic material. The Journal of Prosthetic Dentistry. 98:461-469.
Busscher HJ, van der Mei HC, Subbiahdoss G, Jutte PC, van den Dungen JJAM, Zaat SAJ, Schultz MJ, Grainger DW. 2012. Biomaterial-associated infection: locating the finish line in the race for the surface. Science Translational Medicine. 4:153rv110.
Campoccia D, Montanaro L, Arciola CR. 2013a. A review of the biomaterials technologies for infection-resistant surfaces. Biomaterials. 34:8533-8554.
Campoccia D, Montanaro L, Arciola CR. 2013b. A review of the clinical implications of anti-infective biomaterials and infection-resistant surfaces. Biomaterials. 34:8018-8029.

Chapter 7
116
Cerca N, Pier GB, Vilanova M, Oliveira R, Azeredo J. 2005. Quantitative analysis of adhesion and biofilm formation on hydrophilic and hydrophobic surfaces of clinical isolates of Staphylococcus epidermidis. Research in Microbiology. 156:506-514.
Chen G, Zhu H. 2005. Bacterial adhesion to silica sand as related to Gibbs energy variations. Colloids and Surfaces B: Biointerfaces. 44:41-48.
Cunliffe D, Smart CA, Alexander C, Vulfson EN. 1999. Bacterial adhesion at synthetic surfaces. Applied and Environmental Microbiology. 65:4995-5002.
Desrousseaux C, Sautou V, Descamps S, Traoré O. 2013. Modification of the surfaces of medical devices to prevent microbial adhesion and biofilm formation. Journal of Hospital Infection. 85:87-93.
Gallardo-Moreno AM, Navarro-Pérez ML, Vadillo-Rodríguez V, Bruque JM, González-Martín ML. 2011. Insights into bacterial contact angles: Difficulties in defining hydrophobicity and surface Gibbs energy. Colloids and Surfaces B: Biointerfaces. 88:373-380.
Georgiadis MC, Rotstein GE, Macchietto S. 1998. Modelling and simulation of complex plate heat exchanger arrangements under milk fouling. Computers & Chemical Engineering. 22, Supplement 1:S331-S338.
Goulter RM, Gentle IR, Dykes GA. 2009. Issues in determining factors influencing bacterial attachment: a review using the attachment of Escherichia coli to abiotic surfaces as an example. Letters in Applied Microbiology. 49:1-7.
Grewe D, Roeder B, Charlebois S, Griebel A (2011). Manufacturing methods for covering endoluminal prostheses, Google Patents.
Hong Z, Rong X, Cai P, Dai K, Liang W, Chen W, Huang Q. 2012. Initial adhesion of Bacillus subtilis on soil minerals as related to their surface properties. European Journal of Soil Science. 63:457-466.
Jacobsen SM, Stickler DJ, Mobley HLT, Shirtliff ME. 2008. Complicated catheter-associated urinary tract infections due to Escherichia coli and Proteus mirabilis. Clinical Microbiology Reviews. 21:26-59.
Janczuk B, Chibowski E, Bruque JM, Kerkeb ML, Gonzales-Caballero FJ. 1993. On the consistency of surface free energy components as calculated from contact angle of different liquids: an application to the cholesterol surfaces. J Colloid Interface Sci. 159:421-428.
Kaali P, Strömberg E, Karlsson S. 2011. Biomedical engineering, trends in materials science. InTech. 22, Prevention of biofilm associated infections and degradation of polymeric materials used in biomedical applications.
Katsikogianni M, Amanatides E, Mataras D, Missirlis YF. 2008. Staphylococcus epidermidis adhesion to He, He/O2 plasma treated PET films and aged materials: Contributions of surface free energy and shear rate. Colloids and Surfaces B: Biointerfaces. 65:257-268.
Kochkodan V, Tsarenko S, Potapchenko N, Kosinova V, Goncharuk V. 2008. Adhesion of microorganisms to polymer membranes: a photobactericidal effect of surface treatment with TiO2. Desalination. 220:380-385.
Koseoglu H, Aslan G, Esen N, Sen BH, Coban H. 2006. Ultrastructural stages of biofilm development of Escherichia coli on urethral catheters and effects of antibiotics on biofilm formation. Urology. 68:942-946.
Li B, Logan BE. 2004. Bacterial adhesion to glass and metal-oxide surfaces. Colloids and Surfaces B: Biointerfaces. 36:81-90.
Liu C, Zhao Q. 2011a. Influence of surface-energy components of Ni–P–TiO2–PTFE nanocomposite coatings on bacterial adhesion. Langmuir. 27:9512-9519.
Liu C, Zhao Q. 2011b. The CQ ratio of surface energy components influences adhesion and removal of fouling bacteria. Biofouling. 27:275-285.

Chapter 7
117
McClaine JW, Ford RM. 2002. Reversal of flagellar rotation is important in initial attachment of Escherichia coli to glass in a dynamic system with high- and low-ionic-strength buffers. Applied and Environmental Microbiology. 68:1280-1289.
Missirlis YF, Katsikogianni M. 2004. Concise review of mechanisms of bacterial adhesion to biomaterials and of techniques used in estimating bacteria-material interactions Cells and Materials. 8:37-57.
Multanen M, Talja M, Hallanvuo S, Siitonen A, Välimaa T, Tammela TLJ, Seppälä J, Törmälä P. 2000. Bacterial adherence to ofloxacin-blended polylactone-coated self-reinforced l-lactic acid polymer urological stents. BJU International. 86:966-969.
Nauman EA, Ott CM, Sander E, Tucker DL, Pierson D, Wilson JW, Nickerson CA. 2007. Novel quantitative biosystem for modeling physiological fluid shear stress on cells. Applied and Environmental Microbiology. 73:699-705.
Nikolaev Y, Plakunov V. 2007. Biofilm - “City of microbes” or an analogue of multicellular organisms? Microbiology. 76:125-138.
Oliveira K, Oliveira T, Teixeira P, Azeredo J, Henriques M, Oliveira R. 2006. Comparison of the adhesion ability of different Salmonella Enteritidis Serotypes to materials used in kitchens. Journal of Food Protection. 69:2352-2356.
Ong YL, Razatos A, Georgiou G, Sharma MM. 1999. Adhesion forces between E. coli bacteria and biomaterial surfaces. Langmuir. 15:2719-2725.
Petrova OE, Sauer K. 2012. Sticky situations - Key components that control bacterial surface attachment. Journal of Bacteriology. 194:2413–2425.
Poortinga AT, Bos R, Norde W, Busscher HJ. 2002. Electric double layer interactions in bacterial adhesion to surfaces. Surface Science Reports. 47:1-32.
Qureshi N, Annous B, Ezeji T, Karcher P, Maddox I. 2005. Biofilm reactors for industrial bioconversion processes: employing potential of enhanced reaction rates. Microbial Cell Factories. 4:24.
Ronald LS. 2011. Analysis of pathoadaptive mutations in Escherichia coli. ProQuest, UMI dissertation publishing.
Shi X, Zhu X. 2009. Biofilm formation and food safety in food industries. Trends in Food Science & Technology. 20:407-413.
Shunmugaperumal T. 2010. Biofilm eradication and prevention: a pharmaceutical approach to medical device infections. New Jersey: Wiley.
Simões LC, Simões M, Vieira MJ. 2010a. Adhesion and biofilm formation on polystyrene by drinking water-isolated bacteria. Antonie van Leeuwenhoek. 98:317-329.
Simões M, Simões LC, Cleto S, Pereira MO, Vieira MJ. 2008. The effects of a biocide and a surfactant on the detachment of Pseudomonas fluorescens from glass surfaces. International Journal of Food Microbiology. 121:335-341.
Simões M, Simões LC, Vieira MJ. 2010b. A review of current and emergent biofilm control strategies. LWT - Food Science and Technology. 43:573-583.
Singh R, Paul D, Jain RK. 2006. Biofilms: implications in bioremediation. Trends in Microbiology. 14:389-397.
Soon CF, Omar WIW, Nayan N, Basri H, Narawi MB, Tee KS. 2013. A bespoke contact angle measurement software and experimental setup for determination of surface tension. Procedia Technology. 11:487-494.
Stoodley P, Haalt-Stoodley L, Costernon B, DeMeo P, Shirtliff M, Gawalt E, Kathju S. 2013. Biomaterials Science. An introduction to materials and medicine. Sociaty for biomaterials. Biofilms, Biomaterilas, and device-related infections.

Chapter 7
118
Teodósio JS, Silva FC, Moreira JMR, Simões M, Melo L, Mergulhão FJ. 2013. Flow cells as quasi Ideal systems for biofouling simulation of industrial piping systems. Biofouling. 29:953-966.
Van Houdt R, Michiels CW. 2010. Biofilm formation and the food industry, a focus on the bacterial outer surface. Journal of Applied Microbiology. 109:1117-1131.
van Oss C. 1994. Interfacial Forces in Aqueous Media. New York, USA.: Marcel Dekker Inc.
Van Oss CJ, Chaudhury MK, Good RJ. 1988. Interfacial Lifshitz-van der Waals and polar interactions in macroscopic systems. Chemical Reviews. 88:927-941.
Vogler EA. 1998. Structure and reactivity of water at biomaterial surfaces. Advances in Colloid and Interface Science. 74:69-117.
Wang T, Liu X, Yu Q, Zhang X, Qu Y, Gao P, Wang T. 2005. Directed evolution for engineering pH profile of endoglucanase III from Trichoderma reesei. Biomolecular Engineering. 22:89-94

Chapter 8
119
Chapter 8 Micro and macro flow systems to study E. coli adhesion on polymeric materials
Micro and macro flow systems have been used as in vitro platforms to mimic bacterial adhesion under physiological conditions. The decision of which platform to use is commonly dictated by the dimensions of the systems that they are supposed to mimic and by the available resources in each laboratory. In this chapter, a microchannel and a PPFC were operated in order to observe the adhesion of E. coli to polymeric surfaces (cellulose acetate, glass, poly-L-lactide, polyamide and PDMS) that are commonly used to construct biomedical devices. Both systems enable direct, real-time monitoring of cell adhesion by microscopy and were operated at a physiological shear stress. Thermodynamic surface properties were determined by contact angle measurement and the hydrodynamic conditions were simulated by CFD. This work was made in collaboration with Maha Ponmzohi, who was responsible for the experimental work with the microchannel and respective CFD simulations under the supervision of Dr. João Miranda from the Transport Phenomena Research Center (CEFT-FEUP). The results presented in this study demonstrate that different adhesion rates were obtained with different materials but similar values were obtained in the microchannel and in the PPFC for each material under the same shear stress (0.02 Pa). This suggests that despite the huge scale factor (50000x) both platforms can equally be used to mimic the same biomedical biofilms. Thus, depending on the expertise and equipment availability in different labs, micro flow systems can be used, taking advantage of lower hold-up volumes, or macro flow systems can be selected in order to obtain a higher biofilm mass that can be used for further biochemical analysis.
This chapter was adapted from:
Moreira JMR, Ponmozhi J, Campos J, Miranda JM, Mergulhão FJ. Micro and macro flow systems for E. coli adhesion on biomedical materials. Biomicrofluidics. (Submitted).

Chapter 8
120

Chapter 8
121
8.1 Introduction
Biofilms are communities of microorganisms adhered to living or inert surfaces, surrounded by self-produced extracellular polymeric substances (Nikolaev et al. 2007). Microbial adhesion to surfaces is dictated by a set of important variables, including cell transport and the imposed shear stress, which are dictated by the flow conditions, and by physicochemical interactions between cells and surfaces (Pace et al. 2006).
Hospital-acquired infections are the fourth leading cause of death in the U.S and 65% of this infections are caused by biofilms (Robert et al. 2010). Most cases of infection in critically ill patients are associated with medical devices. Infection rates in medical devices comprise dental implants and fracture fixation devices (5-10 %), bladder catheters (10-30 %) and heart assistant devices (25 -50%) (Weinstein et al. 2001). E. coli has been documented as the major cause for infection of these devices (Castonguay et al. 2006). This bacteria is responsible for 80% of the urinary tract infections, 1.5% of infections in breast implants and it has also been found in pacemakers and contact lenses (Wood 1999; Trautner et al. 2004; Shunmugaperumal 2010). Bacterial adhesion and biofilm development on the surface of these medical devices can compromise their function and increase the health risk (Weinstein et al. 2001).
The scientific community has been trying to understand how to control biofilms in order to reduce their effects. Bacterial adherence to a surface is one of the first steps in biofilm formation (Nikolaev et al. 2007) and controlling this step is one of the most promising biofilm control strategies (Chen et al. 2005; Gallardo-Moreno et al. 2011; Petrova et al. 2012; Campoccia et al. 2013). Shumi et al. (2013) used a microfluidic device in order to investigate the influence of flow shear stress and sucrose concentration in the adhesion of S. mutans aggregates. With this platform they simulated the space between adjacent teeth in order to understand the process of dental caries formation by S. mutans. They observed that sucrose-dependent aggregates (larger than 50 µm in diameter) are more tolerant to shear stress than sucrose-independent aggregates. Bruinsma et al. (2001) investigated the effect of physicochemical surface interactions between seven different bacterial strains isolated from ophthalmic infections and hydrophilic and hydrophobic contact lenses (CL) with and without an adsorbed tear film. They used a PPFC for bacterial adhesion assays in order to mimic the natural eye environment and understand the process of microbial keratitis development. They concluded that CL hydrophobicity dictates the composition of the adsorbed tear film and thus the extension of bacterial adhesion to the lens. Andersen et al. (2010) have used a flow chamber operated at hydrodynamic flow conditions similar to those found in implanted devices in order to observe the effect of surface chemistry and temperature in adhesion and biofilm formation by E. coli strains on two types of silicone rubber. They observed that surface chemistry influenced surface colonization and that temperature was also a critical factor.
PPFC and microchannels are two of the most widely used flow devices for adhesion/biofilm studies (Gottenbos et al. 1999; Busscher et al. 2006; Rivet et al. 2011). Both systems enable real-time visualization of bacterial adhesion/biofilm development in conditions which mimic in vivo environments (Kim et al. 2012; Barros et al. 2013). They enable control the hydrodynamics conditions (e.g. shear stress), temperature, testing

Chapter 8
122
different materials and they can be used as high-throughput platforms (Bakker et al. 2003; Situma et al. 2006; Barros et al. 2013). Microfluidic systems have some advantages such as low volume requirements (e.g. reagents) which may lead to reduced operational costs (Situma et al. 2006), they mimic phenomena occurring at a microscale, such as in microfluidic drug delivery systems (Gerecht et al. 2013), and due to their small dimensions they are easy to handle (Aimee et al. 2013). On the other hand, this platform is not accessible to many labs due to the unique requirements of micro-fabrication processes, liquid handling and sampling. These techniques are often time-consuming, labor-intensive and expensive since in most cases microchannels cannot be reused (Situma et al. 2006). Fabrication of a common PPFC can be more straightforward for some labs with the added advantage that after fabrication it can be used indefinitely. Additionally, several materials can be tested at the same time or consecutively and the amount of produced biofilm is higher enabling further biochemical analysis. This platform is often used to mimic systems with dimensions larger than few centimeters (Teodósio et al. 2013). The selection of a platform for bacterial adhesion studies can be an intricate issue. Both systems have their relative advantages and disadvantages and their selection is usually dictated by the equipment/expertise existing in the lab as well by the similarity to the physiological system that is supposed to be mimicked (e.g. size similarity) (Bakker et al. 2003; Aimee et al. 2013; Barros et al. 2013; Gerecht et al. 2013; Teodósio et al. 2013).
In this work, E. coli adhesion was visualized in a microchannel and in a PPFC in order to compare two platforms commonly used in adhesion studies. The same average wall shear stress (0.02 Pa) was used on both systems and similar shear stress values can be found in the urinary (Aprikian et al. 2011) or reproductive systems (Nauman et al. 2007). Five materials, cellulose acetate (CA), glass, poly-L-lactide (PLLA), polyamide (PA) and polydimethylsiloxane (PDMS), (Multanen et al. 2000; Abbasi et al. 2001; Andersson 2006; Grewe et al. 2011) which are currently used to fabricate biomedical devices that are inserted in these body locations were tested. Besides assessing the influence of the adhesion surface, one of the main objectives of this work was to evaluate if the size similarity between the in vitro formation platform and the in vivo scenario is a relevant issue in the selection of the most adequate biofilm formation platform.
8.2 Materials and methods
8.2.1 Numerical simulations
Numerical simulations were made in Ansys Fluent CFD package (version 14.5). A model of each system was built in Design Modeller 14.5 and was discretized by Meshing 14.5.
The mesh for the PPFC (1,694,960 hexahedral cells) was refined near the walls, where velocity gradients are higher. A refined cylindrical core was also introduced to improve the accuracy of the calculation of the jet flow that forms at the inlet of the PPFC. Results were obtained by solving the SSL k-ω turbulent model (Menter 1994) with low Reynolds corrections. The velocity-pressure coupled equations were solved by the PISO algorithm (Issa 1986), the QUICK scheme (Leonard 1979) was used for the discretization

Chapter 8
123
of the momentum equations and the PRESTO! scheme for pressure equation discretization. The no slip boundary condition was considered for all the bounded walls.
The mesh for the microfluidic channel was divided into two parts, an inlet region with 124,154 hexahedral cells and the microchannel with a mesh of 94,374 hexahedral cells uniformly distributed. Results were obtained by solving the Navier-Stokes equations for the laminar regime using the PISO algorithm, the QUICK scheme and PRESTO!.
For the simulations, the initial velocity field was set to zero, a uniform velocity profile was set at the inlet and the pressure was set to zero at the outlet. The properties of water (density and viscosity) at 37 ºC were used for the fluid. Simulations were made in transient mode, to assure convergence and to capture transient flow structures. For each case, 2 s of physical time were simulated with a fixed time step of 10-4 s.
8.2.2 Bacteria and culture conditions
E. coli JM109(DE3) was used since this strain had already demonstrated a good biofilm formation capacity (Teodósio et al. 2012). A starter culture was obtained by inoculation of 500 µL of a glycerol stock (kept at -80 ºC) to a total volume of 0.2 L of inoculation media with 5.5 g L-1 glucose, 2.5 g L-1 peptone, 1.25 g L-1 yeast extract in phosphate buffer (1.88 g L-1 KH2PO4 and 2.60 g L-1 Na2HPO4) at pH 7.0, as described by Teodósio et al. (2011). This culture was grown in a 1 L shake-flask, incubated overnight at 37 ºC with orbital agitation (120 rpm). A volume of 60 mL from the overnight grown culture was used to harvest cells by centrifugation (for 10 min at 3202 g). Cells were washed twice with citrate buffer 0.05 M (Simões et al. 2008), pH 5.0 and finally the pellet was resuspended and diluted in the same buffer in order to reach a cell concentration of 7.6x10⁷ cell.mL-1.
8.2.3 Surface preparation
Five materials, CA, glass, PLLA, PA and PDMS were prepared for adhesion assays. Glass slides commercially available (VWR) were firstly washed with a commercial detergent (Sonasol Pril, Henkel Ibérica S A) and immersed in sodium hypochlorite (3%). After rinsing with distilled water, part of the glass slides was coated with the polymers. Coatings were prepared by mixing the polymer in solid form with solvents. Dichloromethane was added to PLLA at 5 % (w/w), acetone was added to CA at 8 % (w/w), PA was prepared with trichloroethanol at 5 g.L-1 and a curing agent (Sylgard 184 Part B, Dow Corning) was added (at a 1:10 ratio) to PDMS (polymers from Sigma, solvents from Normapur). These mixtures were carefully stirred to homogenize the two components without introducing bubbles. The polymers were then deposited as a thin layer on the top of glass slides by spin coating (Spin150 PolosTM).
8.2.4 Surface characterization
Bacterial and surface hydrophobicity was evaluated considering the Lifshitz van der Waals acid base approach (van Oss 1994). The contact angles were determined automatically by the sessile drop method in a contact angle meter (OCA 15 Plus;

Chapter 8
124
Dataphysics, Filderstadt, Germany) using water, formamide and α-bromonaphtalene (Sigma) as reference liquids. The surface tension components of the reference liquids were taken from literature (Janczuk et al. 1993). For each surface at least 10 measurements with each liquid were performed at 25 ± 2 ºC. One E. coli suspension was prepared in the same conditions as for the adhesion assay and its physicochemical properties were also determined by sessile drop contact angle measurement as described by Wang et al. (2013). The model proposed by van Oss (1994) indicates that the total surface energy (γ Tot) of a
pure substance is the sum of the Lifshitz van der Waals components of the surface free
energy ( LWγ ) and Lewis acid-base components (ABγ ):
ABLW γγγ +=Tot (1)
The polar AB component comprises the electron acceptor +γ and electron donor
−γ parameters, and is given by:
−+= γγγ 2AB (2)
The surface energy components of a solid or bacterial surface (s) are obtained by measuring the contact angles (θ) with the three different liquids (l) with known surface tension components, followed by the simultaneous resolution of three equations of the type:
( )
++=+ +−−+
lslsLWl
LWsl 2θcos1 γγγγγγγ (3)
The degree of hydrophobicity of a given surface (solid or bacterial surface) is expressed as the free energy of interaction (G∆ mJ.m-2) between two entities of that surface immersed in a polar liquid (such as water (w) as a model solvent). G∆ was calculated from the surface tension components of the interacting entities, using the equation:
−−++
−−=∆ −+−++−−+
wwsswsw
2LWw
LW 42G γγγγγγγγγγ ss ; (4)
If the interaction between the two entities is stronger than the interaction of each
entity with water, G∆ < 0 mJ.m-2, the material is considered hydrophobic, if
G∆ > 0 mJ.m-2, the material is hydrophilic.
8.2.5 PPFC experiments
A PPFC (25.4 x 1.6 x 0.8 cm) was coupled to a jacketed tank connected to a centrifugal pump by a tubing system to conduct the adhesion assay. The PPFC contained a bottom and a top opening for the introduction of the test surfaces. The PPFC was mounted in a microscope (Nikon Eclipse LV100, Japan) to monitor the E. coli attachment to each surface for 30 min. The cellular suspension was circulated at 4 mL.s-1 (corresponding to an average wall shear stress of 0.02 Pa in the visualization zone as determined by CFD) and images were acquired every 60 s with a camera (Nikon digital sight DS-RI 1, Japan) connected to the microscope. The temperature was kept constant at 37 ºC using a

Chapter 8
125
recirculating water bath. All adhesion experiments were performed in triplicate for each surface.
8.2.6 Microchannel experiments
Molds were prepared by the xurographic technique (Bartholomeusz et al. 2005) to fabricate PDMS microchannels with dimensions of 100 x 450 x 15 000 µm by standard PDMS soft lithography (Duffy et al. 1998). The microchannels were placed and sealed over glass slides coated in a two-step procedure with PDMS and small patches of the polymeric surfaces. The microchannel was coupled to a syringe pump by a tubing system to conduct the adhesion assay. The microchannel was mounted in a microscope (Leica DMI 5000 M) to monitor the E. coli attachment to each surface for 30 min. The cellular suspension was circulated at 0.02 µL.s-1 (corresponding to an average wall shear stress of 0.02 Pa in the visualization zone as determined by CFD) and images were acquired every 60 s with a camera (Leica DFC350 FX) connected to the microscope. The temperature was kept constant at 37 ºC by a hot air atmosphere around the microchannel using a hot air blower. All adhesion experiments were performed in triplicate for each surface.
8.2.7 Data analysis
The microscopy images recorded during the on-line cell adhesion assays were analyzed with an image analysis and measurement software program (ImageJ 1.46r) in order to obtain the number of adhered cells over time (30 min assay). This program was also used to calibrate the size of the field of view of each image so that pixels could be converted to square centimeters. The number of bacterial cells was then divided by the surface area of the field of view to obtain the density of bacteria per square centimeter. This cell density was plotted along the assay time and the adhesion rate (cells.cm-2.s-1) was calculated from the slope of a linear regression of the data obtained for each surface and platform. Images taken at the endpoint of the assay were used to calculate the surface coverage using the same software.
8.3 Results and Discussion
Figure 8.1a depicts the wall shear stress distribution along the PPFC. The higher wall shear stress values are obtained in the entry zone for x < 0.05 m and afterwards flow stabilizes as it approaches the viewing point where the conditions are of steady flow. Figure 8.1 c) shows the wall shear stress for the microchannel. The inlet region, which is used for micro/macro interfacing, has a very low shear stress. In the microchannel, no developing region is observed and the shear stress is constant along the flow direction. A detailed representation of the viewing regions of each platform (Figure 8.1b) shows that the wall shear stress is constant in the region where adhesion was measured and that the average shear stress was the same on both platforms.

Chapter 8
126
Figure 8.1 Wall shear stress: a) in the bottom wall of the PPFC (xy plan); b) in the viewing regions of the PPFC and microchannel; c) in the bottom wall of the microchannel (xy plan).
In table 8.1 it is possible to observe that these systems have different dimensions, there is a volumetric scale-up factor of 50000x from the microchannel to the PPFC. Also, the microchannel has a higher aspect ratio when compared to the PPFC. Different flow rates were operated in each system in order to obtain identical average wall shear stresses (in the order of 0.02 Pa). Approximate shear stresses can be found in different locations of the human body like in the bladder, urethra (Aprikian et al. 2011), uterus (Nauman et al. 2007) and veins (Ross et al. 1998). Five materials (CA, glass, PA, PLLA and PDMS) commonly used in biomedical devices (Multanen et al. 2000; Abbasi et al. 2001; Andersson 2006; Grewe et al. 2011) which can be applied in these body locations were chosen for the bacterial adhesion assays. A physicochemical characterization of these materials was made by contact angle measurement. In table 8.2 it is possible to observe that glass is a hydrophilic surface, whereas all the other tested surfaces are hydrophobic, although with different degrees of hydrophobicity. Additionally it is also verified that E. coli has a hydrophilic surface.

Chapter 8
127
Table 8.1 Microchannel and PPFC dimensions, operational data and numerical results.
Microchannel PPFC
Section area / mm2 4.5 x 10⁻² 128
Volumetric scale factor 50000x
Aspect ratio 4.5 2
Flow rate / (ml.s-1) 2.0 x10⁻⁵ 4
Average velocity / (m.s-1) 4.4 x10⁻⁴ 0.04
Average shear stress / Pa 0.02
Maximum surface coverage / % 7.60±0.64 7.10±0.63
In figure 8.2 it is possible to observe the adhesion rates for each tested material obtained in the microchannel and in the PPFC. Results show that when the macro and micro systems were operated at identical wall shear stress, similar adhesion rates were obtained for each material. It is also possible to verify that different adhesion rates were obtained on the different materials. The highest adhesion rate was obtained in PA and the lowest in PLLA. Similar adhesion rates were obtained in glass and PDMS. A higher adhesion rate was expected in the most hydrophobic surface and the lowest in the hydrophilic glass (Kochkodan et al. 2008). However, a correlation between the bacterial adhesion rates and surface hydrophobicity was not found for any of the systems. In table 8.1 it is possible to observe that when the PPFC and the microchannel were operated at identical wall shear stress, a similar maximum surface coverage was also achieved (for PA) and similar results for each surface were obtained in the macro and micro systems (data not shown).
Table 8.2 Contact angle measurements of each surface (bacteria, PLLA, PDMS, PA, CA, glass) with the three liquids, water (θw), formamide (θform) and α-bromonaphtalene (θbr) and hydrophobicity (∆G).
Surface Contact angle / º
Hydrophobicity/ (mJ.m-2)
θw θform θbr ∆∆∆∆G
PLLA 88.03 ± 1.01 68.49 ± 0.95 25.59 ± 1.54 -65.32
PDMS 113.6 ± 0.62 111.2 ± 0.61 87.62 ± 1.77 -61.82
PA 69.36 ± 0.43 48.02 ± 1.24 23.63 ± 0.53 -37.58
CA 65.24 ± 0.49 36.63 ± 2.05 22.47 ± 1.05 -36.04
Glass 16.38 ± 0.35 17.19 ± 0.35 44.48 ± 0.71 27.99
E. coli 19.13 ± 0.88 73.34 ± 0.65 58.54 ± 2.01 121.9
Several factors are known to influence bacterial adhesion to surfaces including
chemical composition of the material, surface charge, hydrophobicity and physical configuration (An et al. 1998). The combination of these factors can lead to higher or lower bacterial adhesion rates depending on the interactions between the cell surface and the

Chapter 8
128
material surface (An et al. 1998). Additionally, the biological aspects of adhesion such as the role of specific bacterial components like adhesins are also determinant on bacterial attachment (Desrousseaux et al. 2013). Several studies have been reporting the importance of shear forces in mediating bacterial adhesion (Patel et al. 2003; Lee et al. 2008; Liu et al. 2011). Katsikogianni et al. (2008) studied the role of the physicochemical surface properties in the attachment of S. epidermidis on plasma modified polyethylene terephthalate films under static and dynamic conditions (shear rates of 50 and 200 s-1). They observed that there was a strong correlation between the thermodynamic predictions and the measured values of bacterial adhesion under static conditions. However, under flow conditions, the increase in the shear rate restricted the predictability of the thermodynamic models. They concluded that at higher wall shear rates, changes in the substratum surface free energy do not affect bacterial adhesion as much as in static conditions. In this work, it was also observed that bacterial adhesion results on the different materials could not be explained by the surface thermodynamics, however the same behavior was observed on both systems (PPFC and microchannel) which were operated at identical wall shear stresses.
Figure 8.2 Bacterial adhesion rates on PA, glass, PDMS, CA and PLLA obtained in the microchannel (black bars) and in the PPFC (white bars). Error bars shown for each surface represent the standard deviation from three independent experiments.
In this work it was observed that for these flow systems with the same geometry and operated at identical wall shear stresses, the same surface coverage and adhesion rates were obtained despite the huge scale factor (50000x). It is therefore reasonable to assume that if similar results were obtained in both platforms in these conditions they are equally capable of mimicking the same biomedical scenarios. Therefore, the results obtained in one of these platforms are transferable to the other and thus the dimensions of the real systems that they are supposed to mimic may no longer be a limiting parameter in the selection of the most adequate flow system for bacterial adhesion assays. This enables different labs to choose whatever system they prefer due to their expertise and equipment availability taking into consideration the advantages and limitations of both systems.

Chapter 8
129
8.4 References
Abbasi F, Mirzadeh H, Katbab A-A. 2001. Modification of polysiloxane polymers for biomedical applications: a review. Polymer International. 50:1279-1287.
Aimee KW, Laura H, Matthew RP, Marvin W. 2013. Going local: technologies for exploring bacterial microenvironments. Nature Reviews Microbiology. 11:337-348.
An YH, Friedman RJ. 1998. Concise review of mechanisms of bacterial adhesion to biomaterial surfaces. Journal of Biomedical Materials Research. 43:338-348.
Andersen TE, Kingshott P, Palarasah Y, Benter M, Alei M, Kolmos HJ. 2010. A flow chamber assay for quantitative evaluation of bacterial surface colonization used to investigate the influence of temperature and surface hydrophilicity on the biofilm forming capacity of uropathogenic Escherichia coli. Journal of Microbiological Methods. 81:135-140.
Andersson JU (2006). Urinary catheter, Patent.
Aprikian P, Interlandi G, Kidd BA, Le Trong I, Tchesnokova V, Ykovenko O, Whitfield MJ, Bullitt E, Stenkamp RE, Thomas WE, Sokurenko E. 2011. The bacterial fimbrial tip acts as a mechanical force sensor. PLoS Biol. 9.
Bakker DP, van der Plaats A, Verkerke GJ, Busscher HJ, van der Mei HC. 2003. Comparison of velocity profiles for different flow chamber designs used in studies of microbial adhesion to surfaces. Appl. Environ. Microbiol. 69:6280-6287.
Barros J, Grenho L, Manuel CM, Ferreira C, Melo LF, Nunes OC, Monteiro FJ, Ferraz MP. 2013. A modular reactor to simulate biofilm development in orthopedic materials. International Microbiology. 16:191-198.
Bartholomeusz DA, Boutte RW, Andrade JD. 2005. Xurography: Rapid prototyping of microstructures using a cutting plotter. Journal of Microelectromechanical Systems. 14:1364-1374.
Bruinsma GM, van der Mei HC, Busscher HJ. 2001. Bacterial adhesion to surface hydrophilic and hydrophobic contact lenses. Biomaterials. 22:3217-3224.
Busscher HJ, van der Mei HC. 2006. Microbial adhesion in flow displacement systems. Clinical Microbiology Reviews. 19:127-141.
Campoccia D, Montanaro L, Arciola CR. 2013. A review of the clinical implications of anti-infective biomaterials and infection-resistant surfaces. Biomaterials. 34:8018-8029.
Castonguay MH, van der Schaaf S, Koester W, Krooneman J, van der Meer W, Harmsen H, Landini P. 2006. Biofilm formation by Escherichia coli is stimulated by synergistic interactions and co-adhesion mechanisms with adherence-proficient bacteria. Research in Microbiology. 157:471-478.
Chen G, Zhu H. 2005. Bacterial adhesion to silica sand as related to Gibbs energy variations. Colloids and Surfaces B: Biointerfaces. 44:41-48.
Desrousseaux C, Sautou V, Descamps S, Traoré O. 2013. Modification of the surfaces of medical devices to prevent microbial adhesion and biofilm formation. Journal of Hospital Infection. 85:87-93.
Duffy DC, McDonald JC, Schueller OJA, Whitesides GM. 1998. Rapid prototyping of microfluidic systems in poly(dimethylsiloxane). Analytical Chemistry. 70:4974-4984.
Gallardo-Moreno AM, Navarro-Pérez ML, Vadillo-Rodríguez V, Bruque JM, González-Martín ML. 2011. Insights into bacterial contact angles: Difficulties in defining hydrophobicity and surface Gibbs energy. Colloids and Surfaces B: Biointerfaces. 88:373-380.
Gerecht S, Abaci HE, Drazer G. 2013. Recapitulating the vascular microenvironment in microfluidic platforms Nano LIFE. 03:1340001.

Chapter 8
130
Gottenbos B, van der Mei HC, Busscher HJ. 1999. Methods in Enzymology. Academic Press. Models for studying initial adhesion and surface growth in biofilm formation on surfaces.
Grewe D, Roeder B, Charlebois S, Griebel A (2011). Manufacturing methods for covering endoluminal prostheses, Google Patents.
Issa RI. 1986. Solution of the implicitly discutised fluid flow equations by operating-splitting. J. Comput Phys. 62:40-65.
Janczuk B, Chibowski E, Bruque JM, Kerkeb ML, Gonzales-Caballero FJ. 1993. On the consistency of surface free energy components as calculated from contact angle of different liquids: an application to the cholesterol surfaces. J Colloid Interface Sci. 159:421-428.
Katsikogianni M, Amanatides E, Mataras D, Missirlis YF. 2008. Staphylococcus epidermidis adhesion to He, He/O2 plasma treated PET films and aged materials: Contributions of surface free energy and shear rate. Colloids and Surfaces B: Biointerfaces. 65:257-268.
Kim J, Park H-D, Chung S. 2012. Microfluidic approaches to bacterial biofilm formation. Molecules. 17:9818-9834.
Kochkodan V, Tsarenko S, Potapchenko N, Kosinova V, Goncharuk V. 2008. Adhesion of microorganisms to polymer membranes: a photobactericidal effect of surface treatment with TiO2. Desalination. 220:380-385.
Lee J-H, Kaplan J, Lee W. 2008. Microfluidic devices for studying growth and detachment of Staphylococcus epidermidis biofilms. Biomedical Microdevices. 10:489-498.
Leonard BP. 1979. A stable and accurate convective modelling procedure based on quadratic upstream interpolation. Comput. Methods Appl. Mech. Eng. 19:59-98.
Liu C, Zhao Q. 2011. Influence of surface-energy components of Ni–P–TiO2–PTFE nanocomposite coatings on bacterial adhesion. Langmuir. 27:9512-9519.
Menter FR. 1994. Two-equation eddy-viscosity turbulence models for engineering applications. AIAA Journal. 32:1598-1605.
Multanen M, Talja M, Hallanvuo S, Siitonen A, Välimaa T, Tammela TLJ, Seppälä J, Törmälä P. 2000. Bacterial adherence to ofloxacin-blended polylactone-coated self-reinforced l-lactic acid polymer urological stents. BJU International. 86:966-969.
Nauman EA, Ott CM, Sander E, Tucker DL, Pierson D, Wilson JW, Nickerson CA. 2007. Novel quantitative biosystem for modeling physiological fluid shear stress on cells. Applied and Environmental Microbiology. 73:699-705.
Nikolaev Y, Plakunov V. 2007. Biofilm - “City of microbes” or an analogue of multicellular organisms? Microbiology. 76:125-138.
Pace JL, Rupp ME, Finch RG. 2006. Biofilms, Infection and Antimicrobial Therapy. Boca Raton: CRC pres Taylor and Francis group.
Patel JD, Ebert M, Stokes K, Ward R, Anderson JM. 2003. Inhibition of bacterial and leukocyte adhesion under shear stress conditions by material surface chemistry. Journal of Biomaterials Science Polymer. 14:279-295.
Petrova OE, Sauer K. 2012. Sticky situations - Key components that control bacterial surface attachment. Journal of Bacteriology. 194:2413–2425.
Rivet C, Lee H, Hirsch A, Hamilton S, Lu H. 2011. Microfluidics for medical diagnostics and biosensors. Chemical Engineering Science. 66:1490-1507.
Robert JM, Salek MM. 2010. Numerical Simulations - examples and applications in computational fluid dynamics. Canada: InTech. Numerical simulation of fluid flow and hydrodynamic analysis in commonly used biomedical devices in biofilm studies.

Chapter 8
131
Ross JM, Alevriadou BR, McIntire LV. 1998. Thrombosis and Hemorrhage. Baltimore, MD: Williams & Wilkins. 17, Rheology.
Shumi W, Kim SH, Lim J, Cho K-S, Han H, Park S. 2013. Shear stress tolerance of Streptococcus mutans aggregates determined by microfluidic funnel device (µFFD). Journal of Microbiological Methods. 93:85-89.
Shunmugaperumal T. 2010. Biofilm eradication and prevention: a pharmaceutical approach to medical device infections. New Jersey: Wiley.
Simões M, Simões LC, Cleto S, Pereira MO, Vieira MJ. 2008. The effects of a biocide and a surfactant on the detachment of Pseudomonas fluorescens from glass surfaces. International Journal of Food Microbiology. 121:335-341.
Situma C, Hashimoto M, Soper SA. 2006. Merging microfluidics with microarray-based bioassays. Biomolecular Engineering. 23:213-231.
Teodósio JS, Simões M, Melo LF, Mergulhão FJ. 2011. Flow cell hydrodynamics and their effects on E. coli biofilm formation under different nutrient conditions and turbulent flow. Biofouling. 27:1-11.
Teodósio JS, Simões M, Mergulhão FJ. 2012. The influence of non-conjugative Escherichia coli plasmids on biofilm formation and resistance. Journal of Applied Microbiology. 113:373–382.
Teodósio JS, Simões M, Melo L, Mergulhão FJ. 2013. Biofilms in bioengineering. Nova science publishers 3, Platforms for in vitro biofilm studies.
Trautner BW, Darouiche RO. 2004. Role of biofilm in catheter-associated urinary tract infection. American Journal of Infection Control. 32:177-183.
van Oss C. 1994. Interfacial Forces in Aqueous Media. New York, USA.: Marcel Dekker Inc.
Wang H, Sodagari M, Ju L-K, Zhang Newby B-m. 2013. Effects of shear on initial bacterial attachment in slow flowing systems. Colloids and Surfaces B: Biointerfaces. 109:32-39.
Weinstein RA, Darouiche RO. 2001. Device-associated infections: a macroproblem that starts with microadherence. Clinical Infectious Diseases. 33:1567-1572.
Wood M. 1999. Conjunctivitis: Diagnosis and Management. Community Eye Health. 12:19-20.

Chapter 8
132

Chapter 9
133
Chapter 9 Conclusions and suggestions for future work
In this chapter, the major conclusions of the present thesis are addressed. Suggestions for future work are also proposed.

Chapter 9
134

Chapter 9
135
9.1 Conclusions
The main goal of this thesis was to gain a deeper understanding of the processes occurring during biofilm formation in order to devise biofilm control strategies that delay the onset detrimental biofilms or promote the development of beneficial biofilms.
The main external factors that affect bacterial adhesion and further biofilm development are the medium composition, surface properties and the hydrodynamic conditions. Therefore, in order to analyse the importance of these factors on biofilm onset and maturation, a hydrodynamic characterization of in vitro platforms commonly used in biofilm studies was made. Numerical simulations using CFD enabled the characterization of the hydrodynamic conditions inside these systems.
Flow hydrodynamics in a semi-circular flow cell were characterized and results have shown that shear stress and the external mass transference coefficient increased with increasing flow rates. Then, the effect of turbulent conditions, usually operated in industrial settings, on biofilm growth was evaluated. It was observed that shear stress effects can be more important than mass transfer on biofilm formation since biofilm growth was favored at lower Re. These results indicate that high flow rates are always preferred to reduce the buildup of bacterial biofilms. These findings may be important during cleaning and disinfection cycles where high flow rates should be used. This will increase the shear stress thus promoting biofilm detachment and may potentiate the effect of biocides and other cleaning agents due to the increased mass transfer from the bulk solution to the surface of the biofilm.
Flow hydrodynamics in a PPFC were also characterized and their effect in bacterial adhesion to surfaces with different properties was evaluated. Results demonstrated that E. coli adhesion to surfaces is modulated by shear stress, with surface properties having a stronger effect at lower and higher flow rates and with negligible effects at intermediate flow rates. These findings suggest that when expensive materials or coatings are selected to produce biomedical devices, this choice should take into count the physiological hydrodynamic conditions that will occur during the utilization of those devices.
Flow hydrodynamics in 96-well microtiter plates were then characterized and their influence on biofilm formation in media with different glucose concentrations was assessed. The results have shown that higher glucose concentrations favored biofilm development and that the shaking diameter did not affect biofilm formation. Additionally, it was demonstrated that the 96-well microtiter plate is a versatile platform for conducting dynamic biofilm studies because besides the high throughput and low hold-up of this platform, it also enables the simulation of physiological shear stresses.
After the hydrodynamic characterization of the three systems, the 96-well microtiter plate and the PPFC were chosen to investigate the effect of surface conditioning with medium components and cellular extracts on bacterial adhesion and biofilm formation. Results showed that surface conditioning with nutrients rich in nitrogen and components of the cell architecture decreased biofilm formation. Additionally, biofilm inhibition caused by cell components could be explained by a reduction in the initial cell attachment. These results suggest that in industrial systems where biofilm formation is not critical below a certain threshold, induced planktonic cellular lysis and subsequent adsorption of cell

Chapter 9
136
components to surfaces may reduce biofilm buildup and extend the operational time by increasing cleaning intervals. Similar biofilm formation results were obtained in 96-well microtiter plates and in the PPFC operated at the same shear stress. This indicates that the average wall shear stress may be a suitable scale up parameter from 96-well microtiter plates to flow systems with a different flow topology.
In order to evaluate the effect of surface properties on bacterial adhesion, different polymeric materials with biomedical application were characterized and bacterial adhesion to those materials was assayed in a PPFC operated at physiological shear stress conditions. An attempt was made to correlate bacterial adhesion with the surface thermodynamic properties and the results have shown that adhesion was correlated with the ᵞLW /ᵞ- ratio. Bacterial adhesion was reduced in surfaces with lower γ LW /ᵞ- and enhanced otherwise and this was validated with results obtained by independent groups. This finding may be helpful in the design of new coatings by controlling ᵞLW /ᵞ- or in the selection of existing materials according to the desired application.
A fourth biofilm formation platform was then used for cell adhesion assays. A microchannel and a PPFC were compared in the adhesion of E. coli to the above mentioned polymers under the same physiological shear stress. This enables the evaluation of the scale up effect when materials with different surface properties are used. Different adhesion rates were obtained on different materials but similar values were obtained in the microchannel and in the PPFC for each material. This suggests that despite the huge scale factor, both platforms can equally be used to mimic the same biomedical biofilms when operated at the same shear stress. This reinforces the hypothesis that the average wall shear stress may be a good scale up parameter for different biofilm formation platforms.
In general, the results obtained in this thesis, have shown that the semi-circular flow cell, the PPFC and the 96-well microtiter plates are suitable in vitro platforms to simulate biofilm formation in relevant biomedical and industrial systems when operated at physiological or operational shear stresses.
It was observed that, in the 96-well microtiter plate, the wall shear stress changes periodically and is unevenly distributed in the well whereas in the flow cell systems, after a stabilization length is reached, the wall shear stress is homogeneously distributed. These platforms have different flow topologies but despite this difference it was observed that average wall shear stress may be a suitable scale-up parameter. Therefore, the results obtained in one of these platforms may be transferable to the others and thus the dimensions of the real systems or the fluid topology that these platforms are supposed to mimic may no longer be a limiting parameter in the selection of the most adequate system for bacterial adhesion assays. This enables different labs to choose whatever system they prefer due to their expertise and equipment availability taking into consideration the advantages and limitations of each system.
9.2 Suggestions for future work
In this thesis, the hydrodynamic characterization of three platforms was made and two platforms (96-well microtiter plates and the PPFC) were chosen to evaluate the effect of surface properties and conditioned surfaces on E. coli adhesion and biofilm formation.

Chapter 9
137
Additionally, some of the results generated in the PPFC were compared with results obtained in a microchannel. It was observed that the average shear stress may be a suitable scale-up parameter and that the results obtained in one of these tested platforms are transferable to the other. Thus, it would be interesting to evaluate if the results obtained in these small scale platforms are also transferable when a large flow cell is operated under the same hydrodynamic conditions and mature biofilms are formed. Since the semi-circular flow cell may be operated at the same tested physiological hydrodynamic conditions used in the PPFC and the microchannel, it would be interesting to evaluate the effect of the tested shear stress on the development of a mature biofilm on the characterized polymeric surfaces.
In this work it was observed that surface conditioning with nutrients rich in nitrogen and components of the cell architecture reduced biofilm formation in the first 24h. Therefore it would be interesting to evaluate the effect of these agents on the properties of mature biofilms (with some days) which is the most common situation in some industrial settings. It has been observed that biofilm mechanical behavior depends on the cohesiveness strength which is the primary factor affecting the balance between growth and detachment (Ahimou et al. 2007), and that this can be affected by surface properties (Brizzolara et al. 2006). Biofilm cohesion can be important in the success of cleaning and disinfection processes (Mathieu et al. 2014), and this may have implications in the dissemination of pathogenic bacteria and in the operation of biofilm reactors (Walter et al. 2013). Thus, the effect of surface conditioning with the tested agents on biofilm cohesion should be evaluated since it may be important in modeling biofilm development.
96-well microtiter plates haves been used as a high throughput biofilm screening platform for antibiotics, disinfectants, and other chemicals (Pitts et al. 2003; Shakeri et al. 2007), and also to study biofilm formation (Stepanovic et al. 2000; Simões et al. 2010). However, these studies have been made with little knowledge about the hydrodynamic conditions and oxygen transference effects. In this thesis, the hydrodynamic characterization inside this platform was made, and its effect on biofilm formation was evaluated. Different studies have addressed the oxygen transfer in microtiter plates by numerical simulation (Duetz et al. 2004; Doig et al. 2005; Zhang et al. 2008) and it is known that oxygen transfer can affect bacterial growth (Büchs 2001). Cotter et al. (2009) have evaluated the effect of oxygen mass depletion on static biofilm growth in this system, having observed that the depletion of dissolved oxygen significantly influenced biofilm production. Therefore, it would be interesting to evaluate the effect of oxygen mass transference on biofilm formation and growth in this platform under different shaking conditions.
9.3 References
Ahimou F, Semmens MJ, Novak PJ, Haugstad G. 2007. Biofilm cohesiveness measurement using a novel atomic force microscopy methodology. Applied and Environmental Microbiology. 73:2897-2904.
Brizzolara RA, Holm ER. 2006. The effect of solid surface tension and exposure to elevated hydrodynamic shear on Pseudomonas fluorescens biofilms grown on modified titanium surfaces. Biofouling. 22:431-440.

Chapter 9
138
Büchs J. 2001. Introduction to advantages and problems of shaken cultures. Biochemical Engineering Journal. 7:91-98.
Cotter JJ, O'Gara JP, Casey E. 2009. Rapid depletion of dissolved oxygen in 96-well microtiter plate Staphylococcus epidermidis biofilm assays promotes biofilm development and is influenced by inoculum cell concentration. Biotechnology and Bioengineering. 103:1042-1047.
Doig SD, Pickering SCR, Lye GJ, Baganz F. 2005. Modelling surface aeration rates in shaken microtitre plates using dimensionless groups. Chemical Engineering Science. 60:2741-2750.
Duetz WA, Witholt B. 2004. Oxygen transfer by orbital shaking of square vessels and deepwell microtiter plates of various dimensions. Biochemical Engineering Journal. 17:181-185.
Mathieu L, Bertrand I, Abe Y, Angel E, Block JC, Skali-Lami S, Francius G. 2014. Drinking water biofilm cohesiveness changes under chlorination or hydrodynamic stress. Water Research. 55:174 - 184.
Pitts B, Hamilton MA, Zelver N, Stewart PS. 2003. A microtiter-plate screening method for biofilm disinfection and removal. Journal of Microbiological Methods. 54:269-276.
Shakeri S, Kermanshahi RK, Moghaddam MM, Emtiazi G. 2007. Assessment of biofilm cell removal and killing and biocide efficacy using the microtiter plate test. Biofouling. 23:79-86.
Simões LC, Simões M, Vieira MJ. 2010. Adhesion and biofilm formation on polystyrene by drinking water-isolated bacteria. Antonie van Leeuwenhoek. 98:317-329.
Stepanovic S, Vukovic D, Dakic I, Savic B, Svabic-Vlahovic M. 2000. A modified microtiter-plate test for quantification of Staphylococcal biofilm formation. Journal of Microbiological Methods. 40:175-179.
Walter M, Safari A, Ivankovic A, Casey E. 2013. Detachment characteristics of a mixed culture biofilm using particle size analysis. Chemical Engineering Journal. 228:1140-1147.
Zhang H, Lamping SR, Pickering SCR, Lye GJ, Shamlou PA. 2008. Engineering characterisation of a single well from 24-well and 96-well microtitre plates. Biochemical Engineering Journal. 40:138-149.