An NMR and molecular mechanics study of squalene and squalene derivatives
14
Chemistry and Physics of LIPIDS ELSEVIER SCIENCE Chemistry and Physics of Lipids IRELAND 70 (1994) 21--34 An NMR and molecular mechanics study of squalene and squalene derivatives Lionello Pogliani a, Maurizio Ceruti b, Gabriele Ricchiardi c, Davide Viterbo *c aDipartimento di Chimica, Universith della Calabria, 87030 Rende ( CS), Italy hlstituto di Chimica Farmaceutica Applicata, Universith degli Studi di Torino, Corso Raffaello 31, 10125 Torino, Italy CDipartimento di Chimica Inorganica, Chimica Fisica e Chimica dei Materiali, Universit~ degli Studi di Torino, Via P. Giuria 7, 10125 Torino, Italy (Received 13 May 1993; revision received 21 September 1993; accepted 21 September 1993) Abstract Various squalene derivatives, including squalene, squalene 2,3-epoxide (monoepoxide, SQME), squalene 2,3;22,23- diepoxide (SQDE), 2-aza-2,3-dihydrosqualene (SQN) and 2-aza-2,3-dihydrosqualene N-oxide (SQNO), were studied in chloroform solutions using ID high-resolution mH spectra and ~3C longitudinal relaxation studies, 2D proton NOESY and COSY and 2D proton-carbon HETCOR spectroscopy. A full interpretation of the mH and ~3C-NMR spectra is presented. Staggered conformations along the C 11--C 12 bond are favoured and a relatively rigid structure of the central part of the chain is indicated in relaxation and coupling data, while further away from the central part the molecular mobility grows. A detected NOE dipolar interaction between terminal and central parts of the molecule indicates the presence of dynamically folded structures in solution. The proposed model also explains the selective reac- tivity of the mobile chain endings with respect to the central part which is protected by these moving ends. Different solvents at different concentrations induce some variations in this molecular model with a shortening or a lengthening of the mean path covered by the tail endings. Molecular mechanics and molecular dynamics calculations on the free squalene molecule indicate that the mobility of the chain is almost equivalent in all its isoprenic moieties, and the great- er mobility of the chain ends may be ascribed to co-operative movements from the center to the tails. The solvent prob- ably plays an important role in hindering the motion of the central part of the molecule. Key words: Squalene; NMR; Molecular mechanics; Conformations 1. Introduction Acyclic isoprenoids constitute a class of sub- stances many of which are found in nature, where * Corresponding author. they have important biological functions. The iso- prenoid squalene has been demonstrated to be, for example, a precursor of sterols, a fundamental step in such biosynthesis being the stereospecific cyclization of squalene 2,3-epoxide [1]. Many NMR (in particular 13C-NMR) studies 0009-3084/94/$07.00 © 1994 Elsevier Science Ireland Ltd. All rights reserved. SSDI 0009-3084(93)02276-W
Transcript of An NMR and molecular mechanics study of squalene and squalene derivatives

Chemistry and Physics of
LIPIDS ELSEVIER SCIENCE Chemistry and Physics of Lipids
IRELAND 70 (1994) 21--34
An NMR and molecular mechanics study of squalene and squalene derivatives
Lionello Pogliani a, Maurizio Ceruti b, Gabriele Ricchiardi c, Davide Viterbo *c
aDipartimento di Chimica, Universith della Calabria, 87030 Rende ( CS), Italy hlstituto di Chimica Farmaceutica Applicata, Universith degli Studi di Torino, Corso Raffaello 31, 10125 Torino, Italy
CDipartimento di Chimica Inorganica, Chimica Fisica e Chimica dei Materiali, Universit~ degli Studi di Torino, Via P. Giuria 7, 10125 Torino, Italy
(Received 13 May 1993; revision received 21 September 1993; accepted 21 September 1993)
Abstract
Various squalene derivatives, including squalene, squalene 2,3-epoxide (monoepoxide, SQME), squalene 2,3;22,23- diepoxide (SQDE), 2-aza-2,3-dihydrosqualene (SQN) and 2-aza-2,3-dihydrosqualene N-oxide (SQNO), were studied in chloroform solutions using ID high-resolution mH spectra and ~3C longitudinal relaxation studies, 2D proton NOESY and COSY and 2D proton-carbon HETCOR spectroscopy. A full interpretation of the mH and ~3C-NMR spectra is presented. Staggered conformations along the C 11--C 12 bond are favoured and a relatively rigid structure of the central part of the chain is indicated in relaxation and coupling data, while further away from the central part the molecular mobility grows. A detected NOE dipolar interaction between terminal and central parts of the molecule indicates the presence of dynamically folded structures in solution. The proposed model also explains the selective reac- tivity of the mobile chain endings with respect to the central part which is protected by these moving ends. Different solvents at different concentrations induce some variations in this molecular model with a shortening or a lengthening of the mean path covered by the tail endings. Molecular mechanics and molecular dynamics calculations on the free squalene molecule indicate that the mobility of the chain is almost equivalent in all its isoprenic moieties, and the great- er mobility of the chain ends may be ascribed to co-operative movements from the center to the tails. The solvent prob- ably plays an important role in hindering the motion of the central part of the molecule.
Key words: Squalene; NMR; Molecular mechanics; Conformations
1. Introduction
Acyclic isoprenoids constitute a class of sub- stances many of which are found in nature, where
* Corresponding author.
they have important biological functions. The iso- prenoid squalene has been demonstrated to be, for example, a precursor of sterols, a fundamental step in such biosynthesis being the stereospecific cyclization of squalene 2,3-epoxide [1].
Many NMR (in particular 13C-NMR) studies
0009-3084/94/$07.00 © 1994 Elsevier Science Ireland Ltd. All rights reserved. SSDI 0009-3084(93)02276-W
22 L. Pogliani et al. /Chem. Phys. Lipids 70 (1994) 21-34
have been carried out on squalene and its derivatives (especially squalene monoepoxide) and other similar isoprenoids [2-14], some of them [8-11] with the aim of checking the interpretation given by van Tamelen [15] in terms of solvent- induced coiling of squalene, in order to explain the highly selective reactivity of the terminal double bonds. This is also the initial step in the oxidation- cyclization of squalene to sterols in vivo.
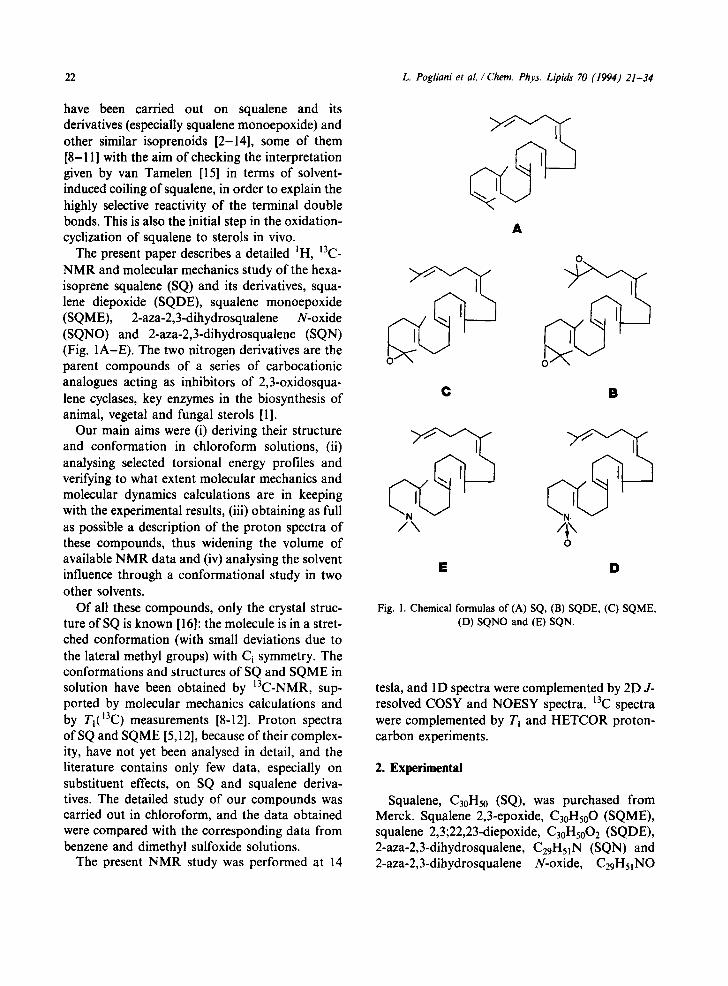
The present paper describes a detailed IH, 13C- NMR and molecular mechanics study of the hexa- isoprene squalene (SQ) and its derivatives, squa- lene diepoxide (SQDE), squalene monoepoxide (SQME), 2-aza-2,3-dihydrosqualene N-oxide (SQNO) and 2-aza-2,3-dihydrosqualene (SQN) (Fig. 1A-E). The two nitrogen derivatives are the parent compounds of a series of carbocationic analogues acting as inhibitors of 2,3-oxidosqua- lene cyclases, key enzymes in the biosynthesis of animal, vegetal and fungal sterols [1].
Our main aims were (i) deriving their structure and conformation in chloroform solutions, (ii) analysing selected torsional energy profiles and verifying to what extent molecular mechanics and molecular dynamics calculations are in keeping with the experimental results, (iii) obtaining as full as possible a description of the proton spectra of these compounds, thus widening the volume of available NMR data and (iv) analysing the solvent influence through a conformational study in two other solvents.
Of all these compounds, only the crystal struc- ture of SQ is known [16]: the molecule is in a stret- ched conformation (with small deviations due to the lateral methyl groups) with Ci symmetry. The conformations and structures of SQ and SQME in solution have been obtained by 13C-NMR, sup- ported by molecular mechanics calculations and by Tl(13C)measurements [8-12]. Proton spectra of SQ and SQME [5,12], because of their complex- ity, have not yet been analysed in detail, and the literature contains only few data, especially on substituent effects, on SQ and squalene deriva- tives. The detailed study of our compounds was carried out in chloroform, and the data obtained were compared with the corresponding data from benzene and dimethyl sulfoxide solutions.
The present NMR study was performed at 14
A
0
C 6
/\ /ix 0
f D
Fig. 1. Chemical formulas of (A) SQ, (B) SQDE, (C) SQME, (D) SQNO and (E) SQN.
tesla, and 1D spectra were complemented by 2D J- resolved COSY and NOESY spectra. 13C spectra were complemented by Ti and HETCOR proton- carbon experiments.
2. Experimental
Squalene, C3oH5o (SQ), was purchased from Merck. Squalene 2,3-epoxide, C30H500 (SQME), squalene 2,3;22,23-diepoxide, C3oH500 2 (SQDE), 2-aza-2,3-dihydrosqualene, C29H51N (SQN) and 2-aza-2,3-dihydrosqualene N-oxide, C29H51NO

h Pogliani et al. / Chem. Phys. Lipids 70 (1994) 21-34
(SQN.0) were synthesized as described [17]. Ap- proximately 1 M solutions ( ~ 50% in volume) in isotopically pure deuterated chloroform of SQ, SQME and SQDE and about 0.6 M solutions in the same solvent of SQN and SQNO were employed. NMR spectra were recorded on a Bruker AM-600 spectrometer. IH and 13C spectra were obtained at 600.13 and 150.91 MHz, respec- tively. The probe temperature was 300 K. The 13C signal of CDC13 was assigned a shift of 77 ppm and was thereafter used as internal standard for carbon spectra. In order to conform with previous work [12], the high-field peak in the IH spectrum of SQ was fixed at 1.61 ppm (RP peak in Table 1) and was taken as reference peak for the proton spectra.
2.1. 1D and 2D IH spectra
Eight scans were accumulated for each spectrum over a spectral width of 3400 Hz in 16K data points. J-resolved COSY and NOESY spectra (phase-sensitive with 10% random variations of mixing time to suppress J scalar couplings) were employed, using standard Bruker microprograms
Table i NMR parameters of SQ
Ci/Hi ~(Ci) biT I (s) a 6(Hi) 3j(ij) (Hz) (ppm) (ppm)
Melt 25.63 9.6 1.688 Me2 17.60 18.0 1.612 2q 131.01 11.6 3 125.45 3.7 5.111 J(3,4) = 7.2 4 26.79 3.2 2.079 ./(4,5) = 7.6 5 39.74 2.8 1.991 6q 134.74 8.4
Me6 15.93 19.5 1.610(RP) 7 124.30 1.8 5.134 J(7,8) = 7.2 8 26.66 2.0 2.097 ./(8,9) = 8.2 9 39.76 2.0 2.005
10q 134.94 6.4 MelO 15.98 17.1 1.618 !1 124.34 1.6 5.166 J(ll,12) = 3.8 12 28.28 1.6 2.032
aNTi values for quaternary 1-5. RP, reference peak.
carbons (q) become T I in Tables
23
[18,19]. The 2D matrix for some NOESY experi- ments was 2K x 2K and for others 2K x 512, while the second dimension of the J-resolved spec- tra was 256 points. The mixing times for NOESY spectra were 0.2, 0.5 and 1 s. Assignments were confirmed with the aid of IH-[IH] homonuclear decoupling and for SQ and SQDE also by simulating their 1D spectra. Simulation was ob- tained by adding the different subspectra from the different spin systems of the squalene chain: two AM2X2, one AM2 and four A 3. A graphical pro- ccdure was used, running under the VMS operat- ing system and developed by colleagues in the Chemistry Department of the University of Calabria [20]. The line width for the simulation was 1.5 Hz in order to take into account the dif- ferent multiplet overlapping and the long-range coupling constants, 4j, which act through the double bond and broaden the concerned peaks. Chemical shifts and coupling constants are correct within ±0.01 ppm and ± 0.4-0.8 Hz, respectively. Large errors on J are mainly due to the partial overlap of the different spin systems and to line- broadening induced by the small 4j couplings.
2.2. 1D and 2D 13C spectra
Thirty-two scans were accumulated for each spectrum. The spectral width was 144 ppm, and 32K data points were acquired and transformed into 64K. Ti spectra were acquired by means of the inversion-recovery pulse sequence, and the pulse recycle time was 80.0 s. Tl values were determined using a least-squares fit of the intensity of 14 r values ranging from 0.01 to 50 s, and their estimated errors are around 12% (quaternary car- bons: ~ 20%). Consistent overlapping of 13C peaks within themselves or with impurity peaks, especially for SQNO, results in some highly am- biguous T l values (see Table 6). 2D HETCOR spectra employed the basic four-pulse sequence (two [13C], two [IH]) [18,19]; the relaxation delay was 1 s, J was 145 Hz, the spectral width was 144 x 5.5 ppm and the data set was 2K x 1K. The accuracy of the ~(13C) is ±0.07 ppm.
13C and lH 1D spectra of SQ and SQDE in pure dr-benzene (50% by volume) and d6-DMSO (~-3% by volume) were obtained under the same

24 L. Pogliani et al./ Chem. Phys. Lipids 70 (1994) 21-34
conditions as for the ID spectra in CDCI3. The proton chemical shifts of the very small solvent peaks were 7.200, 7.221 and 2.718 for chloroform, benzene and DMSO, respectively.
2.3. Molecular mechanics and molecular dynamics calculations
Computational results were obtained using soft- ware from Biosym Technologies of San Diego;
dynamics calculations on the isolated SQ molecule were performed using Discover and graphical display achieved using Insight II [21]. The force field employed was CVFF (Consistent Valence Force Field) [211 with quadratic terms for bond stretching and without cross-terms. The energy profiles were obtained scanning one torsion angle at a time, starting from the X-ray structure [16] and optimizing the geometry at each step of the scan. The molecular dynamics simulations were
I . . . . . 100
A 0
J . . . . . . ,
1(~0 5"0
so
I i .
B
,l 'tGo 50
E
Fig. 2. ID-J3C-NMR spectra (from A to E) of SQ, SQDE, SQME, SQNO and SQN, Spectra taken at 150.91 MHz, number of scans 32, 64K data points acquired and 32K transformed.
L. Pogliani et al./ Chem. Phys. Lipids 70 (1994) 21-34 25
run for 1000 ps with 1-fs steps at two different temperatures, 150 K (=0.3 kcal/mole) and 400 K (~ 0.8 kcal/mole).
3. Results
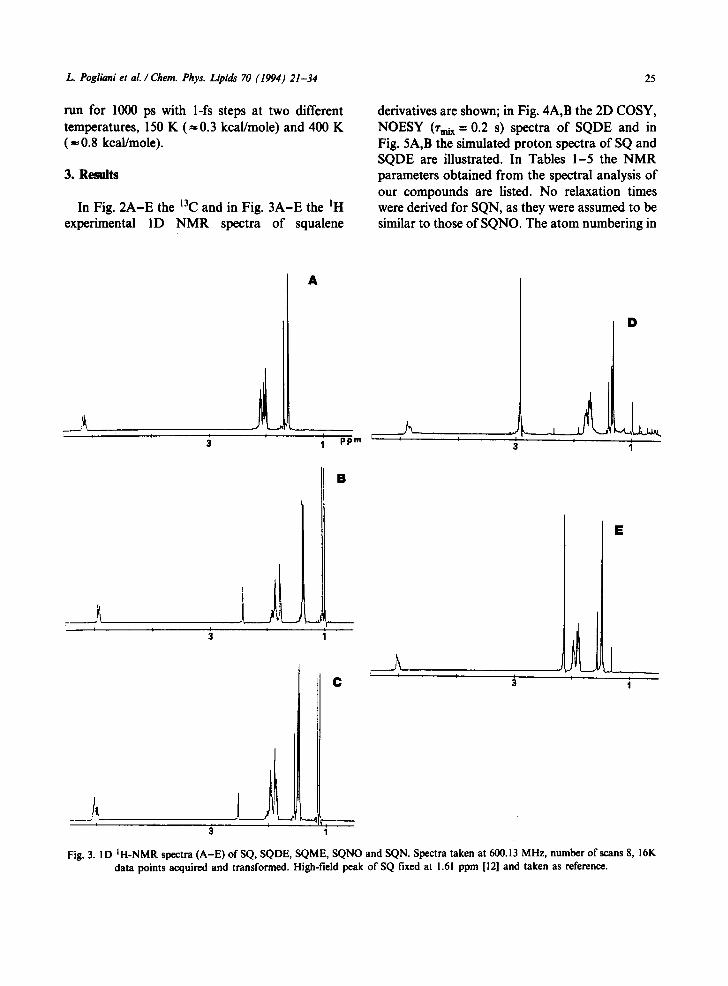
In Fig. 2A-E the 13C and in Fig. 3A-E the 1H experimental ID NMR spectra of squalene
derivatives are shown; in Fig. 4A,B the 2D COSY, NOESY (7"mi x ----0.2 s) spectra of SQDE and in Fig. 5A,B the simulated proton spectra of SQ and SQDE are illustrated. In Tables 1-5 the NMR parameters obtained from the spectral analysis of our compounds are listed. No relaxation times were derived for SQN, as they were assumed to be similar to those of SQNO. The atom numbering in
i
k
A
I I 1 p p m ' , I
I
I
D
I
tt _ _ _ , ' ,
i
B
C ' '
I
E
' i
Fig. 3. ID IH-NMR spectra (A-E) ofSQ, SQDE, SQME, SQNO and SQN. Spectra taken at 600.13 MHz, number of scans 8, 16K data points acquired and transformed. High-field peak of SQ fixed at 1.61 ppm [12] and taken as reference.

26
. J
A
3
i.
' 1 I ' .
.
ppm 5
.=¢ =.
• o . , -
r i . . . . . ! . . . . . . . • - -
3 1
1
ppm 5 :3
t • ~ . ~
F- B
....... :: . . . . "i
" I b ,
" ' °
Fig. 4. COSY (A) and NOESY (B) proton spectra of SQDE. Basic two-pulse and three-pulse sequences used to obtain COSY and NOESY spectra, respectively; data set for both
spectra 2K x 2K; mixing time for NOESY 0.2 s.
L. Pogliani et al./ Chem. Phys. Lipids 70 (1994) 21-34
A
B
Fig. 5. Simulated LD proton spectra of SQ (A) and SQDE (B).
squalene derivatives has been defined in the following way, taking S Q M E as a model:
O / \
(Me 1 - - 2 - - 3 - - 4 - - 5 - - 6 = 7 - - 8 - - 9 - - 1 0 = 11-- 12)' - I I I Me Me Me
Me Me Me I I I
--12--11-~- 1 0 - - 9 - - 8 - - 7 = 6 - - 5 - - 4 - - 3 = 2 ~ M e 1
where Me stands for methyl; methyls in positions 1 and 1' are trans, all the others are cis. In SQ and SQDE the primed and unprimed moieties, because
L. Pogliani et al./ Chem. Phys. Lipids 70 (1994) 21-34
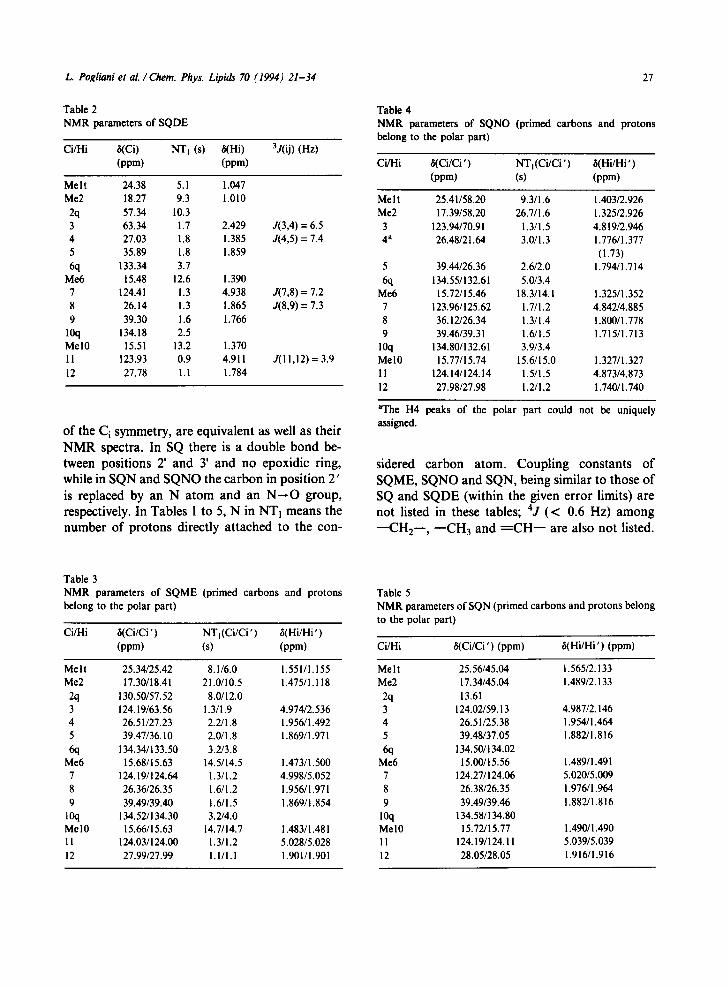
Table 2 NMR parameters of SQDE
Ci/Hi ~Ci) NT 1 (s) 6(Hi) 3j(ij) (Hz) (ppm) (ppm)
Melt 24.38 5.1 i.047 Me2 18.27 9.3 1.010 2q 57.34 10.3 3 63.34 1.7 2.429 ,/(3,4) = 6.5 4 27.03 1.8 1.385 J(4,5) = 7.4 5 35.89 1.8 1.859 6q 133.34 3.7
Me6 15.48 12.6 1.390 7 124.41 1.3 4.938 J(7,8) = 7.2 8 26.14 1.3 1.865 J(8,9) = 7.3 9 39.30 1.6 1.766
10q 134.18 2.5 Mel0 15.51 13.2 1.370 11 123.93 0.9 4.911 J(l 1,12) = 3.9 12 27.78 1.1 1.784
of the Ci symmetry, are equivalent as well as their NMR spectra. In SQ there is a double bond be- tween positions 2' and 3' and no epoxidic ring, while in SQN and SQNO the carbon in position 2' is replaced by an N atom and an N--*O group, respectively. In Tables 1 to 5, N in NTI means the number of protons directly attached to the con-
Table 4 NMR parameters of SQNO (primed carbons belong to the polar part)
27
and protons
Ci/Hi 6(Ci/Ci ' ) NT t (Ci/Ci ' ) ~(Hi/Hi ' ) (ppm) (s) (ppm)
Me I t 25.41/58.20 9.3/1.6 1.403/2.926 Me2 17 .39 /58 .20 2 6 . 7 / 1 . 6 1.325/2.926 3 123.94/70.91 1 .3 /1 .5 4.819/2.946 4 a 26.48/21.64 3 .0 /1 .3 1.776/1.377
(1.73) 5 39.44/26.36 2 . 6 / 2 . 0 1.794/1.714 6q 134.55/132.61 5.0/3.4
Me6 15 .72 /15 .46 1 8 . 3 / 1 4 . 1 1.325/1.352 7 123.96/125.62 1 .7 /1 .2 4.842/4.885 8 36.12/26.34 1 .3 /1 .4 1.800/1.778 9 39.46/39.31 1 .6 /1 .5 1.715/1.713
10q 134.80/132.61 3.9/3.4 Mel0 15 .77/15 .74 1 5 . 6 / 1 5 . 0 1.327/1.327 11 124.14/124.14 1 .5 /1 .5 4.873/4.873 12 27.98/27.98 1 .2 /1 .2 1.740/1.740
aThe H4 peaks of the polar part could not be uniquely assigned.
sidered carbon atom. Coupling constants of SQME, SQNO and SQN, being similar to those of SQ and SQDE (within the given error limits) are not listed in these tables; 4j (< 0.6 Hz) among --CH2--, - -CH 3 and -----CH-- are also not listed.
Table 3 NMR parameters of SQME (primed carbons and protons belong to the polar part)
Ci/Hi 6(Ci/Ci ') NTI(Ci/Ci ') ~(Hi/Hi ') (ppm) (s) (ppm)
Melt 25.34/25.42 8.1/6.0 1.55 !/1.155 Me2 17 .30 /18 .41 2 1 . 0 / 1 0 . 5 1.475/1.118 2q 130.50/57.52 8.0/ 12.0 3 124.19/63.56 1 .3 /1 .9 4.974/2.536 4 26.51/27.23 2 .2 /1 .8 1.956/1.492 5 39.47/36.10 2 .0 /1 .8 1.869/1.971 6q 134.34/133.50 3.2/3.8
Me6 15 .68 /15 .63 1 4 . 5 / 1 4 . 5 1.473/1.500 7 124.19/124.64 1 .3 /1 .2 4.998/5.052 8 26.36/26.35 1 .6 /1 .2 1.956/1.971 9 39.49/39.40 1 .6 /1 .5 1.869/1.854
10q 134.52/134.30 3.2/4.0 Mel0 15 .66/15 .63 1 4 . 7 / 1 4 . 7 1.483/I.481 11 124.03/124.00 1 .3 /1 .2 5.028/5.028 12 27.99/27.99 1.1/1.1 1.901/I .901
Table 5 NMR parameters of SQN (primed carbons and protons belong to the polar part)
Ci/Hi ~(Ci/Ci') (ppm) /t(Hi/Hi') (ppm)
Melt 25.56/45.04 1.565/2.133 Me2 17.34/45.04 1.489/2.133 2q 13.61 3 124.02/59.13 4.987/2.146 4 26.51/25.38 1.954/1.464 5 39.48/37.05 1.882/1.816 6q 134.50/134.02
Me6 15.00/15.56 1.489/ 1.491 7 124.27/124.06 5.020/5.009 8 26.38/26.35 1.976/1.964 9 39.49/39.46 1.882/I .816
10q 134.58/134.80 Me 10 15.72/15.77 1.490/1.490 11 124.19/124. I I 5.039/5.039 12 28.05/28.05 1.916/1.916

28 L. Pogliani et al. / Chem. Phys. Lipids 70 (1994) 21-34
In Fig. 7 the structure of the squalene molecule is represented, together with the numbering used to label the different torsion angles, In Fig. 8 the energy profiles of the scans of the selected torsion angles, scanned one at a time, are reported. At each step of each scan the geometry was optimized by molecular mechanics; the starting geometry was always the X-ray structure [16]. In Fig. 9 the values of torsion angles 1, 2 and 3 are reported at l-ps intervals during the dynamic simulations at 150 and 400 K.
4. Discussion
4.1. 13C-NMR spectra
The 13C-NMR spectra of squalene derivatives (Fig. 2) have been assigned with the aid of the known assignments [2,9,11,22] for SQ and SQME, complemented by our T l and HETCOR measure- ments (vnly the HETCOR spectra of SQDE could be clearly analyzed, since those of the other derivatives were affected by higher-order effects). Assignments for SQN and SQNO in the high-field region should be handled with care, because of partial or severe overlap with peaks due to im- purities.
We shall indicate by 'chain centre' (c.c.) the region around the mid-point of the C12--C12' bond, by 'chain mid' (c.m.) the region including carbons 7, 8 and 9 and by 'chain end' (c.e.) the region with carbons 1 to 5. Comparing the longi, tudinal relaxation times along the chain (see Table 6) in squalenes we have both for polar and apolar moieties:
Tl(c.e.) > Tl(c.m.) > Tl(c.c.). (i)
Such relation tells us that the relaxation rate decreases along the chain as the frequency of segmental motion increases (segmental motions are largest at the chain ends). This trend is violated only when carbon peaks are not clearly resolved (values in parentheses in Table 6). Relation 1, valid along the different types and sets of carbon atoms, points to a high mobility of the chain ends and to some internal rigidity between c.m. and c.c. The model adopted here to analyse the trend in-
dicated by Eq. 1 is based on two correlation times [8,13]: ris related to internal motions and ro re- lated to the overall molecular motion. The weakness of such analysis lies in the difficulty of detecting which structural variations affect both kinds of motion and therefore in establishing the details of the molecular motions. With the assump- tion that the relaxation is dominated, also for quaternary carbons, by the dipole-dipole mecha- nism, from the relaxation times of CI 1 and C12 (where the relaxation is likely to be dominated by the overall correlation time with relatively restricted segmental motions) we can estimate that ro in squalenes is in the region of 35-55 ps [81.
Results from methyl carbons cannot be used, as their relaxation is affected by spin-rotational effects, which explains their relatively long relaxa- tion times. Longer relaxation times of Mel trans relative to Me2 cis have already been explained [23] on the basis that the trans methyl is nearer to the segmental rotation axis going through the sequence Me I t~C-~--C--R-. The smaller Tl(Me2') value of the polar part of SQME is due to the presence of the epoxidic ring at C2--C3, which considerably reduces the mobility of the cis Me. The small and equal values of Tl(Melt ') and TI(Me2') in the polar part of SQNO are due in part to partial overlap with impurities and in part to the replacement of the sp 2 carbon C2 by the N--O group, which renders the two methyls equivalent and graetly hinders their free rotation.
The shorter relaxation times for internal car- bons [8] could support the presence of some sort of coiling, if we suppose that the coiling is originated by a growing rigidity in going from the end to the centre of the squalene-type chain.
4.2. Proton spectra
IH spectra of squalenes (Fig. 3), even at 600 MHz, are rather complicated, because of the over- crowded region at low frequency (especially the - -CH 2 - but also the riCH3 regions). Besides, the small long-range couplings, 4js, which take place between the different spin systems through the double bond (between --Me, - -CH 2 - and the next nearest = C H - - ) are hidden within the

L. Pogliani et al. / Chem. Phys. Lipids 70 (1994) 21-34
Table 6 T I (s) values of sets of different types of carbons in squalenes
29
C type q-sp 2 sp 2 sp 3 sp 3' C sets 2q/6q/10q 3/7/i I 4/8/12 5/9 SQ 12.0/8.0/6.0 3.7/1.8/! .6 3.2/2.0/1.6 2.8/2.0 SQDE 10.0/4.0/2.5 1.7/1.3/0.9 1.8/1.3/1.1 1.8/1.6 SQME 8.0/3.0/3.0 (I.3/1.3/1.3) 2.2/1.6/1.1 2.0/1.6 SQME' 12.0/4.0/4.0 1.9/! .2/1.2 1.8/1.2/1.1 1.8/1.5 SQNO 10.3/5.0/4.0 (1.5/1.9/1.5) 3.0/2.0/1.2 2.6/2.0 SQNO' -- /3.4/3.4 a (1.3/1.1/1.5) a (1.3/1.4/1.2) (I.3/1.5)
Values in parentheses are affected by consistent errors due to severe overlap within peaks or with impurity peaks; q stands for quater- nary carbon; sp y stands for an sp 3 carbon near to a q-sp 2 carbon. aln SQNO' (polar part of SQNO) carbon 2q is replaced by an NO group and the C3' sp 2 carbon becomes a C3' sp 3 one.
line-widths and may be detected by the aid of COSY and decoupling measurements.
The interpretation of the proton spectra was carried out in two steps. First, the SQ and SQDE experimental spectra were interpreted with the aid of COSY/NOESY spectra (Fig. 4A,B), decoupling experiments and by assuming a first-order type of spectra. Simulated spectra (Fig. 5A,B) show that our assumptions were rather good, as minor differ- ences between simulated and experimental spectra may be ascribed to selective long-range couplings and relaxation effects, which could not be included in the simulation program. Then, IH data of the other asymmetric squalenes were derived with the aid of the proton data of SQ and SQDE. Spectral simulation of the asymmetric compounds was not possible, because the number of inequivalent spins exceeded the limits of our computer program. Small peaks near 2 ppm (SQDE) or at 2 ppm (SQME) and at _< 1 ppm (SQNO) and other minor peaks may be ascribed to impurities. H3 in SQDE and H3' in SQME do not show any long-range coupling. From the data in Tables 1-5 it is evident that, when the terminal double bond C2~C3 is replaced by an epoxidic ring, or by an aza or aza- N - O group, the entire spectrum is shifted to high- field. In particular the shift concerns H3, H4, Mel and Me2 in going from SQ to SQDE, and also H3', H4', Mel ' and Me2' in going from SQ to SQME. When the signals of the CH protons in the high-frequency region of the spectra of SQ and SQDE are ordered from high to low frequencies,
the following order is obtained: 11/7/3 for the apolar sequence of SQ and 7/11 for the polar se- quence of SQDE. This trend is obeyed in the polar (7'/11') and apolar (11/7/3) parts of SQME and SQNO and only in the apolar part (11/7/3) of SQN, while in its polar part the trend is reversed (11 '/7 ').
The inverted sequence of protons 11 and 7 in SQ and SQDE (D(11) = 81 I(SQ)-61 I(SQDE) = 0.255 ppm and D(7) = 67(SQ)-87(SQDE) = 0.196 ppm) shows that proton 7 is less affected by the epoxidic substitution at C2--C3 than proton I I. The sub- stitution could then be used as a structural label which gives some interesting information on the overall structure of our compounds and especially of SQ and SQDE. The detected shift differences D(ll) and D(7) can be nicely explained by a through-space deshielding effect, stronger at HI1 than at H7 of the C2-m-C3 double bond in SQ, which requires some kind of coiled structure bring- ing this bond closer to H 11 than to H7. The fact that the polar part of SQN does not show such an inversion could be ascribed to the magnetic pro- perties of the N atom, which could mimic the mag- netic anisotropy of the ethylenic double bond. Let us analyse in greater detail some other chemical shift differences, D(i), between similar protons in SQ and SQDE. Their values, in increasing order, are: D(5) = 0.132, D(Me6) = 0.220, D(8) = 0.232, D(9) = 0.239, D(MeI0) = 0.248, D(12) = 0.248, D(4) = 0.694 and D(3) = 2.682 ppm. With the ex- ception of protons 3 and 4, which, being very near
30 L. Pogliani et al. / Chem. Phys. Lipids 70 (1994) 21-34
the substitution site, are mostly affected by the epoxidation at C2--C3, growing D(i) values from proton 5 to 11 confirm the importance of a struc- ture that enhances the through-space deshielding effects of the C2=C3 of SQ towards the mid-chain in chloroform solutions.
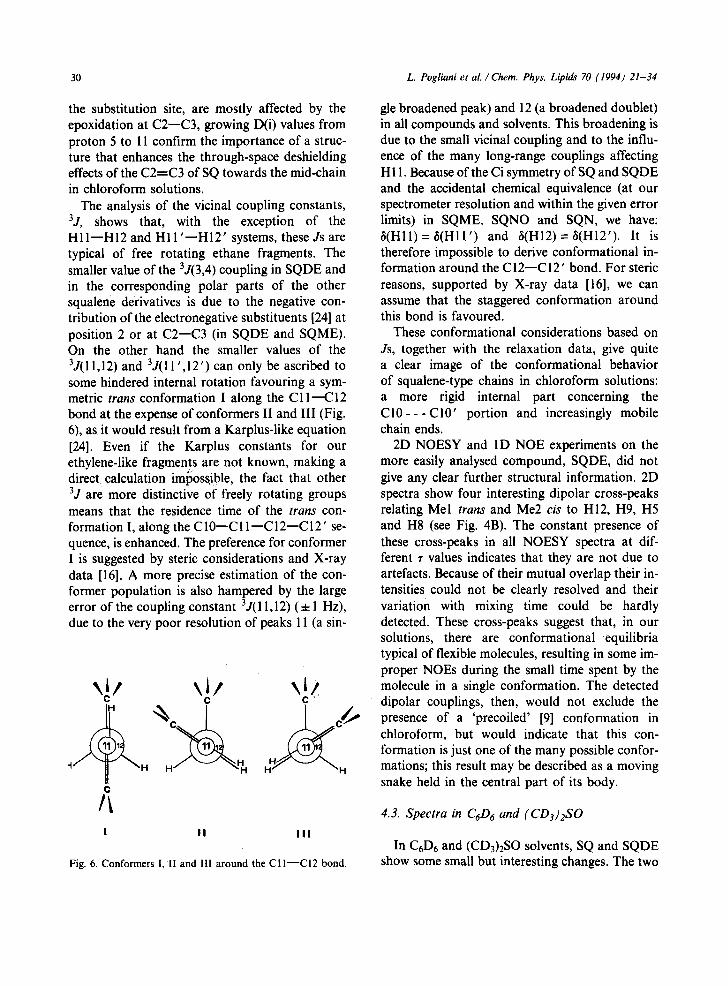
The analysis of the vicinal coupling constants, 3j, shows that, with the exception of the H1 l--H12 and HI 1 ' - -H12 ' systems, these Js are typical of free rotating ethane fragments. The smaller value of the 3J(3,4) coupling in SQDE and in the corresponding polar parts of the other squalene derivatives is due to the negative con- tribution of the electronegative substituents [24] at position 2 or at C2--C3 (in SQDE and SQME). On the other hand the smaller values of the 3j(11,12) and 3j(11 ',12') can only be ascribed to some hindered internal rotation favouring a sym- metric trans conformation I along the C11--C12 bond at the expense of conformers II and III (Fig. 6), as it would result from a Karplus-like equation [24]. Even if the Karplus constants for our ethylene-like fragments are not known, making a direct calculation impossible, the fact that other 3j are more distinctive of freely rotating groups means that the residence time of the trans con- formation I, along the C10--CI 1--C12--C12' se- quence, is enhanced. The preference for conformer I is suggested by steric considerations and X-ray data [16]. A more precise estimation of the con- former population is also hampered by the large error of the coupling constant 3j(11,12) (± 1 Hz), due to the very poor resolution of peaks 11 (a sin-
C C '
C
I I I I I I
Fig. 6. Conformers 1, II and I11 around the CI I - -C12 bond.
gle broadened peak) and 12 (a broadened doublet) in all compounds and solvents. This broadening is due to the small vicinal coupling and to the influ- ence of the many long-range couplings affecting H11. Because of the Ci symmetry of SQ and SQDE and the accidental chemical equivalence (at our spectrometer resolution and within the given error limits) in SQME, SQNO and SQN, we have: a ( H l l ) = ~ ( H I I ' ) and a(Hl2)=a(H12') . It is therefore impossible to derive conformational in- formation around the C 12--C 12' bond. For steric reasons, supported by X-ray data [16], we can assume that the staggered conformation around this bond is favoured.
These conformational considerations based on Js, together with the relaxation data, give quite a clear image of the conformational behavior of squalene-type chains in chloroform solutions: a more rigid internal part concerning the C I 0 - - - C 1 0 ' portion and increasingly mobile chain ends.
2D NOESY and I D NOE experiments on the more easily analysed compound, SQDE, did not give any clear further structural information. 2D spectra show four interesting dipolar cross-peaks relating Mel trans and Me2 cis to H12, H9, H5 and H8 (see Fig. 4B). The constant presence of these cross-peaks in all NOESY spectra at dif- ferent r values indicates that they are not due to artefacts. Because of their mutual overlap their in- tensities could not be clearly resolved and their variation with mixing time could be hardly detected. These cross-peaks suggest that, in our solutions, there are conformational equilibria typical of flexible molecules, resulting in some im- proper NOEs during the small time spent by the molecule in a single conformation. The detected dipolar couplings, then, would not exclude the presence of a 'precoiled' [9] conformation in chloroform, but would indicate that this con- formation is just one of the many possible confor- mations; this result may be described as a moving snake held in the central part of its body.
4.3. Spectra in C6D 6 and (CD3)2S0
In C6D6 and (CD3)2SO solvents, SQ and SQDE show some small but interesting changes. The two

L. Pogliani et al./ Chem. Phys. Lipids 70 (1994J 21-34
compounds display a very low solubility in the sec- ond solvent; from the peak intensity this solubility may be estimated to be around 2-5% in volume. The coupling constants of the two compounds in the two solvents are nearly the same as the ones in chloroform, with variations around 4-1 Hz. In benzene also the high-frequency peaks 3 and 7 of SQ are broad (broader than peak 11), without splitting structure; this is probably due to a shortening of 3j and to an overcrowding of long- range couplings affecting these peaks.
The D(i) values between SQ and SQDE in benzene are: D(5) ~- -0.04, D(Me6) = 0.0, D(12) = 0.039, D(11) = 0.043, D(9) ~ 0.05, D(8)
0.05, D(7)= 0.054, D(Mel0)= 0.064, D(4) 0.61 and D (3) = 2.672 ppm. Apart from protons 3 and 4, which are nearly as affected as in chloroform by the introduction of a double bond in C2--C3, an increasing deshielding effect in going from proton 12 to proton 7 is evident, with the exception of proton 10, which is more affected by the double bond C2=C3; this exception may be ascribed to the preference, in benzene, of the sol- ute for a structure that brings the deshielding space of the C2~---C3 ~r electron system close to the C10-methyl. We may then assume that the struc- ture of SQ and its derivatives in benzene is more open than in chloroform.
In dimethyl sulfoxide the D(i) values are: D(12) =-0.125, D( l l )= -0 .138 , D(8) ~. -0.14, D(9) ~ -0.15, D(Mel0) = -0.154, D(Me6) = -0.177, D(7)=-0.181, D(5) ~ -0.23, D(4) ~. 0.35 and D (3) = 2.292. As expected, protons 3 and 4 are greatly deshielded by the C2=C3 ~- system, while far away from these protons a shielding effect is experienced that grows from the mid- chain towards proton 5, with the C10-methyl pro- tons experiencing a shielding larger than expected. This shielding effect may be explained in the following way. Since the solutions are highly diluted, the solute molecules are highly solvated, especially in the less mobile mid-portion of the molecule; as a consequence the tails are somewhat prevented from bending towards this portion and interacting with it. Further, DMSO should favour a configuration in which the shielding space of the C2=C3 ~r system is brought to interact with the C10-methyl and the C7 proton.
31
Fig. 7. Plot of the squalene molecule with labelling of the tor- sion angles.
The 13C spectra in benzene and DMSO do not show particularly interesting features, as the chemical shifts of SQ and SQDE in these solvents are very similar to the corresponding shifts in chloroform. Also the 2D-NOESY spectra in benzene and DMSO are similar to those in chloroform.
4.4. Dynamic calculations
Molecular mechanics and dynamics calculations were carried out on the isolated squalene molecule (Fig. 7). In Fig. 8a it can be seen that the energy profiles of the scans around torsion angles 4 and 7 are very similar and show a minimum at 180 ° (trans), with two higher minima at 4-60 ° (gauche). The plot is similar to the profile of the rotation around the central bond of n-butane, indicating that a single bond adjacent to two single bonds prefers a trans conformation. This trend is in agreement with the molecular dynamics results shown in the first and fourth plots of Fig. 9, where it can be seen that torsion angle 1, along with 4 and 7, is preferentially at 180 ° with possible jumps to the gauche form at 400 K. In Fig. 8b it can be seen that the energy profiles of the scans around torsion angles 2, 5 and 8 are alike and show a max- imum at 0 ° and a wide and flat minimum around 180 ° (trans), indicating an easy mobility between the two gauche forms via the trans one. The plot is similar to the profile of the rotation around the central single bond of 2-pentene, indicating a high mobility around the trans form of the central sin- gle bond in a sequence --CH2--CH2--CH-----C( Me)--. This trend is in keeping with the second and fifth plots of Fig. 9, where it can be seen that during the molecular dynamics simulations torsion angle 2, along with 5 and 8, is very mobile, with an

32 L. Pogliani et al. / Chem. Phys. Lipids 70 (1994) 21-34
-180 180
Ang in Deg
-180 180
Ang in Deg -180 180
Ang in Deg
Fig. 8. Energy profiles of scans around (a) torsion angles 4 and 7, (b) torsion angles 2, 5 and 8 and (c) torsion angles 3 and 6.
2 0
150K .9
i? a
$
0 le+03
Time in ps
2 a
400K 2' P a 8 I
I
0 le+03 Time. in ps
0 le+03
Time in:;ps
2 a
0 m .,...
-i
0 le+03
Time in ps
0 le+03 0 le+03
Time in ps Time in ps
Fig. 9. Values of torsion angles 1, 2 and 3 at I-ps intervals during molecular dynamics simulations at I50 and 400 K. The plots of torsion angtesq4 and Tare similar to that of I, the plots of torsion angles 5 and 8 are similar to that of 2 and the plot of torsion
angle 6 is similar to that of 3.

L. Pogliani et al. / Chem. Phys. Lipids 70 (1994) 21-34 33
oscillation amplitude of about 200 ° around 180 ° . Only the cis form is hindered, and the motion goes from gauche II to gauche I I I through the trans form I (cf. Fig. 6). Fig. 8c shows that the energy profiles of the scans around torsion angles 3 and 6 are very similar, with minima at ± 60 ° (gauche). The plot is similar to the profile of the rotation around the central bond of 2-methyl-l-butene, which shows a preference for the gauche confor- mations of the central single bond of the sequence - - C H - ' C ( M e ) - - C H 2 - - C H 2 - - : this preference is probably dictated by the adjacent Me group. This trend is in agreement with the third and sixth plots of Fig. 9, where it can be seen that during the mo- lecular dynamics simulations torsion angle 3, along with 6, is mainly in one gauche form at 150 K, while they may jump from one gauche form to the other at 400 K.
5. Conclusion
The squalene-type chains of SQ, SQDE, SQME, SQNO and SQN in chloroform solution undergo conformational equilibria caused by the mobile tails of squalenes moving around the more rigid central portion, which gives the squalene chains the form of a dynamic 'precoil'. In this way the center of the chain is, on average, protected from electrophilic addition reactions. Thus the mobility of the chain ends has a double function: protecting the central part from reaction and at the same time sweeping the surrounding space in order to catch the reactants. The study in three different solvents at different concentrations shows that this model remains the same with small changes at the level of greater or lesser volume covered by the tail move- ments. Molecular mechanics and dynamics calcu- lations do not show a noticeable increase of mobility of the individual torsion angles in going from the center to the end of the chain. The overall mobility of the chain tails is increased because any motion of the central part of the molecule is amplified at the ends, and this induced motion adds to the rotation movements of the tails themselves. A comparison of N M R and calcula- tion results shows that the solvent must play an important role in anchoring the central part of the molecule.
6. Acknowledgements
Thanks are due to professor I. Bertini for providing the 600-MHz N M R spectrometer together with the help and assistance of the entire Laboratory of Magnetic Resonance of the Depart- ment of Chemistry of the University of Firenze and to professor M. Longeri and Dr. G. Celebre of the Chemistry Department of the University of Calabria for assisting and providing their software for spectral simulation.
7. References
1 L. Cattel and M. Ceruti (1992) in: G.W. Patterson and W.D. Nes (Eds.), Physiology and Biochemistry of Sterols, American Oil Chemists' Society, Champaign, Illinois, pp. 50-82 (and references therein).
2 P. Sozzani and G. di Silvestro (1988), Gazz. Chim. It. 118, 385-389.
3 D.K. Dalling, R.J. Pugmire, D.M. Grant and W.E. Hull (1986), Magn. Res. Chem. 24, 191-198.
4 F.C. Shilling, F.A. Bovey, K. Anandakumaran and A.E. Woodward (1985) Macromolecules 18, 2688-2695.
5 P. Metzger and E. Casadevall (1983) Tetrahedron Lett. 24, 4013-4016.
6 R.T. Gampe Jr., J.A. Matson, A.J. Weinheimer and G.A. Martin (1982) Spectrosc. Lett. 15, 795-802.
7 E.R. Dolinskaya, A.S. Khatchaturov, I.A. Poletayeva and V.A, Kormer (1978) Makromol. Chem. 179, 409-420.
8 J.M. Brown and D.R.M. Martens (1977) Tetrahedron 33, 931-935.
9 M.E. van Dommelen, L.J.M. van de Ven, H.M. Buck and J.W. de Haan (1977) Recl. Tray. Chim. Pays-Bas 96, 295-301.
10 J.W. de Haan, L.J.M. van de Ven, A.R.N. Wilson and A.E, van der Hout-Lodder (1976) Org. Magn. Res. 8, 477-482.
11 M.E. van Dommelen, A.R.N. Wilson, J.W. de Haan and H.M. Buck (1974) Red. Tray. Chim. Pays-Bas 94, 206-208.
12 M.A. Golub, M.S. Hsu and L.A. Wilson (1975) Rubber Chem. Tech. 48, 953-971.
13 J.R. Lyerla Jr., H.M. Mclntyre and D.A. Torchia (1974) Macromolecules 7, 11-14.
14 D.E. Dorman, M. Jautelat and J.D. Roberts (1971) J. Org. Chem. 36, 2757-2766.
15 E.E. van Tamelen (1968) Accounts Chem. Res. 1, 111-123.
16 J. Ernst and J.-H. Fuhrhop (1979) Liebigs Ann. Chem. 1635-1642.
17 M. Ceruti, G. Balliano, F. Viola, L. Cattel, N. Gerst and F. Schuber (1987) Eur. J. Med. Chem. 22, 199-208.

34
18 J.K.M. Sanders and B.K. Hunter (1987) Modem NMR Spectroscopy, Oxford University Press, Oxford, pp. 163-205.
19 G.E. Martin and A.S. Zekter (1988) Two-Dimensional NMR Methods for Establishing Molecular Connectivity, VCH Publishers, Weinheim, pp. 59-89.
20 M. Longeri and G. Celebre, unpublished software.
L. Pogliani et al./ Chem. Phys. Lipids 70 (1994) 21-34
21 Insight 11 User Guide, version 2.1.0, Biosym Technologies, San Diego, 1992.
22 F.G. Weigert, M. Jautelat and .I.D. Roberts (1968) Proc. Natl. Acad. Sci. USA 60, !152-1155.
23 A. Nishinaga, T. Shimizu and T. Matsuura 0980) Tetrahedron Lett. 21, 4095-4096.
24 R.K. Harris (1983) Nuclear Magnetic Resonance Spec- troscopy, Pitman, London, pp. 220-226.