Assessment of Static Delamination Propagation Capabilities ...

NeuroImage 48 (2009) 515–524
Contents lists available at ScienceDirect
NeuroImage
j ourna l homepage: www.e lsev ie r.com/ locate /yn img
Technical Note
Static and dynamic characteristics of cerebral blood flow during the resting state
Qihong Zou a,b, Changwei W. Wu a,c, Elliot A. Stein a, Yufeng Zang b,⁎, Yihong Yang a,⁎a Neuroimaging Research Branch, National Institute on Drug Abuse, National Institutes of Health, 251 Bayview Blvd., Suite 200, Baltimore, MD 21224, USAb State Key Laboratory of Cognitive Neuroscience and Learning, Beijing Normal University, No. 19 Xinjiekouwai Street, Beijing 100875, Chinac Department of Electrical Engineering, National Taiwan University, Taipei, Taiwan
⁎ Corresponding authors. Y. Yang is to be contacted atfax: +86 10 58801023.
E-mail addresses: [email protected] (Y. Zang), yiho(Y. Yang).
1053-8119/$ – see front matter. Published by Elsevier Idoi:10.1016/j.neuroimage.2009.07.006
a b s t r a c t
a r t i c l e i n f oArticle history:Received 3 March 2009Revised 29 June 2009Accepted 3 July 2009Available online 14 July 2009
Keywords:CBFStaticDynamicFunctional connectivityALFFReHoResting state
In this study, the static and dynamic characteristics of cerebral blood flow (CBF) in the resting state wereinvestigated using an arterial spin labeling (ASL) perfusion imaging technique. Consistent with previous PETresults, static CBF measured by ASL was significantly higher in the posterior cingulate cortex (PCC),thalamus, insula/superior temporal gyrus (STG) and medial prefrontal cortex (MPFC) than the average CBFof the brain. The dynamic measurement of CBF fluctuations showed high correlation (functionalconnectivity) between components in the default mode network. These brain regions also had high localtemporal synchrony and high fluctuation amplitude, as measured by regional homogeneity (ReHo) andamplitude of low-frequency fluctuation (ALFF) analyses. The spatial pattern of the static CBF correlated wellwith that of the dynamic indices. The high static and dynamic activities in the PCC, MPFC, insula/STG andthalamus suggest that these regions play a vital role in maintaining and facilitating fundamental brainfunctions.
Published by Elsevier Inc.
Introduction
There has been growing interest in resting brain activity (Raichleet al., 2001; Fox and Raichle, 2007; Greicius, 2008). Positronemission tomography (PET) first demonstrated that a set of brainregions including posterior cingulate cortex (PCC), medial prefrontalcortex (MPFC), thalamus and insula exhibit higher cerebral bloodflow (CBF) than the whole brain average in the resting state(Raichle et al., 2001). CBF in the majority of these regions decreasesfrom its baseline level during a wide range of goal-directed tasks(Shulman et al., 1997; Mazoyer et al., 2001). Together, these brainregions have been called the default mode network (DMN). Incontrast to the observation of static CBF in PET studies, dynamicinteractions between brain regions have been revealed usingresting-state functional magnetic resonance imaging (fMRI) (Biswalet al., 1995). Most of these fMRI studies utilized the synchrony ofspontaneous fluctuations in the blood oxygenation level dependent(BOLD) signal to identify coherent brain networks and to assessalterations in connectivity strength in various brain disorders (e.g.,Greicius et al., 2004; Bluhm et al., 2007; Greicius, 2008; Hong et al.,
fax: +1 443 740 2816. Y. Zang,
nc.
2009). While the dynamic signals in the DMN are highly correlated(Greicius et al., 2003; Fransson, 2005; Fox et al., 2005; Beckmann etal., 2005), the static and dynamic characteristics of resting-statesignals have not been systematically studied under a single modalitywithin the same subjects.
Perfusion imaging based on arterial spin labeling (ASL) has beenwidely used to measure resting-state blood flow in the brain (Detreetal., 1992). ASL approaches can also be utilized to measure dynamic,spontaneous CBF changes in the resting state. An early study demons-trated that spontaneous low frequency (b0.1 Hz) flow-weightedfluctuations are highly synchronized within the motor system (Biswalet al., 1997). De Luca et al. (2006) observed several brain networksusing resting-state ASL data from a single subject. Recently, Chuang etal. (2008) developed a strategy to reduce BOLD contamination in theresting-state CBF fluctuations and reported connectivity within thesensorimotor network.
Using ASL, we investigated the spatial distribution of static anddynamic CBF in the resting state within the same subjects. A multi-slice, pulsed ASL (PASL) technique was utilized to collect CBF timecourses from healthy subjects. Static CBF was measured by voxel-wiseaveraging the CBF values over the time domain. Dynamic character-istics of the brain were assessed using three methods. Classic cross-correlation analysis with a predefined “seed” was used to examinefunctional connectivity to the seed. We also assessed the character-istics of the CBF dynamic fluctuations from the aspect of localinformation, which might provide novel and complementary infor-mation to the correlation analysis. Amplitude of low-frequency

516 Q. Zou et al. / NeuroImage 48 (2009) 515–524
fluctuations (ALFF) (Zang et al., 2007), which quantifies the strengthof the fluctuations in each voxel, was adopted in the current study todepict the local intensity of CBF fluctuations. Regional homogeneity(ReHo) (Zang et al., 2004), which reflects local synchrony by calc-ulating similarity of dynamic fluctuations of voxels within a givencluster, was also used in the analysis to reveal local synchrony of CBFfluctuations. Since CBF is a single physiological parameter (vs. BOLDwhich is a composite of several parameters) and is probably moreclosely related to cerebral metabolism than BOLD, ReHo and ALFFresults from CBF data may bemore physiologically relevant than thosefrom BOLD.
Materials and methods
Participants
Twelve healthy subjects (26.3±6.4 years old, 9 females, and 3males) participated in the study. All subjects were screened with aquestionnaire to ensure no history of neurological illness, psychiatricdisorders or past drug abuse. They were recruited under a protocolapproved by the Institutional Review Board of the IntramuralResearch Program of the National Institute on Drug Abuse. Signedinformed consent was obtained from all participants prior to studyenrollment.
Data acquisition
Functional MRI data were collected on a 3 T Siemens AllegraMR scanner (Siemens, Erlangen, Germany) equipped with aquadrature volume head coil. A PASL sequence based on theflow-sensitive alternating inversion recovery (FAIR) echo-planarimaging (EPI) method was adopted for functional scans. Arterialblood was labeled with alternating slice-selective inversionrecovery (label, SIR) and non-slice-selective inversion recovery(control, NSIR) scans. Important components of QUIPSS II (Wonget al., 1998), such as additional saturation pulses to control thetime duration of the tagged bolus, were added into the sequence.These components make the PASL technique relatively insensitiveto transit delays and improve the quantification of perfusion.Imaging parameters of the PASL sequence were as follows: TE(echo time)/TR (repetition time)/TI (inversion time)=33/2000/1400 ms, flip angle=90°, bandwidth=4112 Hz/pixel. The saturationpulse to control the tagged bolus was applied at TI1= 700 ms, witha saturation thickness of 100 mm and a gap of 12 mm to the imagingslab. Ten oblique imaging slices (thickness/gap=6/0 mm, field ofview=220×220 mm2, in-plane resolution=3.44×3.44 mm2) wereprescribed to cover a large part of the default mode network (Raichleet al., 2001). The slab thickness for the SIR scans was approximately1.4 times the imaging slab (84 mm thickness in total) to avoidartifacts in perfusion images due to imperfect transition of the slabprofile (Yang et al., 1998). Head movement was minimized by usinga polyurethane foam helmet individually made for each participant.Before the resting-state scan, subjects were instructed to rest withtheir eyes closed, not to think of anything in particular, and not tofall asleep during the acquisition period. Twelve minutes of con-tinuous ASL data were acquired for each subject, corresponding to360 measurements.
After the functional scans, a total of 19 NSIR-EPI images wereacquired with multiple TIs (30, 80, 130, 180, 230, 330, 430, 530, 630,730, 830, 1030, 1230, 1530, 1830, 2230, 2730, 3230 and 3830 ms) togenerate T1 maps for image segmentation. For registration purposes, aset of high-resolution anatomical images were acquired using a 3-Dmagnetization prepared rapid gradient echo (MPRAGE) T1-weightedsequence (256×192×160 matrix size; 1×1×1 mm3 in-plane resolu-tion; TI/TR/TE=1000/2500/4.38 ms; flip angle=8°) on eachsubject.
Data preprocessing
A T1 map was curve-fitted for each subject using the NSIR-EPIimages with multiple TIs, which was then used for structural seg-mentation into maps of gray matter, white matter, and cerebrospinalfluid (CSF) using a custom linear decomposition algorithm in MATLAB(MathWorks, Inc., CA).
The resting-state PASL data were preprocessed using the Analysisof Functional Neuroimaging (AFNI) software package (Cox, 1996),including the following: (1) slice time correction for acquisition timedifferences between slices; (2) head motion correction for headmovement during the scan; (3) linear detrending of signal drift; (4)spatial normalization to standard Talairach and Tournoux (TT) spacewith a resampled resolution of 3×3×3 mm3 to facilitate groupanalysis; and (5) spatial smoothing with a 6-mm Gaussian kernel tominimize individual variance and enhance the signal-to-noise ratio(SNR). Potential contamination from BOLD was removed using themethod proposed by Chuang et al. (2008). Each PASL dataset washigh-pass filtered at the cutoff frequency of 0.125 Hz (correspondingto 1
4TR) using Chebyshev type II filters in MATLAB. The PASL signal was
demodulated to low frequency by multiplying cos(πn) (n is the scannumber). Note that high-pass filtering followed by demodulation isthe same as demodulation followed by low-pass filtering, and thisprocess will produce similar results to sinc interpolation of the ASLtime course to create time-matched control and label imagesfollowed by subtraction (Aguirre et al., 2002; Liu and Wong, 2005;Chuang et al., 2008). Potential contamination from physiological noisewas reduced using independent component analysis (ICA) at a grouplevel (Beckmann and Smith, 2004), provided in the FMRIB SoftwareLibrary (FSL; http://www.fmrib.ox.ac.uk/fsl/melodic/index.html).The resting-state PASL data of 12 subjects were automaticallydecomposed into 20 components. High spatial correlation of thecomponents with CSF and/or vascular maps suggested the compo-nents to be artifact instead of representing neuronal activity(Stevens et al., 2009). One component that had the highest averagez-score in the thresholded vessel mask (http://www.bic.mni.mcgill.ca/brainweb/anatomic_normal_20.html) and another componentthat had the highest average z-score in the cerebrospinal fluid (CSF)mask (prior probability template provided by FSL, and thresholded at0.5) were considered irrelevant to neuronal function (Fig. 1). Themajority of the voxels in the two components are located in therespective masks, although a small portion of the voxels (especially theCSF component) does not seem to overlapwith themasks, probably dueto imperfections of the ICA source separation. These two componentswere regressedout from thedata usingdual regression (Beckmannet al.,2009) as follows: a subject specific time course of each component wascreated by regressing the group componentmaps against the individualdata (using fsl_glm implemented in FSL). Then the time coursescorresponding to these two noise components were filtered out ofeach subject's data (using fsl_regfilt implemented in FSL).
Data analysis
Average CBF map (static CBF map) was calculated for each subjectfrom the ICA denoised data. Similar to PET analyses (Raichle et al.,2001), the static CBFmap of each subject was divided by themean CBFvalues of that subject in a brain mask that was the intersection ofscanned brain regions in all subjects. To reveal brain regions with CBFsignificantly higher than the global mean CBF, a voxel-wise one-sidedone-sample t-test against 1 was performed on the normalized CBFmaps (Raichle et al., 2001).
To evaluate the dynamic characteristics of CBF, three approacheswere used to analyze the PASL data after ICA denoising:
(1) Seed-based correlation analysis was employed to examine thetemporal relationship between the PCC and other brain regions.

Fig. 1. Spatial patterns of two ICA components that were related to physiological noise estimated from the group of 12 subjects. The numbers below the images refer to the zcoordinates in Talairach space. A. cerebrospinal fluid. B. blood vessels.
517Q. Zou et al. / NeuroImage 48 (2009) 515–524
A 6-mm diameter sphere centered at the Talairach coordinatesof [10,−54,14] (Wu et al., 2009a) was defined as a seed region.A cross-correlation coefficient (CC) map was obtained by cor-relating the average time course of the seed region with eachvoxel's time course over the brain. Several nuisance covariates(six headmotion parameters and average time course retrievedfrom the segmented white matter mask) were regressed outduring the calculation of the CC map. The white matter signalwas used as a nuisance covariate as it is assumed to notsignificantly reflect neuronal activity. Correlation coefficientswere converted to z-scores by using Fisher's r-to-z transforma-tion to improve normality. To reveal the PCC correlationpattern, one-sample t-test was performed on individual z-maps to determine whether the z-scores significantly differedfrom zero.
(2) Regional homogeneity (ReHo) (Zang et al., 2004) was used tomeasure the similarity of time courses of the voxels within agiven cluster (e.g., 27 nearest neighboring voxels). A customsoftware routine, Resting-State fMRI Data Analysis Toolkit(REST, http://resting-fmri.sourceforge.net) was used for ReHoanalysis in a voxel-wise fashion. ReHo assumes that the timecourses within a functional cluster are similar to each other.Kendall's coefficient concordance (KCC, ranged from 0 to 1)(Kendall and Gibbons,1990) was used to estimate the degree ofsimilarity of multiple time courses (Zang et al., 2004),calculated as follows:
W =P
Rið Þ2−n R� �2
112K
2 n3 − n� � ;
where W is the KCC value; Ri is the sum rank of the ith timepoint; R = n + 1ð ÞKð Þ= 2 is the mean of Ris; K is the numberof time courses within a measured cluster (K=27 in thecurrent study); and n is the number of the ranks (n=360 inthe current study). Similar to the static CBF map, the ReHo mapof each subject was divided by that subject's mean ReHo value,and one-sided one-sample t-test against 1 were performed onthe normalized maps.
(3) Amplitude of low-frequency fluctuations (ALFF) (Zang et al.,2007) was utilized to detect the strength of spontaneousfluctuations of the PASL signal in each voxel. Using REST, thetime course of each voxel was transformed to the frequency
domain, and ALFF was calculated as the amplitude integral overa frequency range of 0–0.125 Hz. Similar to the static CBF mapand ReHo map, the ALFF map of each subject was divided bythat subject's mean ALFF value, then one-sided one-samplet-test against 1 was performed on the normalized maps.
The effects of reduced degrees of freedom in the CBF time coursedue to signal processing (such as the Chebyshev filtering process)were taken into account in the t-tests, similar to that in a previousstudy (Fox et al., 2006). To control for type I error in the resultantstatistical maps, Monte Carlo simulations were performed using theAFNI AlphaSim program (parameters: individual voxel pb5×10−4,10,000 simulations, FWHM=6 mm, within the brain mask). Byiterating the process of random image generation, spatial correlationcalculation, thresholding and cluster identification, an estimate of theoverall significance level is achieved by various combinations ofindividual voxel probability and cluster size thresholds (Poline et al.,1997). A corrected significance level of pb0.001 for the resultantstatistical maps was obtained by combining individual voxelpb5×10−4 with a minimum cluster size of 648 mm3. Based on theresults of one-sample one-sided t-tests, four ROIs for the PCC, MPFC,insula/superior temporal gyrus (STG) and thalamus were defined toshow the average static CBF, CBF time courses, ReHo, and ALFF valueswithin each ROI.
Finally, spatial correlations were calculated to measure spatialsimilarity between the statistical t maps of static CBF and indices ofdynamic CBF fluctuations. The spatial correlation was computed as
RX;Y =
PNi=1
tXi − tXi� �
tYi − tYi� �
ffiffiffiffiffiffiffiffiffiffiffiffiffiffiffiffiffiffiffiffiffiffiffiffiffiffiffiffiffiffiffiffiffiffiffiffiffiffiffiffiffiffiffiffiffiffiffiffiffiffiffiffiffiffiPNi=1
tXi −tXi� �2
tYi −tYi� �2
s ;
where N is the number of voxels in the intersection mask of scannedregions in all subjects, tiX is the t value from static CBF map at voxel i,and ti
Y is the t value from dynamic CBF map (PCC-based correlation,ReHo or ALFF) at voxel i.
For each of the four statistical t maps, the significant voxels(uncorrected pb2.5×10−4) were labeled as 1, and non-significantvoxels were labeled as 0. Combinations of two of the static CBF, ALFFand ReHo maps were added together (Figs. 6A–C), and all four binary

518 Q. Zou et al. / NeuroImage 48 (2009) 515–524
maps were added together (Fig. 6D) to show the overlap of these tmaps (with minimum cluster size of 540 mm3).
Results
Static characteristics of CBF in the resting brain
Static CBF tmap is shown in Fig. 2A. Consistent with a previous PETstudy (Raichle et al., 2001), static CBF in the PCC, MPFC, thalamus andinsula/STG were significantly higher than whole brain mean CBF.Fig. 2B shows that the average static CBF within these four ROIs wassignificantly higher than the global average (which was normalized as1).
Dynamic characteristics of CBF in the resting brain
Dynamic CBF fluctuations of the PCC were significantly correlatedwith brain regions in the DMN, such as MPFC, inferior parietal lobuleand insula/STG (Fig. 3A). The average CBF time courses within the PCCand MPFC ROIs from a representative participant are shown in Fig. 3B.The correlation coefficient between these two ROIs in this subjectwas 0.53.
The brain regions that showed higher local synchrony (i.e., higherReHo) are shown in Fig. 4A. The PCC, MPFC, insula/STG and thalamushad higher within-region local synchrony than other brain regions(Fig. 4). The ALFF map (Fig. 5) shows a very similar pattern with theReHo and static CBF maps.
Fig. 2. Static characteristics of the CBF signals from the group of 12 subjects. A. The number beTalairach space. B. Static CBF in the PCC (t=13.60), MPFC (t=7.98), insula/STG (t=10.58)Data plotted are mean+std.
The spatial correlation coefficients between t maps of static CBFand indices of dynamic PASL data (PCC-based correlation, ReHo andALFF) were 0.40, 0.63 and 0.72 (pb0.05), respectively. Fig. 6 shows theoverlap of brain regions obtained from the static and dynamic indices.The overlapped brain regions were primarily in the PCC, MPFC, insula/STG and thalamus.
Discussion
In the current study, we investigated the static and dynamiccharacteristics of resting-state CBF signals recorded using a PASLtechnique. Static CBF was significantly higher in the PCC, thalamus,insula/STG and MPFC than the whole brain average CBF value. Thedynamic measurement of CBF fluctuations showed that the PCC washighly synchronized with brain regions primarily in the DMN (Raichleet al., 2001). The dynamic CBF fluctuations of these four regions alsoshowed high local synchrony (ReHo) and fluctuation amplitude(ALFF).
Compared to PET and BOLD, ASL has the abilities to study both thestatic and dynamic CBF characteristics in a single session within thesame subjects. Static CBF measurements by ASL imaging have beenapplied in clinical settings, including cerebrovascular disease (Detre etal., 1998), brain tumors (Gaa et al., 1996), aging and neurodegenera-tive disorders (Johnson et al., 2005), and pediatric diseases (Strouse etal., 2006). Dynamic changes of CBF measured by ASL can be used tostudy resting-state brain function (Biswal et al., 1997; De Luca et al.,2006; Chuang et al., 2008; Wu et al., 2009a), similar to the more
low the images refer to the z coordinates (axial view) or x coordinates (sagittal view) inand thalamus (t=8.49) were significantly higher than the whole brain average (i.e., 1).

Fig. 3. A. Functional connectivity between the CBF changes in the PCC and other brain regions from the group of 12 subjects. The numbers below the images refer to the z coordinates(axial view) or x coordinates (sagittal view) in Talairach space. The green square indicates the location of the PCC seed. B. Normalized time courses retrieved from the PCC and MPFCfrom a representative su bject.
519Q. Zou et al. / NeuroImage 48 (2009) 515–524
commonly used BOLD techniques. In this study, ASL was used tosimultaneously assess the static and dynamic CBF properties in theDMN within the same subject group, which should reduce variationsbetween subject groups and between imaging modalities.
We employed high-pass filtering (Chuang et al., 2008) andindependent component analysis (ICA) denoising (Beckmann andSmith, 2004) to reduce potential BOLD contamination and physiolo-gical aliasing, respectively. Chuang et al. (2008) proposed a method tosuppress BOLD contributions using the aliased high-frequency rangeCBF signal. The feasibility of this method was demonstrated by theirstudies in the bilateral sensorimotor cortices. In the current study, weadopted this method to reduce the potential contamination fromBOLD in the CBF signals. The relatively low temporal resolution of ASLimaging makes it sensitive to physiological signals irrelevant to neuralfunctions. ICA is a fully data-driven method that is able to decomposethe resting-state fMRI signal into multiple spatially distributed signaland noise components. We used group ICA (Beckmann and Smith,2004) to suppress potential physiological noise from the CBF signalcaused by its low sampling rate. These processing steps are necessaryto ensure the successful utilization of ASL signal for resting-stateanalyses.
Static characteristics of CBF signals were studied in the currentstudy. Despite being widely used in research and clinical applica-tions, ASL has not been used, to our knowledge, in the assessment ofspatial distribution of static CBF when compared to the whole brainaverage. Using PASL, the current study demonstrated that static CBF
in the PCC, thalamus, insula/STG and MPFC were significantly higherthan the global average (Fig. 2). Our findings agree well with aprevious PET study. Using O15 PET, Raichle et al. (2001) found thatCBF in the PCC and MPFC was significantly higher than its globalmean in three groups of subjects. The consistency between the ASLmeasurements in our study and the previous PET measurementsindicates the potential to quantify static CBF without radiation expo-sure (Ye et al., 2000).
We also investigated the dynamic characteristics of CBF signalsfrom three different aspects: remote synchrony (functional connec-tivity), local synchrony (ReHo) and local activity amplitude (ALFF).Almost all the previous CBF-based resting-state studies used func-tional connectivity analyses (Biswal et al., 1997; De Luca et al., 2006;Chuang et al., 2008). Using the PCC as a seed, our correlation analysisdemonstrated that dynamic CBF changes of the PCC were significantlycorrelated with those of brain regions in the DMN, including theMPFC, inferior parietal lobe and insula/STG (Fig. 3). These resultswere similar to those seen in previous BOLD-based (Greicius et al.,2003; Fox et al., 2005) and perfusion-based (Wu et al., 2009a)connectivity studies. Some BOLD-based functional connectivitystudies (e.g. Fox et al., 2005) showed negative correlations betweenthe PCC and insula/STG. One explanation for this inconsistencycould be whether the global mean signals were regressed out(Murphy et al., 2009; Fox et al., 2009) before functional connectivityanalysis. In the current study, only the mean signals in the whitematter mask were used to regress out fluctuations unlikely to be
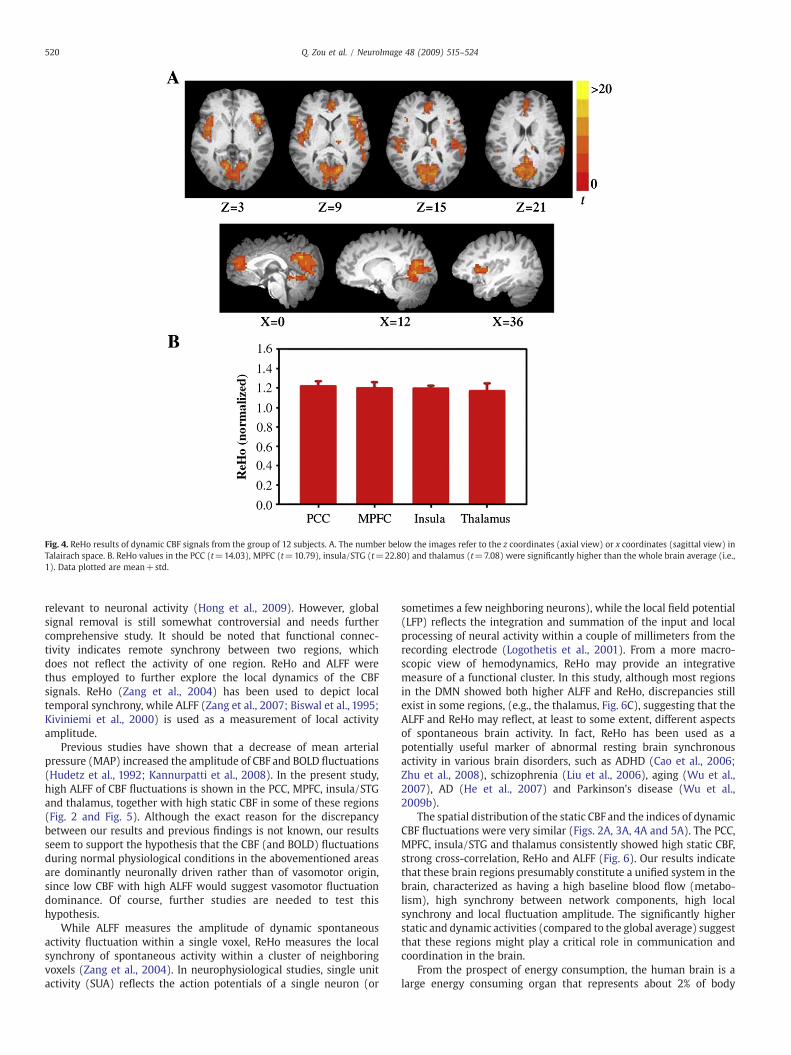
Fig. 4. ReHo results of dynamic CBF signals from the group of 12 subjects. A. The number below the images refer to the z coordinates (axial view) or x coordinates (sagittal view) inTalairach space. B. ReHo values in the PCC (t=14.03), MPFC (t=10.79), insula/STG (t=22.80) and thalamus (t=7.08) were significantly higher than the whole brain average (i.e.,1). Data plotted are mean+std.
520 Q. Zou et al. / NeuroImage 48 (2009) 515–524
relevant to neuronal activity (Hong et al., 2009). However, globalsignal removal is still somewhat controversial and needs furthercomprehensive study. It should be noted that functional connec-tivity indicates remote synchrony between two regions, whichdoes not reflect the activity of one region. ReHo and ALFF werethus employed to further explore the local dynamics of the CBFsignals. ReHo (Zang et al., 2004) has been used to depict localtemporal synchrony, while ALFF (Zang et al., 2007; Biswal et al., 1995;Kiviniemi et al., 2000) is used as a measurement of local activityamplitude.
Previous studies have shown that a decrease of mean arterialpressure (MAP) increased the amplitude of CBF and BOLD fluctuations(Hudetz et al., 1992; Kannurpatti et al., 2008). In the present study,high ALFF of CBF fluctuations is shown in the PCC, MPFC, insula/STGand thalamus, together with high static CBF in some of these regions(Fig. 2 and Fig. 5). Although the exact reason for the discrepancybetween our results and previous findings is not known, our resultsseem to support the hypothesis that the CBF (and BOLD) fluctuationsduring normal physiological conditions in the abovementioned areasare dominantly neuronally driven rather than of vasomotor origin,since low CBF with high ALFF would suggest vasomotor fluctuationdominance. Of course, further studies are needed to test thishypothesis.
While ALFF measures the amplitude of dynamic spontaneousactivity fluctuation within a single voxel, ReHo measures the localsynchrony of spontaneous activity within a cluster of neighboringvoxels (Zang et al., 2004). In neurophysiological studies, single unitactivity (SUA) reflects the action potentials of a single neuron (or
sometimes a few neighboring neurons), while the local field potential(LFP) reflects the integration and summation of the input and localprocessing of neural activity within a couple of millimeters from therecording electrode (Logothetis et al., 2001). From a more macro-scopic view of hemodynamics, ReHo may provide an integrativemeasure of a functional cluster. In this study, although most regionsin the DMN showed both higher ALFF and ReHo, discrepancies stillexist in some regions, (e.g., the thalamus, Fig. 6C), suggesting that theALFF and ReHo may reflect, at least to some extent, different aspectsof spontaneous brain activity. In fact, ReHo has been used as apotentially useful marker of abnormal resting brain synchronousactivity in various brain disorders, such as ADHD (Cao et al., 2006;Zhu et al., 2008), schizophrenia (Liu et al., 2006), aging (Wu et al.,2007), AD (He et al., 2007) and Parkinson's disease (Wu et al.,2009b).
The spatial distribution of the static CBF and the indices of dynamicCBF fluctuations were very similar (Figs. 2A, 3A, 4A and 5A). The PCC,MPFC, insula/STG and thalamus consistently showed high static CBF,strong cross-correlation, ReHo and ALFF (Fig. 6). Our results indicatethat these brain regions presumably constitute a unified system in thebrain, characterized as having a high baseline blood flow (metabo-lism), high synchrony between network components, high localsynchrony and local fluctuation amplitude. The significantly higherstatic and dynamic activities (compared to the global average) suggestthat these regions might play a critical role in communication andcoordination in the brain.
From the prospect of energy consumption, the human brain is alarge energy consuming organ that represents about 2% of body

Fig. 5. ALFF results of dynamic CBF signals from the group of 12 subjects. A. The number below the images refer to the z coordinates (axial view) or x coordinates (sagittal view) inTalairach space. B. ALFF values within the PCC (t=12.98), MPFC (t=9.08), insula/STG (t=11.43) and thalamus (t=11.09) were significantly higher than the whole brain average(i.e., 1). Data plotted are mean+std.
521Q. Zou et al. / NeuroImage 48 (2009) 515–524
weight, while accounting for 20% of the total body energyconsumption. Furthermore, much of the brain's energy consump-tion is not attributed to external stimuli but to intrinsic activity(Raichle, 2006). Thus, these highest energy consuming brainregions, i.e., the PCC, MPFC, insula/STG and thalamus, in thehighest energy consuming organ of the human body, appear to beessential components in maintaining and facilitating resting-statebrain functions. Based on network analysis of the resting-stateBOLD signal, the PCC, STG, thalamus and anterior cingulate havebeen demonstrated to act as functional core regions (Achard et al.,2006; van den Heuvel et al., 2008). Furthermore, using DTI-basedtractography, the PCC was demonstrated to be a hub region thatwidely connects with other regions (Gong et al., 2008). Usingdiffusion spectrum imaging, Hagmann et al. (2008) showed that thePCC and insula/STG constituted a structural core of large-scalestructural brain networks that share a high degree of anatomicalconnectivity. Similarly, the PCC and insula show critical and centralroles in anatomical networks estimated from diffusion-weightedMRI (Iturria-Medina et al., 2008). These structural connectivitystudies point to similar brain regions as revealed from resting-statefunctional connectivity studies. It would thus be reasonable topredict that any damage to these key regions, such as inAlzheimer's disease, might severely impact brain function (Greiciuset al., 2004).
It should be noted that a region with high static CBF might tendto have high ALFF, if the CBF fluctuation level is proportional tobaseline CBF. Our data show overlaps of high static CBF and ALFF insome regions of the PCC, MPFC, thalamus and insula/STG (Fig. 6A).However, a region with high baseline CBF doesn't always show high
fluctuation amplitude. For instance, the dorsal part of MPFC showshigh ALFF, but its static CBF is not significantly higher than theglobal average (Fig. 6A). On the other hand, the striatum illustrateshigh static CBF, while its ALFF does not (Fig. 6A). These data suggestthat the high ALFF in this study can not be attributed solely to highstatic CBF. Similarly, high static CBF might also give rise to high ReHodue to high SNR. Recently, Liau et al. (2008) demonstrated that theSNR of functional CBF response is proportional to its baseline CBF. Inthe present study, the high static CBF in the PCC, MPFC, thalamusand insula/STG might contribute to the high ReHo in these regions.However, regions with high static CBF, such as the striatum, may notnecessarily have high ReHo (Fig. 6B). Furthermore, regions with highReHo are not always accompanied by high static CBF, such as thedorsal part of the PCC (Fig. 6B). Since ReHo calculates cross-correlation between local voxels, the temporal synchronization ofthe time courses between these voxels is likely to dominate theReHo calculation, with SNR being a secondary factor. In addition, inBOLD-based resting-state studies, although the intensity of theBOLD signal in the DMN is lower than that in the CSF, ALFF andReHo of BOLD signals have been shown to be significantly higher inthe DMN than those in the CSF (Zang et al., 2007; Long et al., 2008;Zou et al., 2008). Together, these findings suggest that higher ALFFand ReHo in the DMN are not simply due to the high CBF baselineor SNR, but rather reflect the amplitude of local fluctuations andlocal synchrony.
It should also be noted that high-pass filtering followed bydemodulation may not remove multiplicative BOLD contaminationin the entire frequency band. The high-pass filtering on the CBF timecourses was to “minimize” the BOLD contamination by removing low-

Fig. 6. Spatial overlap of static and dynamic characteristics. The number below the images refer to the z coordinates (axial view) or x coordinates (sagittal view) in Talairach space.A. Overlap of static CBF and ALFF maps. Regions in yellow showed significance in both static CBF (in green) and ALFF (in red) maps. B. Overlap of static CBF and ReHo maps. Regionsin yellow showed significance in both static CBF (in green) and ReHo (in red) maps. C. Overlap of ALFF and ReHo maps. Regions in yellow showed significance in both ALFF (ingreen) and ReHo (in red) maps. D. Overlap of t maps of static CBF, PCC-based correlation, ALFF and ReHo. Regions in yellow, red and green indicate that these regions showedsigni ficant results in all four, three, and two of t maps, respectively.
522 Q. Zou et al. / NeuroImage 48 (2009) 515–524
frequency BOLD signals (b0.125 Hz), the main component of resting-state fluctuations. Recent studies showed that BOLD fluctuations inthe high-frequency band (N0.125 Hz) were low in the gray matter,while relatively high in the CSF andwhitematter (Zou et al., 2008; Zuoet al., 2009). In addition, the high-frequency BOLD fluctuations werenot correlated within specific functional networks (Chuang et al.,2008; Wu et al., 2008). The results in the present study showed morefluctuations in the gray matter than in the CSF and white matter andthe observed fluctuations were significantly correlated within thedefault mode network, suggesting that the low-frequency CBF-weighted fluctuations dominated in our observations. Quantitatively,the spectral power of BOLD signal from the PCC in the high-frequencyrange (0.125–0.25 Hz) was approximately 17% of that in the wholefrequency range (0–0.25 Hz) (Zou et al., 2008). Thus, the detected
functional connectivity, ReHo and ALFF in the present study weremainly from CBF-weighted signal, rather than multiplicative BOLDcontamination.
In summary, we investigated both the static and dynamiccharacteristics of resting human brain activity using a PASL technique.The relatively high temporal resolution of PASL makes it possible tosimultaneously assess the static and dynamic CBF properties by thesame imaging modality within the same subjects. Our data show thatstatic CBF was significantly higher in PCC, thalamus, insula/STG andMPFC than the global brain blood flow average, consistent withprevious PET observations. Dynamic analyses showed that these brainregions are highly correlated with the PCC, and possess high localsynchrony and high fluctuation amplitude. The spatial distributions ofthe static and dynamic indices are well correlated. Together, our

523Q. Zou et al. / NeuroImage 48 (2009) 515–524
results support the importance of these DMN brain regions inmaintaining and facilitating basic brain functions at rest. These resultsmay also suggest that any damage to these brain regions mightseverely impact normal brain functions.
Acknowledgments
This work was supported by the Intramural Research Program ofthe National Institute on Drug Abuse (NIDA), National Institute ofHealth (NIH). The authors thank Dr. Christian F. Beckmann forproviding dual regression method for ICA denoising, Dr. Xinian Zuofor preparing the vessel mask and suggestions for removing noiseusing ICA, and Dr. Thomas J. Ross and Dr. Yong He for helpfuldiscussions.
References
Achard, S., Salvador, R., Whitcher, B., Suckling, J., Bullmore, E., 2006. A resilient, low-frequency, small-world human brain functional network with highly connectedassociation cortical hubs. J. Neurosci. 26, 63–72.
Aguirre, G.K., Detre, J.A., Zarahn, E., Alsop, D.C., 2002. Experimental design and therelative sensitivity of BOLD and perfusion fMRI. NeuroImage 15, 488–500.
Beckmann, C.F., Smith, S.M., 2004. Probabilistic independent component analysis forfunctional magnetic resonance imaging. IEEE Trans. Med. Imag. 23, 137–152.
Beckmann, C.F., DeLuca, M., Devlin, J.T., Smith, S.M., 2005. Investigations into resting-state connectivity using independent component analysis. Philos. Trans. R. Soc. BBiol. Sci. 360, 1001–1013.
Beckmann, C.F., Mackay, C.E., Filippini, N., Smith, S.M., 2009. Group comparison ofresting-state FMRI data using multi-subject ICA and dual regression. 15th AnnualMeeting of Organization for Human Brain Mapping, poster 441 SU-AM.
Biswal, B., Yetkin, F.Z., Haughton, V.M., Hyde, J.S., 1995. Functional connectivity in themotor cortex of resting human brain using echo-planar MRI. Magn. Reson. Med. 34,537–541.
Biswal, B.B., Van Kylen, J., Hyde, J.S., 1997. Simultaneous assessment of flow and BOLDsignals in resting-state functional connectivity maps. NMR Biomed. 10, 165–170.
Bluhm, R.L., Miller, J., Lanius, R.A., Osuch, E.A., Boksman, K., Neufeld, R.W., Theberge, J.,Schaefer, B., Williamson, P., 2007. Spontaneous low-frequency fluctuations in theBOLD signal in schizophrenic patients: anomalies in the default network. Schizophr.Bull. 33, 1004–1012.
Cao, Q., Zang, Y., Sun, L., Sui, M., Long, X., Zou, Q., Wang, Y., 2006. Abnormal neuralactivity in children with attention deficit hyperactivity disorder: a resting-statefunctional magnetic resonance imaging study. NeuroReport 17, 1033–1036.
Chuang, K.H., van Gelderen, P., Merkle, H., Bodurka, J., Ikonomidou, V.N., Koretsky, A.P.,Duyn, J.H., Talagala, S.L., 2008. Mapping resting-state functional connectivity usingperfusion MRI. NeuroImage 40, 1595–1605.
Cox, R.W., 1996. AFNI: software for analysis and visualization of functional magneticresonance neuroimages. Comput. Biomed. Res. 29, 162–173.
De Luca, M., Beckmann, C.F., De Stefano, N., Matthews, P.M., Smith, S.M., 2006. fMRIresting state networks define distinct modes of long-distance interactions in thehuman brain. NeuroImage 29, 1359–1367.
Detre, J.A., Leigh, J.S., Williams, D.S., Koretsky, A.P., 1992. Perfusion imaging. Magn.Reson. Med. 23, 37–45.
Detre, J.A., Alsop, D.C., Vives, L.R., Maccotta, L., Teener, J.W., Raps, E.C.,1998. NoninvasiveMRIevaluation of cerebral blood flow in cerebrovascular disease. Neurology 50, 633–641.
Fox, M.D., Raichle, M.E., 2007. Spontaneous fluctuations in brain activity observed withfunctional magnetic resonance imaging. Nat. Rev., Neurosci. 8, 700–711.
Fox, M.D., Snyder, A.Z., Vincent, J.L., Corbetta, M., Van Essen, D.C., Raichle, M.E., 2005.The human brain is intrinsically organized into dynamic, anticorrelated functionalnetworks. Proc. Natl. Acad. Sci. U. S. A. 102, 9673–9678.
Fox, M.D., Corbetta, M., Snyder, A.Z., Vincent, J.L., Raichle, M.E., 2006. Spontaneousneuronal activity distinguishes human dorsal and ventral attention systems. Proc.Natl. Acad. Sci. U. S. A. 103, 10046–10051.
Fox, M.D., Zhang, D., Snyder, A.Z., Raichle, M.E., 2009. The global signal and observedanticorrelated resting state brain networks. J. Neurophysiol. 101, 3270–3283.
Fransson, P., 2005. Spontaneous low-frequency BOLD signal fluctuations: an fMRIinvestigation of the resting-state default mode of brain function hypothesis. Hum.Brain Mapp. 26, 15–29.
Gaa, J., Warach, S., Wen, P., Thangaraj, V., Wielopolski, P., Edelman, R.R., 1996.Noninvasive perfusion imaging of human brain tumors with EPISTAR. Eur. Radiol.6, 518–522.
Gong, G., He, Y., Concha, L., Lebel, C., Gross, D.W., Evans, A.C., Beaulieu, C., 2008. Mappinganatomical connectivity patterns of human cerebral cortex using in vivo diffusiontensor imaging tractography. Cereb. Cortex 19, 524–536.
Greicius, M., 2008. Resting-state functional connectivity in neuropsychiatric disorders.Curr. Opin. Neurol. 21, 424–430.
Greicius, M.D., Krasnow, B., Reiss, A.L., Menon, V., 2003. Functional connectivity in theresting brain: a network analysis of the default mode hypothesis. Proc. Natl. Acad.Sci. U. S. A. 100, 253–258.
Greicius, M.D., Srivastava, G., Reiss, A.L., Menon, V., 2004. Default-mode networkactivity distinguishes Alzheimer's disease from healthy aging: evidence fromfunctional MRI. Proc. Natl. Acad. Sci. U. S. A. 101, 4637–4642.
Hagmann, P., Cammoun, L., Gigandet, X., Meuli, R., Honey, C.J., Wedeen, V.J., Sporns, O.,2008. Mapping the structural core of human cerebral cortex. PLoS Biol. 6, e159.
He, Y., Wang, L., Zang, Y., Tian, L., Zhang, X., Li, K., Jiang, T., 2007. Regional coherencechanges in the early stages of Alzheimer's disease: a combined structural andresting-state functional MRI study. NeuroImage 35, 488–500.
Hong, L.E., Gu, H., Yang, Y., Ross, T.J., Salmeron, B.J., Buchholz, B., Thaker, G.K., Stein, E.A.,2009. Association of nicotine addiction and nicotine's actions with separatecingulate cortex functional circuits. Arch. Gen. Psychiatry 66, 431–441.
Hudetz, A.G., Roman, R.J., Harder, D.R., 1992. Spontaneous flow oscillations in thecerebral cortex during acute changes in mean arterial pressure. J. Cereb. Blood FlowMetab. 12, 491–499.
Iturria-Medina, Y., Sotero, R.C., Canales-Rodriguez, E.J., Aleman-Gomez, Y., Melie-Garcia,L., 2008. Studying the human brain anatomical network via diffusion-weighted MRIand graph theory. NeuroImage 40, 1064–1076.
Johnson, N.A., Jahng, G.H., Weiner, M.W., Miller, B.L., Chui, H.C., Jagust, W.J., Gorno-Tempini, M.L., Schuff, N., 2005. Pattern of cerebral hypoperfusion in Alzheimerdisease and mild cognitive impairment measured with arterial spin-labeling MRimaging: initial experience. Radiology 234, 851–859.
Kannurpatti, S.S., Biswal, B.B., Kim, Y.R., Rosen, B.R., 2008. Spatio-temporal character-istics of low-frequency BOLD signal fluctuations in isoflurane-anesthetized ratbrain. Neuroimage 40, 1738–1747.
Kendall, M., Gibbons, J.D., 1990. Rank Correlation Methods. Oxford Univ. Press, Oxford.Kiviniemi, V., Jauhiainen, J., Tervonen, O., Paakko, E., Oikarinen, J., Vainionpaa, V.,
Rantala, H., Biswal, B., 2000. Slow vasomotor fluctuation in fMRI of anesthetizedchild brain. Magn. Reson. Med. 44, 373–378.
Liau, J., Perthen, J.E., Liu, T.T., 2008. Caffeine reduces the activation extent and contrast-to-noise ratio of the functional cerebral blood flow response but not the BOLDresponse. NeuroImage 42, 296–305.
Liu, T.T., Wong, E.C., 2005. A signal processing model for arterial spin labeling functionalMRI. NeuroImage 24, 207–215.
Liu, H., Liu, Z., Liang, M., Hao, Y., Tan, L., Kuang, F., Yi, Y., Xu, L., Jiang, T., 2006. Decreasedregional homogeneity in schizophrenia: a resting state functional magneticresonance imaging study. NeuroReport 17, 19–22.
Logothetis, N.K., Pauls, J., Augath, M., Trinath, T., Oeltermann, A., 2001. Neurophysio-logical investigation of the basis of the fMRI signal. Nature 412, 150–157.
Long, X.Y., Zuo, X.N., Kiviniemi, V., Yang, Y., Zou, Q.H., Zhu, C.Z., Jiang, T.Z., Yang, H., Gong,Q.Y., Wang, L., Li, K.C., Xie, S., Zang, Y.F., 2008. Default mode network as revealedwith multiple methods for resting-state functional MRI analysis. J. Neurosci.Methods 171, 349–355.
Mazoyer, B., Zago, L., Mellet, E., Bricogne, S., Etard, O., Houde, O., Crivello, F., Joliot, M.,Petit, L., Tzourio-Mazoyer, N., 2001. Cortical networks for working memory andexecutive functions sustain the conscious resting state in man. Brain Res. Bull. 54,287–298.
Murphy, K., Birn, R.M., Handwerker, D.A., Jones, T.B., Bandettini, P.A., 2009. The impact ofglobal signal regression on resting state correlations: are anti-correlated networksintroduced? NeuroImage 44, 893–905.
Poline, J.B., Worsley, K.J., Evans, A.C., Friston, K.J., 1997. Combining spatial extent andpeak intensity to test for activations in functional imaging. NeuroImage 5,83–96.
Raichle, M.E., 2006. Neuroscience. The brain's dark energy. Science 314, 1249–1250.Raichle, M.E., MacLeod, A.M., Snyder, A.Z., Powers, W.J., Gusnard, D.A., Shulman, G.L.,
2001. A default mode of brain function. Proc. Natl. Acad. Sci. U. S. A. 98,676–682.
Shulman, G.L., Fiez, J.A., Corbetta, M., Buckner, R.L., Miezin, F.M., Raichle, M.E., Petersen,S.E., 1997. Common blood flow changes across visual tasks. 2. Decreases in cerebralcortex. J. Cogn. Neurosci. 9, 648–663.
Stevens, M.C., Pearlson, G.D., Calhoun, V.D., 2009. Changes in the interaction of resting-state neural networks from adolescence to adulthood. Hum. Brain Mapp. 30,2356–2366.
Strouse, J.J., Cox, C.S., Melhem, E.R., Lu, H., Kraut, M.A., Razumovsky, A., Yohay, K., vanZijl, P.C., Casella, J.F., 2006. Inverse correlation between cerebral blood flowmeasured by continuous arterial spin-labeling (CASL) MRI and neurocognitivefunction in children with sickle cell anemia (SCA). Blood 108, 379–381.
van den Heuvel, M.P., Stam, C.J., Boersma, M., Hulshoff Pol, H.E., 2008. Small-world andscale-free organization of voxel-based resting-state functional connectivity in thehuman brain. NeuroImage 43, 528–539.
Wong, E.C., Buxton, R.B., Frank, L.R., 1998. Quantitative imaging of perfusion using asingle subtraction (QUIPSS and QUIPSS II). Magn. Reson. Med. 39, 702–708.
Wu, T., Zang, Y., Wang, L., Long, X., Li, K., Chan, P., 2007. Normal aging decreasesregional homogeneity of the motor areas in the resting state. Neurosci. Lett. 423,189–193.
Wu, C.W., Gu, H., Lu, H., Stein, E.A., Chen, J.H., Yang, Y., 2008. Frequency specificity offunctional connectivity in brain networks. NeuroImage 42, 1047–1055.
Wu, C.W., Gu, H., Lu, H., Stein, E.A., Chen, J.H., Yang, Y., 2009a. Mapping functionalconnectivity based on synchronized CMRO2 fluctuations during the resting state.NeuroImage 45, 694–701.
Wu, T., Long, X., Zang, Y., Wang, L., Hallett, M., Li, K., Chan, P., 2009b. Regionalhomogeneity changes in patients with Parkinson's disease. Hum. Brain Mapp. 30,1502–1510.
Yang, Y., Glover, G.H., van Gelderen, P., Patel, A.C., Mattay, V.S., Frank, J.A., Duyn, J.H.,1998. A comparison of fast MR scan techniques for cerebral activation studies at1.5 Tesla. Magn. Reson. Med. 39, 61–67.
Ye, F.Q., Berman, K.F., Ellmore, T., Esposito, G., van Horn, J.D., Yang, Y., Duyn, J., Smith,A.M., Frank, J.A., Weinberger, D.R., McLaughlin, A.C., 2000. H(2)(15)O PETvalidation of steady-state arterial spin tagging cerebral blood flow measurementsin humans. Magn. Reson. Med. 44, 450–456.

524 Q. Zou et al. / NeuroImage 48 (2009) 515–524
Zang, Y., Jiang, T., Lu, Y., He, Y., Tian, L., 2004. Regional homogeneity approach to fMRIdata analysis. NeuroImage 22, 394–400.
Zang, Y.F., He, Y., Zhu, C.Z., Cao, Q.J., Sui, M.Q., Liang, M., Tian, L.X., Jiang, T.Z., Wang, Y.F.,2007. Altered baseline brain activity in children with ADHD revealed by resting-state functional MRI. Brain Dev. 29, 83–91.
Zhu, C.Z., Zang, Y.F., Cao, Q.J., Yan, C.G., He, Y., Jiang, T.Z., Sui, M.Q., Wang, Y.F., 2008.Fisher discriminative analysis of resting-state brain function for attention-deficit/hyperactivity disorder. NeuroImage 40, 110–120.
Zou, Q.H., Zhu, C.Z., Yang, Y., Zuo, X.N., Long, X.Y., Cao, Q.J., Wang, Y.F., Zang, Y.F.,2008. An improved approach to detection of amplitude of low-frequencyfluctuation (ALFF) for resting-state fMRI: fractional ALFF. J. Neurosci.Methods 172, 137–141.
Zuo, X., Di Martino, A., Kelly, C., Shezhad, Z.E., Gee, D., Klein, D.F., Castellanos, F.X.,Biswal, B.B., Milham, M.P., 2009. Establishing the Reliability of Amplitude Measuresfor Spontaneous Fluctuations in the Resting Brain. 15th Annual Meeting ofOrganization for Human Brain Mapping, poster 548 F-PM.
Copyright © 2022 FDOKUMEN