AN INVESTIGATION INTO HOW BUSINESS EXCELLENCE ...
382
AN INVESTIGATION INTO HOW BUSINESS EXCELLENCE CAN CONTRIBUTE TO SUSTAINED ORGANIZATIONAL PERFORMANCE IN BOTH PRIVATE AND PUBLIC SECTOR ORGANIZATIONS A thesis submitted in partial fulfilment for the award of Doctor of Business Administration By Steve Tanner Henley Management College/ Brunel University January 2005
-
Upload
khangminh22 -
Category
Documents
-
view
3 -
download
0
Transcript of AN INVESTIGATION INTO HOW BUSINESS EXCELLENCE ...

AN INVESTIGATION INTO HOW BUSINESS EXCELLENCE CAN CONTRIBUTE TO
SUSTAINED ORGANIZATIONAL PERFORMANCE IN BOTH PRIVATE AND PUBLIC
SECTOR ORGANIZATIONS
A thesis submitted in partial fulfilment for the award of Doctor of Business Administration
By
Steve Tanner
Henley Management College/ Brunel University
January 2005

2
Dedication
To those that have inspired me over the last three years.

3
Abstract Business Excellence, or Total Quality Management as it is also known, is a philosophy
that may be traced back to the 1950's when Deming and Juran showed the way to the
Japanese at the end of the second world war (Oakland (2003a)). Some of the principles
may even be traced back to the Egyptians (Tanner and Walker (2002)). Despite this,
Business Excellence theory is it an early stage of development (Dale, Wu et al. (2001)).
For over a decade, organizations have pursued the benefits of adopting a Business
Excellence approach and have sought external recognition through the achievement of
regional, national and even continent Quality Awards (Porter and Tanner (2003)). One
day soon, there could even be a 'World Quality Award'.
The research set out with two clear aims. Firstly, there was an objective to add to the
growing body of knowledge supporting the benefits of the adoption of Business
Excellence. Secondly, there was a desire to provide an insight into why Business
Excellence delivers such benefits. The thesis makes a contribution in both these areas.
The research was also novel in that both private and public organizations were included
in the study, and it represents one of the few studies to examine public sector
organizations at a time when the UK government is investing heavily in Business
Excellence as a way to improve public services (PriceWaterhouseCoopers (2000)). The
work also partially replicated the research of two other authors, Hall (Hall (1991); Hall
(1992); Hall (1994)) and Lindgren (2001), and not only provides support for their findings,
but also support for the current work.
The research examined how Business Excellence could lead to a source of competitive
advantage (or source of organizational advantage, as it was termed, as the sample
included both public and private organizations). Use was made of the resource-based
view of the firm as a basis for the theory underpinning the research ((Tena, Llusar et al.
(2001)) taking a scientific Structure - Conduct – Performance perspective (Barney
(1991a)). The literature review identified an initial research model that had the constructs
of Organizational Context, Environmental Dynamics, Leadership Excellence and
Strategic Capability as independent variables, and Performance across a number of
Stakeholder groups as the dependent variable. A positivist approach was taken to collect
data using a self-reporting postal questionnaire from 193 organizations. Use was made
of existing instruments following Churchill‟s 9-step process (Churchill and Iacobucci
(2002)), with some instruments being converted for use in the public sector. Although
primarily a positivist approach, the research also made use of social construction
techniques in the design of the questionnaire and to validate the findings (Jick (1979);
Easterby-Smith, Thorpe et al. (2002)).

4
The first area examined was the benefits of Business Excellence. A comprehensive
review of the literature concluded there was a strong case for its use, although the
majority of work had been conducted on the American Malcolm Baldrige National Quality
Award (MBNQA) framework and not on the more local EFQM Excellence Model®
framework. A number of hypotheses were developed, covering areas such as the
difference in benefit reported between small and large organizations, and whether whole
organizations demonstrated more benefit than business units. There was also an interest
in whether there was a difference in the benefits achieved between public sector and
private sector organizations.
The two most frequently used methodologies for studying Business Excellence benefits
was found to be share price event studies and surveys, with the latter being used in the
current work. A Leadership Excellence instrument was used to operationalize Business
Excellence following a review of the critical success factors of Business Excellence. The
results indicated that Business Excellence had a positive relationship with overall
performance, as well as with individual performance indicators representing different
stakeholder groups. Business Excellence had a positive relationship with key
performance outcomes representing the organization, employee satisfaction representing
the employees, and customer satisfaction representing the customers. These
relationships were found for both private and public sector organizations. Societal
satisfaction, the fourth results area representing society as a stakeholder, did not appear
to be correlated with the Business Excellence approach.
Despite an acceptance that leadership is a driver of organisational performance, there is
very little empirical evidence to support this generalization (Bolden (2004); Burgoyne,
Hirsh et al. (2004)). Although not part of the original scope of the research, as a
leadership instrument has been used to operationalize Business Excellence, the research
contributes to the leadership body of knowledge, providing such empirical evidence of a
positive relationship.
The second area considered was the sources of competitive advantage, or sources of
organizational advantage, as the sample included both public and private organizations.
Partially replicating the work of Hall, employee-know how was found to be a main source
of advantage in public sector organizations, with employee know-how and reputation
being important in private sector organizations. The time to develop the advantage was
measured in terms of „Replacement periods‟, and this was found to be in the order of 2 to
3 years in most cases, with reputation having a slightly higher replacement period.

5
The third area examined the relationship between the ease with which organizations
respond to change, termed „Strategic Capability‟ in this study, and the performance
achieved. The result provided support for the concept of dynamic capabilities (Teece,
Pisano et al. (1997); Eisenhardt and Martin (2000); Zott (2003)). It was concluded that
Business Excellence and the ability of an organization to react to change exhibited a
relationship supporting the „mental buffer‟ theory of Savolainen (2000a). The dynamics of
the external environment was also considered to see if this affected the relationships
based on the theory of Eisenhardt and Martin (2000), but no such relationship could be
found. This lack of a relationship was attributed to either measurement and/ or sampling
issues.
The fourth area and final examined sought to establish a relationship between Business
Excellence, strategic capability and performance. Prahalad (2000) argued the most
important challenge facing managers in the 21st century was the challenge to manage
change in fast-moving environments. The current work developed a framework to aid the
understanding of dynamic capabilities and this framework represents a contribution to
theory. It is hoped the framework will be of value to both practitioners and researchers as
this exciting area of strategy is taken forward.

6
Contents
Abstract ............................................................................................................................... 3
Acknowledgements ........................................................................................................... 13
1 Introduction ............................................................................................................... 15
1.1 Introduction to Business Excellence ................................................................ 16
1.2 The EFQM Excellence Model® ........................................................................ 19
1.3 Research supporting the models‟ structures ................................................... 21
1.4 TQM and research ........................................................................................... 22
1.5 Research focus ................................................................................................ 25
2 Literature review ....................................................................................................... 28
2.1 Business Excellence: Benefits and critical success factors ............................ 29
2.1.1 The benefits of Business Excellence ...................................................... 29
2.1.2 What are the Critical Success Factors of Business Excellence? ........... 48
2.2 Leadership and Business Excellence .............................................................. 59
2.2.1 Leadership from a Business Excellence perspective ............................. 60
2.2.2 Implications of leadership for the current research ................................. 72
2.3 Business Excellence and the resource-based view of the firm ....................... 73
2.3.1 The RBV as a theory for Business Excellence ....................................... 73
2.3.2 Background to the resource-based view of the firm ............................... 74
2.3.3 Distinctive competencies, skills, core competencies and capabilities .... 88
2.3.4 Building strategic capability ................................................................... 102
2.3.5 Dynamic capabilities ............................................................................. 116
2.3.6 Implications from the resource-based view for the current research .... 126
2.4 Research model and hypotheses .................................................................. 129
2.4.1 Research question and model .............................................................. 129
2.4.2 Construct definitions.............................................................................. 134
2.4.3 Hypotheses ........................................................................................... 137
2.5 Chapter summary .......................................................................................... 138
3 Methodology Chapter ............................................................................................. 139
3.1 Research philosophy ..................................................................................... 139
3.2 Approach to measures development ............................................................. 142
3.3 Use of qualitative techniques ......................................................................... 145
3.4 Research design ............................................................................................ 146
3.5 Questionnaire design ..................................................................................... 150
3.5.1 Step 1: Specify what information will be sought ................................... 152
3.5.2 Step 2:Type of questionnaire and method of administration ................ 152
3.5.3 Step 3: Determine content of individual questions ................................ 152
3.5.4 Step 4: Determine form of response of each question ......................... 171
3.5.5 Step 5: Determine wording of each question ........................................ 173
3.5.6 Step 6: Determine sequence of questions ............................................ 177
3.5.7 Step 7: Determine physical characteristics of the questionnaire .......... 177
3.5.8 Step 8: Revisit previous steps ............................................................... 182
3.5.9 Step 9: Pre-test questionnaire .............................................................. 186
3.5.10 Summary of questionnaire design ........................................................ 187
3.6 Sample selection ........................................................................................... 187
3.6.1 Unit and level of analysis ...................................................................... 187
3.6.2 Sampling approach ............................................................................... 188

7
3.6.3 Sources of potential respondents ......................................................... 189
3.6.4 Summary of selected sample ................................................................ 191
3.7 Data collection approach ............................................................................... 192
3.8 Data analysis plan ......................................................................................... 196
3.9 Chapter summary .......................................................................................... 199
4 Results and analysis............................................................................................... 203
4.1 Examining the data ........................................................................................ 203
4.1.1 Sample statistics ................................................................................... 203
4.1.2 Testing the means................................................................................. 205
4.1.3 Treatment of missing data .................................................................... 206
4.1.4 Graphical examination of the data ........................................................ 207
4.1.5 Summary of interval data examination.................................................. 207
4.2 Purify the instruments .................................................................................... 208
4.2.1 Outline of approach taken ..................................................................... 208
4.2.2 Part 1- Environment Dynamics ............................................................. 209
4.2.3 Part 2 – Strategic Capability ................................................................. 211
4.2.4 Part 4 – Performance ............................................................................ 213
4.2.5 Part 5 – Leadership excellence ............................................................. 219
4.2.6 Multicollinearity ...................................................................................... 220
4.2.7 Cluster analysis ..................................................................................... 220
4.2.8 Test of means on final variates ............................................................. 221
4.2.9 Summary ............................................................................................... 230
4.3 Estimate the models and interpret the results ............................................... 231
4.3.1 Leadership Excellence and Performance ............................................. 231
4.3.2 Strategic Capability and Performance .................................................. 237
4.3.3 Leadership Excellence and Strategic Capability ................................... 238
4.3.4 Strategic Capability is developed over time .......................................... 241
4.3.5 Leadership Excellence developing Strategic Capability ....................... 250
4.4 Validate the models ....................................................................................... 255
4.5 Chapter summary .......................................................................................... 257
5 Discussion .............................................................................................................. 258
5.1 Summary of findings by hypothesis ............................................................... 259
5.2 The benefit of Business Excellence ............................................................... 263
5.2.1 Support for the benefit of Business Excellence .................................... 263
5.2.2 Business Excellence in the public sector .............................................. 267
5.2.3 Business Excellence and whole organizations vs. business units ....... 267
5.2.4 Business Excellence and organization size .......................................... 268
5.2.5 Appropriation of benefit to all stakeholders ........................................... 268
5.2.6 The effect of an organization‟s environment ......................................... 270
5.3 Sources of organizational advantage ............................................................ 270
5.3.1 Classification of sources of organizational advantage .......................... 271
5.4 Do dynamic capabilities exist?....................................................................... 278
5.5 Contribution to dynamic capability theory ...................................................... 279
5.6 Chapter summary .......................................................................................... 290

8
6 Conclusions ............................................................................................................ 292
6.1 Academic implications of the research .......................................................... 292
6.1.1 Contributions of the research ................................................................ 292
6.1.2 Potential publication themes ................................................................. 305
6.1.3 Limitations of the research .................................................................... 305
6.1.4 Future research ..................................................................................... 309
6.2 Practical aspects of the work ......................................................................... 311
6.2.1 Practical implications for organizations ................................................. 311
6.2.2 Role of the researcher .......................................................................... 313
6.2.3 Management by research results .......................................................... 315
6.3 The learning process ..................................................................................... 319
6.4 Final words..................................................................................................... 320
7 References ............................................................................................................. 321
8 Appendix 1: Abbreviations ...................................................................................... 361
9 Appendix 2: Original instruments from the literature .............................................. 362
9.1 Appendix 2.1: Competitive environment/turbulence instrument .................... 362
9.2 Appendix 2.2: Kanji‟s Leadership Excellence instrument .............................. 363
9.3 Appendix 2.3: List of assets and capabilities ................................................. 364
9.4 Appendix 2.4: Strategic response capability instrument ................................ 365
9.5 Appendix 2.5: The performance scale ........................................................... 366
10 Appendix 3: Feedback on draft questionnaire ................................................... 368
10.1 Appendix 3.1: Practioners‟ focus group feedback summary ......................... 368
10.2 Appendix 3.2: Private and public sector focus group feedback summary ..... 369
11 Appendix 4: The final questionnaire ................................................................... 370
12 Appendix 5: Analysis of outliers by item ............................................................ 371
13 Appendix 6: Cluster analysis of variates by category ........................................ 373
14 Appendix 7: Initial SEM model ........................................................................... 374
15 Appendix 8: Feedback from focus groups on interpretation .............................. 375

9
Figures and Tables Figure 1-1: The EFQM Excellence Model® ...................................................................... 20
Figure 2-1: Leadership Excellence Index structural equation model ................................ 63
Figure 2-2: Savolainen's 'Mental Buffer'............................................................................ 68
Figure 2-3: Strategic resource model linking leadership with assets and SCA ................ 69
Figure 2-4: The relationship between resource heterogeneity and immobility, rareness,
imperfect imitability and substitutability, and sustained competitive advantage ...... 79
Figure 2-5: Model for the relationship between Business Excellence and performance .. 90
Figure 2-6: Three dimensions of competence .................................................................. 98
Figure 2-7: RBV typology ................................................................................................ 101
Figure 2-8: A resource-based approach to strategy analysis: A practical framework .... 102
Figure 2-9: Intangible resources, capability differentials and sustainable competitive
advantage ............................................................................................................... 106
Figure 2-10: Classification system .................................................................................. 111
Figure 2-11: Strategic industry factors, resources & capabilities, and strategic assets . 115
Figure 2-12: Model overview ........................................................................................... 124
Figure 2-13: Emerging consensus regarding dynamic capabilities and the link to
performance ........................................................................................................... 125
Figure 2-14: Initial research model ................................................................................. 131
Figure 3-1: A view of research ........................................................................................ 143
Figure 3-2: Research methodology followed .................................................................. 146
Figure 3-3: Churchill‟s questionnaire design steps ......................................................... 151
Figure 3-4: Stages of refinement of dual items to final questionnaire ............................ 181
Figure 3-5: Questionnaire review cycles ......................................................................... 183
Figure 3-6: Wisconsin focus group members in a moment of relaxation ........................ 185
Figure 3-7: Main steps in the data collection stage ........................................................ 193
Figure 4-1: Data analysis approach steps 3 to 6 ............................................................ 203
Figure 4-2: Breakdown of respondents by industry type ................................................ 205
Figure 4-3: Contributors to SOA shown as % respondent (All cases) ............................ 244
Figure 4-4: Contributors to SOA shown as % respondent (Public sector) ...................... 245
Figure 4-5: Contributors to SOA shown as % respondent (Private sector) .................... 246
Figure 4-6: Basic path under investigation ...................................................................... 251
Figure 4-7: Final model with regression weights............................................................. 254
Figure 5-1: The link between dynamic capabilities, resources and capabilities, and
performance ........................................................................................................... 258
Figure 5-2: May's intangibles framework ........................................................................ 274
Figure 5-3: Construction of a theory ............................................................................... 280
Figure 5-4: A dynamic capabilities classification framework ........................................... 282

10
Table 1-1: The eight fundamental concepts...................................................................... 19
Table 2-1: Evidence for benefits of Business Excellence ................................................. 32
Table 2-2: Comparison of models derived from the literature ........................................... 49
Table 2-3: Critical success factors from empirical work .................................................... 52
Table 2-4: The common themes from the Business Excellence frameworks ................... 54
Table 2-5: Analysis of critical success factors .................................................................. 57
Table 2-6: Potential factors to measure Business Excellence .......................................... 58
Table 2-7: Strategic leadership practices .......................................................................... 59
Table 2-8: Core competencies of leadership in quality-orientated organizations ............. 61
Table 2-9: Change management competencies ............................................................... 71
Table 2-10: Strengths and weaknesses of the theoretical perspectives of the RBV ........ 75
Table 2-11: Main themes identified from the resource-based view literature ................... 76
Table 2-12: Sample definitions of and relationships among underlying RBV constructs . 80
Table 2-13: Parameterizing Barney‟s resource-based theory components ...................... 83
Table 2-14: Inapplicability arguments and counter-arguments ......................................... 85
Table 2-15: Comparison of the RBV and PBV from a strategic perspective .................... 87
Table 2-16: Top managers‟ rankings of distinctive competences, by strategy & industry 89
Table 2-17: Distinctive competencies ............................................................................... 92
Table 2-18: Sustainable competitive advantage of 248 organizations ............................. 94
Table 2-19: Typology of competences .............................................................................. 99
Table 2-20: Determinants of sustainable competitive advantage ................................... 103
Table 2-21: The relative importance of the contribution each intangible resource made to
the overall success of the business in 1990 ........................................................... 105
Table 2-22: Relative importance of intangible resources in 1987 and 1990 ................... 107
Table 2-23: Replacement periods ................................................................................... 108
Table 2-24: Other views on the sources of advantage ................................................... 109
Table 2-25 General characteristics of strategic industry factors (SIF) ............................ 114
Table 2-26: The VIRO Framework .................................................................................. 116
Table 2-27: Dynamic capabilities and types of dynamic markets ................................... 119
Table 2-28: Features of dynamic communities ............................................................... 121
Table 2-29: Definitions of dynamic capabilities ............................................................... 123
Table 2-30: Comparing the EFQM Excellence Model® with RBV literature ................... 127
Table 2-31: Construct definitions .................................................................................... 135
Table 3-1: Contrasting implications of positivism and social constructionism ................ 141
Table 3-2: Types of validity and reliability ....................................................................... 144
Table 3-3: Types of group interviews and dimensions ................................................... 146
Table 3-4: Research design criteria ................................................................................ 148
Table 3-5: Methods of considering environmental dynamics .......................................... 155
Table 3-6: Potential leadership instruments .................................................................... 157

11
Table 3-7: Support for the content of the Leadership Excellence instrument ................. 159
Table 3-8: Potential assets and capabilities from the literature ...................................... 162
Table 3-9: Analysis of assets and capabilities ................................................................ 164
Table 3-10: Potential instruments to measure performance ........................................... 169
Table 3-11: Base instruments for each construct ........................................................... 171
Table 3-12: Summary of main changes by construct ..................................................... 174
Table 3-13: Questionnaire instruction page considerations ............................................ 179
Table 3-14: Considerations for one or two questionnaire version options ...................... 180
Table 3-15: Initial alphas recorded .................................................................................. 186
Table 3-16: Initial correlations for three of the constructs (N=54) ................................... 186
Table 3-17: Sample sizes by source and respective responses..................................... 191
Table 3-18: Requirements of SEM reporting .................................................................. 198
Table 3-19: Multivariate techniques to test hypotheses .................................................. 200
Table 4-1: Breakdown of responses by category............................................................ 204
Table 4-2: Descriptive statistics for log (P) and Log (T) .................................................. 204
Table 4-3: Skewness and kurtosis statistics by part ....................................................... 207
Table 4-4: Environment variate reliability and descriptive statistics................................ 211
Table 4-5: Strategic Capability factors from EFA ............................................................ 212
Table 4-6: Strategic Capability factors reliability and descriptive statistics ..................... 213
Table 4-7: Reliability statistics for the stakeholder groups .............................................. 214
Table 4-8: Performance factors from EFA ...................................................................... 215
Table 4-9: Performance reliability and descriptive statistics ........................................... 217
Table 4-10: Performance factors from secondary EFA .................................................. 218
Table 4-11: Secondary performance factors reliability and descriptive statistics ........... 218
Table 4-12: Reliability statistics for Kanji‟s leadership instrument .................................. 219
Table 4-13: Correlation matrix of the independent variates ............................................ 220
Table 4-14: Test of means on final variables – Sector and Organization ....................... 221
Table 4-15: Independent samples test Private Vs Public sector .................................... 222
Table 4-16: Independent samples test Whole Organization Vs Business Unit .............. 223
Table 4-17: Test of means on final variables – Leadership level.................................... 224
Table 4-18: ANOVA results for final variates - Leadership levels ................................... 225
Table 4-19: Post hoc ANOVA results on leadership levels (Multiple comparisons) ....... 226
Table 4-20: Regression of Leadership Excellence and Performance ............................ 232
Table 4-21: Difference between the results for public and private organizations ........... 233
Table 4-22: Effect of whole business vs. business unit on the Leadership Excellence and
Performance relationship ....................................................................................... 234
Table 4-23: Effect of organization size on the Leadership Excellence and Performance
relationship ............................................................................................................. 234
Table 4-24: Relationship between Leadership Excellence and different stakeholder
Performance measures .......................................................................................... 235

12
Table 4-25: Effect of Environment Dynamics on the Leadership Excellence and
Performance relationship ....................................................................................... 236
Table 4-26: Examining the relationship Between Capability and Performance .............. 238
Table 4-27: Examining the relationship between Leadership Excellence and Strategic
Capability ................................................................................................................ 239
Table 4-28: Relationship between Strategic Capability and the eight stakeholder
Performance factors ............................................................................................... 240
Table 4-29: Standardized betas for Strategic Capability and the eight stakeholder
Performance factors ............................................................................................... 241
Table 4-30: Sources of organizational advantage missing data ..................................... 242
Table 4-31: Comparison of the results of Hall and this study ......................................... 248
Table 4-32: Replacement periods for top 10 sources of competitive advantage ............ 249
Table 4-33: Summary of SEM results ............................................................................. 252
Table 4-34: Regression coefficients for SEM paths ........................................................ 253
Table 5-1: Summary of results against each hypothesis ................................................ 260
Table 5-2: Comparison of focus of leadership across Business Excellence models...... 264
Table 5-3: Results from other empirical models on the Business Excellence and
Performance relationship ....................................................................................... 265
Table 5-4: Comparison of stakeholder weightings .......................................................... 269
Table 5-5: Classification of the sources of SOA using Kay's framework ........................ 272
Table 5-6: Sources of advantage (SOA) and Business Excellence CSF comparison.... 275
Table 5-7: Classification of dynamic capabilities and other resource-based definitions 284
Table 5-8: Classification of Business Excellence construct definitions .......................... 288
Table 6-1: Potential themes for publications and relevant bodies of knowledge ............ 305
Table 6-2: Comparison of current work with Eden and Huxham's framework ................ 316

13
Acknowledgements
As has become customary I would like to record my thanks for the people who have
provided support during my journey over the last 3 years. First and foremost is my family,
who not only tolerated a lack of attention due to the need to focus on the research, but
also contributed to the work during the data collection phase by entering the data. In
particular Elizabeth was charged with filing away all the papers and for ensuring the
supply of beer was uninterrupted (after appropriate sampling).
My work colleagues at Oakland provided technical, emotional and financial support. This
extended from helpful comments from JSO (whose views on football provided an
alternative insight to the world), to Anna Pye, who in between jumping off buildings,
provided support in identifying respondents for the questionnaire. Special mention also
goes to Dr Mary Davies for proof-reading the thesis with her normal care and Dr Joachim
Bauer for his advice, support and use of the sunbed.
Outside of Oakland, support from my personal networks allowed the research to reach a
successful conclusion. People I had worked with in the award processes or had met at
conferences fulfilled a number of roles, including providing feedback on the questionnaire
and securing responses. A special mention goes to Dr Brigitte Tantawy Monsou for
taking an active interest in the work and for providing support, and Adrian Foster who
provided an insight into public service performance and who we look forward to
welcoming into the family when he finally marries Nibbles. Joe Goasdoue and John
Smith from BQF and Dr. Lway Nackasha from Dubai also deserve a mention.
I was particularly fortunate to meet several of the authors of the papers that I built my own
research on over the course of the programme. This allowed me to obtain a greater
insight into their work and for me to receive their feedback on my work. These people
include Professors Richard D‟Aveni, Rob Grant, Patricia Moura e Sà, Richard Hall and
Mark Easterby-Smith.
Despite having completed my MBA at Henley I was to discover many more excellent
people within the Henley network. I count myself lucky to have received the support of
Professors Malcolm Higgs, Joe Hair, Arthur Money and Phil Samuel, and I have seen my
own knowledge and experience inch towards their level of competence. Although I still
have some way to go before I reach their level of competence at least I am on the road.

14
The Henley doctoral programme, which I am honoured to be a product of, would not
enjoy its worldwide reputation without the inspirational leadership of Dr David Price.
David has provided continual support and guidance throughout the programme and I look
forward to working with him in the future. Mention must also be given to Veronica and
Louise in the Doctoral office, as well as Jackie and Natalie, who have both moved on to
new pastures during my time in the programme.
Tradition determines that under the acknowledgements thanks should be reserved for the
first supervisor, so I have saved the best till last. Over the three years Pat Joynt has
welcomed me warmly into his network and taught me more than just how to conduct
research. His encouragement and support have been exemplary and I look forward to
this thesis being the start of a long-term relationship. But now I can look forward to
sharing my experiences for the benefit of others with the objective of providing the care
and attention that Pat has shown to me.
So there you have it. Many other people have helped me along the way and if I missed
them off the list it was not intentional. Come on you Irons.

15
1 Introduction Everyone has his or her reasons for choosing their research topic. Mine are routed in my
work experience from the time when I left Sussex University with a D. Phil in Enzymology
to become a first line production supervisor at the Ford Motor Company Truck Plant at
Langley, Berkshire. After 2 years I moved into the field of quality control, as my personal
time horizon was beyond the end of the shift, to the annoyance of many of my work
colleagues. I have been there ever since. At that time quality was mainly concerned with
inspection and audits. A critical success factor was the ability to attach the correct label
onto a file in a filing cabinet under the DEF- 05-21 requirements. It did not matter so
much if the wheels fell of the trucks as long as the files were correctly labelled. I am
convinced that many of these external auditors retired to become Reading traffic
wardens.
Quality is a field that has been traced back to the 1950s (Martinez-Lorente, Dewhurst et
al. (1998)) and has changed radically over the past 25 years (Luthans and Hodgetts
(2002); Yarrow, Hanson et al. (2004)). Moving from Ford to International Computers
Limited exposed me to Philip Crosby, and from there I took my experience to the
Financial Sector, working for Prudential to implement a Total Quality Management (TQM)
programme that won a UK National Training Award. It was at this time, in the late 80‟s,
that the American Malcolm Baldrige National Quality Award was born in accidental
circumstances (Porter and Tanner (1998)).
Higher requirements for improved quality of products and services have led to three
important changes in international business over the last decade (Terziovski, Sohal et al.
(1999)). These are the growing recognition of the strategic importance of Total Quality
Management philosophy and methods; a major push by organizations world-wide to seek
certification to the ISO 9000 quality standards; and the growing recognition and
application of the Malcolm Baldrige National Quality Award, the European Quality Award,
and other awards such as the Australian, Taiwan, Canadian, Singapore and Dubai
Quality Awards.
I have been involved with the European Quality Award process since 1992. In that time I
have assessed many organizations and also advised several on how to win the Award.
The objective of these awards is to improve competitiveness in their regions and, as
described in Chapter 2, there is a body of evidence suggesting that this is the case. But
a critic might argue that an organization can win an award by being good at writing an
application, not having an excellent sustained performance; a bit like solving a crossword

16
puzzle without being able to write a sentence. This view was supported by others
(Simms, Bowles et al. (1991); Conti (1992); Wilson and Durant (1995)).
In writing this thesis there is a concern that „criticising quality is like criticising the Queen
Mother‟, as Seddon (1997) remarks. This is especially true given the snowballing interest
in Business Excellence where it has even been suggested that the philosophy could be
applied to Premiership football clubs (Clarke (2000)).
The main focus of this research was to examine the philosophy of Business Excellence to
see whether there was support for its use. In this introductory Chapter a brief summary of
Business Excellence and the EFQM Excellence Model® has been given to aid the reader
not familiar with the subject area. A notable feature is the interest being given to
Business Excellence by the UK Government, which is one of the reasons why it was
decided to include public sector organizations in the current study.
At the outset the reader should avoid any confusion between Business Excellence as
defined in this research, and Peters and Waterman‟s definition of „Excellence‟, which, as
noted by Caruana, Pitt et al. (1994), was based on the three criteria of size, financial
performance and innovation. Research concluded that Peters and Waterman‟s
„Excellence‟ and Performance are not synonymous (Ramanujam and Venkatraman
(1988)).
The first section of this Chapter provides a brief introduction to Business Excellence,
followed by some information on the EFQM Excellence Model®
in section 2. Section 3
reviews some of the research conducted on the structure of the various Business
Excellence models. We see that the empirical underpinning is particularly weak and that
the current research has contributed to this area of debate. The Chapter continues with
section 4 examining some views on the current state of the theory of TQM and Business
Excellence research, and some suggestions made by other authors on where new
research may contribute. TQM is only just building its own body of knowledge and, as a
consequence, the Business Excellence research had to be grounded in the research from
more established areas. In the summary of this Chapter the research focus is defined.
1.1 Introduction to Business Excellence Since the introduction of the Deming Prize in Japan in 1951 a number of other quality
awards have been developed with the aim of increasing the competitiveness of industry
in their respective countries. The most famous awards in the Western World are the

17
USA‟s Malcolm Baldrige National Quality Award (MBNQA), introduced in 1987, and the
European Foundation for Quality Management‟s (EFQM) „Excellence Model‟, which was
introduced in 1991. As explained by Porter and Tanner (1998), the Baldrige Award
adopted the process of the Deming Prize but developed a Business Excellence model
that took a more holistic view of business than the Deming Prize, which was centred on
„Total Quality Control‟. The EFQM approach built on the Baldrige model and award
process, which had seen several organizations go out of business despite being
recognised as „world-class‟ (Powell (1995)). Briggs and Keogh (1999) have noted that
even world-class organizations may find managing change in their business environment
difficult. Both the Baldrige and EFQM models have been refined over the years (Vokurka
and Stading (2000); Porter and Tanner (2003)).
Many books have been published describing the composition and use of the number of
Business Excellence models that are available around the world. These include
publications from the award bodies (e.g., JUSE (1990); EFQM (1999a); NIST (2001)) and
from practitioners (e.g., Hakes (1994); Mahoney and Thor (1994); Oakland (1999a);
ECforBE (2000); ECforBE (2002); Porter and Tanner (2003)). The importance of this
subject area was reinforced by the observation by Garvin (1991) that, in the first three
years of its existence, the American National Institute of Standards and Technology
(NIST) distributed over 450,000 copies of the Baldrige application guidelines. Over this
period there were only approximately 200 applications for the award (Porter and Tanner
(1998)).
Despite this level of interest, some authors challenged whether Business Excellence was
as efficacious as the research indicates (e.g., Fernando (2001); Hughes and Halshaw
(2002)). Rao, Youssef et al. (2004) cited an opinion reported in the Economist in 1992
that there is mounting evidence that the quality programmes of Western companies are
failing dismally. This work also cited a recent survey of 500 manufacturing and service
organizations by Arthur D Little that found that only a third of the organizations felt their
quality programmes were having a significant impact on competitiveness. As noted by
Schaffer and Thompson (1992), „Most improvement efforts have as much impact on
company performance as a rain dance has on the weather!‟ Byrne (1997) proclaimed
that „TQM is as dead as a pet rock‟. Despite this Hendricks and Singhal (1999) advised
organizations „Don‟t Count TQM Out‟. The growth of process management and TQM was
noted by Benner and Tushman (2003) who cited Nohria (1996) who observed that, back
in 1992, every Fortune top 100 organization had a TQM programme.

18
So why do organizations chose to invest in Business Excellence? The European Centre
for Business Excellence conducted a questionnaire-based study with a sample of 200
private sector organizations (ECforBE (1997)). This study included canvassing opinions
on the reasons for starting or continuing Business Excellence. It concluded that the
primary reasons for starting to use the EFQM Excellence Model® were to provide a driver
for improvement and to increase awareness and commitment to quality throughout the
organization. The main reason for continuing was also to drive improvement in the
organization, although the view has been expressed that use of Business Excellence for
improvement and as a mechanism for external recognition must be kept separate (Conti
(1992)). Reed (1995) reported a small survey amongst public service staff that had just
undertaken assessor training. The results indicated that the primary motive behind self-
assessment at the time was its use as a measurement tool. Similar work has also been
conducted on the Baldrige Award (Bemowski and Stratton (1995)).
Redman, Mathews et al. (1995) note a number of reasons why Business Excellence
would be attractive to the public sector organization. These include increasing pressures
on cost and greater consumer choice. In some countries governments are imposing use
of Business Excellence in order to drive up the level of service provided by public sector
organizations. Business Excellence is being used as a vehicle for implementing the UK
Government‟s Best Value initiative (Lewis (1998)). Such is its importance, the EFQM
Excellence Model® was cited in the 1998 White Paper „Modern Local Government: In
touch with the people‟ (I&DeA (2001)). As stated in a UK government report „In the jungle
that is quality improvement, the Model is the biggest beast – used by over 20,000
organizations across Europe. It is an approach therefore that the whole of the public
sector should consider‟. (PriceWaterhouseCoopers (2000: p3)). This report surveyed
public sector organizations noting that a wide range of organizations had adopted the
EFQM Excellence Model® including Local Authorities, Emergency Services and Central
Government. The estimated cost of implementation was placed at anywhere between
£20,000 and over £400,000. The majority of managers interviewed were found to use the
EFQM Excellence Model® to help their organization achieve key objectives and to
enhance organizational performance. No causal approach – deployment linkages were
established, this being put down to the observation that it takes many years to develop
this capability (PriceWaterhouseCoopers (2000)). Work in 2001 came to similar
conclusions but noted that implementation was being used at different organizational
levels: Service Unit level, Department level and Corporate level (I&DeA (2001)).
Despite this level of interest empirical work that investigates why Business Excellence
delivers benefit, particularly in the public sector, is sadly lacking. The EFQM Excellence
Model®, which forms the basis for this research, was formulated by expert opinion and to

19
date has not been empirically tested, although some such work has been conducted on
the American Baldrige model.
On a European stage, Business Excellence is considered to be beyond TQM, but in the
USA the terms Total Quality Management and Business Excellence are interchangeable.
Bauer (2002) gave a comprehensive review of the TQM literature and argued that
Business Excellence is an extension of TQM and, for the purpose of this work, Business
Excellence will be used to cover both terms accept where TQM was specifically
mentioned in others‟ work.
1.2 The EFQM Excellence Model® According to the EFQM Excellence Model
®, truly excellent organizations are measured
by their ability to achieve and sustain outstanding results for all their stakeholders, such
as customers, employees, shareholders and the community (EFQM (1999a)). It is stated
that this requires a management approach based on the eight fundamental concepts in
Table 1-1.
Table 1-1: The eight fundamental concepts
Fundamental Concept Definition
Results Orientation Excellence is achieving results that delight the organization‟s stakeholders
Customer Focus Excellence is creating sustainable customer value
Leadership and Constancy of
Purpose
Excellence is visionary and inspirational leadership, coupled with alignment of purpose
Management by Process and
Fact
Excellence is managing the organization through a set of independent and interrelated systems, processes and facts
People Development and
Involvement
Excellence is maximising the contribution of employees through their development and involvement
Continuous Learning,
Innovation and Improvement
Excellence is challenging the status quo and affecting change by utilizing learning to create innovation and improvement opportunities
Partnership Development Excellence is developing and maintaining value adding partnerships
Corporate Social
Responsibility
Excellence is exceeding the minimum regulatory framework in which the organization operates and to strive to understand and respond to the expectations of their stakeholders in society
Adapted from: EFQM (2003)

20
The eight fundamental concepts form the basis of the EFQM Excellence Model®, which is
shown schematically in Figure 1-1. This has nine criteria broken down into two main
groups, enablers and results. The five enablers are the things an organization does in
order to achieve the desired results. This result/enabler breakdown provides a valuable
way to classify the organization‟s activities and performance. The theme of innovation
and learning spans the model and reinforces the feedback mechanisms that drive the
improvement in the organization‟s performance.
Adapted from: EFQM (1999a)
Figure 1-1: The EFQM Excellence Model®
The fundamental concepts and the EFQM Excellence Model® have been described, but
the key question is „How does the this help drive business improvement?‟ This is
achieved through the application of RADAR® philosophy, which sits at the heart of the
EFQM Excellence Model®. RADAR
® consists of four elements based on Deming‟s widely
accepted „Plan – Do- Check – Act‟ cycle. The philosophy is that an organization needs
to:
Determine the Results it is aiming for from its policy and strategy
Plan and develop an integrated set of Approaches
Deploy the approaches, then
Assess and Review these approaches, to identify, prioritize, plan and implement
improvements.
LeadershipLeadership
PeoplePeople
Policy & StrategyPolicy & Strategy
Partnerships
& Resources
Partnerships
& Resources
ProcessesProcesses
People
Results
People
Results
Customer
Results
Customer
Results
Society
Results
Society
Results
Key
Performance
Results
Key
Performance
Results
Enablers Results
Innovation & Learning

21
European, country-wide and regional awards are given on an annual basis to
organizations who can demonstrate that continued or improving results across all the
results areas are being achieved because of the approaches that are deployed across
the organization. Many organizations conduct the activity of „self-assessment‟ by
reviewing their results and approaches against the EFQM Excellence Model®
on the
journey to becoming „world-class‟. The award process and self-assessment are outside
the scope of this research.
1.3 Research supporting the models’ structures Recent work has examined the internal relationships between the elements within both
the Baldrige Model and the EFQM Excellence Model®. Building on the earlier work of
Evans (1992), who described the Baldrige Model as three related sub-systems, Curkovic,
Melnyk et al. (2000) defined three factors to define TQM, consisting of TQM Strategic
Systems, TQM Operational Systems, and TQM Information Systems. To this they added
the construct of TQM Results and conducted a survey consisting of responses gathered
from 526 plant managers within the US automotive industry. Using structured equation
modeling, the authors found all of the causal paths specified in their hypothesized model
to be positive and statistically significant. In concluding they stated that the study had
shown empirically that the Baldrige framework did capture the concept of Total Quality
Management.
In a study on applicants for the Arizona Quality Award Pannirselvam and Ferguson
(2001) concluded that leadership had a key impact on all the constructs they tested and
that areas such as human resource management had statistically significant impact. In
concluding they claimed that, within scope of the research, they had validated the
Baldrige framework. They did note that this was not the case in earlier work by Winn and
Cameron (1998), the difference being partially put down to sampling and the process
used to collect the data (Pannirselvam and Ferguson (2001)).
Like Curkovic, Melnyk et al. (2000), Meyer and Collier (2001) also used structured
equation modelling to empirically test the causal relationships in the MBNQA Health Care
Pilot Criteria using data from 220 US hospitals. Results of confirmatory structural
equation modelling showed that many of the hypothesized causal relationships in the
Baldrige model were statistically significant. The study found the Baldrige components of
leadership and information and analysis were statistically significantly linked with
organizational performance results, while human resource development and
management and process management statistically significantly linked with customer

22
satisfaction. More recently Su, Li et al. (2003) have used structured equation modelling
to confirm causal relationships in the Taiwan National Quality Award.
No similar studies could be found featuring the EFQM Excellence Model
®. Research has
questioned the weightings of the criteria. Research on Danish organizations suggested
the weightings have remained constant in most areas over the period 1998 to 2001, but
the weights do not match those given by the model. Results suggested that the enabler/
results ratio is 70/30, and not 50/50 as defined in the EFQM Excellence Model®
(Eskildsen, Kristensen et al. (2001); Eskildsen, Kristensen et al. (2002)), a result that is
supported by Chuan and Soon (2000). Vokurka and Stading (2000) noted the different
weightings given to similar criteria within the various quality frameworks and Dervitsiotis
(1999) held the view that the weightings must change in line with changes in the business
environment.
Following the review of the EFQM Excellence Model® in 1999, Nabitz, Severens et al.
(2001) published an alternative model based on work conducted during the review.
Using concept mapping to summarize the main areas of emphasis within the EFQM
Excellence Model® and other Business Excellence models, the work concluded that there
was an emphasis on customers, markets, suppliers and partnerships and that the
measurement systems and results have a central position. Their „improved‟ model had
11 criteria and, like the „official‟ model, it is yet to be tested empirically. Within this
revised model leadership was defined as being the key driving factor delivering the
performance though the various activities.
Reiner (2002) conducted a dependency analysis using information from applicants from
the Austrian Quality Award. The resulting model that Reiner constructed suggested that
logical relationships exist, such as Leadership influencing People Management and
Policy & Strategy and People Management influencing Processes. The work had some
limitations, in particular the fact that the organizations used in the study were following
the pre-1999 model and the range of the scores of these organizations was extremely
wide (ca. 450 +/- 250).
1.4 TQM and research Although it is generally accepted that Business Excellence can generate a sustainable
competitive advantage, there is little or no theory to underpin this belief (Reed, Lemak et
al. (2000)). Those working in the field of Business Excellence need to further establish
underpinning theories that are consistent with Business Excellence practice (Leonard and
McAdam (2001)). Even the large-scale quality models (e.g. Baldrige, EFQM Excellence

23
Model®) attract the attention of researchers who question some of their underpinning
philosophy in regard to Business Excellence principles. For example, Grint (1995) and
Wilkinson and Wilmott (1994) inquired if a coherent quality philosophy underpins these
models. Wilson and Durant (1995) saw theoretical weaknesses, in that Business
Excellence models can encourage a "motivational/directional effect", in other words,
fulfilling award criteria is rewarded rather than achieving business goals. This is a form of
goal displacement where the award model criteria become pseudo business goals.
Furthermore, the models encourage evaluation against a standard rather than evaluation
of the standard. Many of these problems were identified as relating to TQM's lack of
theory and definition based on in-depth qualitative studies (Carr and Littman (1990);
Leonard, McAdam et al. (2002); Leonard and McAdam (2002b)).
In reviewing the current position of TQM theory, Dale, Wu et al. (2001) noted that such
theory was at an early stage of development and that it was often viewed as part of
operations management. The theory is also fragmented (Link and Scott (2001)). The
situation is not unlike the information systems body of knowledge where there are so few
theoretical articles due to the youth of the subject and the difficulty in assembling a view
in a multi-disciplinary field (Webster and Watson (2002)). Dale, Wu et al. (2001)
concluded that TQM was becoming an academic subject in its own right and went on to
state:
'To extend the scope of TQM (Business Excellence) theory it is necessary to
incorporate management theories into its development and that much remains to
be done for TQM (Business Excellence) to reach a stage of 'refine/ extend' in the
theory building process.‟ Dale, Wu et al. (2001: p439).
A good theory has to begin somewhere and often this comes from theories (or
researchers) from other areas (Ladik (1999)). Dale, Wu et al. (2001) noted that most
research to date has been by practitioners and not academics, but many of the
acknowledged theory originators have relevance to TQM theory. Earlier attempts to
develop a theory for Business Excellence drew parallels between management theory
and TQM noting the close connection with leadership theory (Dean and Bowen (1994)).
This work raised a number of questions that are pertinent to the current research and
they included:
Can TQM be considered a substitute for leadership?
What is the role of quality in competitive strategy?
Can strategy formulation processes be improved? How?
What are the relative contributions of person and system factors to performance?

24
In support of the observation TQM/ Business Excellence is establishing itself to be a
dedicated area of theory, the International Encyclopaedia of Business and Management
(Rogerson (2002)) has a short entry describing the evolution of the area from Fredrick
Taylor‟s early views on manufacturing to the Business Excellence models on which this
thesis focuses. Rogerson (2002) made the point that organizations tend to focus on
conformance to these models and not value created from their use. He also outlined four
future research trends, with this thesis contributing the first trend:
How Business Excellence can be used to contribute to competitive advantage
Understanding the voice of the customer
Addressing environmental issues in product and service design
Effect of IT on the core processes, such as Supply Chain and Customer
Management
Zain, Dale et al. (2001) recommended some future research trends based on an
assessment of 14 UK doctoral theses over the period 1988-1995. They categorized the
research areas into „People‟, „Systems‟ and „Techniques‟, but more importantly
categorized 12 frameworks that were a result of the work. Zain, Dale et al. (2001)
recommended a need for a 'meta model' summarizing „Whats‟ and „Hows‟ of the
challenges that organizations face as a starting point for future research. They also
noted that all the work in their sample was retrospective with very little foresight into next
generation of quality tools, approaches and paradigms. New areas, such as e-
commerce, were also not taken into account, supporting the view that the dynamics of the
environment lacked consideration.
There have been calls for research into the relationship between Business Excellence
and strategy. Morgan and Piercy (1996) noted that one of the fundamental questions of
how quality may be used, as a base for competitive strategy has not been addressed and
that this was a priority area for future research. This area of research is pertinent and
applicable to industry as „this is clearly an area which is attracting a great deal of interest
and there is an urgent need to explore what senior managers are increasingly
recognizing as critical interfaces in the pursuit of sustainable competitive advantage and
superior business performance‟ (Morgan and Piercy (1996: p242)). Leonard and
McAdam (2002a) also noted that the full extent of the relationship between Business
Excellence and corporate strategy has not been made at this time.
Sirkin and Stalk (1995) suggested a link between Business Excellence and strategy. In
describing their „Capabilities-based competition‟ approach they identified three basic

25
building blocks: Mastery of business processes, Superior knowledge and Internal
organizational practices. All these three must be linked directly to the delivery of
customer value and to the creation of sustainable competitive advantage for the
company. They also noted that it is the role of top management to focus the organization
on developing these capabilities.
1.5 Research focus In this Chapter the EFQM Excellence Model
® has been introduced and it has been
argued that interest in Business Excellence from both organizations and researchers
demonstrates that this is area where the current research will make a significant
contribution.
The relationship between strategy and Business Excellence was noted to be of particular
importance and there have been calls for more research in this area. Even a cursory
glance at the EFQM Excellence Model®
shows an overlap with the capabilities-based
competition idea of Stalk, Evans et al. (1992), suggesting that the resource-based view of
the firm was a good body of knowledge in which to ground the current research. There is
an early indication, which will be expanded in the literature overview, that the external
environment in which firms compete could have an impact on the success of a Business
Excellence approach.
The focus of this thesis is to examine whether a Business Excellence approach develops
strategic capability and whether this strategic capability leads to enhanced performance.
The scope includes examining the effect of different environments on the success of such
strategic capability development and the level of benefits derived. Being a holistic model
covering most areas of an organization‟s activities, it was appropriate to limit the scope of
this study to the main elements of the EFQM Excellence Model®.
One area that is of particular interest is the way in which Business Excellence could
develop an organization‟s intangible assets. McDonald-Wood (2004) noted that an
organization‟s intangible assets can raise an organization‟s value by between 2 to 10
times its book value and that these intangible assets are an amalgam of knowledge,
relationships, structure, processes, systems, market position, reputation, trust and
leadership as well as the more traditional items such as intellectual property, licences and
brand. Such a view was supported by Beer and Nohria (2000) and Kristensen and
Westlund (2004b) made a direct link between Business Excellence and the value of
intangible assets.

26
The literature review in Chapter 2 commences by reviewing the empirical research that
has been conducted into the benefits to an organization of adopting a Business
Excellence approach. This section of the literature review also examines the critical
success factor research, with the aim of defining the main areas of Business Excellence
for inclusion in the scope of the current work. The literature review continues by
reviewing the current thinking in the area of the resource-based view of the firm, after
establishing that this is a suitable theory on which to base Business Excellence research.
A link is also drawn between the resource-based theory of the firm and the „Management
by processes and fact‟ Fundamental Concept of the EFQM Excellence Model®. Chapter
2 concludes by developing a research model and a number of hypotheses from the
literature in preparation for Chapter 3, which addresses the methodological
considerations.
A positivist approach was chosen for the research for a number of reasons, including the
observation that prior research has tended to use this approach and the fact that the
research sort to examine a number of relationships over a wide range of organizations.
One of the unique features of the current work was the inclusion of both public sector and
private sector organizations in the sample. Chapter 3 discusses the search and choice of
the instruments used in the study, and where necessary, their conversion for use in the
public sector, most research having been conducted in the private sector. Following
Churchill‟s nine-step approach (Churchill and Iacobucci (2002)) the questionnaire was
prepared and tested using a number of focus groups before being used for primary data
collection. Data collection and data analysis plans are also formulated at this stage and
these conclude Chapter 3.
The data analysis approach followed the 6-step advice of Hair (Hair, Anderson et al.
(1998)). Selection of the sample was particularly challenging as the potential
respondents were drawn from a number of sources. Due to this mixture, it was extremely
important to review the data prior to the analysis and the steps taken to examine the data
and purify the instruments are given in Chapter 4. Once the data was structured using
techniques such as factor analysis, it was analyzed by running a number of regression
models following the plan outlined in Chapter 3. This involved simple regression,
multivariate regression and structural equation modelling. Once the models were
calculated the results were interpreted, and these interpretations validated by sharing
them with a number of focus groups to obtain their feedback. Use of interpretive methods
alongside positivist methods is recognised as improving the quality of the output of the
research (Jick (1979); Easterby-Smith, Thorpe et al. (2002)).

27
There was also a descriptive statistics element to the research in that the perceptions of
the sources of organizational advantage were collected through the questionnaire in a
partial replication of work conducted by Hall in 1991 and 1992 (Hall (1991); Hall (1992);
Hall (1994)). Part of the validation was to share the results of the current research with
Dick Hall to find that there was convergence of views between the two researchers.
One of the limitations of applying Hair‟s 6-step approach was that it reduced each
element of the work to individual research streams. For example, there was a result on
hypothesis 1, a result on hypothesis 2, etc. This is clearly the curse of the reductionist!
There was an obvious need to bring all these research streams together in order to
contribute to theory, and this is the purpose of Chapter 5, the Discussion Chapter. This
Chapter commences by reviewing the results of each of the individual research themes,
hypothesis by hypothesis, before bringing all the streams together to stand back and ask
the question „What is this all telling us?‟ This Chapter holds the main contributions of the
current work both to theory and to practice.
The final Conclusions Chapter brings the research to an end. In addition to summarizing
the main academic contributions and practical applications of the work, it notes the work‟s
limitations and suggests further areas for research. There is also a section on the role of
the researcher in the work and a section on the learning process.

28
2 Literature review This literature review is structured around three main sections. First is the Business
Excellence section, which commences with a review of the empirical evidence concerning
the level of benefits that have been achieved by organizations that have adopted a
Business Excellence approach. Although there has been limited empirical research to
support the factors that underpin the various Business Excellence models around the
world, extensive research has been conducted to show support for a relationship
between the use of the Business Excellence frameworks and organizational success.
From a review of the benefits literature a number of factors emerge, such as the level of
benefit, timing of the benefit and the impact of the business environment. The
methodologies used to determine the level of performance are also reviewed. The
Business Excellence section concludes with a review of the „Critical Success Factor‟
research, which identifies leadership as one of the key constructs through which
Business Excellence could be measured.
The second section of the literature review considers the Resource-based View of the
Firm (RBV). Whereas the Business Excellence literature is in its relative infancy, the RBV
theory has evolved since the 1950s. The review explores the parallels between the RBV
and Business Excellence and concludes that Business Excellence could be a potential
contributor in the development of strategic capability, a view shared by several authors
(e.g., Savolainen (2000a); Tena, Llusar et al. (2001); Rao, Youssef et al. (2004)).
As noted in Chapter 1, there has been a call for research to investigate the relationship
between strategy and Business Excellence (Morgan and Piercy (1996); Leonard and
McAdam (2002a)). A main purpose of this thesis was to investigate whether
implementation of Business Excellence leads to the development of strategic capability,
and whether this strategic capability leads to enhanced performance. The third section of
the literature review develops the research model and a number of hypotheses that were
tested. This research model was taken forward into Chapter 3, which addresses the
research methodology.

29
2.1 Business Excellence: Benefits and critical success factors
This section commences by addressing a critical question: „Does Business Excellence
benefit organizations?‟ The literature review shows that, as a generalization, the answer
to this question is „Yes‟. But it is not a simple answer as the various research studies
give some conflicting results and there is suggestion that Business Excellence may not
be an answer for everyone (Powell (1995); Harrington (2004)).
The scope of Business Excellence covers many activities (EFQM (2003)). The second
part of this section reviews what is known as the critical success factor work where
researchers have sought to identify the activities or attributes critical to the success of
Business Excellence. It was from this review that Leadership was established as a
critical success factor and one that could be used in the research to measure the level of
Business Excellence within organizations.
2.1.1 The benefits of Business Excellence Research into the benefits of Business Excellence fall into two broad categories: Single
organization case studies and studies that examine a sample of organizations. The
former often feature award winners and many case studies are written by practitioners,
raising questions about the independence of the conclusions. The literature is full of such
work (e.g., Williams and Boudewijn (1994); Tanner, Duffy et al. (1995); Hirst (1996);
Loveday (1996); Mason (1996); Parry (1996); Cooper (1997); Holmes, McClaskey et al.
(1998); Taylor (1998); Chattopadhyay and Szydlowski (1999); Daniels (2004); Johnson
(2004); Rao, Youssef et al. (2004)).
It remains a fact that the Business Excellence models are based on perceptions of what
organizations believe are important (Black and Porter (1996)). Most research has
focused on searching for a relationship between organizations that compare well against
the excellence models and delivery of outstanding performance. There are a number of
studies that have sought to show the benefits of quality on an organization‟s
performance. For example, in a study of US and Japanese air conditioner
manufacturers, Garvin (1983) found that savings in the internal (scrap and rework) and
external (field service) costs associated with the higher quality manufactures more than
offset quality control costs. Garvin concluded that superior levels of performance come
not from national traits or cultural advantages, but from sound management practices that
are systematically and deliberately applied.

30
The PIMS database has been used to find a positive relationship between quality and
profitability (e.g., Schoeffler, Buzzell et al. (1974); Craig and Douglas (1982); Phillips,
Chang et al. (1983); Buzzell and Gale (1987)). There have also been a number of
studies examining the benefits of quality approaches such as ISO9000 (e.g., Leung and
Chan (1999); Bauer, Tanner et al. (2001); Corbett, Montes et al. (2002a); Corbett, Montes
et al. (2002b); Rajan and Tamimi (2003); Arauz and Suzuki (2004); Mahadevappa and
Kotreshwar (2004); Pivka (2004)) and six-sigma (e.g., Goh, Low et al. (2003); Thawani
(2004)).
In this section the studies that have specifically examined the relationship between
Business Excellence and Performance across a variety of industries have been reviewed
and it will be seen that these use a number of different research methods. The first major
study on an excellence model was conducted by the United States General Accounting
Office in 1991 (GAO (1991). This led to a report linking improvement performance with
quality efforts in the 20 highest scoring Baldrige award applicants over the years 1988
and 1989. The evidence from this small sample suggested that the organizations
achieved improved employee relations, better quality, lower costs, greater customer
satisfaction, improved market share and improved profitability. Common features
appearing in these high-scoring organizations were customer focus, management
leadership in quality values, employee involvement, an 'open' corporate culture, fact-
based decision making and partnerships with suppliers. This report also reviewed
previous research, including one based on Deming Prize Winners between 1961 and
1980, concluding that most companies saw a favourable upturn in performance. Average
annual cost savings attributable to the quality improvement programme ranged from $1.3
million to $116 million per year (Shetty (1993)).
It has been estimated that 1/5 of Business Excellence programmes in the USA and
Europe fail (Prajogo and Sohal (2004)). A report by Wilkinson, Redman et al. (1993) as
cited by MacLeod and Baxter (2001) summarized the outcomes of four European studies
on the effectiveness of Business Excellence. Of these, a London Business School study
concluded that, of the organizations asked to self-evaluate against the US Baldrige model
criteria forty two of them had poor performance (O'Brien and Voss (1992)). Wilkinson,
Redman et al. (1993) conducted a postal self-completed questionnaire of 4000 members
of the British Institute of Management. Only 9% of the 880 respondents claimed their
Business Excellence experience had been very successful. Mellahi and Eyuboglu (2001)
attributed the failure of Business Excellence implementation to the failure of management
to establish a proper system for its implementation, as opposed to being due to external
pressures. They suggested that strong competitive pressures potentially affecting the
survival of the organization could benefit Business Excellence implementation.

31
Over the past 10 years there have been many other studies. Table 2-1 summarizes
some of the more notable research, which has been categorized by research method. A
number of conclusions may be drawn form the analysis, and these have been broken
down into a number of themes.
Lack of work on the EFQM Excellence Model
Most of the work in this area has centred on the Baldrige award (O'Brien and Voss
(1992); Wisner and Eakins (1994); Hendricks and Singhal (1997); Rajan and Tamimi
(1999); Hendricks and Singhal (2000); Fisher, Dauterive et al. (2001); Link and Scott
(2001); Hendricks and Singhal (2001a); Hendricks and Singhal (2001b); Przasnyski and
Tai (2002); NIST (2002b)). Surprising little has looked at the EFQM Excellence Model
(Longbottom (1998); ECforBE (1999); Oakland (1999b); ECforBE (2002)) although the
general area of Total Quality Management has received attention (Wilkinson, Redman et
al. (1993); Powell (1995); Redman, Mathews et al. (1995); Ahrie, Waller et al. (1998);
Easton and Jarrell (1998); Holmes, McClaskey et al. (1998); Terziovski and Samson
(1999); Curkovic, Vickery et al. (2000); Sun (2000); Agus and Sagir (2001); Douglas and
Judge (2001); Kim, Shim et al. (2001); Rahman (2001); Tena, Llusar et al. (2001);
Beheshti and Lollar (2003); Eriksson, Johansson et al. (2003); Agus (2004)).
Lack of work within the pubic sector
Empirical work on public sector organizations is lacking as only the studies by Redman,
Mathews et al. (1995), PriceWaterhouseCoopers (2000) and Agus (2004) could be found
in the review that presented definite results. Even so, the work of Redman, Mathews et
al. (1995) was somewhat basic and, although it acknowledged that public sector
organizations were subject to lower market exposure that private sector organizations,
some of the work is open to question. For example, the concept of profitability in the
public sector is hard to comprehend. The PriceWaterhouseCoopers (2000) UK public
sector, on the other hand, was inconclusive with respect to actual benefits obtained. Sun
(2000) made reference to collecting data from pubic sector organizations in Norway, but
no results were presented.

32
Table 2-1: Evidence for benefits of Business Excellence
Reference Methodology Main Findings
Stock Performance Studies
NIST (2002b) Also see
Helton (1995) for the
original work.
Fictitious stock holding of Baldrige
winning public companies investing on
the day that the award was
announced.
Portfolio outperforms the S&P 500 by about 3 to 1.
„Whole company winners‟ had a return of 4.5 to1.
Easton and Jarrell (1998) Event study with the sample chosen
through interviews. Of over 500
potential firms 108 were selected for
the study. The Value Line Investment
survey was used to forecast future
performance and examination of actual
data to identify the excess unexpected
performance. A five-year time period
since TQM implementation was the
point used to review performance in
the study.
The authors claim clear evidence of the long-term performance of firms that had implemented TQM.
TQM firms were graded into „More advanced TQM‟ and Less advanced TQM‟ firms based on the interviews. The performance of the „More advanced TQM‟ firms was higher than for the „Less advanced firms‟.
The effects were greater for the group of manufacturing firms in the sample.
The possibility that the effects were attributed to re-engineering was examined and this hypothesis was rejected.
It was noted that TQM only worked in certain organizations suggesting that the conditions must be right.
There was no evidence that TQM had a detrimental effect on the organizations.

33
Reference Methodology Main Findings
Rajan and Tamimi (1999) This study expanded on the NIST
findings by tracking the stock
performance of all publicly traded
Baldrige award recipients from 1988
through 1997 using different portfolio
investment strategies. Specifically, two
strategies were examined: a simple
buy-and-hold strategy and a portfolio
rebalancing strategy. The return and
risk of each portfolio was measured
and compared to the Standard &
Poor's 500 performance.
Both investment strategy Baldrige portfolios soundly outperformed the Standard & Poor's 500 index.
Over the period 1989 -1997, the buy-and-hold portfolio provided an average geometric return of 20.19% compared to 18.18% mean return on the S&P 500. The rebalancing portfolio yielded an even higher return of 22.54% for the same period. The volatility of both Baldrige portfolios, measured by the standard deviation, was higher than the S&P 500 index, however.
For the buy-and-hold strategy, an initial investment of $100,000 would have grown to $523,245.
For the rebalancing strategy, the ending value of the portfolio was an impressive $622,949.
An original investment in the S&P 500 index would have grown to $449,809, which was $173,140 less than the value of the rebalancing portfolio.

34
Reference Methodology Main Findings
Hendricks and Singhal
(1997); Hendricks and
Singhal (2000);
Hendricks and Singhal
(2001a); Hendricks and
Singhal (2001b)
Analysis of share price performance
and published data of award winning
organizations in the USA compared
with selected benchmark
organizations. National, regional and
company award winners were also
compared in the analysis. Examined
share price performance five years
prior to winning the award and five
years afterwards.
Prior to implementation there was no difference in the performance of the award winners and benchmarks.
Post-implementation results showed award winners outperformed benchmarks in a number of performance measures (E.g., operating income, sales, ROA, ROS).
Organizations receiving independent awards performed better than for those receiving customer awards. This applied to performance data and stock performance.
More benefit (in % terms) was achieved by small compared to larger organizations.
With stock performance, award winners outperformed the S&P 500 and the control sample of benchmarks.
Authors concluded that TQM is not a tool or technique, not a programme, not a replacement for corporate strategy but was a source of competitive advantage.

35
Reference Methodology Main Findings
Przasnyski and Tai
(2002)
Assessment of stock performance of
public traded award winners up to
1998 including an adjustment for
market and industry effects by taking
matching companies.
Any increase in share price was built over a period as the organizations built their competence. In most cases there was no surprise element.
Baldrige winners under-performed by 17% when compared to stocks with a similar risk and industry. It was concluded that the „spectacular‟ returns in other studies were due to market and industry factors.
Baldrige companies did outperform the S&P 500 but a higher return would have been achieved by investing in the matching companies.
Only one company had a high return for low risk. Adjusting for risk and market movements, only about half of the companies outperformed the market.
A fictitious fund of all the Baldrige winners, when adjusted for risk, did outperform stocks with similar risk.
Baldrige winners can give a superior S&P 500 performance, but it is not a spectacular as that claimed by other researches (e.g., the NIST research).

36
Reference Methodology Main Findings
Survey Based Studies
Powell (1995) Mail survey of 143 firms with 25%
usable response rate (36 returned).
Firms were both TQM adopters and
non-adopters. Followed up with
interviews of CEO and quality
executives in 30 firms.
Study concluded that TQM could produce economic value to the firm but not for all TQM adopters.
Success depended on executive commitment, open organization and employee empowerment.
It depended less so on benchmarking, training, flexible manufacturing, process improvement and improved measurement.
TQM can produce an advantage but it is not necessary for success.
It was suggested that TQM‟s highest purpose and real contribution to US business was that it provided a framework that helped firms understand and acquire resources as part of an integral change programme.
Redman, Mathews et al.
(1995)
Large-scale survey of 4000 managers
nationwide from a number of
industries, including public and private
sector. 201 pubic sector
questionnaires were returned. The
survey sought opinions on the effect of
TQM on a number of performance
measures. T-tests were used to
compare the means of the public
sector and private sector samples.
The public sector means were all higher than the private sector means, indicating a lower effect (scale 0 = major improvement, 4 = major determination).
Most means were below the midpoint of 2 (only labour turnover was above at 2.02).
Public sector returned higher means statistically significant at the 0.05 level for the performance measures of quality awareness, customer satisfaction, teamwork, customer complaints, employee morale, scrap/ defect levels, sales, returns, profitability, and labour turnover.
The other performance measures were cost efficiency, productivity, safety, and absenteeism.
It was concluded that public sector and private sector were at the same stage of TQM development.
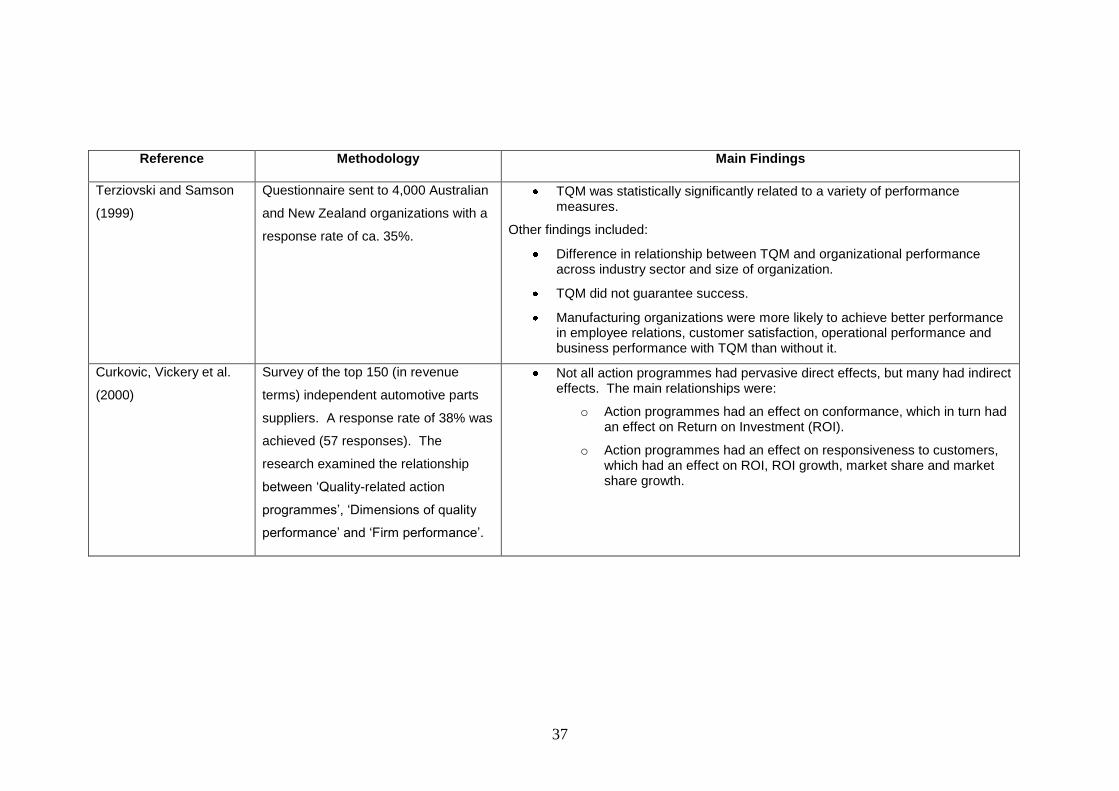
37
Reference Methodology Main Findings
Terziovski and Samson
(1999)
Questionnaire sent to 4,000 Australian
and New Zealand organizations with a
response rate of ca. 35%.
TQM was statistically significantly related to a variety of performance measures.
Other findings included:
Difference in relationship between TQM and organizational performance across industry sector and size of organization.
TQM did not guarantee success.
Manufacturing organizations were more likely to achieve better performance in employee relations, customer satisfaction, operational performance and business performance with TQM than without it.
Curkovic, Vickery et al.
(2000)
Survey of the top 150 (in revenue
terms) independent automotive parts
suppliers. A response rate of 38% was
achieved (57 responses). The
research examined the relationship
between „Quality-related action
programmes‟, „Dimensions of quality
performance‟ and „Firm performance‟.
Not all action programmes had pervasive direct effects, but many had indirect effects. The main relationships were:
o Action programmes had an effect on conformance, which in turn had an effect on Return on Investment (ROI).
o Action programmes had an effect on responsiveness to customers, which had an effect on ROI, ROI growth, market share and market share growth.

38
Reference Methodology Main Findings
Sun (2000) Survey based on the Baldrige criteria
conducted in Norway in 1997 with a
sample of 900 quality managers. 363
replies were returned (ca. 40%).
Manufacturing and service
organizations were included, as well as
organizations of various sizes.
Based on the correlations between the enablers and performance, the top five enablers were quality leadership, strategic management of quality, human resource development, close cooperation with customers and consideration of customer satisfaction.
In terms of attention, however, organizations paid less attention to leadership, quality strategy and human resource development
A public sector sample was also collected but not reported in the paper.
Fisher, Dauterive et al.
(2001)
Survey of the different USA state
awards and comparing this with
economic factors within the State.
The results indicated that there maybe a relationship between US States that demonstrated commitment to quality business practices, but it was accepted that many other factors had an influence on economic performance.
Agus and Sagir (2001) Survey of Malaysian manufacturing
companies to investigate the extent of
total quality practices (based on
Saraph, Benson et al. (1989). The
results were correlated with an
assessment of competitive advantages
and financial performance variables.
TQM practices had an indirect impact on financial performance mediated by competitive advantage.
TQM had a strong effect on competitive advantage, which ultimately led to a more statistically significant impact on financial performance

39
Reference Methodology Main Findings
Douglas and Judge
(2001)
Survey of general medical hospitals.
Target for questionnaire was the CEO
and Director of Quality. Overall
response rate was 22% (193 hospitals
returned at least one questionnaire).
Strong empirical support for a positive relationship between the degree of TQM implementation and organizational performance was found. The greater the degree of TQM implementation then the greater was the benefit.
Some empirical evidence that the relationship between TQM implementation and organizational performance was moderated by organizational structure.
Claim that the study broke new ground in the TQM literature by identifying a complex relationship between organizational structure and TQM implementation success.
Link and Scott (2001) Survey of 875 American Society for
Quality (ASQ) members to examine
the economic impact of the Baldrige
award programme. Overall response
rate was 7.43% (65 responses).
Approach used counterfactual as
opposed to the spillover evaluation
method for the analysis of the
investment using public funds. The
paper argued generalization to all ASQ
members and the US economy.
The conservative estimate of the present value (in constant 2000 dollars) of the net private benefits associated with the Baldrige National Quality Program was $2.17 billion.
Estimated that if the entire economy benefits to the same extent as the ASQ members, the conservative estimate of the present value (in constant 2000 dollars) of social benefits associated with the Baldrige National Quality programme would have been $24.65 billion.
Based on information provided by the Baldrige National Quality programme, the present value (in constant year 2000 dollars) of social costs associated with the programme to date was $119 million.
Therefore, from an evaluation perspective for the economy as a whole, the benefit-to-cost ratio characterizing the Baldrige National Quality programme was conservatively estimated to be 207-to- 1.
The authors recognised that Business Excellence research to be both fragmented and multi-disciplined.

40
Reference Methodology Main Findings
Rahman (2001) Postal survey of SMEs (less than 100
employees) in Western Australia using
the Australian award as a framework.
A sample of 250 organizations
achieved a 21% response (53
responses).
Leadership was defined as being key.
A correlation matrix between factors in the Australian ward framework and Organizational Performance gave statistically significant correlations for leadership, processes, products and services, people and customer focus.
The relationships of organizational performance with information and analysis, and strategy and planning were non-significant.
Tena, Llusar et al. (2001) 231 personal interviews were
conducted to collect the data from
Spanish organizations of varying sizes,
covering different industrial sectors and
service sectors. Structured equation
modelling was used to test the
hypotheses.
A positive relationship was found between the extent of TQM within an organization and performance, with a loading of 0.409.
It was also found that TQM had a positive effect on distinctive competencies (0.775 loading).
Finally a positive relationship was shown to exist between distinctive competencies and financial results (0.392 loading).
No limitations of the research were noted in the paper.

41
Reference Methodology Main Findings
Kim, Shim et al. (2001) Surveyed 399 managers in the Korean
semiconductor industry with a 100%
response rate. They were from three
semiconductor companies in Korea. The
survey captured the managers‟
perception of the definition of quality and
current performance. The alpha on the
10-item performance scale was 0.8815.
The study showed a relationship between quality and perceived performance levels but the result depended on the definition of quality, with a value-based concept of quality giving the strongest relationship.
The performance measures were deliver quality, process quality, customer satisfaction, cost reduction, task-time reduction, market share, productivity, business process systemization, job satisfaction ands profitability.
Beheshti and Lollar
(2003)
Postal survey of 500 US manufacturing
and Service SMEs with between 10 to
499 employees. Response rate was
16.9 % (98 usable responses).
Questions addressed the impact and
importance of quality management.
Data segmented into organizations that
had TQM programmes and those that
had just implemented quality control.
Only descriptive statistics are given as
results.
For manufacturing organizations a composite index measuring the impact of quality management was 4.34 for TQM organizations and 3.86 for non-TQM organizations (out of a maximum of 5). The figures for service industries were 3.91 and 3.62 respectively.
Measuring importance on a similar scale, manufacturing returned values of 4.18 and 3.50 for TQM/ non-TQM and service 4.05 and 3.58.
No statistical tests performed to check significance of the mean differences.
The impact index measured a number of factors, including improved product quality, increased efficiency and increased productivity.
The importance index considered factors such as the importance of quality to profitability, increasing market share and employee training & development.
Crucially, although the composite indices were higher for TQM than non-TQM organizations, the scores on the individual factors were not.
The study concluded that SMEs that invest in TQM do get statistically significant returns and improvement in performance.

42
Reference Methodology Main Findings
Eriksson, Johansson et
al. (2003)
Looked at in-company awards of 4
organizations – 77 units surveyed with
a 66% return rate. Categorized
organizations as not applying, applying
once or applying for more than one
award.
Performance areas examined were customers, employees, operating and financial results.
No real difference in the groups – all had some level of improvement. Time period start of 1998 till end 2001.
Agus (2004) A survey of 430 top officers in
Malaysian public sector organizations
with matching customers. Five
independent variables included were
top management commitment,
customer focus, benchmarking,
training and employee focus.
Dependent variables were service
performance and customer
satisfaction. SEM used to perform the
analysis.
All the independent variables correlated statistically significantly with the dependent variables. It was concluded that top management commitment is crucial to the success of TQM.
A cluster analysis clustered the sample into two groups: „Top TQM implementers‟ and „Average TQM implementers‟.
With the first model loadings were lowest for management commitment and benchmarking. It was suggested that these might not be so critical in the public sector in Malaysia. Study repeated the calculations deleting these 2 items and got the model to fit.
In the second model, the TQM – Performance relationship was high and statistically significant.
Study concluded that employee focus, training and customer focus are important elements in TQM implementation in Malaysia.
Also conclude that service performance and customer satisfaction had a positive impact on overall performance.

43
Reference Methodology Main Findings
Case Studies/ Document Reviews
Wisner and Eakins
(1994)
Review of the quality strategy of 17
Baldrige winners between 1988 to
1992. Changes in performance with
respect to the industry and due to the
quality programme are summarized.
Major benefits reported over a number of financial (Sales, ROA, ROS, etc) and non-financial (quality, rework and returns, projected future competitiveness, etc.) measures. Overall change due to quality programme determined as being 58% for the financial indicators and 84% for the non-financial indicators.
ECforBE (1999); Oakland
(1999b))
Document review of EFQM and BQF
award applications followed by
selected interviews.
Statistically significant results were reported in all the results areas: business results, customer satisfaction, people satisfaction and impact on society.
Good practices were reported for all areas of the pre-1999 EFQM Business Excellence Model
® and a „Route to Business Excellence‟ model was
presented. This model has „People Management‟ at the centre.
Many organizations showed a sustained or improving performance over a three-year period (80-100%) and a sustained or improving performance over a five-year period (50-80%).
It is of interest that many organizations, whilst delivering improved performance, did not meet their internal targets. The range for particular measures varied from 10-100%.
The authors acknowledged that no causal relationship could be proven.

44
Reference Methodology Main Findings
Quantitative Analysis of Secondary Data
Longbottom (1998) 20 organizations studied, 6 of which
where top in terms of self-assessment
against the EFQM Excellence Model®.
The leading group of six organizations
(based on their self-assessment rating)
were compared using 13 financial
ratios over a 3-year period (1991 to
1994). These results were also
compared against industry averages
for the same period.
The leading group achieved better than average results across the range of measures, in some cases by a statistically significant margin. In relation to market share, 30-50% better over the period, profitability 25-28% better and cost attainment 5-8% better.
Two of the organizations in this group of six had achieved a statistically significant transformation in business performance, and were highlighted as best improvers by industry analysts UBS.
While these findings were encouraging and appeared to show a positive link between self-assessment and bottom line, they must be approached with some caution. The size of sample was small and organizations studied were in the early stages of implementation. It was also evident from the research that several companies were moving to greater emphasis on non-financial indicators, i.e. balanced performance measures or scorecards. However, very few data were available at the time of the study with which to make meaningful comparisons.

45
Reference Methodology Main Findings
Ogden and Watson
(1999)
Analysis of published customer service
data and profit/ equity information for
60 privatized water companies in the
UK. The hypotheses tested were that
published customer service levels will
be negatively related to the companies‟
contemporaneous reported profitability
and that there will be a positive
correlation with future performance.
The main conclusion was that it is possible to align the apparently conflicting needs of different stakeholder groups.
Hillman and Keim (2001) Using data from the Stern Stewart
Performance 1000 database and the
KLD database a sample of 308 firms
was subjected to a quantitative
analysis looking to test the relationship
between stakeholder management and
social issue participation on
shareholder value creation.
A positive relationship was found between stakeholder management and shareholder value creation.
A negative relationship was found between social issue participation and shareholder value creation.
The main conclusion was that investing in stakeholder management was of benefit to organizations but social issue participation was not. This conclusion does not find support for the EFQM Corporate Social Responsibility Fundamental concept.

46
The effect of market and industry factors
Although the stock performance of Baldrige award winning organizations outperformed
the S&P 500, the extent to which it does this is open to question. A significant impact on
this type of work appeared to be whether market, industry and risk factors were taken into
account (Easton and Jarrell (1998); Przasnyski and Tai (2002)). That market and
industry factors may have had an effect is supported by work using other research
methodologies, and in particular, survey work (e.g., Terziovski and Samson (1999);
Beheshti and Lollar (2003)). In studying the effect of IT leadership on company
performance, Santhanam and Hartono (2003) adjusted for what they call the „Halo‟ effect
by adjusting the financial results from previous years. These problems show that the
event share-price studies are less than straightforward.
Effect of the environment
The observation that industry and market factors may have an affect on the effectiveness
of Business Excellence raises a question as to the extent of the effect of the dynamics of
the environment. The environment may be a reason why some researches conclude
Business Excellence is not a guaranteed recipe for success (Powell (1995); Terziovski
and Samson (1999); Eriksson, Johansson et al. (2003)). Managing volatility in the
environment will be a major challenge for managers in the future (Prahalad (2000)) and
Jones (2004) argued that high-performing leaders respond to change faster, deal with
ambiguity, provide direction, manage constraints and leverage the intellectual capital of
the people surrounding them. Whether Business Excellence can be effective in periods
of turbulent change has been called into question (Dervitsiotis (2004)).
Competitive advantage
There is a question mark over whether Business Excellence delivers competitive
advantage. There is little theory to underpin the generally held view that Business
Excellence does give a competitive advantage (Reed, Lemak et al. (2000)) and it has
been noted that, despite the search for better ways of doing business and the adoption of
strategies such as Business Excellence, some organizations still continue to struggle to
retain their competitive advantage (Briggs and Keogh (1999)). From an empirical
perspective research indicated organizations following a Business Excellence path are
not guaranteed success and that organizations who have not taken this route can still be
successful Powell (1995); Terziovski and Samson (1999)). Several authors (e.g., Wisner
and Eakins (1994); Holmes, McClaskey et al. (1998); Curkovic, Vickery et al. (2000);
Agus and Sagir (2001); Tena, Llusar et al. (2001); Agus (2004)) provided evidence that
benefit is delivered as a direct of quality activities. Some of the relationships were
mediated through other constructs, as in the case of the Tena work, where the quality to

47
performance relationship was found to be mediated through „Distinctive Competencies‟
(Tena, Llusar et al. (2001)).. The research included both small and large organizations
taken from a selection of different industries.
Path dependency
How long it takes to deliver the benefit was another talking point. Hendricks and Singhal
(2001b) concluded that a level of Business Excellence must be reached before the
benefit is achieved, as the performance of the award winners was no difference to the
benchmark organizations prior to an award being given. This conclusion is at variance
with other authors (Douglas and Judge (2001); Tena, Llusar et al. (2001); Przasnyski and
Tai (2002); Sureshchandar, Rajendran et al. (2003); Warwood and Roberts (2004)), who
indicated that benefit was built as a result of Business Excellence implementation over
time. Researchers have used a 5-year time period to allow for implementation (Easton
and Jarrell (1998); Hendricks and Singhal (2000); Hendricks and Singhal (2001a);
Hendricks and Singhal (2001b)). Whatever the situation, all this research points to a
path-dependency.
Effect of organization size
Small organizations were reported to achieve a higher level of benefit in percentage
terms than large organizations (Hendricks and Singhal (2001a)). In another study an
opposite effect was reported and larger organizations delivered more benefit (Terziovski
and Samson (1999)). The observation is that size may have an effect on a Business
Excellence and performance relationship.
Meeting all stakeholder needs
The stakeholder study of Ogden and Watson (1999) supported the argument that multiple
stakeholder needs may be balanced, which is a central principle behind the Fundamental
Concepts of the EFQM Excellence Model®. The work of Hillman and Keim (2001),
however, suggested that social issue participation had a negative effect on shareholder
value. It is acknowledged that both of these studies are limited, as they were conducted
within specific industries, but there is an indication that the Fundamental Concepts may
be an oversimplification of the real word situation.

48
Research methodologies
Looking at the research methodologies, a number have been used, with the stock
performance approaches and survey approaches being the most popular. With the
survey research, bias in the sample if it is taken from award winners is a concern as is the
low sample size in many studies. A limitation of the stock performance research, apart
from the way that external factors are accounted for, is the way that the comparisons are
chosen. Several authors noted that different benchmarks might have led to different
conclusions. The impact of the results on the size on the firm and industry are also
worthy of note.
2.1.2 What are the Critical Success Factors of Business Excellence? The purpose of this section is to identify the factor or factors by which the level of
excellence in an organization could be measured. Link and Scott (2001) noted that due
to the holistic nature of Business Excellence researchers often choose to take a specific
aspect to study.
The work to identify the critical success factors for success of Business Excellence has
been broken down into three approaches. First, the work where the factors were derived
from the literature has been described. This is followed by the work that has defined
several success factors and tested these empirically. Finally, a review of the major
Business Excellence frameworks concludes the section, before drawing the findings
together to select the factor that was used to represent Business Excellence in the
current research.
2.1.2.1 Critical success factors derived from the literature Dumond (2000) identified ten factors from the literature to generate a model for delivering
value within organizations. As part of the index measuring the competitive fitness of
global firms, Larréché (2002) determined twelve „capabilities‟ and Hodgetts, Luthans et al.
(1994) ten core values from the literature, with their framework being justified using
examples of practices taken from leading organizations. Waldman (1994), as cited by
Rahman (2004), summarized Juran and Crosby‟s approaches and identified eight
elements for TQM. Finally, the work of Oakland (1999a) defined a framework from a
combination of the literature and consulting experience. Table 2-2 summarizes the
comparisons. The references chosen are not designed to be an exhaustive list but just a
cross-section of available work.

49
Table 2-2: Comparison of models derived from the literature
Source Factors
Kaye and Anderson
(1999)
Senior management commitment and involvement.
Leadership and active commitment to continuous improvement demonstrated by managers at all levels.
Focusing on the needs of the customer.
Integrating continuous improvement activities into the strategic goals across the whole organization, across boundaries and at all levels.
Establishing a culture for continuous improvement and encouraging high involvement innovation.
Focusing on people.
Focusing on critical processes.
Standardizing achievements in a documented quality management system.
Establishing measurement and feedback systems.
Learning from continuous improvement results, the automatic capturing and sharing of learning.
Dumond (2000) Continuous improvement
Customer success
Interface relationships
Job design
Organization culture
Organization mission and strategy
Performance measurement system
Process management
Training
Larréché (2002) Corporate culture
Customer orientation
Human resources
Innovation
International
Market strategy
Marketing operations
Mission and vision
Organization and systems
Performance
Planning and intelligence
Technical resources

50
Source Factors
Luthans and
Hodgetts (2002)
Customer-driven
Full participation
Information system
Leadership
Long-range outlook
Management by fact
Partnership development
Prevention, not detection
Reduced cycle-time
Reward systems
Public responsibility
Waldman (1994) Broad definition of quality
Commitment continually to improve
Development of a quality culture
Involvement and empowerment
Involvement of external suppliers and customers
Institution of leadership practices
Orientation toward managing-by-facts
Upper management commitment
Oakland (1999a) Benchmarking
Continuous improvement
Defining improvement priorities
Defining opportunities for improvement
Direction: Vision, mission, goals and critical success factors
Education, training and development
Measurement of progress
People development
Process management
Leadership
Self-assessment
Step change
Examining Table 2-2 it is clear that continuous improvement/ change, customer focus,
culture, direction, involvement and empowerment, management by fact, employee
development, involvement of customers and suppliers, and leadership are all common
factors.

51
2.1.2.2 Empirical evaluation of the critical success factors Research has been conducted on the critical factors of the success of Business
Excellence since the late 80‟s. Based on a questionnaire and factor analysis Saraph,
Benson et al. (1989) derived eight critical success factors for TQM. Later Porter and
Parker (1993) derived a model from the literature and tested this for criticality using a
survey. Black and Porter (1996) followed this with another study, which led to ten critical
success factors.
One problem faced by these authors was that the results of the research had been limited
by the scope of the studies. As noted by Black and Porter (1996), the Saraph et. al.
study did not include customer satisfaction and customer relationship management
whereas their own work based on a sample of EFQM members was biased. Table 2-3
summarizes the major studies this field.
Various researchers have used different terms to represent similar concepts. The
common factors identified from the analysis were communication, culture change,
customer focus and satisfaction, direction setting, employee development, employee
involvement and empowerment, leadership/ top management commitment, learning,
performance measurement, process and systems management, and supplier
management and involvement.
2.1.2.3 Business Excellence award model frameworks The final area considered was the content of the Business Excellence frameworks
themselves. Table 2-4 summarizes an analysis of the content of the most popular
Business Excellence models. The main themes identified from the analysis included
leadership, strategy & planning, customer focus, people focus, suppliers & partnerships,
process management and a balanced scorecard of results.

52
Table 2-3: Critical success factors from empirical work
Saraph, Benson et al.
(1989)
Porter and Parker (1993) Ramirez and Loney (1993)
(Tier 1 only)
Flynn, Schroeder et al.
(1994)
Powell (1995)
Employee relations
Process management
Product/ service design
Quality data and recording
Quality policy
Role of the quality department
Role of top managers
Supplier quality management
Training of employees
Communication for TQM
Employee involvement
Management behaviour
Organization for TQM
Process management and systems
Quality technologies
Strategy for TQM implementation
Training and education
Clear mission statements
Culture change
Customer satisfaction
Education
Error prevention
Goal clarity
Management commitment
Participative management
Strategic quality plan
Top management steering committee
Customer involvement
Employee empowerment
Process management
Product design
Quality information
Supplier involvement
Top management support
Workforce management
Adoption and communication of TQM
Benchmarking
Closer customer relationships
Closer supplier relationships
Committed leadership
Employee involvement
Flexible manufacturing
Increased training
Open organization
Process improvement measurement
Zero-defects mentality

53
Ahrie, Golhar et al. (1996) Black and Porter (1996) Dow, Samson et al. (1999) Claver, Tari et al. (2003) Baidoun (2004)
(Tier 1 only)
Benchmarking
Customer focus
Design quality management
Employee empowerment
Employee training
Internal quality information usage
Statistical process control usage
Supplier performance
Supplier quality management
Teamwork structures
Top management commitment
Customer Satisfaction Orientation
Communication of Improvement Information
Corporate Quality Culture
External Interface Management
Operational Quality Planning
People and Customer Management
Quality Improvement Measurement Systems
Supplier Partnerships
Strategic Quality Management
Teamwork Structures for Improvement
Teamwork Structures for Improvement
Quality Improvement Measurement Systems
Benchmarking
Corporate supplier relations
Customer focus
Design quality management
Personal training
Shared vision
Use of Just In Time principles
Use of teams
Workforce commitment
Business Results
Continuous improvement
Customer satisfaction
Leadership
Learning
Process Management
Quality Planning
Social impact
Specialised training
Supplier management
Training
Committed workforce
Consistent communication on direction
Continuous improvement
Customer focus
Documented quality system
Policy development and goal deployment
Quality management structure
Senior executives involvement
Visibility of senior executive commitment

54
Table 2-4: The common themes from the Business Excellence frameworks
Deming Prize Baldrige Award European Quality Award
Canadian Quality Award Australian Quality Award
Singapore Quality Award
Leadership Policy & organization for
leadership; supporting
supervision
Guiding the organization,
governance and
organizational
performance
Setting direction &
values and creating an
environment for
excellence
Establishing unity of
purpose & direction.
Enabling change for
improvement
Executive, company &
community leadership
Senior executive
leadership,
organizational culture,
community &
environment
responsibility
Strategy & planning Future plans, quality
control focus & initiatives
Action plans - strategy
into action plans, key
performance measures
& projecting future
performance
Implementing the vision
& mission via a clear
stakeholder focused
strategy
Linking planning to
strategic direction.
Implementing & measuring
performance to assess
progress
Policy, value integration
& the strategic process
Strategy development &
deployment
Customer focus Service activities &
customer relationships
Market requirements,
customer relationships &
satisfaction
Leaders involvement
with customers,
customer relationship
management, customer
satisfaction
measurement &
feedback
Focus on the customer &
marketplace and on the
achievement of customer
satisfaction & loyalty
Customer needs
awareness, customer
relationship
management and
satisfaction
measurement
Establishing customer
requirements, managing
the relationship &
measuring satisfaction

55
Deming Prize Baldrige Award European Quality Award
Canadian Quality Award Australian Quality Award
Singapore Quality Award
People focus Training & motivation of
skilled labour
Human resource focus
and emphasis on
approaches to promote
high performance
Releasing the full
potential of people
through trust &
empowerment
Encouraging & enabling
people to contribute to the
organization‟s goals whilst
realizing their full potential
Developing potential
through effective people
management,
involvement, training &
communication
Emphasizes planning
and enabling people
performance through
development,
involvement, care &
recognition
Suppliers &
partnerships
Vendor training &
associations of related
companies
Improvement of
partnering process &
evaluation of supplier
performance
Beneficial partnerships
built on trust, sharing of
knowledge & integration
Building key external
relationships that are
critical to the organization‟s
strategic objectives
Building “quality”
relationships
Effective supplier &
partnering process
Process management Standardization, quality
assurance, maintenance
& improvement
Value creation & support
processes – design,
control & improvement
Process design,
management &
improvement.
Generating value for
customers & other
stakeholders
Process management to
support the organization‟s
strategic direction with an
emphasis on prevention &
continuous improvement
Quality of product design
& services, supplier
relationships &
improvement
Focus on the innovation
process and process
management &
improvement
Balanced scorecard of
results
Quality, delivery, cost,
profit, safety &
environmental effects of
quality control
Customer, product &
service, financial &
market, human resource
& organizational
effectiveness results
Perception &
performance indicators
for customers, people &
society.
Key performance
outcomes & indicators
Customer, people,
process, partnership,
societal &
owner/shareholder
measures
Organizational
performance –
customers,
shareholders, employees
& community
Customer, financial &
market, people &
operational results
Adapted from: Vokurka and Stading (2000); Porter and Tanner (2003), and Stading and Vokurka (2003)

56
2.1.2.4 Implications of the CSF literature for the current research The purpose of this section of the literature review is to review the current literature,
defining the critical success factors with the objective of defining a factor that could be
used to measure the level of Business Excellence within organizations. The actual
Business Excellence framework adopted is not important (Fountain (1998)) and a number
of authors have expressed the view there is no universal recipe that gives a solution to
successful Business Excellence for all organizations (e.g., Youssef and Zairi (1995);
Harrington (2004)). Rahman (2004) suggested the critical success factors be categorized
as „soft‟ or „hard‟ to reflect their focus. The results of the analysis of the literature from the
three sub-sections have been categorized in this way in Table 2-5.
The analysis in Table 2-5 identified several potential factors that could be used to
measure Business Excellence within an organization. The potential factors have been
categorized by the enabler criteria of the EFQM Excellence Model® in Table 2-6. From
the available options Leadership was chosen as the area on which to base the research.
This conclusion is well supported (e.g., Crosby (1984); Deming (1991); Juran (1992);
Dale and Cooper (1994); Hodgetts, Luthans et al. (1994); Waldman (1994); Powell
(1995); Youssef and Zairi (1995); Zairi (1995); Darling (1999); Edgeman and Rodgers
(1999); Scholtes (1999); Yusof and Aspinwall (1999); Zairi (1999); Oakland (1999a); Sun
(2000); Savolainen (2000a); Guillen and Gonzalez (2001); Kanji (2001); Rahman (2001);
Waldman, Ramirez et al. (2001); Kanji and Sá (2001a); Perles (2002); Beheshti and
Lollar (2003); Eng and Yousof (2003); Sureshchandar, Rajendran et al. (2003); Agus
(2004); Gallear and Ghobadian (2004); Prajogo and Sohal (2004); Rao, Youssef et al.
(2004); Warwood and Roberts (2004)). There has been a call for more work to be
conducted on the relationship between Business Excellence and leadership (Dean and
Bowen (1994)).

57
Table 2-5: Analysis of critical success factors
Perspective CSFs Derived From The Literature CSFs From Empirical Work Common Themes From The Business
Excellence Frameworks
Soft Factors Customer focus †
Culture †
Employee involvement and
empowerment †
Leadership/ top management
commitment †
Communication
Culture change *
Customer focus and satisfaction †
Employee involvement and
empowerment †
Leadership/ top management
commitment †
Customer focus †
Culture †
Leadership †
People focus †
Hard Factors Continuous improvement/ change
Direction setting †
Management by fact
Employee development *
Involvement of customers and
suppliers †
Direction setting †
Employee development *
Learning
Performance measurement *
Process and systems management *
Supplier management and
involvement †
Balanced scorecard of results *
Process management *
Strategy & planning †
Suppliers & partnerships †
Key: † Common factors across all three areas. * Common factors from two areas

58
Table 2-6: Potential factors to measure Business Excellence
Enabler Criteria Soft Factors Hard Factors
Leadership Customer focus
Culture
Leadership
Involvement with customers
Involvement with suppliers
Policy and Strategy Direction setting
People Management Employee involvement/
People focus
Partnership and Resources Involvement with suppliers
Processes Involvement with customers
Another reason for choosing leadership as a key enabler area for the research was that
leadership is common across different industries. As the EFQM Excellence Model® is a
universal model it is expected that the leadership approach and the way that people are
involved in the organization will show some consistent themes. It is not as if one has to
deal with the complication of manufacturing Vs service or public Vs private variations with
leadership, as might be the situation with direction setting, involvement with customers
and the involvement with suppliers. An alternative option would have been the employee
involvement/ people focus.
Leadership as a subject area has a very large scope (Bolden (2004)). Higgs (2002)
noted the number of books and library references on the subject. Defining leadership is
complicated due to its complexity. Grint (2004) notes that firstly there is a process
problem, secondly a position problem, thirdly a philosophical problem and finally a
question over the purity of leadership. Northouse (2001) identified four common themes
in leadership: leadership is a process, leadership involves influence, leadership occurs in
a group context, and leadership involves goal attainment.
This literature search had to have focus and be consistent with a Business Excellence
viewpoint. The review in the next section commences with an overview of the area of
Leadership and will continue to examine Leadership and people involvement in a
Business Excellence context. It is worth noting is his review of leadership frameworks
Bolden (2004) cited the EFQM Excellence Model as one of the more important
frameworks.

59
2.2 Leadership and Business Excellence Ireland and Hitt (1999: p43) defined strategic leadership as „a person‟s ability to
anticipate, envision, maintain flexibility, think strategically, and work with others to initiate
changes that will create a viable future for the organization‟. Strategic leadership is
distributed amongst employees within the organizational community. Ireland and Hitt
continued by arguing that sometimes leadership processes are difficult to understand and
imitate, and therefore may lead to a competitive advantage. The impact of knowledge
workers in the 21st century is also emphasized and Warren Bennis is cited as having said
„the key to competitive advantage in the 1990s and beyond will be the capacity of
leadership to create social architecture that generates intellectual capital‟ (Ireland and Hitt
(1999: p53)). Such views are consistent with a Business Excellence philosophy. This
was further confirmed when one considers Ireland and Hitt‟s comparison between the
strategic leadership practices over the 20th and 21
st centuries (Table 2-7).
Table 2-7: Strategic leadership practices
20th
Century Practice 21st
Century Practice
Outcome focused
Stoic and confident
Sought to acquire knowledge
Guided peoples‟ creativity
Work flows determined by hierarchy
Articulated the importance of integrity
Demanded respect
Tolerated diversity
Reacted to environmental change
Served one great leader
Viewed employees as a resource
Operated primarily through a democratic mindset
Invested in employees‟ development
Outcome and process focused
Confident, but without hubris
Seeks to acquire and leverage knowledge
Seeks to release and nurture peoples‟ creativity
Work flows influenced by relationships
Demonstrates the importance of integrity through actions
Willing to earn respect
Seeks diversity
Acts to anticipate environmental change
Serves as the leader and the great group motivator
Views organizational citizens as a critical resource
Operated primarily through a global mindset
Invests significantly in citizens‟ continuous development
Adapted from: Ireland and Hitt (1999)

60
2.2.1 Leadership from a Business Excellence perspective „Globally, leadership is regarded as crucial to quality‟ (Edgeman and Rodgers (1999:
p117)). Perles (2002: p59) concluded from the literature that „managerial commitment
and leadership are indispensable elements in a successful implementation of TQM‟. He
distinguished the difference between commitment and leadership, noting that „Some
authors do not appreciate that managerial commitment is a narrower term than
managerial leadership. A manager who is a leader is committed to the process of
change, but a committed manager does not have to be a leader‟ (Perles (2002: p62)).
This is a view shared by Guillen and Gonzalez (2001), who also noted the growth in the
use of Business Excellence models and the fact that the results of such an approach are
mixed. In reflecting on the situation they state „leadership seems to be the key of
success in TQM implementation process, it is hard to find sound reasons to justify that
TQM cannot be deployed without leadership‟ (Guillen and Gonzalez (2001: p175)). Their
work, featuring two case studies on Spanish ceramic companies, concluded that the
degree of implementation of the Business Excellence principles depended on the
leadership. Bauer (2002), in a quantitative study of EFQM member organizations, also
found a relationship between leadership and the success of Business Excellence
implementation. A limitation of both these studies was external validity and subsequent
generalizability.
In studying organizational excellence, Darling (1999) reported an analysis of a large
number of multinational companies led to the confirmation of the success of four
leadership strategies as proposed by Bennis and Nannus:
Attention through vision (which is essential to create focus for the organization).
Meaning through communication (capacity to articulate a compelling image of the
future and develop shared meanings and interpretations of reality, facilitating
coordinated action).
Trust through positioning (trust provides the foundation which maintains
organizational integrity, through establishing and sustaining a position, i.e. a set of
actions to implement the vision, the leaders establishes trust).
Confidence through respect.
Kanji and Sá (2001a) presented a number of core competencies of leadership in quality-
orientated organizations as derived from the literature. These are given in Table 2-8.

61
Table 2-8: Core competencies of leadership in quality-orientated organizations
Vision and Purpose Creating and Articulating Vision, Mission and Guiding Principles
Ethics and principles Shaping an organizational culture based on the organizational values
that stresses integrity and builds trust; use principles to guide decision-
making
Communication Sharing the vision with all organizational members; encouraging
discussion, feedback and involvement; inspiring confidence in the
employees; reinforcing organizational values; establishing empathy
Customer orientation Directing attention to customer concerns and needs; commitment to
serve both external and internal customers; designing systems to
respond to their expectations
Organizational change Creating change; making vision a reality even in the face of resistance
or opposition; providing adequate resources for changes to happen
Structures and
systems
Establishing organizational policies, structures and practices that are
consistent with the TQM vision
Measurement,
evaluation and
reporting
Establishing systems to measure effectiveness, efficiency and service;
creating and maintaining reporting mechanisms
Process improvement Designing and redesigning processes and systems to improve
productivity and responsiveness; organize work in a way that makes
inter-connectedness between the various roles clear; apply statistical
process control
Team development Establishing a team-based structure that cuts across all the functions
and boundaries; fostering high performance through teams and
teamwork
Developing
subordinates
Challenging subordinates to learn; setting developmental and career
goals; stretching subordinates to full potential
Developing
partnerships
Creating a climate of win-win with customers, suppliers and the
community, through a strategic approach that will help deliver benefits
for all the parties
Innovation and
continuous learning
Generating new ideas and stimulating them in others; actively pursuing
and encouraging creativity; learn from subordinates, colleagues,
suppliers and customers
Adapted from: Kanji and Sá (2001a: p708)

62
Easton (1993), cited in Zairi (1995), conducted a study of leadership practices among 22
organizations that submitted applications for the MBNQA. Some strengths were
consistently identified:
Leaders spend substantial time reminding people of the importance of customers
and improving quality. In addition, a lot of effort was placed in educating people,
speaking in public and face-to-face contacts with customers, suppliers and
employees.
Leaders had developed a vision and a set of values to develop a quality culture.
The vision was translated into congruent goals.
A proper structure supports quality efforts.
On the other hand, the following areas for improvement were identified:
Senior managers‟ primary focus was on short-term strategic goals that tended to
be financial in nature and they lacked appreciation of quality measures and
improvement measures.
Leaders did not take a process-based approach in their decision-making and
their use of hard facts and information was poor.
Leaders had a limited and poor understanding of TQM and its potential.
Leaders set targets in isolation from the process and expected people to perform
and deliver the expected results.
Poor use of data relating to customers, suppliers and employees. As such
leaders had very poor understanding of causes of problems and what caused
variability in their organizations.
Although a structure for quality might be present, leaders tended to treat quality
as a separate activity.
From a review of Business Excellence models Edgeman and Scherer (1999) concluded
that leadership was considered in four non-prescriptive areas:
Leadership internal to the organization (particularly as related to TQM,
recognition and reward, and resource commitment)
Involvement with customers, suppliers and other external constituencies
Responsibility to society
The leadership system
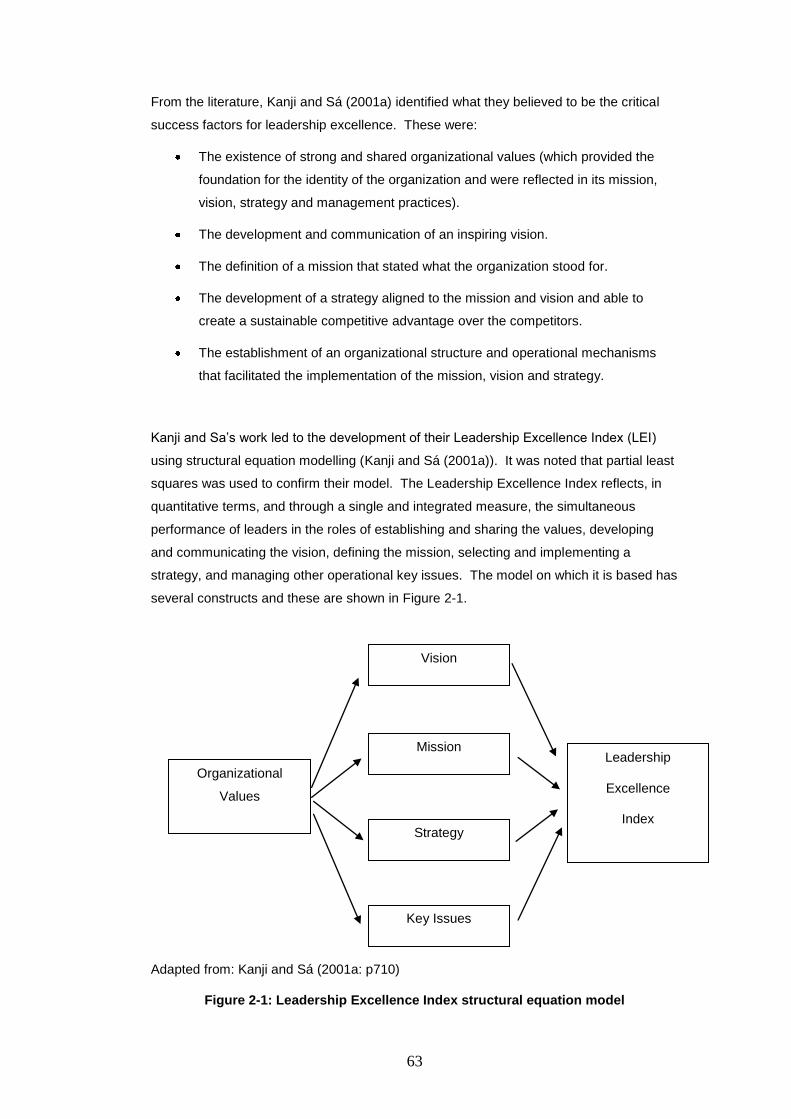
63
From the literature, Kanji and Sá (2001a) identified what they believed to be the critical
success factors for leadership excellence. These were:
The existence of strong and shared organizational values (which provided the
foundation for the identity of the organization and were reflected in its mission,
vision, strategy and management practices).
The development and communication of an inspiring vision.
The definition of a mission that stated what the organization stood for.
The development of a strategy aligned to the mission and vision and able to
create a sustainable competitive advantage over the competitors.
The establishment of an organizational structure and operational mechanisms
that facilitated the implementation of the mission, vision and strategy.
Kanji and Sa‟s work led to the development of their Leadership Excellence Index (LEI)
using structural equation modelling (Kanji and Sá (2001a)). It was noted that partial least
squares was used to confirm their model. The Leadership Excellence Index reflects, in
quantitative terms, and through a single and integrated measure, the simultaneous
performance of leaders in the roles of establishing and sharing the values, developing
and communicating the vision, defining the mission, selecting and implementing a
strategy, and managing other operational key issues. The model on which it is based has
several constructs and these are shown in Figure 2-1.
Adapted from: Kanji and Sá (2001a: p710)
Figure 2-1: Leadership Excellence Index structural equation model
Organizational
Values
Leadership
Excellence
Index
Vision
Mission
Strategy
Key Issues

64
A review of the leadership literature allowed Kanji and Sá (2001a) to operationalize the
constructs, developing a number of questionnaire items with high content validity. The
instrument has been applied to „a typical service sector company‟ and the results gave
alphas for each of the constructs of between 0.736 to 0.978 demonstrating high reliability.
Kanji and Sá (2001a) recognized, however, that the model was embryonic and was in
need of being tested in other situations. The instrument was identified as having some
value in the current research to measure Leadership Excellence.
Prabhu and Robson (2000) conducted a survey of 289 manufacturing companies in the
North East of England using an instrument developed from a „PILOT‟ instrument that had
been developed by IBM Consulting (UK) and the London Business School to determine
good performance in the manufacturing industry. The Prabhu and Robson instrument
considered „practice‟ and „performance‟ and the results led to six categories:
1. 'World class‟ (WC) for those achieving high scores in every area of practice and
performance.
2. `Potential winners‟ (PW) who were similar to, but not as high achieving, as `world
class‟.
3. `Vulnerable‟ (Vuln), who achieved good performance but were weak on practice.
4. `Promising‟ (Prom), whose strengths and weaknesses were opposite to those of
(Vuln).
5. `Room for improvement‟ (RfI).
6. `Could do better‟ (CdB), for those still a long way short of best practice in many areas.
The manufacturing companies varied in size but 75% had less than 200 people. All
companies faced intense competition on price, quality, reliability, short lead times and, to
a lesser extent, on product customisation. It was noted, however, that the instrument was
designed for use in the manufacturing sector and that no alphas were given for the
constructs. There are four constructs in the instrument, these being:
1. „Explicit‟ variables relate to practices that are strategic in nature and which would be
undertaken by senior management in these organizations. Establishing strategies for
manufacturing, quality, human relations and product technology fell into this category.
2. `Implicit‟ variables relate to a number of other practices, which had a direct
association with leadership in that they were the outcomes of strategic directions set
by the senior management of the company. Examples include `shared vision‟ or
`employee involvement‟ practices.
3. `Operational Performance‟ variables that were outcomes from the above two
constructs of `leadership‟ practices. The measures selected represented performance

65
indicators in areas such as manufacturing, quality, product design or customer
service.
4. The impact of competition and the pressure for change on the above three groups of
variables was considered in the fourth category.
The Prabhu and Robson research found that despite a strong association between the
leadership variables and world-class status, there was a great deal of variation in the extent to
which the better performing companies scored on certain measures. Moreover, there was
variation in the way in which the poorer performing companies scored on particular measures.
In particular, the proportion of PW/WC scoring highly on explicit leadership measures varied
between 18 and 78%, and in the same way, the proportion of RfI/CdB scoring poorly on the
same measures varied between 21 and 84%. Indeed, where PW/WC were relatively weak in
practice and performance, the RfI/CdB were extremely poor. Areas in this particular category
included benchmarking and employee involvement, as well as performance issues involving
product cycle times. Prabhu and Robson (2000) concluded that the results indicated how
both explicit and implicit leadership characteristics are associated with various aspects of
operational performance and that senior management commitment to leadership can have a
positive effect on operational performance. However, the results also gave an indication that
while internal impact can be seen, their impact on issues external to the business is much
more varied.
The results with regards to different practices within different classifications of company were
consistent with the findings of Seddon (1998) who noted that organizations with similar
Business Excellence leadership self-assessment scores varied in their practices and the
outcomes of their activities. Baxter and MacLeod (1999) used a case study approach to
examine two organizations that had a similar self-assessment score but different outcomes.
One was an aerospace company whose senior manager tried to get continuous
improvement going but then went down a directive re-engineering route. Improvements
were made through the re-engineering project but the target was not reached. After the
loss of the leader the project was abandoned. The second case study was a cement firm
and the leader went for a more empowered approach. This approach was embedded
into the organization and it continued when the leader moved to another position. Baxter
and MacLeod (1999: p16) stated that „authors are keen to draw a distinction between
militaristic notions of leadership and what they assert is necessary to promote TQM within
organizations, which is a participative, facilitative style of leadership. There are few
empirical studies investigating these ideas. The literature contains many post hoc
rationalizations of successful attempts at quality improvement and a key element of this is
frequently a tale of a charismatic leader who drives the process on‟.

66
One example where people participation did have a definite positive effect was reported
by Sobo and Sadler (2002). Recording the situation in a Childrens' Health Care
organization the authors described a participatory action research approach where an
„Employee Leadership Council‟ was formed to improve leader-employee communications.
The initiative delivered a number of benefits to the organization, including direct CEO
exposure to employee concerns, positive communications and improved accountability.
No negatives were recorded. There were also benefits to the Employee Leadership
Council members, such as improved interdepartmental interaction, access to the CEO
and the opportunity to contribute to change (Sobo and Sadler (2002)).
Case study data gathered from four Finnish manufacturing companies in the food, metal,
construction and concrete products industries showed that advantageous learning in
quality implementation was based on developing solid conceptual skills for managers in
the first place, managerial commitment to quality and the sharing of quality thinking in the
entire organization (Savolainen (2000b)). The paper acknowledged a lack of empirical
studies in this area and chose to use a case study approach to examine the factors that
support learning.
Savolainen (2000b) noted that:
Enhancing competitiveness through quality had become a more and more
important challenge of learning in organizations.
Quality improvement efforts had failed in a number of cases; implying that in spite
of the rapidly expanding quality movement, systematic evidence concerning its
actual effects on management practices is relatively scarce.
In the food industry company, managers' perceptions of quality were unclear, fragmented
and general in nature but they pursued clearer, more integrated thinking. This was
demonstrated, for example, by the fact that quality was mainly perceived as a broad,
holistic, organization-wide activity (process quality). Although the basic principles of the
TQM ideology were printed in the quality policy, depending on the managerial level, the
management viewed quality from different perspectives. A philosophical view was
common at the top level, whereas a customer perspective dominated at the middle level.
A negative learning cycle developed and the company "avoided" effective learning. The
need for cultural change was evident in the food industry company. However, the
characteristics of the current organizational culture, i.e. lack of purpose and vision,
seemed to hinder improvement initiatives.

67
In the metal and construction companies, top and upper management played a visible
role, acting as quality advocates and champions and supporting the implementation. This
facilitated gaining support to the ideas of quality, overcoming resistance, sharing ideas,
and achieving organizational involvement, which all promoted learning. As a result, a
positive learning cycle developed: concepts and ideas were materialized and internalized.
Active measures were taken through several quality programmes to transforming the
ideas of quality into action.
Savolainen (2000b: p202) provided a quotation from a middle manager in the
construction company, that had undergone the learning process for over ten years and
summarized the nature of the learning process in quality implementation, and the
outcome and strategic meaning of continuous learning for the company: "The point is, it's
a competitive advantage that cannot be copied or stolen, it must be accomplished and
earned through your own efforts, it's not the kind of knowledge that you can steal from
someone. If you want to influence the organization's way of action and operations they
change terribly slowly and awkwardly, however hard you try to pressure all workers.
Changing an individual may be easier, but just try to move the entire system ... you can't
even transfer a person who knows and masters these things to a different place because
there will be new people there who have their particular way of operating. It may take
something like five years, nobody can do it in two or three years.” "The result is the
survival of our company ... we've even survived these times. If we hadn't got the
ideological basis the company would not exist any more. In that sense it was quite
crucial." Such views are consistent with the resource-based view of the firm that will be
discussed later in this Chapter.
Savolainen (2000a) also recognised that competitive advantage could potentially be
achieved through embedding quality ideology into an organization, and reported a
longitudinal study on two Finish firms, one from the construction industry and the other
from the metal industry, although the paper only reports on the construction industry
case. Both firms were considered to have embraced a Business Excellence approach
and were under competitive pressure. Four elements of success were identified, these
being a participative strategy, the use of external expertise, gradual implementation with
persistent, gentle persuasion, and top and upper management role and commitment –
„The champion and the persuader‟.
Two successful leadership strategies were observed. These were:
Coach-leadership strategy – Driven by leader with „resilient coaching‟ through
indigenous pioneering efforts and in cooperation with organization members.

68
Leadership-expertise strategy – Driven by founder-manager with „gentle
persuasion‟, supported by cooperation with the external expert as a supplier of
quality theory.
Savolainen (2000a) concluded that the advantageous embedding of a quality
management ideology began to dislodge the assumptions and beliefs of the established
management paradigm. This led to a „mental buffer‟ to resist the challenges of the
external environment and, therefore, facilitated the organization‟s adaptation to the
environment by strengthening its competitive ability (see Figure 2-2). This conclusion
was supported by Lakomski (2001), who stated that an organization‟s resistance to
change in the face of environmental pressure could be a function of its culture. Although
not mentioned specifically by either author, this conclusion is consistent with the concept
of dynamic capabilities where an organization has the ability to re-configure its resources
in reaction to changes in the external environment (e.g., Eisenhardt and Martin (2000)).
Adapted from: Savolainen (2000a)
Figure 2-2: Savolainen's 'Mental Buffer'
Embedded TQM Ideology
A mental buffer
Challenges ofBusiness Environment
EntrepreneurialSpirit
Logic ofInnovation
Shared Values
OrganizationalCulture
Embedded TQM Ideology
A mental buffer
Challenges ofBusiness Environment
EntrepreneurialSpirit
Logic ofInnovation
Shared Values
OrganizationalCulture

69
Keeping with the theme of role of leadership in the creation competitive advantage,
successful corporate leaders, when applying their global leadership style and substance
skills, enhance the intangible assets of corporate reputation (Petrick, Scherer et al.
(1999)). A link between Business Excellence and the development of leadership that
generates a sustainable advantage has been noted, the Baldrige model being explicitly
mentioned as a beneficial management practice. The authors provided a strategic
resource model, which provides a valuable link between leadership and the resource-
based view of the firm, which will be discussed in the next section. This model is given in
Figure 2-3.
Figure 2-3: Strategic resource model linking leadership with assets and SCA
Adapted from: Petrick, Scherer et al. (1999)
Tierney, Farmer et al. (1999) were interested in employee creativity and conducted a
study of 191 non-clerical employees from the research and development sector of a U.S.
chemical corporation. Three indicators of creative performance were collected for each
employee, which were supervisor ratings of creativity; number of invention-disclosure
forms (forms submitted by employees describing their new ideas and screened for quality
by an independent group of judges); and number of published research reports. In
addition, employees completed questionnaires to assess their cognitive style, intrinsic
motivation for creativity, and perception of the quality of their relationship with their
supervisors. Finally, supervisors completed questionnaires to assess their own cognitive
style and intrinsic motivation for creativity. It was noted that the study was a cross-
sectional study when a longitudinal study would have been more appropriate to test
causal relationships.
Skills (Leadership
Competences)
Assets (Reputational
Capital)
Core Capability Differentials
Sustainable Competitive Advantage

70
The study revealed some interesting associations between employee personal
characteristics, leader-employee relationships, and creative performance. As expected,
Tierney, Farmer et al. (1999) found that employees higher in innovative cognitive style
and intrinsic motivation tended to have higher creativity ratings than those who were
lower in these characteristics. Employees higher in intrinsic motivation also tended to
produce a greater number of invention-disclosure forms than those lower in intrinsic
motivation. In addition, employees who reported a positive leader-employee relationship
tended, on average, to have higher creativity ratings and produce more invention-
disclosure forms than those reporting less positive relationships.
The leader-employee relationship did not affect the number of invention-disclosure forms
or research reports of employees with very innovative cognitive styles, but did have an
effect on employees with less innovative cognitive styles. Adaptive and moderately
innovative employees in very positive leader-employee relationships produced a greater
number of invention-disclosure forms and research reports than those with less positive
leader-employee relationships. In fact, adaptive employees in a positive leader-employee
relationship produced more invention-disclosure forms than employees with a highly
innovative cognitive style in any situation (Tierney, Farmer et al. (1999)).
The final area reviewed in this section relates to the building of change capability.
Eisenbach, Watson et al. (1999) noted the importance of leadership to change
management. Higgs (2002) notes that it has been estimated that up to 70% of change
initiatives fail and that „there is a driving need for leadership behaviours which result in
effective change implementation‟. Indeed, how „Leaders identify and champion
organizational change‟ has now become a specific sub-criterion in the earlier 1994
version of the EFQM Excellence Model® (Porter and Tanner (2003)). Higgs and Rowland
(2001: p3) observed organizations need to consider change from two perspectives:
Fundamental change: A change in the culture or identity of the organization
Building a capacity for change that, importantly, highlights both speed of
response and implementation excellence.
The first perspective could be considered to be consistent with the overall aim of
Business Excellence, which is the achievement of „world-class‟ performance, and the
second perspective could be considered to be consistent with the adoption of an
excellence philosophy, which allows the organization to achieve this transformational
goal. Indeed, Ulrich and Yeung (1989) found that critical competencies related to:
Helping to focus individual attention on organizational mind-sets;

71
Facilitating strategy implementation; and
Building change capability.
Higgs and Rowland (2000) developed a change management competency framework
defining eight clusters, which are given in Table 2-9. A thirty-scale instrument supported
the framework, which was derived following the observation of two organizations, that the
authors claimed had high face validity.
Table 2-9: Change management competencies
Competence Description
Change initiation Ability to create the case for change and secure credible
sponsorship.
Change impact Ability to scope the breadth, depth, sustainability and returns of a
change strategy.
Change facilitation Ability to help others, through effective facilitation, to gain insight
into the human dynamics of change and to develop the confidence
to achieve the change goals.
Change leadership Ability to influence and enthuse others, through personal advocacy,
vision and drive, and to access resources to build a solid platform
for change.
Change learning Ability to scan, reflect and identify learning and to ensure insights
are used to develop individual, group and organizational
capabilities.
Change execution Ability to formulate and guide the implementation of a credible
change plan with appropriate goals, resources, metrics and review
mechanisms.
Change presence Demonstrates high personal commitment to achievement of change
goals through integrity and courage, whilst maintaining objectivity
and individual resilience.
Change
technology
Knowledge, generation and skilful application of change theories,
tools and process.
Adapted from: Higgs and Rowland (2000)

72
In discussing their findings, Higgs and Rowland (2000) raised the question whether the
ability to lead change should be a core aspect of all leadership development. „There are
numerous writers currently claiming that this ability is really the only competency that will
make a difference to competitive advantage in the ever changing word of increased
globalisation, rapid technological shifts, and consumers demanding ever greater quality at
lower costs‟ (Higgs and Rowland (2000: p20)).
The change management competency framework has been subjected to limited empirical
testing (Higgs and Rowland (2001)). Research measured the response to the instrument
before and after a change management programme. The impact of the change
management programme on the demonstration of change leadership competencies was
tested. Qualitative data was given to support the findings. A statistically significant
impact was found for all eight competences except the change leadership element, which
is disappointing as this in the factor that is of most interest in the current work. Higgs and
Rowland (2001) called for more work in this area. A question mark remains over the
external validity of the instrument due to its limited application.
2.2.2 Implications of leadership for the current research The literature review in this section has identified a number of interesting issues. There is
evidence that leadership has an effect on organizational performance (e.g., Ireland and
Hitt (1999); Shea (1999); Prabhu and Robson (2001); Kanji and Sá (2001a)), which
supports its use in this study. Leadership is therefore confirmed as the key component
by which Business Excellence would be measured in the current work.
It is apparent that there are many leadership theories and although leadership features in
the current research it is only a component with the objective of representing Business
Excellence. The review uncovered two important studies linking leadership to Business
Excellence. The first of these was Prabhu and Robson‟s work using the „Pilot‟ based
instrument (Prabhu and Robson (2000)) and the second the „Leadership Excellence‟
instrument (Kanji and Sá (2001a)). These are potential instruments that will be
considered as part of the research methodology, which is outlined in Chapter 3.

73
2.3 Business Excellence and the resource-based view of the firm
This section commences by arguing that the resource-based view of the firm (RBV) is an
appropriate body of knowledge on which to base Business Excellence research. This is
followed by a review of the basics of the RBV as an introduction to what is a very large
body of knowledge. For this research there are three areas that are of particular interest
and each of these is covered in the following sections. Firstly, the sources of competitive
advantage are reviewed, as different authors have developed different terms for what
essentially are the same things. Secondly, how strategic capability is built is addressed
as the current research examined whether Business Excellence builds strategic
capability. Thirdly, the emerging area of dynamic capabilities has been reviewed as this
area introduces the external environment, which was a theme noted from the benefits of
Business Excellence section earlier in this Chapter. The resource-based view section
concludes by reviewing the implications of the RBV literature for the current research.
2.3.1 The RBV as a theory for Business Excellence Tena, Llusar et al. (2001) considered that the resource-based view of the firm provided a
useful theoretical base to explain the effects of Business Excellence on performance.
The basic argument was that Business Excellence can contribute to the improvement of
performance by encouraging the development of assets that are „specific, produce
socially complex relationships, are steeped in the history and culture of the company and
generate tacit knowledge‟ (Tena, Llusar et al. (2001: p934)). These correspond to the
conditions, which, according to the resource-based view, allow a sustained competitive
advantage (Barney (1991a)). Das, Handfield et al. (2000) held a similar view noting that
Business Excellence research reflects the RBV.
This same argument has been set out in previous work. According to Barney (1991a:
p93) Business Excellence „can further the development of a series of routines and of a
form of behaviour in the organization, which result from a process of learning and
experience within the company itself‟. Powell (1995) considered that other companies
could not precisely replicate Business Excellence as it allows for the creation of certain
isolating mechanisms that inhibit their reproduction. Savolainen (2000a) also held that a
commitment to Business Excellence can trigger an inimitable competitive advantage due
to its ability to encourage routines and guidelines within the company, which make it
difficult for potential imitators to gather resources for the successful reproduction of the
same strategy. Therefore, in line with the resource-based view, TQM becomes an
important competitive factor. In the same vein, following the arguments of Rose and Ito
(1996), the creation of knowledge through Business Excellence-linked activities helps in
the deployment of distinctive competencies at the heart of the organization.

74
2.3.2 Background to the resource-based view of the firm The resource-based view of the firm traces its roots to the Edith Penrose classic „The
theory of the growth of the firm‟ (Penrose (1959)). In the most recent version of this work
Penrose (1995) noted that many of the arguments within the original work have
strengthened over time. Penrose (1995: pxvii) noted „Another approach has been
recently centering on the „culture‟ of a firm to bind together the self-interest of the
members of the firm‟s community, from workers to top management‟, providing evidence
of the close think between this theory and Business Excellence. Rugman and Verbeke
(2002: p769) have argued that her influence in the resource-based field „has only partially
been as she intended‟, but this observation does not distract from the arguments with the
current work. More recently Ramos-Rodriguez and Ruiz-Navarro (2004: p1001) noted
that „Recently, the most important contribution to the (strategy) discipline proves to be the
resource-based view of the firm‟. The opinion was supported by a bibliometric study of
the Strategic Management Journal articles over the period 1980 to 2000 where it was
found that both Barney‟s 1991 paper and Welfert‟s 1994 paper had the biggest change of
influence in strategy research over the last seven year period of the study (Ramos-
Rodriguez and Ruiz-Navarro (2004)).
There are many excellent works dedicated to the resource-based view of the firm (e.g.,
Swords and Turner (1997); Kay (1998); Barney (2002)). Thomas, Pollock et al. (1999:
p71) described the resource-based view as „A conceptual framework for understanding
firm-level growth using resources as the basic building blocks. These resources may be
financial, intangible, physical, organizational or technological. The rate and direction of a
firm‟s growth is influence by how management conceptualizes the firm‟s resource base‟.
This process is at the centre of a Business Excellence approach (Tena, Llusar et al.
(2001)). The work by Thomas, Pollock et al. (1999) sought to review the current global
strategic analysis frameworks and approaches. They drew a distinction between a
resource-based view and core competence view and summarized the concepts of these
approaches (See Table 2-10). Their observations were informative but the division
between the two was not so clear when one widens the literature review beyond these
basic concepts. An important conclusion is that determining the resources that leads to
the competitive advantage is no easy task (Wernerfelt (1984); Grant (1991); Thomas,
Pollock et al. (1999); Priem and Butler (2001); Walsh and Linton (2001)).

75
Table 2-10: Strengths and weaknesses of the theoretical perspectives of the RBV
Theory Resource-based View Core Competence
Concept Firms possess inimitatable
resources that can be the
source of sustained competitive
advantage.
Firms possess certain skills or
competences that are difficult to
imitate and can be a source of
sustained competitive
advantage.
Strengths Focus on the firm level and
manager identifies sources of
competitive advantage relative
to competitors.
Focus on the firm level and
manager identifies sources of
competitive advantage relative
to competitors.
Weaknesses Does not provide guidelines for
determining what these
resources are, and whether or
not they are truly unique.
Does not provide guidelines for
determining what these
competences are, and whether
or not they are truly unique. It
is also a top down approach.
Adapted from: Thomas, Pollock et al. (1999)
Klavans (1994) noted that the intellectual roots of core competence research might be
found in the disciplines of economics, administrative science and strategy. Barney
(2001b) supported this noting that the resource-based view may be argued from the
perspectives of neoclassical economics, evolutionary economics or a strategic „Structure
– Conduct – Performance‟ Model. This literature review will concentrate on the resource-
based view from the strategy perspective.
In reviewing the literature 4 main theses were established. These themes, together with
the primary contributors, are listed in Table 2-11. Each of these areas will be covered in
more detail in the following sections with the first being covered in this section.
Wernerfelt (1984) sought to build on the earlier work of Penrose (1959) by advancing the
economic theory of the diversification and acquisition of firms based on their resources. It
was argued that resources and products were the two sides of a coin and this led to the
development of the resource-product matrix. Wernerfelt (1984), who was addressing
RBV from an economic perspective, used Porter‟s Five Forces to determine the economic
value of resources and his work led to the development of a mathematical model for

76
Table 2-11: Main themes identified from the resource-based view literature
Theme Description Main Contributors
Resource-based view of the firm The presence of Valuable, Rare, Inimitatable and Non-
substitutable resources leads to a competitive advantage.
Resource heterogeneity is central to the argument.
Penrose (1959); Wernerfelt (1984); Castanias and Helfat
(1991); Fiol (1991); Barney (1991a); Barney (1991b); Stalk,
Evans et al. (1992); Peteraf (1993); Barney, Wright et al.
(2001); Fiol (2001); Priem and Butler (2001); Sveiby
(2001); Barney (2001a); Barney (2001b); Soderling,
Lindhult et al. (2003)
Distinctive competences, skills,
core competences and
capabilities
The things that firms do better than their competitors,
which leads to a competitive advantage.
Selznick (1957); Andrews (1971); Lenz (1980); Snow and
Hrebiniak (1980b); Itami (1987); Aaker (1989); Grant
(1991); Hall (1991); Hall (1992); Leonard-Barton (1992);
Stalk, Evans et al. (1992); Amit and Schoemaker (1993);
Hamel (1994); Winterscheid (1994); Hamel and Prahalad
(1996); Durand (1998); Dess and Picken (1999); Hatton
and Rosenthal (1999); Winter (2000); Sussland (2001);
Tena, Llusar et al. (2001); Walsh and Linton (2001);
Wright, Dunford et al. (2001); Low and Kalufat (2002);
Kristensen and Westlund (2003)

77
Theme Description Main Contributors
Building strategic capability How the resources and capabilities are built over time so
that competitive advantage is achieved. This includes the
value of intangible resources such as knowledge,
technology, brands and the skills of people that lead to
competitive advantage.
Itami (1987); Dierickx and Cool (1989); Grant (1991); Hall
(1991); Klein, Edge et al. (1991); Hall (1992); Amit and
Schoemaker (1993); Pettus (2001); Tena, Llusar et al.
(2001); Barney (2002)
Dynamic capabilities Dynamic capability is a relatively concept introduced to
cater for the building of strategic assets recognizing
dynamic industry conditions.
Lenz (1980); Barney (1986); Lei, Hitt et al. (1996); Petts
(1997); Teece, Pisano et al. (1997); Zahra (1999);
Eisenhardt and Martin (2000); Galunic and Eisenhardt
(2001); Adner and Helfat (2003); Winter (2003); Zott (2003)

78
sequential entry into a market. This model focused on resource position barriers and
entry barriers and Wernerfelt proposed the concept of „attractive‟ resources that led to
competitive advantage.
Wernerfelt (1984) recognized the identification of the resources was difficult and, at the
time, the theory of their use was not well developed. As a consequence the difficulty in
identifying growth strategies based on resources other than product-based resources was
noted, these being many of the resources that fall within the scope of a Business
Excellence approach, such as technology, skilled personnel, stakeholder management,
efficient procedures and capital (Wernerfelt (1984: p172)).
Barney, who has been a major contributor in the area, sought to use a strategy
perspective to compare the RBV with an external environmental model Barney (1991a).
He has since argued that he could have used an economic perspective for his analysis,
but chose a Structure – Conduct – Performance approach as this was considered to
more appropriate at the time (Barney (2001b)). In Barney‟s 1991 landmark paper,
Barney noted two main assumptions with environmental models. These were they
assume that:
Firms within an industry or strategic group are identical in terms of the
strategically relevant resources they control and the strategies they pursue
Should resource heterogeneity develop this will be short-lived because the
resources used to implement the strategies are highly mobile
Barney proposed two alternative assumptions for the RBV. These were:
There may be resource heterogeneity
The resources may not be perfectly mobile
These assumptions and subsequent arguments led to the conclusion that firm resources
included all assets, capabilities, processes, attributes, etc controlled by the firm that are
used to used to improve its effectiveness and efficiency. Further, competitive advantage
is achieved when a firm is implementing a value strategy not being simultaneously
implemented by a current or potential competitor, and that sustained competitive
advantage is achieved when other firms cannot duplicate the benefits of the strategy. No
timeframe was put on the length of the sustainability.

79
Barney developed a framework that indicates that to hold the potential of being a
sustained competitive advantage a firm resource must have four attributes:
It must be valuable in that it exploits opportunities and/ or neutralizes threats in a
firm‟s environment. These are empirical indicators of how heterogeneous and
immobile a firm‟s resources are and thus how useful they are in generating
sustained competitive advantage
It must be rare among a firm‟s current and potential competition
It must be imperfectly imitatable. Resources are imperfectly imitable for one or a
combination of three reasons (borrowed from Dierickx and Cool (1989)):
o Unique historical conditions
o Casual ambiguity
o Socially complex
There cannot be strategically equivalent substitutes for this resource that are
valuable but neither rare or imperfectly imitable
Adapted from: Barney (1991a)
Figure 2-4: The relationship between resource heterogeneity and immobility, rareness, imperfect imitability and substitutability, and sustained competitive
advantage
The framework, shown diagrammatically in Figure 2-4, has supplied the footing for many
resource-based view studies, with subsequent work based on either this framework or an
extension. Table 2-12 provides a number of resource-based view definitions that refer to
Barney‟s conceptual work.
Firm resource heterogeneity Firm resource immobility
Value Rareness Imperfect imitability
History dependent
Causal ambiguity
Social complexity
Substitutability
Sustained competitive advantage

80
Table 2-12: Sample definitions of and relationships among underlying RBV constructs
Resource-based View Article Definitions and Underlying Relationships
Powell (1992b: p552) "The resource view holds that, in order to generate sustainable competitive advantage, a resource must provide
economic value and must be presently scarce, difficult to imitate, non-substitutable, and not readily obtainable in
factor markets (Dierickx and Cool (1989); Barney (1991a); Peteraf (1993)).”
Bates and Flynn (1995: 235) “This theory rests on two key points. First, that resources are the determinants of firm performance (Barney (1991a),
Shulze (1992)), and second that resources must be rare, valuable, difficult to imitate and non-substitutable by other
rare resources. When the latter occurs, a competitive advantage has been created (Barney (1991a)).”
Litz (1996: p1356) "Barney's (1991) conceptual work on resource characteristics was especially helpful. He proposed that resources
be characterized as simultaneously valuable, rare, non-substitutable, and inimitable. To the extent that an
organization's physical assets, infrastructure, and workforce satisfy these criteria, they qualify as resources."
Michalisin, Smith et al. (1997: p360) "Such resources, coined strategic assets, are simultaneously valuable, rare, imperfectly imitable and non-
substitutable (Barney (1991a)). RBV proponents assert that ownership or control of strategic assets determine [sic]
which firms can earn superior profits and which firms do not. Unfortunately, there is little empirical research to
support that prescription (Miller and Shamsie (1996)).”
Bowen and Wiersema (1999: p628-
629)
“... as the strategy literature argues, a firm's performance depends fundamentally on its ability to have a distinctive,
sustainable competitive advantage which derives from the possession and utilization of unique, non- imitable, non-
transferable, firm-specific resources (Wernerfelt (1984); Barney (1991a); Peteraf (1993))."

81
Resource-based View Article Definitions and Underlying Relationships
Brush and Artz (1999: p223) "... some gaps in the available theories raise new challenges. Barney‟s four criteria for resources to confer a
competitive advantage - value, rarity, imitability, and substitutability - are limited in their practical usefulness for this
problem because they are context insensitive (i.e., non contingent)."
Combs and Ketchen (1999: p869) “To be a source of sustained above-average performance, resources must meet three criteria. They must be: (1)
valuable, meaning buyers are willing to purchase the resources' outputs at prices significantly above their costs; (2)
rare, so that buyers cannot turn to competitors with the same or substitute resources; and (3) imperfectly imitable,
meaning it is difficult for competitors to either imitate or purchase the resources (Barney (1991a); Peteraf (1993))."
Rindova and Fombrum (1999: 694) “Resource-based theory (Penrose (1959); Barney (1991a)) attributes advantage in an industry to a firm's control
over bundles of unique material, human, organizational and locational resources and skills that enable unique value-
creating strategies (Barney (1991a)). Heterogeneous resources create distinct strategic options for a firm that, over
time, enable its managers to exploit different levels of economic rent (Barney (1991a); Peteraf (1993)). A firm's
resources are said to be a source of competitive advantage to the degree that they are scarce, specialized,
appropriable (Amit and Schoemaker (1993)), valuable, rare, difficult to imitate or substitute (Barney (1991a))."
Adapted from: Priem and Butler (2001)

82
Priem and Butler (2001) challenged the value of the resource-based view in strategic
management perspective and raised a number of concerns. Focusing on single-
businesses, they agued that there is a need for more conceptual work before the
resource-based view can meet the requirements of a theoretical structure, that the
resource-based view makes implicit assumptions about product markets in the same way
that environment-based models make implicit assumptions about resources, and the
fundamental „value‟ variable is exogenous to the resource-based view. They also
considered some issues from the perspective of strategy research. Firstly, they conclude
that that the number of definitions of resources makes it difficult to establish contextual
and prescriptive boundaries. This point is reinforced by the number of terms found in the
literature. Secondly, they noted that static, cross-sectional approaches to resource-
based view strategy development may result in causal „Hows‟ and „Whys‟ remaining in a
„Black-box‟. They called for research into the „Hows‟ questions in terms of how the
resource may be obtained and how and in what context the resource contributes to
competitive advantage. It is interesting that Edith Penrose was one of the first people to
understand the contents of the „black-box‟ and the value of intangible assets (Pitelis and
Whal (1998)). Finally, they stated that for the resource-based view to fulfil its potential „its
ideas must be integrated with an environmental demand model‟ (Priem and Butler (2001:
p35)), a point supported by Barney himself as he noted that „It seems likely that the
resource-based theory developed relative to SCP logic could be fully subsumed by
resource-based theory developed relative to neo-economics‟ Barney (2001b: 648). Fiol
(2001) also questioned the basis of the RBV in the context that the theory of the
sustained competitive advantage has become outdated. It has been argued that the
concept of a sustained competitive advantage is outdated (Powell (2001)).
Priem and Butler (2001) raised four areas of concern regarding the resourced-based view
and in particular the work of Barney (1991a). These were that:
1. The resource-based view is tautological
2. It fails to acknowledge that many different resource configurations could generate
the same value for firms and, thus, would not be the sources of competitive
advantage
3. The role of product markets is underdeveloped in the argument
4. The theory developed in the article has limited prescriptive implications
In responding to the tautological criticism, Barney (2001a: p42) stated “The ability to re-
state a theory in ways that make it tautological provides no insights about its empirical
testability of the theory whatsoever”. Barney (2001a) concluded that the real issue is
whether aspects of the resource-based theory can be parameterized in ways that can

83
generate testable hypotheses. He continued by exploring the ways that this could be
done for the components of the resource-based theory. A summary of his conclusions
has been given in Table 2-13.
Table 2-13: Parameterizing Barney’s resource-based theory components
Resource-based
Theory
Component
Comments
Value Work to define resource value falls into two large categories:
Structure – Conduct – Performance (S-C-P) based
theories to specify the conditions under which different
firm resources will be valuable
Efforts to determine the value of the firm resources that
apply to other theories derived from industrial organization
modules (I/O) of perfect and non-perfect competition.
Rarity Barney (2001a: p43-44) noted that „A complete parameterization
of rare would enable a researcher to specify the maximum number
of competing firms that can possess a particular resource and still
have perfect competition based that resource‟. Barney
acknowledged that there is not a rigorous theory that allows such
a number to be determined and calls for more research in this
area.
Imitability Barney (2001a: p45) argued that a firm that possesses a particular
valuable resource (where the value of that resource is determined
in ways that are erogenous to the theory developed in the 1991
article) that is rare (possessed by fewer firms than required to
generate perfect competition dynamics) and obtained in unique
historical circumstances can gain a sustained competitive
advantage (i.e., can improve its efficiency and effectiveness in
ways that competing firms cannot and in ways that competing
firms cannot imitate over time).
Adapted from: Based on Barney (2001a)
The second point raised by Priem and Butler (2001) related to the equifinality in the
resource-based view, which means that other firms may achieve above average profits
from a set of quite different resources (Bowman and Ambrosini (2001)). Barney‟s
response to this point was to remind the reader of the concept of substitutability, which is

84
defined with respect to strategic equivalence. As stated in the 1991 paper, „Two valuable
firm resources …are strategically equivalent when they can each be exploited separately
to implement the same strategies‟ (Barney (1991a: p111)). The general conclusion is
that even if a resource is valuable, rare, and costly to imitate, if it has strategically
equivalent substitutes that are themselves not rare or costly to imitate, then it cannot be a
source of sustained competitive advantage.
Barney (2001a) also noted that Priem and Butler (2001) defined competitive advantage
as „systematically creating above average returns‟, which, by including a reference to the
industry, is in contradiction to Barney‟s definition as Barney defined competitive
advantage at the firm level. Barney (2001a: p48) gave two ways that this may be
achieved at the firm level. Firstly, it may be defined with respect to the actions of other
firms – either current or potential competitors. In this approach a firm is said to have
competitive advantage when it is engaging in activities that increase its efficiency or
effectiveness in ways that competing firms are not, regardless of whether those other
firms are in a particular firm‟s industry (Barney (1991a)). Henderson and Mitchell (1997)
have since noted that there is a lack of understanding of the interactions between an
organization and its competitive influences.
The second way an organization may create a competitive advantage, economic rent, is
to define competitive advantage in respect to return expectations of that firm‟s owners.
Stockholders, as residual claimants, develop expectations about returns a firm will
generate, so it is argued that firms that generate higher returns than expected at constant
levels of risk have a competitive advantage. It is interesting to note from the benefits of
Business Excellence literature Easton and Jarrell (1998) witnessed „excess unexpected
performance‟ from organizations that had adopted Business Excellence.
The fourth concern raised by Priem and Butler (2001) relates to its limited prescriptive
ability and this argument has important consequences for the current thesis. The
argument and counter-arguments are summarized in Table 2-14. It is clear that the
identification of the resources that led to the advantage is a challenge. The need for a
dynamic research approach is a concern due to the limitations placed on the current
research thesis. These concerns will be addressed in Chapter 3 when we turn to the
research design.

85
Table 2-14: Inapplicability arguments and counter-arguments
Area of Concern Argument
Priem and Butler (2001)
Counter-argument
Barney (1991a)
Managerial manipulation of
resources
Many of the attributes of resources
that make them likely to be sources
of competitive sustained
competitive advantage, especially
path dependence and social
complexity, are not amenable to
managerial manipulation
Although Priem and Butler may be correct, resource-based logic has several
important practical implications for managers. These include:
Identifying resource deficiencies to gain strategic parity
Extension and protection of existing resources that can lead to
competitive advantage
It is noted that there are some prescriptive limits. Firstly, the identification of
the resources may not be possible. Secondly, it cannot be used to create
sustained competitive advantage when the potential for such advantage does
not exist.
All-inclusive definition of resources „Resources‟ cover so many things
that the use of the theory is limited
The theory did not claim that a list of resources can be generated to gain
sustained strategic advantage and such resources would be context specific as
value is set within a market context. The theory does, however, provide the
attributes that any valuable resource must possess.
Static resource-based logic Much of the work subsequent to
1991 has been static rather than
dynamic
Barney agreed that this is a concern and noted that dynamic research where
the conditions under which the resources are developed or acquired in one
period have implications for the strategic advantages of a firm in subsequent
periods is particularly important.

86
Although a strategic perspective is the main focus of this thesis, the work of Peteraf
(1993) is worthy of inclusion. Her paper, „The cornerstones of competitive advantage‟,
provided an insight into an economic viewpoint of the RBV. Four conditions are listed, all
of which must be met, in order to achieve competitive advantage. The first of these is
resource heterogeneity, from which comes Ricardian or monopoly rents. Ex post limits to
competition are necessary to sustain the rents. Imperfect resource mobility ensures that
the rents are bound to the firm and shared by it. Ex ante limits to competition prevent
costs from offsetting the rents. There is a whole body of knowledge addressing the RBV
from an economics perspective but this was outside the scope of the current study.
Although this section has focused on the RBV, several other competing or complimentary
theories (depending on one‟s viewpoint) have emerged over the years. Sveiby (2001)
developed „A knowledge-based theory of the firm‟, which is stated to start with the
competence of people (Sveiby (2001). People in organizations can use their
competences to create value mainly in two directions: externally and internally. It was
noted that tangible goods tend to depreciate when transferred, but knowledge grows
when it is used and depreciates when not used, so a principle of the knowledge-based
view is to use knowledge transfers to create value. It was also noted that such transfers
lead to both tangible and intangible assets (Sveiby (2001)) and that, in line with Allee
(2000), value networks are an appropriate vehicle for studying the knowledge transfers.
Sveiby (2001) developed nine knowledge transfer opportunities. One limitation of the
theory is that it has only been applied to one situation involving two organizations (Sveiby
(2001) and to date there is no evidence of any empirical testing. There is some support
for the perspective from Itami (1987) who listed three types of information flow involving
both the internal and external environments.
The practice-based view was described by Soderling, Lindhult et al. (2003). This theory
is based on the assumption that there are practices that, in combination and when
effectively linked together, can be expected to consistently improve operational
performance and thus provide firms who adopt them with an advantage over those that
do not. Thus, good business practices, and the learning and knowledge creation
developed through using them, can be thought of as the base or foundation on which
distinctive capabilities and hence competitive advantage is built. Soderling, Lindhult et al.
(2003) have noted that Eisenhardt and Martin (2000) connected dynamic capabilities with
business processes and highlight the contribution of best practice transfer. The practice-
based view has particular relevance for the current research as processes are at the
heart of Business Excellence. Table 2-15 compares the practice-based view to the
resource-based view of the firm.

87
Table 2-15: Comparison of the RBV and PBV from a strategic perspective
Resource-based View Practice-based View
Conceptualization of the
firm
Bundle of resources Network of business
practices
Measure of competitive
advantage
Firm specific resources Operational efficiency in
performance of practices
Process of competitive
advantage
VRIN (valuable, rare,
inimitable, non-substitutable
resources/ resource
combinations)
Closeness to best practice
in different process areas,
coordination of practices
Process of strategy
development
Path dependence Equifinality of paths
Development of competitive
advantage
Dynamic capabilities as
ability to use and develop
resources
Learning approaches and
practices to improve
existing business practices
Adapted from: Soderling, Lindhult et al. (2003)
Similar to the practice-based view is the process-based view of the firm (Hatton and
Rosenthal (1999)). One of the key features of their model is the „three Cs‟: Customer
relations, Capabilities and Competences. Capabilities are measures of the performance
of business processes along dimensions defined by customers' needs and expectations
(time, cost, quality, functionality, flexibility and acuity). The market test of a capability is
whether it satisfies the firm's target customers. The competitive test is whether those
customers judge the firm advantaged, compared to its rivals on that dimension, and
positioned to be their preferred supplier.
Competencies are measures of the organization's potential to conduct business at the
state-of-the- art in both the firm's input markets (labour, capital, information and
technology) and its output markets with its customers. Competencies are cognitive
characteristics of an organization, its 'know-how', and are typically tied to business
functions. The organization gains competitive power when its competences are
marshaled through cross-functional process design and levered with materials, labour
and capital in action (Hatton and Rosenthal (1999)).

88
Other theories include the Managerial Rents model (Castanias and Helfat (1991);
Castanias and Helfat (2001)), the Identity-based View (Fiol (1991); Fiol (2001)), and
Competency-based Competition (Stalk, Evans et al. (1992); Sirkin and Stalk (1995)) to
name just three. In reading this literature it is clear that these are all variations of the
common theme of creating a sustainable advantage. The next section reviews the
research that has been conducted with a view to isolating the sources of competitive
advantage.
2.3.3 Distinctive competencies, skills, core competencies and capabilities
One of the problems faced by a researcher in this field is the number of different terms
that are used to describe similar things (Priem and Butler (2001); Anderson (2004)). In
this section the literature has been reviewed with the objective of defining a typology to
support the research whilst at the same time, examining the empirical work that has been
conducted in this field.
Selznick (1957) has been given credit for the first use of the term „Distinctive
Competences‟, which Andrews (1971) described as a set of things that an organization
does particularly well relative to its competitors.
Snow and Hrebiniak (1980b) examined the relationship between strategy, distinctive
competence and organizational performance. Four industries were selected for the study
reflecting different levels of uncertainty. The central hypothesis was that the different
strategies for Defender, Prospector, Analyzer and Reactor would lead to different
distinctive competencies. Defenders will look towards manufacturing to reduce costs,
with prospectors focusing on product and market development to capitalise on new
products. Analyzers were expected to display a mix of the two and Reactors were
expected to have limited distinctive competencies and, as a consequence, be doomed to
failure. Success was measured in terms of profit (the ratio of total income to total assets).
Table 2-16 summarizes some of the results from the survey of top managers of 236
organizations and gives an indication of the types of distinctive competencies that were
found. Snow and Hrebiniak (1980b) noted that the managerial perceptions of
competence varied both within and across organizations in the same industry. One other
important conclusion was that Reactors, with limited distinctive competences, could be
successful in highly regulated industries.

89
Table 2-16: Top managers’ rankings of distinctive competences, by strategy & industry
Strategy Plastics Semi-conductors Automotive Air Transportation
Defender General management
Financial management
Production
Marketing/ Selling
Applied engineering
General management
Production
Financial management
Financial management
General management
Production
Applied engineering
Financial management
Marketing/ Selling
General management
Production
Prospector Product research and development
Marketing/ Selling
General management
Distribution
Financial management
Product research and development
General management
Basic engineering
Production
Marketing/ Selling and Basic engineering Tie)
Financial management
Marketing/ Selling
General management
Basic engineering
Analyzer Distribution
Production
Personnel
Financial management
Production
General management
Financial management
Applied engineering
Financial management
General management
Applied engineering
Legal affairs
Financial management
General management and Legal affairs (Tie)
Production
Marketing/ Selling
Reactor Personnel
Financial management
Production
Applied engineering
Financial management
Production
Marketing/ Selling
Legal affairs
Marketing/ Selling
Production
Distribution
Applied engineering and Financial management (Tie)
Financial management
General management
Marketing/ Selling
Applied engineering and Production (Tie)
Adapted from: Snow and Hrebiniak (1980b)

90
Tena, Llusar et al. (2001) defined four dimensions to Total Quality Management that
underpinned their model:
1. Customer focus
2. Continuous improvement
3. Employee fulfilment
4. The organization as a total system.
Adapted from: Tena, Llusar et al. (2001)
Figure 2-5: Model for the relationship between Business Excellence and performance
They also noted that the creation of knowledge through TQM-linked activities helps the
deployment of distinctive competences at the heart of the organization and listed several
of these (Table 2-17). Tena, Llusar et al. (2001) developed a research model where the
wealth of the firm‟s distinctive competencies acts as a mediating variable in the
relationship between TQM and the generation of improved performance. The work
concluded that TQM had a positive relationship with performance and on distinctive
competencies. The distinctive competencies also had a positive relationship with
performance.
Itami (1987) defined invisible assets as the key to competitive advantage, with a
particular interest in informational resources. He stated that the concept of the firm gives
CustomerFocus
ContinuousImprovement
EmployeeFulfilment
TotalSystem
Business
ExcellencePerformance
DistinctiveCapabilities

91
three components of strategy: Products and markets (what to sell, and to whom),
Operations mission (what to do in-house) and Corporate resources (what resources are
required). This observation is consistent with that of Barney (1991a), but it adds the
operations dimension as Itami notes that such assets are built through day to day
operations.. Itami (1987) also noted that a firm‟s strategy requires five types of fit and this
fit must be both short-term and long-term. These five types of fit are the environmental fit
with technology, competition and customers, the fit with resources and the fit with the
organization (the way that organization controls its people).

92
Table 2-17: Distinctive competencies
Competence Description
Managerial
competencies
TQM allows for both the company's adaptation to its environment
and the deployment of leadership abilities through the articulation
and communication of a shared vision (Webley and Cartright
(1996)).
Employee know-
how
TQM contributes to the enhancement of know-how through human
resources policies that encourage employee creativity (Bowen and
Lawler (1992)).
External co-
operation skills
TQM breaks down the organization's frontiers and favours the
setting up of associate relationships with both clients and
suppliers (Rao, Solis et al. (1999)).
Creation of a
collective mind
TQM gives rise to the creation of a principle of cooperation as
opposed to a principle of conflict between members of the
organization (Watson and Korukonda (1995)).
Organizational
commitment
TQM-related initiatives imply favourable attitudes towards the
internalization of the goals and values of the company, along with
a willingness to make an effort for the benefit of the organization
and feel a part of it (Allen and Brady (1997)).
Stimulation of the
organizational
learning process
The TQM initiative stimulates the organization to learn how to
solve problems by following structured and scientific processes
(Wruck and Jensen (1998)).
Speed and flexibility
in the design of new
products or services
TQM favours a reduction in the variability of processes and in lead
times, and also promotes the decentralization of the decision-
making process, and the use of techniques such as quality
function deployment (QFD), which allow for customer needs to be
incorporated into design specifications (Youssef, Boyd et al.
(1996)).
Reputation TQM contributes to the improvement of the company's reputation,
through the good relationships maintained with clients, suppliers
and amongst the employees themselves, and through the
generation of high expectations in the attainment of good
performance (Lemak and Reed (1997)).
Adapted from: Tena, Llusar et al. (2001)

93
Aaker (1989) differentiated between an asset, which is something that a firm possesses
superior to competition, and a skill, which is something a firm does better than
competitors. Taking an evolutionary economics perspective, Nelson and Winter (1982:
p73) defined a skill as „a capability for a smooth sequence of coordinated behaviour that
is ordinarily effective relative to its objectives given the context which it normally occurs‟.
Aaker (1989) also argued that sustainable competitive advantage is created through the
way the firm competes (product strategy, positioning strategy, sourcing and pricing
strategy, etc), where the firm competes (market selection, competitor selection) and that
the bases of competition are the firm‟s assets and skills.
Four questions to guide the implementation of a strategic focus on assets and skills have
been posed (Aaker (1989)):
What are the relevant skills and assets for your industry? What assets and skills
either should be obtained or neutralized if you are to compete successfully?
What is, or should be, the assets and skills that underlie your sustainable
competitive advantage (SCA)? Of the set of relevant assets and skills, how do
you select the optimal ones to develop, strengthen or maintain?
How can you go about creating assets and skills that support SCAs?
Finally, how can formidable assets and skills of competitors be neutralized?
In his work Aaker (1989) surveyed 248 managers of strategic business units from the
Northern California area to ask them what the sustainable competitive advantage of their
business was. A mix of organizations was chosen representing different industries and
the top 10 responses are given in Table 2-18.

94
Table 2-18: Sustainable competitive advantage of 248 organizations
Reported Sustainable
Competitive Advantages
High-
Tech
Service Other Total
Reputation for quality 26 50 29 105
Customer service/ Product support 23 40 15 78
Name recognition/ High profile 8 42 21 71
Retain good management and
engineering staff
17 43 5 65
Low cost production 17 15 21 53
Financial resources 11 26 14 51
Customer orientation/ Feedback/
Market research
13 26 9 48
Product line breadth 11 7 9 46
Technical superiority 30 7 9 46
Installed base of satisfied customers 19 22 4 45
Adapted from: Aaker (1989)
A number of conclusions may be drawn from Table 2-18. Firstly, of the top 10 SCAs, 5
may be classified as assets and 5 as skills (customer service, staff retention, low cost
manufacturing, customer orientation and technical superiority), with 3 of the assets being
tangible (financial resources, product line breadth and customer base) and 2 intangible
(reputation for quality and profile). Secondly, all these sustainable competitive
advantages are consistent with a Business Excellence approach. Thirdly, it is not
possible to align the assets and skills with particular types of industry given the data
presented.
Unlike Aaker (1989) who referred to assets and skills, Prahalad and Hamel (1990) talked
of „Core Competences‟. These are deemed to be more than a bundle of skills and
technologies, with the skills being organizationally integrated in some way and not the
property of individuals or small teams. Core competences are also considered to be
more than an asset as used in an accounting sense. They are defined as the product of
a learning process incorporating both tacit and explicit knowledge, the value of which
tends to appreciate rather than depreciate over time, and they are said to deliver high

95
customer benefit (value). Winterscheid (1994) noted „clusters‟ of tangible and intangible
assets spanning individuals and groups, thereby enabling the performance of distinctive
activities. Core competences also suffer from what Priem and Butler (2001: p33)
described as the „In search of excellence‟ problem, where „it is quite easy to identify, a
posteriori, many “valuable” resources in high-performing firms‟. Authors have also warned
against the dangers of core competences become core rigidities (Leonard-Barton (1992);
Johnson and Scholes (2002)).
In line with Barney (1991a), core competences are in some sense unique and sustainable
if they are to convey competitive advantage (Prahalad and Hamel (1990)). In doing so
they provide a gateway to new markets. In later work Hamel (1994) stated that core
competences were divided into three types:
1. Market-access competences which bring the firm into contact with its customers
2. Integrity-related competences which enable the firm to do things better and faster
and to a higher quality than their competitors
3. Functionally-led competences that confer distinctive customer benefits
Walsh and Linton (2001) supported the core competence view and have developed „The
Competency Pyramid‟ as a mechanism for determining core competences. Based on the
thoughts of Tsu (1988), the competencies are sub-divided into two categories: Physical
product production and Service product production. Physical production competencies
are sub-divided into materials competencies, and fabrication and assembly
competencies. The Service production competencies are sub-divided into knowledge-
based competencies and knowledge-embedded competencies. One is reminded of the
„Hard‟ Vs „Soft‟ classification of Business Excellence critical success factors discussed
earlier (Rahman (2004)).
Stalk, Evans et al. (1992) referred to „capability-based competition‟ where capabilities are
more broadly based than core competences. Many other authors have used the term
„capability‟ (e.g., Amit and Schoemaker (1993); Walsh and Linton (2001)) and although
many authors (such as Nelson and Winter (1982); Barney (1991a); Walsh and Linton
(2001)) inferred that processes are the driving force behind capabilities Stalk, Evans et al.
(1992: p62) mentioned the connection explicitly by stating that „A capability is a set of
business processes strategically understood‟. The work is limited, however, by the fact
that the capabilities-based competition theory is based on the observation of just two
organizations, Wal-Mart and Kmart. In reviewing the success of Wal-Mart and other
organizations, Dess and Picken (1999) supported Stalk, Evans et al. (1992) in their view

96
that processes are at the centre of the success and talk in terms of the need to perform a
„Strategic Inventory‟ based around Porter‟s value chain.
The capabilities-based competition theory does have four principles (Stalk, Evans et al.
(1992)):
1. The building blocks of corporate strategy are not products and markets but
business processes
2. Competitive success depends on transforming a company‟s key processes into
strategic capabilities that consistently provide superior value to the customer
3. Companies create these capabilities by making strategic investments in a support
infrastructure that links together and transcends traditional strategic business
units and functions
4. Because capabilities necessarily cross functions, the champion of a capabilities-
based strategy is the CEO
On a more academic basis, Winter (2000) introduced the „Satisficing Principle‟ on
capability learning. In his paper Winter (2000: p983) defined an organizational capability
as „a high-level routine (or collection of routines) that, together with its implementing input
flows, confers upon an organization‟s management a set of decision options for
producing significant outputs of a particular type‟ and satisfying as a theory of choice
focused on the process by which alternatives are examined and assessed. Overt
learning is a key principle of the theory and Winter (2000) suggested that it may be
triggered by either a crisis or the need for a continuous improvement programme.
Building on the process theme, Grant (1991) talks of resources, which are inputs to the
production process and capabilities, which operate on the resources to perform some
task. Whilst resources are the source of a firm‟s capabilities, capabilities are the main
source of its competitive advantage. Grant (1991) noted that the case for making
resources and capabilities of the firm the foundation for its long-term strategy rests upon
two premises. First, internal resources and capabilities provide the basic direction for a
firm‟s strategy. Second, resources and capabilities are the primary source of profit for the
firm. He continued by stating that a firm‟s business strategy should be viewed less as a
quest for monopoly rents (the returns to market power) and more a quest for Recardian
rents (the returns to the resources which confer competitive advantage over and above
the real costs of resources).

97
Amit and Schoemaker (1993: p35) also made a distinction between resources, which are
defined as „stocks of available factors that are owned or controlled by the firm ….
converted into final products or services by using a wide range of other firm assets‟, and
capabilities, which relate to a firm‟s capacity to deploy the resources. Capabilities are
„information-based, tangible or intangible processes that are firm specific and are
developed over time through complex interactions among the firms‟ resources‟. This view
was supported by Makadok (2001), who defined a resource as an observable (but not
necessarily tangible) asset that can be valued and traded-such as a brand, a patent, a
parcel of land, or a license. A capability, on the other hand, is not observable (and hence
necessarily intangible), cannot be valued, and changes hands only as part of its entire
unit.
Grant (1991) identified six major categories of resources: Financial, physical, human,
technological, reputation and organizational resources. He noted that there is a major
problem in valuing intangible resources, as they have no market price. Grant‟s approach
was to take the difference between stock market value of the firm and the replacement
value of the tangible assets (Book value), although he has since expressed the view that
option evaluation may be a better approach (Grant (2004b)).
Grant (1991) used the methodology described by Snow and Hrebiniak (1980b) to classify
the firm‟s activities and makes a connection to the „organizational routines‟ described by
Nelson and Winter (1982). With the relationship between resources and capabilities, a
key ingredient between the resources and capabilities is the ability to get cooperation and
coordination within teams. This requires that an organization motivates and socializes its
members in a manner conducive to the development of smooth running routines. The
organization‟s style, values, traditions and leadership are critical encouragements to the
cooperation and commitment of its members. These can be viewed as intangible
resources that are common ingredients of the whole range of a corporation‟s
organizational routines. This is an important point as it is conducive with a Business
Excellence approach and reinforces the importance of leadership, which is a key theme
of this thesis. It is also noted that capabilities deriving from a single source are not so
sustainable. The relationship between the RBV and Business Excellence is further
supported by the views of Durand (1998), who defined the three dimensions of
competence given in Figure 2-6.

98
Adapted from: Durand (1998)
Figure 2-6: Three dimensions of competence
Wright, Dunford et al. (2001) drew a comparison between the RBV and Strategic Human
Resource Management, noting that RBV had put people on the radar screen. They noted
that a number of RBV concepts proposed as sources of competitive advantage turn the
researchers‟ attention between the intersection of strategy and human resource issues.
These concepts included Culture/ corporate identity, Knowledge, Learning organizations
and Leadership.
Knowledge•Data•Information
•Knowledge
Attitudes•Behaviour
•Identity•Will
Know-how•Skills
•Capabilities•Know-how
Shared vision
OrganizationalStructure
Management Processand Routines
Identity
Knowledge•Data•Information
•Knowledge
Attitudes•Behaviour
•Identity•Will
Know-how•Skills
•Capabilities•Know-how
Shared vision
OrganizationalStructure
Management Processand Routines
Identity

99
Table 2-19: Typology of competences
Term Description References
Distinctive capabilities A set of things that an organization does particularly well relative to its
competitors.
Selznick (1957); Andrews (1971); Snow and
Hrebiniak (1980b); Tena, Llusar et al. (2001)
Strategic capability The capability of an enterprise to successfully undertake action that is
intended to affect its long-term growth and development
Lenz (1980)
Invisible assets Informational resources as essential for effective operation as the more
visible corporate resources.
Itami (1987)
Strategic capabilities Complex bundle of skills and accumulated knowledge that enable firms to
coordinate activities and make use of their assets
Day (1990) as cited by Desarbo, Di Benedetto
et al. (2005)
Intangible resources May be classified as assets and competences. Assets are things that a
company owns and has a sense of „belongingness‟. Competences are
things that companies „do‟.
Hall (1994)
Assets and skills Assets are something that a firm processes superior to competition
A skill is something a firm does better than competitors.
Aaker (1989); Castanias and Helfat (1991);
Castanias and Helfat (2001)
Core competences The product of a learning process incorporating both tacit and explicit
knowledge, the value of which tends to appreciate rather than depreciate
over time, and they are said to deliver high customer benefit (value).
Leonard-Barton (1992); Winterscheid (1994);
Hamel and Prahalad (1996); Javidan (1998);
Walsh and Linton (2001)
Strategic competences Capabilities used to deliver services in service industries that result in
superior rents.
Douglas and Ryman (2003)
Capabilities A capability is a set of business processes strategically understood. Stalk, Evans et al. (1992); Dess and Picken
(1999); Hatton and Rosenthal (1999)

100
Term Description References
Organizational capability A high-level routine (or collection of routines) that, together with its
implementing input flows, confers upon an organization‟s management a
set of decision options for producing significant outputs of a particular type.
Winter (2000)
Resources and capabilities Resources are inputs to the production process.
Capabilities operate on the resources to perform some tasks, which leads to
a competitive advantage.
Grant (1991); Amit and Schoemaker (1993);
Makadok (2001)

101
This sub-section has sought to review the literature on the definition of the resources and
capabilities that relate to the activities of a firm that lead to competitive advantage. A
summary is provided in Table 2-19. Anderson (2004) provides a useful summary putting
the various terms into context. This is shown in Figure 2-7.
Adapted from: Anderson (2004)
Figure 2-7: RBV typology
Skills Individual level
Processes, routines Organizational, recombinant
Capabilities
Distinctive capabilities
Resources
Reliable capacity to produce an outcome
Outcomes no one else producesat the same level
Hard to copy factors that underpin distinctive capabilities
Skills Individual level
Processes, routines Organizational, recombinant
Capabilities
Distinctive capabilities
Resources
Reliable capacity to produce an outcome
Outcomes no one else producesat the same level
Hard to copy factors that underpin distinctive capabilities

102
2.3.4 Building strategic capability A recurring theme is the need to understand the relationship between resources,
capabilities, competitive advantage and profitability in order to apply a resource-based
approach to strategy formulation. Grant (1991) argued that the implications of the RBV
are unclear for two reasons: there is no single integrating framework and there has been
little effort to develop the practical implications of the theory. To further the field of study,
Grant (1991) proposed a „practical‟ framework, which is shown in Figure 2-8.
Adapted from: Grant (1991)
Figure 2-8: A resource-based approach to strategy analysis: A practical framework
In evaluating rent-earning potential of the resources and capabilities, Grant (1991) stated
that the returns depend on 2 key factors: the sustainability of competitive advantage over
time and the ability to appropriate rents earned from the resources and capabilities.
Appropriability is defined as the ability of a firm to capitalize on its resources and
capabilities. This is especially the case if the capability is derived through the
organization‟s people.
Strategy
Competitive
Advantage
Capabilities
Resources
5. Identify resource gaps
that need to be filled.
Invest in replenishing,
augmenting and
upgrading the firm's
resource base.
4. Select a strategy that best
exploits the firm’s resources and
capabilities relative to external
opportunities.
3. Appraise the rent-generating potential
of resources and capabilities in terms of:
(a) their potential for sustainable
competitive advantage, and
(b) the appropriability of their returns.
2. Identify the firm’s capabilities:
What can the firm do more effectively
than its rivals? Identity the resources
inputs to each capability and the
complexity of each capability.
1. Identify and classify the firm’s
resources. Appraise strengths and
weaknesses relative to
competitors. Identity
opportunities for better utilization
of resources.

103
Table 2-20: Determinants of sustainable competitive advantage
Determinant Explanation
Durability How fast the resources and capabilities depreciate or become
obsolete.
Transparency How fast firms can imitate requires two problems to be
overcome:
1. The information problem: What is the competitive
advantage of the successful rival?
2. The strategy duplication problem: How will the rival
obtain the resources and capabilities to imitate the
strategy?
These are both problems of transparency. The more uncertainty
within a market over how successful companies „do it‟, the more
inhibited the potential entrants and the higher the level of profits
that established firms can maintain within the market. This
relates to theory of „uncertain imitability‟ (Lippman and Rumelt
(1982)).
Transferability The ease of amassing the necessary resources and capabilities.
Sometimes this is not easy and imperfections in transferability
may come from several sources:
Geographical immobility: The cost of relocating capital
equipment and people.
Imperfect information: Do not know the value of the
resources and its productivity. This is built up over time.
Firm-specific resources: The value of the resource falling
on transfer due to a decline in its productivity, e.g., a
change in the ownership of a brand name.
The immobility of capabilities: Capabilities are much less
mobile. They require the transfer of the whole team.
Replicability Imperfect transferability of resources and capabilities limits the
ability of a firm to buy the means to imitate success. The firm
therefore tries to replicate the resources and capabilities through
internal investment.
Adapted from: Grant (1991)

104
Over the long-term, competitive advantage is eroded through depreciation and through
imitation. The speed of erosion depends on the characteristics of the resources and
capabilities. Four determinants of sustainability of competitive advantage have been
defined and these are given in Table 2-20. Table 2-20 views the capabilities from the
perspective of their erosion, but we are equally interested in how these capabilities are
developed in the first instance. This is the area of the literature that we now turn to.
An effective strategy builds strategic assets and future strategy must make effective use
of the resources that have been amassed. Hamel (1994) described an approach to
building core competencies, deploying them and protecting them once they have been
identified. Invisible assets are accumulated in two ways (Itami (1987)):
The direct route, where a firm takes explicit actions to achieve the goal
The operations route, in which assets are accumulated as by-products of daily
operations
Hall (1991) also had an interest in intangible resources and chose to categorize the
intangible resources into those that were people independent and those that were people
dependent. The people independent intangible resources were sub-categorized into
those with legal protection and those without legal protection. The people dependent
intangible resources were listed as know-how (employee, suppliers and distributors),
networks, organizational culture (e.g., cope with change, put the customer first) and
reputation. The 1992 work included a survey of 100 CEOs that had a 29% return rate
(N=29). A later paper reported work with a larger samples size but the 1991 paper gave
an indication of the importance of the intangible resources as well as the ranking. The
results of Hall‟s survey are given in Table 2-21. The paper also included data on
„replacement periods‟ and evidence of a relationship between sales growth and the
perceived lead in employee know-how. The paper called for research between employee
know-how and core competences.

105
Table 2-21: The relative importance of the contribution each intangible resource made to the overall success of the business in 1990
Importance rating scale: Insignificant 1, to Critical 5 (N=29)
Intangible Resource Average Importance
Ranking Rating
Company reputation 1 4.3
Employee know-how 1 4.3
Product reputation 1 4.3
Networks 4 3.9
Specialist physical resources 5 3.5
Supplier know-how 6 3.3
Intellectual property rights 7 2.9
Contracts 8 2.9
Distributor know-how 9 2.7
Trade secrets 9 2.7
Public knowledge 11 2.5
Adapted from: Hall (1991)
Hall (1992) reminded us that Itami (1987) argued that a characteristic of successful
organizations is the recognition that there is a learning process that runs in parallel with
all operations that enhances intangible assets. Hall‟s work built on his 1991 paper and
the work of Coyne (1986), who identified four sources of sustainable competitive
advantage. This resulted in the model shown in Figure 2-9, which has two types of
resource – Assets and Competencies, leading to four types of „Capability Differential‟ that
in turn leads to a competitive advantage. Comparison of Hall‟s model with the EFQM
Excellence Model® indicates that all the elements of the former model are to be found in
the EFQM Excellence Model®.

106
Type of Resource Type of Capability Differential
Su
sta
inab
le C
om
peti
tive A
dvan
tag
e
Assets
Assets Within A Legal Context
Contracts
Licences
Intellectual property
Owned physical
resources
Regulatory Differential
(Protectable in Law)
Assets Without A legal Context
Reputation
Networks
Databases
Positional Differential
(Due to skills and
experience)
Competencies
Know-How
Employee know-how
Supplier know-how
Distributor know-how
Etc.
Functional Differential
(Due to skills and
experience)
Organizational Culture
Perception of quality
Ability to manage change
Perception of service
Etc.
Cultural Differential
(Aptitudes of the
organization)
Adapted from: Hall (1992)
Figure 2-9: Intangible resources, capability differentials and sustainable competitive advantage

107
Hall‟s 1992 paper contained additional data over the 1991 paper as it gave a comparison
between two years, 1987 and 1990. The total sample size is larger in the later paper but
it is not clear if this increased sample includes both surveys, or whether it represents a
separate survey. Whatever the case the sample size was larger, which indicates that the
data may be more reliable and may explain why the ranking order has changed from the
1991 paper. The relative importance of the contribution made by each intangible
resource to the overall success of the business for the two years is given in Table 2-22.
Table 2-22: Relative importance of intangible resources in 1987 and 1990
1 Most Important to 13 Least important (N=95)
Intangible Resource Ranking
1990 1987
Company reputation 1 1
Product reputation 2 2
Employee know-how 3 3
Culture 4 5
Networks 5 4
Specialist physical resources 6 6
Databases 7 10
Supplier know-how 8 7
Distributor know-how 9 8
Public knowledge 10 9
Contracts 11 11
Intellectual property rights 12 13
Trade secrets 13 12
Adapted from: Hall (1992)
Given the short period between the two surveys, it is perhaps not surprising that there
has been little change in the ranking with the exception of databases, which possibly
reflects the improved use of technology, which is consistent with the view of Itami (1987)
who saw technology to be a key intangible resource. The longitudinal approach data was

108
used so that a performance group factor could be used for some additional analysis. The
research also classified the organizations surveyed in terms of performance based on an
„increase in sales per employee‟ basis over the period. The data is shown in Table 2-23
and it is of interest that the higher the perceived replacement period the higher the
perceived competitive advantage. This is confirmed by the observation that the top three
ranked intangible resources have the highest replacement period. It is also noteworthy
that the performance grouping does not appear to be an influencing factor apart from
Company reputation.
Table 2-23: Replacement periods
Intangible Resource Replacement Period (years)
Total
Sample
Performance Groups
Low Medium High
Company reputation 10.8 13.0 14.0 8.1
Product reputation 6.0 6.8 6.4 6.3
Employee know-how 4.6 4.4 4.6 4.7
Networks 3.4 3.0 3.9 3.3
Supplier know-how 3.1 2.4 4.4 3.0
Databases 2.1 2.0 2.8 1.6
Distributor know-how 1.6 1.4 1.9 1.8
Adapted from: Hall (1992)
Many authors have noted the role that intangible assets play in creating value (e.g.,
Penrose (1995); Pitelis and Whal (1998); Teece (2000); Doyle (2001); Sussland (2001);
Gray (2003); Kristensen and Westlund (2003); Kaplan and Norton (2004); McDonald-
Wood (2004); Pock, Westlund et al. (2004); Kristensen and Westlund (2004b)). Many
have developed lists of assets that are argued to contribute to creating business value or
competitive advantage. Table 2-24 lists the views of some of these authors.

109
Table 2-24: Other views on the sources of advantage
Reference Source of Advantage
Sussland (2001) Financial assets, Organizational capital, Marketing capital,
Time-cycles/ Life cycles and Human capital
DTI (2001) Relationships, Knowledge, Leadership and communication,
Culture and values, Reputation and trust, Skills and
competences, Processes and systems
Kristensen and Westlund
(2003)
Customers, Human resources, Partners and Brand
Kaplan and Norton (2004) Human capital, Information capital and Organizational
capital
Low and Kalufat (2002)
(Cited in Pock, Westlund
et al. (2004))
Leadership, Strategy execution, Communication and
transparency, Brand equity, Reputation, Alliances and
networks, Technology and processes, Human capital,
Workplace organization and culture, Innovation, Intellectual
capital, Adaptability
International Federation of
Accountants (in Print
(2004))
Human capital, Relational (customer) capital, Organizational
(structural) capital
Information flow plays a role in the asset accumulation process (Itami (1987)). Dierickx
and Cool (1989) put forward a framework based on the notion of asset stock
accumulation and developed guidelines for assessing the sustainability of a firm's
competitive advantage. They argued that a firm that does not own a non-tradable asset
that it requires for the implementation of its product market strategy is constrained to
"building" this asset. For example, a reputation for quality may be built (rather than
bought) by following a consistent set of production, quality control etc. policies over some
period of time. They noted that strategic asset stocks are accumulated by choosing
appropriate time paths of flows over a period of time and use the „bath-tub‟ example to
illustrate this, noting that it takes a consistent pattern of resource flows to accumulate a
desired change in strategic stock assets. They defined critical or strategic asset stocks
as those assets that are non-tradable, and as inimitable and non-substitutable.
Dierickx and Cool (1989) noted that the sustainability of a firm's privileged asset position
hinges on how easily it can be replicated. If certain assets cannot be bought in factor

110
markets, rivals may either attempt to imitate them by accumulating similar asset stocks of
their own or they may try to substitute them by other assets. Whether imitation of a
particular asset stock will be time consuming, costly, or both depend on the relative ease
with which rival firms are able to accumulate a similar asset stock of their own. That is,
imitability of an asset stock is related to the characteristics of the process by which it may
be accumulated. In general, the following characteristics can be identified:
1. Time compression diseconomies (problem with doing things in shorter
timeframes)
2. Asset mass efficiencies (having a big stock to start with)
3. Interconnectedness of asset stocks (access to assets you need to grow the
asset)
4. Asset erosion (loosing assets over time)
5. Causal ambiguity (whether it is 'jackpot' model or not).
In concluding, Dierickx and Cool (1989) noted their asset flow and growth framework had
important implications for empirical strategy-performance research. Barney (1991a)
made use of Dierickx and Cool‟s framework when deriving his resource model, which is
reproduced in Figure 2-4.
It is recognised that the resource development path is important to developing sustained
competitive advantage (Dierickx and Cool (1989); Barney (2002)). Pettus (2001)
considered whether there is a sequencing of a firm‟s resource development that best
leads to a firm‟s growth over time. The longitudinal study commenced with the
deregulation of interstate transportation by the Motor Carrier Act in 1980 and ended in
1993 when there was a further change in the law. 59 publicly traded companies from a
total of 166 identified enterprises were selected and it was noted that these publicly
traded companies accounted for 70% of the growth in revenues, employees and assets.
Published company annual reports were used as the source of the data for the study.
Firm growth was the dependent variable and this was measured in terms of change in
sales, employees and assets. Pettus (2001) used the classification system in Figure 2-10
to position the various companies.

111
Existing A
Excess Capacity
C
International Economies of
Scale Resource Development
New
B
Dynamic Capabilities
D
Innovation
Existing New
Market Position
Adapted from: Pettus (2001: p884)
Figure 2-10: Classification system
A number of industrial experts were asked to identify strategic actions in order to
ascertain the different strategic development path for each firm. The study demonstrated
that the firms that followed a specific hypothesised resource development pattern
generated higher growth that those following other development plans. This hypothesized
path related to a movement from quadrant A to C in Figure 2-10, followed by a move to
quadrant B before briefly returning to A before moving to quadrant D. The research was
limited in two respects. Firstly, it was considered static as it lacked a time line and
secondly, generalizability was an issue as the de-regulation may have caused a
„Schumpeterian Shock‟. It was also noted that the resources in the industry are „lumpy‟
(Pettus (2001: p886)).
Working with technology companies where there is a need to compete in a world of
shorter lifecycles, Klein, Edge et al. (1991) recognized that the term „skill‟ is not clearly
defined in the strategy literature and define a corporate skill as a systematic property of
the entire organization. It involves both a human skill and organizational factors: „hard
factors‟ such as equipment and facilities and „soft factors‟ such as organizational culture
and design, which is again consistent with the thoughts of Rahman (2004). Klein, Edge
et al. (1991) noted that if either the human element or organizational factor is removed
then the skill disappears.
Like the intangible resources of Hall, a corporate skill can take years to build up or
replace. It is also a dynamic concept that simultaneously involves both thought and
action and is continuously updated and modified through use, which is in contrast to a

112
concept such as a core competence, which is noted to be a static attribute where
management seek out opportunities for these attributes (Klein, Edge et al. (1991)). The
paper proposed a learning cycle where „Raw Skills‟ (people and organizational) are
introduced into an organization and used for a specific task and, by doing so, these
become „Dedicated Skills‟ for a specific task. Through learning, these dedicated skills are
shared and they become „Core Skills‟, which are applied in other situations across the
organization. When this skills transfer process is complete, the organization has the
ability to innovate and thereby improve the application of the original Dedicated Skills on
the specific task.
In studying a number of organizations Klein, Edge et al. (1991) identified „Metaskills‟,
which are the way in which skills are managed more or less effectively in an organization.
Metaskills are about behaviour rather than knowledge. Four main metaskills were
defined, these being:
1. Learning – the process of building up core skills from dedicated skills
2. Innovating – the process of using core skills in creative ways
3. Skill categorizing – combining and structuring dedicated skills into a forward
looking set of core skills. This is about looking towards the future requirements
4. Embedding – finding ways to preserve skills and prevent their rapid leakage
DeCarolis and Deeds (1999) conducted a quantitative study in the biotechnology industry
to examine whether knowledge generation, which was considered to be a firm specific
inimitable and non-tradable asset, led to superior firm performance. It was noted that the
knowledge flow was increasing the knowledge strategic assets in this industry. A number
of hypotheses were generated that related firm performance to factors such as
geographical location, number of strategic alliances and research activities. 218 firms
that all become publicly traded after 1982 were contacted to obtain a copy of their
research reports, on which the analysis was based. 106 companies, representing a
response rate of 48%, participated in the study.
The study concluded that the company location was significant and that this gave the
company access to better knowledge flows and the ability to attract skilled personnel.
The second knowledge flow variable, Research and Development activity, gave mixed
results and this was attributed to multicollinearity. The third knowledge flow variable, the
number of alliances, which represented the number of connections to other research
institutions, was also found to be non-significant. It was concluded that this variable did
not, in effect, measure knowledge flow.

113
Three stocks of knowledge were also examined. The study found that products in the
pipeline and number of firm citations were the two independent variables that had an
effect on firm performance. Knowledge stocks represented by the number of patents was
non-significant, this being explained by the observation that the number of patents did not
consider the quality of the patents. The research concluded that the relative importance
of stocks versus flows is in need of further research. The authors also called for
longitudinal studies to be conducted to investigate the flows and stocks. It was noted that
the generalizability was limited and the research was conducted in a single industry.
Amit and Schoemaker (1993) were concerned with the growth of strategic assets. They
define the firm‟s Strategic Assets as „the set of difficult to trade and imitate, scare,
appropriable and specialised Resources and Capabilities that bestow the firm‟s
competitive advantage‟ (Amit and Schoemaker (1993: p36) and noted that „while
empirical models may, ex post, point to a limited set of resources and capabilities that
explain some of the firm‟s past performance, ex ante, such models offer limited insight
into the dimensions of competition that will prevail in the future‟ (Amit and Schoemaker
(1993: p33)). This view is in line with the „In search of excellence‟ comment from Priem
and Butler (2001).
Amit and Schoemaker (1993) suggested that managerial decisions about the resources
and capabilities are made within a setting that is characterized by uncertainty about the
external environment (which includes the macro-environment as well as competitors‟
behaviour and customers‟ preferences), complexity (concerning the causes that shape
the environment and the competitive interactions), and intra-organizational conflicts
amongst decision makers. It was noted earlier that there has been a call for more
research on the interactions of organizational and competitive influences on strategy and
performance (Henderson and Mitchell (1997)).
Within an industry at a given point in time certain resources and capabilities, which are
subject to market failures, have become the prime determinants of economic rents and
these resources and capabilities have become termed „Strategic Industry Factors‟
(Barney (1986)). Table 2-25 lists some general characteristics of strategic industry
factors. Amit and Schoemaker (1993) noted that the set of strategic industry factors
changes and cannot be predicted with certainty ex ante. However, a major challenge to a
firm is to identify, ex ante, a set of strategic assets as the grounds of establishing the
firm‟s sustainable competitive advantage and thereby generate organizational rents.
Organizational rents are defined as economic rents that stem from the organization‟s

114
resources and capabilities and that can be appropriated by the organization (rather than
any single factor).
Table 2-25 General characteristics of strategic industry factors (SIF)
1. Stock type Resources and Capabilities that, ex post, are shown to be key
determinants of firm profitability in an industry.
2. Determined at the market level through complex interactions among industry
rivals, new entrants, customers, regulators, innovators, suppliers, and other
stakeholders.
3. Strategic in that they are subject to market failures and may be the basis for
competition among rivals.
4. The bundle of SIF changes over time and is not known ex ante.
5. Their development takes time, skill, and capital; they may be specialized to
particular uses; investments in them are largely irreversible (i.e., entail sunk
costs).
6. Their values deteriorate or appreciate, over time, at varying rates of change.
7. Their pace of accumulation may be affected by a range of managerial actions
(policy levers) and by the magnitude of other Resources and Capabilities that are
controlled by industry rivals. One cannot easily speed up their development (e.g.,
doubling the investment will not usually halve the time).
8. Their value to any particular firm may depend on its control of other factors - the
complementary property. For instance, the value of a firm's product design
capability may depend upon the effectiveness of its distribution network.
9. Not all aspects of their development and interactions will be known or
controllable.
Adapted from: Amit and Schoemaker (1993)
Amit and Schoemaker (1993) defined the relationship between industry determined
strategic industry factors, and firm level resources, capabilities and strategic assets, using
the model shown in Figure 2-11. When making decisions about strategic assets three
factors for consideration have been defined. The first is the challenge of uncertainly, the
second that of complexity and thirdly conflict with the organization. In support of the third
factor King, Fowler et al. (2001) observed that agreement among managers on the core
competencies leads to better organizational performance.

115
Strategic Assets
A subset of the firm‟s R&C subject to market failure
Overlap with Strategic Industry Factors
Uncertain ex-ante
Form the basis of the firm‟s competitive strategy
Determine organizational rents
Non-tradable
Complementary
Scarce
Appropriable
Firm specific
Adapted from: Amit and Schoemaker (1993)
Figure 2-11: Strategic industry factors, resources & capabilities, and strategic assets
To end this sub-section we return to the thoughts of Barney. In his more recent work
Barney (2002) gave us the VIRO framework (Table 2-26). This work started to integrate
the strategy (S – C – P) perspective with a neo-economics perspective (Barney (2001b)).
Within this framework Barney made the point that, to have above normal returns, an
organization must exploit its valuable, rare and difficult to imitate resource. This sub-
section has reviewed the literature to see how this might be achieved.
Firm Industry
Resources
Externally available and transferable
Owned and controlled by the firm Convertible
Capabilities
Information-based organizational processes
Firm specific
Tangible or intangible
Intermediate goods
Strategic Industry Factors
Industry specific
R&C subject to market failure
Effect industry profitability
Change & subject to ex-ante uncertainty
Rivals
Entrants
Substitutes
Suppliers Environmental
Factors (E.g.,
Technology, regulation)
Customers

116
Table 2-26: The VIRO Framework
Valuable? Rare? Costly
to
Imitate?
Exploited by
Organizations?
Competitive
Implications
Economic
Performance
No - - No Competitive
disadvantage
Below normal
Yes No - Competitive parity
Normal
Yes Yes No Temporary
competitive
advantage
Above
normal
Yes Yes Yes Yes Sustained
competitive
advantage
Above
normal
Adapted from: Barney (2002: p173)
2.3.5 Dynamic capabilities The potential disruption effects of Schumpeterian shocks when there are structural
revolutions in the industry have been noted Barney (1991a), and the work of Snow and
Hrebiniak (1980b) sought to look at distinctive competences in different industry
situations. Before Barney produced his landmark paper on the RBV, he examined the
value of resources (for controllers) against the benefit delivered by the resources on
implementing a strategy (to strategizers). He argued that these resources are the
„strategic factors‟ that are traded in „strategic factor markets‟, e.g., if the resource is
reputation then there is a need to trade in the market for reputations (Barney (1986))
Although the value of such strategic factor markets has been challenged by Dierickx and
Cool (1989), it is clear that the external environment has to be taken into account when
considering the RBV (Henderson and Mitchell (1997); Priem and Butler (2001); Webb
and Gile (2001)). Barney (1986) also expressed the view that to achieve above average
returns, a firm must be better informed about the future value of the strategy or be lucky,
and he recommend the use of environmental analysis and organizational analysis to
improve forecasting the future.
Lenz (1980), in building on earlier work by Selznick and Druker, recognised the need to
evaluate an organisations‟ ability to pursue its strategic choices. He used the term

117
„Strategic Capability‟ to recognise this ability and developed a model to further its
understanding. Lenz‟s model noted a number of dimensions for this purpose, these
being knowledge-technique base for value creation, capacity to generate and acquire
resources, and general management technology. Although focused on the competence
of strategy implementation, strategic capabilities recognise the characteristics of the
market and are a good starting point for the discussion on the way that organizations
overcome changes in their environment.
Competitive advantage changes over time as witnessed by changing focus from
economies of scale to economies of scope to value chain integration to whatever next.
This has been credited to „disruptive technologies‟ (Christensen (2001)). In discussing the
changing nature of the core competences of an organization, Lei, Hitt et al. (1996) used
the term „Dynamic core competences‟. They argued that if change was the norm,
organizations needed to develop dynamic core competences that could be used as
platforms from which to offer new products, goods, and services. It was recognized that
these competences would be hard to develop and once they were in place, they should
be nurtured, replenished and upgraded (Lei, Hitt et al. (1996)). Petts (1997) gave advice
on the „Core Competence Engine‟, which integrates metaskills, core competences,
capability, customer needs and time. The core competence engine is described as a
practical approach for managing the growth of core competences.
In building on the work of Lei, Hitt et al. (1996), who argued the case for dynamic core
competencies from a learning perspective not dissimilar to that of Klein, Edge et al.
(1991), Zahra (1999) expressed the view that leadership was key to future
competitiveness. Zahra (1999) linked leadership with the need to harvest the wellspring
of creativity and knowledge among an organizations‟ employees in order to sustain the
dynamic capabilities. They also noted that this would require significant changes in
organizational cultures, systems, and views of human resources and would require
investments in upgrading the firm's human capital. A second way to build these dynamic
capabilities, according to Zahra (1999), was to selectively use external sources of
organizational competencies to complement and augment the firm's existing skills, for
example, through the use of outsourcing, joint ventures, and licensing agreements. Care
must be taken not to rely too heavily on external sources to develop skills as this could
lock out the internal skill set and contact rates with third-parties tend to be less frequent
than internal contacts (Lei and Slocum (1992)). Zahra (1999) held the view that
companies are trading off growth and profitability for short-term advantage, whereas
building dynamic capabilities requires sustained investments in the firms' assets and
resources in ways that set the company apart from its rivals.

118
Several authors have noted that one of the limitations to RBV and Business Excellence
research is that the external environment is not taken into account (e.g., Miles, Snow et
al. (1978); Henderson and Mitchell (1997); Das, Handfield et al. (2000); Fiol (2001)). The
concept of „Dynamic Capabilities‟ builds on the theories surrounding capabilities by
applying the resource-based view to dynamic markets (Teece, Pisano et al. (1997)). In
these markets, where the competitive landscape is shifting, the dynamic capabilities by
which a firm manages integrates, builds and re-configures internal and external
competences to address rapidly changing environments become the source of sustained
competitive advantage. Eisenhardt and Martin (2000: p1107) defined Dynamic
capabilities as „the firm‟s processes that use resources – specifically the processes to
integrate, re-configure, gain and release resources – to match and even create market
change. Dynamic Capabilities, thus, are the organizational process and strategic
routines by which firms achieve new resource configurations as markets emerge, collide,
split, evolve, and die‟.
Eisenhardt and Martin (2000) noted that dynamic capabilities exhibit commonalities
across effective firms or what they term „best practice‟. They have greater equifinality,
homogeneity and substitutability across firms than the traditional resource-based view
implies, and they vary with market dynamism. When markets are moderately dynamic
such that change occurs in the context of stable industry structure, dynamic capabilities
resemble the traditional conception of routines. That is, they are complicated, detailed,
analytic processes that rely extensively on existing knowledge and linear execution to
produce predictable outcomes. In contrast, in high-velocity markets where industry
structure is blurring, dynamic capabilities take on a different character. They are simple,
experiential, unstable processes that rely on quickly created new knowledge and iterative
execution to produce adaptive, but unpredictable outcomes. Finally, well-known learning
mechanisms guide the evolution of dynamic capabilities and underlie path dependence.
Table 2-27 shows the distinction between dynamic capabilities under different industry
conditions.

119
Table 2-27: Dynamic capabilities and types of dynamic markets
Moderately Dynamic
Markets
High Velocity Markets
Market definition Stable industry structure,
defined boundaries, clear
business models, identifiable
players, linear and predictable
change
Ambiguous industry structure,
blurred boundaries, fluid
business models, ambiguous
and shifting players, non-linear
and unpredictable change
Pattern Detailed, analytic routines that
rely extensively on existing
knowledge
Simple, experiential routines
that rely on newly created
knowledge specific to the
situation
Execution Linear Iterative
Stable? Yes No
Outcomes Predictable Unpredictable
Key to effective
evolution
Frequent, nearby variation Carefully managed selection
Adapted from: Eisenhardt and Martin (2000)
Key to the views held by Eisenhardt and Martin (2000) is that dynamic capabilities are not
vague or ill-defined, but consist of many well-known processes such as product
development, strategic decision making and alliancing. Their value for competitive
advantage lies in their ability to alter the resource base: create, integrate, re-combine and
release resources. Whilst a specific dynamic resource might be firm specific, they can be
shared across firms, although it has been noted that such sharing of practice is not
straightforward (O'Dell and Grayson (1997); Szulanski, Winter et al. (2000); Harrington
(2004)). Competitive advantage derived from both having a superior practice and „using
dynamic capabilities sooner, more astutely, or more fortuitously than the competition to
create resource configurations that have that advantage‟ (Eisenhardt and Martin (2000:
p1117)).
Galunic and Eisenhardt (2001) recognized that research on dynamic capabilities has
examined knowledge transfer, integrative capabilities, and product innovation processes.
They sought to extend this work by examining the micro processes and roles that form
the capabilities, the impact of social imperatives and how dynamic capabilities and

120
organizational structures can combine to constitute new organizational forms. Focusing
on a large, multi-business Fortune 100 corporation, a multiple case study approach was
taken to examine events where there had been a change in business divisions‟
responsibility (a „charter change event‟). A total of 11 such divisions were studied with 86
interviews being conducted.
The study identified three patterns. The first pattern was with new opportunities where it
was found that the best opportunities were given to weaker divisions to improve their
success. The second pattern, termed „charter wars‟, emphasized inter-divisional rivalry in
established markets resulting in better matches between divisions and their charters.
The third pattern related to rapidly organized businesses being placed in a temporary
home until a more permanent move could be agreed. The observations led to the
definition of „Dynamic communities‟, which have the following features shown in Table
2-28.

121
Table 2-28: Features of dynamic communities
Features Description
Modular structures: Independent but
related
Modularity generates diversity within the
divisions, with each division having its own
unique product-market domain that demands
different skills. As a consequence the different
divisions focus on different capabilities. But,
given that the divisions compete in similar
market places, there is an advantage to sharing
common approaches and this aids the transfer
of product responsibilities from one division to
another.
Corporate culture: Competition and
cooperation
Capitalizing on the change process required a
corporate culture that emphasised both the
competitive aspects as well as the common
identity. This type of culture, where common
rules for behaviour guide the actions of
individual managers, is seen as a requirement
of self-organizing systems.
Dynamic capabilities: Economic and
social rules
The dynamic capabilities seem at first glance to
be complicated, but in fact do not match the
traditional concept of strategic processes. They
consist of a few simple, often competing, rules
that enable highly effective behaviour. These
rules are economic and social, despite the fact
that they are often weighed against each other
in the short term, as they ensure the viability of
dynamic communities in the long-term.
Leaders as architects, entrepreneurs
and cultural guardians
Corporate executives play roles that go beyond
the traditional roles of managing corporate
boundaries and overseeing performance.
Executives are much more entrepreneurial in
spotting opportunities at the divisional level and
re-crafting the corporate architecture, taking
advantage of the resource stocks and helping to
generate them.
Adapted from: Galunic and Eisenhardt (2001: p1243):

122
More recent work has led to the definition of the term „Dynamic Managerial Capabilities‟
(Adner and Helfat (2003)). These authors conducted a single industry study where
managers faced a similar, but changing, set of external conditions to test the proposition
that managerial decisions at the corporate level are associated with heterogeneity in
business performance. The analysis indicated that corporate-level managers in different
firms made different decisions in response to changes in the external environment. In
addition, the inclusion of a time varying corporate effect associated with corporate-level
decisions led to a statistically significant increase in the explained variance of business
profitability, after controlling for year, industry segment, 'stable' corporate, business, and
segment-year effects. The authors note that Rosenbloom (2000) suggested leadership
by individuals may be a „central element‟ in the more general dynamic capability of an
organization to change. Adner and Helfat (2003) proposed that dynamic managerial
capabilities were rooted in three underlying factors:
1. Managerial human capital
2. Managerial social capital
3. Managerial cognition
They called for more work to be conducted in this area (Adner and Helfat (2003)). Table
2-29 summarizes the various definitions for dynamic capabilities given by the authors
reviewed in this section.
The link between dynamic capabilities and knowledge and skills has been noted by
several authors (Lei, Hitt et al. (1996); Pitt and Clarke (1999); Zahra (1999); Teece
(2000)). Wiklund and Shepherd (2003) examined the way that organizations used their
bundle of knowledge-based resources to see if there was a positive relationship with
performance. A key point in their argument was that the „O‟ in Barney‟s VIRO framework
operates on the „VIR‟ and that the knowledge-base resources could represent the „O‟. A
survey of Swedish SMEs was conducted and the results found support the positive
relationship between the knowledge resource and performance (Lei, Hitt et al. (1996);
Zahra (1999)). It is interesting that Teece argued that, in a world where legal
mechanisms isolate knowledge assets, dynamic capabilities are less critical (Teece
(2000)), a view that reminds the reader of Hall‟s framework (Hall (1992)) that was
discussed earlier.

123
Table 2-29: Definitions of dynamic capabilities
Term Definition Reference
Strategic Capability The capability of an enterprise to
successfully undertake action that is
intended to affect its long-term
growth and development
Lenz (1980)
Dynamic Core
Competences
Firms investing and upgrading their
competences to create new growth
alternatives.
Lei, Hitt et al. (1996)
Dynamic Capabilities Capacity to reshape and reconfigure
resources in response to change.
Teece, Pisano et al.
(1997)
Dynamic Capabilities Specific processes that create,
reconfigure, integrate, or import
resources.
Eisenhardt and Martin
(2000)
Dynamic Capabilities The organizational and strategic
processes by which managers
manipulate resources into productive
assets in the context of changing
markets.
Galunic and
Eisenhardt (2001)
Dynamic Capabilities Collective activity of modifying or
creating routines. Changing how we
earn a living now.
Winter (2003)
Dynamic Managerial
Capabilities
The capabilities with which
managers build, integrate, and
reconfigure organizational resources
and competences.
Adner and Helfat
(2003)
Building on the work of Teece, Pisano et al. (1997) and Eisenhardt and Martin (2000),
Zott (2003) used computer simulations to examine why firms in the same industry perform
differently and, as a result, presented a four stage model that included:
1. Variation – by imitation (external) or experimentation (internal)
2. Selection – related to learning
3. Retention – related to timing
4. Intra-industry competition

124
The model overview from the perspectives of one of the firms is presented in Figure 2-12
with the „Dynamic Capability Attributes‟ of Cost, Learning and Timing. Zott (2003) noted
that the model is closely linked to a system of evolutionary change as described by Helfat
and Raubitschek (2000) and Zollo and Winter (2002). Helfat and Peteraf (2003) also
introduced the concept of „Capability lifecycles‟ to advance dynamic resource-based
theory.
Adapted from: Zott (2003)
Figure 2-12: Model overview
Zott (2003) concluded that a consensus appears to be emerging in the strategy field on
the nature of dynamic capabilities in that they are embedded in routine organizational
processes aimed at effecting change. A schematic version of the consensus view is
given in Figure 2-13. The theory developed in the paper shows that even if dynamic
capabilities are equifinal across firms, performance differences between firms might occur
due to the costs and the differential timing with which they are used. In addition Zott
noted that „In contrast to conventional wisdom, dynamic capabilities may thus serve to
gain and sustain competitive advantage‟ (Zott (2003: p120)).
Period t
Dynamic Capability: Evolving Resources (Intra-firm)
Stages Variation
By imitation
and/ or experimentation
Selection Intra-
Industry
Competition Retention
Dynamic
Capability
Attributes
Cost Cost of imitation
Cost of experimentation
Learning Learning to
imitate
Learning to experiment
Timing Likelihood of
implementation of selected new
resource
configurations
Unit of
Analysis Firm’s Resource Configuration (q, r, i)
q represents production quantity, r stands for product
innovation, and i represents process innovation

125
Adapted from: Zott (2003: p100)
Figure 2-13: Emerging consensus regarding dynamic capabilities and the link to performance
Zott (2003) noted that different search directions (imitation Vs experimentation) could
explain the intrafirm performance and this could be a key to understanding how dynamic
capabilities should be configured to achieve superior performance. It is suggested that
empirical testing of the ideas would require the costs of imitation and experimentation to
be calculated, together with the timing and frequency of change, and the speed of
learning how to change. As costs of reconfiguration are normally hidden within a firm,
measurement of this variable would be challenging. The question of the roles of
leadership and culture was also raised by Zott (2003).
Dynamic
Capabilities
Competences,
Operational Routines,
Resource Positions
Firm Performance
Action of dynamic capabilities on resources and capabilities
Invest and upgrade (Lei, Hitt et al. (1996))
Integrate, build, reconfigure (Teece, Pisano et al. (1997))
Gain, reconfigure, integrate, release (Eisenhardt and Martin (2000))
Manipulate (Galunic and Eisenhardt (2001))
Build, integrate and reconfigure (Adner and Helfat (2003))
Modify or create (Winter (2003))
Resulting effect on resources and capabilities
Match/ address changing environment (Teece, Pisano et al. (1997))
Create a „Mental buffer‟ (Savolainen (2000a))
Create market change (Eisenhardt and Martin (2000))
Improve effectiveness (Zollo and Winter (2002))

126
2.3.6 Implications from the resource-based view for the current research
Stevenson (1976), as cited by Snow and Hrebiniak (1980b), noted that one can only look
at broad patterns between strategy and distinctive competences due to complexity. The
fact that there are problems with identifying the resources that led to competitive
advantage is also well documented (e.g., Grant (1991); Thomas, Pollock et al. (1999);
Priem and Butler (2001); Walsh and Linton (2001)). One area where there is consensus,
however, is that intangible resources play a significant part in generating competitive
advantage (Itami (1987); Aaker (1989); Hall (1991); Hall (1992)). One theme that has
emerged through the literature review is the parallel between the RBV research and the
structure of the EFQM Excellence Model®.
This parallel is illustrated in Table 2-30. The
conclusion is that there is further support between Business Excellence and the RBV.
One is reminded of the view of Powell (1995), who suggested that one of the most
valuable uses of the Business Excellence frameworks is to provide a structure within
which an organization may be considered.

127
Table 2-30: Comparing the EFQM Excellence Model® with RBV literature
Model Criterion
Part
Resource References
Leadership Organizational alignment Powell (1992a); Allen and Brady (1997)
Trust Barney and Hansen (1994)
Organizational culture Fiol (1991); Hall (1992); Penrose (1995); Watson and Korukonda (1995); Oliver (1997); Fiol (2001); Galunic and Eisenhardt (2001)
Top-management skills Castanias and Helfat (1991)
Leadership Norburn and Birley (1988); Thomas (1988); Finkestein and Hambrick (1996); Darling (1999); Galunic and Eisenhardt (2001); Zott (2003)
Structure Galunic and Eisenhardt (2001)
Customer focus Tena, Llusar et al. (2001)
Policy and
Strategy
Strategic planning Powell (1992b); Michalisin, Smith et al. (1997)
People Organizational alignment Powell (1992a)
Human resource management
Wright and McMaham (1992); Lado and Wilson (1994); Flood, Smith et al. (1996); Galunic and Eisenhardt (2001)
Trust Barney and Hansen (1994)
Know-how Bowen and Lawler (1992); Hall (1992)
Managerial competences Webley and Cartright (1996)
Continuous Improvement Tena, Llusar et al. (2001)
Partnership
and
Resources
Information technology Mata, Feuerst et al. (1995); Powell (1997)
Legal assets, Other assets
Hall (1992); Lemak and Reed (1997)
External co-operation skills
Rao, Solis et al. (1999)
Learning Fiol and Lyles (1985); Wruck and Jensen (1998); Fisher and White (2000)
Knowledge Grant (1996); Leibeskind (1996); Argote and Ingram (2000); Sveiby (2001)
Processes Administrative skills Powell (1993)
Organization as a system Tena, Llusar et al. (2001)
Speed and flexibility on product and service design
Youssef, Boyd et al. (1996)
Continuous improvement Tena, Llusar et al. (2001)
Main Sources: Priem and Butler (2001); Tena, Llusar et al. (2001); Wright, Dunford et al.
(2001)

128
A second key theme from the RBV literature review concerns the way that strategic
assets are built over time (Aaker (1989); Dierickx and Cool (1989); Grant (1991); Hall
(1991); Hall (1992)). The key driving factor of the EFQM Excellence Model® that relates
to the improvement in performance relates to the „Innovation and learning‟ aspect (EFQM
(1999a)). A number of RBV authors followed this learning theme when discussing the
development of sustained competitive advantage. For example, Itami (1987) referred to
the „operations route‟ where assets are accumulated as by products of daily operations
and Klein, Edge et al. (1991) „meta-skills‟. Both these views are compatible with the
views of Zott (2003), who referred to „internal‟ experimentation (continuous improvement/
re-engineering) and „external‟ imitation (benchmarking/ good practice transfer).
The concept of dynamic capabilities suggest that the environment may have an impact on
an organization‟s ability to reconfigure its resources (Eisenhardt and Martin (2000)) and
the effect of the external environment is rarely taken into account when conducting RBV
and Business Excellence research (Miles, Snow et al. (1978); Henderson and Mitchell
(1997); Das, Handfield et al. (2000); Fiol (2001)). The literature review in the first section,
which examined the empirical work on the benefits for organizations that adopt Business
Excellence, raised the potential effect of the external environment on the level of benefit
and longer-term success of the organization (Hendricks and Singhal (1997); Hendricks
and Singhal (2000); Hendricks and Singhal (2001a); Hendricks and Singhal (2001b);
Przasnyski and Tai (2002); NIST (2002b)). It has also been noted that „excellence‟
organizations form a „mental buffer‟ to help them react to external environmental changes
(Savolainen (2000a)). The effect of the external environment on the effectiveness of
Business Excellence forms the third theme that has emerged from the RBV literature
review. It would appear that the application of a Business Excellence philosophy through
the use of a model might have an impact on the organization‟s ability to learn and
subsequently re-configure its resources, but only under certain conditions. Barney,
Wright et al. (2001) suggested that research involving resources, dynamic capabilities
and knowledge would provide a valuable contribution to the RBV body of knowledge.
A final point of note from the RBV literature review is that the majority of the research, if
not all, is focused on private organizations. The resource-based view has been found to
be a better predictor of share value on the privatisation of Czech public sector
organizations (Makhija (2003)), yet, when questioned, Grant expressed the opinion that
there was a lack of understanding on the application of the RBV to public sector
organizations (Grant (2004a)). A similar conclusion was drawn from the benefits
research in the previous section. One of the principles of the Business Excellence
models is that, whereas the detail may change, the overall concepts of excellence are as
applicable to public organizations as private organizations. This is evidenced by the fact

129
that public sector organizations compete for the awards, sometimes in a separate
category but sometimes head-to-head with private organizations. There is also a range
of support documentation available. This discussion leads to the questions of whether
the RBV may be applied to public sector organizations, whether Business Excellence
works for public sector organizations, and whether the RBV is a good theoretical basis for
Business Excellence. These are three important questions that the research addressed
and will provide valuable contributions to the body of knowledge in both the RBV and
Business Excellence fields.
Barney (2001b) suggested that the perspective chosen for RBV research should be
dependent on the interest. Those interested in industry effects can used RBV as defined
in 1991. Those interested in studying specific sources of sustained competitive
advantage can take the basic 1991 logic and link it to papers such as Dierickx and Cool
(1989) and Peteraf (1993). Finally, those interested in studying how resources and
capabilities evolve over time can link the 1991 paper with the evolutionary theory of
economic change model (Nelson and Winter (1982)) and the work of Teece, Pisano et al.
(1997). Barney, Wright et al. (2001) noted the methodological issues that the RBV
researcher faces, these being the need for the measurement of resources as they are
intangible, the need for longitudinal studies and the need to use different methodologies,
e.g., Administrative Science (e.g., surveys) and economics (e.g., modelling).
2.4 Research model and hypotheses 2.4.1 Research question and model Considering the conclusions from the literature review, the following research question
was formulated:
Does adopting a Business Excellence philosophy lead to the development of the
ability to withstand changes in the external environment for both private and
public organizations?
The question focuses on a number of points. Firstly, it asks whether Business Excellence
works when viewed from the perspective of the Resource-based view of the firm. Despite
the number of studies empirical work on the RBV has not evolved at the rate the theory
has evolved (Hoopes, Madsen et al. (2003)). Secondly, it asks whether it is applicable to
both private and public organizations. Thirdly, it challenges the generalizability of
Business Excellence in that it is assumed that the philosophy is applicable to all
organizations.

130
The literature review examined the empirical work conducted into the benefits of adopting
a Business Excellence approach in support of the view that such adoption leads to
improved business results. The Business Excellence critical success factor work
identified Leadership as the critical success factor that would be used as the construct to
measure the level of Business Excellence in the research. The section on Business
Excellence and Leadership uncovered two important studies linking the two areas. The
first of these was Prabhu and Robson‟s work using the „Pilot‟ based instrument (Prabhu
and Robson (2000)) and the second, the „Leadership Excellence‟ instrument (Kanji and
Sá (2001a); Sá and Kanji (2003)). So the first two constructs in the research model are
Leadership Excellence, to reflect the measurement of the level of Business Excellence,
and Performance.
The benefits literature review concluded that, although there is strong evidence for the
advocacy of Business Excellence, there is some variety in the results and there could be
important factors to examine through the current research. In particular, firm size and
industry type appear to have an effect on the level of benefit. The third construct in the
research model was therefore the Organizational Context.
There is some debate in the literature over the path dependency of the benefit. Some
research suggested that such benefit is built over time whereas other research concluded
that the performance of an award-winning firm is not differentiated until after award level
performance is achieved. This latter point is particularly interesting, as the RBV literature
supports the proposition that strategic capability, which leads to superior performance, is
built over time (e.g., Aaker (1989); Hall (1991); Hall (1992); Hall (1994)). This raises the
question as to whether Business Excellence does lead to superior performance or
whether such performance is down to „luck‟ (Barney (1986)), which could be caused by
an event (Swords (1999)). The time taken to develop the assets and capabilities was
therefore of interest and this led to the definition of the Strategic Capability construct.
Recent developments in the area of dynamic capabilities were found to have particular
relevance to the current research, as a link could be drawn between the concept of the
quality ideology of a an organization and its ability to react to change (Savolainen
(2000a)). This feature fell under the scope of the Strategic Capability construct. Dynamic
capabilities also recognize the impact of the dynamics of the industry on the ability of a
firm to develop its strategic assets to a point where they are leading to superior
performance. According to Zott (2003), the aspects of cost, learning and timing are key
factors in developing dynamic capability. This was particularly interesting, given the calls
to include the effect of the environment in RBV ((Henderson and Mitchell (1997); Priem

131
and Butler (2001)) and Business Excellence research (Das, Handfield et al. (2000);
Leonard, McAdam et al. (2002)). These arguments led to the inclusion of the fifth and
final construct in the research model, which was the Environmental Dynamics.
An initial research model was defined as shown in Figure 2-14. Later, in Chapter 3 of the
thesis, the research model will be drawn in the context of the specific relationships under
examination. For clarity in explanation of the constructs and for developing the
methodology, it serves to show the constructs in a simple relationship. Each of the
constructs is discussed in more detail in the next sections.
Figure 2-14: Initial research model
2.4.1.1 Performance construct Empirical research supports the assertion that Business Excellence leads to superior
performance. For example, GAO (1991); Hendricks and Singhal (1997); Terziovski and
Samson (1999); Zahra (1999); Oakland (1999b); Curkovic, Vickery et al. (2000); Agus
and Sagir (2001); Douglas and Judge (2001); Tena, Llusar et al. (2001); Hendricks and
Singhal (2001b); Przasnyski and Tai (2002); NIST (2002b). A range of methods has
been used to study the benefits, including surveys and secondary information such as
Performance
Organizational Context
Leadership Excellence
Environment Dynamics
Strategic Capability

132
share-price performance. Performance has also been considered in researching the
RBV of the firm examining the perception of the factors that contribute to sustained
competitive importance such as in the work of Aaker (1989), Hall (Hall (1991); Hall
(1992)) and of Snow and Hrebiniak (1980b).
2.4.1.2 Organizational context construct The benefits of Business Excellence research indicated that firm size (Easton and Jarrell
(1998); Terziovski and Samson (1999); Hendricks and Singhal (2001a); Hendricks and
Singhal (2001b)), whole organizations or business units (NIST (2002b)) and industry
type ((Easton and Jarrell (1998); Terziovski and Samson (1999); Beheshti and Lollar
(2003)) have an effect on the level of benefit delivered. On the Whole Organization Vs
Business Unit, it was noted that empirical research has tended to use the Business Unit
as the unit of analysis (e.g., Schendel and Patton (1978)). It was also noticed that size
was a factor in the strategic competences in hospitals (Douglas and Ryman (2003)).
Industry type was a variable in the work of Snow and Hrebiniak (1980b), although this did
not have the effect that was anticipated. Different industries (Manufacturing, Service and
Other) were also differentiated by Aaker (1989) and Hall (1992) considered firms in
different „Performance‟ categories. It was also noted, from the review of the benefits
literature, that limited studies featuring public sector organizations were found, with only
the work of Redman, Mathews et al. (1995), PriceWaterhouseCoopers (2000) and Agus
(2004) being found. This was also the case with the resource-based view research,
where it was noticed that there was a lack of research.
2.4.1.3 Environment dynamics construct Related to the organizational construct where the industry type was considered as a
factor, market conditions were noted to be an independent variable in the benefits
research (Terziovski and Samson (1999); Przasnyski and Tai (2002)). The external
environment has also been studied in RBV research (e.g., Snow and Hrebiniak (1980b);
Bourgeois and Eisenhardt (1988)). The potential disruption effects of Schumpeterian
shocks have been noted (Barney (1991a)) and Priem and Butler (2001) argued that the
external environment has to be taken into account when considering the RBV, a view
shared by Eisenhardt and Sull (2001). Barney (1986) expressed the view that to achieve
above average returns, a firm must be better informed about the future value of the
strategy or be lucky, and he recommend the use of environmental analysis and
organizational analysis to improve forecasting the future. To aid this, Barney and Zajac
(1994) provided a theoretical foundation on which to test the relationship between
organizational resources, environmental context and firm performance. There are calls

133
for more research in this area (Henderson and Mitchell (1997); Das, Handfield et al.
(2000)).
The reason for including the external environment as an independent variable in its own
right was as a result of recent emergence of the concept of dynamic capabilities, as this
field of work acknowledges the competitive landscape is shifting (Teece, Pisano et al.
(1997)). Eisenhardt and Martin (2000) argued that the ability of a firm to reconfigure its
resources is severely restricted in a fast moving environment, which may explain why
some of the „world-class‟ organizations have lost their competitive advantage over a
relatively short space of time (Porter and Tanner (2003)). Specifically, Dervitsiotis (2004)
predicted that Business Excellence is not expected to be effective in periods of turbulent
times. He had earlier made the case for „Sustainable Business Excellence‟, noting that a
deterioration in the effectiveness of Business Excellence was signalled by limited
available resources (Dervitsiotis (2003)).
2.4.1.4 Leadership excellence construct The literature review identified that leadership is a critical success factor underpinning
Business Excellence (For example, Saraph, Benson et al. (1989); Porter and Parker
(1993); Youssef and Zairi (1995); Zairi (1995); Black and Porter (1996); Darling (1999);
Edgeman and Scherer (1999); Savolainen (2000a); Dayton (2001); Guillen and Gonzalez
(2001); Nabitz, Severens et al. (2001); Pannirselvam and Ferguson (2001); Bauer (2002);
Perles (2002); Reiner (2002); EFQM (2003); Porter and Tanner (2003)). Leadership
would therefore appear to be a suitable independent variable to select to measure the
level of excellence in an organization. The literature review identified several studies on
which this current work can build upon (e.g., Seddon (1998); Baxter and MacLeod (1999);
Prabhu and Robson (2000); Kanji and Sá (2001a)).
It has been noted that the inability to identify the resources that lead to competitive
advantage is one of the major limitations of the RBV of the firm (e.g., Thomas, Pollock et
al. (1999); Priem and Butler (2001)). Focusing on one resource, leadership overcomes
this limitation. There is also an interest in leadership from within the RVB literature. Of
particular note, Zott (2003) called for work to investigate the effect of leadership on the
dynamic capabilities of an organization.
2.4.1.5 Strategic capability construct Whereas the leadership construct will examine an organization‟s level of excellence, this
construct will consider its ability to develop strategic capability. The key factor will be
ability of an organization to react to changes in the environment. In examining strategic

134
competences in hospitals, Douglas and Ryman (2003) reported that the value of the
hospital‟s strategic competences was positively related to hospital financial performance.
Tena, Llusar et al. (2001) have also reported a positive relationship between distinctive
capabilities and performance.
A second factor will be the length of time it takes to build specific resources and
capabilities. The benefits research revealed conflicting views on whether capability that
leads to superior performance is built over time (Douglas and Judge (2001); Przasnyski
and Tai (2002)) or is only evident once „world-class‟ status is recognised (e.g., Hendricks
and Singhal (2001a)). The former view is consistent with the majority of the RBV
literature (e.g., Dierickx and Cool (1989); Grant (1991); Hall (1992)) although „luck‟ can
play a part (Barney (1986)) and under dynamic environmental conditions building
strategic capability is difficult (Eisenhardt and Martin (2000)). Time is also a key
component of Zott‟s model (Zott (2003)).
The third factor was the source of the capability. Many studies have examined
organizations‟ perceptions of their sustained competitive advantage (e.g., Snow and
Hrebiniak (1980b); Aaker (1989); Hall (1991); Hall (1992)). King and Zeihaml (2001)
recognized that the level of consensus amongst managers on both an organization‟s
strengths and weakness had positive effect on an organization‟s performance.
2.4.2 Construct definitions Schwab (1999) advised that each construct should be accompanied with a construct
domain definition and position in the nomological network (Schwab (1999)). A summary
of these is given in Table 2-31.

135
Table 2-31: Construct definitions
Construct Construct Domain Definition Position in the Nomological Network Key References
Performance Level of performance of the
organization against its own
objectives and competition/ other
agencies as perceived by senior
management.
It is expected that the perception of the
performance of the organization against its own
objectives and that of others will be higher under
certain conditions as defined in the other
constructs.
Snow and Hrebiniak (1980b); Eisenhardt
and Martin (2000); Hendricks and Singhal
(2001a); Hendricks and Singhal (2001b);
Przasnyski and Tai (2002); Zott (2003)
Organizational
Context
Size of organization and industry type
(whether public or private).
The relationships between Performance and
Leadership Excellence, and Performance and
Strategic Capability, will not be affected by the
industry type.
Snow and Hrebiniak (1980b); Redman,
Mathews et al. (1995); Easton and Jarrell
(1998); Terziovski and Samson (1999);
EFQM (1999a); PriceWaterhouseCoopers
(2000); Przasnyski and Tai (2002)
Size will have an impact on the relationship
between Performance and Leadership
Excellence.
Terziovski and Samson (1999); EFQM
(1999a); Hendricks and Singhal (2000);
Hendricks and Singhal (2001a); Hendricks
and Singhal (2001b); Douglas and Ryman
(2003)
Environment
Dynamics
Dynamics of organization‟s external
environment as perceived by senior
management.
The relationships between Performance and
Leadership Excellence, and Performance and
Capability, will be lower in highly dynamic as
opposed to moderate environments.
Teece, Pisano et al. (1997); Eisenhardt
and Martin (2000); Galunic and Eisenhardt
(2001); Zott (2003)

136
Construct Construct Domain Definition Position in the Nomological Network Key References
Leadership
Excellence
Measure of leadership that reflects
the level of excellence of the
organization such that the higher the
level of leadership excellence the
closer the organization is to being
considered as „world-class‟.
There will be a positive relationship between the
level of Leadership Excellence and
Performance.
Dean and Bowen (1994); Zairi (1995);
Baxter and MacLeod (1999); Petrick,
Scherer et al. (1999); Higgs and Rowland
(2000); Prabhu and Robson (2000);
Nabitz, Severens et al. (2001);
Pannirselvam and Ferguson (2001); Kanji
and Sá (2001a)
Strategic Capability The ability to react to changes in the
external environment and the time to
develop organizational advantage as
perceived by senior management.
There will be a positive relationship between the
level of Strategic Capability and Performance.
The sources of sustained organizational
advantage will be developed over time.
Itami (1987); Dierickx and Cool (1989);
Hall (1991); Klein, Edge et al. (1991);
Barney (1991a); Hall (1992); Teece,
Pisano et al. (1997); Eisenhardt and Martin
(2000); Tena, Llusar et al. (2001); Zott
(2003)

137
2.4.3 Hypotheses Considering the model and construct definitions leads to a number of hypotheses that the
research sought to find support for. These were:
H1: There will be a positive relationship between the level of Leadership
Excellence and Performance (Dean and Bowen (1994); Zairi (1995); Petrick,
Scherer et al. (1999); Yusof and Aspinwall (1999); Zahra (1999); EFQM (1999a);
Das, Handfield et al. (2000); Higgs and Rowland (2000); Pannirselvam and
Ferguson (2001); Kanji and Sá (2001a))
H1a: The strength of the relationship will be similar with private sector
organizations and public sector organizations (Redman, Mathews et al.
(1995); EFQM (1999a); PriceWaterhouseCoopers (2000))
H1b: The strength of the relationship will be higher with whole
organizations than Business Units (NIST (2002b))
H1c: Size will have an impact on the strength of the relationship (Easton
and Jarrell (1998); Terziovski and Samson (1999); Terziovski and
Samson (2000); Hendricks and Singhal (2001a); Wiklund and Shepherd
(2003))
H1d: Leadership Excellence will have a positive relationship with all
stakeholder performance results (Miles, Snow et al. (1978); Wright,
Dunford et al. (2001); EFQM (2003))
H1e: The strength of the relationship will be weaker in highly dynamic
environments (Das, Handfield et al. (2000); Eisenhardt and Martin
(2000); Fiol (2001); Leonard, McAdam et al. (2002); Dervitsiotis (2004);
Jones (2004))
H2: There will be a positive relationship between Capability and Performance
(Klein, Edge et al. (1991); Savolainen (1999); Zahra (1999); Rosenbloom (2000);
Savolainen (2000a); Tena, Llusar et al. (2001); Douglas and Ryman (2003);
Wiklund and Shepherd (2003))
H2a: The strength of the relationship will be weaker in highly dynamic
environments (Barney and Zajac (1994); Henderson and Mitchell (1997);
Das, Handfield et al. (2000); Eisenhardt and Martin (2000); Eisenhardt
and Sull (2001); Fiol (2001))
H3: There will be a positive relationship between Leadership Excellence and
Capability (Teece, Pisano et al. (1997); Ireland and Hitt (1999); Petrick, Scherer
et al. (1999); Zahra (1999); Prahalad (2000); Zott (2003))

138
H4: Capability is developed over time (Dierickx and Cool (1989); Hendricks and
Singhal (2000); Douglas and Judge (2001); Tena, Llusar et al. (2001); Hendricks
and Singhal (2001a); Hendricks and Singhal (2001b); Przasnyski and Tai (2002);
Sureshchandar, Rajendran et al. (2003); Warwood and Roberts (2004))
H5: Leadership Excellence has a positive relationship with capability, which leads
to higher levels of performance (Tena, Llusar et al. (2001))
2.5 Chapter summary This Chapter has seen a review of the literature from three perspectives: benefits of
Business Excellence and the critical success factors, Business Excellence and
leadership, and the resource-based view of the firm. Each perspective has contributed
important insights to the research. The „benefits‟ perspective showed that benefits could
be derived from Business Excellence but the level of benefit and timing of benefit varied
across the studies. Organization size and industry were noted to be key factors. The
review of the resource-based-view of the firm led to the conclusion that was a good
theoretical foundation on which to base Business Excellence research. A number of
similarities were also drawn between the two subject areas, with it being noted that there
was commonality between the structure of the model and the authors that have argued
for particular sources of competitive advantage. The way that assets are developed also
has some things in common with the philosophy of Business Excellence. This led to a
review of the emerging dynamic capabilities literature.
The literature review allowed the definition of a research question that seeks to examine
whether Business Excellence contributes to the success of an organization using the
resource-based view of the firm as a basis of the research. Of particular interest are the
conditions under which any advantages are observed. This has led to a research model
with Performance as the dependent variable with Organizational Context, Environment
Dynamics, Leadership Excellence and Strategic Capability as the four independent
variables.
The research makes a contribution to a number of areas, including the Business
Excellence and resource-based view of the firm bodies of knowledge. It also has a
practical impact, as it will inform organizations on the conditions under which Business
Excellence will be of value. We now move to Chapter 3, which outlines the research
methodology that was used to conduct the research.

139
3 Methodology Chapter Chapter 2 concluded with an initial research model, a number of relationships that were
to be explored, and a number of hypotheses that were to be tested. In this Chapter the
approach taken to conduct the research is described.
The Chapter commences with a discussion supporting the decision to adopt a positivist
approach, which led to the research design used. A major section relates to the design of
the data collection instrument given the challenge to include both public and private
organizations in the research. Sampling was also a little complex given the need to cover
both types of organization. One of the lessons taken from the study was that the data
collection stage is far from a forgone conclusion. Several practical difficulties had to be
overcome when conducting the research and it is hoped that these will be a lesson for
others (see Tanner (2004b)). The Chapter concludes with a description of the data
analysis plan, which forms the structure of the next Chapter.
3.1 Research philosophy This section takes its structure from Remenyi, Williams et al. (1998: p45), where the
research process from research question through the research strategy to research
tactics is given. The research tactics are addressed in the next section.
The research question defined in Chapter 2 was:
Does adopting a Business Excellence philosophy lead to the development of the
ability to withstand changes in the external environment for both private and
public organizations?
As was seen in Chapter 2, research in the area of Business Excellence has included
positivist (e.g., Hendricks and Singhal (1997); Das, Handfield et al. (2000); Link and Scott
(2001); Kanji and Sá (2001a); Claver, Tari et al. (2003); Agus (2004); Mahadevappa and
Kotreshwar (2004)), constructivist (e.g., ECforBE (1999); Savolainen (2000a); MacLeod
and Baxter (2001); Powell (2001); Prajogo and Sohal (2004); Rao, Youssef et al. (2004)),
and a mixture of the two approaches (e.g., Easton and Jarrell (1998); Bauer (2002)).
Being exploratory in nature, both positivist and phenomological research philosophies
would be appropriate for the current work (Hair, Babin et al. (2003)).

140
The aspects of cost, time and the skill of researcher should be considered at the same
time as the nature of the research question in deciding on the research strategy
(Remenyi, Williams et al. (1998)). Cost was not a major consideration although, at the
time the research was designed, the full cost of using a survey approach was not fully
appreciated. A major consideration was time, as the research was conducted on a part-
time basis and there was a desire to complete the work within a sensible timeframe. The
skill of the researcher was not a major consideration with arguments for a scientific
approach (due to previous doctoral research) being balanced with more recent
experience conducting qualitative studies. On balance, the preference was to adopt a
cross–sectional positivist approach.
Many authors (e.g., Gill and Johnson (1991); Trochim (2001); Saunders, Lewis et al.
(2003)) distinguished between the two different approaches to research - deduction and
induction. Deduction is concerned with the development of a conceptual and theoretical
model prior to its testing through empirical observation. Whereas induction starts with
observation of empirical data based upon which explanations and theories are
constructed (Gill and Johnson (1991)). In a strict sense, both approaches lead to the use
of different types of data. Deduction is concerned with quantitative data and induction
with qualitative data (Gill and Johnson (1991); Saunders, Lewis et al. (2003)). Whether
there is a major difference between the two is a matter of opinion. The differences lie
more in the choice of research methods rather than any substantive differences at a
metatheoretical level (Weber (2004)).
Creswell (1994), used by Saunders, Lewis et al. (2003: p90), suggested, that "A topic on
which there is a wealth of literature from which you can define a theoretical framework
and a hypothesis lends itself more readily to the deductive approach". In terms of
induction, "With research into a topic that is new and exciting much debate, and on which
there is little existing literature, it may be more appropriate to generate data and analyze
and reflect on what theoretical themes the data are suggesting". The nature of the
research propositions in this study pointed to the need for quantitative hypotheses
testing. This is supported by the literature described later in this Chapter where it was
noted that there were several instruments available for consideration for use in the study.
In choosing the particular approach the implications of the choice were in need of
consideration. Table 3-1 outlines the implications of the choice.

141
Table 3-1: Contrasting implications of positivism and social constructionism
Feature Positivism Social Constructionism
Ontology
(The observer)
Person (researcher) and reality are separate. The researcher must be independent
Person (researcher) and reality are inseparable (life-world). The researcher is part of what is being observed
Epistemology Objective reality exists beyond the human mind
Knowledge of the world is intentionally constituted through a person‟s lived experience
Research object Research object has inherent qualities that exist independently of the researcher
Research object is interpreted in light of meaning structure of person‟s (researcher‟s) lived experience
Human interests Should be irrelevant Are the main drivers of science
Method Statistics, content analysis Hermeneutics, phenomenology, etc.
Theory of truth
(Explanations)
Correspondence theory of truth: One to one mapping between research statements and reality. Looking to demonstrate causality
Truth as intentional fulfilment: Interpretations of research object match lived experience of object. The aim is to increase general understanding of the situation
Research progresses
through
Hypothesis and deductions Gathering rich data from which ideas are induced
Concepts Need to be operationalized so that they can be measured
Should incorporate stakeholder perspectives
Validity Certainty: Data truly measures reality
Defensible knowledge claims
Reliability Replicability: Research results can be reproduced
Interpretive awareness: Researchers recognise and address implications of their subjectivity
Units of analysis Should be reduced to simplest terms
May include the complexity of „whole‟ situations
Generalization through Statistical probability Theoretical abstraction
Sampling requires Large numbers selected randomly
Small number of cases chosen for specific reasons
Adapted from: Easterby-Smith, Thorpe et al. (2002); Weber (2004)
As noted by McGrath (1982) all research has to live with the pain of compromise. In the
case of the survey approach chosen, the emphasis on generalization was traded against
the concern for the context and measurement of behaviours. There have been calls for

142
research using a constructivist philosophy on the grounds that rich data is required in
order to develop Business Excellence theory (Carr and Littman (1990); Leonard and
McAdam (2001); Leonard and McAdam (2002b)), which has already been noted to be
underdeveloped (Dale, Wu et al. (2001)). An additional argument is that, as Business
Excellence is socially complex, objectivity cannot be preserved between researcher and
object in Business Excellence research (Alvesson and Willmott (1996)). There have also
been calls for constructivist strategy research (Mir and Watson (2000)).
Before discussing the approach to measures development and qualitative techniques
used in the study, the decision to adopt a cross sectional approach as opposed to a
longitudinal approach will be addressed. The literature review of the benefits of Business
Excellence, critical success factors of Business Excellence and Leadership relating to
Business Excellence noted an overwhelming number of cross-sectional studies
compared to longitudinal studies. However, both Business Excellence (Leonard,
McAdam et al. (2002); Leonard and McAdam (2002b)) and strategy researchers
(Henderson and Mitchell (1997); Bowen and Wiersema (1999); Barney, Wright et al.
(2001); Priem and Butler (2001)) have called for longitudinal studies. A cross-sectional
approach was chosen for the current research as the focus was on examining the
relationships in the research model. Between the years 1995 to 1997 over 85% of
strategy research published in three A-class journals was cross-sectional in nature
(Scandura and Williams (2000)). It is noted in section 6.1.4, which discusses potential
future research, that longitudinal work could be used to examine the proposed causal
relationships.
3.2 Approach to measures development Stevens defined measurement as „the assignment of numbers to objects or events
according to rules‟ over 50 years ago (Carmines and Zeller (1979)). The trick is to make
sure that the numbers actually mean something. Throughout the research the issues of
validity and reliability are considered. Trochim (2001) provided a particularly useful way
of defining the various categories of validity as shown in Figure 3-1. Each of the types of
validity are further defined in Table 3-2. Whereas most authors broadly agree on the
definitions of external, internal and statistical conclusion validity there is some debate
over construct validity. The general view is that there are three types of construct validity:
Construct, content and criterion related validity (Carmines and Zeller (1979); Churchill
(1992); Scandura and Williams (2000)). All of these have been clustered under the term
„Construct validity‟ in the current work. In addition, the terms „face validity‟ and „content
validity‟ have been clustered under „Content validity‟ (Churchill (1992); Trochim (2001)).

143
Adapted from Trochim (2001: p viii)
Figure 3-1: A view of research
Bauer (2002) argued the field of measuring Business Excellence using quantitative
instruments is underdeveloped, which could suggest an inductive approach. The
complexity and challenge of establishing construct validity for a new measures has also
been highlighted (Cronbach and Meehl (1955)). As a consequence the instruments used
in this study are derived from other fields, such as that of strategy and leadership, to
avoid this issue (Dean and Bowen (1994); Ladik (1999); Dale, Wu et al. (2001)). It
includes both public and private sector organizations and statistical probability was
chosen as an appropriate approach to allow generalization to both the two categories of
organization and the population as a whole. Although there may be some subtle
differences in the interpretation of excellence for both public and private sector
organizations, the actual concepts are equally applicable to both (NIST (2002a); EFQM
(2003)).
Several authors warn of the danger of using borrowed scales. Engelland, Alford et al.
(1999) advised that domain definitions must be appropriate, experts should be used to
improve content validity, scales developed before 1989 should be avoided due to validity
and reliability concerns, and scales should only be subject to „modest‟ refinement. Scales
that do not report on validity and reliability should also be avoided (Churchill and Peter
(1984); Peter and Churchill (1986); Engelland, Alford et al. (1999)) and care should be
taken as construct validity may not be transferable between different situations (Peter and
Churchill (1986)).
External validity Sampling
Construct validity Measurement
Internal validity Design
Conclusion validity Analysis Th
e t
he
ory
of
researc
h
Th
e p
ractic
e o
f rese
arc
h

144
Table 3-2: Types of validity and reliability
Type Description
External validity External validity refers to the extent to which research findings can be generalized to other populations (Cook and Campbell (1979); Gill and Johnson (1991); Scandura and Williams (2000)).
Construct validity Construct validity:
Construct validity refers to the extent to which a particular measure relates to other measures consistent with theoretically developed hypotheses concerning the concepts measured (Carmines and Zeller (1979); Scandura and Williams (2000)).
It is concerned with what the measure is measuring (Churchill (1992)).
„The degree of construct validity is a subjective judgment or inference which cannot be proven either through logic or empirical research‟ (Peter and Churchill (1986: p2)).
Content validity:
Face validity - "Assumed" validity by people (Weber (1985))).
Content validity - Content validity concerns the degree to which a measurement mirrors a particular domain of content (Carmines and Zeller (1979)). It focuses on the adequacy with which the domain of the characteristic is defined by the measure (Churchill (1992)).
Criterion-related validity
Have both predictive validity (forecasts the future) and concurrent validity (relates to the present). A key issue is that it is not related to theory (Carmines and Zeller (1979)). Most work refers just to predictive validity.
Three types of predictive capability (Peter and Churchill (1986)):
1. Convergent validity measures the degree of correlation between two measures. Relates to the level of systematic error.
2. Discriminate validity is the primary measure as it concerns the degree to which a measure is unique. It is the only type that has low correlations.
3. Nomological validity sometimes described as „lawlike‟ as it predicts the pattern of relationships.
Internal validity Internal validity is regarded as the approximate truth of cause-effect or causal relationships. (Gill and Johnson (1991); Scandura and Williams (2000); Trochim (2001)).
Statistical
conclusion
validity
Statistical conclusion validity refers to the possibility of the researcher drawing false conclusions about the presumed relationship between independent and dependent variables (Cook and Campbell (1979); Smith (1981); Scandura and Williams (2000)).
Reliability Reliability is concerned with the degree of consistency of the results (Carmines and Zeller (1979); Peter and Churchill (1986); Gill and Johnson (1991)).
Adapted from Scandura and Williams (2000); Trochim (2001); Bauer (2002)

145
3.3 Use of qualitative techniques Two types of qualitative techniques were used to collect data in the current research:
semi-structured interviews and focus groups. The interviews followed the guidelines
given by other researchers (e.g., Fontana and Frey (2000); Huberman and Miles (2002);
Saunders, Lewis et al. (2003)). As noted by several authors (e.g., Jick (1979); Bickman
and Rog (1997); Scandura and Williams (2000)), triangulation enhances validity. With
the current research focus groups were used to improve the content validity of the
questionnaire (Carmines and Zeller (1979); Peter and Churchill (1986); Churchill (1992);
Scandura and Williams (2000); Churchill and Iacobucci (2002); Easterby-Smith, Thorpe
et al. (2002)) as well as to validate the interpretations from the statistical data and
models.
Group interviews are essentially a qualitative data collection technique that relies on the
systematic questioning of several individuals simultaneously in a formal or informal
setting (Fontana and Frey (2000)). As such they are somewhere between formal and
informal interviewing. During the early 1940s Merton and Lazarsfield introduced the
method of group interviewing into the social sciences (Madriz (2000)). As cited in
Fontana and Frey (2000), Merton, Fiske et al. (1950) coined the term „focus group‟ to
apply to a situation in which the researcher asks specific questions about a topic after
having already completed considerable research. They are particularly valuable in the
process of triangulation (Cicourel (1974)). Frey and Fontana (1991) described a variety
of Group Interview situations as summarized in Table 3-3.
Authors have noted that group interviews have a number of advantages, such as low
cost, flexibility and they generate rich data (Fontana and Frey (2000)). They also have a
number of problems, such as the need to ensure that all participants contribute to the
discussion and the need to ensure that all the data is collected accurately (Saunders,
Lewis et al. (2003)). To protect against these problems a number of actions were taken.
Firstly, the information was presented in a structured way at the start of the session (Frey
and Fontana (1991)). After presenting the information, pre-designed questions were
asked in order to solicit a response or a specific brief was given to the focus group
(Madriz (2000)). Secondly, use was made of targeted questions to get a contribution
from all participants who were not actively participating, such as „What do you think
Chris?‟ (Saunders, Lewis et al. (2003)).
Thirdly, the focus groups were conducted in a relaxed setting (Saunders, Lewis et al.
(2003)) For example, when conducting the focus groups the room was cleared wherever

146
possible so participants could interact freely. Finally, action was taken to ensure that the
feedback was captured accurately (Saunders, Lewis et al. (2003)). This was achieved
either by appointing a scribe or, when this was not possible, collecting the feedback
through a syndicate session.
Table 3-3: Types of group interviews and dimensions
Type Setting Role of
Interviewer
Question
Format
Purpose
Focus Group Formal-preset Directive Structured Exploratory pre-
test
Brainstorming Formal or
informal
Nondirective Very
structured
Exploratory
Nominal/
Delphi
Formal Directive Structured Pre-test
exploratory
Field, Natural Informal
spontaneous
Moderately
directive
Very
structured
Exploratory
phenomenological
Field, Formal Preset, but
field
Somewhat
directive
Semi
structured
Phenomenological
Adapted from Frey and Fontana (1991)
In this thesis the term focus group has been chosen as opposed to group interview, as
this accurately reflects the purpose of their use
3.4 Research design „A research design provides the basic directions or „recipe‟ for carrying out the project‟
(Hair, Babin et al. (2003: p57))). In this section the overall research design stages have
been described and this is shown in Figure 3-2.
Figure 3-2: Research methodology followed
Research design criteria
Research tactics options
Questionnaire design
Data analysis
plan
Data collection
Sample selection

147
A positivist approach was selected for the research, but this still presents a number of
options for the research tactics (e.g., Denscombe (1998); Remenyi, Williams et al. (1998);
Easterby-Smith, Thorpe et al. (2002); Saunders, Lewis et al. (2003)). The final choice of
using a survey was made considering research design criteria, which were derived from
the literature review and from research methodology text. Table 3-4 provides a summary
of these criteria.

148
Table 3-4: Research design criteria
Criteria References Response
Complexity of data required low Gill and Johnson (1991: 979); Saunders, Lewis et
al. (2003).
May use a remote survey as opposed to the need
to conduct interviews.
Increase probability of getting a contribution Stage 1 Thesis Critique (Tanner (2002)). Design „symmetrical‟ research and cover more
than one option in the questionnaire.
Limited research on public sector organizations Porter and Tanner (2003). Include both public and private organizations in the
sample.
Avoid bias through using a membership list
sample
Porter and Parker (1993); Bauer (2002). Work from commercial databases not award
databases and membership lists.
Differences in responses depending on level of
respondent in organization with self-reported
scales – referred to as the „Key informant problem‟
Downey, Hellriegel et al. (1975); Downey and
Slocum (1975); Huber and Power (1985);
Bourgeois and Eisenhardt (1988); James and
Hatton (1995); Dess, Lumpkin et al. (1997);
Curkovic, Melnyk et al. (2000); Kanji and Sá
(2001a).
Target senior managers and include a qualifying
question.
Ensure a range of environmentally dynamic
conditions
Snow and Hrebiniak (1980b); Bourgeois and
Eisenhardt (1988); Lindgren (2001).
Select sample from various industries, including
private and public.
Different level of benefits between business units
and whole organizations
NIST (2002b). Target business units and record whole
organization responses.

149
Criteria References Response
Different results from large and small
organizations
Terziovski and Samson (1999); Hendricks and
Singhal (2001a); Hendricks and Singhal (2001b);
Douglas and Ryman (2003).
Include size as a variable.
Maximize reliability and validity of instruments Churchill (1979); Hair, Anderson et al. (1998);
Bowd (2002).
Base data collection on previously used
instruments.
Jick (1979); Easterby-Smith, Thorpe et al. (2002). Use focus groups to improve content validity of
instruments.

150
Of the four research tactics proposed by Easterby-Smith, Thorpe et al. (2002: p57) a
survey was chosen from the detached positivist options. A postal survey had the ability
to collect data from a wide range of organizations in a cost-effective manner.
This section has demonstrated the process used to select a positivist approach as the
research paradigm and a postal survey as the research tactic. It has also listed a number
of criteria that were defined prior to the start of the detailed design. In the next sections
the major stages of the research methodology: Questionnaire design, Sample selection
and Data collection are discussed.
3.5 Questionnaire design The development of measures falls into three basic stages. Stage 1 is item development,
or the generation of individual items. Stage 2 is scale development, or the manner in
which items are combined to form scales. Stage 3 is scale evaluation, or the
psychometric examination of the new measure (Schwab (1980) cited in Hinkin (1995)).
This section covers stages 1, with stages 2 and 3 being discussed in the next Chapter. A
meta-analysis on previous research concluded that the measures development process
may not have a major effect on reliability, but it may have on validity (Churchill and Peter
(1984)).
Guidance was taken from Churchill and Iacobucci (2002: p315)) who suggested nine
steps for questionnaire design (Figure 3-3). Churchill and Iacobucci (2002) stressed the
steps were not sequential and that a researcher should use an iterative process. This
was, in fact, found to be the case in practice and the questionnaire was subjected to
several review cycles. For clarity in this section, the actions taken under each of the
steps have been described. Step 8 has been used to document the reviews that were
performed and the reader should note that these specific reviews might have taken place
during earlier steps.

151
Step 1
Specify what information will be sought
Step 2
Determine type of questionnaire and method of administration
Step 3
Determine content of individual questions
Step 4
Determine form of response to each question
Step 6
Determine wording of each question
Step 7
Determine physical characteristics of questionnaire
Step 8
Re-examine steps 1-7 and revise as necessary
Step 9
Pre-test questionnaire and revise if necessary
Step 5
Determine sequence of questions
Adapted from: Churchill and Iacobucci (2002)
Figure 3-3: Churchill’s questionnaire design steps
The following sub-sections describe the approach that was taken in line with Churchill‟s
approach.

152
3.5.1 Step 1: Specify what information will be sought The information sought was derived directly from the research model defined in Chapter
2. The five constructs to be operationalized were:
1. Organizational Context
2. Environment Dynamics
3. Leadership Excellence
4. Strategic Capability
5. Performance
3.5.2 Step 2:Type of questionnaire and method of administration Churchill and Iacobucci (2002) referred to the level of disguise, structure of the
questionnaire and method of administration noting that these factors are interrelated. In
the current study there was no need for the questionnaire to be disguised, but to increase
the applicability of the questionnaire to all organizations the use of „Business Excellence‟
jargon was avoided, as was the assumption that the target organizations knew what
Business Excellence was.
A structured questionnaire was administered remotely. As noted below the use of open
questions such as „please give me your name‟ proved to be a challenge for some
respondents, so a simple „tick-box‟ was used wherever possible. This approach was
suitable for the data sought (Gill and Johnson (2002); Saunders, Lewis et al. (2003)).
Some thought was given on whether to administer the questionnaire through a website.
Personal preference dictated that this would not be practical due to the length of the
questionnaire. Feedback from the pilots confirmed this decision. In some cases the
questionnaire was distributed by e-mail. This was avoided as much as possible due to
the quality issues described in the data collection section below and due to the difficulties
in accounting for the responses.
3.5.3 Step 3: Determine content of individual questions This section describes the instruments that were selected as a basis for the
questionnaire. Due to the need to use scales that suited both public and private sectors,
and the fact that most of the literature pertains to the private sector application, Step 5
(Determine the wording of the question), was a very significant step in the process. At
this stage the changes made are not described but the reasons for selecting the
instruments for modifications are stated. Although different to the final sequence on the
questionnaire, the constructs have been described in the order of the research model.

153
First the Organizational Context is described followed by Environmental Dynamics,
Leadership Excellence, Strategic Capability and, finally, Performance. When scales have
been borrowed it is good practice to report on any changes (Schriesheim, Powers et al.
(1993)). This has been kept in mind when describing the questionnaire development
process and, so that direct comparisons may be made, the original instruments are
provided in the appendices.
3.5.3.1 Organizational context There were a number of factors identified that were considered important to the study.
Firstly, the size of the organization has been shown to have an effect on the level of
benefit achieved from Business Excellence (Hendricks and Singhal (2001a)).
Organizational size is measured in one of two ways: Capacity or Scale of Operations, and
each have their problems (Dobrev and Carroll (2003)). In the current study, size was
captured in terms of number of people and turnover/ budget, these being used by other
researchers (e.g., Hendricks and Singhal (2001a); Bauer (2002); Beheshti and Lollar
(2003); Baidoun (2004)). Whether business unit/ division or whole organization was
another factor (NIST (2002b)).
At the highest level the analysis considered two types of organization – public and private
sector organizations. Which category the respondent fell into was important, but even
public sector has different types, e.g., local councils and central government, which are
subjected to different environments. A simple industry classification code was used
based on the consultancy outlook reports (Abbott (2003)) to capture the industry of the
respondent, as this was considered to be simpler than SIC coding and more applicable to
the public sector. There was also the desire, had response rates permitted, to analyse
the results by organizational type, for example, for public sector by local government,
central government, Police, etc, as an added bonus. This was not possible, however,
within the scope of the current work.
The final factor grouped together under the „Organizational Context‟ heading was the
level of the respondent. As discussed above, there is evidence that perceptions will be
effected by the role of the respondent in the organization. The initial target for the survey
was the most senior manager so the level of the respondent in their organization was
recorded.

154
3.5.3.2 Environmental Dynamics Environmental dynamism has been defined as the rate and the instability of
environmental change (Simerly and Mingfang (2000)). There is no widely held
consensus on how organizational environment should be assessed (Lenz (1980)). From
the literature two main methods were noted for considering the dynamics of the industry.
These are expert selection of the industries to study and self-reported perceptions of the
environment. Examples of the use of these methods are given in Table 3-5. The self-
reporting approach was found to be most popular. It was also noted that the instruments
were often customized for the industry.
In considering the options, the Hart and Banbury (1994) approach was chosen for this
study. Apart from being more recent than the Ireland, Hitt et al. (1987) instrument, the
Hart and Banbury approach has been used by several other researchers and it was
considered better for conversion for use in a public sector environment. The original Hart
and Banbury instrument as used by Lindgren (2001) is given in Appendix 2.1:
Competitive environment/turbulence instrument.

155
Table 3-5: Methods of considering environmental dynamics
Method Instrument Items Reliability References
Expert selection Environmental uncertainty Not applicable Snow and Hrebiniak (1980b);
Bourgeois and Eisenhardt
(1988); Hough and White
(2003).
Self-reported Perceived environmental
uncertainty
25 in 6 dimensions. 7 point Likert.
0.60 – 0.89
Ireland, Hitt et al. (1987) based
on Miles, Snow et al. (1978).
Competitive
environment/Turbulence
Complexity (2 items), munificence
(2 items) & dynamism (8 items)
7 pt Likert for 10 items, 5 pt for
munificence items.
0.63-0.67 Hart and Banbury (1994)
based on Dess and Beard
(1984).
Used by Lindgren (2001); Baum
and Wally (2003); Wilberg
(2003).
Environmental volatility Simple/ complex, static/ dynamic
classification.
Not given Bourgeois (1985) based on
Duncan (1972).

156
Method Instrument Items Reliability References
Self-reported continued Environmental uncertainty 16-item scale developed
specifically for manufacturing in
Taiwan. 3-factors: Customer
uncertainty, Supply uncertainty
and Competitor uncertainty.
0.68-0.72 Chang, Lin et al. (2002)
based on Duncan (1972).
Environmental dynamism 3-item on a 1 to 7 Likert scale. 0.79 Garg, Walters et al. (2003).
Market-related dynamism Major changes in market-related
aspects of the business
environment.
Not given Homberg, Krohmer et al.
(1999).
Environment 10-item scale based on goal
attainment developed for a
savings and loans organization.
Not given Lenz (1980).
Level of domestic and
competition from Japan
3-point categoric scale. Not applicable Das, Handfield et al. (2000).

157
3.5.3.3 Leadership Excellence In discussing this construct it is worth remembering its purpose. Within the scope of the
study the decision had been made to measure the level of „Business Excellence‟ through
a leadership based construct. Alternative decisions included measuring excellence
though one of several other criteria, such as policy and strategy, people, partnership and
resources, processes, or a combination of these (assuming that the EFQM version of
Business Excellence was being adopted). But the study sought not to be restricted by
the use of a specific excellence model and the literature review identified that Leadership
was the critical success factor. Traditional leadership instruments such as MLQ and LPI
measure the leader as an individual and not leadership in the organization, nor were they
linked with the level of Business Excellence. So, in summary, Leadership was being
measured as a proxy for Business Excellence, and a relationship between the two was
one of the requirements of the instruments selected. A search of the literature revealed
five potential leadership instruments and these are summarized in Table 3-6.
Table 3-6: Potential leadership instruments
Instrument Items Reliability/
alpha
References
EXCEL 8 attributes 16 items.
7 point Likert scale.
0.89 Sharma, Netemeyer et al.
(1990) used by Caruana, Pitt
et al. (1994).
PILOT 4 factors 60 items.
5 point scale leads to a
1 of 6 classification.
Not given Prabhu and Robson (2000).
Leadership
Excellence
6 factors 18 items.
10 point scale.
0.74 – 0.98 Kanji (2002) as used by Kanji
and Sá (2001a) and Moura e
Sa and Kanji (2003).
Leadership 1 factor covering
leadership with 5
items.
7 point scale.
0.76 Claver, Tari et al. (2003) as
used by Claver and Tari
(2003).
Leadership
and
consistency of
purpose
1 factor 1 item at „Core
concept‟ level.
24 potential items at
„Areas to address‟
level.
Not used EFQM (1999a).

158
The Kanji (2002) Leadership Excellence instrument was chosen for a number of reasons.
Both the EFQM (1999a) and Claver, Tari et al. (2003) instruments were unused at the
time that the methodology was designed and, in fact, the EFQM (1999a) would require
significant development. EXCEL is the most proven instrument but it measures
„Excellence‟ in a Peters and Waterman sense and not a „Business Excellence‟ sense, and
it has been used as a dependent variable to measure performance (e.g., Lindgren (2001);
Wilberg (2003)). In addition, the linkage between the instrument and „Business
Excellence‟ in the context of this study could not be made. PILOT looked promising, as a
level of Business Excellence classification could be derived from its use, but the
instrument had the disadvantages that it was not in the public domain and it was
designed specifically for a manufacturing environment.
Use of the Kanji and Sa‟s Leadership Excellence instrument had several advantages.
Firstly, it had been designed for use in both the public and private sectors and had been
used in several studies. Secondly, an early version of the instrument was available in the
public domain, although this version required some modification to remove some basic
design faults in the instrument, such as the use of double meaning questions such as
„Leaders develop shared meanings and interpretations of reality‟ (Churchill and Iacobucci
(2002); Hair, Babin et al. (2003)). It has since been discovered that the original
instrument was used in Portuguese (Sá (2004)). The English version of the original
instrument is given in Appendix 2.2: Kanji‟s Leadership Excellence instrument. Thirdly,
the items in the questionnaire were found to be supported by the theory of other
researchers (Table 3-7).

159
Table 3-7: Support for the content of the Leadership Excellence instrument
Areas Covered Reference
Vision, support, challenge, attitude, behaviours,
performance.
Jones (2004).
Commitment to and involvement in continuous improvement,
establishing a culture of continuous improvement, focusing
on people, learning.
Kaye and Anderson
(1999).
Attention through vision, meaning through communication,
trust through positioning, confidence through respect.
Bennis and Nanus (1985)
as cited by Darling
(1999).
Actively communicate a quality commitment to the
employees, employees are encouraged to help implement
changes in the organization, managers and supervisors
allow employees to make their own decisions, managers and
supervisors motivate their employees and help them perform
at a high level in their tasks.
Claver, Tari et al. (2003).
Commitment to Business Excellence, allocation of
resources, viewing employees as valuable and long-term,
senior managers being dynamic, acting as friends.
Philosophers and guides, evaluating the effectiveness of
Business Excellence, providing a clear vision (based on both
a customer and employee focus), making decisions on the
basis of the vision, taking into account the external
environment, being prepared for change, emphasis on
quality rather than cost.
Sureshchandar,
Rajendran et al. (2003).
Creating a learning environment for employees, creating
value for the stakeholder, using continuous improvement,
seeking innovation through performance measurement, top
management positively relating to organization performance.
Su, Li et al. (2003).
3.5.3.4 Strategic Capability How researchers measure resources and capabilities varies extensively (Hoopes,
Madsen et al. (2003)). For example, as measures studies have used patent data (e.g.,
Henderson and Cockburn, 1994), survey responses (e.g., McGrath, MacMil and
Venkataraman, 1995; McEvily and Zaheer, 1999), firm experience, market share (e.g.,
Levinthal and Myatt, 1994), human capital (e.g., Maijoor and van Witteloostuijn, 1996;

160
Kraatz and Zajac, 2001), investments in functional areas (e.g., Helfat, 1994; Yeoh and
Roth, 1999), property rights (e.g., Miller and Shamsie, 1996), and reputation (e.g., Kraatz
and Zajac, 2001). In the current study three aspects of Strategic Capability are
considered. These are path-dependency, sources of organizational advantage and level
of strategic capability. Each will be discussed in turn.
Path dependency
Research into the benefits of Excellence has shown that some authors concluded
superior performance is developed over time (Douglas and Judge (2001); Tena, Llusar et
al. (2001); Przasnyski and Tai (2002); Sureshchandar, Rajendran et al. (2003); Warwood
and Roberts (2004)) and some on the event of winning an award (Hendricks and Singhal
(2001b)). The former view is supported by Hall (Hall (1991); Hall (1992)) in his research
into intangible assets. Time to develop the capability was therefore an important aspect.
Two different approaches were considered as a measure of time. The first was that
developed by Hall (Hall (1991); Hall (1992)) where the perception of „Replacement
periods‟ and „Lead over the competition‟ were measured. An adaptation of this approach
was considered suitable for this study. The other approach identified, Competitive
advantage period (e.g., Mills and Dahlhoff (2003)), was not considered suitable due to its
reliance on financial information that would have been difficult to obtain for both business
units and public sector organizations.
Sources of organizational advantage
A composite list of potential assets and capabilities was generated from the literature
(Table 3-8). The views of Snow and Hrebiniak (1980b) were dismissed as these were
considered to be functions and not assets and capabilities. The Hall (1991) list was
dismissed in favour of the Hall (1992) list, which was more extensive. The remaining
assets and capabilities were mapped against one of the Business Excellence models, the
EFQM Excellence Model®, and a number selected on the basis of their fit with the model.
The work of Hall was also considered, the logic being that as the Hall methodology was
to be used, a solid basis would be Hall‟s own work, as a direct comparison could be
drawn between Hall‟s study and the results of the current study. The analysis is provided
in Table 3-9, which includes the classification of Assets (A) and Capabilities (C), using the
definitions that an asset is something that an organization possesses and a capability is
something that an organization does better than its competitors. The final list as used is
given in Appendix 2.3: List of assets and capabilities.

161
Level of strategic capability
Strategic Capability is defined as an organization‟s ability to adapt to changes in its
external environment. This ability has also been referred to as „Strategic Flexibility‟
(Hamel, Prahalad et al. (1998); Lindgren (2001)). The concept builds on the idea of
Savolainen (2000a), who proposed that an embedded quality ideology led to an
organization being more adaptable to change.
The „Strategic response capability„ instrument used by Lindgren (2001), which was based
on that developed by Bettis and Hitt (1995), was identified for use in this study. This was
a 2 factor, 17 items 7-point scale with a reported alpha of 0.82-0.89. This scale as used
by Lindgren (2001) is given in Appendix 2.4: Strategic response capability instrument.

162
Table 3-8: Potential assets and capabilities from the literature
Snow and
Hrebiniak (1980b)
Aaker (1989) Hall (1991) Hall (1992) Teece, Pisano et
al. (1997)
Tena, Llusar et al.
(2001)
Larréché (2002)
General management Financial management Production Marketing/ Selling Product research and development Distribution Production Personnel Applied engineering Basic engineering Legal affairs
Reputation for quality Customer service/ product support Name recognition/ High profile Retain good management and engineering staff Low cost production Financial resources Customer orientation/ Feedback/ Market research Product line breadth Technical superiority Installed base of satisfied customers Segmentation focus Product characteristics/ differentiation Continuing product innovation Market share Size/ location/ distribution Low price/ high value offering Knowledge of
Company reputation Employee know-how Product reputation Networks Specialist physical resources Supplier know-how Intellectual property rights Contracts Distributor know-how Trade secrets Public knowledge
Company reputation Product reputation Employee know-how Culture Networks Specialist physical resources Databases Supplier know-how Distributor know-how Public knowledge Contracts Intellectual property rights Trade secrets
Technological Complementary, such as an investment in a sales force or brake drums for brake pads Financial Reputation Structural Institutional Market (structure) assets Organizational boundaries (the level of integration)
Managerial competencies Employee know-how External co-operation skills Creation of a collective mind Organizational commitment Stimulation of the organizational learning process Speed and flexibility in the design of new products or services Reputation
Mission and vision Customer orientation Corporate culture Organization and systems Planning and intelligence Market strategy Human resources Technical resources Innovation Marketing operations Performance – positive results from actions International

163
business Pioneer/ Early entrant in industry Operations adaptable to customers Effective sales force Overall marketing skills Shared vision/ culture Strategic goals Powerful well-known parent Location Effective advertising/ image Enterprising/ entrepreneurial Good co-ordination Engineering research development Short-term planning Good distributor relations

164
Table 3-9: Analysis of assets and capabilities
Model
Criterion
Aaker (1989) Hall (1992) Teece, Pisano et al.
(1997)
Tena, Llusar et al.
(2001)
Larréché (2002). Selected
Assets (A) and
Capabilities (C)
Leadership Operations adaptable to
customers
Shared vision/ culture
Enterprising/
entrepreneurial
Good co-ordination
Customer orientation
(culture)
Culture
Public knowledge
External co-operation
skills
Creation of a
collective mind
Organizational
commitment
Stimulation of the
organizational
learning process
Mission and
vision
Customer
orientation
Corporate culture
Organization and
systems
Culture (C)
Public knowledge
(A)
Leadership (C)
Organization &
Structure (A)
Systems (A)
Co-ordination and
co-operation (C)
Learning (C)
Policy &
strategy
Customer orientation/
Feedback/ Market
research
Segmentation focus
Knowledge of business
Strategic goals
Short-term planning
Market (structure)
assets
Institutional
Planning and
intelligence
Market strategy
Customer focus
(C)
Capture customer
information (C)

165
Model
Criterion
Aaker (1989) Hall (1992) Teece, Pisano et al.
(1997)
Tena, Llusar et al.
(2001)
Larréché (2002). Selected
Assets (A) and
Capabilities (C)
People Retain good management
and engineering staff
Effective sales force
Overall marketing skills
Enterprising/
entrepreneurial
Employee know-how
Structural (?)
Managerial
competencies
Employee know-how
Human resources Employee know-
how (A)
Staff skills and
competences (A)
Partnership
and
resources
Financial resources
Technical superiority
Continuing product
innovation
Enterprising/
entrepreneurial
Engineering research
development
Good distributor relations
Networks
Specialist physical
resources
Databases
Supplier know-how
Distributor know-how
Intellectual property
rights
Trade secrets
Technological
Complementary, such
as an investment in a
sales force or brake
drums for brake pads
Financial
Technical
resources
Innovation
Networks (A)
Specialist
physical
resources (A)
Databases (A)
Supplier know-
how (A)
Distributor know-
how (A)
Intellectual
property rights (A)
Trade secrets (A)
Finance (A)

166
Model
Criterion
Aaker (1989) Hall (1992) Teece, Pisano et al.
(1997)
Tena, Llusar et al.
(2001)
Larréché (2002). Selected
Assets (A) and
Capabilities (C)
Processes Customer service/ product
support
Low cost production
Product line breadth
Product characteristics/
differentiation
Effective sales force
Effective advertising/
image
Organizational
boundaries (the level
of integration)
Speed and flexibility
in the design of new
products or services
Continuous
improvement
Marketing
operations
Customer service/
product support
(C)
Low cost
production (C)
Speed and
flexibility in the
design of new
products or
services (C)
Continuous
improvement (C)
Results Reputation for quality
Name recognition/ High
profile
Installed base of satisfied
customers
Market share
Company reputation
Product reputation
Contracts
Reputation Reputation Performance –
positive results
from actions
Reputation (A)
Product
reputation (A)
Contracts/
installed customer
base (A)

167
Model
Criterion
Aaker (1989) Hall (1992) Teece, Pisano et al.
(1997)
Tena, Llusar et al.
(2001)
Larréché (2002). Selected
Assets (A) and
Capabilities (C)
Other Size/ location/ distribution
Low price/ high value
offering
Pioneer/ Early entrant in
industry
Powerful well-known
parent
Location
International

168
3.5.3.5 Performance Performance is a common dependent variable in strategy research but it is one that
raises a number of concerns, such as instability of performance advantage,
oversimplification using simple models in a complex world and retrospect recall (March
and Sutton (1997)). The mix of appropriate performance measures has even been found
to vary according to industry and size of business (Maltz, Shenhar et al. (2003)).
Venkatraman and Ramanujam (1986) recognized that different measures are required for
different studies and defined three domains: financial, financial and operational
performance and organizational effectiveness. Fitzgerald, Johnson et al. (1991), as cited
by Neely, Mills et al. (2000), suggested a measurement framework with „Results‟ and
„Determinants‟. Results included financial performance and competitiveness, and
determinants quality, flexibility, resource utilisation and innovation.
For a research study focusing on Business Excellence, an approach based on more than
just financial measures and one that considers multiple stakeholders is most appropriate.
This is despite the observation that effectiveness is often said to be important but the
concept is not well defined (Steers (1975)).
Given that public sector organizations were included in the sample, a perception-based
approach negating the use of reported financials was also appropriate. Perceptions are
more accurate than archival data in any case (Miller and Cardinal (1994)). A number of
potential instruments were identified for use in the study and these are shown in Table
3-10.

169
Table 3-10: Potential instruments to measure performance
Instrument Items Reliability/ alpha References
Financial Measures
(For example,
Profitability)
Ratio of total income
to total assets
Not applicable (not
self-reported)
Snow and Hrebiniak
(1980b)
Performance
5 factors 13 items
7 point scale
0.69-0.75
Hart and Banbury
(1994) as used by
Lindgren (2001)
Firm Performance
Subjective and
objective data taken
at various levels of
the organization
0.84-0.87
Dess and Robinson
(1984)
Business
Excellence
1 factor 7 items
10 point scale
0.89
Kanji (2002)
Quality
Management
Results
4 factors 17 items
7 point scale
0.37-0.81
Claver, Tari et al.
(2003)
Dynamic Multi-
dimensional
Performance
Framework
5 dimensions:
Financial, Market/
customer, Process,
People development
and Future
performance
Not available Maltz, Shenhar et
al. (2003)
The use of financial data from either primary or secondary sources was considered
inappropriate and the Dynamic Multi-dimensional Performance Framework was
considered to be a consultancy tool. So the choice of instrument was between Hart and
Banbury‟s, Kanji‟s, and Claver, Tari et al‟s, but each had its problems. Ideally the
instrument would measure one factor for each stakeholder grouping. Only the latter
instrument did this but it was an unproven scale with a very low alpha on the employee

170
indicators factor. Neither the Hart and Banbury or the Kanji instrument considered all the
potential stakeholders. Although the former had a more established track record, it was
designed for private sector use and only had 13 items covering 5 factors, which raised a
reliability concern given the advice that at least three-factor scales should be used
(Peterson (1994); Foreman and Money (2004)). It was therefore decided to generate a
new scale through the combination of all the three instruments. Appendix 2.5: The
performance scale captures the details of the individual instruments.
In the study questionnaire, performance was categorized into four factors, each capturing
the perspective of a stakeholder group, these being customer, people, society and
organization. Note was taken of the work of Campbell (1973) (cited in Steers (1975))
who identified 19 different univariate variables, which included in the top 5 „Overall
performance‟, measured by employee or supervisory ratings and „Employee satisfaction‟,
measured by self-reported questionnaires. „Productivity‟, measured typically with actual
output data, „Profit, or rate of return‟, based on accounting data, and „Withdrawal‟, based
on archival turnover and absenteeism data, were also in the top 5 and, although
measured using self-reported scales, these areas were covered in the current research.
3.5.3.6 Summary This section has discussed the selection of the base instruments for use in the study.
The next step is to determine the form of response for each of the questions, but before
moving forward, Table 3-11 summarizes the original instruments selected for each
construct, details of which are given in the appendices to aid reproducibility (Schriesheim,
Powers et al. (1993)).

171
Table 3-11: Base instruments for each construct
Construct Instrument Selected Main References
Organizational Context N/A Douglas and Judge
(2001); Hendricks and
Singhal (2001a);
Przasnyski and Tai
(2002); NIST (2002b);
Abbott (2003)
Environment Dynamics Competitive
environment/Turbulence
instrument
Hart and Banbury (1994);
Lindgren (2001)
Leadership Excellence Leadership excellence Kanji (2002)
Strategic Capability Time to replace asset or
capability (Path
dependence) and sources
of advantage
Aaker (1989); Hall (1992);
Teece, Pisano et al.
(1997); Tena, Llusar et al.
(2001); Larréché (2002)
Strategic response
capability
Bettis and Hitt (1995) as
used by Lindgren (2001)
Performance Performance by
stakeholder
Hart and Banbury (1994);
Kanji (2002); Claver, Tari
et al. (2003)
3.5.4 Step 4: Determine form of response of each question Of all the instruments used as a basis of the questionnaire, only one from Claver, Tari et
al. (2003), had reverse scales. Opinions are divided as to whether reversed scales are a
good thing or not (Churchill and Peter (1984); Schriesheim and Eisenbach (1995)) and,
as a consequence, the decision was taken to avoid reverse scales in the questionnaire.
A second decision related to the number of points on the scale. Hair, Babin et al. (2003)
advised the use of similar scales to avoid influences from shifting scales. It was therefore
decided to adopt 7-point scales for consistency as opposed to the 10-point scale
favoured by Kanji‟s Leadership Excellence and Business Excellence instruments (Kanji
(2002)). The literature showed that there are differences in Cronbach's alpha coefficient
between using a two-response category scale and more than two response category
scale (Churchill and Peter (1984); Peterson (1994)), and there are no significant
differences between using a Likert 1 to 5 scale and a 1 to 7 scale.

172
Turning to the number of items in a scale, there is a tendency towards higher reliability
and lower measurement error when the number of items is increased (Churchill (1979)).
However, this is not a very strong relationship and the greatest differences appear in
scales between two and three items and those with more than three. Ten-item scales
have very high coefficients (Peterson (1994); Foreman and Money (2004)), and very high
coefficients (higher than 0.9) should be avoided, for they might entail redundancy
between the items (Boyle (1991)).
There were also several approaches to positioning the statements in the instruments.
These included „Disagree/ Agree‟ for Environmental dynamics (Lindgren (2001)) and
Performance (Lindgren (2001); Claver, Tari et al. (2003)), and „To what extent‟ for
Leadership Excellence and Performance (Kanji (2002)). For simplicity and reliability the
wording of the statements for the scales followed the original wording as far as possible.
The only complication was the performance instrument where it was decided to express
this as a „To what extent scale‟ to maintain consistency with the Leadership Excellence
instrument, which was to follow it on the questionnaire.
The most difficult part of the questionnaire related to the Strategic Capability instrument
for time, where the form of response went through several iterations based on the
feedback received. To maintain consistency with the approach of Hall (Hall (1991); Hall
(1992)) the first version asked three questions:
1. How long (in years) would it take to replace the asset or capability?
2. How important is the asset or capability?
3. How far in front or behind your competitors are you in the asset or capability?
The early tests highlighted some difficulties with this approach. Firstly, presenting the 26
assets and capabilities 3 times lengthened the questionnaire and there were comments
about repetition. Secondly, respondents were finding this to be the most difficult part of
the questionnaire and it was taking time to complete. The suggestion was made that
respondents listed their top three strengths and weaknesses, but this was abandoned
after trials led to difficulties in coding the responses. The final version distilled the part of
the questionnaire down to a single page asking respondents to record whether they
thought the particular asset or capability contributed to their Sustainable Organizational
Advantage and how long it would take to replace it if lost. This was a compromise
situation in that it made the questionnaire easier to complete, but did not give the level of
detail required for a direct comparison with Hall. However, as this area was only one of

173
several aspects being examined the trade-off in order to improve the response rate was
considered acceptable.
3.5.5 Step 5: Determine wording of each question The approach to determine the wording of each question was to first build the
questionnaire from the base instruments whilst, at the same time, developing draft
wording for the items that were in need of modification for the application to public sector
organizations. The resulting questionnaire was presented to four industry experts for
completion in the researcher‟s presence to improve content validity before being revised.
Hall (1992) noted one of the reasons why content validity could be compromised was
when the respondent does not understand the question. One industry expert was from a
large private sector organization, one a public sector local council directorate, one the
CEO of a voluntary trust and the fourth from a small enterprise. Table 3-12 summarizes
the major changes by construct made as a result of this exercise. The resultant
questionnaire was subsequently subjected to a number of pre-tests to further improve
content validity as described under step 9 below.

174
Table 3-12: Summary of main changes by construct
Construct Feedback
Organizational Context No changes required other than adding „Police‟ as an additional category.
Environment Dynamics Remove terms such as „business‟ to make it more acceptable to the public sector. For example, change „The
business outlook for the next 12 months looks good‟ to „The outlook for the next 12 months looks good‟.
Whereas private sector organizations face changes in their marketplace the equivalent in the public sector is
changes in their funding. For example, the draft translated public sector statement for the private sector
statement „The market will grow for several years‟ was „Demand for services will grow for several years‟. After
the feedback this statement was modified to „Public sector spending will grow for several years‟.
Leadership Excellence Double-barrelled questions reduced.
One item added:
Leaders keep the mission current.

175
Construct Feedback
Strategic Capability
Strategic response capability
The major change was the removal of the item „Research and Development‟ from the original instrument. This
is because this function has no equivalent in the public sector.
Other changes were minor. For example, the first translation of „Business Concept‟ from the original instrument
for the public sector was „Service concept‟, but Raison d‟être was considered more appropriate. Another
example was the original term „Financial platform‟, which neither expert understood so „Financial viability‟ and
„Budget position‟ were used for Private and Public sector respectively.
Time to replace and Sources of Organizational Advantage
Only minor changes were required, some of which were common with the „Strategic response capability‟ factor
above. One example was changing „Distributor know-how‟ to „Service provider know-how‟ for public sector. A
second example was the translation of „Low cost production and or/ service delivery‟ to „Value for money‟.

176
Construct Feedback
Performance The first version of the performance instrument assumed that there would be no difference in the rating of the
performance of the public sector and the private sector as a starting point. But the feedback from the experts
proved this assumption to be false, as the public sector works to a completely different business mode. For
example, with the private sector an increased demand is a good thing whereas in the public sector this is more
a reflection of political and environmental forces. The customer is a fundamentally different stakeholder.
Examples of changes in this respect were the translation of „Has an increasing market share‟ to „Has an
increasing share of budget‟.
A second issue that had to be overcome is that public sector organizations do not compete. As a consequence
items such as „Has a high competitive position‟ were translated to „Has a high performance rating‟ and „Has
high profitability‟ to „Provides value for money‟.
A third issue was that some items were removed. These related to the TQM Practice questions in the Claver,
Tari et al. (2003) instrument as they were not considered to represent organizational performance.
A fourth category of change was minor context changes. For example, under people „Has low absenteeism
compared to the industry standard‟ was amended to „Has low absenteeism compared to the public sector
norms‟. Some other items were re-worded to make them simpler, for example, „Employee satisfaction has
historically improved‟ to „Has improving levels of employee satisfaction over time‟.
Finally some items added under the Social responsibility‟ and Employee satisfaction‟ areas. For example,
„Follows sustainability‟ and „Develops its staff at all levels of seniority‟.

177
3.5.6 Step 6: Determine sequence of questions As mentioned in the introduction, Step 6, „Determine sequence of questions‟, was
considered at the macro-level prior to the commencement of Step 5. This led to the
decision to structure the questionnaire following the guidance of Churchill and Iacobucci
(2002) in the order of Organizational Context, Environment Dynamics, Strategic
Capability (Strategic Response Capability), Strategic Capability (Time to develop and
Sources of Organizational Advantage), Performance and finally Leadership Excellence.
The reasons for this sequence were that the first questions were straightforward and
questions 2 and 3 simple tick-boxes. Question 4, Strategic Capability (Time to develop
and Sources of Organizational Advantage) was the most difficult question and so it was
positioned after the respondent had warmed up and before they were tired. Questions 5
and 6 were also simple tick-box questions but the last question, related to Leadership
Excellence, was the most sensitive.
Following the early tests some changes were made to the sequence of the questions.
The major change was to move the Organizational Context section to the back as it was
observed that completing the respondents‟ details was the one question people struggled
with the most. They were senior managers after all. There was also a change to the
physical characteristics of the questionnaire based on feedback, which will be discussed
in the next section.
The Environment Dynamics question had a number of items where there was need for
alternative statements to cover public sector organizations. The question was simplified
by presenting the items that were common to both sectors first before listing those with
alternatives. In the early versions two alternatives were presented on some questions
and only one on others. It was noted that the respondents missed some questions when
they were only presented with different format questions in this section
One other minor change to the sequence of the assets and capabilities on the Strategic
Capability (Time to develop and Sources of Organizational Advantage) question was to
put the assets and capabilities into alphabetical order.
3.5.7 Step 7: Determine physical characteristics of the questionnaire As discussed previously it had been decided to administer the questionnaire through a
postal survey but, at the same time, make the questionnaire available electronically. The
main thrust of the design of the questionnaire was focused on the postal use of the
questionnaire and the basic design was based on other work that had been well received
(e.g., Bauer (2002); ECforBE (2002)).

178
Four issues are addressed in the remainder of this section. First, there is the issue of the
branding of the questionnaire and the decision as to whether to adopt a „professional
organization‟ or „poor DBA student‟ approach. Second, there is the instruction page of
the questionnaire. Third, the covering letter is considered and then finally, the critical
question of whether to use one or two versions of the questionnaire.
3.5.7.1 Branding of the questionnaire A decision was made for the questionnaire and supporting material to carry the
organization‟s brand, the European Centre for Business Excellence. This was to raise
brand awareness during the collection of the primary data, as the organization was
sponsoring this aspect of the work. This decision was taken with the knowledge that it
could have an impact on the return rate by being perceived as a commercial exercise,
such as a direct mail shot. As will be seen from the level of response given in the next
Chapter, this concern was well grounded but there is no doubt the questionnaire did
reinforce and raise brand awareness.
3.5.7.2 Questionnaire instruction sheet The research called for a number of different types of organization to be included in the
sample. It was decided to have a standard instruction sheet at the front of the
questionnaire and to have targeted covering letters. The questionnaire instruction page
was based on that used by others (Lindgren (2001); Bauer (2002)). Several issues were
considered when constructing the instruction page. These are summarized in Table
3-13.

179
Table 3-13: Questionnaire instruction page considerations
Consideration Concern Solution
Unit of analysis Unusable questionnaires
would be returned and / or
the number of completed
questionnaires would be
lower than the potential.
Include definition of „your
organization‟.
Level of analysis Unusable questionnaires
would be returned, as the
level of respondent was too
junior.
Include definition of
required respondent and
option to snowball if
required. A qualification
question was also included
on the questionnaire.
Value of the questionnaire
to the respondent
Reduced response rate. Include value statement as
an example.
Ease of completion of the
questionnaire
Reduced response rate. Reinforce simplicity and
time to complete.
Specific differences
between public and private
sector organizations
Reduced response rate
and/ or inaccurate
responses due to confusion.
Include a section defining
how the questionnaire
recognises both types of
organization.
The draft questionnaire instruction page was subject to review and refinement through
the focus groups described below under Step 8. No major changes were made apart
from correcting typographical errors and changing the wording to reflect the content
changes made.
3.5.7.3 Questionnaire covering letter The first covering letter produced followed the guidance of Churchill and Iacobucci (2002:
349). This covered aspects such as the importance of individuals‟ contributions and the
fact they were selected at random. It was the intention to customize the covering letters
depending on the target group of respondent, but a major refinement based on feedback
from the reviews was to simplify and shorten the letter, and to include a „Valid Business
Reason‟, which is an idea borrowed from a sales arena. This is defined as „the potential
customers‟ reason for seeing you‟ (Miller and Heiman (1988: 237)). The valid business
reason varied from the private to the public sector audience. In the former, the motivation

180
was the ability to identify potential competitive advantages that they could use to their
benefit. For the public sector the motivation was to learn more about Business
Excellence to enable them to improve their business planning, Business Excellence being
a concept being forced upon them by the Government.
One change made during the course of the data collection was to provide an early insight
into the results of the study. As the questionnaire was issued to target respondents on a
rolling basis the later covering letters (and the letters used to chase up respondents)
hinted at the early results to whet the appetite without biasing the responses.
3.5.7.4 Number of versions of the questionnaires A major decision was whether to conduct the data collection with a combined public and
private sector questionnaire, or two versions of the questionnaire with one for each type.
A number of factors were considered in making this decision and these are shown in
Table 3-14.
Table 3-14: Considerations for one or two questionnaire version options
Factor Single Version Two Versions
Required sample size The ability to achieve an
acceptable response
greater.
There was a potential need
to collect an acceptable
response level for each
version.
Simplicity of presentation More complex where there
were two options especially
where a separate question
structure was required.
Much simpler as only one
option presented.
Simplicity of completion Questionnaire length longer
and slower to complete.
Shorter and faster to
complete (estimate 10%
from observation).
Comprehension of items Enhanced by presenting
both options.
Not considered to be a
major issue.
From the feedback received when running the reviews it was decided to go with a single
questionnaire for four main reasons:
Lower risk to statistical power as there was more probability of getting a larger
sample (Hair, Anderson et al. (1998))

181
For items that had two options it was found that this improved the comprehension
of the translation as public sector respondents could relate the question to a
commercial environment
It was a false assumption that the respondents could be categorized into „Private‟
or „Public‟ sector as public sector organizations become more commercially
aware
The problem of presenting two options to a respondent simply was solved.
The first three points need no further explanation but the fourth point has been expanded
to capture the learning for others. Figure 3-4 captures the various stages of refinement
that the questionnaire went through.
Figure 3-4: Stages of refinement of dual items to final questionnaire
Separate items (a) and (b)
Separate sections for private and
public
Two versions of questionnaire
'Translated' items
Refinements in data collection

182
The first version of the questionnaire took the approach of having (a) and (b) versions of
the items that needed to be changed to suit the public sector. This was tested in the
initial content validity tests and found to be limited. These first tests were conducted by
getting the respondent to complete the questionnaire in the researcher‟s presence,
followed by a debrief at the end of the exercise. Watching the respondent complete the
questionnaire provided additional insights through their body language (Clayton (2003))
and one of these insights was that when presented with a mixture of item options, then a
single item, some of the items were missed out.
The next version of the questionnaire took the approach of having all the common
questions in one section, followed by specific questions for the public and private
responses in separate sections. This approach was not popular with the test
respondents and led to the conclusion that two versions of the questionnaire should be
completed, or that the research method should be changed to utilize one-to-one
interviews rather than using a postal questionnaire. The former was considered to be
more practical given the desired sample size so a dual version of the questionnaire was
produced and piloted. On separating the questionnaires into two versions, the conclusion
was that although this simplified the questionnaire for the respondent, it had major
implications for the research.
The matter was given consideration at the Wisconsin theme group in October 03. This is
mentioned as it demonstrates the value of actively participating is such support groups.
The cost, 36 hour journey and exposure to „American‟ Shakespeare was well worth the
investment as an inspired member of the group suggested that the problem should be
solved using a „translation‟ approach as used when using dual language questionnaire. A
version of the questionnaire was produced where a public variation of the item was
reproduced in a second colour underneath, or beside, the general statement. When
tested with some of the early respondents the changes were received positively and so
this was the method used. As Figure 3-5 indicates, a further refinement was required
when the practicalities of using the questionnaire were considered, but this will be
discussed in the data collection section below.
3.5.8 Step 8: Revisit previous steps Determining construct validity is a subjective process that may be improved through the
use of experts to improve content validity (Carmines and Zeller (1979); Churchill (1992);
Clayton (2003)). Peter and Churchill (1986) in particular noted the need to rely on both
judgemental as well as empirical relationships when assessing construct validity. During
the development of the questionnaire five review cycles were conducted and these are

183
shown in Figure 3-5. The first review consisted of four industry representatives
examining the questionnaire in order to ensure that the wording of the items could be
understood in their industries. This was described under Step 5 in section 3.5.5 above.
Figure 3-5: Questionnaire review cycles
The second review cycle involved a focus group of four Business Excellence practioners,
two from private sector and two from public sector organizations, considering the content
validity of the questionnaire. It was the review of this version of the questionnaire that
identified there was a major concern with part 3 of the questionnaire, which sought to
Content validity
industry expert
review
Content validity
practioner focus
group
Content validity
expert focus
groups
Peer review of
final questionnaire
In use review

184
examine the sources of organizational advantage. There were also some changes to the
items on the questionnaire, with some items being added. A summary of the feedback is
shown in Appendix 3.1: Practioners‟ focus group feedback. The focus groups were
managed using the qualitative methods outlined in section 3.3 above.
The third cycle exposed the revised version 3 of the questionnaire to two five-person
focus groups with Business Excellence experience. One focus group comprised public
sector experts, and the other private sector experts. The focus groups were conducted at
the same time, but in different rooms. A plenary session held at the end reviewed the
feedback and this included some issues that are addressed in the data collection section
below. Appendix 3.2: Private and public sector focus group contains the summary
feedback from both groups.
The penultimate review was conducted on version 4 of the questionnaire with a peer
group at the October 03 Theme Group. The focus group consisted of five members and
to demonstrate the quality of the participants Figure 3-6 shows two of the group captured
during a moment of relaxation. Several minor changes were made to the wording, for
example, refining questions so that they were not so leading, but the major change as
described above was to re-combine the two versions of the questionnaire into a single
version.
At the end of the questionnaire design process the questionnaire was at version 5. The
last box in Figure 3-5 relates to some cosmetic changes made when preparing for the
data collection, and these will be described below. The final version of the questionnaire
is given in Appendix 4: The final questionnaire.

185
Figure 3-6: Wisconsin focus group members in a moment of relaxation

186
3.5.9 Step 9: Pre-test questionnaire Due to the decision to base the questionnaire on existing instruments and due to the
effort put into the review cycles, a pilot study was not considered necessary. Despite
this, to reduce the risk, some preliminary analysis was conducted after approximately 50
questionnaires had been returned. The alphas were calculated for all the relevant
instruments and a correlation analysis conducted on three of the constructs. Table 3-15
and Table 3-16 contain these preliminary results.
Table 3-15: Initial alphas recorded
Construct Reported Alpha This Study
(N=54)
Environmental Dynamics 0.63 - 0.67 0.68
Leadership Excellence 0.74 – 0.98 0.85 - 0.97
Strategic Response Capability 0.82 - 0.89 0.94
Performance Not applicable 0.66 - 0.88
Table 3-16: Initial correlations for three of the constructs (N=54)
Performance Leadership
Excellence
Capability
Performance Pearson correlation
Sig. (2-tailed) N
1
Leadership
Excellence
Pearson correlation
Sig. (2-tailed) N
0.769** .000
47
1
Strategic
Capability
Pearson correlation
Sig. (2-tailed) N
0.743** .000
46
0.722** .000
54
1
** Correlation significant at the 0.001 level (2-tailed)
One additional benefit of conducting this early analysis (apart from having the comfort
that the research was on course to deliver a defendable contribution) was that the results
could be used to sell participation in the study. This point has been discussed elsewhere.

187
3.5.10 Summary of questionnaire design This section has described the approach to designing the questionnaire. The Churchill
and Iacobucci (2002) approach was followed and a number of review cycles were
conducted. A complete copy of the final questionnaire has been given in the Appendix 4:
The final questionnaire.
It was noted that some further refinements were made when the data collection activities
commenced and these are described below. In the next section the sampling approach
is described.
3.6 Sample selection The scope of the sample selection stage is defined as starting with the definition of the
attributes of the required sample and ending when the potential respondents had been
identified and recorded in a database. Trochim (2001) noted that most research
necessitates a multi-stage approach to sampling. In the current study the situation was
complicated by the desire to include both public and private organizations in the sample.
Prior research (e.g. ECforBE (1997); ECforBE (1999); Hendricks and Singhal (2001b);
Bauer (2002); Przasnyski and Tai (2002); NIST (2002b)) used the convenience of award
winners as a sample and this research recognizes the limitations caused by the bias in
the sample. To check for bias in this research the source of the respondents was
recorded.
3.6.1 Unit and level of analysis The need to target respondents at a senior level in the organization was a further
complication. It has already been mentioned that several actions were taken to ensure
this, such as clearly stating the level of the analysis in the questionnaire introduction,
providing the option of passing the questionnaire to „a more appropriate executive‟ and
including a organizational qualification level on the questionnaire. One further action was
to change the emphasis of the covering letter so that some were addressed to the senior
executive and others to a contact asking them to pass it to an appropriate contact in a
„snowballing‟ approach (e.g., Moser and Kalton (1971); Denscombe (1998); Trochim
(2001)).
The unit of analysis was defined as an organizational unit that had its own leadership
team and its own discrete stakeholder results. This definition is in line with that used for
award applications where it must be possible to assess all aspects of the organization.
This approach was also taken for practical reasons, as it increased the probability of
getting an acceptable response as, for example, it was possible to target 83 leaders in

188
the Inland Revenue whereas, only considering the Inland Revenue, as an organization,
the target would have been one. It was also considered that it would be easier to connect
with organizational unit leaders than very senior executives. Responses were therefore
being sort from whole organizations (multinational and SMEs), Divisions, Business Units,
Regions and Directorates. The approach also had the benefit of providing a wide range
of organizational sizes, and size was one of the variables being examined.
3.6.2 Sampling approach The design of the research considered the need for efficient sampling (Hair, Babin et al.
(2003)) Several factors were considered in estimating the required sample size, most of
which related to statistical power. Taking a general view, Cohen (1977), as cited by Hair,
Anderson et al. (1998), recommends a statistical power of 80% and significance level of
0.05. On consulting Hair a sample size of over 130 would be required to achieve a power
of 80% with an effect size of 0.35 at a 0.05 significance level. The required sample size
reduces to over approximately 65 when the effect level increases to 0.50 (Hair, Anderson
et al. (1998: p12-13)). A review of empirical work in the Business Excellence literature
suggested that a small to moderate effect size was expected, setting the required sample
size at around 200 to be on the safe side. The danger of excess power was not a major
risk with this sample size, this being a raised when the sample size exceeds 1000 (Hair,
Anderson et al. (1998)).
A second consideration was the required number of observations for the factor analysis.
For this Hair, Anderson et al. (1998) suggest an absolute minimum of 5 observations per
variable, with a 10 to 1 ratio being more suitable. Examining the questionnaire it may be
seen that the largest instruments were the Performance instrument with 39 items,
followed by the Leadership Excellence item with 26 items. Taking the Performance
instrument this gave a minimum sample size of 195, with an ideal of 390.
A third consideration was the power required to detect a statistically significant R2 in the
regression analysis. Taking the worse case of 5 independent variables in the regression,
a sample size of 100 would be required to detect a statistically significant R2 of 12% at a
0.05 significance level, with a 5% R2 being detectable at a sample size of 250 (Hair,
Anderson et al. (1998: p165)).
The final consideration was generalizability. Turning to Hair yet again the suggestion is a
minimum ratio of observations to variables of 5 to 1, with 15 to 20 to 1 being more
desirable. Taking the worse case again of 5 independent variables, this would require a

189
minimum sample size of 100. Taking all the considerations, the objective was to have a
sample size of 200 with a minimum of 100.
Potential respondents were identified from a number of sources. These were:
Two bought-in commercial databases, one for private and one for public sector
organizations
Public sector conference attendees
Personal networks
As the number of potential respondents was low, with a range of between approximately
80 to 150 depending on the source, a 100% sample was taken (Moser and Kalton
(1971)). In designing the approach some assumptions were made about the likely
response rates. It was estimated that an average response rate of 10% would be
achieved with the worst-case scenario of no lower than 5%. Although a quota sampling
approach was not used the ideal number of responses was set at 100 public sector and
100 private sector organizations. If this could not be achieved it was calculated that, with
a 5% return, 100 responses would be collected with a sample of 2000 potential
respondents. If only a very small return was achieved there was a high confidence that at
least 50 returns would be achieved, although it was recognised this would lead to
concerns over the limitations.
Given the potential respondents had to be identified from a downloaded excel
spreadsheet, selected, checked for duplication, linked to address data that was copied
from a web-page in some cases, and transferred to an excel database that was used for
the mailing, the identification of the target respondents was an extremely time consuming
process. It was estimated that 25 contacts could be processed per hour and so over 84
hours effort was expended for the 2100 contacts identified in the sample.
3.6.3 Sources of potential respondents Each of the four categories are now briefly described.
3.6.3.1 Bought-in commercial database for private sector organizations Two commercial databases were „purchased‟. The first, OneSource, was used as the
source of the potential private sector organizations, which draws its data from sources
such as Dunn and Bradstreet. Of the 17 different industry sectors covered by OneSource
7 were chosen on the basis of their level of growth as consultancy industry sectors

190
(Abbott (2003)), their commercial interest to the consultancy and their use in prior studies
(e.g., Snow and Hrebiniak (1980b); Bourgeois and Eisenhardt (1988); Lindgren (2001)).
These industry sectors were Automotive & Aerospace, Communications, Computers &
Electronics, Construction, Finance, Services and Utilities & Energy. From these 7
industries a total of 27 subgroups were selected. Using the database 500 potential
executive contacts were downloaded for each industry sub-sector. The limit of 500 was
imposed as the researcher only had access to a preview version of the database (the
subscription cost was £10,000 per year). This did not give a major cause for concern as
the organizations were of mixed origin (e.g., sizes). Later in the research a potentially
more suitable database was identified in the Hemscott database, but this database is not
available through Henley although access could have been gained through LUBS.
Each sub-industry group gave a number of contacts for the organizations included and
when a response is only being sought from one contact it is important to chose the most
knowledgeable person (Huber and Power (1985)). A set of rules was therefore designed
to ensure that a consistent approach was taken to selecting the individuals. Given the
„valid business reason‟ of the determination of competitive advantage, the Strategy or
Marketing Director was selected as the target respondent if such a contact was listed.
The second option was the Managing Director and the third, the Chief Executive or
Chairperson. In some cases only „Directors‟ were listed and so the first director in
alphabetical order was selected to avoid duplication. Once all the potential respondents
were identified a check for duplication was made. It was concluded that this was
extremely necessary as several organizations were found to trade under different names
or/ and in different industry sectors.
3.6.3.2 Bought-in commercial database for public sector organizations A database of Chief Executives from local councils was purchased. Entitled the
„Municipal Yearbook‟, this provided over 420 potential contacts. Although some data
manipulation was required this was not as labour intensive as for the OneSource data.
One lesson from using this database was that, although the database was purchased for
use in „research‟, the vendor had a different understanding of research than the
researcher. When potential respondents on the original list were sent a chase-up letter,
as is normal research practice, the vendor issued a threatening letter accusing breach of
contract as the licence was for a one-shot use. This increased the cost of the survey by
over £300 and considerable aggravation as the vendor threatened court action if we did
not pay their „fine‟. After paying the invoice the vendor started to send „25% off your next
purchase‟ discount vouchers, which make handy targets if one wants to practice throwing
darts.

191
The inclusion of central government organizations was considered but no commercially
available database was identified. Sources within central government suggested that one
way of identifying suitable contacts would be through web-searches, but on attempting
this it was found to be impractical. In fact one of the network contacts kindly offered to
provide a list of senior contacts with the Inland Revenue, but this took their secretary
several days‟ effort to provide a list of 83 contacts, and they had the advantage of internal
systems!
3.6.3.3 Public sector conference attendees To overcome the problem of not having central government representation, two
conference lists were obtained, one from a „Public Sector Excellence‟ conference in
February 2003 and the other a „Police Excellence‟ conference in September 03. Some
consideration was given to bias as these were „Business Excellence‟ conferences, but as
no direct Business Excellence questions were being asked this was considered a
manageable limitation, as the source of all the respondents was recorded as a data field.
3.6.3.4 Personal networks Over the years a number of personal contacts have been made. To this was added
potential contacts from the consultancy database, other networks such as Business
Excellence networks and by targeting contacts in large organizations with the request to
distribute the questionnaire internally. The actions taken to mange any bias through the
use of such an approach have been well described elsewhere in this section.
3.6.4 Summary of selected sample Although technically a result, it is considered of value to record the number of identified
contacts who received the questionnaire segmented by source, and the respective
response rates. This data is summarized in Table 3-17.
Table 3-17: Sample sizes by source and respective responses
Source Issued Responses % Response
OneSource 1074 25 2.3%
Municipal Yearbook 453 47 10.4%
Networks 318 82 23.6%
Conference lists 261 38 14.6%
Total 2106 192 9.1%

192
The response rate was disappointing but very close to the anticipated figure of 10%.
Other studies have returned higher response rates (e.g., Das, Handfield et al. (2000);
Beheshti and Lollar (2003); Baidoun (2004)) but this has not always been the case (e.g.,
Link and Scott (2001)). Low response rates are expected from direct mail surveys
(Churchill and Iacobucci (2002)), especially to senior executives (Simons (1995); Collins
and Porras (1998); Agle, Mitchell et al. (1999); Simons, Pelled et al. (1999); Makhija
(2003)). An option when considering publication of the research will be to consider the
effect of removing the OneSource sample, thereby improving the generalizability of the
research to the higher responding population.
3.7 Data collection approach Sample selection concluded with the potential respondents being recorded in a database.
The scope of the data collection stage was defined as starting with the mass production
of the questionnaire and ending when the data collection step was considered over.
Figure 3-7 defines the main steps in the approach.
Before describing the steps some general points will be made about the approach taken.
The approach was designed following the advice of Saunders, Lewis et al. (2003). In
addition to the selection of a „Valid Business Reason‟, which was described above, to
increase the response rate the non-monetary incentive of a copy of a summary of the
research was given in the covering letter and there was a question on the questionnaire
so that the respondent could indicate whether they wanted to receive this. Feedback in
the development of the questionnaire suggested that there was an issue over
confidentiality as a leadership scale was being used, so the confidentiality of the results
was reinforced in the covering letter as well as on the questionnaire. A follow-up was
also conducted as shown in Figure 3-7.
Some advice was not taken. A freepost licence was organized to provide return postage
although it is noted that a higher response may have been achieved using stamps. Given
the forecast response rate, this could have added as much £500 to the cost of the
research. It was also noted that Saunders, Lewis et al. (2003) suggested and other
researchers have used (e.g., Lindgren (2001); Wilberg (2003)), a prior notification to
increase the rate of response. Apart from the potential cost (£500 again), the timing did
not suit such an approach. The data collection commenced in November 03 and the
target cut-off date was 29 February 04. Given that Christmas was bang in the middle of
this period, it was decided to have a break over the Christmas period, so two weeks were
taken out of the schedule with the objective of running the first data cycle collection
November to Christmas and the second data collection cycle early January to February.

193
The description of the approach has been given in the context of the postal questionnaire.
Where there was a difference between the postal approach and questionnaires
distributed by e-mail, this has been noted.
Figure 3-7: Main steps in the data collection stage
questionnaires
Despatch
questionnaires
Chase responses
Acknowledge
questionnaire
receipt
Code responses
Enter responses
into database
Transfer database
to SPSS

194
Print questionnaires
One of the major lessons from this study is that „it is not over until the fat lady sings‟.
From the point that the questionnaire was designed and potential respondents were
identified the perception was that it would be plain sailing, but the first step in the
approach threw up some challenging practicalities.
Firstly, the final questionnaire had the public sector translations in blue and this proved to
be very effective. However, in going into production it was found that the cost of printing
two colour questionnaires was expensive and, more importantly, it would have put a 2 to
3 week delay in the process, meaning that the data collection would have not
commenced until 2004. Both litho-printing and colour laser printing were explored, and
although laser printing was more convenient, the equipment lacks reliability when
producing large numbers. The questionnaire therefore had to be changed to a black and
white version, with a very different text style replacing the blue. The modified version was
tested with a group of 3 respondents and although it was not considered as good as the
colour version, this comment was only made by the three respondents who had
experienced the colour version.
Another point concerns the file type. The word version of the questionnaire was
converted to an acrobat version as this gave a slightly more professional result and it
improved security, as respondents receiving the questionnaire by e-mail were unable to
change it. It was found, however, that when printed by the respondents, acrobat files
sometimes did not print with the required resolution. Some early versions were returned
with no check boxes on them. At this point the use of acrobat files was abandoned and
word files used.
One complication with the approach was the need to customize the questionnaire. This
was done for three reasons. Firstly, in the pre-tests it was found that the most difficult
task for a senior leader was to complete his or her name and address. This came to light
during the observed interviews. Secondly, in the focus groups the view was expressed
that having the questionnaire pre-printed with the respondents name and address looked
more professional. Finally, it was possible to include a code on the questionnaire so that
the source of the response could be tracked.
The customization requirement was satisfied through the purchase of a Dymo
LabelWriter machine, which prints labels direct from a database. The label was attached
to the last page of the questionnaire in a pre-defined box. Where questionnaires were

195
despatched my e-mail, a variant of the questionnaire was used that had an embedded
source code and space for the name and address to be completed.
One issue that did come to light during the despatch questionnaire step was one of
photocopier quality. The questionnaires were printed on demand using a fast black and
white laser printer. Due to the need to label the questionnaires everyone had to be
handled and it was found that several questionnaires were misprinted with text missing.
It was therefore necessary to implement a quality control check on the output of the
photocopier machine.
Despatch questionnaire
As mentioned above, the covering letters were customized depending on the target
respondent and it was found that printing the letters, signing them individually, printing the
questionnaire labels, attaching them to the questionnaire and stuffing a window envelope
with the letter, customized questionnaire and freepost return envelope was a simple, if
time consuming, task. The researcher‟s thanks goes to his family at this point for
completing this task during the course of the study, while he was off watching WHU play.
Chase responses
After a three to four week period non-respondents were chased either by e-mail or by
post. With both methods a hint of the results was included, as the preliminary analysis
had been completed. For the postal chases the incentive of a free copy of one of my
books was given in order to increase the response rate and to reinforce personal
credibility.
The follow-up had a small impact and did increase the response rate by approximately
10%. It was interesting that, whereas several people still had the questionnaire in their
in-tray, many remarked that they had not received the questionnaire in the first place and
so requested a second copy. This was particularly noted for contacts that had been sent
the questionnaire by post and then chased by e-mail. It is likely that a „protective PA‟
effect was being observed in these cases. It is also worth noting that, for the OneSource
targets, many of the rejections came from executive assistants so they did not land
anywhere near the desks of the intended respondents.
Acknowledge questionnaire receipt
For those respondents who were kind enough to participate in the study a follow-up letter
was issued by Professor John Oakland, who is the CEO of the sponsoring organization

196
and well-known in the field, having written several best selling books. The main purpose
of this action was to build future relationships and prepare the ground for the pre-release
of the results to test validity (Jick (1979)).
Code responses
On receipt of the responses, the date received was noted on the database together with
whether the respondent wanted a summary of the results. Two additional codes were
added, which were for the source of the respondent and whether they fell into the private
or public sector category.
Enter responses into database
Periodically the returned questionnaires were transferred into an excel database. Excel
was chosen as this was easier to use for the data entry operatives and it faciltated a
100% cross-check prior to commencing the analysis. At this point the issue of missing
data was not considered with the fields simply being left blank. As a generalization, the
only part of the questionnaire that had missing data was part three, which considered the
sources of orgainzational advantage and replacement periods.
Transfer database to SPSS
Although some data had been used to set up the receiving SPSS data file and to conduct
some preliminary analysis, the final transfer of the data to the SPSS data file was made in
early March 04, to signal the completion of the collection of data at the end of February
04.
3.8 Data analysis plan The analysis followed the advice of Hair, Anderson et al. (1998: p25-27) who suggested
that six steps should be followed:
1. Define research problem and technique
2. Develop analysis plan
3. Evaluate assumptions
4. Estimate model
5. Interpret the variates
6. Validate the model

197
The research problem was derived from the literature and discussed in the literature
review in Chapter 2 and this Chapter has focused on the research techniques. Chapter 3
is structured around the next four steps. After testing the assumptions regarding normality
of the data and purifying the instruments, a number of models are estimated and the
results interpreted. In order to improve confidence in the results, focus groups and other
feedback mechanisms were used to seek feedback on the analysis. These activities build
the platform for a discussion on the results, which is the subject of Chapter 5.
Given that a dependence relationship with one dependent variable was examined and the
data was metric, multivariate regression was the appropriate analysis technique for
testing most of the hypotheses, with Structured Equation Modelling (SEM) required for
one hypothesis (Hair, Anderson et al. (1998: p20-21)). Returning to Chapter 2, where a
number of hypotheses were proposed, Table 3-19 provides a reminder of these
hypotheses and identifies the multivariate techniques that were used to test them. This
table identifies the configuration of the research model for each hypothesis, together with
the multivariate technique used to test the relationship. The table also contains a list of
the variates used in the specific regression equations.
The multivariate regression analysis called on the need to test the effect of moderating
variables and this was achieved in two ways. Where the moderating variable was a
metric variable, the product of the predictor variable and moderator variables was
included in the regression equation (Baron and Kenny (1986); Jepsen, Berthon et al.
(1996); Schwab (1999)). The moderator hypothesis is supported if the interaction is
statistically significant (Baron and Kenny (1986)). Where the moderator variables were
categorical, dummy variables were deployed, using indicating coding.
The quality of structured equation modelling has been criticized by researchers (Chin
(1998)). Such results should be reported in such a way that allows replication. Table
3-18 summarizes the main requirements and provides the necessary information, where
applicable.

198
Table 3-18: Requirements of SEM reporting
Requirement Comments
Population from which the sample was obtained See section 3.6.3.
Distribution of the data to determine adequacy of
the statistical estimation procedure
See section 4.1.
The conceptual model to determine the
appropriateness of the statistical models
analyzed
See Figure 4-7.
Statistical results to corroborate the subsequent
interpretation and conclusions
See Table 4-33 and Table 4-34.
Computer programme and version number Amos 5 version build 5138.
Computer Toshiba Portégé with Pentium III
processes running at 933MHz and
with 496MB of RAM.
Changes to default parameters None.
Correlation and standard deviations to third
significant digit
Not given due to space restrictions.
Adapted from Chin (1998)

199
3.9 Chapter summary This Chapter has focused on how the research approach was designed and executed.
Given the chosen philosophy of a positivist approach, a questionnaire for the postal
survey was designed and tested prior to its use to collect the data. The sample was
unique as it covered organizations of different sizes and from different industries. A key
feature of the research was that both public and private organizations were covered and
these operate to different business models. The instruments to collect the collect the
data for analysis had to be modified to accommodate this.
The data collection itself presented a number of challenges, such as the need to avoid
using a colour questionnaire and the customization of the questionnaire. The response
rate from one of the data sources was disappointing, but the overall results provided
enough data to conduct the analysis with some confidence. The cost of the questionnaire
was tracked and the estimated investment to collect the data was £3000. Had additional
steps been taken to improve the response rate, notably using a pre-survey teaser and
using stamps in place of a freepost service, the cost of these steps is estimated to have
been another £1000 and it is unlikely that this would have increased the response rate
significantly.
The next step after collecting the data was to analyze the data using the approach
outlined at the end of this Chapter. This forms the basis of the next Chapter.

200
Table 3-19: Multivariate techniques to test hypotheses
Hypotheses Variates Utilized Multivariate Technique
Independent Categoric Dependent
Hypothesis 1 Research Model
H1: There will be a positive relationship between the level of Leadership Excellence and Performance (Dean and Bowen (1994); Zairi (1995); Petrick, Scherer et al. (1999); Yusof and Aspinwall (1999); Zahra (1999); EFQM (1999a); Das, Handfield et al. (2000); Higgs and Rowland (2000); Pannirselvam and Ferguson (2001); Kanji and Sá (2001a))
Leadership Excellence
Performance Simple regression
H1a: The strength of the relationship will be similar with private sector organizations and public sector organizations (Redman, Mathews et al. (1995); EFQM (1999a); PriceWaterhouseCoopers (2000))
Leadership Excellence
Sector: Public and Private
Performance Multivariate regression
H1b: The strength of the relationship will be higher with whole organizations than Business Units (NIST (2002b))
Leadership Excellence
Whole Organization and Business Unit
Performance Simple & Multivariate regression
H1c: Size will have an impact on the strength of the relationship (Easton and Jarrell (1998); Terziovski and Samson (1999); Terziovski and Samson (2000); Hendricks and Singhal (2001a); Wiklund and Shepherd (2003))
Leadership Excellence
Size (LogP)/ (LogT)
Size Dummy Performance Multivariate regression
H1d: Leadership Excellence will have a positive relationship with all stakeholder performance results (Miles, Snow et al. (1978); Wright, Dunford et al. (2001); EFQM (2003))
Leadership Excellence
8 stakeholder groups
Simple regression
H1e: The strength of the relationship will be weaker in highly dynamic environments (Das, Handfield et al. (2000); Eisenhardt and Martin (2000); Fiol (2001); Leonard, McAdam et al. (2002); Dervitsiotis (2004); Jones (2004))
Leadership Excellence
Environment Dynamics
Environment Dummy
Performance Multivariate regression
Performance
Organizational Context
Leadership Excellence
Environment Dynamics

201
Hypotheses Variates Utilized Multivariate
Technique Independent Categoric Dependent
Hypothesis 2 Research Model
H2: There will be a positive relationship between Capability and Performance (Klein, Edge et al. (1991); Savolainen (1999); Zahra (1999); Rosenbloom (2000); Savolainen (2000a); Tena, Llusar et al. (2001); Douglas and Ryman (2003); Wiklund and Shepherd (2003))
Capability Performance Simple regression
H2a: The strength of the relationship will be weaker in highly dynamic environments (Barney and Zajac (1994); Henderson and Mitchell (1997); Das, Handfield et al. (2000); Eisenhardt and Martin (2000); Eisenhardt and Sull (2001); Fiol (2001))
Capability
Environment Dynamics
Environment Dummy
Multivariate regression
Hypothesis 3 Research Model
H3: There will be a positive relationship between Leadership Excellence and Capability (Teece, Pisano et al. (1997); Ireland and Hitt (1999); Petrick, Scherer et al. (1999); Zahra (1999); Prahalad (2000); Zott (2003))
Leadership Excellence
Capability Simple regression
Strategic Capability
Leadership Excellence
Performance Strategic Capability
Environment Dynamics

202
Hypotheses Variates Utilized Multivariate
Technique Independent Categoric Dependent
Hypothesis 4 Research Model
H4: Capability is developed over time (Dierickx and Cool (1989); Hendricks and Singhal (2000); Douglas and Judge (2001); Tena, Llusar et al. (2001); Hendricks and Singhal (2001a); Hendricks and Singhal (2001b); Przasnyski and Tai (2002); Sureshchandar, Rajendran et al. (2003); Warwood and Roberts (2004))
Replacement Periods
Log (Time)
Sources of organizational advantage
Performance Simple Regression
Descriptive Statistics
Hypothesis 5 Research Model
H5: Leadership Excellence has a positive relationship with capability, which leads to higher levels of performance (Tena, Llusar et al. (2001)
Leadership Excellence
Capability
Performance
SEM
Performance Leadership Excellence
Strategic Capability
Performance Replacement Period

203
4 Results and analysis The last Chapter described the approach followed to collect the data for the analysis.
This Chapter makes use of the advice of Hair, Anderson et al. (1998: p25-27) to analyze
the data collected using the steps also outlined in the previous Chapter (See Section 3.8).
First the data was examined to test the assumptions required so that it could be used in
multivariate analysis. The instruments were then purified checking for issues such as
reliability. Once the instruments had been confirmed, the data was subjected to a
number of statistical analyses to test the hypotheses and the results interpreted and
validated in preparation for the next Chapter, which discusses the results. Figure 4-1
displays schematically the steps taken in this Chapter.
Adapted from: Hair, Anderson et al. (1998)
Figure 4-1: Data analysis approach steps 3 to 6
4.1 Examining the data As pointed out by Hair, time spent in examining the data prior to the application of the
multivariate techniques is time well spent (Hair, Anderson et al. (1998)). This section
commences with a summary of the sample collected in terms of the different categories
as a basis of understanding the data better. Before examining areas such as the
normality of the data the subject of missing data is addressed to complete the basic data
manipulation.
Normality, skewness, kurtosis and the identification of case and variable outliers were
next addressed through graphical examination of the data and statistical tests. This was
followed by a number of tests of means to examine whether there is a statistically
significant difference between the responses from the various key groups: public vs.
private, level of leadership and whole organizations Vs business units. These latter tests
for statistically significant differences gave an insight for the analysis that was conducted.
Tests on normality, linearity and the homoscedasticity of the variates were conducted
once the instruments were purified.
4.1.1 Sample statistics Based on the literature several categories were selected for inclusion in the research.
Taking the total sample of 193 responses
Estimate Model
Examine Data
Purify Instruments
Interpret the Results
Validate the Model

204
Table 4-1 provides a breakdown of the sample by type of organization, leadership level of
respondent and whole organization Vs business unit.
Table 4-1: Breakdown of responses by category
Categories and Sub-categories Count
Public Vs Private Organizations
Public 101
Private 92
Leadership Levels
Most senior executive 59
Senor manager 101
Middle manager 25
Other 8
Whole Organizations Vs Business Units
Whole organizations 110
Business units 83
Data for the size of the organization in terms of number of people and turnover/ budget
were examined. The untransformed data showed high skewness and kurtosis (up to 100)
and so the data was transformed by taking the log (Hair, Anderson et al. (1998)). The
descriptive statistics for the transformed data is given in Table 4-2. Based on these
results, the log of the size as measured by both number of people (LogP) and turnover/
budget (LogT) were used in the model. Data transformation was also attempted by
taking the square root of the original data (Sharma (1996)), but this did not offer any
improvement over the original data.
Table 4-2: Descriptive statistics for log (P) and Log (T)
Variable Mean Skewness Kurtosis Potential
Outliers
Log P 2.93 -0.14 -0.23 60, 145
Log T 1.87 0.21 0.11 193

205
The response rate of public and private organizations was 12.7% and 6.5% respectively,
but due to the features of the sample, the actual number of responses was almost equal
(101 to 92, respectively). Figure 4-2 shows the response by industry type, raising some
concerns over response bias. This result is a consequence of the responses received to
the questionnaire from the various sources as dictated by the sampling frame
documented in Table 3-17.
Figure 4-2: Breakdown of respondents by industry type
Churchill defined non-response error as „a failure to obtain information from some
elements of the population that were selected and designated for the sample‟ (Churchill
and Iacobucci (2002: p528)). This study did not seek to obtain data from particular
industry types other than just the broad private and public sector classification, only the
responses had a distribution of different environmental conditions. The potential
limitation in the research due to the inequality shown here is noted, however. To test for
non-response bias a test of means was performed on both the main industry clusters and
the sources. The main area of concern was with the performance and leadership
instruments, a point that is taken up in the next section.
4.1.2 Testing the means A number of tests of means were calculated across the dataset to examine statistically
significant difference in response from different categories. This was conducted so that a
decision could be made on what sub-sets of data would be used in the analysis. The key
questions to be examined were:
0
10
20
30
40
50
60
70
Business Services
Central Governm
ent
Financial Services
Local Government
Manufacturing & Consum
er Goods
Other Sector
Police
Responses

206
Was there a difference between the responses of:
1. Public and private sector?
2. Whole organization and business units?
3. Leadership levels?
The first two were tested using an independent samples t-test and the latter using
ANOVA (George and Mallery (2003)). The conclusion was that there were some
statistically significant differences in the responses given on some items for both public/
private organizations and the whole organization/ business unit responses. No clear
patterns emerged and although examining the differences between public and private
organizations was outside the scope of the current study, it did raise a concern over
different factor structures for both these categories (Hair, Anderson et al. (1998)).
The test of means on the leadership levels confirmed that this category was showing
signs of bias on the response from the different leadership levels, as expected due to the
„key informant‟ problem (Downey and Slocum (1975); Bourgeois (1985); Dess, Lumpkin
et al. (1997); Kanji and Sá (2001a)). Although there were differences across a number of
items, the measurement of the Strategic Capability in Part 2 and Leadership Excellence
in Part 5 of the questionnaire were the two that were most effected. As a consequence,
consideration was given to given to removing both the „Middle Manager‟ and „Other‟
categories from the data analysis, but the main conclusion was that the test of means
was in need of re-visiting once the final variates had been identified.
4.1.3 Treatment of missing data Hair advised that missing data may only be replaced by imputations when the data is
missing completely at random (MCAR) (Hair, Anderson et al. (1998)). Calculation
revealed that 0.30% of the data was missing and inspection of the cases that had missing
interval variables identified case 6 as a potential for removal (16 missing variables),
followed by case 31 (10 missing) and 128 and 179 at 7 missing each. From a variable
perspective, item 4.37 had 7 missing responses, items 4.6, 1.36 and 4.38 had 6 missing
responses and item 4.15 had 5 missing responses. No cases or variables were removed
at this point.

207
Analysis of the data concluded that missing data was MCAR supporting the use of an
imputation method, which was mean substitution (Hair, Anderson et al. (1998)). It is
recognized that a Little‟s test could have been performance to support this conclusion.
4.1.4 Graphical examination of the data All the interval variables were examined to assess their degree of normality and to
identify potential outliers (cases and variables). Table 4-3 presents the range of
skewness and kurtosis statistics for all the interval data by questionnaire part. Taking the
guidelines given by Hair, that skewness should be within a range of plus/ minus 1 and
kurtosis plus/ minus 3 (Hair, Babin et al. (2003)), the only item that caused concern was
item 4.19. This did have a number of outliers identified, but was not the only one. In
total, 187 potential outliers were identified originating from 78 cases across the data set.
Case 51 was the most frequent cause of outliers and this contributed 9 outliers.
Table 4-3: Skewness and kurtosis statistics by part
Part Skewness Kurtosis
One - Environment -0.77 to 0.03 -1.07 to 0.18
Two - Capability -1.01 to – 0.14 -0.75 to 0.97
Four - Performance -0.35 to 1.55 -1.00 to 3.36
Result excluding item 4.19 -0.35 to 1.01 -1.00 to 1.00
Five - Leadership excellence -1.14 to –0.56 -0.69 to 1.12
An analysis of the outliers was also conducted from an item perspective, as it was
possible that the variable was an outlier as opposed to the specific cases. The nature of
the outliers in respect of the key categories was also examined to see if this was a cause.
A summary of the analysis is presented in Appendix 5: Analysis of outliers by item.
4.1.5 Summary of interval data examination The analysis of the missing data, descriptive statistics, outliers, and the data in Table 4-3
and Appendix 5: Analysis of outliers by item, enabled a number of conclusions to be
drawn:
Missing data was missing completely at random (MCAR) and so imputation
techniques may be applied (Hair, Anderson et al. (1998)).
The data exhibited a normal distribution, with the exception of item 4.19, which
was a Societal Performance item „Develops policies to reduce and prevent health

208
and safety risks‟. On reflection it was noted that this item had double-barreled
wording (Churchill and Iacobucci (2002)).
A number of potential outliers were identified (187 in total) which represented
0.50% of the observations collected.
Case 51 was identified as a potential for removal as this had contributed 9
outliers. This was followed by cases 151, 153, 171 that contributed 7 each.
There was evidence that some of the outliers on Part 5 Leadership may be
caused by the leadership level of the respondent. There was also a suggestion
that „Whole organization‟ responses were potentially leading to a number of
outliers.
There were a total of 11 potential outlier variables, with 1 in Part 1 Environment
and Part 2 Strategic Capability, 4 in Part 4 Performance and 5 in Part 5
Leadership.
At this stage, no data was removed from the data set, the conclusions being captured to
inform decisions later in the analysis.
4.2 Purify the instruments 4.2.1 Outline of approach taken A unique feature of the research was that the scales were modified to allow their use in
public sector organizations. However, all the original scales were derived from theory
and, in some cases, scales had been used by several previous researchers.
Purification was conducted using two methods. First, the inter-item correlations and
Cronbach‟s alpha on the scales as defined on the questionnaire were examined, seeking
any inter-item correlation below 0.3 (Hair, Anderson et al. (1998)) and to ensure that the
alphas were above the minimum acceptable level of 0.60 (Nunnally (1967)). Purification
consisted of removing any suspect items and re-calculating the alpha, being mindful that,
whereas reducing the number of items lowers reliability (Churchill and Peter (1984)), the
acceptable alpha is dependent on the number of items in the scale (Peterson (1994);
Foreman and Money (2004)).
The second method, Exploratory Factor Analysis (EFA) was used to examine the scales
on a scale-to-scale basis. As noted by Hair, factor analysis is an interdependence
technique, and one of the conditions of its use is that there are no independent/
independent relationships (Hair, Anderson et al. (1998)). For this reason, EFA was not

209
used as a technique to examine the underlying structure of all the items in the
questionnaire, although it did seek to confirm the structure of the individual instruments
as opposed be used to simplify the data. The factor analysis was conducted on the full
sample of 193 responses and vaximax rotation used. Hair suggested a factor loading of
0.40 for such a sample size (Hair, Anderson et al. (1998)) and this was used as a starting
point for the easy-read matrix. Factors were selected based on their Eigen values being
> 1.0, the percentage of variance being > 60% and the ability to assign logical names
(Hair, Babin et al. (2003)). Once the factors had been identified, correlation analysis was
used to examine the reliability of the purified scales.
The descriptive statistics of the resulting variates were also examined to ensure that the
basic assumptions of the use of the multi-variate techniques were not violated (Hair,
Anderson et al. (1998)).
Given the preceding analysis, a decision was made as to what variates should be used in
the analysis for each construct. On one hand, the EFA route had the potential to develop
variates that were a closer fit to the data collected, especially given the fact that the
sample included both public and private sector organizations. On the other hand,
Churchill noted that there is a good reason for keeping the original variables when they
were developed from the theory (Churchill (1979)). In the end, the selection of the
measures was based on a number of factors, including their reliability, their relevance
and the impact of increasing the number of variates as a ratio to the number of
observations, with one in five being the lower limit whereas fifteen to twenty per variate is
more acceptable (Hair, Babin et al. (2003)).
A final activity before moving onto the next stage of estimating the model was to perform
a cluster analysis, a technique also used my Agus and Sagir (2001) in his research to
classify the level of TQM adoption. The earlier test of means suggested some statistically
significant differences between results from the different categories. It was thought
prudent to check at this stage that the main categories were not falling into discriminate
groups (Hair, Anderson et al. (1998)).
4.2.2 Part 1- Environment Dynamics It was noted that there were no major problems with the data identified during the data
examination stage of this analysis for the Environment instrument, with just one outlier
being identified on item 1.3, case 95.

210
The work of Hart and Banbury noted that the original Dess and Beard scale had a 3-
factor solution of Complexity, Munificence and Turbulence, whereas their own studies
revealed a 4-factor solution which, regrettably, is not given (Hart and Banbury (1994)).
They reported alphas of between 0.63 and 0.67 for the three-factors, whereas in this
study, the factors varied from 0.23 to 0.73, there being a problem on the 2-item factors.
In using the scale Lindgren chose to combine the 12 factors into one scale, resulting in an
alpha of 0.764 before purification by removing one item (1.9: Actions by my firm heavily
affect our competitors), which led to a final alpha of 0.770 (Lindgren (2001)). In the
current study the alpha using all 12 items was 0.688. Three items had an inter-item
correlation below 0.3, one of which was the same as that removed by Lindgren. The
other two were item 1.6, „The business outlook for the next 12 months looks good/ The
public service outlook for the next 12 months looks good ‟, and item 1.10, „The
market will grow for several years/ Public sector spending will grow for several years‟.
Given the state of the public sector, where the government has an aggressive aim to
reduce public sector spending, it is not unsurprising that there were marked differences
between public and private perceptions. The alpha using the 9-item scale was 0.770,
and so this scale was selected as a solution.
The initial factor analysis on all items gave a measure of sampling adequacy (MSA) of
0.725 with no individual items having an MSA of below 0.5 (Hair, Anderson et al. (1998)).
Three different factor scenarios were considered, these being 3, 4 and 5-factors, and the
results compared to those of Hart and Banbury and Lindgren. Of the three solutions, the
3 and 4-factor solutions identified Munificence as a separate factor. Complexity and
Turbulence did not separate into discrete factors in any of the three solutions. The
percentage of variance explained was 52% in the 3-factor solution, 62% in the 4-factor
and 70% in the 5-factor, thereby rejecting the 3-factor solution. With both the 4-factor
and 5-factor solutions, a number of items loaded on two or more factors, most of the
alphas were below the threshold of 0.6 and no logical names could be given to the
factors. For these reasons all the factor solutions were rejected and a summated score
on the 9-items identified by looking at the correlations used in the analysis as the
Environment Dynamics variate. The descriptive statistics of the final scale are given in
Table 4-4.
Three outliers were identified, with case 30 being at the top end of the scale and cases
52 and 183 at the lower. The critical ratios were both within the + or –1.96 limit, indicating
normality (Sharma (1996)).

211
Table 4-4: Environment variate reliability and descriptive statistics
Items
1.1 Our customers‟ requirements are continually changing rapidly
1.2 The social values in society are continually changing rapidly
1.3 There are many unforeseen threats that we have to cope with
1.4 The performance of our organization is highly influenced by unpredictable public
politics
1.5 Our business environment is very complex with many unclear factors and relations
influencing our organization/ OOuurr ppuubblliicc sseerrvviiccee eennvviirroonnmmeenntt iiss vveerryy ccoommpplleexx wwiitthh
mmaannyy uunncclleeaarr ffaaccttoorrss aanndd rreellaattiioonnss iinnfflluueenncciinngg oouurr oorrggaanniizzaattiioonn
1.7 The business environment is continually changing rapidly/TThhee ppuubblliicc sseerrvviiccee
eennvviirroonnmmeenntt iiss ccoonnttiinnuuaallllyy cchhaannggiinngg
1.8 It is very difficult to anticipate change in the business environment/IItt iiss vveerryy ddiiffffiiccuulltt ttoo
aannttiicciippaattee cchhaannggee iinn tthhee ppuubblliicc sseerrvviiccee eennvviirroonnmmeenntt
1.11 New competition is unpredictable/DDeemmaanndd ffoorr oouurr rreessoouurrcceess iiss uunnpprreeddiiccttaabbllee
1.12 The innovation rate in the market is high/TThhee nnuummbbeerr ooff ppoolliicciieess aanndd nneeww iinniittiiaattiivveess iiss
hhiigghh
Alpha Mean SD Skewness
(CR)
Kurtosis
(CR)
0.770 4.634 0.852 -0.217
(-1.24)
0.149
(0.43)
4.2.3 Part 2 – Strategic Capability During the examination of the data it was noted that there was a problem with item 2.3,
where 19 outliers were identified. The inspection of the correlations, however, showed
that the two components, Robustness and Response Capability, had alphas of 0.911 and
0.907 and no items had an inter-item correlation of below 0.3.
On running the EFA, the MSA was 0.912 with no individual item having an MSA below
0.5. A 4-factor solution was extracted, all of which had an Eigen value above 1, and the
percentage of variance explained was 63%. The factors, together with their
corresponding item loadings, are given in Table 4-5.

212
Table 4-5: Strategic Capability factors from EFA
Factor Components and Loading
Response Capability
2.21 Conceptualize a response and make decisions and plans to meet opportunities
.819
2.22 Reconfigure resources and implement necessary changes to meet opportunities
.799
2.19 Reconfigure resources and implement necessary changes to meet threats
.772
2.18 Conceptualize a response and make decisions and plans to meet threats
.749
2.20 Sense new business or technological opportunities
.664
2.17 Sense potential threats (legislative, political, technological, competitive, customer demands etc)
.564
2.1 Leadership approach .509
Strategy Robustness
2.3 Business concept .780
2.4 Long-term goals .706
2.5 Market strategy .637
2.6 Service/ product portfolio .627
Organizational Robustness
2.11 Financial strategy .828
2.12 Financial viability .740
2.8 Human resource strategy .556
Knowledge Robustness
2.14 Information management and knowledge strategy
.771
2.15 Sustainability (corporate & social responsibility) strategy
.626
2.9 Competency (skills) base
.549
Extraction Method: Principal Component Analysis. Rotation Method: Varimax with Kaiser Normalization. a Rotation converged in 7 iterations.
Table 4-6 summarizes the descriptive statistics for the variates. As can be seen there
were some problems identified with normality in that the critical ratio indicated high
skewness in three out of the four variates. One potential outlier, case 51, was identified
on the Response Capability variate and two cases, 55 and 144, on the Organizational
Robustness variate.

213
Table 4-6: Strategic Capability factors reliability and descriptive statistics
Factor Alpha Mean SD Skewness
(CR)
Kurtosis
(CR)
Response Capability 0.912 4.723 1.043 -0.782
(-4.47)
0.170
(0.49)
Strategy Robustness 0.811 4.991 1.028 -0.609
(-3.48)
0.198
(0.57)
Organizational Robustness
0.749 4.696 1.202 -0.451
(-2.56)
-0.082
(-0.24)
Knowledge Robustness 0.671 4.496 1.004 -0.139
(-0.79)
-0.411
(1.18)
A secondary factor analysis was conducted to see if the scale could be further simplified
and all the factors loaded onto a single factor explaining 68.7% of the variance. A
summated single variate „Strategic Capability‟ was therefore computed. This variate had
a mean of 4.723, SD of 0.887, skewness of –0.509 and kurtosis of 0.18, with critical ratios
being -2.91 and 0.53, respectively. A number of potential outliers were identified, these
being cases 51, 144 and 171. Removing these outliers led to revised critical ratios of –
1.27 and –1.96 indicating normality, which was confirmed by an non-significant
Kolmogorov-Smirnov test (Sharma (1996); Hair, Anderson et al. (1998)). The Cronbach‟s
alpha for the scale with all the data was 0.846.
4.2.4 Part 4 – Performance Examining the Performance items showed that there was a non-normality problem with
item 4.19. In addition, four of the items, 4.1, 4.4, 4.7 and 4.19 had a number of outliers.
Calculating the inter-item correlations determined that no correlations were below 0.3,
and Table 4-7 lists the Cronbach Alpha‟s for each of the stakeholder groups.

214
Table 4-7: Reliability statistics for the stakeholder groups
Stakeholder Group Number of Items Cronbach Alpha
Customer satisfaction 7 0.802
Employee satisfaction/ motivation 11 0.910
Social responsibility 8 0.878
Key outcomes 11 0.891
An EFA was run for the complete performance set giving an overall MSA of 0.888 and all
the individual items had an MSA above 0.5. Potential of 8 and 9-factor solutions were
identified. The 9-factor solution varied from the 8-factor by separating the items related to
recruitment, but this did lead to one item loading on the two separated factors. The 8-
factor solution was therefore selected and Table 4-8 lists the factors and their
corresponding item loadings and Table 4-9 the reliability and descriptive statistics.

215
Table 4-8: Performance factors from EFA
Factor Components and Loading
Employee Results
4.14 Has improving levels of employee satisfaction over time .806
4.13 Has high employee satisfaction .792
4.11 Develops its staff at all levels of seniority .697
4.10 Has the ability to retain outstanding staff .643
4.12 Collects relevant information from employees to measure their satisfaction .633
4.18 Ensures individuals know how to contribute to the success of the organization .582
4.17 Has a well-defined people management plan linked to the overall business plan .534
4.19 Has recruited outstanding staff .521
4.8 Has undertaken recruitment and admission of employees effectively .509
Employee Absence
4.16 Has low employee turnover compared to the industry standard/ compared to the public service norms
.785
4.15 Has low absenteeism compared to the industry standard/ compared to the public sector norms
.752
Key Outcomes 4.34 Has a positive cash flow/ balanced budget .777
4.29 Has a strong financial performance .729
4.33 Has high profitability/ provides value for money .722
4.30 Achieves it goals .683
4.39 Has a good overall organizational performance .673
4.31 Has achieved the desired service and/ or product outcomes .605
4.32 Has a high competitive position/ performance rating .592
4.1 Has a high customer demand/ Has a high demand for its services .470
New Products and Services
4.37 Will introduce new products and services .827
4.36 Will change its existing products and services .822
4.38 Will have an active services and/ or product development programme .714
4.35 Will seek to diversify in the marketplace/ sub-contract additional services .639

216
Factor Components and Loading
Customer Results
4.2 Is concerned about collecting information from its customers in order to measure their satisfaction
.679
4.4 Has implemented a process to listen to and solve customer complaints .678
4.3 Has customers whose satisfaction that has improved over time .580
4.7 Has a high standard of quality in service and/ or products .505
Sustainability 4.20 Develops policies to protect the environment .863
4.23 Is environmentally responsible .819
4.25 Follows sustainability policies .702
4.19 Develops policies to reduce and prevent health and safety risks .684
Community 4.21 Is actively involved in the local community .804
4.22 Is well respected by the local community .738
4.24 Develops the local economy .561
Growth 4.6 Has an increasing market share/ Has an increasing share of budget .898
4.5 Has a positive sales growth /Has increased funding .881 Extraction Method: Principal Component Analysis. Rotation Method: Varimax with Kaiser Normalization. a Rotation converged in 8 iterations.

217
Table 4-9: Performance reliability and descriptive statistics
Factor Alpha Mean SD Skewness
(CR)
Kurtosis
(CR)
Employee Results 0.910 4.654 1.140 -0.410
(-2.34)
-0.277
(-0.80)
Employee Absence 0.729 4.809 1.417 -0.571
(-3.26)
-0.031
(-0.09)
Key Outcomes 0.899 5.139 1.030 -0.739
(-4.22)
0.548
(1.57)
New Products and Services
0.837 4.641 1.205 -0.524
(-2.99)
0.227
(0.65)
Customer Results 0.816 5.193 1.103 -0.785
(-4.49)
0.685
(1.97)
Sustainability 0.880 5.165 1.237 -0.938
(-5.36)
0.868
(2.49)
Community 0.823 4.794 1.492 -1.026
(-5.86)
0.492
(1.41)
Growth 0.912 4.220 1.634 -0.200
(-1.14)
-0.756
(-2.17)
From the critical ratios in Table 4-9 it can be seen that there is a potential problem with
skewness on all the variates and with kurtosis on a number. A number of potential
outliers were also identified, with Case 51 being an outlier on Employee Results, Key
Outcomes and Customer Results. It was also a potential outlier on New Products and
Services along with cases 53 and 129, and Sustainability with Cases 16, 123, 153 and
171.
Due to the number of factors, a secondary factor analysis was conducted. Using all the
factors 2 and 3-factor solutions were examined, with the 3-factor solution giving a clear
sustainability factor and two results factors with separate factors cross loading.

218
Table 4-10 gives the factor loadings of the three components and Table 4-11 provides the
descriptive statistics.
Table 4-10: Performance factors from secondary EFA
Factor Components and Loading
CSR (Corporate & Social Responsibility)
Community .877
Sustainability .863
Employee Outcomes Employee Absence .885
Employee Results .633
Organization Outcomes New Products and Services .767
Key Outcomes .668
Growth .617
Customer Results .574
Extraction Method: Principal Component Analysis. Rotation Method: Varimax with Kaiser Normalization. a Rotation converged in 5 iterations.
Table 4-11: Secondary performance factors reliability and descriptive statistics
Factor Alpha Mean SD Skewness
(CR)
Kurtosis
(CR)
Potential
Outliers
CSR 0.773 4.980 1.237 -1.044
(-5.97)
0.968
(2.78)
16, 51, 123, 153,
171
Employee Outcomes
0.694 4.731 1.125 -0.416
(-2.38)
0.029
(0.08)
51
Organization Outcomes
0.677 4.798 0.901 -0.613
(-3.50)
0.946
(2.72)
51, 106, 153
A final activity was to see if the three secondary factors loaded onto a single Performance
factor. This was found to be the case with the combined factors explaining 63% of the
variance. This variate had a mean of 4.836 and a SD of 0.864. Skewness was –0.791
and kurtosis 1.695, with critical ratios of –4.52 and 4.87, respectively. Cases 51, 153 and
171 were noted as potential outliers and removing these outliners resulted in an non-
significant Kolmogorov-Smirnov test (Sharma (1996); Hair, Anderson et al. (1998)).

219
4.2.5 Part 5 – Leadership excellence The final construct is Leadership Excellence and this is the construct where most
problems were expected. Examination of the data indicated that there were statistically
significant differences in the responses of leaders at different levels, and a total of 5 of
the 26 items were potential outlier variables. These were:
„5.7 Leaders identify the organization‟s purpose‟
„5.10 Leaders develop policies and strategies consistent with the
organization‟s mission, vision and values‟
„5.11 Leaders anticipate change‟
„5.15 Leaders monitor resources and use feedback to review strategies for
customer satisfaction‟
„5.20 Leaders are accessible‟
The scale for Leadership Excellence was based on the work of Kanji (Kanji and Sá
(2001a)) and it must be remembered that the model contained six constructs. Data was
collected for all six constructs in this study although only one related to the measure of
Leadership Excellence, which was the prime focus of this study. Despite this, the
purification of the instrument looked at all six areas. Examination of the reliability showed
that no item had an inter-item correlation of below 0.3 and the alphas, compared to those
reported elsewhere, are given in Table 4-12.
Table 4-12: Reliability statistics for Kanji’s leadership instrument
Construct Reported Alphas
(Kanji and Sá (2001a))
Cronbach Alpha
This Study
Organizational Values 0.844 0.923
Vision 0.736 0.930
Mission 0.790 0.912
Strategy 0.906 0.921
Key Issues 0.927 0.922
Leadership Excellence 0.978 0.946
The EFA returned an MSA of 0.946 and no individual item was lower than 0.5. The initial
factor solution identified 3-factors accounting for a total of 73.4% of variance. In this
solution, Leadership Excellence and Key Issues were clearly identified as two factors,

220
and the remaining items clustered into the third factor. A 6-factor solution was then run
and this accounted for 82.5% of variance. This gave a clear Leadership Excellence
factor, a Mission/ Vision factor, a Key Issues factor, an Organizational Values Factor, a
Strategy factor a mixed Key Issues/ Strategy factor. It was therefore decided to use the
Leadership Excellence factor as a single summated score.
Examining the descriptive statistics of the summated factor gave a mean of 4.974, a
standard deviation of 1.197, skewness of –0.640 and kurtosis of –0.125, with critical
ratios of –3.66 and – 0.36, respectively. One outlier, case 51, was identified as a
potential problem. Removing this outlier resulted in a statistically significant Kolmogorov-
Smirnov test, suggesting that there was still a potential problem with normality (Sharma
(1996); Hair, Anderson et al. (1998)).
4.2.6 Multicollinearity To check for multicollinearity a correlation matrix of the independent variates was
conducted (Table 4-13). This analysis indicated that there was a statistically significant
correlation between Leadership Excellence and Strategic Capability, indicating that
multicollinearity between these two variates was a potential problem.
Table 4-13: Correlation matrix of the independent variates
Environment
Dynamics
Leadership
Excellence
Strategic
Capability
Environment Dynamics 1
Leadership Excellence 0.030 1
Strategic Capability -0.002 0.563 (**) 1
** Correlation is significant at the 0.001 level (2-tailed).
4.2.7 Cluster analysis Before moving on to test the hypotheses, it felt prudent to use cluster analysis to
establish whether the data fell into discrete groups for public and private, whole business
and business unit and level of leadership natural groups. Agus and Sagir (2001) took a
similar approach in his work. The cluster analysis was run using all the independent
variates against the three categories, and the count of the numbers in each of two or four
clusters is given in Appendix 6: Cluster analysis of variates by category. The cluster
analysis made use of Ward‟s method. The conclusion from the analysis was that no
category of responses was falling into a specific group and, as a consequence, the data
could be treated as a homogenous group.

221
4.2.8 Test of means on final variates As a final check a series of test of means was conducted to examine the effect of the
different categories for the final variates. Table 4-14 summarizes the means and
standard deviations for public vs. private sector and whole organization vs. business unit
samples, with Table 4-15 giving the independent sample results for the Private Vs Public
sector and Table 4-16 for Whole Organization Vs Business Unit. The conclusion from
these results is that there is a statistically significant difference between the Performance
means of the public and private sector samples, suggesting that Private sector
organizations were achieving a higher level of performance than public sector
organizations using the instrument developed.
Table 4-14: Test of means on final variables – Sector and Organization
Category N Environment
Dynamics
Strategic
Capability
Leadership
Excellence
Performance
Mean SD Mean SD Mean SD Mean SD
Private Vs Public Sector
Private 92 4.443 .833 4.929 .932 5.018 1.154
4.937
* .978
Public 10
1 4.808 .834 4.541 .805 4.882 1.236
4.744
* .737
Whole Organization Vs Business Unit
Whole
Organization
11
0 4.737 .825 4.631 .876 4.788 1.220 4.742 .914
Business Unit 83 4.498 .872 4.854 .891 5.158 1.138 4.961 .779
* p<0.05, ** p<0.001. t-test: Levene‟s test of equality of means

222
Table 4-15: Independent samples test Private Vs Public sector
Variate Condition Levene's Test for
Equality of
Variances
t-test for Equality of Means
t df Sig. (2-tailed)
Mean Difference
Std. Error Difference
95% Confidence Interval of the
Difference
F Sig. Lower Upper
Environment
Dynamics
Equal variances assumed
.042 .838 -3.037 191 .003 -.365 .120 -.602 -.128
Equal variances not assumed
-3.037 189.402 .003 -.365 .120 -.602 -.128
Strategic
Capability
Equal variances assumed
1.577 .211 3.105 191 .002 .388 .125 .142 .635
Equal variances not assumed
3.084 180.742 .002 .388 .126 .140 .637
Leadership
Excellence
Equal variances assumed
1.295 .257 .788 191 .432 .136 .173 -.204 .477
Equal variances not assumed
.791 190.878 .430 .136 .172 -.203 .475
Performance Equal variances assumed
6.654 .011 1.564 191 .119 .194 .124 -.051 .438
Equal variances not assumed
1.544 168.405 .124 .194 .126 -.054 .442

223
Table 4-16: Independent samples test Whole Organization Vs Business Unit
Variate Condition Levene's Test for
Equality of
Variances
t-test for Equality of Means
t df Sig. (2-tailed)
Mean Difference
Std. Error Difference
95% Confidence Interval of the
Difference
F Sig. Lower Upper
Environment
Dynamics
Equal variances assumed
.528 .468 1.943 191 .053 .239 .123 -.004 .481
Equal variances not assumed
1.928 171.371 .055 .239 .124 -.006 .483
Strategic
Capability
Equal variances assumed
.427 .514 -1.736 191 .084 -.223 .128 -.476 .030
Equal variances not assumed
-1.732 175.181 .085 -.223 .129 -.476 .031
Leadership
Excellence
Equal variances assumed
.935 .335 -2.147 191 .033 -.370 .172 -.710 -.030
Equal variances not assumed
-2.168 182.584 .031 -.370 .171 -.707 -.033
Performance Equal variances assumed
.483 .488 -1.751 191 .081 -.219 .125 -.465 .028
Equal variances not assumed
-1.791 188.151 .075 -.219 .122 -.456 .022

224
Table 4-17 summarizes the means given by the various levels of leadership for each of
the four constructs.
Table 4-17: Test of means on final variables – Leadership level
Category N Environment
Dynamics
Strategic
Capability
Leadership
Excellence
Performance
Mean SD Mean SD Mean SD Mean SD
Most senior
executive 59 4.694 .833 4.871 .760 5.525 .979 5.013 .751
Senior
manager
10
1 4.531 .857 4.801 .916 4.860 1.141 4.837 .922
Middle
manager 25 4.686 .745 4.385 .764 4.269 1.193 4.595 .710
Other 8 5.328 1.006 3.780 1.056 3.911 1.437 4.286 1.041
Total 19
3 4.634 .852 4.727 .887 4.947 1.197 4.836 .864
Examining the breakdown of the Post Hoc ANOVA results showed that there were
differences at all levels and that these differences varied depending on the variable.
Table 4-18 summarizes the ANOVA analysis and Table 4-19 the post-hoc difference in
means analysis. LSD was used as a technique as it is the most conservative.

225
Table 4-18: ANOVA results for final variates - Leadership levels
Variate Condition Sum of Squares df
Mean Square F Sig.
Environment
Between
Groups 5.200 3 1.733 2.444 .065
Within Groups 134.057 189 .709
Total 139.257 192
Capability
Between
Groups 11.904 3 3.968 5.391 .001
Within Groups 139.114 189 .736
Total 151.017 192
Leadership Excellence
Between
Groups 40.603 3 13.534 10.917 .000
Within Groups 234.313 189 1.240
Total 274.916 192
Performance
Between
Groups 5.712 3 1.904 2.618 .052
Within Groups 137.449 189 .727
Total 143.160 192
One must be mindful of the low sample sizes at the Middle Manager and Other Manager
leadership levels when examining the results. One conclusion is that the level of
respondent was a limitation in the research with particular reference to the difference
between the Most Senior and Senior Manager level on the Leadership Excellence
responses. Secondly, when computing the regression results the calculations were
repeated with samples taken at the different levels to ensure that these differences were
not having a major impact on the results. It might be that a different effect would be
observed if the lower two leadership levels were omitted from the analysis.

226
Table 4-19: Post hoc ANOVA results on leadership levels (Multiple comparisons)
Variate
(I) Level of
respondent (J) Level of respondent
Mean
Difference (I-J) Std. Error Sig.
95% Confidence Interval
Lower Bound Upper Bound
Environment Most senior
executive
Senior manager .163 .138 .240 -.110 .435
Middle manager .008 .2010 .968 -.389 .405
Other -.634(*) .317 .047 -1.260 -.008
Senior manager Most senior executive -.163 .138 .240 -.435 .110
Middle manager -.155 .188 .412 -.526 .216
Other -.797(*) .309 .011 -1.407 -.187
Middle manager Most senior executive -.008 .201 .968 -.405 .388
Senior manager .155 .188 .412 -.216 .526
Other -.642 .342 .062 -1.317 .033
Other Most senior executive .634(*) .317 .047 .008 1.260
Senior manager .797(*) .309 .011 .187 1.407
Middle manager .642 .342 .062 -.033 1.317

227
Variate
(I) Level of
respondent (J) Level of respondent
Mean
Difference (I-J) Std. Error Sig.
95% Confidence Interval
Lower Bound Upper Bound
Capability Most senior
executive
Senior manager .070 .141 .621 -.208 .347
Middle manager .487(*) .205 .018 .083 .891
Other 1.092(*) .323 .001 .454 1.730
Senior manager Most senior executive -.070 .141 .621 -.347 .208
Middle manager .417(*) .192 .031 .039 .795
Other 1.022(*) .315 .001 .401 1.644
Middle manager Most senior executive -.487(*) .205 .018 -.891 -.0823
Senior manager -.417(*) .192 .031 -.795 -.039
Other .605 .349 .084 -.082 1.293
Other Most senior executive -1.092(*) .323 .001 -1.730 -.454
Senior manager -1.022(*) .315 .001 -1.644 -.401
Middle manager -.605 .349 .084 -1.293 .082

228
Variate
(I) Level of
respondent (J) Level of respondent
Mean
Difference (I-J) Std. Error Sig.
95% Confidence Interval
Lower Bound Upper Bound
Leadership
Excellence
Most senior
executive
Senior manager .665(*) .182 .000 .306 1.025
Middle manager 1.257(*) .266 .000 .733 1.781
Other 1.614(*) .420 .000 .787 2.442
Senior manager Most senior executive -.665(*) .182 .000 -1.025 -.306
Middle manager .591(*) .249 .018 .101 1.08
Other .949(*) .409 .021 .143 1.76
Middle manager Most senior executive -1.257(*) .266 .000 -1.781 -.733
Senior manager -.591(*) .249 .018 -1.082 -.101
Other .358 .452 .430 -.534 1.250
Other Most senior executive -1.614(*) .420 .000 -2.442 -.787
Senior manager -.949(*) .409 .021 -1.756 -.143
Middle manager -.358 .452 .430 -1.250 .534

229
Variate
(I) Level of
respondent (J) Level of respondent
Mean
Difference (I-J) Std. Error Sig.
95% Confidence Interval
Lower Bound Upper Bound
Performance Most senior
executive
Senior manager .176 .140 .210 -.100 .452
Middle manager .417(*) .204 .042 .016 .819
Other .727(*) .321 .025 .093 1.361
Senior manager Most senior executive -.176 .140 .210 -.452 .100
Middle manager .242 .191 .206 -.134 .617
Other .551 .313 .080 -.067 1.169
Middle manager Most senior executive -.418(*) .204 .042 -.819 -.016
Senior manager -.242 .191 .206 -.617 .134
Other .309 .346 .373 -.374 .992
Other Most senior executive -.727(*) .321 .025 -1.361 -.093
Senior manager -.551 .313 .080 -1.169 .067
Middle manager -.309 .346 .373 -.993 .374
LSD * The mean difference is significant at the .05 level.

230
4.2.9 Summary In bringing this section to a conclusion a number of observations are made. These are:
A total of 6 variates have been identified: Environment Dynamics, Strategic
Capability, Leadership Excellence, Organizational Outcomes, Employee
Outcomes and Corporate & Social Responsibility (CSR), the first three being
independent variables and the latter three, dependent variables. Simple
descriptive statistics (Sharma (1996); Hair, Anderson et al. (1998)) indicate that
the data approached normality in all cases and all Cronbach alphas were above
the 0.60 threshold. The items used in the factor analysis all had an MSA above
the 0.5 threshold.
o The Environment Dynamics variate is composed of a 9-item summated
scale. Three cases were identified as potential outliers, these being
cases 30, 52 and 183.
o The Strategic Capability variate was developed as a summated score
from four primary factors, these being Response Capability, Strategy
Robustness, Organizational Robustness and Knowledge Robustness.
Three potential outliers were identified, these being cases 51, 144 and
171.
o A factor analysis confirmed the Leadership Excellence variate, which was
based on the work of Kanji (Kanji and Sá (2001a); Kanji (2002)). One
potential outlier, case 51, was identified.
o Three-second order Performance dependent variates were developed,
Organizational Outcomes, Employee Outcomes and CSR using a
secondary factor analysis of eight primary factors. Several potential
outliers were identified for Organizational Outcomes cases (51, 106 and
153), Employee Outcomes (case 51) and CSR (16, 51, 123, 153 and
171). The 3-second order factors also loaded onto a single factor,
Performance. Cases 51, 153 and 171 were identified as potential
outliers on this variate.
Three other variates were identified in an earlier section of the Chapter, these
being two for organization Size (LogP and LogT) and one for the Replacement
Period (LogTime).
Three categoric variables were also defined. These are private and public sector,
whole organization vs. business unit and the level of respondent.
A correlation analysis identified a high level of multicollinearity between two of the
independent variates, Leadership Excellence and Strategic Capability

231
A cluster analysis supported the assumption that the data formed a homogenous
group. Testing means on the final variates by categoric variable suggested that
the level of leadership might have an impact on the analysis.
4.3 Estimate the models and interpret the results Although shown as two separate steps in Figure 4-1, the estimation of the models
following the guidelines given in Table 3-19 and the interpretation of the output is
discussed here under one section for convenience. The emphasis in this section is one
of statistical significance, practical significance being the main focus of the next Chapter.
The last section concluded with a number of observations relating to the set of variates
that have been developed for use in the analysis. Due to the number of outliers, and the
fact that the test of means showed that the level of leadership could be having an impact,
all the models were run first with all data, then with the outliers removed, then with just
the top two leadership levels and then, finally, with both the outliers removed and only
using the top two leadership levels. In some instances the sample was also split into
private and public sector responses.
4.3.1 Leadership Excellence and Performance One of the key questions investigated by this research was whether Business Excellence,
as measured through the Leadership Excellence construct, was correlated to higher
levels of performance. A number of simple regression equations were run in order to
establish whether such relationships could be determined. Each hypothesis will be
examined in turn based on the defined research model:
4.3.1.1 H1: There will be a positive relationship between the level of Leadership Excellence and Performance
For this hypotheses simple regression equations were run with Leadership Excellence as
the independent variable and Performance as the dependent variable. Table 4-20
provides the results of the regression. Plots of the residual errors against the predicted
errors showed a random scatter plot and approaching normal distribution in all cases
supporting the linearity of the data.
Performance
Organizational Context
Leadership Excellence
Environment Dynamics

232
Table 4-20: Regression of Leadership Excellence and Performance
Data Set R2 Sig F B Stand
Beta
Sig t
All data 0.319 0.000 0.408 0.565 0.000
Less outliers 0.251 0.000 0.331 0.501 0.000
Top leaders 0.295 0.000 0.416 0.543 0.000
Top leaders less outliers 0.232 0.000 0.340 0.482 0.000
The results show support for the hypothesis that Business Excellence, as measured
through Leadership Excellence, has a positive relationship with the Performance. The
conclusion was not effected by the removal of the outliers or by only taking the top
leaders‟ responses.
As an additional test the Comprehensive Performance Ratings (CPA) for some public
sector respondents were obtained from the Audit Commission (site:www.audit-
commission.gov.uk/cpa/index). The ratings for 45 respondents on a Poor, Weak, Fair,
Good and Excellent rating system were treated as the dependent variable with
Leadership Excellence being the independent variable. The model had a poor fit (R2 =
0.1 and non- significant) and Leadership Excellence was non-significant. This result was
not considered to be important, as the CPA ratings were only available for the
organization as a whole and not at a Business / Service Unit level. For example, the
closest to a police rating was the rating for the respective local council.
4.3.1.2 H1a: The strength of the relationship will be similar with private sector organizations and public sector organizations
Simple regressions were run with a split sample to examine whether there was a
difference between the strength of the relationship between Leadership Excellence and
Performance for public sector and private sector organizations. The results are given in
Table 4-21. Plots of the residual errors against the predicted errors showed a random
scatter plot and approaching normal distribution in all cases supporting the linearity of the
data.

233
Table 4-21: Difference between the results for public and private organizations
Data Set Public Sector Private Sector
R2 Sig F B Stand
Beta
Sig t R2 Sig F B Stand
Beta
Sig t
All data 0.403 0.000 0.378 0.635 0.000 0.266 0.000 0.437 0.516 0.000
Less outliers
0.329 0.000 0.312 0.574 0.000 0.196 0.000 0.340 0.443 0.000
Top leaders
0.398 0.000 0.384 0.631 0.000 0.230 0.000 0.452 0.480 0.000
Top leaders less outliers
0.311 0.000 0.308 0.566 0.000 0.181 0.000 0.369 0.425 0.000
The standardized betas indicate that the strength of the relationship between Leadership
Excellence and Performance is higher for public sector organizations than for private
sector organizations. Removing the outliers and/ or only taking the top-level managers
did not have a major impact on the results. It was noted that the coefficient of
determination was higher for public sector sample than for the private sector sample,
reflecting a weaker fit of the model in the latter case. This was confirmed by examination
of the standard deviations, which feature in the calculation of R2 and of the standardized
betas. Like the other scales used Leadership Excellence is a consistent scale across
both samples and so the lower standardized betas in the private sector case may be a
consequence of limitations in the data as opposed to being a signal of a weaker
relationship.
Due to the concern with the data, a second regression was run including the private/
public category as a dummy variable. This resulted in an R2 of 0.326 and standardized
beta of 0.560 for Leadership Excellence. Crucially, the dummy variable for the sector
was non- significant, indicating that the results from the two sectors were not statistically
significantly different. On this evidence the hypothesis was accepted
4.3.1.3 H1b: The strength of the relationship will be higher with whole organizations than business units
To test this hypothesis a simple regression was run on the complete data sample with the
Whole Organization/ Business Unit included as a dummy variable. The model had an R2
of 0.321, was significant to 0.000 and the residuals approached normality. The results
are given in Table 4-22, from which it was concluded that Whole Organization/ Business

234
Unit category did not have an impact on the Leadership Excellence and Performance
relationship. The hypothesis was therefore rejected.
Table 4-22: Effect of whole business vs. business unit on the Leadership Excellence and Performance relationship
Model Unstandardized
Coefficients
Standardized
Coefficients t Sig.
Collinearity
Statistics
B Std. Error Beta Tolerance VIF
1 (Constant) 2.811 .220 12.783 .000
Leadership
Excellence .403 .044 .559 9.237 .000 .976 1.024
Whole or
Business
Unit
.069 .105 .040 .660 .510 .976 1.024
a Dependent Variable: Performance
4.3.1.4 H1c: Size will have an impact on the strength of the relationship To test this hypothesis two regressions were run on the complete data sample with
organization size as measured by the log (number of people) and log (turnover/ budget).
The results are given in Table 4-23 and the residuals approached normality.
Table 4-23: Effect of organization size on the Leadership Excellence and Performance relationship
The results show that organization size, when measured both as a function of number of
people and turnover/ budget, does have a statistically significant positive effect on the
relationship between Leadership Excellence and Performance. When running the
regression with the interaction variable (product of Leadership Excellence and the log of
the size variable (LogP or LogT)), neither the size variable nor the interaction variables
were statistically significant. This indicates that size was not operating as a moderating
variable.
A common cut-off point for SMEs as used by other researchers was 500 persons
(Warwood and Roberts (2004)), although a cut off of 250 has also been used (Wiklund
Size Variate R2 Sig F B Stand
Beta
Sig t
Log (P) 0.356 0.000 0.180 0.205 0.001
Log (T) 0.368 0.000 0.199 0.230 0.000

235
and Shepherd (2003)). The analysis was repeated using a dummy variable for size
where organizations with less than 500 people were coded 0 and above 500 1. This
resulted in the t-test for the dummy variable for size to be non-significant (Sig. 0.274).
The calculation was repeated with a cut-off of 250 employees, but again the dummy
variable for size was non-significant (Sig. 0.193). The conclusion was therefore that size
does make a difference and that larger organizations display a more positive relationship
between Leadership Excellence and Performance than smaller organizations. The
hypothesis was therefore accepted. It was not possible to account for the effect by
classifying the organizations into large organizations and SMEs.
4.3.1.5 H1d: Leadership Excellence will have a positive relationship with all stakeholder performance results
The next hypothesis considered one of the fundamental concepts of the EFQM
Excellence Model®. This was that Business Excellence organizations have a positive
impact on all the stakeholder groups, these being the customers, employees, society and
the organization itself. To test for these relationships separate regressions were first run
on the full data sample using Leadership Excellence as the independent variable and the
different Performance variates as the dependent variable where appropriate. Table 4-24
summarizes the results, which are presented in descending standardized beta order. In
all cases the residuals approached normality.
Table 4-24: Relationship between Leadership Excellence and different stakeholder Performance measures
Stakeholder Dependent Variable R2 Sig F B Stand
Beta
Sig t
Employees Employee Outcomes 0.332 0.000 0.542 0.576 0.000
Organization Key Outcomes 0.246 0.000 0.427 0.496 0.000
Customer Customer Results 0.193 0.000 0.405 0.440 0.000
Organization New Products/ Services 0.126 0.000 0.357 0.355 0.000
Society CSR 0.097 0.000 0.322 0.312 0.000
Organization Growth 0.032 0.000 0.246 0.180 0.000
The results show that Leadership Excellence does have a positive impact on Employee
Outcomes, Key Outcomes and Customer Results, which are the three main stakeholder
groups. The three remaining areas had a poor fit with the regression equation and to test
the possibility that this was due to the difference between the public and private sector
organizations the regressions were recalculated using a split file (Tanner (2004a)). This

236
did not have a major effect on the results. The conclusion was drawn that there was
support for the hypothesis in the case of the Employee, Organization and Customer
stakeholders, but not for the Society stakeholders.
4.3.1.6 H1e: The strength of the relationship will be weaker in highly dynamic environments
One of the hypotheses tested under the Strategic Capability set of hypotheses related to
whether the dynamics of the industry had a statistically significant negative effect on its
relationship with Performance. It was therefore speculated that the relationship between
Leadership Excellence and Performance might be affected in a similar way. A
multivariate regression was run with the Environment Dynamics variate and a Leadership
Excellence/ Environment Dynamics interaction variable in the model. This led to a model
with an R2 of 0.360 with an F statistically significant at the 0.000 level. The results are
given in Table 4-25.
Table 4-25: Effect of Environment Dynamics on the Leadership Excellence and Performance relationship
Model Unstandardized
Coefficients
Standardized
Coefficients t Sig.
Collinearity
Statistics
B
Std.
Error Beta
Tol VIF
1 (Constant) -1.017 1.164 -.874 .383
Leadership
Excellence 1.070 .223 1.483 4.803 .000 .035 28.173
Environment
Dynamics .842 .251 .830 3.355 .001 .055 18.095
Interaction
variable -.146 .048 -1.206 -3.038 .003 .021 46.574
a Dependent Variable: Performance
From the results in Table 4-25 it appears that the Environment Dynamics is having a
moderating effect on the leadership Excellence – Performance relationship, but high
multicollinearity with a tolerance of < 0.1 gives cause for concern in drawing conclusions
(Hair, Anderson et al. (1998)). As a consequence an alternative model was examined
with Environment Dynamics as a dummy variable (see below). This suggested that,
although the variable loaded at the 0.1 significance level, the standardized beta was
slightly positive at 0.10. The hypothesis was therefore rejected.

237
4.3.2 Strategic Capability and Performance The next area examined was the effect of Strategic Capability on an organization‟s
Performance. There was also an interest in seeing whether the Environmental Dynamics
affected any relationship. The research model was:
The two hypotheses were:
4.3.2.1 H2: There will be a positive relationship between Strategic Capability and Performance
4.3.2.2 H2a: The strength of the relationship will be weaker in highly dynamic environments
Running two simple regression equations with Strategic Capability and Performance as
the dependent variable (model 1), and adding Environment Dynamics as a second
independent variable together with an interaction variable (model 2), tested both of these
relationships. The results gave an R2 of 0.521 with an F-factor significance of 0.000 for
model 1, with an R2 of 0.545 and F-factor significance of 0.000 for model 2. The
residuals approached normality. Table 4-26 summarizes the results for both models.
The results show that Strategic Capability does indeed have a positive relationship with
Performance and that this relationship is strong with a standardized beta of 0.722. This
result leads to the acceptance of Hypothesis H2.
Environment Dynamics was also found to be a statistically significant factor, but with a
positive relationship. The interaction factor was also statistically significant indicating that
Environmental Dynamics was indeed a moderating factor, but as with the Leadership
Excellence and Performance relationship above, multicollinearity was too high for such a
conclusion to be confirmed. Hypothesis H2a also called for this relationship to be
negative and so no evidence could be found to support hypothesis H2a, where the
dynamics of the environment were expected to have a negative impact on the
relationship between Strategic Capability and Performance.
Performance Strategic Capability
Environment Dynamics
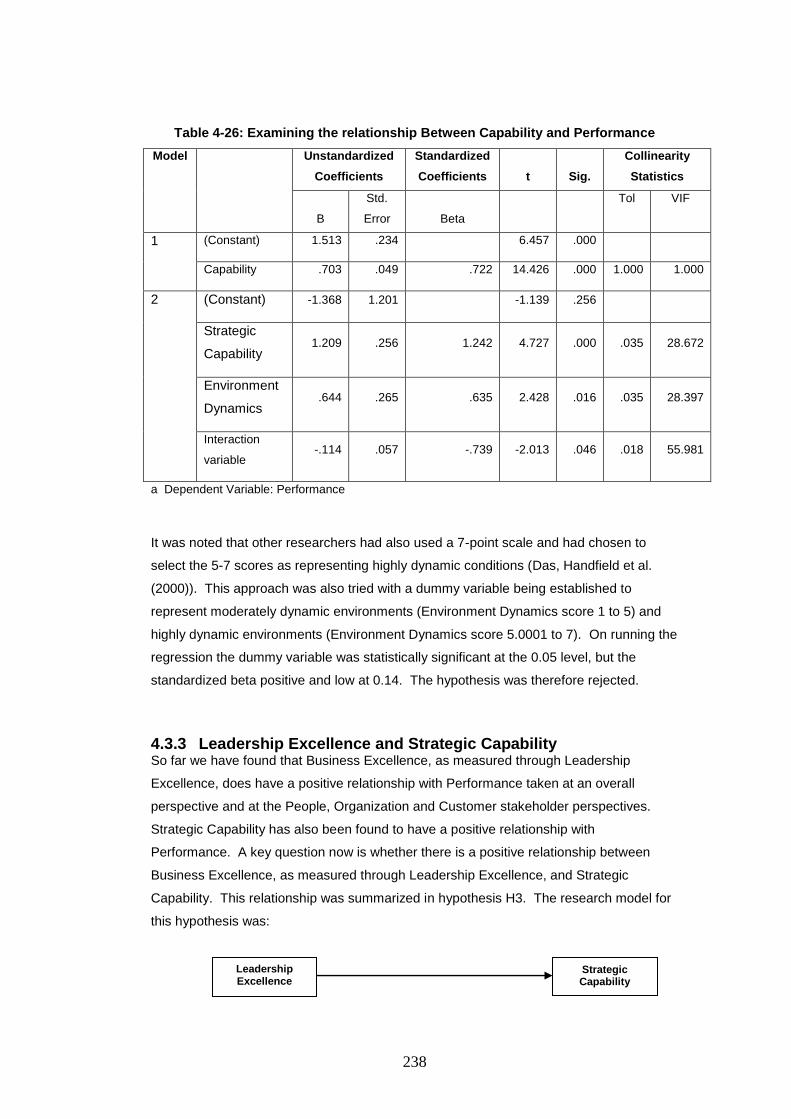
238
Table 4-26: Examining the relationship Between Capability and Performance
Model Unstandardized
Coefficients
Standardized
Coefficients t Sig.
Collinearity
Statistics
B
Std.
Error Beta
Tol VIF
1 (Constant) 1.513 .234 6.457 .000
Capability .703 .049 .722 14.426 .000 1.000 1.000
2 (Constant) -1.368 1.201 -1.139 .256
Strategic
Capability 1.209 .256 1.242 4.727 .000 .035 28.672
Environment
Dynamics .644 .265 .635 2.428 .016 .035 28.397
Interaction
variable -.114 .057 -.739 -2.013 .046 .018 55.981
a Dependent Variable: Performance
It was noted that other researchers had also used a 7-point scale and had chosen to
select the 5-7 scores as representing highly dynamic conditions (Das, Handfield et al.
(2000)). This approach was also tried with a dummy variable being established to
represent moderately dynamic environments (Environment Dynamics score 1 to 5) and
highly dynamic environments (Environment Dynamics score 5.0001 to 7). On running the
regression the dummy variable was statistically significant at the 0.05 level, but the
standardized beta positive and low at 0.14. The hypothesis was therefore rejected.
4.3.3 Leadership Excellence and Strategic Capability So far we have found that Business Excellence, as measured through Leadership
Excellence, does have a positive relationship with Performance taken at an overall
perspective and at the People, Organization and Customer stakeholder perspectives.
Strategic Capability has also been found to have a positive relationship with
Performance. A key question now is whether there is a positive relationship between
Business Excellence, as measured through Leadership Excellence, and Strategic
Capability. This relationship was summarized in hypothesis H3. The research model for
this hypothesis was:
Strategic Capability
Leadership Excellence

239
4.3.3.1 H3: There will be a positive relationship between Leadership Excellence and Capability
This hypothesis was tested by running a simple regression equation with Leadership
Excellence as the independent variable and Strategic Capability as the dependent
variable. Table 4-27 summarizes the results for all data sets. In all cases the residuals
approached normality.
Table 4-27: Examining the relationship between Leadership Excellence and Strategic Capability
Data Set R2 Sig F B Stand
Beta
Sig t
All data 0.312 0.000 0.417 0.563 0.000
Less outliers 0.255 0.000 0.358 0.505 0.000
Top leaders 0.279 0.000 0.402 0.528 0.000
Top leaders less outliers 0.215 0.000 0.342 0.464 0.000
Again the different data sets did not have a major effect on the results, which showed that
there was indeed a positive relationship between Leadership Excellence and Strategic
Capability. As a consequence hypothesis 3 was accepted.
The regressions were also run on the original 8 Performance factors splitting the file
between public and private organizations as shown in Table 4-28.

240
Table 4-28: Relationship between Strategic Capability and the eight stakeholder Performance factors
Results Area Public Sector Private Sector
R2 Sig F B Stand
Beta
Sig t R2 Sig F B Stand
Beta
Sig t
Employee Results 0.375 0.000 0.873 0.612 0.000 0.565 0.000 0.917 0.752 0.000
Key Outcomes 0.378 0.000 0.843 0.615 0.000 0.549 0.000 0.913 0.741 0.000
Employee Absence 0.234 0.002 0.877 0.484 0.000 0.102 0.000 0.463 0.319 0.002
Customer 0.153 0.000 0.527 0.391 0.000 0.370 0.000 0.762 0.608 0.000
Community 0.114 0.001 0.475 0.337 0.001 0.294 0.000 1.038 0.542 0.000
New Products/ Services 0.095 0.002 0.442 0.308 0.002 0.102 0.002 0.445 0.319 0.002
Sustainability 0.074 0.006 0.355 0.271 0.006 0.292 0.000 0.834 0.540 0.000
Growth 0.065 0.010 0.491 0.255 0.010 0.356 0.000 0.959 0.597 0.000

241
The results show some differences between the public and private sector. Although all
the results are statistically significant at the 0.05 level, the strength of the relationships
vary depending on the stakeholder group/ Performance factor as shown in Table 4-29,
where the results have been put in standardized beta order.
Table 4-29: Standardized betas for Strategic Capability and the eight stakeholder Performance factors
Public Sector Private Sector
Employee Results 0.612 Employee Results 0.752
Key Outcomes 0.615 Key Outcomes 0.741
Employee Absence 0.484 Customer 0.608
Customer 0.391 Growth 0.597
Community 0.337 Community 0.542
New Products/ Services 0.308 Sustainability 0.540
Sustainability 0.271 Employee Absence 0.319
Growth 0.255 New Products/ Services 0.319
The general trend was that the standardized betas were higher for the private sector
organizations, but, as before, there is a health warning on the fit of the data, which makes
such conclusions unreliable. Employee Results and Key Outcomes are top of the list for
both types of organization, but for private sector organizations the Customer and Growth
are the next, with Sustainability also featuring higher up the table. Hair notes that the
value of the standardised betas may only be compared in the context of the specific
regression that is under examination (Hair, Anderson et al. (1998)), reinforcing the care
that needs to be taken over the interpretation of these results.
4.3.4 Strategic Capability is developed over time Part 3 of the questionnaire considered the factors that led to organizational advantage
and sought perceptions on how long it would take to replace such advantages. The work
sought to build on the work of Hall (Hall (1991); Hall (1992); Hall (1994)), who asked
private sector Chief Executives to consider these factors. In addition, the Business
Excellence benefits research (e.g., Hendricks and Singhal (2001a)) raised the debate as
to when the benefit of the approach is delivered. For these reasons Part 3 collected both
categorical and time-perception data.

242
Part 3 of the questionnaire was found to be the most challenging to complete and had to
be dramatically simplified during the questionnaire design. Despite this simplification,
respondents found answering the questions difficult, which resulted in a high number of
cases with missing data as shown in Table 4-30.
Table 4-30: Sources of organizational advantage missing data
Source of Advantage # Missing % Missing
Capture and use of customer information 22 12
Capture and use of public information 22 12
Continuous improvement activities 28 16
Culture of the organization 20 11
Customer base 21 12
Customer focus 24 14
Customer service and/or product support 20 11
Databases 20 11
Distributor/ Service provider know-how 17 9
Employee know-how 21 12
External networks 19 10
Financial viability/ Budget position 22 12
Intellectual property rights and trade secrets 15 8
Knowledge sharing 19 10
Leadership 19 10
Learning 25 14
Low cost / Value for money 27 16
Organization and structure 15 8
Organization‟s reputation 15 8
Processes and systems 17 9
Service/ Product/ Brand reputation 21 12
Specialist physical resources 14 7
Speed and flexibility in product/ service design 17 9
Staff skills and competences 24 14
Supplier know-how 16 9
Use of technology 17 9
Despite this limitation the results provide a valuable insight into how respondents view the
sources of organizational advantage. Figure 4-3, Figure 4-4 and Figure 4-5 show these
results for the total sample, public sector and private sector, respectively.

243
Considering the top ten sources of organizational advantage, the interpretation of these
results is that people are a common source of organizational advantage for both public
and private sector organizations, but private organizations also rely heavily on their
brands and reputations. This conclusion is consistent with the argument that one of the
limitations of the Resource-based View is that it underestimates market positioning
(Wernerfelt (1984); Priem and Butler (2001)). Public sector organizations, on the other
hand, rely on their external perspective such as their service providers and networks.
One final comment is that the culture of the organization was considered to be a higher
rated advantage in private sector organizations.

244
0 10 20 30 40 50 60 70 80 90 100
Specialist physical resources
Speed & flexibility in product/ service design
Intellectual property rights and trade secrets
Supplier know-how
Knowledge sharing
Organisation and structure
Databases
Use of technology
Financial viability/ Budget position
Processes and systems
Distributor/ Service provider know-how
Low cost / Value for money
Capture and use of public information
Customer base
Learning
External networks
Customer service and/or product support
Service/ Product/ Brand reputation
Leadership
Culture of the organisation
Capture and use of customer information
Organisation‟s reputation
Customer focus
Continuous improvement activities
Employee know-how
Staff skills and competences
(All cases (N=193) Adjusted for non-respondents)
Figure 4-3: Contributors to SOA shown as % respondent (All cases)

245
0 20 40 60 80 100 120
Intellectual property rights and trade secrets
Speed & flexibility in product/ service design
Specialist physical resources
Supplier know-how
Customer base
Service/ Product/ Brand reputation
Processes and systems
Knowledge sharing
Financial viability/ Budget position
Organisation and structure
Databases
Use of technology
Low cost / Value for money
Customer service and/or product support
Culture of the organisation
Organisation‟s reputation
Learning
Leadership
Capture and use of customer information
Capture and use of public information
External networks
Distributor/ Service provider know-how
Customer focus
Continuous improvement activities
Employee know-how
Staff skills and competences
(Public sector (N=101) Adjusted for non-respondents)
Figure 4-4: Contributors to SOA shown as % respondent (Public sector)

246
0 10 20 30 40 50 60 70 80 90 100
Specialist physical resources
Speed & flexibility in product/ service design
Knowledge sharing
Supplier know-how
Distributor/ Service provider know-how
Organisation and structure
Capture and use of public information
Intellectual property rights and trade secrets
Databases
Learning
Use of technology
External networks
Low cost / Value for money
Financial viability/ Budget position
Processes and systems
Leadership
Customer service and/or product support
Culture of the organisation
Capture and use of customer information
Customer focus
Continuous improvement activities
Service/ Product/ Brand reputation
Customer base
Staff skills and competences
Organisation‟s reputation
Employee know-how
Private sector (N=91) Adjusted for non-respondents)
Figure 4-5: Contributors to SOA shown as % respondent (Private sector)

247
The second aspect to part three was the measurement of the perceived time it would take
to replace the sources that contributed to the sustainable organizational advantage. It
was hoped that the data could have been used as a ratio variable but it was clear from
the responses that this data was not normal, with skewness and kurtosis being as high as
5 and 40, respectively. There was also a concern over missing data, as many
respondent failed to give a response of the replacement period as they found this to be
difficult. For example, the top item was „Staff skills and competences‟, but although 156
out of 169 respondents reported this as a source of organizational advantage, only 136
gave a replacement period.
Due to its non-normality the Replacement period data was transformed by taking a log
function. The descriptive statistics for the transformed data showed that of the 26 items,
4 had a question mark against their normality, and only 5 did not have any identified
outliers. Of these outliers cases 141 and 191 were candidates for removal as they
occurred several times, over 10 times with the latter. As with the other data in the data
set, no outliers were removed at this point.
The results of this study were also compared with the results of Hall. Table 4-31
compares the results of the two studies and this includes the replacement period data.
It is not surprising that this study did not exactly replicate the work of Hall. In fact there
were some differences experienced by Hall himself between his 1991 and 1992 papers
(Hall (1992)). The current study utilized a different sampling frame, had slight wording
revisions to account for its use in both the private and public sector, and it has already
been noted that respondents had difficulty in estimating the replacement periods, a factor
not recorded by Hall. The general conclusions are that, for private sector, the employees‟
contribution is significant as is the organizations reputation and brand. As a
generalization, it can take in the order of three to five years to rebuild an asset if lost, and
it is expected that this is a similar timeframe to the time it would take to fully introduce an
excellence philosophy into an organization (Douglas and Judge (2001); Hendricks and
Singhal (2001a)).

248
Table 4-31: Comparison of the results of Hall and this study
Results Hall (1991); Hall (1992) This Study (Private
Sector Organizations)
Position Intangible Resource Average
Replacement
Period
Range Position Average
Replacement
Period
1 Employee know-how 4.6 4.4-4.7 1 3.4
1 Company reputation 10.8 8.1-14.0 2 6.5
1 Product reputation 6.0 6.3-6.8 5 5.3
4 Networks 3.4 3.0-3.9 15 2.9
5 Specialist physical
resources
- - 26 2.9
6 Supplier know-how 3.1 2.4-4.4 23 2.7
7 Intellectual property rights - -- 19 5.0
8 Contracts - - 4 4.6
9 Distributor know-how 1.6 1.4-1.9 22 2.4
9 Trade secrets - 19 5.0
Table 4-31 shows that for the top ten sources of organizational advantage in the private
sector organizations, the average Replacement Periods varies between 2.4 to 6.5 years.
Table 4-32 provides a comparison of the top ten sources of organizational advantage and
their replacement periods for private sector, public sector and the combined sample. The
replacement periods have been calculated using two methods. Firstly, by taking the
average of the log distribution and secondly by reporting the medium. Easton and Jarrell
(1998) noted that medians are often used to interpret financial data, as it is non-normal,
as medians are more robust to non-normality problems, such as outliers.

249
Table 4-32: Replacement periods for top 10 sources of competitive advantage
Public Sector Private Sectors Total Sample
Source of Organizational
Advantage
Replacement
Period (Yrs)
Source of Organizational
Advantage
Replacement
Period (Yrs)
Source of Organizational
Advantage
Replacement
Period (Yrs)
Mean Median Mean Median Mean Median
Staff skills and competences
3.7 3.0 Employee know-how 3.4 3.0 Staff skills and competences
3.6 3.0
Employee know-how 3.4 3.0 Organization‟s reputation 6.5 5.0 Employee know-how 2.6 3.0
Continuous improvement activities
2.2 2.0 Staff skills and competences
3.4 3.0 Continuous improvement activities
2.4 2.0
Customer focus 2.1 2.0 Customer base 4.6 5.0 Customer focus 2.4 2.0
Service provider know-how 3.3 3.0 Service/ product/ brand reputation
5.3 5.0 Organization‟s reputation 6.0 5.0
External networks 2.4 2.0 Continuous improvement activities
2.6 3.0 Capture and use of customer information
2.5 2.0
Capture and use of public information
2.0 2.0 Customer focus 2.7 3.0 Culture of the organization 3.8 3.0
Capture and use of customer information
2.2 2.0 Capture and use of customer information
2.9 3.0 Leadership 2.4 2.0
Leadership 2.3 2.0 Culture of the organization 4.1 3.5 Service/ Product/ Brand reputation
4.8 5.0
Learning 2.8 3.0 Customer service and/ or product support
2.4 3.0 Customer service and/or product support
2.4 2.0

250
4.3.4.1 H4: Strategic Capability is built over time Hypothesis 4 sought to examine the relationship between the Strategic Capability variate
and the time required to build the capability. Examination of this relationship was
attempted by considering the relationship between the Log (Replacement Period) for the
top ten overall sources of sustainable organizational advantage as the independent
variable and Strategic Capability as the dependent variable. A stepwise regression
approach was used with the entry level set at the default of 0.05, but none of the
Replacement periods loaded. This was confirmed by re-running the regression using the
enter approach. The model had an R2 of 0.382 but was non-significant. It was therefore
concluded that the approach taken was unable to provide evidence to support this
hypothesis other than the Replacement Period data already discussed above.
4.3.5 Leadership Excellence developing Strategic Capability The final hypothesis, H5: Leadership Excellence has a positive relationship with strategic
capability, which leads to higher levels of performance, sought to establish a causal path
between Business Excellence, as measured through Leadership Excellence, Strategic
Capability and Performance. As this required a path analysis Structured Equation
Modelling (SEM) was used to examine the path using the advice of many authors and in
particular Hair, Anderson et al. (1998) and Byrne (2001). SEM is known to be a powerful
but intolerant technique. Maruyama (1998) noted that the roots of SEM go back to the
1920s when Sewell Wright, a geneticist, attempted to solve simultaneous equations to
disentangle genetic influences across generations. At times one wonders whether he
has got it working yet.
A confirmatory modelling strategy was used when conducting the structured equation
modelling, assessing the fit of a single model to the data. It is recognised that such an
approach is not as rigorous as with a competing models strategy, but it served the
purpose in the current work (Hair, Anderson et al. (1998)).
The basic model being examined is shown in Figure 4-6, with the full model being given
in Appendix 7: Initial SEM model. This comprised three related measurement models
defined down to the item level, as determined from the output of the EFA.

251
Figure 4-6: Basic path under investigation
Given the complexity of the model, AMOS was unable to run despite the fact that the PC
being used was a Pentium 3 933 MHz machine. The model was therefore simplified to
replace the latent variables with the first order summated factors. This model did lead to
some output, but the statistics indicated a poor fit. The estimates of the regression
weights were all significant.
Examination of the modification indices of the simplified model indicated that one area of
concern was with the Leadership Excellence construct. This was therefore replaced with
its summated score. The resulting model still had a significant Chi-square, but the other
goodness of fit indicates were much better. Finally, the model was re-calculated using
the data files that were restricted to the top leaders and/ or the outliers were removed.
Table 4-33 summarizes the statistics for the various computations. It was noted that
other researchers have taken a similar approach (e.g., Das, Handfield et al. (2000)).
Some researchers advocated the calculation of statistical power when considering the
chi-square result (Chin (1998); Shook, Ketchen et al. (2004)). Given the number of
degrees of freedom and the desire to achieve a statistical power of at least 0.8, the
sample size may be calculated. However such calculations have been described as
„crude‟ and in their meta-analysis, Shook, Ketchen et al. (2004) found that only 2 out of
92 studies reported statistical power. In the current study, heuristics suggested that a
sample size of between 150 and 200 would satisfy the statistical power requirements.
Leadership
Excellence
Strategic
CapabilityPerformance
•Excellence as measured throughLeadership
•The ability of anorganisation to reactto change
•The level of performanceachieved for all stakeholders
Leadership
Excellence
Strategic
CapabilityPerformance
•Excellence as measured throughLeadership
•The ability of anorganisation to reactto change
•The level of performanceachieved for all stakeholders

252
Table 4-33: Summary of SEM results
Model CMIN P CMIN/df GFI AFI TLI CFI RMSR
Required value (Byrne (2001)) - >0.05 <3.0* >0.9 >0.9 >0.9 >0.95 <0.05
Complete model Would not solve
First order model 305 0.000 2.348 0.841 0.790 0.914 0.927 0.084
First order model with summated Leadership
Excellence – All data
106 0.000 2.121 0.917 0.871 0.934 0.950 0.076
First order model with summated Leadership
Excellence – Less outliers
102 0.000 2.042 0.916 0.869 0.918 0.938 0.076
First order model with summated Leadership
Excellence – Top leaders only
86 0.001 1.712 0.920 0.876 0.946 0.959 0.067
First order model with summated Leadership
Excellence – Top leaders only and less
outliers
87 0.001 1.733 0.916 0.869 0.928 0.945 0.069
* Note: A Χ2/
df ratio of < 3.0 is given by Curkovic, Melnyk et al. (2000) and Tena, Llusar et al. (2001). Su, Li et al. (2003) suggest a Χ2/
df ratio of < 2.0.

253
Byrne (2001: 81) made the point that goodness of fit indicators were developed due to
the acknowledged limitations in Χ2. From the statistics in Table 4-33 there is evidence
that the specified model is a reasonable fit for the data, and the best fit is given with the
data from the top leaders sample. This data set still has a Root Mean Square Residual
above 0.05, but as cited within the Amos 5 help notes, a more practical level is 0.08 and
the upper limit 0.10 (Browne and Cudeck (1993)).
Being the best fit the Top Leader data set has been used to calculate the regression
weights given in Figure 4-7, which also shows the model used and Table 4-34 the values
of the main coefficients. Taking the advice that standardized paths should be at least 0.2
and ideally above 0.3 (Chin (1998)), the overall conclusion was that the evidence
supports the hypothesis, which is thereby accepted.
Table 4-34: Regression coefficients for SEM paths
Path Description Coefficient Critical
Ratio
Hypotheses
Supported
Leadership Excellence to
Capability
0.390 (p<0.001) 7.072 H2 and H5
supported
Capability to Overall Results 0.624 (p<0.001) 4.249 H3 and H5
supported

254
Figure 4-7: Final model with regression weights
Note: Error terms have been
omitted for the sake of clarity
Leadership
Excellence
Strategic
CapabilityPerformance
Response
Capability
Knowledge
Robustness
Strategy
Robustness
Organizational
Robustness
Organization
Outcomes
Employee
OutcomesCSR
Key
Outcomes
Customer
Results
New Products &
Services
CommunitySustainabilityEmployee
OutcomesEmployee
Results
0.62
1.00 1.27
1.76 1.00 0.84 1.00
0.99
1.41
1.241.001.00
0.39
0.88
0.73
0.90

255
4.4 Validate the models As has been mentioned previously, Easterby-Smith, Thorpe et al. (2002) noted that the
validity of the results may be improved through the use of focus groups, a view supported
by Jick (1979). To this end several focus groups were held to get their reaction to the
results, together with feedback from other sources, such as original authors. The focus
groups and interviews followed the qualitative methods outlined in section 3.3.
A total of 6 focus groups were held covering both practitioners and academics, and three
original authors were approached. These researchers were Patricia Moura e Sá, who
developed the Leadership Excellence instrument, Dick Hall, whose work was partially
replicated in the current study, and Dick D‟Aveni, who is an acknowledged expert in
Hypercompetition. Appendix 8: Feedback from focus groups on interpretation,
summarizes the feedback from the focus groups on the interpretation of the results. The
main themes from the feedback were as follows:
There was general acceptance of many of the findings. In particular, the role that
leadership plays in the success of organizations and how the leadership relates
to the people, who are a driving force behind the sustainable organizational
advantage;
The idea of Business Excellence embedding an ideology, which helps
organizations react to change, was considered an insight. This link, when drawn,
was recognized by nearly all organizations. It was also interesting that a number
of consulting models such as „Change-able‟ and „Changeability‟ (e.g., Lever
(2000)), were seen as being confirmed by the current research;
It was also interesting that none of the organizations felt that they competed in
highly dynamic or hypercompetitive conditions and, if they were to do so, would
struggle as they could not keep pace with such conditions, their culture being
counterproductive to radical, fast change;
That culture plays a key role in an organization‟s ability to adapt to change was
supported by the detail in Dick Hall‟s work, which has not been published.
Through his case studies Dick identified some aspects of „Culture‟ that led to a
sustainable competitive advantage. Dick‟s description could have been taken
straight out of a Business Excellence practitioners‟ book;
Whilst on Dick Hall‟s work, it was satisfying that although some compromises
were made in the current study the results are in line with one another. At the
time the current analysis was completed it was not known that Dick had
segmented his responses by industry, and had found differences, as in the
current work. Dick also found Replacement Periods difficult for respondents to
estimate, as with the current study;

256
The focus groups also confirmed that organizations build their advantage over
time and that, in general, there is no instant recipe for success;
Several people remarked that there was no disconcernable difference between
„Employee-know-how‟ and „Skills and competences‟, suggesting that the terms
were measuring similar things. There was also some suggestion that sources of
organizational advantage, such as the people and the culture, were actually
drivers of the holistic reputation, which covers many features of an organization‟s
performance;
The lack of a relationship between either Leadership Excellence or Strategic
Capability with Societal Results was felt to be counterintuitive;
The emerging nature of dynamic capabilities was mentioned by strategy
academics. The point was also made that it would be valuable to continue the
work such that longitudinal information could be made available;
Finally, many of the academic sources remarked on the quality of the research
that has been conducted.

257
4.5 Chapter summary This Chapter has taken the reader thought the process of converting the raw data into a
number of key findings. The quality of the data was noted not to be perfect and this
made the use of advanced techniques such as Structured Equation Modelling all the
more difficult. The current research was challenged by the desire to include both public
and private organizations in the study, which required the conversion of private sector
instruments for use in the public sector, which operates under a different business model
(e.g., see Alford (2001)). The fact that this research, which makes use of the RBV
literature, included the public sector allowed both a practical and academic contribution,
so the decision was well worth the inconvenience. Foresight, fuelled by the literature,
had allowed for a number of categoric variables to be defined and this allowed the data to
be used under a number of conditions to test to see if the data was having a major effect.
This was shown to be a good decision, as the data did not have a major effect on the
conclusions.
A number of hypotheses were proposed and some were accepted. The results provide
additional evidence of the benefit of adopting a Business Excellence approach in a way
that avoided the need to rely on award winners and society members. What was
surprising was the finding that Business Excellence works for everyone, public and
private, large and small, whole organization or business unit. The dynamics of the
environment did not seem to have an effect, although it is believed that the sample and
instrumentation may have led to this conclusion. The results also provide an insight as to
why Business Excellence works, through the embedding of a quality ideology that allows
organizations to react to environmental changes, in line with the „mental buffer‟ theory of
Savolainen (Savolainen (1999); Savolainen (2000a)).
Although the research would be classified by many as positivist, the contribution from the
focus groups and other sources, which provided an interpretive input, added weight to the
findings. This has allowed a number of observations to be made that are now taken
forward into the next Chapter, where the focus will be on discussing the practical
significance of the results in greater detail.

258
5 Discussion In the last Chapter data was analyzed and a number of hypotheses tested to provide a
series of results. The focus of the interpretation was on statistical significance. This
Chapter commences by reviewing the results against each of the hypotheses before
placing the results into the context of the main themes of the research, picking up on the
theme of practical significance (Hair, Anderson et al. (1998)). These themes form the
main body of findings from the research, resulting in a framework that may be used to
categorize the sources on dynamic capability, in a similar way to Hall‟s work on intangible
assets. In contributing to theory, the advice of several authors was considered (e.g.,
Christensen and Raynor (2003); Weber (2003); Remenyi (2004)).
In discussing the results it is pertinent to recall the research question developed following
the literature review so that the main purpose of the research is not lost. This question
was:
Does adopting a Business Excellence philosophy lead to the development of the
ability to withstand changes in the external environment for both private and
public organizations?
The literature review detailed a number of models. The model reported by Zott (2003),
simplified in Figure 5-1, has been used as a basis for the structure of this Chapter.
Adapted from: Zott (2003)
Figure 5-1: The link between dynamic capabilities, resources and capabilities, and performance
The first theme discussed addresses the question „Does Business Excellence work?‟
The literature review uncovered many studies that answered „yes‟ to this question and the
current work adds to this body of knowledge. The second theme concentrates on the
„Resources and Capabilities‟ to „Performance‟ link in Figure 5-1. It reviews the sources of
organizational advantage, the time it takes to build such advantage and seeks a link
between Business Excellence and the types of advantage identified.
Dynamic
Capabilities
Resources and
CapabilitiesPerformance
Act On That Generate
Dynamic
Capabilities
Resources and
CapabilitiesPerformance
Act On That Generate

259
The research did not specifically focus on the area of dynamic capabilities, which is a fast
moving and complex area. But during the study a potential link between Business
Excellence and dynamic capabilities was identified. The third theme looks at a
relationship between an organization‟s ability to resist change and performance under
different environmental conditions. Such a relationship provides support for the existence
of dynamic capabilities and represents a second relationship in Figure 5-1.
Finally, the fourth theme draws the previous themes together. It examines the total
model in Figure 5-1 raising the possibility that Business Excellence may develop
organizations‟ dynamic capabilities. A model is presented, which provides a contribution
to theory.
5.1 Summary of findings by hypothesis In this section the results compared with the original hypotheses are reviewed. This
review is provided in Table 5-1. These hypotheses were designed to support a number
of themes and these themes are discussed in the following sections.
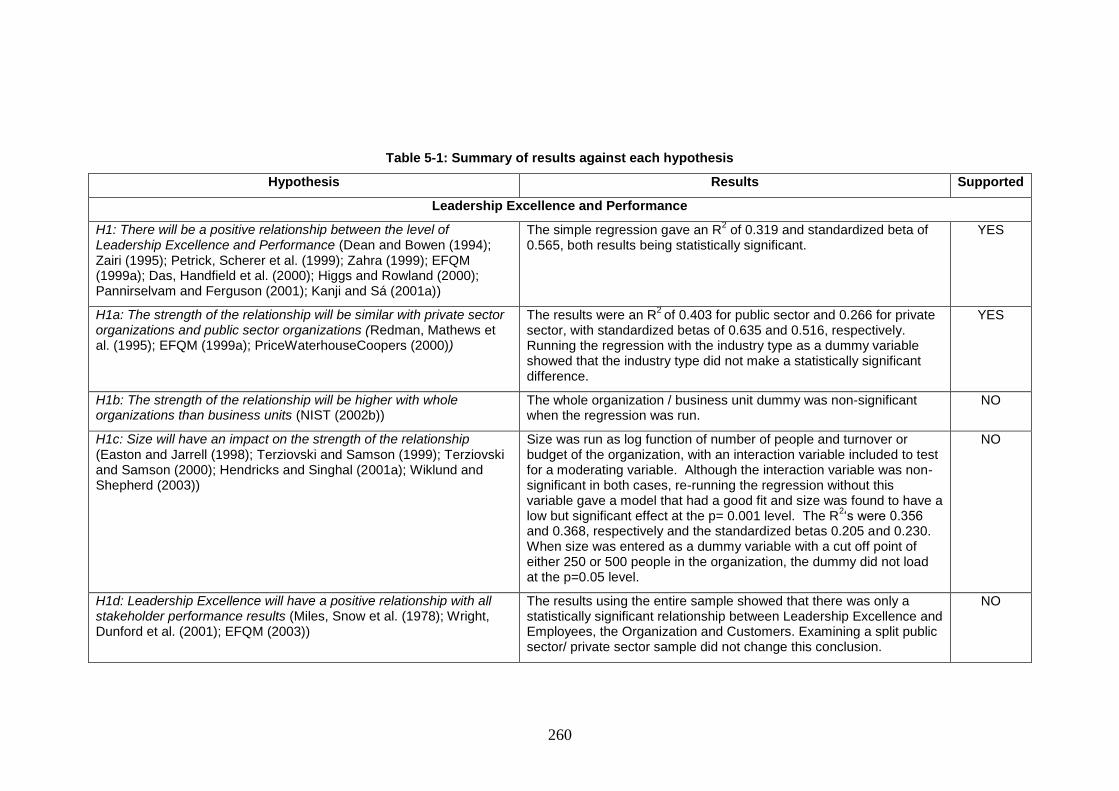
260
Table 5-1: Summary of results against each hypothesis
Hypothesis Results Supported
Leadership Excellence and Performance
H1: There will be a positive relationship between the level of Leadership Excellence and Performance (Dean and Bowen (1994); Zairi (1995); Petrick, Scherer et al. (1999); Zahra (1999); EFQM (1999a); Das, Handfield et al. (2000); Higgs and Rowland (2000); Pannirselvam and Ferguson (2001); Kanji and Sá (2001a))
The simple regression gave an R2 of 0.319 and standardized beta of
0.565, both results being statistically significant. YES
H1a: The strength of the relationship will be similar with private sector organizations and public sector organizations (Redman, Mathews et al. (1995); EFQM (1999a); PriceWaterhouseCoopers (2000))
The results were an R2 of 0.403 for public sector and 0.266 for private
sector, with standardized betas of 0.635 and 0.516, respectively. Running the regression with the industry type as a dummy variable showed that the industry type did not make a statistically significant difference.
YES
H1b: The strength of the relationship will be higher with whole organizations than business units (NIST (2002b))
The whole organization / business unit dummy was non-significant when the regression was run.
NO
H1c: Size will have an impact on the strength of the relationship (Easton and Jarrell (1998); Terziovski and Samson (1999); Terziovski and Samson (2000); Hendricks and Singhal (2001a); Wiklund and Shepherd (2003))
Size was run as log function of number of people and turnover or budget of the organization, with an interaction variable included to test for a moderating variable. Although the interaction variable was non-significant in both cases, re-running the regression without this variable gave a model that had a good fit and size was found to have a low but significant effect at the p= 0.001 level. The R
2„s were 0.356
and 0.368, respectively and the standardized betas 0.205 and 0.230. When size was entered as a dummy variable with a cut off point of either 250 or 500 people in the organization, the dummy did not load at the p=0.05 level.
NO
H1d: Leadership Excellence will have a positive relationship with all stakeholder performance results (Miles, Snow et al. (1978); Wright, Dunford et al. (2001); EFQM (2003))
The results using the entire sample showed that there was only a statistically significant relationship between Leadership Excellence and Employees, the Organization and Customers. Examining a split public sector/ private sector sample did not change this conclusion.
NO

261
Hypothesis Results Supported
Leadership Excellence and Performance continued
H1e: The strength of the relationship will be weaker in highly dynamic environments (Das, Handfield et al. (2000); Eisenhardt and Martin (2000); Fiol (2001); Leonard, McAdam et al. (2002); Dervitsiotis (2004); Jones (2004))
The Environment Dynamics variable and interaction variable were significant in the regression, but multicollinearity was high. Re-running the regression with Environment Dynamics as a dummy did lead to a significant result at the 0.1 level, but the standardized beta was positive and not negative as predicted.
NO
Strategic Capability and Performance
H2: There will be a positive relationship between Capability and Performance (Klein, Edge et al. (1991); Savolainen (1999); Zahra (1999); Rosenbloom (2000); Savolainen (2000a); Tena, Llusar et al. (2001); Douglas and Ryman (2003); Wiklund and Shepherd (2003))
The regression had a very good fit with an R2 of 0.585 and a
standardized beta of 0.772 for the total sample. Running the regression models at the industry and stakeholder level indicated that the relationships were statistically significant for all the variations, although the R
2„s for New Products and Services for both Private
Sector and Public Sector, and for Community, Sustainability and Growth for Public Sector, were all low.
YES
H2a: The strength of the relationship will be weaker in highly dynamic environments (Barney and Zajac (1994); Henderson and Mitchell (1997); Das, Handfield et al. (2000); Eisenhardt and Martin (2000); Eisenhardt and Sull (2001); Fiol (2001))
The multivariate regression with Environment Dynamics as a variable and including an interaction variable did show that both were statistically significant in the model, but high multicollinearity prevented the conclusion that Environment Dynamics was having a moderating effect on the Strategic Capability and Performance relationship. The standardized beta was also positive as opposed to being negative as expected. Re-running the multivariate regression with the Environment Dynamics as a dummy revealed that this did have a statistically significant effect, but the standardized beta was slightly positive at 0.118, which was the opposite to what was expected.
NO
Leadership Excellence and Strategic Capability
H3: There will be a positive relationship between Leadership Excellence and Capability (Teece, Pisano et al. (1997); Ireland and Hitt (1999); Petrick, Scherer et al. (1999); Zahra (1999); Prahalad (2000); Zott (2003))
The regression had a good fit with an R2 of 0.312 and a standardized
beta of 0.563. YES

262
Hypothesis Results Supported
Strategic Capability is developed over time
H4: Capability is developed over time (Dierickx and Cool (1989); Hendricks and Singhal (2000); Douglas and Judge (2001); Tena, Llusar et al. (2001); Hendricks and Singhal (2001a); Hendricks and Singhal (2001b); Przasnyski and Tai (2002); Sureshchandar, Rajendran et al. (2003); Warwood and Roberts (2004))
The results from the descriptive data indicated that the sources of sustained organizational advantage take between 2 to 6 years to build.
YES
Leadership Excellence develops Strategic Capability, which leads to Performance
H5: Leadership Excellence has a positive relationship with Strategic Capability, which leads to higher levels of performance (Tena, Llusar et al. (2001)
Despite the Chi-squared remaining statistically significant, other indices indicated a good fit on the SEM.
YES

263
5.2 The benefit of Business Excellence Based on the underlying assumption that Business Excellence is of benefit to
organizations this section reviews the evidence to provide further support for this claim.
First the results consider this from a generic viewpoint before discussing the findings at a
categoric level.
The literature review concluded that the two most popular methods for studying such
relationships were event-based studies considering secondary data such as share price
data, and surveys collecting primary data. Like the current study the latter mainly make
use of self-reported methods although interviews have been used in some studies. One
advantage of the current study apart from including both public and private organizations
was that the sample was drawn from industry sources and not from an award list. This
was to reduce any bias.
5.2.1 Support for the benefit of Business Excellence There is wealth of evidence supporting the view that, with the reservation that it does not
guarantee success, Business Excellence is of benefit to organizations. The current work
adds support for this argument with an acceptable coefficient of determination of 0.319
and the size of the standardized beta, at 0.565, indicates that the relationship is strong.
Most of this work in the area of Business Excellence benefits has focused on the
American Malcolm Baldrige model or Business Excellence in general. The current work
had a bias towards the EFQM Excellence Model® framework although this bias was
considered to be low. In the operationization of the Leadership Excellence instrument,
general direction was taken from the EFQM Excellence Model®
but the objective was to
use an instrument that captured the behaviour of leaders in organizations that would be
considered to have a high level of Business Excellence. By way of comparison Vokurka
and Stading (2000) provided an interpretation of the focus of leadership in a number of
the Business Excellence models and this is shown in Table 5-2. From this table it is
concluded that leadership, as defined in an EFQM sense, is compatible with other models
from around the world.

264
Table 5-2: Comparison of focus of leadership across Business Excellence models
Business Excellence Model Focus of Leadership Criteria
EFQM Excellence Model® Inspiration, support, and promotion of Business
Excellence
American Malcolm Baldrige Executive, company and community leadership
Deming Prize (Japan) Policy, organization and helpful supervision
Canadian Quality Award Strategic direction, involvement and improvement
Australian Quality Award Executive, company and community leadership
Adapted from: Vokurka and Stading (2000)
The reason why leadership was chosen as the critical factor on which to base Business
Excellence was a matter of scope. It would have been possible to operationalize
Business Excellence using a wider scope of activities, for example, by including people
management or by having representation from all of the criteria. This was the approach
taken by other researchers (e.g., Curkovic, Melnyk et al. (2000); Tena, Llusar et al.
(2001); Claver, Tari et al. (2003); Su, Li et al. (2003)) although only Su, Li et al. (2003)
attempted an operationization of an entire model. The decision was made not to do this,
as the main focus of the research was not to validate the EFQM Excellence Model®.
Whilst the current research was being conducted, other researchers expressed the view
that Business Excellence could not be related to a single factor and that the „system‟ had
to be considered (Reed, Lemak et al. (2000); Sun (2000)). If this is the case, then a
stronger relationship may have been observed if Business Excellence had been
represented by more than just a leadership construct, even if leadership is a major
contributory factor. This may, however, have caused a measurement problem, as one of
the requirements was to have an instrument that measured the level of Business
Excellence and this condition would have been broken had a new instrument been used
without additional validation.
It is of value to compare the current research with the three studies that modelled the
relationships between Business Excellence models and Performance (Table 5-3). The
current study certainly had the benefit of parsimony, yet its findings are consistent with
those from other researchers. It is notable in the work of Tena, Llusar et al. (2001) that a
link was established between Business Excellence and the development of distinctive
competences. This is an area of interest that is covered in a later section.

265
Table 5-3: Results from other empirical models on the Business Excellence and Performance relationship
Base Model Constructs Result Reference
Malcolm Baldrige TQM strategic systems
TQM operations systems
TQM information systems
TQM results
Chi-squared statistically significant but other fit
indicators acceptable. All paths in the
confirmatory factor analysis were statistically
significant. Authors claim support for the
Baldrige model.
Curkovic, Melnyk et
al. (2000)
Total Quality
Management
TQM:
o Customer focus
o Continuous improvement
o Employee fulfillment
o Organization as a total system
Distinctive capabilities
Performance
Model had a non-significant Chi-squared and
GFI of 0.913. Results indicated that Business
Excellence had a positive relationship with
Performance and Distinctive Capabilities.
Tena, Llusar et al.
(2001)
Australian Quality Award Organization performance
Leadership
Informational and analysis
Strategy and planning
Processes, products and service
People
Customer focus
Statistically significant correlations reported
between organization performance and
leadership, process, products and services,
people and customer focus.
The correlation between organization
performance and information & analysis, and
strategy & planning were non-significant.
Rahman (2001)

266
Base Model Constructs Result Reference
Taiwan Quality Award Leadership
Information Management
Innovation and Strategic Management
Human Resource and Knowledge Management
Customer/ Market Development
Process Management
Business Results
Achieved good model fit (GFI 0.998). Su, Li et al. (2003)
EFQM Excellence Model® Leadership Excellence Positive relationship between Leadership
Excellence and Performance.
This study

267
5.2.2 Business Excellence in the public sector One of the contributions of this research was the examination of the Business Excellence
and Performance relationship in public sector organizations. The literature review noted
that there was limited research in this area.
In the current study the results indicate there is a positive relationship between
Leadership Excellence and Performance with both the public sector and private sector
samples. In addition, the strength of the relationship was potentially stronger in public
sector organizations but the difference is likely to be due to the fit of the data. Re-running
the simple regression models using the sector as a dummy variable led to the conclusion
that this claim could not be made. The conclusion, that there is no difference between
the effect of Business Excellence on public, as opposed to private, sector organizations,
was supported by the work of Redman, Mathews et al. (1995) who concluded that both
sectors were at a similar level of maturity with regards to Business Excellence. Public
sector and private sector organizations also share a similar management model (Voss,
Tsikriktsis et al. (2004)).
The conclusion is considered to be a generalization. Due to the size of the responses by
industry type, it was not possible to test the means at an industry level. The literature
review identified that market and industry conditions were a factor (Easton and Jarrell
(1998); Terziovski and Samson (1999); Przasnyski and Tai (2002)). In addition, in
studying Richard Hall‟s results it was found that different industries reported different
sources of competitive advantage. Aaker (1989) had reached a similar conclusion. An
area for further research would be to repeat the study at an industry, as opposed to a
sector, level.
5.2.3 Business Excellence and whole organizations vs. business units
The results of the NIST fictitious buy and hold stock fund suggested that the relationship
between Business Excellence and Performance would be stronger for whole
organizations than business units (NIST (2002b)). The current study could not find
evidence to support this claim and is questionable how safe the NIST conclusion is given
the observation that business units do not have separate stock holdings. On re-reading
the report, it would appear that the distinction was made by categorizing organizations
based on their structure, but still tracking the overall share price. The difference may well
be due to organization size and not structure, although a link between the structure of the
organization and the benefits of Business Excellence has been reported (Douglas and
Judge (2001)). It was interesting, although studies have looked at industry and size
considerations, that only the NIST work considered the whole organization vs. business

268
unit results (e.g., Easton and Jarrell (1998); Rajan and Tamimi (1999); Hendricks and
Singhal (2001a); Przasnyski and Tai (2002)). Reed, Lemak et al. (2000) noted that
Business Excellence should be considered at the business level, as here it is most
relevant.
5.2.4 Business Excellence and organization size Small organizations reported a higher level of benefit in percentage terms than large
organizations (Hendricks and Singhal (2001a)). In another study an opposite effect was
reported and larger organizations delivered more benefit (Terziovski and Samson
(1999)). The conclusion from the literature was that size might have an effect on the
Business Excellence and Performance relationship. The result of the current study
suggested that size did have a weak effect on the relationship between Business
Excellence and Performance, with larger organizations having a stronger relationship.
However this conclusion should be treated with caution, given the results that the
interaction variable was non-significant and the attempt to see whether an SME/ larger
organization classification could be determined was not successful.
Yusof and Aspinwall (2000) argued that SMEs have certain features such as faster
communication and simple systems that provide an advantage over large organizations,
which could have led to a negative relationship between Leadership Excellence and
Performance. But they also noted a number of disadvantages, such as a lack of resource
(financial and people) and expertise (Yusof and Aspinwall (2000); Beheshti and Lollar
(2003)). In studying Business Excellence success factors, Merino-Diaz de Cerio (2003)
found that larger organizations were able to adopt TQM practices due to having the
available resources, but they noted that other authors had found an opposite relationship,
the differences being put down to a smaller sample size and the fact that the research
had focused on a particular industry sector. The observation that large organizations
have more effective Business Excellence implementation was also supported by Eng and
Yousof (2003). Size was also found to be an important factor in a study of strategic
competences in hospitals (Douglas and Ryman (2003)). The conclusion drawn from this
was that large organizations may have an advantage over SMEs in gaining the rewards
of Business Excellence, but this advantage is small. It appears that Business Excellence
benefits both small and large organizations.
5.2.5 Appropriation of benefit to all stakeholders One of the fundamental principals of Business Excellence is that all stakeholders share in
the benefits (EFQM (2003)). The EFQM Excellence Model® has different weightings
applied to each of the stakeholder groups (EFQM (1999a)) and these weightings do
serve as a comparison. The hypothesis H1d was that Business Excellence, as measured

269
through Leadership Excellence, would have a positive relationship with all the
stakeholder areas. Table 5-4 provides a comparison of the weightings given by the
EFQM Excellence Model®, with the highest rating results area, Customer Satisfaction,
being given a rating of 1, and the ratios of the standardized betas from the current
research for the overall sample, with the ratios being compared with Customer
Satisfaction. Care should be taken over the interpretation of this information given that
the value of standardized betas are regression equation specific (Hair, Anderson et al.
(1998)).
Table 5-4: Comparison of stakeholder weightings
Stakeholder
Group
EFQM Excellence
Model®
Weighting
Customer = 1
Variate Stand.
Beta
Weighting this
Research
Customer = 1
Customer 1.00 Customer Results 0.440 1.00
People
Outcomes
0.23 Employee Results 0.576 1.31
Society 0.30 CSR 0.312 0.71
Key Outcome 0.38 Key Outcomes 0.496 1.13
Growth 0.180 0.41
Key Indicators 0.38 Products and Services 0.355 0.81
The hypothesis that Business Excellence, as measured through Leadership Excellence,
has a positive relationship with all stakeholder groups was rejected as the coefficients of
determination for were low for Society, although significant R2 values as low as 0.05 have
been found in the literature (McGrath (1998)). This conclusion is consistent with
stakeholder research. Although Ogden and Watson (1999) noted that the needs of
differing stakeholder groups could be balanced, Hillman and Keim (2001) questioned the
impact of social participation, which is a fundamental principle of Business Excellence.
The analysis in Table 5-4 has some limitations in the match between the stakeholders
and variates. There is also a warning regards the level of fit of the data as indicated by
the R2 but it does provide some support for other researchers who concluded that the
weightings with the EFQM Excellence Model® are in need of further investigation
(Eskildsen, Kristensen et al. (2001); Eskildsen, Kristensen et al. (2002)).

270
One other issue raised by stakeholder results data concerns the interdependence
between the different stakeholders. Although outside the scope of the current study, the
EFQM Excellence Model®
predicts that high levels of customer, people and societal
satisfaction will lead to high key outcome results. Other researchers indicated that such
relationships do in fact exist (Das, Handfield et al. (2000); Eskildsen and Nussler (2000);
Oakland and Oakland (2001); Rahman (2001); Agus (2004); Michie and West (2004)).
Blyler and Coff (2003) noted that in socially complex systems, such as Business
Excellence, the appropriation of the value generated covers more stakeholders than just
the organization. This may explain why, when organizations face tough times and take a
shorter-term focus, the continuance of Business Excellence comes under threat
(Dervitsiotis (2003)).
5.2.6 The effect of an organization’s environment The observation that industry and market factors may have an effect on the effectiveness
of Business Excellence raised a question as to the extent of the effect of the dynamics of
the environment. Researchers have called specifically for research examining the effect
of the environment on Business Excellence (Das, Handfield et al. (2000); Leonard,
McAdam et al. (2002)). The environment may be a reason why some researches
concluded Business Excellence is not a guaranteed recipe for success (Powell (1995);
Terziovski and Samson (1999); Eriksson, Johansson et al. (2003)). In the current study
no support could be found to support the hypothesis that the dynamics of the
environment had a negative effect on the Business Excellence and Performance
relationship. A possible reason for this concerned the way that the dynamics of the
environment was measured, an issue that is discussed below. Although Environment
Dynamics appeared to have a moderating effect on the Leadership Excellence and
Performance relationship, high multicollinearity was the concern that led to this
conclusion being drawn with caution.
That the dynamics of the environment has an impact on the benefit of Business
Excellence remains an important issue and whether Business Excellence can be effective
in periods of turbulent change has been called into question (Dervitsiotis (2004)).
Managing volatility in the environment will be a major challenge for managers in the
future (Prahalad (2000)).
5.3 Sources of organizational advantage One of the assumptions made during this research was that competitive advantage is a
reality. Authors have argued competitive advantage does not exist (Powell (2001)) or
that the environment is changing so fast that a sustained advantage, is impossible to

271
maintain (Fiol (2001)). Accepting the concept of competitive advantage the next question
is whether Business Excellence can generate such an advantage, given that there is a
lack of theory underpinning this claim (Reed, Lemak et al. (2000)).
Another question is whether competitive advantage is built over time or whether it comes
about through some form of „jackpot‟ model (Barney (1995)). Many authors argued for a
path dependency approach (Grant (1991); Hall (1991); Hall (1992); Amit and
Schoemaker (1993); Pettus (2001)). A way of examining this question was to seek the
drivers of a sustained competitive advantage, or sustained organizational advantage as
termed in the current work, as the sample included both public and private sector
organizations. This section examines the relationship between „Resources and
Capabilities‟ and „Performance‟ in Figure 5-1, commences by reviewing the results of the
sources of organizational advantage work. In doing so, the classification of the sources
has been conducted and compared against the findings from the literature review
examining the Business Excellence critical success factors. A parallel has also been
drawn between the time taken to develop the sources of advantage and time taken to
implement Business Excellence.
5.3.1 Classification of sources of organizational advantage The current work reproduced the earlier work of Hall, including input from a wider range
of authors to generate a potential list of assets and capabilities. Using the ideas of Coyne
(1986), Hall categorized the intangible assets into assets with or without legal protection,
and competences based on functions or culture (Hall (1992)). Many authors have
reported a difference in the significance of particular intangible assets across different
industries (Snow and Hrebiniak (1980b); Aaker (1989); Hall (1994)), and so the result in
the current work that there were different results in the public and private sector was
expected. Kay (1998) developed a framework for considering distinctive capabilities in
different industries, which are argued to lead to competitive advantage. This framework
contains four main categories: Architecture, Reputation, Innovation and Strategic assets.
Table 5-5 provides a classification of the sources of sustainable organizational advantage
for both the public and private sector organization from the current research.

272
Table 5-5: Classification of the sources of SOA using Kay's framework
Kay (1998) Distinctive Capabilities Classification Public Sector Top 10 Private Sector Top 10
Categories Sub-categories
Architecture Internal: Between the firm and its employees and
among employees
External: Between the firm and its suppliers or
customers
Networks: Between a group of collaborating firms
Staff skills and competences
Employee know-how
Continuous improvement activities
Customer focus
Service provider know-how
External networks
Capture and use of public information
Capture and use of customer
information
Leadership
Learning
Employee know-how
Staff skills and competences
Continuous improvement activities
Customer focus
Capture and use of customer
information
Culture of the organization
Customer service and/ or product
support

273
Kay (1998) Distinctive Capabilities Classification Public Sector Top 10 Private Sector Top 10
Categories Sub-categories
Reputation Building reputation
Spreading reputation
Maintaining or devaluing reputation
Organization‟s reputation
Service/ product/ brand reputation
Innovation The process of innovation
Protecting and exploiting innovation
Standards
Strategic Assets Natural monopoly from scale economies and narrow
markets
Natural monopoly from compatibility standards or
interdependence between customers
Sunk costs from tangible investment
Sunk cost through reputation, advertising and market
knowledge
Exclusivity through licensing and regulation
Exclusivity from strategic action
Customer base

274
The analysis in Table 5-5 suggests that organizational architecture is the main source of
advantage in both public and private sector organizations. The public sector had no
„market factors‟ ranked in their top 10, with the Organization‟s Reputation coming in at
number 11 and Service/ Product/ Brand reputation at number 21. Kay noted that
„reputation is not equally important in all markets‟ (Kay (1998: p87)) indicating that this is
not a necessarily a public versus private sector issue. The effect of different industries on
capabilities has already been noted (Snow and Hrebiniak (1980b); Aaker (1989); Hall
(1994)).
That reputation was rated high and, from the replacement period data, took longer to
build suggests that reputation is an overarching concept. When questioned, Richard Hall
agreed with this view (Hall (2004)), which is further enhanced by considering May‟s
framework, which is shown in Figure 5-2.
Market Value
Fin
ancia
l
Ph
ysic
al
Custo
mer
Valu
e
Bra
nd V
alu
e
R &
D
Inte
llectu
alP
ropert
y
Infr
astr
uctu
re
Peo
ple
Book Value Corporate Reputation
Balance Sheet Customer Organization Human
Tangibles Intangibles
Adapted from May (2002)
Figure 5-2: May's intangibles framework
It was of interest that the people derived capabilities, such as employee know-how, were
considered to be of great importance in both the public sector and the private sector, an
observation also reported by Hall (1994) for the private sector. This may have a bearing
on the relationship between Leadership Excellence and stakeholder Performance, which
indicated that the greatest impact was on the People Outcomes. The result brings
support to the management slogan „people are our greatest asset‟.

275
Considering the source of advantage using Kay‟s classification, and May‟s framework,
there is support for the view that Business Excellence, which has all the Architecture
„Distinctive Capabilities‟ within its scope, could potentially generate organizational
advantage. Further support comes from a comparison between what organizations are
saying are their sources of advantage and the research that has identified the Business
Excellence critical success factors (CSFs). Such a comparison is provided in Table 5-6
Table 5-6: Sources of advantage (SOA) and Business Excellence CSF comparison
Top 10 SOA (This work all
organizations)
CSFs (From Table 2-5)
Matched Staff skills and competences
Employee know-how
Continuous improvement activities
Employee involvement/
People focus
Customer focus Customer focus
Culture of the organization Culture
Leadership Leadership
Not matched Organization‟s reputation
Service/ Product/ Brand reputation
Capture and use of customer
information
Customer service and/or Product
support
Involvement with customers
Involvement with suppliers
Direction setting
From Table 5-6 there is a close map between the people aspects, customer, culture and
leadership. Some of these linkages are supported by the literature. For example,
Oakland and Oakland (2001) made the connection between people and world-class
performance and Sussland (2001) had „Human Capital‟ at the centre of his model. Earlier
the role leadership plays in developing assets into core capability differentials was noted
(Petrick, Scherer et al. (1999)). The whole basis of the „Identity-based view‟ of Fiol (1991)
rests on the corporate culture.
The match is not perfect and there are a number of reasons for this apart from
classification wording difference. Firstly, as noted above, reputation is built from a

276
number of sources (May (2002)). Secondly, the work of Sun (2000) found that
organizations rank certain factors as important to their success, yet pay these factors little
attention. This suggests that the question of success factors has to be taken in the
context in which it is used.
The main conclusion from the analysis is that there is evidence of a link between
Business Excellence and the sources of sustained organizational advantage. The
arguments for this claim are as follows. Firstly, the analysis using the Kay framework
concluded that the majority of sources of organizational advantage factors were placed
under the „Architecture‟ classification. This classification relates to the social networks
within the organization (Kay (1998)). Secondly, the other main source of advantage,
reputation, is built on the intangibles within an organization (Hall (1994); May (2002)), all
of which fall with the scope of the Business Excellence construct. Thirdly, a comparison
between the sources of organizational advantage factors and the Business Excellence
critical success factors indicates a close match.
The work of Hall also provided evidence of a link between Business Excellence and the
sources of organizational advantage. Hall made a link between the people dependent
capabilities of an organization and the generation of its strategic assets (Hall (1994)).
Taking a case study approach he visited six organizations to identify the detail behind the
intangible resources that had been identified. One of these intangible resources was the
culture, which reflects the social systems within the organizations. Six aspects of culture
were identified, all relating closely to a Business Excellence social system. The aspects
were (Hall (1994: p163); Hall (2004)):
Ability to manage change
Ability to innovate
Teamworking ability
Participative management style
Perception of high quality standards
Perceptions of high standards of customer service
It is also noted that there is a parallel between this culture description and the culture that
may be expected in an organization that has developed dynamic capabilities, for
example, the ability to „Integrate, build, reconfigure‟ (Teece, Pisano et al. (1997); Adner
and Helfat (2003)), „Gain, reconfigure, integrate, release‟ (Eisenhardt and Martin (2000))
and „Modify or create‟ (Winter (2003)).

277
One final area for discussion relates to path-dependency. Researchers have noted that
path dependence is an important concept in the RBV (Dierickx and Cool (1989); Hall
(1991); Hall (1992); DeCarolis and Deeds (1999)). Other research has shown that an
organization‟s advantage through the use of Business Excellence is built over time as the
level of benefit is related to the degree of implementation (e.g., Douglas and Judge
(2001); Tena, Llusar et al. (2001); Przasnyski and Tai (2002); Sureshchandar, Rajendran
et al. (2003); Warwood and Roberts (2004)), and that it is possible to classify
organizations in terms of their level of Business Excellence maturity (Redman, Mathews
et al. (1995); Beheshti and Lollar (2003)). Hendricks and Singhal, and the work of NIST,
suggested that an advantage is not realized until the point when external recognition is
received (e.g., Hendricks and Singhal (1997); NIST (2002b); British_Quality_Foundation
(2003)). It was therefore of interest to see if strategic capability was built over time.
The current research, based on the methodology of Hall but including the views of others,
leads to the conclusion that such strategic capability is built over time, and that the
timeframe was, in general, 2 to 3 years. Hall had previously reported longer replacement
periods, but as noted earlier estimation of the replacement periods was difficult for
respondents and so this reduction in replacement periods may not be significant. If it is
significant, however, it could be argued that the asset is being erroded faster (Dierickx
and Cool (1989); Grant (1991)).
In their work, Hendricks and Singhal took a pre-award implementation period of 5-years,
so the finding from the current research is not at variance with these authors results as
was first expected. Other researchers have also used a 5-year implementation time
period in their studies (e.g., Easton and Jarrell (1998); Sureshchandar, Rajendran et al.
(2003)). The main finding is that the results indicate that building capability is not an
overnight job.
What is interesting is that there is evidence of equifinality in the Business Excellence
literature. Several authors have noted that organizations with similar „world-class‟ levels
may have totally different resource and capability configurations (Seddon (1998); Baxter
and MacLeod (1999); Prabhu and Robson (2000)). This builds another link between
Business Excellence and the development of capabilities, which will be returned to before
the end of the Chapter. In the next section the results are review in the context of
providing further evidence for the concept of dynamic capabilities.

278
5.4 Do dynamic capabilities exist? Authors see dynamic capabilities as key to competitive advantage (Teece, Pisano et al.
(1997)). Others question whether they even exist (Winter (2003)). In the current study
the term „Strategic capability‟ has been chosen to avoid the dynamic capabilities debate,
but a close parallel may be drawn between the two concepts. There is also a third
concept, „Strategic flexibility‟. Strategic flexibility was a term chosen to describe the study
of managing in a turbulent environment. As Hamel and Prahalad stated, strategic
flexibility relates to „new ideas, new theory, new applications, new concepts that are
relevant to a manager facing the new millennium‟ (Hamel, Prahalad et al. (1998: pxv)).
Lindgren (2001) noted that both strategic flexibility and dynamic capabilities fall under the
same general heading of the ability of organizations to manage in turbulent environments.
What is not clear from the literature is how the presence of dynamic capabilities may be
measured, apart from their effect on the performance of the organization that possesses
them and their categorization.
Whatever the term used, the principle of their operation remains the same. Savolainen
(2000a) referred to a „mental buffer‟, the ability of an organization to resist changes in its
environment. The measurement of this „mental buffer‟ borrowed the strategic response
instrument from Lindgren (2001) who examined the relationship between strategic
flexibility and performance, using the Sharma EXCEL performance instrument. Lindgren
reported a strong relationship between the two constructs. The strategic flexibility
instrument challenges the resistance an organization has to change.
The results of the regression in the current study conclude that there was a positive
relationship between strategic capability and performance for the total sample and for
private and public sector organizations individually. The literature review noted that the
area of dynamic capabilities was relatively new and no literature could be found relating
the implications of the resource-based view of the firm on public sector organizations.
This result is therefore a significant contribution to the RBV body of knowledge.
Examining the relationship between strategic capability and the stakeholder groups
showed that the relationship with the Product and Services variate had a poor fit.
Although this may have been expected for the public sector where there is limited product
and service development, it was a surprise not to see the relationship in the private
sector, as many organizations compete with a „New Products‟ strategy (Ansoff (1991);
Johnson and Scholes (2002)). A conclusion could be that measurement of the Products
and Services variate had some limitations (Churchill (1979)). The poor fit on the other

279
stakeholder groups with the public sector sample was explainable. The concept of
growth is more applicable with the private sector, and often public sector organizations
take a view that as they service the community separate CSR measurement has little
relevance.
Eisenhardt and Martin (2000) argued that under highly dynamic conditions an
organization does not have the time to reconfigure its resources. Others noted that the
RBV has a weakness in that the theory does extend to Schumpeterian shocks (e.g.,
Grant (1991); Barney (1995); Priem and Butler (2001)). Several early Baldrige award
winners in the USA have also run into difficulties due to changes in the environment
(Porter and Tanner (2003)). A key question for the current research was whether the
relationship between Strategic Capability and Performance would be affected by the
dynamics of the environment. Support could not be found for this hypothesis, however.
Johnson and Scholes (2002: p1064) defined hypercompetition as occurring „where the
frequency, boldness and aggressiveness of dynamic movements by competitors
accelerate to create a condition of constant disequlibrium and change‟. D‟Aveni stated
that hypercompetition is „an environment characterized by intense and rapid competitive
moves, in which competitors must move quickly to build (new) advantages and erode the
advantages of their rivals‟ (D'Aveni (1994: p217-8)). Thomas and D'Aveni (2004) noted,
however, that there is a growing debate about the very existence of hypercompetition and
their work suggested that its existence might be restricted to manufacturing industries.
The conclusion for the current research is that hypercompetition is a difficult construct to
measure and that it is highly likely that the instrument chosen to operationalize the
dynamics of the environment was not appropriate. This conclusion was supported by
D'Aveni (2004), although he also notes that many organizations are seeking to avoid the
impact of environmental changes (D'Aveni (2002)).
5.5 Contribution to dynamic capability theory This final section combines the findings from the study to present a new framework for
the classification of dynamic capabilities. It also explains the role Business Excellence
may have in contributing to an organization‟s ability to respond to changes in its external
environment.
Many authors have expressed an opinion on how to develop theory. The central theme is
that a phenomenon should be explained (Weber (2003); Remenyi (2004)) and an account
should be given predicting what actions will lead to what results (Christensen and Raynor
(2003); Weber (2003)). Christensen and Raynor (2003) proposed three steps to aid

280
theory construction. In step one a description of the phenomenon under investigation
should be defined. In the current work this phenomenon is dynamic capabilities. Step
two sees the phenomenon being categorized to increase understanding about the
phenomenon. The framework defined below enacts this step. Finally in step three a
hypothesis or hypotheses should predict cause and effect relationships (or laws as
defined by Webber) involving the phenomenon. The hypothesis is that Business
Excellence is a contributor to the development of organizations‟ dynamic capabilities.
Christensen and Raynor (2003) provided a graphical representation of their three steps
(Figure 5-3).
Adapted from Christensen and Raynor (2003)
Figure 5-3: Construction of a theory
In this section, first a quick reminder of the resource-based view of the firm is presented
together with the reasons why the concept of dynamic capabilities was introduced.
Secondly, the arguments for the need for an organization to change are reviewed with
particular reference to Barney‟s „O‟ in his VIRO framework (Barney (2002)). Thirdly, a
framework is suggested, which proposes that dynamic capabilities may be viewed from
both a mechanical process perspective and from a human social system perspective. An
analysis of the various clone resource-based theories and dynamic capability theories is
used to provide support for the framework. Finally, evidence is presented that supports
the role that Business Excellence plays in the framework. The conclusion is that
Formation of a Theory:
A statement of what causeswhat and why
Categorization
Observation and Description of the Phenomenon
Prediction Confirmation
Formation of a Theory:
A statement of what causeswhat and why
Categorization
Observation and Description of the Phenomenon
Prediction Confirmation

281
investing in Business Excellence will lead to the development of organizations‟ dynamic
capabilities.
The emergence of dynamic capabilities as a concept
Penrose‟s theory of the growth of the firm first introduced the notion of the resource-
based view as an alternative to Porter‟s market-based view of the firm (Ferdinand,
Antonacopoulou et al. (2004)). Many authors have criticized the resource-based view as
it does not take into account the business environment (Barney and Zajac (1994);
Henderson and Mitchell (1997); Das, Handfield et al. (2000); Eisenhardt and Martin
(2000); Eisenhardt and Sull (2001); Fiol (2001); Priem and Butler (2001). As noted by
Wernerfelt (1984), they are two sides of a coin.
The resource-based view has been criticized for being static (Lei, Hitt et al. (1996); Priem
and Butler (2001)). Despite the popularity of management solutions such as core
competences (Hamel and Prahalad (1996)), it was realised, to avoid issues such as core
rigidities, the configuration of resources had to change over time (Leonard-Barton
(1992)). Hence came the concept of dynamic capabilities, which have been described as
an evolutionary version of the resource-based view of the firm (Ferdinand,
Antonacopoulou et al. (2004)). Many authors have defined what dynamic capabilities do
for an organization, the common theme being that they reconfigure an organization‟s
resources (see Figure 2-13).
The dynamic nature of Barney’s VIRO framework
In describing his VIRO framework Barney noted that, for an organization to remain
successful, it has to exploit its resources (Barney (2002)). This is represented by the „O‟
in the framework. Termed „complementary resources and capabilities‟, Barney gave
examples of the management control systems, reporting structures and the
compensation systems. Although not designed to engineer change, it is argued that
these systems have a role to play in managing change. Wiklund and Shepherd (2003)
noted that there has been a limited interest in studying the relationship between the „O‟
and „VIR‟ resources in Barney‟s framework and drew a direct comparison with the
manipulation of resources by the organization and the concept of dynamic capabilities. It
is therefore proposed that it is the capabilities embedded in the organization that lead to
the ability of an organization to manage change. This is no an earth-shattering
observation, but it is surprising that Barney and dynamic capabilities are not more closely
linked in the literature.

282
A framework for the classification of resources and dynamic capabilities
It should be remembered that dynamic capabilities remains a concept and there is some
argument if such a phenomenon exists (Eisenhardt and Martin (2000)). Assuming that it
does, there are many views as to where dynamic capabilities are actually rooted. Figure
5-4 proposes a model that may help improve the understanding of the source of dynamic
capability. The model has three layers. The base represents an organization‟s
resources, using Hall‟s classification, with Assets, or things that an organization owns,
and Capabilities, or things that organizations do (Hall (1994)). These resources generate
the advantage in the markets and the assets and capabilities will vary from industry to
industry (Snow and Hrebiniak (1980b); Aaker (1989); Hall (1994)). This is the basis of
the resource-based view of the firm.
Figure 5-4: A dynamic capabilities classification framework
The concept of dynamic capabilities has been divided into two distinct levels: the
mechanistic process level and the social systems level. Both are necessary to deliver
change and in combination provide the ability to manipulate the resources. By way of
support for this classification, various domain definitions of dynamic capabilities have
been examined to see where the authors place their emphasis (Table 5-7). Also included
in the analysis are the resource-based view clones, such as the process-based and
knowledge based view of the firm, as these are also evolutionary ideas. Many authors
have made a strong link between knowledge systems and dynamic capabilities (Wiklund
and Shepherd (2003)).
Several conclusions may be drawn from the analysis in Table 5-7. Firstly, of the theories
analyzed the vast majority have a social element reinforcing the contribution social
systems make to competitive advantage. Secondly, most of the resource-based view
clones, such as the capabilities based view and knowledge-based view, have a dynamic
element supporting the „evolutionary‟ claim. Conversely, some of the theories designed
to tackle the need for change also have a resources element. This just reinforces the
complexity of the situation. Thirdly, the classification framework appears to
DynamicCapabilities
Resources (RBV) Assets and Capabilities
Mechanistic Processes
Social Systems
DeliveringAdvantage
DeliveringChange
DynamicCapabilities
Resources (RBV) Assets and Capabilities
Mechanistic Processes
Social Systems
DeliveringAdvantage
DeliveringChange

283
accommodate the theories proposed by others suggesting that it is a valuable framework.
It may be appropriate to sub-divide the capabilities aspect of resources into process and
social system capabilities, as capabilities include the social systems side of resources.
But this revision is postponed as it only serves to give a minor clarification.

284
Table 5-7: Classification of dynamic capabilities and other resource-based definitions
Dynamic Capability Construct Domains Reference Classification
RBV Dynamic Capabilities
Resources Process Social
Strategic capability: The capability of an enterprise to successfully undertake action
that is intended to affect its long-term growth and development
Lenz (1980)
Skill-based competition: Based on four meta-skills – Learning, Innovating, Skill
categorizing and Embedding
Klein, Edge et al. (1991)
Identity-based view: Human resources and behaviours Fiol (1991)
Dynamic capabilities: Harvest the wellspring of creativity and knowledge among the
company's employees leading to changes in organizational cultures, systems, views
of human resources and investments in upgrading the firm's human capital. Another
way is to use external sources
Zahra (1999)
Capabilities-based competition: A capability is a set of business processes
strategically understood. There is a need to have speed, consistency, acuity, agility
and innovativeness
Stalk, Evans et al. (1992);
Sirkin and Stalk (1995)
Strategic flexibility: Capabilities – these are largely embodied in the collective skills
and knowledge of its people and the organizational procedures that share the way
that employees interact
Hayes and Pisano (1994)

285
Dynamic Capability Construct Domains Reference Classification
RBV Dynamic Capabilities
Resources Process Social
Dynamic core competences: Organizational learning through information transfer and
retrieval, experimentation and dynamic routines
Lei, Hitt et al. (1996)
Dynamic capabilities: Organizational and managerial processes Teece, Pisano et al.
(1997)
Process-view of the firm: Customer relations, capabilities and competences Hatton and Rosenthal
(1999)
Dynamic capabilities: Organizational skills and knowledge, and the cycle of societal
learning
Pitt and Clarke (1999)
Dynamic capabilities: Reside in organizations‟ processes and strategic routines such
as product development, strategic decision-making and alliancing
Eisenhardt and Martin
(2000)
Dynamic capabilities: Micro processes and roles that form the capabilities, the impact
of social imperatives and recombination to constitute new organizational forms
Galunic and Eisenhardt
(2001)
Dynamic capabilities: Emergence of integrative routines D'Adderio (2001)
Knowledge-based theory of the firm: External relationships, internal structures and
individual competence
Sveiby (2001)

286
Dynamic Capability Construct Domains Reference Classification
RBV Dynamic Capabilities
Resources Process Social
Strategic flexibility: Top management, organization and culture, strategic planning
process and strategy
Lindgren (2001)
Developing capabilities and resources: Internal learning, external learning and
proprietary processes & equipment
Schroeder, Bates et al.
(2002)
Dynamic capabilities: Organizational capabilities that are concerned with change.
Organizational capabilities are high-level routines that, together with its implementing
input flows, confer upon an organization's management a set of decision options for
producing significant outputs of a particular type
Winter (2003)
Dynamic Managerial Capabilities: Managers manipulating resources through
decision making
Adner and Helfat (2003)
Dynamic capabilities: Exploration and exploitation through processes Benner and Tushman
(2003)
Dynamic capabilities: Related to trust comprising of capability, goodwill, behaviour
and self-reference. Trust generates a meta-capability
Blomqvist and Seppanen
(2003)

287
Dynamic Capability Construct Domains Reference Classification
Dynamic capabilities: Social capital Blyler and Coff (2003)
Practice-based view: Processes and practices Soderling, Lindhult et al.
(2003)

288
The role of Business Excellence in developing dynamic capability
The idea of the link between Business Excellence and dynamic capabilities was triggered
by the idea of Savolainen‟s „Mental buffer‟ as a result of the embedding of a Business
Excellence philosophy within an organization (Savolainen (1999); Savolainen (2000a)).
In her work, Savolainen did not make the connection herself. In work within the change
management literature, Ulrich and Yeung (1989) noted three critical competences relating
to the need to help individuals focus on organization mind-sets, facilitating strategy
implementation and building change capability. The concept of strategic capability as
defined by Lenz (1980) also related to strategy implementation. In their model, Petrick,
Scherer et al. (1999) made a direct connection between leadership skills and assets
generating capability differentials. All this evidence points towards Business Excellence
functioning as an enabler of change capability.
The EFQM Excellence Model® contains both social and process elements. The quality
ideology aspect has already been mentioned and the work of others provides support for
the other aspects. The information previously provided in Table 5-3 has been
represented in Table 5-8 to show support for the resource-based and dynamic capability
classifications in Table 5-7.
Table 5-8: Classification of Business Excellence construct definitions
Reference Business Excellence Construct
Domains
Classification
Resources Process Social
Curkovic, Melnyk et
al. (2000)
TQM strategic systems
TQM operations systems
TQM information systems
Tena, Llusar et al.
(2001)
Customer focus
Continuous improvement
Employee fulfillment
Organisation as a total system
Rahman (2001) Leadership
Information and analysis
Strategy and planning
Processes, products and service
People
Customer focus

289
There is a host of other evidence supporting the argument that Business Excellence
contributes to the development of dynamic capabilities. In reviewing the challenges for
managers in the 21st century, Prahalad (2000) noted six key elements central to the
changing face of management. Although neither Business Excellence nor dynamic
capabilities were mentioned specifically, in reviewing these six elements the link to both is
extremely close. The elements are:
1. Having a shared competitive agenda
2. Creating a clear charter of values and behaviours and enforcing them without
exception
3. Focusing on influence without ownership – managing relationships rather than
transactions
4. Competing for talent and building the skill mix to retain sources of competitive
advantage
5. Increasing speed by making decisions at the lowest levels
6. Leveraging competitive resources requires that resources are constantly
recombined to address emerging opportunities
Further evidence for a connection comes from Zott (2003), who noted the role that best
practice transfer, which is central to a Business Excellence approach (Porter and Tanner
(1998)), has to play in the re-configuration of resources. Zott (2003) specifically noted the
potential effect of leadership and culture on dynamic capabilities and called for research
in this area.
In discussing how Business Excellence develops distinctive capabilities, Tena, Llusar et
al. (2001: p934) noted that Business Excellence develops assets that are „specific,
produce socially complex relationships, are steeped in the history and culture of the
company and generate tacit knowledge‟. Authors have noted that socially complex
assets and capabilities such as reputation, trust, friendship, teamwork and culture are
more difficult to imitate (e.g., Barney (1995); Ferdinand, Antonacopoulou et al. (2004)).
The fact that Business Excellence is socially complex has also been noted (Briggs and
Keogh (1999)). As stated by Hodgetts, Luthans et al. (1999: p17), „The skills, ideas,
efforts and behaviours of people are inimitatable‟.

290
5.6 Chapter summary The result of the examination of the relationship between Leadership Excellence and
Performance has demonstrated that Leadership Excellence does have a positive
relationship with Performance supporting the benefits of Business Excellence research.
This conclusion is appropriate to both public sector and private sector organizations and it
could not be concluded that Business Excellence has a different level of effect in public
over private organizations. Organization size was found to have weak effect on the
strength of the relationship between Business Excellence and Performance, with the
relationship being slightly stronger with large organizations. Although this result is at
variance with the findings of Hendricks and Signhal, their conclusions were based on
„percentage terms‟ and there is evidence in the literature as to why a stronger relationship
may be observed with large organizations.
Whether the unit was a whole organization or business unit, or whether the organization
operated in a highly dynamic environment did not have an effect on the relationship
between Leadership Excellence and Performance. The first conclusion is at variance
with the NIST results but the reliance of this result has been questioned. In terms of the
dynamics of the industry, the lack of an effect was attributed to instrumentation.
One area that the research did call into question was the benefit of Business Excellence
on all stakeholders. In particular the study could not find a positive relationship between
Business Excellence and Society results. This result is supported by the stakeholder
literature. Related to this, a question mark has been raised over the accuracy of the
weighting's on the results area of the EFQM Excellence Model®.
It was found that strategic assets are built over time, with it taking around 2-3 years to
build the strategic assets and capabilities. This compares favourably with the timescale
researchers have used to monitor Business Excellence implementation. From the
analysis of the sources of sustained organizational advantage it argued that Business
Excellence may be a source of the generation of such advantages.
Strategic Capability, as measured through an organization's ability to react to change,
was positively related to organizational performance as predicted by others (e.g., Teece,
Pisano et al. (1997); Eisenhardt and Martin (2000); Savolainen (2000a); Zott (2003)).
This was the case for both the public and private sector organizations and the result is of
particular interest as the majority of the work on dynamic capabilities is theoretical. The
research could not support the view of Eisenhardt and Martin (2000) that the dynamics of
the environment had an effect, but it was not appreciated how difficult it was to measure

291
highly dynamic conditions when the methodology was designed (D'Aveni (2004); Thomas
and D'Aveni (2004)). Problems measuring the dynamics of the environment have been
noted in other studies. In discussing measures of the envoirnment, Lenz (1980: p213)
noted „this approach to measuring environments is fraught with serious conceptual and
methodological problems‟. That measuring the environment is so difficult was a valuable
learning point from the current study.
There was a positive relationship between Business Excellence, as measured through
Leadership Excellence, and Strategic Capability. This confirms the views of both
Eisenhardt and Martin (2000) who believed that dynamic capabilities could be found in
strategic routines, and Zott (2003) who recognized a relationship between dynamic
capabilities and leadership and culture.
Finally, a framework was developed suggesting the role that Business Excellence might
play in building dynamic capability, which in turn leads to higher performance. This
framework is applicable to both the public and private sector organizations, although it
was noted that the sources of advantage vary between the two sectors.

292
6 Conclusions This Chapter brings the work to a close. In the first section the main academic
contributions of the research are summarized, which includes an outline publication plan.
This is followed by the limitations of the research before proceeding to discuss some
ideas for future research.
The second section addresses the practical nature of the research and three aspects are
considered. Firstly, the outcomes of the research are summarized from a business
perspective, which includes a number of potential business (as opposed to academic)
practical implications for organizations. Secondly, although primarily a positivist
approach was taken for the research, there was a constructivist element beyond the
questionnaire design and results interpretation activities. The researcher had an
influence on the work, mainly due to experience over the past 25 years and some of the
consequences of this are debated. Thirdly, one of the many benefits of a Henley DBA,
and especially one that was been supervised by a member of the International Centre for
Management of Technology (ICMOT), was the practical focus of the work. The last topic
considered is management by research.
In the penultimate section, the learning aspect of the work is discussed, just before we
switch off the light and close the door on the current piece of work.
6.1 Academic implications of the research This section covers the academic implications of the research. First the contributions of
the research are summarized as an extension of the Discussion Chapter. This leads to a
number of themes for potential publications. As with any academic research the
limitations of the research are discussed, which includes reinforcement of the point that,
as the research utilized a self-reporting survey, the relationships observed, such as that
between Business Excellence and Performance, are based on respondents‟ perceptions.
The final area discussed is the area of future research.
6.1.1 Contributions of the research The research has made several valuable contributions covering a number of areas.
Although this was not the intention at the start, it replicated two other studies as well as
adding to the Business Excellence benefits and resource-based view literature. Inclusion
of the public sector in the sample was a contribution in its own right. In this section four
areas are addressed in terms of main contributions from this work. Firstly, the question
as to whether Business Excellence delivers a sustainable organizational advantage is
discussed. This was the main theme of the thesis and deserves to be debated at the end

293
of the work. Secondly, the relationship between Leadership and Performance is tackled.
That evidence for such a relationship is a product of this work is an unexpected major
contribution. Thirdly, the fact that the resource-based view of the firm has been applied
to public sector organizations receives comment. Finally, the contribution to research
methodology is recorded. These main contributions are based on the arguments outlined
in more detail the Discussion Chapter.
6.1.1.1 Does Business Excellence generate a sustainable organizational advantage?
The research contributed to the benefits of Business Excellence research, as it indicated
that Business Excellence, as measured through Leadership Excellence, does indeed
correlate positively with Performance. In the Discussion Chapter, the parallel between
the current research and the works of others (Curkovic, Melnyk et al. (2000); Rahman
(2001); Tena, Llusar et al. (2001); Su, Li et al. (2003)) was drawn. Of particular
importance, the current research is one of a handful of studies that have included
organizations of various sizes and from both the public and private sectors.
It is recognized that the relationship between Business Excellence and Performance, as
measured in the current study, is limited by the use of self-reporting instruments, although
the literature review did identify several other researchers who lived with this limitation. It
was also noted that there were limitations with other research approaches, such as in the
share price research, where the choice of benchmarks had an affect on the final
outcomes.
That there is a relationship between Business Excellence and Performance is of
immense interest. But this does not answer the question set out in the title of this thesis,
which is „How Business Excellence can contribute to sustained organizational
performance in both public and private sector organizations‟. To address this question
this section looks at three aspects of sustainable organizational advantage following the
logic of Hatch and Dyer (2004), who differentiated between generating and sustaining
any advantage. The first aspect is whether Business Excellence can generate an
organizational advantage. The second aspect is whether Business Excellence can
sustain the organizational advantage generated, and the third aspect is how Business
Excellence can help organizations keep their organizational advantages current.
Can Business Excellence generate an organizational advantage?
The question as to whether Business Excellence does confirm a competitive (or
organizational) advantage on an organization is still open to debate. It will be recalled

294
that that there is little theory to underpin the view that Business Excellence leads to a
competitive advantage (Reed, Lemak et al. (2000)), although using the resource-based
view of the firm these researchers did deduce that Business Excellence was capable of
producing a cost-based or differentiation-based advantage. They called for more
research in this area. Yet previous research has suggested that Business Excellence
does not guarantee business success (Powell (1995); Terziovski and Samson (1999);
Eriksson, Johansson et al. (2003)), although it was suggested that the business
environment could be an important factor. Further, a survey of 500 firms using Business
Excellence found that only 36% believed it significantly boosted their competitiveness
(Little (1992)), so whether Business Excellence does create an advantage is not an open
and shut case.
To examine the relationship further, use will be made of Grant‟s „practical framework‟, the
components being the identification and classification of resources, the identification of
capabilities and an appraisal as to whether the resources and capabilities lead to a
competitive advantage (Grant (1991)). In considering the third factor one is reminded of
Barney‟s „O‟ (Barney (2002)). But before entering the discussion two points need to be
raised. Firstly, the current research does not seek to identify an empirical relationship
between the sources of organizational advantage and the generation of the advantage.
Table 5-6 does draw a comparison between the sources of organizational advantage
identified and the Business Excellence critical success factors, but it is recognized that
this evidence is limited. This has been noted as an area for future research below.
Secondly, in separating the resources and capabilities, one can run into tautological
problems (Priem and Butler (2001)), so these are treated together.
In identifying the sources of organizational advantage, the role of people and the social
systems in generating the intangible assets was noted. By classifying the sources of
organizational advantages in a number of ways, it was argued that Business Excellence
might contribute to the generation of organizational advantage. The analysis in Table 5-5
suggests that organizational architecture is the main source of advantage in both public
and private sector organizations. The public sector had no „market factors‟ ranked in their
top 10, with the Organization‟s Reputation coming in at number 11 and Service/ Product/
Brand reputation at number 21. Kay noted that „reputation is not equally important in all
markets‟ (Kay (1998: p87)) indicating that this is not a necessarily a public versus private
sector issue. It was interesting that the Kay classifications of innovation and strategic
assets did not feature highly, which was surprising as innovation is fundamental to a
product development strategy (Porter (1985); Kay (1998); Johnson and Scholes (2002))
and „strategic assets‟ is an often used term in the resource-based view of the firm.

295
The high ranking of reputation in previous work (Aaker (1989); Hall (1992)) and the
current study is significant and its importance supported by other authors (DTI (2001);
Low and Kalufat (2002); Kaplan and Norton (2004)), with relational or marketing capital
also featuring widely (DTI (2001); Sussland (2001); Kristensen and Westlund (2003);
Print (2004)). Day (1994) drew a direct link between Business Excellence and reputation,
with this link being supported by other authors (Hamel (1994); Lemak and Reed (1997);
Easton and Jarrell (1998); Edgeman and Scherer (1999); Edgeman and Rodgers (1999);
Kanji and Sá (2001a)).
So, to summarize, in examining the potential sources of organizational advantage,
Reputation, which has been linked directly with Business Excellence, and People skills
and competences have been identified as two key sources of advantage. The question
to be asked now is „how are these sources of advantage used or built to create the
advantage?‟ To answer this question we turn to Barney who noted that Business
Excellence „can further the development of a series of routines and of a form of behaviour
in the organization, which result from a process of learning and experience within the
company itself‟ (Barney (1991a: p93)). This is interpreted in the same way as other
researchers (Wiklund and Shepherd (2003)) in that Barney was referring to the „O‟ in his
model (Barney (2002)).
An effective strategy builds strategic assets and future strategy must make effective use
of the resources that have been amassed. Many authors have noted the value of
intangible assets, which is the category that both reputation and people skills and
competences fall into. Itami (1987) considered invisible assets to be accumulated in two
ways, either through a direct route where a firm takes explicit actions to achieve the goal,
or an operations route, in which assets are accumulated as by-products of daily
operations. The latter route, which is consistent with the Business Excellence approach,
develops assets that are „specific, produce socially complex relationships, are steeped in
the history and culture of the company and generate tacit knowledge‟ (Tena, Llusar et al.
(2001: p934)). Amit and Schoemaker (1993: p35) also made a distinction between
resources, which are defined as „stocks of available factors that are owned or controlled
by the firm …. converted into final products or services, by using a wide range of other
firm assets‟, and capabilities, which relate to a firm‟s capacity to deploy the resources.
Capabilities are „information-based, tangible or intangible processes that are firm specific
and are developed over time through complex interactions among the firm‟s resources‟.
These correspond to the conditions, which, according to the resource-based view, allow a
sustained competitive advantage (Barney (1991a)).

296
To support this, Carmeli and Tishler (2004) found a relationship between intangibles and
performance in the public sector in Israel. They stated that „the finding that strong
organizational culture is critical to a local authority in achieving an advantageous position
is especially notable‟ (Carmeli and Tishler (2004: p1271)). Blyler and Coff (2003) noted
that, in socially complex systems, such as Business Excellence, the appropriation of the
value generated covers more stakeholders than just the shareholders, which is a
fundamental concept of the EFQM Business Excellence Model® (EFQM (2003)).
In the current study the focus has been on leadership as this was how Business
Excellence was measured. But a „world-class‟ organization, as evaluated through a
comparison with a Business Excellence model, would cover other practices as well as
leadership. It would include strategy formulation and implementation, people
management, management of resources (including intangible resources), and process
management. To take some examples from the literature that indicate that Business
Excellence might create a competitive advantage, Nelson and Winter (1982) proposed
that a key ingredient between resources and capabilities was the ability to get
cooperation and coordination within teams. This requires that an organization motivates
and socializes its members in a manner conducive to the development of smooth running
routines. Wright, Dunford et al. (2001) drew a comparison between the RBV and
Strategic Human Resource Management, noting that RBV had put people on the radar
screen. They noted that a number of RBV concepts proposed as sources of competitive
advantage turn the researchers‟ attention between the intersection of strategy and human
resource issues. These concepts included Culture/ corporate identity, Knowledge,
Learning organizations and Leadership.
Hall (1992) had „culture‟ as one of the four categories of his intangible asset classification
framework. His later work examined culture in greater detail, identifying six aspects to the
culture: Ability to manage change, ability to innovate, team working ability, participative
management style, perception of high quality standards, and perceptions of high
standards of customer service (Hall (1994)). Not only do these provide further support for
the work of Day (1994), they reflect a Business Excellence social system. Haslam (2004)
made reference to the fact that Business Excellence, and other initiatives, has been used
to develop the culture of the organisation. Michie and West (2004) developed a
theoretical model that links the culture of the organization with organizational
performance mediated by employee satisfaction.
In reflecting on the situation, Guillen and Gonzalez stated „leadership seems to be the
key of success in TQM implementation process, it is hard to find sound reasons to justify

297
that TQM cannot be deployed without leadership‟ (Guillen and Gonzalez (2001: p175)).
In considering the different theories of leadership, Business Excellence leadership is a
mixture of transformational and distributed leadership (Bolden (2004)). There is also
some similarity with Ireland and Hitt‟s definition of strategic leadership, which included a
person‟s ability to anticipate, envision, maintain flexibility, think strategically, and work
with others to initiate changes that will create a viable future for the organization (Ireland
and Hitt (1999)). Strategic leadership is distributed amongst employees within the
organizational community.
Nelson and Winter (1982) observed that the organization‟s style, values, traditions and
leadership are critical encouragements to the cooperation and commitment of its
members. That leadership creates competitive advantage was supported by Petrick,
Scherer et al. (1999), who noted that successful corporate leaders, when applying their
global leadership style and substance skills, enhance the intangible assets of corporate
reputation. This provides further evidence for the link between leadership, through is
application in Business Excellence, creating an organizational advantage. All this
evidence begs the question whether there should be a „leadership-view of the firm‟?
Turning to the process side of Business Excellence, many of the evolutionary resource-
based views have similarities with Business Excellence. Stalk, Evans et al. (1992)
referred to „capability-based competition‟ where capabilities are more broadly based than
core competences. Dess and Picken (1999)) supported Stalk, Evans et al. (1992) with
their view that processes are at the centre of the success and talk in terms of the need to
perform a „Strategic Inventory‟ based around Porter‟s value chain. Further, the practice-
based view of Soderling, Lindhult et al. (2003) and the process-based view of Hatton and
Rosenthal (1999) have direct links with Business Excellence. One of the key features of
the process-based view is the „three Cs‟: Customer relations, Capabilities and
Competences, providing yet more support for the views of Day (Day (1990); Day (1994)).
The overall conclusion from this section is that there is evidence that Business
Excellence may generate organizational advantage. This has been argued by reviewing
the social process side of Business Excellence, which includes leadership and culture,
and the process side of Business Excellence.
Can Business Excellence sustain the organizational advantage generated?
Briggs and Keogh (1999) reported organizations that have adopted Business Excellence
continue to struggle to retain their competitive advantage. This may be because

298
advantages generated in this way are not sustainable. In this section the question of
sustainability of organizational advantages that have been generated through Business
Excellence is examined using Grant‟s framework of the four determinants of sustainable
advantage: Durability, transparency, transferability and replicability.
Sveiby (2001) noted that tangible goods tend to depreciate when transferred, but
knowledge grows when it is used and depreciates when not used, so a principle of the
knowledge-based view was to use knowledge transfers to create value. Business
Excellence may be argued to have a similar affect when practices are transferred from
area to area, or even from organization to organization. Despite this, there is an
indication that organizational advantages may be getting less durable. Although the
difficulties in measuring replacement periods is acknowledged, the fact that the
replacement periods in this study are shorter than those from Hall‟s study in 1992 might
be taken as an indication that durability of the advantages is reducing with time.
Transparency is Grant‟s second determinant. Organizations wishing to protect their
advantages tend not to broadcast the details of the resources and capabilities that
underpin them. The formula of Coca Cola is a well-worn example of this. Despite this,
with Business Excellence, organizations often open their doors to share their good
practices, even with competitors. One is reminded of the story of the Japanese showing
Ford Motor Company representatives around their manufacturing plants to provide an
insight on their quality circle approaches. When asked why they did this when Ford was
a direct competitor, one senior manager replied to the effect that they were happy to do
this as „we will show you as we know you will never do this for yourselves‟ (Hutchins
(1990)). He was referring to the cultural differences between Japanese and Americans.
Transparency is hindered by the complexity of the systems. Dierickx and Cool (1989)
proposed that inimitability could be protected due to causal ambiguity and social
complexity, both of which are related to the systems that Business Excellence generates.
In addition, Hatch and Dyer (2004) observed that many of the resources and capabilities
that generate sustainable advantages are either unobservable or extremely difficult to
measure. I show you but you do not see.
Grant‟s third determinant was transferability, and two points may be made. Firstly, staying
with Hatch and Dyer‟s study on the competitive advantage of human capital, they found
that investments in firm-specific human capital, which often leads to an increase in social
complexity, had a significant effect on learning and firm performance (Hatch and Dyer
(2004)). Business Excellence is an example of such an investment. Crucially for the

299
current discussion, they found that acquiring human capital from external sources
significantly reduced learning performance. The inference is that you can buy the people
but you cannot buy in the social systems, hence transferability in this case is difficult.
A second point relates to costs and timing. Zott (2003) argued that performance
differences between firms might occur due to the costs and the differential timing with
which they are used. This view is consistent with that of Argarwal, Sarkar et al. (2002),
who argued that long term survival may depend on timing more than anything else.
The fourth and final determinant of sustainable advantage is replicability, which is seen
as a combination of the previous two determinants. In discussing distinctive capabilities,
which he argued could be generated by Business Excellence, Day (1994) noted that
competitors find them difficult to understand and imitate. He went on to add that theory
would suggest that this is especially true with complex, multistage processes, in which
there is a large amount of tacit knowledge throughout the organization. From her case
study work, Savolainen provided quotations from interviewees reinforcing the inimitatible
nature of Business Excellence, „it's a competitive advantage that cannot be copied or
stolen, it must be accomplished and earned through your own efforts‟ (Savolainen
(2000b:p 202)).
Can Business Excellence help organizations keep their organizational advantages
current?
So far we have examined whether there is a case for Business Excellence generating a
competitive advantage and, if this is the case, whether such an advantage would be
sustainable. The answer to the first question is that, within the limitations of the research,
there is an indication that Business Excellence may have an impact on both the social
system and the practices. Further, the previous section suggested that the complexity of
such advantages made them sustainable. Both of these relate to the static nature of
sustainable advantages. The static nature of the resource-based view has been criticized
(Leonard-Barton (1992); Lei, Hitt et al. (1996); Priem and Butler (2001)).
In this section, a third question regarding competitive advantage is examined. This is
whether Business Excellence has an impact on organizations‟ ability to develop
advantages in line with its changing environment. This is the dynamic nature of the
sustainable advantages. As noted earlier, the body of knowledge on dynamic capabilities
is fast developing and the results of this research make an important contribution to this
area of theory. Other researchers have been searching for the sources of dynamic

300
capabilities and this has proved to be challenging. For example, qualitative work by
Easterly-Smith suggested that the actual causes of dynamic capability are different from
those identified by organizations (Easterby-Smith (2004)).
There is evidence supporting the argument that Business Excellence contributes to the
development of dynamic capabilities. It will be recalled that, in reviewing the challenges
for managers in the 21st century, Prahalad (2000) noted six key elements central to the
changing face of management. Although neither Business Excellence nor dynamic
capabilities were mentioned specifically, in reviewing these six elements the link to both is
extremely close. Itami (1987)) argued that a characteristic of successful organizations is
the recognition that there is a learning process that runs in parallel with all operations that
enhances intangible assets. Learning is a key component of the EFQM Business
Excellence model®.
Quality circles, a basic Business Excellence approach, may be used to facilitate
organizational development (Furnham (1997)). Day (1994) made a direct link between
Business Excellence and changing capabilities, noting that Business Excellence supports
a market-driven organization and that top-down direction and commitment was important
for this to succeed. Business Excellence also allows for both the company's adaptation
to its environment and the deployment of leadership abilities through the articulation and
communication of a shared vision (Webley and Cartright (1996)).
Here we are particularly interested in leadership‟s impact on change, as Business
Excellence is measured through leadership in the current study. Eisenbach, Watson et
al. (1999) noted the importance of leadership to change management, and Ireland and
Hitt (1999) included a reference to change when constructing their definition of strategic
leadership. Higgs (2002) noted that it has been estimated that up to 70% of change
initiatives fail and that there is a driving need for leadership behaviours which result in
effective change implementation.
Managing volatility in the environment will be a major challenge for managers in the
future (Prahalad (2000)), and Jones (2004) argued that high-performing leaders respond
to change faster, deal with ambiguity, provide direction, manage constraints and leverage
the intellectual capital of the people surrounding them. Rosenbloom (2000) suggested
leadership by individuals may be a „central element‟ in the more general dynamic
capability of an organization to change, but it is of interest that Cockerill (1993) found that
management competence has a greater influence on performance in dynamic
environments than in static environments, implying leadership is not so crucial in times of

301
stability. This finding reinforces the importance of leadership and also may explain why
the Environment Dynamics had a positive effect on the Leadership Excellence and
Performance relationship, as opposed to the negative relationship expected.
In considering the effect of leadership in relation to dynamic capabilities, the model
displayed in Figure 5-4 suggests that leadership will have both a process perspective and
a social perspective. Grint (2004) described the complexity of leadership, recognising
that there is a tension between the process perspective of leadership and the social
perspective when trying to define leadership. Several other authors supported that there
are two perspectives. In describing skills Klein, Edge et al. (1991) referred to the hard
factors such as equipment and facilities, and to the soft factors such as the organisation
culture. They argued that both are necessary to develop skills in an organization.
Further, Higgs and Rowland (2001) considered that organizations had to tackle change
from a fundamental perspective, for example changing the culture or identity, and from a
capacity perspective, which is more aligned to processes. A third example comes from
the work of Ethiraj, Kale et al. (2005) who, in studying software services and projects,
found two types of capability. The first was client-specific, built through interactions with
clients over time through learning, and the second, project management capabilities,
which were related to specific projects. The first of these relates to the social perspective
and the latter to the process perspective.
Taking the process perspective, Lenz (1980) introduced „strategic capability‟, which is the
concept of the capability to undertake strategic action. The main theme is the process of
strategy implementation and it is linked to resources such as financial, physical, human,
organisational and technological. More recently, Bowman, James et al. (2004) revisited
this area, with their work drawing parallels with Business Excellence as it calls for the use
of a vision and the need for leaders to inspire their followers.
Turning to the social perspective, the work of Savolainen has been mentioned several
times and, in particular, her conclusion that the advantageous embedding of a quality
management ideology began to dislodge the assumptions and beliefs of the established
management paradigm (Savolainen (2000a)). Ulrich and Yeung (1989) supported the
need for a shared mindset, noting that critical competencies helped to focus individual
attention on organizational mind-sets; facilitated strategy implementation; and built
change capability. A third example of this perspective comes from Adner and Helfat
(2003), who proposed that dynamic managerial capabilities were rooted in three
underlying factors: Managerial human capital, managerial social capital and managerial
cognition.

302
6.1.1.2 Relationship between Leadership and Organizational Performance This research contributes to the Leadership body of knowledge, as Leadership is used as
the measure of Business Excellence. One of the assumptions prior to the research was
that Leadership would have a well-proven relationship with Performance. Some evidence
for this relationship was found in the work of Prabhu and Robson (2000) who used the
PILOT instrument, and the work of Sá and Kanji (Kanji and Sá (2001a); Sá and Kanji
(2003)). But the value of the evidence of a relationship between Leadership and
Performance was only fully appreciated following a question from the floor during a
presentation on the current research at the 2004 Leadership Refrains conference held at
the University of Exeter (Tanner (2004j)). The question was somewhat rhetorical, as the
participant stated that there was no evidence in the literature of a relationship between
Leadership and Organizational Performance. The question at the conference sparked a
search of the literature and although some evidence was found, this was not as abundant
as first expected.
Using an experimental design, Shea (1999) compared the effect of a charismatic
leadership style with both structuring and considerate leadership styles. The hypothesis
was that leaders who display charismatic leadership behaviours would provide followers
with clear visions of the future, expressing high expectations for follower performance,
and displaying confidence in their followers‟ ability to accomplish challenging tasks. Shea
(1999) cited House (1988) and Bass (1990), noting that leadership research had
consistently found a strong positive relationship between charismatic leadership
behaviours and follower performance.
The results found that that considerate leaders outperformed charismatic leaders at the
start of the experiment, but the performance of the charismatic leaders‟ group caught up
after the first two cycles. The group, led by the structuring leader, consistently under
performed in relation to the other two groups. Shea (1999) concluded that the findings
were consistent with prior research where participants working under structuring leaders
never outperformed those working under considerate or charismatic leaders, and they
performed significantly worse at the outset.
It is noted that the Shea (1999) research focused on follower performance, whereas the
current research is concerned with organizational performance. In this area, Waldman,
Ramirez et al. (2001) surveyed 48 of the Fortune 500 firms, taking a cross-section of
firms from different industries. Senior managers were selected for the questionnaire and
the objective was to secure two returns per firm. Transactional and charismatic

303
leadership were measured using items from the Multifactor Leadership Questionnaire
(MLQ), this being the only instrument that assesses both. Perceived environmental
uncertainty was measured using four items from an instrument developed by Khandwalla
(1976). Organisational performance was measured as Net Profit Margin (NPM),
computed as net income divided by net sales. Data for this was obtained from the
COMPUSTAT database.
The results showed that, after controlling for organisational size (total assets), CEO
tenure and 1989 performance neither transactional leadership nor charisma predicted
significant variance on performance. There was evidence that perceived environmental
uncertainty had a moderating effect on the relationship between CEO Charisma and
corrected NPM (Waldman, Ramirez et al. (2001)).
Burgoyne, Hirsh et al. (2004) developed a model linking the development of leadership
and management development with leadership and management competences, which in
turn is linked to performance. They noted a lack of research to provide support for the
leadership and management competences and organizational performance relationship,
citing just three studies. Rucci, Kirm et al. (1998) studied 800 Sears stores in the US and
found employee attitudes towards their jobs and employer to be positively linked to
customer attitudes and business results. Barber, Hayday et al. (1999) conducted a
similar study of 100 stores of a major UK retailer and found employee satisfaction and
commitment to be positively related to increased sales. In both studies the quality of line
management (as perceived by staff) was an important link in the chain between capability
and organisational performance via its impact on employee commitment and motivation.
Finally, Burgoyne, Hirsh et al. (2004) reported on a longitudinal study that concluded that
none of a number of tools and techniques had a direct causal relationship to superior
performance. What did make a difference was having a clear grasp of management and
leadership practices (Nohria, Joyce et al. (2003)).
In conclusion, the current research provides evidence of a relationship between
Leadership and Organizational Performance. That there appears to be very limited
evidence to support such a relationship does cause some concern, and it must be
remembered that the current research has based its findings on self-reported data so the
relationship is based on respondents‟ perceptions.
6.1.1.3 Public sector organizations and the resource-based view (RBV) of the firm „Studies applying the core concepts of the RBV in testing the effect of strategic elements
on the performance of public sector organizations are rare‟ (Carmeli and Tishler (2004:

304
p1258)). It was surprising that the application of the RBV theory has not been further
developed in the literature, with many authors avoiding the debate. This may be due to
the close links between the concept of sustainable competitive advantage (which is
somewhat under attack as a concept (e.g., Fiol (2001); Powell (2001)) and the generation
of economic rents (Grant (1991); Peteraf (1993)), which is a concept that is not so easily
applicable to public sector organizations. It is suggested that the resource-based view of
the firm may be an appropriate approach for public sector strategy formulation in support
of the argument of Makhija (2003). Of interest is that two recognized public sector
strategy books by Bryson (1995) and Johnson and Scholes (2001) do not mention the
RBV. In addition, a search of „Public‟ and „Resource‟ as words in the title field of EBSCO
did not identify any literature. Grant (2004a) confirmed that the application of the RBV to
the public sector was an under-developed area of theory.
6.1.1.4 Development of instruments The research makes a contribution in the area of research methodology. On the positive
side, some new instruments have been developed for use in public sector research, in
particular the Performance and Strategic Capability instruments. The research also
refines the Leadership Excellence instrument and applies this instrument in an English
context, as opposed to the original Portuguese context (Sá (2004)).
On the negative side, the research has reinforced the difficulty in measuring highly
dynamic environments

305
6.1.2 Potential publication themes From the contributions a number of themes for potential publications have been
identified. These are given, together with the relevant body of knowledge areas where
these papers might be placed, in Table 6-1
Table 6-1: Potential themes for publications and relevant bodies of knowledge
Theme Target Body of knowledge
Business Excellence and performance TQM/ Business Excellence
Business Excellence and performance in the
public sector
Public sector
The RBV and its application to the public
sector
Public sector
Strategy
Strategic/ dynamic capability/ and
performance
Strategy
Sources of advantage Strategy
Operational and financial reporting Performance measurement
Leadership and performance Leadership
Business excellence developing strategic/
dynamic capability
TQM/ Business Excellence
Strategy
Leadership and strategic capability
relationship
Strategy
Leadership
Strategic/ dynamic capability model Strategy
6.1.3 Limitations of the research Several limitations were noted in the approach taken in conducting the research. Each of
these will be discussed briefly.
6.1.3.1 Reliance of self-reported instruments One of the conclusions from the research methodology literature was that self-reported
instruments are commonly used in research. Many researchers have pointed out the
limitations of their use, however. For example, Easton and Jarrell (1998) noted problems
with self-reporting questionnaires in that respondents see the questions differently and
that there is no critical evaluation of the response. Huber and Power (1985) expressed

306
four main concerns with such instruments in relation to data inaccuracy and bias. They
noted that often respondents are motivated to provide inaccurate data when it suits there
needs, that their perceptual and cognitive limitations result in inadvertent errors, they may
lack crucial information about the event of interest when giving a response, and they have
been questioned with an inappropriate data elicitation procedure.
That the method for collecting affects the results was concluded by Miller and Cardinal
(1994). In reviewing the results of 26 previous studies examining the strategic planning
and performance relationship, they concluded that self-reporting instruments gave more
reliable results than by using archival data.
The main observation is that the use of self-reported scales imparts a limitation on the
research, and as such, the results must be treated with some caution. The conclusions
drawn in the study are based on the existence of relationships dependent on the
perceptions of the respondents, and not true cause and effect relationships.
6.1.3.2 Key informant problems As with any use of self-reported instruments (Downey, Hellriegel et al. (1975); Downey
and Slocum (1975); Huber and Power (1985); Bourgeois and Eisenhardt (1988); James
and Hatton (1995); Dess, Lumpkin et al. (1997); Curkovic, Melnyk et al. (2000); Kanji and
Sá (2001a)), there is always a concern over the accuracy of the responses. In the
current research care was taken to record the level of respondent so that any potential
differences could be isolated, but running the regressions indicated that this was not
having a major effect on the models. Such distortion of the data remains a concern,
however.
6.1.3.3 Violation of the multivariate data assumptions A limitation related to the normality of the data. One of the challenges in the current
research was the desire to collect a sample from both public and private sector
organizations and this required collection of data from different sources. It is believed this
led to a sample that did not demonstrate normality in all circumstances. As mentioned in
the text, although the data met the normality tests of + or – 1 on skewness and + or – 3
on kurtosis (Hair, Anderson et al. (1998)), in some circumstances the critical ratio did not
meet the + or - 1.96 requirement (Sharma (1996)). Hair and colleagues did note,
however, that most multivariate techniques are very tolerant to non-normal data (Hair,
Anderson et al. (1998); Hair, Babin et al. (2003)). Sharma (1996) noted that an effect of
using non-normal data is that it can over, or under, estimate the statistical significance
tests. Precaution was taken by removing the outliers, which produced a dataset where

307
most of the variates had statistically significant Kolmogorov-Smirnov test results.
Running the regression models with this revised data set did not effect the conclusions
drawn, although it did improve the fit of the models.
6.1.3.4 Mixed factor structures Hair advised that when using a mixed sample where there is an expected difference in
the responses from different respondents, such as male and female respondents, the
factor analysis should be applied to the separate groups to examine the differences (Hair,
Anderson et al. (1998)). There are three issues to consider on this point. Firstly, Hair‟s
advice relates to when different loadings of the factors are expected and in the current
research great care was taken in adapting the instruments for use in the public sector so
no such difference was expected.
Secondly, running the exploratory factor analysis on a split public sector/ private sector
gave different factors, particularly on lower loading items. This may have been an impact
of different factor structures, but by splitting the sample the sample size was decreased
and this in itself would have had an effect on the results (Hair, Anderson et al. (1998)).
Thirdly, the factor analysis was being conducted to look at the structure of the data, and
not to simplify the data (Hair, Anderson et al. (1998)). In the final analysis the decision
was taken to develop the factors on the total sample, but it is accepted that this may have
had an impact on results.
There was an intention to use confirmatory factor analysis using SEM to test the factor
structures (Hoyle (1995)), but given the difficulties in running the structural equation
models, especially on small samples, this proved not to be possible.
6.1.3.5 Muticollinearity between variables in multivariate regression models The research called for the testing of the moderating effect of several metric variables,
including organization size and Environmental Dynamics. Under ideal circumstances
when testing for moderating variables, there will be no correlation between the interaction
variable and the predictor variables (Baron and Kenny (1986)), but this was not found to
be the case in the current research. As a consequence, although the interaction variable
was statistically significant, the presence of a moderating variable could not be confirmed
due to the high multicollinearity.
6.1.3.6 Reliance on Leadership Excellence to operationalize Business Excellence A limitation was the assumption that the Leadership Excellence instrument was an
accurate operationalization of the Business Excellence construct. Although comparisons

308
were drawn between high Leadership Excellence scores and high levels of Business
Excellence (Dess, Lumpkin et al. (1997); Kanji and Sá (2001a); Kanji (2002)), it is
recognized that these comparisons were limited to Portuguese organizations. In addition,
more recent research has suggested that Business Excellence cannot be treated as a
single construct but must be considered as a system (Reed, Lemak et al. (2000); Sun
(2000)).
6.1.3.7 Generalizability Previous studies that have based their sample on award winners or membership lists
have been subject to bias, which, in turn, has had an impact on generalizability (e.g.,
GAO (1991); ECforBE (1999); Bauer (2002); Su, Li et al. (2003)). This study tried to
avoid this problem by working from industry contact lists and by using a partially
disguised questionnaire (Churchill and Iacobucci (2002)). In addition, a selection of
different industries was chosen from which to draw the sample. Despite these efforts the
variation in response rate from the various sources caused concern and, although a
source code was used to test for non-response bias and no such bias was detected,
there may have been a risk to generalizability caused through the sample.
6.1.3.8 Measurement issues Instrumentation was a potential problem with the Environmental Dynamics construct and
the society stakeholder performance scale. In making this statement it is assumed that
the underlying theory was correct and the lack of a relationship was due to construct
validity. Churchill and Iacobucci (2002) noted that content validity may be threatened
when either the items reflecting any of the hypothesized domains are omitted, the
aggregate score disproportionately reflects one domain over another; or the instrument is
difficult to follow for respondents. Given the use of the experts and focus groups to
develop the scales, content validity should not have been a concern. On reflection, the
use of multi-trait multi-method matrix may have improved the instrumentation (Churchill
(1979)).
Due to the problems associated with measuring highly dynamic environments, the
research was unable to test the hypothesis related to the effect of such environments
conclusively. This may have been due to measurement issues, but it might have also
been due to sampling. If no, or only a few, organizations in the sample were operating in
hyper competitive conditions the detection of an effect would have been difficult. In
effect, a type 2 error would have occurred (Saunders, Lewis et al. (2003)). That the
environment did not have an effect on the relationships between Leadership Excellence
and Performance, and Strategic Capability and Performance, should be treated with
caution as it is at variance with theory and is counter-intuitive.

309
6.1.3.9 Difficulty in estimating replacement periods A final limitation to note concerned the collection of the data on replacement periods.
During the questionnaire design it was noted that respondents struggled with Part 3,
which related to the sources of organizational advantage. Despite simplification there
was a high level of non-responses in this section of the questionnaire, and so the
percentages were calculated based on a pair wise basis where the results were corrected
by removing item non-responses. An analysis ignoring missing responses (treating the
number of responses as a constant N=193) and a case wise approach where the case
was removed from the sample did not have a major effect on the results. The
consequences of the missing data in terms of generalizability was appreciated, however
(Hair, Anderson et al. (1998)).
In discussing the results with Richard Hall, it was noted that Richard did not have a major
problem with non-responses. His questionnaire provided more support to the respondent
and requested that the respondent rated the source of advantage, which may also have
helped. Richard did, however, find that respondents had a problem estimating the
replacement period, as with the current study.
6.1.4 Future research As with other research, the current study raises a number of questions that future
research could address. Some of these address the issues raised in the limitations
section.
6.1.4.1 Searching for empirical evidence that Business Excellence generates sustainable organizational advantage
Due to the design of the research, the questionnaire did not include a section to identify
whether or not respondents perceived that the sustainable organizational advantages
they identified were as a direct result of their leadership practices. Above it has been
argued that Business Excellence might generate such advantages, but it would be
valuable to collect empirical evidence to support this hypothesis.
6.1.4.2 Widening the domain of the Business Excellence construct The current study used Leadership Excellence as a measure of Business Excellence. It
would be valuable to repeat the research, only expanding the scope of the Business
Excellence construct to include other factors, such as People and Process Management.
It would also be valuable to measure Business Excellence in a more traditional way, such
as through a self-assessment score (Longbottom (1998); EFQM (1999b); Bauer (2002);
Porter and Tanner (2003)) or through the receipt of external recognition (e.g., Hendricks
and Singhal (2001b); Przasnyski and Tai (2002); NIST (2002b)).

310
6.1.4.3 Examining the relationships between the stakeholder groups Related to the structure of the Business Excellence models, more work could be
conducted looking at the relationships between the various stakeholder performance
areas. In the current research the use of canonical analysis was considered as a way of
examining the relationships, but this was considered outside the scope of the current
research. It should also be possible to use SEM to look at the potential causal paths.
Several authors have provided evidence that such a relationship exists (Das, Handfield et
al. (2000); Eskildsen and Nussler (2000); Oakland and Oakland (2001); Rahman (2001);
Agus (2004); Michie and West (2004)).
6.1.4.4 Replication of the entire Leadership Excellence instrument The Leadership Excellence instrument appears to be a valuable instrument but it is not
without its problems. Further work could be conducted on the Leadership Excellence
instrument and, in particular, the correlation of the instrument to levels of Business
Excellence in different industries. It has also already been noted that the data collected
did not factor as expected and so there is the potential to develop this instrument further.
The original instrument was developed using a Partial Least Squares approach and this
is known to be more tolerant than SEM.
6.1.4.5 Continued search for hyper competitive environments The current research was unable to show that the dynamics of the industry had an effect
on the relationship between Strategic Capability and Performance. Such an effect was
predicted by Eisenhardt and Martin (2000) and so this aspect of the research could be
repeated. The full effect of the business environment on the Business Excellence and
Performance relationship also remains untested. Authors suggested that such an effect
should be observable (Das, Handfield et al. (2000); Eisenhardt and Martin (2000); Fiol
(2001); Leonard, McAdam et al. (2002); Dervitsiotis (2004); Jones (2004)).
6.1.4.6 Extension of industry segmentation It would be interesting to extend the industry classifications beyond the simple Public/
Private classification to see if the relationships are affected by different industries, for
example, manufacturing and services. The Business Excellence literature (Terziovski
and Samson (1999)) and resource-based view literature (Aaker (1989); Hall (1994))
indicated that this may be the case.
6.1.4.7 Longitudinal study to seek support for causal relationships Many researchers have noted the limitations of cross-sectional research and have called
for longitudinal studies to be conducted (Henderson and Mitchell (1997); Bowen and
Wiersema (1999); Barney, Wright et al. (2001); Priem and Butler (2001); Leonard,

311
McAdam et al. (2002); Leonard and McAdam (2002b)). Repeating the research after a
time period, for example 2-3 years, may lead to the collection of evidence to support the
theory that an increase in Leadership Excellence leads to an increase in Performance.
6.1.4.8 Validation of dynamic capabilities classification framework The information given in Table 5-7 demonstrates the wide range of views on the sources
of dynamic capabilities. The classification framework may go someway to aiding the
understanding in this area and it opens up a range of opportunities for further research.
For example, it would be of interest to collect more detailed information through case
studies in a number of organizations in order to expand the classification model to
expand the framework to one such as Hall‟s or Kay‟s. A longitudinal study would also
examine how the balance between the two dynamic capability categories has changed
over time.
6.1.4.9 Further work on the Leadership and Performance relationship The research has added to the debate regarding the relationship between Leadership
and Organizational Performance. Clearly there is a need for more work in this area.
6.2 Practical aspects of the work This section addresses the practical aspects of the work. Firstly, the implications for
organizations are summarized, which reviews the outcomes of the research from a
business perspective. This section includes a number of potential business publication
opportunities that may be pursued now that the work has reached completion. Secondly,
the role of the researcher in the work is discussed. It could be argued that the researcher
had a vested interest in the outcomes of the work and it is important to reinforce that this
was not the case. Being involved in the Business Excellence field did, however, have a
number of advantages. Finally, the nature of the work is discussed using Eden and
Huxham‟s framework, as cited by Joynt (2004).
6.2.1 Practical implications for organizations In considering Business Excellence one is reminded of Christensen‟s visit to the doctor:
„The doctor writes out a prescription and says, “Take two of these three times a
day, and call me next week”. “But – I haven‟t told you what‟s wrong.” came the
reply, “How will I know it will help me?” “Why wouldn‟t it?” says the doctor, “It
worked for my last two patients”‟.
Christensen and Raynor (2003: p67)

312
It is difficult to imagine Business Excellence as a form of „snake oil‟ that cures all troubles,
but the overall conclusion from this research in a practical context is that Business
Excellence „Does what it says on the tin‟, borrowing from a popular UK TV advertisement.
It would appear that Business Excellence, as measured through the Leadership
Excellence instrument, is a valuable intervention for all the sorts of organizations included
in the sample: Various sizes, both public and private sector, whether implemented by an
entire organization or just a business unit. This was not expected at the start of the
research, but it will be a welcome conclusion for the Business Excellence industry.
The research also suggests to organizations why Business Excellence is of value.
Implementing Business Excellence enables an organization to reconfigure its resources
more easily under the changing condition, a situation that most, if not all, organizations
face. The only caveat with this conclusion is that it is suspected that the environmental
effect was not detected due to the instrumentation used or sample chosen. It is still
suspected that the environment will have an effect on the relationship between Business
Excellence and Performance, supporting the view of Dervitsiotis (2004)
This ability to reconfigure resources is based on the affect Business Excellence has on
the social systems within the organization, as well as introducing alternative approaches
that are both effective and efficient. There is a wealth of literature from practioners that
supports this conclusion, including the work of Deming, Juran, Crosby, Oakland, as well
as from the award bodies such as EFQM and NIST.
So why are the findings important for organizations? Firstly, mention has already been
made of the money that is being invested in implementing Business Excellence
throughout the world (e.g., PriceWaterhouseCoopers (2000)). The fact that Business
Excellence repays the investment and that it takes around 2 to 3 years to develop the
capability are key messages from the research. Organizations need to understand that
Business Excellence will not bring overnight success, but what it will do is increase
capability over time.
Secondly, in reflecting on the major challenges facing managers in the 21st century,
Prahalad (2000) argued that managing change in fast-moving environments would be a
major challenge. The framework developed will not only increase our theoretical
understanding of dynamic capabilities, it will be of practical benefit to organizations
seeking to invest in developing such capability. The framework suggests that
organizations must invest in both their hard and soft systems if they are to manage such
change.

313
Another area of practical contribution relates to the value of people as an asset. In the
UK the Government has, as part of their Modernizing Government agenda, taken it upon
themselves to demand a reduction in headcount following various reviews such as the
Gresohn Spending Review, the Lyons 'Well Placed to Deliver' independent review of
Public sector Relocation and the O'Donnell report, „Financing Britain's Future - A review
of the Revenue Departments‟. Given that people were found to be the greatest source of
organizational advantage, this research provides the insight that such programmes could
have a negative effect on the level of public service provided. In fact, as this thesis was
being written, the troubles of British Airways were being reported in the press where a
lack of experienced staff was leading to a number of cancelled flights, and as a
consequence British Airway‟s reputation, a market asset, was being damaged.
One further practical implication centres on the support for the Leadership and
Performance relationship. A report by the Council for Excellence in Management and
Leadership report (CEML (2002)) raised the issue over the quality of leadership in the
UK. This led to the UK Government pledging to address the national leadership and
leadership deficit through a range of initiatives to increase demand and improve supply of
management and leadership development (DfES (2002)). Given the observation by
Burgoyne regarding the availability of empirical evidence to support a Leadership and
Performance relationship (Burgoyne, Hirsh et al. (2004)), the current work has important
practical implications.
6.2.2 Role of the researcher As mentioned in the introduction, my interest in the subject stems from my involvement in
the quality field for the last 25 years. A positivist approach was chosen due to its more
common use in the Business Excellence field and to the nature of the research question,
which was to seek support for particular relationships. But, as noted by Weber (2004),
the difference between a positivist and interpretive approach comes down to a choice of
research method as opposed to a difference in metatheoretical assumptions.
Weber (2004) also noted that with an interpretive approach, the researcher must be
aware of any bias and, as this research contained some interpretive elements involving
focus groups, it is relevant to declare these biases. Acting as an assessor for both the
European and UK Quality Awards, I have observed many organizations that thought they
were „world-class‟ but their results and approaches indicated otherwise. Based on my
experience I have also helped three organizations win awards by advising them on „how
to play the game‟. I therefore went into this research with a preconception that a model
that had been socially constructed mainly by large private sector organizations would not

314
be generalizable to other organizations such as the public sector and SMEs, but that view
has now changed.
I also held the view that, under conditions of dramatic change, Business Excellence
would not be the answer to an organization‟s problems. This view was informed by my
observation that many organizations abandon their quality approach when times get
tough. This view is supported by the literature (MacLeod and Baxter (2001); Dervitsiotis
(2004)). Although the current research has not provided evidence to support this view, it
remains a view that I hold and it is supported by the dynamic capabilities literature (e.g.,
Eisenhardt and Martin (2000)). What has come out of this research is that Business
Excellence inoculates organizations from the effects of environmental change, which
provides an insight into how Business Excellence may be effective by embedding a
quality ideology.
My level of activity in the quality networks has helped me with the research, as it allowed
me to use snowballing as a way to collect my sample (Moser and Kalton (1971)). It was
notable that the response rate from the networks was much higher than the „cold-calling‟
approach when an unsolicited letter was used to gain a response. This may have
introduced some bias and so, as mentioned under limitations, a test of means was
conducted to see if the source of the response led to means that were statistically
significantly different. This analysis was complicated by the fact that many of the other
categories, such as public Vs private and level of leadership, were having an effect. But
an ANOVA test and LSD post-hoc analysis showed that only responses from the Local
Council Municipal Yearbook list for the Environment Dynamics variate, and the
OneSource Industry leads on the Strategic Capability variate, were significantly different
at the 0.05 level. It was, therefore, concluded that the source of the response was not a
major concern.
The quality networks introduced an interesting insight as the work drew to a close. The
European Foundation for Quality management has been reviewing the fundumental
concepts of Excellence and are proposing the introduction of an eleventh fundumantal
concept, „Responding with agility‟ (Goasdoé (2005)). Such a fundumetnal conept reflects
the main theme of this thesis.
Being actively involved in the quality networks has other advantages. Already the early
results from the work have been shared at quality conferences and in magazine articles
(Tanner (2004d); Tanner (2004e); Tanner and Oakland (2004f); Tanner and Oakland

315
(2004g)). Now that the research has been completed dissemination of the results in
layperson‟s language will be continued to share the findings with practioners.
6.2.3 Management by research results The Henley DBA programme commenced in 1992 and since then there have been over
100 DBA graduates. In 1995 the International Centre for Management and Technology
(ICMOT) was formed, with a primary mission of Management by Research Results
(MBRR) and since that time they have been actively supporting the Henley DBA
programme. In considering past research from an action research perspective, Joynt
(2004) analyzed eight abstracts using Eden and Huxham‟s framework (Eden and
Huxham (1996)), considering the issues of generalizability and validity. Table 6-2 builds
on this analysis by considering the current work in the light of Joynt‟s reflections.
It is recognized that one cannot classify the current work as action research, as no
intervention has been applied to a single organization or organizations (Denscombe
(1998)). Yet a key objective of the work was to provide insights that would be of value to
organizations through an intervention. The analysis shown in Table 6-2 indicates that the
current work meets the requirements of Eden and Huxham‟s framework in many
respects, supporting the conclusions of Joynt.

316
Table 6-2: Comparison of current work with Eden and Huxham's framework
Action Research Characteristic Reflection
Action research demands an integral involvement by the researcher in an intent to
change the organization. This intent may not succeed - no change may take place as a
result of the intervention - and the change may not be as intended.
The intent to change the organization related to the adoption of
Business Excellence as a way to improve organizational
performance. The conclusion is that such an intervention is likely to
lead to benefits for an organization.
Action research must have some implications beyond those required for action or
generation of knowledge in the domain of the project. It must be possible to envisage
talking about the theories developed in relation to other situations. Thus, it must be
clear that the results could inform other contexts, at least in the sense of suggesting
areas for consideration.
As concluded by Joynt, this is a strong characteristic of the work.
As well as being usable in everyday life, action research demands valuing theory, with
theory elaboration and development as an explicit concern of the research process.
This is one of the essential ingredients in DBA work.
As concluded by Joynt, this is a strong characteristic of the work.
If the generality drawn out of the action research is to be expressed through the design
of tools, techniques, models and method, then this, alone, is not enough; the basis for
their design must be explicit and shown to be related to the theories which inform the
design and which, in turn, are supported or developed through action research.
Although the EFQM Excellence Model® was at the centre of the
research, the research made use of a number of other models and
methods. A particular strength was that these models were tested
in the real world.
Action research will be concerned with a system of emergent theory, in which the
theory develops from a synthesis of that which emerges from the use in practice of the
body of theory which informed the intervention and research intent.
The emergent theory in the current theory in the current work is that
of both Business Excellence and dynamic capabilities. The results
of this research contribute to both bodies of knowledge.

317
Action Research Characteristic Reflection
Theory building, as a result of action research, will be incremental, moving through a
cycle of developing theory-to-reflection-to-developing theory from the particular to the
general in small steps.
As concluded by Joynt, this is a characteristic of the work, with the
research adding its „grain of sand‟.
What is important for action research is not a (false) dichotomy between prescription
and description, but a recognition that description will be prescription, even if implicitly
so. Thus, presenters of action research should be clear about what they expect the
consumer to take from it and present it with a form and style appropriate to this aim.
The current work embraces negative hypothesis testing in the main.
This was a similar conclusion drawn by Joynt.
For good quality action research, a high degree of systematic method and orderliness
is required in reflecting about, and holding on to, the research data and the emergent
theoretical outcomes of each episode or cycle of involvement in the organization.
As concluded by Joynt, this is a strong characteristic of the work.
For action research, the processes of exploration of the data - rather than collection of
the data - in the detecting of emergent theories and development of existing theories,
must either be replicable or, at least, capable of being explained to others.
The current work replicates, in part, the work of other researchers.
Adhering to the nine characteristics above is a necessary, but not sufficient, condition
for the validity of action research.
By utilizing instruments that have been developed from theory and
applied in other contexts, the claim of validity rests on firmer ground.
The full process of action research involves a series of interconnected cycles, where
writing about research outcomes at the latter stages of an action research project is an
important aspect of theory exploration and development, combining the processes of
explicating pre-understanding and methodical reflection to explore and develop theory
formally.
The current work will continue beyond the completion of the DBA.
This will include pursuing a publication plan (see above) as well as
extending the research to other areas, using the suggestion for
future research noted above.

318
Action Research Characteristic Reflection
It is difficult to justify the use of action research when the same aims can be satisfied
using approaches (such as controlled experimentation or surveys) that can
demonstrate the link between data and outcomes more transparently. Thus, in action
research, the reflection and data collection process - and hence the emergent theories
- are most valuably focused on the aspects that cannot be captured by other
approaches.
The analysis in this table does suggest that similar aims may be
satisfied using methods other than action research.
In action research, the opportunities for triangulation that do not offer themselves with
other methods should be exploited fully and reported. They should be used as a
dialectical device which powerfully facilitates the incremental development of theory.
Although perhaps not as strong in this area as the other thesis
reviewed by Joynt, the current work does include a triangulation
aspect through the use of focus groups.
The history and context for the intervention must be taken as critical to the
interpretation of the likely range of validity and applicability of the results of action
research.
The context of the intervention was taken into account in the current
work by capturing sector type, organization size and whether the
respondent was from a whole organization or business unit. The
history of the intervention was not, however, considered such as
with the event benefit studies (e.g., Hendricks and Singhal (2001a))
Action research requires that the theory development which is of general value is
disseminated in such a way as to be of interest to an audience wider than those
integrally involved with the action and/or with the research.
Some early outcomes from the study have already been
disseminated. There are plans to submit a number of business and
academic papers as a result of the work.
Based on Joynt (2004)

319
6.3 The learning process One of the features of the DBA over a Ph.D. was the focus on learning in Stage One.
The Competency Development Plan (CDP) and associated final report provided the
opportunity to consider learning theory and this is an appropriate point at the end of the
programme to reflect briefly on this aspect of the DBA.
The personal diagnostic assessment conducted during the Advanced Management
Programme week in September 01, based on the Kolb Learning Style Inventory, resulted
in my learning style being defined as a converger. One would expect a converger to find
practical uses for ideas and to focus on specific problems using hypothetical-deductive
reasoning. They would expect to be generally unemotional, preferring to deal with things
rather than people. There is no doubt that during the DBA programme I have sought to
solve practical problems in order to progress forward. Looking back at the decisions
made, there is no doubt that this learning style has some drawbacks and extra reflection
and more time on theory may have produced a slightly different result. The section on
the limitations of the research is where some of the compromises made may be found.
One learning theory that has been reinforced by the DBA experience is that of „Double-
loop‟ learning (Argyris (1991)). Related to the point above on limitations, there is no
doubt future research studies will take into account the learning gained in this study and
many of the lessons have already been put into practice. Good examples of this are the
need to reach an early definition for the focus of the research so that the project may
progress, and the recognition that the research will evolve over time.
A final point relates to the difference between scientific research and social science
research. Having the privilege of experiencing both types of research, it is clear that the
fundamental principles are very similar: Know the literature, use good methodologies and
make a contribution. It is interesting that it is also easier to make a contribution in a
science field that has not been extensively researched, but the drawback is that such
research is technically more difficult. For example, in my science lifetime I worked on an
enzyme that was readily available but everything you could think of had been done to it,
whereas a colleague worked on an enzyme that had been subjected to very little
experimentation as it was so difficult to isolate. In the current research the decision to
include the public sector in the scope of the research meant that the challenge of making
a contribution was reduced, but this introduced the complexity of having to modify the
instruments. So the conclusion is that science research and social science research are,
in many ways, very similar, but they do vary in the way that concrete evidence is
obtained. Science research has the benefit of the „Water on Mars‟ paradigm, whereas

320
social science sits in the more inferential „Only the dog knows for sure‟ paradigm (Tanner
(2004c)).
6.4 Final words So, finally the end of the journey has been reached. There is no doubt that the DBA
programme has been of immense value from a technical skills transfer and building
personal esteem perspective. But one feels that one has just passed the driving test and
now is the time to learn to drive for real.
In completing this research I feel that I have made a contribution to the body of
knowledge in my area of interest. I have added my „grain of sand‟. I also hope that my
experiences may be shared with others as they follow me in this life-changing
experience.

321
7 References Aaker, D. A. (1989). "Managing assets and skills: The key to a sustainable competitive
advantage." California Management Review 31(2): 91-106.
Abbott, P. G. (2003). 2003 Current market outlook: The UK market for management
consultancy. London, Industry Research Group: 102.
Adner, R. and C. E. Helfat (2003). "Corporate effects and dynamic managerial
capabilities." Strategic Management Journal 24: 1011-1025.
Agle, B. R., R. K. Mitchell and J. A. Sonnenfeld (1999). "Who matters to CEOs? An
investigation of stakeholder attributes and salience, corporate performance, and
CEO values." Academy of Management Journal 42(5): 507-525.
Agus, A. (2004). "TQM as a focus for improving overall service performance and
customer satisfaction: An empirical study on a public service sector in Malaysia."
Total Quality Management 15(5-6): 615-628.
Agus, A. and R. M. Sagir (2001). "The structural relationships between total quality
management, competitive advantage and bottom-line financial performance: An
empirical study of Malaysian manufacturing companies." Total Quality
Management 12(7 & 8): 1018-1024.
Ahrie, S. L., D. Y. Golhar and M. A. Waller (1996). "Development and validation of TQM
implementation constructs." Decision Sciences 27: 23-56.
Ahrie, S. L., M. A. Waller and D. Y. Golhar (1998). "Quality management in TQM versus
non-TQM firms: An empirical investigation." International Journal of Quality and
Reliability Management 13(8).
Alford, J. (2001). The implications of 'publicness' for strategic management theory.
Exploring public sector strategy. G. Johnson and K. Scholes. Harlow, Pearson
Education Ltd: 1-16.
Allee, V. (2000). "Reconfiguring the value network." Journal of Business Strategy 21(4).
Allen, M. V. and R. M. Brady (1997). "Total quality management, organizational
commitment, perceived organizational support, and intraorganizational
communication." Management Communications Quarterly 10: 316-342.
Alvesson, M. and H. Willmott (1996). Making sense of management. London, Sage
Publications Ltd.
322
Amit, R. and P. J. H. Schoemaker (1993). "Strategic assets and organizational rents."
Strategic Management Journal 14: 33-46.
Anderson, P. (2004). The emergence of dynamic capabilities in entrepreneurial firms.
Dynamic Capabilities in High Uncertainty markets, Ostini, Italy, E-Business
Management School, Leece.
Andrews, K. R. (1971). The concept of corporate strategy. Homewood, Irwin.
Ansoff, H. I. (1991). "Strategic management in a historical perspective." The International
Review of Strategic Management 2(1).
Arauz, R. and H. Suzuki (2004). "ISO 9000 performance in Japanese industries." Total
Quality Management 15(1): 3-33.
Argarwal, R., M. B. Sarkar and R. Echambadi (2002). "The conditioning effect of time on
firm survival: an industry lifecycle approach." Academy of Management Journal
45(5): 989.
Argote, L. and P. Ingram (2000). "Knowledge transfer: A basis for competitive advantage
in firms." Organizational Behavior and Human Decision Process 82(1): 150-169.
Argyris, C. (1991). "Teaching smart people to learn." Harvard Business Review: 99-109.
Baidoun, S. (2004). "Towards an index of comparative criticality: An empirical study of
TQM implementation in Palestinian industry." Total Quality Management 15(1):
127-144.
Barber, L., S. Hayday and S. Beven (1999). From people to profits. Brighton, Institute for
Employment Studies.
Barney, J. (1986). "Strategic factor markets: Expectations, luck, and business strategy."
Management Science: 1231-1241.
Barney, J. (1991a). "Firm resources and sustained competitive advantage." Journal of
Management 17(1): 99-100.
Barney, J. (1991b). "The resource-based model of the firm: Origins, implications and
prospects." Journal of Management 17(1): 97-98.
Barney, J. (1995). "Looking inside for competitive advantage." Academy of Management
Executive 9(4): 49-61.

323
Barney, J. (2001a). "Is the resources-based "view" a useful perspective for strategic
management research? Yes." Academy of Management Review 26(1): 41-56.
Barney, J. (2001b). "Resource-based theories of competitive advantage: A ten year
retrospective on the resource-based view." Journal of Management 27: 643-650.
Barney, J. (2002). Gaining and sustaining competitive advantage. New Jersey, Pearson
Education Inc.
Barney, J. and M. H. Hansen (1994). "Trustworthiness as a source of competitive
advantage." Strategic Management Journal 15 (Winter Special Issue): 175-190.
Barney, J., M. Wright and D. J. Ketchen (2001). "The resource-based view of the firm: ten
years after 1991." Journal of Management 27: 625-641.
Barney, J. and E. J. Zajac (1994). "Competitive organizational behavior: Toward an
organizationally-based theory of competitive advantage." Strategic Management
Journal 15(8): 5-9.
Baron, R. M. and D. A. Kenny (1986). "The moderator-mediator variable distinction in
social psychological research: Conceptual, strategic, and statistical
considerations." Journal of Personality and Social Psychology 51(6): 1173-82.
Bass, B. M. (1990). Bass and Stogdill's handbook of leadership. New York, The Free
Press.
Bates, K. A. and J. E. Flynn (1995). "Innovation history and competitive advantage: A
resource-vased view analysis of manufacturing technology innovations."
Academy of Management Best Papers Proceedings: 235-239.
Bauer, J. (2002). Implementing business excellence. Business Excellence. Leeds, Leeds
University Business School.
Bauer, J., S. J. Tanner and C. Pertwee (2001). Benefits of IS0:9000. Leeds, European
Centre for Business Excellence.
Baum, J. A. and S. Wally (2003). "Strategic decision speed and firm performance."
Strategic Management Journal 24: 1107-1129.
Baxter, L. F. and A. MacLeod (1999). "Measuring business excellence: The case of
leadership." Management Services 43(7): 14-17.

324
Beer, M. and N. Nohria (2000). Cracking the code of change. Harvard Business Review.
78: 133-142.
Beheshti, H. M. and J. G. Lollar (2003). "An empirical study of US SMEs using TQM."
Total Quality Management 14(8): 839-847.
Bemowski, K. and B. Stratton (1995). "How do people use the Baldrige Award criteria?"
Quality Progress 28(5): 43-47.
Benner, M. J. and M. L. Tushman (2003). "Exploitation, exploration, and process
management: The productivity dilemma revisited." Academy of Management
Review 28(2): 238-256.
Bennis, W. and B. Nanus (1985). Leaders. New York, NY, Harper & Row.
Bettis, R. A. and M. A. Hitt (1995). "The new competitive landscape." Strategic
Management Journal 16(5): 7-19.
Bickman, L. B. and D. J. Rog (1997). Handbook of applied social research methods.
London, Sage Publications.
Black, S. A. and L. J. Porter (1996). "Identification of the critical success factors of TQM."
Decision Sciences 27(1): 1-21.
Blomqvist, K. and R. Seppanen (2003). Bringing together the emerging theories on trust
and dynamic capabilities: Collaboration and trust as focal concepts.
Lappeenranta: 25.
Blyler, M. and R. W. Coff (2003). "Dynamic capabilities, social capital and rent
appropriation: Ties that split pies." Strategic Management Journal 24: 677-686.
Bolden, R. (2004). What is leadership? Exeter, Leadership South West: 36.
Bourgeois, L. J. (1985). "Strategic goals, perceived uncertainty, and economic
performance in volatile environments." Academy of Management Journal 28(3):
548-573.
Bourgeois, L. J. and K. M. Eisenhardt (1988). "Strategic decision processes in high
velocity environments: Four cases in the microcomputer industry." Management
Science 34(7): 816-835.
Bowd, L. (2002). The strategic roles of middle managers, collaborative relationships
between top management and the middle, and the impact of these roles and

325
relationships on the organization performance. Henley, Henley Management
College: 361.
Bowen, D. E. and E. E. Lawler (1992). "Total quality-orientated human resources
management." Organizational Dynamics 20: 392-418.
Bowen, H. P. and M. F. Wiersema (1999). "Matching method to paradigm in strategy
research: Limitations of cross-sectional analysis and some methodological
alternatives." Strategic Management Journal 20: 625-636.
Bowman, C. and V. Ambrosini (2001). ""Value" in the resource-based view of the firm: A
contribution to the debate." Academy of Management Review: 501-502.
Bowman, C., K. James and R. Kwiatkowski (2004). Developing individual strategic
capability. Leadership refrains: Encounters, conversations and enchantments,
Exeter, Centre for Leadership Studies.
Boyle, G. J. (1991). "Does item homogeneity indicate internal consistency or item
redundancy in psychometric scales?" Personality and Individual Differences 12:
291-294.
Briggs, S. and W. Keogh (1999). "Integrating human resource strategy and strategic
planning to achieve business excellence." Total Quality Management 10(4 & 5):
S446-S453.
British_Quality_Foundation (2003). The impact of business excellence on financial
performance. London, British Quality Foundation: 6.
Browne, M. W. and R. Cudeck (1993). Alternative ways of assessing model fit. Testing
structural equation models. K. A. Bollen and J. Long, S. Newbury Park, CA,
Sage: 136-162.
Brush, T. H. and K. W. Artz (1999). "Toward a contingent resource-based theory: The
impact of information asymmetry on the value of capabilities in veterinary
medicine." Strategic Management Journal 20: 223-250.
Bryson, J. M. (1995). Strategic planning for public and non-profit organizations. San-
Francisco, Jossey-Bass.
Burgoyne, J., W. Hirsh and S. Williams (2004). The development of management and
leadership capability and its contribution to performance: The evidence, the

326
prospects and the research need. London, Leadership and Management Unit of
the DfES.
Buzzell, R. D. and B. T. Gale (1987). The PIMS principles, The Free Press.
Byrne, B. M. (2001). Structural equation modeling with AMOS. New Jersey, Lawrence
Erlbaum Associates.
Byrne, J. A. (1997). Management theory - or fad of the month? Business Week. 47.
Campbell, J. P. (1973). Research into the nature of organizational effectiveness: An
endangered species? Working Paper, University of Minnesota.
Carmeli, A. and A. Tishler (2004). "The relationships between intangible organizational
elements and organizational performance." Strategic Management Journal
25(13): 1257-1278.
Carmines, E. G. and R. A. Zeller (1979). Reliability and validity assessment. Sage
University Paper Series on Quantitative Applications in the Social Sciences.
Newbury Park.
Carr, D. and I. Littman (1990). Excellence in government. Total quality management in
the 1990s. New York, Coopers & Lybrand.
Caruana, A., L. Pitt and M. Morris (1994). "Service firms and the excellence construct:
Implications for performance." Henley Working Paper Series(HWP 9424): 13.
Castanias, R. P. and C. E. Helfat (1991). "Managerial resources and rents." Journal of
Management 17: 155-171.
Castanias, R. P. and C. E. Helfat (2001). "The managerial rents model: Theory and
empirical analysis." Journal of Management 27(6): 661-678.
CEML (2002). Managers and leaders: Raising our game. London, Council for Excellence
in Management and Leadership.
Chang, S., N. Lin and C. Sheu (2002). "Aligning manufacturing flexibility with
environmental uncertainty: Evidence from high-technology component
manufacturers in Taiwan." International Journal of Production Research 40(18):
4765-4780.
Chattopadhyay, S. P. and S. J. Szydlowski (1999). "TQM Implementation for competitive
advantage in healthcare delivery." Managing Service Quality 9(2): 96.

327
Chin, W., W, (1998). "Issues and opinion on structural equation modeling." MIS Quarterly:
vii-xvi.
Christensen, C. M. (2001). "The past and future of competitive advantage." MIT Sloan
Management Review: 105-109.
Christensen, C. M. and M. E. Raynor (2003). "Why hard-nosed executives should care
about management theory." Harvard Business Review 81(9): 66-75.
Chuan, T. K. and L. C. Soon (2000). "A detailed trends analysis of national quality awards
world-wide." Total Quality Management 11(8): 1065-1080.
Churchill, J., G. A. (1979). "A paradigm for developing better measures of marketing
constructs." Journal of Marketing Research 16: 64-73.
Churchill, J., G. A. (1992). "Better measurement practices are critical to better
understanding of scale management issues." Journal of Personal Selling & Sales
Management 12(2): 73-80.
Churchill, J., G. A. and D. Iacobucci (2002). Marketing research methodological
foundations. Ohio, South-Western.
Churchill, J., G. A. and J. P. Peter (1984). "Research design effects on the reliability of
rating scales: a meta-analysis." Journal of Marketing Research 21: 360-375.
Cicourel, A. (1974). Theory and method in a study of Argentine fertility. New`York, John
Wiley.
Clarke, M. (2000). "Moving the goalposts." Strategy.
Claver, E. and J. J. Tari (2003). "Levels of quality management in certified firms." Total
Quality Management 14(9): 981-998.
Claver, E., J. J. Tari and J. F. Molina (2003). "Critical factors and results of quality
management: An empirical study." Total Quality Management 14(1): 91-118.
Clayton, P. (2003). Body language at work. London, Hamlyn.
Cockerill, A. P. (1993). Validation study into the high performance managerial
competencies. London, London Business School.
Cohen, J. (1977). Statistical power analysis for the behavioral sciences. New York,
Academic Press.
Collins, J. C. and J. I. Porras (1998). Built to last. London, Century Ltd.

328
Combs, J. G. and D. J. Ketchen (1999). "Explaining interfirm cooperation and
performance: Towards a reconciliation of predictions from the resource-based
view and organizational economics." Strategic Management Journal 20: 867-888.
Conti, T. (1992). Time for a critical review of quality self-assessment: 169-180.
Cook, T. D. and D. T. Campbell (1979). Quasi-experimentation. Design and analysis
issues for field settings. Chicago, Rand McNally College Publishing Company.
Cooper, P. (1997). "Assessing the planning process." Self-assessment.
Corbett, C. J., M. J. Montes and D. A. Kirsch (2002a). The financial impact of ISO 9000
certification: An empirical analysis: 31.
Corbett, C. J., M. J. Montes, D. A. Kirsch and M. J. Alvarez-Gil (2002b). Does ISO 9000
certification pay? ISO Management Systems: 31-40.
Coyne, K. P. (1986). "Sustainable competitive advantage - What it is and what it isn't."
Business Horizons: 54-61.
Craig, C. and S. Douglas (1982). "Strategic factors associated with market and financial
performance." Quarterly Review of Economics and Business: 101-111.
Creswell, J. (1994). Research design: Quantitative and qualitative approaches. Thousand
Oaks, Sage.
Cronbach, L. J. and P. C. Meehl (1955). "Construct validity in psychological tests."
Psychological Bulletin 52: 281-302.
Crosby, P. B. (1984). Quality without tears, McGraw-Hill.
Curkovic, S., S. Melnyk, R. J. Calantone and R. B. Handfield (2000). "Validating the
Malcolm Baldrige National Quality Award framework through structured equation
modelling." International Journal of Production Research 38(4): 765-791.
Curkovic, S., S. Vickery and C. Dröge (2000). "Quality-related action programmes: Their
impact on quality performance and firm performance." Decision Sciences 31(4):
885-905.
D'Adderio, L. (2001). Crafting the virtual prototype: How firms integrate knowledge and
capabilities across organizational boundaries. Edinburgh: 42.
Dale, B. and C. Cooper (1994). "Introducing TQM: The role of senior management."
Management Decision 32: 20-26.

329
Dale, B. G., P. Y. Wu, M. Zairi, A. R. T. Williams and T. Van der Wiele (2001). "Total
quality management and theory: An exploratory study of contribution." Total
Quality Management 12(4): 439-449.
Daniels, S. E. (2004). "The image and reality of excellence." Quality Progress 37(7): 57-
63.
Darling, J. (1999). "Organizational excellence and leadership strategies: Principles
followed by top multinational executives." Leadership & Organization
Development Journal 20: 309-321.
Das, A., R. B. Handfield, R. J. Calantone and S. Ghosh (2000). "A contingent view of
quality management - The impact of international competition on quality."
Decision Sciences 31(3): 469-690.
D'Aveni, R. (1994). Hypercompetition. New York, The Free Press.
D'Aveni, R. (2002). "The empire strikes back: Counter revolutionary strategies for industry
leaders." Harvard Business Review 80: 67-74.
D'Aveni, R. (2004). Discussion on measuring hypercompetition. S. J. Tanner. Ostini.
Day, G. S. (1990). Market driven strategy: Processes for creating value. New York, Free
Press.
Day, G. S. (1994). "The capabilities of market-driven organizations." Journal of Marketing
58(4): 37-52.
Dayton, N. A. (2001). "Total quality management critical success factors: The UK versus
the USA." Total Quality Management 12(3): 293-298.
Dean, J. W. and J. D. E. Bowen (1994). "Management theory and total quality: Improving
theory and practice through theory development." Academy of Management
Review 19(3): 392-418.
DeCarolis, D. M. and D. L. Deeds (1999). "The impact of stocks and flows of
organizational performance: An empirical investigation of the biotechnology
industry." Strategic Management Journal 20: 953-968.
Deming, W. E. (1991). Out of the crisis. Cambridge, Massachusetts Institute of
Technology.

330
Denscombe, M. (1998). The good research guide for small-scale social research projects.
Philadelphia, Open University Press.
Dervitsiotis, K. N. (1999). "How to attain and sustain excellence with performance-based
process management." Total Quality Management 10(3): 309-326.
Dervitsiotis, K. N. (2003). "The pursuit of sustainable business excellence: Guiding
transformation for effective organizational change." Total Quality Management
14(3): 251-267.
Dervitsiotis, K. N. (2004). "Navigating in turbulent environmental conditions for sustained
business excellence." Total Quality Management 15(5-6): 807-827.
Desarbo, W. S., C. A. Di Benedetto, M. Song and I. Sinha (2005). "Revisiting the Miles
and Snow strategic framework: Uncovering interrelationships between strategic
types, capabilities, environmental uncertainty, and firm performance." Strategic
Management Journal 26(1): 47-74.
Dess, G. G. and D. W. Beard (1984). "Dimensions of organizational task environments."
Administrative Science Quarterly 29: 52-73.
Dess, G. G., G. T. Lumpkin and J. G. Covin (1997). "Entrepreneurial strategy making and
firm performance: Tests of contingency and configurational models." Strategic
Management Journal 18(9): 677-695.
Dess, G. G. and J. C. Picken (1999). "Creating competitive (dis) advantage - Learning
from Food Lion's freefall." Academy of Management Executive 13(3): 97-101.
Dess, G. G. and R. B. Robinson (1984). "Measuring organizational performance in the
absence of objective measures: The case of the privately-held firm and
conglomerate business unit." Strategic Management Journal 5(3): 265-273.
DfES (2002). Government response to the report of the Council for Excellence in
Management and Leadership. Nottingham, DfES Publications.
Dierickx, I. and K. Cool (1989). "Asset stock accumulation and sustainability of
competitive advantage." Management Science 35(12): 1504-1514.
Dobrev, S. D. and G. R. Carroll (2003). "Size (and competition) among organizations:
Modeling scale-based selection among automobile producers in four major
countries, 1885-1981." Strategic Management Journal 24: 541-558.

331
Douglas, T. J. and W. Q. Judge (2001). "Total quality management implementation and
competitive advantage: The role of structural control and exploration." Academy
of Management Journal 44(1): 158-169.
Douglas, T. J. and J. A. Ryman (2003). "Understanding competitive advantage in the
general hospital industry: Evaluating strategic competencies." Strategic
Management Journal 24(4): 333-347.
Dow, D., D. Samson and S. Ford (1999). "Exploding the myth: Do all quality management
practices contribute to superior quality performance." Production and Operations
Management 8: 1-27.
Downey, H. K., D. Hellriegel and J. W. Slocum (1975). The effects of individual
differences on managers' perceptions of environmental uncertainty, Academy of
Management: 200-202.
Downey, H. K. and J. W. Slocum (1975). "Uncertainty: Measures, research and sources
of variation." Academy of Management Journal 18(3): 562-578.
Doyle, P. (2001). "Building value-based branding strategies." Journal of Strategic
Marketing 9: 255-268.
DTI (2001). Creating value from your intangible assets. London, Future and Innovation
Unit, DTI.
Dumond, E. J. (2000). "Value management: An underlying framework." International
Journal of Operations and Production Management 20(9).
Duncan, R. B. (1972). "Characteristics of organizational environments and perceived
environmental uncertainty." Administrative Science Quarterly 17(3): 313-328.
Durand, T. (1998). The alchemy of competence. Strategic flexibility: Managing in a
turbulent environment. G. Hamel, C. K. Prahalad, H. Thomas and D. O' Neal.
Chichester, Wiley & Sons Ltd.
Easterby-Smith, M., R. Thorpe and A. Lowe (2002). Management research. An
introduction. London, Sage.
Easton, G. S. and S. L. Jarrell (1998). "The effects of total quality management on
corporate performance: An empirical investigation." Journal of Business 71(2):
253-307.

332
ECforBE (1997). Evaluating the operation of the European quality model for self-
assessment. Leeds, European Centre for Business Excellence: 106.
ECforBE (1999). The x-factor: Winning performance through business excellence. Leeds,
European Centre for Business Excellence.
ECforBE (2000). The model in practice. London, British Quality Foundation.
ECforBE (2002). The model in practice. London, British Quality Foundation.
Eden, C. and C. Huxham (1996). Action research for the study of organizations.
Handbook of organizational studies. S. Clegg, C. Hardy and W. Nord. Beverly
Hills, CA, Sage.
Edgeman, R. and F. Scherer (1999). "Systemic leadership via core value deployment."
Leadership & Organization Development Journal 20(2).
Edgeman, R. L. and T. Rodgers (1999). "Escape from organizational nihilism: Leadership
core values for business excellence." International Journal of Applied Quality
Management 2(1): 117-125.
EFQM (1999a). The EFQM Excellence Model®. Brussels, European Foundation for
Quality Management.
EFQM (1999b). Assessing for excellence. Brussels, European Foundation for Quality
Management.
EFQM (2003). The fundamental concepts. Brussels, EFQM.
Eisenbach, R., K. Watson and R. Pillai (1999). "Transformational leadership on the
context or organizational change." Journal of Organizational Change
Management 12(2): 80-88.
Eisenhardt, K. M. and J. Martin (2000). "Dynamic capabilities: What are they?" Strategic
Management Journal 21: 1105-1121.
Eisenhardt, K. M. and D. N. Sull (2001). "Strategy as simple rules." Harvard Business
Review 79(1): 107-116.
Eng, Q. E. and S. M. Yousof (2003). "A survey of TQM practices in the Malaysian
electrical and electronic industry." Total Quality Management 14(1): 63-67.
Engelland, B. T., B. L. Alford and R. D. Taylor (1999). Cautions and precautions on the
use of 'borrowed' scales in marketing research.

333
Eriksson, H., F. Johansson and H. Wilklund (2003). "Effects of in-company quality awards
on organizational performance." Total Quality Management 14(2): 235-242.
Eskildsen, J. K., K. Kristensen and H. J. Juhl (2001). "The criterion weights of the EFQM
excellence model." International Journal of Quality and Reliability Management
18(8/9): 783-795.
Eskildsen, J. K., K. Kristensen and H. J. Juhl (2002). "Trends in EFQM criterion weights."
Measuring Business Excellence 6(2): 22-28.
Eskildsen, J. K. and M. L. Nussler (2000). "The managerial drivers of employee
satisfaction and loyalty." Total Quality Management 11(4/5&6): S581-S588.
Ethiraj, S. K., P. Kale, M. S. Kirshnan and J. V. Singh (2005). "Where capabilities come
from and how do they matter? A study in the software services industry."
Strategic Management Journal 26(1): 25-45.
Evans, J. R. (1992). A report of the total quality leadership steering committee and
working councils. Milwaukee, Proctor and Gamble.
Ferdinand, J., E. Antonacopoulou, M. Graça and M. Easterby-Smith (2004). Dynamic
capability: Tracking the development of a concept. Liverpool: 16.
Fernando, M. (2001). "Are popular management techniques a waste of time?" Academy
of Management Executive 15(3): 138-140.
Finkestein, S. and D. C. Hambrick (1996). Strategic leadership: Top executives and their
effects on organizations. Minneapolis, West Publication Company.
Fiol, C. M. (1991). "Managing culture as a competitive resource: An identity-based view of
sustainable competitive advantage." Journal of Management 17: 191-211.
Fiol, C. M. (2001). "Revisiting an identity-based view of sustainable competitive
advantage." Journal of Management 27(6): 691-699.
Fiol, C. M. and M. A. Lyles (1985). "Organizational learning." Academy of Management
Review 10: 808-813.
Fisher, C., J. Dauterive and J. Barfield (2001). "Economic impact of quality awards: Does
offering an award bring returns to the state?" Total Quality Management 12(7 &
8): 981-987.

334
Fisher, S. R. and M. A. White (2000). "Downsizing in organizations: Are there hidden
costs?" Academy of Management Review 25(1): 244-251.
Fitzgerald, L., R. Johnson, S. Brignall, R. Silvestro and C. A. Voss (1991). Performance
measurement in service business. London, CIMA.
Flood, P. C., K. A. Smith and P. Derfus (1996). "Top management teams: A neglected
topic in strategic management." Ibar 17: 1-17.
Flynn, B. B., R. G. Schroeder and S. Sakakibara (1994). "A framework for quality
management research and associated instrument." Journal of Operations
Management 11: 339-366.
Fontana, A. and J. H. Frey (2000). The interview: From structured questions to negotiated
text. Handbook of qualitative research. N. K. Denzin and Y. S. Lincoln. London,
Sage Publications Ltd: 645-672.
Foreman, S. and A. Money (2004). Just how reliable is reliable? A note on the estimation
of Cronbach alpha. Henley: 14.
Fountain, M. (1998). "The target assessment model as an international standard for self-
assessment." Total Quality Management 9(4-5): 595-600.
Frey, J. H. and A. Fontana (1991). "The group interview in social research." Social
Science Journal 28: 175-187.
Furnham, A. (1997). The psychology of behaviour at work. Hove, Psychology Press.
Gallear, D. and A. Ghobadian (2004). "An empirical investigation of the channels that
facilitate a total quality culture." Total Quality Management 15(8): 1043-67.
Galunic, D. C. and K. M. Eisenhardt (2001). "Architectural innovation and modular
corporate forms." Academy of Management Journal 44(6): 1229-1249.
GAO (1991). G. A. O. Management practices: U.S. companies improve performance
through quality efforts. Washington D.C., General Accounting Office.
Garg, V. K., B. A. Walters and R. L. Priem (2003). "Chief executive scanning emphasis,
environmental dynamism, and manufacturing firm performance." Strategic
Management Journal 24: 725-744.
Garvin, D. A. (1983). "Quality on the line." Harvard Business Review: 55-75.

335
Garvin, D. A. (1991). "How the Baldrige award really works." Harvard Business Review
69(6): 80-93.
George, D. and P. Mallery (2003). SPSS for windows step by step. Boston, Pearson
Education Inc.
Gill, J. and P. Johnson (1991). Research methods for managers. Liverpool, Paul
Chapman Publishing Ltd.
Gill, J. and P. Johnson (2002). Research methods for managers. London, Sage
Publications Ltd.
Goasdoé, J. (2005). Conversation on review of EFQM fundamental concepts. S. J.
Tanner. London.
Goh, T. N., P. C. Low, K. L. Tsui and M. Xie (2003). "Impact of six-sigma implementation
on stock price performance." Total Quality Management 14(7): 753-763.
Grant, R. M. (1991). "The resource-based theory of competitive advantage: Implications
for strategy formulation." California Management Review 33(3): 114-135.
Grant, R. M. (1996). "Towards a knowledge-based theory of the firm." Strategic
Management Journal 17(Winter Special Issue): 108-122.
Grant, R. M. (2004a). The application of the resource-based view to public sector
organizations. P. communication.
Grant, R. M. (2004b). Options thinking: Some implications for simple strategic analysis.
Dynamic capabilities in high uncertainty markets, Ostini, Italy, E-Business
Management School, Leece.
Gray, D. (2003). Measuring intellectual assets, Centre for Business Performance. 2004.
Grint, K. (1995). Management: A sociological introduction. London, Polity Press.
Grint, K. (2004). What is leadership? From hydra to hybrid. Said Business School and
Templeton College Working Paper. Oxford.
Guillen, M. and T. F. Gonzalez (2001). "The ethical dimension of managerial leadership:
Two illustrative case studies in TQM." Journal of Business Ethics 34(3/4): 175-
189.
Hair, J. F., R. E. Anderson, R. L. Tatham and W. C. Black (1998). Multivariate data
analysis. New Jersey, Prentice-Hall.

336
Hair, J. F., B. Babin, A. Money and P. Samouel (2003). Essentials of business research.
Hoboken, Leyh Publishing.
Hakes, C. (1994). The self-assessment handbook. London, Chapman and Hall.
Hall, R. (1991). "The contribution of intangible resources to business success." Journal of
General Management 16(4): 41-52.
Hall, R. (1992). "The strategic analysis of intangible resources." Strategic Management
Journal 13: 135-144.
Hall, R. (1994). A framework for identifying the tangible sources of sustainable
competitive advantage. Competence-based competition. G. Hamel and A.
Heene. Chichester, John Wiley & Sons Ltd: 149-169.
Hall, R. (2004). Conversation at Durham Business School. S. J. Tanner. Durham.
Hamel, G. (1994). The concept of core competence. Competence-based competition. G.
Hamel and A. Heene. Chichester, Wiley: 11-33.
Hamel, G. and C. K. Prahalad (1996). Competing for the future. Boston, Harvard
Business School Press.
Hamel, G., C. K. Prahalad, H. Thomas and D. O' Neal (1998). Strategic flexibility:
Managing in a turbulent environment. Chichester, John Wiley & Sons Ltd.
Harrington, H. J. (2004). "The fallacy of universal best practices." Total Quality
Management 15(5-6): 849-858.
Hart, S. and C. Banbury (1994). "How strategy-making processes can make a difference."
Strategic Management Journal 15(4): 251-269.
Haslam, S. A. (2004). Psychology in organizations: the social identity approach. London,
Sage Publications.
Hatch, N. W. and J. H. Dyer (2004). "Human capital and learning as a source of
sustainable competitive advantage." Strategic Management Journal 25(12):
1155-1178.
Hatton, K. J. and S. R. Rosenthal (1999). "Managing the process-centred enterprise."
Long Range Planning 32(3): 293-310.
Hayes, R. H. and G. Pisano (1994). "Beyond world-class: The new manufacturing
strategy." Harvard Business Review 8(1): 77-86.

337
Helfat, C. E. and M. A. Peteraf (2003). "The dynamic resource-based view: Capability
lifecycles." Strategic Management Journal 24: 997-1010.
Helfat, C. E. and R. S. Raubitschek (2000). "Product sequencing co-evolution of
knowledge, capabilities and products." Strategic Management Journal 21(Special
issue (10-11)): 961-979.
Helton, R. (1995). The Baldie play. Quality Progress. 28: 43-45.
Henderson, R. and W. Mitchell (1997). "The interactions of organizational and competitive
influences on strategy and performance." Strategic Management Journal 18: 5-
14.
Hendricks, K. B. and V. R. Singhal (1997). "Does implementing an effective TQM
program actually improve operating performance: Empirical evidence from firms
that have won quality awards." Management Science 44(9): 1258-1274.
Hendricks, K. B. and V. R. Singhal (1999). "Don't count TQM out." Quality Progress
32(4): 35-42.
Hendricks, K. B. and V. R. Singhal (2000). "The long-run stock price performance of firms
with effective TQM programs as proxied by quality award winners." Management
Science 47(3): 359-368.
Hendricks, K. B. and V. R. Singhal (2001a). "Firm characteristics, total quality
management, and financial performance." Journal of Operations Management
19: 269-285.
Hendricks, K. B. and V. R. Singhal (2001b). The impact of TQM on financial performance:
Evidence from quality award winners. Stakeholder Value - The Path to
Sustainable Growth, Lucerne.
Higgs, M. (2002). "Leadership - the long line: A view on how we can make sense of
leadership in the 21st century." Henley Working Paper Series(HWP 0207): 31.
Higgs, M. and D. Rowland (2000). "Building change leadership capability." Henley
Working Paper Series(HWP 2000/04): 22.
Higgs, M. and D. Rowland (2001). "Developing change leaders: Assessing the impact of
a development programme." Henley Working Paper Series(HWP 0106): 32.

338
Hillman, A. J. and G. D. Keim (2001). "Shareholder value, stakeholder management, and
social issues: What's the bottom line?" Strategic Management Journal 22: 125-
139.
Hinkin, T. R. (1995). "A review of scale development practices in the study of
organizations." Journal of Management 21(5): 967-988.
Hirst, J. (1996). "Return to positive equity." UK Quality.
Hodgetts, R. M., F. Luthans and S. M. Lee (1994). "From total quality to learning to world-
class." Organizational Dynamics 22(3): 5-19.
Hodgetts, R. M., F. Luthans and J. W. Solocum (1999). "Strategy and HRM initiatives for
the '00s environment: Redefining roles and boundaries, linking competencies and
resources." Organizational Dynamics 28(2): 7-21.
Holmes, J. D., D. J. McClaskey and A. R. Tarpley (1998). Doubling research's
productivity using TQM. Annual Quality Conference, Philadelphia, ASQ.
Homberg, C., H. Krohmer and J. Workman, . J. P. (1999). "Strategic consensus and
performance: The role of strategy type and market related dynamism." Strategic
Management Journal 20: 339-357.
Hoopes, D. G., T. L. Madsen and G. Walker (2003). "Why is there a resource-based
view? Towards a theory of competitive heterogeneity." Strategic Management
Journal 24: 889-902.
Hough, J. R. and M. A. White (2003). "Environmental dynamism and strategic decision-
making rationality: An examination at the decision level." Strategic Management
Journal 24(5): 481-489.
House, R. J. (1988). Leadership research: Some forgotten, ignored, or overlooked
findings. Emerging Leadership Vistas. J. G. Hunt, B. R. Baliga, H. T. Dachler and
C. A. Schriesheim. Lexington, Mass, Lexington Books: 246–60.
Hoyle, R. H. (1995). Structural equation modelling. Thousand Oaks, Sage.
Huber, G. P. and D. J. Power (1985). "Retrospective reports or strategic-level managers:
Guidelines for increasing their accuracy." Strategic Management Journal 6: 171-
180.

339
Huberman, A. M. and M. B. Miles (2002). The qualitative researcher's companion.
Thousand Oaks, Sage Publications Inc.
Hughes, A. and D. N. Halshaw (2002). "Comparison of the 14 deadly diseases and the
business excellence model." Total Quality Management 13(2): 255-263.
Hutchins, D. (1990). In pursuit of quality. London, Pitman Publishing.
I&DeA (2001). Made to measure. London, Improvement and Development Agency: 40.
Ireland, R. D. and M. A. Hitt (1999). "Achieving and maintaining strategic competitiveness
in the 21st century: The role of strategic leadership." Academy of Management
Executive 13(1): 43-57.
Ireland, R. D., M. A. Hitt, R. A. Bettis and D. Auld de Porras (1987). "Strategy formulation
processes: Differences in perceptions of strength and weaknesses indicators and
environmental uncertainty by managerial level." Strategic Management Journal
8(5): 469-485.
Itami, H. (1987). Mobilising invisible assets. Cambridge, MA, Harvard University Press.
James, W. L. and K. J. Hatton (1995). "Further evidence on the validity of the self typing
paragraph approach: Miles and Snow strategic archetypes in banking." Strategic
Management Journal 16(2): 161-168.
Javidan, M. (1998). "Core competence: What does it mean in practice?" Long Range
Planning 31(1): 60-71.
Jepsen, B., P. Berthon and L. Pitt (1996). "Where angels fear to tread: Interaction effects
in multiple regression - A research note." Henley Working Paper Series(HWP
9627).
Jick, T. D. (1979). "Mixing qualitative and quantitative methods: Triangulation in action."
Administrative Science Quarterly 24(4): 602-612.
Johnson, G. and K. Scholes (2001). Exploring public sector strategy. Harlow, Pearson
Education Ltd.
Johnson, G. and K. Scholes (2002). Exploring corporate strategy. Harlow, Pearson
Education Ltd.
Johnson, K. (2004). "Stoner: Built on a strong foundation." Quality Progress 37(8): 40-46.

340
Jones, G. (2004). "High-performance leadership: Turning pressure to advantage."
Strategy Magazine(3): 18-21.
Joynt, P. (2004). MBRR (Management by research results). Managers learning in action.
D. Coghlan, T. Dromgoole, P. Joynt and P. Sorensen. London, Routledge: 168-
82.
Juran, J. M. (1992). Juran on quality by design. New York, The Free Press.
JUSE (1990). The Deming prize for overseas companies. Tokyo, Union of Japanese
Scientists and Engineers.
Kanji, G. (2001). "Forces of excellence in Kanji's Business Excellence Model." Total
Quality Management 12(2): 259-272.
Kanji, G. (2002). Measuring business excellence. London, Routledge.
Kanji, G. J. and P. Sá (2001a). "Measuring leadership excellence." Total Quality
Management 12(6): 701-718.
Kaplan, R. S. and D. P. Norton (2004). "Measuring the strategic readiness of intangible
assets." Harvard Business Review 82(2): 52-63.
Kay, J. (1998). Foundations of corporate success. Oxford, Oxford University Press.
Kaye, M. and R. Anderson (1999). "Continuous improvement: The ten essential criteria."
The International Journal of Quality & Reliability Management 16(5): 485-506.
Khandwalla, P. N. (1976). The design of organizations. New York, Harcourt Brace
Jovanovich.
Kim, B., J. Shim and J. Kim (2001). "Managers' quality and performance perceptions: The
case of the Korean semiconductor industry." Total Quality Management 12(5):
643-655.
King, A. W., S. W. Fowler and C. P. Zeihaml (2001). "Managing organizational
competencies for competitive advantage: The middle management edge."
Academy of Management Executive 15(2): 95-106.
King, A. W. and C. P. Zeihaml (2001). "Competencies and firm performance: Examining
the causal ambiguity paradox." Strategic Management Journal 22: 75-99.

341
Klavans, R. (1994). The measurement of a competitor's core competence. Competence-
based competition. G. Hamel and A. Heene. Chichester, John Wiley & Sons Ltd:
171-182.
Klein, J. A., G. M. Edge and T. Kass (1991). "Skill-based competition." Journal of General
Management 16(4): 1-15.
Kristensen, K. and A. H. Westlund (2003). "Valid and reliable measurements for
sustainable non-financial reporting." Total Quality Management 14(2): 161-170.
Kristensen, K. and A. H. Westlund (2004b). "Performance measurement and business
results." Total Quality Management 15(5-6): 719-733.
Ladik, D. M. (1999). Knowledge borrowing: Embellishing or eroding the theory base in
marketing?
Lado, A. A. and M. C. Wilson (1994). "Human resource systems and sustained
competitive advantage: Towards a conceptual integration." Academy of
Management Review 19: 699-727.
Lakomski, G. (2001). "Organizational change, leadership and learning: Culture as
cognitive process." International Journal of Educational Management 15(2): 68.
Larréché, J. (2002). The competitive fitness of global firms. Edinburgh, Pearson
Education Ltd.
Lei, D., M. A. Hitt and R. Bettis (1996). "Dynamic core competences through meta-
learning and strategic context." Journal of Management 22(4): 549-569.
Lei, D. and J. W. Slocum (1992). "Global strategy, competence-building and strategic
alliances." California Management Review 35(1): 81-97.
Leibeskind, J. P. (1996). "Knowledge, strategy, and the theory of the firm." Strategic
Management Journal 17(Winter Special Issue): 93-107.
Lemak, D. J. and R. Reed (1997). "Commitment to total quality management: Is there a
relationship with firm performance?" Journal of Quality Management 2: 67-87.
Lenz, R. T. (1980). "Environment, strategy, organization structure and performance:
Patterns in one industry." Strategic Management Journal 1(2): 209-226.
Lenz, R. T. (1980). "Strategic capability: A concept and framework for analysis." Academy
of Management Review 5(2): 225-34.

342
Leonard, D. and R. McAdam (2001). "Grounded theory methodology and practitioner
reflexivity in TQM research." The International Journal of Quality & Reliability
Management 18(2): 180-194.
Leonard, D. and R. McAdam (2002a). "Developing strategic quality management: A
research agenda." Total Quality Management 13(4): 507-522.
Leonard, D. and R. McAdam (2002b). "The strategic dynamics of total quality
management: A grounded theory research study." Quality Management Journal
9(1): 50-62.
Leonard, D., R. McAdam and R. Reid (2002). "A grounded multi-model framework for
TQM dynamics." International Journal of Quality and Reliability Management
19(6): 710-736.
Leonard-Barton, D. (1992). "Core capabilities and core rigidities: A paradox in managing
new product development." Strategic Management Journal 13(Special issue):
111-125.
Leung, H. K. N. and K. C. C. Chan (1999). "Costs and benefits of ISO9000 series: A
practical study." The International Journal of Quality & Reliability Management
16(7): 675-690.
Lever, C. (2000). Changeability. Hampshire, Atticus: 127.
Lewis, M. (1998). Achieving best value through total quality management. Coventry,
University of Warwick/ DETR Best Value Series.
Lindgren, M. (2001). Strategic flexibility: Antecedents and performance implications in
turbulent environments. Henley Management College. Henley, Brunel University:
303.
Link, A. N. and J. T. Scott (2001). Economic evaluation of the Baldrige National Quality
Programme, NIST: 68.
Lippman, S. A. and R. P. Rumelt (1982). "Uncertain imitability: An analysis of interfirm
differences under competition." Bell Journal of Economics 23: 418-438.
Little, A. D. (1992). Quality: Small and midsize companies seize the challenge - not a
moment too soon. Business Week: 66-75.

343
Litz, R. A. (1996). "A resource-based view of the socially responsible firm: stakeholder
interdependence, ethical awareness, and issue responsiveness as strategic
assets." Journal of Business Ethics 15: 1355-1363.
Longbottom, D. (1998). "Self-assessment: Game over?" Total Quality Management 9(4 &
5): S156-S159.
Loveday, M. (1996). "Mirror, mirror on the wall." Self-assessment.
Low, J. and P. Kalufat (2002). Invisible advantage - How intangibles are driving business
performance. New York, Perseus Publishing.
Luthans, F. and R. M. Hodgetts (2002). Managing in North America. Managing Across
Cultures: Issues and Perspectives. M. Warner and P. Joynt. London, Thompson
Learning: 59-72.
MacLeod, A. and L. F. Baxter (2001). "The contribution of business excellence models in
restoring failed improvement initiatives." European Management Journal 19(4):
392-403.
Madriz, E. (2000). Focus groups in feminist research. Handbook of qualitative research.
N. K. Denzin and Y. S. Lincoln. London, Sage Publications Ltd: 835-850.
Mahadevappa, B. and G. Kotreshwar (2004). "Quality management practices in Indian
ISO 9000 certified companies: An empirical evaluation." Total Quality
Management 15(3): 295-305.
Mahoney, F. X. and C. G. Thor (1994). The TQM trilogy. New York, Amacon.
Makadok, R. (2001).
Makhija, M. (2003). "Comparing the resource-based and market-based views of the firm:
Material evidence from Czech privatization." Strategic Management Journal
24(5): 433-451.
Maltz, A. C., A. J. Shenhar and R. R. Reilly (2003). "Beyond the balanced scorecard:
Redefining the search for organizational success measures." Long Range
Planning 36: 187-204.
March, J. G. and R. I. Sutton (1997). "Organizational performance as a dependent
variable." Organizational Science 8(6): 698-711.

344
Martinez-Lorente, A. R., F. Dewhurst and B. Dale (1998). "Total quality management:
Origins and evolution of the term." The TQM Magazine 10(5): 378-386.
Maruyama, G. M. (1998). Basics of structural equation modelling. London, Sage.
Mason, J. (1996). "World-class water." Self-assessment.
Mata, F. J., W. L. Feuerst and J. Barney (1995). "Information technology and sustained
competitive advantage: A resource-based analysis - change." MIS Quarterly 19:
487-505.
May, M. (2002). "Generation next." Financial Management 31.
McDonald-Wood, I. (2004). "Business strategy and the annual report." Strategy
Magazine(3): 5-7.
McGrath, J. E. (1982). Dilemmatics: the study of research choices and dilemmas.
Judgement calls in research. J. E. McGrath, J. Martin and R. A. Kulka. Beverly
Hills, California, Sage Publications: 69-102.
McGrath, R. G. (1998). Discovering strategy: Competitive advantage from idiosyncratic
experimentation. Strategic flexibility: Managing in a turbulent environment. G.
Hamel, C. K. Prahalad, H. Thomas and D. O'Neil. Chichester, John Wiley & Sons
Ltd: 351-370.
Mellahi, K. and Eyuboglu (2001). "Critical success factors for successful total quality
management implementation in Turkey: Evidence from the banking sector." Total
Quality Management 12(6): 745-756.
Merino-Diaz de Cerio, J. (2003). "Factors relating to the adoption of quality management
practices: An analysis for Spanish manufacturing firms." Total Quality
Management 14(1): 25-44.
Merton, R. K., M. Fiske and P. L. Kendall (1950). Continuities in social research: Studies
in the scope and method of 'The American Soldier'. Glencoe, IL, Free Press.
Meyer, S. D. and D. A. Collier (2001). "An empirical test of the causal relationships in the
Baldrige health care pilot criteria." Journal of Operations Management 19(4): 403-
425.
Michalisin, M. D., R. D. Smith and D. M. Kline (1997). "In search of strategic assets."
International Journal of Organizational Analysis 5: 360-387.

345
Michie, S. and M. A. West (2004). "Managing people and performance: An evidence
based framework applied to health service organizations." International Journal of
Management Reviews 5/6(2): 91-111.
Miles, R. E., C. C. Snow, A. D. Meyer and H. J. Coleman (1978). "Organizational
strategy, structure, and process." Academy of Management Review 3(3): 546-
563.
Miller, C. C. and L. B. Cardinal (1994). "Strategic planning and firm performance: A
synthesis of more than two decades of research." Academy of Management
Journal 37(6): 1649-1665.
Miller, D. and J. Shamsie (1996). "The resource-based view of the firm in two
environments: The Hollywood film studios from 1936 to 1965." Academy of
Management Journal 39: 519-543.
Miller, R. B. and S. E. Heiman (1988). Face-to-face selling. Milton Keynes, Miller-Heiman
Inc.
Mills, R. W. and J. Dahlhoff (2003). "Competitive advantage period (CAP) analysis.
Looking at share price and firm value from a different perspective." Henley
Working Paper Series: 36.
Mir, R. and A. Watson (2000). "Strategic management and the philosophy of science: The
case for a constructivist methodology." Strategic Management Journal 21: 941-
953.
Morgan, N. A. and N. Piercy (1996). "Competitive advantage, quality strategy and the role
of marketing." British Journal of Management 7(3): 231-245.
Moser, C. A. and G. Kalton (1971). Survey methods in social investigation. Aldershot,
Dartmouth.
Moura e Sa, P. and G. Kanji (2003). "Leadership for excellence in the Portuguese
municipalities: Critical success factors and improvement strategies." Total Quality
Management 14(2): 131-139.
Nabitz, U., P. Severens, W. van den Brink and P. Jansen (2001). "Improving the EFQM
Model®: An empirical study on model development and theory building using
concept mapping." Total Quality Management 12(1): 69-81.

346
Neely, A., J. Mills, K. Platts, H. Richards, M. Gregory, M. Bourne and M. Kennerley
(2000). "Performance measurement system design: Developing and testing a
process-based approach." International Journal of Operations and Production
Management 20(10): 1119-1145.
Nelson, R. R. and S. G. Winter (1982). An evolutionary theory of economic change.
Cambridge, Harvard University Press.
NIST (2001). Malcolm Baldrige national quality award criteria, U.S. Department of
Commerce,. National Institute of Science and Technology.
NIST (2002a). Malcolm Baldrige National Quality Award criteria, U.S. Department of
Commerce,. National Institute of Science and Technology.
NIST (2002b). Baldrige winners beat the S&P 500 for the eighth year, N.I.S.T. 2002.
Nohria, N. (1996). From the M form to the N form. Boston, Harvard Business School.
Nohria, N., W. Joyce and B. Roberson (2003). "What really works." Harvard Business
Review 81: 43-52.
Norburn, D. and S. Birley (1988). "The top management team and corporate
performance." Strategic Management Journal 9: 225-237.
Northouse, P. G. (2001). Leadership theory and practice. London, Sage Publications Inc.
Nunnally, J. C. (1967). Psychometric theory. New York, McGraw-Hill.
Oakland, J. S. (1999a). Total organizational excellence. Oxford, Butterworth-Heinemann.
Oakland, J. S. (1999b). "Winning performance through business excellence." Credit
Control 20(7): 25-31.
Oakland, J. S. (2003a). TQM: Text with cases. Oxford, Butterworth-Heinemann.
Oakland, S. and J. S. Oakland (2001). "Current people management activities in world-
class organisations." Total Quality Management 12(6): 773-788.
O'Brien, C. and C. A. Voss (1992). In search of quality. London Business School Working
Paper. London.
O'Dell, C. and C. J. Grayson (1997). If we only knew what we know. Houston, APQC: 32.
Ogden, S. and R. Watson (1999). "Corporate performance and stakeholder management:
Balancing shareholder and customer interests in the U.K. privatized water
industry." Academy of Management Journal 42(5): 526-538.

347
Oliver, C. (1997). "Sustainable competitive advantage: Combining institutional and
resource-based views." Strategic Management Journal 18: 697-713.
Pannirselvam, G. P. and L. A. Ferguson (2001). "A study of the relationships between
Baldrige categories." International Journal of Quality and Reliability Management
18(1): 14-34.
Parry, M. (1996). "Cops and models." UK Quality.
Penrose, E. (1959). The theory of the growth of the firm. Oxford, Blackwell.
Penrose, E. (1995). The theory of the growth of the firm. Oxford, OXford University Press.
Perles, G. S. M. (2002). "The ethical dimension of leadership in the programmes of total
quality management." Journal of Business Ethics 39(1/2): 59-66.
Peter, J. P. and J. Churchill, G. A. (1986). "Relationships among research design choices
and psychometric properties of rating scales: A meta-analysis." Journal of
Marketing Research 23: 1-10.
Peteraf, M. A. (1993). "The cornerstones of competitive advantage: A resource-based
view." Strategic Management Journal 14: 179-191.
Peterson, R. A. (1994). "A meta-analysis of Cronbach's coefficient alpha." Journal of
Consumer Research 21: 381-391.
Petrick, J. A., R. F. Scherer, J. D. Brodzinski, J. F. Quinn and M. F. Ainina (1999). "Global
leadership skills and reputational capital: Intangible resources for sustainable
competitive advantage." Academy of Management Executive 13(1): 58-69.
Petts, N. (1997). "Building growth on core competences: A practical approach." Long
Range Planning 30(4): 551-561.
Pettus, M. L. (2001). "The resource-based view as a developmental growth process:
Evidence from the deregulated trucking industry." Academy of Management
Journal 44(4): 876-896.
Phillips, L., D. Chang and R. D. Buzzell (1983). "Product quality, cost position and
business performance: A test of some key hypotheses." Journal of Marketing: 26-
43.
Pitelis, C. N. and M. W. Whal (1998). "Edith Penrose: Pioneer of stakeholder theory."
Long Range Planning 31(2): 252-261.

348
Pitt, M. and K. Clarke (1999). "Competing on competence: A knowledge perspective on
the management of strategic innovation." Technical Analysis & Strategic
Management 11(3): 301-316.
Pivka, M. (2004). "ISO 9000 value-added auditing." Total Quality Management 15(3):
345-353.
Pock, T., A. H. Westlund and F. Fahrni (2004). "Gaining bilateral benefit through holistic
performance management and reporting." Total Quality Management 15(5-6):
557-567.
Porter, L. J. and A. J. Parker (1993). "Total quality management. The critical success
factors." Total Quality Management 4(1): 13-22.
Porter, L. J. and S. J. Tanner (1998). Assessing business excellence. Oxford,
Butterworth-Heinemann.
Porter, L. J. and S. J. Tanner (2003). Assessing business excellence. Oxford,
Butterworth-Heinemann.
Porter, M. (1985). Competitive advantage. New York, The Free Press.
Powell, T. C. (1992a). "Organizational alignment as a source of competitive advantage."
Strategic Management Journal 13: 119-134.
Powell, T. C. (1992b). "Strategic planning as a source of competitive advantage."
Strategic Management Journal 13: 551-558.
Powell, T. C. (1993). "Administrative skills as a competitive advantage. Extending
Porter's analytical framework." Canadian Journal of Administrative Science 10:
141-153.
Powell, T. C. (1995). "TQM as competitive advantage. A review and empirical study."
Strategic Management Journal 16: 15-37.
Powell, T. C. (1997). "Information technology as a competitive advantage: The role of
human, business and technological resources." Strategic Management Journal
18: 375-405.
Powell, T. C. (2001). "Competitive advantage: Logical and philosphical considerations."
Strategic Management Journal 22: 875-888.

349
Prabhu, V. B. and A. Robson (2000). "Impact of leadership and senior management
commitment on business excellence: An empirical study in the North East of
England." Total Quality Management 11(4/5 & 6): S399-S409.
Prabhu, V. B. and A. Robson (2001). Business Excellence and perceived
competitiveness: Evidence from North East Businesses. The 6th World
Conference for Total Quality Management, St. Petersburg, Russia.
Prahalad, C. K. (2000). "Emerging work." Executive Excellence: 5-6.
Prahalad, C. K. and G. Hamel (1990). "The core competence of a corporation." Harvard
Business Review 68(3): 79-91.
Prajogo, D. I. and A. S. Sohal (2004). "The sustainability and evolution of quality
improvement programmes: An Australian case study." Total Quality Management
15(2): 205-220.
PriceWaterhouseCoopers (2000). Report on the evaluation of the public sector
excellence programme: Main report. London, PriceWaterhouseCoopers.
Priem, R. L. and J. E. Butler (2001). "Is the resource-based "view" a useful perspective
for strategic management research?" Academy of Management Review 26(1):
22-40.
Print, C. F. (2004). People value: There's no accounting for people. Henley, Henley
Centre for Value Improvement: 29.
Przasnyski, Z. H. and L. S. Tai (2002). "Stock performance of Malcolm Baldrige National
Award winning companies." Total Quality Management 13(4): 475-488.
Rahman, S. (2001). "Total quality management practices and business outcomes:
Evidence from small and medium enterprises in Western Australia." Total Quality
Management 12(2): 201-210.
Rahman, S. (2004). "The future of TQM is past. Can TQM be resurrected?" Total Quality
Management 15(4): 411-422.
Rajan, M. and N. Tamimi (1999). "Baldrige award winners: The payoff to quality." Journal
of Investing 8(4): 39-42.
Rajan, M. and N. Tamimi (2003). "Pay-off to ISO9000 registration." Journal of Investing
12(1): 7177.

350
Ramanujam, V. and N. Venkatraman (1988). "Excellence, planning, and performance."
Interfaces 18(3): 23-31.
Ramirez, C. and T. Loney (1993). Baldrige award winners identify the essential activities
of a successful quality process. Quality Digest: 38-40.
Ramos-Rodriguez, A. R. and J. Ruiz-Navarro (2004). "Changes in the intellectual
structure of strategic management research: A bibliometric study of the Strategic
Management Journal." Strategic Management Journal 25(10): 981-1004.
Rao, M. P., M. A. Youssef and C. J. Stratton (2004). "Can TQM lift a sinking ship? A case
study." Total Quality Management 15(2): 161-171.
Rao, S. S., L. E. Solis and T. S. Raghunathan (1999). "A framework for international
quality management research: Development and validation of a measurement
instrument." Total Quality Management 10: 1047-1075.
Redman, T., B. Mathews, A. Wilkinson and E. Snape (1995). "Quality management in
services: Is the public sector keeping pace?" Quality Management in Services
8(7): 21-34.
Reed, D. (1995). Public test on the award model. UK Quality.
Reed, R., D. J. Lemak and N. P. Mero (2000). "Total quality management and
sustainable competitive advantage." Journal of Quality Management 5: 5-26.
Reiner, G. (2002). Analysis of the critical factors of company success based on the
EFQM Excellence Model®. Business Excellence. Make it happen!, Verona,
Sinergie-Ueim.
Remenyi, D. (2004). The central question in academic research: What is an academic
contribution? Research Techniques Workshop, Henley Management College.
Remenyi, D., B. Williams, A. Money and E. Swartz (1998). Doing research in business
and management. London, Sage publications.
Rindova, V. and C. J. Fombrum (1999). "Constructing competitive advantage: The role of
the firm-constituent interactions." Strategic Management Journal 20: 691-710.
Rogerson, J. H. (2002). Total quality management (TQM). International encyclopaedia of
business and management. M. Warner. London, Thompson Learning: 6491-
6498.

351
Rose, E. L. and K. Ito (1996). "Knowledge creation through the internal information
market: An integration of total quality management." Quality Management Journal
3: 87-102.
Rosenbloom, R. S. (2000). "Leadership, capabilities and technological change: The
transformation of NCR in the electronic era." Strategic Management Journal
21(10-11): 1083-1104.
Rucci, A. J., S. P. Kirm and R. T. Quinn (1998). "The employee-customer-profit chain at
Sears." Harvard Business Review 76: 84-97.
Rugman, A. M. and A. Verbeke (2002). "Edith Penrose's contribution to the resource-
based view of strategic management." Strategic Management Journal 23: 769-
780.
Sá, P. (2004). Design of Leadership Excellence Instrument. P. conversation. Edinburgh.
Sá, P. and G. Kanji (2003). "Leadership for excellence in the Portuguese municipalities:
Critical success factors and improvement strategies." Total Quality Management
14(2): 131-139.
Santhanam, R. and E. Hartono (2003). "Issues in linking information technology capability
to firm performance." MIS Quarterly 27(1): 125-153.
Saraph, J. V., P. G. Benson and R. G. Schroeder (1989). "An instrument for measuring
the critical success factors of total quality management." Decision Sciences 20:
810-829.
Saunders, M., P. Lewis and A. Thornhill (2003). Research methods for business
students. Essex, Pearson Education.
Savolainen, T. (1999). Strategies for achieving business excellence: An ideological
perspective. The 53rd Annual Quality Congress, ASQ.
Savolainen, T. (2000a). "Leadership strategies for gaining business excellence through
TQM. A Finish Case Study." Total Quality Management 11(2): 211-226.
Savolainen, T. (2000b). "How organisations promote and avoid learning: Development of
positive and negative learning cycles." Journal of Workplace Learning 12(5): 195-
204.

352
Scandura, T. A. and E. A. Williams (2000). "Research methodology in management:
Current practices, trends, and implications for future research." Academy of
Management Journal 43(5): 1248-1264.
Schaffer, R. H. and H. A. Thompson (1992). "Successful change programs begin with
results." Harvard Business Review 70(1): 80-89.
Schendel, D. and G. R. Patton (1978). "A simultaneous equation model of corporate
strategy." Management Science 24(15): 1611-1621.
Schoeffler, S., R. D. Buzzell and D. Heany (1974). "Impact of strategic planning on profit
performance." Harvard Business Review 52: 135-45.
Scholtes, P. R. (1999). "The new competencies of leadership." Total Quality Management
10(4 & 5): S704-S710.
Schriesheim, C. A. and R. J. Eisenbach (1995). "An exploratory and confirmatory factor-
analytic investigation of item working on the obtained factor structures of survey
questionnaire measures." Journal of Management 21(6): 1177-1193.
Schriesheim, C. A., K. J. Powers, T. A. Scandura, C. C. Gardiner and M. J. Lankau
(1993). "Improving construct measurement in management research: Comments
and a quantitative approach for assessing the theoretical content adequacy of
paper-and-pencil survey-type instruments." Journal of Management 19(2): 385-
417.
Schroeder, R. G., K. A. Bates and Junttila (2002). "A resource-based view of
manufacturing strategy and relationship to manufacturing performance." Strategic
Management Journal 23: 105-117.
Schwab, D. P. (1980). Construct validity in organization behavior. Research in
organizational behavior. B. M. Straw and L. L. Cummings. Greenwich, CT, JAI
Press. 2: 3-43.
Schwab, D. P. (1999). Research methods for organisational studies. New Jersey,
Lawrence Erlbaum Associates.
Seddon, J. (1997). "Ten arguments against ISO9000." Managing Service Quality 7(4):
162.

353
Seddon, J. (1998). "The business excellence model: Will it deliver?" Management
Services 42(10): 8-9.
Selznick, P. (1957). Leadership in administration. New York, Harper & Row.
Sharma, S. (1996). Applied multivariate techniques. Hoboken, John Wiley & Sons Inc.
Sharma, S., R. G. Netemeyer and V. Mahajan (1990). In search of excellence revisited:
An empirical evaluation of Peters and Waterman's attributes of excellence.
Enhancing knowledge development in marketing. W. O. Bearden and A.
Parasuraman. Chicago, American Marketing Association. 1: 322-328.
Shea, C. M. (1999). "The effect of leadership style on performance improvement on a
manufacturing task." Journal of Business 72(3): 407-422.
Shetty, Y. K. (1993). "The quest for quality excellence: Lessons from the Malcolm
Baldrige quality award." S.A.M. Advanced Management Journal 58(2): 34-40.
Shook, C. L., D. J. Ketchen, G. T. Hult, M. and K. M. Kacmar (2004). "An assessment of
the use of structural equation modeling in strategic management research."
Strategic Management Journal 25(4): 397-404.
Simerly, R. L. and L. Mingfang (2000). "Environmental dynamism, capital structure and
performance: A theoretical integration and an empirical test." Strategic
Management Journal 21: 31-49.
Simms, A. C., J. Bowles, P. B. Crosby, B. T. Gale and D. A. Garvin (1991). "Does the
Baldrige award really work?" Harvard Business Review 69: 126-147.
Simons, T. L. (1995). "Top management team consensus, heterogeneity, and debate as
contingent predictors of company performance: The complementarity of group
structure and process." Academy of Management Best Papers Proceedings: 62-
66.
Simons, T. L., L. H. Pelled and K. A. Smith (1999). "Making use of difference: Diversity,
debate and decision comprehensiveness in top management teams." Academy
of Management Journal 42(5): 662-673.
Sirkin, H. L. and G. Stalk (1995). "Accept no compromises." Journal of Business Strategy
16(4): 25-26.
Smith, H. W. (1981). Strategies of social research. Englewood Cliffs, Prentice-Hall.

354
Snow, C. C. and G. Hrebiniak (1980b). "Strategy, distinctive competence and
organizational performance." Administrative Science Quarterly 25: 317-336.
Sobo, E. J. and B. L. Sadler (2002). "Improving organizational communication and
cohesion in a health case setting through employee-leadership exchange."
Human Organization 61(3): 277-287.
Soderling, R. A., E. Lindhult, J. Sundqvist and P. M. Wijkman (2003). From capabilities to
practices: A study of the use of best practices in manufacturing companies in
Sweden on a survey from New Zealand. 17th Nordic Conference on Business
Studies, Reykjavik.
Stading, G. L. and R. J. Vokurka (2003). "Building quality strategy content using the
process from national and international quality awards." Total Quality
Management 14(8): 931-946.
Stalk, G., P. Evans and L. Shulman (1992). "Competing on capabilities: The new rules of
corporate strategy." Harvard Business Review 70(2): 57-69.
Steers, R. M. (1975). "Problems in the measurement of organizational effectiveness."
Administrative Science Quarterly 20: 546-558.
Stevenson, H. H. (1976). "Defining corporate strengths and weaknesses." Sloan
Management Review 17: 51-68.
Su, C.-T., S.-C. Li and C.-H. Su (2003). "An empirical study of the Taiwan National
Quality Award causal model." Total Quality Management 14(8): 875-893.
Sun, H. (2000). "Total quality management, ISO 9000 certification and performance
improvement." The International Journal of Quality & Reliability Management
17(2): 168-179.
Sureshchandar, G. S., C. Rajendran and R. N. Anantharaman (2003). "The influence of
total quality service age on quality and operational performance." Total Quality
Management 14(9): 1033-1052.
Sussland, W. A. (2001). "Creating business value through intangibles." Journal of
Business Strategy: 23-28.
Sveiby, K. (2001). "A knowledged-based theory of the firm to guide in strategy
formulation." Journal of Intellectual Capital 2(4): 344-358.

355
Swords, D. (1999). "Defining and measuring innovation." Henley Working Paper
Series(HWP 9916): 1-35.
Swords, D. and I. Turner (1997). Strategy from the inside out. London, International
Thompson Business Press.
Szulanski, G., S. Winter and R. Cappetta (2000). Knowledge transfer within the firm: A
replication perspective on stickiness. Philadelphia, The Wharton School: 37.
Tanner, S. J. (2002). DBA Stage 1 Thesis Critique. Henley, Henley Management College.
Tanner, S. J. (2004a). The impact of Business Excellence on public sector and private
sector performance. 7th Toulon-Verona Conference on Quality in Services,
Toulon, France, Université du Sud Toulon-Var.
Tanner, S. J. (2004b). Collecting your data: Far more than a foregone conclusion. Henley
Working Paper Series. Henley.
Tanner, S. J. (2004c). Thesis completion risk analysis. USA Theme Group, Muscoda,
Wisconsin.
Tanner, S. J. (2004d). Change or die! South East Excellence, Reading.
Tanner, S. J. (2004e). Does excellence lead to a customer advantage? Performance and
Efficiency, London.
Tanner, S. J. (2004j). Impact of Business Excellence leadership on performance.
Leadership refrains: Encounters, conversations and enchantments, Exeter,
Centre for Leadership Studies.
Tanner, S. J., F. Duffy and L. J. Porter (1995). Journey to a better way of life. Self-
Assessment: 43-46.
Tanner, S. J. and J. S. Oakland (2004f). Does excellence work in the public sector? BQF
Public Sector Conference, Kendall.
Tanner, S. J. and J. S. Oakland (2004g). Going public. UK Excellence.
Tanner, S. J. and R. Walker (2002). The benchmarking roadmap. Leeds, European
Centre for Business Excellence.
Taylor, J. (1998). "Gift-wrapped improvement." UK Excellence.
Teece, D. J. (2000). "Strategies for managing knowledge assets: The role of firm
structure and industrial context." Long Range Planning 33(1): 35-54.

356
Teece, D. J., G. Pisano and A. Shuen (1997). "Dynamic capabilities and strategic
management." Strategic Management Journal 18(7): 509-533.
Tena, A. B. E., J. C. B. Llusar and V. R. Puig (2001). "Measuring the relationship between
total quality management and sustainable competitive advantage: A resource-
based view." Total Quality Management 12(7 & 8): 932-938.
Terziovski, M. and D. Samson (1999). "The link between total quality management
practice and organisational performance." International Journal of Quality and
Reliability Management 16(3): 226-237.
Terziovski, M. and D. Samson (2000). "The effect of company size on the relationship
between TQM strategy and organisational performance." The TQM Magazine
12(2): 144.
Terziovski, M., A. Sohal and S. Moss (1999). "Longitudinal analysis of quality
management practices in Australian organizations." Total Quality Management
10(6): 915-926.
Thawani, S. (2004). "Six sigma - Strategy for organizational advantage." Total Quality
Management 15(5-6): 655-664.
Thomas, A. B. (1988). "Does leadership make a difference in organizational
performance." Administrative Science Quarterly 33: 388-400.
Thomas, H., T. Pollock and P. Gorman (1999). "Global strategic analysis: Frameworks
and approaches." Academy of Management Executive 13(1): 70-82.
Thomas, L. G. and R. D'Aveni (2004). The rise of hypercompetition in the US
manufacturing sector, 1950 to 2002: 44.
Tierney, P., S. M. Farmer and G. B. Graen (1999). "An examination of leadership and
employee creativity: The relevance of traits and relationships." Personnel
Psychology 52: 591-620.
Trochim, W. M. K. (2001). The research methods knowledge base. Cincinnati, OH,
Atomic Dog Publishing.
Tsu, S. (1988). The art of war. Boston, Shambhala.
Ulrich, D. and A. Yeung (1989). A shared mindset. HR Magazine. 34: 38-46.

357
Venkatraman, N. and V. Ramanujam (1986). "Measurement of business performance in
strategy research: A comparison of approaches." Academy of Management
Review 1(4): 801-814.
Vokurka, R. J. and G. L. Stading (2000). "A comparative analysis of national and regional
quality awards." Quality Progress 33(8): 41-50.
Voss, C. A., N. Tsikriktsis, B. Funk, D. Yarrow and J. Owen (2004). Managerial choice
and performance in service management: A comparison of private sector
organisations with public sector further education colleges.: 42.
Waldman, D. A. (1994). "The contributions of total quality management to a theory of
work performance." Academy of Management Review 19: 510-536.
Waldman, D. A., G. Ramirez, G. and R. J. House (2001). "Does leadership matter? CEO
leadership attributes and profitability under conditions of perceived environmental
uncertainty." Academy of Management Journal 44(1): 134-143.
Walsh, S. T. and J. D. Linton (2001). "The competence pyramid: A framework for
identifying and analyzing firm and industry competence." Technology Analysis &
Strategic Management 13(2): 165-177.
Warwood, S. J. and P. A. B. Roberts (2004). "A survey of TQM success factors in the
UK." Total Quality Management 15(8): 1109-17.
Watson, J. G. and A. R. Korukonda (1995). "The total quality management jungle: A
dialectical analysis." International Journal of Quality and Reliability Management
12: 100-109.
Webb, J. and C. Gile (2001). "Reversing the value chain." Journal of Business Strategy:
13-17.
Weber, R. (2003). "Theoretically speaking." MIS Quarterly 27(3): iii-xii.
Weber, R. (2004). "The rhetoric of positivism versus interpretivism: A personal view." MIS
Quarterly 28(1): iii-xii.
Weber, R. P. (1985). Basic content analysis. Beverly Hills, Sage Publications.
Webley, P. and J. Cartright (1996). "The implicit psychology of total quality management."
Total Quality Management 7: 483-492.

358
Webster, J. and R. T. Watson (2002). "Analyzing the past to prepare for the future:
Writing a literature review." MIS Quarterly 26(2): xiii-xxiii.
Wernerfelt, B. (1984). "A resource-based view of the firm." Strategic Management Journal
5: 171-180.
Wiklund, J. and D. Shepherd (2003). "Knowledge-based resources, entrepreneurial
orientation, and the performance of small and medium-sized businesses."
Strategic Management Journal 24: 1307-1314.
Wilberg, E. (2003). An investigation into leadership practices and performance of
newspapers in Norway and Sweden. Henley Management College. Henley,
Brunel University: 221.
Wilkinson, A., T. Redman and E. Snape (1993). Quality and the manager: An Institute of
Management report. Corby, Institute of Management.
Wilkinson, A. and H. Wilmott (1994). Making quality critical - new perspectives on
organisational change. London, Routledge.
Williams, R. and J. Boudewijn (1994). Quality leadership in Taiwan, European Foundation
for Quality Management.
Wilson, L. and R. Durant (1995). "Evaluating TQM: The case for a theory driven approach
(total quality management)." Public Administration Review(2): 137-46.
Winn, B. A. and K. S. Cameron (1998). "Organizational quality: An examination of the
Malcolm Baldrige quality framework." Research in Higher Education 39(5): 491-
512.
Winter, S. (2000). "The satisficing principle in capability." Strategic Management Journal
21: 981-996.
Winter, S. (2003). "Understanding dynamic capabilities." Strategic Management Journal
24: 991-995.
Winterscheid, B. C. (1994). Building capacity from within: The insider's view of core
competence. Competency-based competition. G. Hamel and A. Heene.
Chichester, Wiley: 265-292.

359
Wisner, J. D. and S. G. Eakins (1994). "A performance based assessment of the US
Baldrige quality award winners." International Journal of Quality and Reliability
Management 11(2): 8-25.
Wright, P. M., B. B. Dunford and S. A. Snell (2001). "Human resources and the resource-
based view of the firm." Journal of Management 27(6): 701-721.
Wright, P. M. and G. C. McMaham (1992). "Theoretical perspectives on strategic human
resource management." Journal of Management 18: 295-320.
Wruck, K. H. and M. C. Jensen (1998). "The two key principles behind effective TQM
programmes." European Financial Management 4: 401-423.
Yarrow, D., P. Hanson and A. Robson (2004). "Made in the 21st century: How far have
we come on the journey to excellence?" Total Quality Management 15(5-6): 829-
839.
Youssef, M. A., J. Boyd and E. Williams (1996). "The impact of total quality management
on firm's responsiveness: an empirical analysis." Total Quality Management 7:
127-144.
Youssef, M. A. and M. Zairi (1995). "Benchmarking critical factors for TQM. Part 2:
Empirical results from different regions in the world." Benchmarking for Quality
Management and Technology 2(2): 3-19.
Yusof, S. M. and E. Aspinwall (1999). "Critical success factors for total quality
management implementation in small and medium enterprises." Total Quality
Management 10(4 & 5): S803-S809.
Yusof, S. M. and E. Aspinwall (2000). "Total quality management implementation
frameworks: Comparison and review." Total Quality Management 11(3): 281-294.
Zahra, S. A. (1999). "The changing rules of global competitiveness in the 21st century."
Academy of Management Executive 13(1): 36-42.
Zain, Z. M., B. G. Dale and D. F. Kehoe (2001). "Doctoral TQM research: A study of
themes, directions and trends." Total Quality Management 12(5): 599-609.
Zairi, M. (1995). "Leadership in TQM implementation: Some case examples." American
Journal of Management Development 1: 37- 44.
Zairi, M. (1999). "Managing excellence leadership." The TQM Magazine 11: 215-220.

360
Zollo, M. and S. Winter (2002). "Deliberate learning and the evolution of dynamic
capabilities." Organization Science 13: 339-351.
Zott, C. (2003). "Dynamic capabilities and the emergence of intraindustry differential firm
performance: Insights from a simulation study." Strategic Management Journal
24: 97-125.

361
8 Appendix 1: Abbreviations
Abbreviation Definition
AMOS Analysis of Moment Structures
ASQ American Society for Quality
BQF British Quality Foundation
CDP Competency Development Plan
CPA Comprehensive Performance Assessment ratings
CSF Critical Success Factor (in relationship to the successful
implementation of Business Excellence)
CSR Corporate and Social Responsibility
EFQM European Foundation for Quality Management
ESOE European Society for Organizational Excellence
EFA Exploratory Factor Analysis
IT Information Technology
ICMOT International Centre for Management of Technology
LUBS Leeds University Business School
MBNQA Malcolm Baldrige National Quality Award
MBRR Management by Research Results
MCAR Missing Completely at Random
MLQ Multifactor Leadership Questionnaire
MSA Measure of Sampling Adequacy
NIST American National Institute of Standards and Technology
PBV Practice-based View of the Firm
PLS Partial Least Squares
RBV Resource-based View of the Firm
SCA Sustainable Competitive Advantage
SEM Structured Equation Modeling
SIF Strategic Industry Factors
SOA Sustained Organizational Advantage
SHRM Strategic Human Resource Management
SME Small-Medium Enterprise
SPSS Software Package for the Social Sciences
TQM Total Quality Management
WHU West Ham United

362
9 Appendix 2: Original instruments from the literature
9.1 Appendix 2.1: Competitive environment/turbulence instrument
Robustness can be defined as an organization’s ability to adopt to new challenges
in the business environment (threats and opportunities) without being forced to
change strategy or structure. Assess your company’s robustness to changes in
the competitive landscape compared to other companies in the same market and at
a similar stage of development.
1. Business concept
2. Long-term goals
3. Financial strategy
4. Market strategy
5. Supplier strategy
6. R & D strategy
7. Human resource strategy
8. Organizational structure
9. Financial platform
10. Product/ service portfolio
11. Competence/ knowledge base
Assess in a similar way your company’s ability to give quick and adequate
responses to changes in the environment (legislative, technological, competitive,
customer demands etc).
1. Sense potential threats (legislative, technological, competitive, customer
demands etc.)
2. Conceptualise a response and make decisions and plans to meet threats
3. Reconfigure resources and implement necessary changes to meet threats
1. Sense new business or technological opportunities
2. Conceptualise a response and make decisions and plans to exploit opportunities
3. Reconfigure resources and implement necessary changes to exploit opportunities
Adapted from Lindgren (2001)

363
9.2 Appendix 2.2: Kanji’s Leadership Excellence instrument
Factor Statements
Organizational
values
Leaders develop shared meanings and interpretations of reality
Leaders use the organizational principles to guide decision-
making
Leaders put in place reinforcement systems that are consistent
with organizational values and principles
Vision Leaders create a compelling vision of the future of the
organization
Leaders communicate the vision effectively
Leaders inspire confidence in the vision
Mission Leaders identify the organization‟s purpose
Leaders generate commitment among organizational members
for the chosen purpose
Strategy Leaders develop policies and strategies consistent with the
organization‟s mission, vision and values
Leaders anticipate and guide change
Leaders monitor resources and organizational performance and
use feedback to review strategies for customer satisfaction
Key issues Leaders align the organization‟s structure to support delivery of
its policy and strategy
Leaders give subordinates authority to act and make decisions
Leaders communicate and build supportive relationships with
peers and subordinates in order to motivate people
Leadership
excellence
Leaders are accessible, actively listen and respond to people
Leaders promote discussion, feedback and involvement
Leaders identify best practices in leadership
Adapted from Kanji (2002)

364
9.3 Appendix 2.3: List of assets and capabilities Assets Capabilities
1. Public knowledge
2. Structure
3. Customer focus
4. Employee know-how
5. Staff skills and competences
6. Networks
7. Specialist physical resource
8. Databases
9. Supplier know-how
10. Distributor know-how
11. Intellectual property rights
12. Trade secrets
13. Finance
14. Reputation
15. Product reputation
16. Contracts/ installed customer base
1. Culture
2. Leadership
3. Processes and systems
4. Co-ordination and co-operation
5. Learning
6. Capture customer information
7. Customer service/ product support
8. Low cost production
9. Speed and flexibility in the design
of new products or services
10. Continuous improvement

365
9.4 Appendix 2.4: Strategic response capability instrument Robustness can be defined as an organization’s ability to adopt to new challenges
in the business environment (threats and opportunities) without being forced to
change strategy or structure. Assess your company’s robustness to changes in
the competitive landscape compared to other companies in the same market and at
a similar stage of development.
1. Business concept
2. Long-term goals
3. Financial strategy
4. Market strategy
5. Supplier strategy
6. R & D strategy
7. Human resource strategy
8. Organizational structure
9. Financial platform
10. Product/ service portfolio
11. Competence/ knowledge base
Assess in a similar way your company’s ability to give quick and adequate
responses to changes in the environment (legislative, technological, competitive,
customer demands etc).
1. Sense potential threats (legislative, technological, competitive, customer
demands etc.)
2. Conceptualise a response and make decisions and plans to meet threats
3. Reconfigure resources and implement necessary changes to meet threats
4. Sense new business or technological opportunities
5. Conceptualise a response and make decisions and plans to exploit
opportunities
6. Reconfigure resources and implement necessary changes to exploit
opportunities
Adapted from Lindgren (2001)

366
9.5 Appendix 2.5: The performance scale Factor Statements
Performance (Hart and Banbury (1994))
Current profit
Has high profitability/ return on assets
Has a positive cash flow
Growth/ share Has a positive sales growth/ increased funding
Has an increasing market share/ share of budget
Future position Will seek to diversify in the marketplace
Will change its existing products and services
Will introduce new products and services next year
Will have an active product and services
development programme
Quality Good overall organization performance
High employee satisfaction
High standard of quality in products and services
Social responsiveness Is environmentally responsible
Has an active involvement in the local community
Business Excellence (Kanji (2002))
N/A Has strong financial performance
Has high customer demand
Achieves its goals
Has performed recruitment and admission of
employees effectively
Has achieved the desired product and services
outcomes
Has performed recruitment of outstanding staff
Has the ability to retain outstanding staff

367
Factor Statements
Quality management results (Claver, Tari et al. (2003))
Customer satisfaction This organization is not concerned about collecting
information from its customers in order to measure
their satisfaction (*)
Customer satisfaction has historically shown
improvements
This organization has implemented a process to
listen to and solve customer complaints
Employee satisfaction This organization collects relevant information from
employees to measure their satisfaction
Employee satisfaction has historically improved.
Absenteeism is high (*)
Employee rotation is low.
Social impact Policies are developed to reduce and prevent health
and safety risks
Policies are developed to protect the environment
This organization is not much actively involved in the
community*
TQM performance Our financial results have been excellent
Our quality programme has increased our revenue
Our quality programme has increased our yield
Our quality programme has improved our competitive
position
Our quality programme has improved our
performance in general
Our quality programme has had a negative impact
upon our profitability
We could have done better (i.e. obtained better
financial results) without a quality programme
Note: (*) represented reverse coded item
Adapted from Hart and Banbury (1994); Kanji (2002); Claver, Tari et al. (2003)

368
10 Appendix 3: Feedback on draft questionnaire 10.1 Appendix 3.1: Practioners’ focus group feedback
summary
Part 1
o Sequencing of questions (parts a and b) caused confusion
Part 2
o No major issues
Part 3
o Respondents struggled with the time lengths but most completed the
section
o Respondents could readily list the top strengths and weaknesses but
question may have wrong emphasis (did not lead to strategic responses)
o Asking the public sector respondents if they are „ahead‟ is a problem
Part 4
o Some comments on terminology, e.g., what is Sustainability?
Part 5 (Leadership)
o Issues relating to confidentiality raised

369
10.2 Appendix 3.2: Private and public sector focus group feedback summary
Feedback from Private sector group• Some word ing suggestions on introduction
• Time taken to complete 20-30 minutes
• Length of questionnaire would be a concern for CEOs – suggested pre-contact to get buy-in or face to face conversation
• Concern over dependence on CEO awareness – suggest send questionnaire to other directors as well as CEO
• Multiple issues in questions (were in original scales or where have adapted for public sector)
• Need for ‘Not applicable’ or instruction to leave blank
• Part 3 was difficult to complete (most people did not do it)
• Some questions were loaded particularly around the staff satisfaction issues. Also enabler/ results mix
• Concern raised on confidentiality
• Suggest make it a web-based survey with a a better layout (less wordy)
• Issue raised about a 7-point scale (prefer 6-point scale)
• Suggestion to get the self-completed part pre-completed
Feedback from Public sector group• Do not like multiple questions in one question
• Time taken to complete 20-30 mins
• Many concepts require definition, e.g., customer, vulnerable and business
• Suggest use 2 separate questionnaires
• Need a box for ‘not relevant’
• Need to define meaning of middle box (Neutral, not sure, etc.)
• Inconsistency depending on person completing (CEO or below)
• Some sections do not have numbered questions
• Confusion on branch on part 1
• Question 1.6 ambiguous
• Reword ‘Human Resources’ in part 2. Also separate questions into current position and future plans
• Question 2.2 relevance of ‘new business opportunities’ to public sector and meaning of ‘sense’ (passive or active)
• In Part 3 are the similar organisations obvious. Also are you asking for 2-3 in total or 2-3 per question. Also should the As and Cs be in priority order?
• Question value of answers ‘time to replace’
• Part 4 – what is the comparison against?

370
11 Appendix 4: The final questionnaire

371
12 Appendix 5: Analysis of outliers by item Part Item Item Description # Outliers Potential Cause
One - Environment 1.3 There are many unforeseen threats that we have to
cope with.
1 Not examined
Two - Capability 2.3 Business concept/ Raison d‟êtré. 19 Not due to pubic / private
Not due to Whole organization/ business unit
Not due to level of leadership
Four - Performance 4.1 Has a high customer demand/ Has a high demand for
its services.
8 Mainly private – only 1 public
Mainly whole – 1 business unit
Not due to level of leadership
4.4 Has implemented a process to listen to and solve
customer complaints.
26 Not due to pubic / private
Not due to Whole organization/ business unit
Not due to level of leadership
4.7 Has a high standard of quality in service and/ or
products.
17 Not due to pubic / private
Mainly whole – 1 business unit
Not due to level of leadership
4.19 Develops policies to reduce and prevent health and
safety risks.
9 Not due to pubic / private
Mainly whole – 1 business unit
Not due to level of leadership

372
Part Item Item Description # Outliers Potential Cause of Outlier
Five – Leadership
excellence
5.7 Leaders identify the organization‟s purpose. 20 Not due to pubic / private
Not due to Whole organization/ business unit
Not due to level of leadership
5.10 Leaders develop policies and strategies consistent with
the organization‟s mission, vision and values.
21 Not due to pubic / private
Not due to Whole organization/ business unit
No „Most senior executive‟
5.11 Leaders anticipate change. 24 Not due to pubic / private
Not due to Whole organization/ business unit
No „Most senior executive‟
5.15 Leaders monitor resources and use feedback to review
strategies for customer satisfaction.
24 Not due to pubic / private
All due to Whole organization
Not due to level of leadership
5.20 Leaders are accessible. 21 Not due to pubic / private
Mainly Whole organization – just 2 business unit
No „Most senior executive‟

373
13 Appendix 6: Cluster analysis of variates by category
Category Percent Cluster 1 Percent Cluster 1
Private Vs
Public
Private Public Private Public
82% 75% 18% 25%
Whole Vs
Business Unit
Whole Business Unit Whole Business Unit
79% 77% 21% 23%
Leadership
Level
Level % Cluster 1 % Cluster 1 % Cluster 1 % Cluster 1
Most Senior
(N=59)
42% 14% 32% 12%
Senior
(N=101)
29% 22% 32% 18%
Middle
(N=25)
28% 36% 12% 24%
Other
(N=8)
25% 50% 0% 2%

374
14 Appendix 7: Initial SEM model
LeadershipExcellence Capability
OverallResults
P5.21 P5.22
P5.24 P5.25 P5.26
P5.23P5.20
e11 e21 e31 e41
e51 e61 e71
1
P2.22_1P2.19_1P2.18_1P2.20_1P2.17_1P2.1_1P2.21_1
P2.3_1 P2.4_1
P2.5_1
P2.6_1
P2.11_1P2.12_1P2.8_1 P2.14_1P2.15_1P2.9_1
e81 e91 e101 e111 e121 e131 e141
e151e16
e19 e20 e21 e22 e23 e24
e17
e18
P4.14_1P4.13_1P4.11_1P4.10_1P4.12_1P4.18_1P4.17_1P4.19_1P4.8_1 P4.16_1
P4.15_1
P4.34_1P4.29_1P4.33_1P4.30_1
P4.39_1P4.31_1P4.32_1 P4.1_1 P4.2_1 P4.4_1 P4.3_1 P4.7_1
P4.5_1
P4.6_1
e251 e261 e271 e281 e291 e301 e311 e321 e331
e341 e351 e361 e371
e421
e431
e381 e391 e401 e411 e471 e481 e491e501
e451
e461e61
e60
e59
e56e57
e54
e55
e52
e62
e58
1 e53 1
e71
EMPLOYEE Results
1
EMPLOYEE Outcomes
1
1 1
EMPLOYEE Absence
11
SUSTAIN
COMMUNE
1
KEY OUTCOMES
1
CUSTOMER RESULTS
GOWTH
1
11
1
PRODS & SERV
E721
P4.24P4.36
P4.37
P4.35
P4.38
P4.22
P4.25
P4.21
P4.20
1e761
e731e741
e751
ORG OUTCOMES
e771
1
e811e82
1
e83
C&SR
e8411
e851
e801
1
P4.19
P4.23
e881e89
e871
e86
1
1
1
e91
1
RESP
1
1
1STRAT
1
1
1
1
1
KNOW
1
ORG
1
1
1 11 1
1
11

375
15 Appendix 8: Feedback from focus groups on interpretation
Public sector conference
Group Membership and Context
Presentation of a paper „Does Excellence work in the public sector?‟ at the BQF Public
Sector Conference in Kendal, 8 June 2004.
35 participants from both public and private sector organizations including leaders at
senior level and middle managers.
Focus of discussion on the interpretation of the results in relation to public sector and in
particular the benefits of Business Excellence and the link between Capability and
Performance.
Presentation was also published in a paper in the BQF journal „UK Excellence‟.
Main Comments on Interpretation
Interpretation was well accepted. In particular the parallel was drawn between
the results of this research and the concept of „Change Agile‟, which was derived
through a qualitative approach based on observations in several industries.
One question was raised about the Employee Results, the view being that
Leaders may have a biased view on employee performance. The fact that
leadership level was a categoric variable was considered to be a necessary test.
Some surprise was expressed at the lack of a relationship between Leadership
Excellence and Society Results. The general view was that a positive
relationship was expected, especially in the public sector.
Feedback from published paper provided support for findings.

376
Police focus group
Group Membership and Context
Presentation to 16 middle managers who held both serving police roles and civilian
support roles on 22 June 2004.
Focus was the interpretation of the results with respect the to Police and the link between
Capability and Performance. The sources of competitive advantage were also discussed.
Main Comments on Interpretation
General agreement that the Police have poor leadership and also are ineffective
at reacting to change due mainly to the culture, as the required tools and skills
are in place. This validated the leadership performance link and the leadership
capability link. This view was supported by a Chief Constable, who made the link
between this research and his decision to introduce an „Action Leadership‟
programme to improve his force‟s ability to react to change.
Employees were acknowledged to be a leading source of organizational
advantage in the Police.
The time to develop the culture was thought to be shorter than perceived. It was
a general view that the Police culture had developed over the last 100 years and
would therefore take considerable time to replace.

377
Academic conference
Group Membership and Context
Presentation of the paper „The Impact of Business Excellence on Public and Private
Sector Performance‟ at the 7th Toulon-Verona conference in Toulon, France on 2
September 03. Presentation of methodology, stakeholder results, linkage between
Business Excellence, Capability and Performance, and sources of competitive
advantage.
Attended by approximately 20 academics/ doctoral students from around the world.
Main Comments on Interpretation
Findings that Business Excellence as measured through Leadership Excellence
thought to be a valuable contribution. The linkage between Leadership,
Capability and Performance was considered to be an insight that no one else had
recognized before.
Some discussion on sources of advantage results. Comment made about the
difference between Staff Skills and Competences and Staff Know-how, as they
were considered to be similar terms.
Question about the political stakeholders in public sectors and whether this
should have been included as a separate stakeholder area. This was felt to be
particularly important in a European context.
Agreement on the observation that the operationalization of constructs for use in
the public service was under-developed. The questionnaire used in the study
was noted to be a contribution in itself and of a higher standard than other
research presented at the conference.

378
Academic focus group
Group Membership and Context
Wisconsin focus group help at Muscoda, USA on 25 September 04. Theme Group
attended by three professors and three research associates
Main Comments on Interpretation
The question was raised as to whether data should be collected after a period of
time to allow a longitudinal study. This would support the evidence of causality in
the model, particularly with hypothesis 5.
In the sources of organizational advantage the difference between „Employee
know-how‟ and „Staff skills and Competences‟ was questioned.
The result that the society results did not have a strong relationship in the models
was raised. It was suggested that this may be due to the long-term/ short-term
conflict, which is especially the case with these results, as investing in society is a
longer-term action.
Industry effects were also said to be of interest and the point was made that
„Industry‟ was not a particularly good label for the split between the public and
private sectors.
A final comment was that it was felt that the work had made a contribution both in
an academic and practical sense.

379
Private sector middle managers
Group Membership and Context
16 Middle managers from First Direct, a leading non-branch network bank that is part of
HSBC. Session held on 25 October 04 as part of an alumni event.
Main Comments on Interpretation
First Direct competes on its customer service reputation and for this it charges a
premium. It was felt that the reputation is delivered through two main
mechanisms: the customer focus of its people and its IT systems. There was
surprise that IT systems did not feature highly in the list of sources of
organizational advantage as it was felt that this was a major feature of the offer
and it was considered that their IT systems were difficult to replicate.
Alongside a very customer focused culture, which has been developed by the
leaders, there is a strong continuous improvement culture. In fact, Continuous
Improvement is one of the First Direct values. The culture allows them to react to
external changes, which was a key conclusion of the current research. However,
there was a perception that First Direct could not handle major changes in the
environment, as the continuous improvement culture coupled with paternal care
for its people proved to be resistive. This observation supports hypothesis 2b,
which was that the dynamic capabilities would be disrupted under highly dynamic
conditions. The focus group felt that although First Direct competed in a
competitive market, it was not in a hypercompetitive industry.
One final observation was that the capability to change was embedded in the
internal routines. First Direct does not have a mature approach to process
management.

380
Finance academic focus group
Group Membership and Context
Accounting & Finance Research Colloquium held at Henley Management College on 6
November 04. Theme Group attended by 19 Henley research faculty and research
associates
Main Comments on Interpretation
Some concern was raised regarding the dynamic capability aspects of the work
and in particular the link to social capital. The opinion was expressed that this a
very new area.
It was noted that other work looking at dynamic capabilities has been longitudinal
in nature in that „snapshots‟ of capabilities had been taken at two points in time to
see how they had developed.
In response to a question to the audience, none of the researchers could provide
a reference for a heuristic value for the coefficient of determination. The general
view was that an R2 of above 0.5 was good, but lower ones had been seen in the
literature.
There was a debate about the linkage of the work to the observation of
behaviours, which would place the work in the area of behavioural economics.
This stemmed from a discussion on appropriation, where it was suggested that,
in Business Excellence organizations, value is appropriated to the employees
and customer at the expense of the organization/ shareholders.
The appropriation discussion led to a further discussion on the Business
Excellence beliefs, which were possibly driving the behaviour. The view was
expressed that hypotheses that relate to behaviour cannot be proven.
A suggestion was made that Robert Thorpe at LUBS may be a good person to
talk to.
It was also suggested that there might be studies on public sector organizations
within the Leadership literature.

381
Original authors
Authors Main Comments on Interpretation
Richard D‟Aveni. Met Dick
at Dynamic Capabilities
Conference, Ostini, Italy held
between 8 to 10 July 04
Hypercompetition is a very difficult state to measure
and some argue that it does not exist. Most of the
work has been conducted in the manufacturing
sectors. It was not a surprise to Dick that an
environmental effect could not be detected.
Patricia Moura e Sá who I
met at the PMA2004
Conference in Edinburgh,
held between 28 to 30 July
04. Have also had an e-mail
exchange of the results with
Patricia.
The original Leadership Excellence instrument was
only used in Portugal and for municipal organizations.
The version I had based this research on had been
translated from Portuguese into English and had not
been used in this state.
Partial Least Squares (PLS) software had been used
for the analysis as Patricia‟s supervisor sold the
software and insisted that she used it. Patricia had
since tried to use Amos to replicate her work, but had
found Amos to be less forgiving. The result in this
work that failed to replicate the other constructs in
Patricia‟s model was not a surprise to Patricia, given
her own experience with Amos.
Richard Hall. Meeting 12
October 04 at Durham
Business School.
The difference between the two papers Dick
produced was that the first data came from a pilot in
the North-East of England and the second data came
from a full UK survey.
The categories used in Dick‟s surveys were
„invented‟. A key source for the material was Itami‟s
book. On reviewing the list in the current work, Dick
felt that the current list was more comprehensive. He
raised the question over the difference between
Employee Know-how and Skills and competencies.
In a discussion he also agreed that areas such as
Employee Know-how, Customer Focus and
Continuous Improvement were predictors of
Reputation.
Dick had problems with respondents estimating
Replacement Periods and in one example his thesis
showed a range of 0 to 175 years. It was suggested
that in assessing times it would have been useful to
have framed the question in the context of close

382
competitors.
Dick did not have a problem with non-respondents,
but his questionnaire was more detailed and gave
examples of the assets as opposed to just one-line
statements. His questionnaire only sought to collect
data on intangibles and so had a limited scope to the
current research.
Examining Dick‟s detailed results showed that there
was a good correlation between his original work and
the current study. Even though the times did vary,
the general pattern did not. It was also of interest that
Dick segmented his data by industry type and found
differences in responses between the industries. For
example, Supplier Know-how was one of the top
rated factors in diversifies industries. We agreed that
in reality the order was not completely reliable;
Dick noted the importance of the Coyne paper, which
he found by a chance meeting. He referred to the
people/ people independent split and referred to a
Mechanistic Vs Humanistic view of strategy.
The use of sustainable organizational advantage in
the current work was questioned. I explained why it
had been chosen and he was happy with the
response. Dick noted that in his work the sources of
sustainable advantage were easier to identify than the
sustainability of competitive advantage.
Dick‟s work also included a quantitative phase where
a number of case studies were produced to follow up
on the findings from the survey. What was
particularly noteworthy were the features defined
under the source of competitive advantage, culture.
These were:
Ability to manage change
Ability to innovate
Teamworking ability
Participative management style
Perception of high quality standards
Perception of high customer service