An investigation into increased cases of idiopathic infantile ...
119
An investigation into increased cases of idiopathic infantile hypercalcaemia Lisa Anne Amato A thesis in fulfilment of the requirements for the degree of Master of Medicine School of Women’s And Children’s Health Faculty of Medicine March 2019
-
Upload
khangminh22 -
Category
Documents
-
view
3 -
download
0
Transcript of An investigation into increased cases of idiopathic infantile ...

An investigation into increased cases of idiopathic infantile
hypercalcaemia
Lisa Anne Amato
A thesis in fulfilment of the requirements for the degree of
Master of Medicine
School of Women’s And Children’s Health
Faculty of Medicine
March 2019


Acknowledgements
iii
Acknowledgements It is with deepest gratitude that I would like to acknowledge a number of people who have
assisted me during the course of my candidature.
First and foremost, I would like to acknowledge the valuable input from my supervisor, Jan
Walker, who has worked tirelessly to assist me in the preparation of this study and writing of this
manuscript. Jan has been an inspirational mentor to me for many years and I have learnt so much
from her. She has fostered my interest in paediatric endocrinology and in the course of this work
has taught me to think critically and always ask the question ‘why?’. I am deeply indebted to her
for her time, patience and commitment.
I would like to thank my co-supervisor Kristen Neville who has also been an inspiring mentor to
me for many years and greatly assisted with this work. In particular Kristen has taught me the
importance of being organized and concise in both thinking and writing.
I am grateful for the expertise of Rory Clifton-Bligh and his team members Catherine Luxford and
Anne Richardson, at the Kolling Institute who provided the genetic testing for this project. I am
particularly grateful to Rory for sharing his passion for calcium genetics, his endless patience and
willingness to spend many hours answering my questions.
Acknowledgement should also be given to Helen Woodhead, Charles Verge, Shihab Hameed and
nursing staff from the Sydney Children’s Hospital Paediatric Endocrinology Department who
helped to provide guidance with this project and assisted with patient recruitment. In addition I
would like to thank Sean Kennedy and Adam Jaffe, both members of my supervising panel, who
guided and encouraged me through this process.
There were many people at SEALS Pathology who assisted me in gathering information for this
study. In particular I am grateful to Christopher White and Rita Horvath who helped me obtain
and interpret some of the information in the early days of this study. Alex Eigenstetter and Joanna
Stoj kindly sent me the many years of calcium data. Keith Westbury helped me to set up the

Acknowledgements
iv
blood collection for families, and both Teresa Hewlett and Christine Moffat helped me to obtain
detailed information regarding the calcium analysers.
I am grateful to Kylie Mallit, biostatistician, who has spent many hours looking at SPSS data sets
with me and helping me to interpret the statistical analyses in this study. I would also like to thank
medical student Wei Shern Quek for his assistance with data entry.
I owe a big thank you to the many doctors, allied health and administration staff at Campbelltown
Hospital who have provided support and encouragement and been willing to ‘hold the fort’ whilst
I took the time to finish writing up this work.
Of course, no study would be possible without the patients who agree to take part, and so I would
like to extend a huge thank you to the parents and children who kindly participated in this study.
I would also like to thank my wonderful family and friends, in particular my parents, June and
Maurice Amato, my sister Naomi, brother in law and nephews, who have supported me
throughout this project and my entire medical career. Thank you for teaching me to work hard
and for always cheering me on.
Lastly, I would like to make special mention of my wonderful partner, Todd McFarlane, who has
always encouraged me to follow my dreams. Thank you for believing in me and being so willing to
look after me and our home so that I could get this work completed.

Table of Contents
v
Table of Contents
Originality Statement .......................................................................................................................... i
Inclusion of Publications Statement ................................................................................................... ii
Acknowledgements ........................................................................................................................... iii
Table of Contents ............................................................................................................................... v
List of Abbreviations .......................................................................................................................... vii
List of Tables ....................................................................................................................................... ix
List of Figures...................................................................................................................................... xi
List of Publications............................................................................................................................ xiii
Chapter 1 - Introduction ..................................................................................................................... 1
Chapter 2 – Review of Literature ....................................................................................................... 3
2.1. Calcium and Vitamin D Metabolism in the Foetus, Neonate and Infant ................................ 3
2.1.1. Calcium Metabolism in the Foetus ................................................................................... 3
2.1.2. Calcium Metabolism in the Neonate and Infant .............................................................. 4
2.1.3. Vitamin D Metabolism in the Neonate and Infant ........................................................... 5
2.2. Diagnosis and Treatment of Hypercalcaemia ......................................................................... 8
2.2.1. Laboratory Findings .......................................................................................................... 8
2.2.2. Clinical Findings .............................................................................................................. 10
2.2.3. Treatment of Hypercalcemia .......................................................................................... 10
2.3. Causes of Infantile Hypercalcaemia ...................................................................................... 12
2.3.1. Hypercalcaemia with High PTH ...................................................................................... 13
2.3.2. Hypercalcaemia with Normal or Low PTH ...................................................................... 14
2.4. Idiopathic Infantile Hypercalcaemia and Mutations in the CYP24A1 gene .......................... 18
2.5. Familial Hypocalciuric Hypercalcaemia and Mutations in the CASR, GNA11 or AP2S1 genes ...................................................................................................................................................... 21
2.6. Vitamin D Supplementation .................................................................................................. 24
2.6.1. Interest in Vitamin D ...................................................................................................... 24
2.6.2. Measurement of Vitamin D Reserve and Definition of Vitamin D deficiency ................ 24
2.6.3. Measurement of 1,25 Dihydroxyvitamin D .................................................................... 25
2.6.4. Vitamin D Supplementation in Infancy and Antenatally ................................................ 26
2.6.5. Vitamin D and the Calcium Content of Breast Milk ....................................................... 30
2.6.6. Vitamin D Conclusion ..................................................................................................... 30
2.7. Summary ............................................................................................................................... 31
Table of Contents
vi
Chapter 3 – Materials and Methods ................................................................................................ 32
3.1. Study Overview ..................................................................................................................... 32
3.2. Ethics ..................................................................................................................................... 32
3.3. Definitions ............................................................................................................................. 33
3.4. Subjects with Idiopathic Infantile Hypercalcaemia ............................................................... 34
3.5. Genetic Analysis .................................................................................................................... 37
3.6. Identification of Trends in Calcaemia in Infants .................................................................... 40
3.7. SEALs Laboratory Platforms .................................................................................................. 42
3.8. Statistical Analysis ................................................................................................................. 45
Chapter 4 – Results........................................................................................................................... 46
4.1. Sydney Children’s Hospital Idiopathic Infantile Hypercalcaemia Case Series 2008-2014 .... 46
4.1.1. Cases Series of Idiopathic Infantile Hypercalcaemia ...................................................... 46
4.1.2. Biochemistry of Patients with Idiopathic Infantile Hypercalcaemia .............................. 49
4.1.3. Management of Patients with Idiopathic Infantile Hypercalcaemia.............................. 52
4.1.4. High Parathyroid Hormone (PTH) During Treatment with Locasol™ ............................. 53
4.1.5. Outcome After Cessation of Locasol™ ........................................................................... 54
4.1.6. Genetic Results ............................................................................................................... 55
4.2. Analysis of SEALS laboratory Data 2002-2014 ...................................................................... 58
4.2.1. Overview of Data ........................................................................................................... 58
4.2.2. Prevalence of Hypercalcaemia and Hypocalcaemia ....................................................... 63
4.2.3. Analysis of Calcium Concentration over time for Total Calcium and Ionised Calcium .. 65
4.2.4. Comparison of Total Calcium Concentration Between Sites According to Changes in Assay ......................................................................................................................................... 67
4.2.5 Analysis of Vitamin D ....................................................................................................... 69
4.2.6 Analysis of Calcium Related Analytes .............................................................................. 73
Chapter 5 – Discussion ..................................................................................................................... 75
References ........................................................................................................................................ 87

List of Abbreviations
vii
List of Abbreviations 25OHD 25 hydroxyvitamin D
25OHD2 25 hydroxyvitamin D2
25OHD3 25 hydroxyvitamin D3
1,25 OHD 1,25 dihydroxyvitamin D
IIH Idiopathic Infantile Hypercalceamia
AACB Australian Association of Clinical Biochemists
AF Allele Frequency
ALP Alkaline Phosphatase
ANCOVA Analysis of Covariance
APGAR Activity Pulse Grimace Appearance Respiration
AP2S1 Adaptor Related Protein Complex 2 gene
ARA Anti-rachitic activity
BAPTA Bis(o-aminophenoxy)ethan-N,N,N',N'-tetraacetic acid
CaBP9K Calbindin-9K Calcium Binding Protein
CaSR Calcium sensing receptor
CASR Calcium sensing receptor gene
CYP Cytochrome P450
Epi-25OHD Epi-25 hydroxyvitamin D
ExAC Exome Aggregation Consortium
FGF23 Fibroblast Growth Factor 23
FHH Familial Hypocalciuric Hypercalcaemia
FHH1 Familial Hypocalciuric Hypercalcaemia Type 1
FHH2 Familial Hypocalciuric Hypercalcaemia Type 2
FHH3 Familial Hypocalciuric Hypercalcaemia Type 3
FISH Fluorescence In Situ Hybridization
GNA11 G Protein Subunit Alpha 11 gene
IU International Units
IUGR Intrauterine Growth Restriction
IV Intravenous

List of Abbreviations
viii
LCMS Liquid Chromatography Tandem Mass Spectrometry
MCDA Monochorionic Diamniotic
Mg Magnesium
PCR Polymerase Chain Reaction
PO4 Phosphate
PTH Parathyroid Hormone
PTH1R Parathyroid Hormone 1 Receptor
PTHrP Parathyroid Hormone Related Peptide
RI Reference Interval
SEALS South Eastern Area Laboratory Service
SD Standard Deviation
TPN Total Parenteral Nutrition
TRPV6 Transient Receptor Potential Vallinoid 6 Calcium Channel
Ur Ca:Cr Urine Calcium:Creatinine ratio
UVB Ultraviolet B
VSD Ventricular Septal Defect

List of Tables
ix
List of Tables
Table 2-1 Calcium reference intervals for infants from harmonized data (5) and SEALS laboratory
2002 - 2014 ......................................................................................................................................... 9
Table 2-2 Ionised calcium reference intervals for infants SEALS laboratory 2002 - 2014 ................. 9
Table 2-3 The average calcium, vitamin D and phosphorous content per 1 litre of Locasol™,
compared with standard infant formula and human breast milk (25-27)
(http://www.nutricia.ie/products/view/locasol#). .......................................................................... 11
Table 2-4 Causes of hypercalcaemia in infants and association with parathyroid hormone (PTH)
levels ................................................................................................................................................. 12
Table 2-5 Genes contributing to vitamin D metabolism or calcium sensing in which mutations are
reported to have caused hypercalcaemia in infants. ....................................................................... 13
Table 2-6 Comparison of Vitamin D dosing recommendations according to Australian Guidelines in
2006 and 2013 (8, 9) ........................................................................................................................ 27
Table 3-1 SEALS reference ranges for analytes including 1,25(OH)2D, parathyroid hormone,
phosphate, magnesium and alkaline phosphatase. ......................................................................... 34
Table 3-2 Number of patients on handover lists for August, September and October (Aug-Oct) and
January, February and March (Jan-Mar) each year from March 2008 to March 2014, including
number of infants less than 6 months old identified as having hypercalcaemia and hypocalcaemia
and hypercalcaemic infants not captured in the original analysis. .................................................. 35
Table 3-3 Primer sequences for CASR, AP2S1 and GNA11 mutation analyses ................................ 38
Table 3-4 Analysers used for serum calcium, urine calcium, ionised calcium and 25 hydroxyvitamin
D at SEALS Randwick and peripheral site 2002-2014 ....................................................................... 44
Table 3-5 Analysers used for biochemical analytes at SEALS Randwick and peripheral site 2002-
2014 .................................................................................................................................................. 44
Table 4-1 Clinical Characteristics of patients managed for idiopathic infantile hypercalcaemia at
Sydney Children’s Hospital 2011-2014 ............................................................................................. 47
Table 4-2 Reason for initial calcium measurement and comorbidities in patients managed for
idiopathic infantile hypercalcaemia at Sydney Children’s Hospital 2011-2014 ............................... 48
Table 4-3 Baseline biochemistry in patients who developed nephrocalcinosis and those who did
not, in a cohort of infants treated for idiopathic infantile hypercalcaemia at Sydney Children’s
Hospital 2011-2014 .......................................................................................................................... 49

List of Tables
x
Table 4-4 Biochemical data at baseline (or within 1 week of baseline) from 14 patients treated for
idiopathic infantile hypercalcaemia at Sydney children’s Hospital 2011-2014 ............................... 51
Table 4-5 PTH values and associated biochemical data in infants whilst on Locasol™ treatment for
idiopathic hypercalcaemia at Sydney Children’s Hospital 2011-2014 ............................................. 54
Table 4-6 Follow up biochemistry, taken after stopping Locasol™, in 14 patients treated for
idiopathic infantile hypercalcaemia at Sydney Children’s Hospital 2002 to 2014 ........................... 55
Table 4-7 Genetic testing results including common variants in AP2S1, CASR, GNA11 and CYP24A1,
in 9 patients treated for idiopathic infantile hypercalcaemia at Sydney children’s Hospital 2011-
2014 .................................................................................................................................................. 57
Table 4-8 Descriptive data for biochemical analytes paired with total calcium at SEALS Randwick
and peripheral site 2002-2014 ......................................................................................................... 59
Table 4-9 Mean calcium ± SD for total calcium and ionised calcium at the Randwick and peripheral
sites approximately 2 years before and after the analyser and assay changes for infants 1 day to 6
months of age................................................................................................................................... 68

List of Figures
xi
List of Figures
Figure 2-1 Overview of Calcium Metabolism ..................................................................................... 7
Figure 2-2 Overview of Vitamin D Metabolism .................................................................................. 8
Figure 3-1 Decision tree used to identify infants with idiopathic infantile hypercalcaemia at Sydney
Children’s Hospital March 2008 to March 2014 .............................................................................. 36
Figure 4-1 Total calcium data set: Cohort diagram of the number of total calcium measurements
in infants 1 day to 6 months of age at SEALS Randwick and peripheral site 2002-2014 ................. 59
Figure 4-2 Ionised calcium data set: Cohort diagram of the number of ionised calcium
measurements in infants 1 day to 6 months of age at SEALS Randwick and the peripheral site
2002-2014 ........................................................................................................................................ 60
Figure 4-3 25OHD data set: Cohort diagram of the number of 25 hydroxyvitamin D measurements
(25OHD) in infants 1 day to 6 months of age at SEALS Randwick and the peripheral site .............. 60
Figure 4-4 Age distribution (days) of all total calcium measurements in infants aged 1 day to 6
months at SEALS either site (Randwick and peripheral site) between 2002 and 2014 ................... 61
Figure 4-5 Number of infants per year aged 1 day to 6 months, who had a total calcium
concentration measured at SEALS Randwick (blue) and peripheral site (red) between 2002 and
2014 .................................................................................................................................................. 61
Figure 4-6 Number of infants per year aged 1 day to 6 months who had an ionised calcium
concentration measured at SEALS at either site (Randwick and peripheral site) between 2002 and
2014 .................................................................................................................................................. 62
Figure 4-7 Prevalence of hypercalcaemia and hypocalcaemia by year at the Randwick site 2002 to
2014 based on age related reference intervals and the first total calcium measurement per
patient in infants 1 day to 6 months of age. .................................................................................... 63
Figure 4-8 Prevalence of hypercalcaemia and hypocalcaemia by year at the peripheral site 2002 to
2014 based on age related reference intervals and the first total calcium measurement per
patient in infants 1 day to 6 months of age. .................................................................................... 64
Figure 4-9 Prevalence of hypercalcaemia and hypocalcaemia by year at all sites 2002 to 2014
based on age related reference intervals and the first ionised calcium measurement per patient in
infants 1 day to 6 months of age. ..................................................................................................... 64
Figure 4-10 Total calcium concentration by date collected at the Randwick site 2002 to 2014 for
infants 1 day to 6 months of age. ..................................................................................................... 65

List of Figures
xii
Figure 4-11 Total calcium concentration by date collected at the peripheral site 2002 to 2014 for
infants 1 day to 6 months of age. ..................................................................................................... 66
Figure 4-12 Ionised calcium concentration by date collected at all sites 2002 to 2014 for infants 1
day to 6 months of age. .................................................................................................................... 66
Figure 4-13 Ionised calcium concentration (paired with calcium levels from the total calcium data
set) by date collected at all sites 2009 to 2014 for infants 1 day to 6 months of age. .................... 67
Figure 4-14 Measurements of 25 hydroxyvitamin D by year at all sites (Randwick and peripheral
site) in infants 1 day to 6 months of age, and defined as sufficient (25OHD ≥50nmol/L) or
insufficient (25OH D<50 nmol/L)...................................................................................................... 69
Figure 4-15 25 hydroxyvitamin D and total calcium correlation all sites (Randwick and peripheral
site) in infants 1 day to 6 months of age. ......................................................................................... 70
Figure 4-16 25 hydroxyvitamin D and PTH correlation all sites (Randwick and peripheral site) in
infants 1 day to 6 months of age. ..................................................................................................... 71
Figure 4-17 25 hydroxyvitamin D concentration (nmol/L) by date collected at all sites (Randwick
and peripheral site) 2002 to 2014 in infants 1 day to 6 months of age. .......................................... 72
Figure 4-18 Calcium concentration (paired with 25 hydroxyvitamin; mmol/L) by date collected at
all sites (Randwick and peripheral site) 2002 to 2014 in infants 1 day to 6 months of age. ........... 73

List of Publications
xiii
List of Publications
Increased rates of infantile hypercalcaemia following guidelines for antenatal vitamin D3
supplementation
Co Authors: Dr Jan Walker, Dr Shihab Hameed, Dr Kristen Neville, Dr Charles Verge, Dr Helen
Woodhead, Dr Wei Shern Quek, Dr Chris White, Dr Andrea Rita Horvath
Poster category P1 ESPE Scientific Meeting Dublin 2014
Increased rates of infantile hypercalcaemia following guidelines for antenatal vitamin D3
supplementation
Co Authors: Dr Jan Walker, Dr Shihab Hameed, Dr Kristen Neville, Dr Charles Verge, Dr Helen
Woodhead, Dr Wei Shern Quek, Dr Chris White, Dr Andrea Rita Horvath
Young Investigator presentation APEG Scientific meeting Darwin 2014

- Introduction
1
Chapter 1 - Introduction Hypercalcaemia in infants is rare, but can have potentially serious sequelae including failure to
thrive, vomiting, dehydration, nephrocalcinosis and death. The cause of infantile hypercalcaemia
is often not identified and many infants are classified as having idiopathic infantile
hypercalcaemia.
The term, Idiopathic infantile hypercalcaemia (IIH) was first coined in the 1950s when Lightwood
reported on the occurrence of an epidemic of hypercalcaemia in Great Britain during which some
infants died (1, 2). The epidemic seemed to relate to increased doses of Vitamin D in infant
formula and fortified milk, although many infants receiving this treatment were unaffected. A
number of these children have now been found to have loss of function mutations in the gene
responsible for metabolizing active vitamin D, CYP24A1(3). A small number of children with
infantile hypercalcaemia have also been found to have loss of function mutations in the genes
responsible for calcium sensing, consistent with a diagnosis of familial hypocalciuric
hypercalcaemia, but with biochemical findings that overlap with IIH (4).
At our tertiary children’s hospital, referrals for idiopathic infantile hypercalcaemia increased
markedly after 2011. In addition, there were nationwide shortages of low calcium formula at
least 3 times between 2012 and 2014, and in that same time the Australian Association of Clinical
Biochemists (AACB) proposed a small increase to serum calcium reference intervals of infants (5).
These findings coincide with an increased interest in vitamin D supplementation in Australia,
reflected by much higher rates of vitamin D testing and sales (6, 7). In addition, position
statements released in 2006 and updated in 2013 recommended antenatal vitamin D
supplementation in vitamin D deficient women, supported by trials demonstrating efficacy and
safety (8-11).
To date there have been no population-based reports of the prevalence of infantile
hypercalcaemia since vitamin D supplementation became more common and few studies looking
for a genetic predisposition. Although maternal vitamin D plays little role in foetal calcium

- Introduction
2
homeostasis, it has been shown to modify neonatal vitamin D status and post-natal calcium
concentrations. Therefore, we hypothesized that in infants born with variations in genes involved
in calcium sensing or vitamin D metabolism, there may be an increased susceptibility to
hypercalcaemia. We hypothesized that in the general population an increased rate of vitamin D
supplementation during pregnancy might be associated with a gradual rise in infantile calcium
concentration, an increased prevalence of hypercalceamia and a decreased prevalence of
hypocalcemia. We also hypothesized that in infants identified with symptomatic hypercalcaemia,
maternal vitamin D supplementation might have unmasked a predisposition to hypercalcaemia
due to variants in genes associated with calcium sensing or vitamin D metabolism.
This study therefore aimed to examine 1) the biochemical profiles, history of maternal vitamin D
supplementation and response to treatment of infants presenting to our department with
idiopathic hypercalcaemia; 2) the possibility that variants in a panel of genes responsible for
calcium sensing and vitamin D metabolism might have contributed to the presentation with
hypercalcaemia in this cohort; and 3) the trend in calcaemia and prevalence of infantile
hypercalcaemia in our hospital region over a 12 year period.
Chapter 2 – Review of Literature
3
Chapter 2 – Review of Literature
2.1. Calcium and Vitamin D Metabolism in the Foetus, Neonate and Infant The ability to understand hypercalcaemia in infants and the possible mechanisms that may
contribute to its development requires an understanding of calcium metabolism and in particular
the complex changes that occur in the first weeks of life, when the neonate transitions from
foetal to postnatal life.
2.1.1. Calcium Metabolism in the Foetus
The main goal of foetal calcium metabolism is to mineralize the foetal skeleton and maintain
appropriate calcium levels for foetal tissues. Human foetuses accrete 80% of their mineral
content during the third trimester. Serum calcium levels in the foetus exceed maternal levels and
appear to be necessary for skeletal mineralization, as without this state of ‘foetal
hypercalcaemia’, foetal skeletal mineralization is reduced and the foetus is at greater risk of
hypocalcaemia after birth. The foetus maintains calcium levels by flux of calcium across the
placenta but also from the foetal skeleton, kidney and intestine. Evidence suggests that the foetal
blood calcium concentration is set at a level independent of the maternal calcium concentration
(12). It is therefore largely independent of acute alterations in maternal calcium concentration;
however chronic alterations in maternal calcium have been shown to be harmful. The foetus has
low levels of parathyroid hormone (thought to be suppressed by the high calcium); however
animal models have shown that loss of parathyroid hormone results in foetal hypocalcaemia,
suggesting it still plays a key role in foetal calcium regulation (12, 13). Foetal concentration of
1,25 dihydroxyvitamin D (1,25(OH)2D) is low, thought to be due to both its inability to cross from
the maternal circulation and decreased activity of foetal renal 1 alpha hydroxylase secondary to
low parathyroid hormone (PTH) and high calcium concentrations. The foetus has high levels of
calcitonin, derived from the foetal thyroid gland and high levels of parathyroid hormone related
peptide (PTHrP), derived mostly from the placenta. Animal models suggest that PTHrP stimulates
placental calcium transfer from the maternal circulation. In the foetus, loss of foetal PTH or
PTHrP results in hypocalcaemia and hyperphosphatemia whereas loss of 1,25 dihydroxyvitamin D,
25 hydroxyvitamin D (25OHD) or the vitamin D receptor causes no change to serum calcium (12,
13).

Chapter 2 – Review of Literature
4
2.1.2. Calcium Metabolism in the Neonate and Infant
Once the umbilical cord has been cut, the placental infusion of calcium and PTHrP is lost so the
neonate must rely on intestinal calcium absorption and skeletal calcium to maintain serum levels.
Therefore, PTH and 1,25 (OH)2D become more important. In the first 24 hours after birth, PTHrP
concentrations decline rapidly, calcium levels fall 20-30% and phosphorus rises. PTH increases to
normal adult values by 24-48 hours, followed by a rise in 1,25(OH)2D and calcium, and a decline in
phosphorous (13). Concentrations of calcium, phosphorous, PTH and 1,25(OH)2D approach
normal adult levels by around day 5-10 of life. The neonatal intestinal absorption of calcium
initially occurs via passive non-saturable mechanisms, thought to be facilitated by the high lactose
content of milk. As the neonate matures, 1,25(OH)2D plays a more active role in intestinal calcium
absorption.(12-14)
Calcium metabolism throughout the infantile period is thought to be the same as calcium
metabolism in older childhood and adulthood, reliant on an ongoing interplay between calcium
absorption by the small intestine, calcium reabsorption in the kidneys and remodeling of bone
(Figure 2-1). The main hormones that directly affect these processes and maintain tight control of
serum calcium are parathyroid hormone (PTH) and 1,25(OH)2D. Calcitonin and PTHrP play more
minor roles. Calcium metabolism is closely linked with phosphate and magnesium metabolism.
Magnesium can directly influence calcium levels by altering PTH secretion in response to
hypocalcaemia. PTH and 1,25(OH)2D, along with fibroblast growth factor 23 (FGF23), influence
phosphate metabolism. FGF23 requires another factor, Klotho, for FGF signaling (15).
Almost all calcium (99%) is contained within bone and the remainder is present intracellularly and
in plasma. In plasma, 50% of calcium exists in ionised form and the remainder is mostly bound to
albumin. The concentration of calcium in plasma is kept within a narrow range to maintain
neuromuscular stability.
Calcium binds to the calcium sensing receptor (CaSR), which is present mostly in the parathyroid
glands and renal tubules, but also in many other tissues. When calcium binds, PTH secretion is
altered to maintain the ionised calcium concentration within narrow limits ‘set’ by the CaSR.
Mutations in the CaSR gene (CASR) can lead to activation or inactivation of the receptor, causing

Chapter 2 – Review of Literature
5
hypo or hypercalcaemia. In addition, mutations in the AP2S1 gene, which encodes the adaptor
related protein complex 2, a protein critical for clathrin mediated endocytosis of the calcium
sensing receptor, and GNA11, the gene encoding the alpha subunit of G11, which is involved in
signaling by the calcium receptor, can also affect calcium sensing receptor function. (16-18)
Parathyroid hormone (PTH) is encoded by a gene on chromosome 11. The half-life of PTH in the
circulation is only 1-2 minutes (15). Various fragments of PTH can be measured in the circulation.
Most current assays measure ‘intact’ PTH which ignores the inactive fragments and is a good
indication of bioactive PTH. PTH acts mostly on the bone and kidney. In the bone, PTH stimulates
bone resorption and in the kidney PTH has several actions: it stimulates conversion of 25
hydroxyvitamin D to 1,25 dihydroxyvitamin D; it stimulates reabsorption of calcium and
magnesium; and it promotes excretion of phosphate so that phosphate which has been resorbed
from bone is excreted. PTH acts via two receptors: PTH1R (PTH/PTHrP receptor) which responds
to both PTH and PTHrP ; and PTH2R which binds only PTH and is mostly found in the central
nervous system. Intracellular signaling of the PTH receptors is mediated by G-protein second
messengers.
Parathyroid hormone related peptide (PTHrP) is a hormone with similar biological activity to PTH.
It is coded for by a gene on chromosome 12. Post-natal circulating concentrations are below
levels of detection. It is secreted physiologically in breast milk during lactation and pathologically
by some malignancies, causing hypercalcaemia of malignancy.
Calcitonin is produced by the para follicular cells of the thyroid gland. It is secreted in response to
high calcium and acts to lower calcium by inhibiting osteoclastic activity in bone and inhibiting
reabsorption of calcium and phosphate, leading to increased urinary calcium and phosphate
excretion
2.1.3. Vitamin D Metabolism in the Neonate and Infant Vitamin D is synthesized from 7 dehydrocholesterol following exposure to UV light and is
metabolized in the skin to form vitamin D3 (cholecalciferol). Concentrations therefore vary with
sun exposure. It is also ingested in the diet in the form of vitamin D2 (ergocalciferol). Both vitamin
D3 and vitamin D2 are collectively known as vitamin D and once absorbed, follow the same

Chapter 2 – Review of Literature
6
metabolic pathway (Figure 2-2). Vitamin D is transported bound to vitamin D binding protein. It is
first hydroxylated to 25 hydroxyvitamin D (25OHD) in the liver and then to 1,25 dihydroxyvitamin
D (1,25(OH)2D) in the kidney. 1,25(OH)2D is the active metabolite which acts via the vitamin D
receptor to exert its effects. 1,25(OH)2D plays a key role in promoting calcium absorption in the
small intestine, suppressing PTH secretion and stimulating differentiation of osteoclasts (19).
Cytochrome P450 (CYP) enzymes are required in all steps of vitamin D metabolism. The first step
is catalyzed in the liver by cytochrome P450 25 hydroxylases including CYP2R1 (the major
enzyme), CYP27A1, CYP3A4 and CYP2J2. The second step is catalyzed by the 25 hydroxyvitamin D
1 alpha hydroxylase enzyme, CYP27B1. Activity is stimulated by PTH and inhibited by FGF23 and
1,25(OH)2D. Another cytochrome P450 enzyme, CYP24A1, is responsible for breakdown of 25
hydroxyvitamin D into 24,25 dihydroxyvitamin D and 1,25 dihydroxyvitamin D into calcitroic acid.
It is inhibited by PTH and stimulated by 1,25(OH)2D and FGF23 (19).

Chapter 2 – Review of Literature
7
Figure 2-1 Overview of Calcium Metabolism
Binding of calcium to the calcium sensing receptors in the parathyroid gland influences the amount of PTH that is released. PTH acts on osteoblasts and increases osteoclastic activity, which mobilises calcium from bone. In the kidney, PTH increases reabsorption of calcium from the distal renal tubule and promotes phosphate excretion. It also stimulates hydroxylation of 25 hydroxyvitamin D to 1,25 dihydroxyvitamin D. 1,25 dihydroxyvitamin D is the active metabolite of vitamin D and increases intestinal calcium and phosphate absorption. In bone, 1,25 dihydroxyvitamin D mobilises calcium and phosphate and in the kidney 1,25 dihydroxyvitamin D increases calcium resorption. Calcitonin is produced by the para follicular cells of the thyroid gland. It inhibits osteoclastic activity in bone and inhibits resorption of calcium and phosphate, leading to increased urinary excretion.

Chapter 2 – Review of Literature
8
Figure 2-2 Overview of Vitamin D Metabolism
Vitamin D is synthesized in the skin from 7 dehydrocholesterol following exposure to UV light. It is also ingested in the diet. It comes in the form of vitamin D2 (ergocalciferol) and vitamin D3 (cholecalciferol). Vitamin D is transported bound to vitamin D binding protein. Vitamin D is hydroxylated to 25 hydroxyvitamin D in the liver via the action of 25 hydroxylase. It is further hydroxylated in the kidney to 1,25 dihydroxyvitamin D, via the action of 1 a hydroxylase. 1,25 dihydroxyvitamin D is the active metabolite which acts via the vitamin D receptor to exert its effects. Cytochrome P450 (CYP) enzymes are involved in all steps of vitamin D metabolism. Direction of action is indicated by blue arrows. Stimulatory effects are indicated by red arrows. Inhibitory effects are indicated by purple arrows.
2.2. Diagnosis and Treatment of Hypercalcaemia
2.2.1. Laboratory Findings
Hypercalcaemia of infancy is considered to be a total calcium concentration more than 2 standard
deviations above the mean, which is defined according to age. At our own laboratory, South
Eastern Area Laboratory Service (SEALS), between 2002 and 2014, the period relevant to our
study, the upper limit of normal was unchanged for the first year of life, but the lower limit of

Chapter 2 – Review of Literature
9
normal was lowest in the first two weeks of life, accounting for the changes that occur in the
transition from foetal to neonatal life. In 2014, The Australian Association of Clinical Biochemists
published a harmonization project establishing reference intervals for calcium and other analytes,
to be used throughout Australia and New Zealand following a number of working parties between
2012-2014, largely driven by the desire to be able to amalgamate an individual patient’s results
from different laboratories into the one health record (5). The group used a data mining approach
and included 1.8 million results from 15 laboratories. The reference ranges agreed upon for
calcium levels in infancy and childhood included an upper limit of normal that was 0.5 mmol/L
higher than our laboratory in the first 6 months of life and a lower limit of normal that was 0.5
mmol/L lower in the first week of life. The AACB publication did not indicate the time interval
during which data were collected (although we understand from personal communication that
collection started in 2012), nor how the harmonized reference intervals compared to the
reference intervals of the laboratories studied. The reference intervals used by our laboratory
between 2002 and 2014 and the reference intervals established by the harmonization project are
detailed in Table 2-1. Our laboratory adopted the harmonized reference intervals after they were
published in 2014, which was after completion of our study.
Table 2-1 Calcium reference intervals for infants from harmonized data (5) and SEALS laboratory 2002 - 2014
Age Harmonised data RI SEALS Laboratory RI
0 – 7 days 1.85 – 2.8 mmol/L 1.90 – 2.75 mmol/L
7 days – 14 days 2.20 – 2.8 mmol/L 1.90 – 2.75 mmol/L
14 days – 26 week 2.20 – 2.8 mmol/L 2.25 – 2.75 mmol/L
26 weeks - 1 year 2.20 – 2.70 mmol/L 2.25 – 2.75 mmol/L RI: Reference interval
The harmonization project by Tate et al (5) did not report on harmonized ionised calcium levels.
Our own laboratory uses a reference range of 1.1-1.3 mmol/L from 1 year of life and throughout
adulthood. Slightly higher and lower ionised calcium levels are accepted in younger children as
detailed in Table 2-2.
Table 2-2 Ionised calcium reference intervals for infants SEALS laboratory 2002 - 2014
Age SEALS Laboratory RI
0 - 1 month 0.97-1.5 mmol/L
1 – 6 months 0.93 – 1.48 mmol/L RI: Reference Interval

Chapter 2 – Review of Literature
10
Although it is not always practical, because of the method of collection, an ionised calcium level is
considered more accurate than a total calcium level. This is because it eliminates variables
affecting the total calcium measurement such as albumin concentration. Calcium adjustment
equations, accounting for albumin concentration, have been used in adults to produce a
‘corrected calcium’, but may not be reliable in young children due to variations in the relationship
between albumin and calcium at different ages, particularly in neonates. Jassam et al showed
that whilst adjusted calcium equations used for adult data sets can be applied to children greater
than 1 year of age they are less reliable in children during the first year of life (20).
Serum calcium can be influenced by collection technique. When measuring calcium, the
recommended technique for blood collection is fasting, from a free flowing vein, without
tourniquet. Prolonged tourniquet leading to venous occlusion has been reported to increase
serum calcium by up to 0.3 mmol/L in adults. Falsely elevated levels also can be observed in
patients in liver or renal failure, as well as those in whom the specimen is haemolysed or lipaemic.
In addition, standing posture, immediate prior exercise and non-fasting collection have all been
implicated as possible causes for falsely elevated results (21).
2.2.2. Clinical Findings
Many infants with mild hypercalcaemia (serum calcium < 3.0 mmol/L) are asymptomatic at
diagnosis and the elevated calcium level is picked up incidentally. Whilst there is variation in the
concentration associated with clinical abnormality, most infants with a serum calcium
concentration above 3.5 mmol/L are symptomatic with vomiting, weight loss, failure to thrive,
irritability, lethargy, polyuria or seizures. Upon clinical examination, these infants may be
dehydrated, lethargic and hypotonic. They can have bradycardia, short QT intervals and
hypertension. They may also develop nephrocalcinosis and renal impairment (22).
2.2.3. Treatment of Hypercalcemia
To appropriately treat hypercalcaemia it is important to determine, if possible, the underlying
diagnosis and to stop any medications such as vitamin D and calcium supplements, or reduce the
calcium content of parenteral or enteral feeds that may be exacerbating the problem. The main
goals of treatment are then to treat dehydration, increase renal excretion of calcium and reduce
gut absorption of calcium or bone resorption.

Chapter 2 – Review of Literature
11
First line treatment is with hydration, to overcome the dehydration associated polyuria that
results from hypercalcaemia induced nephrogenic diabetes insipidus. The mechanism for the
latter is incompletely understood but may be related to downregulation of aquaporin 2 water
channels (23). Hydration will help to expand intravascular volume and dilute the calcium. In many
cases, IV hydration is indicated with 0.9% normal saline, sometimes up to 1.5-2 times
maintenance (22). In addition to correcting dehydration, the normal saline will help to further
reduce calcium, as the sodium load reduces the need for sodium and therefore calcium
reabsorption (24). Loop diuretics such as frusemide can also be useful, as they promote urinary
calcium excretion, but need to be used with caution as they can exacerbate the dehydration and
predispose to nephrocalcinosis.
Low calcium formula may be all that is needed in the infant, particularly in PTH or vitamin D
mediated hypercalcaemia, in which gut calcium absorption is increased. Locasol™ is the low
calcium formula available in Australia. The average calcium and vitamin D content in Locasol™,
compared with standard formula and breast milk, is detailed in Table 2-3.
Table 2-3 The average calcium, vitamin D and phosphorous content per 1 litre of Locasol™, compared with standard infant formula and human breast milk (25-27) (http://www.nutricia.ie/products/view/locasol#).
Nutrients per litre Locasol™ Standard Infant Formula Human Breast Milk
Calcium <70mg 400-700 mg 250-280 mg
Phosphorous 460 mg 230-480 mg 110-160 mg
Vitamin D 0 400 IU 10-80 IU ARA*
*ARA: antirachitic activity Hypercalcaemia can also be treated with glucocorticoids, which reduce the absorption of calcium
in the gut by reducing conversion of 25OHD to 1,25(OH)2D (28). They may also have an effect on
bone resorption; however, they are not useful for long term treatment due to undesirable side
effects. Calcitonin is given by subcutaneous injection and acts to oppose the action of PTH;
however the effects of calcitonin are usually not prolonged as tachyphylaxis is common.
Cinacalcet is a calcimimetic that binds the CASR within the transmembrane domain (rather than
the extracellular domain, where calcium binds) and increases CASR sensitivity to calcium. It has
been used in some cases of hyperparathyroidism in children (29, 30). Bisphosphonates rapidly
inhibit osteoclastic bone resorption and lower serum and urine calcium. The effects are usually

Chapter 2 – Review of Literature
12
seen within 12-24 hours of treatment, and can last for weeks (28). It is important to monitor for
potential side effects including an acute phase reaction, hypocalcaemia, hypophosphataemia and
hypomagnesaemia. Parathyroidectomy has been used in cases of severe hyperparathyroidism,
and haemodialysis or peritoneal dialysis, using a low calcium dialysate, may be needed in cases of
severe or life threatening hypercalcaemia.
2.3. Causes of Infantile Hypercalcaemia The exact prevalence of hypercalcaemia in infancy is not known; however it is reported to be rare
and the causes can be grouped according to whether or not PTH is high (Table 2-4). ‘Idiopathic
Infantile hypercalcaemia’ by definition is a diagnosis of exclusion. In the past few years, genetic
variants related to vitamin D metabolism have been identified as causes of hypercalcaemia in
infants who previously were labelled as idiopathic (
Table 2-5). The likelihood is that more genetic variations in the genes governing vitamin D and
calcium metabolism will explain the hypercalcaemia in others from this idiopathic group.
Table 2-4 Causes of hypercalcaemia in infants and association with parathyroid hormone (PTH) levels
PTH High PTH Normal or Low
High PTH Levels Primary Hyperparathyroidism Secondary Hyperparathyroidism
- Following maternal hypocalcaemia
- Mucolipidosis type II
Normal PTH Levels Familial hypocalciuric hypercalcaemia Low/Suppressed PTH Levels Idiopathic infantile hypercalcaemia (IIH) Vitamin D toxicity Williams Beuren syndrome Subcutaneous fat necrosis Phosphate depletion in prematurity Vitamin A intoxication Down syndrome Hypophosphatasia Congenital hypothyroidism Congenital lactase deficiency Bartter syndrome Blue diaper syndrome Renal tubular acidosis Incontinentia Pigmenti Jansen Type Metaphyseal Dysplasia

Chapter 2 – Review of Literature
13
Table 2-5 Genes contributing to vitamin D metabolism or calcium sensing in which mutations are reported to have caused hypercalcaemia in infants.
Vitamin D Calcium sensing
CYP24A1 SLC34A1
CASR AP2S1 GNA11
2.3.1. Hypercalcaemia with High PTH
Primary or secondary hyperparathyroidism
Primary Hyperparathyroidism
Primary hyperparathyroidism was first reported in 1982 and is extremely rare in infants (31). It is
an autosomal recessive condition in which inactivating mutations of the calcium sensing receptor
(CaSR) lead to inappropriate secretion of PTH. Infants usually present in the neonatal period with
life-threatening hypercalcaemia. Calcium levels up to 7.1 mmol/L have been reported (31). In
addition to raised PTH, affected infants have marked elevation of alkaline phosphatase (ALP).
Serum phosphate is generally low (reflecting the increased PTH) and urinary calcium excretion has
been reported to be both high and low (31). Clinical features leading to presentation are often
related to hypercalcaemia and include failure to thrive, dehydration, irritability and constipation.
Hypotonia and respiratory distress are also frequent. Skeletal abnormalities include osteopenia,
deformity of the rib cage, metaphyseal splaying, sub-periosteal erosion and fractures (29, 32).
Parathyroid hyperplasia has been reported on post-surgical or postmortem examination of the
parathyroids. The condition can be fatal if not treated. Infants can be managed with intravenous
fluids and bisphosphonates and, more definitively, parathyroidectomy. Recently, a type 2
calcimimetic drug (cinacalcet) has been used successfully (29, 30, 33). Calcium binds the CaSR
within the extracellular domain, whereas calcimemtics bind within the transmembrane domain,
which increases CaSR sensitivity to calcium (34).
Secondary Hyperparathyroidism
Secondary hyperparathyroidism is a rare cause of hypercalcaemia in infants, but may occur in the
neonatal period in infants born to mothers with hypocalcaemia due to hypoparathyroidism,
pseudohypoparathyroidism, chronic renal failure or renal tubular acidosis (35). Maternal
hypocalcaemia leads to foetal hypocalcaemia and thus stimulation of foetal parathyroid tissue.

Chapter 2 – Review of Literature
14
These infants more commonly present with hypocalcaemia and bone demineralization, but may
have normal or even high calcium levels. The condition is usually transient and resolves within
weeks, though some infants have persistently elevated parathyroid hormone levels for up to 3-4
months (35, 36). Secondary hyperparathyroidism has also been reported in infants with
mucolipidosis type II, presumed to be due to impaired foetal placental calcium transport.
2.3.2. Hypercalcaemia with Normal or Low PTH
Conditions with Hypercalcaemia as a Predominant Feature
Idiopathic infantile hypercalcaemia
See 2.4. Idiopathic Infantile Hypercalcaemia and Mutations in the CYP24A1, page18
Familial hypocalciuric hypercalcaemia
See 2.5. Familial Hypocalciuric Hypercalcaemia and Mutations in the CASR, GNA11 or AP2S1,
page21
Iatrogenic vitamin D toxicity
Vitamin D toxicity was first reported in 1931 (37) attributable to an overdose of Vitamin D
supplementation given as irradiated ergosterol (37). Further cases have been reported since then
following fortification of milk and preterm formula with Vitamin D, as well as high dose vitamin D
either prescribed or following errors in dosing or manufacturing (37-40). Both the dose of vitamin
D administered and the serum concentration of vitamin D associated with toxicity vary. Toxicity
has been described in very high doses 40,000 to 560, 000 units, resulting in serum vitamin D levels
250-670 ng/ml (624-1672 nmol/L) and serum calcium concentrations 3.5-4.5 mmol/L (38).
However mild asymptomatic hypercalcaemia has also been reported in children receiving lower
doses of 1400 – 2000 IU per day (41). Serum levels of 25 hydroxyvitamin D (25OHD) above 250
nmol/L have been associated with hypercalcaemia and hypercalciuria, and levels above 375
nmol/L have been associated with symptomatic hypercalcaemia; however there does not appear
to be a strict relationship between vitamin D dose, the serum levels achieved and calcaemia (37,
38, 42).Variations in assays and the timing of the testing in relation to intoxication may explain
some of the variability. It is also likely that mutations or polymorphisms in the genes involved in

Chapter 2 – Review of Literature
15
metabolism of vitamin D may partly explain the poor relationship between vitamin D dose and
toxicity (38).
The typical biochemical findings in Vitamin D intoxication include high 25 hydroxyvitamin D
(25OHD), elevated calcium, normal or elevated phosphate, low PTH, elevated urinary calcium and
normal 1,25 dihydroxyvitamin D (1,25(OH)2D). The pathologic basis for the toxicity is not
completely understood but may be due to high 25OHD concentrations (and possibly other vitamin
D metabolites) displacing 1,25(OH)2D from its binding proteins or direct entry of 25OHD into the
target cell where it acts on intracellular transcription (37, 38). Due to lipophilic storage, vitamin D
intoxication can take weeks to resolve (38). Symptomatic infants can be treated in the acute
phase with hyper-hydration, frusemide, glucocorticoids, calcitonin or bisphosphonates (38, 43,
44). Haemodialysis has been used as a last resort in life threatening cases (38, 43).
Williams Beuren Syndrome
Williams Beuren syndrome is a rare genetic disorder caused by the deletion of 28 contiguous
genes on chromosome 7 at 7q11.23. It occurs with a frequency of 1 in 20,000 to 50,000. It is
characterized by a number of clinical features including structural cardiac abnormalities,
distinctive facial features and personality traits, intellectual disability and endocrine problems
including poor growth, thyroid abnormalities (subclinical hypothyroidism and thyroid hypoplasia),
precocious puberty and hypercalcaemia. Of note, the phenotypic features may be difficult to
identify in neonates and infants. Hypercalcaemia was reported in some of the first described
cases of Williams Beuren syndrome in 1963 (45), and has been reported to occur in up to 40% of
patients (46). Efforts to identify the cause of the hypercalcaemia have been inconclusive, with
various reports suggesting abnormalities involving intestinal absorption of calcium and impaired
vitamin D metabolism, as well as defective calcitonin release (46-49). Hypercalcaemia usually
occurs in the first year of life, resolving by 4 years (48). Occasionally, the hypercalcaemia is severe
and associated with nephrocalcinosis (50). Most patients can be managed with reduced calcium
and vitamin D intake, but more severe cases have been treated with bisphosphonate therapy (50-
52).
Subcutaneous fat necrosis
Subcutaneous fat necrosis occurs in the neonatal period and is a rare form of lobular panniculitis
with necrotic fatty plaques. It is characterised by palpable areas of subcutaneous tissue

Chapter 2 – Review of Literature
16
presenting as firm flesh coloured or blue subcutaneous nodules or plaques usually occurring on
the trunk, buttocks, thighs arms and cheeks. Histology shows subcutaneous, needle-shaped clefts
surrounded by an inflammatory infiltrate containing macrophages. It generally occurs following
birth asphyxia, meconium aspiration or therapeutic cooling (53, 54). Risk factors include maternal
smoking, hypertension and maternal exposure to cocaine or calcium antagonists (53, 55).
Hypercalcaemia has been reported to occur in 28-69% of cases, usually after the onset of skin
lesions (53, 56). The hypercalcaemia is usually moderate, but severe hypercalcaemia has been
reported, as has nephrocalcinosis (56). The infants with hypercalcaemia typically are found to
have low/normal serum phosphate, suppressed PTH, normal 25OHD and elevated 1,25(OH)2D
(57). The cause of hypercalcaemia is postulated to arise from 1 alpha hydroxylase in macrophages
leading to excess production of 1,25(OH)2D and increased calcium absorption from the gut (53,
55, 58). Other theories include release of calcium from necrotic fat cells, increased prostaglandin
E which stimulates bone resorption, and differentiation of particle filled macrophages into
osteoclasts (55, 59, 60). The skin lesions and associated hypercalcaemia tend to resolve
spontaneously within months (60). Treatment has included hydration, corticosteroids, frusemide
and low calcium feeds. Pamidronate has also been used successfully in some infants (60).
Dietary phosphate deficiency
Phosphate deficiency has been described in preterm very low birth weight infants receiving
human milk or total parenteral nutrition (TPN) with inadequate phosphate content to meet their
increased needs (61-63). The foetus accretes 80% of its mineral content during the third
trimester so preterm infants are born deficient in total body phosphorous. These infants have
increased 1 alpha hydroxylase activity leading to increased 1,25(OH)2D which increases intestinal
absorption of calcium and stimulates bone resorption, causing hypercalcaemia. The addition of
phosphate to TPN and infant formula for preterm babies has largely eliminated this problem.
Conditions in which Hypercalcaemia Has Been Reported
There are a number of very rare disorders in which hypercalcaemia has been described and some
more common conditions in which hypercalcaemia is very rarely described. Given the rarity of the
conditions or hypercalcaemia, the incidence and mechanism of hypercalcaemia is often poorly
understood and management is not always clearly defined.

Chapter 2 – Review of Literature
17
The rare conditions in which hypercalcaemia has been described include: Jansen type
metaphyseal dysplasia, due to mutations of the PTH/PTHrP gene, causing constitutive activation
of the receptor (64-67); autosomal recessive hypophosphatasia, a rare inborn error of metabolism
due to mutations in the akaline phosphatase liver like gene (68-70); blue diaper syndrome, an
inborn error of metabolism due to a defect in the intestinal transport of tryptophan (71);
congenital lactase deficiency, due to mutations in the lactase phloricin hydrolase gene (72, 73);
vitamin A toxicity (74) and incontinentia pigmenti (75).
Some more common conditions in which hypercalcaemia has rarely been reported include
disorders of the thyroid (76-78); adrenal insufficiency and congenital adrenal hyperplasia (28, 79);
Down syndrome (80); distal (or type 1) renal tubular acidosis (81, 82) and Bartter syndrome (4).

Chapter 2 – Review of Literature
18
2.4. Idiopathic Infantile Hypercalcaemia and Mutations in the CYP24A1 gene Idiopathic infantile hypercalcaemia (IIH) is, by definition, a diagnosis of exclusion. It was first
described by Lightwood in the 1950s (1, 2, 83) when he reported on an epidemic of
hypercalcaemia in Great Britain, during which some infants died. At the time Lightwood noted
that infants were typically diagnosed around 5 months of age but some at a few weeks of age.
The infants were found to have elevated serum calcium and urinary excretion of calcium, normal
serum phosphate and magnesium and sometimes low ALP. It was noted that these findings were
similar to those seen in children who had received large doses of vitamin D so Lightwood
postulated a role for vitamin D which was being given in fortified infant formula at the time,
sometimes in doses up to 4000 units daily (1, 3). Given that many infants receiving the treatment
were unaffected, he hypothesized variability in infants’ sensitivity to vitamin D.
With the passage of time, causes for some cases of hypercalcaemia previously classified as
idiopathic have emerged. Some of the infants originally reported by Lightwood were also noted to
have elfin facies and heart defects, and were later found to have what is now known as Williams
Beuren Syndrome (84). More recently, Schlingman and colleagues identified loss of function
mutations in the CYP24A1 gene, encoding 25 hydroxyvitamin D, 24 hydroxylase, responsible for
degradation of 25OHD and 1,25 dihydroxyvitamin D into water soluble calcitroic acid (3). Six
patients from 4 families and 4 patients with suspected Vitamin D toxicity were found to carry such
mutations. CYP24A1 mutations in patients classified as IIH have subsequently been reported by
other authors (85-88). In one study of hypercalcaemia, mostly in adults, CYP24A1 mutations were
found in 25 of 72 patients studied, and 20 of these patients had biallelic mutations (89).
Studies of families affected by infantile hypercalcaemia secondary to CYP24A1 mutations show
that these patients typically have elevated calcium levels with low levels of parathyroid hormone,
high urinary calcium, normal 25 hydroxyvitamin D (25OHD)and high 1,25 dihydroxyvitamin D
(1,25(OH)2D)(3, 90). The normal level of 25OHD in the face of high 1,25(OH)2D is explained by the
finding that 25OHD levels are reduced by both CYP27B1 and CYP24A1, whereas 1,25(OH)2D levels
are only reduced by CYP24A1 (91) (Figure 2-2, page 8). A number of these patients have been
found to also have low levels of 24,25 dihydroxyvitamin D and an elevated 25OHD to 24,25
dihydroxyvitamin D ratio, suggesting that these parameters may be used to demonstrate reduced

Chapter 2 – Review of Literature
19
24,25 dihydroxyvitamin D in patients with CYP24A1 mutations (92). Unfortunately though,
methods for measuring 24, 25 dihydroxyvitamin D have not been standardized (93) and as far as
we are aware, there are no Australian laboratories measuring it for clinical use.
Children with hypercalcaemia secondary to CYP24A1 mutations frequently have nephrocalcinosis.
(85, 90, 94, 95). In addition, heterozygous and homozygous CYP24A1 mutations have been
reported in adult patients with nephrocalcinosis and nephrolithiasis, some of whom never
presented with hypercalcaemia during infancy or childhood, and others who only presented with
hypercalcaemia in early childhood and adolescence (91, 95, 96).
The incidence of idiopathic infantile hypercalcaemia is estimated to be 1 in 47, 000, based on UK
data from 1960-1980 (97, 98). The prevalence of CYP24A1 mutations is not clearly known but
Nesterova et al estimated the prevalence of biallelic mutations based on data from 2012, to be
between 420-1960 cases per 100,000 people and estimated the frequency of kidney stones due
to CYP24A1 mutations to be between 4-20% of all cases of kidney stones (91). In 2017 Pronicka et
al estimated the carrier frequency of CYP24A1 mutations in the Polish population to be 1 in 90;
thus the expected incidence of infantile hypercalcaemia secondary to CYP24A1 recessive
mutations was estimated as 1 in 32 465 births (86).
There is limited information on the long term outcome of IIH and most data are from cases of IIH
prior to the discovery of CYP24A1 mutations. The hypercalcaemia is thought to resolve in most
patients by 2-3 years of age; although there have been reports of hypercalcaemia persisting past 5
years (4, 99). Hypercalciuria seems to persist longer, with one case series reporting hypercalciuria
lasting for 12 years, in the absence of hypercalcaemia (100). Similarly, nephrocalcinosis can persist
but tends to be non-progressive and usually not clinically significant (4, 99).
Most patients identified with mutations in CYP24A1 have been found to have homozygous or
compound heterozygous variants (3, 85, 86, 88, 101) . Heterozygotes have been reported and
whilst many are asymptomatic, mild clinical phenotypes have been described with features such
as mild asymptomatic hypercalcaemia, nephrocalcinosis or nephrolithiasis. In most cases, the
patients do not have the classic biochemical profile usually described in IIH (hypercalcaemia,
hypercalciuria, low or low-normal PTH and the absence of hypophosphatemia or elevated levels
Chapter 2 – Review of Literature
20
of 25OHD). Authors have suggested modifying factors on the clinical phenotype of both
homozygous and heterozygous carriers, including vitamin D supplementation, dietary calcium and
sunlight exposure (101). In a group of 5 asymptomatic, hypercalcaemic neonates heterozygous for
CYP24A1 mutations or polymorphisms, biochemical parameters suggested a functional CYP24A1,
except that these neonates had higher 1,25(OH)2D and lower PTH levels than heterozygous
adults. The authors postulated that the immaturity of renal function in neonates or an increased
sensitivity to vitamin D that exceeds the capacity of 25 hydroxyvitamin D,24 hydroxylase activity,
may explain their relative predisposition to hypercalcaemia (89).
Twin studies indicate that serum vitamin D is influenced by genetic factors (102). Levels of serum
vitamin D have been associated with variants in vitamin D associated genes and have also been
associated with response to vitamin D supplementation (103, 104). Barry et al showed that
variants in genes involved in vitamin D metabolism, including CYP24 A1, modified adult response
to vitamin D supplementation (103). In addition, Sollid et al 2016 noted that variants in 4 genes
associated with vitamin D metabolism, including CYP24A1, were associated with baseline vitamin
D levels in a cohort of pre-diabetic adult patients randomized to receive placebo or vitamin D
supplementation. Variants were also associated with greater change in vitamin D after 12 months
of supplementation (104).

Chapter 2 – Review of Literature
21
2.5. Familial Hypocalciuric Hypercalcaemia and Mutations in the CASR, GNA11 or AP2S1 genes Familial hypocalciuric hypercalcaemia (FHH) was first described in 1972. It is due to heterozygous
mutations impairing the function of the calcium sensing receptor (CaSR), a guanine nucleotide-
binding protein coupled receptor highly expressed in parathyroid and renal tubular cells. The
receptor is directly activated by high levels of calcium and inhibits parathyroid hormone secretion
and renal calcium reabsorption. Loss of one functional allele in the calcium sensing receptor gene
(CASR) causes reduced sensitivity of the parathyroid and renal cells leading to rightward shift in
the dose response curve for calcium, resulting in a higher ‘set point’ and persistent mild to
moderate hypercalcaemia (105). FHH is thought to be similar to primary hyperparathyroidism,
which is caused by homozygous mutations in CASR, but is considered less severe and without the
renal and skeletal manifestations, although apparent autosomal recessive transmission of FHH
has been described (106). FHH has a benign course and treatment is not generally required. For
patients with symptomatic hypercalcaemia, low calcium intake has been helpful, but diuretics and
bisphosphonates are generally not useful (16). Parathyroidectomy or calcimimetic drugs have
been considered in severe cases (107, 108).
For many years, mutations in the calcium sensing receptor were considered to be responsible for
FHH. Through gene mapping and with the discovery of several other genetic mutations, there are
now thought to be three genetically distinct but phenotypically similar forms of FHH. FHH type 1
(FHH1) is due to loss of function mutations in the calcium sensing receptor on 3q21.1 and
accounts for approximately 65% of all case; FHH type 2 (FHH2) is due to mutations in G protein
subunit alpha 11 gene (GNA11) on 19p13.3 that is involved in calcium sensing receptor signaling;
and FHH type 3 (FHH3), first described in 2013, is due to mutations in the adaptor related protein
complex 2 sigma 1 subunit gene (AP2S1) on 19q13.32, resulting in altered endocytosis of the
calcium sensing receptor (16-18, 109). There do not appear to be phenotypic features that help to
clearly differentiate the different subtypes, although FHH3 may be associated with higher serum
calcium and magnesium as well as cognitive deficits or behavioural disturbance in children (18,
110).
Classically, patients with FHH have hypercalcaemia, normal or elevated PTH, normal or low
phosphate, high magnesium and hypocalciuria (defined as calcium creatinine ratio <0.01);

Chapter 2 – Review of Literature
22
however, hypocalciuria is not a constant feature (4, 16, 18, 111, 112). Fujisawa et al reported a
female neonate who presented with hypercalcaemia associated with hypercalciuria who was
found to have an AP2S1 mutation consistent with FHH type 3 (16). Pasieka et al reported on a
family with benign familial hypercalcaemia, in which some members had hypocalciuria and some
had hypercalciuria; however genetic studies were not available at the time (113). In addition,
there have been case reports of adults with FHH type 1 in whom calcium creatinine clearance is
above 1%, higher than expected in this condition (112, 114).
Zajickova et al also reported on a family with hypocalciuric hypercalcaemia secondary to a CASR
mutation and noted that Vitamin D deficiency in two patients, including an infant and an adult
male with elevated calcium and elevated PTH levels, made the initial diagnosis difficult (114).
Supplementation with Vitamin D resulted in normalization of PTH levels. The calcium levels of the
adult male remained steady following Vitamin D supplementation and the calcium levels in the
infant rose slightly. The authors suggested that Vitamin D deficiency and then supplementation
modulated the clinical phenotype.
FHH type 1 has been associated with over 130 different mutations affecting the calcium sensing
receptor. Most are missense mutations that tend to be clustered around the extracellular domain
near the calcium binding site and the transmembrane domain which is involved in transmission of
activation signals (109). In contrast, only a few mutations in GNA11 have so far been identified as
causing FHH2 (109). AP2S1 mutations have been reported in more than 60 patients with FHH3. All
AP2S1 mutations affect the arginine 15 residue, with three substitutions so far described (17, 18).
Variants have been reported in all three genes associated with calcium sensing (109). Twin studies
estimate the heritability of serum calcium to be between 33 and 78% and variants in the CASR
may explain some of this variance (115-117). The A986S variant has been associated with serum
and ionised calcium levels in healthy adults (118, 119). Scillitani et al (115, 120) showed that
clusters of variants in CASR were associated with variance in serum calcium and suggested that
tri-locus haplotyping of the 986S allele and two neighbouring loci may be more useful for studying
the association between CASR variants and disease. In addition, the R990G variant of the CASR
has been associated with hypercalciuria in adults (121). There are limited studies of CASR variants
in children, although the A986S variant has been shown to be associated with total serum calcium

Chapter 2 – Review of Literature
23
in a cohort of African-American and European-American Children and total serum calcium
corrected for albumin in a group of Caucasian teenage girls in Sweden (122).

Chapter 2 – Review of Literature
24
2.6. Vitamin D Supplementation
2.6.1. Interest in Vitamin D
Vitamin D was first introduced in the 1920s after cod liver oil was successfully used to treat
vitamin D deficient rickets, and the active hormone was isolated (123, 124). Vitamin D plays a
crucial role in calcium absorption from the gut and it is well established that deficiency of vitamin
D is associated with rickets in children (125). Nutritional rickets due to vitamin D and calcium
deficiency is most prevalent in the Middle East, Asia and Africa but increasing prevalence has
been reported in Western countries, likely related to migration from geographic areas of high risk
(126-128). Other possible causes include prolonged breast feeding, reduced sunlight exposure
and restricted diets (126). The vitamin D receptor is found in many cells within the body and
recent studies have suggested a role for vitamin D insufficiency in many chronic diseases and in
epigenetic programming (129, 130). Improved vitamin D status has been linked to reduced risk of
chronic disease including Type 1 Diabetes, Crohn’s disease, multiple sclerosis and rheumatoid
arthritis.
Based on this emerging information, and population studies suggesting widespread prevalence of
vitamin D deficiency in Australia (131), interest in vitamin D has escalated. In 2012 Bilinski et al
reviewed the Medicare Benefits Schedule and noted that Medicare billings for vitamin D testing
increased from $1.02 million in the year 2000 to $96.7 million in the year 2010, indicating a yearly
increase of 59% in vitamin D testing (7). Bilinski et al also reported on sales of vitamin D
supplements in Australia and noted a 3 fold increase between 2000 and 2010 (6).
2.6.2. Measurement of Vitamin D Reserve and Definition of Vitamin D deficiency
Serum 25 hydroxyvitamin D (25OHD) is a marker of vitamin D reserve and is used to define
vitamin D status (37). Most of the 25OHD is made up of 25 hydroxyvitamin D3 (25OHD3). In the
past measurement has been mostly by immunoassay but some laboratories have now moved to
liquid chromatography tandem mass spectrometry (LCMS), which is felt to be more accurate.
Immunoassay results may be affected by differing concentrations of vitamin D binding protein
and cross reactivity with other vitamin D metabolites. The immunoassays do not differentiate
Chapter 2 – Review of Literature
25
between 25 hydroxyvitamin D2 (25OHD2) and 25 hydroxyvitamin D3 (25OHD3), and as they do
not bind 25OHD2 as well as 25OHD3, they can be an inaccurate representation of total vitamin D
level, particularly in countries where vitamin D2 is the main form of supplementation (93). LCMS
on the other hand does not distinguish epi-25 hydroxyvitamin D (epi-25OHD), which is not
measured by immunoassay, from 25OHD. Epi-25OHD exists in high levels in neonates and infants
and is thought to account for about 9% of 25OHD in adults, so inability to distinguish the two,
particularly in children, can lead to an overestimation of 25OHD (93). Comparisons between
different immunoassays and LCMS suggest that there is not a consistent correlation between
assays, even in Australia where there is fairly rigorous quality assurance (93, 132-134) .
The serum level of vitamin D to indicate sufficiency is a source of debate because of the difficulty
linking the serum level to an endpoint. Definitions for sufficiency of vitamin D in adults have
varied between serum 25OHD levels of 30 to 75 nmol/L, with optimal vitamin D being considered
in relation to PTH levels and/or causal association with disease (134). Atapattu et el reported an
inflection point of PTH when 25OHD levels reached 34nmol/L in children, although it was noted
that calcium intake was likely a significant influencing factor (135). The published consensus
seems to be that 25OHD levels of 50 nmol/L are adequate, although there is little evidence to
support this in children (9). In addition, it is well known that 25OHD levels vary with season,
reflecting variations in sun exposure.
2.6.3. Measurement of 1,25 Dihydroxyvitamin D
The measurement of 1,25 dihydroxyvitamin D (1,25(OH)2D) can be useful in the diagnosis of some
conditions which affect 1,25(OH)2D production, action or degradation, such as 1 alpha
hydroxylase deficiency, vitamin D resistant rickets and granulomatous disorders, in which there is
increased extra renal production of 1,25(OH)2D; however, it is not a good marker of vitamin D
status, as it has often been found to be normal in states of proven vitamin D deficiency (136).
Measurement of 1,25(OH)2D is also afflicted by similar issues that affect measurement of 25OHD
and although most laboratories use radioimmunoassay, some are using LCMS and there seems to
be a lack of good correlation across platforms (93). In addition, recent data using samples run on
Diasorin Liaison XL assay suggest that neonates and infants have higher 1,25(OH)2D levels that

Chapter 2 – Review of Literature
26
decrease with age, although the authors were unable to conclude whether this was due to cross-
reaction with another substance (137).
2.6.4. Vitamin D Supplementation in Infancy and Antenatally
For supplementation, vitamin D is given orally either as ergocalciferol (vitamin D2) or
cholecalciferol (vitamin D3). Both undergo the same metabolism, but vitamin D2 does not seem
to raise serum 25OHD levels as high as vitamin D3. This may either be because of the inability of
the radioimmunoassay to detect vitamin D2 accurately or differential metabolism of vitamin D2
and D3 (138).
Vitamin D supplementation has been used for many years to prevent rickets in infants and
children (8, 9, 139). Breast fed infants are a particularly important group, since breast milk
contains only very small amounts of vitamin D, usually between 10-80 units per litre expressed as
antirachitic activity and correlated with maternal plasma 25 hydroxyvitamin D concentrations
(25). The recommended intake of vitamin D in all infants and children in Australia to prevent
rickets is 400 units per day (9, 125). Most infant formula in Australia contains approximately 400
units of vitamin D in every 1000 ml, but not all formula fed children are taking 1 litre of milk in the
first months of life.
Australian guidelines for vitamin D supplementation in infants and children were first published in
2006 and provided advice around supplementation requirements to treat vitamin D deficiency, as
well as doses to prevent vitamin D deficiency in children at risk. To prevent vitamin D deficiency
in infants, it was recommended that mothers be screened antenatally and if moderately to
severely deficient, treated with 3000 to 5000 units daily until a 25 hydroxyvitamin D level above
50 nmol/L was achieved (8). The guidelines were revised in 2013 and the doses were reduced,
although the authors did not indicate the reasons for this and noted that data on optimal vitamin
D dosing regimens in pregnancy are lacking. In this publication, infant and childhood doses were
recommended to be 400 to 4000 units per day, depending on age and 25OHD level, and antenatal
doses were reduced to 1000 to 2000 units daily (9) (
Table 2-6). Clinical practice guidelines in pregnancy were updated further in 2018 and a significant
change was that vitamin D testing should not be routinely performed in pregnancy in the absence
of specific risk factors; although it was recommended that vitamin D supplementation be

Chapter 2 – Review of Literature
27
prescribed to those with 25OHD levels below 50 nmol/L. No specific recommendations regarding
vitamin D dose were provided (140). In 2016, Munns et al published a global consensus
statement on the prevention of rickets in infants and children and recommended that all infants,
irrespective of mode of feeding, be supplemented with 400 units of vitamin D from birth to 12
months, and thereafter, meet the nutritional requirements of 600 IU per day. Recommendations
for treatment of vitamin D deficient rickets in infants less than 12 months of age included 2000 IU
of vitamin D for 90 days, followed by a maintenance dose of 400 IU per day (125).
Table 2-6 Comparison of Vitamin D dosing recommendations according to Australian Guidelines in 2006 and 2013 (8, 9)
Vitamin D Level
2006 Recommendations 2013 Recommendations 2016 Recommendations
Definition 25OHD Concentration
Sufficient >50 nmol/L ≥ 50 nmol/L >50 nmol/L
Mild deficiency
25-50 nmol/L 30-49 nmol/L Insufficiency 30-50 nmol/L
Moderate deficiency
12.5-25 nmol/L 12.5-29 nmol/L Deficiency < 30 nmol/L
Severe Deficiency
< 12.5 nmol/L < 12.5 nmol/L
Age, Degree of Vitamin D Insufficiency and Vitamin D dose (IU/day)
Treatment of Vitamin D deficiency in infants and children
Age < 1 month Moderate-severe 1000 IU/day for 12 months
Preterm Mild 200 IU/day Moderate-severe 800 IU/day
Routine 25OHD screening not recommended, therefore no specific 25OHD threshold for vitamin D supplementation is targeted. 400 IU/day is recommended for all infants from birth to 12 months, independent of mode of feeding, to prevent rickets and osteomalacia. 600IU/day is recommended for children beyond 12 months of age and adults, through either diet or supplementation, to prevent rickets
Age 1-12 months Moderate-severe 3000 IU/day for 3 months or 300 000 IU over 1-7 days
Term < 3 months Mild 400 IU/day for 3 months Moderate-severe 1000 IU/day for 3 months
Age >12 months Moderate-severe 5000 IU/day for 3 months or 500 000 units over 1-7 days
3-12 months Mild 400 IU/day for 3 months Moderate-severe 1000 IU/day for 3 months or 50 000 IU stat
1-18 years Mild 1000-2000 IU/day for 3 months or 150 000 IU stat Moderate- severe 1000-2000 IU/day for 6 months or 3000-4000 IU/day for 3 months or

Chapter 2 – Review of Literature
28
150 000 IU single dose and repeat 6 weeks later
For treatment of nutritional rickets, at least 2000 IU/day is recommended for a minimum of 3 months, in addition to at least 500 mg/day calcium either dietary or as a supplement.
Treatment of vitamin D deficiency antenatally
Mild 400 IU/day
Mild 1000 IU/day
Pregnant women should receive 600IU/day of vitamin D to prevent nutritional rickets Moderate-severe
3000-5000 IU until 25OHD 50 nmol/L then 400 IU/day
Moderate-severe 2000 IU/day until 25OHD 50 nmol/L then 600 IU/day
IU: International units. 25OHD: 25 hydroxyvitamin D Studies have assessed vitamin D sufficiency following supplementation and it has been shown
that increasing doses of vitamin D supplementation increase serum 25 hydroxyvitamin D levels in
infants (38, 141). Zeghoud et al (142) showed that supplementation with high dose cholecalciferol
led to a rise in serum calcium concentrations, albeit still within the normal range . Large doses of
vitamin D have been shown to raise serum concentrations of 25 hydroxyvitamin D above the
supposed therapeutic range, but this is not always associated with hypercalcaemia (143). In 2013
Gallo et al (144) published data from a randomized controlled trial investigating the efficacy of
different dosages of cholecalciferol to maintain serum 25OHD levels greater than 75 nmol/L. One
month old breast fed infants were randomly assigned to receive 400 IU, 800 IU, 1200 IU or 1600
IU cholecalciferol. The 1600 IU group was stopped prematurely because 93% of infants developed
25OHD concentration above 250 nmol/L at 3 months. Two patients in each group had suspected
hypercalcaemia during the study but there was limited information about these cases provided by
the study group. Vitamin D in doses of 400 units (the amount in 1 teaspoon of cod liver oil) has
not been reported to cause toxicity.
The role of vitamin D supplementation antenatally has also received significant attention.
Maternal serum 25OHD levels in the third trimester have been positively correlated with
neonatal 25OHD in cord blood and the first week of life (145, 146), with cord blood levels
reported to be approximately 62-65% of maternal serum levels at birth (147). It is well reported
that supplementing women with vitamin D during pregnancy, increases maternal serum 25OHD at

Chapter 2 – Review of Literature
29
term and subsequently neonatal 25OHD (11, 148, 149). Higher levels of vitamin D given
antenatally have been associated with higher neonatal 25OHD levels (149). There is some
evidence that vitamin D supplementation antenatally may reduce the risk of pre-eclampsia, pre-
term birth and low birthweight, although further studies are required to confirm these findings
and until such time, the only neonatal outcome with good supportive data is an improvement in
25OHD concentration (11).
Follow up of infants born to mothers who received vitamin D supplementation antenatally has
not been rigorous. Cord blood 25OHD has been positively correlated with cord blood calcium
(146) and two studies have reported that vitamin D supplementation given antenatally seemed to
attenuate the physiological nadir in calcium and increase 1,25(OH)2D in the first week of life(150,
151). Delvin et al studied a group of women who received 1000 units of Vitamin D
supplementation in the last trimester of pregnancy and compared their offspring with women
who did not. Cord blood and blood taken at 4 days of age was assessed for calcium, 25
hydroxyvitamin D and 1,25 dihydroxyvitamin D levels. The study group noted that those who
were born to mothers receiving supplementation had significantly higher 25OHD levels on cord
blood, but they also had lower 1,25 dihydroxyvitamin D levels. On day 4 serum calcium levels
were higher in the supplemented group as were 25OHD and 1,25 dihydroxyvitamin D levels.
When compared with the samples taken from cord blood, calcium levels declined significantly in
the un-supplemented group. 25 hydroxyvitamin D levels dropped in both groups but the drop was
more pronounced in the supplemented group. 1,25 dihydroxyvitamin D levels increased in the
supplemented group but remained stable in the un-supplemented group. The authors concluded
that the supplemented group most likely had 25 hydroxyvitamin D more readily available to
convert to 1,25 dihydroxyvitamin D (150). Harrington et al also showed that in infants born to
mothers supplemented with high dose vitamin D (35, 000 IU per week) the drop in calcium level
over the first 3 days of life was attenuated. They estimated that for every 10 nmol/L increase in
cord blood vitamin D, there was 0.02 mmol/L attenuation in day 3 infant calcium. Hypercalcaemia
was reported in some infants but there was no significant difference in the rates of
hypercalcaemia between the two groups. Of note, all infant calcium levels were measured within
the first week of life (151).

Chapter 2 – Review of Literature
30
2.6.5. Vitamin D and the Calcium Content of Breast Milk
Vitamin D content of breast milk is related to maternal ultraviolet B (UVB) exposure, maternal
vitamin D intake, and varies with season (147, 152, 153). The 25 OHD concentration of breast milk
is expressed as antirachitic activity (ARA) which is usually based on the biologic activity values of
vitamin D or 25OHD, and is about 10-80 IU/L in human milk (154). Vitamin D preferentially
transfers into breast milk rather than 25OHD, so levels are thought to be only approximately 1%
of the maternal 25OHD concentration (25, 154). Supplementation of breast feeding mothers with
vitamin D has been shown to directly correlate with infant vitamin D levels (155), but only
maternal doses of 6400 IU have been reported to raise infant vitamin D levels to that of infant
supplementation with 400 IU/day (156). The main sources of calcium in breast milk are thought to
be from increased maternal bone resorption and intestinal calcium absorption. There are large
inter-individual differences in the calcium content of breast milk but it is thought that the calcium
concentration of breast milk is unrelated to maternal dietary calcium or vitamin D. Rather, some
authors suggest that the calcium concentration of breast milk is dependent on the concentration
of casein and citrate (157, 158).
2.6.6. Vitamin D Conclusion
It is apparent from the data available to date, that whilst vitamin D deficiency is associated with
infantile rickets, the exact serum concentration to denote sufficiency, the role of vitamin D
supplementation in pregnancy and in prevention of diseases other than rickets, and the exact
amount of vitamin D to meet the health needs of infants, is still not clear. There are likely a
number of important modifying factors that determine each individual’s vitamin D requirement,
including their ethnic background, genetics, maternal vitamin D sufficiency and calcium intake.
Whilst current global recommendations to supplement all breast fed infants with 400 units
vitamin D will likely achieve the primary aim of preventing rickets, it is likely that such a blanket
recommendation may not be necessary for everyone.

Chapter 2 – Review of Literature
31
2.7. Summary It is apparent that we have come a long way since the term ‘Idiopathic infantile hypercalcaemia’
was first coined by Lightwood in the 1950s. We now know that this term likely reflects a variety of
underlying diagnoses, which may or may not be related to an increased sensitivity to vitamin D,
including Williams syndrome, CYP24A1 mutations and FHH. However, there are many cases of
infantile hypercalcaemia that remain unlabeled, so whilst IIH may be a dwindling category, there
is much left to learn before it becomes a redundant term. In addition we still do not fully
understand the role of variants in genes involved in calcium and vitamin D metabolism, and how
these may affect how we interact with the environment around us, including response to
widespread increases in vitamin D supplementation.

Chapter 3 – Materials and Methods
32
Chapter 3 – Materials and Methods
3.1. Study Overview This study was conducted at the Sydney Children’s Hospital, Randwick, and was carried out in
three parts.
We observed an unusual increase in the number of referrals to the Endocrine service of the
Sydney Children’s Hospital for hypercalcaemia in infancy after 2010. To explore whether our
impression was correct, we surveyed our referral database from its establishment in March 2008
until March 2014 for referrals of infants with hypercalcaemia, and carried out a retrospective
chart review of the 14 infants identified with idiopathic hypercalcaemia.
To examine whether the apparent increased incidence might reflect variation in the genes known
to be involved in calcium sensing or vitamin D metabolism, the families of the above mentioned
14 infants with idiopathic hypercalcaemia were offered genetic testing for CYP24A1, CASR, GNA11
and AP2S1.
We asked if the increase in referral for hypercalcaemia was due to chance or reflected an
underlying increase in calcaemia in infancy, potentially exposed by increased vitamin D
supplementation in pregnancy. To explore this, we obtained de-identified data for serum calcium
and related analytes and 25OHD measured in all infants under 6 months of age from the South
Eastern Area Laboratory Service (SEALS), on the Randwick campus, between January 2002 and
December 2014. Because the laboratory method for measuring plasma calcium changed
significantly in January 2011, we obtained the same data on infants whose serum calcium was
measured at a peripheral hospital, also under the umbrella of SEALS, whose laboratory platform
changed 4 months prior to that at Randwick.
3.2. Ethics The study was approved by the Sydney Children’s Hospitals Network Human Research Ethics
Committee’s Executive HREC/14/SCHN/372. Site authorization was provided by the Sydney

Chapter 3 – Materials and Methods
33
Children’s Hospital research and governance office SSA/14/SCHN/380. Written informed consent
was provided by the parents of children who underwent genetic testing.
3.3. Definitions Hypercalcaemia was defined as a total serum calcium concentration above 2.75 mmol/l,
according to the reference ranges in place for SEALS during the study period (Table 2-1, page 9).
Hypocalcaemia was defined as total serum calcium concentration below 1.9 mmol/l in neonates
under the age of 2 weeks, and below 2.25 mmol/l for infants between 2 weeks and 6 months of
age.
Ionised calcium concentrations were used to validate trends seen in the total calcium data set,
and hypercalcaemia and hypocalcaemia were defined according to the age related reference
ranges detailed in Table 2-2, page 9.
Vitamin D sufficiency was defined as 25 hydroxyvitamin D (25OHD) concentration greater than or
equal to 50 nmol/L, as defined by the 2013 Australian and New Zealand position statement (9).
Severity of vitamin D insufficiency was defined by the same statement (
Table 2-6, page 27).
Reference ranges for other analytes were as defined by SEALS laboratory (Table 3-1) 1,25
dihydroxyvitamin D (1,25(OH)2D) levels were measured by radioimmunoassay at 2 external
laboratories, both with the same reference interval
Reference ranges for paediatric urinary calcium:creatinine ratios have not been established for
our laboratory. Urinary calcium:creatinine ratios are higher in infants than in adults and decrease
with age, likely related to the immature neonatal kidney and the rise in creatinine as muscle mass
increases with age. In infants less than 6 months of age, reference intervals with an upper limit of
normal from 1.5 to 2.4 mmol/mmol have been reported (159-161). For the purpose of this study
we chose to use the reference interval 0.4-2.2 mmol/mmol, reported by Matos et al, on the
advice of the renal physicians in our centre (159).

Chapter 3 – Materials and Methods
34
Table 3-1 SEALS reference ranges for analytes including 1,25(OH)2D, parathyroid hormone, phosphate, magnesium and alkaline phosphatase.
Test Age Reference Interval
1,25(OH)2D (pmol/L) 0 – 18 years 60-158
PTH (pmol/L) 0 – 18 years 0.5-5
Phosphate (mmol/L) 0-14 days 1.7-3
14 days-12 months 1.3-2.3
Magnesium (mmol/L) 0 – adult 0.65-1.02
ALP (U/L) 0-2 years 80-450
1,25(OH)2D: 1,25 dihydroxyvitamin D. ALP: alkaline phosphatase. PTH: parathyroid hormone.
3.4. Subjects with Idiopathic Infantile Hypercalcaemia To confirm our impression that the number of referrals had increased, infants referred to the
Endocrine Department at Sydney Children’s Hospital for the management of hypercalcaemia were
identified by searching a password protected database of electronically stored weekly inpatient
and consultation handover records available from March 2008. At the end of each on call week, a
new handover record is generated in Microsoft Word and saved by the on call registrar who has
been responsible for receiving all acute referrals for that week. The record captures all referrals
including those being managed at peripheral referring hospitals, patients who have been
discharged and those who are still being monitored and will be handed over to the new on call
team. Twenty-eight infants referred between March 2008 and March 2014 were identified using
the search terms ‘hypercalcaemia’, ‘hypercalcemia’ and ‘calcium’, and their clinical and
biochemical findings were analysed by chart review. To be included in our analysis, the infants
had to have documented hypercalcaemia for which there was no diagnosis, be aged less than 6
months at presentation and to have been assessed and treated by one of the endocrinologists in
our department (either as an inpatient, outpatient or in consultation with a general
paediatrician). Infants were excluded if they did not have sufficient medical information available
including at least 1 month of follow up biochemistry, to determine response to treatment and
outcome (Figure 3-1).
To check whether the increased number of referrals for hypercalcaemia was paralleled by an
increase in referral numbers generally, the number of patients being ‘handed over’ to the new on
call team was manually counted on each weekly list for the randomly chosen three month periods

Chapter 3 – Materials and Methods
35
of January to March and August to October each year from March 2008 to March 2014. This did
not showed a significant increase in the total number of referrals in each 12 month period (March
to March) over the 6 years (p=0.149), although there was an increase in the 2013/2014 year
(Table 3-2). To validate our method of capture, referrals during that time were scrutinized for
infants referred for hypercalcaemia We found 5 hypercalcemic patients who had not been
captured in our original analysis, however these five infants would not have met criteria to be
included in our cohort of patients with IIH because of: insufficient data; hypercalcaemia
secondary to distal RTA; hypercalcaemia following treatment for hypocalcaemia in the setting of
CHARGE syndrome; and hypercalcaemia that developed in intensive care in two infants following
major surgery for congenital diaphragmatic hernia repair or coarctation repair, respectively. We
also reviewed the rates of presentation for hypocalcaemia in the total data set, using the search
terms ‘hypocalcaemia’, ‘hypocalcemia’, ‘hypocalcaemic seizure’, ‘rickets’ and ‘vitamin D
deficiency’. There were 25 referrals for hypocalcaemia between March 2008 and March 2014. Of
these 25 referrals, only 6 patients were less than 6 months of age and all of these were referred
between March 2008 and August 2010. Four of these patients were captured in our count of the
handover lists. In summary, on review of the handover record, there was no significant increase
in referrals from March 2008 to March 2014, although there was a decrease from 2 to zero cases
of hypocalcaemia and a 7 fold increase in cases of hypercalcaemia captured within the same
record.
Table 3-2 Number of patients on handover lists for August, September and October (Aug-Oct) and January, February and March (Jan-Mar) each year from March 2008 to March 2014, including number of infants less than 6 months old identified as having hypercalcaemia and hypocalcaemia and hypercalcaemic infants not captured in the original analysis.
Year^ (Mar -Mar)
Number of patients on handover list
Number of infants with hypercalcaemia
Number of infants with hypocalcaemia
Number of hyercalcaemic infants not captured in original analysis
Aug-Oct Jan-Mar Total Aug-Oct Jan-Mar Aug-Oct Jan-Mar
08/09 276 136 412 1 0 1 1 1*
09/10 254 155 409 1 0 0 1 0
10/11 201 203 404 0 0 1 0 0
11/12 154 225 379 3 3 0 0 0
12/13 203 239 442 2 5 0 0 1*
13/14 246 280 526 2 5 0 0 3*

Chapter 3 – Materials and Methods
36
^Year was calculated from March to March, commencing March 2008 when handover records were first available *Did not meet inclusion criteria due to: insufficient data; hypercalcaemia secondary to distal RTA; hypercalcaemia following treatment for hypocalcaemia in the setting of CHARGE syndrome; hypercalcaemia developed in intensive care following major surgery for congenital diaphragmatic hernia or coarctation repair, respectively. Jan: January. Mar: March. Aug: August. Oct: October.
Figure 3-1 Decision tree used to identify infants with idiopathic infantile hypercalcaemia at Sydney Children’s Hospital March 2008 to March 2014
From the charts of the 14 infants identified with idiopathic infantile hypercalcaemia, clinical data
related to the presentation with hypercalcaemia were obtained, including symptoms leading to
the diagnosis of hypercalcaemia (specifically lethargy, poor weight gain, poor feeding or
vomiting), the presence of prior co-morbidities, and documentation of nephrocalcinosis on renal
ultrasound. The history of maternal vitamin D supplementation during pregnancy and infant
vitamin D supplementation postnatally was also obtained retrospectively. Serum calcium (total,

Chapter 3 – Materials and Methods
37
and where available, ionised), magnesium, phosphate, albumin, alkaline phosphatase, PTH,
25OHD and 1,25(OH)2D concentrations and urinary calcium:creatinine ratios were obtained from
the biochemical records of each patient.
All patients were treated with a low calcium formula (Locasol™, by Nutricia). Details of the
infants’ biochemistry during treatment and the duration of treatment were extracted from the
individual files.
3.5. Genetic Analysis The families of the 14 infants identified were approached to obtain blood for DNA for analysis of
the CYP24A1 gene, involved in vitamin D degradation (page 18) and the genes associated with
calcium sensing, namely CASR, GNA11 and AP2S1 (page 21), and nine families agreed to
participate.
Testing was performed at the Kolling Institute, a medical research facility at Royal North Shore
Hospital, which provides genetic testing for endocrine conditions that affect calcium, vitamin D
and phosphate regulation. All patients provided written informed consent for genetic testing. The
institute provided a summary of the techniques used for DNA sequencing. DNA was extracted
from peripheral blood leukocytes using the QIAamp DNA Blood Mini Kit (Qiagen). A custom gene
panel (TruSeq Custom Amplicon Assay, Illumina), including CASR, GNA11 and AP2S1 was
developed using DesignStudio (Illumina) to create libraries that are sequenced on Illumina MiSeq
platform. The protein-coding exons and flanking intronic regions of each of the genes were
encompassed. DNA (250 ng) was prepared from each sample according to the manufacturer’s
instructions (TruSeq Custom Amplicon Assay, Illumina). Sequencing data were analysed using
Illumina Miseq Reporter software (v2.3, Illumina) which assess sequencing quality, aligns
sequencing reads to the reference human genome [hg19] using a banded Smith-Waterman
algorithm and identifies variants (using the Genome Analysis Toolkit [GATK]). Annotation of
variants was performed using ANNOVAR (version 2013 Jul) (162), while visualization of data was
performed with the Integrated Genomics Viewer (IGV, v2.3, ww.broadinstitute.org) which allows
exploration of data aligned to the selected reference genome. To confirm findings, coding exons
of the gene of interest were amplified by Polymerase Chain Reaction (PCR) and the PCR products

Chapter 3 – Materials and Methods
38
were examined by Sanger sequencing which is outsourced to AGRF (Westmead, NATA ACC No.:
14332) where the samples are analysed using Big Dye Terminators (BDT) and capillary
electrophoresis on an AB3730xl DNA analyser. Each PCR product is sequenced in the forward and
reverse direction. The primer sequences used for CASR, AP2S1, GNA11 and CYP24A1 are detailed
in Table 3-3.
Table 3-3 Primer sequences for CASR, AP2S1 and GNA11 mutation analyses
Exon Name Primer
CASR
2 CaSR-2F CaSR-2R
ATCCCTTGCCCTGGAGAGACGGC AGAGAAGAGATTGGCAGATTAGGCC
3 CaSR-3F CaSR-3R
AGCTTCCCATTTTCTTCCACTTCTT CCCGTCTGAGAAGGCTTGAGTACCT
4A CaSR-4AF CaSR-4AR
ACTCATTCACCATGTTCTTGGTTCT GCTGTTGCTAAACCTGTCGC
4B CaSR-4BF CaSR-4BR
CCCAGGAAGTCTGTCCACAATG CCCAACTCTGCTTTATTATACAGCA
5 CaSR-5F CaSR-5R
GGCTTGTACTCATTCTTTGCTCCTC GACATCTGGTTTTCTGATGGACAGC
6 CaSR-6F CaSR-6R
CAAGGACCTCTGGACCTCCCTTTGC GACCAAGCCCTGCACAGTGCCCAAG
7A CaSR-7AF CaSR-7AR
AGTCTGTGCCACACAATAACTCACTC CTTGTTGAAGATGCACGCCA
7B CaSR-7BF CaSR-7BR
TGCTCATCTTCTTCATCGTCTGG CTCTCTGCATTCTCCCTAGCCCAGT
2 CaSR-2F CaSR-2R
ATCCCTTGCCCTGGAGAGACGGC AGAGAAGAGATTGGCAGATTAGGCC
3 CaSR-3F CaSR-3R
AGCTTCCCATTTTCTTCCACTTCTT CCCGTCTGAGAAGGCTTGAGTACCT
4A CaSR-4AF CaSR-4AR
ACTCATTCACCATGTTCTTGGTTCT GCTGTTGCTAAACCTGTCGC
4B CaSR-4BF CaSR-4BR
CCCAGGAAGTCTGTCCACAATG CCCAACTCTGCTTTATTATACAGCA
5 CaSR-5F CaSR-5R
GGCTTGTACTCATTCTTTGCTCCTC GACATCTGGTTTTCTGATGGACAGC
6 CaSR-6F CaSR-6R
CAAGGACCTCTGGACCTCCCTTTGC GACCAAGCCCTGCACAGTGCCCAAG
GNA11
1 GNA11 1F GNA11 1R
CCAGCCTGCTAGGTTGTCC ACTCACCGAGCAGCAGCAG
2 GNA11 2F GNA11 2R
GCAGGGTCTGGGTAAGAGG ATGGATGACCAGGGGTAGC
3 GNA11 3F CGAGCTCTCGACGTCTCC
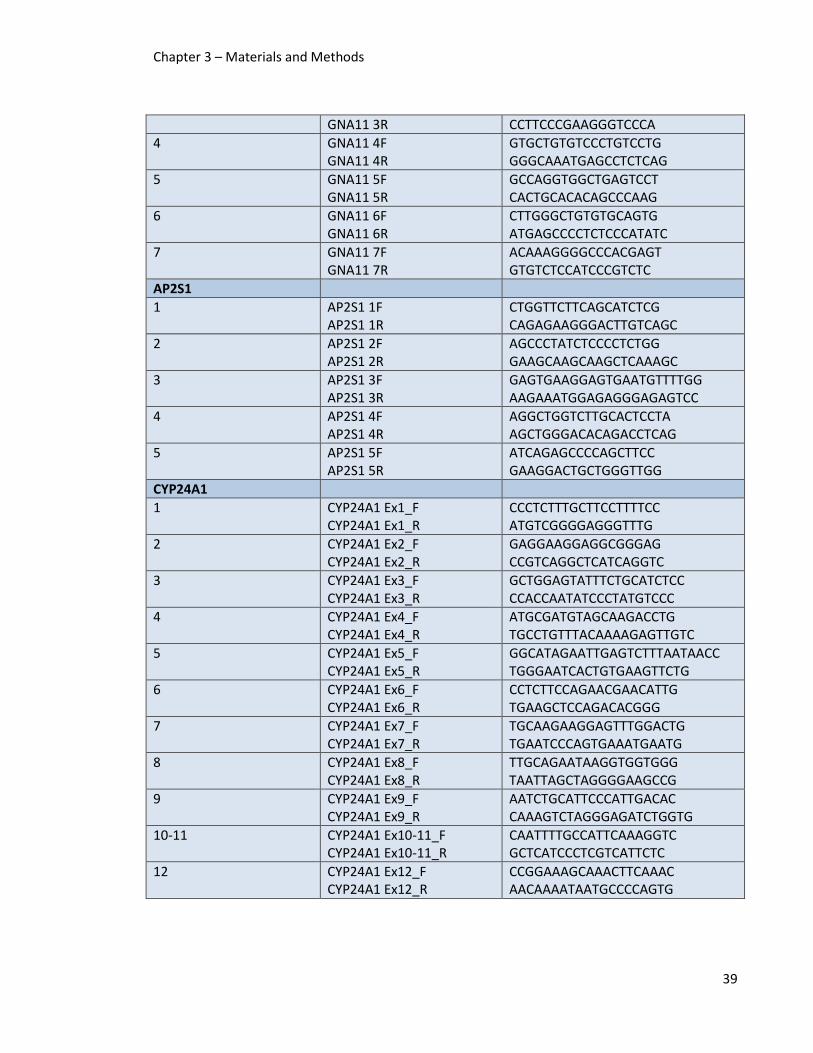
Chapter 3 – Materials and Methods
39
GNA11 3R CCTTCCCGAAGGGTCCCA
4 GNA11 4F GNA11 4R
GTGCTGTGTCCCTGTCCTG GGGCAAATGAGCCTCTCAG
5 GNA11 5F GNA11 5R
GCCAGGTGGCTGAGTCCT CACTGCACACAGCCCAAG
6 GNA11 6F GNA11 6R
CTTGGGCTGTGTGCAGTG ATGAGCCCCTCTCCCATATC
7 GNA11 7F GNA11 7R
ACAAAGGGGCCCACGAGT GTGTCTCCATCCCGTCTC
AP2S1
1 AP2S1 1F AP2S1 1R
CTGGTTCTTCAGCATCTCG CAGAGAAGGGACTTGTCAGC
2 AP2S1 2F AP2S1 2R
AGCCCTATCTCCCCTCTGG GAAGCAAGCAAGCTCAAAGC
3 AP2S1 3F AP2S1 3R
GAGTGAAGGAGTGAATGTTTTGG AAGAAATGGAGAGGGAGAGTCC
4 AP2S1 4F AP2S1 4R
AGGCTGGTCTTGCACTCCTA AGCTGGGACACAGACCTCAG
5 AP2S1 5F AP2S1 5R
ATCAGAGCCCCAGCTTCC GAAGGACTGCTGGGTTGG
CYP24A1
1 CYP24A1 Ex1_F CYP24A1 Ex1_R
CCCTCTTTGCTTCCTTTTCC ATGTCGGGGAGGGTTTG
2 CYP24A1 Ex2_F CYP24A1 Ex2_R
GAGGAAGGAGGCGGGAG CCGTCAGGCTCATCAGGTC
3 CYP24A1 Ex3_F CYP24A1 Ex3_R
GCTGGAGTATTTCTGCATCTCC CCACCAATATCCCTATGTCCC
4 CYP24A1 Ex4_F CYP24A1 Ex4_R
ATGCGATGTAGCAAGACCTG TGCCTGTTTACAAAAGAGTTGTC
5 CYP24A1 Ex5_F CYP24A1 Ex5_R
GGCATAGAATTGAGTCTTTAATAACC TGGGAATCACTGTGAAGTTCTG
6 CYP24A1 Ex6_F CYP24A1 Ex6_R
CCTCTTCCAGAACGAACATTG TGAAGCTCCAGACACGGG
7 CYP24A1 Ex7_F CYP24A1 Ex7_R
TGCAAGAAGGAGTTTGGACTG TGAATCCCAGTGAAATGAATG
8 CYP24A1 Ex8_F CYP24A1 Ex8_R
TTGCAGAATAAGGTGGTGGG TAATTAGCTAGGGGAAGCCG
9 CYP24A1 Ex9_F CYP24A1 Ex9_R
AATCTGCATTCCCATTGACAC CAAAGTCTAGGGAGATCTGGTG
10-11 CYP24A1 Ex10-11_F CYP24A1 Ex10-11_R
CAATTTTGCCATTCAAAGGTC GCTCATCCCTCGTCATTCTC
12 CYP24A1 Ex12_F CYP24A1 Ex12_R
CCGGAAAGCAAACTTCAAAC AACAAAATAATGCCCCAGTG

Chapter 3 – Materials and Methods
40
Only genetic changes, including common variants, within exons were reported. Common variants
(sometimes referred to as polymorphisms) are defined as genetic variations that occur in greater
than 1% of the population. The allele frequency (AF) from the ExAC (Exome Aggregation
Consortium) database was provided for the variants identified (http://exac.broadinstitute.org).
The AF refers to the frequency with which the reported allele occurs in the population. An AF of
0.45 means that 45% of chromosomes studied will carry that allele. In some cases a reported
variant may be the more frequent allele, but has been identified as a variant because it differs
from the allele that was identified when constructing the human reference genome. Information
from ClinVar (https://www.ncbi.nlm.nih.gov/clinvar), a public database of reports of the
relationship between genetic variants and phenotypes was used to further asses the likely
pathogenicity of variants identified.
When variants occur in the coding region of the protein, they can be synonymous or non-
synonymous. Synonymous variations do not change the amino acid sequence of the protein,
whereas non-synonymous variations change the amino acid sequence of the protein.
Synonymous variants are unlikely to have functional consequences or effects on phenotype but
both synonymous and non-synonymous variants are reported for completeness.
3.6. Identification of Trends in Calcaemia in Infants To determine if there was a trend to increased calcium concentrations amongst infants and
whether the incidence of hypercalcaemia and hypocalcaemia changed over time, we requested all
episodes of biochemical data (serum total calcium, ionised calcium, albumin, phosphate, PTH, ALP
and 25OHD) collected between 1st January 2002 and 31st December 2014 for all infants aged less
than 6 months at the time of sampling. Initially, these data were requested for infants sampled at
the Randwick campus comprising Sydney Children’s Hospital, Prince of Wales Private Hospital and
the Royal Hospital for Women. Subsequently, the same data were requested from an external
hospital site under the umbrella of SEALS, to confirm their generalizability and to test the possible
contribution of a change in the laboratory assay platform, which occurred approximately 4
months earlier at the peripheral site.

Chapter 3 – Materials and Methods
41
The data provided by SEALS were de-identified with each patient assigned a record number
(independent of their medical record number) and episode numbers to denote each occasion of
testing for an individual patient. The episode numbers also allowed identification of analytes run
concurrently. To be included, site of analysis, the date of birth for each infant and the date of
each episode of sampling had to be available to allow calculation of the age of the infant at each
time point.
Because of the potential for cord blood samples to positively skew analysis of the incidence of
hypercalcaemia, data from patients less than 1 day of age were excluded from all analyses. For
analysis of calcium-related analytes (phosphate, magnesium, alkaline phosphatase, albumin and
PTH), only samples associated with a total calcium concentration were used.
From the data provided, there were 26 765 measurements of total calcium concentration in 6146
infants, 83 228 measurements of ionised calcium in 9128 infants and 1581 measurements of
25OHD in 1398 infants across both sites.
Of note, whereas serum calcium or ionised calcium concentration has to be specifically requested
on a venous sample for it to be measured, ionised calcium is measured routinely in all venous or
arterial blood gas samples. The total calcium data set of 26 765 measurements, included 237
samples paired with ionised calcium. The paired total and ionised calcium measurements were
only available from 2009 to 2014. The ionised calcium data set comprising 83 228 measurements
was completely independent of the total calcium data set and was used to validate trends
suggested by the total calcium data set.
Analysis of total calcium was separated by site (Randwick or peripheral site) whereas ionised
calcium concentrations and 25OHD were combined for both sites, because the assays were the
same at each site and either did not change during the study period (ionised calcium) or changed
at the same time (25OHD).
To determine if there was an increase in total calcium concentration over the 12 year time period
of the study, serum calcium values were analysed by year, adjusted for age and multiple
observations per subject. To further examine any trend, the same analysis was performed for

Chapter 3 – Materials and Methods
42
calcium-related analytes and for the separate data set of ionised calcium. Correlations between
analytes paired with total calcium concentration were sought to confirm expected associations as
further validation of the data.
To determine if the rates of hypercalcaemia and hypocalcaemia changed over time, the
prevalence of each was reviewed by year of collection for both total calcium and ionised calcium.
Only the first serum total calcium or ionised calcium measurement was used on each infant, to
exclude multiple observations per patient and to minimize the effect of any therapeutic
intervention.
To determine if changes in calcium assay between 2010 and 2013 were associated with an
increase in calcium concentrations, we performed a comparison of the 2 year period prior to the
initial change of analyser, the approximately 2 year period that followed this prior to the
subsequent modification of the assay, and the approximately 2 year period from the assay
modification to the end of our data collection in December 2014. The comparison was performed
separately for both the Randwick and peripheral sites. The same assessment was performed for
ionised calcium values taken from a separate data set containing all ionised calcium, and also
ionised calcium paired with the first total calcium from each patient, which was available from
2009 to 2014.
Vitamin D was analysed to assess for changes in measurement frequency and concentration.
Because the method for measuring 25OHD changed in 2005 and 2014, with significant differences
reported between assays (163-166), we only assessed 25OHD values measured on the Diasorin
analyser from 14/11/05 to 14/07/2014 (n=1407 25OHD measurements in 1246 patients). The
trend for 25OHD concentrations was analysed over the study period, adjusted for the inclusion of
multiple observations per patient. To determine if there was an increase in the rate of vitamin D
sufficiency over time, 25OHD measurements above and below 50 nmol/L were reviewed by year
of collection, based on the first 25OHD level per patient.
3.7. SEALs Laboratory Platforms The analysers used for total calcium, ionised calcium and 25OHD are detailed in Table 3-4 and the
analysers used for the other analytes are detailed in Table 3-5.

Chapter 3 – Materials and Methods
43
The Diasorin Liaison chemiluminescence immunoassay (Diasorin, Saluggia, Italy) was used for
measurement of 25OHD from 2005 to 2014. The total interbatch imprecision was 10.6%. Before
2005 25OHD was measured on the Nichols Advantage chemiluminescence protein binding
immunoassay and after 2014 25OHD was measured using LCMS. Only the 25OHD measurements
on the Diasorin Liaison assay were analysed for this study. From 2002 to 2013, PTH was measured
using the Immulite chemiluminescent enzyme labelled immunoassay (Diagnostic Products
Corporation, Los Angeles), which measures intact PTH. From 2013 PTH was measured using Roche
e601 electrochemiluminescence immunoassay (Roche Diagnostics, Rotkreuz, Switzerland) which
measures intact PTH. The interbatch imprecision was less than 3.5%. 1,25 dihydroxyvitamin D was
referred to an external laboratory and measured on Diasorin radioimmunoassay (Diasorin,
Saluggia, Italy).
Serum biochemistry was measured using basic spectrophotometry assays run on a standard
chemistry analyser. For calcium analysis, the Randwick laboratory moved from Beckman to Roche
analyser (with cresolphtaleine assay) in January 2011 and, based on internal laboratory
correlations, there was a positive bias in calcium measurements of 2.2%, up to 4-5% in the higher
calcium ranges, such as in neonates. Roche later changed their assay from cresolphtaleine to the
BAPTA method, which is thought to be less likely to be inaccurate in the presence of high
concentrations of magnesium ions and contrast agents (167). This new assay was used in the
Randwick laboratory from January 2013 and based on internal correlations, was thought to
correct the previously noted upward bias in calcium concentrations.
The peripheral site moved to a Roche analyser (with cresolphtaleine assay) in August 2010, which
was being run concurrently with a Beckman Coulter analyser, until September 2010 when only
Roche analysers were used. The peripheral site changed to the Roche BAPTA method on the
same date as Randwick, in January 2013.
The ionised calcium assay did not change between 2002 and 2012 at either site.
Despite the many changes in method, there was no change in reference interval for total calcium
concentration at SEALS laboratory between 2002 and 2014 for infants less than 6 months of age.

Chapter 3 – Materials and Methods
44
Corrected calcium levels were not used due to previous data showing that they are unreliable in
infants under 12 months of age (20).
Table 3-4 Analysers used for serum calcium, urine calcium, ionised calcium and 25 hydroxyvitamin D at SEALS Randwick and peripheral site 2002-2014
Time 2002 2014
Analyte Site 14/11/05 22/09/10 14/01/11 23/1/13 14/7/14
Total calcium/Urine calcium
Randwick Beckman Coulter Roche Cobas
Roche Cobas with BAPTA method
Peripheral site
Beckman Coulter Roche Cobas Roche Cobas with BAPTA method
Ionised Calcium
Both sites Radiometer ABL blood gas analyser
25OHD Both sites Nicholls Advantage
Diasorin Liaison LCMS
LCMS: liquid chromatography tandem mass spectrometry. 25OHD: 25 hydroxyvitamin D. Table 3-5 Analysers used for biochemical analytes at SEALS Randwick and peripheral site 2002-2014
Time 2002 2014
Analyte Site 18 May 2006
22 Sept 2010
Dec 2010
14 Jan 2011
18 Oct 2013
17 Dec 2013
Mg Randwick Beckman Coulter Roche Cobas
Peripheral site
Beckman Coulter Roche Cobas
Phos Randwick Beckman Coulter Roche Cobas
Peripheral site
Beckman Coulter Roche Cobas
ALP Randwick Beckman Coulter
DXC880i Roche Cobas
Peripheral site
Beckman Coulter Roche Cobas
PTH Randwick Immulite Roche e601
Peripheral site
Sent to Randwick Roche e601
Albumin Randwick Beckman Coulter Roche Cobas
Peripheral site
Beckman Coulter Roche Cobas
Cr Randwick Beckman Coulter Roche Cobas with CREJ method
Roche Cobas with CREJ2 method
Peripheral site
Beckman Coulter Roche Cobas with CREJ method Roche Cobas with CREJ2 method
Mg: Magnesium. Phos: Phosphate. ALP: Alkaline Phosphatase. PTH: Parathyroid Hormone. Cr: Creatinine. LCMS: liquid chromatography tandem mass spectrometry.

Chapter 3 – Materials and Methods
45
3.8. Statistical Analysis
Statistical analyses were performed using IBM SPSS Statistical Software Version 25 (IBM Corp.
Released 2017. IBM SPSS Statistics for Windows, Version 25.0. Armonk, NY: IBM Corp) and
reviewed by a statistician.
For the small cohort assessment, median values were reported for non-normally distributed data,
with range reported to describe the variability in the data. Spearman’s correlations were used to
determine the relationship between continuous variables. Time series analysis was used to assess
for significant changes in handover counts over time.
For the larger data set, linear mixed models were used to assess for significant changes in
biochemical concentrations over time, adjusted for potential confounding factors and multiple
observations per patient. Multinomial logistic regressions were used to assess for significant
changes in rates of hypercalcaemia and hypocalcaemia over time. Linear regressions were used to
analyse correlations between continuous variables. Time series analysis was used to assess for
significant changes in frequency of vitamin D and calcium measurements over time. Chi Square
tests were used to compare categorical variables. An analysis of covariance (ANCOVA) with
Bonferroni post hoc test was used to assess for differences in estimated marginal mean of calcium
concentration before and after the analyser and assay changes.
For all statistical tests, p value < 0.05 was considered significant.

Chapter 4 – Results
46
Chapter 4 – Results
4.1. Sydney Children’s Hospital Idiopathic Infantile Hypercalcaemia Case Series 2008-2014
4.1.1. Cases Series of Idiopathic Infantile Hypercalcaemia Of the 14 patients (Table 4-1) included in the study, none presented between March 2008 and
March 2011; 5 were diagnosed between March 2011 and March 2012; 6 were diagnosed between
March 2012 and March 2013; and 3 were diagnosed between March 2013 and March 2014. All
were managed for hypercalcaemia by the Department of Paediatric Endocrinology either as
inpatients or outpatients of the hospital or in consultation with general paediatricians, if managed
at remote sites. If we had used the AACB harmonized reference interval introduced in 2014 with
an upper limit of calcium of 2.8 mmol/L, two infants (Patients 3 and 12) would not have met the
criteria for hypercalcaemia based on their first elevated calcium, but would have met the criteria
based on subsequent calcium measurements (calcium 2.82 mmol/L and 2.84 mmol/L,
respectively). Eight infants had non-specific symptoms consistent with hypercalcaemia, namely
poor weight gain (n= 6), lethargy (n= 6), poor feeding (n=5), vomiting (n=1) and/or irritability (n=
1). In the remaining 6 infants, hypercalcaemia was identified incidentally. Calcium concentrations
were measured in those identified incidentally because of respectively: prolonged jaundice; scalp
nodules (later thought to be bony protuberances); thyroid function tests in an infant born to a
mother with hypothyroidism; previous hypoglycaemia; routine blood tests in an infant with
hypopituitarism; and routine follow up blood tests in an infant born with low APGAR scores and
respiratory distress. Comorbidities (in addition to symptoms attributable to hypercalcaemia) were
present in 11/14 infants and are detailed in Table 4-2. Hypercalcaemia was classified as idiopathic
in the absence of clinical and biochemical evidence for potential causes including dehydration, fat
necrosis, FHH, hyperparathyroidism and Williams syndrome. None of the patients had dysmorphic
features suggestive of Williams syndrome and it was excluded in 10/14 patients (Patients
1,2,3,4,6,7,8,10,12 and 13) by fluorescence in situ hybridization (FISH). The median gestational
age was 40 weeks [33-41] with only two infants born at less than 36 weeks gestation, and the
median age at presentation was 17 days [5-53].

Chapter 4 – Results
47
Table 4-1 Clinical Characteristics of patients managed for idiopathic infantile hypercalcaemia at Sydney Children’s Hospital 2011-2014
Clinical Characteristic Number affected/Number in whom data available (%)
Male 4/14 (29)
Comorbidities including prematurity 11/14 (79)
Breast milk exclusively at diagnosis^ 11/12 (92)
Maternal vitamin D supplementation^ 10/11 (91)
Infant vitamin D supplementation 1/14 (7)
Symptomatic hypercalcaemia* 8/14 (57) ^Information not available in all patients * Lethargy, poor weight gain, poor feeding or vomiting

Chapter 4 – Results
48
Table 4-2 Reason for initial calcium measurement and comorbidities in patients managed for idiopathic infantile hypercalcaemia at Sydney Children’s Hospital 2011-2014
Patient Reason for initial calcium
measurement Comorbidities
1 Presented with fever, rash, lethargy and irritability
Small patent foramen ovale on echocardiogram, not requiring treatment. Small bilateral subdural haematomas.
2 Nodules noted on head (likely bony protuberances).
Scalp nodules.
3 Routine blood tests in premature infant with comorbidities. Loss of 10% birth weight.
Gestation 35+5. Twin 2 (MCDA). Growth retardation. Hypoglycaemia. Poor feeding. Anaemia. Discordant growth.
4 Meconium aspiration. Meconium liquor and fetal distress during delivery. Respiratory distress syndrome at birth and low APGAR scores (41/65). Treated with antibiotics for meconium aspiration. On intravenous fluids initially, started breast feeds on day 2 of life. Mother on calcium supplements.
5 Hypopituitarism and diabetes insipidus.
Septo optic dysplasia and panhypopituitarism on full replacement.
6 Mother hypothyroid and on thyroxine.
No comorbidities.
7 Hypoxic ischaemia encephalopathy, vomiting and failure to thrive
Hypoxic ischaemic encephalopathy secondary to perinatal asphyxia with multi-organ failure. Renal dysfunction and hypoglycaemia. Feeding difficulties. Tremor ?basal ganglia injury and mild cerebral palsy.
8 Poor feeding, lethargy and weight loss.
Treated for possible neonatal sepsis.
9 Postnatal follow up of microdeletion.
16p13.11 microdeletion diagnosed in utero.
10 Failure to thrive. No comorbidities.
11 Prematurity and poor weight gain.
33+5 weeks gestation. IUGR. VSD/pericardial effusion. Respiratory distress at birth. Dysmorphic features. Persistent tachypnea. Pulmonary hypertension.
12 Poor weight gain. No comorbidities.
13 Prolonged jaundice. Presented with prolonged jaundice, breast buds and umbilical granuloma.
14 Lassitude and poor feeding Hypotonia.
Vitamin D supplementation was given as cholecalciferol to 10/11 mothers in whom the
information was available. Six women received vitamin D as part of their multivitamin in doses of
350 or 500 IU daily (patients 1, 2, 4, 7, 9 and 13). One of these mothers was intermittently taking
1000 IU daily in addition to the multivitamin and increased this to 2000 units daily in the last

Chapter 4 – Results
49
trimester (patient 13). Two women were taking 1000 IU daily (patients 6 and 10) and two women
were taking 2000 IU daily (patients 3 and 8). Two women were also taking calcium
supplementation (patients 9 and 10).
Nephrocalcinosis was identified in 4/13 infants who had a renal ultrasound (patients 7, 10, 11 and
14). The baseline biochemistry in those who did and did not develop nephrocalcinosis is detailed
in Table 4-3, however no statistical analyses were done because of the small numbers.
Table 4-3 Baseline biochemistry in patients who developed nephrocalcinosis and those who did not, in a cohort of infants treated for idiopathic infantile hypercalcaemia at Sydney Children’s Hospital 2011-2014
Median Baseline Values Nephrocalcinosis (n=4) No nephrocalcinosis (n=10)
Calcium (mmol/L 2.98 [2.88-4.03] 2.90 [2.8-3.12]
Magnesium (mmol/L) 0.93 [0.69-0.93] (n=3) 0.75 [0.69-0.98]
Phosphate (mmol/L) 1.95 [1.23-2.08] (n=3) 2.13 [1.1-2.24] (n=9)
PTH (pmol/L) 0.5 [0.3-3.1] 0.75 [0.3-1.6] (n=8)
25OHD (nmol/L) 88 [44-218] 39.5 [17-73] (n=8)
1,25(OH)2D (pmol/L) 68 [64-190] (n=3) 214 [174-302] (n=3)
PTH: parathyroid hormone. 25OHD: 25 hydroxyvitamin D. 1,25(OH)2D: 1,25 dihydroxyvitamin D. n: total number.
4.1.2. Biochemistry of Patients with Idiopathic Infantile Hypercalcaemia
The biochemical characteristics for each individual patient at baseline are detailed in Table 4-4,
page 51. The baseline total calcium was the first calcium recorded at consultation with us and
associated chemistry was obtained either concurrently or within one week of the baseline
calcium. The median serum calcium concentration at presentation was 2.92 mmol/L [range 2.79-
4.03]. All paired magnesium levels fell within the reference range and are not included.
Twelve patients had a PTH concentration obtained a median of 1 day [range 0-5] after the
baseline calcium. None of these patients had an elevated PTH level. Five PTH levels were below
and seven were within the reference range (0.5-5 pmol/L) with a median PTH concentration of 0.6
pmol/L [range 0.3-3.1] at the time of hypercalcaemia (median 2.92 mmol/L [2.8-4.03]). For the
remaining two patients (patients 5 and 8) PTH levels were taken on days 13 and 17 from the
baseline calcium and were, respectively, 2.5 pmol/L with paired calcium 2.9 mmol/L, and 3 pmol/L
with paired calcium 2.67 mmol/L.

Chapter 4 – Results
50
Twelve infants had 25OHD concentrations measured within one week of baseline and in six of
them, concentrations were below 50 nmol/L (median 56 nmol/L [range 17-218]). In ten patients
there was associated hypercalcaemia (median paired calcium concentration 2.89 mmol/L [range
2.6-3.5]). There were no 25OHD levels above 250 nmol/L. The remaining two patients (patients 5
and 6) had 25OHD levels of 52 nmol/L and 30 nmol/L respectively with paired calcium 2.9 mmol/L
and 2.46 mmol/L, 13 and 11 days from baseline.
1,25(OH)2D concentrations were available in six patients within 1 week of consultation and above
the reference range in four patients (median 182 [64-302]), despite high calcium concentrations
(median 2.98 mmol/L [2.83-3.5]), implicating vitamin D metabolism as potentially contributing to
the hypercalcaemia.
Urinary calcium:creatinine ratios paired with a serum calcium concentration were measured in 11
infants a median of 2 days [range 0-5] after the first consultation. Ten of the eleven were still
hypercalcaemic, 7 of whom were hypercalciuric. None of the remaining 4 had hypocalciuria as
defined by either the reference range or the literature (168).
Alkaline phosphatase measurements were within the reference range in all 10 patients in whom it
was measured within one week of baseline.
Serum calcium concentrations were normal in 8 mothers and 3 fathers in whom it was measured.

Chapter 4 – Results
51
Table 4-4 Biochemical data at baseline (or within 1 week of baseline) from 14 patients treated for idiopathic infantile hypercalcaemia at Sydney children’s Hospital 2011-2014
Patient
Age first consult
(days)
Ca at first
consult (mmol/
L)
PO4 (mmol/
l)
PTH (pmol/L)
(Paired Ca, days from
first consult)
ALP (Paired Ca, days
from first consult)
First 25OHD (nmol/L)
(Paired Ca, days from
first consult)
First 1,25(OH)2D (pmol/L) (Paired Ca, days from
first consult)
First Ur Ca:Cr (mmol/mmol)
(Paired Ca, days from first
consult)
RI 1.9-2.75
1.3-2.3 0.5-5 80-450
>50 60-158 0.09-2.2
1 10 3.02 1.69 0.4
(Ca 2.84; +1 day)
278 40 (Ca 2.84; +1
day)
7.9 (Ca 2.82; +3days)
2 17 2.86 2.24 1.2 124 39 174 0.4
3 17 2.8 2.19 1.6 274 68
(2.6; +2 days)
4 5 3.01 1.1 0.3 107
32 3
(Ca 2.69; +1 day)
5 19 2.93 2.13
0.4
(Ca 2.92; +2 days)
6 5 2.83
Haem (PO4 2.0;
+3days)
0.5 (Ca 2.93; +4days)
2.3
(Ca 2.93; +4days)
7* 25 3.04 1.95 0.3
(Ca 3.16; +2days)
144 (Ca 3.16: +2days)
44 68
8 17 2.82 1.87 73
(Ca 2.71; +3 days)
1.9
9 8 3.12 1.73 0.3
(Ca 3.07; +5 days)
146 69 (Ca3.07; +5
days)
302 (Ca 3.07; +5 days)
4.4 (Ca 3.07; +5
days)
10* 50 4.03 1.23 0.3 232 102
(Ca 3.5; +1 day)
64 (Ca 3.5; +1
day)
3.8 (Ca 3.5; +1
day)
11* 53 2.88 2.08 3.1
(Ca 2.8; +4 days)
218 (Ca 2.8; +4
days)
7.3 (+3 days)
12 14 2.79 2.14 1.6
(Ca 2.84; +2 days)
167 33 (Ca=2.84; +2days)
1.2
(Ca 2.8; +4 days)
13 20 3.03 2.16 1 281
17 214
(Ca 2.83; +2 days)
7
14* 10 2.92
1.93 (Ca
2.91; +1day)
0.7 (Ca 2.91; +1
day)
150 (Ca 2.91; +1
day) 74 190
3.65 (Ca 2.77; +2days)

Chapter 4 – Results
52
Baseline biochemistry in patients treated for idiopathic infantile hypercalcaemia. The calcium concentration is the first elevated calcium recorded at consultation with our team. If associated biochemistry was not taken concurrently with baseline calcium, the value taken within 1 week of the initial consultation is reported together with the paired calcium and the number of days from consultation in brackets. PTH in patients 5 and 8 were measured 13 and 17 days, respectively, after baseline and are described in the text. *Nephrocalcinosis on renal ultrasound. PO4: phosphate. PTH: parathyroid hormone. 25OHD: 25 hydroxyvitamin D. 1,25(OH)2D: 1,25 dihydroxyvitamin D. Ur Ca:Cr: urinary calcium creatinine ratio. ALP: Alkaline phosphatase. Day: days from first consultation. RI: reference interval. Haem: haemolysed
Relationship Between Calcium Related Analytes Run Concurrently
Consistent with normal physiology, there was a significant negative correlation between PTH and
calcium concentrations (n= 12, r = -0.827, p=0.001, Spearman’s correlation), and a significant
positive correlation between phosphate concentration and PTH (n=10, r =0.919, p<0.001,
Spearman’s correlation). There was no significant correlation between calcium and phosphate
concentration (n=12, r=-0.566, p=0.055, Spearman’s correlation) and there were no significant
correlations between calcium concentration and either the first 25OHD level (n=12, r=-0.077,
p=0.812, Spearman’s correlation) or the first 1,25(OH)2D (n=6, r=-0.371, p=0.468, Spearman’s
correlation)
4.1.3. Management of Patients with Idiopathic Infantile Hypercalcaemia Of the 14 patients, 7 received IV fluids (patients 1, 2, 3, 6, 7, 10 and 13) and 2 received frusemide
(patients 2 and 7) for acute management of hypercalcaemia. All patients were treated with low
calcium formula (Locasol™). Treatment with low calcium formula was started once
hypercalcaemia was confirmed and the infant was able to tolerate oral feeds. The proportion of
Locasol™ prescribed (versus breast milk or formula feeds) was at the discretion of the treating
physician and was adjusted according to subsequent serum calcium concentrations.
Hypercalcaemia resolved in all infants in response to Locasol™. Most patients responded quickly,
with 13/14 patients having normal calcium levels recorded within 1 week of the initial
consultation. In the remaining patient (patient 12) calcium levels did not normalize until 12 days
after the initial consultation. Locasol™ treatment was continued then weaned and stopped once
calcium levels had normalized and were stable. The median time from consultation to stopping
full Locasol™ feeds was 49 days [0-183]. Three patients were never treated with full Locasol™
feeds. The median time of treatment from consultation until Locasol™ was stopped completely
was 226 days [24-1827] in 11/14 patients in whom this information was available.

Chapter 4 – Results
53
4.1.4. High Parathyroid Hormone (PTH) During Treatment with Locasol™
For all patients, follow up was individualized and at the discretion of the treating physician, with
weaning of low calcium formula usually based on serum calcium and hormonal investigations
variably performed. Results for PTH measured subsequent to the initial values were available for
13/14 infants a median of 89 days [range 9-357] after diagnosis (Table 4-5). In 9 infants the PTH
concentration had increased to above the reference range (median 10.7 pmol/L [Range 5.9-49.3]),
associated with a serum calcium concentration in the upper half of the reference range (>2.5
mmol/L) in 7/9 infants (median for the 9 infants: 2.68 mmol/L [range 2.11-2.79]. Five of 9 patients
were receiving Locasol™ exclusively at the time of the increased PTH.
Only 2 of 9 infants with a high PTH had a 25OHD concentration above 50 nmol/L; however of the
6 with values falling within the deficient or severely deficient range, only 2 (patients 3 and 4) had
biochemistry consistent with Vitamin D deficiency (Table 4-5). Seven of 9 infants with an elevated
PTH had an ALP measured at the time of the PTH or within 1 week and in 2 patients the ALP was
elevated above the reference interval.
Relationship between analytes
There were no significant correlations between PTH and Calcium, phosphate and PTH, calcium
and phosphate or calcium and 25OHD when all patients were analysed whilst on treatment with
Locasol; however there was a significant negative correlation between 25OHD and PTH (n=10, r=-
0.796, p=0.006, Spearman’s correlation). When only those who developed a rise in their PTH were
analysed, there was a significant negative correlation between PTH and calcium (n=9, r=-0.733,
p=0.025, Spearman’s correlation) and a significant positive correlation between 25OHD and
calcium (n=8, r = 0.886, p=0.003). There was also a significant negative correlation between PTH
and 25OHD (n=8, r=-0.790, p=0.02), however there was no significant correlation between
phosphate and PTH (n=9, r =0.100, p =0.798) or calcium and phosphate (n=9, r =-0.067, p=0.865).
These data are consistent with Locasol treatment leading to vitamin D deficiency and perturbed
mineral metabolism; however the fact that many of the patients still had relatively high calcium
concentration suggests an alteration in the calcium set point.

Chapter 4 – Results
54
Table 4-5 PTH values and associated biochemical data in infants whilst on Locasol™ treatment for idiopathic hypercalcaemia at Sydney Children’s Hospital 2011-2014
Patients in bold had elevated PTH. For patients with elevated PTH, the biochemical data is provided at the time of the first elevated PTH whilst on mostly Locasol™ or all Locasol™ feeds and with the most complete additional biochemistry. For patients without elevated PTH, the most complete biochemical data whilst on treatment with Locasol™ is provided. *Nephrocalcinosis on ultrasound. PTH: parathyroid hormone. Ca: calcium. PO4: phosphate. 25OHD: 25 hydroxyvitamin D. ALP: alkaline phosphatase. RI: reference interval
4.1.5. Outcome After Cessation of Locasol™
The median calcium concentration was 2.55 mmol/L [2.41-2.88] 1-6 months after stopping
Locasol in the 11/14 for whom the duration of Locasol treatment was known. 25OHD levels were
above 50 nmol/L in the 8 patients in whom they were measured (Table 4-6).
For the 4 patients with nephrocalcinosis, the ultrasound findings were unchanged in 3 patients
(patients 7, 10 and 11) who had follow-up ultrasounds at 3 years, 5 years and 8 months
respectively. In 1 patient (patient 4), the nephrocalcinosis was improving on follow up ultrasound
at 4 months.
Patient
Time from first
consult
(days)
Ca (mmol/
L)
PO4 (mmol/L
)
PTH (pmol
/L)
ALP (within
1 week;I
U/L)
Paired 25OHD
(within 1 week;
nmol/L)
Paired 125 OHD
(within 1 week;
pmol/L)
Time on Locasol™
exclusively (days)
Total time on Locasol (days)
RI 1.9-2.75
1.3-2.3 0.5-5 80-450
>50 60-158
1 125 2.75 2.15 12.8 23 0 708
2 35 2.57 3.22 5 35
3 150 2.29 1.87 17.8 608 16 158
4 51 2.11 2.58 49.3 452 10 51 226
5 357 2.52 1.93 2.5 182 456
6 190 2.69 1.8 4.2 43 597 183 213
7* 160 2.76 1.92 6.6 395 62 47 1827
8 17 2.67 2.04 3 324 0 24
9 216 2.46 2 1 226 71 7
10* 51 2.56 1.32 10.7 10 62 64 986
11* 53 2.93 2 5.9 394 119 720 145 145
12 136 2.57 2.39 9.5 441 38 298
13 9 2.68 2.69 8.2 247 47 179 139 139
14* 46 2.69 2.45 10.8 235 20 0
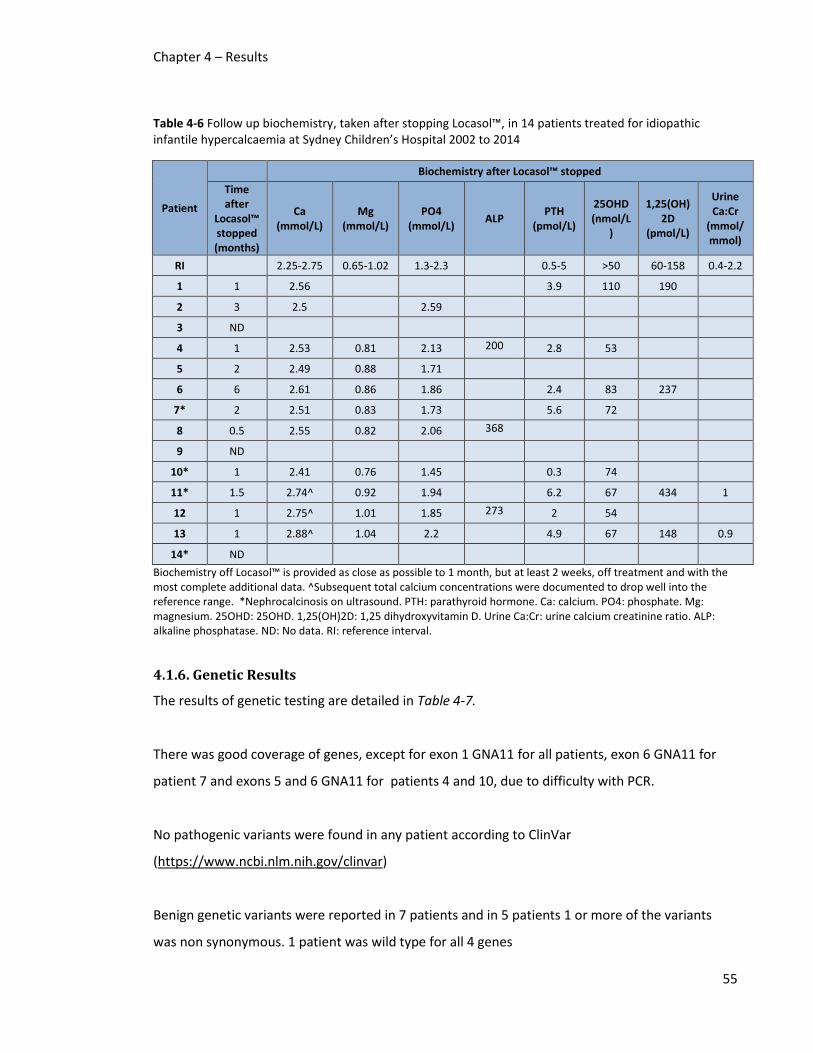
Chapter 4 – Results
55
Table 4-6 Follow up biochemistry, taken after stopping Locasol™, in 14 patients treated for idiopathic infantile hypercalcaemia at Sydney Children’s Hospital 2002 to 2014
Patient
Biochemistry after Locasol™ stopped
Time after
Locasol™ stopped (months)
Ca (mmol/L)
Mg (mmol/L)
PO4 (mmol/L)
ALP PTH
(pmol/L)
25OHD (nmol/L
)
1,25(OH)2D
(pmol/L)
Urine Ca:Cr
(mmol/mmol)
RI 2.25-2.75 0.65-1.02 1.3-2.3 0.5-5 >50 60-158 0.4-2.2
1 1 2.56 3.9 110 190
2 3 2.5 2.59
3 ND
4 1 2.53 0.81 2.13 200 2.8 53
5 2 2.49 0.88 1.71
6 6 2.61 0.86 1.86 2.4 83 237
7* 2 2.51 0.83 1.73 5.6 72
8 0.5 2.55 0.82 2.06 368
9 ND
10* 1 2.41 0.76 1.45 0.3 74
11* 1.5 2.74^ 0.92 1.94 6.2 67 434 1
12 1 2.75^ 1.01 1.85 273 2 54
13 1 2.88^ 1.04 2.2 4.9 67 148 0.9
14* ND
Biochemistry off Locasol™ is provided as close as possible to 1 month, but at least 2 weeks, off treatment and with the most complete additional data. ^Subsequent total calcium concentrations were documented to drop well into the reference range. *Nephrocalcinosis on ultrasound. PTH: parathyroid hormone. Ca: calcium. PO4: phosphate. Mg: magnesium. 25OHD: 25OHD. 1,25(OH)2D: 1,25 dihydroxyvitamin D. Urine Ca:Cr: urine calcium creatinine ratio. ALP: alkaline phosphatase. ND: No data. RI: reference interval.
4.1.6. Genetic Results
The results of genetic testing are detailed in Table 4-7.
There was good coverage of genes, except for exon 1 GNA11 for all patients, exon 6 GNA11 for
patient 7 and exons 5 and 6 GNA11 for patients 4 and 10, due to difficulty with PCR.
No pathogenic variants were found in any patient according to ClinVar
(https://www.ncbi.nlm.nih.gov/clinvar)
Benign genetic variants were reported in 7 patients and in 5 patients 1 or more of the variants
was non synonymous. 1 patient was wild type for all 4 genes

Chapter 4 – Results
56
No patient had non synonymous variants in CYP24A1 but 5 patients had non synonymous variants
in CASR, AP2S1 or both, although the biochemistry at baseline in these patients was not
suggestive of hypocalciuric hypercalcaemia.
Although none of the variants is reported as pathogenic, A986S has been associated with higher
serum calcium and R990G has been associated with hypercalciuria (118, 119, 121, 169).

Chapter 4 – Results
57
Table 4-7 Genetic testing results including common variants in AP2S1, CASR, GNA11 and CYP24A1, in 9 patients treated for idiopathic infantile hypercalcaemia at Sydney children’s Hospital 2011-2014
Pt AP2S1 CASR GNA11 CYP24A1
1 WT WT WT (exons 2-7) WT
2 Non synonymous c.164T>G, p.I55S AF 0.49
Non synonymous c.3031G>C, p.E1011Q AF 0.95 c.2968A>G, p.R990G AF 0.15 Synonymous c.2244G>C p.P748P AF 0.99
Synonymous c.771C>T p.T257T AF 0.43
Synonymous c.552C>T, p.A184A (homozygous) AF 0.49
4 WT WT WT (exons 2,3,4,7) Synonymous c.552C>T, p.A184A (homozygous) AF 0.49 c.1125G>A, p.P375P AF 0.28
5 Non synonymous c.164T>G, p.I55S AF 0.49
Non synonymous c.3031G>C, p.E1011Q AF 0.95 Synonymous c.2244G>C p.P748P AF0.99
Synonymous c.771C>T p.T257T AF 0.43
Synonymous c.552C>T, p.A184A (homozygous) AF 0.49 c.1125G>A, p.P375P AF 0.28
6 WT Non synonymous c.3031G>C, p.E1011Q AF 0.95 c.2956G>T, p.A986S AF 0.13 Synonymous c.2244G>C p.P748P AF 0.99
Synonymous c.771C>T p.T257T AF 0.43
WT
7 WT WT WT (exons2-5,7) Synonymous c.552C>T, p.A184A (homozygous) AF 0.49
8 WT Non Synonymous C1333A>G, p.T445A AF 0.02
WT (exons2-7) Synonymous c.552C>T, p.A184A AF 0.49
10 WT WT WT (exons 2,3,4,7) WT
14 Non synonymous c.164T>G, p.I55S AF 0.49
Non synonymous c.3031G>C, p.E1011Q AF 0.95 Synonymous c.2244G>C p.P748P AF 0.99
WT Synonymous c.552C>T, p.A184A (homozygous) AF 0.49 c.1125G>A, p.P375P AF 0.28
WT: wild type. AF: Allele frequency from ExAC database. All variants were heterozygous unless stipulated as homozygous in brackets. Pt: patient

Chapter 4 – Results
58
4.2. Analysis of SEALS laboratory Data 2002-2014
4.2.1. Overview of Data There were 131 372 episodes of biochemical measurements obtained from infants aged between
1 day and 6 months from all sites. The numbers and descriptive data for each analyte that was
paired with total calcium are detailed in Table 4-8. Ionised calcium data paired with total calcium
was only available from 2009. The numbers of total and ionised calcium measurements and of
25OHD according to the number of patients from whom these measurements were obtained and
the spread of calcaemia and vitamin D sufficiency are described in the cohort diagrams (Figure
4-1, Figure 4-2 and Figure 4-3). There was a significant difference in proportions of
hypocalcaemia (p<0.001, chi square) between the Randwick site and the peripheral site, which
may be explained by the volume of critically ill patients under 6 months of age being managed in
the neonatal and paediatric Intensive care units at Randwick. There was a smaller but significant
difference in proportions of hypercalcaemia (p=0.037, chi square). The age distribution of the
episodes of total calcium measurement is detailed in Figure 4-4. For all calcium values (and paired
analytes), 50% were measured in infants 30 days of age or younger. The number of calcium
measurements per year for total calcium concentration at each site and ionised calcium
incorporating both sites are shown in Figure 4-5 and Figure 4-6 respectively. There was a
significant increase in the frequency of total calcium measurements at the Randwick site
(p<0.001) but not at the peripheral site (p=0.986) from 2002 to 2014. There was no significant
increase in the frequency of ionised calcium measurements at all sites (p=0.107).
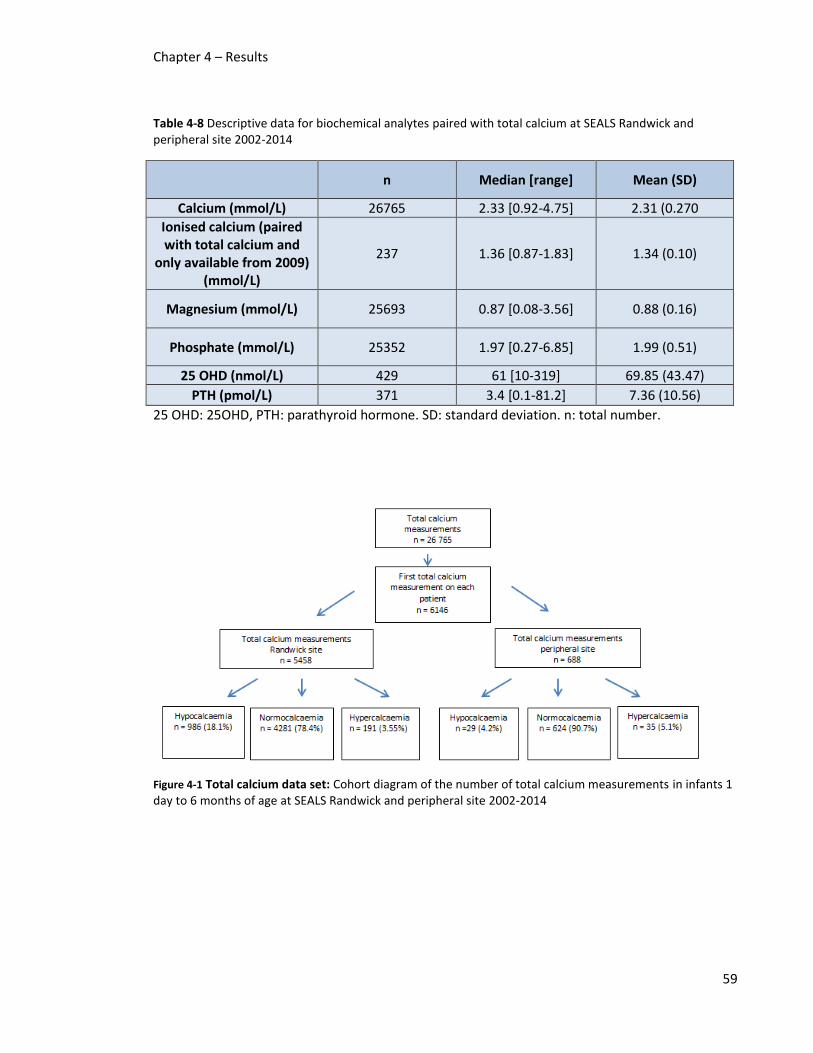
Chapter 4 – Results
59
Table 4-8 Descriptive data for biochemical analytes paired with total calcium at SEALS Randwick and peripheral site 2002-2014
n Median [range] Mean (SD)
Calcium (mmol/L) 26765 2.33 [0.92-4.75] 2.31 (0.270
Ionised calcium (paired with total calcium and
only available from 2009) (mmol/L)
237 1.36 [0.87-1.83] 1.34 (0.10)
Magnesium (mmol/L) 25693 0.87 [0.08-3.56] 0.88 (0.16)
Phosphate (mmol/L) 25352 1.97 [0.27-6.85] 1.99 (0.51)
25 OHD (nmol/L) 429 61 [10-319] 69.85 (43.47)
PTH (pmol/L) 371 3.4 [0.1-81.2] 7.36 (10.56)
25 OHD: 25OHD, PTH: parathyroid hormone. SD: standard deviation. n: total number.
Figure 4-1 Total calcium data set: Cohort diagram of the number of total calcium measurements in infants 1 day to 6 months of age at SEALS Randwick and peripheral site 2002-2014

Chapter 4 – Results
60
Figure 4-2 Ionised calcium data set: Cohort diagram of the number of ionised calcium measurements in infants 1 day to 6 months of age at SEALS Randwick and the peripheral site 2002-2014
Figure 4-3 25OHD data set: Cohort diagram of the number of 25 hydroxyvitamin D measurements (25OHD) in infants 1 day to 6 months of age at SEALS Randwick and the peripheral site

Chapter 4 – Results
61
Figure 4-4 Age distribution (days) of all total calcium measurements in infants aged 1 day to 6 months at SEALS either site (Randwick and peripheral site) between 2002 and 2014
Figure 4-5 Number of infants per year aged 1 day to 6 months, who had a total calcium concentration measured at SEALS Randwick (blue) and peripheral site (red) between 2002 and 2014

Chapter 4 – Results
62
Figure 4-6 Number of infants per year aged 1 day to 6 months who had an ionised calcium concentration measured at SEALS at either site (Randwick and peripheral site) between 2002 and 2014

Chapter 4 – Results
63
4.2.2. Prevalence of Hypercalcaemia and Hypocalcaemia
4.2.2.1. Calcium: Prevalence of hypercalcaemia and hypocalcaemia Over time, at the Randwick site, the prevalence of hypercalcaemia increased (P<0.001, OR =1.24
95% CI = 1.18-1.31, Multinomial Logistic Regression) and of hypocalcaemia decreased (P<0.001,
OR =0.88 95% CI = 0.86-0.89, Multinomial Logistic Regression; Figure 4-7). A similar trend was
seen for hypercalcaemia at the peripheral site (P=0.003, OR =1.16 95% CI = 1.05-1.27, Multinomial
Logistic Regression) but not hypocalcaemia (P=0.549, Multinomial Logistic Regression; Figure 4-8).
These data were supported by analysis of the ionised calcium data set in which the prevalence of
hypercalcaemia increased (P<0.001, OR =1.13 95% CI = 1.07-1.19, Multinomial Logistic
Regression) and the prevalence of hypocalcaemia decreased (P<0.001, OR =0.89 95% CI = 0.87-
0.90, Multinomial Logistic Regression) over time (Figure 4-9).
Figure 4-7 Prevalence of hypercalcaemia and hypocalcaemia by year at the Randwick site 2002 to 2014 based on age related reference intervals and the first total calcium measurement per patient in infants 1 day to 6 months of age.
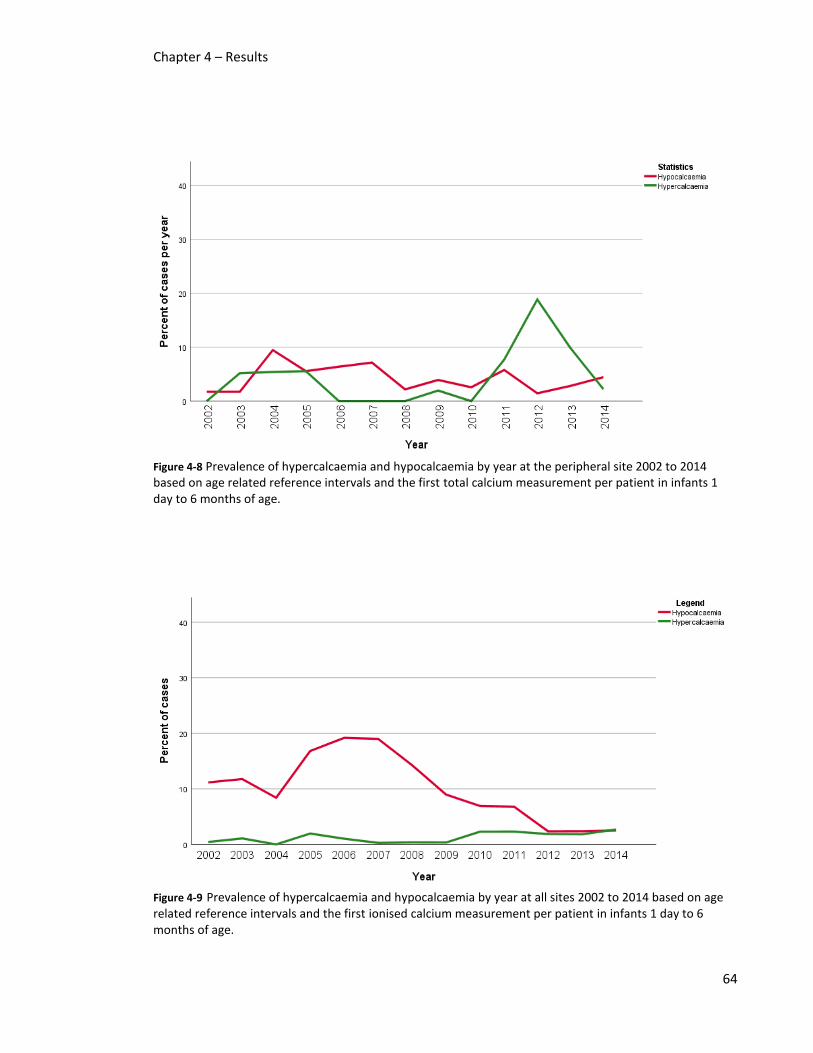
Chapter 4 – Results
64
Figure 4-8 Prevalence of hypercalcaemia and hypocalcaemia by year at the peripheral site 2002 to 2014 based on age related reference intervals and the first total calcium measurement per patient in infants 1 day to 6 months of age.
Figure 4-9 Prevalence of hypercalcaemia and hypocalcaemia by year at all sites 2002 to 2014 based on age related reference intervals and the first ionised calcium measurement per patient in infants 1 day to 6 months of age.

Chapter 4 – Results
65
4.2.3. Analysis of Calcium Concentration over time for Total Calcium and Ionised Calcium To explore whether the rise in cases of hypercalcaemia and decrease in cases of hypocalcaemia
might reflect a general rise in calcium concentration, we also assessed change in total calcium
concentration at each site and ionised calcium concentration at both sites, over time.
4.2.3.1 Calcium concentration over time Total calcium concentrations at each site and ionised calcium concentrations at both, significantly
increased over time adjusted for age and the inclusion of multiple observations per subject
(P<0.001 using a linear mixed model; Figure 4-10, Figure 4-11 and Figure 4-12). On average, each
year, total calcium increased by 0.019 mmol/L at Randwick and 0.01mmol/l at the peripheral site
and ionised calcium by 0.015 mmol/L across all sites When the data set for ionised calcium was
restricted to only those who had a paired total calcium measurement from 2009, the trend to
increase was maintained (p=0.001 using a linear mixed model; Figure 4-13)
Figure 4-10 Total calcium concentration by date collected at the Randwick site 2002 to 2014 for infants 1 day to 6 months of age.
Red line: 2.75 mmol/L. Green line: 1.9 mmol/L. Blue line: line of fit.

Chapter 4 – Results
66
Figure 4-11 Total calcium concentration by date collected at the peripheral site 2002 to 2014 for infants 1 day to 6 months of age.
Red line: 2.75 mmol/L. Green line: 1.9 mmol/L. Blue line: line of fit.
Figure 4-12 Ionised calcium concentration by date collected at all sites 2002 to 2014 for infants 1 day to 6 months of age.
Red line: Calcium 1.5 mmol/L. Green line: Calcium 0.93 mmol/L.

Chapter 4 – Results
67
Figure 4-13 Ionised calcium concentration (paired with calcium levels from the total calcium data set) by date collected at all sites 2009 to 2014 for infants 1 day to 6 months of age.
Red line 1.5 mmol/L. Green line 0.93 mmol/L. Blue line: line of fit.
4.2.4. Comparison of Total Calcium Concentration Between Sites According to Changes in Assay To determine if the change in assay may have contributed to the observed rise in calcaemia, we
used an ANCOVA with Bonferroni post hoc test, adjusted for age, to compare means of total
serum calcium 2 years before the analyser change (group 1), the approximately 2 years between
the analyser and assay change (group 2) and the approximately 2 years after the assay change
until the end of the study (group 3), at each site (Table 4-9). The Randwick site changed its
calcium analyser on 14/1/11 and made a further change to the assay on 23/1/13, whereas the
peripheral site changed the calcium analyser on 22/9/10 and made a further change to the assay
on 23/1/13 (Table 3-4).
At the Randwick site, the mean total calcium concentrations differed significantly between groups
(p<0.001). The mean total calcium concentration increased after the analyser change (p<0.001).
The mean total calcium concentration decreased after the subsequent assay change (p<0.001) but

Chapter 4 – Results
68
remained above that prior to the analyser change (p=0.003). This was in keeping with the
laboratory’s own observation that the initial analyser change led to a small increase in total
calcium that was corrected with the updated assay in 2013. However, we found that although an
increase in mean calcium concentration was noted after the analyser change at the peripheral
site, this did not correct after the 2nd assay change (p<0.001 for all groups, p<0.001 group 1 and 2,
p<0.001 group 1 and 3 and p=0.314 group 2 and 3). A similar pattern was observed when
analysing the paired samples for total and ionised calcium for the Randwick site. The mean total
calcium concentration increased after the change in analyser (p<0.001) but did not fall
subsequently (p=0.304) and the mean ionised calcium concentration did not change in these
paired samples (p=0.809). These findings support a contribution from the change in analyser to
the increase in total calcium observed. On the other hand, analysis of the separate ionised
calcium data set at Randwick, using the time periods corresponding to the changes in analyser
and assay for total calcium, showed a significant increase in mean ionised calcium suggesting that
there was an increase in calcaemia independent of changes in the analyser (p<0.001 for all
groups, p<0.001 groups 1 and 2, p<0.001 groups 1 and 3 and p=0.676 groups 2 and 3)
Table 4-9 Mean calcium ± SD for total calcium and ionised calcium at the Randwick and peripheral sites approximately 2 years before and after the analyser and assay changes for infants 1 day to 6 months of age.
Total Ca (mmol/L) Ionised Ca (mmol/L) mean ±SD
Paired Sample
Total Ca (mmol/L)
Ionised Ca (mmol/L)
Site Statistic Randwick† Peripheral site†
Randwick† Randwick† Randwick
Group 1
Mean ±SD (n)
2.32±0.27 (850)^
2.42±0.19 (91)
1.19 ±0.17 (1908)
2.47 ±0.13 (23)^
1.34 ±0.08 (23)
Group 2
Mean ±SD (n)
2.41 ±0.30 (994)*
2.56±0.21 (139)*
1.24 ±0.15 (1858)*
2.64 ±0.19 (40)*
1.36 ±0.09 (40)
Group 3
Mean ±SD (n)
2.36 ±0.29 (1136)*^
2.51±0.20 (110)*
1.25 ±0.13 (1677)*
2.59 ±0.14 (76)*
1.35±0.06 (76)
*Significantly different from group 1 p<0.05 ^Significantly different from group 2 p<0.05 †Significant overall difference between 3 groups p<0.05. Group 1: 2 years prior to the analyser change. Group 2: between the analyser and assay change (approximately 2 years). Group 3: from the assay change until the end of the study (approximately 2 years). Ca: calcium. SD: standard deviation. n: total number of samples

Chapter 4 – Results
69
4.2.5 Analysis of Vitamin D
4.2.5.1 Vitamin D sufficiency Over Time To determine whether there was an increased interest in vitamin D testing and/or sufficiency, in
association with changes in rates of hypercalcaemia, we assessed frequency of vitamin D testing
over time and changes in the number of cases that would be defined as sufficient or insufficient.
Using only the data obtained with the Diasorin analyser, there were 1407 vitamin D levels across
both sites between 14/11/05 and 14/07/2014 in 1246 patients, 90.8% of them (n= 1132) after
2009. In keeping with this, there was a significant increase in frequency of vitamin D testing over
time (p=0.015, time series analysis) but there was no significant change in the prevalence of
vitamin D sufficiency over time (p=0.662, Binary Logistic regression; Figure 4-14)
Figure 4-14 Measurements of 25 hydroxyvitamin D by year at all sites (Randwick and peripheral site) in infants 1 day to 6 months of age, and defined as sufficient (25OHD ≥50nmol/L) or insufficient (25OH D<50 nmol/L)
For the 308 paired measurements of calcium and 25OHD (Diasorin assay), the median total
calcium was 2.55 mmol/L [1.42-3.56] and the median 25OHD was 59 nmol/L [20-319]; thus, as
illustrated in Figure 4-15 many infants with a 25OHD as low as 10 nmol/L had total calcium

Chapter 4 – Results
70
concentration well within the reference range. There was no significant correlation between
25OHD and calcium (p=0.752). There was also no significant correlation between the 144 paired
PTH and 25OHD levels (p=0.983; Figure 4-16), nor was there a significant correlation between the
295 paired ALP and 25OHD measurements (p=0.716); however, there was a significant negative
correlation between the 122 paired PTH and calcium measurements (p=0.014, ᵝ=-0.222, r =0.222)
and a significant positive correlation between the 88 paired ALP and PTH measurements
(p<0.001, ᵝ=0.385, r=0.385). Taking the calcium measurements of greater than 2.75 mmol/L
(n=35) the median paired 25OHD was 53 nmol/L [11-144] and taking the calcium measurements
below 2.25 nmol/L (n=29) the median paired 25OHD was 50 nmol/L [11-243]. These data
underline the necessity of assessing 25OHD concentrations in the context of calcaemia.
Figure 4-15 25 hydroxyvitamin D and total calcium correlation all sites (Randwick and peripheral site) in infants 1 day to 6 months of age.
Green vertical line: Vitamin D 50 nmol/L. Red horizontal line: Calcium 2.75 mmol/L. Blue line: line of fit

Chapter 4 – Results
71
Figure 4-16 25 hydroxyvitamin D and PTH correlation all sites (Randwick and peripheral site) in infants 1 day to 6 months of age.
Green vertical line: Vitamin D 50 nmol/L. Red horizontal line: PTH 5.0 pmol/L. Blue line: line of fit.
4.2.5.2. Vitamin D Concentration over Time
Combining data from both sites, Vitamin D concentration significantly decreased over time,
excluding infants on day 1 of life and adjusted for the inclusion of multiple observations per
subject. On average vitamin D decreased by 1.59 nmol/L each year (P=0.001 using a linear mixed
model; Figure 4-17).

Chapter 4 – Results
72
Figure 4-17 25 hydroxyvitamin D concentration (nmol/L) by date collected at all sites (Randwick and peripheral site) 2002 to 2014 in infants 1 day to 6 months of age.
Red line:50 nmol/L. Blue line: line of fit.
Although there was a significant decrease in vitamin D levels over time, there was a significant
increase in paired calcium concentration (P<0.001 using a linear mixed model). On average and
across all sites, each year, total calcium concentration increased by 0.038 mmol/L. There was no
significant change in PTH concentration (n=144; p = 0.897) nor was there any significant change in
ALP (n=295; p=0.896).

Chapter 4 – Results
73
Figure 4-18 Calcium concentration (paired with 25 hydroxyvitamin; mmol/L) by date collected at all sites (Randwick and peripheral site) 2002 to 2014 in infants 1 day to 6 months of age.
Red line: 2.75 mmol/L. Green line: 1.9 mmol/L. Blue line: line of fit.
4.2.6 Analysis of Calcium Related Analytes
4.2.6.1. Correlation of Paired Analytes Of the 26765 calcium values, 25 352 had paired phosphate concentrations, 308 had paired
vitamin D (Diasorin assay only), 371 had paired PTH and 237 had paired ionised calcium (from
2009 to 2014 only). The expected physiological relationships were found. There was a significant
relationship between calcium and ionised calcium (p=0.004, ᵝ =0.601, r=0.601). There were
significant inverse relationships between calcium and phosphate (p<0.001, ᵝ=-0.106, r=0.106),
calcium and PTH (p<0.001, ᵝ =-0.229, r=0.229) and PTH and phosphate (p=0.002, ᵝ=-0.160, r=
0.160). There was no significant relationship between 25OHD and either calcium (p=0.752) or PTH
(p=0.684).

Chapter 4 – Results
74
4.2.6.2. Change in Concentration of Calcium Related Analytes Over Time Combining the data from both sites over the 12 years, there was an average annual increase in
the concentrations of PTH and ALP by 0.58 pmol/L and 6.68 U/L respectively (P<0.001 using a
linear mixed model). Magnesium decreased by 0.002 mmol/L and phosphate by 0.02 mmol/L per
year P<0.001 using a linear mixed model). The concentration of albumin decreased by an average
of 0.05 g/L (p<0.001 using a linear mixed model).

Chapter 5 – Discussion
75
Chapter 5 – Discussion
Analysis of our referral data confirmed that we experienced a spike in referrals for idiopathic
hypercalcaemia of infancy between March 2011 and March 2014 albeit in a younger age group
than originally reported by Lightwood (1, 83). The biochemical profiles of the infants referred was
similar to other reported cases of IIH; however the CYP24A1 gene implicated in some infants with
idiopathic hypercalcaemia was normal in all those tested. All infants responded well to reduced
calcium intake; however we noted that prolonged use of a low calcium feed was associated with
an increase in PTH and low 25OHD in most infants, even if total calcium concentrations remained
in the upper part of the reference range. This might indicate an abnormality of calcium sensing;
however there was no genetic evidence for this in those tested. We suggest that prolonged
treatment with low calcium feed needs close monitoring and early weaning because of the
potentially deleterious effect of raised PTH on bone health.
Analysis of laboratory-based population data in infants under 6 months of age identified an
increase in prevalence of hypercalcaemia, a decrease in prevalence of hypocalcaemia and a
gradual increase in both total and ionised calcaemia over 12 years; however we found no direct
evidence to link vitamin D supplementation in pregnancy with the rise in calcaemia. While some
of the change in total calcaemia is likely to be explained by a change in laboratory assay around
2011, hypercalcaemia in the infants referred to us was associated in many cases with significant
morbidity and was unlikely to be explained by assay variation. Although the frequency of
measurements of 25OHD increased with time, the concentration of 25OHD did not increase and
nor did the number of values above 50 nmol/L despite the widespread practice of vitamin D
supplementation during pregnancy, evident in our own cohort of hypercalcaemic infants. The
overall lack of correlation between calcaemia and 25OHD concentration, in both our cohort of IIH
and the laboratory-based population data, and the association of concentrations of 25OHD
classified as indicating moderate to severe vitamin D deficiency with total calcium concentrations
well within or above the reference range, suggests that the 25OHD concentration in an individual
should not be interpreted in isolation, as it more likely reflects both vitamin D stores and adaptive
vitamin D metabolism.

Chapter 5 – Discussion
76
The infants in our cohort had similar biochemical findings to previously described cases of IIH in
whom high calcium, low or normal PTH, high 1,25(OH)2D and normal 25OHD have been reported
(3, 4, 90, 99), a pattern also thought to implicate vitamin D in the aetiology (170). None of our
patients had elevated 25OHD (> 250 nmol/L) and in 6/12, the 25OHD concentration was below 50
nmol/L (Table 4-4, page 51); however 1,25(OH)2D measured within a week of the initial
consultation was above the reference range in 4 of 6 infants, associated with hypercalcaemia and
a PTH concentration below or in the lower part of the reference range. Several reports have
shown a similar pattern of high 1,25(OH)2D in spite of normal or in some cases, low, 25OHD (4),
suggesting that 1,25(OH)2D is driving the hypercalcaemia via increased intestinal absorption. The
underlying pathology explaining the divergent pattern of 25OHD and 1,25(OH)2D concentrations
may be either increased activity of the 1 alpha hydroxylase, resulting in increased conversion of
25OHD to 1,25(OH)2D (4) or impaired destruction of 1,25(OH)2D but normal breakdown of
25OHD, as occurs in CYP24A1 mutations (170). 1,25(OH)2D promotes intestinal and renal
phosphate absorption and therefore an excess of 1,25(OH)2D should be associated with high or
high-normal phosphate concentration (170). None of our patients had a phosphate concentration
above the reference range; however in 9/14 the phosphate concentration was in the upper half of
the reference range despite hypercalcaemia (Table 4-4, page 51).
There were two obvious differences between our cohort of IIH infants and those previously
reported: they were younger and there was a high rate of comorbidity, ranging from prematurity
and difficult deliveries to neonatal sepsis and genetic mutations (not associated with
hypercalcaemia). All patients in our cohort were diagnosed in the first 2 months of life, with 12 of
14 presenting within the first month of life, whereas IIH has been described as usually presenting
between 3 and 7 months of age (4, 99). Only one infant in our case series was receiving vitamin D
supplementation (as a low dose in an infant multivitamin), but 10 of 11 patients in whom the
information was available were born to mothers who received relatively modest antenatal
vitamin D supplementation. Five mothers were taking vitamin D in doses ranging from 1000 to
2000 units per day and 5 mothers were receiving lower dose vitamin D (350-500 units per day) in
multivitamin preparations. Antenatal vitamin D supplementation has been studied extensively.
Most studies do not report an increased incidence of infant hypercalcaemia; however there are
data to suggest that the physiological nadir usually seen in serum calcium within the first 48 hours
of life is attenuated in those exposed to antenatal vitamin D (151). A recent study by Roth et al

Chapter 5 – Discussion
77
(171) found that antenatal vitamin D supplementation was associated with higher calcium
concentration in cord blood and at 3 months of age compared with the infants of placebo treated
mothers, although this effect was no longer seen at 6 months. Brooke et al also noted that serum
calcium concentrations in infants on days 3 and 6 of life were higher in those whose mothers
received 1000 units of calciferol each day during pregnancy (172). In addition, a recent systematic
review and meta-analysis of the effects of maternal vitamin D supplementation also concluded
that neonates had higher calcium concentrations (173). We did not find direct evidence to
support our original hypothesis that maternal vitamin D supplementation unmasked a
predisposition to hypercalcaemia, however; the absence of a definable aetiology, the early
presentation and the resolution in all infants after a period of support with low calcium feed
raises the possibility that the hypercalcaemia was a carry-over from the environment in utero,
and/or that post-natal events uncovered a predisposition to hypercalcaemia. If following
antenatal vitamin D supplementation neonates are more calcium replete, it is feasible that non-
pathological genetic variants affecting vitamin D metabolism or calcium sensing, or stimuli of
1,25(OH)2D production unrelated to mineral metabolism could be associated with a
predisposition to hypercalcaemia.
In critically ill adults and children, low 25OHD concentrations have been associated with greater
illness severity and mortality, but the direction of association is unclear. Some authors propose a
role for vitamin D status as a prognostic tool; however it is likely that critical illness or therapeutic
intervention in very unwell patients modifies vitamin D metabolism, and this is supported by the
finding that 25OHD levels decrease during acute illness in adult patients (174, 175). Potential
mechanisms to explain the low 25OHD levels in critically ill patients include haemodilution by
intravenous fluid, a decrease in vitamin D binding protein or conversion of 25OHD to its
metabolites (176). A dysregulated vitamin D metabolism model has also been proposed in chronic
inflammation, whereby bacterial pathogens invade cells and increase 1,25(OH)2D in an attempt to
upregulate the vitamin D receptor; 25OHD is then rapidly broken down and levels decrease (177).
25OHD may therefore be a particularly poor measure of vitamin D status in patients with critical
illness, chronic inflammation or other co-morbidities, and might explain the findings in our study,
whereby 6/14 patients had 25OHD levels below 50 nmol/L despite elevated total calcium and in
some cases, elevated 1,25(OH)2D.

Chapter 5 – Discussion
78
It should be noted that 1,25(OH)2D is not measured routinely in all laboratories and the assays
are not robust. Difference between assays and poor correlation between platforms has been
reported (93). In addition, reference ranges for adults have been used for infants and children,
likely related to the accepted physiology that neonatal 1,25(OH)2D levels rise after birth and
reach adult levels within the first week of life(12, 13); however, recent data suggest that neonates
and infants may have higher 1,25 dihydroxyvitamin D levels that decline with age (137).
Nearly all of our patients were fed with breast milk exclusively at diagnosis and responded quickly
to the introduction of Locasol™, raising the possibility that the calcium concentration of the
breast milk may have contributed to the hypercalcaemia. One study comparing lactating mice
sufficient or insufficient for 1 alpha hydroxylase, suggested that 1,25 dihydroxyvitamin D and
dietary calcium had an effect on the calcium concentration of breast milk (178). However there is
no evidence to date in human studies that maternal vitamin D supplementation or even maternal
calcium intake alters the calcium content of breast milk (157, 158, 179). The calcium content of
breast milk appears to be highly variable between populations and it is likely that genetic factors,
rather than dietary calcium or vitamin D, are of more significance in determining the calcium
concentration of breast milk (180).
Alterations in intestinal calcium absorption also might explain sensitivity to the calcium content of
milk. Current evidence, mostly based on animal models, suggests that neonatal absorption of
calcium results from passive non-saturable paracellular transport, but shifts towards more active
saturable transcellular transport with increasing postnatal age. Mouse models suggest that the
greatest transition in gut absorption mechanisms is around the time of weaning and may be
related to upregulation in the expression of genes involved in transcellular transport, including
TRPV6 (transient receptor potential vallinoid 6 calcium channel) and CaBP9K (Calbindin-9K
calcium binding protein)(181). In mouse models, 1,25(OH)2D has been shown to increase
transcription of TRPV6 and CaBP9K in the intestine around the time of weaning. In vivo studies
have also shown 1,25(OH)2D to increase passive calcium absorption, although the findings have
not been replicated in studies in adult rodents (181). Given that there is some evidence to show a
greater increase in 1,25(OH)2D across the first 4 days of life in infants born to mothers
supplemented with vitamin D (150), it is possible that antenatal vitamin D supplementation

Chapter 5 – Discussion
79
modifies or enhances changes in the intestinal absorption of calcium in the infant, however no
studies have looked at this in detail.
In four of twelve infants in whom it was measured within a week of the initial consultation, the
urinary calcium:creatinine ratio was inappropriately low or normal in association with
hypercalcaemia, raising the possibility of Familial Hypocalciuric Hypercalcaemia (FHH). Because of
the range of biochemical findings in FHH, this diagnosis can be hard to exclude and assessment of
parental serum and urinary calcium looking for FHH was incomplete in our cohort. Urinary
calcium:creatinine ratios within or even above the reference range have been reported in proven
FHH, particularly in neonates (16), however none of the 9 infants tested, including 2 who had
ratios < 0.5, had pathological variants of the genes known to be associated with FHH. Moreover,
the biochemistry both prior to and during Locasol™ treatment was inconsistent with an
abnormality of calcium sensing in those who had common non-synonymous genetic variants of
the CASR and/or AP2S1 genes.
An unexpected finding in our cohort of patients was the rise in PTH noted over the course of
treatment with Locasol™, despite calcium levels at the upper end of the reference interval. The
combination of low calcium and no vitamin D intake associated with prolonged, exclusive
Locasol™ feeds would predispose to vitamin D deficient rickets. Nine of 13 patients who had PTH
levels measured had elevated PTH, associated with calcium levels in the upper half of the
reference range in 7/9. Only 5/9 were exclusively on Locasol™ at the time. Of 10 infants who had
a paired 25OHD concentration, only 3 had values above 50nmol/l. Of the remaining 7/10, 5 had
values <25nmol/l, two of whom had low or low-normal calcium concentrations and increased ALP
consistent with vitamin D deficiency (Table 4-5, 54). No radiological examinations were
performed in any of the infants.
The association of increased PTH, low 25OHD and relatively high calcium concentrations seen in
four of the patients is suggestive of a calcium sensing receptor abnormality. Fujisawa et al
reported similar findings in an infant with an AP2S1 mutation, consistent with FHH type 3 (16).
Treatment of the symptomatic infant with low calcium formula resulted in resolution of
symptoms and improved growth, but PTH became elevated as serum calcium normalized. We did
not find genetic evidence for pathogenic calcium sensing receptor abnormalities in our cohort,
Chapter 5 – Discussion
80
and in the 5 patients who had common non synonymous variants in at least one of the genes
involved in calcium sensing, only 2 developed a rise in PTH on treatment with low calcium
formula. The genes we tested are thought to explain only up to 70% of cases of FHH (182), so it is
possible that genes aside from those studied may be implicated. In view of our findings, we would
recommend that use of low calcium formula is monitored with frequent measurement of PTH,
calcium, phosphate and alkaline phosphatase, to guard against a potentially deleterious effect on
bone health.
No pathogenic gene mutations were identified in our cohort of patients who agreed to genetic
testing. When Schlingman and colleagues reported on CYP24A1 mutations in 2011, they
postulated that their findings may explain the molecular basis behind IIH and why these infants
seemed to have an increased sensitivity to vitamin D supplementation. Our data, however,
suggest that many cases of IIH still remain unexplained, and unlike other case series, genetic
testing did not increase our diagnostic yield. Since this study was completed, genetic mutations in
SLC34A1(183) have been identified as a potential cause of IIH, and it may be that looking at other
genes involved in calcium and vitamin D metabolism will be more fruitful. In 2017, Pronicka et al
found that out of 11 patients with idiopathic infantile hypercalcaemia, 9 patients had CYP24A1
mutations and 2 patients had SLC34A1 mutations (86). SLC34A1 encodes the renal sodium
phosphate transporter and affected patients develop hypophosphatemia due to renal phosphate
wasting leading to a decrease in FGF23. This results in increased CYP27B1 expression and activity
of 1 alpha hydroxylase and decreased CYP24A1 expression and 24 hydroxylase activity. The net
effect is an increase in 1,25(OH)2D, hypercalcaemia and hypercalciuria. Vitamin D
supplementation in these patients results in unlimited vitamin D activation due to lack of the
counter-regulatory effects of FGF23. Only 2 patients from our cohort had low phosphate levels on
presentation (Table 4-4, page 51), but analysis of this gene may prove informative, as may the
role of other genes involved in FGF23/Klotho signaling that could potentially result in decreased
FGF23 action (184, 185).
Common polymorphisms in CASR, AP2S1, GNA11 and CYP24A1 were identified in 7 of 9 patients
in our cohort who underwent genetic testing. Non-synonymous variants that alter the amino acid
sequence of the protein have greater potential to affect phenotype, although there is increasing
awareness that synonymous variants are in some cases implicated in pathogenicity (186). All five

Chapter 5 – Discussion
81
of the non-synonymous variants that were identified in our patients were located in the AP2S1
and CASR genes. The biochemistry in these patients was not suggestive of hypocalciuric
hypercalcaemia and information from ClinVar (https://www.ncbi.nlm.nih.gov/clinvar), a public
database of reports of the relationship between genetic variants and phenotypes, identified these
as benign variants based on The American College of Medical Genetics and Genomics consensus
recommendation (186). However it is important to note that the concept of ‘benign’ and
‘pathogenic’ variants might not be well suited to the genes we studied whereby variants may not
lead directly to pathology but may result in changes in phenotype that predispose to pathology
under certain circumstances.
Two of the variants reported in the CASR in our patients have been associated with specific
phenotypes. One of the variants in the CASR (R990G), with an allele frequency of 0.15, occurred in
patient 2. This variant has been associated with an increased risk for urolithiasis and
hypercalciuria and increased sensitivity to the PTH lowering effects of Cinacalcet (121, 169, 187).
One study also reported that vitamin D deficient individuals (based on 25OHD level <20ng/ml [50
nm/L]) who were homozygous for the R990G allele had lower serum calcium and higher PTH
levels (188). In our study, the only patient harbouring this heterozygous variant (patient 2) had
one of the lower urine calcium excretions at the time of hypercalcaemia but did not have follow
up vitamin D and PTH levels during treatment. Another patient in our study (patient 6) had the
CASR A986S variant, which in homozygous form has been associated with variance in serum
calcium in adults and several small studies involving African American and European American
children(115, 118, 119, 122). One of these studies also analysed tri-locus haplotypes of the CASR ,
looking at A986S along with neighbouring R990G and Q1011E variants, and showed that higher
ionised blood calcium levels were associated with the SRQ/ARE genotype, compared with the
ARQ/ARQ (wild type) genotype(115). This group suggested that tri-locus haplotyping may provide
more information regarding the role of CASR variants and phenotype.
To determine if our findings of increasing presentation of IIH reflected a more widespread
phenomenon, we analysed population data from our hospital laboratory.
Review of the first total serum calcium concentration obtained from infants less than 6 months of
age, between 2002 and 2014, showed that according to laboratory age-related reference

Chapter 5 – Discussion
82
intervals, the incidence of hypercalcaemia increased at both Randwick and the peripheral site
(p<0.003; Figure 4-7, page 63 and Figure 4-8, page 64). This might have been explained by
changes in the assay for total calcium or by increased sampling; however the same analysis was
performed on a separate data set of ionised calcium for which there was no change in assay
method and no significant increase in sampling and the same pattern was seen (p<0.001; Figure
4-9, page 64). We also examined these independent data sets for changes in concentration over
time as continuous variables, and the same statistically significant trend to increasing calcium
concentration over time was observed in both (p<0.001; Figure 4-10, page 65, Figure 4-11, page
66 and Figure 4-12, page 66). During the same time period, the incidence of hypocalcaemia
decreased (p<0.001). Hypocalcaemia was more common than hypercalcaemia in this hospital
laboratory based cohort (Figure 4-1, page 59; Figure 4-2, page 60); however most of the
measurements of calcium were obtained from neonates (Figure 4-4, page 61) and the
preponderance of hypocalcaemia was probably due to the contribution of sick or premature
neonates and infants from the intensive care units serviced by the laboratory. We considered
whether vitamin D deficiency may have also contributed to the proportion of hypocalcaemic
infants (with a subsequent decline in prevalence of hypocalcaemia following increased vitamin D
supplementation); however our data showed that although there was a slight decline in the
25OHD concentration over time (Figure 4-17, page 72), the proportion of sufficiency (25OHD > 50
nmol/L) did not change (Figure 4-14, page 69) and in paired samples calacaemia increased over
time (Figure 4-18, page 73). In paired samples, there was no relationship between 25OHD
concentration and the concentrations of calcium, alkaline phosphatase, or PTH. Moreover, the
median 25OHD concentrations were similar whether paired with calcium concentrations >2.75
mmol/L or <2.25 mmol/L (53 and 50nmol/l respectively). These data suggest that despite the
number of 25OHD values <50 nmol/l, the contribution of Vitamin D deficiency to the prevalence
of hypocalcaemia in the laboratory-based cohort is likely to be small.
It is notable that frequency of hypercalcaemia in the laboratory based data appeared to rise after
2011 and then decline from 2013 onwards, and so we explored whether the change to the Roche
analyser at the beginning of 2011 might have contributed to these findings. Internal correlations
performed by the laboratory suggested that there was a positive bias in calcium concentrations
associated with the change in platform, more marked at higher concentrations, that was later
corrected in 2013 when the assay changed again. To investigate this, total calcium data for the

Chapter 5 – Discussion
83
Randwick and peripheral site were analysed separately, comparing the 3 approximately 2 year
blocks before and after the change in analyser and after the change in assay (Table 4-9, page
68). At both sites there was a step up in mean total calcium concentration after the change in
analyser (p<0.05) however while the subsequent change in assay resulted in a drop at Randwick,
the mean total calcium concentration after the second change in assay remained above that
observed for the 2 years prior to the initial change at both sites (p<0.05). A similar pattern was
observed in the mean ionised calcium concentrations from the independent ionised calcium
dataset analysed over the same time periods, suggesting that the progressive increase in total
calcaemia we observed over time was not attributable to the change in analyser. The
preservation of physiological relationships between analytes in the total calcium dataset and the
many patients in our small cohort who were symptomatic and/or had nephrocalcinosis also
militate against the changes observed in calcaemia being spurious. A contribution from the
change in analyser however is suggested by the analysis of paired measurements of total and
ionised calcium from the total calcium dataset, where the mean concentration of total calcium
increased following the change in analyser, but the mean for paired ionised calcium did not (Table
4-9, 68). We conclude that whilst the change in analyser may not explain all cases of
hypercalcaemia in our data, it most likely contributed to the magnitude of the change observed.
This highlights the importance of considering the role of assays in addition to the clinical picture
when assessing any child presenting with a condition such as hypercalcaemia.
The frequency of vitamin D testing increased significantly between 2005 and 2014 (p = 0.015;
Figure 4-14; page 69), consistent with the increased interest in vitamin D status reported by
others (6, 7) and following publications highlighting the importance of vitamin D supplementation
in the prevention of rickets (8, 9). In Australia, between 2000 to 2010, the cost of Medicare
subsidized tests of 25OHD concentration increased by 59% per year and sales of vitamin D
supplements tripled. Guidelines for vitamin D supplementation, including antenatally, were
published in 2006 and updated in 2013 with a reduction in the recommended vitamin D dose in
pregnant women with moderate to severe deficiency, from 3000-5000 units daily to 2000 units
daily (8, 9). Whilst it is plausible that vitamin D supplementation contributed to the reciprocal
changes observed in our data set in the rates of hypercalcaemia and hypocalcaemia over time,
including the downward trend in hypercalcaemia noted after the 2013 revised guidelines, we did
not find data to support this in our study. Direct evidence would have required a more robust

Chapter 5 – Discussion
84
relationship between 25OHD concentration and calcaemia or an increase in vitamin D sufficiency
or concentration and a decrease in ALP and PTH, none of which was found. Dudenkov et al
conducted a retrospective population based study from 2002 to 2011 (189) and found that the
incidence of vitamin D values above 50 ng/ml (125 nmol/L) and associated calcaemia increased
over time, which they attributed to increased use of vitamin D supplements. There did not appear
to be an increase in vitamin D toxicity and they did not find a relationship between the
concentrations of calcium and 25OHD. Our data set of infants less than 6 months of age was
vastly different from Dudenkov’s group which included 25OHD concentrations from people of all
ages, and the number of infants who had 25OHD analysed in our cohort was relatively low (n=
1246) compared to the number who had calcium analysed (n=6146). We have no way of knowing
how many of the infants in our cohort were exposed to vitamin D supplementation pre- or
postnatally. Similarly, we cannot determine how many of the 25OHD measurements were
obtained in the setting of acute illness or in those deemed to be at risk of vitamin D deficiency. As
was reported by Dudenkov et al, we also did not demonstrate a relationship between 25OHD and
calcium concentration. In fact, we showed that very low and high concentrations of 25OHD could
be associated with hypercalcaemia and hypocalcaemia, respectively. In addition, although most of
the mothers of the infants referred to us with hypercalcaemia were known to have had antenatal
vitamin D supplementation, 6/12 infants in whom it was measured had 25OHD concentrations
less than 50 nmol/L on presentation with hypercalcaemia (Table 4-4, page 51). As has been
demonstrated in cases of vitamin D toxicity, there is not a clear relationship between the
concentrations of 25OHD and calcium, nor is there a clear relationship between oral vitamin D
supplementation dose and 25OHD concentration achieved (38, 190, 191). The only patients in
whom we were able to demonstrate a relationship between 25OHD concentration and both
calcium concentration and PTH, were those infants who developed a rise in their PTH on
treatment with Locasol. It is thus difficult to interpret a 25OHD concentration in isolation, as it is
likely that variations in 25OHD assays, calcium intake, inter-current illness and differences in
pathways governing Vitamin D metabolism all contribute to the measured 25OHD and its clinical
implications (93, 103, 104, 174, 175, 192). This has been recognised in a recent review that
suggested further investigation of the contribution of 25OHD concentration to clinical outcomes
such as rickets should include a panel of biomarkers, such as PTH, ALP and other markers of
vitamin D including 24,25 dihydroxyvitamin D and Vitamin D binding protein, and consideration of
risk factors such as calcium intake and genetic markers, to aid interpretation (192).

Chapter 5 – Discussion
85
Our study has a number of limitations. Firstly, as is the nature of retrospective studies, in our
cohort of IIH, treatment and follow up was at the discretion of the treating physician, so follow up
biochemistry was not taken at defined time points and therefore was incomplete and not always
comparable between subjects. In addition, important biochemistry such as 1,25(OH)2D, was
missing from a number of patients at diagnosis. The measurement of 24,25 dihydroxyvitamin D
would have been helpful but at the time was only available as a research tool. We found no
mutations in the genes studied; however very large numbers would be needed to draw definitive
conclusions regarding the possible contribution of common genetic variants to infantile
hypercalcaemia. In our laboratory based data set, the data were pooled from all patients less than
6 months of age who had calcium levels measured, and many of these may have been sick
paediatric or neonatal intensive care patients whose gestation and potential comorbidities could
not be determined from the data requested or received, therefore the data were not
representative of a normal healthy infant population. As this was a retrospective study, we were
also unable to document the method of collection for calcium values. Although there was no
change in the laboratory’s recommendation for blood collection of calcium, we cannot guarantee
that all samples were collected in the same way, particularly given the difficulties in blood
collection from infants. However, manner of collection in bloods is unlikely to have changed over
time, thus in a large population unlikely to have altered the trends we were observing.
In spite of the numerous studies since Lightwood first described IIH in the 1950s, there is a lot
that still remains to be understood about the underlying pathogenesis. We did not increase the
diagnostic yield using a gene panel in our cohort; however the scope of potential genetic
variations continues to broaden, including the consideration of whether multiple variations in
genes involved in vitamin D and calcium metabolism might influence serum calcium
concentrations and/or the response to vitamin D supplementation. Although there are a number
of studies demonstrating safety and efficacy of antenatal vitamin D supplementation, the effect of
antenatal vitamin D supplementation on postnatal vitamin D metabolism beyond the first few
weeks of life also remains an area to be elucidated. In addition, we note that our patient cohort
had a high rate of co-morbidity, and determining the influence of acute illness on vitamin D and
calcium metabolism pathways requires further study.

Chapter 5 – Discussion
86
The rise in PTH seen in a number of our patients on treatment with low calcium formula, despite
maintaining high normal serum calcium, suggests that a rise in the calcium set point may be part
of the underlying pathology; however treatment of these patients with very low calcium feed
should be monitored closely to avoid damaging bone health as a result of increased PTH. Data on
changes in calcaemia subsequent to antenatal vitamin D supplementation make such
supplementation a plausible contributor to the increase in calcaemia observed in our laboratory
population data, but we did not demonstrate a change in 25OHD, ALP or PTH concentrations to
support this and vitamin D deficiency by current definitions remains prevalent. The disparity
between serum 25OHD and calcium concentration in our cohort of IIH, the laboratory population
data and the literature suggests that in addition to being a marker of vitamin D sufficiency, 25OHD
concentrations are likely to reflect adaptions in vitamin D metabolism and should be interpreted
in the light of the clinical picture and other biochemical findings.

References
87
References
1. Stapleton T, Macdonald WB, Lightwood R. The pathogenesis of idiopathic hypercalcemia
in infancy. Am J Clin Nutr. 1957;5(5):533-42.
2. Lightwood R. Idiopathic hypercalcaemia with failure to thrive:nephrocalcinosis. Proc R Soc
Med. 1952;45:401.
3. Schlingmann KP, Kaufmann M, Weber S, Irwin A, Goos C, John U, et al. Mutations in
CYP24A1 and idiopathic infantile hypercalcemia. The New England journal of medicine.
2011;365(5):410-21.
4. Koltin D, Rachmiel M, Wong BY, Cole DE, Harvey E, Sochett E. Mild infantile
hypercalcemia: diagnostic tests and outcomes. The Journal of pediatrics. 2011;159(2):215-21 e1.
5. Tate JR, Sikaris KA, Jones GR, Yen T, Koerbin G, Ryan J, et al. Harmonising adult and
paediatric reference intervals in australia and new zealand: an evidence-based approach for
establishing a first panel of chemistry analytes. Clin Biochem Rev. 2014;35(4):213-35.
6. Bilinski K, Talbot P. Vitamin d supplementation in australia: implications for the
development of supplementation guidelines. Journal of nutrition and metabolism.
2014;2014:374208.
7. Bilinski KL, Boyages SC. The rising cost of vitamin D testing in Australia: time to establish
guidelines for testing. The Medical journal of Australia. 2012;197(2):90.
8. Munns C, Zacharin MR, Rodda CP, Batch JA, Morley R, Cranswick NE, et al. Prevention and
treatment of infant and childhood vitamin D deficiency in Australia and New Zealand: a consensus
statement. The Medical journal of Australia. 2006;185(5):268-72.
9. Paxton GA, Teale GR, Nowson CA, Mason RS, McGrath JJ, Thompson MJ, et al. Vitamin D
and health in pregnancy, infants, children and adolescents in Australia and New Zealand: a
position statement. The Medical journal of Australia. 2013;198(3):142-3.
10. Thorne-Lyman A, Fawzi WW. Vitamin D during pregnancy and maternal, neonatal and
infant health outcomes: a systematic review and meta-analysis. Paediatric and perinatal
epidemiology. 2012;26 Suppl 1:75-90.
11. De-Regil LM, Palacios C, Lombardo LK, Pena-Rosas JP. Vitamin D supplementation for
women during pregnancy. Cochrane Database Syst Rev. 2016(1):CD008873.

References
88
12. Kovacs CS. Bone metabolism in the fetus and neonate. Pediatric nephrology.
2014;29(5):793-803.
13. Kovacs C KH. Maternal-Fetal Calcium and Bone Metabolism During Pregnancy,
Puerperium and Lactation. . Endocrine Reviews. 1997;18(6):832-72.
14. Salle BL, Delvin EE, Lapillonne A, Bishop NJ, Glorieux FH. Perinatal metabolism of vitamin
D. Am J Clin Nutr. 2000;71(5 Suppl):1317S-24S.
15. Allgrove J. Physiology of calcium, phosphate and magnesium. Endocr Dev. 2009;16:8-31.
16. Fujisawa Y, Yamaguchi R, Satake E, Ohtaka K, Nakanishi T, Ozono K, et al. Identification of
AP2S1 mutation and effects of low calcium formula in an infant with hypercalcemia and
hypercalciuria. The Journal of clinical endocrinology and metabolism. 2013;98(12):E2022-7.
17. Nesbit MA, Hannan FM, Howles SA, Babinsky VN, Head RA, Cranston T, et al. Mutations
affecting G-protein subunit alpha11 in hypercalcemia and hypocalcemia. The New England journal
of medicine. 2013;368(26):2476-86.
18. Hendy GN, Canaff L, Newfield RS, Tripto-Shkolnik L, Wong BY, Lee BS, et al. Codon Arg15
mutations of the AP2S1 gene: common occurrence in familial hypocalciuric hypercalcemia cases
negative for calcium-sensing receptor (CASR) mutations. The Journal of clinical endocrinology and
metabolism. 2014;99(7):E1311-5.
19. Christakos S, Ajibade DV, Dhawan P, Fechner AJ, Mady LJ. Vitamin D: metabolism.
Endocrinol Metab Clin North Am. 2010;39(2):243-53, table of contents.
20. Jassam N, Gopaul S, McShane P, McHugh A, Coleman R, Thompson D, et al. Calcium
adjustment equations in neonates and children. Annals of clinical biochemistry. 2012;49(Pt
4):352-8.
21. Goldstein Clinical Methods: The History, Physical, and Laboratory Examinations. 3rd
edition. Boston: Butterworths; 1990.
22. Rodd C, Goodyer P. Hypercalcemia of the newborn: etiology, evaluation, and
management. Pediatric nephrology. 1999;13(6):542-7.
23. Khositseth S, Charngkaew K, Boonkrai C, Somparn P, Uawithya P, Chomanee N, et al.
Hypercalcemia induces targeted autophagic degradation of aquaporin-2 at the onset of
nephrogenic diabetes insipidus. Kidney Int. 2017;91(5):1070-87.
24. Hosking DJ, Cowley A, Bucknall CA. Rehydration in the treatment of severe
hypercalcaemia. Q J Med. 1981;50(200):473-81.

References
89
25. Kasalova E, Aufartova J, Krcmova LK, Solichova D, Solich P. Recent trends in the analysis of
vitamin D and its metabolites in milk--a review. Food Chem. 2015;171:177-90.
26. Nutrition JFIoP. The Feeding Guide. Sydney, Australia: James Fairfax Institute of Paediatric
Nutrition; 2010.
27. Gidrewicz DA, Fenton TR. A systematic review and meta-analysis of the nutrient content
of preterm and term breast milk. BMC Pediatr. 2014;14:216.
28. Davies JH, Shaw NJ. Investigation and management of hypercalcaemia in children.
Archives of disease in childhood. 2012;97(6):533-8.
29. Fisher MM, Cabrera SM, Imel EA. Successful treatment of neonatal severe
hyperparathyroidism with cinacalcet in two patients. Endocrinol Diabetes Metab Case Rep.
2015;2015:150040.
30. Gannon AW, Monk HM, Levine MA. Cinacalcet monotherapy in neonatal severe
hyperparathyroidism: a case study and review. The Journal of clinical endocrinology and
metabolism. 2014;99(1):7-11.
31. Gunn IR, Gaffney D. Clinical and laboratory features of calcium-sensing receptor
disorders: a systematic review. Annals of clinical biochemistry. 2004;41(Pt 6):441-58.
32. Eftekhari F, Yousefzadeh DK. Primary infantile hyperparathyroidism: clinical, laboratory,
and radiographic features in 21 cases. Skeletal Radiol. 1982;8(3):201-8.
33. Wilhelm-Bals A, Parvex P, Magdelaine C, Girardin E. Successful use of bisphosphonate and
calcimimetic in neonatal severe primary hyperparathyroidism. Pediatrics. 2012;129(3):e812-6.
34. Reh CM, Hendy GN, Cole DE, Jeandron DD. Neonatal hyperparathyroidism with a
heterozygous calcium-sensing receptor (CASR) R185Q mutation: clinical benefit from cinacalcet.
The Journal of clinical endocrinology and metabolism. 2011;96(4):E707-12.
35. Demirel N, Aydin M, Zenciroglu A, Okumus N, Cetinkaya S, Yildiz YT, et al.
Hyperparathyroidism secondary to maternal hypoparathyroidism and vitamin D deficiency: an
uncommon cause of neonatal respiratory distress. Ann Trop Paediatr. 2009;29(2):149-54.
36. Alikasifoglu A, Gonc EN, Yalcin E, Dogru D, Yordam N. Neonatal hyperparathyroidism due
to maternal hypoparathyroidism and vitamin D deficiency: a cause of multiple bone fractures. Clin
Pediatr (Phila). 2005;44(3):267-9.
37. Ketha H, Wadams H, Lteif A, Singh RJ. Iatrogenic vitamin D toxicity in an infant--a case
report and review of literature. The Journal of steroid biochemistry and molecular biology.
2015;148:14-8.

References
90
38. Vogiatzi MG, Jacobson-Dickman E, DeBoer MD, Drugs, Therapeutics Committee of The
Pediatric Endocrine S. Vitamin D supplementation and risk of toxicity in pediatrics: a review of
current literature. The Journal of clinical endocrinology and metabolism. 2014;99(4):1132-41.
39. Anik A, Catli G, Abaci A, Dizdarer C, Bober E. Acute vitamin D intoxication possibly due to
faulty production of a multivitamin preparation. J Clin Res Pediatr Endocrinol. 2013;5(2):136-9.
40. Blank S, Scanlon KS, Sinks TH, Lett S, Falk H. An outbreak of hypervitaminosis D associated
with the overfortification of milk from a home-delivery dairy. Am J Public Health. 1995;85(5):656-
9.
41. Vanstone MB, Oberfield SE, Shader L, Ardeshirpour L, Carpenter TO. Hypercalcemia in
children receiving pharmacologic doses of vitamin D. Pediatrics. 2012;129(4):e1060-3.
42. Ozkan B, Hatun S, Bereket A. Vitamin D intoxication. Turk J Pediatr. 2012;54(2):93-8.
43. Smollin C, Srisansanee W. Vitamin D toxicity in an infant: case files of the University of
California, San Francisco medical toxicology fellowship. J Med Toxicol. 2014;10(2):190-3.
44. Hatun S, Cizmecioglu F. Use of alendronate in the treatment of vitamin D intoxication in
infants. Turk J Pediatr. 2005;47(4):373-5.
45. Donnai D, Karmiloff-Smith A. Williams syndrome: from genotype through to the cognitive
phenotype. Am J Med Genet. 2000;97(2):164-71.
46. Lashkari A, Smith AK, Graham JM, Jr. Williams-Beuren syndrome: an update and review
for the primary physician. Clin Pediatr (Phila). 1999;38(4):189-208.
47. Taylor AB, Stern PH, Bell NH. Abnormal regulation of circulating 25-hydroxyvitamin D in
the Williams syndrome. The New England journal of medicine. 1982;306(16):972-5.
48. Kruse K, Pankau R, Gosch A, Wohlfahrt K. Calcium metabolism in Williams-Beuren
syndrome. The Journal of pediatrics. 1992;121(6):902-7.
49. Culler FL, Jones KL, Deftos LJ. Imparied calcitonin secretion in patients with Williams
syndrome. The Journal of pediatrics. 1985;107(5):720-3.
50. Cagle AP, Waguespack SG, Buckingham BA, Shankar RR, Dimeglio LA. Severe infantile
hypercalcemia associated with Williams syndrome successfully treated with intravenously
administered pamidronate. Pediatrics. 2004;114(4):1091-5.
51. Ismail J. Pamidronate for long-term control of hypercalcemia associated with Williams
syndrome. Indian Pediatr. 2015;52(2):163-4.

References
91
52. B O, Sr M, C M, Jc G, Argerich LP. Long-term control of hypercalcaemia in an infant with
Williams-Beuren syndrome after a single infusion of biphosphonate (Pamidronate). Acta
Paediatrica. 2004;93(7):1002-3.
53. Burden AD, Krafchik BR. Subcutaneous fat necrosis of the newborn: a review of 11 cases.
Pediatr Dermatol. 1999;16(5):384-7.
54. Strohm B, Hobson A, Brocklehurst P, Edwards AD, Azzopardi D, Register UTC.
Subcutaneous fat necrosis after moderate therapeutic hypothermia in neonates. Pediatrics.
2011;128(2):e450-2.
55. Tuddenham E, Kumar A, Tarn A. Subcutaneous fat necrosis causing neonatal
hypercalcaemia. BMJ Case Rep. 2015;2015.
56. Mahe E, Girszyn N, Hadj-Rabia S, Bodemer C, Hamel-Teillac D, De Prost Y. Subcutaneous
fat necrosis of the newborn: a systematic evaluation of risk factors, clinical manifestations,
complications and outcome of 16 children. Br J Dermatol. 2007;156(4):709-15.
57. Kruse K, Irle U, Uhlig R. Elevated 1,25-dihydroxyvitamin D serum concentrations in infants
with subcutaneous fat necrosis. The Journal of pediatrics. 1993;122(3):460-3.
58. Cook JS, Stone MS, Hansen JR. Hypercalcemia in association with subcutaneous fat
necrosis of the newborn: studies of calcium-regulating hormones. Pediatrics. 1992;90(1 Pt 1):93-
6.
59. Akin MA, Akin L, Sarici D, Yilmaz I, Balkanli S, Kurtoglu S. Follow-up during early infancy of
newborns diagnosed with subcutaneous fat necrosis. J Clin Res Pediatr Endocrinol. 2011;3(4):216-
8.
60. Alos N, Eugene D, Fillion M, Powell J, Kokta V, Chabot G. Pamidronate: Treatment for
severe hypercalcemia in neonatal subcutaneous fat necrosis. Horm Res. 2006;65(6):289-94.
61. Lyon AJ, McIntosh N, Wheeler K, Brooke OG. Hypercalcaemia in extremely low
birthweight infants. Archives of disease in childhood. 1984;59(12):1141-4.
62. Miller RR, Menke JA, Mentser MI. Hypercalcemia associated with phosphate depletion in
the neonate. The Journal of pediatrics. 1984;105(5):814-7.
63. Sagy M, Birenbaum E, Balin A, Orda S, Barzilay Z, Brish M. Phosphate-depletion syndrome
in a premature infant fed human milk. The Journal of pediatrics. 1980;96(4):683-5.
64. Juppner H. Jansen's metaphyseal chondrodysplasia: a disorder due to a PTH/PTHrP
receptor gene mutation. Trends Endocrinol Metab. 1996;7(5):157-62.

References
92
65. Schipani E, Langman CB, Parfitt AM, Jensen GS, Kikuchi S, Kooh SW, et al. Constitutively
activated receptors for parathyroid hormone and parathyroid hormone-related peptide in
Jansen's metaphyseal chondrodysplasia. The New England journal of medicine. 1996;335(10):708-
14.
66. Kozlowski K, Campbell JB, Azouz ME, Sprague P. Metaphyseal chondrodysplasia, type
Jansen. Australas Radiol. 1999;43(4):544-7.
67. Kruse K, Schutz C. Calcium metabolism in the Jansen type of metaphyseal dysplasia.
European journal of pediatrics. 1993;152(11):912-5.
68. Bianchi ML. Hypophosphatasia: an overview of the disease and its treatment.
Osteoporosis international : a journal established as result of cooperation between the European
Foundation for Osteoporosis and the National Osteoporosis Foundation of the USA.
2015;26(12):2743-57.
69. Demirbilek H, Alanay Y, Alikasifoglu A, Topcu M, Mornet E, Gonc N, et al.
Hypophosphatasia presenting with pyridoxine-responsive seizures, hypercalcemia, and
pseudotumor cerebri: case report. J Clin Res Pediatr Endocrinol. 2012;4(1):34-8.
70. Barcia JP, Strife CF, Langman CB. Infantile hypophosphatasia: treatment options to control
hypercalcemia, hypercalciuria, and chronic bone demineralization. The Journal of pediatrics.
1997;130(5):825-8.
71. Drummond KN, Michael AF, Ulstrom RA, Good RA. The Blue Diaper Syndrome: Familial
Hypercalcemia with Nephrocalcinosis and Indicanuria; a New Familial Disease, with Definition of
the Metabolic Abnormality. Am J Med. 1964;37:928-48.
72. Fazeli W, Kaczmarek S, Kirschstein M, Santer R. A novel mutation within the lactase gene
(LCT): the first report of congenital lactase deficiency diagnosed in Central Europe. BMC
Gastroenterol. 2015;15:90.
73. Saarela T, Simila S, Koivisto M. Hypercalcemia and nephrocalcinosis in patients with
congenital lactase deficiency. The Journal of pediatrics. 1995;127(6):920-3.
74. Manickavasagar B, McArdle AJ, Yadav P, Shaw V, Dixon M, Blomhoff R, et al.
Hypervitaminosis A is prevalent in children with CKD and contributes to hypercalcemia. Pediatric
nephrology. 2015;30(2):317-25.
75. Adashek J, Mu W, Francis J, Cohen B, Pruette C, Grossberg A, et al. Incontinentia Pigmenti
with Persistent Hypercalcemia: Case Report. Pediatr Dermatol. 2016;33(5):e315-7.
References
93
76. Jacobs TP, Bilezikian JP. Clinical review: Rare causes of hypercalcemia. The Journal of
clinical endocrinology and metabolism. 2005;90(11):6316-22.
77. Tau C, Garabedian M, Farriaux JP, Czernichow P, Pomarede R, Balsan S. Hypercalcemia in
infants with congenital hypothyroidism and its relation to vitamin D and thyroid hormones. The
Journal of pediatrics. 1986;109(5):808-14.
78. Carey DE, Jones KL. Hypothyroidism and hypercalcemia. The Journal of pediatrics.
1987;111(1):155-6.
79. Schoelwer MJ, Viswanathan V, Wilson A, Nailescu C, Imel EA. Infants With Congenital
Adrenal Hyperplasia Are at Risk for Hypercalcemia, Hypercalciuria, and Nephrocalcinosis. J Endocr
Soc. 2017;1(9):1160-7.
80. Ramage IJ, Durkan A, Walker K, Beattie TJ. Hypercalcaemia in association with trisomy 21
(Down's syndrome). J Clin Pathol. 2002;55(7):543-4.
81. Pela I, Seracini D, Lavoratti G, Materassi M. Hypercalcemia and distal renal tubular
acidosis: an association not only in the newborn. Pediatric nephrology. 2003;18(8):850.
82. Igarashi T, Sekine Y, Kawato H, Kamoshita S, Saigusa Y. Transient neonatal distal renal
tubular acidosis with secondary hyperparathyroidism. Pediatric nephrology. 1992;6(3):267-9.
83. Lightwood R ST. Idiopathic hypercalcaemia in infants. Lancet. 1953(265):255-6.
84. N D T MARTIN GJAIS, AND R D COHEN. Idiopathic infantile hypercalcaemia: a continuing
enigma. Archives of disease in childhood. 1984(59):605-13.
85. Dauber A NT, Sochett E, Cole D, Horst R, Abrams S, Carpenter T, Hirschhorn J. Genetic
Defect in CYP24A1, the Vitamin D 24-Hydroxylase Gene, in a Patient with Severe Infantile
Hypercalcemia. Journal of Clinical Endocrinology and Metabolism. 2012;97(2):268-74.
86. Pronicka E, Ciara E, Halat P, Janiec A, Wojcik M, Rowinska E, et al. Biallelic mutations in
CYP24A1 or SLC34A1 as a cause of infantile idiopathic hypercalcemia (IIH) with vitamin D
hypersensitivity: molecular study of 11 historical IIH cases. J Appl Genet. 2017;58(3):349-53.
87. Marks BE, Doyle DA. Idiopathic infantile hypercalcemia: case report and review of the
literature. J Pediatr Endocrinol Metab. 2016;29(2):127-32.
88. Fencl F, Blahova K, Schlingmann KP, Konrad M, Seeman T. Severe hypercalcemic crisis in
an infant with idiopathic infantile hypercalcemia caused by mutation in CYP24A1 gene. European
journal of pediatrics. 2013;172(1):45-9.
References
94
89. Molin A, Baudoin R, Kaufmann M, Souberbielle JC, Ryckewaert A, Vantyghem MC, et al.
CYP24A1 Mutations in a Cohort of Hypercalcemic Patients: Evidence for a Recessive Trait. The
Journal of clinical endocrinology and metabolism. 2015;100(10):E1343-52.
90. Castanet M, Mallet E, Kottler ML. Lightwood syndrome revisited with a novel mutation in
CYP24 and vitamin D supplement recommendations. The Journal of pediatrics. 2013;163(4):1208-
10.
91. Nesterova G, Malicdan MC, Yasuda K, Sakaki T, Vilboux T, Ciccone C, et al. 1,25-(OH)2D-24
Hydroxylase (CYP24A1) Deficiency as a Cause of Nephrolithiasis. Clinical journal of the American
Society of Nephrology : CJASN. 2013;8(4):649-57.
92. Kaufmann M, Gallagher JC, Peacock M, Schlingmann KP, Konrad M, DeLuca HF, et al.
Clinical utility of simultaneous quantitation of 25-hydroxyvitamin D and 24,25-dihydroxyvitamin D
by LC-MS/MS involving derivatization with DMEQ-TAD. The Journal of clinical endocrinology and
metabolism. 2014;99(7):2567-74.
93. Dirks NF, Ackermans MT, Lips P, de Jongh RT, Vervloet MG, de Jonge R, et al. The When,
What & How of Measuring Vitamin D Metabolism in Clinical Medicine. Nutrients. 2018;10(4).
94. Nguyen M, Boutignon H, Mallet E, Linglart A, Guillozo H, Jehan F, et al. Infantile
hypercalcemia and hypercalciuria: new insights into a vitamin D-dependent mechanism and
response to ketoconazole treatment. The Journal of pediatrics. 2010;157(2):296-302.
95. Dinaur D BP, Ganon L, Tordjman K, Eisenstein Z, Holtzman E. Loss of Function Mutations
of CYP24A1, the Vitamin D 24 Hydroxylase Gene, Cause Long-standing Hypercalciuric
Nephrolithiasis and Nephrocalcinosis. The Journal of urology. 2013(190):552-7.
96. Wolf P, Muller-Sacherer T, Baumgartner-Parzer S, Winhofer Y, Kroo J, Gessl A, et al. A
Case of "Late-Onset" Idiopathic Infantile Hypercalcemia Secondary to Mutations in the CYP24A1
Gene. Endocr Pract. 2014;20(5):e91-5.
97. Martin ND, Snodgrass GJ, Cohen RD. Idiopathic infantile hypercalcaemia--a continuing
enigma. Archives of disease in childhood. 1984;59(7):605-13.
98. Mugg A, Legeza B, Tee MK, Damm I, Long RK, Miller WL. Quantitation of CYP24A1
enzymatic activity with a simple two-hybrid system. The Journal of clinical endocrinology and
metabolism. 2015;100(2):684-8.
99. Huang J, Coman D, McTaggart SJ, Burke JR. Long-term follow-up of patients with
idiopathic infantile hypercalcaemia. Pediatric nephrology. 2006;21(11):1676-80.

References
95
100. Pronicka E, Rowinska E, Kulczycka H, Lukaszkiewicz J, Lorenc R, Janas R. Persistent
hypercalciuria and elevated 25-hydroxyvitamin D3 in children with infantile hypercalcaemia.
Pediatric nephrology. 1997;11(1):2-6.
101. Carpenter TO. CYP24A1 loss of function: Clinical phenotype of monoallelic and biallelic
mutations. The Journal of steroid biochemistry and molecular biology. 2017;173:337-40.
102. Snellman G, Melhus H, Gedeborg R, Olofsson S, Wolk A, Pedersen NL, et al. Seasonal
genetic influence on serum 25-hydroxyvitamin D levels: a twin study. PLoS One.
2009;4(11):e7747.
103. Barry EL, Rees JR, Peacock JL, Mott LA, Amos CI, Bostick RM, et al. Genetic variants in
CYP2R1, CYP24A1, and VDR modify the efficacy of vitamin D3 supplementation for increasing
serum 25-hydroxyvitamin D levels in a randomized controlled trial. The Journal of clinical
endocrinology and metabolism. 2014;99(10):E2133-7.
104. Sollid ST, Hutchinson MY, Fuskevag OM, Joakimsen RM, Jorde R. Large Individual
Differences in Serum 25-Hydroxyvitamin D Response to Vitamin D Supplementation: Effects of
Genetic Factors, Body Mass Index, and Baseline Concentration. Results from a Randomized
Controlled Trial. Horm Metab Res. 2016;48(1):27-34.
105. Mayr B, Schnabel D, Dorr HG, Schofl C. GENETICS IN ENDOCRINOLOGY: Gain and loss of
function mutations of the calcium-sensing receptor and associated proteins: current treatment
concepts. Eur J Endocrinol. 2016;174(5):R189-208.
106. Lietman SA, Tenenbaum-Rakover Y, Jap TS, Yi-Chi W, De-Ming Y, Ding C, et al. A novel
loss-of-function mutation, Gln459Arg, of the calcium-sensing receptor gene associated with
apparent autosomal recessive inheritance of familial hypocalciuric hypercalcemia. The Journal of
clinical endocrinology and metabolism. 2009;94(11):4372-9.
107. Varghese J, Rich T, Jimenez C. Benign familial hypocalciuric hypercalcemia. Endocr Pract.
2011;17 Suppl 1:13-7.
108. Nakamura A, Hotsubo T, Kobayashi K, Mochizuki H, Ishizu K, Tajima T. Loss-of-function
and gain-of-function mutations of calcium-sensing receptor: functional analysis and the effect of
allosteric modulators NPS R-568 and NPS 2143. The Journal of clinical endocrinology and
metabolism. 2013;98(10):E1692-701.
109. Hannan FM, Babinsky VN, Thakker RV. Disorders of the calcium-sensing receptor and
partner proteins: insights into the molecular basis of calcium homeostasis. J Mol Endocrinol.
2016;57(3):R127-42.

References
96
110. Fadil M Hannan VNBaRVT. <Disorders of the calcium sensing receptor and partner
proteins.pdf>. 2016.
111. Christensen SE, Nissen PH, Vestergaard P, Mosekilde L. Familial hypocalciuric
hypercalcaemia: a review. Curr Opin Endocrinol Diabetes Obes. 2011;18(6):359-70.
112. Christensen SE, Nissen PH, Vestergaard P, Heickendorff L, Brixen K, Mosekilde L.
Discriminative power of three indices of renal calcium excretion for the distinction between
familial hypocalciuric hypercalcaemia and primary hyperparathyroidism: a follow-up study on
methods. Clinical endocrinology. 2008;69(5):713-20.
113. Pasieka JL, Andersen MA, Hanley DA. Familial benign hypercalcaemia: hypercalciuria and
hypocalciuria in affected members of a small kindred. Clinical endocrinology. 1990;33(4):429-33.
114. Zajickova K, Vrbikova J, Canaff L, Pawelek PD, Goltzman D, Hendy GN. Identification and
functional characterization of a novel mutation in the calcium-sensing receptor gene in familial
hypocalciuric hypercalcemia: modulation of clinical severity by vitamin D status. The Journal of
clinical endocrinology and metabolism. 2007;92(7):2616-23.
115. Scillitani A, Guarnieri V, De Geronimo S, Muscarella LA, Battista C, D'Agruma L, et al. Blood
ionized calcium is associated with clustered polymorphisms in the carboxyl-terminal tail of the
calcium-sensing receptor. The Journal of clinical endocrinology and metabolism.
2004;89(11):5634-8.
116. O'Seaghdha CM, Wu H, Yang Q, Kapur K, Guessous I, Zuber AM, et al. Meta-analysis of
genome-wide association studies identifies six new Loci for serum calcium concentrations. PLoS
genetics. 2013;9(9):e1003796.
117. O'Seaghdha CM, Yang Q, Glazer NL, Leak TS, Dehghan A, Smith AV, et al. Common
variants in the calcium-sensing receptor gene are associated with total serum calcium levels. Hum
Mol Genet. 2010;19(21):4296-303.
118. He Y, Han L, Li W, Shu X, Zhao C, He Y, et al. Effects of the calcium-sensing receptor A986S
polymorphism on serum calcium and parathyroid hormone levels in healthy individuals: a meta-
analysis. Gene. 2012;491(2):110-5.
119. Cole DE, Vieth R, Trang HM, Wong BY, Hendy GN, Rubin LA. Association between total
serum calcium and the A986S polymorphism of the calcium-sensing receptor gene. Mol Genet
Metab. 2001;72(2):168-74.
120. Scillitani. <Blood ionised calcium is associated with clustered polymorphisms of
CASR.pdf>. 2004.
References
97
121. Vezzoli G, Terranegra A, Arcidiacono T, Biasion R, Coviello D, Syren ML, et al. R990G
polymorphism of calcium-sensing receptor does produce a gain-of-function and predispose to
primary hypercalciuria. Kidney Int. 2007;71(11):1155-62.
122. Chang X, Li J, Guo Y, Wei Z, Mentch FD, Hou C, et al. Genome-wide association study of
serum minerals levels in children of different ethnic background. PLoS One. 2015;10(4):e0123499.
123. Holick MF. Resurrection of vitamin D deficiency and rickets. J Clin Invest.
2006;116(8):2062-72.
124. Rajakumar K, Reis EC, Holick MF. Dosing error with over-the-counter vitamin D
supplement: a risk for vitamin D toxicity in infants. Clin Pediatr (Phila). 2013;52(1):82-5.
125. Munns CF, Shaw N, Kiely M, Specker BL, Thacher TD, Ozono K, et al. Global Consensus
Recommendations on Prevention and Management of Nutritional Rickets. The Journal of clinical
endocrinology and metabolism. 2016;101(2):394-415.
126. Wharton B, Bishop N. Rickets. The Lancet. 2003;362(9393):1389-400.
127. Creo AL, Thacher TD, Pettifor JM, Strand MA, Fischer PR. Nutritional rickets around the
world: an update. Paediatr Int Child Health. 2017;37(2):84-98.
128. Elder CJ, Bishop NJ. Rickets. The Lancet. 2014;383(9929):1665-76.
129. Saggese G, Vierucci F, Boot AM, Czech-Kowalska J, Weber G, Camargo CA, Jr., et al.
Vitamin D in childhood and adolescence: an expert position statement. European journal of
pediatrics. 2015;174(5):565-76.
130. Hossein-nezhad A, Holick MF. Vitamin D for health: a global perspective. Mayo Clin Proc.
2013;88(7):720-55.
131. Nowson CA, Margerison C. Vitamin D intake and vitamin D status of Australians. The
Medical journal of Australia. 2002;177(3):149-52.
132. Hsu SA, Soldo J, Gupta M. Evaluation of two automated immunoassays for 25-OH vitamin
D: comparison against LC-MS/MS. The Journal of steroid biochemistry and molecular biology.
2013;136:139-45.
133. Farrell CJ, Martin S, McWhinney B, Straub I, Williams P, Herrmann M. State-of-the-art
vitamin D assays: a comparison of automated immunoassays with liquid chromatography-tandem
mass spectrometry methods. Clin Chem. 2012;58(3):531-42.
134. Lucas R, Neale R. What is the optimal level of vitamin D? - separating the evidence from
the rhetoric. Aust Fam Physician. 2014;43(3):119-22.

References
98
135. Atapattu N, Shaw N, Hogler W. Relationship between serum 25-hydroxyvitamin D and
parathyroid hormone in the search for a biochemical definition of vitamin D deficiency in children.
Pediatric research. 2013;74(5):552-6.
136. Couchman L, Moniz CF. Analytical considerations for the biochemical assessment of
vitamin D status. Ther Adv Musculoskelet Dis. 2017;9(4):97-104.
137. Higgins V, Truong D, White-Al Habeeb NMA, Fung AWS, Hoffman B, Adeli K. Pediatric
reference intervals for 1,25-dihydroxyvitamin D using the DiaSorin LIAISON XL assay in the healthy
CALIPER cohort. Clin Chem Lab Med. 2018;56(6):964-72.
138. Jones G. Extrarenal vitamin D activation and interactions between vitamin D(2), vitamin
D(3), and vitamin D analogs. Annu Rev Nutr. 2013;33:23-44.
139. Wagner CL, Greer FR, American Academy of Pediatrics Section on B, American Academy
of Pediatrics Committee on N. Prevention of rickets and vitamin D deficiency in infants, children,
and adolescents. Pediatrics. 2008;122(5):1142-52.
140. Homer CS, Oats J, Middleton P, Ramson J, Diplock S. Updated clinical practice guidelines
on pregnancy care. The Medical journal of Australia. 2018;209(9):409-12.
141. Holmlund-Suila E, Viljakainen H, Hytinantti T, Lamberg-Allardt C, Andersson S, Makitie O.
High-dose vitamin d intervention in infants--effects on vitamin d status, calcium homeostasis, and
bone strength. The Journal of clinical endocrinology and metabolism. 2012;97(11):4139-47.
142. Zeghoud F, Ben-Mekhbi H, Djeghri N, Garabedian M. Vitamin D prophylaxis during
infancy: comparison of the long-term effects of three intermittent doses (15, 5, or 2.5 mg) on 25-
hydroxyvitamin D concentrations. Am J Clin Nutr. 1994;60(3):393-6.
143. Huynh J, Lu T, Liew D, Doery JC, Tudball R, Jona M, et al. Vitamin D in newborns. A
randomised controlled trial comparing daily and single oral bolus vitamin D in infants. J Paediatr
Child Health. 2017;53(2):163-9.
144. Gallo S, Comeau K, Vanstone C, Agellon S, Sharma A, Jones G, et al. Effect of different
dosages of oral vitamin D supplementation on vitamin D status in healthy, breastfed infants: a
randomized trial. JAMA. 2013;309(17):1785-92.
145. Thomas SD, Fudge AN, Whiting M, Coates PS. The correlation between third-trimester
maternal and newborn-serum 25-hydroxy-vitamin D in a selected South Australian group of
newborn samples. BMJ open. 2011;1(2):e000236.
146. El Koumi MA, Ali YF, Abd El Rahman RN. Impact of maternal vitamin D status during
pregnancy on neonatal vitamin D status. Turk J Pediatr. 2013;55(4):371-7.

References
99
147. Vieth Streym S, Kristine Moller U, Rejnmark L, Heickendorff L, Mosekilde L, Vestergaard P.
Maternal and infant vitamin D status during the first 9 months of infant life-a cohort study. Eur J
Clin Nutr. 2013;67(10):1022-8.
148. Roth DE, Gernand AD, Al Mahmud A. Vitamin D Supplementation in Pregnancy and
Lactation and Infant Growth. The New England journal of medicine. 2018;379(19):1881.
149. Wagner CL, McNeil RB, Johnson DD, Hulsey TC, Ebeling M, Robinson C, et al. Health
characteristics and outcomes of two randomized vitamin D supplementation trials during
pregnancy: a combined analysis. The Journal of steroid biochemistry and molecular biology.
2013;136:313-20.
150. Delvin EE, Salle BL, Glorieux FH, Adeleine P, David LS. Vitamin D supplementation during
pregnancy: effect on neonatal calcium homeostasis. The Journal of pediatrics. 1986;109(2):328-
34.
151. Harrington J, Perumal N, Al Mahmud A, Baqui A, Roth DE. Vitamin D and fetal-neonatal
calcium homeostasis: findings from a randomized controlled trial of high-dose antenatal vitamin D
supplementation. Pediatric research. 2014;76(3):302-9.
152. Greer FR, Hollis BW, Cripps DJ, Tsang RC. Effects of maternal ultraviolet B irradiation on
vitamin D content of human milk. The Journal of pediatrics. 1984;105(3):431-3.
153. Dawodu A, Tsang RC. Maternal vitamin D status: effect on milk vitamin D content and
vitamin D status of breastfeeding infants. Advances in nutrition. 2012;3(3):353-61.
154. Bae YJ, Kratzsch J. Vitamin D and calcium in the human breast milk. Best Pract Res Clin
Endocrinol Metab. 2018;32(1):39-45.
155. Rothberg AD, Pettifor JM, Cohen DF, Sonnendecker EW, Ross FP. Maternal-infant vitamin
D relationships during breast-feeding. The Journal of pediatrics. 1982;101(4):500-3.
156. Hollis BW, Wagner CL, Howard CR, Ebeling M, Shary JR, Smith PG, et al. Maternal Versus
Infant Vitamin D Supplementation During Lactation: A Randomized Controlled Trial. Pediatrics.
2015;136(4):625-34.
157. Kent JC, Arthur PG, Mitoulas LR, Hartmann PE. Why calcium in breastmilk is independent
of maternal dietary calcium and vitamin D. Breastfeed Rev. 2009;17(2):5-11.
158. Prentice A, Yan L, Jarjou LM, Dibba B, Laskey MA, Stirling DM, et al. Vitamin D status does
not influence the breast-milk calcium concentration of lactating mothers accustomed to a low
calcium intake. Acta Paediatr. 1997;86(9):1006-8.

References
100
159. Matos V, van Melle G, Boulat O, Markert M, Bachmann C, Guignard JP. Urinary
phosphate/creatinine, calcium/creatinine, and magnesium/creatinine ratios in a healthy pediatric
population. The Journal of pediatrics. 1997;131(2):252-7.
160. Metz MP. Determining urinary calcium/creatinine cut-offs for the paediatric population
using published data. Annals of clinical biochemistry. 2006;43(Pt 5):398-401.
161. Sargent JD, Stukel TA, Kresel J, Klein RZ. Normal values for random urinary calcium to
creatinine ratios in infancy. The Journal of pediatrics. 1993;123(3):393-7.
162. Wang K, Li M, Hakonarson H. ANNOVAR: functional annotation of genetic variants from
high-throughput sequencing data. Nucleic Acids Res. 2010;38(16):e164.
163. Binkley N, Krueger D, Cowgill CS, Plum L, Lake E, Hansen KE, et al. Assay variation
confounds the diagnosis of hypovitaminosis D: a call for standardization. The Journal of clinical
endocrinology and metabolism. 2004;89(7):3152-7.
164. Carter GD, Carter R, Jones J, Berry J. How accurate are assays for 25-hydroxyvitamin D?
Data from the international vitamin D external quality assessment scheme. Clin Chem.
2004;50(11):2195-7.
165. Leventis P, Garrison L, Sibley M, Peterson P, Egerton M, Levin G, et al. Underestimation of
serum 25-hydroxyvitamin D by the Nichols Advantage Assay in patients receiving vitamin D
replacement therapy. Clin Chem. 2005;51(6):1072-4; author reply 4.
166. Terry AH, Sandrock T, Meikle AW. Measurement of 25-hydroxyvitamin D by the Nichols
ADVANTAGE, DiaSorin LIAISON, DiaSorin RIA, and liquid chromatography-tandem mass
spectrometry. Clin Chem. 2005;51(8):1565-6.
167. Bourguignon C, Dupuy AM, Coste T, Michel F, Cristol JP. Evaluation of NM-BAPTA method
for plasma total calcium measurement on Cobas 8000(R). Clin Biochem. 2014;47(7-8):636-9.
168. Matos V, Melle GV, Markert M, Guignard JP. [Urinary excretion of calcium, magnesium,
phosphates, oxalates and urates in normal children en Switzerland]. Rev Med Suisse Romande.
1996;116(10):839-43.
169. Liu K, Wang X, Ye J, Qin C, Shao P, Zhang W, et al. The G allele of CaSR R990G
polymorphism increases susceptibility to urolithiasis and hypercalciuria: evidences from a
comprehensive meta-analysis. Biomed Res Int. 2015;2015:958207.
170. Tebben PJ, Singh RJ, Kumar R. Vitamin D-Mediated Hypercalcemia: Mechanisms,
Diagnosis, and Treatment. Endocr Rev. 2016;37(5):521-47.
References
101
171. Roth DE, Morris SK, Zlotkin S, Gernand AD, Ahmed T, Shanta SS, et al. Vitamin D
Supplementation in Pregnancy and Lactation and Infant Growth. The New England journal of
medicine. 2018;379(6):535-46.
172. Brooke OG, Brown IR, Bone CD, Carter ND, Cleeve HJ, Maxwell JD, et al. Vitamin D
supplements in pregnant Asian women: effects on calcium status and fetal growth. Br Med J.
1980;280(6216):751-4.
173. Bi WG, Nuyt AM, Weiler H, Leduc L, Santamaria C, Wei SQ. Association Between Vitamin D
Supplementation During Pregnancy and Offspring Growth, Morbidity, and Mortality: A Systematic
Review and Meta-analysis. JAMA Pediatr. 2018;172(7):635-45.
174. McNally JD, Nama N, O'Hearn K, Sampson M, Amrein K, Iliriani K, et al. Vitamin D
deficiency in critically ill children: a systematic review and meta-analysis. Crit Care.
2017;21(1):287.
175. Silva MC, Furlanetto TW. Does serum 25-hydroxyvitamin D decrease during acute-phase
response? A systematic review. Nutr Res. 2015;35(2):91-6.
176. Amrein K, Papinutti A, Mathew E, Vila G, Parekh D. Vitamin D and critical illness: what
endocrinology can learn from intensive care and vice versa. Endocr Connect. 2018;7(12):R304-
R15.
177. Mangin M, Sinha R, Fincher K. Inflammation and vitamin D: the infection connection.
Inflamm Res. 2014;63(10):803-19.
178. Ji J, Lu R, Zhou X, Xue Y, Shi C, Goltzman D, et al. 1,25-Dihydroxyvitamin D(3) contributes
to regulating mammary calcium transport and modulates neonatal skeletal growth and turnover
cooperatively with calcium. Am J Physiol Endocrinol Metab. 2011;301(5):E889-900.
179. Jarjou LM, Prentice A, Sawo Y, Laskey MA, Bennett J, Goldberg GR, et al. Randomized,
placebo-controlled, calcium supplementation study in pregnant Gambian women: effects on
breast-milk calcium concentrations and infant birth weight, growth, and bone mineral accretion in
the first year of life. Am J Clin Nutr. 2006;83(3):657-66.
180. Prentice A, Dibba B, Jarjou LM, Laskey MA, Paul AA. In breast milk calcium concentration
influenced by calcium intake during pregnancy. Lancet. 1994;344(8919):411-2.
181. Beggs MR, Alexander RT. Intestinal absorption and renal reabsorption of calcium
throughout postnatal development. Exp Biol Med (Maywood). 2017;242(8):840-9.
182. Stratta P, Merlotti G, Musetti C, Quaglia M, Pagani A, Izzo C, et al. Calcium-sensing-related
gene mutations in hypercalcaemic hypocalciuric patients as differential diagnosis from primary

References
102
hyperparathyroidism: detection of two novel inactivating mutations in an Italian population.
Nephrol Dial Transplant. 2014;29(10):1902-9.
183. Schlingmann KP, Ruminska J, Kaufmann M, Dursun I, Patti M, Kranz B, et al. Autosomal-
Recessive Mutations in SLC34A1 Encoding Sodium-Phosphate Cotransporter 2A Cause Idiopathic
Infantile Hypercalcemia. J Am Soc Nephrol. 2016;27(2):604-14.
184. Ichikawa S, Imel EA, Kreiter ML, Yu X, Mackenzie DS, Sorenson AH, et al. A homozygous
missense mutation in human KLOTHO causes severe tumoral calcinosis. J Musculoskelet Neuronal
Interact. 2007;7(4):318-9.
185. Murali SK, Roschger P, Zeitz U, Klaushofer K, Andrukhova O, Erben RG. FGF23 Regulates
Bone Mineralization in a 1,25(OH)2 D3 and Klotho-Independent Manner. J Bone Miner Res.
2016;31(1):129-42.
186. Richards S, Aziz N, Bale S, Bick D, Das S, Gastier-Foster J, et al. Standards and guidelines
for the interpretation of sequence variants: a joint consensus recommendation of the American
College of Medical Genetics and Genomics and the Association for Molecular Pathology. Genet
Med. 2015;17(5):405-24.
187. Rothe HM, Shapiro WB, Sun WY, Chou SY. Calcium-sensing receptor gene polymorphism
Arg990Gly and its possible effect on response to cinacalcet HCl. Pharmacogenet Genomics.
2005;15(1):29-34.
188. Majid H, Khan AH, Moatter T. R990G polymorphism of calcium sensing receptor gene is
associated with high parathyroid hormone levels in subjects with vitamin D deficiency: a cross-
sectional study. Biomed Res Int. 2015;2015:407159.
189. Dudenkov DV, Yawn BP, Oberhelman SS, Fischer PR, Singh RJ, Cha SS, et al. Changing
Incidence of Serum 25-Hydroxyvitamin D Values Above 50 ng/mL: A 10-Year Population-Based
Study. Mayo Clin Proc. 2015;90(5):577-86.
190. Zittermann A, Ernst JB, Gummert JF, Borgermann J. Vitamin D supplementation, body
weight and human serum 25-hydroxyvitamin D response: a systematic review. Eur J Nutr.
2014;53(2):367-74.
191. Lopez-Molina M, Santillan C, Murillo M, Valls A, Bosch L, Bel J, et al. Measured free 25-
hydroxyvitamin D in healthy children and relationship to total 25-hydroxyvitamin D, calculated
free 25-hydroxyvitamin D and vitamin D binding protein. Clin Biochem. 2018;61:23-7.

References
103
192. Sempos CT, Heijboer AC, Bikle DD, Bollerslev J, Bouillon R, Brannon PM, et al. Vitamin D
assays and the definition of hypovitaminosis D: results from the First International Conference on
Controversies in Vitamin D. Br J Clin Pharmacol. 2018;84(10):2194-207.