An Investigation into Parents' Awareness of Effects of ...
138
An Investigation into Parents' Awareness of Effects of Commercial Fruit Beverages on Their Children's Teeth Prathibha Sural A thesis submitted to Auckland University of Technology in partial fulfilment of the requirements for the degree of Master of Public Health Department of Public Health Auckland University of Technology 2016
-
Upload
khangminh22 -
Category
Documents
-
view
2 -
download
0
Transcript of An Investigation into Parents' Awareness of Effects of ...
An Investigation into Parents' Awareness of Effects of
Commercial Fruit Beverages on Their Children's
Teeth
Prathibha Sural
A thesis submitted to Auckland University of Technology in partial fulfilment of
the requirements for the degree of Master of Public Health
Department of Public Health
Auckland University of Technology
2016
Table of Contents
Attestation of Authorship .................................................................................................. x
Acknowledgements .......................................................................................................... xi
Ethics Approval ............................................................................................................... xii
Abstract ............................................................................................................................. 1
Chapter 1: Introduction ..................................................................................................... 3
Introduction ................................................................................................................... 3
Research questions ........................................................................................................ 4
Research process ........................................................................................................... 5
Key assumptions ........................................................................................................... 5
Researcher Positioning .................................................................................................. 6
Thesis organisation........................................................................................................ 6
Chapter 2: Background of Dental Caries and Erosion ...................................................... 8
Introduction ................................................................................................................... 8
Dental caries .................................................................................................................. 8
Sugars and tooth decay.................................................................................................. 9
Quantity versus frequency of acid attack: Stephan curve ........................................... 10
Early childhood caries ................................................................................................. 11
Natural sugar alternatives ............................................................................................ 12
Epidemiology of ECC ................................................................................................. 13
Dental erosion ............................................................................................................. 14
Epidemiology of dental erosion .................................................................................. 15
ii
Prevalence in New Zealand ......................................................................................... 16
Childhood dental problems: A cycle of events ........................................................... 17
Preventive measures .................................................................................................... 19
Plaque control.......................................................................................................... 19
Diet control.............................................................................................................. 20
Community water fluoridation ................................................................................ 20
Utilisation of oral health services ............................................................................ 21
Summary ..................................................................................................................... 23
Chapter 3: Fruit Beverages and Their Health Effects ..................................................... 24
Introduction ................................................................................................................. 24
Description of fruit beverages ..................................................................................... 24
Fruit juice ................................................................................................................ 24
Fruit smoothies ........................................................................................................ 26
Fruit drinks (Juice drinks) ....................................................................................... 26
Impact of fruit beverages on general health ................................................................ 27
Effects on dental health ............................................................................................... 28
Fruit-based drinks consumption in New Zealand ....................................................... 30
Recommendations for amount and frequency of fruit beverage consumption ........... 31
Summary ..................................................................................................................... 32
Chapter 4: Parental Perspectives ..................................................................................... 33
Introduction ................................................................................................................. 33
Children's way of knowing ......................................................................................... 33
Parental influence ........................................................................................................ 34
Evidence from New Zealand ....................................................................................... 34
iii
Rationale of the study.................................................................................................. 36
Rationale for label reading .......................................................................................... 37
Summary ..................................................................................................................... 38
Chapter 5: Methods ......................................................................................................... 39
Introduction ................................................................................................................. 39
Study Setting ............................................................................................................... 39
Study Design ............................................................................................................... 39
Study Population ......................................................................................................... 41
Sampling method ........................................................................................................ 41
Sample size.............................................................................................................. 41
Recruitment ............................................................................................................. 42
Control of bias ......................................................................................................... 43
Control of coverage issues ...................................................................................... 44
Instrument ................................................................................................................... 45
Questionnaire design ............................................................................................... 45
Questions about demographic information ............................................................. 45
Questions about product and influence ................................................................... 46
Questions about knowledge, activities and information source .............................. 47
Questionnaire validation ......................................................................................... 47
Pilot testing ............................................................................................................. 48
Data collection ............................................................................................................ 48
Ethics approval ........................................................................................................ 48
Informed consent ..................................................................................................... 48
Online approach ...................................................................................................... 49
iv
Offline approach...................................................................................................... 49
Label reading procedure .............................................................................................. 49
Data entry, data cleaning and reclassification ............................................................. 50
Reclassification of demographic variables.............................................................. 50
Re-classification in Section A of the questionnaire ................................................ 51
Data analysis ............................................................................................................... 52
Summary ..................................................................................................................... 53
Chapter 6: Results ........................................................................................................... 54
Introduction ................................................................................................................. 54
Sample characteristics ................................................................................................. 54
Demographic profile of participants ........................................................................... 54
Number of children ..................................................................................................... 55
Results of Section A: Products and influence ............................................................. 57
Fruit beverage purchased in a week ........................................................................ 57
Consumption over weekdays and weekends ........................................................... 57
Juice in the lunch box .............................................................................................. 59
Difference between fruit juice and fruit drink......................................................... 59
Factors influencing the purchase ............................................................................. 59
Reasons to give fruit beverage to children .............................................................. 61
Server of fruit beverage to children ........................................................................ 62
Effects of availability of commercial fruit beverage on amount and frequency
consumed ................................................................................................................ 62
Results of Section B: Knowledge, activities and information source ......................... 63
Dental harmfulness of fruit beverages .................................................................... 63
v
Dental harmfulness of behaviours ........................................................................... 64
Dental health-related activities ................................................................................ 65
Source of child oral health information .................................................................. 65
Association between awareness level and covariates ................................................. 66
Number of children ................................................................................................. 66
Gender of respondents............................................................................................. 66
Age of respondents .................................................................................................. 67
Education level ........................................................................................................ 69
Ethnicity .................................................................................................................. 72
Family income ......................................................................................................... 73
Results of label reading ............................................................................................... 76
Summary ..................................................................................................................... 77
Chapter 7: Discussion ..................................................................................................... 79
Introduction ................................................................................................................. 79
Strengths ...................................................................................................................... 79
Study objective ........................................................................................................ 80
Methodology and sample ........................................................................................ 80
Validity .................................................................................................................... 81
Limitations .................................................................................................................. 81
Methodology and response rate .............................................................................. 81
Sample characteristics ............................................................................................. 82
Questionnaire .......................................................................................................... 83
Study findings ............................................................................................................. 84
Purchase and consumption of commercial fruit beverages ..................................... 84
vi
Parental knowledge about commercial fruit beverages .......................................... 85
Factors influencing the purchase ............................................................................. 86
Practice of commercial fruit beverage consumption in children ............................ 88
Label reading ........................................................................................................... 91
Summary ..................................................................................................................... 93
Chapter 8: Conclusion and Recommendations ............................................................... 95
Conclusion .................................................................................................................. 95
Recommendations ....................................................................................................... 96
Integrated approach ................................................................................................. 96
User-friendly labelling ............................................................................................ 97
Equity-focused policy actions and educational programmes .................................. 97
Future research ........................................................................................................ 98
References ..................................................................................................................... 100
Appendices .................................................................................................................... 117
Appendix A: Participant Information Sheet .............................................................. 117
Appendix B: Advertisement ...................................................................................... 120
Appendix C: Questionnaire ....................................................................................... 121
vii
List of Tables
Table 1. Some common juice definitions ........................................................................ 25
Table 2. Demographic characteristics of respondents..................................................... 56
Table 3. Reasons that influence respondents’ choice of fruit beverages for their
children ............................................................................................................. 60
Table 4. Natural and added sugars in fruit beverages are bad for teeth. ......................... 64
Table 5. Mean scores of harmfulness of some activities to teeth. .................................. 65
Table 6. Mean scores of preventive activities related to fruit juice consumption. ......... 66
Table 7. Preventive activities related to fruit juice consumption among different
respondents with different number of children ................................................. 67
Table 8. Source of child oral health information by ethnicity ........................................ 73
List of Figures
Figure 1. Schematic diagram of factors involved in the pathogenesis of dental caries .... 9
Figure 2. An example of oral pH changes demonstrated using a Stephan curve ............ 11
Figure 3. Morbidity and mortality pyramid for ECC. ..................................................... 18
Figure 4. A map showing the twenty-one local boards of Auckland region................... 40
Figure 5. Flowchart of selection of participants.............................................................. 43
Figure 6. Number of children of respondents ................................................................. 55
Figure 7. Average purchase of fruit beverage in weekly shopping................................ 57
Figure 8. Fruit beverage consumption by family members ............................................ 58
Figure 9. Frequency of consumption of fruit beverage on weekdays ............................. 58
viii
Figure 10. Frequency of consumption of fruit beverage on weekends. .......................... 58
Figure 11. Difference between a fruit juice and a fruit drink in terms of fruit content... 59
Figure 12. Reasons to give fruit beverage to children .................................................... 61
Figure 13. Person who serves fruit beverage to children ................................................ 62
Figure 14. Anticipated effects of availability of commercial fruit beverages on
amount of fruit beverage consumption ......................................................... 63
Figure 15. Anticipated effects of availability of commercial fruit beverages on
frequency of fruit beverage consumption ..................................................... 63
Figure 16. Different age groups of respondents and their responses about the
quantity of fruit juice they purchase weekly ................................................. 68
Figure 17. The age group of respondents and their preference to purchase fruit
beverage of their child based on child’s liking for tangy taste ..................... 69
Figure 18. Education level of the respondents and their preferred mode of survey ....... 70
Figure 19. Association between education level of respondents and the practice of
giving juice to children less than once a week. ............................................. 70
Figure 20. Education level of the respondents and affordability of the fruit beverage
influencing the purchase ............................................................................... 71
Figure 21. Ethnic breakdown of respondents and their knowledge of difference
between fruit juice and a fruit drink .............................................................. 72
Figure 22. Family income of the respondents and their preferred mode of survey ........ 74
Figure 23. Family income of the respondents and affordability of the fruit beverage
influencing the purchase ............................................................................... 74
ix
Figure 24. Family income of respondents and availability of the fruit beverage in
their neighbourhood influencing the purchase .............................................. 75

x
Attestation of Authorship
“I hereby declare that this submission is my own work and that, to the best of my
knowledge and belief, it contains no material previously published or written by another
person (except where explicitly defined in the acknowledgements), nor material which
to a substantial extent has been submitted for the award of any other degree or diploma
of a university or other institution of higher learning.”
Prathibha Sural
Signature: _________________________________
Date: ____________________________________
xi
Acknowledgements
I would like to express my heartfelt gratitude to my supervisors Dr. Heather Came and
Dr. Daniel Shepherd who have been the driving force behind every step of my
research. Without their support, encouragement and guidance this thesis would not have
taken on an academic form.
I would like to thank my mentor Dr. Chandrashekar Janakiram for rescuing me from the
ocean of biostatistics and teaching me to efficiently utilise SPSS software. Steve
Taylor from Auckland University of Technology who helped me in designing the
questionnaire for my study also deserves recognition for his valuable input.
I would like to express my deepest gratitude to the managers and coordinators of early
childhood education centres and primary schools who helped me to promote my study in
their wider school community and were the intermediaries between the research team
and the parents and caregivers. The contributions of the Clinical Services Managers and
care providers of Plunket need a special mention. A big thank you to all parents and
caregivers who showed interest in this study and participated in the survey.
I would like to acknowledge the contributions of the Ethics Committees of AUT and
Plunket for granting ethics approval for this study and for shaping up my study design to
be ethically acceptable.
I deeply thank Andrew South and David Parker of Auckland University of Technology
for your advice on the technical aspects of academic writing. Thanks also go to Amy
Zander for proofreading this thesis.
I would like to thank the silent contributors to this piece of work - my husband, Ravi and
my gorgeous son, Prithvi for understanding that mum should be left alone when she
works on her laptop. The support of my sister, Pavithra, my ‘stand-in’ Kiwi
parents, Lynda and Bernie is valued beyond words.
xii
Ethics Approval
This study was approved by Auckland University of Technology Ethics Committee
(AUTEC) on 30 January 2015. AUTEC Reference number 14/388.
This study was also approved by Plunket Ethics Committee on 15 March 2015.
1
Abstract
Good dental health is essential to overall health and has strong linkage with people’s
self-esteem, employability and quality of life. Poor dental health can be a major burden
to individuals, families and nations. Good dental habits practiced during childhood have
long-term benefits later in life. Dental caries and tooth erosion are common public
health problems affecting children. These can be attributed to increased amount and
frequency of intake of sugar and low pH foods. Many studies worldwide and in New
Zealand highlight tooth wear in children, which can in part be attributed to frequent
consumption of fruit juices. Both natural and added sugars in home-made or commercial
fruit beverages can affect dental health, however, commercial fruit beverages are more
easily accessible and storable than home-made beverages, so are more frequently
consumed. This quantitative study assessed parents' knowledge of effects of commercial
fruit beverages (any store-bought drink that contained 5% or more fruit) on their
children's teeth.
This study used a mixed-mode, anonymous survey for data collection using online and
paper questionnaires. Questions were focused on participants’ knowledge, awareness
and practices towards their children’s consumption of fruit beverages in relation to
controlling early childhood caries and erosion. Parents/guardians of children aged
between 1-10 years and living in the Auckland region were invited to participate in the
survey. Participants’ oral health literacy level was assessed through label-reading of
their preferred brand and sub-brand; the factors that influence the choice of the juice
were also identified.
Since most of the participants in the present study were European women aged above
thirty and from higher socioeconomic background, the results indicate that the oral
health awareness in this group is reasonable. Price and availability of the beverage and
child’s liking for its sweet taste were the important considerations for choosing a brand.
A majority of the respondents agreed that the availability of store-bought drinks increase
2
the amount and frequency of fruit beverage consumption in children. There was a
modest correlation between awareness level and the ethnicity, age, education and family
income of the respondents, however there was no significant association between the
awareness level and number of children the respondents had.
Understanding of the difference between fruit juice and a fruit drink was considerably
low among the respondents. This might be compounded by the unclear labelling of the
beverages. Accordingly, there is a need to improve oral health literacy of parents and
caregivers in addition to developing standards for more explicit labelling. Advocacy
actions should also take the erosive potential of fruit beverages into account in addition
to their sugar contents.
3
Chapter 1: Introduction
Introduction
A healthy set of teeth with strong supporting structures is important at every stage of life
for chewing food, speaking and for aesthetics purpose. Oral health status also affects the
physical and psychological well being of individuals and influences how they grow,
socialise, and their perception of social well-being. A systematic review by Moynihan
and Kelly (2014) indicates that even mild dental problems commonly affecting young
children can have significant effects on dental health throughout the life-course. Poor
dental health and untreated dental conditions can have a significant impact on quality of
life. As stated in the World Oral Health Report 2003 (Petersen), “the four most
prominent non-communicable diseases (NCDs) - cardiovascular diseases, diabetes,
cancer and chronic obstructive pulmonary diseases - share common risk factors with
oral diseases, preventable risk factors that are related to lifestyle” (p. 9). For example,
poor dietary practices play a significant role in development of these diseases. They also
influence the development of tooth decay (FDI World Dental Federation, 2014); hence,
improving oral health by curbing these risk factors can also lead to prevention of many
comorbid disorders.
Oral health was one of the thirteen population health objectives in the New Zealand
Health Strategy published in 2000. It is also one of the twelve priorities for Māori health
(Ministry of Health, 2006). The New Zealand health sector has obligations to Māori
through the Treaty of Waitangi, as declared in the New Zealand Public Health and
Disability Act 2000 and a number of key health policy documents including the recent
New Zealand Health Strategy (Ministry of Health, 2016b). In its vision statement of oral
health strategy the Ministry of Health (2006) has outlined the seven key action areas on
oral health policy. The key elements of this vision include improving oral health of
young people and reducing oral health inequalities. While still embracing the principles
of the previous health strategy, the new health strategy developed in 2016 emphasises
4
improving health literacy of people as a means to achieve ‘people-powered health’ by
2026 (Ministry of Health). Oral health literacy is the “degree to which individuals have
the capacity to obtain, process and understand basic oral health information and services
needed to make appropriate health decisions, a definition consistent with that of general
health literacy” (Sabbahi, Lawrence, Limeback, & Rootman, 2009, p. 452).
Dental caries, commonly known as 'tooth decay', has long been considered one of the
most widespread non-communicable diseases in the world (FDI World Dental
Federation, 2014). According to the 2009 New Zealand Oral Health Survey (Ministry of
Health, 2010), dental caries is the most prevalent, preventable, chronic and irreversible
disease in New Zealand. Although tooth decay can occur at any age, early childhood
caries (ECC) is a condition seen in young children which affects multiple teeth in a very
short time (Manton & Hayes-Cameron, 2013).
Dental erosion is a type of tooth wear which is caused by increased acid level in saliva.
This condition has become a recognised problem in children in recent years (Fung &
Brearley Messer, 2013; Kassebaum et al., 2015; Noble, 2006). Fung and Brearley
Messer (2013) have identified a strong correlation between frequent consumption of
drinks containing fruit and these two common dental problems. This study explored the
knowledge of parents about the risk factors present in fruit beverages sold in the market
and their effects on children’s teeth. It also examined the oral health literacy levels of
the parents regarding the difference between fruit juice and fruit drink and correlated
their awareness with their choice of the beverage by label reading.
Research questions
This research was carried out with an aim of investigating the awareness level of parents
and guardians regarding the effects of commercial fruit beverages on their children’s
teeth.
5
Secondary research questions are:
Does the awareness level vary according to education levels, age groups,
ethnicity and socioeconomic status of parents?
What are the factors that influence their selection of fruit beverages?
Research process
This was a quantitative study that used a cross-sectional anonymous survey to obtain
information from participants. Parents and grandparents who were primary caregivers of
children aged between 1-10 years were invited to take part in an anonymous survey. In
order to include participants from different socioeconomic backgrounds and education
levels, both online and paper questionnaires were used for data collection. The raw data
collected was entered into an SPSS database and analysed using univariate and bivariate
analyses to check the overall awareness level and the differences in awareness across
different independent variables.
Key assumptions
It should be explicitly noted that this research was done with a number of key
assumptions. Made mainly on the basis of a literature review by the Health Promotion
Agency (Health Promotion Agency, 2015), these assumptions are: (a) that children’s
health is a priority; (b) that dental caries and erosion are important childhood oral health
problems in New Zealand; (c) people’s dietary practices could be one of the major risk
factors of dental caries and erosion; (d) people do not have sufficient health literacy
levels to understand the influence of consumption of fruit beverages in causation of
common dental problems; (e) nutritional labelling and health choice symbols are
important indicators at the point of sale to guide consumer decision making; and (f)
choosing commercial fruit beverages for the study will help to develop better standards
for its marketing strategies.
6
Researcher Positioning
I am a dentist graduated from India with eight years’ experience in clinical dentistry.
While working as a tutor in the Department of Paediatric Dentistry in India I developed
a special interest in child dental care. After my arrival in New Zealand I completed a
Postgraduate Diploma in Public Health. While working as a research assistant for two
projects at University of Auckland, I worked as a dental assistant and administrator of a
private mobile school dental service that offers free dental care to adolescents. After
learning that even developed countries like New Zealand are not immune to childhood
dental problems, I chose to work as a temporary dental assistant in different suburbs of
Auckland in order to learn more about private and public health systems in New
Zealand. I have recently become a mother, which has heightened my interest in child
health.
Thesis organisation
This thesis is presented to the readers under following sections:
Chapter One – Introduction
Introduces my topic and research question, why it is significant and the structure of my
thesis.
Chapter Two – Background of Dental Caries and Erosion
Examines dental caries, ECC and erosion, their risk factors and protective factors. The
epidemiology and burden of diseases are discussed in this section. The chapter also
explores how dental diseases in childhood can cause later dental-related harm.
Chapter Three – Commercial Fruit Beverages and Their Health Effects
Begins with the description of different types of commercial fruit beverages and
discussion of the health impacts of fruit beverages. This chapter also examines the
7
overall consumption of fruit-based drinks among children of New Zealand.
Chapter Four – Parental Perspectives
Provides an overview of children’s ways of learning and how their parents and
grandparents (apart from the health system) play a role in learning good dental habits.
The oral health knowledge of parents across the globe as well as in New Zealand is
critically analysed in this chapter.
Chapter Five – Research Methods
Research methodology, study design and ethical issues involved in this study are
described.
Chapter Six – Analysis
Analysis of the results in relation to the research questions and objectives of the study
are illustrated.
Chapter Seven – Discussion
The findings of this research and their implications are discussed in relation to the
research objectives and existing literature. Strengths and limitations of this study are
also listed.
Chapter Eight – Conclusion and Recommendations
Summarises the conclusion of the study followed by recommendations to augment oral
health policy initiatives and educational programmes to improve oral health literacy of
parents and caregivers and future research.
8
Chapter 2: Background of Dental Caries and Erosion
Introduction
Oral health is strongly linked with general wellbeing and is associated with positive
development of individuals, communities and nations. However, this association is not
well acknowledged (FDI World Dental Federation, 2014). The reasons for overlooking
this correlation are the chronic nature of dental diseases, a gap in understanding of their
pathogenesis and inadequate promotion and advocacy about oral health in the political
arena (FDI World Dental Federation, 2014). This chapter gives an understanding of the
causes, clinical features and complications of dental caries and dental erosion with an
overview of burden of the diseases in New Zealand both at individual and community
levels.
Dental caries
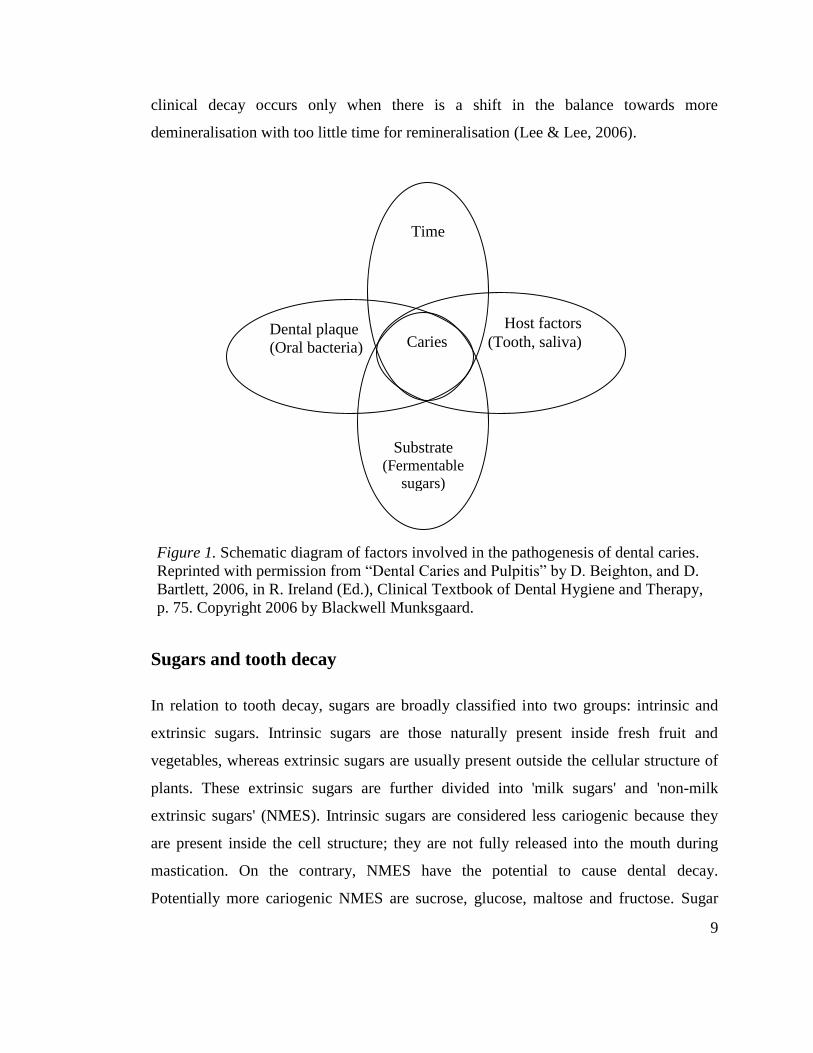
Dental caries or tooth decay is the prime cause for tooth loss in both children (Beighton
& Bartlett, 2006). As Figure 1 illustrates, it is a multifactorial disease which is caused by
interaction of the bacteria in the presence of fermentable carbohydrates over time. The
community of oral bacteria is harboured in the biofilm, called ‘dental plaque’, present
on the tooth surface. The carbohydrates are fermented by the bacteria, producing organic
acids which can dissolve the minerals on the tooth surface they come in contact with.
Most of the oral microorganisms remain active only in acidic medium (Beighton &
Bartlett, 2006).
Alternatively, saliva protects the oral environment from the progressive destruction
through buffering actions, lavage of acids and antimicrobial properties (Rugg-Gunn &
Nunn, 1999). As the saliva adjusts the oral pH to the normal level, minerals move back
onto the surface of the tooth—thus reversing the caries process. This demineralisation
and remineralisation takes place continuously at microscopic level. The development of
9
clinical decay occurs only when there is a shift in the balance towards more
demineralisation with too little time for remineralisation (Lee & Lee, 2006).
Sugars and tooth decay
In relation to tooth decay, sugars are broadly classified into two groups: intrinsic and
extrinsic sugars. Intrinsic sugars are those naturally present inside fresh fruit and
vegetables, whereas extrinsic sugars are usually present outside the cellular structure of
plants. These extrinsic sugars are further divided into 'milk sugars' and 'non-milk
extrinsic sugars' (NMES). Intrinsic sugars are considered less cariogenic because they
are present inside the cell structure; they are not fully released into the mouth during
mastication. On the contrary, NMES have the potential to cause dental decay.
Potentially more cariogenic NMES are sucrose, glucose, maltose and fructose. Sugar
Time
Host factors
(Tooth, saliva)
Substrate (Fermentable
sugars)
Substrate
(Fermentabl
e sugars)
Dental plaque
(Oral bacteria)
Caries
Figure 1. Schematic diagram of factors involved in the pathogenesis of dental caries
Figure 1. Schematic diagram of factors involved in the pathogenesis of dental caries.
Reprinted with permission from “Dental Caries and Pulpitis” by D. Beighton, and D.
Bartlett, 2006, in R. Ireland (Ed.), Clinical Textbook of Dental Hygiene and Therapy,
p. 75. Copyright 2006 by Blackwell Munksgaard.
10
added to food and drinks and sugars naturally present in fruit juices, syrup and honey
both fall under NMES (Noble, 2006).
Sugars naturally present in dairy products are called lactose, or milk sugar. Lactose is
known to be a low cariogenic sugar and is considered safer for dental health.
Furthermore, cow's milk (when no sugar is added) is cariostatic in nature due to the
presence of calcium phosphate and casein, making it a dentally safer drink (Moynihan,
2002). Experiments on animals have shown that milk may have protective action against
caries. In a study on rats from which the salivary glands were deliberately removed in
order to make them caries-prone, lactose had the lowest cariogenicity when compared to
other sugars (Bowen, Pearson, VanWuyckhuyse, & Tabak, 1991). Bowen et al.
concluded that unsweetened cow's milk can be given as a beverage to prevent tooth
decay, particularly in children with reduced saliva and at night when salivary flow is
naturally low. A recent systematic review by Aarthi, Muthu, and Sujatha (2013) also
upholds this claim, while in a Saudi Arabian study (Alshehri & Alshehri, 2015),
preschoolers who slept with a milk-filled bottle in their mouth had highest prevalence of
caries. The Saudi Arabian study does not specify whether the milk given in the bottle
was sweetened or unsweetened. It did, however, find a positive correlation between high
caries prevalence and consumption of sweetened milk beverages in general.
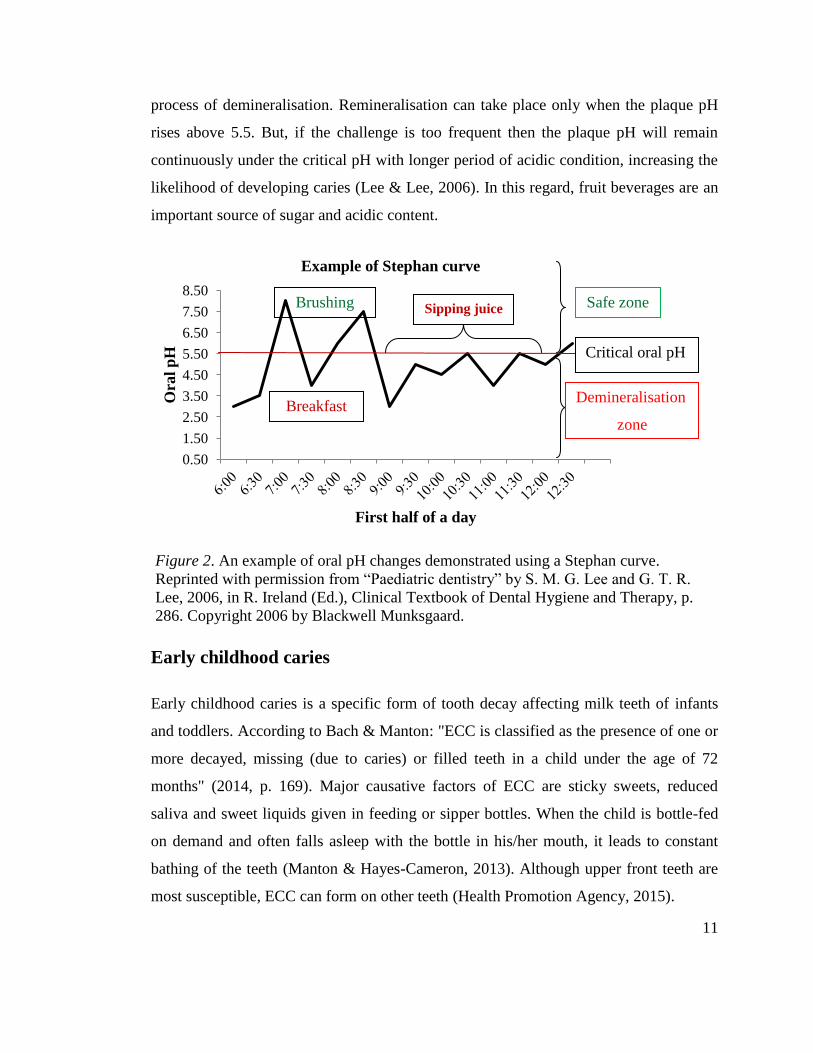
Quantity versus frequency of acid attack: Stephan curve
The strength of evidence for association of dental caries and the amount of sugar
consumption over frequency of consumption has always been a subject of debate
(Moynihan, 2002). Manton and Hayes-Cameron (2013) and Caswell (2009) argue that
the frequency of sugar consumption is more detrimental in terms of dental decay than
one time consumption of significant amounts of sugar. As explained by the Stephan
curve (Figure 2), any single fermentable carbohydrate in the diet reduces the pH of the
oral environment rapidly from its resting state of 7.0 to below 5.5, which is the threshold
at which enamel begins to dissolve. Reduction of pH is more if the food consumed is
more acidic. Ions present in saliva help to buffer the plaque acids, thus controlling the
11
process of demineralisation. Remineralisation can take place only when the plaque pH
rises above 5.5. But, if the challenge is too frequent then the plaque pH will remain
continuously under the critical pH with longer period of acidic condition, increasing the
likelihood of developing caries (Lee & Lee, 2006). In this regard, fruit beverages are an
important source of sugar and acidic content.
Figure 2. An example of oral pH changes demonstrated using a Stephan curve
Early childhood caries
Early childhood caries is a specific form of tooth decay affecting milk teeth of infants
and toddlers. According to Bach & Manton: "ECC is classified as the presence of one or
more decayed, missing (due to caries) or filled teeth in a child under the age of 72
months" (2014, p. 169). Major causative factors of ECC are sticky sweets, reduced
saliva and sweet liquids given in feeding or sipper bottles. When the child is bottle-fed
on demand and often falls asleep with the bottle in his/her mouth, it leads to constant
bathing of the teeth (Manton & Hayes-Cameron, 2013). Although upper front teeth are
most susceptible, ECC can form on other teeth (Health Promotion Agency, 2015).
0.50
1.50
2.50
3.50
4.50
5.50
6.50
7.50
8.50
Ora
l p
H
First half of a day
Example of Stephan curve
Critical oral pH
Demineralisation
zone
Safe zone Sipping juice Brushing
Breakfast
Figure 2. An example of oral pH changes demonstrated using a Stephan curve.
Reprinted with permission from “Paediatric dentistry” by S. M. G. Lee and G. T. R.
Lee, 2006, in R. Ireland (Ed.), Clinical Textbook of Dental Hygiene and Therapy, p.
286. Copyright 2006 by Blackwell Munksgaard.
12
All children are prone to ECC. It is more prevalent in disadvantaged populations such as
children with poor socioeconomic status, from an ethnic minority, malnutrition,
abnormal development of tooth and poor health practices or whose parents—particularly
mothers—have low literacy levels or any condition that leads to poor dietary choices
(Çolak, Dülgergil, Dalli, & Hamidi, 2013).
Natural sugar alternatives
In recent years a plant called 'stevia', a Paraguayan shrub, is competing against sugar
and other artificial sweeteners. It belongs to the Asteraceae family and is used either as a
crude extract or in a highly purified form, though the latter is gaining popularity in a
wide number of countries (Urban, Carakostas, & Taylor, 2015).
There is evidence to show the benefits of stevia on general health as well in controlling
diabetes, hypertension, weight control and many other health problems. It has also
demonstrated the ability to reduce the craving for sweet foods (Goyal & Goyal, 2010).
According to the review by Goyal & Goyal, an experiment conducted on rats in 1992
did not show a potential to increase the risk of developing tooth decay. A study by de
Slavutzky (2010) demonstrated the dental benefits of stevia. All cases in the study
demonstrated significantly lower amounts of plaque following rinsing with stevia when
compared to a sucrose rinse. The plaque deposit following the sucrose rinse was more
gelatinous in appearance whereas the plaque after using stevia rinse appeared like
“ground flour”, which was easy to remove (p. 214). The results of this study, however,
should be considered carefully because it used a small sample of eight volunteers.
The Ministry of Primary Industries of New Zealand first approved the commercial use
of stevia in 2008. In 2012 Frucor Beverages launched ‘Just Juice with stevia’ as an
alternative to sugar, a product claiming to contain 50% less sugar. While it has helped to
increase the popularity of stevia, people are sceptical about its safety. There have also
been reports of hypersensitivity to stevia in different parts of the world, including New
Zealand (Crispe, 2014; Euromonitor International, 2014). A recent review by Urban et
13
al. (2015) concluded that there is no potential danger in consuming the purified form of
this sweetener. They argue that the cases reported in the literature were possibly due to
the consumption of stevia in its crude form and that stevia can induce an allergic
reaction in individuals who are also allergic to other plants in the Asteraceae family. As
a result there have been calls for more obvious labelling of products containing stevia,
using methods such as having pictures of the stevia leaf on the pack as a standard
(Crispe, 2014; Euromonitor International, 2014). My study attempted to obtain parents’
opinions of stevia and as such it may help in understanding the general perception of
New Zealanders towards this sweetener.
Epidemiology of ECC
Despite the major emphasis placed on controlling the disease at the global level, ECC
has been a major problem in developed countries, whereas in developing countries it is
at epidemic proportion (Çolak et al., 2013). A comprehensive review and other studies
from the late 1990s indicate ECC prevalence of 1-12% in developed countries and
around 70% in developing countries (Çolak et al., 2013; Health Promotion Agency,
2015). In New Zealand, despite several scientific advances in clinical dentistry and
public health interventions since the 1920s (Jones, 1984), the 2009 New Zealand Oral
Health Survey shows that only 51% of 5-year-old children of New Zealand are free from
dental caries (Ministry of Health, 2010). Furthermore, there is significant disparity in
oral health across ethnicity, education level, socioeconomic status, geographic
deprivation and other factors. Approximately 48% of Māori children and 47% of Pacific
children were caries-free when compared to their Asian (66%) and European/other
(62%) counterparts (Ministry of Health, 2010).
The 2002 National Children’s Nutrition Survey and 2006/07 New Zealand Health
Survey also highlight the oral health disparity in Māori and Pacific children (Ministry of
Health, 2003, 2008a). The school dental data showed caries prevalence of approximately
50% in 5-year-olds with a majority being Māori and Pacific children; moreover, there
has been no significant reduction in prevalence and severity of ECC in the past decade
14
(Bach & Manton, 2014). Dental emergencies are identified as a primary cause of
hospital admission of young children (particularly in 3- to 4-year-olds) in many District
Health Boards in New Zealand (Whyman, Mahoney, Morrison, & Stanley, 2014).
According to Bach and Manton (2014), between 2000 and 2009, 7.3% of all hospital
admissions for children aged between 29 days to 14 years was for dental emergencies.
These emergencies are mainly caused by dental caries.
Dental erosion
Dental erosion is the physical result of the chronic chemical dissolution of the tooth
surface (Noble, 2006). It is defined as the "physical result of a pathological, chronic,
localised, painless (initially) loss of dental hard tissue which is chemically etched away
from the tooth surface by acid and/or chelation without bacterial involvement" (Rugg-
Gunn & Nunn, 1999, p. 64).
The areas affected and the clinical picture of erosion and dental caries are very different.
While caries develop beneath dental plaque and areas that are difficult to clean (pits and
fissures, proximal surfaces between teeth), erosion develops in areas that are devoid of
plaque but exposed to acid (such as palatal and buccal surfaces of all teeth and occlusal
cusp tips of posterior teeth) (Rugg-Gunn & Nunn, 1999). Erosion may present itself in
different forms, such as change in the cutting edge of front teeth, yellowish tint due to
exposure of underlying yellow dentin as the white enamel cover is dissolved, broad
rounded shiny concavity and dental fillings that appear to be rising above the tooth
surface as the surrounding tooth substance dissolves (Noble, 2006).
The tooth has its nerves and blood vessels in the innermost layer (called 'pulp').
However, some nerve endings extend into the outer layer or dentin, making it
hypersensitive to cold and acidic pH; for that reason, the outside of the crown of the
tooth is insulated by highly calcified enamel. Enamel is lost by continuous exposure to
acid which later exposes the nerve endings in the dentin to the oral environment. While
dental erosion is initially symptomless, exposure of dentin can be extremely sensitive
15
and annoying. It should be noted that even though the body can produce 'reparative
dentin' to make up for the lost dentin, loss of enamel is permanent (Noble, 2006).
There are a number of causes for dental erosion. It can be caused by intrinsic factors like
vomiting, gastric reflux, anorexia and bulimia or by extrinsic causes such as acidic diet,
medicine and environmental factors. Fruits and fruit juices naturally contain acids such
as phosphoric, citric, tartaric, acetic, malic and carbonic acids (Moynihan, 2002).
Ascorbic acid—which has been identified as potentially erosive—is added in significant
quantities to some commercial food and drinks (Noble, 2006). If the nutrition label
indicates the presence of any of these acids then the product is likely to be highly
erosive. When the tooth surface is flushed with acidic liquids it erodes the whole surface
of the tooth by demineralisation (Rugg-Gunn & Nunn, 1999). Erosion resulting from
intrinsic factors is outside the scope of this research.
According to K. Ayers, Drummond, Thomson, and Kieser (2002), tooth wear progresses
faster in primary teeth than in permanent teeth owing to the thinner dentin and enamel
and greater solubility of enamel in primary teeth. While caries invades only one tooth at
a time, erosion can affect all teeth (permanent and primary) all at the same time, causing
irreversible dissolution of the tooth to varying degrees (Noble, 2006). Furthermore,
when the dental hard tissue is softened by the acids it is more susceptible to other forms
of tooth wear, such as attrition (resulting from tooth-against-tooth friction) and abrasion
(resulting from mechanical rubbing of hard foreign substance) also (Rugg-Gunn &
Nunn, 1999).
Epidemiology of dental erosion
As estimated by Black in 1908, the prevalence of chemical tooth wear was less than
0.1% (as cited in Gambon, Brand, & Veerman, 2012). It was once seen mainly as part of
aging but has more recently become a common problem in children (Fung & Brearley
Messer, 2013; Noble, 2006).
16
Taji and Seow (2010), in a comprehensive review of dental erosion, observed the wider
variation in the prevalence from 13% to 82% in 5- to 12-year-old subjects. The results of
this review, however, are predominantly based on the studies from the United States of
America, Europe, Saudi Arabia, China and Brazil. The researchers also noted that the
prevalence of erosion recorded in Australian schoolchildren was 78% and 25% in
primary and permanent teeth respectively, and there was a notable association with
caries. A similar study in Australian primary school children highlights the prevalence
of tooth wear and its significant association with drinking fruit juice (Fung & Brearley
Messer, 2013). The wide ranging values appear to be due to inherently different sample
populations, study design and scoring criteria used. There is also contretemps over
classification of erosion used in the studies and presence of various confounding risk
factors.
Epidemiological studies indicate that in contrast to dental caries, higher socioeconomic
status and education level of the parents can be risk factors for erosion (Gambon et al.,
2012; Millward, Shaw, & Smith, 1993). As Gambon et al. argue, tooth wear is seen
more frequently in males than females because boys need more sourness and sweetness
to perceive the taste. They prefer stronger flavours in comparison to girls. In a Brazilian
study, school boys from the higher income families and those who had parents with
higher education levels showed higher prevalence of tooth wear than female students
from similar background (Mangueira, Sampaio, & Oliveira, 2009).
Prevalence in New Zealand
Dental erosion in young people was included in the national surveys of United Kingdom
as early as the early 1990’s and in the National Oral Health Survey in Iceland (as cited
in Arnadottir et al., 2010; Nunn, Gordon, Morris, & Walker, 2003), but prevalence of
dental erosion is not included in any regular New Zealand national survey. In their
review, Taji and Seow (2010) found only one eligible study from New Zealand,
conducted by K. Ayers et al. (2002), which reported 82% of tooth wear (inclusive of
erosion and other forms of tooth wear) in 5- to 8-year-old subjects.
17
Childhood dental problems: A cycle of events
ECC is a virulent form of caries, characterised by decay in multiple teeth that can
progress quickly. Children presenting with dental caries in their primary teeth are also
prone to decay in their permanent teeth; poor oral health in childhood often persist to
adulthood. Primary teeth play an important role in chewing, speech, aesthetics,
maintenance of an intact dental arch and reserve space for the future permanent
successors. While ECC is often involved with pain, infection, chewing problems and
malnutrition, early loss of primary teeth can affect speech articulation, dietary practices
and development of the jaw. The sequelae of the dental caries (including ECC) ranges
from painless lesion (incipient) to life threatening conditions such as sepsis of oral
cavity (Finucane, 2012). Although no cases of death of children due to dental infections
have been recently reported in New Zealand, there have been a few cases documented in
the United States (Finucane, 2012). The mortality and morbidity pyramid in Figure 3
outlines the human and economic costs of ECC.
Permanent teeth begin to erupt from the age of six years, hence between 6-14 years-old
is called the 'mixed dentition period'. If affected primary teeth are left untreated during
this period, the chance of spreading the decay to permanent teeth increases (Finucane,
2012). Premature loss of deciduous teeth has been shown to contribute to jaw
discrepancy, crowding and malocclusion, malnutrition, small stature, poor general
health and quality of life, behavioural problems and poor school performance (Finucane,
2012; Health Promotion Agency, 2015). In Thailand, dental problems resulted in a
staggering loss of 1900 school hours per 1000 children in 2008 (FDI World Dental
Federation, 2014). It should be noted that the patients who are negatively influenced by
their bad dental experiences in childhood are more likely to delay dental treatment for
their children in the future (Smith & Freeman, 2010).
Initial dental defects can be restored with little pain and discomfort, whereas the pulpal
infections require more complex treatments such as pulpectomy (surgical removal of
pulp) and tooth extraction; such treatments in children are usually performed under
18
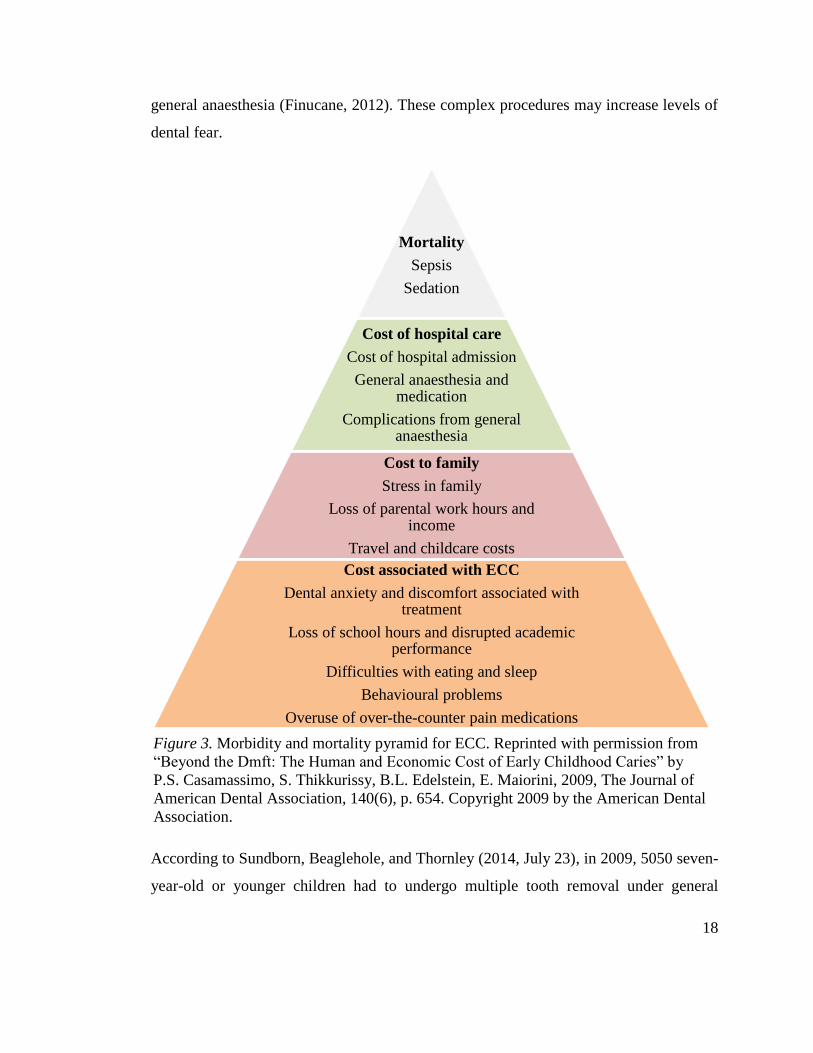
general anaesthesia (Finucane, 2012). These complex procedures may increase levels of
dental fear.
Figure 3. Morbidity and mortality pyramid for ECC.
According to Sundborn, Beaglehole, and Thornley (2014, July 23), in 2009, 5050 seven-
year-old or younger children had to undergo multiple tooth removal under general
Mortality
Sepsis
Sedation
Cost of hospital care
Cost of hospital admission
General anaesthesia and medication
Complications from general anaesthesia
Cost to family
Stress in family
Loss of parental work hours and income
Travel and childcare costs
Cost associated with ECC
Dental anxiety and discomfort associated with treatment
Loss of school hours and disrupted academic performance
Difficulties with eating and sleep
Behavioural problems
Overuse of over-the-counter pain medications
Figure 3. Morbidity and mortality pyramid for ECC. Reprinted with permission from
“Beyond the Dmft: The Human and Economic Cost of Early Childhood Caries” by
P.S. Casamassimo, S. Thikkurissy, B.L. Edelstein, E. Maiorini, 2009, The Journal of
American Dental Association, 140(6), p. 654. Copyright 2009 by the American Dental
Association.
19
anaesthesia. Most of the cases were due to a high-sugar diet. The total cost of these
treatments accounted for more than $20 million—which was borne by the taxpayers.
Apart from the expense of curative treatment, there is a huge indirect cost to parents,
children and the community. A study by Anderson, Drummond, and Thomson (2004)
identified that out of 95 parents, 66 of them had to arrange time off work on the day of
their child’s dental treatment under general anaesthesia. Almost half of them reported
lost income for the day. Even though this study has demonstrated an improvement in
children’s quality of life following treatment under general anaesthesia, increasing
number of treatments requiring general anaesthesia also increases the waiting time for
the child—causing further disruption.
Preventive measures
Most of the risk factors of ECC and tooth wear can be prevented through plaque control,
diet control, community water fluoridation and regular visits to the dental clinic (Health
Promotion Agency, 2015). Therefore, dental public health initiatives should include
these measures.
Plaque control
Plaque control is one of the most efficient methods in caries prevention. Tooth brushing
with fluoridated toothpaste, mouth rinsing and flossing are common methods of plaque
control (Manton & Hayes-Cameron, 2013). Tooth brushing commenced before twelve
months of age is associated with lower caries experience (Health Promotion Agency,
2015). In young children, brushing teeth twice daily is recommended for controlling
formation of plaque and controlling caries process (Manton & Hayes-Cameron, 2013).
Owing to their lack of self-motivation and limited dexterity to brush their teeth
effectively, plaque control in young children depends on parents' dental awareness and
motivation to brush their children's teeth (Bach & Manton, 2014; Lee & Lee, 2006). In
New Zealand only 66% of the parents with children aged 2- to 4-years-old brushed their
children’s teeth twice a day (Health Promotion Agency, 2015). There is evidence that
20
children of lower socioeconomic families begin tooth brushing at later ages and that
they are more likely to seek dental care only for symptomatic problems. Parents who
have higher oral health literacy are more likely to commence tooth brushing of their pre-
schooler children earlier than those who lack oral health knowledge (Bach & Manton,
2014).
Diet control
A systematic review commissioned by the World Health Organization suggests that
restricting total sugar intakes to less than 5% of total energy consumption can minimise
the lifetime risk of tooth decay. This review included data published since 1950
addressing sugar consumption and dental caries (Moynihan & Kelly, 2014).
Alternatively, controlling the frequency of sugar intake, avoiding 'grazing' between
meals, restricting sweet foods to mealtimes and leaving a gap of at least two hours
between every intake allows sufficient time for remineralisation and reduces caries risk
(Manton & Hayes-Cameron, 2013; Noble, 2006). Evidence shows that consumption of
sugar among New Zealand children is on the rise, particularly through beverages (Bach
& Manton, 2014). Reports show that soft drinks featured six times among the top 30
selling products and fruit juices made up 20% of sales (Bach & Manton, 2014). Further
discussion on purchase and intakes of fruit-based beverages is available in Chapter
Three.
Community water fluoridation
Fluoride offers dental benefits through increasing resistance to demineralisation by
forming firmly bound fluoroapatite crystals into the dental tissue and through interfering
with the bacterial activities by increasing the pH of the plaque (Blinkhorn &
Mekertichian, 2013). Fluoride can be delivered through adding it to the community
water supply, toothpastes, rinses, gels, salt and fluoride-releasing restorative materials
(Manton & Hayes-Cameron, 2013).
21
While most dentists support community water fluoridation in New Zealand there are
campaigns against it too, with differences in knowledge and beliefs among people,
particularly across different ethnic groups (Fluoride Action Network NZ Inc, n.d.;
Grant, Dawson, & Thomson, 2013). Any dose higher than one part per million given
through water fluoridation at the time of the development of the tooth can cause
mottling of enamel, a condition called 'fluorosis' (McDonagh et al., 2000). Since
mineralisation of all the developing teeth usually occurs in the first five years of age,
exposure to excess fluoride during this period is problematic. The systematic review by
McDonagh et al. shows that fluoridated water supply is associated with reduction in the
number of teeth affected by caries. At the same time, it underscores dose-dependent
increase in dental fluorosis.
Reports in New Zealand show lower caries prevalence in under-5-year-olds who have
access to fluoridated water supply than those with no access to community water
fluoridation (Ministry of Health, 2006), yet only 60% of the population have access to
fluoridated drinking water (Ministry of Health, 2016a). Instead of solely relying on
fluoride to prevent caries, other methods like diet control and good oral hygiene
practices should be promoted simultaneously.
Utilisation of oral health services
Regular dental check-ups ensure prevention and early intervention of dental problems
through appropriate oral health education, professional plaque removal and application
of restorative materials (Lee & Lee, 2006). Children and adolescents in New Zealand
are entitled to free dental care until their eighteenth birthday. Dental service providers
are contracted with the Ministry of Health to receive a standard package for a prescribed
list of curative and preventive treatments per annum per enrolled patient, which is much
less than the fee-for-service price (Mathu-Muju, Friedman, & Nash, 2013; Ministry of
Health, 2011). Unattractive remuneration and occupational stress have led to job
dissatisfaction among dental therapists, resulting in a shortage of workforce (K. Ayers,
Meldrum, Thomson, & Newton, 2006; K. M. S. Ayers, 2009). This in turn may put
22
pressure on available providers to see many patients in a short time with little space to
give complete oral health education to every patient. The Ministry guidelines for dental
providers use a high-risk individual approach to identify candidates for caries prevention
and early intervention (Ministry of Health, 2011); however, caries development is
dynamic and can occur and progress in individuals of lower risk groups too (Selwitz,
Ismail, & Pitts, 2007).
According to the 2009 New Zealand Oral Health Survey, only 72% of 2- to 17-year-old
children living in the most deprived areas (decile 5) accessed the dental service in the
past year, whereas for decile 3 areas the rate was 91%. When broken down by ethnicity,
Pacific and Māori children had lower rates (71% and 77% respectively) when compared
to Asian (80%) and European/other children (83%) (Ministry of Health, 2010).
In another study, 54% of the mothers of pre-schoolers from the Pacific population did
not know that enrolling their children in the Community Oral Health Service was free
(Health Promotion Agency, 2015). Only 59% of 1- to 4-year-old children had visited the
dental service provider when compared to older children for the past 12 months in 2013-
14 (Ministry of Health, 2014). However another survey by the Ministry of Health (2015)
shows a marginal increase of 3% of service utilisation in 2014-15.
Some of the community-level barriers identified that impede the use of dental service in
New Zealand are: a lack of adequate transport, limited opening hours of operation in
rural areas, Māori oral health professionals being underrepresented in the workforce and
not knowing what types of dental service are available for free. Some individual and
family factors noted are: (a) no perceived need; (b) lack of awareness about importance
of primary teeth; (c) influence of cultural beliefs and practices; (d) people’s attitudes
towards dental service providers; and (e) utilising dental services for treatment rather
than for preventive care (Health Promotion Agency, 2015).
Plunket nurses are the first port of call for receiving health advice and support for many
families with infants and preschool children (Drummond, Clarke, Maxwell-McRae,
23
Konthasinghe, & Thomson, 2002). In 1992 Plunket developed an oral health training
module for their nurses, after recognising the role Plunket nurses had in providing
relevant advice and information to parents of small children. The evaluation of
effectiveness of this module, carried out five years after its introduction, has shown that
this model was moderately successful in providing nurses with basic knowledge of oral
health and ability to make appropriate referrals. According to the report of this study
however, competency of the nurses was assessed mainly on their knowledge of dental
caries and its relation to sugar intakes and oral hygiene, with little focus on acidic foods
(particularly fruit juice) and their role in erosion. It appears from this evaluation that
there is a need for continuous updating of the information used in the module, along
with its systemic evaluation (Drummond et al., 2002). Plunket has been working in
liaison with Colgate and the New Zealand Dental Association (NZDA) since February
2015 to control ECC and to encourage enrolment with the Community Oral Health
Service. This further highlights the need for widening Plunket nurses’ current
knowledge of oral care for young children (Riches, 2015).
Summary
Dental caries and dental erosion are two common dental problems in children. Dental
caries is caused by demineralisation of tooth structure due to the activity of the oral
bacteria in the acidic medium by fermenting the sugars in the diet. Dental erosion is
caused by washing of the acidic liquids, leading to slow dissolution of hard structures of
teeth. Studies have shown that NMES in the diet increases the risk for caries and acidic
diet leads to erosion, while milk sugar has protective effects. Frequency of acid attack
with insufficient time for buffering action further increases the chances of progression of
cavity formation and erosion. Data shows that childhood dental diseases have been a
huge burden on the New Zealand economy. Untreated childhood dental problems can be
very serious, with temporary and permanent complications. The preventive strategies
used for caries prevention can be challenging to apply in children.
24
Chapter 3: Fruit Beverages and Their Health Effects
Introduction
The nutrients in fruit are vital for maintenance of health. Fruit and vegetables consumed
sufficiently on a daily basis could help prevent many major non-communicable diseases
and certain cancers (World Health Organization, 2003). For pre-schoolers and
schoolchildren, the Ministry of Health (2012) recommends at least two servings of fruits
along with two and three servings of vegetables respectively for these age groups. Fruit
juices are more appealing to some busy individuals who want to get their recommended
fruit servings. Availability of several types of fruit beverages in the market with
different combinations of fruit makes it more attractive and convenient to prefer
commercial fruit beverages.
Description of fruit beverages
The New Zealand Juice and Beverage Association (NZJBA) (2013, p. 1) defines juice as
"that product made from the liquid portion obtained from the edible part of the fruit or
vegetable". While the definitions of different fruit beverages vary across countries, the
Food and Agriculture Organization of the United Nations (FAO) (2001) provides some
common juice designations, which are outlined in Table 1.
Fruit juice
Fresh juices typically do not undergo any heating process. Some types of juice, such as
juice concentrate, are processed by evaporating the water content of the juice. After the
concentrate is transported to its destination the same amount of water is then added to
reconstitute to 100% juice. Some fruit beverages are heat-treated at up to 900C for about
10-20 seconds to make them sterile; they are then vacuum-packed in sterilised
containers so they can be stored without refrigeration for 6-9 months (when the seal
25
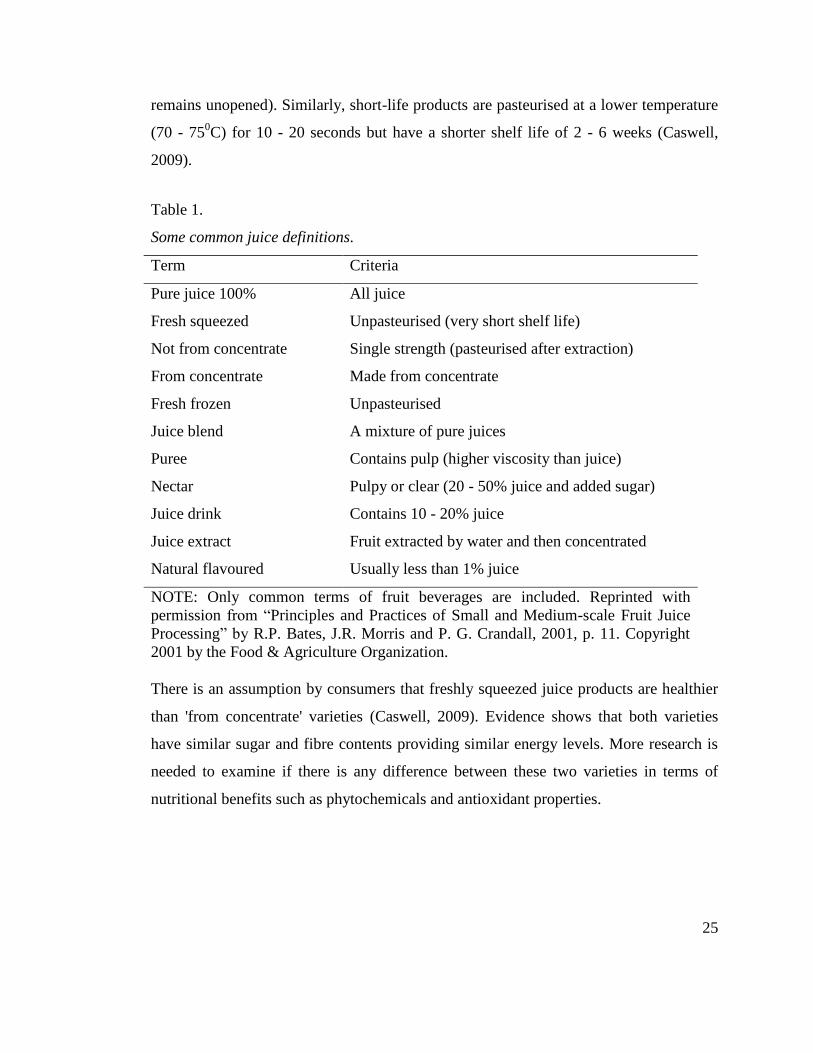
remains unopened). Similarly, short-life products are pasteurised at a lower temperature
(70 - 750C) for 10 - 20 seconds but have a shorter shelf life of 2 - 6 weeks (Caswell,
2009).
Table 1. Some common juice definitions
Table 1.
Some common juice definitions.
Term Criteria
Pure juice 100% All juice
Fresh squeezed Unpasteurised (very short shelf life)
Not from concentrate Single strength (pasteurised after extraction)
From concentrate Made from concentrate
Fresh frozen Unpasteurised
Juice blend A mixture of pure juices
Puree Contains pulp (higher viscosity than juice)
Nectar Pulpy or clear (20 - 50% juice and added sugar)
Juice drink Contains 10 - 20% juice
Juice extract Fruit extracted by water and then concentrated
Natural flavoured Usually less than 1% juice
NOTE: Only common terms of fruit beverages are included. Reprinted with
permission from “Principles and Practices of Small and Medium-scale Fruit Juice
Processing” by R.P. Bates, J.R. Morris and P. G. Crandall, 2001, p. 11. Copyright
2001 by the Food & Agriculture Organization.
There is an assumption by consumers that freshly squeezed juice products are healthier
than 'from concentrate' varieties (Caswell, 2009). Evidence shows that both varieties
have similar sugar and fibre contents providing similar energy levels. More research is
needed to examine if there is any difference between these two varieties in terms of
nutritional benefits such as phytochemicals and antioxidant properties.
26
Fruit smoothies
In the United Kingdom, commercial fruit smoothies typically contain 80 grams of fruit
with 150 ml of fruit juice for every serving of 250 ml. The Department of Health
considers one typical serving of fruit smoothie to be two servings of fresh fruit, because
fruit smoothies contain more crushed fruit when compared to any other fruit beverage
(Caswell, 2009). According to NZJBA (2013), there are generally two types of fruit
smoothies with the following designations:
i) Fruit smoothies are thick, fruit containing drinks often sweetened with fruit puree
rather than fruit juice. Tiwary, Ward & Jackson (1997) claim that fruit smoothies have
higher soluble fibre content than that in juice, over half of which is pectin, thus helping
in increasing short-term satiety.
ii) Traditional smoothies are blends of fruit juice or fruit puree, usually with ice cream
or milk.
The present study included only bottled fruit smoothies commonly sold in shops and
supermarkets (for example, Homegrown Raw Fruit Smoothie and Charlie's Honest
Smoothie) because although both types of smoothies are available in the market,
there is too much variation in the fruit content, nutritional values and health effects of
freshly made traditional smoothies. Also, freshly made traditional smoothies at cafes
and restaurants do not provide the convenience of label-reading.
Fruit drinks (Juice drinks)
Different countries define fruit drinks in different ways as well. According to Caswell
(2009), fruit drink is a fruit beverage which contains anything less than 100% pure fruit
juice. They can also be purchased as ready-to-drink beverages or squash or cordials that
require dilution prior to consumption (Caswell, 2009). NZJBA (2013) does not give an
upper limit for the fruit content of fruit drinks but it must contain a minimum of 5% of
fruit. According to NZJBA (2013), juice drinks and fruit drinks are synonymous.
27
In addition to the definitions of fruit juice, fruit drink and fruit smoothies, NZJBA
(2013) has given description of cordials, fruit syrups, nectars, crushies, quenchers and
more. These drinks are not legally defined in New Zealand. According to New Zealand
guidelines, different types of fruit beverages have fruit content ranging between 5 and
100%. To avoid ambiguity the term ‘fruit beverage’ was used for this research as a
collective term to refer to any drink that has fruit content of 5% or more.
Impact of fruit beverages on general health
Fruit-based drinks are undoubtedly a great way to reap the benefits of fruit for those
who struggle to eat it (for example, babies and toothless individuals or children who do
not like eating fruit at all). But fruit beverages cannot be a substitute for fresh fruits for
several reasons.
Fruit beverages provide very little dietary fibre. Dietary fibre is a part of plant food
which cannot be digested by our digestive system. It is present in fruits, vegetables,
cereals and legumes. It helps in cholesterol reduction, normal bowel function and other
essential health functions (Caswell, 2009). Reference value for dietary fibre for 1- to 3-
year-olds and 4- to 8-year-olds are 14 grams and 18 grams respectively (National Health
and Medical Research Council, 2006). Squeezing the juice out of fruit removes the
dietary fibre naturally found in fruits (Caswell, 2009). Therefore, according to the
Ministry of Health (2012), it only contributes up to one serving of fruit while additional
servings of fruit should come from fresh, frozen or canned fruits, irrespective of the type
and amount of juice consumed.
Two studies (one with children and one with adults) have shown that drinking moderate
amounts of fruit juice on a daily basis can be considered as a “marker of healthier
dietary habits” (Caswell, 2009, p. 282). The study groups in these studies were
associated with consumption of healthier food in general with fewer intakes of junk
foods. These studies do not, however, provide any details about association with
socioeconomic factors and other confounders that may have influenced this habit.
28
Furthermore, a study by Dennison, Rockwell, and Baker (1997) has proven that drinking
fruit juice which far exceeds the recommended amount has also been associated with
short stature and increased risk of obesity among pre-schoolers. Although a review by
O'Neil and Nicklas (2008) concluded that drinking moderate amounts of 100% fruit
juice can be an important source of vitamin C, folic acid, potassium and some
antioxidants for children and adolescents, it acknowledges the low fibre content in 100%
juice varieties as well. One of the ways that the relationship between obesity and fruit
juices has been explained is by Benelam (2009), using 'liquid calories' theory. This
theory states that energy derived from energy-dense liquid is less satiating than solid
food that provides the same amount of energy; it increases the chances of consumption
of more energy than needed. This may lead to frequent juice consumption causing tooth
problems.
Effects on dental health
Some fruits have fibrous texture and on chewing them they act as natural abrasives,
eliminating plaque from teeth and gums. Chewing also stimulates salivary flow,
accelerating the cleansing action (Glosman, 2011, July/August). Even though fruit is
packed with natural sugars and many studies have shown that fruit is acidogenic, along
with other epidemiological studies the Dietary Sugars and Human Disease report 1989
concluded that these intrinsic sugars are negligible causes of tooth decay (Great Britain
Panel on Dietary Sugars, Acheson, & Great Britain Department of Health and Social
Security, 1989; Moynihan, 2002). In contrast, fruit juice contains NMES, which is
produced by the release of natural sugars from the whole fruit as a result of the juicing
process (Caswell, 2009). As estimated by Moynihan (2002), NMES content in an
unsweetened fruit beverage may be equivalent to that of a standard soft drink.
Most of the fruit juices reduce the pH of saliva to below 5.5. In support of this, all fruit
juices used in one study reduced the pH of the saliva to different values. Some of the
readings were well below the critical pH within a minute of consumption and it took at
least thirty minutes to recover to normal levels (Saha, Gudamarlahally, Shivkumar, &
29
Pal, 2011). This drop in pH was higher in commercial fruit juices. The result of a recent
study on the effects of fruit smoothies on enamel erosion is also formidable
(Tahmassebi, Kandiah, & Sukeri, 2014). Tahmassebi et al. argue that while pH is only a
measure of the strength of acid, titratable acidity (TA) measures the time needed for an
alkali to neutralise the acid present in the medium. Although fruit juices are made of
weak acids, their TA is much higher. In support of this argument the smoothies used in
their study had slightly higher pH than Diet Coke. Their TA however was 3.5-4 times
more than Diet Coke. This means fruit juices require more time to neutralise by saliva.
There has been contretemps regarding whether to use pH or TA for measuring the
erosive potential of a drink. In this regard, Jensdottir, Holbrook, Nauntofte, Buchwald,
and Bardow (2006) suggest using pH as a guide to predict the erosive potential within
the first few minutes (initial erosive potential), while the TA can be used to identify the
erosive challenge for longer period of exposure. They also state that a drink with a high
initial erosive potential is well defended by the salivary proteins than those with higher
TA. In their experiment, although cola drinks showed lower pH and higher initial
erosive potential than orange juices used in the study, salivary proteins showed
significant protection against erosive potential of cola drinks while no protection was
obtained for orange juices. Physical characteristics of the drink (such as high viscosity)
and drinking juice from a sipper bottle while sleeping tend to keep the acid in contact
with the teeth for longer period thus resulting in slow oral clearance (Jensdottir et al.,
2006).
Furthermore, two different experiments in India and Saudi Arabia have demonstrated
macerating effects of fruit juices on restorative materials, jeopardising the longevity of
dental fillings as well (Fatima, Abidi, Qazi, & Jat, 2013; Maganur, Prabhakar, Satish,
Namineni, & Kurthukoti, 2013). Both studies depicted changes, to different degrees, in
the surface hardness, micro leakage and decomposition of resin content of commonly
used, tooth-coloured filling materials. These studies show that fruit beverages are
detrimental to dental health in several ways.
30
Besides all this, we should not overlook the significant impact the commercial fruit
beverages have on the environment. As Caswell (2009) argues, production,
pasteurisation, cold storage and transport of fruit beverages all contribute to increased
carbon dioxide emissions. Increasing consumer demand for freshness, variety of
flavours and freshness puts further pressure on beverage industries to cause damage to
the environment.
Fruit-based drinks consumption in New Zealand
Following increasing awareness of the effects of fizzy drinks on health, there is a shift in
the consumer demand towards fruit-containing drinks. According to the Euromonitor
International (2014), New Zealanders prefer fruit-based drinks to other sugar-sweetened
beverages for their children. Sale of fruit-based beverages is on the rise. In 2014, Frucor
Beverages held 57% value share of the market (including fruit-based drinks and soft
drinks) while Fresh Up showed sales of NZ$20 million (Euromonitor International,
2014). As stated by D'Costa (2013, February 20), the per capita juice consumption in
New Zealand is around twenty-five litres per year, making New Zealand the tenth
highest juice-consuming country in the world. According to the latest reports of Statista
(2016), juices accounted for 17% of market share and are still only second to cola
carbonates (the highest selling soft drinks).
In the study carried out by K. Ayers et al. (2002), tooth wear was less common in
children who were weaned after twelve months than those weaned before twelve
months. In this study, even though there was no statistically significant relationship
between extent of tooth wear and the dietary risk factors examined, greater wearing of
molars was seen in children who drank from a feeding cup or bottle for more than six
months. A possible explanation to this is the liquids fed to babies after weaning
comprise drinks other than milk (K. Ayers et al., 2002). Food and Nutrition Guidelines
by the Ministry of Health (2012) do not recommend giving any fruit beverage or sugary
drinks to children. If consumed, it suggests restricting the consumption only to one
small serving occasionally (less than once per week). But in the study by Ayers et al.,
31
fruit-based drinks accounted for over 40% of the daily consumption of the dietary risk
factors for erosion among the participants. According to New Zealand Children’s Food
and Drinks Survey 2007 (National Research Bureau, 2008), fruit juice is second only to
tap water in the most consumed beverages by children aged 5-16 years.
Consumption of sugary drinks and juices by Māori and Pacific children is much higher
than children of other ethnic groups (Ministry of Health, 2012). However, even in
privileged ethnic groups like New Zealand European, fruit beverage intake by pre-
schoolers has notably surpassed the Ministry’s recommendation. A study by Theodore et
al. (2006) depicts that around 30% of New Zealand European pre-schoolers drank more
than one serving of fruit juice per day. In addition to this, 71% of the pre-schoolers
consumed at least one serving of juice per week and 50% of them drank at least one
serving of milkshake and flavoured milk per week. Here it should be noted that adding
milk to fruit beverages adjusts the pH of the drink to some extent, but if the drink
contains added sugar it may still be detrimental to teeth (Noble, 2006). None of the
studies discussed in this thesis state whether the beverages consumed by the children
were home-made or store-bought or demonstrate the differences in their impact.
Recommendations for amount and frequency of fruit beverage
consumption
Fortunately there are some ways to reap the nutritional benefits of fruit beverages and
avoid its ill effects on teeth. Consuming fruit beverages only during meals, drinking
water or plain milk at other times and rinsing mouth after juice consumption can aid in
fewer acid attacks and give sufficient time for acid clearance and buffering capacity of
saliva (Lee & Lee, 2006).
Diluting the juice with water helps to adjust the pH of the drink to some extent and
adding milk adds some benefits of its low cariogenicity discussed earlier. Even Frucor, a
leading brand selling fruit-based drinks in New Zealand, advises its consumers to dilute
one part of juice with three parts of water for children aged 1-2 years. For 2- to 5-year-
32
olds, its recommendation is to dilute one part of juice with one part of water and to
restrict consumption only during meals rather than in between. Only those over 6 years
of age should drink undiluted juice; that too should only be one serving per day, taken
with meals (Frucor, 2016). The advice mentioned above is included in the oral health
education given by dental providers during dental appointments (Lee & Lee, 2006).
However, little is known about to what extent the parents are aware of these
recommendations and how much are they motivated to follow these guidelines.
Summary
Different types of fruit beverages contain different percentage of fruits in them, but they
cannot be consumed as an alternative for fresh or canned fruits due to their low fibre
content and difference in nutrition levels. Literature shows various health impacts of
overconsumption of fruit beverages, particularly in children. Detrimental effects of fruit-
based drinks on teeth and the dental fillings are also highlighted. Fruit-containing drinks
are becoming more popular among young New Zealanders, with increasing sales of
ready-made fruit beverages. Following the Ministry’s guideline for consumption of fruit
beverages, restricting the consumption to meal times and diluting the drinks with water
or milk are some recommendations made in order to minimise the dental impacts of
these beverages on children. But there is very little information available about
awareness, knowledge and practice of these recommendations among parents and
primary caregivers of New Zealand.
33
Chapter 4: Parental Perspectives
Introduction
Parenting, as defined by Savage, Fisher, and Birch (2007), “involves the task of care and
feeding one’s children” (p. 8). Every word spoken and every activity of the parents has
an influence on their children. They are the ultimate role models. Savage et al. (2007)
argue that since food scarcity has always been one of the major perceived environmental
threats to well-being of children, the traditional child feeding practices include feeding
frequently in response to demand or distress. However, the major threats to child health
in this contemporary world are posed by too much food. It is pertinent to shift the focus
to these threats (Savage et al., 2007). This chapter discusses the influence of parents and
caregivers on the oral health behaviours of their children; it also provides the rationale
for this study.
Children's way of knowing
According to Sheiham and B necker (2006), there are basically two types of health
behaviours: health-related and health-directed. They state that the health-related
behaviours are needed to maintain health but are not carried out mainly for health
reasons. For example, most people brush their teeth as part of body hygiene, feel and
freshness, which in turn helps in maintaining dental health. These habits are typically
learned at a very young age from their parents, friends or significant individuals. On the
other hand, health-directed behaviours are usually carried out when the individual is
concerned about health or when there is a threat to health. In this regard, brushing in the
morning can be health-related and bed-time brushing can be health-directed. Individuals
show different levels of readiness to follow health-directed behaviours. Dietary habits of
parents and the education given by dental professionals need to be more health-related
34
to be religiously followed by children (Sheiham B necker, 2006). The same concept
can be applied for fruit juice consumption.
Parental influence
For at least the first few years, parents select the foods of the children’s diet which may
later serve as models of eating patterns and health behaviours in children (Savage et al.,
2007). Simultaneously, children rely mainly on their primary caregivers in receiving
home dental care and to access professional dental services. As previously discussed,
oral hygiene habits and poor oral health knowledge of parents, along with their readiness
to seek dental advice, has strong influence on children's oral health behaviour. In
support of this, a meta-analysis has also confirmed the association between parental and
child dental anxiety, particularly in those 8 years old or younger (Themessl‐Huber,
Freeman, Humphris, Macgillivray, & Terzi, 2010). A study in the United States showed
a strong correlation of impact of parental influences in the aetiology of ECC
(Weatherwax, Bray, Williams, & Gadbury-Amyot, 2014).
In an Australian study (Plutzer & Spencer, 2008), oral health education administered
during pregnancy for first-time-mothers was helpful in reducing the rate of ECC in their
children. Interestingly, telephone consultation at six and twelve months showed that the
retention of information was greater among mothers with low literacy levels. From this
study it appears that the mothers with lower levels of education were more interested
than mothers with higher education to extend their knowledge and parenting skills when
there was an opportunity to learn.
Evidence from New Zealand
The Health Promotion Agency (2015) recently conducted a literature review on oral
health in pre-schoolers. The review confirms the limited availability of New Zealand
data on overall oral health knowledge, awareness and practices of parents. In this regard,
only three completed studies and two surveys were identified. One study (Schluter,
35
Durward, Cartwright, & Paterson, 2007) included Pacific pre-schoolers and mothers.
This study finds a lack of understanding of good oral health practices in children along
with mothers’ negligent attitude towards primary teeth.
Overall oral health literacy levels of parents were assessed in a Christchurch study
(Veerasamy, 2010). Despite 61% of the participants included in this research having
university-level education, only 21 % of participants showed good oral health literacy
level, while 41% and 38% of participants had moderate and poor oral health literacy
respectively.
A study (Rothnie, Walsh, Wang, Morgaine, & Drummond, 2012) carried out in Dunedin
on expectant mothers' knowledge of child oral health care illustrated that a substantial
number of pregnant women had insufficient knowledge about providing appropriate oral
health care to their future children despite the available information. In this study more
than half of the participants were not first-time mothers. Although 98% of the
participants believed oral healthcare was important for their child, they were uncertain
about appropriate home oral health care methods—particularly younger mothers, first-
time mothers and those from low socioeconomic groups. It should be noted that the
review by the Health Promotion Agency excluded studies which focused on dietary
factors alone.
According to the 2007 New Zealand Children’s Food and Drinks Survey (National
Research Bureau, 2008), a majority (85%) of parents and caregivers reported that fruit
juice was available in their home and when it was available, 93% of them noticed that
their child drank fruit juice. Other juice (juice-from-concentrate, powder and cordials)
were also available in 56% of homes. Around nine out of ten parents and caregivers
from these homes said that their child drank it when it was available, while 23% of them
said that their child drank daily or more often. When broken down by age groups, 21%
of parents and caregivers of children aged between 8-12 years and one quarter of parents
and caregivers of children aged between 5-7 years said that their children drank fruit
juice daily or more often when available. The percentage for other juice consumption
36
was 23% and 19% for 8- to 12-year-olds and 5- to 7-year-olds respectively. Availability
and reported child consumption of fruit juice was more common in the homes of Asians
and Europeans/other when compared to Māori and Pacific homes. In contrast,
availability and frequency of consumption of other juice by children was higher in
Māori and Pacific peoples than Asian and European/other groups.
Around 42% of parents and caregivers regularly monitored their children’s food and
drink intakes when they were away from home whereas 14% of parents never
monitored. Around six out of ten parents and caregivers kept a watch on their children’s
food and drinks consumption between meals at home, one in ten did this rarely and one
in ten never monitored their children’s between-meals food habits (National Research
Bureau, 2008)
Rationale of the study
There are many school-based nutritional health programmes at local and national levels.
Initiatives such as ‘Fuelled4life’, ‘traffic light system’, ‘water-only schools’ are some
examples. Fuelled4life is a programme managed by the Heart Foundation and it is based
on the Food and Nutrition Guidelines of Ministry of Health. This initiative offers food
and beverage suggestions to the people involved in selecting food and beverages mainly
in schools and preschools. Food companies can register their products with Fuelled4life
if the items meet the nutrition criteria of the ‘Food & Beverage Classification System’
(Heart Foundation, 2012).
The traffic light system is a food and beverage classification system using green, amber
and red colours. Green is for healthy options (including water and unsweetened milk),
amber for drinks that can be consumed in moderation (including fruit juices up to 250
ml and fruit drinks up to 350 ml) and red is for options that are unsuitable for regular
consumption (drinks that are high in calorie but low in nutritional value, including those
with bigger pack sizes). Beverages that are in the red category are not to be sold in
school premises (Waitemata District Health Board, n.d.).
37
Ministries of Health and Education are encouraging schools to sign up to the ‘water-
only’ policy by becoming free of sugary drinks. This policy does support consumption
of plain milk. By 2015, 10% of schools in New Zealand were water-only ("2016: The
year of the water-only school?," 2016, March 21).
Apart from the studies and surveys discussed in this thesis, there is very little known in
New Zealand about the understanding of parents and guardians of dental impacts of fruit
beverages and their responsibility in controlling the problem. Since both home-made
and commercial juices contain NMES and low pH, they can affect dental health, yet,
raising awareness about commercial fruit beverages specifically can be a prudent course
of action; ‘market fruit beverages’ are more easily accessible and storable than making
fresh juice every time, so are more frequently consumed. Additionally, commercial fruit
juices may contain considerable amounts of added sugar, even if the label says 'contains
no added sugar' (Ministry of Health, 2012). The Food Standards Australia New Zealand
(2012) states,
The amount of sugars in the nutrition information panel will include naturally
occurring sugars, such as those found in fruit, as well as added sugar. Note the
products with 'no added sugar' nutrition claims may contain high levels of
natural sugars. (para. 13)
The NZJBA (2013) states that juices that claim to be pure can legally have up to 4% of
added sugar.
Rationale for label reading
Guiding individuals in self-management facilitates improvement in their health
knowledge, thus helping them to follow health instructions more precisely (Coultzer,
Parsons, & Askham, 2008). Improving oral health literacy is a very effective measure to
help individuals make healthier choices and is important for informed decision-making
regarding their children’s health (Ministry of Health, 2008b). This in turn may reduce
the fiscal burden on the government caused by poor dental health of children of New
Zealand.
38
Commercial fruit beverages allow assessment of nutritional quality through label-
reading. Literature shows a gap in knowledge about whether parents and caregivers of
New Zealand have sufficient awareness of the dental effects of these products. Label
reading might help to examine the discrepancy between parents’ self-reporting of their
knowledge of health effects of fruit beverages and their actual shopping-practice. A
study by University of Minnesota researchers compared self-reporting of label-reading
behaviours of consumers with their actual behaviours with the help of a robust
computerised eye-tracking device. While 24% of the respondents claimed that they
almost always looked at the sugar content of the products, the eye-tracking device
recorded only 1% of the respondents actually doing that (Graham & Jeffery, 2011).
Collecting information about parents’ choice of brand and sub-brand of beverages could
be a simpler and more cost effective method to compare this discrepancy. Data from this
study might also help to understand the factors that influence parents' choice of type and
brand of fruit beverages.
Summary
Parents select the foods for their children, which may later serve as models of their
eating patterns. Health-related behaviours of parents are often religiously followed by
children. There is evidence to show that understanding the parental perspectives and
factors influencing the selection of fruit beverages are important for more precise oral
health promotion. Although all fruit beverages have damaging effect on teeth to some
degree, commercial fruit beverages are sold in different forms with different proportions
of natural and added sugars. They also tend to increase the frequency of consumption,
thus are more destructive to teeth.
39
Chapter 5: Methods
Introduction
This study utilised a quantitative descriptive format to explore the awareness level of
parents and caregivers about dental effects of commercial fruit beverages. This chapter
gives an outline of materials and methods used to achieve the study objectives. It
includes the study design, sampling method and data collection process involved.
Ethical and recruitment issues specific to this study are also discussed.
Study Setting
The study was carried out in the Auckland region, including all twenty-one local board
areas of the Auckland Council (Figure 4). This region was selected because 34%
(approximately 1.5 million) of the population of New Zealand reside in Auckland
region. Auckland is also home to a more culturally diverse population than other regions
of the country. According to the 2013 Census, Europeans made up almost 60% of the
population while 11% were identified as Māori, 15% as Pacific people, and Asians
made up almost a quarter of the total population (Auckland Council, 2014). It should be
noted that the rates of all ethnic populations do not add up to 100% as the Census
allowed the respondents to identify themselves with more than one ethnicity.
Study Design
The study was designed to assess the awareness of parents and caregivers regarding
dental effects of commercial fruit beverages on their children’s teeth. Consequently,
knowledge was selected as an independent variable while an effect of fruit beverages on
children’s dental health was a dependent variable. In this regard a cross sectional
approach was considered appropriate for identifying descriptive information about the
knowledge of the participants (Gordis, 2009). This study did not involve testing the
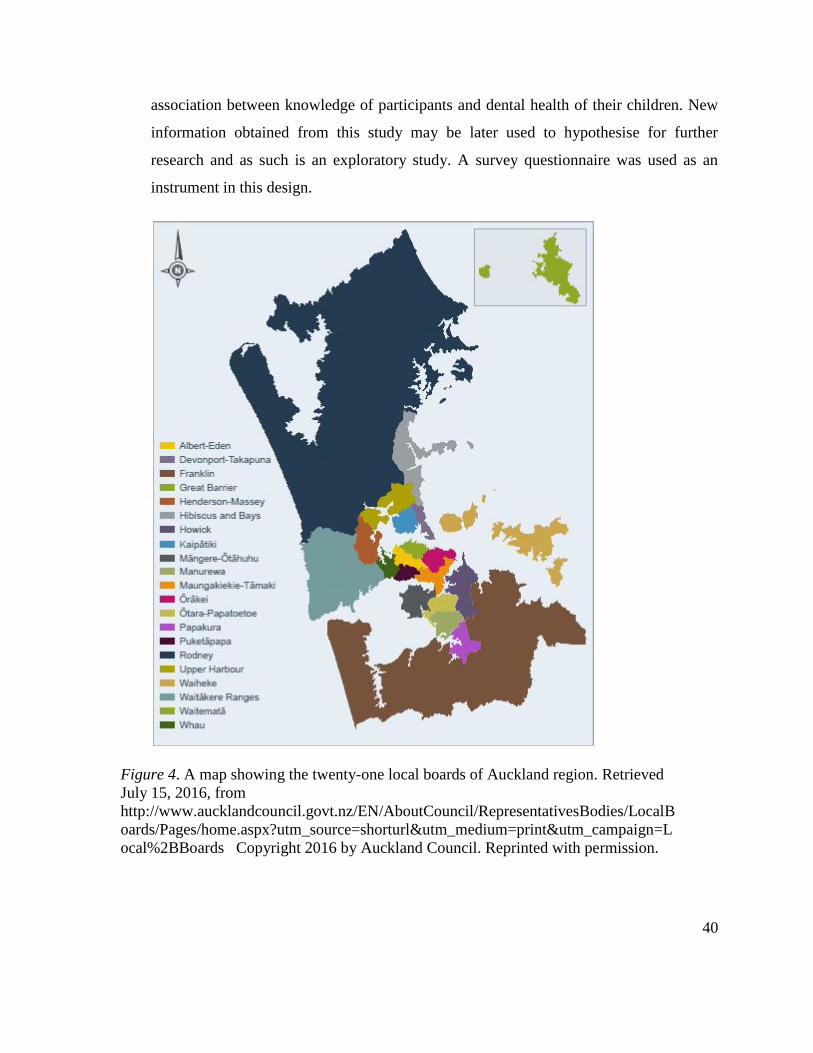
40
association between knowledge of participants and dental health of their children. New
information obtained from this study may be later used to hypothesise for further
research and as such is an exploratory study. A survey questionnaire was used as an
instrument in this design.
Figure 4. A map showing the twenty-one local boards of Auckland region
Figure 4. A map showing the twenty-one local boards of Auckland region. Retrieved
July 15, 2016, from
http://www.aucklandcouncil.govt.nz/EN/AboutCouncil/RepresentativesBodies/LocalB
oards/Pages/home.aspx?utm_source=shorturl&utm_medium=print&utm_campaign=L
ocal%2BBoards Copyright 2016 by Auckland Council. Reprinted with permission.
41
Study Population
The study participants were parents and caregivers of children aged between 1-10 years
and residing in the Auckland region. Caregivers may be grandparents or guardians,
which was made explicit on the participant information sheet (Appendix A).
Considering the susceptibility of the primary teeth to erosion and the challenge of
controlling cavities in young children, this age group was targeted. Infants under twelve
months of age were excluded from the study. The reason is that usually the first tooth
starts to erupt only after the age of 6-7 months (Phillips, 2006). Between 6-12 months is
also the age range when many parents consider weaning their infants from breastfeeding
and begin to introduce other liquids (K. Ayers et al., 2002). Therefore, infants under 12-
months of age are less likely to have major dental impacts caused by fruit beverages.
Similarly, children older than 10 years of age were not included in the research because
they are less influenced by their parents’ dietary choices than their younger counterparts
(Lee & Lee, 2006). They have better dexterity and motivation to brush their teeth and
the capability to understand health messages. Using fluoride toothpaste is also safer in
this age group (Lee & Lee, 2006).
Participants included in the study were required to have basic English reading and
writing skills. Those with insufficient English fluency might have had to rely on others
to read and understand the participant information sheet and to answer the questionnaire,
which could have led to privacy and response issues.
Sampling method
Sample size
The sample size for this study was selected with an aim of detecting statistically
significant findings that are generalisable to the population of Auckland. Since the study
population for this research was parents and caregivers of children aged 1-10 years, an
approximate total number of eligible respondents was calculated using the data from
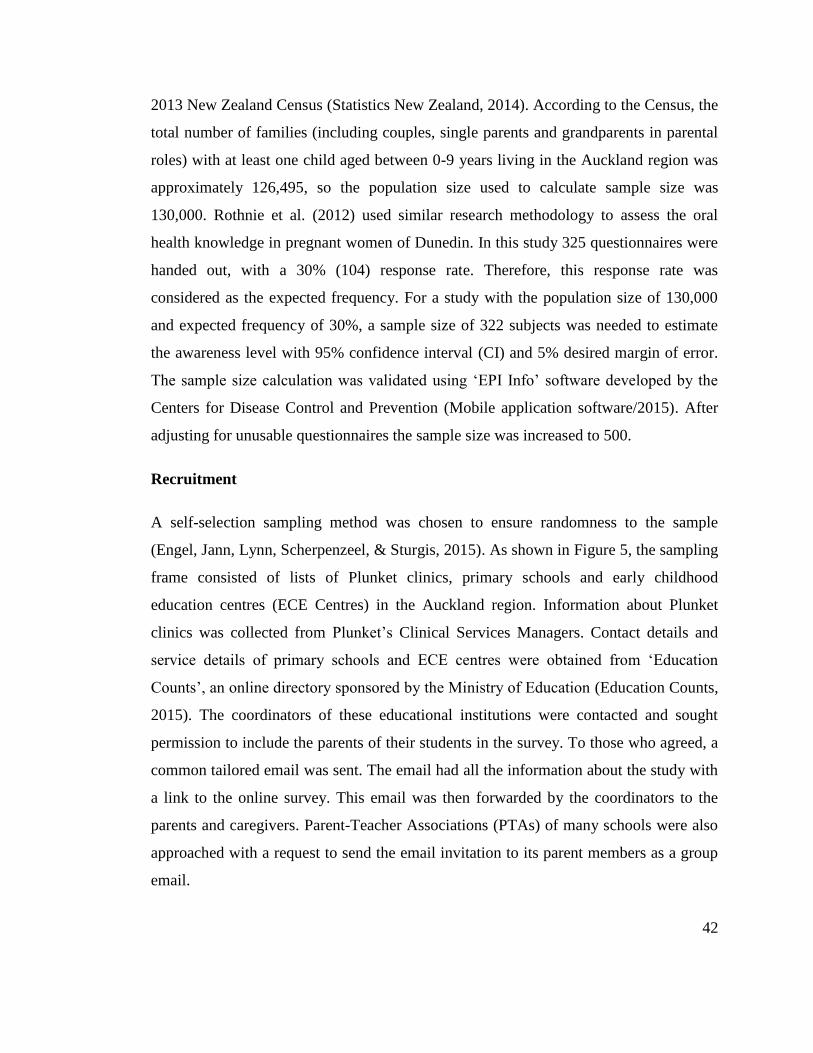
42
2013 New Zealand Census (Statistics New Zealand, 2014). According to the Census, the
total number of families (including couples, single parents and grandparents in parental
roles) with at least one child aged between 0-9 years living in the Auckland region was
approximately 126,495, so the population size used to calculate sample size was
130,000. Rothnie et al. (2012) used similar research methodology to assess the oral
health knowledge in pregnant women of Dunedin. In this study 325 questionnaires were
handed out, with a 30% (104) response rate. Therefore, this response rate was
considered as the expected frequency. For a study with the population size of 130,000
and expected frequency of 30%, a sample size of 322 subjects was needed to estimate
the awareness level with 95% confidence interval (CI) and 5% desired margin of error.
The sample size calculation was validated using ‘EPI Info’ software developed by the
Centers for Disease Control and Prevention (Mobile application software/2015). After
adjusting for unusable questionnaires the sample size was increased to 500.
Recruitment
A self-selection sampling method was chosen to ensure randomness to the sample
(Engel, Jann, Lynn, Scherpenzeel, & Sturgis, 2015). As shown in Figure 5, the sampling
frame consisted of lists of Plunket clinics, primary schools and early childhood
education centres (ECE Centres) in the Auckland region. Information about Plunket
clinics was collected from Plunket’s Clinical Services Managers. Contact details and
service details of primary schools and ECE centres were obtained from ‘Education
Counts’, an online directory sponsored by the Ministry of Education (Education Counts,
2015). The coordinators of these educational institutions were contacted and sought
permission to include the parents of their students in the survey. To those who agreed, a
common tailored email was sent. The email had all the information about the study with
a link to the online survey. This email was then forwarded by the coordinators to the
parents and caregivers. Parent-Teacher Associations (PTAs) of many schools were also
approached with a request to send the email invitation to its parent members as a group
email.
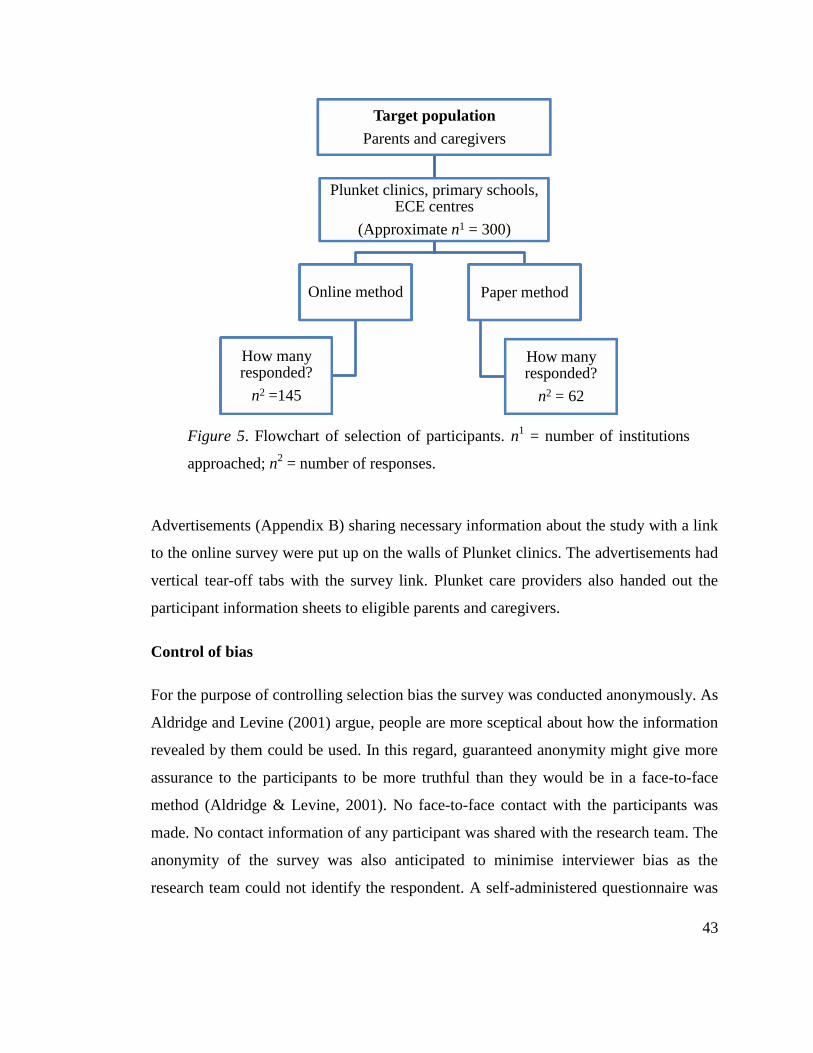
43
Figure 5. Flowchart of selection of participants.
Advertisements (Appendix B) sharing necessary information about the study with a link
to the online survey were put up on the walls of Plunket clinics. The advertisements had
vertical tear-off tabs with the survey link. Plunket care providers also handed out the
participant information sheets to eligible parents and caregivers.
Control of bias
For the purpose of controlling selection bias the survey was conducted anonymously. As
Aldridge and Levine (2001) argue, people are more sceptical about how the information
revealed by them could be used. In this regard, guaranteed anonymity might give more
assurance to the participants to be more truthful than they would be in a face-to-face
method (Aldridge & Levine, 2001). No face-to-face contact with the participants was
made. No contact information of any participant was shared with the research team. The
anonymity of the survey was also anticipated to minimise interviewer bias as the
research team could not identify the respondent. A self-administered questionnaire was
Target population
Parents and caregivers
Plunket clinics, primary schools, ECE centres
(Approximate n1 = 300)
Online method
How many responded?
n2 =145
Paper method
How many responded?
n2 = 62
Figure 5. Flowchart of selection of participants. n1 = number of institutions
approached; n2 = number of responses.
44
used for data collection. As suggested by Engel et al. (2015), self-administered modes
are likely to yield more honest responses, particularly in studies involving self-reporting
of behaviours, thus minimising response bias.
Control of coverage issues
Some studies favour the internet-based survey for its advantage of reaching a large
population in short time. It is also more cost effective than other methods (Engel et al.,
2015). In contrast, some studies also focus on reduced representativeness of participants
who take part in online surveys, owing to coverage and selection bias (Khazaal et al.,
2014). Traditional paper-and-pen method helps to include people with less computer
literacy or those who have limited access to the internet (Engel et al., 2015). In a study
by Mayr et al. (2012) there was a significant demographic variation between
respondents who preferred web-based surveys and those who preferred paper-and-pen
method. Since one of the objectives of this study was to compare the differences in
awareness levels across age, education levels and socioeconomic status of parents of
various ethnic groups, both written and online questionnaires were used. Mixed mode
designs help in improving response rate, reduce under-coverage issues and avoid social
desirability bias (Engel et al., 2015).
Due to the anonymous nature of the survey, the research team was unable to directly
approach eligible parents and caregivers to encourage them to complete the survey. The
participants were approached from all wards of the Auckland region. Efforts were also
made to encourage parents of Waiheke and Great Barrier Islands to take part in the
survey. Māori-based educational institutions were contacted with the email invitation to
encourage Māori participation. Similar attempts were also made for other ethnicities in
order to draw a representative sample. The coordinators of most of the Māori and
Pacific peoples’ schools and preschools contacted said that their clients had a low level
of computer literacy so preferred paper questionnaires. However, despite the frequent
reminders by the school staff, Māori and Pacific participants were less keen to return the
completed questionnaire.
45
Instrument
Questionnaire design
Questions used in the survey questionnaire (Appendix C) were formatted in simple
English in order to be easily understood by a person with a secondary school education.
The questionnaire began with a question about how many of the respondents’ children
were under ten years of age; information about their age and gender were also sought.
The purpose of this question was to examine the association between the awareness
levels of the participants and number of children they had. This question was placed in
the beginning of the questionnaire to confirm that the respondents had children in this
age group before they proceeded to answer other questions. Options were given up to
five children, with an assumption that participants were less likely to have more than
five children aged less than ten years.
Other items in the questionnaire were categorised into three sections: (1) Section A:
Products and influence; (2) Section B: Knowledge, activities and information source;
and (3) Section C: Demographic information. The questionnaire was comprised
predominantly of closed-ended questions in order to make it easy for the participants to
understand and choose appropriate options; however, four closed-ended questions had
the ‘other- please specify’ option where the respondents could bring up any options
other than listed. Three questions were left open-ended to encourage free expression of
the subjects’ own knowledge and/or feelings/practices. Four of the closed-ended
questions used had five-point Likert scales with “agree”, “strongly agree”, “neither
agree nor disagree”, “disagree” and “strongly disagree” options. Two questions used
ordinal scales from one to five to rank the dental harmfulness and preventive activities
related to fruit juice consumption.
Questions about demographic information
The demographic section was placed near the end of the survey in order to avoid survey
fatigue. Demographic information included gender, age group, ethnicity, education level
46
and annual household income of the participant. Education level and household income
were used as the indicators of socioeconomic status of the participants.
Information about age of respondents in years was sought by using five groups with the
class interval of five years from ‘24 or less’ to ’45-49’. After that, a class interval of ten
years was used for 50-59 with an assumption that few respondents in this age group
have children aged less than 10 years. The ethnicity question, as used in the New
Zealand Census 2006, gave multiple options to participants based on their cultural
affiliation rather than their race or citizenship (Statistics New Zealand, n.d.). The options
given were: New Zealand European, Māori, Samoan, Cook Island Māori, Tongan,
Niuean, Chinese, Indian, European and Other. For education, options given were:
secondary school, diploma, technical college, university graduate, postgraduate and
other. Information about annual household income was sought using the following
income bands: $30,000 or less, $30,001–50,000, $50,001–70,000, $70,001–100,000,
$100,000 or more and not stated. The suburb where the participant lived was asked
using an open-ended question to ensure that the study included participants from all
wards of the Auckland region.
Questions about product and influence
The questionnaire had a section related to average purchase of fruit beverages in
household shopping and average consumption by children. Respondents were requested
to name the brand and fruit content of the beverage they chose for their child and factors
that influenced their choice. This aspect was considered important in order to understand
the discrepancy between what is known and what is feasible when parents make these
choices. The common brands and types of beverage preferred by the respondents were
later compared through label-reading.
This part also focused on assessing participants' knowledge of difference in fruit content
and sugar levels in different types of fruit beverages available in the market. Other
questions included were about the opinion of respondents regarding presence of stevia in
47
the child’s drink, reasons behind giving fruit beverage to children and the anticipated
impact of availability of commercial fruit beverages on the amount and frequency of
their children’s consumption.
Questions about knowledge, activities and information source
The section about knowledge, activities and information source included questions to
assess respondents’ perception and knowledge about the dental effects of store-bought
fruit beverages on their children. It covered regular practices in amount, frequency and
type of fruit beverage consumed, and precautionary measures followed to prevent
common dental problems caused by these beverages. The source of information
obtained in the past year by the respondents about their child’s oral health was also
collected.
Questionnaire validation
This research was undertaken as part of a Master of Public Health programme.
Therefore, the questionnaire used for this study was not formally validated due to time
constraints. The demographic information obtained through the questionnaire was,
however, based on the standard definitions used in the New Zealand Census 2006.
Questions related to amount and frequency of fruit beverage consumption in children
were adapted from the food frequency diary used in 2002 National Children’s Nutrition
Survey (Ministry of Health, 2003). Questions related to purchase and factors influencing
purchase of fruit beverage were adapted from a small marketing research project
conducted by students of the Institute for Integrated Learning in Management–Graduate
School of Management in India (Bardhan, Jha, Jaiswal, & Alam, n.d.). Other questions
were developed specifically for this study considering their face validity. The
questionnaire was peer-reviewed by the staff of the Oral Health Department of
Auckland University of Technology (AUT).
48
Pilot testing
Pilot study assessments were utilised for proper planning and execution of the main
study and also to finalise the pro forma to be used for collection of data. The
questionnaire was pilot tested with fifteen participants to confirm that the questions were
comprehensible and acceptable to potential participants. Before carrying out the pilot
survey, only parents and guardians were included in the survey. After the pilot testing,
grandparents were also included in the inclusion criteria. Age group ‘60 and over’ was
also added in the demographics section with an assumption that most of the
grandparents will be in this age group. No other major changes were required for the
questionnaire, however some ethical issues identified in the participant information
sheet were rectified.
Data collection
The survey for this study was accessible between May and July 2015. Label-reading of
the market fruit beverages was done in April 2016.
Ethics approval
The study proposal was first approved by Auckland University of Technology Ethics
Committee (AUTEC) on 30 January 2015 (Reference number: 14/388). Since Plunket
was also involved in recruitment, ethical approval was secured from Plunket Ethics
Committee as well on 15 March 2015.
Informed consent
Both online and paper questionnaires included a participant information sheet at the
beginning, which explained the details and rationale of this study. Responding to the
survey questionnaire was considered as consent to participation, which was made
explicit in the participant information sheet provided.
49
Online approach
For the online survey, SurveyMonkey online survey software was used because this was
more familiar among potential participants than other survey software packages
considered. Evidence shows that people tend to respond better to survey invitations from
familiar sources than those that come from unknown or less familiar sources (Fowler Jr,
2013).
Offline approach
While the administrators of many ECE centres agreed to advertise the online version,
there were a few institutions where the coordinators notified that their clients had
limited access to the internet due to their lack of computer literacy and availability of a
computer and/or internet. In such cases, a bundle of paper questionnaires was sent to the
school staff to distribute among the parents. Paper copies of the questionnaire were
given to participants who preferred the conventional paper-and-pen method. The staff of
the institutions took responsibility for reminding the parents to complete the survey and
to return the paper copies. The filled paper questionnaires returned to the staff were
collected from the schools and ECE centres.
Label reading procedure
In order to assess the understanding of oral health literacy level of the participants, they
were requested to name the brand and fruit type of the store-bought beverage their child
drank often. If there was no specific choice they were also given an option to tick 'No
specific choice'. Popular brands and fruit types among the participants were then studied
for their fruit and sugar contents.
The ingredients lists of the beverages were examined for percentage of juice from fruits
and vegetables and presence of added sugar. Hidden added sugars with alternative
names (such as sucrose, glucose and cane juice solids) were also spotted. The nutritional
panel of the beverage was studied as per the labelling guidelines from the Food
50
Standards Australia New Zealand (2012). The Food Standards Australia New Zealand
specifies that any type of added sugar or alternative sweetener present in the drink must
be declared in the ingredient list. However, it does not mandate the companies to declare
the amount of added sugar or sweeteners present in the drink. In the nutrition panel the
amount of sugar depicted includes natural sugars, such as those found in fruits and
vegetables and also added sugars. Since both natural sugars and added sugars present in
fruit beverages are equally detrimental to teeth, this component was considered. For the
convenience of comparison with similar products, amount of total sugars per 250 ml of
fruit beverage was used for analysis.
Label reading was however only a minor component of this research because there are
several brands and combinations of fruit types available in the market; not many
participants are expected to remember or stick to a specific brand or type of fruit
beverage. Moreover, evidence supports that frequently consumed sugar is more
detrimental in terms of dental decay than the total amount of sugar consumed at any one
time (Caswell, 2009). But this component of study was anticipated to provide an insight
into the level of awareness of the parents and other factors that influence their choice.
Data entry, data cleaning and reclassification
Online responses from SurveyMonkey were directly downloaded from the website as an
MS-Excel file. Paper responses were manually entered into the file. Later it was
imported into SPSS software package for analysis. Data cleaning was done using logical
checks such as removal of unusable questionnaires and ensuring that the age of the
children of all respondents was listed in descending order.
Reclassification of demographic variables
Even though attempts were made to include all ethnic populations of New Zealand,
obtaining a representative sample for all ethnic groups was not possible. Participants
from some ethnic groups were too few to do further analysis. Therefore, for ethnicity
results the respondents were regrouped into two major groups: ‘Europeans’ and
51
‘Others’. Europeans and New Zealand Europeans were included in the European group.
All other ethnic populations were re-classified into the ‘Others’ group due to their small
numbers when considered individually. This classification was made only to make the
labels of variables more meaningful statistically; future studies with larger participant
bases will be able to explore ethnicity variables with wider breadth and depth.
Similar issues were encountered for age, education level and household income. For age
of respondents, participants were regrouped into three intervals: under 30 years, 30-39
years and 40 years and older. For education level, the respondents who had studied up to
secondary school, diploma or technical college were merged into a diploma/technical
college group due to their small number when considered separately. The number of
participants with university graduate degrees and postgraduate education was however
analysed without any modification. For annual household income, the respondents were
reclassified into three major groups: those who earn up to $70,000, whose earnings are
above $70,000 and not stated. Cut-off income level of $70,000 was chosen as it was
close to the median household income of Aucklanders as stated in 2013 Census, which
is $76,500 (Auckland Council, 2014).
Re-classification in Section A of the questionnaire
Initially five options were given for the question regarding amounts of fruit beverage
bought in a week. However, for analysis purpose the options were regrouped into three
groups: ‘half litre or less’, ‘one litre’ and ‘two litres or more’. For the question regarding
children’s beverage consumption on typical weekends and weekdays, the five options
given were regrouped into three options: ‘never’, ‘once a day’ and ‘twice a day or
more’. Due to few responses in some groups, the five options given for the question
regarding how often they put a juice box in their child’s school lunch box were re-
classified into two groups: “never” and “once a week or more”.
Section A of the questionnaire was comprised of some questions that had 5-point Likert
scales with “strongly disagree”, “disagree”, “neither agree nor disagree”, “agree” and
52
“strongly agree” options. At the time of analysis, due to the small number of responses,
these variables were collapsed into 3-point scales with “disagree”, “neither agree nor
disagree” and “agree” options.
In section B, the questions regarding dental harmfulness of natural and added sugars
present in fruit beverages were planned to be asked separately, but due to a typing error
both questions were merged in the paper questionnaire. Therefore, only online responses
(n = 144) were considered for this aspect. These responses were also regrouped into 3-
point Likert scale for data analysis.
Data analysis
Since this was exploratory research, descriptive statistics were used to describe the main
features of the data, mainly focusing on univariate analysis expressed as frequency,
percentages and means. This research also involved a small component of bivariate
analysis to compare the independent variables with various covariates. A chi-square test
for independence was used to assess the association between demographic variables of
the respondents with certain responses related to knowledge and practices related to
child’s fruit juice consumption. This test was considered because the responses were
categorical variables which were expressed in percentages (Daniel & Cross, 2013). Non-
parametric tests were used for some responses that had extreme outliers. The Mann-
Whitney U test was used to compare the means of the scores between two independent
ethnic groups—Europeans and others—with practices related to child’s fruit juice
consumption. This test was considered as it met the criteria for comparing the
association of the mean score of activities related to fruit juice between two groups
(Daniel & Cross, 2013). The Kruskal-Wallis H test was used to compare mean ranks of
two or more categories of independent variables with ordinal dependent variables
(knowledge about dental harmfulness of juice consumption and preventive activities)
(Daniel & Cross, 2013).
53
Summary
This chapter outlined the methodology used for this study. Participants for this study
were recruited through a self-selection method from Plunket clinics, ECE centres and
primary schools. Nutrition panels of the favoured fruit beverages selected were studied
for fruit and sugar content. Data analysis on SPSS was done using descriptive statistics,
chi-square tests and non-parametric tests. The findings of this study are discussed in the
following chapter.
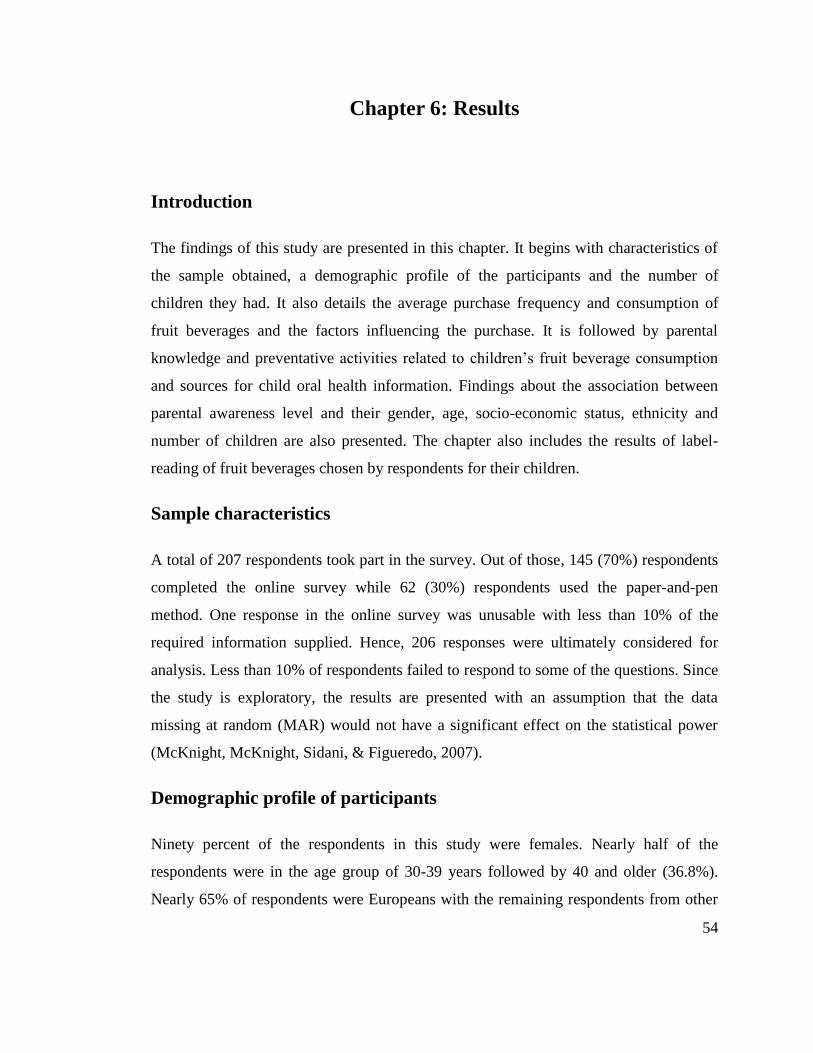
54
Chapter 6: Results
Introduction
The findings of this study are presented in this chapter. It begins with characteristics of
the sample obtained, a demographic profile of the participants and the number of
children they had. It also details the average purchase frequency and consumption of
fruit beverages and the factors influencing the purchase. It is followed by parental
knowledge and preventative activities related to children’s fruit beverage consumption
and sources for child oral health information. Findings about the association between
parental awareness level and their gender, age, socio-economic status, ethnicity and
number of children are also presented. The chapter also includes the results of label-
reading of fruit beverages chosen by respondents for their children.
Sample characteristics
A total of 207 respondents took part in the survey. Out of those, 145 (70%) respondents
completed the online survey while 62 (30%) respondents used the paper-and-pen
method. One response in the online survey was unusable with less than 10% of the
required information supplied. Hence, 206 responses were ultimately considered for
analysis. Less than 10% of respondents failed to respond to some of the questions. Since
the study is exploratory, the results are presented with an assumption that the data
missing at random (MAR) would not have a significant effect on the statistical power
(McKnight, McKnight, Sidani, & Figueredo, 2007).
Demographic profile of participants
Ninety percent of the respondents in this study were females. Nearly half of the
respondents were in the age group of 30-39 years followed by 40 and older (36.8%).
Nearly 65% of respondents were Europeans with the remaining respondents from other
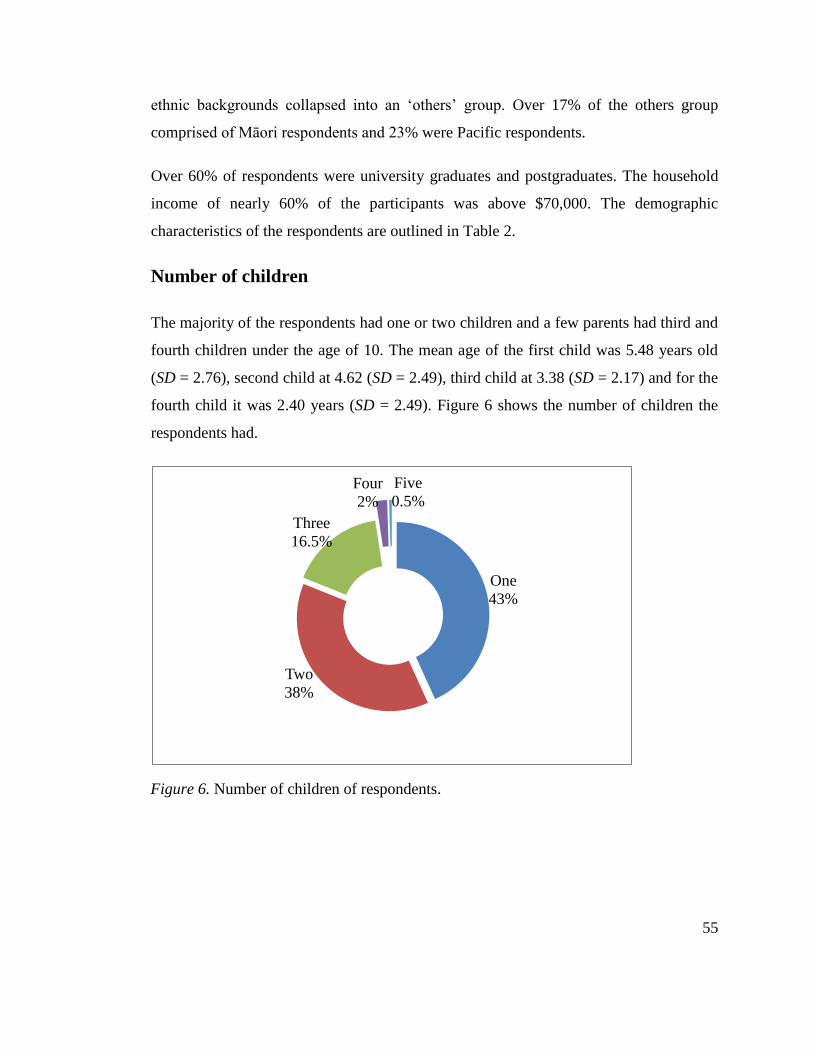
55
ethnic backgrounds collapsed into an ‘others’ group. Over 17% of the others group
comprised of Māori respondents and 23% were Pacific respondents.
Over 60% of respondents were university graduates and postgraduates. The household
income of nearly 60% of the participants was above $70,000. The demographic
characteristics of the respondents are outlined in Table 2.
Number of children
The majority of the respondents had one or two children and a few parents had third and
fourth children under the age of 10. The mean age of the first child was 5.48 years old
(SD = 2.76), second child at 4.62 (SD = 2.49), third child at 3.38 (SD = 2.17) and for the
fourth child it was 2.40 years (SD = 2.49). Figure 6 shows the number of children the
respondents had.
Figure 6. Number of children of respondents
Figure 6. Number of children of respondents.
One
43%
Two
38%
Three
16.5%
Four
2%
Five
0.5%
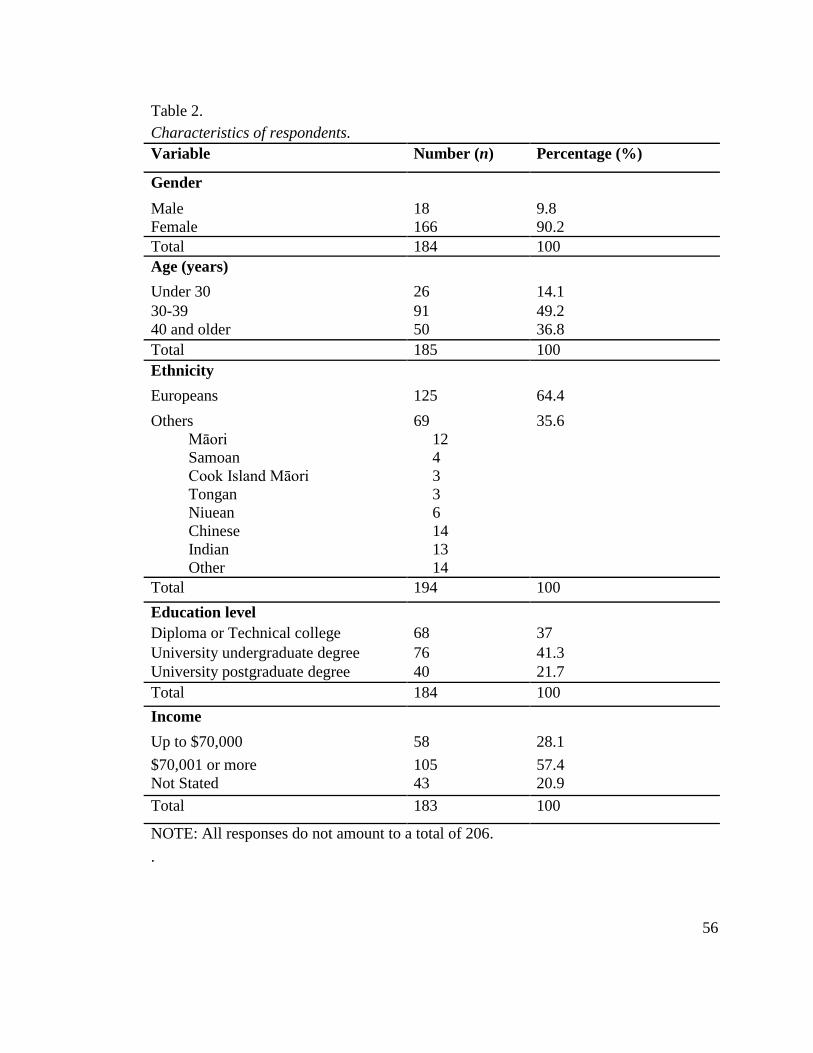
56
Table 2. Demographic characteristics of respondents
Table 2.
Characteristics of respondents.
Variable Number (n) Percentage (%)
Gender
Male 18 9.8
Female 166 90.2
Total 184 100
Age (years)
Under 30 26 14.1
30-39 91 49.2
40 and older 50 36.8
Total 185 100
Ethnicity
Europeans 125 64.4
Others
Māori
Samoan
Cook Island Māori
Tongan
Niuean
Chinese
Indian
Other
69
12
4
3
3
6
14
13
14
35.6
Total 194 100
Education level
Diploma or Technical college 68 37
University undergraduate degree 76 41.3
University postgraduate degree 40 21.7
Total 184 100
Income
Up to $70,000 58 28.1
$70,001 or more 105 57.4
Not Stated 43 20.9
Total 183 100
NOTE: All responses do not amount to a total of 206.
.
57
Results of Section A: Products and influence
Fruit beverage purchased in a week
Nearly 60% of the respondents were buying half a litre or less of fruit beverages in their
weekly shopping, followed by 20% who were buying two litres or more (Figure 7).
Figure 7. Average purchase of fruit beverage in weekly shopping
As outlined in Figure 8, the partners of the respondents consume the majority share of
beverages bought, followed by respondents themselves, their guests during social
occasions, and the least by their children or grandchildren.
Consumption over weekdays and weekends
A minority of respondents (41%) claimed that their children never drank fruit beverages
over weekends compared to weekdays (67%). As shown in Figures 9 and 10, children
drank fruit beverages more frequently over weekends than on weekdays.
Figure 7. Average purchase of fruit beverage in weekly shopping.
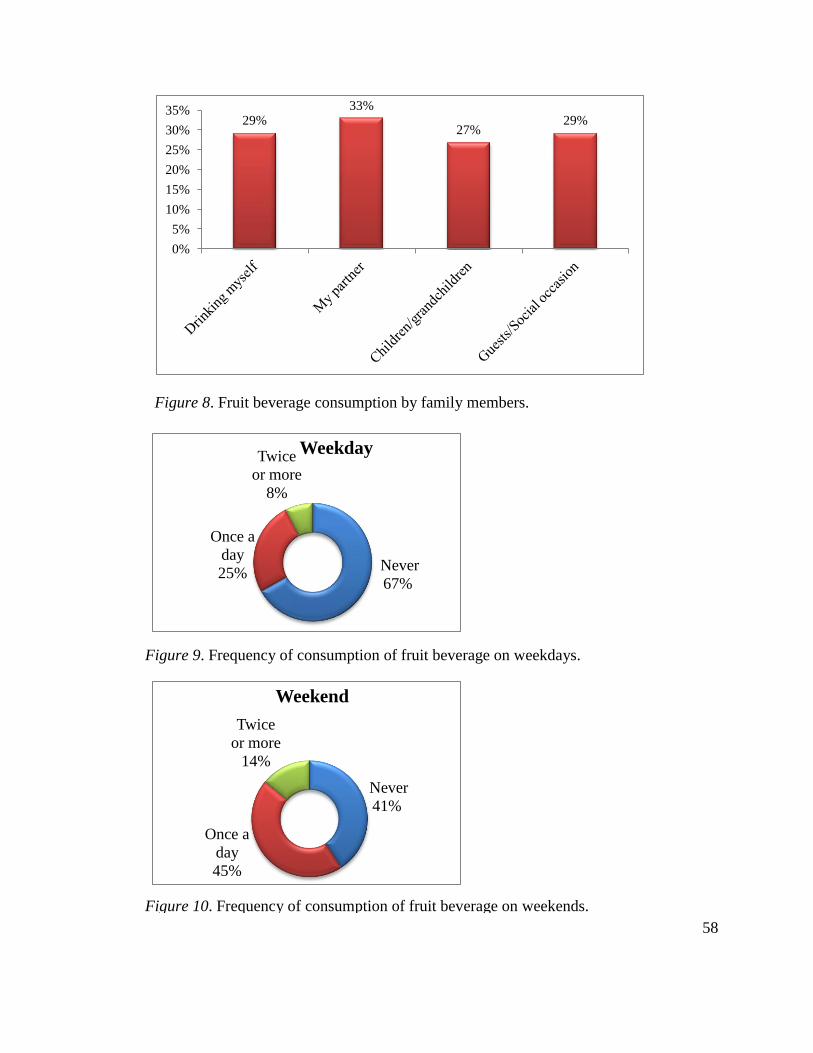
58
Figure 8. Fruit beverage consumption by family members
Figure 9. Frequency of consumption of fruit beverage on weekdays
Figure 10. Frequency of consumption of fruit beverage on weekends.
29% 33%
27% 29%
0%
5%
10%
15%
20%
25%
30%
35%
Never
67%
Once a
day
25%
Twice
or more
8%
Weekday
Never
41%
Once a
day
45%
Twice
or more
14%
Weekend
Figure 8. Fruit beverage consumption by family members.
Figure 9. Frequency of consumption of fruit beverage on weekdays.
Figure 10. Frequency of consumption of fruit beverage on weekends.
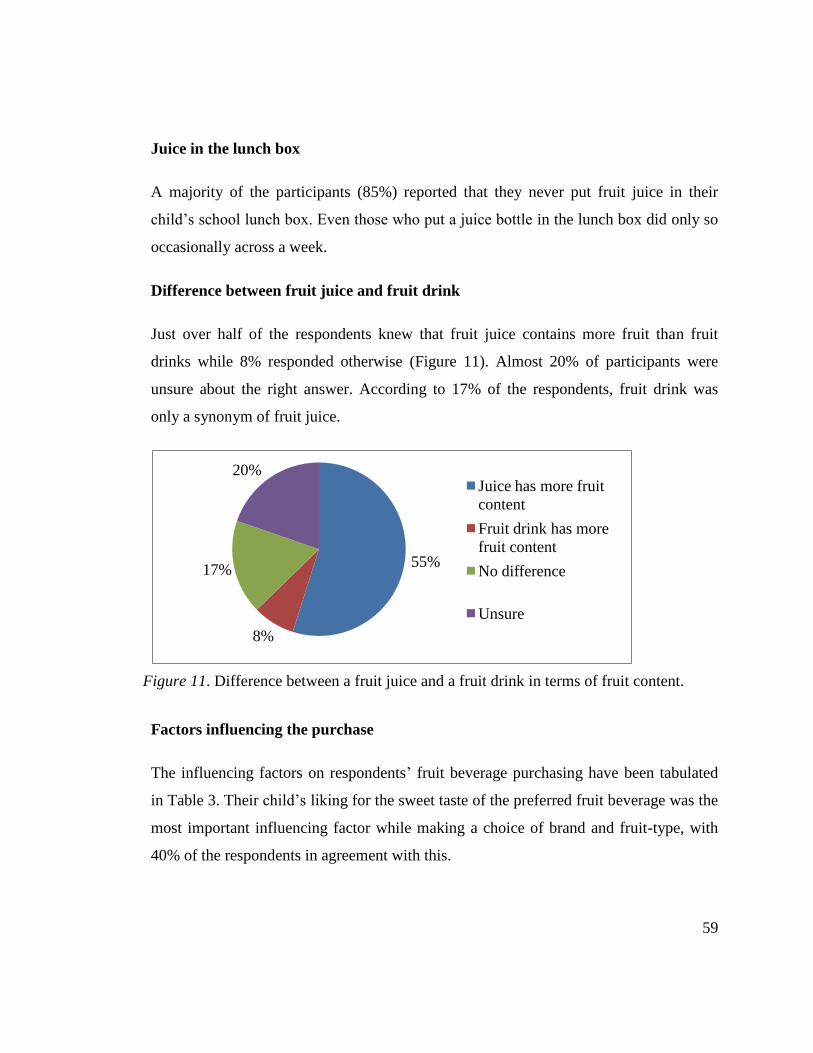
59
Juice in the lunch box
A majority of the participants (85%) reported that they never put fruit juice in their
child’s school lunch box. Even those who put a juice bottle in the lunch box did only so
occasionally across a week.
Difference between fruit juice and fruit drink
Just over half of the respondents knew that fruit juice contains more fruit than fruit
drinks while 8% responded otherwise (Figure 11). Almost 20% of participants were
unsure about the right answer. According to 17% of the respondents, fruit drink was
only a synonym of fruit juice.
Figure 11. Difference between a fruit juice and a fruit drink in terms of fruit content
Factors influencing the purchase
The influencing factors on respondents’ fruit beverage purchasing have been tabulated
in Table 3. Their child’s liking for the sweet taste of the preferred fruit beverage was the
most important influencing factor while making a choice of brand and fruit-type, with
40% of the respondents in agreement with this.
55%
8%
17%
20% Juice has more fruit
content
Fruit drink has more
fruit content
No difference
Unsure
Figure 11. Difference between a fruit juice and a fruit drink in terms of fruit content.
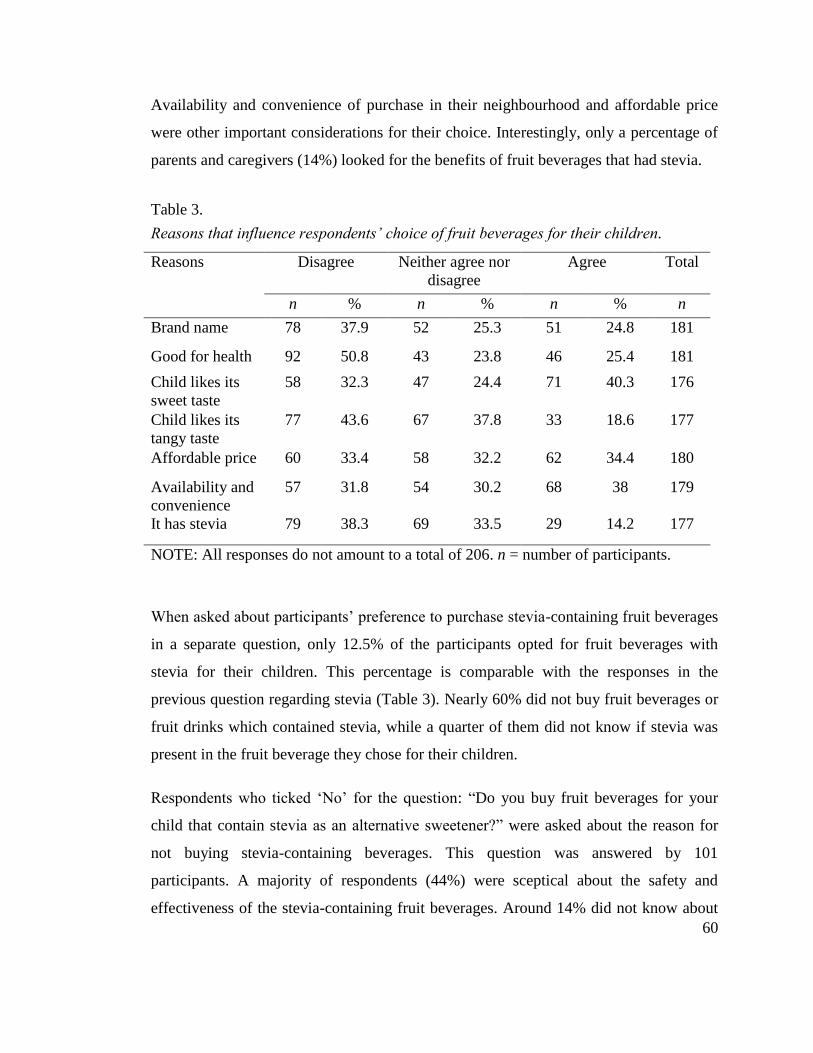
60
Availability and convenience of purchase in their neighbourhood and affordable price
were other important considerations for their choice. Interestingly, only a percentage of
parents and caregivers (14%) looked for the benefits of fruit beverages that had stevia. Table 3. Reasons that influence respondents’ choice of fruit beverages for their children
Table 3.
Reasons that influence respondents’ choice of fruit beverages for their children.
Reasons Disagree Neither agree nor
disagree
Agree Total
n % n % n % n
Brand name 78 37.9 52 25.3 51 24.8 181
Good for health 92 50.8 43 23.8 46 25.4 181
Child likes its
sweet taste
58 32.3 47 24.4 71 40.3 176
Child likes its
tangy taste
77 43.6 67 37.8 33 18.6 177
Affordable price 60 33.4 58 32.2 62 34.4 180
Availability and
convenience
57 31.8 54 30.2 68 38 179
It has stevia 79 38.3 69 33.5 29 14.2 177
NOTE: All responses do not amount to a total of 206. n = number of participants.
When asked about participants’ preference to purchase stevia-containing fruit beverages
in a separate question, only 12.5% of the participants opted for fruit beverages with
stevia for their children. This percentage is comparable with the responses in the
previous question regarding stevia (Table 3). Nearly 60% did not buy fruit beverages or
fruit drinks which contained stevia, while a quarter of them did not know if stevia was
present in the fruit beverage they chose for their children.
Respondents who ticked ‘No’ for the question: “Do you buy fruit beverages for your
child that contain stevia as an alternative sweetener?” were asked about the reason for
not buying stevia-containing beverages. This question was answered by 101
participants. A majority of respondents (44%) were sceptical about the safety and
effectiveness of the stevia-containing fruit beverages. Around 14% did not know about
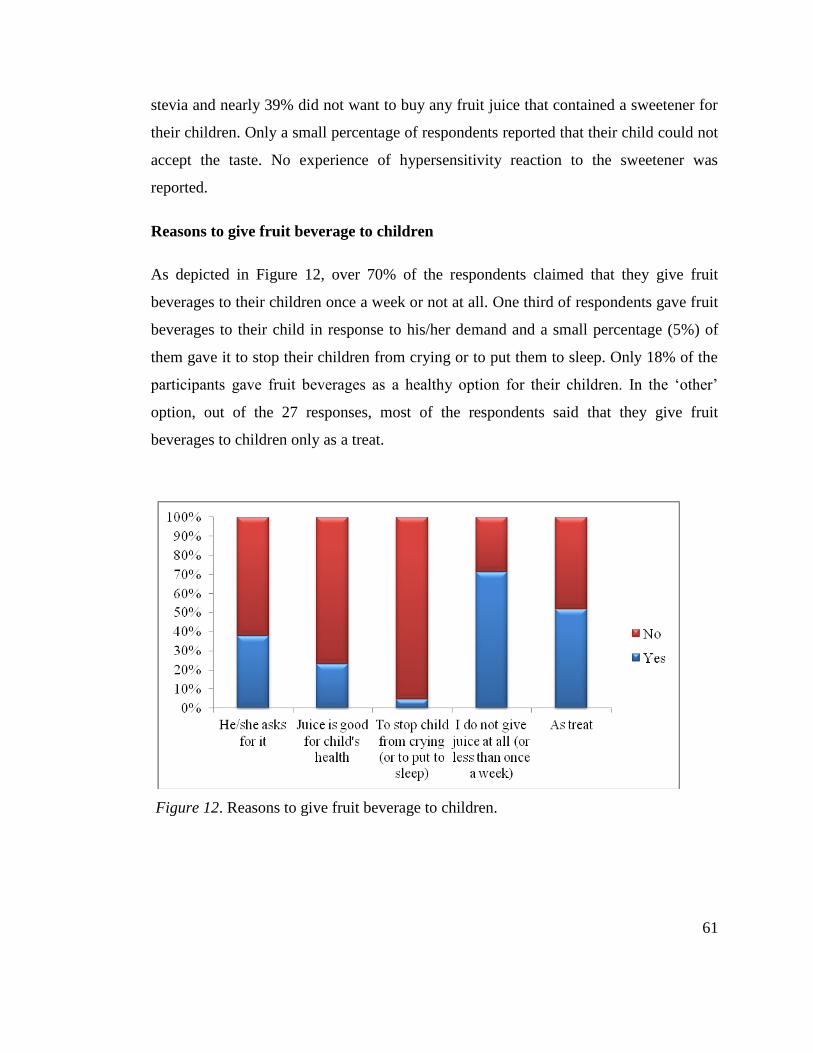
61
stevia and nearly 39% did not want to buy any fruit juice that contained a sweetener for
their children. Only a small percentage of respondents reported that their child could not
accept the taste. No experience of hypersensitivity reaction to the sweetener was
reported.
Reasons to give fruit beverage to children
As depicted in Figure 12, over 70% of the respondents claimed that they give fruit
beverages to their children once a week or not at all. One third of respondents gave fruit
beverages to their child in response to his/her demand and a small percentage (5%) of
them gave it to stop their children from crying or to put them to sleep. Only 18% of the
participants gave fruit beverages as a healthy option for their children. In the ‘other’
option, out of the 27 responses, most of the respondents said that they give fruit
beverages to children only as a treat.
Figure 12. Reasons to give fruit beverage to children
Figure 12. Reasons to give fruit beverage to children.
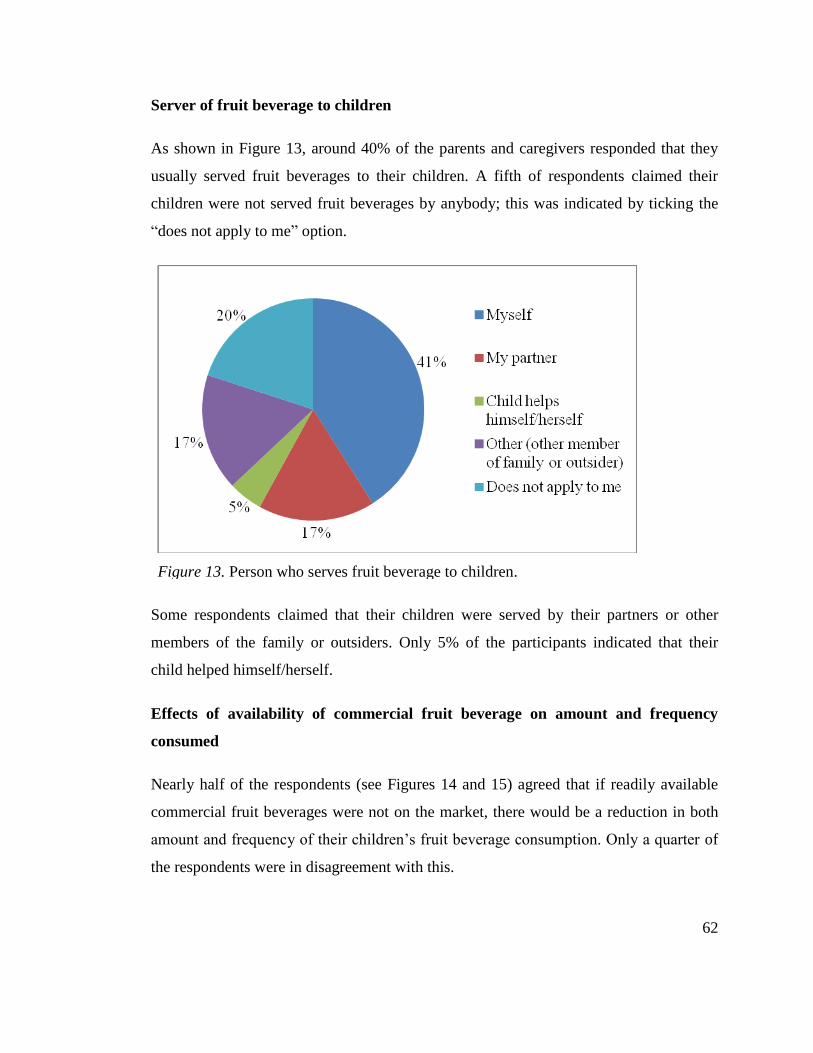
62
Server of fruit beverage to children
As shown in Figure 13, around 40% of the parents and caregivers responded that they
usually served fruit beverages to their children. A fifth of respondents claimed their
children were not served fruit beverages by anybody; this was indicated by ticking the
“does not apply to me” option.
Figure 13. Person who serves fruit beverage to children
Some respondents claimed that their children were served by their partners or other
members of the family or outsiders. Only 5% of the participants indicated that their
child helped himself/herself.
Effects of availability of commercial fruit beverage on amount and frequency
consumed
Nearly half of the respondents (see Figures 14 and 15) agreed that if readily available
commercial fruit beverages were not on the market, there would be a reduction in both
amount and frequency of their children’s fruit beverage consumption. Only a quarter of
the respondents were in disagreement with this.
Figure 13. Person who serves fruit beverage to children.
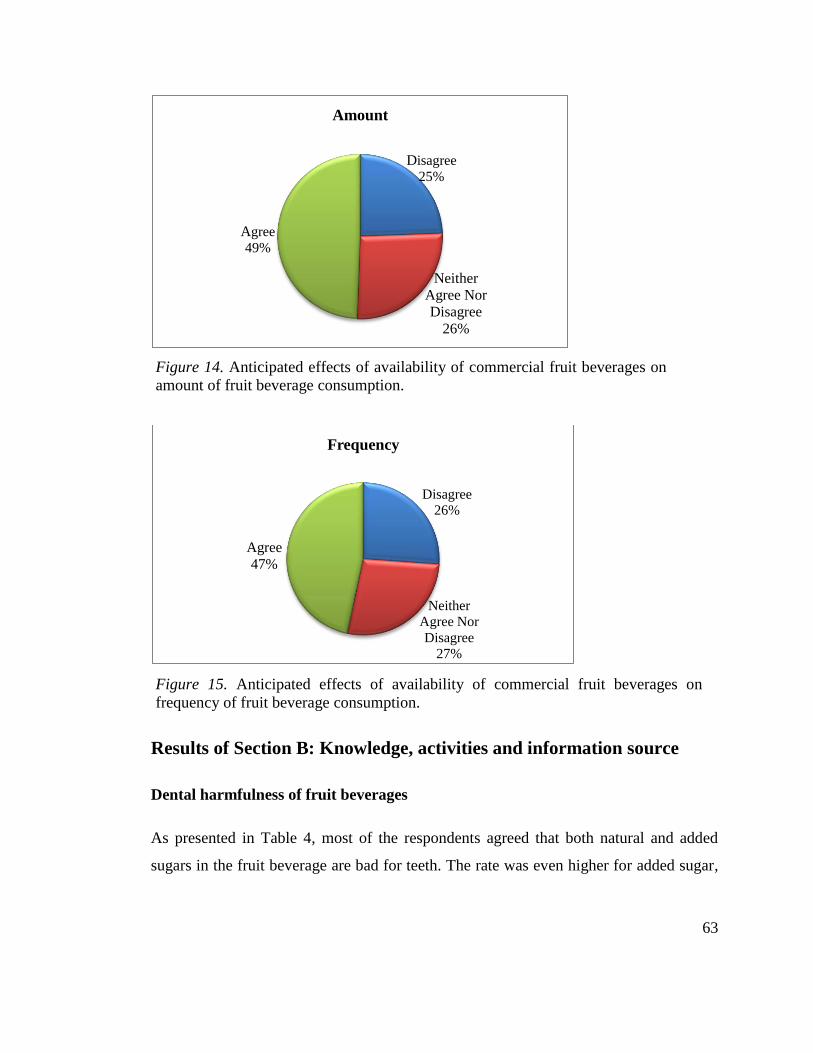
63
Figure 14. Anticipated effects of availability of commercial fruit beverages on amount of fruit beverage consumption
Figure 15. Anticipated effects of availability of commercial fruit beverages on frequency of fruit beverage consumption
Results of Section B: Knowledge, activities and information source
Dental harmfulness of fruit beverages
As presented in Table 4, most of the respondents agreed that both natural and added
sugars in the fruit beverage are bad for teeth. The rate was even higher for added sugar,
Disagree
25%
Neither
Agree Nor
Disagree
26%
Agree
49%
Amount
Disagree
26%
Neither
Agree Nor
Disagree
27%
Agree
47%
Frequency
Figure 14. Anticipated effects of availability of commercial fruit beverages on
amount of fruit beverage consumption.
Figure 15. Anticipated effects of availability of commercial fruit beverages on
frequency of fruit beverage consumption.
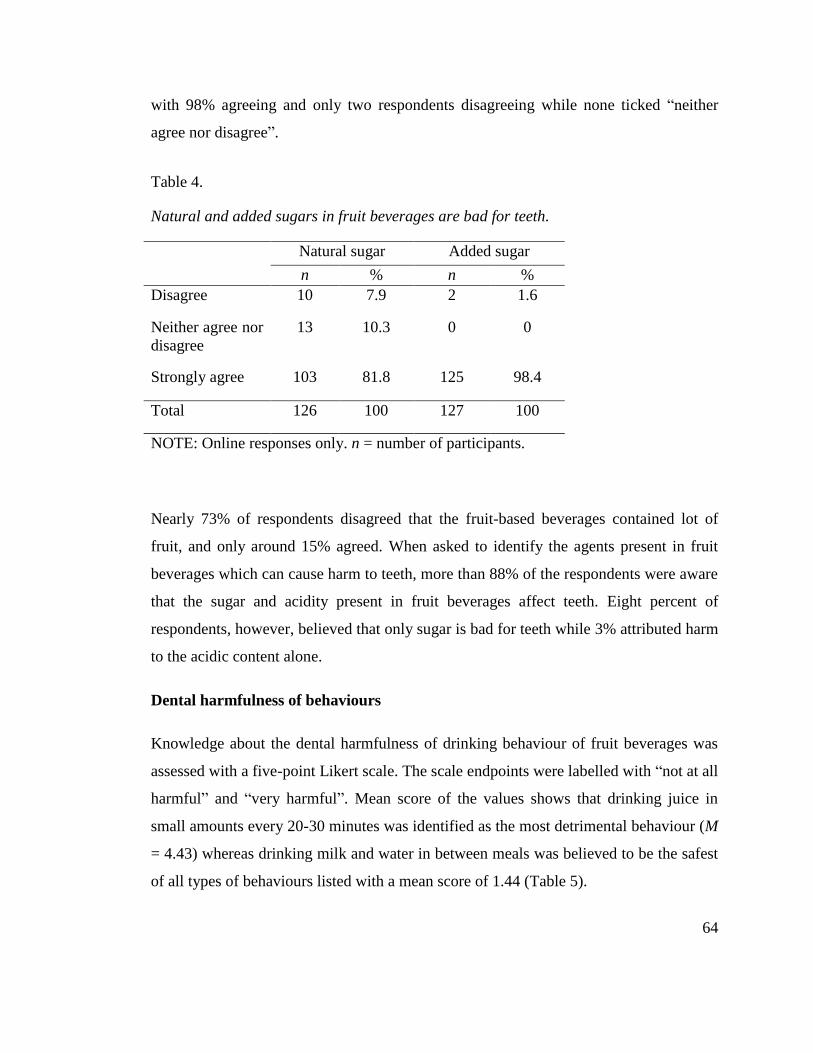
64
with 98% agreeing and only two respondents disagreeing while none ticked “neither
agree nor disagree”.
Table 4. Natural and added sugars in fruit beverages are bad for teeth.
Table 4.
Natural and added sugars in fruit beverages are bad for teeth.
Natural sugar Added sugar
n % n %
Disagree 10 7.9 2 1.6
Neither agree nor
disagree
13 10.3 0 0
Strongly agree 103 81.8 125 98.4
Total 126 100 127 100
NOTE: Online responses only. n = number of participants.
Nearly 73% of respondents disagreed that the fruit-based beverages contained lot of
fruit, and only around 15% agreed. When asked to identify the agents present in fruit
beverages which can cause harm to teeth, more than 88% of the respondents were aware
that the sugar and acidity present in fruit beverages affect teeth. Eight percent of
respondents, however, believed that only sugar is bad for teeth while 3% attributed harm
to the acidic content alone.
Dental harmfulness of behaviours
Knowledge about the dental harmfulness of drinking behaviour of fruit beverages was
assessed with a five-point Likert scale. The scale endpoints were labelled with “not at all
harmful” and “very harmful”. Mean score of the values shows that drinking juice in
small amounts every 20-30 minutes was identified as the most detrimental behaviour (M
= 4.43) whereas drinking milk and water in between meals was believed to be the safest
of all types of behaviours listed with a mean score of 1.44 (Table 5).
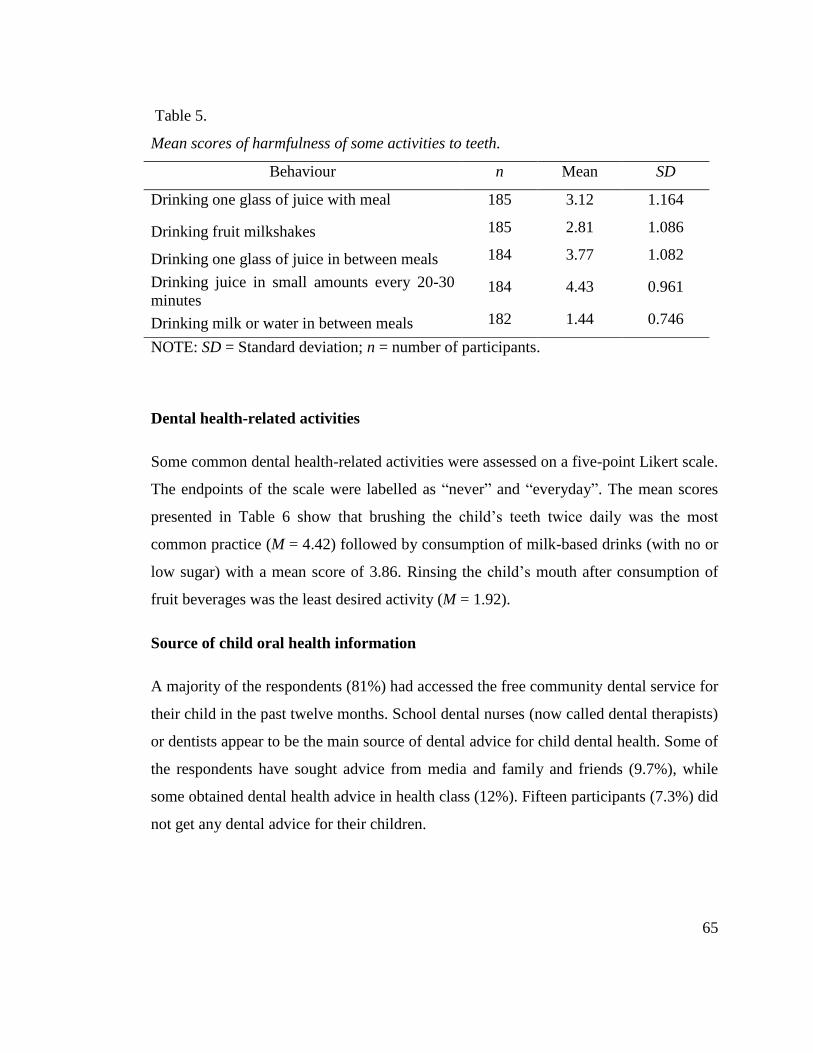
65
Table 5. Mean scores of harmfulness of some activities to teeth.
Dental health-related activities
Some common dental health-related activities were assessed on a five-point Likert scale.
The endpoints of the scale were labelled as “never” and “everyday”. The mean scores
presented in Table 6 show that brushing the child’s teeth twice daily was the most
common practice (M = 4.42) followed by consumption of milk-based drinks (with no or
low sugar) with a mean score of 3.86. Rinsing the child’s mouth after consumption of
fruit beverages was the least desired activity (M = 1.92).
Source of child oral health information
A majority of the respondents (81%) had accessed the free community dental service for
their child in the past twelve months. School dental nurses (now called dental therapists)
or dentists appear to be the main source of dental advice for child dental health. Some of
the respondents have sought advice from media and family and friends (9.7%), while
some obtained dental health advice in health class (12%). Fifteen participants (7.3%) did
not get any dental advice for their children.
Table 5.
Mean scores of harmfulness of some activities to teeth.
Behaviour n Mean SD
Drinking one glass of juice with meal 185 3.12 1.164
Drinking fruit milkshakes 185 2.81 1.086
Drinking one glass of juice in between meals 184 3.77 1.082
Drinking juice in small amounts every 20-30
minutes 184 4.43 0.961
Drinking milk or water in between meals 182 1.44 0.746
NOTE: SD = Standard deviation; n = number of participants.
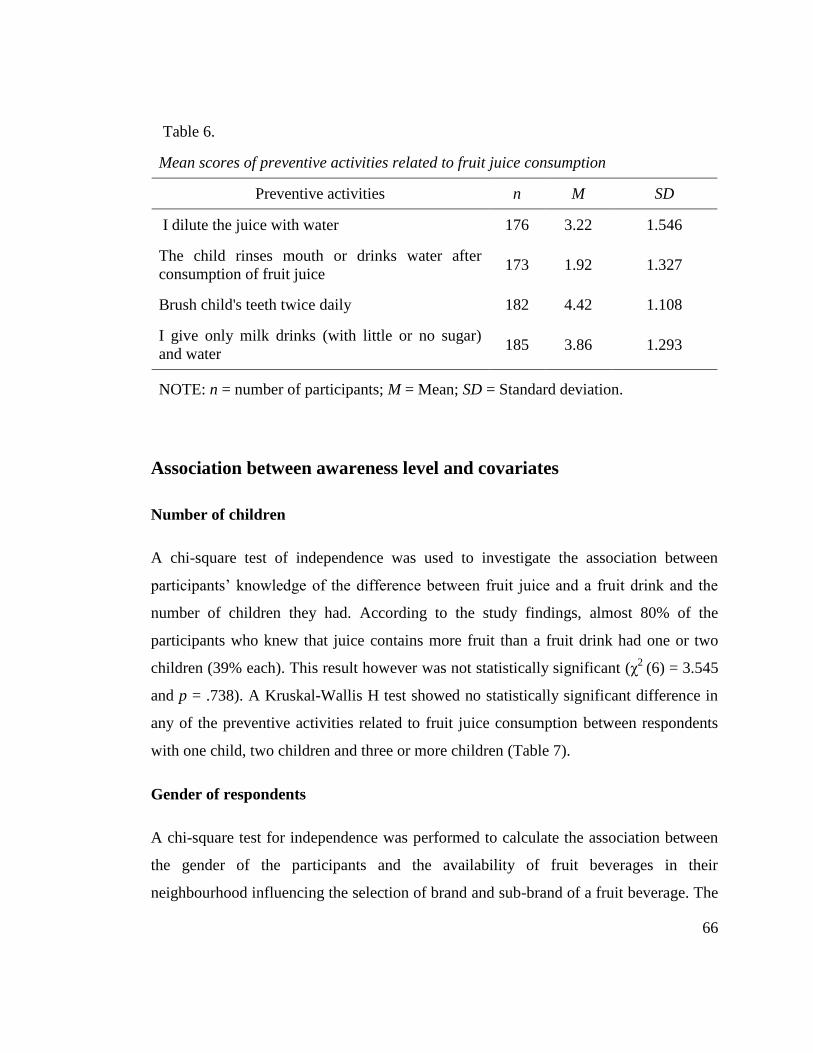
66
Table 6. Mean scores of preventive activities related to fruit juice consumption.
Association between awareness level and covariates
Number of children
A chi-square test of independence was used to investigate the association between
participants’ knowledge of the difference between fruit juice and a fruit drink and the
number of children they had. According to the study findings, almost 80% of the
participants who knew that juice contains more fruit than a fruit drink had one or two
children (39% each). This result however was not statistically significant (χ2
(6) = 3.545
and p = .738). A Kruskal-Wallis H test showed no statistically significant difference in
any of the preventive activities related to fruit juice consumption between respondents
with one child, two children and three or more children (Table 7).
Gender of respondents
A chi-square test for independence was performed to calculate the association between
the gender of the participants and the availability of fruit beverages in their
neighbourhood influencing the selection of brand and sub-brand of a fruit beverage. The
Table 6.
Mean scores of preventive activities related to fruit juice consumption
Preventive activities n M SD
I dilute the juice with water 176 3.22 1.546
The child rinses mouth or drinks water after
consumption of fruit juice 173 1.92 1.327
Brush child's teeth twice daily 182 4.42 1.108
I give only milk drinks (with little or no sugar)
and water 185 3.86 1.293
NOTE: n = number of participants; M = Mean; SD = Standard deviation.
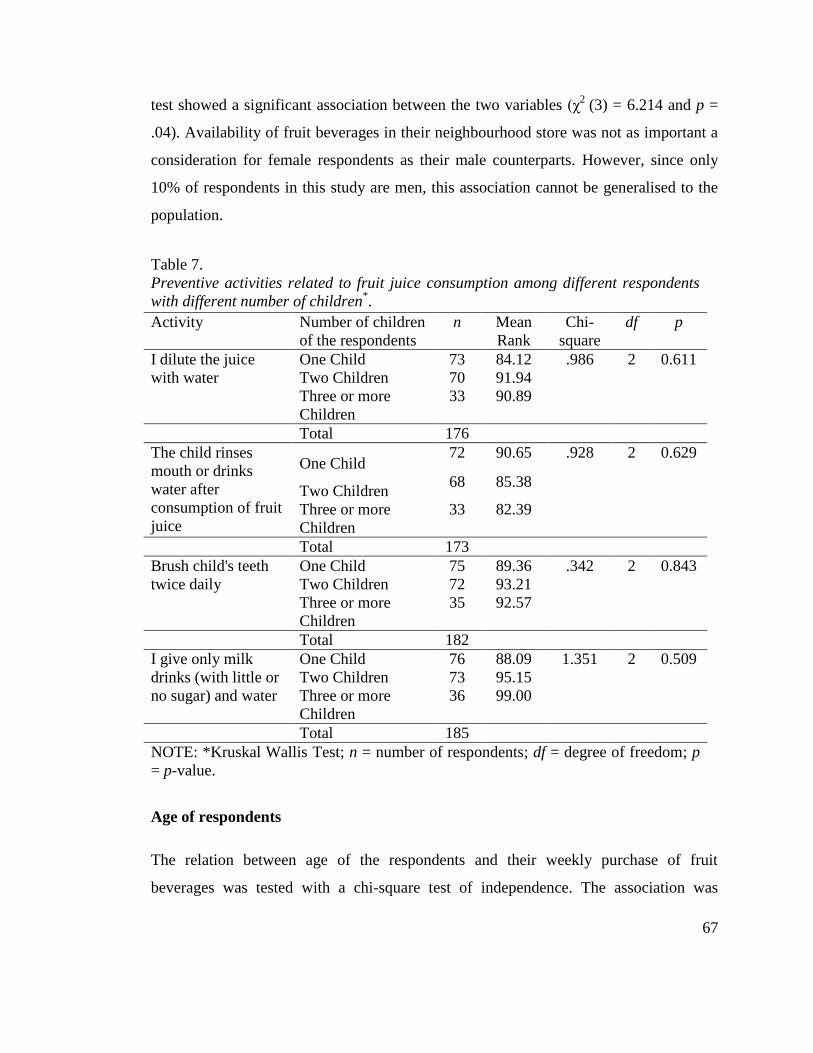
67
test showed a significant association between the two variables (χ2
(3) = 6.214 and p =
.04). Availability of fruit beverages in their neighbourhood store was not as important a
consideration for female respondents as their male counterparts. However, since only
10% of respondents in this study are men, this association cannot be generalised to the
population.
Table 7. Preventive activities related to fruit juice consumption among different respondents with different number of children
Table 7.
Preventive activities related to fruit juice consumption among different respondents
with different number of children*.
Activity Number of children
of the respondents
n Mean
Rank
Chi-
square
df p
I dilute the juice
with water
One Child 73 84.12 .986 2 0.611
Two Children 70 91.94
Three or more
Children
33 90.89
Total 176
The child rinses
mouth or drinks
water after
consumption of fruit
juice
One Child 72 90.65 .928 2 0.629
Two Children 68 85.38
Three or more
Children
33 82.39
Total 173
Brush child's teeth
twice daily
One Child 75 89.36 .342 2 0.843
Two Children 72 93.21
Three or more
Children
35 92.57
Total 182
I give only milk
drinks (with little or
no sugar) and water
One Child 76 88.09 1.351 2 0.509
Two Children 73 95.15
Three or more
Children
36 99.00
Total 185
NOTE: *Kruskal Wallis Test; n = number of respondents; df = degree of freedom; p
= p-value.
Age of respondents
The relation between age of the respondents and their weekly purchase of fruit
beverages was tested with a chi-square test of independence. The association was
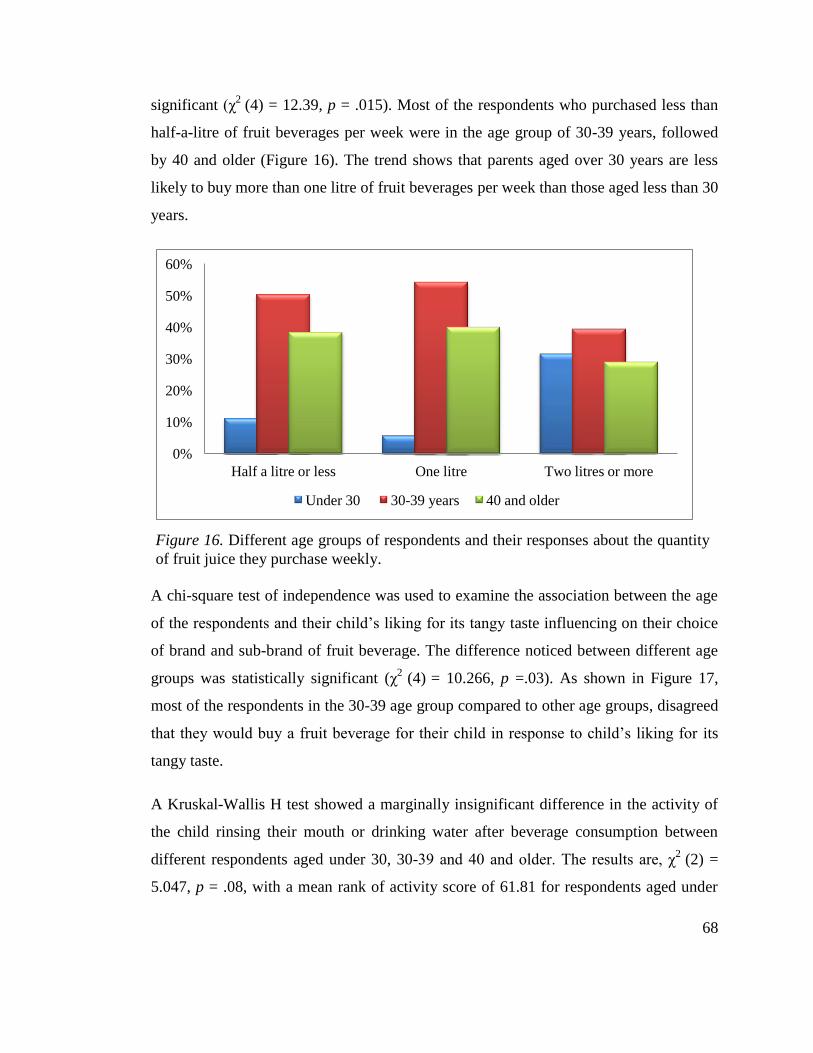
68
significant (χ2
(4) = 12.39, p = .015). Most of the respondents who purchased less than
half-a-litre of fruit beverages per week were in the age group of 30-39 years, followed
by 40 and older (Figure 16). The trend shows that parents aged over 30 years are less
likely to buy more than one litre of fruit beverages per week than those aged less than 30
years.
Figure 16. Different age groups of respondents and their responses about the quantity of fruit juice they purchase weekly
A chi-square test of independence was used to examine the association between the age
of the respondents and their child’s liking for its tangy taste influencing on their choice
of brand and sub-brand of fruit beverage. The difference noticed between different age
groups was statistically significant (χ2
(4) = 10.266, p =.03). As shown in Figure 17,
most of the respondents in the 30-39 age group compared to other age groups, disagreed
that they would buy a fruit beverage for their child in response to child’s liking for its
tangy taste.
A Kruskal-Wallis H test showed a marginally insignificant difference in the activity of
the child rinsing their mouth or drinking water after beverage consumption between
different respondents aged under 30, 30-39 and 40 and older. The results are, χ2
(2) =
5.047, p = .08, with a mean rank of activity score of 61.81 for respondents aged under
0%
10%
20%
30%
40%
50%
60%
Half a litre or less One litre Two litres or more
Under 30 30-39 years 40 and older
Figure 16. Different age groups of respondents and their responses about the quantity
of fruit juice they purchase weekly.
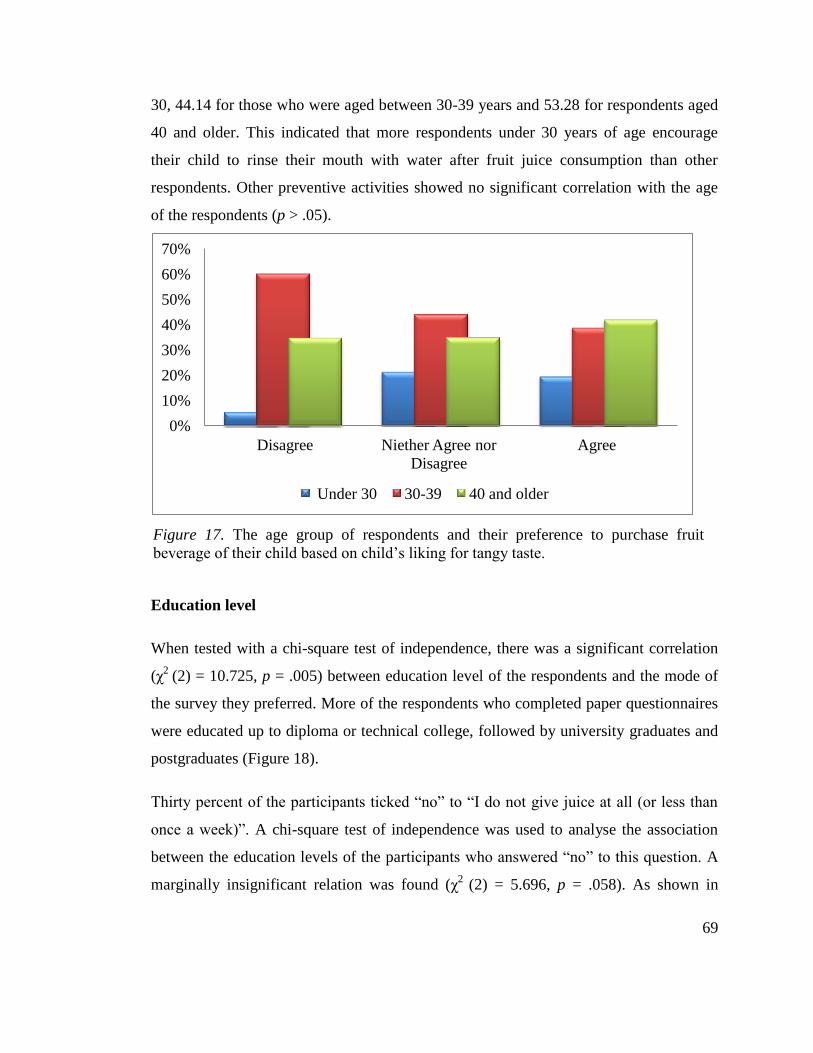
69
30, 44.14 for those who were aged between 30-39 years and 53.28 for respondents aged
40 and older. This indicated that more respondents under 30 years of age encourage
their child to rinse their mouth with water after fruit juice consumption than other
respondents. Other preventive activities showed no significant correlation with the age
of the respondents (p > .05).
Figure 17. The age group of respondents and their preference to purchase fruit beverage of their child based on child’s liking for tangy taste
Education level
When tested with a chi-square test of independence, there was a significant correlation
(χ2
(2) = 10.725, p = .005) between education level of the respondents and the mode of
the survey they preferred. More of the respondents who completed paper questionnaires
were educated up to diploma or technical college, followed by university graduates and
postgraduates (Figure 18).
Thirty percent of the participants ticked “no” to “I do not give juice at all (or less than
once a week)”. A chi-square test of independence was used to analyse the association
between the education levels of the participants who answered “no” to this question. A
marginally insignificant relation was found (χ2
(2) = 5.696, p = .058). As shown in
0%
10%
20%
30%
40%
50%
60%
70%
Disagree Niether Agree nor
Disagree
Agree
Under 30 30-39 40 and older
Figure 17. The age group of respondents and their preference to purchase fruit
beverage of their child based on child’s liking for tangy taste.
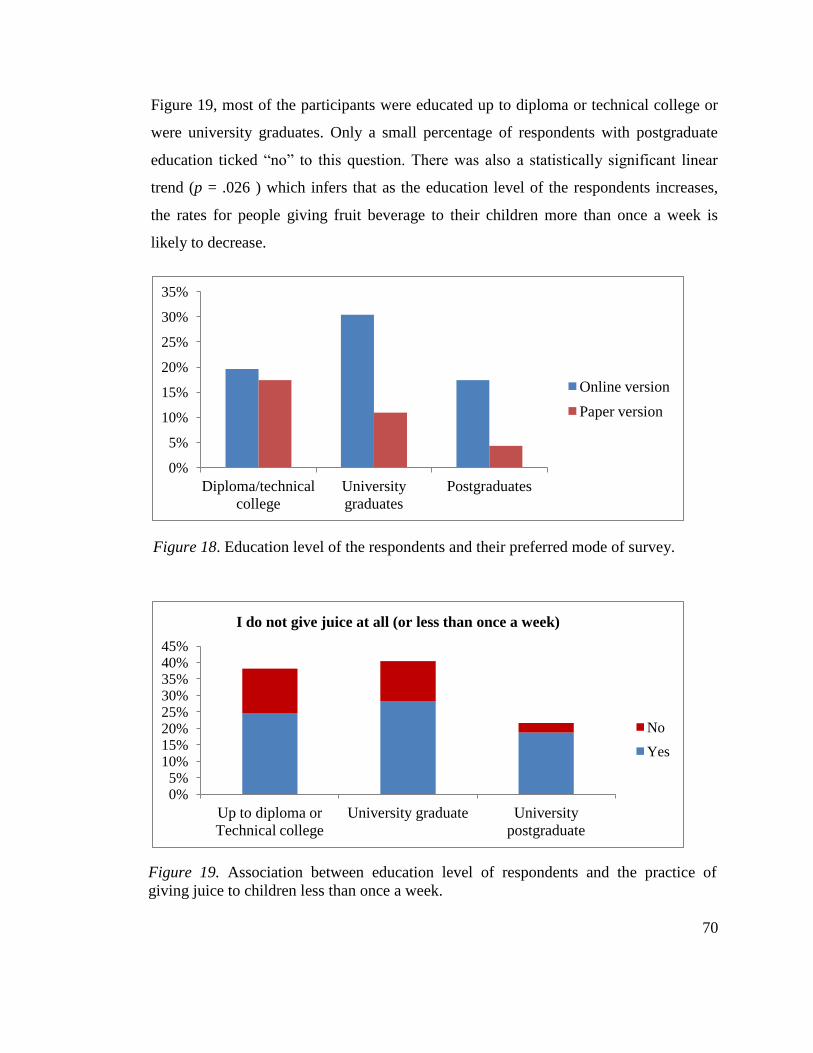
70
Figure 19, most of the participants were educated up to diploma or technical college or
were university graduates. Only a small percentage of respondents with postgraduate
education ticked “no” to this question. There was also a statistically significant linear
trend (p = .026 ) which infers that as the education level of the respondents increases,
the rates for people giving fruit beverage to their children more than once a week is
likely to decrease.
Figure 18. Education level of the respondents and their preferred mode of survey
Figure 19. Association between education level of respondents and the practice of giving juice to children less than once a week.
0%
5%
10%
15%
20%
25%
30%
35%
Diploma/technical
college
University
graduates
Postgraduates
Online version
Paper version
0% 5%
10% 15% 20% 25% 30% 35% 40% 45%
Up to diploma or
Technical college
University graduate University
postgraduate
I do not give juice at all (or less than once a week)
No
Yes
Figure 18. Education level of the respondents and their preferred mode of survey.
Figure 19. Association between education level of respondents and the practice of
giving juice to children less than once a week.
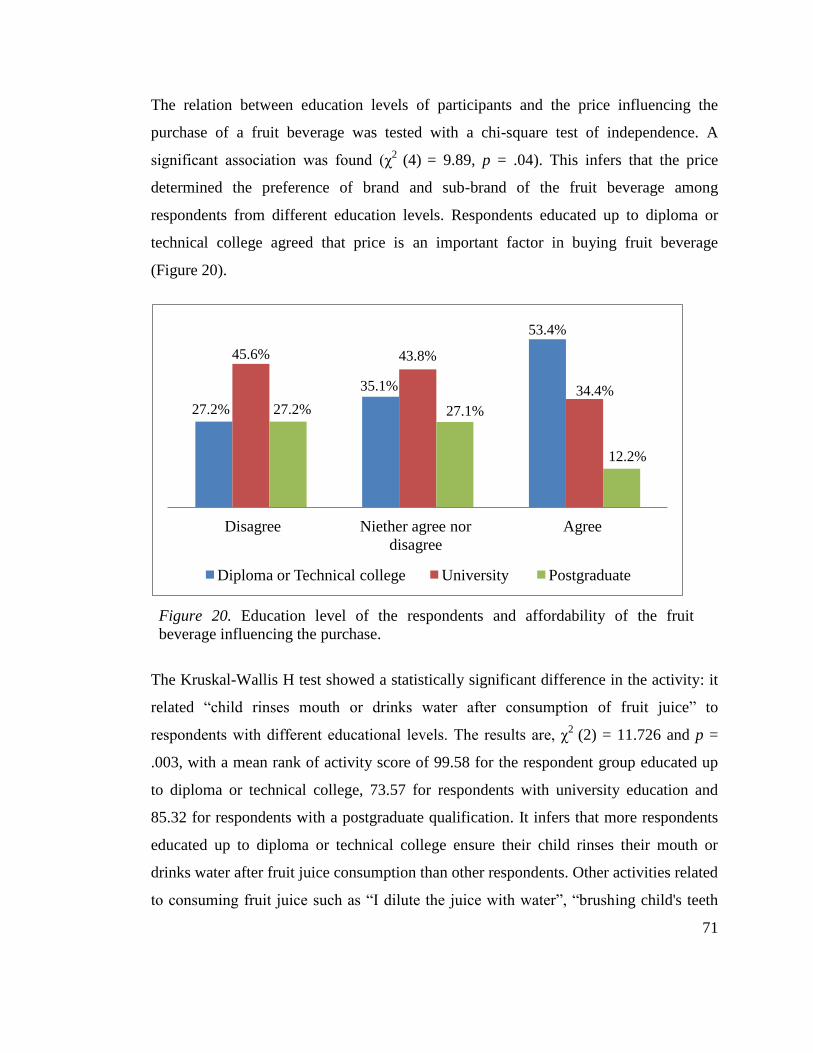
71
The relation between education levels of participants and the price influencing the
purchase of a fruit beverage was tested with a chi-square test of independence. A
significant association was found (χ2
(4) = 9.89, p = .04). This infers that the price
determined the preference of brand and sub-brand of the fruit beverage among
respondents from different education levels. Respondents educated up to diploma or
technical college agreed that price is an important factor in buying fruit beverage
(Figure 20).
Figure 20. Education level of the respondents and affordability of the fruit beverage influencing the purchase
The Kruskal-Wallis H test showed a statistically significant difference in the activity: it
related “child rinses mouth or drinks water after consumption of fruit juice” to
respondents with different educational levels. The results are, χ2
(2) = 11.726 and p =
.003, with a mean rank of activity score of 99.58 for the respondent group educated up
to diploma or technical college, 73.57 for respondents with university education and
85.32 for respondents with a postgraduate qualification. It infers that more respondents
educated up to diploma or technical college ensure their child rinses their mouth or
drinks water after fruit juice consumption than other respondents. Other activities related
to consuming fruit juice such as “I dilute the juice with water”, “brushing child's teeth
27.2%
35.1%
53.4%
45.6% 43.8%
34.4%
27.2% 27.1%
12.2%
Disagree Niether agree nor
disagree
Agree
Diploma or Technical college University Postgraduate
Figure 20. Education level of the respondents and affordability of the fruit
beverage influencing the purchase.
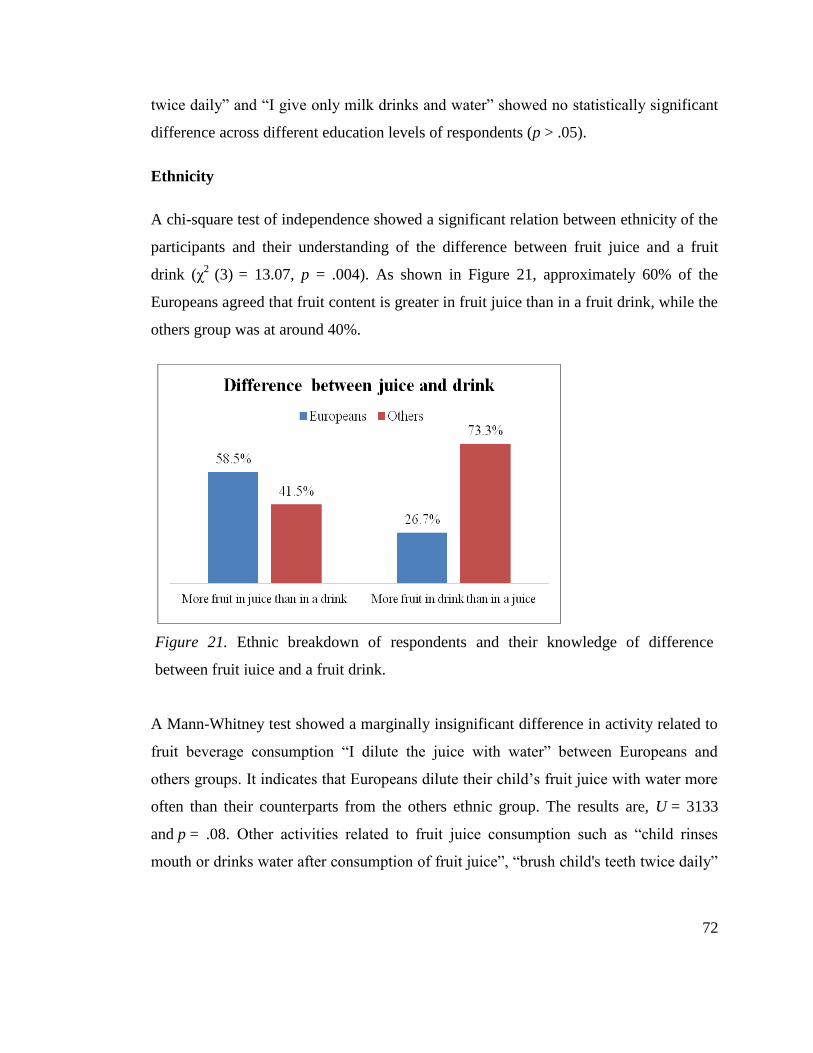
72
twice daily” and “I give only milk drinks and water” showed no statistically significant
difference across different education levels of respondents (p > .05).
Ethnicity
A chi-square test of independence showed a significant relation between ethnicity of the
participants and their understanding of the difference between fruit juice and a fruit
drink (χ2
(3) = 13.07, p = .004). As shown in Figure 21, approximately 60% of the
Europeans agreed that fruit content is greater in fruit juice than in a fruit drink, while the
others group was at around 40%.
Figure 21. Ethnic breakdown of respondents and their knowledge of difference between fruit juice and a fruit drink
A Mann-Whitney test showed a marginally insignificant difference in activity related to
fruit beverage consumption “I dilute the juice with water” between Europeans and
others groups. It indicates that Europeans dilute their child’s fruit juice with water more
often than their counterparts from the others ethnic group. The results are, U = 3133
and p = .08. Other activities related to fruit juice consumption such as “child rinses
mouth or drinks water after consumption of fruit juice”, “brush child's teeth twice daily”
Figure 21. Ethnic breakdown of respondents and their knowledge of difference
between fruit juice and a fruit drink.
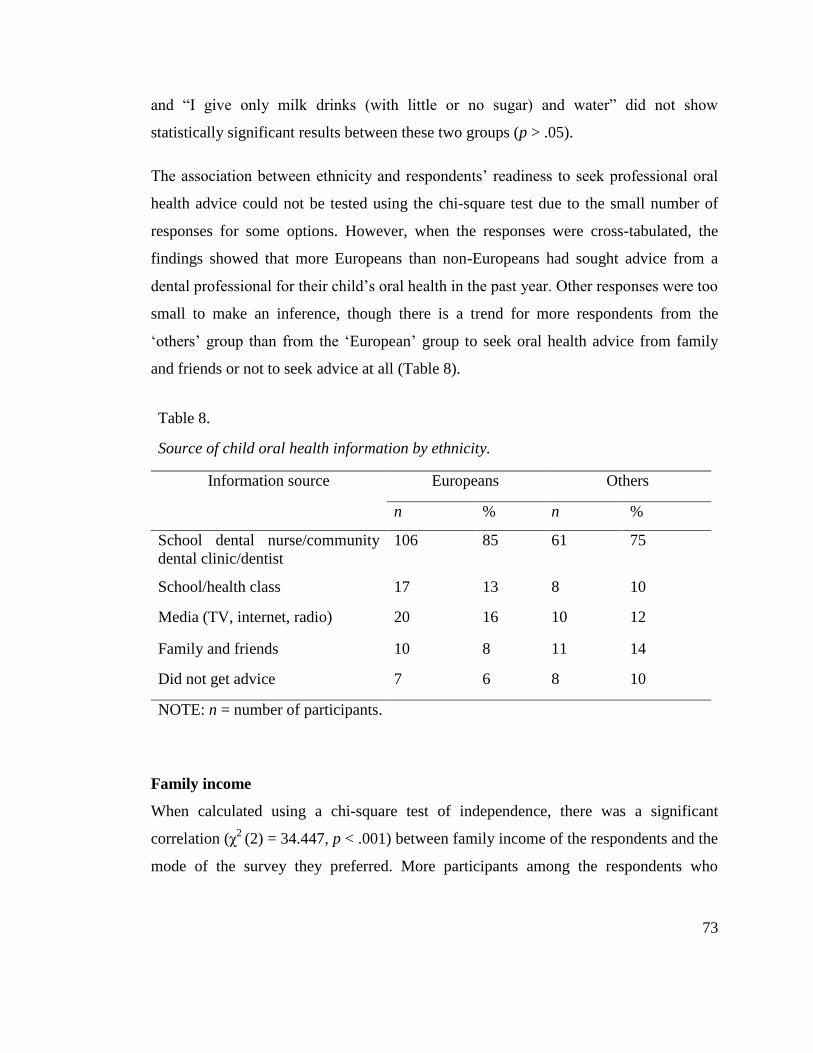
73
and “I give only milk drinks (with little or no sugar) and water” did not show
statistically significant results between these two groups (p > .05).
The association between ethnicity and respondents’ readiness to seek professional oral
health advice could not be tested using the chi-square test due to the small number of
responses for some options. However, when the responses were cross-tabulated, the
findings showed that more Europeans than non-Europeans had sought advice from a
dental professional for their child’s oral health in the past year. Other responses were too
small to make an inference, though there is a trend for more respondents from the
‘others’ group than from the ‘European’ group to seek oral health advice from family
and friends or not to seek advice at all (Table 8).
Table 8. Source of child oral health information by ethnicity
Table 8.
Source of child oral health information by ethnicity.
Information source Europeans Others
n % n %
School dental nurse/community
dental clinic/dentist
106 85 61 75
School/health class 17 13 8 10
Media (TV, internet, radio) 20 16 10 12
Family and friends 10 8 11 14
Did not get advice 7 6 8 10
NOTE: n = number of participants.
Family income
When calculated using a chi-square test of independence, there was a significant
correlation (χ2
(2) = 34.447, p < .001) between family income of the respondents and the
mode of the survey they preferred. More participants among the respondents who
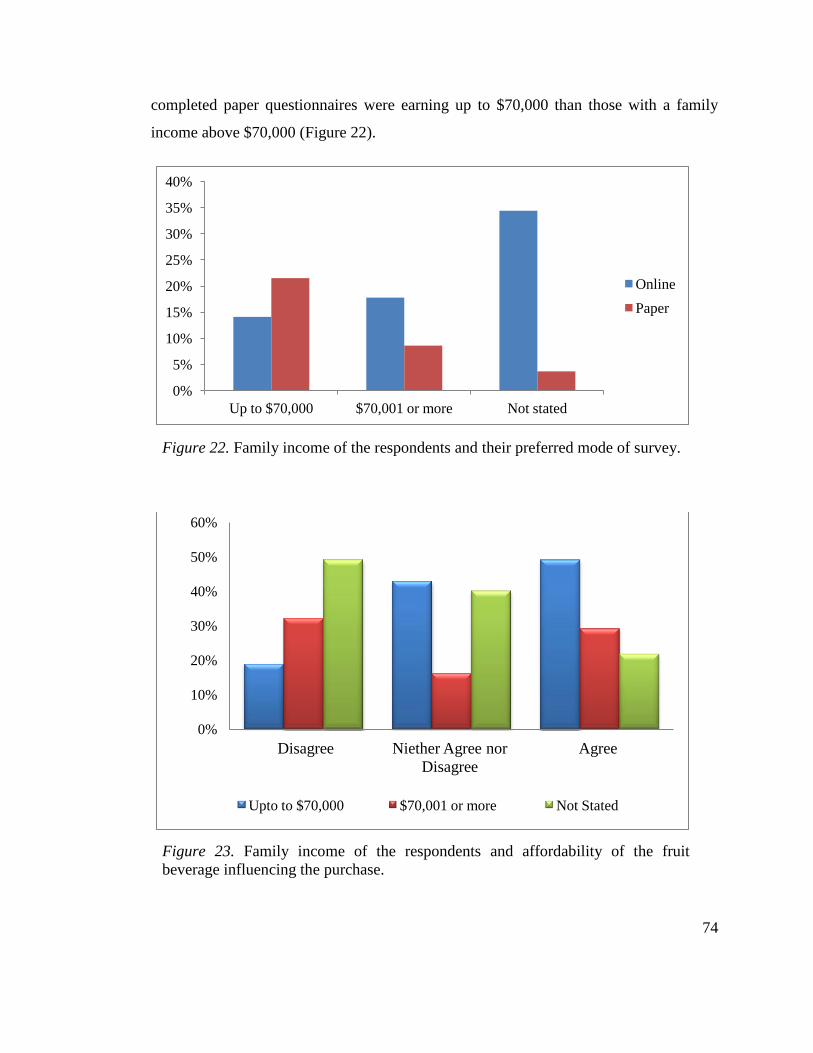
74
completed paper questionnaires were earning up to $70,000 than those with a family
income above $70,000 (Figure 22).
Figure 22. Family income of the respondents and their preferred mode of survey
Figure 23. Family income of the respondents and affordability of the fruit beverage influencing the purchase
0%
5%
10%
15%
20%
25%
30%
35%
40%
Up to $70,000 $70,001 or more Not stated
Online
Paper
0%
10%
20%
30%
40%
50%
60%
Disagree Niether Agree nor
Disagree
Agree
Upto to $70,000 $70,001 or more Not Stated
Figure 23. Family income of the respondents and affordability of the fruit
beverage influencing the purchase.
Figure 22. Family income of the respondents and their preferred mode of survey.
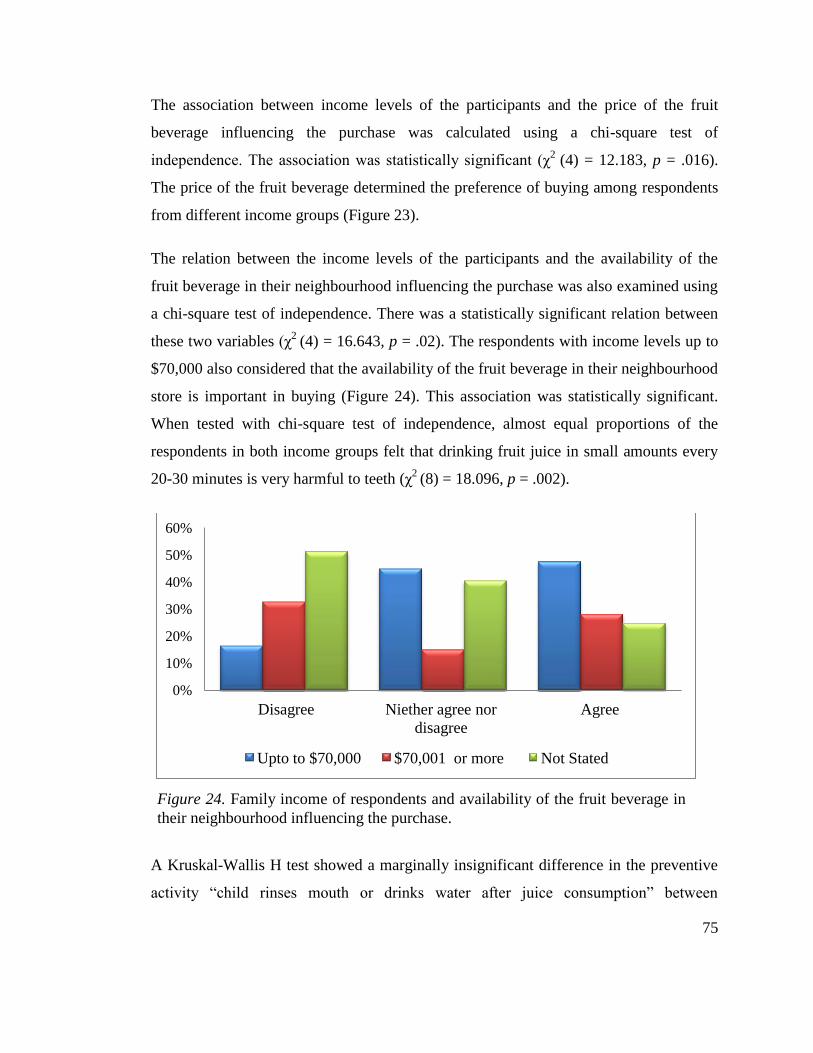
75
The association between income levels of the participants and the price of the fruit
beverage influencing the purchase was calculated using a chi-square test of
independence. The association was statistically significant (χ2
(4) = 12.183, p = .016).
The price of the fruit beverage determined the preference of buying among respondents
from different income groups (Figure 23).
The relation between the income levels of the participants and the availability of the
fruit beverage in their neighbourhood influencing the purchase was also examined using
a chi-square test of independence. There was a statistically significant relation between
these two variables (χ2
(4) = 16.643, p = .02). The respondents with income levels up to
$70,000 also considered that the availability of the fruit beverage in their neighbourhood
store is important in buying (Figure 24). This association was statistically significant.
When tested with chi-square test of independence, almost equal proportions of the
respondents in both income groups felt that drinking fruit juice in small amounts every
20-30 minutes is very harmful to teeth (χ2
(8) = 18.096, p = .002).
Figure 24. Family income of respondents and availability of the fruit beverage in their neighbourhood influencing the purchase
A Kruskal-Wallis H test showed a marginally insignificant difference in the preventive
activity “child rinses mouth or drinks water after juice consumption” between
0%
10%
20%
30%
40%
50%
60%
Disagree Niether agree nor
disagree
Agree
Upto to $70,000 $70,001 or more Not Stated
Figure 24. Family income of respondents and availability of the fruit beverage in
their neighbourhood influencing the purchase.
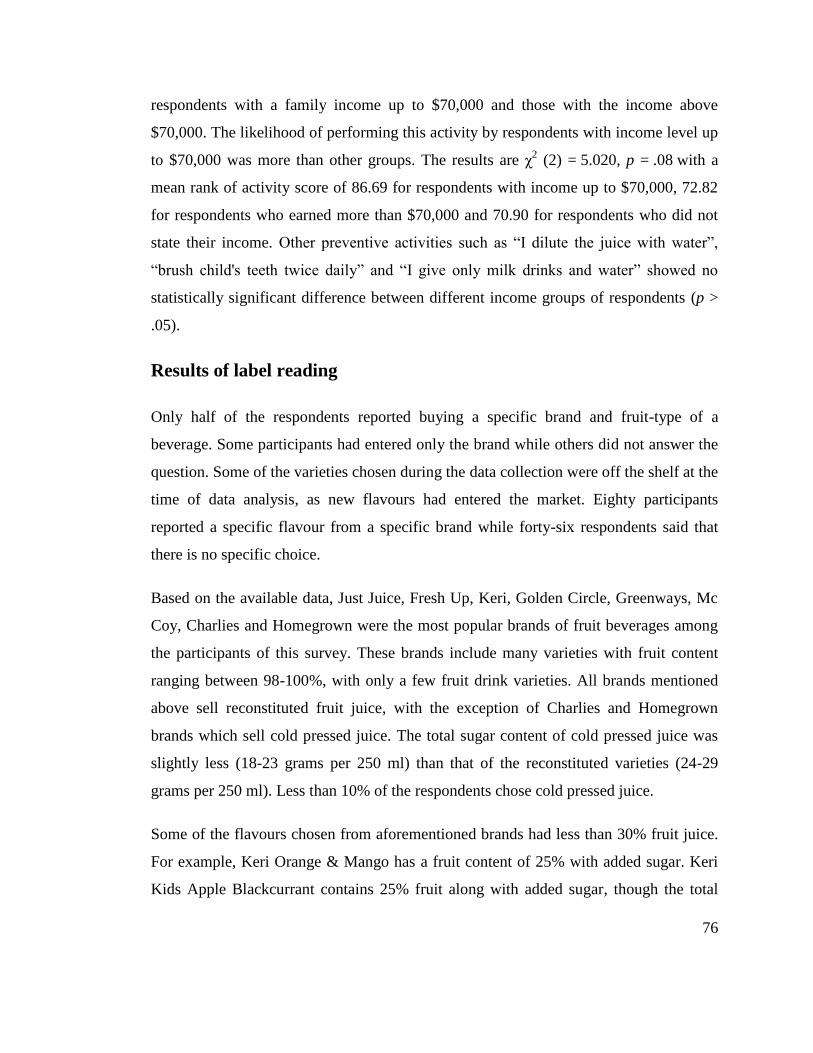
76
respondents with a family income up to $70,000 and those with the income above
$70,000. The likelihood of performing this activity by respondents with income level up
to $70,000 was more than other groups. The results are χ2 (2) = 5.020, p = .08 with a
mean rank of activity score of 86.69 for respondents with income up to $70,000, 72.82
for respondents who earned more than $70,000 and 70.90 for respondents who did not
state their income. Other preventive activities such as “I dilute the juice with water”,
“brush child's teeth twice daily” and “I give only milk drinks and water” showed no
statistically significant difference between different income groups of respondents (p >
.05).
Results of label reading
Only half of the respondents reported buying a specific brand and fruit-type of a
beverage. Some participants had entered only the brand while others did not answer the
question. Some of the varieties chosen during the data collection were off the shelf at the
time of data analysis, as new flavours had entered the market. Eighty participants
reported a specific flavour from a specific brand while forty-six respondents said that
there is no specific choice.
Based on the available data, Just Juice, Fresh Up, Keri, Golden Circle, Greenways, Mc
Coy, Charlies and Homegrown were the most popular brands of fruit beverages among
the participants of this survey. These brands include many varieties with fruit content
ranging between 98-100%, with only a few fruit drink varieties. All brands mentioned
above sell reconstituted fruit juice, with the exception of Charlies and Homegrown
brands which sell cold pressed juice. The total sugar content of cold pressed juice was
slightly less (18-23 grams per 250 ml) than that of the reconstituted varieties (24-29
grams per 250 ml). Less than 10% of the respondents chose cold pressed juice.
Some of the flavours chosen from aforementioned brands had less than 30% fruit juice.
For example, Keri Orange & Mango has a fruit content of 25% with added sugar. Keri
Kids Apple Blackcurrant contains 25% fruit along with added sugar, though the total
77
sugar content in this drink was 12.5 grams per serving. Eight participants claimed that
they buy Just Juice’s ‘50% Less Sugar’ variety, which is a combination of 50%
reconstituted fruit juice and stevia. Only two respondents claimed that they buy Just
Juice Veges, which is a combination of fruits and vegetables. Total sugar content of this
juice was 19 grams per serving.
It was noted that the same brands that sell fruit juices also sell fruit drink varieties under
the same names as the juice varieties; fruit drink varieties were slightly cheaper. Buyers
who fail to notice the front-of-pack labels or those who do not know the difference
between a fruit drink and a fruit juice can easily fail to understand the fruit content
present in the beverage. Since around half of the respondents of this survey did not
know the difference between a fruit juice and a fruit drink, it is difficult to conclude that
participants who opted for these brands chose pure juice only.
Some participants chose Ribena, Homebrand, and Thextons, which sell fruit drinks only
with reconstituted fruit juice ranging between 5 and 35%. The total sugar content
however was equal or higher than that of pure juice varieties, implying that they had a
significant amount of added sugar. It can be concluded from these findings that
participants who selected these beverages chose only fruit drinks for their children.
Summary
The study was hypothesis generating and exploratory in nature, so most of the data
analysed were descriptive in format and were expressed in frequencies and percentages.
Bivariate analysis using Kruskal-Wallis H tests, a Mann Whitney test and a chi-square
test were done for various demographic variables and activities related to children’s fruit
juice consumption. The overview of the findings depicts that the majority of the
participants were European women aged above thirty years with university education
who earned a family income above the median level. Fewer participants from other
groups consented to complete the survey despite sufficient recruitment efforts.
78
Gender, income, education and age group of the respondents had some influence on the
purchase of fruit beverages, but there was no significant association noticed for the
dental health-related activities with these covariates except for activities like diluting the
juice with water and encouraging children to rinse their mouth. Overall, the awareness
level appears to be reasonable, particularly in the European group. However, based on
the label reading, it is difficult to make an assumption that the respondents who wanted
to make healthier choice for their children did so, due to ambiguity in the types of
products available in the market.
79
Chapter 7: Discussion
Introduction
This study has examined the awareness level of parents and caregivers about the effects
of store-bought fruit-based drinks on their children’s oral health. This chapter focuses on
analytical discussion regarding the implications of the findings of this study. The
information collected from the participants of the survey about their knowledge,
behaviour and practices pertaining to their children’s fruit beverage consumption was
analysed and compared with their demographic characteristics. The research questions
were:
What is the awareness level of parents and guardians regarding the effects of
commercial fruit beverages on their children’s teeth?
Does the awareness level vary according to education levels, age groups, ethnicity
and socioeconomic status of parents?
What are the factors that influence their selection of fruit beverages?
The strengths and limitations of this study are made explicit in the beginning of the
chapter.
Strengths
The seed of the idea for this research came from observations from dental clinics and
existing literature, wherein there was evidence of increased consumption of fruit juice
among pre-schoolers. It is also known from previous studies that the pH of commercial
fruit beverages is more acidic, thereby making the oral cavity more conducive to dental
caries and erosion while affecting the strength of the dental fillings as well. Threading
these observations, the research questions were designed for an exploratory study
80
seeking to assess the awareness level of parents and caregivers of the children of the
Auckland region. The strengths of this study are discussed as follows:
Study objective
To the best of my knowledge this is the first study in New Zealand which has
investigated the knowledge of caregivers about the dental effects specific to commercial
fruit beverages on their children. The focus of the study was to augment the oral health
promotion strategies, improve advocacy and to design a more explicit nutritional
advisory module for feeding practices in children. In this regard, the study findings have
considerable implications for further policy directions and future research. Since ECC
and erosion are multifactorial in nature, the attempt was made to gather information
from respondents about most of the factors and knowledge levels that could influence
their efforts to prevent these two common dental problems in their children.
Methodology and sample
Methodologically speaking, the cross-sectional design, self-administered, mixed mode
and anonymous nature of the survey were able to achieve the study objective and
minimise possible biases (Engel et al., 2015; Fowler Jr, 2013; Gordis, 2009). The mixed
mode design has helped to achieve the objective of including people from different
socioeconomic backgrounds. More people who participated in the online survey are
from higher socioeconomic background than lower socioeconomic background, while
the opposite was true for the paper survey. Although some participants did not state their
suburb, considering the available data it appears that the survey has covered a cross
section of the Auckland region including Great Barrier and Waiheke islands.
Although a sample size of 322 participants would have been ideal to obtain valid results
in “stringent conditions” (5% accepted margin of error and 95% CI), a sample of 206
respondents is acceptable in “liberal conditions” (6.35% margin of error and 90% CI)
(Nulty, 2008, p. 310). Only one of the responses obtained for this study was unusable,
which implies that the questionnaire was comprehensible and acceptable for the
81
participants who had an interest in the topic. Since the participants were the parents and
caregivers who directly controlled the feeding practices of children aged between 1- 10
years and the questions were directed at the current practices followed by them, it is
unlikely that there is any recall bias in the responses.
Validity
A majority of respondents in this survey are European women from higher
socioeconomic background in the age group of 30-39 years, however the external
validity of the study findings is considerable since biases were controlled and
respondents were representative of the population from where they were selected.
According to the 2013 Census, the median age of Aucklanders is 35.1 years and there
are 40,563 more females than males (Auckland Council, 2014). Since women are the
primary caregivers of children in general (Savage et al., 2007), it is natural that more
mothers responded than their male counterparts. The mean age of the children in this
study shows that it has targeted the right population because that age is the most
vulnerable age range for common childhood dental problems (Lee & Lee, 2006; Rugg-
Gunn & Nunn, 1999). The percentage of university graduates and postgraduates living
in Auckland is higher than the national average and the rates are even higher for women
(Auckland Council, 2014).
Limitations
The findings and implications of this study should be considered with following
limitations:
Methodology and response rate
While a self-selection sampling method gives randomness to the sample, it is often
associated with non-response bias (Engel et al., 2015; Fowler Jr, 2013). Though it is not
possible to draw a concrete conclusion about the awareness level of non-respondents, it
possibly implies that the survey topic was less salient to non-respondents (Cook, Heath,
82
& Thompson, 2000). Since no contact information of the respondents was available to
the research team due to the anonymous nature of the survey, sending reminders
depended solely on compliance of the staff of institutions in the sampling frame. An
accurate response rate for this study cannot be obtained because the total number of
potential respondents who received the invitation is not known.
Although the centres were selected according to the representativeness of participants
for ethnicity and geographic location, Māori and Pacific centres were less interested in
becoming involved in the research. Those who agreed found it challenging to remind
their clients to participate in the survey. A stratified random sampling would have
helped to draw a more representative sample, particularly for various ethnic and income
groups.
Sample characteristics
Though the sampling frame included Plunket clinics, primary schools and ECE centres,
response rate was very low during the initial stages of recruitment when only Plunket
clinics were approached. In addition, the willingness of institutions to become the
intermediaries between the researcher and study population was also crucial for reaching
the potential participants. Most of the primary schools did not agree to be involved in
the recruitment of samples. Rate of response was higher when more ECE centres were
approached. Availability of contact details for the coordinators of ECE centres on the
‘Education Counts’ website made it easier to directly approach them and seek support. It
should be noted that for paper questionnaires only ECE centres were included, as most
of them agreed to take responsibility to oversee distribution and collection of
questionnaires. Therefore, most of the participants recruited for this study are from ECE
centres.
According to the New Zealand Childcare Survey 2009, fewer children from ‘Māori-
only’ and ‘Pacific-only’ families than European and ‘European/Māori’ families attend
formal care (Statistics New Zealand, 2010). This could be a reason for the smaller
83
number of Māori and Pacific respondents in this study. Since cost of the formal care was
one of the factors pointed out in the Childcare Survey, this deters many low-income
parents sending their children to ECE centres. Consequently, study participants are from
higher income groups.
Due to the small number of male participants in this study, the findings related to gender
of respondents cannot be extrapolated to the male population of Auckland. As noted in
Chapter Five, participants were re-grouped (as the responses in various categories were
too small) in order to draw meaningful inferences, so the inferences drawn from these
mixed groups should be considered with caution.
Questionnaire
The questionnaire was a mixed type, consisting predominantly of closed-ended
questions with multiple choices and Likert scale, having ordinal and interval scales.
Though these questions were framed to answer the research questions of the study, the
questionnaire was not validated for content, criteria and construct types. Some of the
responses may not reflect current practices of the respondents because of the non-
validated questions. The ordinal scales with only endpoints labelled in some questions
might have affected the reliability of the responses, since scaling is subjective and may
differ at different points of time when the same question is asked (Engel et al., 2015).
Like other self-reported studies (National Research Bureau, 2008), this study is not
immune to possible inherent non-sampling error; this might limit the external and
internal validity of the findings.
The study used the label-reading method in addition to collecting subjective response
about the awareness level, with an aim to control response bias. Since label-reading is a
small part of this research and there is a large presence of several brands and types of
fruit beverages in the market, participants could not be probed more in a fifteen-minute
oral health survey. Less than 50% of the respondents stated their preferred brand and
flavour of fruit beverage whereas other participants said there was no specific choice or
84
did not answer the question. A few sub-brands were off the shelf due to the time gap
between the survey and label-reading.
Study findings
There are several studies and a number of health promotion activities and advocacy
efforts addressing the dental effects of carbonated soft drinks (Beaglehole, 2014;
Gambon et al., 2012). This study explored the knowledge of parents and caregivers
about the dental effects of commercial fruit-based drinks on their children. The main
findings of this study indicate that the overall awareness level of parents and caregivers
in the Auckland region is good. Since a majority of the respondents of this study were
European women from higher socioeconomic background, the findings can be
extrapolated to the wider European community in this region.
Purchase and consumption of commercial fruit beverages
The consumption patterns of fruit beverages by respondents or their children can be
tracked by the quantity they purchase in their weekly shopping. A majority of the study
participants purchased less than half a litre of fruit beverages on weekly basis. A major
proportion of those who bought less than half a litre were aged between 30-39 years.
Average purchase of fruit beverages, however, is not comparable with the sales data of
New Zealand (as discussed in Chapter Two and Three). Some researchers (Eyles, Jiang,
& Mhurchu, 2010; Hamilton, Mhurchu, & Priest, 2007) have also suggested the use of
supermarket sales data to analyse the food purchasing behaviour of people in order to
reduce possible reporting bias. This approach appears to be a promising way to estimate
household purchase of food and drinks with minimal participant burden and possible
recall and reporting biases. However, it is not immune to inaccuracies since not
everybody will purchase fruit beverages only from supermarkets. This method can only
supplement the traditional methods of data collection.
In the present study, though the proportion of the fruit beverages consumed by children
is less than amounts consumed by respondents’ partners, respondents themselves and
85
guests, the difference is small. Increased juice consumption in children is linked to their
parents’ and caregivers’ consumption levels (Health Promotion Agency, 2014). More
research is needed to find out which age group is drinking more juice.
This study shows that children drink juice more frequently over the weekends than
weekdays, with only a few parents and caregivers putting a juice box in their child’s
school lunch box. This may be an indication that the school policies such as ‘traffic light
system’, ‘water-only schools’ and ‘Fuelled4life’ are yielding success in reducing sugar
intakes of students at schools and ECE centres ("2016: The year of the water-only
school?," 2016, March 21; Heart Foundation, 2012; Waitemata District Health Board,
n.d.). Following the Voluntary Schools Beverage agreement with the New Zealand
government, Coca-Cola and Frucor brands “have seen the removal of an estimated
52.8kgs of sugar from the diet of every kid since its introduction in 2009” (Frucor, 2014,
para.1). In this regard, improving parental awareness and oral health literacy level could
be the next focus in order to reduce fruit juice consumption of children over weekends.
Parents and caregivers also need to know how their fruit beverage consumption
influences their children’s consumption.
Parental knowledge about commercial fruit beverages
Most of the study participants did not believe that the fruit beverages sold in
supermarkets contained a lot of fruit. Most of them also knew that the fruit beverage can
cause harm to teeth through its sugar content and acidity. However, it is evident from
the findings that the difference between the terms ‘fruit juice’ and ‘fruit drink’ were
confusing to the respondents. Only half of the respondents knew that fruit juices contain
more fruit than fruit drinks do. More Europeans than other ethnicities knew the
difference between these two terms and it appears that the terms are often used
interchangeably. The observations can be related to label-reading capacity of the parents
and caregivers while purchasing fruit beverages. Since there are both fruit drinks and
fruit juices sold under the same brands and flavours with little difference in packaging, it
86
can be confusing for buyers unless they read labels precisely. This infers that there is a
need to promote label reading in the oral public health messages.
Factors influencing the purchase
Price of the beverage was an important factor in making a choice among lower
socioeconomic groups (low-income and education up to diploma or technical college).
This may encourage low-income people to buy fruit drink varieties because they are
cheaper options than juice varieties.
However, while there are notable national-level health promotion activities to control
sugar intakes by children (as discussed earlier in this chapter), there is a need to shift the
focus on the erosive potential of fruit beverages. For example, the traffic light beverage
guidelines do not allow the foods and drinks listed in the red group to be sold in the
school premises (Waitemata District Health Board, n.d.). But it has placed fruit juices
with 250 ml or smaller sized packages, fruit drinks up to 350 ml and artificially-
sweetened carbonated beverages up to 400 ml package size in the amber group. It means
that they can be consumed in moderation and sold in tuck shops. This suggests that
existing health promotion activities are focused primarily on the effects of sugar-
component of the drinks on general health. Furthermore, replacing sugar with artificial
sweeteners does not reduce the erosive potential of a drink (Beaglehole, 2014). It is time
to note that though the causes and pathogenesis of caries and erosion are different, the
burden of the diseases to individuals and the community is equally significant.
Child’s liking for sweet taste was the main consideration when parents selected the
brand and sub-brand of the beverage, while the child’s liking for tangy taste was least
considered, particularly in 30-to 39-year-old respondents. Price and availability of the
beverage in their neighbourhood were also other important factors recorded, especially
for lower socioeconomic groups and male respondents. A review from New Zealand
highlights the influence of neighbourhood on health status and health-behaviour of
people (Stevenson, Pearce, Blakely, Ivory, & Witten, 2009). A report of food security
87
among Pacific peoples in New Zealand discusses some issues in the rural suburbs such
as fewer healthy food and drink choices than urban suburbs. Milk is lot more expensive
than fruit drinks and foods sold in local dairies are more expensive than foods in
supermarkets (Rush, 2009).
A literature review at the global level confirms that availability of healthy foods in the
neighbourhood is one of the most important determinants for healthy eating behaviours
in children (Blanchette & Brug, 2005). The review also states that the low availability of
fresh fruits may limit exposure to these foods, which may affect children’s liking for the
taste of fruits in the future. In this regard, introducing the sweeter taste of fruit beverages
to children may lead to low preference of whole fruits. The reason for this is that
processed fruit beverages sold in the market contain added sugar and other ingredients
(Caswell, 2009), hence may taste different from whole fruits. Future oral health
promotion should make parents and caregivers aware of how preference to a particular
taste is developed in children. Developing self-efficacy and asking skills are other
recommendations made by the researchers (Blanchette & Brug, 2005; Jaeger & Bava,
2009).
Interestingly, only a quarter of the respondents bought a fruit beverage for their children
after considering its health benefits. In support of this, the recent Euromonitor report
shows that juice sales showed a small decline since 2014, particularly for reconstituted
varieties. Premiumisation within not-from-concentrate juices and smoothies was a trend
in 2015 (Euromonitor International, 2016). It may be an indication that there is
improvement in parental health awareness levels pertaining to general health, though it
is difficult to conclude that it is due to importance given to oral health specifically.
Label reading results also showed that not-from-concentrate juices and smoothies were
more expensive than reconstituted varieties. Those on low budgets may settle for
cheaper drinks. More research is needed to understand which populations consider fruit
juice healthy so that oral health promotion activities can be targeted.
88
Only a few parents and caregivers considered fruit beverages with stevia for their
children. A quarter of respondents did not know if the beverage they bought for their
children contained stevia, which may suggest that these respondents have lower health
literacy levels. Over half of the respondents did not buy a fruit beverage that contained
stevia. The main concern reported for not buying stevia-containing beverage was the
scepticism about its safety and effectiveness in children. Another major group of
respondents did not want to give any sweetened fruit beverage to their children. In
contrast to media reports discussed in Chapter Two, none of the participants in this
study reported any hypersensitivity to this sweetener. A minority of respondents were
unaware of the sweetener. Since the introduction of stevia-containing fruit beverages by
Frucor in 2012 (Frucor, 2012), many stevia-containing juice varieties from other brands
also can be seen on the supermarket shelves. It is important to increase awareness about
stevia and its benefits and limitations so that people can make an informed choice.
Although there is sufficient evidence for the health benefits and safety of stevia, the
possibility exists that people will consume more of such beverages as they perceive
them to be safer than sugary drinks. This may still be considered as training people to
like sweet foods (Beaglehole, 2014). Also, as discussed earlier in this chapter, including
stevia does not help in controlling the erosive potential of a drink.
Practice of commercial fruit beverage consumption in children
The study findings suggest that most of the respondents do not give juice to their
children at all or less than once a week. Respondents with postgraduate qualifications
were less likely to give juice to their children more than once a week when compared to
those with lower educational levels. The significant linear-by-linear association shows
that the amount of juice the respondents gave to their children was inversely related to
the education levels of the respondents. The main reasons for giving juice to children
were (a) child’s demand, and (b) health benefits of fruit juice. Only a small group (5%)
in this study gave juice to children as a soothing agent or for putting them to sleep. This
finding suggests that the oral health information given by Plunket and similar
89
organisations is effectively reaching the public (Plunket, 2016; Riches, 2015). Giving
fruit juice or any sugary drink to console a child increases the frequency of acid attack
by the drink, whereas the child going to sleep sipping juice increases the chances of
acquiring ECC (Jensdottir et al., 2006; Noble, 2006). Since a majority of the participants
in the present study obtained oral health information from dental professionals, this
could also be a contributing factor to the increased awareness. The reasons for giving
fruit beverage to their children were not associated with education, income, age or
ethnicity of the respondents.
The drinks were usually served by the respondents themselves, giving less chance for
recall bias. This also infers that respondents usually have more control over the fruit
beverage consumption of their children. Improving parental awareness may help in
reducing the fruit beverage consumption in children.
Over half of the respondents believed that availability of commercial fruit beverages
contributed to increased frequency and amount consumed by their children. Commercial
fruit-based drinks offer consistency in taste and flavour, better accessibility and longer
shelf life than home-made beverages, making it easier to drink in small amounts at short
intervals. As discussed earlier in Chapter Four, according to the 2007 New Zealand
Children’s Food and Drinks Survey, a majority of the parents and caregivers agreed that
their children drank fruit beverages more often when they were readily available in their
home. It also shows that more Māori and Pacific children than European and Asian
children had access to “other juice” varieties such as juice-from-concentrate, powder
and cordials in their home (National Research Bureau, 2008, p. 14). Only a few
respondents of the present study have reported that their children help themselves to
fruit beverages; however, availability of ready-made fruit beverages can increase the
chances of children drinking these beverages without the permission of parents or
caregivers or in their absence.
Over 80% of respondents agreed that the natural sugar present in the fruit beverages is
bad for teeth, though a small percentage neither agreed nor disagreed. However, almost
90
all of the respondents agreed that the added sugar in the fruit beverages is bad for teeth.
This is an indication of good awareness levels among the participants about natural and
artificial sugars. When respondents’ knowledge about the relationship between dental
health and fruit juice drinking behaviour was assessed, a majority of respondents rated
“drinking juice in small amounts every 20-30 minutes” as the most detrimental
behaviour whereas ‘drinking milk or water in between meals’ was considered the safest
of all activities listed. Furthermore, the order of scores for other activities also shows
reasonable awareness among the respondents. These study findings cannot be compared
with existing data due to unavailability of similar studies.
Brushing child’s teeth twice daily was the most common practice among the study
participants, performed more regularly by all demographic groups. According to the
findings of the 2009 New Zealand Oral Health Survey (Ministry of Health, 2010), only
66% of 2- to 4-year-old and 5- to 11-year-old children brushed their teeth twice daily.
The rates were notably lower for Māori children and adolescents than their non-Māori
counterparts. In the present study, giving their child only water and milk with little or no
sugar was the second most performed activity reported by the participants, followed by
diluting juice. Diluting juice was more common among European parents and caregivers
than those in the ‘others’ group, though the correlation was marginally insignificant.
Further research is needed to support this correlation.
Rinsing their mouth or drinking water after juice consumption was the least desired
activity. There was a marginally insignificant correlation between encouraging this
activity in children and the age, education and income level of parents and caregivers.
Those who were less than thirty years of age and lower socioeconomic groups were
more likely to ensure that their child rinsed their mouth or drank water after juice
consumption, compared to older and higher socioeconomic groups. Since similar
findings from other studies are not available to compare the present study findings,
further research in this area may be needed to draw a conclusion.
91
Over 80% of the respondents have sought professional oral health advice for their
children in the past twelve months. While a majority of the participants from the ‘others’
group also had a dental visit for their children, more participants from this group than
their European counterparts have sought advice from family and friends or did not seek
advice at all. Even though this result cannot be generalised to the population due to the
small number of respondents, the trend is consistent with existing literature (Health
Promotion Agency, 2015). In contrast to the study by Rothnie et al. (2012), there was no
significant correlation between the dental awareness level and practices of the
respondents in relation to their children’s fruit beverage consumption and the number of
children they had.
Label reading
Asking the respondents about their choice of beverage is likely to give less biased
information about their health literacy level than using the eye-tracking device as used
in the study by Graham and Jeffery (2011). The reason is that people may not read the
labels every time for the products that they are already familiar with.
Label reading results show that cold-pressed juices, smoothies and vegetable juice
varieties had slightly lower amounts of sugar and were more expensive than other
varieties. Evidence shows that smoothies have higher fibre content (Tiwary et al., 1997).
However most of the participants bought reconstituted fruit beverages, with only a few
opting for fresh, cold-pressed juices and raw smoothies. There were too few participants
who disclosed the brand and sub-brand of their preferred fruit beverage to find
correlation between nutrition level of the drinks and demographic characteristics of the
respondents. However, the recent report from Health Promotion Agency (2014) depicts
that children from a Māori background and whose parents or caregivers have low
education levels are more likely to drink reconstituted juice, cordials and powdered
drinks.
92
Some health-conscious respondents might have wanted to buy fruit juice for their
children for its nutritional benefits over fruit drinks. However, some brands sell both
fruit juices and fruit drinks under the same sub-brand names with little difference in
packaging. There was little difference in the total sugars displayed on the nutrition panel
when compared with 100% juice varieties, which implies that the sweetness was
adjusted by significant amounts of added sugar. Even some sub-brands developed
specially for children by these most popular brands had only 25% of reconstituted juice
and added sugar. Despite the type of the beverage being displayed with front-of-pack
labelling, people seem to be confused with the terms ‘fruit juice’ and ‘fruit drink’. Due
to this ambiguity in labelling, it is difficult to conclude that all health-conscious
respondents have bought fruit juice only.
The children, who drank mainly fruit drink varieties, must be consuming notable amount
of sugar while gaining little nutritional benefit of the fruit content of the drinks. The
reason is that all fruit drinks sold in the supermarkets had very low proportions of fruit
content in the form of reconstituted juice, ranging between 5-35% with no difference in
total sugars. For example, Ribena (a blackcurrant fruit drink), which was in the news in
2007 and 2014 for its false claims about vitamins A and C in the blackcurrant fruit, had
only 5.7% reconstituted blackcurrant juice; total sugars per serving however was 25.5
grams (APNZ, 2014, May 15; Vasagar, 2007, March 27). All fruit beverages containing
added sugar had declared the presence of sugar in the ingredient list as per the Food
Standards Australia New Zealand (2012) guidelines. However, in some drinks it was
displayed using synonyms such as sucrose, glucose, cane sugar and many more, which
can confuse those with limited health literacy levels.
Front-of-pack labelling through Health Star Rating (HSR) was launched in Australia and
New Zealand in 2014 (Brunton, 2016). It has received mixed reviews from public health
experts and customers, both for being voluntary and for glaring inconsistencies in the
system—which could be easily exploited by the food companies to advertise their
products that are less healthy (Johnston, 2016, September 9; Stanford, 2016). Before
launching its first social awareness campaign on HSR in New Zealand, the Health
93
Promotion Agency conducted a baseline measure of awareness of New Zealanders in
January 2016, which shows that only 1-3% of shoppers could recall about HSR without
any prompts. According to this study, currently HSR is a more popular and trusted mode
for making healthier food choices among Pacific people. Even in this population the
final decision on food choice is influenced mainly by the price of the item and
preferences of their family members (Brunton, 2016). The post-campaign study may
show the role of HSR in encouraging the companies to reformulate their products to
make them healthier in response to rising consumer awareness.
Graham and Jeffery (2011) argue that the location of the nutrition information displayed
on the product has a major influence on consumer use of these labels. According to the
recordings of the eye-tracking device used in their study, labels presented on the centre
of the screen were viewed more commonly by the shoppers than those printed on the
sides. The labels which are easily readable without turning or moving the products were
also commonly viewed. Similarly, the nutrition components located at the top of the
nutritional panel were viewed more often than those at the bottom. In the present study
many fruit beverages had labels on the side of the pack, while in some the font-size was
too small to read without having to bring the pack closer to the eyes. Studying the
perception of New Zealanders on structure and location of the nutrition information may
help to augment the current regulations.
Summary
This study was conducted to assess the child oral health awareness of parents and
caregivers regarding the dental effects of store-bought fruit beverages. The respondents
of the study have reasonable knowledge about the dental effects of commercial fruit
beverages. A major proportion of the respondents were European women aged above
thirty years and from higher socio-economic backgrounds, so the results can be
generalised to this population. Though gender, age, socioeconomic status and ethnicity
had some influence on the awareness level and on child oral health practices, there was
no significant association with the number of children of each respondent. Since average
94
purchase and consumption of fruit beverages in this study was not comparable with
existing data, and some components of this research were newly acquired knowledge,
there is need for further research to confirm these findings. Despite sufficient awareness,
the ambiguity in understanding of difference between fruit juices and fruit drinks in
terms of fruit contents may still lead parents and caregivers to make poor choices.
95
Chapter 8: Conclusion and Recommendations
Conclusion
Since a major proportion of the respondents were European women from the Auckland
region with university education and higher household income, it can be concluded that
this population presents with sound oral health awareness. The oral health-related
knowledge, in particular to fruit beverage consumption and preventive methods,
practised in children are also satisfactory in this group.
However, only half of the respondents knew the difference between a fruit juice and a
fruit drink. Two in ten respondents thought that a fruit drink had more fruit content than
a juice, almost two in ten thought that there is no difference, while one in ten was unsure
about the difference between the two. Some leading brands are selling both reconstituted
fruit juices and fruit drinks under the same sub-brands with little difference in
packaging. Added sugar was disguised in the list of ingredients using scientific names.
Despite distinguishing the type of the drink on the front of the packs, reconstituted fruit
juices and fruit drinks were still popular among the respondents.
There was a modest disparity in the awareness level between European and non-
European respondents in general. Understanding of the terms ‘fruit juice’ and ‘fruit
drink’, activities such as diluting the juice and seeking professional oral health advice
were higher in Europeans than non-Europeans. Children were consuming fruit
beverages more often on weekends than on weekdays. This may be because parents and
caregivers are less concerned about the health impacts of fruit beverages when school
policies were not applicable. Likewise, children might be tempted to drink juice after
seeing other family members drinking it.
96
Recommendations
Integrated approach
In a television show, broadcast in March 2015 (Kamo & Hudson), the Associate Health
Minister Peter Dunne states that the control of tooth decay does not start with
controlling sugar consumption but with cleaning teeth twice a day. However, it should
be noted that consumption of juice softens the enamel of the teeth and brushing teeth
more often will only hasten the process of enamel loss through abrasion (Noble, 2006).
This indicates that the public health burden of sugary drinks is still trivial in the political
arena. There is a need among policy-makers for a shift in this attitude.
Some public health experts in New Zealand are advocating for the imposition of ‘sugar
tax’ on sugar-sweetened beverages. The definition of sugar-sweetened beverages varies
across different countries and among different researchers (Beaglehole, 2014). In
Australia it includes reconstituted 100% fruit juices whereas in New Zealand fruit juice
is not included in SSBs because it contains mainly natural sugars (Australian National
Preventive Health Agency, 2014; Beaglehole, 2014). It should be noted that both natural
and added sugars are associated with dental caries and obesity whereas fruit juices rich
in these sugars also play a major role in tooth wear. More than half of the parents and
caregivers in the current study agreed that availability of commercial fruit beverages
increases the amount and frequency of juice consumption in children. A Herald poll
conducted in March 2016 showed 80% support for a sugar tax (Plumb, 2016, April 2).
Most nutrition health promotion activities and educational campaigns highlight the sugar
contents of the fruit beverages (Beaglehole, 2014; Heart Foundation, 2012; Waitemata
District Health Board, n.d.). It appears that these activities are mainly aimed at
controlling obesity and non-communicable diseases. This might underemphasise the
effects of erosive nature of the drinks on teeth. If health promoters keep highlighting the
97
adverse effects of sugars only, then people may drink more beverages with alternative
sweeteners. This study recommends more precise and consistent health messages.
User-friendly labelling
Taking the ambiguity in labels and packaging into account, this study recommends
clearer labelling of fruit beverages with pictorial warning signs on the front of the
package. Pictorial warnings are better than exhaustive label reading since they are more
comprehensible for individuals with limited oral health literacy. Along with HSR
symbols on the pack, a ‘happy tooth logo’ is also recommended. Happy Tooth mark was
first introduced in Switzerland in early 1980s by Toothfriendly, a non-profit
organisation (Gambon et al., 2012; Toothfriendly International, n.d.). As of 2010, 90%
of the Swiss population recognise the logo (Toothfriendly International, n.d.). It
separately measures both erosive and caries potential of a food or a beverage using
standard tests such as pH-telemetry test (Toothfriendly International, 2015). Children at
school are taught about benefits of consuming products which have tooth-friendly
labels. Now the programme is been extended to forty countries (Toothfriendly
International, n.d.). Introducing this concept in New Zealand may assist the consumers
to make better choices for their family while encouraging the food and beverage
companies to make their products more ‘tooth friendly’. Before launching this policy,
concept testing might help to understand its acceptance among New Zealanders.
Equity-focused policy actions and educational programmes
Commercial fruit beverages are readily available and accessible and their marketing
usually targets children, adolescents and low-income people (Beaglehole, 2014). This
could be controlled by restrictions on advertisements and sales and sponsorship bans on
these drinks.
Price of a drink and its availability in their neighbourhood was important for the
participants from lower socioeconomic backgrounds. It infers that in conjunction with
developing self-efficacy skills, if healthier drinks such as milk and bottled waters
98
become cheaper and more readily available than fruit drinks, people with low-income
may prefer them to fruit beverages. This can be achieved by keeping the price of
healthier drinks notably low, taking actions such as removal of GST (Goods and Service
Tax) and providing subsidies on these drinks. In many developed countries, such as
Australia and the countries of the United Kingdom, unflavoured milk beverages are
exempt from GST, which makes them markedly cheaper than in New Zealand
(Australian Taxation Office, 2016; Woodford, 2014, March 30).
While food pricing strategies and advertising strategies could help in curbing the
purchase of fruit beverages, raising parental awareness cannot be decelerated. Oral
health campaigns should make the meanings of fruit juice and fruit drink clear to the
consumers, along with an emphasis on diluting the fruit beverages of children with
water or unsweetened milk. Providing oral health information in learner-centred small
groups may encourage the underprivileged population to challenge the beliefs and
norms that are adverse to good oral health and foster empowerment.
Future research
As the first of its kind, this study has set a basic foundation to further research on dental
effects of fruit beverages. While dental caries has been a recognised public health
problem for many decades, dental erosion has often gone unrecognised, mainly due to
its slow progression and coexistence with other forms of tooth wear. Knowledge of
dental erosion is developing in recent years among clinicians and researchers in many
developed countries. However, as discussed in Chapter Two, erosion is still understated
in New Zealand and the prevalence of erosion is not known (Health Promotion Agency,
2015; Taji & Seow, 2010). Presence of dental erosion may be a risk indicator for dental
caries and unhealthy dietary habits. This study recommends inclusion of prevalence of
dental erosion in national oral health surveys in New Zealand like United Kingdom and
Iceland (Arnadottir et al., 2010; Nunn et al., 2003). It may help to assess the burden of
the disease and help to encourage people to work in collaboration to mitigate it.
99
This study encourages further research to find out the difference in the nutritional
benefits of squeezed or cold-pressed juices and from-concentrate varieties sold
commonly in New Zealand. If there is no difference in the health benefits of these two
groups, then they should be treated as any other sugary drinks. This evidence may also
encourage people to reduce consumption.
Although the reported average amount of fruit beverages purchased by most of the study
respondents is less than half litre per week, the sales records of New Zealand show that
the sale of commercial fruit beverages still remains high. My literature review illustrated
that the children of New Zealand consume more of these beverages than recommended,
with significant disparities across certain ethnic and lower socioeconomic groups.
Therefore, this study encourages further research in larger, more diverse populations in
order to understand their fruit beverage consumption patterns and the factors influencing
them. This study also encourages future studies to correlate the knowledge of parents
about the dental health effects of the fruit beverages and measure the oral health findings
in their children. This may provide conclusive evidence to the potential
interconnectedness between the knowledge of parents and caregivers, their oral health-
related practices and the oral health of their children.
100
References
2016: The year of the water-only school? (2016, March 21). New Zealand Education
Gazette, 95(5). Retrieved from http://www.edgazette.govt.nz/
Aarthi, J., Muthu, M., & Sujatha, S. (2013). Cariogenic potential of milk and infant
formulas: A systematic review. European Archives of Paediatric Dentistry, 14(5), 289-
300. doi:10.1007/s40368-013-0088-6
Aldridge, A., & Levine, K. (2001). Surveying the social world : Principles and practice
in survey research. Buckingham, England: Open University Press.
Alshehri, A., & Alshehri, F. (2015). Association between breastfeeding and dental caries
in Saudi preschool children. International Journal of Dental Science and Research, 2(2–
3), 69-74. doi:10.1016/j.ijdsr.2015.11.001
Anderson, H., Drummond, B. K., & Thomson, W. M. (2004). Changes in aspects of
children's oral‐health‐related quality of life following dental treatment under general
anaesthesia. International Journal of Paediatric Dentistry, 14(5), 317-325.
doi:10.1111/j.1365-263X.2004.00572.x
APNZ. (2014, May 15). Ribena caught out again. The New Zealand Herald. Retrieved
from http://www.nzherald.co.nz
Arnadottir, I. B., Holbrook, W. P., Eggertsson, H., Gudmundsdottir, H., Jonsson, S. H.,
Gudlaugsson, J. O., . . . Agustsdottir, H. (2010). Prevalence of dental erosion in
children: A national survey. Community Dentistry and Oral Epidemiology, 38(6), 521-
526. doi:10.1111/j.1600-0528.2010.00559.x
Auckland Council. (2014). Auckland Profile - Initial results from the 2013 Census
Retrieved from
http://www.aucklandcouncil.govt.nz/EN/planspoliciesprojects/reports/Documents/auckl
andprofileinitialresults2013census201405.pdf
101
Australian National Preventive Health Agency. (2014). Obesity: Sugar-sweetened
beverages, obesity and health. Retrieved from https://sydney.edu.au/medicine/public-
health/menzies-health-
policy/publications/Evidence_Brief_Sugar_sweetened_Beverages_Obesity_Health.PDF
Australian Taxation Office. (2016). GST food guide. Retrieved August 25, 2016, from
https://www.ato.gov.au/Business/GST/In-detail/Your-industry/Food/GST-food-
guide/?page=22
Ayers, K., Drummond, B. K., Thomson, W. M., & Kieser, J. A. (2002). Risk indicators
for tooth wear in New Zealand school children. International Dental Journal, 52(1), 41-
46. doi:10.1111/j.1875-595X.2002.tb00596.x
Ayers, K., Meldrum, A. M., Thomson, W. M., & Newton, J. T. (2006). The working
practices and job satisfaction of dental hygienists in New Zealand. Journal of Public
Health Dentistry, 66(3), 186-191. doi:10.1111/j.1752-7325.2006.tb02578.x
Ayers, K. M. S. (2009). The dental workforce in New Zealand (Doctoral thesis,
University of Otago, Dunedin, New Zealand). Retrieved from
http://hdl.handle.net/10523/4569
Bach, K., & Manton, D. J. (2014). Early childhood caries: A New Zealand perspective.
Journal of Primary Health Care, 6(2), 169-174. doi:10.1071/HC14169
Bardhan, A., Jha, C., Jaiswal, V., & Alam, F. (n.d.). Consumer decision analysis for
puchase of fruit drinks. Retrieved November 15, 2014, from
https://www.scribd.com/document/51026236/Questionnaire-on-non-carbonated-drinks
Bates, R. P., Morris, J. R., & Crandall, P. G. (2001). Defining juices. In Principles and
practices of small-and medium-scale fruit juice processing. Rome, Italy: Food &
Agriculture Organization.
102
Beaglehole, R. (2014). Sugar-sweetened beverages, obesity, diabetes and oral health: A
preventable crisis. Pacific Health Dialog, 20(1), 39-42. Retrieved from
http://pacifichealthdialog.org.fj
Beighton, D., & Bartlett, D. (2006). Dental caries and pulpitis. In R. Ireland (Ed.),
Clinical textbook of dental hygiene and therapy. Oxford, England: Blackwell
Munksgaard.
Benelam, B. (2009). Satiation, satiety and their effects on eating behaviour. Nutrition
Bulletin, 34(2), 126-173. doi:10.1111/j.1467-3010.2009.01753.x
Blanchette, L., & Brug, J. (2005). Determinants of fruit and vegetable consumption
among 6–12‐years‐old children and effective interventions to increase consumption.
Journal of Human Nutrition and Dietetics, 18(6), 431-443. doi:10.1111/j.1365-
277X.2005.00648.x
Blinkhorn, A., & Mekertichian, K. (2013). Fluoride and dental health. In A. C. Cameron
& R. P. Widmer (Eds.), Handbook of pediatric dentistry (4th ed., pp. 63-78). Edinburgh,
Scotland: Mosby/Elsevier.
Bowen, W., Pearson, S., VanWuyckhuyse, B., & Tabak, L. (1991). Influence of milk,
lactose-reduced milk, and lactose on caries in desalivated rats. Caries Research, 25(4),
283-286. doi:10.1159/000261377
Brunton, C. (2016). Health Star Rating monitoring and evaluation. Retrieved from
http://www.hpa.org.nz/sites/default/files/Health%20Star%20Rating%20Monitoring%20
and%20Evaluation.pdf
Caswell, H. (2009). The role of fruit juice in the diet: An overview. Nutrition Bulletin,
34(3), 273-288. doi:10.1111/j.1467-3010.2009.01760.x
103
Centers for Disease Control and Prevention. (2015). Epi Info (7.1.1.6) [Mobile
application software]. Retrieved March 25, 2015, from
http://www.cdc.gov/epiinfo/support/downloads.html
Çolak, H., Dülgergil, Ç. T., Dalli, M., & Hamidi, M. M. (2013). Early childhood caries
update: A review of causes, diagnoses, and treatments. Journal of Natural Science,
Biology and Medicine, 4(1), 29. doi:10.4103/0976-9668.107257
Cook, C., Heath, F., & Thompson, R. L. (2000). A meta-analysis of response rates in
web-or internet-based surveys. Educational and Psychological Measurement, 60(6),
821-836. doi:10.1177/00131640021970934
Coultzer, A., Parsons, S., & Askham, J. (2008). Where are the patients in decision
making about their own care? Retrieved from
http://www.euro.who.int/__data/assets/pdf_file/0007/73285/E93419.pdf
Crispe, I. (2014). Stevia sweetener blamed for illness. Retrieved March 31, 2015, from
http://www.3news.co.nz/nznews/stevia-sweetener-blamed-for-illness-2013050316
D'Costa, N. T. (2013, February 20). The state of the New Zealand fruit juice industry.
NZ Food Technology. Retrieved from www.foodtechnology.co.nz
Daniel, W. W., & Cross, C. L. (2013). Biostatistics : A foundation for analysis in the
health sciences. Hoboken, NJ: John Wiley & Sons.
de Slavutzky, S. M. B. (2010). Stevia and sucrose effect on plaque formation. Journal
für Verbraucherschutz und Lebensmittelsicherheit, 5(2), 213-216. doi:10.1007/s00003-
010-0555-5
Dennison, B. A., Rockwell, H. L., & Baker, S. L. (1997). Excess fruit juice consumption
by preschool-aged children is associated with short stature and obesity. Pediatrics,
99(1), 15-22. Retrieved from http://pediatrics.aappublications.org/
104
Drummond, B. K., Clarke, H. M., Maxwell-McRae, A. M., Konthasinghe, P. P., &
Thomson, W. M. (2002). Oral health knowledge of Plunket nurses in New Zealand:
Evaluation of oral health module. New Zealand Dental Journal, 98, 64-66. Retrieved
from https://www.nzda.org.nz/pub/index.php?id=93&no_cache=1
Education Counts. (2015). Find early learning services. Retrieved April 29, 2015, from
http://www.educationcounts.govt.nz
Engel, U., Jann, B., Lynn, P., Scherpenzeel, A., & Sturgis, P. (2015). Improving survey
methods: Lessons from recent research. New York, NY: Routledge.
Euromonitor International. (2014). Juice in New Zealand. Retrieved November 15,
2014, from http://www.euromonitor.com/juice-in-new-zealand/report
Euromonitor International. (2016). Juice in New Zealand. Retrieved July 15, 2016, from
http://www.euromonitor.com/juice-in-new-zealand/report
Eyles, H., Jiang, Y., & Mhurchu, C. N. (2010). Use of household supermarket sales data
to estimate nutrient intakes: A comparison with repeat 24-hour dietary recalls. Journal
of the American Dietetic Association, 110(1), 106-110. doi:10.1016/j.jada.2009.10.005
Fatima, N., Abidi, S. Y. A., Qazi, F.-U.-R., & Jat, S. A. (2013). Effect of different tetra
pack juices on microhardness of direct tooth colored-restorative materials. The Saudi
Dental Journal, 25(1), 29. doi:10.1016/j.sdentj.2012.09.002
FDI World Dental Federation. (2014). Oral health worldwide: A report by FDI World
Dental Federation. Retrieved from http://www.worldoralhealthday.com/wp-
content/uploads/2014/03/FDIWhitePaper_OralHealthWorldwide.pdf
Finucane, D. (2012). Rationale for restoration of carious primary teeth: A review.
European Archives of Paediatric Dentistry, 13(6), 281-292. doi:10.1007/BF03320828
Fluoride Action Network NZ Inc. (n.d.). Fluoride Free NZ. Retrieved September 24,
2014, from http://fluoridefree.org.nz/
105
Food Standards Australia New Zealand. (2012). Nutrition information panels. Retrieved
January 15, 2015, from
http://www.foodstandards.govt.nz/consumer/labelling/panels/Pages/default.aspx
Fowler Jr, F. J. (2013). Survey research methods. Thousand Oaks, CA: Sage
publications.
Frucor. (2012). New juice with 50% less sugar. Retrieved February 25, 2015, from
http://www.frucor.co.nz/index.php/news/stories/new_just_juice_with_50_less_sugar
Frucor. (2014). Students across the country benefit from world-leading agreement.
Retrieved August 11, 2016, from http://www.frucor.co.nz
Frucor. (2016). Nutrition. Retrieved April 10, 2016, from
http://www.frucor.co.nz/index.php/social_responsibility/nutrition/
Fung, A., & Brearley Messer, L. (2013). Tooth wear and associated risk factors in a
sample of Australian primary school children. Australian Dental Journal, 58(2), 235-
245. doi:10.1111/adj.12055
Gambon, D., Brand, H., & Veerman, E. (2012). Dental erosion in the 21st century: What
is happening to nutritional habits and lifestyle in our society? British Dental Journal,
213(2), 55-57. doi:10.1038/sj.bdj.2012.613
Glosman, A. (2011, July/August). Green your dental routine. Natural Solutions(136),
28. Retrieved from www.naturalsolutionsmag.com
Gordis, L. (2009). Epidemiology (4th ed.). Philadelphia, PA.: Saunders.
Goyal, S., & Goyal, R. (2010). Stevia (Stevia rebaudiana) a bio-sweetener: A review.
International Journal of Food Sciences and Nutrition, 61(1), 1-10.
doi:10.3109/09637480903193049
106
Graham, D. J., & Jeffery, R. W. (2011). Location, location, location: Eye-tracking
evidence that consumers preferentially view prominently positioned nutrition
information. Journal of the American Dietetic Association, 111(11), 1704-1711.
doi:10.1016/j.jada.2011.08.005
Grant, S. M., Dawson, S. K., & Thomson, W. M. (2013). New Zealand dentists' views
on community water fluoridation. New Zealand Dental Journal, 109(2), 69-73.
Retrieved from https://www.nzda.org.nz/pub/index.php?id=93&no_cache=1
Great Britain Panel on Dietary Sugars, Acheson, D., & Great Britain Department of
Health and Social Security. (1989). Dietary sugars and human disease: Report of the
Panel on Dietary Sugars. Retrieved from https://archive.org/stream/op1278066-
1001#page/n7/mode/2up
Hamilton, S., Mhurchu, C. N., & Priest, P. (2007). Food and nutrient availability in New
Zealand: An analysis of supermarket sales data. Public Health Nutrition, 10(12), 1448-
1455. doi:10.1017/S1368980007000134
Health Promotion Agency. (2014). Consumption of juice and fruit drinks among
children and their parents or caregivers. Retrieved from
http://www.hpa.org.nz/sites/default/files/In%20Fact%20Juice%20Consumption.pdf
Health Promotion Agency. (2015). A literature review on oral health in preschoolers.
Retrieved from
http://www.hpa.org.nz/sites/default/files/Literature%20review%20oral%20health.pdf
Heart Foundation. (2012). Fuelled4life: Buyer's guide. Retrieved May 4, 2016, from
http://www.fuelled4life.org.nz
Jaeger, S. R., & Bava, C. M. (2009). Fruit consumption among people living in a high
deprivation New Zealand neighbourhood. Australian and New Zealand Journal of
Public Health, 33(5), 471-476. doi:10.1111/j.1753-6405.2009.00432.x
107
Jensdottir, T., Holbrook, P., Nauntofte, B., Buchwald, C., & Bardow, A. (2006).
Immediate erosive potential of cola drinks and orange juices. Journal of Dental
Research, 85(3), 226-230. doi:10.1177/154405910608500304
Johnston, M. (2016, September 9). Researchers challenge food Health Star Ratings. The
New Zealand Herald. Retrieved from http://www.nzherald.co.nz/
Jones, R. B. (1984). The school‐based dental care systems of New Zealand and South
Australia: A decade of change. Journal of Public Health Dentistry, 44(3), 120-124.
doi:10.1111/j.1752-7325.1984.tb03062.x
Kamo, M. (Presenter), & Hudson, J. (Reporter). (2015). Bittersweet [Television series
episode]. In K. Peacock (Producer), Sunday. Auckland, New Zealand: Television New
Zealand Limited.
Kassebaum, N., Bernabé, E., Dahiya, M., Bhandari, B., Murray, C., & Marcenes, W.
(2015). Global burden of untreated caries: A systematic review and metaregression.
Journal of Dental Research, 94(5), 650-658. doi:10.1177/0022034515573272
Khazaal, Y., Van Singer, M., Chatton, A., Achab, S., Zullino, D., Rothen, S., . . .
Thorens, G. (2014). Does self-selection affect samples’ representativeness in online
surveys? An investigation in online video game research. Journal of Medical Internet
Research, 16(7), e164. doi:10.2196/jmir.2759
Lee, S. M. G., & Lee, G. T. R. (2006). Paediatric dentistry. In R. Ireland (Ed.), Clinical
textbook of dental hygiene and therapy. Oxford, England: Blackwell Munksgaard.
Maganur, P. C., Prabhakar, A. R., Satish, V., Namineni, S., & Kurthukoti, A. (2013).
Erosive effect of soft drink and fresh fruit juice on restorative materials. World Journal
of Dentistry, 4(1), 32-40. Retrieved from http://www.wjoud.com/
108
Mangueira, D. F., Sampaio, F. C., & Oliveira, A. F. (2009). Association between
socioeconomic factors and dental erosion in Brazilian schoolchildren. Journal of Public
Health Dentistry, 69(4), 254-259. doi:10.1111/j.1752-7325.2009.00131.x
Manton, D. J., & Hayes-Cameron, L. (2013). Dental caries. In A. C. Cameron & R. P.
Widmer (Eds.), Handbook of pediatric dentistry (4th ed., pp. 47-62). Edinburgh,
Scotland: Mosby/Elsevier.
Mathu-Muju, K. R., Friedman, J. W., & Nash, D. A. (2013). Oral health care for
children in countries using dental therapists in public, school-based programs, contrasted
with that of the United States, using dentists in a private practice model. American
Journal of Public Health, 103(9), e7-e13. doi:10.2105/AJPH.2013.301251
Mayr, A., Gefeller, O., Prokosch, H.-U., Pirkl, A., Fröhlich, A., & de Zwaan, M. (2012).
Web-based data collection yielded an additional response bias—but had no direct effect
on outcome scales. Journal of Clinical Epidemiology, 65(9), 970-977.
doi:10.1016/j.jclinepi.2012.03.005
McDonagh, M. S., Whiting, P. F., Wilson, P. M., Sutton, A. J., Chestnutt, I., Cooper, J.,
. . . Kleijnen, J. (2000). Systematic review of water fluoridation. British Medical
Journal, 321(7265), 855-859. doi:10.1136/bmj.321.7265.855
McKnight, P. E., McKnight, K. M., Sidani, S., & Figueredo, A. J. (2007). Missing data:
A gentle introduction. New York, NY: Guilford Press.
Millward, A., Shaw, L., & Smith, A. (1993). Dental erosion in four-year-old children
from differing socioeconomic backgrounds. ASDC Journal of Dentistry for Children,
61(4), 263-266. Retrieved from http://europepmc.org
Ministry of Health. (2003). NZ food NZ children: Key results of the 2002 National
Children's Nutrition Survey. Retrieved from
https://www.health.govt.nz/system/files/documents/publications/nzfoodnzchildren.pdf
109
Ministry of Health. (2006). Good oral health for all, for life: The strategic vision for
oral health in New Zealand. Retrieved from
http://www.health.govt.nz/system/files/documents/publications/good-oral-health-
strategic-vision-2006.pdf
Ministry of Health. (2008a). A portrait of health: Key results of the 2006/07 New
Zealand Health Survey. Retrieved from
https://www.health.govt.nz/system/files/documents/publications/portrait-of-health-
june08.pdf
Ministry of Health. (2008b). Promoting oral health: A toolkit to assist the development,
planning, implementation and evaluation of oral health promotion in New Zealand.
Retrieved from
https://www.health.govt.nz/system/files/documents/publications/promoting-oralhealth-
a-toolkit-jan08.pdf
Ministry of Health. (2010). Our oral health: Key findings of the 2009 New Zealand Oral
Health Survey. Retrieved from
http://www.health.govt.nz/system/files/documents/publications/our-oral-health-2010.pdf
Ministry of Health. (2011).
Operational guidelines for the service agreement for the provision of oral health service
s for adolescents and special dental services for children and adolescents. Retrieved
from http://www.countiesmanukau.health.nz/funded-Services/Oral-
Health/operationalguidelines-Mar11.pdf
Ministry of Health. (2012). Food and nutrition guidelines for healthy children and
young people (aged 2–18 years): A background paper. Retrieved from
https://www.health.govt.nz/system/files/documents/publications/food-nutrition-
guidelines-healthy-children-young-people-background-paper-feb15-v2.pdf
110
Ministry of Health. (2014). Annual update of key results 2013/14: New Zealand Health
Survey. Retrieved from
https://www.health.govt.nz/system/files/documents/publications/annual-update-key-
results-nzhs-2013-14-dec14-v2.pdf
Ministry of Health. (2015). Annual update of key results 2014/15: New Zealand Health
Survey. Retrieved from
http://www.health.govt.nz/system/files/documents/publications/annual-update-key-
results-2014-15-nzhs-dec15-1.pdf
Ministry of Health. (2016a). Annual report on drinking-water quality 2014-2015.
Retrieved from https://www.health.govt.nz/system/files/documents/publications/annual-
report-drinking-water-quality-2014-2015-mar16.pdf
Ministry of Health. (2016b). New Zealand Health Strategy: Future direction. Retrieved
from http://www.health.govt.nz/system/files/documents/publications/new-zealand-
health-strategy-futuredirection-2016-apr16.pdf
Moynihan, P. (2002). Dietary advice in dental practice. British Dental Journal, 193(10),
563-568. doi:10.1038/sj.bdj.4801628
Moynihan, P., & Kelly, S. (2014). Effect on caries of restricting sugars intake systematic
review to inform WHO guidelines. Journal of Dental Research, 93(1), 8-18.
doi:10.1177/0022034513508954
National Health and Medical Research Council. (2006). Nutrient reference values for
Australia and New Zealand: Executive summary. Retrieved from
https://www.nhmrc.gov.au/_files_nhmrc/publications/attachments/n36.pdf
National Research Bureau. (2008). 2007 New Zealand Children's Food and Drinks
Survey. Retrieved from http://www.hpa.org.nz/sites/default/files/CFDS-full%20report-
fnl.pdf
111
Noble, S. (2006). Diet and nutrition. In R. Ireland (Ed.), Clinical textbook of dental
hygiene and therapy. Oxford, England: Blackwell Munksgaard.
Nulty, D. D. (2008). The adequacy of response rates to online and paper surveys: What
can be done? Assessment & Evaluation in Higher Education, 33(3), 301-314.
doi:10.1080/02602930701293231
Nunn, J., Gordon, P., Morris, A., & Walker, A. (2003). Dental erosion–changing
prevalence? A review of British National childrens’ surveys. International Journal of
Paediatric Dentistry, 13(2), 98-105. doi:10.1046/j.1365-263X.2003.00433.x
NZJBA. (2013). Beverage descriptors. Retrieved from
http://www.nzjba.org.nz/myfiles/Juice_Descriptors_May_2013.pdf
O'Neil, C. E., & Nicklas, T. A. (2008). A review of the relationship between 100% fruit
juice consumption and weight in children and adolescents. American Journal of Lifestyle
Medicine, 2(4), 315-354. doi:10.1177/1559827608317277
Petersen, P. E. (2003). The World Oral Health Report 2003. Retrieved from
http://www.who.int/oral_health/media/en/orh_report03_en.pdf
Phillips, S. (2006). Oral embryology, histology and anatomy. In R. Ireland (Ed.),
Clinical textbook of dental hygiene and therapy. Oxford, England: Blackwell
Munksgaard.
Plumb, S. (2016, April 2). Medical experts push for sugar tax. The New Zealand Herald.
Retrieved from www.nzherald.co.nz
Plunket. (2016). Dental decay. Retrieved August 20, 2016, from
http://www.plunket.org.nz/your-child/1-2-years/health-and-daily-care/dental-decay/
Plutzer, K., & Spencer, A. J. (2008). Efficacy of an oral health promotion intervention in
the prevention of early childhood caries. Community Dentistry and Oral Epidemiology,
36(4), 335-346. doi:10.1111/j.1600-0528.2007.00414.x
112
Riches, J. (2015). Colgate, Plunket and the NZDA work together. Retrieved April 12,
2015, from https://www.plunket.org.nz/news-and-research/media-releases/colgate-
plunket-and-the-nzda-work-together/
Rothnie, J. J., Walsh, C. A., Wang, M. J., Morgaine, K. C., & Drummond, B. K. (2012).
An exploratory study of pregnant women's knowledge of child oral health care in New
Zealand. New Zealand Dental Journal, 108(4), 129-133. Retrieved from
https://www.nzda.org.nz/pub/index.php?id=93&no_cache=1
Rugg-Gunn, A. J., & Nunn, J. H. (1999). Nutrition, diet, and oral health. New York,
NY: Oxford University Press Inc.
Rush, E. (2009). Food security for Pacific peoples in New Zealand: A report for the
Obesity Action Coalition. Retrieved from
http://www.ana.org.nz/sites/default/files/PacificfoodsecurityreportfinalMarch09_3.pdf
Sabbahi, D. A., Lawrence, H. P., Limeback, H., & Rootman, I. (2009). Development
and evaluation of an oral health literacy instrument for adults. Community Dentistry and
Oral Epidemiology, 37(5), 451-462. doi:10.1111/j.1600-0528.2009.00490.x
Saha, S., Gudamarlahally, J. V., Shivkumar, S., & Pal, S. K. (2011). Effect of
commonly consumed fresh fruit juices and commercially available fruit juices on ph of
saliva at various time intervals. Journal of International Dental and Medical Research,
4(1), 7-11. Retrieved from http://www.ektodermaldisplazi.com/journal.htm
Savage, J. S., Fisher, J. O., & Birch, L. L. (2007). Parental influence on eating behavior:
Conception to adolescence. The Journal of Law, Medicine & Ethics, 35(1), 22-34.
doi:10.1111/j.1748-720X.2007.00111.x
Schluter, P. J., Durward, C., Cartwright, S., Paterson, J. (2007). Maternal self‐report
of oral health in 4‐year‐old Pacific children from South Auckland, New Zealand:
Findings from the Pacific islands families study. Journal of Public Health Dentistry,
67(2), 69-77. doi:10.1111/j.1752-7325.2007.00014.x
113
Selwitz, R. H., Ismail, A. I., & Pitts, N. B. (2007). Dental caries. Lancet, 369(9555), 51-
59. doi:10.1016/S0140-6736(07)60031-2
Sheiham, A., B necker, M. (2006). Promoting children's oral health: Theory &
practice. Sao Paulo, Brazil: Quintessence Editora Ltda.
Smith, P. A., & Freeman, R. (2010). Remembering and repeating childhood dental
treatment experiences: Parents, their children, and barriers to dental care. International
Journal of Paediatric Dentistry, 20(1), 50-58. doi:10.1111/j.1365-263X.2009.01004.x
Stanford, E. (2016). Glaring inconsistencies highlighted in Health Star Ratings.
Retrieved September 9, 2016, from http://www.newstalkzb.co.nz/news/national/glaring-
inconsistencies-highlighted-in-health-star-ratings/
Statista. (2016). Market share of soft drinks in New Zealand as of 2016, by category.
Retrieved August 15, 2016, from http://www.statista.com/statistics/422491/new-
zealand-market-share-of-soft-drinks-by-category/
Statistics New Zealand. (2010). New Zealand Childcare Survey 2009 (Revised 17
December 2010). Retrieved from
http://www.stats.govt.nz/~/media/Statistics/Browse%20for%20stats/ChildcareSurvey/H
OTP2009revised/ChildcareSurvey2009revisedHOTP.pdf
Statistics New Zealand. (2014). Census quickstats about families and households.
Retrieved from
http://www.stats.govt.nz/~/media/Statistics/Census/2013%20Census/profile-and-
summary-reports/quickstats-about-families-households/2013-census-qs-families-
households.pdf
Statistics New Zealand. (n.d.). Statistical standard for ethnicity. Retrieved from
http://www.stats.govt.nz/~/media/Statistics/surveys-and-methods/methods/class-
stnd/ethnicity/ETHNIC05-statistical-standard.pdf
114
Stevenson, A., Pearce, J., Blakely, T., Ivory, V., & Witten, K. (2009). Neighbourhoods
and health: A review of the New Zealand literature. New Zealand Geographer, 65(3),
211-221. doi:10.1111/j.1745-7939.2009.01164.x
Sundborn, G., Beaglehole, R., & Thornley, S. (2014, July 23). Sugar's bitter after-
effects. Dominion Post. Retrieved from http://www.stuff.co.nz/dominion-post/
Tahmassebi, J., Kandiah, P., & Sukeri, S. (2014). The effects of fruit smoothies on
enamel erosion. European Archives of Paediatric Dentistry, 15(3), 175-181.
doi:10.1007/s40368-013-0080-1
Taji, S., & Seow, W. (2010). A literature review of dental erosion in children.
Australian Dental Journal, 55(4), 358-367. doi:10.1111/j.1834-7819.2010.01255.x
Themessl‐Huber, M., Freeman, R., Humphris, G., Macgillivray, S., Terzi, N. (2010).
Empirical evidence of the relationship between parental and child dental fear: A
structured review and meta‐analysis. International Journal of Paediatric Dentistry,
20(2), 83-101. doi:10.1111/j.1365-263X.2009.00998.x
Theodore, R. F., Thompson, J. M. D., Wall, C. R., Becroft, D. M. O., Robinson, E.,
Clark, P. M., . . . Mitchell, E. A. (2006). Dietary patterns of New Zealand European
preschool children. New Zealand Medical Journal, 119(1235). Retrieved from
http://www.nzma.org.nz/journal
Tiwary, C., Ward, J., & Jackson, B. (1997). Effect of pectin on satiety in healthy US
Army adults. Journal of the American College of Nutrition, 16(5), 423-428.
doi:10.1080/07315724.1997.10718708
Toothfriendly International. (2015). Toothfriendly guidelines: pH-telemetry testing.
Retrieved from http://www.toothfriendly.org/images/pHTelemetryGuidelines.pdf
Toothfriendly International. (n.d.). Toothfriendly Inernational. Retrieved August 27,
2016, from http://www.toothfriendly.org/en/
115
Urban, J. D., Carakostas, M. C., & Taylor, S. L. (2015). Steviol glycoside safety: Are
highly purified steviol glycoside sweeteners food allergens? Food and Chemical
Toxicology, 75, 71-78. doi:10.1016/j.fct.2014.11.011
Vasagar, J. (2007, March 27). Schoolgirls rumble Ribena vitamin claims. The Guardian.
Retrieved from www.theguardian.com
Veerasamy, A. (2010). Oral health literacy of parents of preschoolers (Master's thesis,
University of Canterbury, Christchurch, New Zealand). Retrieved from
https://ir.canterbury.ac.nz/bitstream/handle/10092/5116/thesis_fulltextpdf.pdf?sequence
=1&isAllowed=y
Waitemata District Health Board. (n.d.). Beverage guidelines. Retrieved from
http://www.arphs.govt.nz/Portals/0/Health%20Information/Nutrition%20and%20Health
y%20Eating/82420%20Beverage%20guidelines%20Brochure.pdf
Weatherwax, J. A., Bray, K. K., Williams, K. B., & Gadbury-Amyot, C. C. (2014).
Exploration of the relationship between parent/guardian sociodemographics, intention,
and knowledge and the oral health status of their children/wards enrolled in a Central
Florida Head Start Program. International Journal of Dental Hygiene, 13(1), 49-55.
doi:10.1111/idh.12097
Whyman, R. A., Mahoney, E. K., Morrison, D., & Stanley, J. (2014). Potentially
preventable admissions to New Zealand public hospitals for dental care: A 20-year
review. Community Dentistry and Oral Epidemiology, 42(3), 234-244.
doi:10.1111/cdoe.12073
Woodford, K. (2014, March 30). Why is New Zealand’s retail milk so expensive?
Sunday Star Times. Retrieved from http://www.stuff.co.nz/sunday-star-times
116
World Health Organization. (2003). Fruit and vegetable promotion initiative: A meeting
report: 25-27 August 2003. Retrieved from
http://www.who.int/dietphysicalactivity/publications/f&v_promotion_initiative_report.p
df
117
Appendices
Appendix A: Participant Information Sheet
Participant Information Sheet
Date Information Sheet Produced: 14 November 2014
Project Title
An Investigation into Parents' Awareness of Effects of Commercial Fruit Beverages on
Their Children's Teeth.
Invitation
Hello,
I am Prathibha Sural, a MPH (Master of Public Health) student of AUT (Auckland
University of Technology). I would like to invite you to participate in this research
which will be contributing to the completion of my qualification.
Commercial fruit beverages offer better accessibility and storability than home-made
beverages; hence they are likely to be preferred by many parents. This study explores
parents' knowledge of effects of commercial fruit beverages on their children's teeth
through this survey.
Purpose of the study
The aim of the research is to assess parents' knowledge of the impact the store-bought
fruit drinks could have on their children's teeth. The output of this study will be a thesis
and potentially a journal article or other academic publication or presentation.
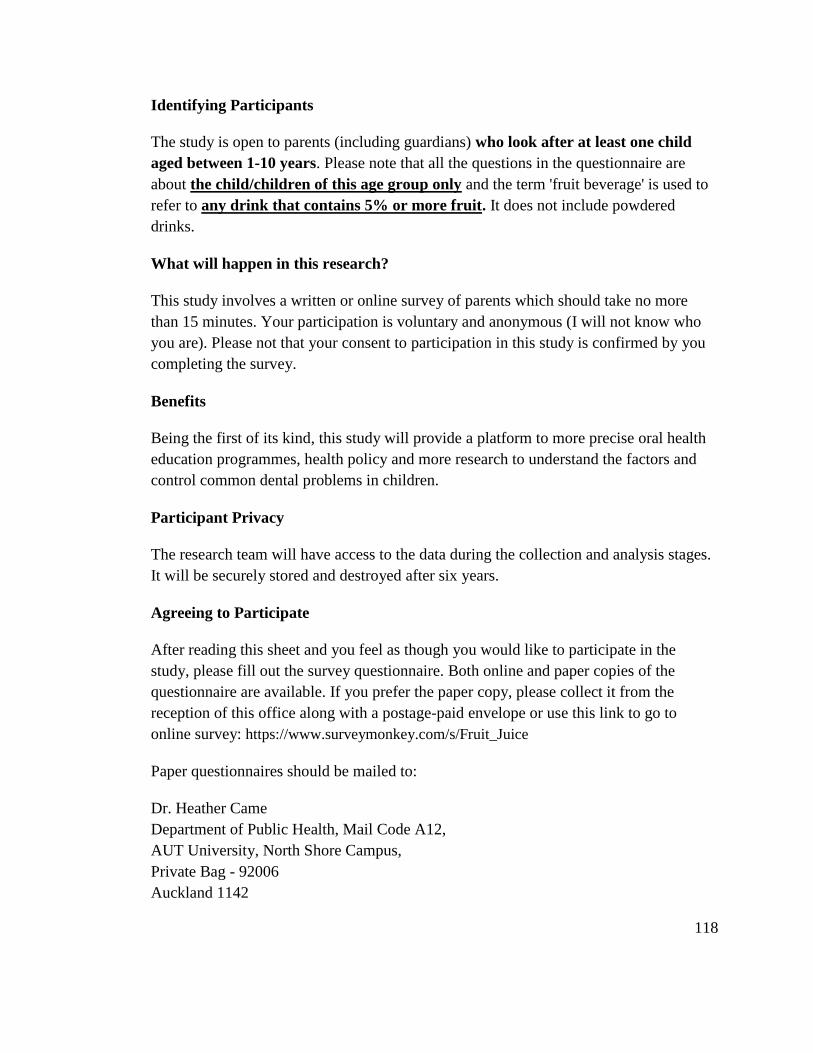
118
Identifying Participants
The study is open to parents (including guardians) who look after at least one child
aged between 1-10 years. Please note that all the questions in the questionnaire are
about the child/children of this age group only and the term 'fruit beverage' is used to
refer to any drink that contains 5% or more fruit. It does not include powdered
drinks.
What will happen in this research?
This study involves a written or online survey of parents which should take no more
than 15 minutes. Your participation is voluntary and anonymous (I will not know who
you are). Please not that your consent to participation in this study is confirmed by you
completing the survey.
Benefits
Being the first of its kind, this study will provide a platform to more precise oral health
education programmes, health policy and more research to understand the factors and
control common dental problems in children.
Participant Privacy
The research team will have access to the data during the collection and analysis stages.
It will be securely stored and destroyed after six years.
Agreeing to Participate
After reading this sheet and you feel as though you would like to participate in the
study, please fill out the survey questionnaire. Both online and paper copies of the
questionnaire are available. If you prefer the paper copy, please collect it from the
reception of this office along with a postage-paid envelope or use this link to go to
online survey: https://www.surveymonkey.com/s/Fruit_Juice
Paper questionnaires should be mailed to:
Dr. Heather Came
Department of Public Health, Mail Code A12,
AUT University, North Shore Campus,
Private Bag - 92006
Auckland 1142
119
Obtaining Study Results
A summary of the research report will be made available on 'AUT Scholarly Commons'
(http://aut.researchgateway.ac.nz/) which you can find by searching under the author
'Prathibha Sural' after December 2015. We also plan on submitting a peer reviewed
article to a high-profile journal.
Participants Concerns
Any concerns regarding the nature of this project should be notified in the first instance
to the Project Supervisor: Dr. Heather Came, [email protected] or 09 9219999 ext 7799.
Concerns regarding the conduct of the research should be notified to the Executive
Secretary of AUTEC, Kate O’Connor, [email protected] , 921 9999 ext 6038.
Researcher Contact Details
For further details regarding the study please contact one of the individuals below:
Primary Researcher: Prathibha Sural, [email protected].
Project Supervisor: Dr. Heather Came, [email protected] or 09 9219999 ext 7799.
Approved by the Auckland University of Technology Ethics Committee on 30 January 2015, AUTEC Reference
number 14/388.
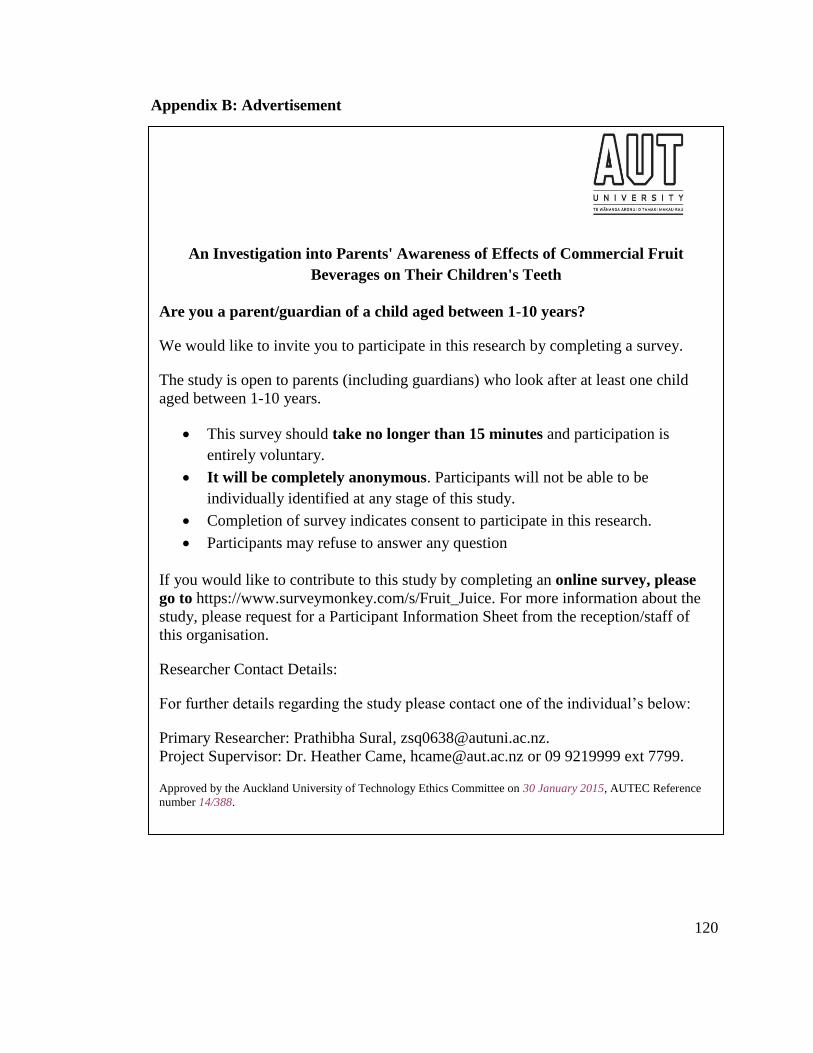
120
Appendix B: Advertisement
An Investigation into Parents' Awareness of Effects of Commercial Fruit
Beverages on Their Children's Teeth
Are you a parent/guardian of a child aged between 1-10 years?
We would like to invite you to participate in this research by completing a survey.
The study is open to parents (including guardians) who look after at least one child
aged between 1-10 years.
This survey should take no longer than 15 minutes and participation is
entirely voluntary.
It will be completely anonymous. Participants will not be able to be
individually identified at any stage of this study.
Completion of survey indicates consent to participate in this research.
Participants may refuse to answer any question
If you would like to contribute to this study by completing an online survey, please
go to https://www.surveymonkey.com/s/Fruit_Juice. For more information about the
study, please request for a Participant Information Sheet from the reception/staff of
this organisation.
Researcher Contact Details:
For further details regarding the study please contact one of the individual’s below:
Primary Researcher: Prathibha Sural, [email protected].
Project Supervisor: Dr. Heather Came, [email protected] or 09 9219999 ext 7799.
Approved by the Auckland University of Technology Ethics Committee on 30 January 2015, AUTEC Reference
number 14/388.
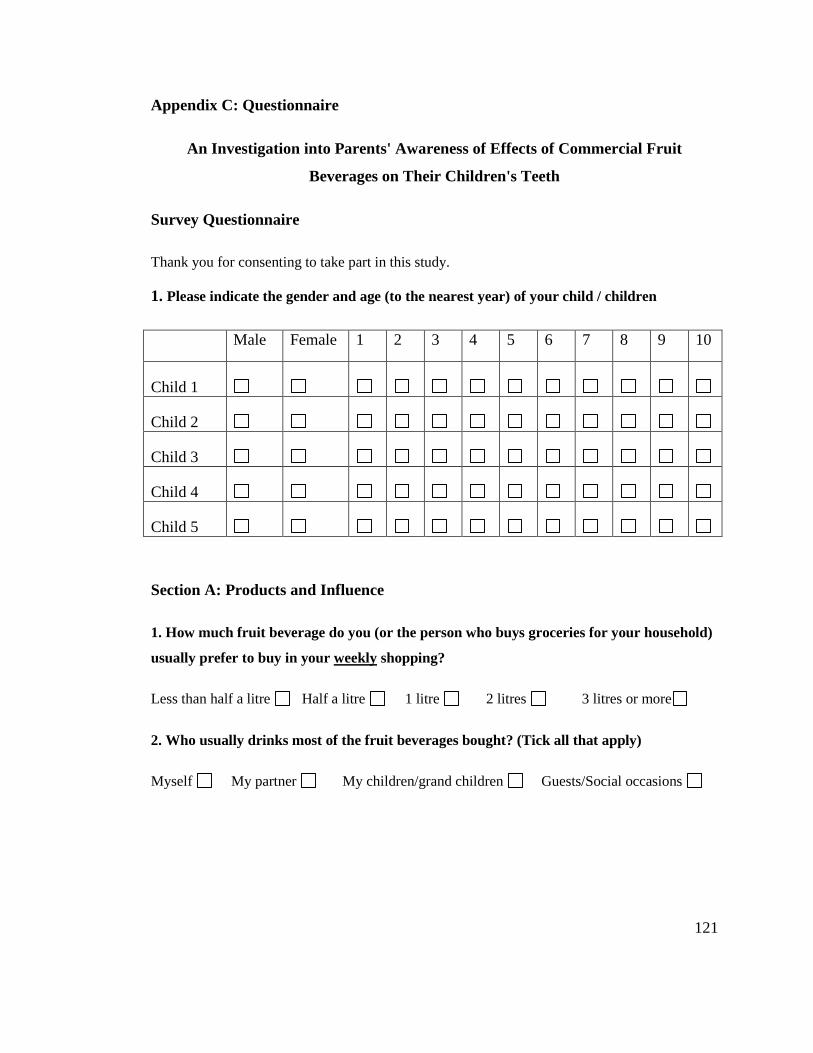
121
Appendix C: Questionnaire
An Investigation into Parents' Awareness of Effects of Commercial Fruit
Beverages on Their Children's Teeth
Survey Questionnaire
Thank you for consenting to take part in this study.
1. Please indicate the gender and age (to the nearest year) of your child / children
Male Female 1 2 3 4 5 6 7 8 9 10
Child 1
Child 2
Child 3
Child 4
Child 5
Section A: Products and Influence
1. How much fruit beverage do you (or the person who buys groceries for your household)
usually prefer to buy in your weekly shopping?
Less than half a litre Half a litre 1 litre 2 litres 3 litres or more
2. Who usually drinks most of the fruit beverages bought? (Tick all that apply)
Myself My partner My children/grand children Guests/Social occasions
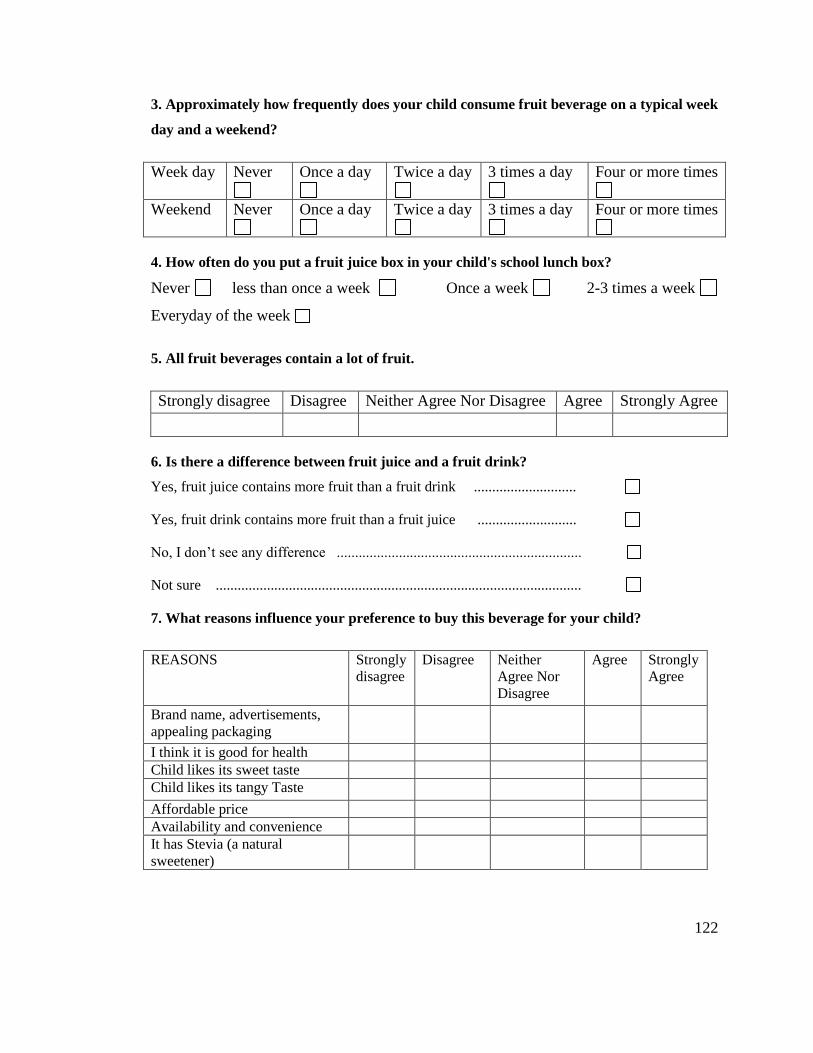
122
3. Approximately how frequently does your child consume fruit beverage on a typical week
day and a weekend?
Week day Never
Once a day
Twice a day
3 times a day
Four or more times
Weekend Never
Once a day
Twice a day
3 times a day
Four or more times
4. How often do you put a fruit juice box in your child's school lunch box?
Never less than once a week Once a week 2-3 times a week
Everyday of the week
5. All fruit beverages contain a lot of fruit.
Strongly disagree Disagree Neither Agree Nor Disagree Agree Strongly Agree
6. Is there a difference between fruit juice and a fruit drink?
Yes, fruit juice contains more fruit than a fruit drink ............................
Yes, fruit drink contains more fruit than a fruit juice ...........................
No, I don’t see any difference ...................................................................
Not sure ....................................................................................................
7. What reasons influence your preference to buy this beverage for your child?
REASONS Strongly
disagree
Disagree Neither
Agree Nor
Disagree
Agree Strongly
Agree
Brand name, advertisements,
appealing packaging
I think it is good for health
Child likes its sweet taste
Child likes its tangy Taste
Affordable price
Availability and convenience
It has Stevia (a natural
sweetener)
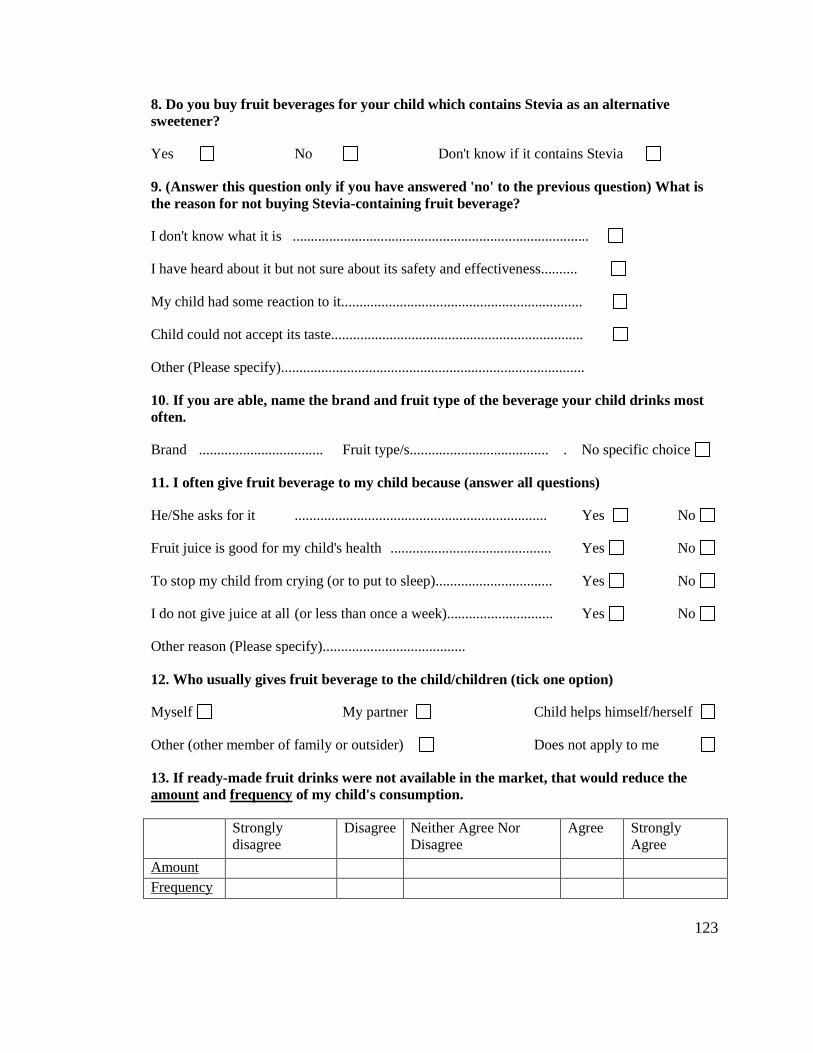
123
8. Do you buy fruit beverages for your child which contains Stevia as an alternative
sweetener?
Yes No Don't know if it contains Stevia
9. (Answer this question only if you have answered 'no' to the previous question) What is
the reason for not buying Stevia-containing fruit beverage?
I don't know what it is .................................................................................
I have heard about it but not sure about its safety and effectiveness..........
My child had some reaction to it..................................................................
Child could not accept its taste.....................................................................
Other (Please specify)...................................................................................
10. If you are able, name the brand and fruit type of the beverage your child drinks most
often.
Brand .................................. Fruit type/s...................................... . No specific choice
11. I often give fruit beverage to my child because (answer all questions)
He/She asks for it ..................................................................... Yes No
Fruit juice is good for my child's health ............................................ Yes No
To stop my child from crying (or to put to sleep)................................ Yes No
I do not give juice at all (or less than once a week)............................. Yes No
Other reason (Please specify).......................................
12. Who usually gives fruit beverage to the child/children (tick one option)
Myself My partner Child helps himself/herself
Other (other member of family or outsider) Does not apply to me
13. If ready-made fruit drinks were not available in the market, that would reduce the
amount and frequency of my child's consumption.
Strongly
disagree
Disagree Neither Agree Nor
Disagree
Agree Strongly
Agree
Amount
Frequency

124
Section B: Knowledge, Activities and Information Source
1. Natural and added sugars in the fruit beverage are bad for teeth
Strongly
disagree
Disagree Neither Agree Nor
Disagree
Agree Strongly
Agree
Natural sugar
Added sugar
2. How do fruit beverages affect teeth?
By sugar By acidity By both sugar and acidity Fruit beverages don't affect teeth
3. How harmful is each of these activities to teeth?
Habit/Activity 1
Not at all
harmful
2 3 4 5
Very
harmful
Drinking one glass of juice with meal
Drinking fruit milkshakes
Drinking one glass of juice in between
meals
Drinking juice in small amounts every
20-30 minutes
Drinking milk and water in between
meals
4. Please tick the most appropriate number from 1 to 5 for each statement which
corresponds to your desired response.
Habit/Activity 1
Never
2 3 4 5
Everyday
I dilute the juice with water
The child rinses mouth or drinks water after
consumption of fruit juice
Brush child's teeth twice daily
I give only milk drinks (with little or no
sugar) and water
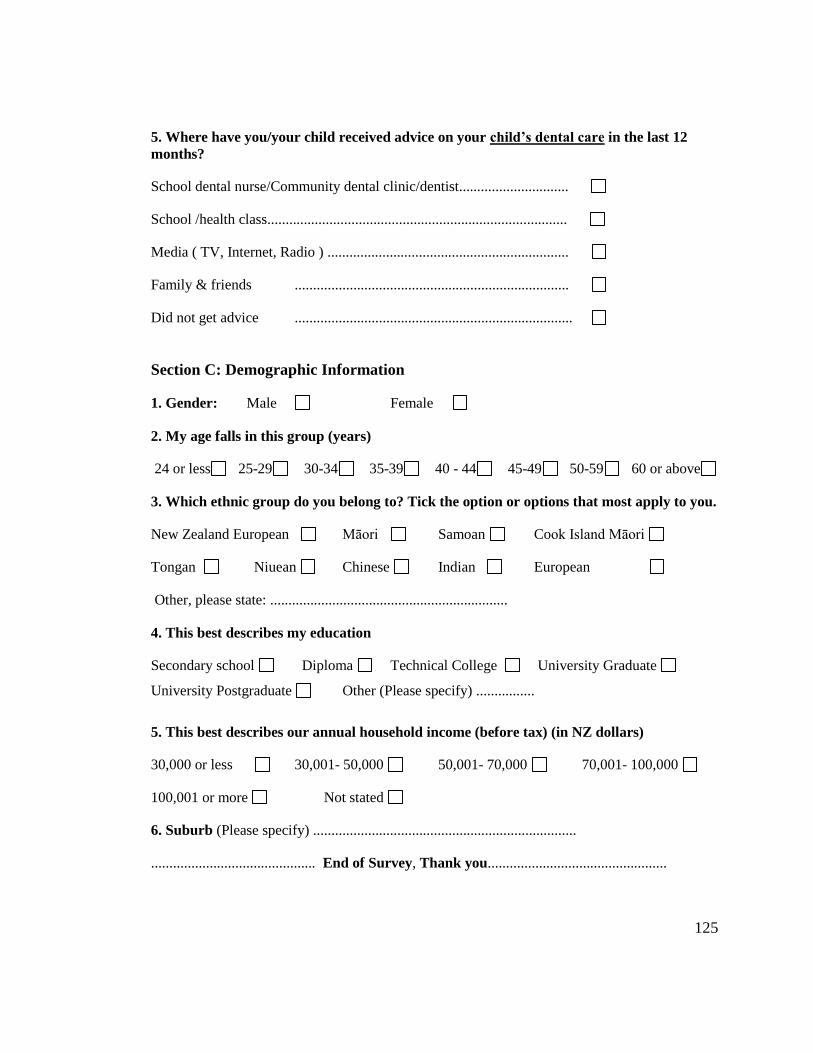
125
5. Where have you/your child received advice on your child’s dental care in the last 12
months?
School dental nurse/Community dental clinic/dentist..............................
School /health class..................................................................................
Media ( TV, Internet, Radio ) ..................................................................
Family & friends ...........................................................................
Did not get advice ............................................................................
Section C: Demographic Information
1. Gender: Male Female
2. My age falls in this group (years)
24 or less 25-29 30-34 35-39 40 - 44 45-49 50-59 60 or above
3. Which ethnic group do you belong to? Tick the option or options that most apply to you.
New Zealand European Māori Samoan Cook Island Māori
Tongan Niuean Chinese Indian European
Other, please state: .................................................................
4. This best describes my education
Secondary school Diploma Technical College University Graduate
University Postgraduate Other (Please specify) ................
5. This best describes our annual household income (before tax) (in NZ dollars)
30,000 or less 30,001- 50,000 50,001- 70,000 70,001- 100,000
100,001 or more Not stated
6. Suburb (Please specify) ........................................................................
............................................. End of Survey, Thank you.................................................