An Investigation into the Performance of Axial Flow ...
150
An Investigation into the Performance of Axial Flow Refrigerator Fans by Ryan McKinlay A thesis submitted in partial fulfilment of the requirements for the degree of Master of Engineering in the Department of Mechanical Engineering, University of Canterbury, Christchurch, New Zealand June 2014
-
Upload
khangminh22 -
Category
Documents
-
view
0 -
download
0
Transcript of An Investigation into the Performance of Axial Flow ...

An Investigation into the
Performance of Axial Flow
Refrigerator Fans
by
Ryan McKinlay
A thesis submitted in partial fulfilment of the requirements for the degree of
Master of Engineering
in the
Department of Mechanical Engineering, University of Canterbury,
Christchurch, New Zealand
June 2014

i
Abstract
This work was concerned with the aerodynamic and acoustic performance of small axial flow refrigerator fans. Relevant literature focusing on the principles of fan noise generation and fan system elements that contribute to noise generation was identified and discussed. A plenum chamber test rig was designed and constructed following ISO 10302-1.
A range of 200 mm diameter pressed aluminium Air-Drive fans, commonly used in commercial refrigerator systems, were evaluated using the test rig. It was found that the performance of these fans was highly dependent upon the impedance of the system in which they are installed. Indications of rotating stall under high load were observed and shown to significantly increase the noise output of the fan without greatly affecting the air moving capability. A series of novel colour map plots are presented, which allow for a visual interpretation of fan performance over a wide range of operating conditions.
A fanpack developed by Wellington Drive Technologies Ltd was evaluated. This fanpack was found to generate significant tonal noise. The design of the fanpack was evaluated and improvements are suggested. Prototype fans were developed from the fanpack based on promising concepts presented in the literature. The performance of four prototype fans was evaluated. The results were disappointing, but proof of concept was demonstrated.

ii

iii
Acknowledgements
I would like to thank my supervisor Associate Professor John Pearse. His guidance throughout the course of the project is greatly appreciated.
Thanks to Wellington Drive Technologies Ltd who were so positive and proactive in sponsoring this work.
Thanks to the members of Acoustics Research Group whose expertise and friendship made this such a memorable and enjoyable experience.
Finally, I would like to thank my family: To my parents, John and Marilyn, whose encouragement and support has provided me with such a fantastic foundation on which to grow. And to Alice and Clare, who taught me to question the information presented before me.
iv
Table of Contents
Abstract ....................................................................................................................................... i
Acknowledgements .................................................................................................................. iii
Chapter 1 - Introduction
1.1 Fan Noise ........................................................................................................................ 3
1.2 Fan Performance Testing ................................................................................................ 3
1.2.1 Air-Drive Fans ......................................................................................................... 3
1.2.2 Wellington Drive Fanpack ....................................................................................... 4
1.2.3 Prototype Fans ......................................................................................................... 4
1.3 Conclusions and Future Work ........................................................................................ 4
Chapter 2 - Literature Review
Summary .................................................................................................................................... 5
2.1 Principles of Fan Noise Generation ................................................................................ 7
2.1.1 Broadband Noise ..................................................................................................... 7
2.1.2 Tonal Noise.............................................................................................................. 8
2.2 Fan System Elements ...................................................................................................... 9
2.2.1 The Fan .................................................................................................................... 9
2.2.2 The Shroud ............................................................................................................ 10
2.2.3 The Support Structure ............................................................................................ 11
2.3 Other Considerations .................................................................................................... 11
2.4 References ..................................................................................................................... 11
Chapter 3 - Experimental Facility
Summary .................................................................................................................................. 13
List of Figures and Tables........................................................................................................ 15
3.1 Introduction ................................................................................................................... 16
v
3.2 Test Environment .......................................................................................................... 16
3.3 Fan Test Arrangement................................................................................................... 17
3.3.1 Test Rig Specifications .......................................................................................... 17
3.3.2 Test Rig Qualification ........................................................................................... 20
3.4 Instrumentation ............................................................................................................. 23
3.4.1 Data Acquisition System ....................................................................................... 23
3.4.2 Motor Control System ........................................................................................... 23
3.4.3 Pressure Measurement ........................................................................................... 24
3.4.4 Air Flow Rate Measurement .................................................................................. 24
3.4.5 Development of Flow Rate Prediction .................................................................. 28
3.4.6 Sound Power Level Measurement ......................................................................... 30
3.4.7 Fan Environment ................................................................................................... 32
3.5 References ..................................................................................................................... 32
Chapter 4 - Performance Evaluation of Air-Drive Fans
Summary .................................................................................................................................. 33
List of Figures and Tables........................................................................................................ 35
4.1 Introduction ................................................................................................................... 38
4.2 Air-Drive Fans .............................................................................................................. 38
4.3 Performance of a 26 Degree Pitch Fan ......................................................................... 39
4.3.1 Frequency Spectrum Analysis of Fan Performance .............................................. 44
4.3.2 Effect of Changing Impedance on Noise Spectrum .............................................. 47
4.4 Effect of Blade Pitch Angle .......................................................................................... 57
4.4.1 Fan Performance Curves ....................................................................................... 57
4.4.2 Comparison at 1800 rpm ....................................................................................... 60
4.5 Interpolation Colour Maps ............................................................................................ 62
4.5.1 Fan Efficiency Maps .............................................................................................. 63
4.5.2 Fan SWL Maps ...................................................................................................... 66
4.6 References ..................................................................................................................... 70
Chapter 5 - Performance Evaluation of a Wellington Drive Fanpack
Summary .................................................................................................................................. 71
vi
List of Figures .......................................................................................................................... 73
5.1 Introduction ................................................................................................................... 75
5.2 Wellington Drive Fanpack ............................................................................................ 75
5.2.1 The Fan .................................................................................................................. 75
5.2.2 The Shroud ............................................................................................................ 76
5.2.3 The Motor .............................................................................................................. 77
5.3 Fanpack Performance with a 25 Watt Motor ................................................................ 79
5.3.1 Fanpack Performance Curves ................................................................................ 79
5.3.2 Frequency Spectrum Analysis ............................................................................... 83
5.3.3 Efficiency and SWL Performance Maps ............................................................... 88
Chapter 6 - Development and Performance of Prototype Fans
Summary .................................................................................................................................. 91
List of Figures .......................................................................................................................... 93
6.1 Introduction ................................................................................................................... 95
6.2 Prototype Fan P1 ........................................................................................................... 95
6.2.1 Suction Side Winglets ........................................................................................... 95
6.2.2 Performance of P1 ................................................................................................. 96
6.2.3 Frequency Spectrum Analysis of P1 ..................................................................... 98
6.3 Prototype Fan P2 ......................................................................................................... 101
6.3.1 Suction Side Winglets ......................................................................................... 101
6.3.2 Performance of P2 ............................................................................................... 102
6.3.3 Frequency Spectrum Analysis of P2 ................................................................... 104
6.4 Prototype Fan P3 ......................................................................................................... 107
6.4.1 Pressure Side Winglets ........................................................................................ 107
6.4.2 Performance of P3 ............................................................................................... 108
6.4.3 Frequency Spectrum Analysis of P3 ................................................................... 110
6.5 Prototype Fan P4 ......................................................................................................... 113
6.5.1 Serrated Trailing Edges ....................................................................................... 113
6.5.2 Performance of P4 ............................................................................................... 115
6.5.3 Frequency Spectrum Analysis of P4 ................................................................... 116
6.6 Conclusion .................................................................................................................. 119

vii
6.7 References ................................................................................................................... 119
Chapter 7 - Conclusions and Future Work
7.1 Conclusions ................................................................................................................. 122
7.2 Future Work ................................................................................................................ 123
Appendices
A Plenum Chamber Drawing .......................................................................................... 125
B Fan Performance Data................................................................................................. 129


Chapter 1
Introduction

Chapter 1 Introduction 2
Table of Contents
1.1 Fan Noise ........................................................................................................................ 3
1.2 Fan Performance Testing ................................................................................................ 3
1.2.1 Air-Drive Fans ......................................................................................................... 3
1.2.2 Wellington Drive Fanpack ....................................................................................... 4
1.2.3 Prototype Fans ......................................................................................................... 4
1.3 Conclusions and Future Work ........................................................................................ 4
Chapter 1 Introduction 3
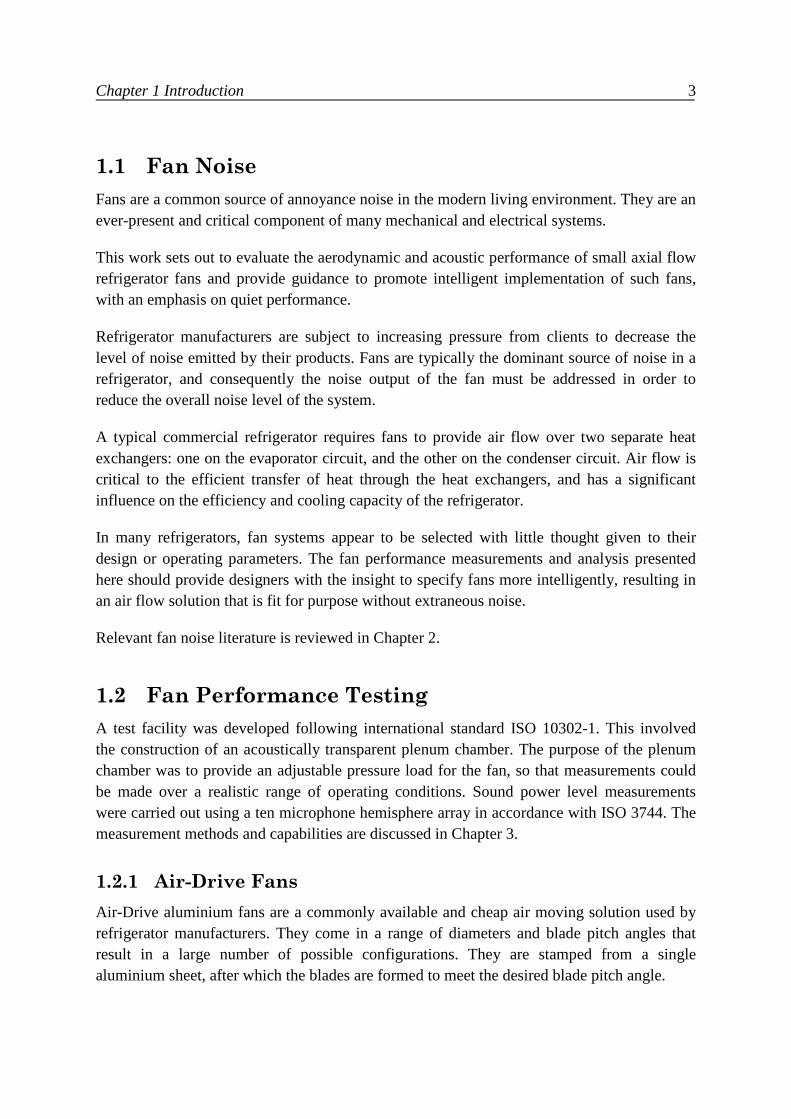
1.1 Fan Noise
Fans are a common source of annoyance noise in the modern living environment. They are an ever-present and critical component of many mechanical and electrical systems.
This work sets out to evaluate the aerodynamic and acoustic performance of small axial flow refrigerator fans and provide guidance to promote intelligent implementation of such fans, with an emphasis on quiet performance.
Refrigerator manufacturers are subject to increasing pressure from clients to decrease the level of noise emitted by their products. Fans are typically the dominant source of noise in a refrigerator, and consequently the noise output of the fan must be addressed in order to reduce the overall noise level of the system.
A typical commercial refrigerator requires fans to provide air flow over two separate heat exchangers: one on the evaporator circuit, and the other on the condenser circuit. Air flow is critical to the efficient transfer of heat through the heat exchangers, and has a significant influence on the efficiency and cooling capacity of the refrigerator.
In many refrigerators, fan systems appear to be selected with little thought given to their design or operating parameters. The fan performance measurements and analysis presented here should provide designers with the insight to specify fans more intelligently, resulting in an air flow solution that is fit for purpose without extraneous noise.
Relevant fan noise literature is reviewed in Chapter 2.
1.2 Fan Performance Testing
A test facility was developed following international standard ISO 10302-1. This involved the construction of an acoustically transparent plenum chamber. The purpose of the plenum chamber was to provide an adjustable pressure load for the fan, so that measurements could be made over a realistic range of operating conditions. Sound power level measurements were carried out using a ten microphone hemisphere array in accordance with ISO 3744. The measurement methods and capabilities are discussed in Chapter 3.
1.2.1 Air-Drive Fans
Air-Drive aluminium fans are a commonly available and cheap air moving solution used by refrigerator manufacturers. They come in a range of diameters and blade pitch angles that result in a large number of possible configurations. They are stamped from a single aluminium sheet, after which the blades are formed to meet the desired blade pitch angle.
Chapter 1 Introduction 4
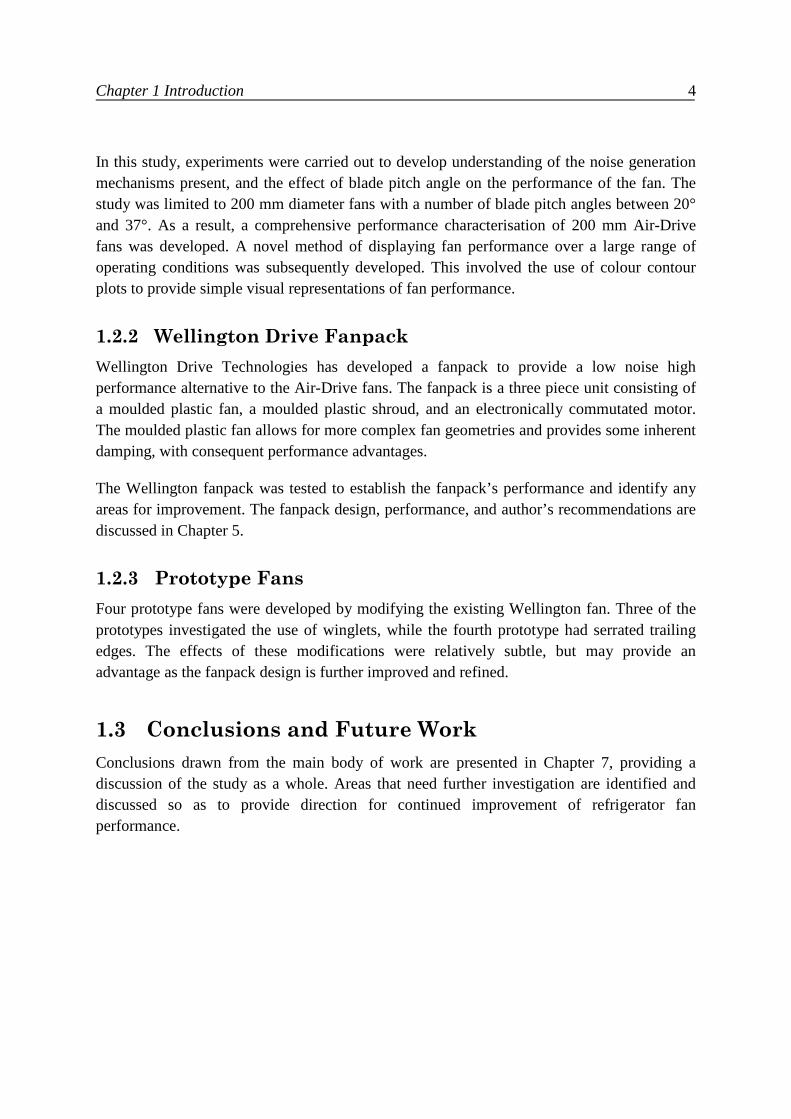
In this study, experiments were carried out to develop understanding of the noise generation mechanisms present, and the effect of blade pitch angle on the performance of the fan. The study was limited to 200 mm diameter fans with a number of blade pitch angles between 20° and 37°. As a result, a comprehensive performance characterisation of 200 mm Air-Drive fans was developed. A novel method of displaying fan performance over a large range of operating conditions was subsequently developed. This involved the use of colour contour plots to provide simple visual representations of fan performance.
1.2.2 Wellington Drive Fanpack
Wellington Drive Technologies has developed a fanpack to provide a low noise high performance alternative to the Air-Drive fans. The fanpack is a three piece unit consisting of a moulded plastic fan, a moulded plastic shroud, and an electronically commutated motor. The moulded plastic fan allows for more complex fan geometries and provides some inherent damping, with consequent performance advantages.
The Wellington fanpack was tested to establish the fanpack’s performance and identify any areas for improvement. The fanpack design, performance, and author’s recommendations are discussed in Chapter 5.
1.2.3 Prototype Fans
Four prototype fans were developed by modifying the existing Wellington fan. Three of the prototypes investigated the use of winglets, while the fourth prototype had serrated trailing edges. The effects of these modifications were relatively subtle, but may provide an advantage as the fanpack design is further improved and refined.
1.3 Conclusions and Future Work
Conclusions drawn from the main body of work are presented in Chapter 7, providing a discussion of the study as a whole. Areas that need further investigation are identified and discussed so as to provide direction for continued improvement of refrigerator fan performance.
Chapter 2
Literature Review
Summary
A literature review was conducted to establish the present state of knowledge in the field of fan noise and other related technologies. The review revealed that there are numerous unique noise generation mechanisms in axial flow fan systems and that not all of these mechanisms are well understood. Many studies have strived to identify causal relationships between observed noise and fan design features and to provide practical guidelines for design and implementation of effective quiet fan systems.
Chapter 2 Literature Review 6
Table of Contents
Summary .................................................................................................................................... 5
2.1 Principles of Fan Noise Generation ................................................................................ 7
2.1.1 Broadband Noise ..................................................................................................... 7
2.1.2 Tonal Noise.............................................................................................................. 8
2.2 Fan System Elements ...................................................................................................... 9
2.2.1 The Fan .................................................................................................................... 9
2.2.2 The Shroud ............................................................................................................ 10
2.2.3 The Support Structure ............................................................................................ 11
2.3 Other Considerations .................................................................................................... 11
2.4 References ..................................................................................................................... 11

Chapter 2 Literature Review 7
2.1 Principles of Fan Noise Generation
Noise from axial flow fans can be categorised into two key components: (1) broadband noise, and (2) tonal noise.
2.1.1 Broadband Noise
The broadband component of fan noise arises from randomly fluctuating forces. Sharland [1] described three key mechanisms by which such forces could originate. These are; turbulent boundary layers, vortex shedding, and turbulence in the intake flow.
A turbulent boundary layer on the surface of the fan blade results in an unsteady flow. As a result there is a randomly fluctuating lift force on the blade, which acts as a source of broadband noise [1].
Force fluctuations caused by vortices shed from the surface of a body in a moving flow have been identified as a potential source of both broadband and tonal noise. Sharland [1] discussed periodic vortex shedding from bluff bodies at low Reynolds numbers, but states that the phenomenon is unlikely to be well-defined in a streamlined fan system. As such the lift force would fluctuate randomly resulting in a noise source that is broadband in nature. This was contradicted by Longhouse [2] who attributed a strong narrowband noise source to vortex shedding.
Turbulence in the intake flow of a fan can also result in a fluctuating lift force. If the incidence velocity of flow onto the fan blade is varying randomly, as would be expected in a turbulent flow, the fluctuations in lift on the fan blade will be random in nature. Thus, broadband noise will be generated [1]. Grille plates or heat exchangers installed upstream of a fan would be typical sources of such turbulence. Similar disturbances in the incident flow can be generated within the fan blade row itself. Common examples would be tip clearance vortices, and aerodynamic stall of the fan blades.
Tip clearance noise is a common source of broadband noise in nearly all axial flow machines. The pressure imbalance at the tip of the fan blades causes roll-up of a tip vortex, which is shed downstream of the blade. The unsteady tip vortex interacts with both the trailing edge of the blade from which it is shed, and the leading edge of the following fan blade [3]. This results in broadband noise in the same way as described above for a turbulent intake flow.
Aerodynamic stall can occur in fans with moderate to high blade pitch angles under significant load. The flow separates from the suction side of the fan blade resulting in mass turbulence. These pockets of turbulence interact with the following fan blade resulting in broadband noise [4]. A special case of aerodynamic stall - known as partial rotating stall - results in both broadband and tonal noise and is discussed further in Chapter 4.
Chapter 2 Literature Review 8
Turbulence itself is also a source of broadband noise, due to the randomly fluctuating pressures in the air flow. However, it is quadrupole in nature and consequently does not radiate noise efficiently. In a typical axial flow fan aerodynamic noise due to turbulence would be dominated by noise caused by fluctuating forces between the fluid and a solid boundary, which is dipole in nature [5].
2.1.2 Tonal Noise
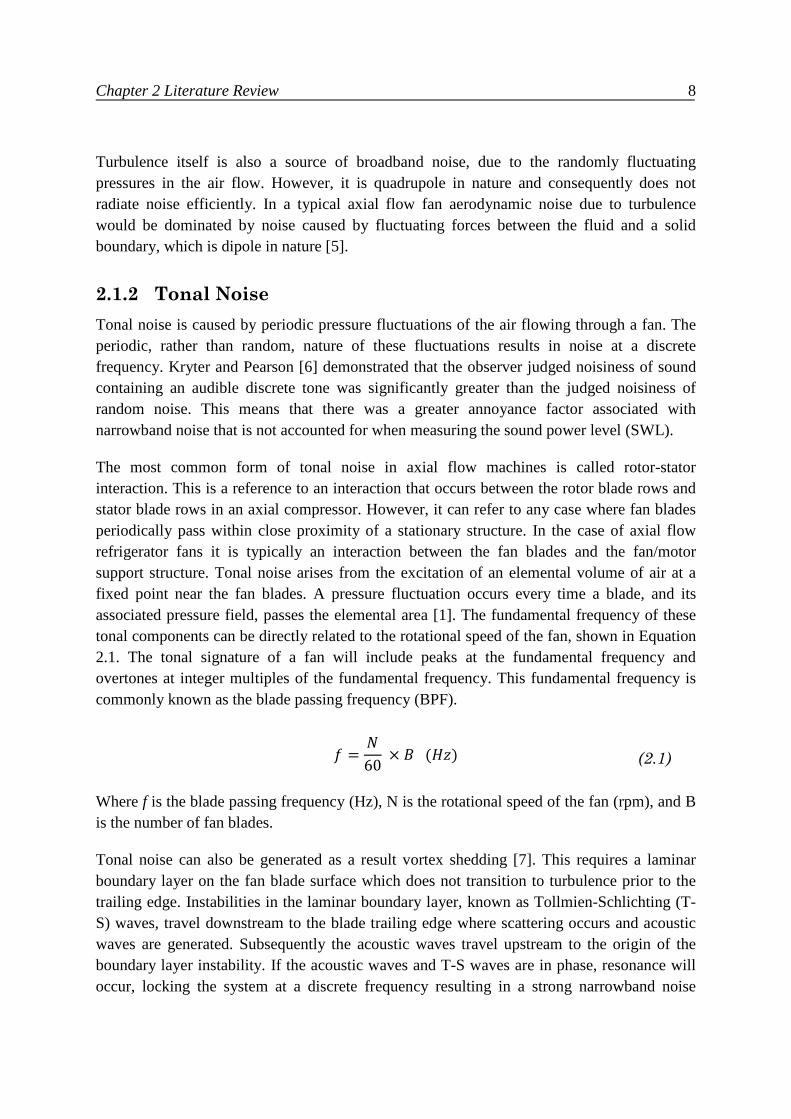
Tonal noise is caused by periodic pressure fluctuations of the air flowing through a fan. The periodic, rather than random, nature of these fluctuations results in noise at a discrete frequency. Kryter and Pearson [6] demonstrated that the observer judged noisiness of sound containing an audible discrete tone was significantly greater than the judged noisiness of random noise. This means that there was a greater annoyance factor associated with narrowband noise that is not accounted for when measuring the sound power level (SWL).
The most common form of tonal noise in axial flow machines is called rotor-stator interaction. This is a reference to an interaction that occurs between the rotor blade rows and stator blade rows in an axial compressor. However, it can refer to any case where fan blades periodically pass within close proximity of a stationary structure. In the case of axial flow refrigerator fans it is typically an interaction between the fan blades and the fan/motor support structure. Tonal noise arises from the excitation of an elemental volume of air at a fixed point near the fan blades. A pressure fluctuation occurs every time a blade, and its associated pressure field, passes the elemental area [1]. The fundamental frequency of these tonal components can be directly related to the rotational speed of the fan, shown in Equation 2.1. The tonal signature of a fan will include peaks at the fundamental frequency and overtones at integer multiples of the fundamental frequency. This fundamental frequency is commonly known as the blade passing frequency (BPF).
� =�
60× �(�) (2.1)
Where f is the blade passing frequency (Hz), N is the rotational speed of the fan (rpm), and B is the number of fan blades.
Tonal noise can also be generated as a result vortex shedding [7]. This requires a laminar boundary layer on the fan blade surface which does not transition to turbulence prior to the trailing edge. Instabilities in the laminar boundary layer, known as Tollmien-Schlichting (T-S) waves, travel downstream to the blade trailing edge where scattering occurs and acoustic waves are generated. Subsequently the acoustic waves travel upstream to the origin of the boundary layer instability. If the acoustic waves and T-S waves are in phase, resonance will occur, locking the system at a discrete frequency resulting in a strong narrowband noise

Chapter 2 Literature Review 9
source [2]. Tam [8] referred to this noise source as a self-excited feedback loop of aerodynamic origin.
Aeolian tones were found to be generated due to vortex shedding in the presence of a blunt body [4]. Coherent vortex shedding can occur in the separated flow region immediately downstream of a blunt body, resulting in periodically fluctuating forces and tonal noise [9]. Chong et al. [10] demonstrated significant tonal noise due to bluntness in the serrated trailing edge of an aerofoil.
2.2 Fan System Elements
A typical axial flow fan system is comprised of three key elements; the fan, the shroud and the support structure. Many studies have been carried out investigating different design features and their effects on performance.
2.2.1 The Fan
There are many features of an axial flow fan that may have a profound effect on the operating conditions and resulting performance of the fan system.
Sharland [1] states that blades will stall as the angle of attack is increased, resulting in boundary layer separation, large scale pressure fluctuations, and significant broadband noise.
Deeprose [11] evaluated asymmetrically spaced blades and found that they lowered and broadened tonal peaks. This alternative spectral structure resulted in a reduced noise rating. However, the SWL of the fan remained the same.
Yen and Lin [12] found that adding winglets increased lift and reduced drag, resulting in a more stable flow field. Nashimoto [13] showed that winglets would also reduce the SWL of the fan, and used PIV techniques to identify a reduction in the size and strength of tip vortices.
The effects of boundary layer trip-strips installed on the suction side of fan blades were the subject of several investigations. Boundary layer trip strips were implemented by placing small serrations on the blade face to prevent flow separation and laminar vortex shedding at the trailing edge. Longhouse [2] measured a reduction in vortex shedding and improved peak efficiency, though performance was highly dependent upon the fan stalling characteristics. In some cases an increase in noise output was measured. Fitzgerald and Lauchle [14] also found that suction side serrations could reduce unsteady blade forces by preventing laminar separation. Soderman [15] investigated the same effect by fitting brass serrations to the leading edge of large rotors (over 1.5m diameter). Overall noise level reductions of 4 - 8 dB were achieved.

Chapter 2 Literature Review 10
The trailing edge of the blade was shown to have a significant effect on noise generation by Brooks and Hodgson [9] who established that vortex shedding can be caused by the presence of a blunt trailing edge. This vortex shedding was identified as an important source of aerofoil self-noise.
2.2.2 The Shroud
Shrouds have long been used as an effective means of increasing fan performance, both aerodynamically and acoustically. Cumpsty [16] emphasised the powerful effect that a shroud can have on the acoustics of a fan. The shroud geometry, the tip clearance and the lateral location of the fan in the shroud were all found to be important.
The clearance between the tip of the fan blades and the shroud can greatly affect fan performance. The presence of a shroud disturbs the formation of tip vortices, consequently reducing drag and noise output. Reducing the tip clearance also reduces the area through which flow recirculation can occur. A near-zero tip clearance would be ideal but there are practical constraints on the minimum achievable tip clearance. Typical problems are associated with manufacturing tolerances, creep, and rotor eccentricity.
Fukano et al. [17] carried out a study that focused on the effects of tip clearance and its role in fan noise generation. A number of different fans - of approximately 600 mm diameter - were tested in a 14 m duct system. Each fan was operated at its optimal design point. It was found that changes in tip clearance have a more significant effect on acoustic performance than aerodynamic performance, with a decrease in tip clearance proving beneficial in each case. This study also extended to mixed flow fans, which showed similar noise generation mechanisms to axial fans.
Cooper et al. [18] investigated effects in fan/radiator systems from trucks. This work determined several features that are important to efficient fan and shroud implementation; the tip clearance should not be greater than 1% of the blade span, the shroud should have a smooth bellmouth entry, and the leading edge of the fan should not be placed upstream of the shroud throat.
In an attempt to control tip vortex noise, Longhouse [3] carried out a study integrating a rotating shroud into the fan design. This study found that on a typical shrouded fan the tip clearance noise dominates if the tip clearance is greater than 3 - 4% of chord length, and contributes up to 15 dB to the fan noise level. If large clearances must be maintained a rotating shroud was shown to be a practical and effective solution, reducing noise levels by up to 12 dB when configured correctly. The radius of curvature of the rotating shroud inlet should be minimised, but maintain a smooth inflow. The peak efficiency and minimum noise output were achieved at almost identical operating conditions.

Chapter 2 Literature Review 11
2.2.3 The Support Structure
Interaction between fan blades and the support structure is a well-documented source of tonal noise. Longhouse [19] highlighted the effect of noise generation caused by the interaction of blades with nearby stationary objects, referring to them as potential field interactions. These mechanisms are generally tonal and related to the blade passing frequency (BPF). Sharland [1] also investigated the interaction of blade wakes and support struts, showing that tonal peaks at the BPF and its harmonics became more prominent as the clearance between elements was decreased.
Fitzgerald and Lauchle [14] decreased noise levels by streamlining and skewing support struts both upstream and downstream of the fan. In addition to this, Filleul [20] showed that a strut placed upstream of the fan has a more significant effect on fan noise than that of a strut placed downstream of the fan.
2.3 Other Considerations
Longitudinal vortices in the fan wake have a significant positive impact on heat transfer in refrigeration systems [21]. However, intentionally introducing a longitudinal vortex is likely to contribute as a noise generation mechanism, but a noise reduction may be achieved through a decrease in the required volumetric flow rate. This condition should be considered carefully, given that the application of small axial flow fans is invariably to promote heat transfer.
2.4 References
[1] I. J. Sharland, "Sources of Noise in Axial Flow Fans," Journal of Sound and Vibration, vol. 1, pp. 302-322, 1964.
[2] R. E. Longhouse, "Vortex Shedding Noise of Low Tip Speed, Axial-Flow Fans," Journal of Sound and Vibration, vol. 53, pp. 25-46, 1977.
[3] R. E. Longhouse, "Control of Tip-Vortex Noise of Axial-Flow Fans by Rotating Shrouds," Journal of Sound and Vibration, vol. 58, pp. 201-214, 1978.
[4] T. F. Brooks, D. S. Pope, and M. A. Marcolini, "Airfoil self-noise and prediction," National Aeronautics and Space Administration, Office of Management, Scientific and Technical Information Division, Washington, D.C., 1989.
[5] M. J. Lighthill, "On Sound Generated Aerodynamically . II. Turbulence as a Source of Sound," Proceedings of the Royal Society of London Series A, vol. 222, pp. 1-32, 1954.
[6] K. D. Kryter and K. S. Pearsons, "Judged Noisiness of a Band of Random Noise Containing an Audible Pure Tone," Journal of the Acoustical Society of America, vol. 38, pp. 106-112, 1965.
Chapter 2 Literature Review 12
[7] R. W. Paterson, P. G. Vogt, M. R. Fink, and C. L. Munch, "Vortex Noise of Isolated
Airfoils," Journal of Aircraft, vol. 10, pp. 296 - 302, 1973.
[8] C. K. W. Tam, "Discrete Tones of Isolated Airfoils," Journal of the Acoustical Society of America, vol. 55, pp. 1173-1177, 1974.
[9] T. F. Brooks and T. H. Hodgson, "Trailing Edge Noise Prediction from Measured Surface Pressures," Journal of Sound and Vibration, vol. 78, pp. 69-117, 1981.
[10] T. P. Chong, P. F. Joseph, and M. Gruber, "Airfoil self noise reduction by non-flat plate type trailing edge serrations," Applied Acoustics, vol. 74, pp. 607-613, Apr 2013.
[11] W. M. Deeprose, "Fan Noise Generation and its Control," Chartered Mechanical Engineer, pp. 64 - 69, November 1974.
[12] S. C. Yen and F. K. T. Lin, "Exit Flow Field and Performance of Axial Flow Fans," Journal of Fluids Engineering - Transactions of the ASME, vol. 128, pp. 332-340, Mar 2006.
[13] A. Nashimoto, N. Fujisawa, T. Akuto, and Y. Nagase, "Measurements of aerodynamic noise and wake flow field in a cooling fan with winglets," Journal of Visualization, vol. 7, pp. 85-92, 2004.
[14] J. M. Fitzgerald and G. C. Lauchle, "Reduction of Discrete Frequency Noise in Small, Subsonic Axial-Flow Fans," Journal of the Acoustical Society of America, vol. 76, pp. 158-166, 1984.
[15] P. T. Soderman, "Leading-Edge Serrations Which Reduce the Noise of Low-Speed Rotors," NASA TN D-7371, 1973.
[16] N. A. Cumpsty, "A Critical Review of Turbomachinery Noise," Journal of Fluids Engineering - Transactions of the ASME, vol. 99, pp. 278-293, 1977.
[17] T. Fukano, Y. Takamatsu, and Y. Kodama, "The Effects of Tip Clearance on the Noise of Low-Pressure Axial and Mixed Flow Fans," Journal of Sound and Vibration, vol. 105, pp. 291-308, Mar 8 1986.
[18] P. I. D. Cooper, R. J.; Chan, C. Y. L.; Welsh, M. C., "Improvements to Engine Cooling Systems in the Mineral Industries," presented at the Institution of Engineers, Australia National Conference, Perth, 1989.
[19] R. E. Longhouse, "Noise Mechanism Separation and Design Considerations for Low Tip-Speed, Axial-Flow Fans," Journal of Sound and Vibration, vol. 48, pp. 461-474, 1976.
[20] N. L. S. Filleul, "An Investigation of Axial Flow Fan Noise," Journal of Sound and Vibration, vol. 3, pp. 147-165, 1966.
[21] M. Fiebig, "Vortices, Generators and Heat Transfer," Chemical Engineering Research & Design, vol. 76, pp. 108-123, Feb 1998.
Chapter 3
Experimental Facility
Summary
A facility was constructed and commissioned in accordance with ISO 10302-1 to determine the acoustic and aerodynamic performance of small axial flow fans.
Chapter 3 Experimental Facility 14
Table of Contents
Summary .................................................................................................................................. 13
List of Figures and Tables........................................................................................................ 15
3.1 Introduction ................................................................................................................... 16
3.2 Test Environment .......................................................................................................... 16
3.3 Fan Test Arrangement................................................................................................... 17
3.3.1 Test Rig Specifications .......................................................................................... 17
3.3.2 Test Rig Qualification ........................................................................................... 20
3.4 Instrumentation ............................................................................................................. 23
3.4.1 Data Acquisition System ....................................................................................... 23
3.4.2 Motor Control System ........................................................................................... 23
3.4.3 Pressure Measurement ........................................................................................... 24
3.4.4 Air Flow Rate Measurement .................................................................................. 24
3.4.5 Development of Flow Rate Prediction .................................................................. 28
3.4.6 Sound Power Level Measurement ......................................................................... 30
3.4.7 Fan Environment ................................................................................................... 32
3.5 References ..................................................................................................................... 32

Chapter 3 Experimental Facility 15
List of Figures and Tables
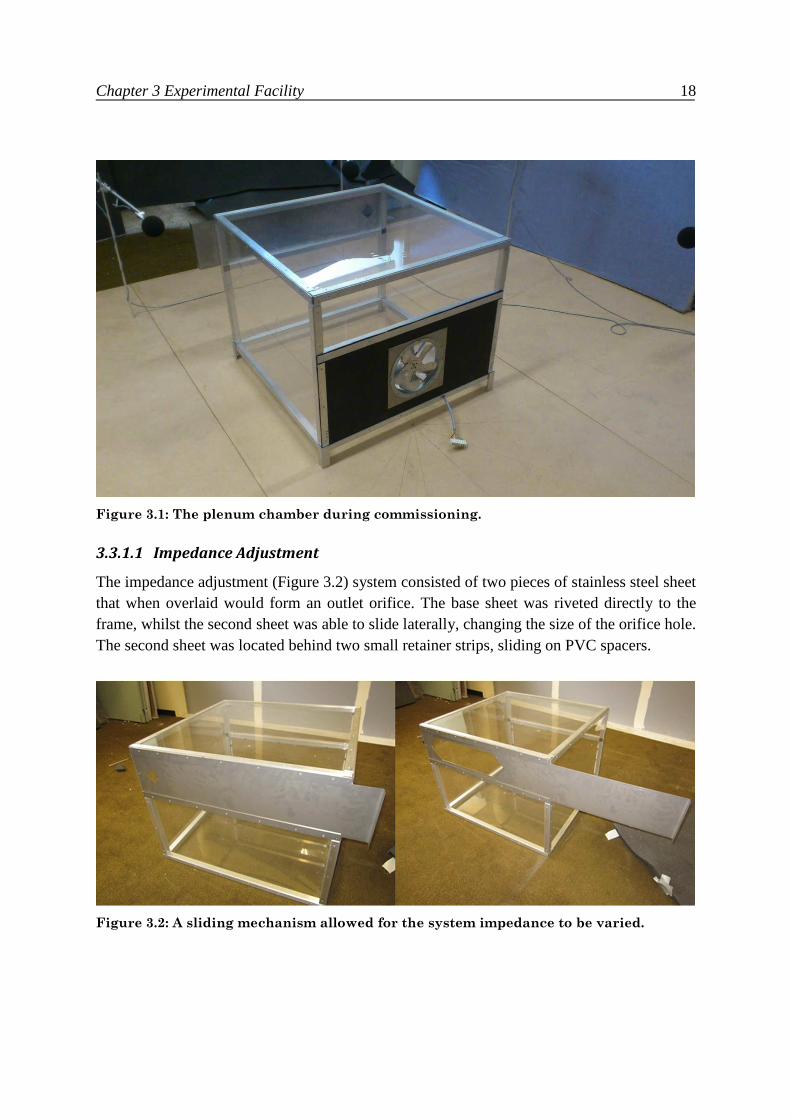
Figure 3.1: The plenum chamber during commissioning. ....................................................... 18
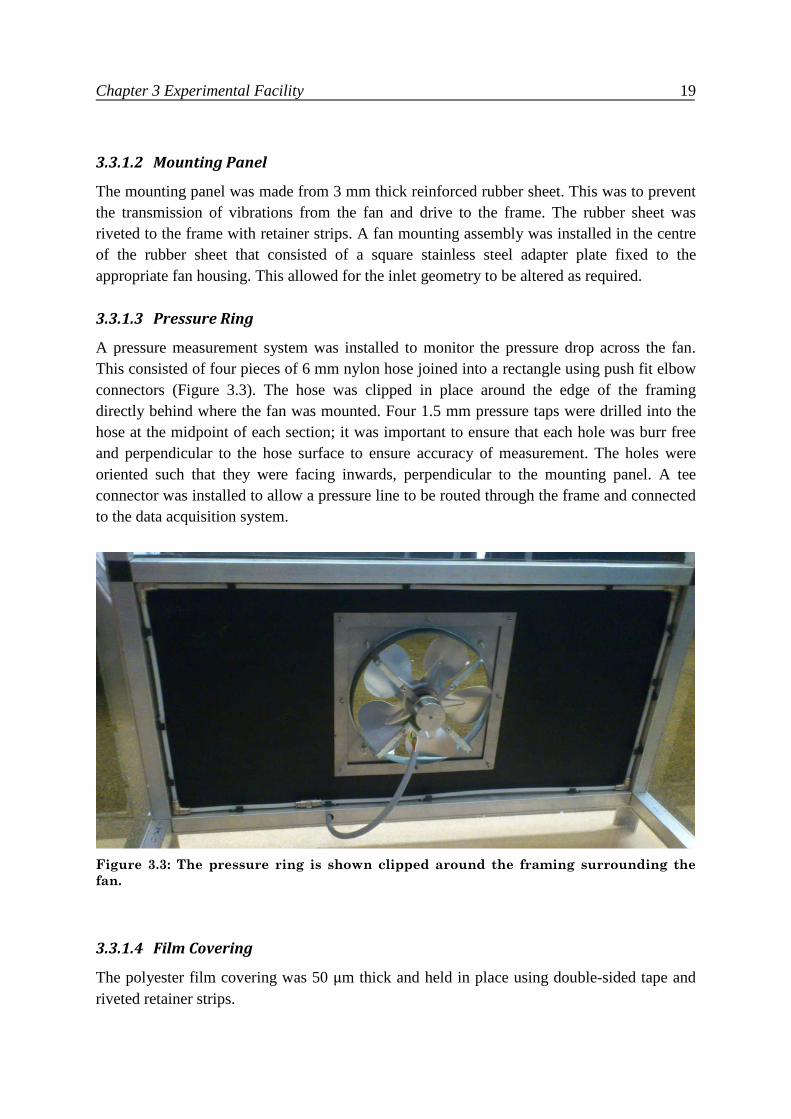
Figure 3.2: A sliding mechanism allowed for the system impedance to be varied. ................ 18
Figure 3.3: The pressure ring is shown clipped around the framing surrounding the fan. ...... 19
Figure 3.4: Hemisphere measurement of loudspeaker for transparency measurements showing insertion of plenum chamber. .................................................................................................. 20
Figure 3.5: Insertion loss of plenum chamber with both the chamber and sound source mounted directly on MDF surface. The blue lines indicate the preferred limits for insertion loss, while the red lines indicate the maximum allowable insertion loss. ............................... 21
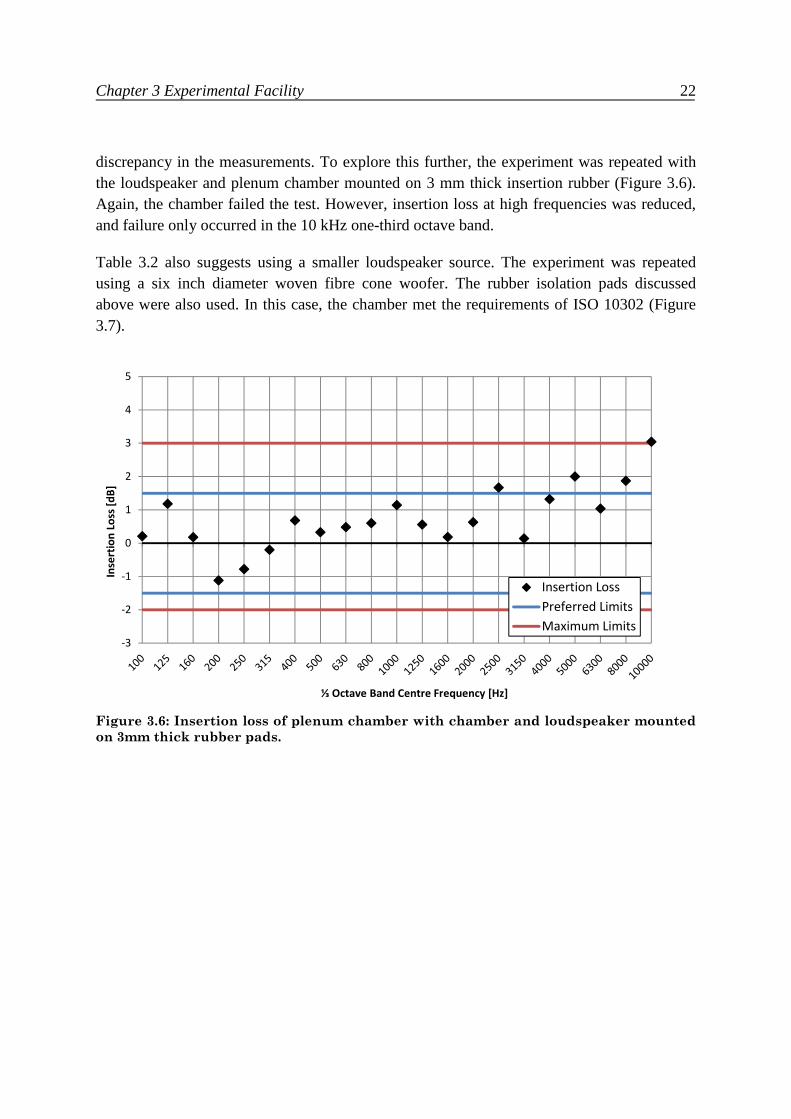
Figure 3.6: Insertion loss of plenum chamber with chamber and loudspeaker mounted on 3mm thick rubber pads............................................................................................................. 22
Figure 3.7: Insertion loss of plenum chamber using six inch loudspeaker source and rubber isolation pads. The chamber meets the requirements of ISO 10302........................................ 23
Figure 3.8: Measurement grid for outlet flow velocity. The left, central, and right sections were divided evenly with measurement points located at the centroid of each sub-section.... 25
Figure 3.9: Flow velocity map for orifice position x = 0 mm. a) Set one. b) Set two. ............ 26
Figure 3.10: Flow velocity map for orifice position x = 60 mm. a) Set one. b) Set two. ........ 26
Figure 3.11: Flow velocity map for orifice position x = 120 mm. a) Set one. b) Set two. ...... 27
Figure 3.12: Flow velocity map for orifice position x = 180 mm. a) Set one. b) Set two. ...... 27
Figure 3.13: Data generated from flow rate measurements confirm the proportionality relationship described by Equation 3.4. ................................................................................... 30
Figure 3.14: Plan view showing microphone locations, sheet arrangement and chamber placement for hemisphere array. The height of each microphone from the reflective surface is given alongside the microphone number. ................................................................................ 31
Table 3.1: Results of an absolute comparison test in the University of Canterbury aero-acoustics laboratory. ................................................................................................................ 16
Table 3.2: Possible causes of discrepancy for acoustic transparency. ..................................... 21
Table 3.3: Comparison of flow rate measurements for ∆P ≈ 25 Pa. ........................................ 28
Table 3.4: System configuration and measurement count for design and validation of flow rate prediction equation............................................................................................................ 29
Chapter 3 Experimental Facility 16
3.1 Introduction
This chapter describes the experimental facility and methods developed for testing small axial flow fans. A test facility was built according to ISO 10302-1 – Measurement of airborne noise emitted by small air moving devices [1]. The measurements required were the sound power level, the static pressure drop across the fan, the air flow rate through the system, the shaft output power of the motor, and the fan speed.
3.2 Test Environment
The tests were carried out in a semi-anechoic environment over a reflecting plane in the aero-acoustics laboratory at the University of Canterbury, in accordance with ISO 10302-1. The reflective plane was constructed from three 3660 x 1220 mm sheets of 25 mm MDF board. The walls of the room were covered with sound absorption material, absorbent polyester panels were suspended to cover the ceiling, and hanging panel absorbers were distributed around the room.
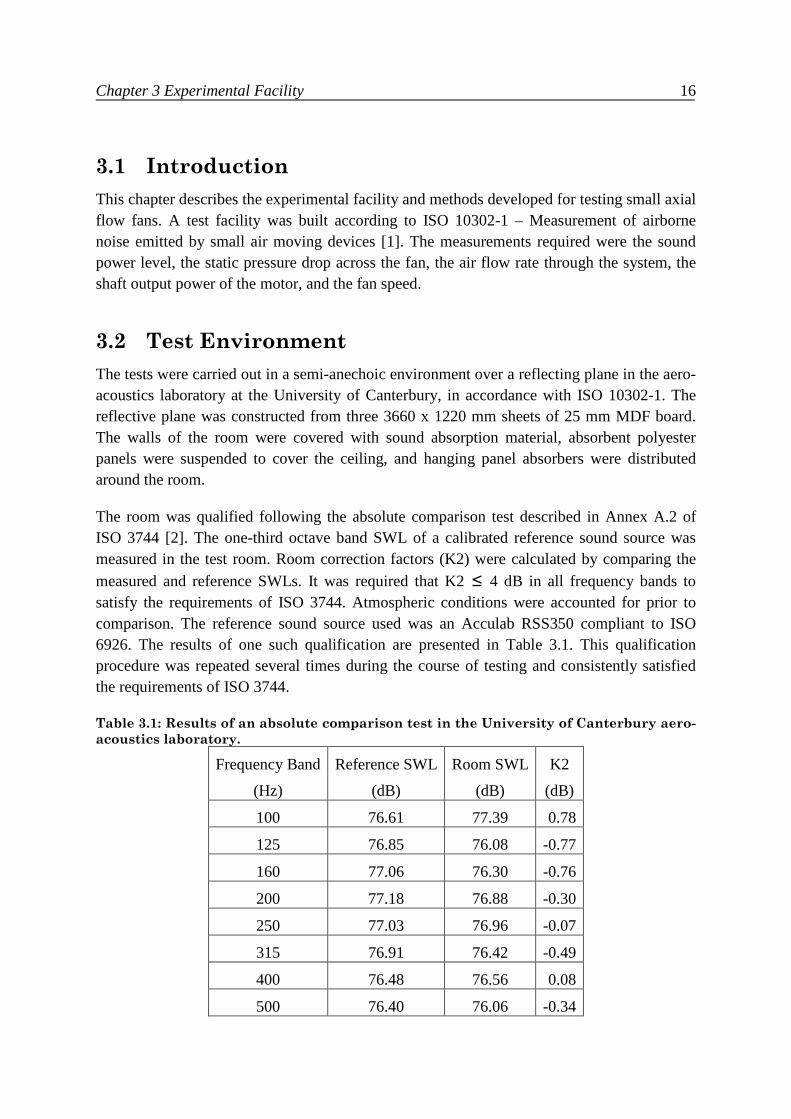
The room was qualified following the absolute comparison test described in Annex A.2 of ISO 3744 [2]. The one-third octave band SWL of a calibrated reference sound source was measured in the test room. Room correction factors (K2) were calculated by comparing the measured and reference SWLs. It was required that K2 ≤ 4 dB in all frequency bands to satisfy the requirements of ISO 3744. Atmospheric conditions were accounted for prior to comparison. The reference sound source used was an Acculab RSS350 compliant to ISO 6926. The results of one such qualification are presented in Table 3.1. This qualification procedure was repeated several times during the course of testing and consistently satisfied the requirements of ISO 3744.
Table 3.1: Results of an absolute comparison test in the University of Canterbury aero-
acoustics laboratory.
Frequency Band
(Hz)
Reference SWL
(dB)
Room SWL
(dB)
K2
(dB)
100 76.61 77.39 0.78
125 76.85 76.08 -0.77
160 77.06 76.30 -0.76
200 77.18 76.88 -0.30
250 77.03 76.96 -0.07
315 76.91 76.42 -0.49
400 76.48 76.56 0.08
500 76.40 76.06 -0.34
Chapter 3 Experimental Facility 17
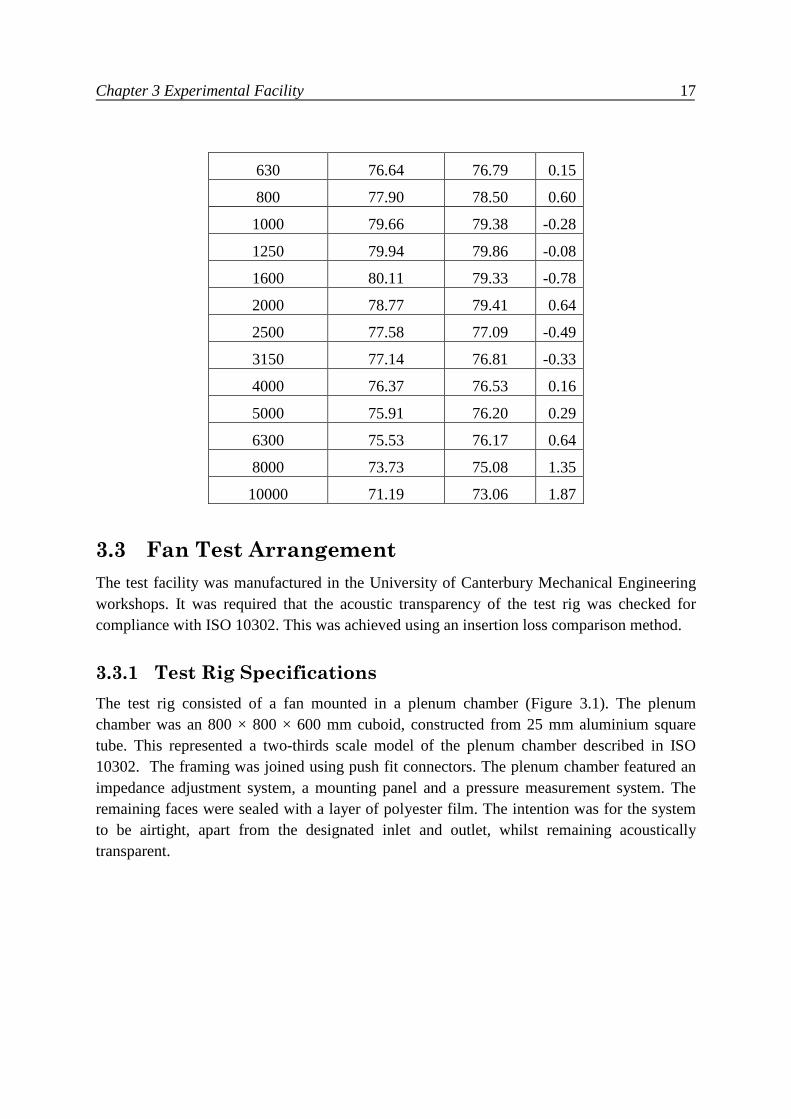
630 76.64 76.79 0.15
800 77.90 78.50 0.60
1000 79.66 79.38 -0.28
1250 79.94 79.86 -0.08
1600 80.11 79.33 -0.78
2000 78.77 79.41 0.64
2500 77.58 77.09 -0.49
3150 77.14 76.81 -0.33
4000 76.37 76.53 0.16
5000 75.91 76.20 0.29
6300 75.53 76.17 0.64
8000 73.73 75.08 1.35
10000 71.19 73.06 1.87
3.3 Fan Test Arrangement
The test facility was manufactured in the University of Canterbury Mechanical Engineering workshops. It was required that the acoustic transparency of the test rig was checked for compliance with ISO 10302. This was achieved using an insertion loss comparison method.
3.3.1 Test Rig Specifications
The test rig consisted of a fan mounted in a plenum chamber (Figure 3.1). The plenum chamber was an 800 × 800 × 600 mm cuboid, constructed from 25 mm aluminium square tube. This represented a two-thirds scale model of the plenum chamber described in ISO 10302. The framing was joined using push fit connectors. The plenum chamber featured an impedance adjustment system, a mounting panel and a pressure measurement system. The remaining faces were sealed with a layer of polyester film. The intention was for the system to be airtight, apart from the designated inlet and outlet, whilst remaining acoustically transparent.
Chapter 3 Experimental Facility 18
Figure 3.1: The plenum chamber during commissioning.
3.3.1.1 Impedance Adjustment
The impedance adjustment (Figure 3.2) system consisted of two pieces of stainless steel sheet that when overlaid would form an outlet orifice. The base sheet was riveted directly to the frame, whilst the second sheet was able to slide laterally, changing the size of the orifice hole. The second sheet was located behind two small retainer strips, sliding on PVC spacers.
Figure 3.2: A sliding mechanism allowed for the system impedance to be varied.
Chapter 3 Experimental Facility 19
3.3.1.2 Mounting Panel
The mounting panel was made from 3 mm thick reinforced rubber sheet. This was to prevent the transmission of vibrations from the fan and drive to the frame. The rubber sheet was riveted to the frame with retainer strips. A fan mounting assembly was installed in the centre of the rubber sheet that consisted of a square stainless steel adapter plate fixed to the appropriate fan housing. This allowed for the inlet geometry to be altered as required.
3.3.1.3 Pressure Ring
A pressure measurement system was installed to monitor the pressure drop across the fan. This consisted of four pieces of 6 mm nylon hose joined into a rectangle using push fit elbow connectors (Figure 3.3). The hose was clipped in place around the edge of the framing directly behind where the fan was mounted. Four 1.5 mm pressure taps were drilled into the hose at the midpoint of each section; it was important to ensure that each hole was burr free and perpendicular to the hose surface to ensure accuracy of measurement. The holes were oriented such that they were facing inwards, perpendicular to the mounting panel. A tee connector was installed to allow a pressure line to be routed through the frame and connected to the data acquisition system.
Figure 3.3: The pressure ring is shown clipped around the framing surrounding the
fan.
3.3.1.4 Film Covering
The polyester film covering was 50 μm thick and held in place using double-sided tape and riveted retainer strips.

Chapter 3 Experimental Facility 20
3.3.2 Test Rig Qualification
The acoustic transparency of the plenum chamber was verified using an insertion loss test. A loudspeaker sound source generating white noise was placed in the centre of the hemispherical microphone array (Figure 3.4). The sound pressure level (SPL) at each microphone location was measured in one-third octave bands from 100 Hz – 10 kHz. The plenum chamber, with mounting panel and fan removed, was lowered over the loudspeaker. The SPL was again measured at each microphone location and the sound power level (SWL) was calculated for each one-third octave band. ISO 10302 states that the one-third octave band insertion loss of the test plenum should not be greater than (0��
�� ) dB, and preferably not greater than (0 ± 1.5) dB. Insertion loss is defined in Equation 3.1.
�� �,� � � �,�� (3.1)
Where ∆L is the insertion loss, Lw,out is the sound power level determined without the plenum chamber, and Lw,in is the sound power level determined with the plenum chamber in place.
Figure 3.4: Hemisphere measurement of loudspeaker for transparency measurements
showing insertion of plenum chamber.
Initial measurements at five of the ten locations indicated difficulties in achieving the required transparency. Thus further investigations into the insertion loss test were carried out. Possible causes of discrepancy and solutions are identified in Table 3.2.

Chapter 3 Experimental Facility 21
Table 3.2: Possible causes of discrepancy for acoustic transparency.
Cause of Discrepancy Solution
Change of loading on the loudspeaker driver alters frequency response.
Repeat test using a smaller loudspeaker.
Reflection of sound due to steel orifice plate.
Confirm with line of sight photography. A clear line of sight from microphone to source may be required. If energy is being reflected to another microphone the effect on the overall SWL may be inconsequential.
Loudspeaker exciting floor panels and chamber frame.
Mount speaker and frame on rubber sheet to damp structural vibrations.
Excitation of steel orifice plate, resulting in large radiation surface.
Add damping material to slider arrangement.
Further measurements were carried out once a ten channel measurement system was available. The chamber failed the test, with the insertion loss exceeding 3 dB in the 5, 8 and 10 kHz one-third octave bands (Figure 3.5). In general an increase in insertion loss was observed above 2 kHz.
Figure 3.5: Insertion loss of plenum chamber with both the chamber and sound source
mounted directly on MDF surface. The blue lines indicate the preferred limits for
insertion loss, while the red lines indicate the maximum allowable insertion loss.
As mentioned in Table 3.2 it was hypothesised that structure-borne vibration between the MDF panel, the loudspeaker sound source, and the plenum chamber could cause some
-3
-2
-1
0
1
2
3
4
5
Inse
rtio
n L
oss
[d
B]
⅓ Octave Band Centre Frequency [Hz]
Insertion Loss
Preferred Limits
Maximum Limits
Chapter 3 Experimental Facility 22
discrepancy in the measurements. To explore this further, the experiment was repeated with the loudspeaker and plenum chamber mounted on 3 mm thick insertion rubber (Figure 3.6). Again, the chamber failed the test. However, insertion loss at high frequencies was reduced, and failure only occurred in the 10 kHz one-third octave band.
Table 3.2 also suggests using a smaller loudspeaker source. The experiment was repeated using a six inch diameter woven fibre cone woofer. The rubber isolation pads discussed above were also used. In this case, the chamber met the requirements of ISO 10302 (Figure 3.7).
Figure 3.6: Insertion loss of plenum chamber with chamber and loudspeaker mounted
on 3mm thick rubber pads.
-3
-2
-1
0
1
2
3
4
5
Inse
rtio
n L
oss
[d
B]
⅓ Octave Band Centre Frequency [Hz]
Insertion Loss
Preferred Limits
Maximum Limits

Chapter 3 Experimental Facility 23
Figure 3.7: Insertion loss of plenum chamber using six inch loudspeaker source and
rubber isolation pads. The chamber meets the requirements of ISO 10302.
3.4 Instrumentation
3.4.1 Data Acquisition System
A data acquisition system (DAQ) using a National Instruments USB-6009 module was assembled in the electronics workshop in the Department of Mechanical Engineering. The DAQ system was connected to a laptop via USB and monitored using National Instruments LabView software.
3.4.2 Motor Control System
3.4.2.1 Air-Drive Fan Testing
The Air-Drive fans discussed in Chapter 4 were driven by a Maxon EC45 flat 70 W brushless DC Motor with inbuilt Hall sensors. This allowed for the fan speed (N) to be monitored and controlled when paired with a Maxon ESCON 50/5 speed controller unit. The fan speed was able to be controlled in LabView. The current drawn by the motor was also measured, and was used to calculate the power at the motor shaft.
-3
-2
-1
0
1
2
3
4
5
Inse
rtio
n L
oss
[d
B]
⅓ Octave Band Centre Frequency [Hz]
Insertion Loss
Preferred Limits
Maximum Limits
Chapter 3 Experimental Facility 24
3.4.2.2 Fanpack Testing
The sample fanpack that was tested was supplied with an appropriate motor and speed controller. The fan speed was checked manually using a handheld laser tachometer. The power consumption of the motor was measured using a clip-on AC power meter.
3.4.3 Pressure Measurement
The static pressure drop across the fan (∆P) was measured using the pressure ring, as described in Section 3.3.2 of ISO 10302. A 6 mm nylon tube was attached to a tee connector in the pressure ring and routed through the frame to the data acquisition system. This pressure line was connected directly to a Dwyer MS 321 differential pressure transmitter that gave a digital readout as well as providing a 0 - 10 V analog output signal that was routed to the DAQ for data-logging.
3.4.4 Air Flow Rate Measurement
The air flow rate (Q) through the plenum chamber was investigated using a hot-wire anemometer. It was found that there exists a relationship between the air flow rate, the pressure drop and the orifice area. An empirical equation was developed to predict the air flow rate.
3.4.4.1 Flow Velocity Measurement
Air flow velocity measurements were made using a calibrated Dantec multi-channel constant temperature anemometry (CTA) system with a 55P11 hot wire probe.
3.4.4.2 Determination of Air Flow Rate
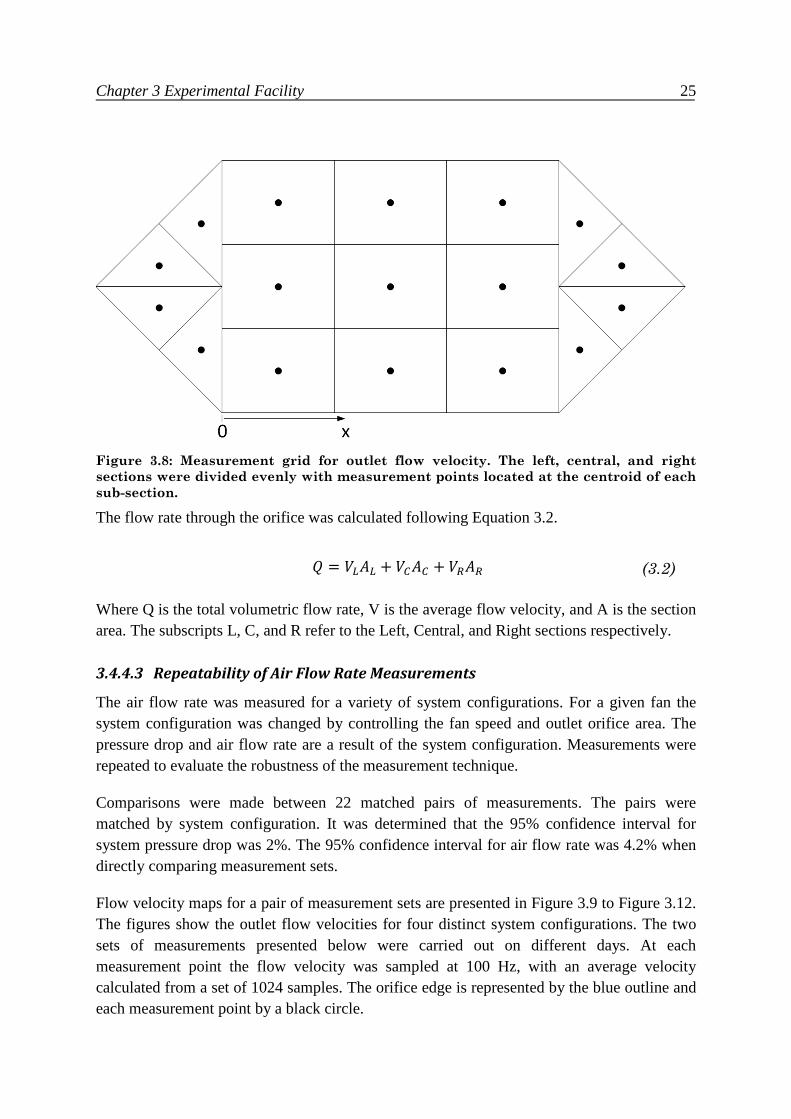
The air flow rate was determined by finding the mean flow velocity at the outlet orifice of the plenum chamber. This presented some challenges as the outlet area was not constant during fan characterisation testing, and the flow at the outlet was turbulent and non-uniform. A 17 point measurement grid was created to define a set of measurement locations that would fairly represent the outlet as a whole. Due to the geometry of the outlet orifice, it was treated as three distinct sections; left, right, and central. The left and right sections were triangular, and were divided further into four equal triangular sub-sections. The central area was divided into nine equal rectangular sub-sections. Measurement points were placed at the centroid of each sub-section. As the size of the orifice is adjustable the area of the central section does not remain constant. The sub-sections and measurement locations were adjusted accordingly, based on the width of the central section. A graphical representation of the sub-sections and measurement points is shown in Figure 3.8. The width of the central section (x) is known as the orifice position, and is used hereafter to describe the state of the outlet orifice.
Chapter 3 Experimental Facility 25
Figure 3.8: Measurement grid for outlet flow velocity. The left, central, and right
sections were divided evenly with measurement points located at the centroid of each
sub-section.
The flow rate through the orifice was calculated following Equation 3.2.
� ���� � ���� � ���� (3.2)
Where Q is the total volumetric flow rate, V is the average flow velocity, and A is the section area. The subscripts L, C, and R refer to the Left, Central, and Right sections respectively.
3.4.4.3 Repeatability of Air Flow Rate Measurements
The air flow rate was measured for a variety of system configurations. For a given fan the system configuration was changed by controlling the fan speed and outlet orifice area. The pressure drop and air flow rate are a result of the system configuration. Measurements were repeated to evaluate the robustness of the measurement technique.
Comparisons were made between 22 matched pairs of measurements. The pairs were matched by system configuration. It was determined that the 95% confidence interval for system pressure drop was 2%. The 95% confidence interval for air flow rate was 4.2% when directly comparing measurement sets.
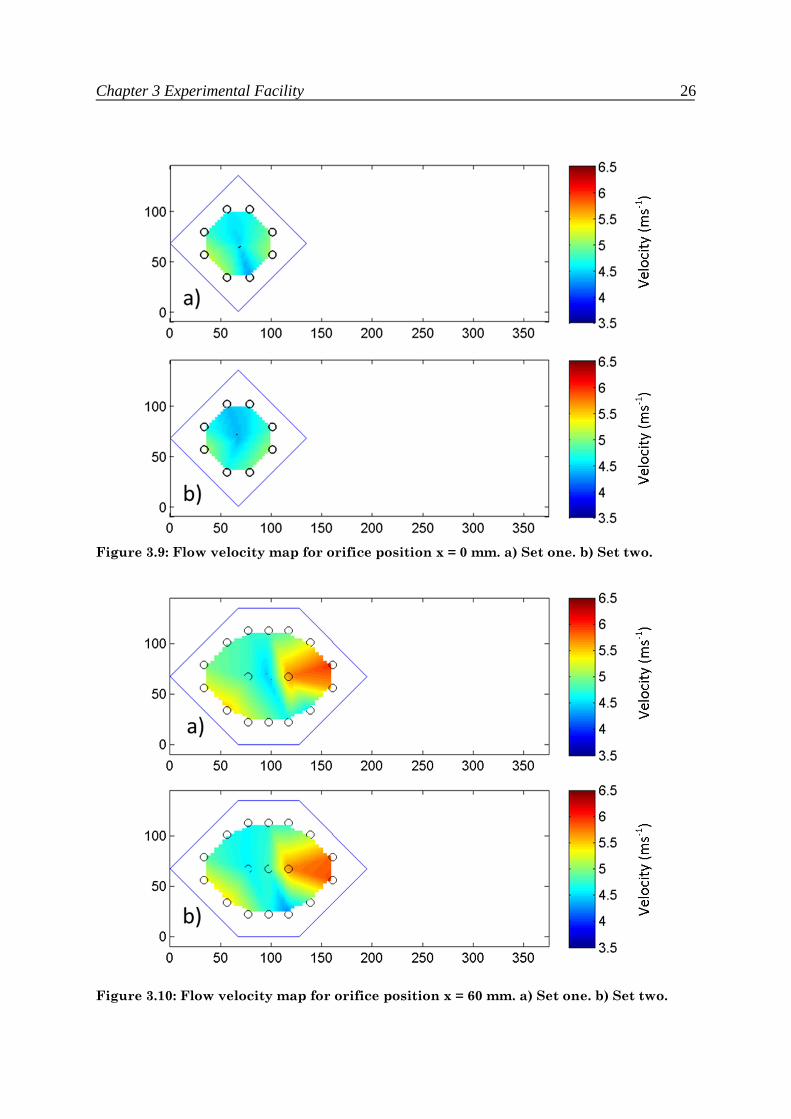
Flow velocity maps for a pair of measurement sets are presented in Figure 3.9 to Figure 3.12. The figures show the outlet flow velocities for four distinct system configurations. The two sets of measurements presented below were carried out on different days. At each measurement point the flow velocity was sampled at 100 Hz, with an average velocity calculated from a set of 1024 samples. The orifice edge is represented by the blue outline and each measurement point by a black circle.
Chapter 3 Experimental Facility 26
Figure 3.9: Flow velocity map for orifice position x = 0 mm. a) Set one. b) Set two.
Figure 3.10: Flow velocity map for orifice position x = 60 mm. a) Set one. b) Set two.
Chapter 3 Experimental Facility 27
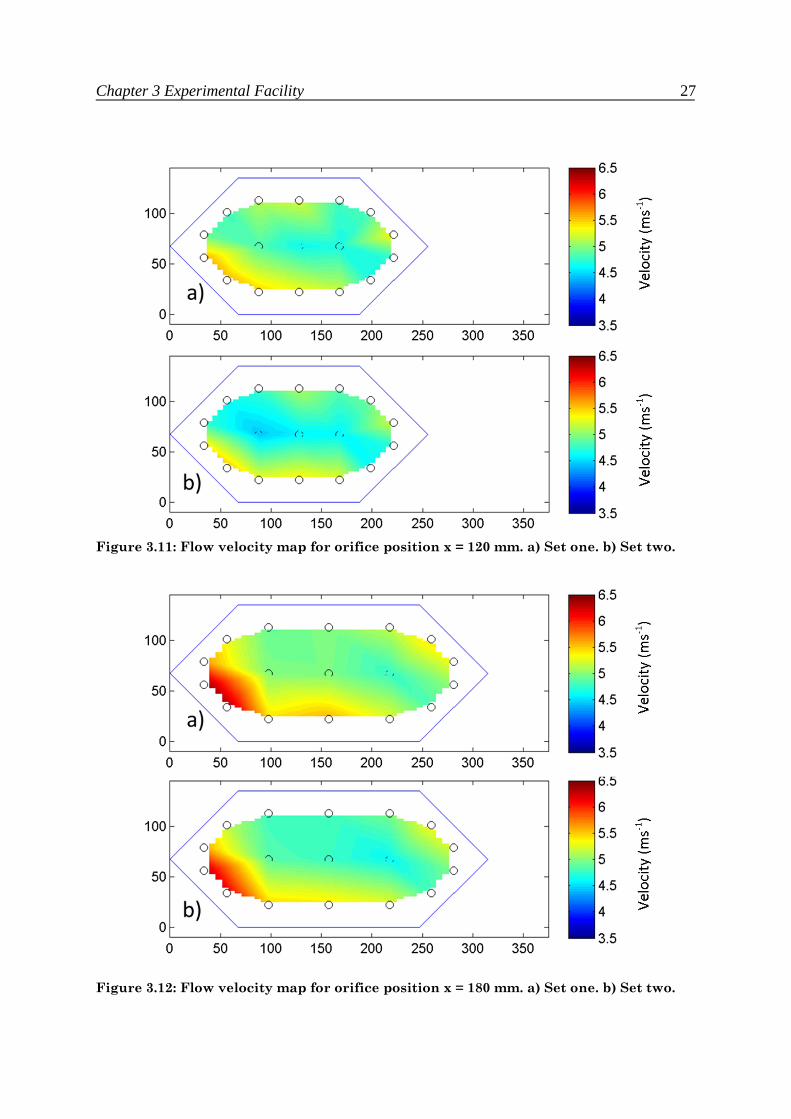
Figure 3.11: Flow velocity map for orifice position x = 120 mm. a) Set one. b) Set two.
Figure 3.12: Flow velocity map for orifice position x = 180 mm. a) Set one. b) Set two.
Chapter 3 Experimental Facility 28
The above figures show that the flow at the outlet orifice is not uniform, and the location of areas of high or low velocity are not consistent between system configurations. For example Figure 3.10 shows an area of high flow velocity toward the right side of the orifice, while Figure 3.12 has a similar area in the bottom left corner.
There is good consistency between measurement sets shown by the repeatability of the velocity maps. In particular the area of high velocity at the bottom left of Figure 3.12 is captured consistently in both measurements. This gives confidence that this area of high velocity is a real phenomenon due to flow conditions in the plenum chamber, and not the result of a measurement system inadequacy.
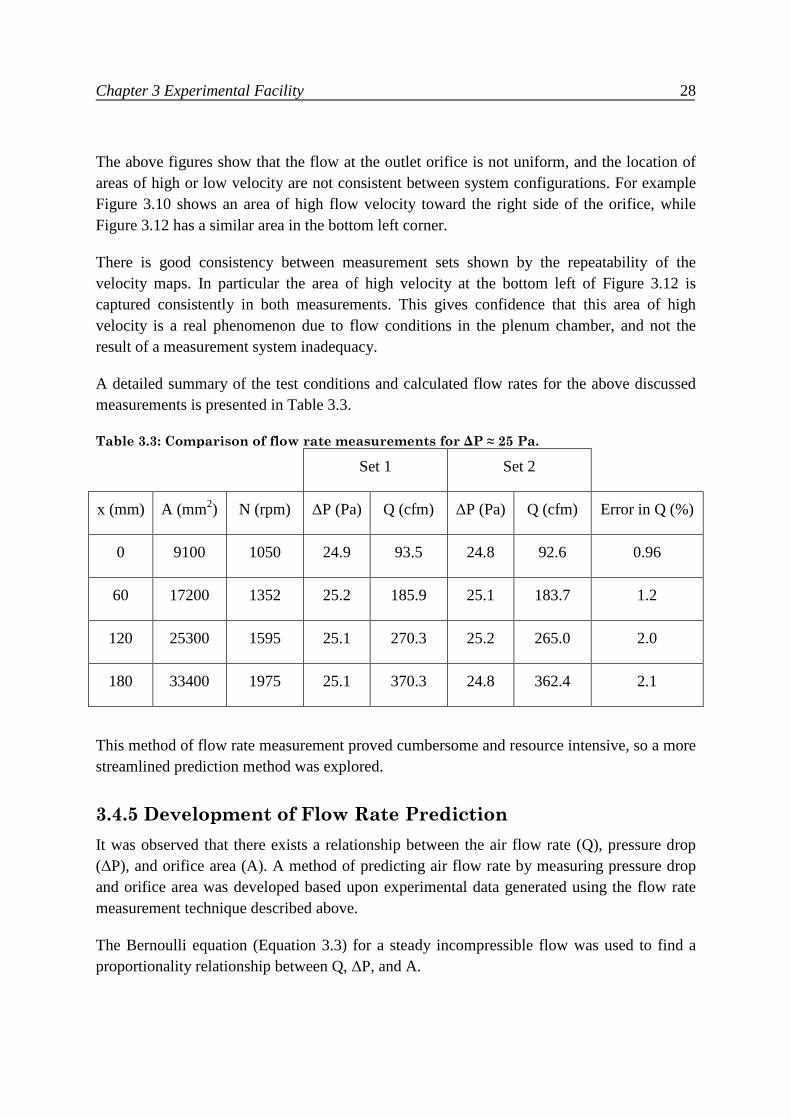
A detailed summary of the test conditions and calculated flow rates for the above discussed measurements is presented in Table 3.3.
Table 3.3: Comparison of flow rate measurements for ∆P ≈ 25 Pa.
Set 1 Set 2
x (mm) A (mm2) N (rpm) ∆P (Pa) Q (cfm) ∆P (Pa) Q (cfm) Error in Q (%)
0 9100 1050 24.9 93.5 24.8 92.6 0.96
60 17200 1352 25.2 185.9 25.1 183.7 1.2
120 25300 1595 25.1 270.3 25.2 265.0 2.0
180 33400 1975 25.1 370.3 24.8 362.4 2.1
This method of flow rate measurement proved cumbersome and resource intensive, so a more streamlined prediction method was explored.
3.4.5 Development of Flow Rate Prediction
It was observed that there exists a relationship between the air flow rate (Q), pressure drop (∆P), and orifice area (A). A method of predicting air flow rate by measuring pressure drop and orifice area was developed based upon experimental data generated using the flow rate measurement technique described above.
The Bernoulli equation (Equation 3.3) for a steady incompressible flow was used to find a proportionality relationship between Q, ∆P, and A.
Chapter 3 Experimental Facility 29
����
���
�� ��
����
���
�� ��� (3.3)
Where P is pressure, ρ is density, v is velocity, g is gravity and z is height. Assuming that there is no flow in the plenum chamber and no change in potential energy the Bernoulli equation was rearranged to give the proportionality relationship in Equation 3.4.
� ∝ �√�# (3.4)
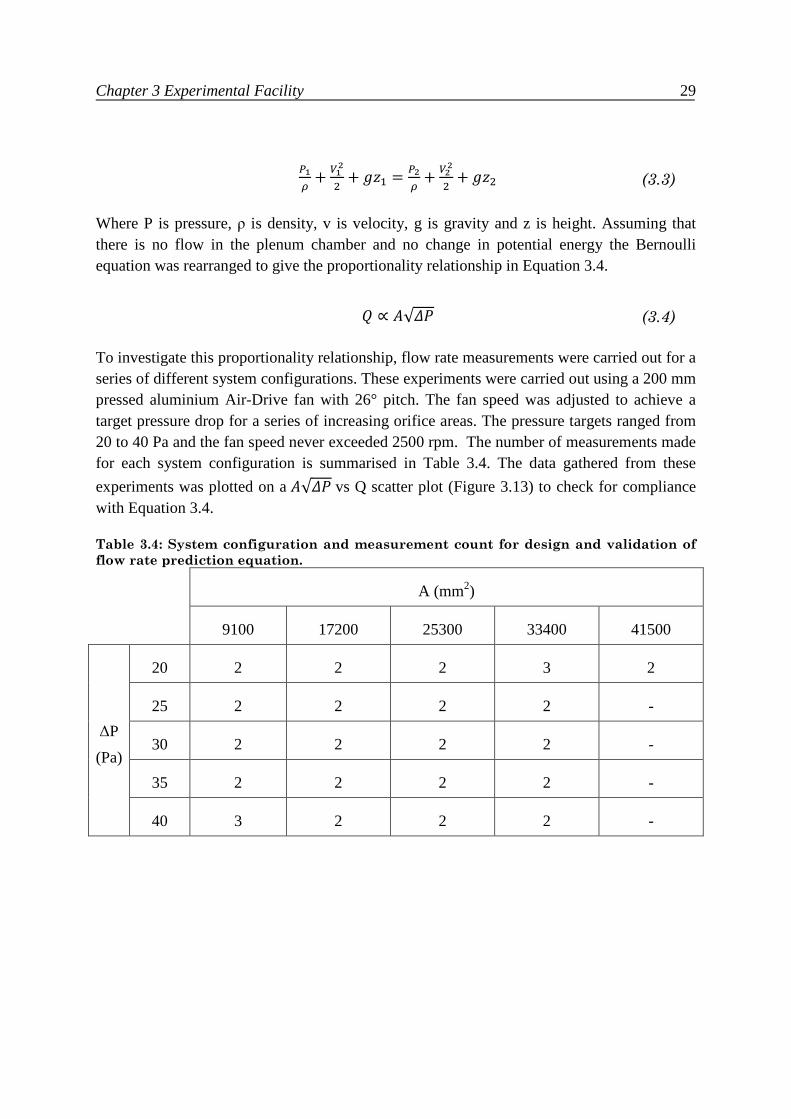
To investigate this proportionality relationship, flow rate measurements were carried out for a series of different system configurations. These experiments were carried out using a 200 mm pressed aluminium Air-Drive fan with 26° pitch. The fan speed was adjusted to achieve a target pressure drop for a series of increasing orifice areas. The pressure targets ranged from 20 to 40 Pa and the fan speed never exceeded 2500 rpm. The number of measurements made for each system configuration is summarised in Table 3.4. The data gathered from these
experiments was plotted on a �√�# vs Q scatter plot (Figure 3.13) to check for compliance with Equation 3.4.
Table 3.4: System configuration and measurement count for design and validation of
flow rate prediction equation.
A (mm2)
9100 17200 25300 33400 41500
∆P
(Pa)
20 2 2 2 3 2
25 2 2 2 2 -
30 2 2 2 2 -
35 2 2 2 2 -
40 3 2 2 2 -
Chapter 3 Experimental Facility 30
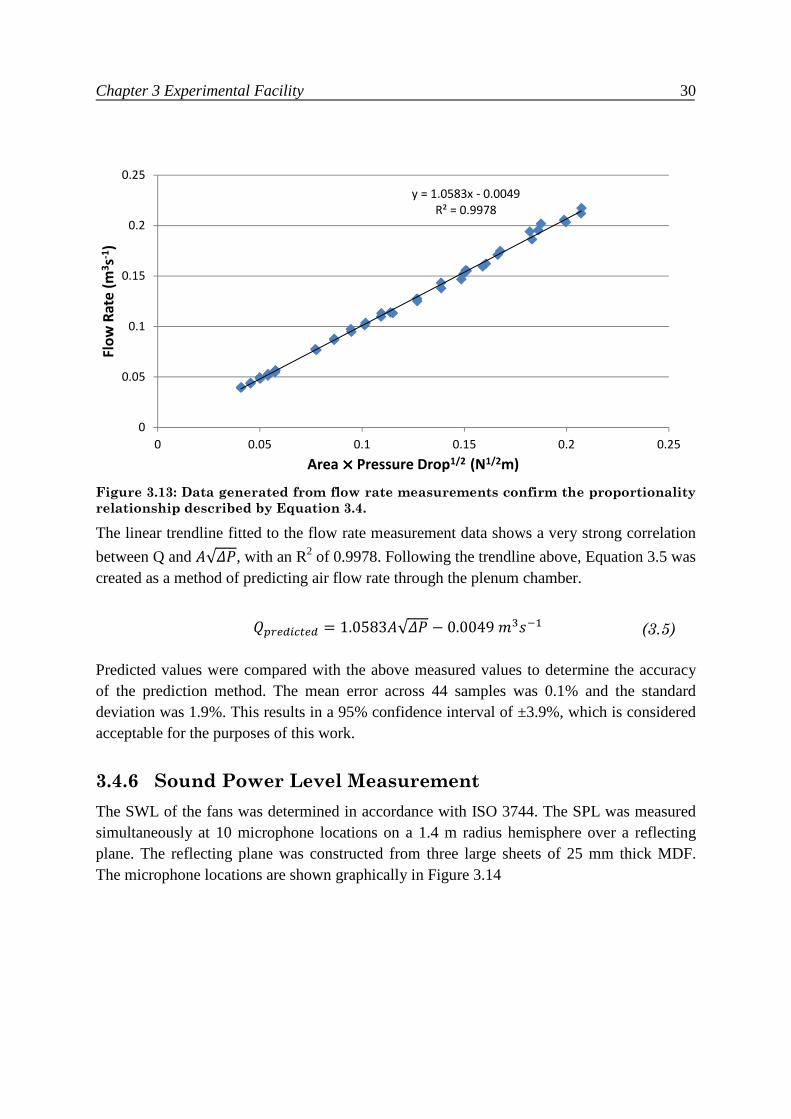
Figure 3.13: Data generated from flow rate measurements confirm the proportionality
relationship described by Equation 3.4.
The linear trendline fitted to the flow rate measurement data shows a very strong correlation
between Q and �√�#, with an R2 of 0.9978. Following the trendline above, Equation 3.5 was created as a method of predicting air flow rate through the plenum chamber.
�$%&'�(�&' 1.0583�√�# − 0.00491�2� (3.5)
Predicted values were compared with the above measured values to determine the accuracy of the prediction method. The mean error across 44 samples was 0.1% and the standard deviation was 1.9%. This results in a 95% confidence interval of ±3.9%, which is considered acceptable for the purposes of this work.
3.4.6 Sound Power Level Measurement
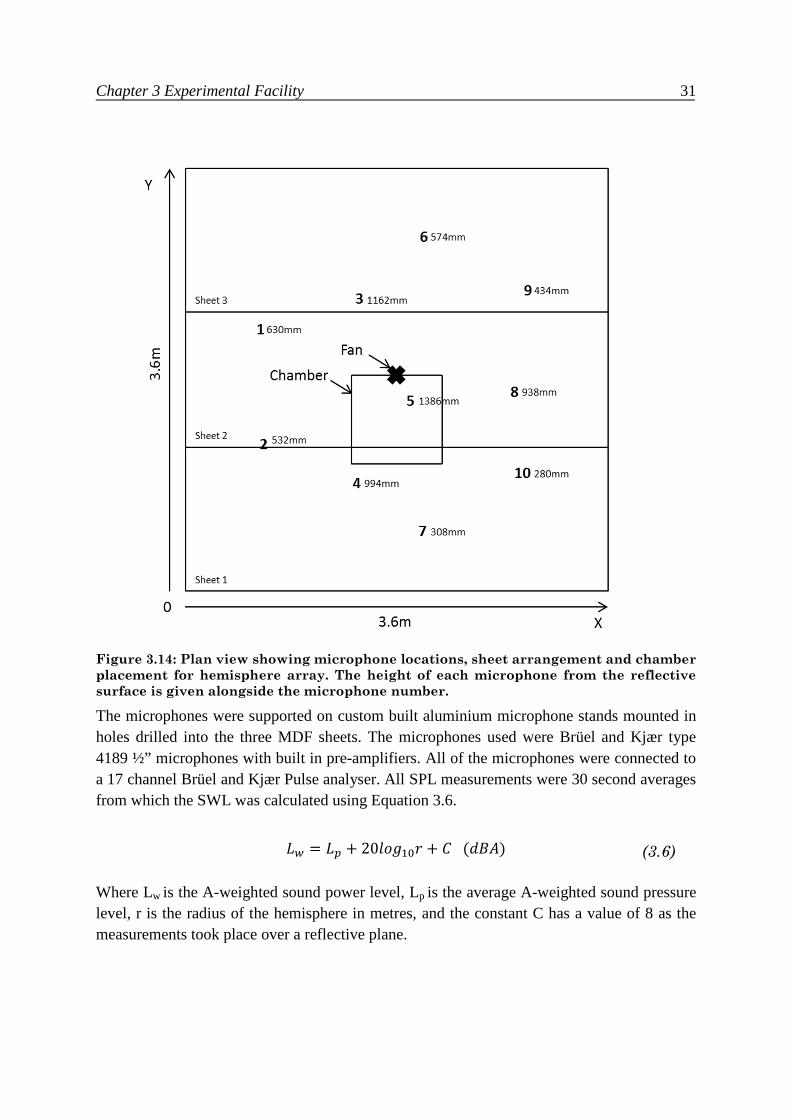
The SWL of the fans was determined in accordance with ISO 3744. The SPL was measured simultaneously at 10 microphone locations on a 1.4 m radius hemisphere over a reflecting plane. The reflecting plane was constructed from three large sheets of 25 mm thick MDF. The microphone locations are shown graphically in Figure 3.14
y = 1.0583x - 0.0049
R² = 0.9978
0
0.05
0.1
0.15
0.2
0.25
0 0.05 0.1 0.15 0.2 0.25
Flo
w R
ate
(m
3s-1
)
Area ×××× Pressure Drop1/2 (N1/2m)
Chapter 3 Experimental Facility 31
Figure 3.14: Plan view showing microphone locations, sheet arrangement and chamber
placement for hemisphere array. The height of each microphone from the reflective
surface is given alongside the microphone number.
The microphones were supported on custom built aluminium microphone stands mounted in holes drilled into the three MDF sheets. The microphones used were Brüel and Kjær type 4189 ½” microphones with built in pre-amplifiers. All of the microphones were connected to a 17 channel Brüel and Kjær Pulse analyser. All SPL measurements were 30 second averages from which the SWL was calculated using Equation 3.6.
�4 �$ � 2067� 89 � :;<=�> (3.6)
Where Lw is the A-weighted sound power level, Lp is the average A-weighted sound pressure level, r is the radius of the hemisphere in metres, and the constant C has a value of 8 as the measurements took place over a reflective plane.

Chapter 3 Experimental Facility 32
3.4.7 Fan Environment
3.4.7.1 Air-Drive Fan Testing
The Air-Drive fans were mounted in a sheet metal shroud as is typical in industrial applications. The shroud was 25 mm deep with four simple motor support struts.
3.4.7.2 Fanpack Testing
The fanpack was provided with its own moulded plastic shroud. Detailed information about this shroud is presented in Chapter 5.
3.5 References
[1] "Acoustics - Measurement of airborne noise emitted and structure-borne vibration induced by small air-moving devices - Part 1: Airborne noise measurement," in ISO Standard 10302-1, ed, 2011.
[2] "Acoustics - Determination of sound power levels and sound energy levels of noise sources using sound pressure - Engineering methods for an essentially free field over a reflecting plane," in ISO Standard 3744, ed, 2010.
Chapter 4
Performance evaluation of Air-
Drive Fans
Summary
The aerodynamic and acoustic performance of a series of Air-Drive pressed aluminium axial fans was evaluated following the methods described in Chapter 3.

Chapter 4 Performance Evaluation of Air-Drive Fans 34
Table of Contents
Summary .................................................................................................................................. 33
List of Figures and Tables........................................................................................................ 35
4.1 Introduction ................................................................................................................... 38
4.2 Air-Drive Fans .............................................................................................................. 38
4.3 Performance of a 26 Degree Pitch Fan ......................................................................... 39
4.3.1 Frequency Spectrum Analysis of Fan Performance .............................................. 44
4.3.2 Effect of Changing Impedance on Noise Spectrum .............................................. 47
4.4 Effect of Blade Pitch Angle .......................................................................................... 57
4.4.1 Fan Performance Curves ....................................................................................... 57
4.4.2 Comparison at 1800 rpm ....................................................................................... 60
4.5 Interpolation Colour Maps ............................................................................................ 62
4.5.1 Fan Efficiency Maps .............................................................................................. 63
4.5.2 Fan SWL Maps ...................................................................................................... 66
4.6 References ..................................................................................................................... 70
Chapter 4 Performance Evaluation of Air-Drive Fans 35
List of Figures and Tables
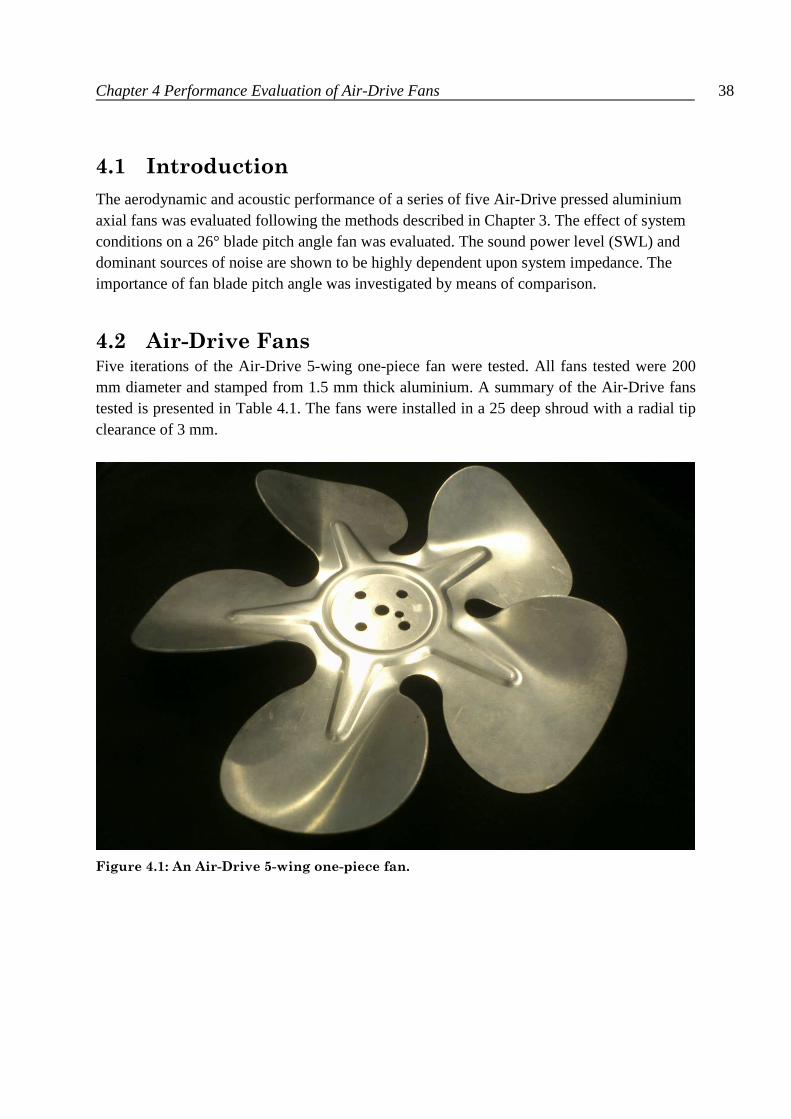
Figure 4.1: An Air-Drive 5-wing one-piece fan. ..................................................................... 38
Figure 4.2: Aerodynamic performance of a 26° blade pitch Air-Drive fan for speeds between 1200 and 2400 rpm. ................................................................................................................. 42
Figure 4.3: Efficiency of a 26° blade pitch Air-Drive fan for speeds between 1200 and 2400 rpm. .......................................................................................................................................... 42
Figure 4.4: SWL of a 26° blade pitch Air-Drive fan for speeds between 1200 and 2400 rpm................................................................................................................................................... 43
Figure 4.5: Efficiency of a 26° blade pitch Air-Drive fan for speeds between 1200 and 2400 rpm. .......................................................................................................................................... 43
Figure 4.6: SWL of a 26° blade pitch Air-Drive Fan at several operating speeds. ................. 44
Figure 4.7: Noise spectrum of a 26° Air-Drive fan for N = 1800 rpm and x = 120 mm. ........ 45
Figure 4.8: Noise spectrum with the BPF and first four harmonics overlaid in red. ............... 45
Figure 4.9: Motor noise spectrum when loaded with a rope brake. ......................................... 46
Figure 4.10: A-weighted 1/3 octave band noise spectrum of a 26° Air-Drive fan for N = 1800 rpm and x = 120 mm. ............................................................................................................... 47
Figure 4.11: Noise spectrum highlighting frequency span of dominant 1/3 octave bands. ..... 47
Figure 4.12: Comparison of quietest operating points. Overall SWLs are 63.5 and 63.4 dBA for x = 100 mm and x = 120 mm respectively. ........................................................................ 48
Figure 4.13: Comparison of noise spectra showing the effect of increasing system impedance. Overall SWLs are 65.9 and 63.4 dBA for x = 80 mm and x = 120 mm respectively. ............. 49
Figure 4.14: Comparison of noise spectra showing the effect of further increasing system impedance. Overall SWLs are 68.3 and 65.9 dBA for 60 and 80 mm respectively. ............... 49
Figure 4.15: Schematic illustration of partial rotating stall in a fan system, showing three stall cells. ......................................................................................................................................... 51
Figure 4.16: Noise spectrum for x = 80 mm with the BPF and four harmonics (red), and rotating stall frequencies at multiples of 0.74BPF (blue) overlaid. ......................................... 52
Figure 4.17: Noise spectrum for x = 60 mm with the BPF and four harmonics (red), and rotating stall frequencies at multiples of 0.70 BPF (blue) overlaid. ........................................ 52
Figure 4.18: A-weighted one-third octave band noise spectrum of a 26° Air-Drive fan for N = 1800 rpm and x = 80 mm. ........................................................................................................ 53
Figure 4.19: A-weighted one-third octave band noise spectrum of a 26° Air-Drive fan for N = 1800 rpm and x = 60 mm. ........................................................................................................ 53

Chapter 4 Performance Evaluation of Air-Drive Fans 36
Figure 4.20: Comparison of noise spectra showing the effect of decreasing system impedance. Overall SWLs are 63.4 and 65.6 dBA for x = 120 mm and x = 160 mm respectively. ............................................................................................................................. 55
Figure 4.21: Comparison of noise spectra showing the effect of decreasing system impedance. Overall SWLs are 65.6 and 66.6 dBA for x = 160 mm and x = 200 mm respectively. ............................................................................................................................. 55
Figure 4.22: A-weighted 1/3 octave band noise spectrum of a 26° Air-Drive fan for N = 1800 rpm and x = 160 mm. ............................................................................................................... 56
Figure 4.23: A-weighted 1/3 octave band noise spectrum of a 26° Air-Drive fan for N = 1800 rpm and x = 200 mm. ............................................................................................................... 56
Figure 4.24: Fan performance curves of a 20° blade pitch Air-Drive fan for speeds between 1200 and 2400 rpm. ................................................................................................................. 57
Figure 4.25: Fan performance curves of a 23° blade pitch Air-Drive fan for speeds between 1200 and 2400 rpm. ................................................................................................................. 58
Figure 4.26: Fan performance curves of a 26° blade pitch Air-Drive fan for speeds between 1200 and 2400 rpm. ................................................................................................................. 58
Figure 4.27: Fan performance curves of a 30° blade pitch Air-Drive fan for speeds between 1200 and 2400 rpm. ................................................................................................................. 59
Figure 4.28: Fan performance curves of a 37° blade pitch Air-Drive fan for speeds between 1200 and 2400 rpm. ................................................................................................................. 59
Figure 4.29: Fan performance curves for five different blade pitch angles at 1800 rpm. ....... 60
Figure 4.30: Fan efficiency curves for five different blade pitch angles at 1800 rpm. ............ 61
Figure 4.31: Fan SWL curves for five different blade pitch angles at 1800 rpm. ................... 61
Figure 4.32: Noise spectrum of a 37° Air-Drive fan for N = 1800 rpm and x = 160 mm showing strong harmonics of the BPF. .................................................................................... 62
Figure 4.33: Performance of a 23° Air-Drive fan showing measurement points. ................... 63
Figure 4.34: Colour map showing the efficiency of a 20° blade pitch Air-Drive fan over the entire range of operation. ......................................................................................................... 63
Figure 4.35: Colour map showing the efficiency of a 23° blade pitch Air-Drive fan over the entire range of operation. ......................................................................................................... 64
Figure 4.36: Colour map showing the efficiency of a 26° blade pitch Air-Drive fan over the entire range of operation. ......................................................................................................... 64
Figure 4.37: Colour map showing the efficiency of a 30° blade pitch Air-Drive fan over the entire range of operation. ......................................................................................................... 65
Chapter 4 Performance Evaluation of Air-Drive Fans 37
Figure 4.38: Colour map showing the efficiency of a 37° blade pitch Air-Drive fan over the entire range of operation. ......................................................................................................... 65
Figure 4.39: Map showing the most efficient blade pitch angle over the entire anticipated operating range......................................................................................................................... 66
Figure 4.40: Colour map showing the A-weighted SWL of a 20° blade pitch Air-Drive fan over the entire range of operation. ........................................................................................... 67
Figure 4.41: Colour map showing the A-weighted SWL of a 23° blade pitch Air-Drive fan over the entire range of operation. ........................................................................................... 67
Figure 4.42: Colour map showing the A-weighted SWL of a 26° blade pitch Air-Drive fan over the entire range of operation. ........................................................................................... 68
Figure 4.43: Colour map showing the A-weighted SWL of a 30° blade pitch Air-Drive fan over the entire range of operation. ........................................................................................... 68
Figure 4.44: Colour map showing the A-weighted SWL of a 37° blade pitch Air-Drive fan over the entire range of operation. ........................................................................................... 69
Figure 4.45: Map showing the blade pitch angle that gives the lowest SWL over the entire anticipated operating range ...................................................................................................... 69
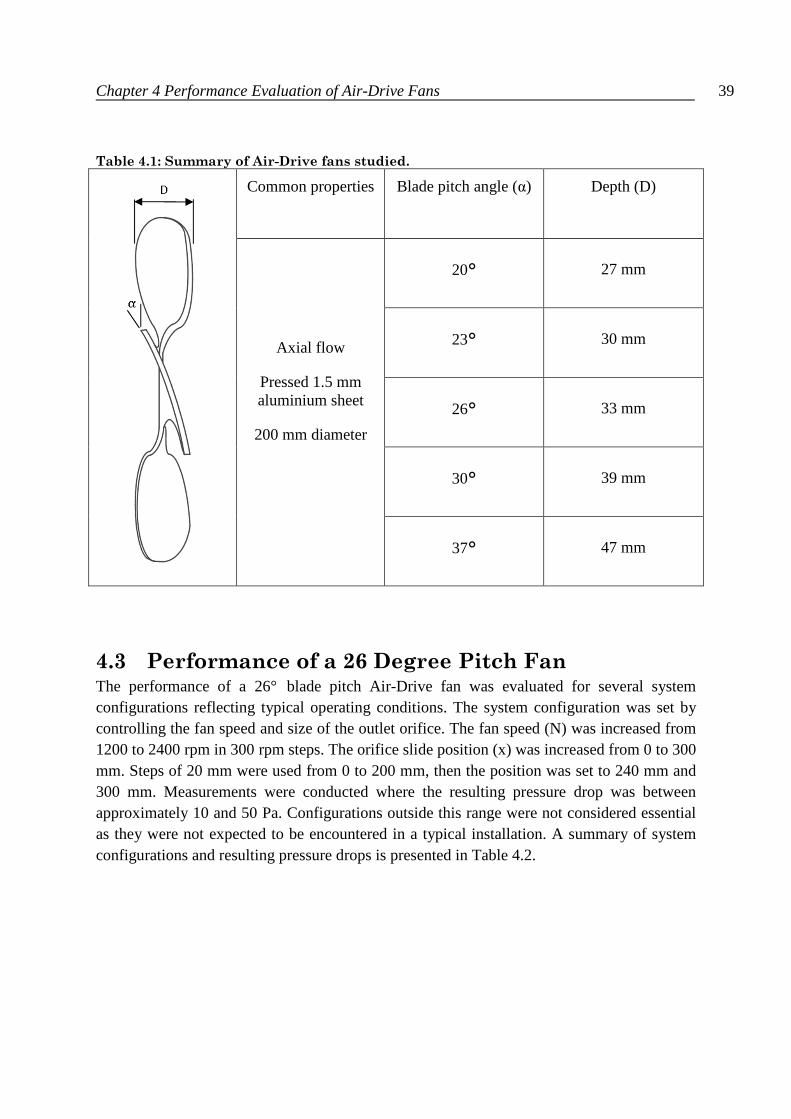
Table 4.1: Summary of Air-Drive fans studied. ...................................................................... 39
Table 4.2: Summary of measured system configurations showing magnitude of pressure drop in Pascals. ................................................................................................................................. 40
Table 4.3: Summary of key variables at four orifice positions ................................................ 48
Table 4.4: Comparison of key variables. ................................................................................. 54
Chapter 4 Performance Evaluation of Air-Drive Fans 38
4.1 Introduction
The aerodynamic and acoustic performance of a series of five Air-Drive pressed aluminium axial fans was evaluated following the methods described in Chapter 3. The effect of system conditions on a 26° blade pitch angle fan was evaluated. The sound power level (SWL) and dominant sources of noise are shown to be highly dependent upon system impedance. The importance of fan blade pitch angle was investigated by means of comparison.
4.2 Air-Drive Fans Five iterations of the Air-Drive 5-wing one-piece fan were tested. All fans tested were 200 mm diameter and stamped from 1.5 mm thick aluminium. A summary of the Air-Drive fans tested is presented in Table 4.1. The fans were installed in a 25 deep shroud with a radial tip clearance of 3 mm.
Figure 4.1: An Air-Drive 5-wing one-piece fan.
Chapter 4 Performance Evaluation of Air-Drive Fans 39
Table 4.1: Summary of Air-Drive fans studied.
Common properties Blade pitch angle (α) Depth (D)
Axial flow
Pressed 1.5 mm aluminium sheet
200 mm diameter
20° 27 mm
23° 30 mm
26° 33 mm
30° 39 mm
37° 47 mm
4.3 Performance of a 26 Degree Pitch Fan The performance of a 26° blade pitch Air-Drive fan was evaluated for several system configurations reflecting typical operating conditions. The system configuration was set by controlling the fan speed and size of the outlet orifice. The fan speed (N) was increased from 1200 to 2400 rpm in 300 rpm steps. The orifice slide position (x) was increased from 0 to 300 mm. Steps of 20 mm were used from 0 to 200 mm, then the position was set to 240 mm and 300 mm. Measurements were conducted where the resulting pressure drop was between approximately 10 and 50 Pa. Configurations outside this range were not considered essential as they were not expected to be encountered in a typical installation. A summary of system configurations and resulting pressure drops is presented in Table 4.2.
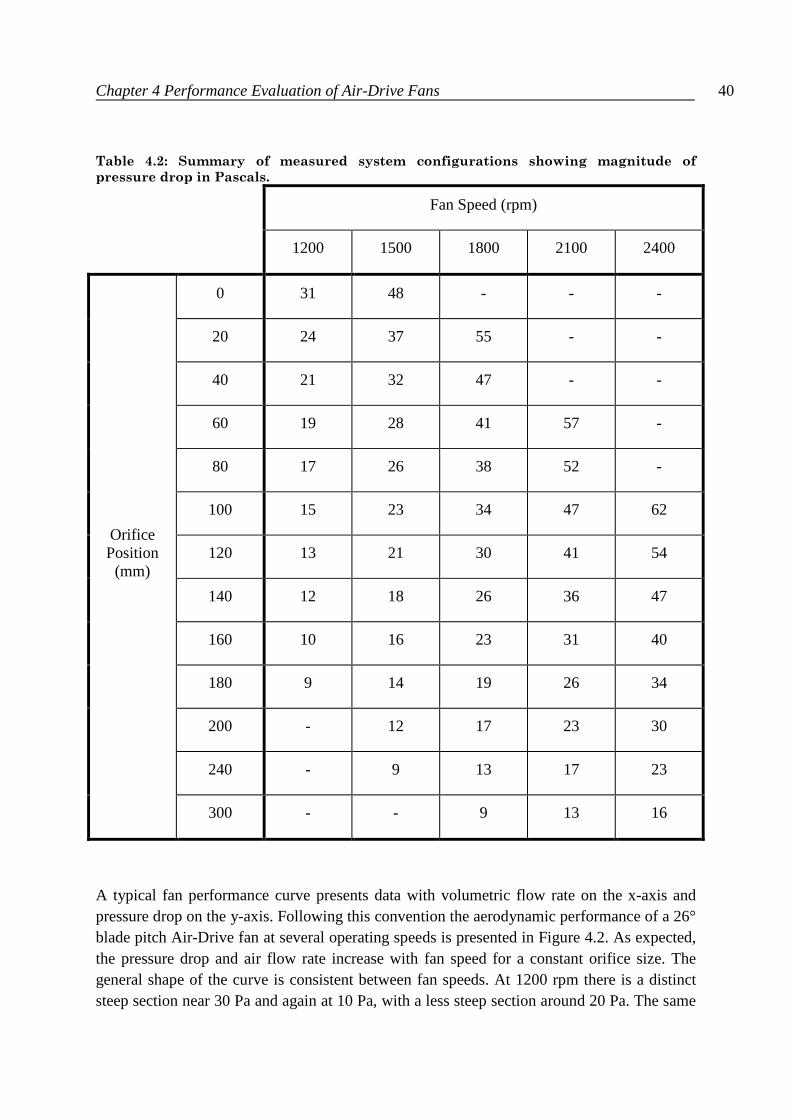
Chapter 4 Performance Evaluation of Air-Drive Fans 40
Table 4.2: Summary of measured system configurations showing magnitude of
pressure drop in Pascals.
Fan Speed (rpm)
1200 1500 1800 2100 2400
Orifice Position (mm)
0 31 48 - - -
20 24 37 55 - -
40 21 32 47 - -
60 19 28 41 57 -
80 17 26 38 52 -
100 15 23 34 47 62
120 13 21 30 41 54
140 12 18 26 36 47
160 10 16 23 31 40
180 9 14 19 26 34
200 - 12 17 23 30
240 - 9 13 17 23
300 - - 9 13 16
A typical fan performance curve presents data with volumetric flow rate on the x-axis and pressure drop on the y-axis. Following this convention the aerodynamic performance of a 26°
blade pitch Air-Drive fan at several operating speeds is presented in Figure 4.2. As expected, the pressure drop and air flow rate increase with fan speed for a constant orifice size. The general shape of the curve is consistent between fan speeds. At 1200 rpm there is a distinct steep section near 30 Pa and again at 10 Pa, with a less steep section around 20 Pa. The same
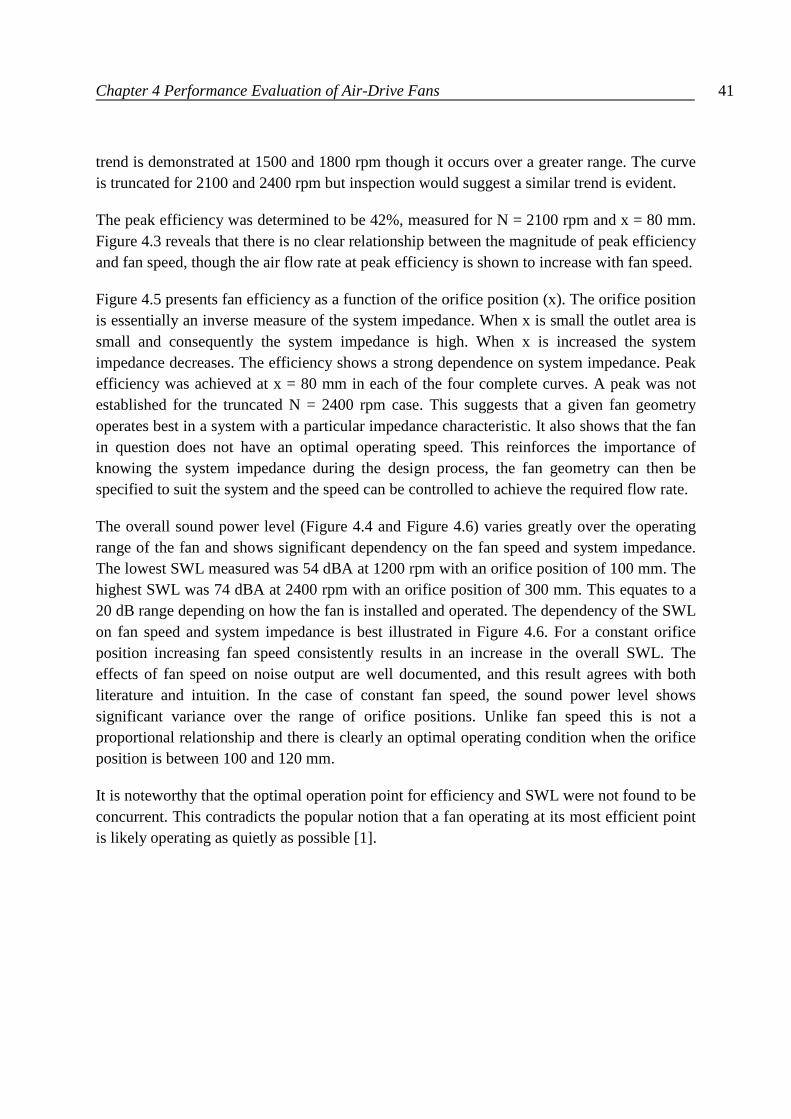
Chapter 4 Performance Evaluation of Air-Drive Fans 41
trend is demonstrated at 1500 and 1800 rpm though it occurs over a greater range. The curve is truncated for 2100 and 2400 rpm but inspection would suggest a similar trend is evident.
The peak efficiency was determined to be 42%, measured for N = 2100 rpm and x = 80 mm. Figure 4.3 reveals that there is no clear relationship between the magnitude of peak efficiency and fan speed, though the air flow rate at peak efficiency is shown to increase with fan speed.
Figure 4.5 presents fan efficiency as a function of the orifice position (x). The orifice position is essentially an inverse measure of the system impedance. When x is small the outlet area is small and consequently the system impedance is high. When x is increased the system impedance decreases. The efficiency shows a strong dependence on system impedance. Peak efficiency was achieved at x = 80 mm in each of the four complete curves. A peak was not established for the truncated N = 2400 rpm case. This suggests that a given fan geometry operates best in a system with a particular impedance characteristic. It also shows that the fan in question does not have an optimal operating speed. This reinforces the importance of knowing the system impedance during the design process, the fan geometry can then be specified to suit the system and the speed can be controlled to achieve the required flow rate.
The overall sound power level (Figure 4.4 and Figure 4.6) varies greatly over the operating range of the fan and shows significant dependency on the fan speed and system impedance. The lowest SWL measured was 54 dBA at 1200 rpm with an orifice position of 100 mm. The highest SWL was 74 dBA at 2400 rpm with an orifice position of 300 mm. This equates to a 20 dB range depending on how the fan is installed and operated. The dependency of the SWL on fan speed and system impedance is best illustrated in Figure 4.6. For a constant orifice position increasing fan speed consistently results in an increase in the overall SWL. The effects of fan speed on noise output are well documented, and this result agrees with both literature and intuition. In the case of constant fan speed, the sound power level shows significant variance over the range of orifice positions. Unlike fan speed this is not a proportional relationship and there is clearly an optimal operating condition when the orifice position is between 100 and 120 mm.
It is noteworthy that the optimal operation point for efficiency and SWL were not found to be concurrent. This contradicts the popular notion that a fan operating at its most efficient point is likely operating as quietly as possible [1].
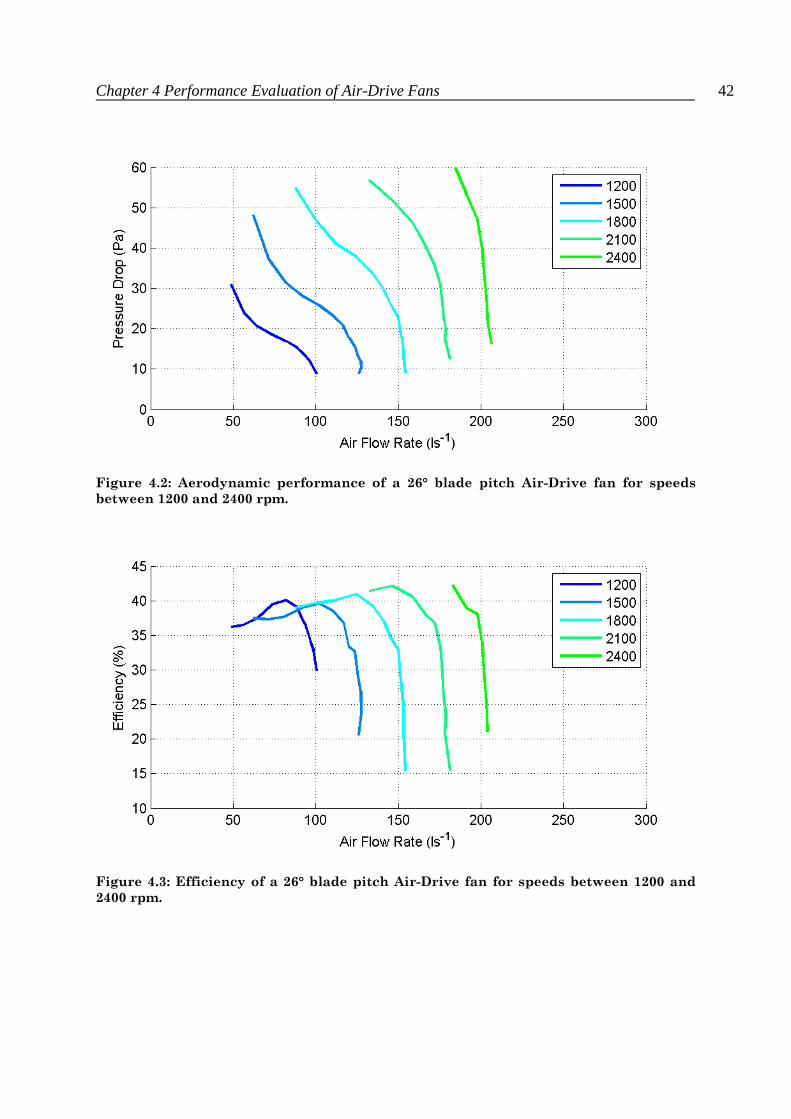
Chapter 4 Performance Evaluation of Air-Drive Fans 42
Figure 4.2: Aerodynamic performance of a 26° blade pitch Air-Drive fan for speeds
between 1200 and 2400 rpm.
Figure 4.3: Efficiency of a 26° blade pitch Air-Drive fan for speeds between 1200 and
2400 rpm.
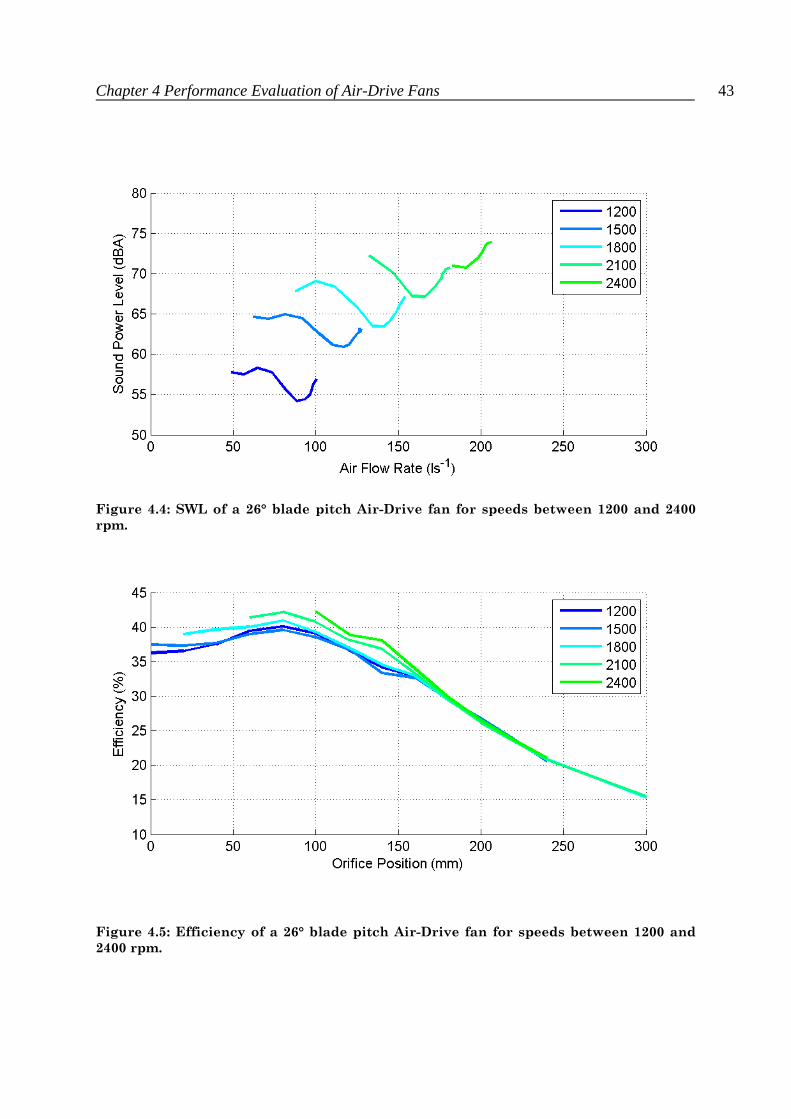
Chapter 4 Performance Evaluation of Air-Drive Fans 43
Figure 4.5: Efficiency of a 26° blade pitch Air-Drive fan for speeds between 1200 and
2400 rpm.
Figure 4.4: SWL of a 26° blade pitch Air-Drive fan for speeds between 1200 and 2400
rpm.
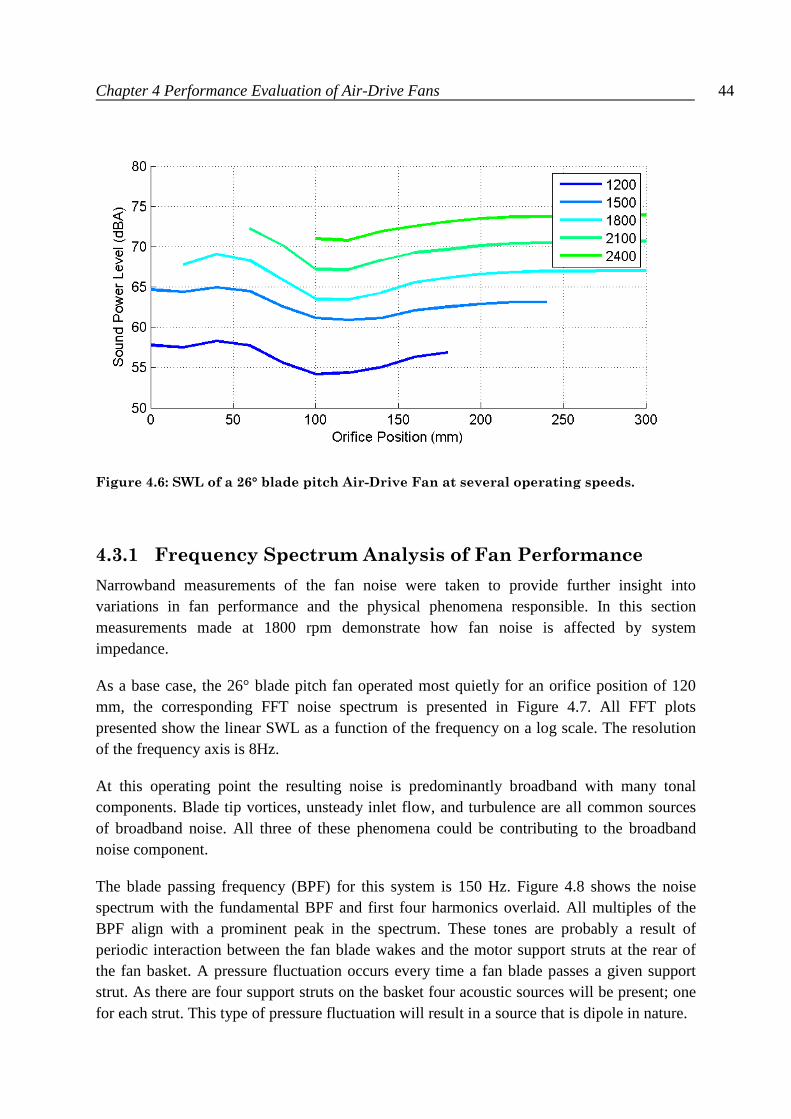
Chapter 4 Performance Evaluation of Air-Drive Fans 44
Figure 4.6: SWL of a 26° blade pitch Air-Drive Fan at several operating speeds.
4.3.1 Frequency Spectrum Analysis of Fan Performance
Narrowband measurements of the fan noise were taken to provide further insight into variations in fan performance and the physical phenomena responsible. In this section measurements made at 1800 rpm demonstrate how fan noise is affected by system impedance.
As a base case, the 26° blade pitch fan operated most quietly for an orifice position of 120 mm, the corresponding FFT noise spectrum is presented in Figure 4.7. All FFT plots presented show the linear SWL as a function of the frequency on a log scale. The resolution of the frequency axis is 8Hz.
At this operating point the resulting noise is predominantly broadband with many tonal components. Blade tip vortices, unsteady inlet flow, and turbulence are all common sources of broadband noise. All three of these phenomena could be contributing to the broadband noise component.
The blade passing frequency (BPF) for this system is 150 Hz. Figure 4.8 shows the noise spectrum with the fundamental BPF and first four harmonics overlaid. All multiples of the BPF align with a prominent peak in the spectrum. These tones are probably a result of periodic interaction between the fan blade wakes and the motor support struts at the rear of the fan basket. A pressure fluctuation occurs every time a fan blade passes a given support strut. As there are four support struts on the basket four acoustic sources will be present; one for each strut. This type of pressure fluctuation will result in a source that is dipole in nature.
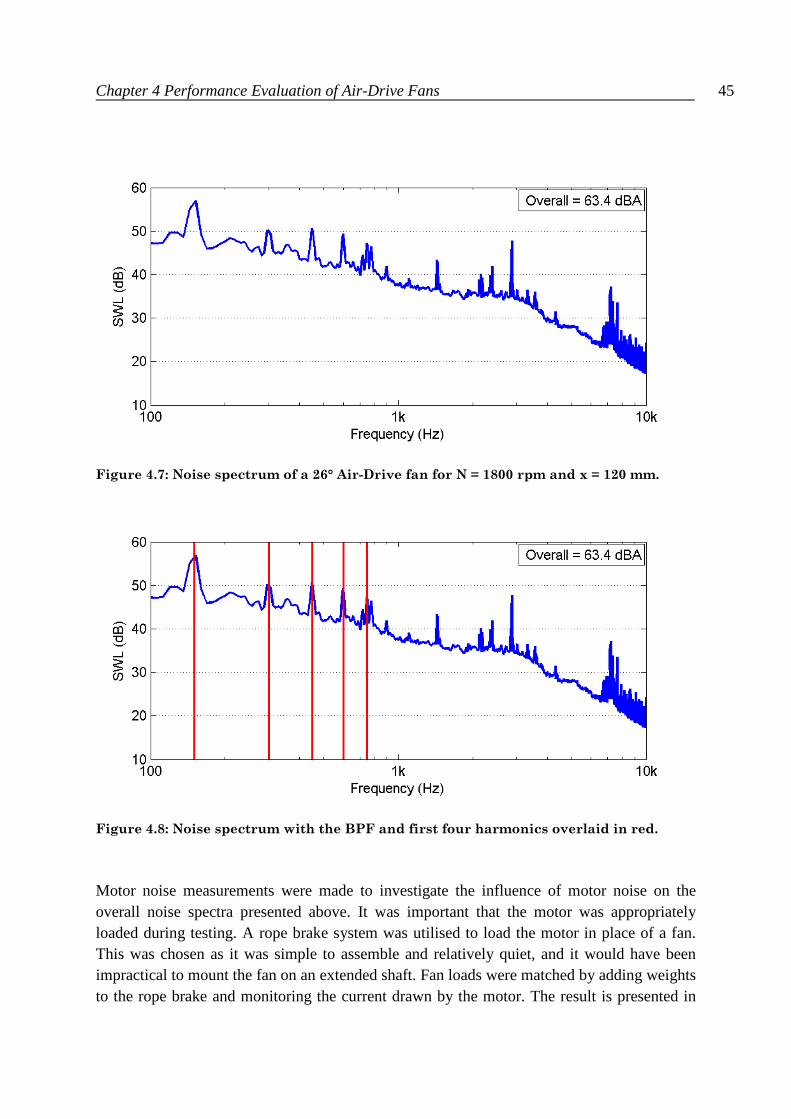
Chapter 4 Performance Evaluation of Air-Drive Fans 45
Figure 4.8: Noise spectrum with the BPF and first four harmonics overlaid in red.
Motor noise measurements were made to investigate the influence of motor noise on the overall noise spectra presented above. It was important that the motor was appropriately loaded during testing. A rope brake system was utilised to load the motor in place of a fan. This was chosen as it was simple to assemble and relatively quiet, and it would have been impractical to mount the fan on an extended shaft. Fan loads were matched by adding weights to the rope brake and monitoring the current drawn by the motor. The result is presented in
Figure 4.7: Noise spectrum of a 26° Air-Drive fan for N = 1800 rpm and x = 120 mm.
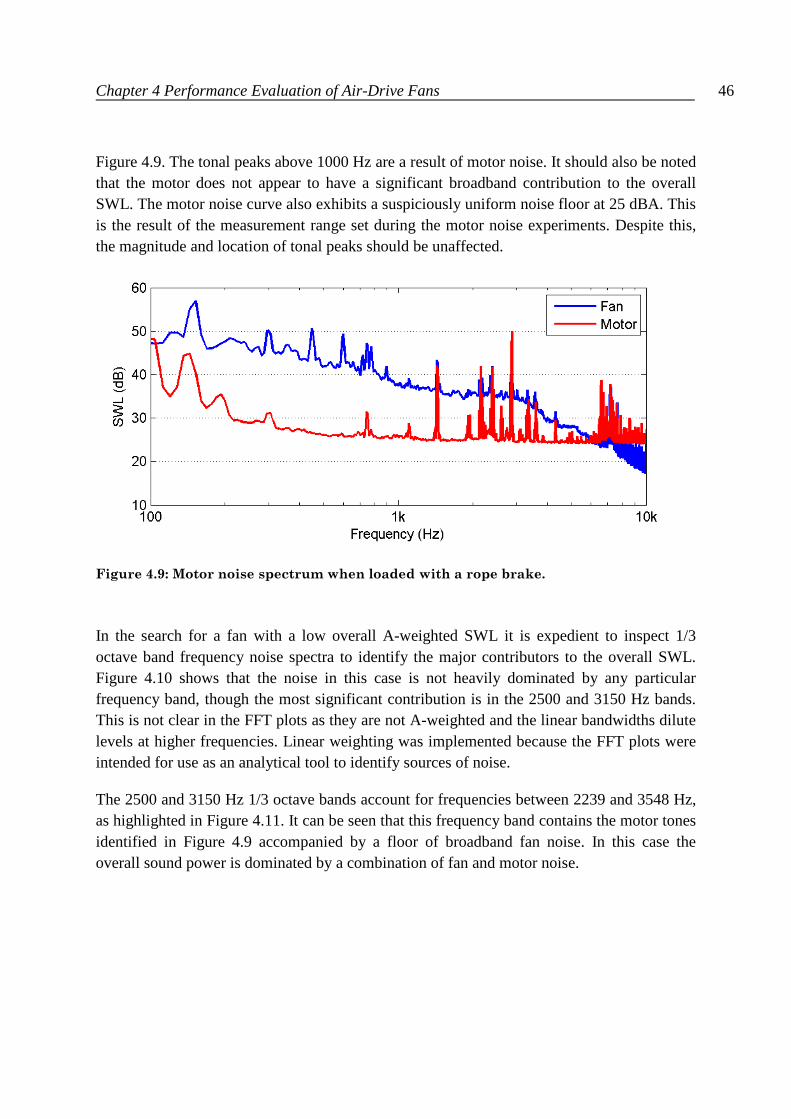
Chapter 4 Performance Evaluation of Air-Drive Fans 46
Figure 4.9. The tonal peaks above 1000 Hz are a result of motor noise. It should also be noted that the motor does not appear to have a significant broadband contribution to the overall SWL. The motor noise curve also exhibits a suspiciously uniform noise floor at 25 dBA. This is the result of the measurement range set during the motor noise experiments. Despite this, the magnitude and location of tonal peaks should be unaffected.
Figure 4.9: Motor noise spectrum when loaded with a rope brake.
In the search for a fan with a low overall A-weighted SWL it is expedient to inspect 1/3 octave band frequency noise spectra to identify the major contributors to the overall SWL. Figure 4.10 shows that the noise in this case is not heavily dominated by any particular frequency band, though the most significant contribution is in the 2500 and 3150 Hz bands. This is not clear in the FFT plots as they are not A-weighted and the linear bandwidths dilute levels at higher frequencies. Linear weighting was implemented because the FFT plots were intended for use as an analytical tool to identify sources of noise.
The 2500 and 3150 Hz 1/3 octave bands account for frequencies between 2239 and 3548 Hz, as highlighted in Figure 4.11. It can be seen that this frequency band contains the motor tones identified in Figure 4.9 accompanied by a floor of broadband fan noise. In this case the overall sound power is dominated by a combination of fan and motor noise.

Chapter 4 Performance Evaluation of Air-Drive Fans 47
Figure 4.10: A-weighted 1/3 octave band noise spectrum of a 26° Air-Drive fan for N =
1800 rpm and x = 120 mm.
Figure 4.11: Noise spectrum highlighting frequency span of dominant 1/3 octave bands.
4.3.2 Effect of Changing Impedance on Noise Spectrum
From Figure 4.6 it is clear that the overall SWL is significantly influenced by the system impedance. At 1800 rpm the SWL was lowest when the orifice position was between 100 and 120 mm, but increased markedly either side of this range. Narrowband analysis was
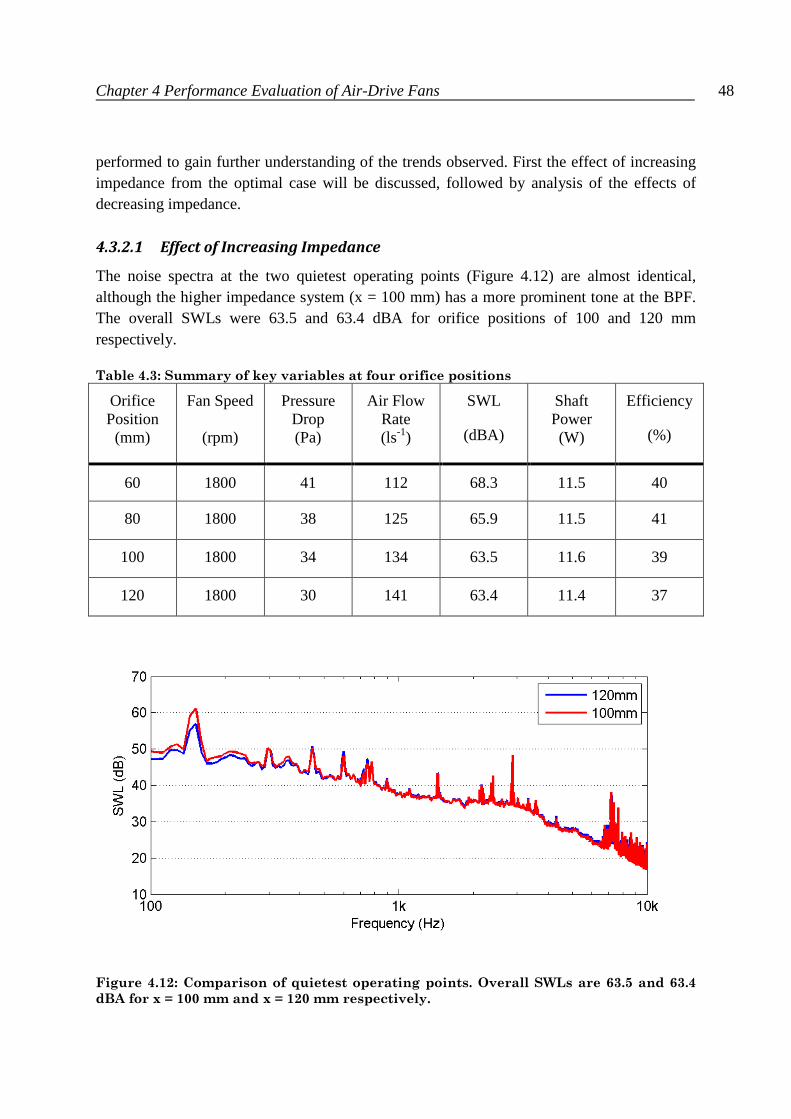
Chapter 4 Performance Evaluation of Air-Drive Fans 48
performed to gain further understanding of the trends observed. First the effect of increasing impedance from the optimal case will be discussed, followed by analysis of the effects of decreasing impedance.
4.3.2.1 Effect of Increasing Impedance
The noise spectra at the two quietest operating points (Figure 4.12) are almost identical, although the higher impedance system (x = 100 mm) has a more prominent tone at the BPF. The overall SWLs were 63.5 and 63.4 dBA for orifice positions of 100 and 120 mm respectively.
Table 4.3: Summary of key variables at four orifice positions
Orifice Position (mm)
Fan Speed
(rpm)
Pressure Drop (Pa)
Air Flow Rate (ls-1)
SWL
(dBA)
Shaft Power (W)
Efficiency
(%)
60 1800 41 112 68.3 11.5 40
80 1800 38 125 65.9 11.5 41
100 1800 34 134 63.5 11.6 39
120 1800 30 141 63.4 11.4 37
Figure 4.12: Comparison of quietest operating points. Overall SWLs are 63.5 and 63.4
dBA for x = 100 mm and x = 120 mm respectively.

Chapter 4 Performance Evaluation of Air-Drive Fans 49
Figure 4.13: Comparison of noise spectra showing the effect of increasing system
impedance. Overall SWLs are 65.9 and 63.4 dBA for x = 80 mm and x = 120 mm
respectively.
Changing the slide position from 120 mm to 80 mm resulted in an overall SWL increase of 2.5 dB, and an efficiency increase from 37 to 41%. Figure 4.13 shows a significant increase in broadband noise below 2000 Hz, an increase in the magnitude of the BPF tone and the introduction of a broad tonal peak at 220 Hz, all with little change in the contribution of motor noise.
Figure 4.14: Comparison of noise spectra showing the effect of further increasing
system impedance. Overall SWLs are 68.3 and 65.9 dBA for 60 and 80 mm respectively.
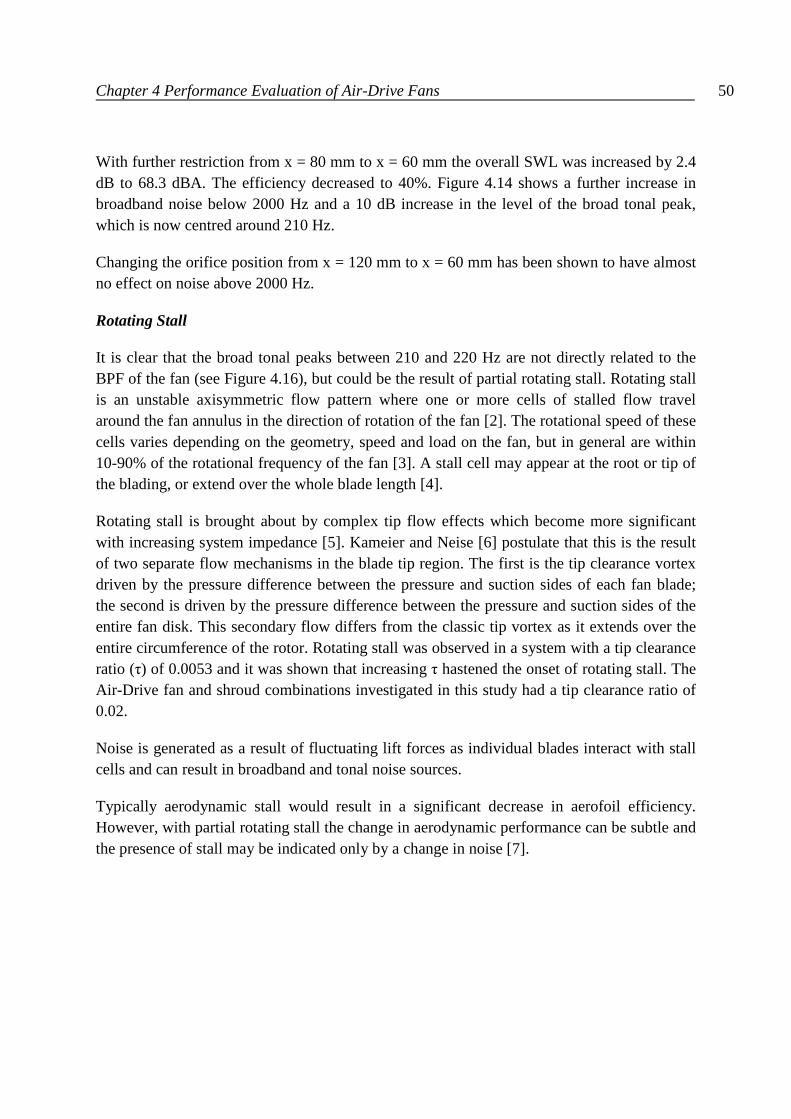
Chapter 4 Performance Evaluation of Air-Drive Fans 50
With further restriction from x = 80 mm to x = 60 mm the overall SWL was increased by 2.4 dB to 68.3 dBA. The efficiency decreased to 40%. Figure 4.14 shows a further increase in broadband noise below 2000 Hz and a 10 dB increase in the level of the broad tonal peak, which is now centred around 210 Hz.
Changing the orifice position from x = 120 mm to x = 60 mm has been shown to have almost no effect on noise above 2000 Hz.
Rotating Stall
It is clear that the broad tonal peaks between 210 and 220 Hz are not directly related to the BPF of the fan (see Figure 4.16), but could be the result of partial rotating stall. Rotating stall is an unstable axisymmetric flow pattern where one or more cells of stalled flow travel around the fan annulus in the direction of rotation of the fan [2]. The rotational speed of these cells varies depending on the geometry, speed and load on the fan, but in general are within 10-90% of the rotational frequency of the fan [3]. A stall cell may appear at the root or tip of the blading, or extend over the whole blade length [4].
Rotating stall is brought about by complex tip flow effects which become more significant with increasing system impedance [5]. Kameier and Neise [6] postulate that this is the result of two separate flow mechanisms in the blade tip region. The first is the tip clearance vortex driven by the pressure difference between the pressure and suction sides of each fan blade; the second is driven by the pressure difference between the pressure and suction sides of the entire fan disk. This secondary flow differs from the classic tip vortex as it extends over the entire circumference of the rotor. Rotating stall was observed in a system with a tip clearance ratio (τ) of 0.0053 and it was shown that increasing τ hastened the onset of rotating stall. The Air-Drive fan and shroud combinations investigated in this study had a tip clearance ratio of 0.02.
Noise is generated as a result of fluctuating lift forces as individual blades interact with stall cells and can result in broadband and tonal noise sources.
Typically aerodynamic stall would result in a significant decrease in aerofoil efficiency. However, with partial rotating stall the change in aerodynamic performance can be subtle and the presence of stall may be indicated only by a change in noise [7].
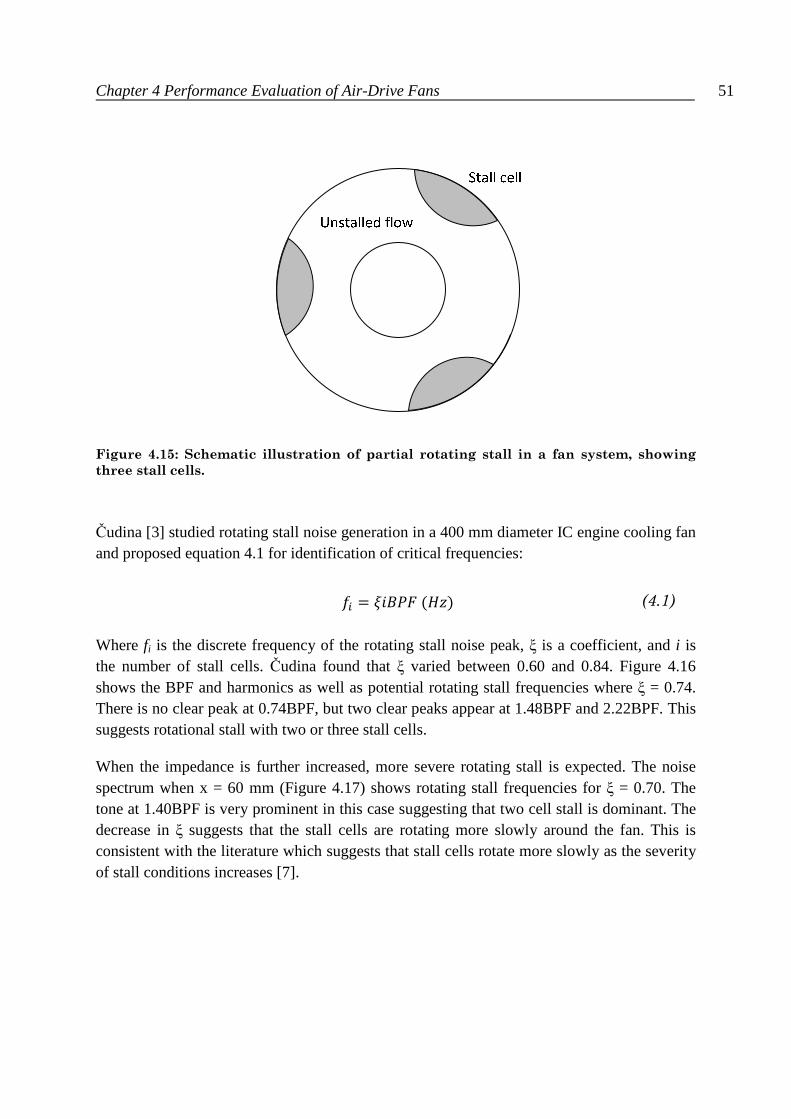
Chapter 4 Performance Evaluation of Air-Drive Fans 51
Figure 4.15: Schematic illustration of partial rotating stall in a fan system, showing
three stall cells.
Čudina [3] studied rotating stall noise generation in a 400 mm diameter IC engine cooling fan and proposed equation 4.1 for identification of critical frequencies:
�� = �����(��) (4.1)
Where fi is the discrete frequency of the rotating stall noise peak, ξ is a coefficient, and i is the number of stall cells. Čudina found that ξ varied between 0.60 and 0.84. Figure 4.16 shows the BPF and harmonics as well as potential rotating stall frequencies where ξ = 0.74. There is no clear peak at 0.74BPF, but two clear peaks appear at 1.48BPF and 2.22BPF. This suggests rotational stall with two or three stall cells.
When the impedance is further increased, more severe rotating stall is expected. The noise spectrum when x = 60 mm (Figure 4.17) shows rotating stall frequencies for ξ = 0.70. The tone at 1.40BPF is very prominent in this case suggesting that two cell stall is dominant. The decrease in ξ suggests that the stall cells are rotating more slowly around the fan. This is consistent with the literature which suggests that stall cells rotate more slowly as the severity of stall conditions increases [7].

Chapter 4 Performance Evaluation of Air-Drive Fans 52
Figure 4.16: Noise spectrum for x = 80 mm with the BPF and four harmonics (red), and
rotating stall frequencies at multiples of 0.74BPF (blue) overlaid.
Figure 4.17: Noise spectrum for x = 60 mm with the BPF and four harmonics (red), and
rotating stall frequencies at multiples of 0.70 BPF (blue) overlaid.
The one-third octave band spectrum (Figure 4.18) shows that the noise at x = 80 mm is not dominated by any particular frequency band, similar to the previous case when x = 120 mm. Unlike the previous case the most significant contribution is in the 315 Hz band. The 315 Hz one-third octave band accounts for frequencies between 282 and 355 Hz. This frequency
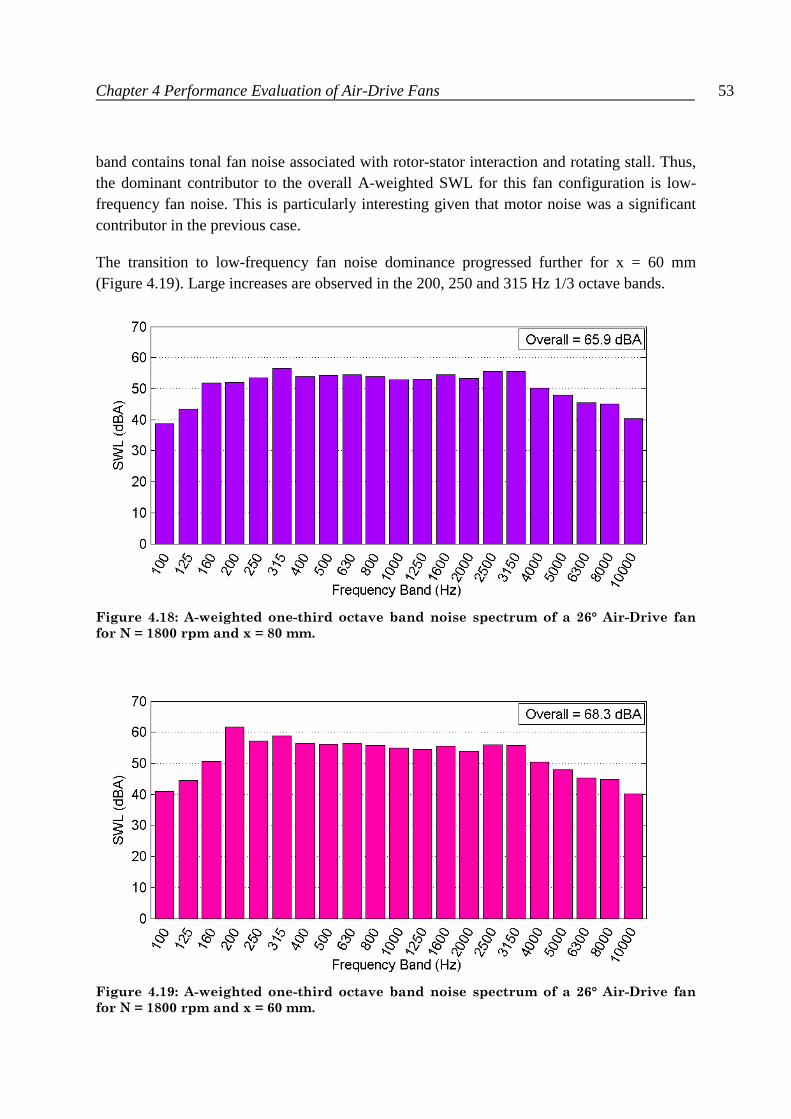
Chapter 4 Performance Evaluation of Air-Drive Fans 53
band contains tonal fan noise associated with rotor-stator interaction and rotating stall. Thus, the dominant contributor to the overall A-weighted SWL for this fan configuration is low-frequency fan noise. This is particularly interesting given that motor noise was a significant contributor in the previous case.
The transition to low-frequency fan noise dominance progressed further for x = 60 mm (Figure 4.19). Large increases are observed in the 200, 250 and 315 Hz 1/3 octave bands.
Figure 4.18: A-weighted one-third octave band noise spectrum of a 26° Air-Drive fan
for N = 1800 rpm and x = 80 mm.
Figure 4.19: A-weighted one-third octave band noise spectrum of a 26° Air-Drive fan
for N = 1800 rpm and x = 60 mm.
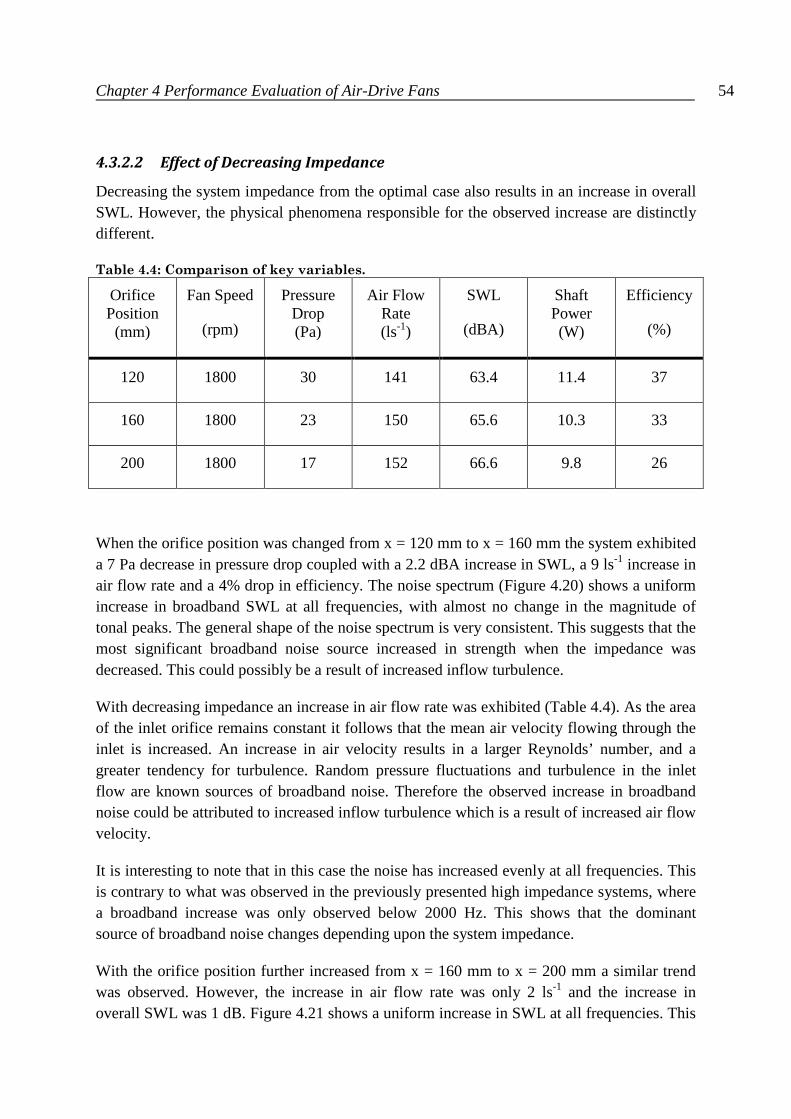
Chapter 4 Performance Evaluation of Air-Drive Fans 54
4.3.2.2 Effect of Decreasing Impedance
Decreasing the system impedance from the optimal case also results in an increase in overall SWL. However, the physical phenomena responsible for the observed increase are distinctly different.
Table 4.4: Comparison of key variables.
Orifice Position (mm)
Fan Speed
(rpm)
Pressure Drop (Pa)
Air Flow Rate (ls-1)
SWL
(dBA)
Shaft Power (W)
Efficiency
(%)
120 1800 30 141 63.4 11.4 37
160 1800 23 150 65.6 10.3 33
200 1800 17 152 66.6 9.8 26
When the orifice position was changed from x = 120 mm to x = 160 mm the system exhibited a 7 Pa decrease in pressure drop coupled with a 2.2 dBA increase in SWL, a 9 ls-1 increase in air flow rate and a 4% drop in efficiency. The noise spectrum (Figure 4.20) shows a uniform increase in broadband SWL at all frequencies, with almost no change in the magnitude of tonal peaks. The general shape of the noise spectrum is very consistent. This suggests that the most significant broadband noise source increased in strength when the impedance was decreased. This could possibly be a result of increased inflow turbulence.
With decreasing impedance an increase in air flow rate was exhibited (Table 4.4). As the area of the inlet orifice remains constant it follows that the mean air velocity flowing through the inlet is increased. An increase in air velocity results in a larger Reynolds’ number, and a greater tendency for turbulence. Random pressure fluctuations and turbulence in the inlet flow are known sources of broadband noise. Therefore the observed increase in broadband noise could be attributed to increased inflow turbulence which is a result of increased air flow velocity.
It is interesting to note that in this case the noise has increased evenly at all frequencies. This is contrary to what was observed in the previously presented high impedance systems, where a broadband increase was only observed below 2000 Hz. This shows that the dominant source of broadband noise changes depending upon the system impedance.
With the orifice position further increased from x = 160 mm to x = 200 mm a similar trend was observed. However, the increase in air flow rate was only 2 ls-1 and the increase in overall SWL was 1 dB. Figure 4.21 shows a uniform increase in SWL at all frequencies. This
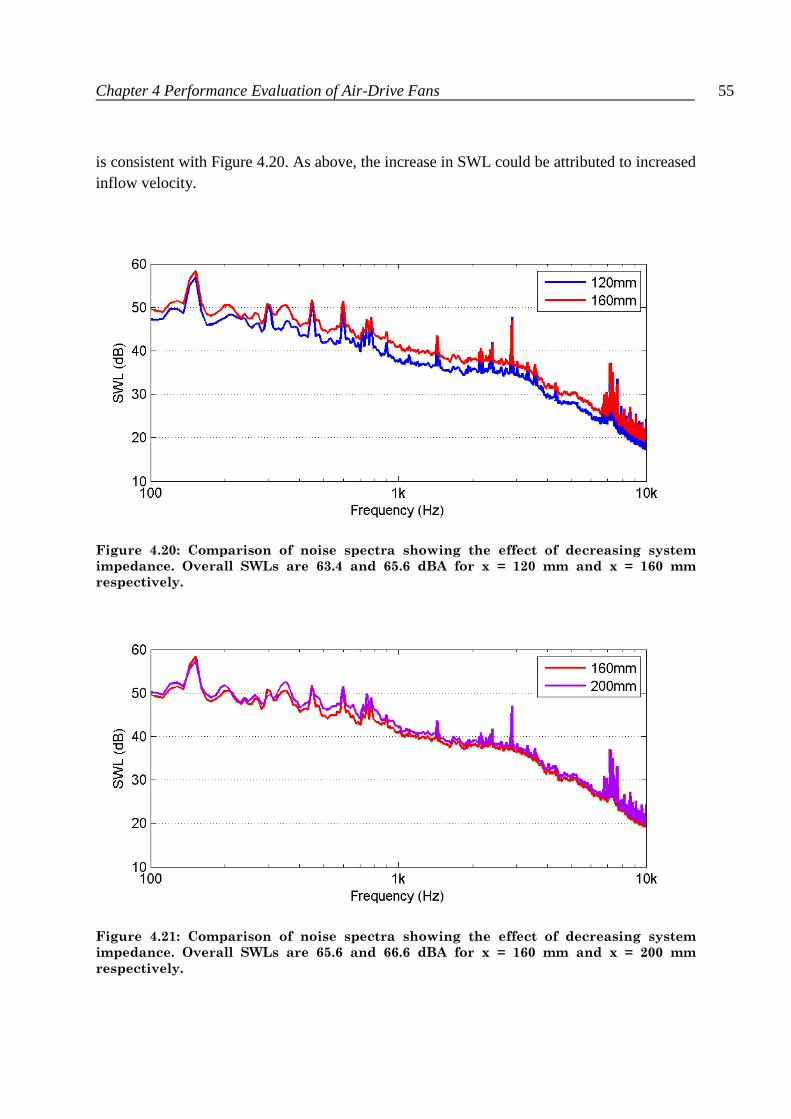
Chapter 4 Performance Evaluation of Air-Drive Fans 55
is consistent with Figure 4.20. As above, the increase in SWL could be attributed to increased inflow velocity.
Figure 4.20: Comparison of noise spectra showing the effect of decreasing system
impedance. Overall SWLs are 63.4 and 65.6 dBA for x = 120 mm and x = 160 mm
respectively.
Figure 4.21: Comparison of noise spectra showing the effect of decreasing system
impedance. Overall SWLs are 65.6 and 66.6 dBA for x = 160 mm and x = 200 mm
respectively.
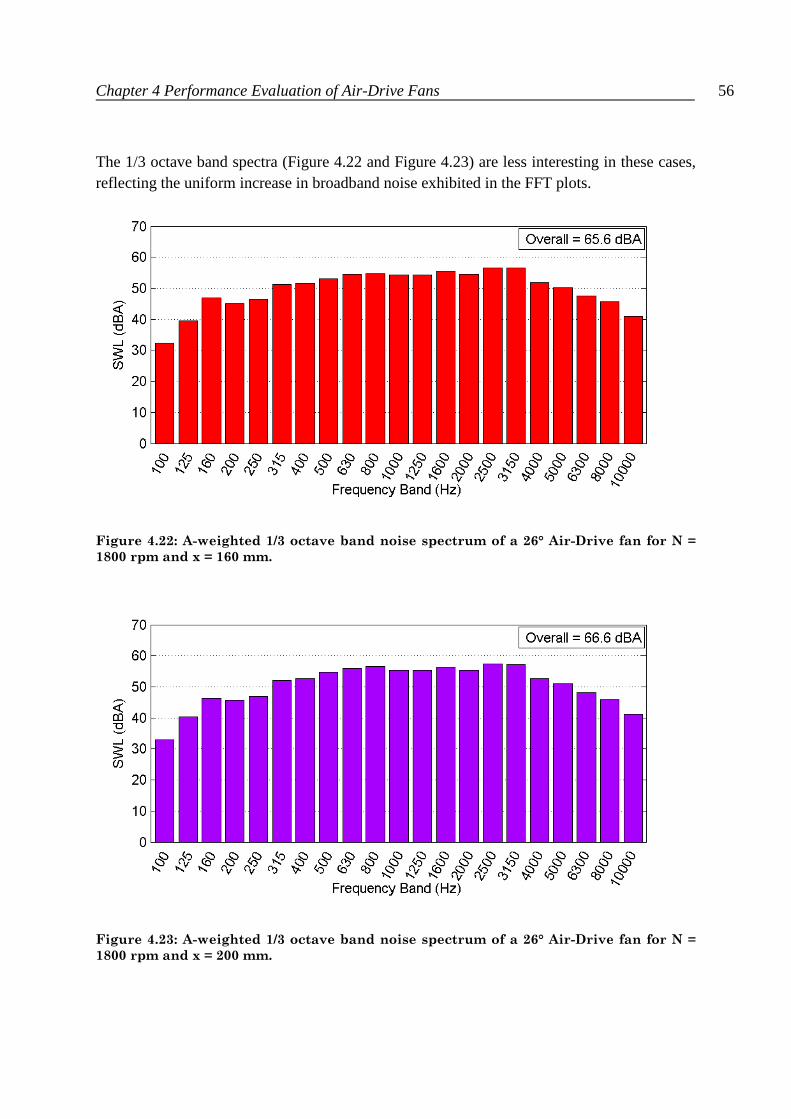
Chapter 4 Performance Evaluation of Air-Drive Fans 56
The 1/3 octave band spectra (Figure 4.22 and Figure 4.23) are less interesting in these cases, reflecting the uniform increase in broadband noise exhibited in the FFT plots.
Figure 4.22: A-weighted 1/3 octave band noise spectrum of a 26° Air-Drive fan for N =
1800 rpm and x = 160 mm.
Figure 4.23: A-weighted 1/3 octave band noise spectrum of a 26° Air-Drive fan for N =
1800 rpm and x = 200 mm.
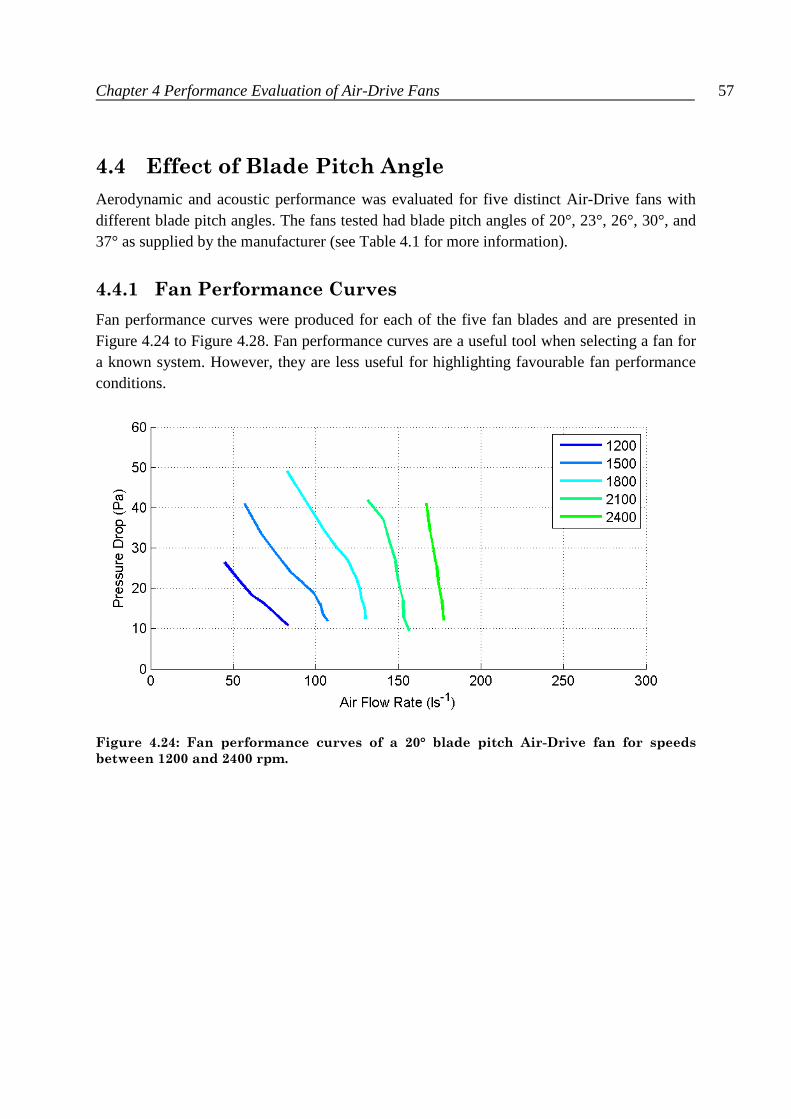
Chapter 4 Performance Evaluation of Air-Drive Fans 57
4.4 Effect of Blade Pitch Angle
Aerodynamic and acoustic performance was evaluated for five distinct Air-Drive fans with different blade pitch angles. The fans tested had blade pitch angles of 20°, 23°, 26°, 30°, and 37° as supplied by the manufacturer (see Table 4.1 for more information).
4.4.1 Fan Performance Curves
Fan performance curves were produced for each of the five fan blades and are presented in Figure 4.24 to Figure 4.28. Fan performance curves are a useful tool when selecting a fan for a known system. However, they are less useful for highlighting favourable fan performance conditions.
Figure 4.24: Fan performance curves of a 20° blade pitch Air-Drive fan for speeds
between 1200 and 2400 rpm.
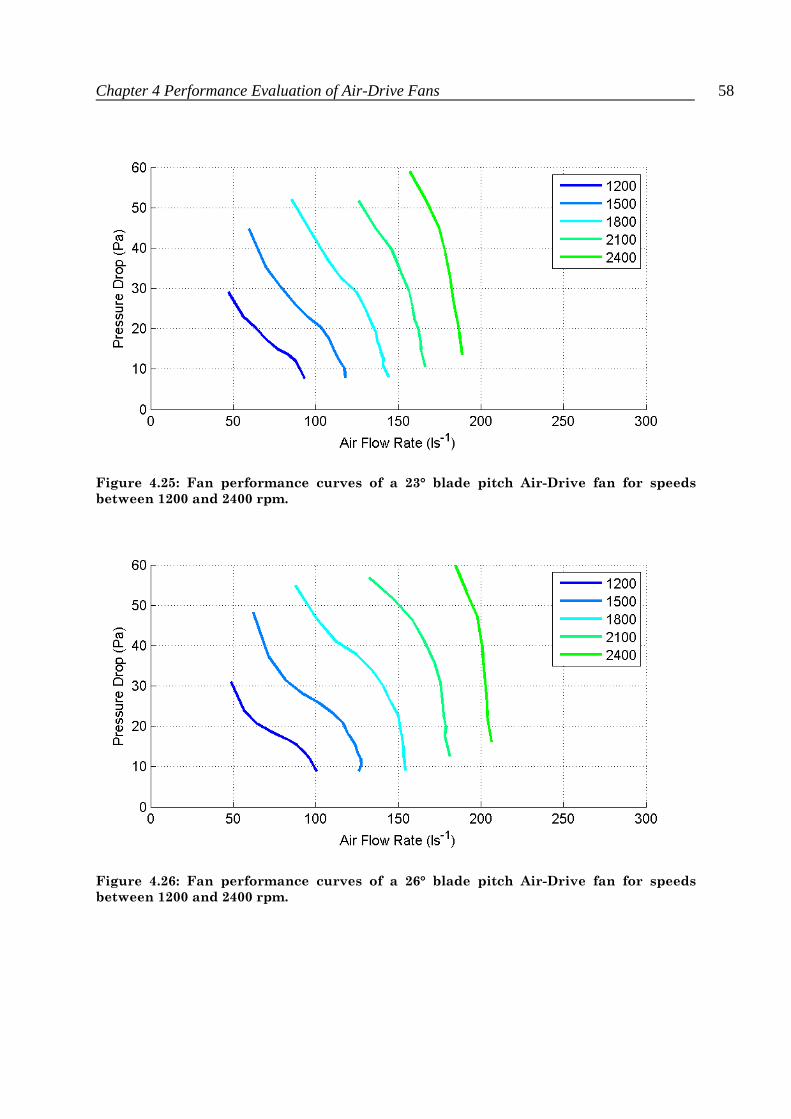
Chapter 4 Performance Evaluation of Air-Drive Fans 58
Figure 4.25: Fan performance curves of a 23° blade pitch Air-Drive fan for speeds
between 1200 and 2400 rpm.
Figure 4.26: Fan performance curves of a 26° blade pitch Air-Drive fan for speeds
between 1200 and 2400 rpm.

Chapter 4 Performance Evaluation of Air-Drive Fans 59
Figure 4.27: Fan performance curves of a 30° blade pitch Air-Drive fan for speeds
between 1200 and 2400 rpm.
Figure 4.28: Fan performance curves of a 37° blade pitch Air-Drive fan for speeds
between 1200 and 2400 rpm.
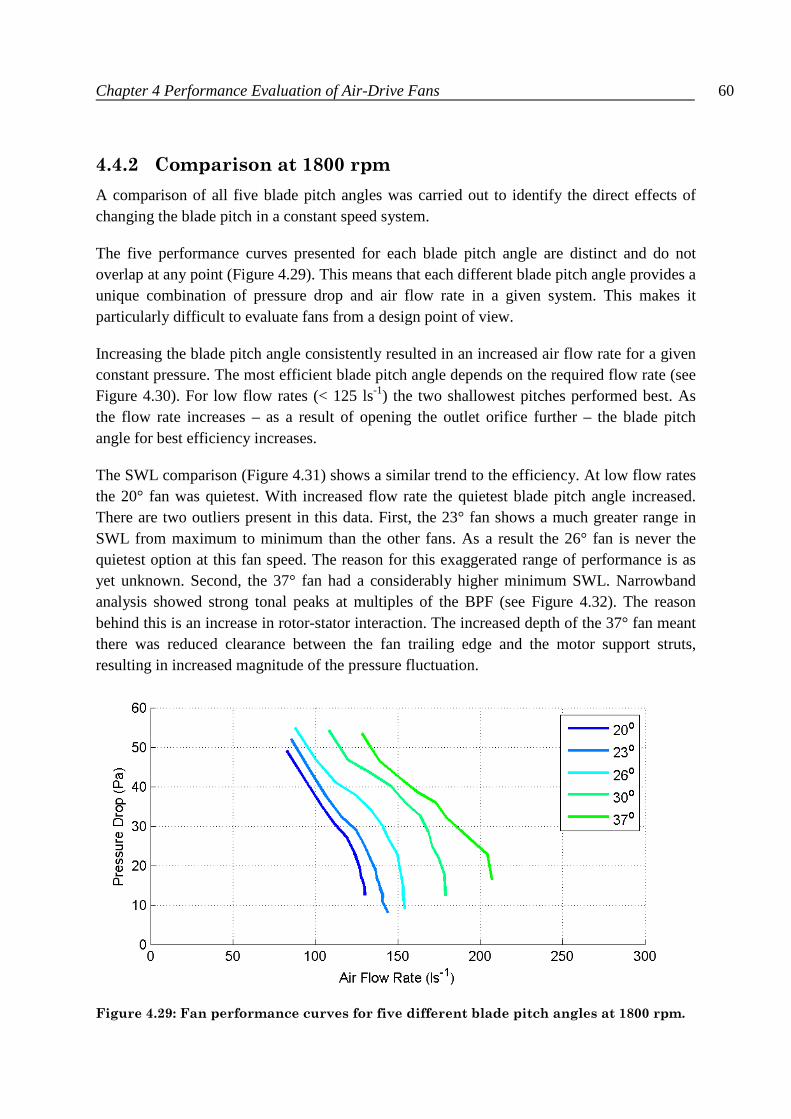
Chapter 4 Performance Evaluation of Air-Drive Fans 60
4.4.2 Comparison at 1800 rpm
A comparison of all five blade pitch angles was carried out to identify the direct effects of changing the blade pitch in a constant speed system.
The five performance curves presented for each blade pitch angle are distinct and do not overlap at any point (Figure 4.29). This means that each different blade pitch angle provides a unique combination of pressure drop and air flow rate in a given system. This makes it particularly difficult to evaluate fans from a design point of view.
Increasing the blade pitch angle consistently resulted in an increased air flow rate for a given constant pressure. The most efficient blade pitch angle depends on the required flow rate (see Figure 4.30). For low flow rates (< 125 ls-1) the two shallowest pitches performed best. As the flow rate increases – as a result of opening the outlet orifice further – the blade pitch angle for best efficiency increases.
The SWL comparison (Figure 4.31) shows a similar trend to the efficiency. At low flow rates the 20° fan was quietest. With increased flow rate the quietest blade pitch angle increased. There are two outliers present in this data. First, the 23° fan shows a much greater range in SWL from maximum to minimum than the other fans. As a result the 26° fan is never the quietest option at this fan speed. The reason for this exaggerated range of performance is as yet unknown. Second, the 37° fan had a considerably higher minimum SWL. Narrowband analysis showed strong tonal peaks at multiples of the BPF (see Figure 4.32). The reason behind this is an increase in rotor-stator interaction. The increased depth of the 37° fan meant there was reduced clearance between the fan trailing edge and the motor support struts, resulting in increased magnitude of the pressure fluctuation.
Figure 4.29: Fan performance curves for five different blade pitch angles at 1800 rpm.

Chapter 4 Performance Evaluation of Air-Drive Fans 61
Figure 4.30: Fan efficiency curves for five different blade pitch angles at 1800 rpm.
Figure 4.31: Fan SWL curves for five different blade pitch angles at 1800 rpm.
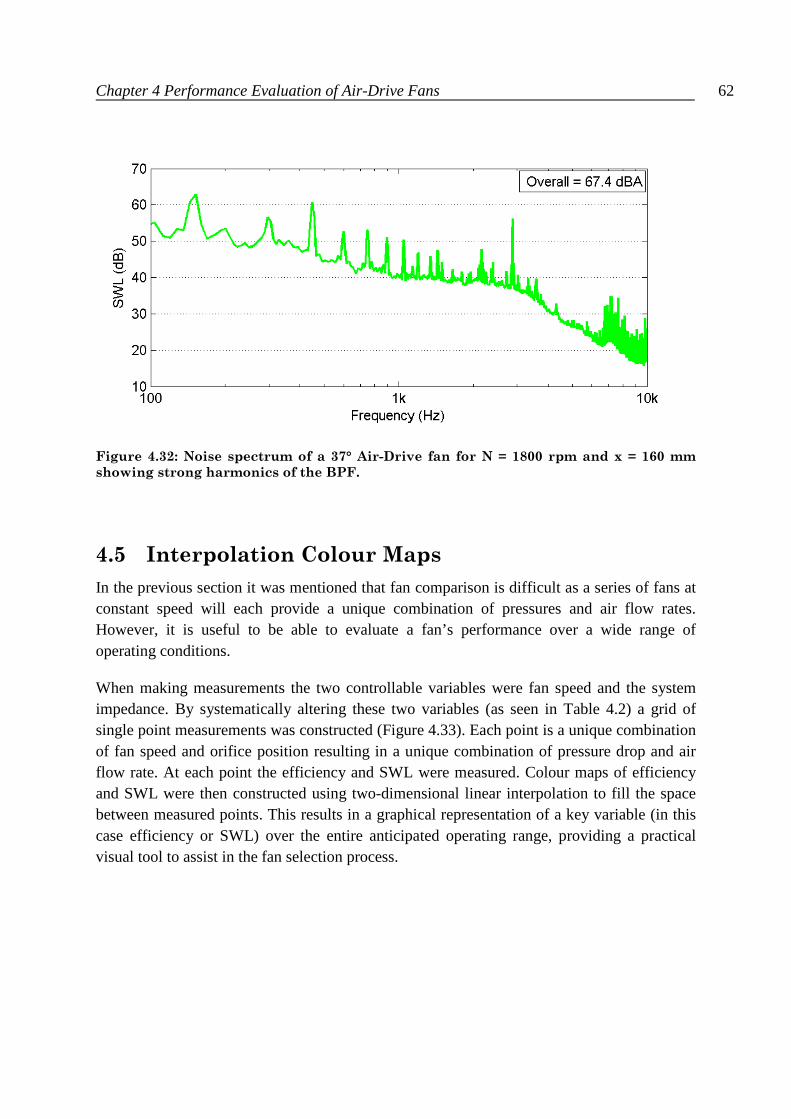
Chapter 4 Performance Evaluation of Air-Drive Fans 62
Figure 4.32: Noise spectrum of a 37° Air-Drive fan for N = 1800 rpm and x = 160 mm
showing strong harmonics of the BPF.
4.5 Interpolation Colour Maps
In the previous section it was mentioned that fan comparison is difficult as a series of fans at constant speed will each provide a unique combination of pressures and air flow rates. However, it is useful to be able to evaluate a fan’s performance over a wide range of operating conditions.
When making measurements the two controllable variables were fan speed and the system impedance. By systematically altering these two variables (as seen in Table 4.2) a grid of single point measurements was constructed (Figure 4.33). Each point is a unique combination of fan speed and orifice position resulting in a unique combination of pressure drop and air flow rate. At each point the efficiency and SWL were measured. Colour maps of efficiency and SWL were then constructed using two-dimensional linear interpolation to fill the space between measured points. This results in a graphical representation of a key variable (in this case efficiency or SWL) over the entire anticipated operating range, providing a practical visual tool to assist in the fan selection process.

Chapter 4 Performance Evaluation of Air-Drive Fans 63
Figure 4.33: Performance of a 23° Air-Drive fan showing measurement points.
4.5.1 Fan Efficiency Maps
The efficiency for each of the five blade pitch angles tested is presented as a colour map below. The efficiency colour scale is consistent between plots, allowing for direct comparison. In general the fans operated more efficiently in high pressure low flow rate conditions.
Figure 4.34: Colour map showing the efficiency of a 20° blade pitch Air-Drive fan over
the entire range of operation.

Chapter 4 Performance Evaluation of Air-Drive Fans 64
Figure 4.35: Colour map showing the efficiency of a 23° blade pitch Air-Drive fan over
the entire range of operation.
Figure 4.36: Colour map showing the efficiency of a 26° blade pitch Air-Drive fan over
the entire range of operation.
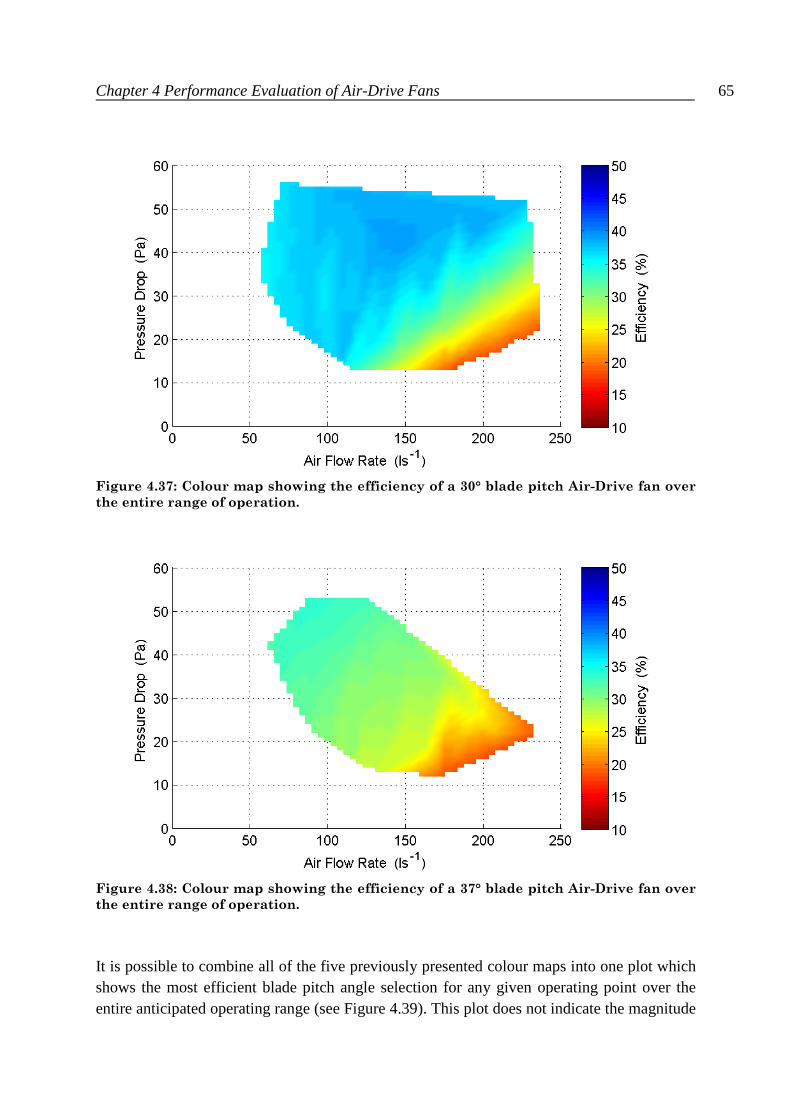
Chapter 4 Performance Evaluation of Air-Drive Fans 65
Figure 4.37: Colour map showing the efficiency of a 30° blade pitch Air-Drive fan over
the entire range of operation.
Figure 4.38: Colour map showing the efficiency of a 37° blade pitch Air-Drive fan over
the entire range of operation.
It is possible to combine all of the five previously presented colour maps into one plot which shows the most efficient blade pitch angle selection for any given operating point over the entire anticipated operating range (see Figure 4.39). This plot does not indicate the magnitude
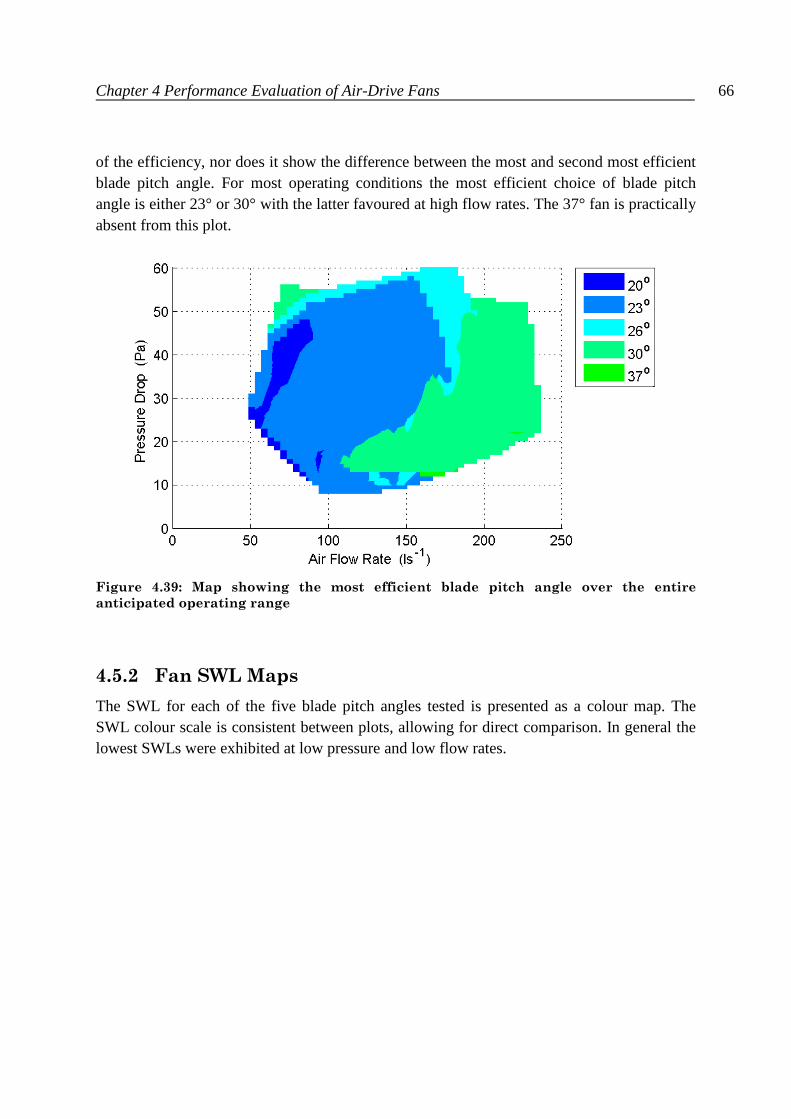
Chapter 4 Performance Evaluation of Air-Drive Fans 66
of the efficiency, nor does it show the difference between the most and second most efficient blade pitch angle. For most operating conditions the most efficient choice of blade pitch angle is either 23° or 30° with the latter favoured at high flow rates. The 37° fan is practically absent from this plot.
Figure 4.39: Map showing the most efficient blade pitch angle over the entire
anticipated operating range
4.5.2 Fan SWL Maps
The SWL for each of the five blade pitch angles tested is presented as a colour map. The SWL colour scale is consistent between plots, allowing for direct comparison. In general the lowest SWLs were exhibited at low pressure and low flow rates.
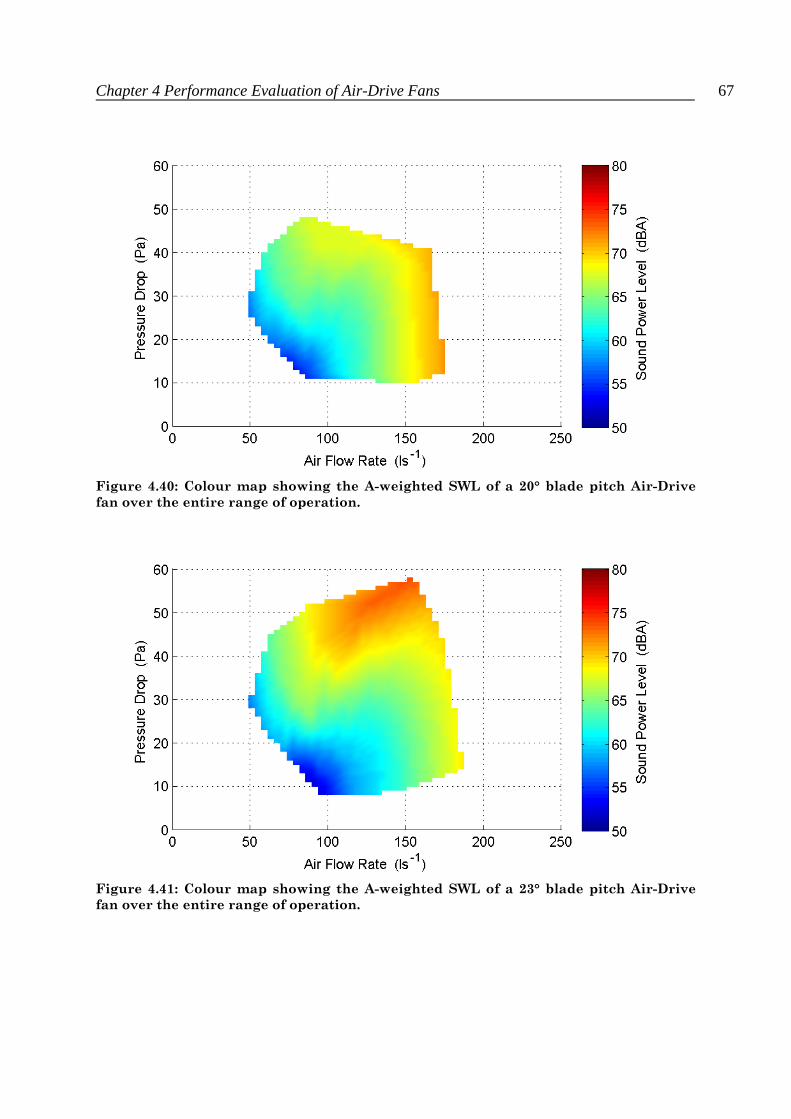
Chapter 4 Performance Evaluation of Air-Drive Fans 67
Figure 4.40: Colour map showing the A-weighted SWL of a 20° blade pitch Air-Drive
fan over the entire range of operation.
Figure 4.41: Colour map showing the A-weighted SWL of a 23° blade pitch Air-Drive
fan over the entire range of operation.
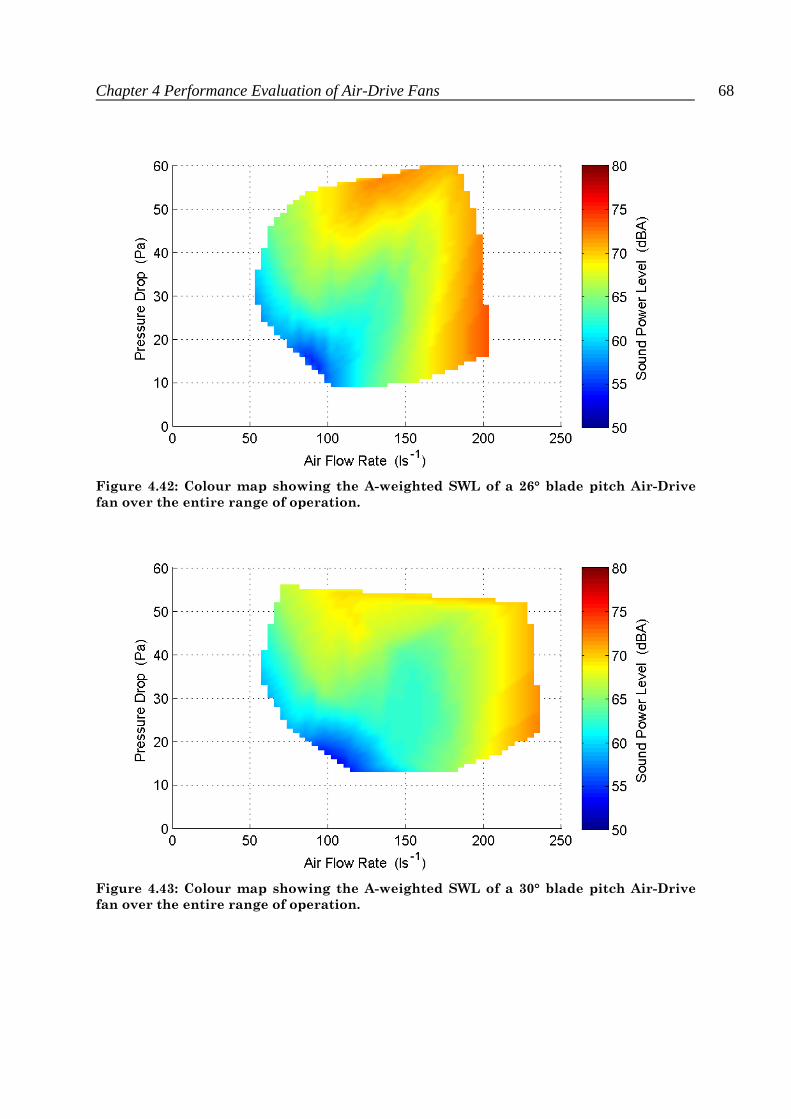
Chapter 4 Performance Evaluation of Air-Drive Fans 68
Figure 4.42: Colour map showing the A-weighted SWL of a 26° blade pitch Air-Drive
fan over the entire range of operation.
Figure 4.43: Colour map showing the A-weighted SWL of a 30° blade pitch Air-Drive
fan over the entire range of operation.

Chapter 4 Performance Evaluation of Air-Drive Fans 69
Figure 4.44: Colour map showing the A-weighted SWL of a 37° blade pitch Air-Drive
fan over the entire range of operation.
The previous five plots were overlaid to show which blade pitch angle gave the lowest SWL for any given point in the operating range (see Figure 4.45). It is clear that each of the five blade pitch angles has a favourable point of operation where it is the quietest possible choice. The 23° fan that was prominent in the corresponding efficiency map is much less visible in this case.
Figure 4.45: Map showing the blade pitch angle that gives the lowest SWL over the
entire anticipated operating range
Chapter 4 Performance Evaluation of Air-Drive Fans 70
4.6 References
[1] Woods of Colchester ltd. and B. B. Daly, Woods Practical Guide to Fan Engineering, 3rd ed. Colchester: Woods of Colchester Limited, 1978.
[2] E. M. Greitzer, "Surge and Rotating Stall in Axial-Flow Compressors I. Theoretical Compression System Model," Journal of Engineering for Power - Transactions of the ASME, vol. 98, pp. 190-198, 1976.
[3] M. Cudina, "Noise Generation in Vane Axial Fans due to Rotating Stall and Surge," Proceedings of the Institution of Mechanical Engineers Part C - Journal of Mechanical Engineering Science, vol. 215, pp. 57-64, 2001.
[4] A. H. Stenning, "Rotating Stall and Surge," Journal of Fluids Engineering - Transactions of the ASME, vol. 102, pp. 14-20, 1980.
[5] F. Kameier and W. Neise, "Experimental Study of Tip Clearance Losses and Noise in Axial Turbomachines," Turbomachinery - Fluid Dynamic and Thermodynamic Aspects, vol. 1186, pp. 229-243, 1995.
[6] F. Kameier and W. Neise, "Rotating Blade Flow Instability as a Source of Noise in Axial Turbomachines," Journal of Sound and Vibration, vol. 203, pp. 833-853, 1997.
[7] N. A. Cumpsty, Compressor Aerodynamics. Harlow, Essex, England: Longman Scientific & Technical, 1989.
71
Chapter 5
Performance Evaluation of a
Wellington Drive Fanpack
Summary
The aerodynamic and acoustic performance of a Wellington Drive fanpack was evaluated following the methods described in Chapter 3.
Chapter 5 Performance Evaluation of a Wellington Drive Fanpack 72
Table of Contents
Summary .................................................................................................................................. 71
List of Figures .......................................................................................................................... 73
5.1 Introduction ................................................................................................................... 75
5.2 Wellington Drive Fanpack ............................................................................................ 75
5.2.1 The Fan .................................................................................................................. 75
5.2.2 The Shroud ............................................................................................................ 76
5.2.3 The Motor .............................................................................................................. 77
5.3 Fanpack Performance with a 25 Watt Motor ................................................................ 79
5.3.1 Fanpack Performance Curves ................................................................................ 79
5.3.2 Frequency Spectrum Analysis ............................................................................... 83
5.3.3 Efficiency and SWL Performance Maps ............................................................... 88
Chapter 5 Performance Evaluation of a Wellington Drive Fanpack 73
List of Figures
Figure 5.1: A Wellington 200 mm diameter moulded plastic fan. .......................................... 75
Figure 5.2: Wellington moulded plastic shroud. ...................................................................... 76
Figure 5.3: The radial tip clearance between shroud and fan is approximately 4 mm. ........... 77
Figure 5.4: Wellington motor showing fastening mounts. ...................................................... 77
Figure 5.5: Clearance between fan and fastening mounts was 2 mm. ..................................... 78
Figure 5.6: Schematic highlighting clearance between the motor and fan. ............................. 79
Figure 5.7: Performance curves of a Wellington fanpack with 25 W motor at fan speeds between 1200 and 2300 rpm. ................................................................................................... 80
Figure 5.8: Efficiency of a Wellington fanpack with 25 W motor at fan speeds between 1200 and 2300 rpm. .......................................................................................................................... 81
Figure 5.9: SWL of a Wellington fanpack with 25 W motor at fan speeds between 1200 and 2300 rpm. ................................................................................................................................. 81
Figure 5.10: Efficiency of a Wellington fanpack with 25 W motor at fan speeds between 1200 and 2300 rpm. .......................................................................................................................... 82
Figure 5.11: SWL of a Wellington fanpack with 25 W motor at fan speeds between 1200 and 2300 rpm. ................................................................................................................................. 82
Figure 5.12: Narrowband noise spectrum of a Wellington fanpack with 25 W motor at N = 1200 rpm and x = 180 mm. ...................................................................................................... 83
Figure 5.13: One-third octave band noise spectrum of a Wellington fanpack with 25 W motor at N = 1200 rpm and x = 180 mm. ........................................................................................... 84
Figure 5.14: Narrowband noise spectrum of a Wellington fanpack with 25 W motor at N = 1500 rpm and x = 180 mm. ...................................................................................................... 84
Figure 5.15: One-third octave band noise spectrum of a Wellington fanpack with 25 W motor at N = 1500 rpm and x = 180 mm. ........................................................................................... 85
Figure 5.16: : Narrowband noise spectrum of a Wellington fanpack with 25 W motor at N = 1800 rpm and x = 180 mm. ...................................................................................................... 85
Figure 5.17: : Narrowband noise spectrum of a Wellington fanpack with 25 W motor at N = 2100 rpm and x = 180 mm. ...................................................................................................... 86
Figure 5.18: One-third octave band noise spectrum of a Wellington fanpack with 25 W motor at N = 2100 rpm and x = 180 mm. ........................................................................................... 86
Figure 5.19: SWL of a Wellington fanpack with 25 W motor at N = 2300 rpm and x = 180 mm. .......................................................................................................................................... 87

Chapter 5 Performance Evaluation of a Wellington Drive Fanpack 74
Figure 5.20: Narrowband noise spectrum of a 25 W motor at 1500 rpm when loaded with a rope brake compared to equivalent operating state when loaded with a fan. .......................... 88
Figure 5.21: Colour map showing the efficiency of a Wellington 200 mm fanpack with 25 W motor over the entire range of operation. ................................................................................. 89
Figure 5.22: Colour map showing the A-weighted SWL of a Wellington 200 mm fanpack with 25 W motor over the entire range of operation. ............................................................... 89
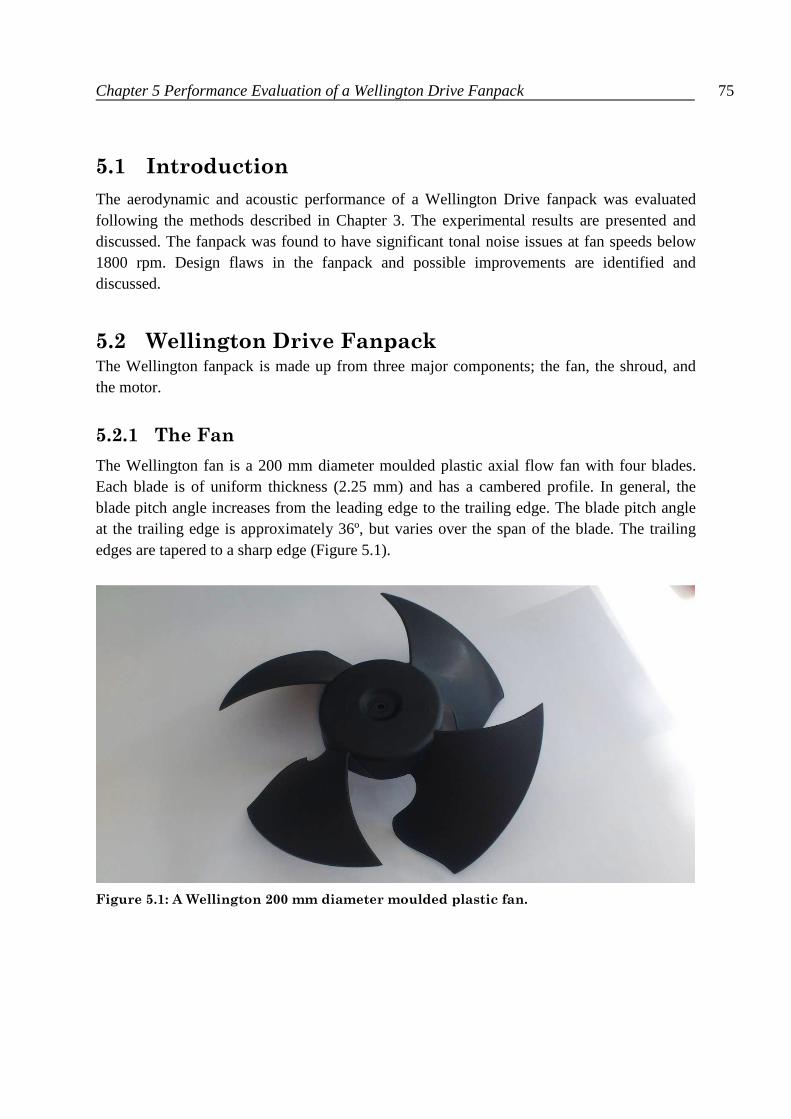
Chapter 5 Performance Evaluation of a Wellington Drive Fanpack 75
5.1 Introduction
The aerodynamic and acoustic performance of a Wellington Drive fanpack was evaluated following the methods described in Chapter 3. The experimental results are presented and discussed. The fanpack was found to have significant tonal noise issues at fan speeds below 1800 rpm. Design flaws in the fanpack and possible improvements are identified and discussed.
5.2 Wellington Drive Fanpack The Wellington fanpack is made up from three major components; the fan, the shroud, and the motor.
5.2.1 The Fan
The Wellington fan is a 200 mm diameter moulded plastic axial flow fan with four blades. Each blade is of uniform thickness (2.25 mm) and has a cambered profile. In general, the blade pitch angle increases from the leading edge to the trailing edge. The blade pitch angle at the trailing edge is approximately 36º, but varies over the span of the blade. The trailing edges are tapered to a sharp edge (Figure 5.1).
Figure 5.1: A Wellington 200 mm diameter moulded plastic fan.
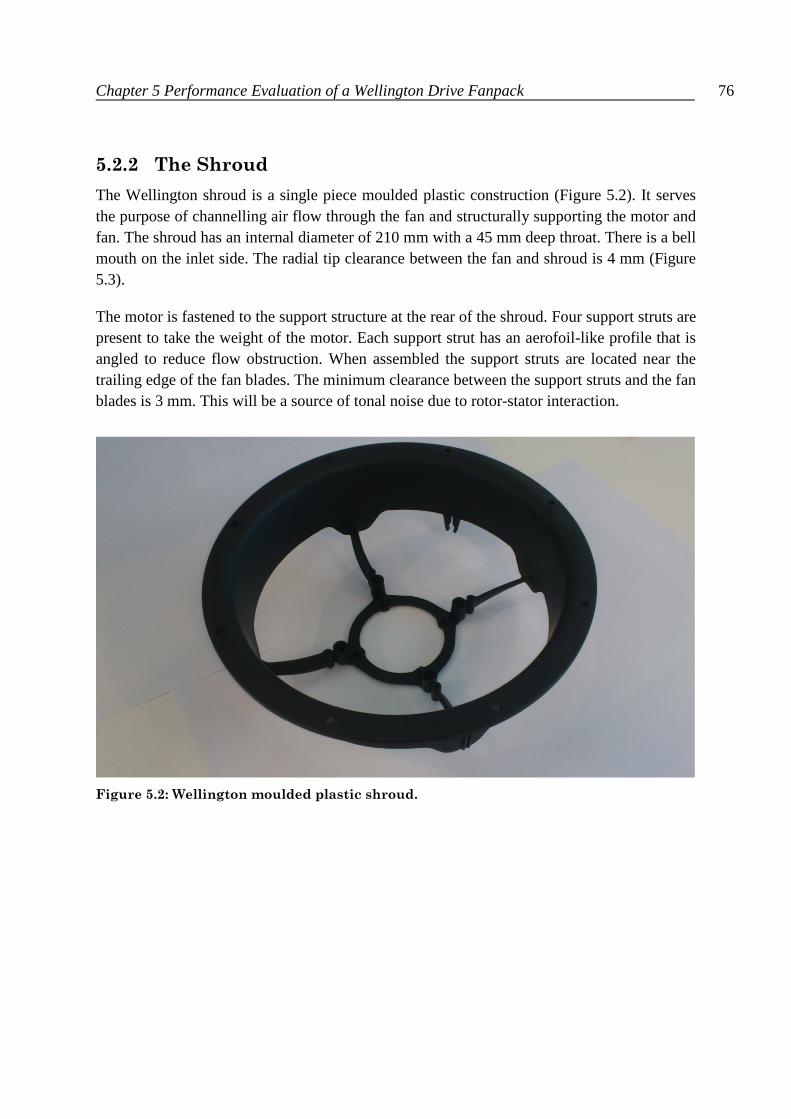
Chapter 5 Performance Evaluation of a Wellington Drive Fanpack 76
5.2.2 The Shroud
The Wellington shroud is a single piece moulded plastic construction (Figure 5.2). It serves the purpose of channelling air flow through the fan and structurally supporting the motor and fan. The shroud has an internal diameter of 210 mm with a 45 mm deep throat. There is a bell mouth on the inlet side. The radial tip clearance between the fan and shroud is 4 mm (Figure 5.3).
The motor is fastened to the support structure at the rear of the shroud. Four support struts are present to take the weight of the motor. Each support strut has an aerofoil-like profile that is angled to reduce flow obstruction. When assembled the support struts are located near the trailing edge of the fan blades. The minimum clearance between the support struts and the fan blades is 3 mm. This will be a source of tonal noise due to rotor-stator interaction.
Figure 5.2: Wellington moulded plastic shroud.
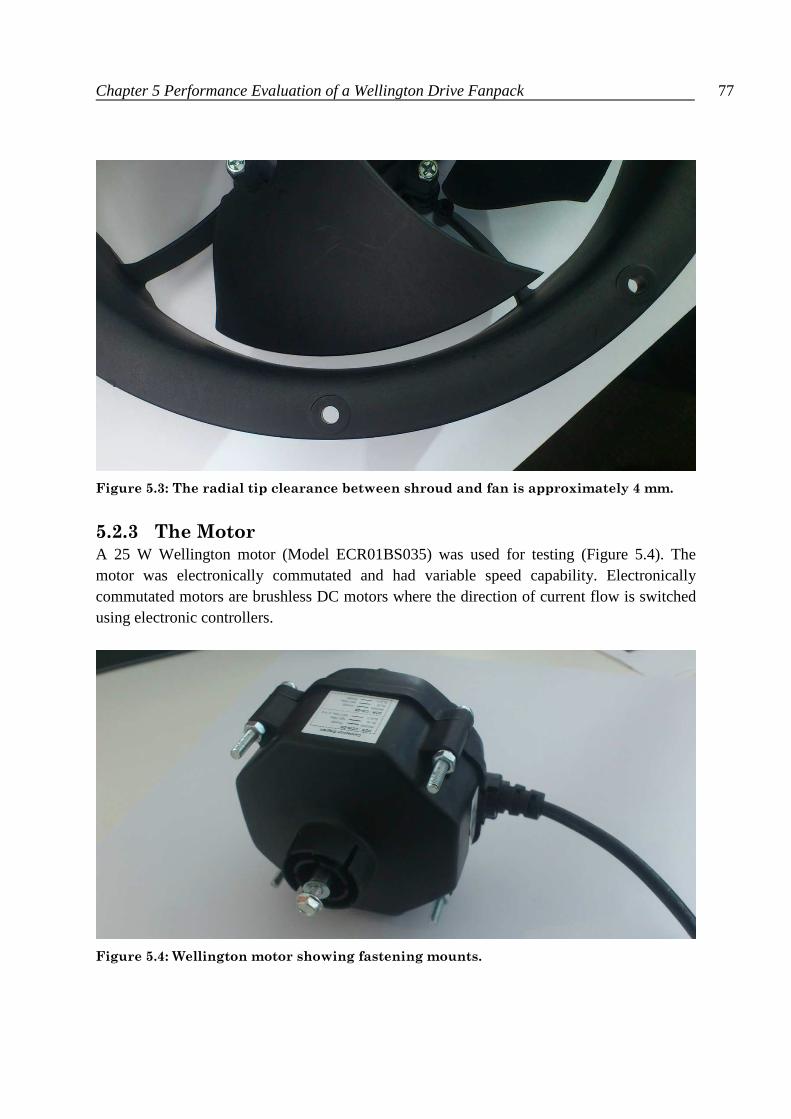
Chapter 5 Performance Evaluation of a Wellington Drive Fanpack 77
Figure 5.3: The radial tip clearance between shroud and fan is approximately 4 mm.
5.2.3 The Motor A 25 W Wellington motor (Model ECR01BS035) was used for testing (Figure 5.4). The motor was electronically commutated and had variable speed capability. Electronically commutated motors are brushless DC motors where the direction of current flow is switched using electronic controllers.
Figure 5.4: Wellington motor showing fastening mounts.
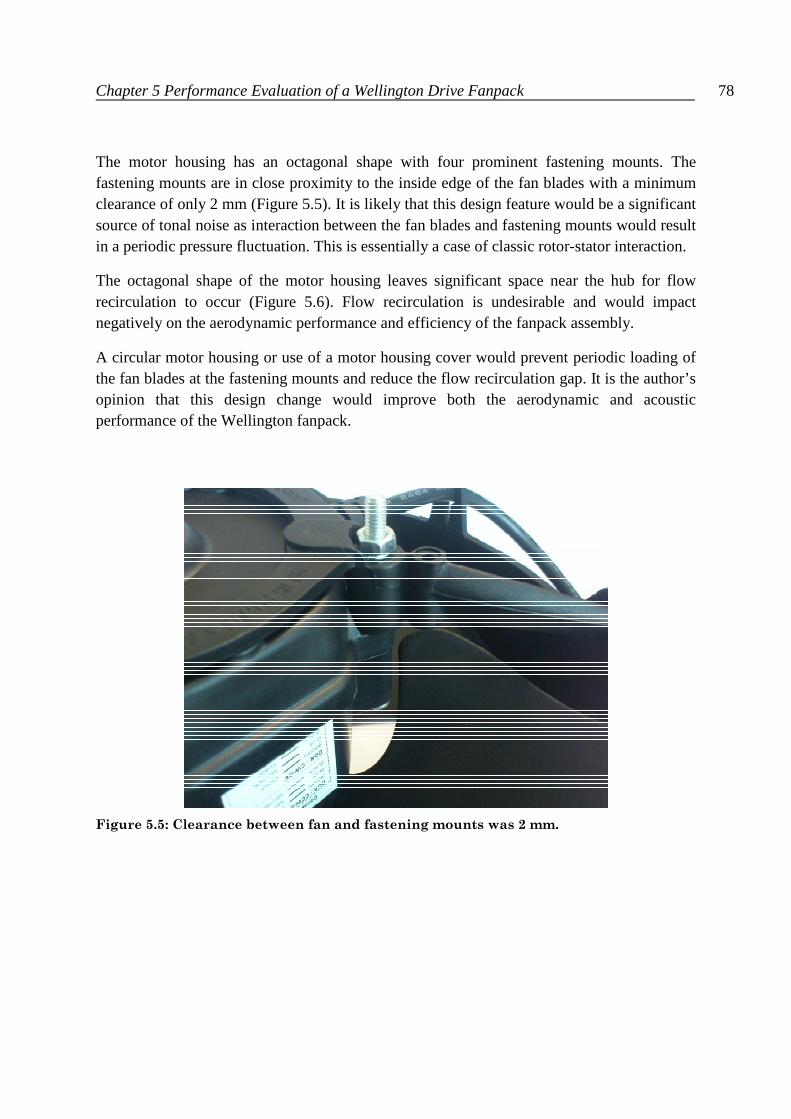
Chapter 5 Performance Evaluation of a Wellington Drive Fanpack 78
The motor housing has an octagonal shape with four prominent fastening mounts. The fastening mounts are in close proximity to the inside edge of the fan blades with a minimum clearance of only 2 mm (Figure 5.5). It is likely that this design feature would be a significant source of tonal noise as interaction between the fan blades and fastening mounts would result in a periodic pressure fluctuation. This is essentially a case of classic rotor-stator interaction.
The octagonal shape of the motor housing leaves significant space near the hub for flow recirculation to occur (Figure 5.6). Flow recirculation is undesirable and would impact negatively on the aerodynamic performance and efficiency of the fanpack assembly.
A circular motor housing or use of a motor housing cover would prevent periodic loading of the fan blades at the fastening mounts and reduce the flow recirculation gap. It is the author’s opinion that this design change would improve both the aerodynamic and acoustic performance of the Wellington fanpack.
Figure 5.5: Clearance between fan and fastening mounts was 2 mm.

Chapter 5 Performance Evaluation of a Wellington Drive Fanpack 79
Figure 5.6: Schematic highlighting clearance between the motor and fan.
5.3 Fanpack Performance with a 25 Watt Motor
The performance of the fanpack with the 25 W ECR01BS035 motor was evaluated following the methods described in Chapter 3.
5.3.1 Fanpack Performance Curves
The fan curves (Figure 5.7) are typical, showing a sginificant increase in performance with fan speed. The maximum fan speed used during testing was 2300 rpm, not 2400 rpm as used in Chapter 4, as 2300 rpm was the nominal speed quoted on the motor casing. It became clear during initial testing that the motor was not capable of maintaining 2400 rpm when loaded with a 50 Pa pressure drop.
The fanpack efficiency showed a strong dependency upon system impedance as demonstrated in both Figure 5.8 and Figure 5.10. This is best illustrated at 1800 rpm where the efficiency curve has a distinct hump shape. The peak achievable efficiency increases significantly with fan speed. The three complete efficiency curves at 1200, 1500 and 1800 rpm peak at 15 %, 19 %, and 24 % respectively. The highest efficiency achieved was 28 % for N = 2100 rpm and x = 140 mm. The 2100 and 2300 rpm curves are truncated, but extrapolation of the trends observed at lower speeds suggests that significant efficiency gains would be achieved at lower flow rates. Lower flow rates were not measured as the resulting increase in pressure would have exceeded the operational range of the measurement system. It should be noted that the efficiencies quoted here represent the efficiency of the fanpack as a whole (see Equation 5.1). This differs from the efficiencies quoted in Chapter 4, which were the
Area swept by fan
Motor
Fastening mount
Area of recirculation
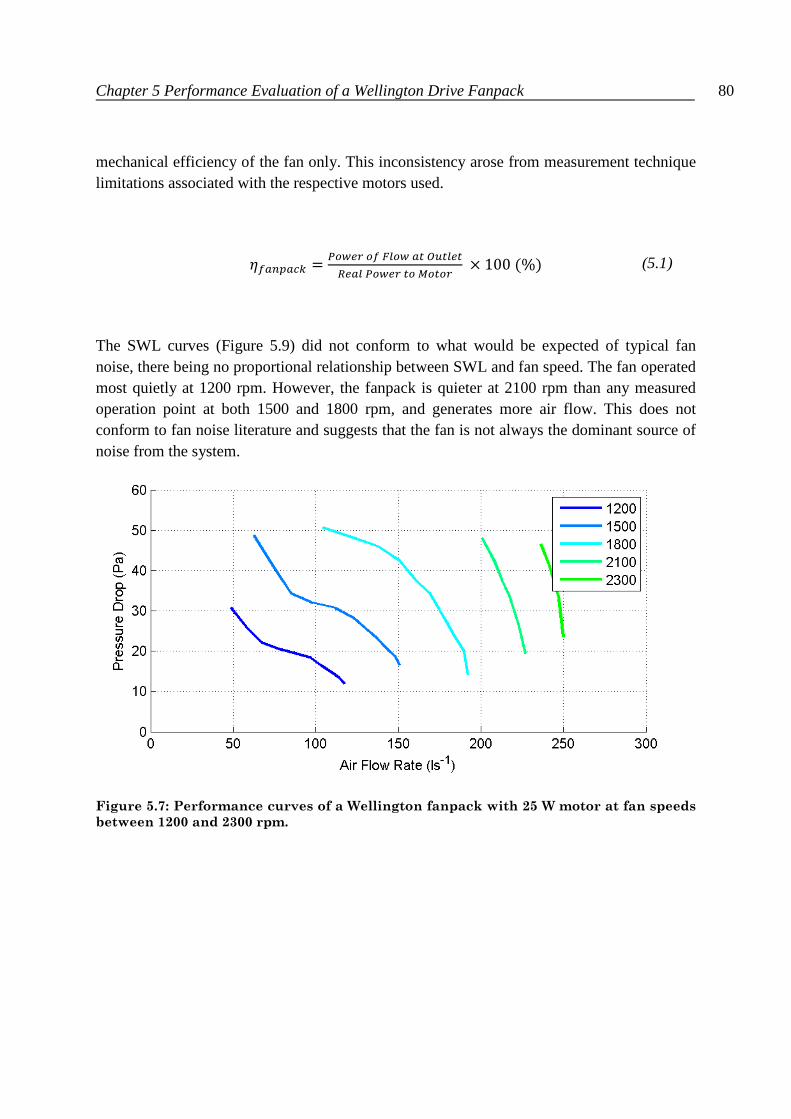
Chapter 5 Performance Evaluation of a Wellington Drive Fanpack 80
mechanical efficiency of the fan only. This inconsistency arose from measurement technique limitations associated with the respective motors used.
�������� =�� ������������
������ ��� × 100(%) (5.1)
The SWL curves (Figure 5.9) did not conform to what would be expected of typical fan noise, there being no proportional relationship between SWL and fan speed. The fan operated most quietly at 1200 rpm. However, the fanpack is quieter at 2100 rpm than any measured operation point at both 1500 and 1800 rpm, and generates more air flow. This does not conform to fan noise literature and suggests that the fan is not always the dominant source of noise from the system.
Figure 5.7: Performance curves of a Wellington fanpack with 25 W motor at fan speeds
between 1200 and 2300 rpm.
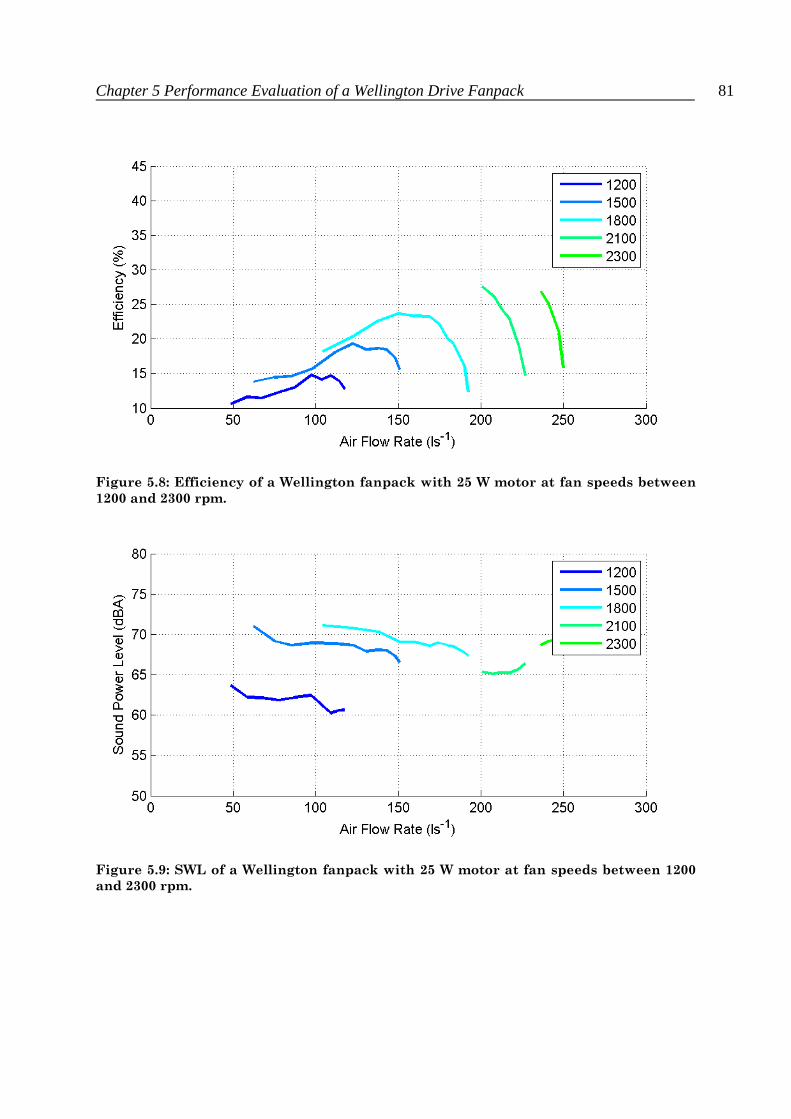
Chapter 5 Performance Evaluation of a Wellington Drive Fanpack 81
Figure 5.8: Efficiency of a Wellington fanpack with 25 W motor at fan speeds between
1200 and 2300 rpm.
Figure 5.9: SWL of a Wellington fanpack with 25 W motor at fan speeds between 1200
and 2300 rpm.

Chapter 5 Performance Evaluation of a Wellington Drive Fanpack 82
Figure 5.10: Efficiency of a Wellington fanpack with 25 W motor at fan speeds between
1200 and 2300 rpm.
Figure 5.11: SWL of a Wellington fanpack with 25 W motor at fan speeds between 1200
and 2300 rpm.
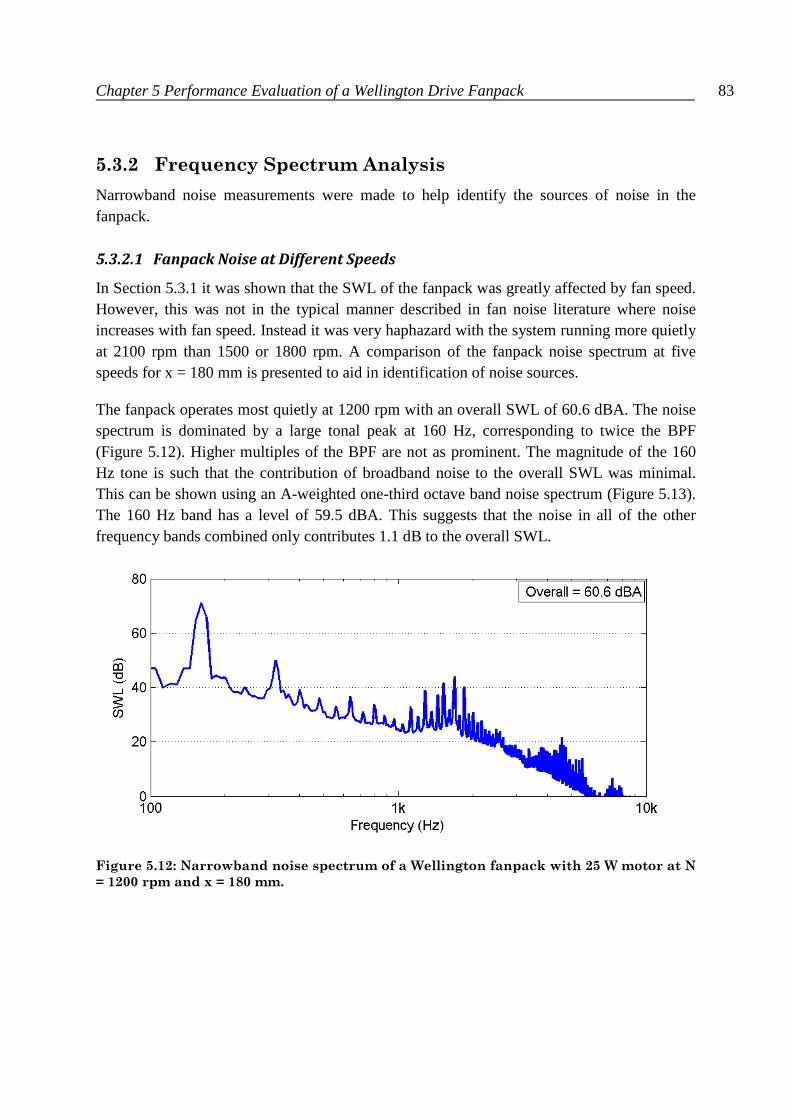
Chapter 5 Performance Evaluation of a Wellington Drive Fanpack 83
5.3.2 Frequency Spectrum Analysis
Narrowband noise measurements were made to help identify the sources of noise in the fanpack.
5.3.2.1 Fanpack Noise at Different Speeds
In Section 5.3.1 it was shown that the SWL of the fanpack was greatly affected by fan speed. However, this was not in the typical manner described in fan noise literature where noise increases with fan speed. Instead it was very haphazard with the system running more quietly at 2100 rpm than 1500 or 1800 rpm. A comparison of the fanpack noise spectrum at five speeds for x = 180 mm is presented to aid in identification of noise sources.
The fanpack operates most quietly at 1200 rpm with an overall SWL of 60.6 dBA. The noise spectrum is dominated by a large tonal peak at 160 Hz, corresponding to twice the BPF (Figure 5.12). Higher multiples of the BPF are not as prominent. The magnitude of the 160 Hz tone is such that the contribution of broadband noise to the overall SWL was minimal. This can be shown using an A-weighted one-third octave band noise spectrum (Figure 5.13). The 160 Hz band has a level of 59.5 dBA. This suggests that the noise in all of the other frequency bands combined only contributes 1.1 dB to the overall SWL.
Figure 5.12: Narrowband noise spectrum of a Wellington fanpack with 25 W motor at N
= 1200 rpm and x = 180 mm.
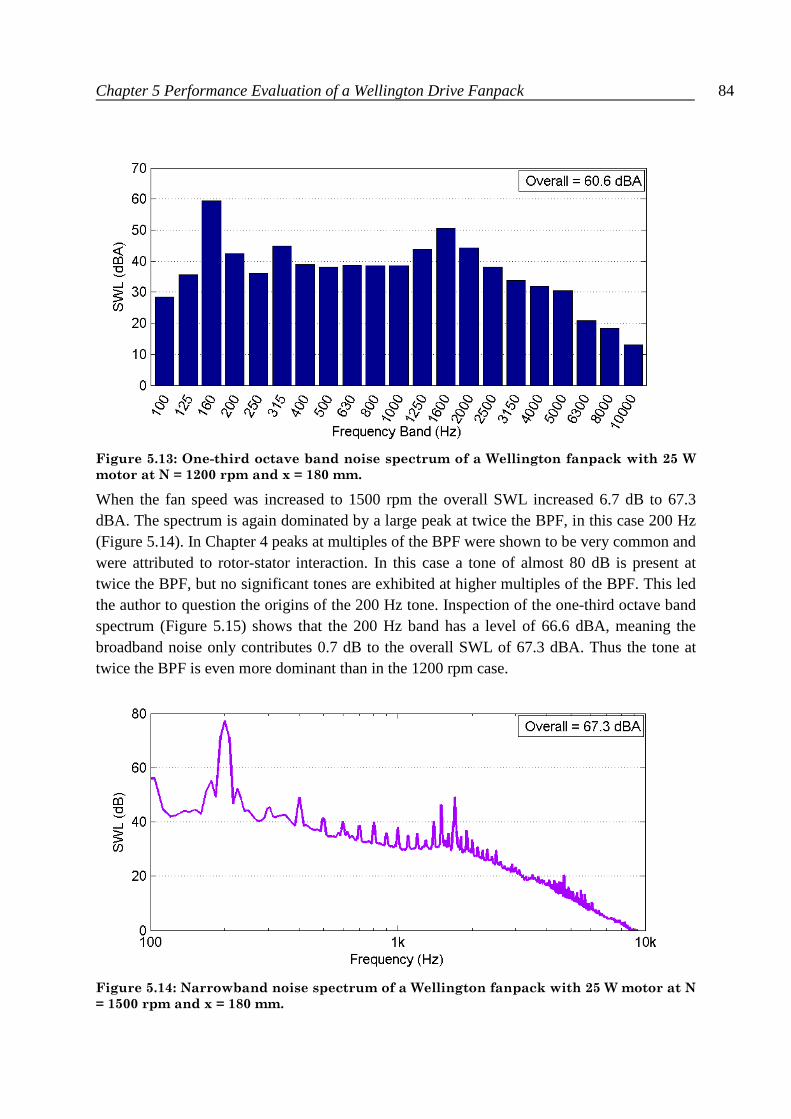
Chapter 5 Performance Evaluation of a Wellington Drive Fanpack 84
Figure 5.13: One-third octave band noise spectrum of a Wellington fanpack with 25 W
motor at N = 1200 rpm and x = 180 mm.
When the fan speed was increased to 1500 rpm the overall SWL increased 6.7 dB to 67.3 dBA. The spectrum is again dominated by a large peak at twice the BPF, in this case 200 Hz (Figure 5.14). In Chapter 4 peaks at multiples of the BPF were shown to be very common and were attributed to rotor-stator interaction. In this case a tone of almost 80 dB is present at twice the BPF, but no significant tones are exhibited at higher multiples of the BPF. This led the author to question the origins of the 200 Hz tone. Inspection of the one-third octave band spectrum (Figure 5.15) shows that the 200 Hz band has a level of 66.6 dBA, meaning the broadband noise only contributes 0.7 dB to the overall SWL of 67.3 dBA. Thus the tone at twice the BPF is even more dominant than in the 1200 rpm case.
Figure 5.14: Narrowband noise spectrum of a Wellington fanpack with 25 W motor at N
= 1500 rpm and x = 180 mm.
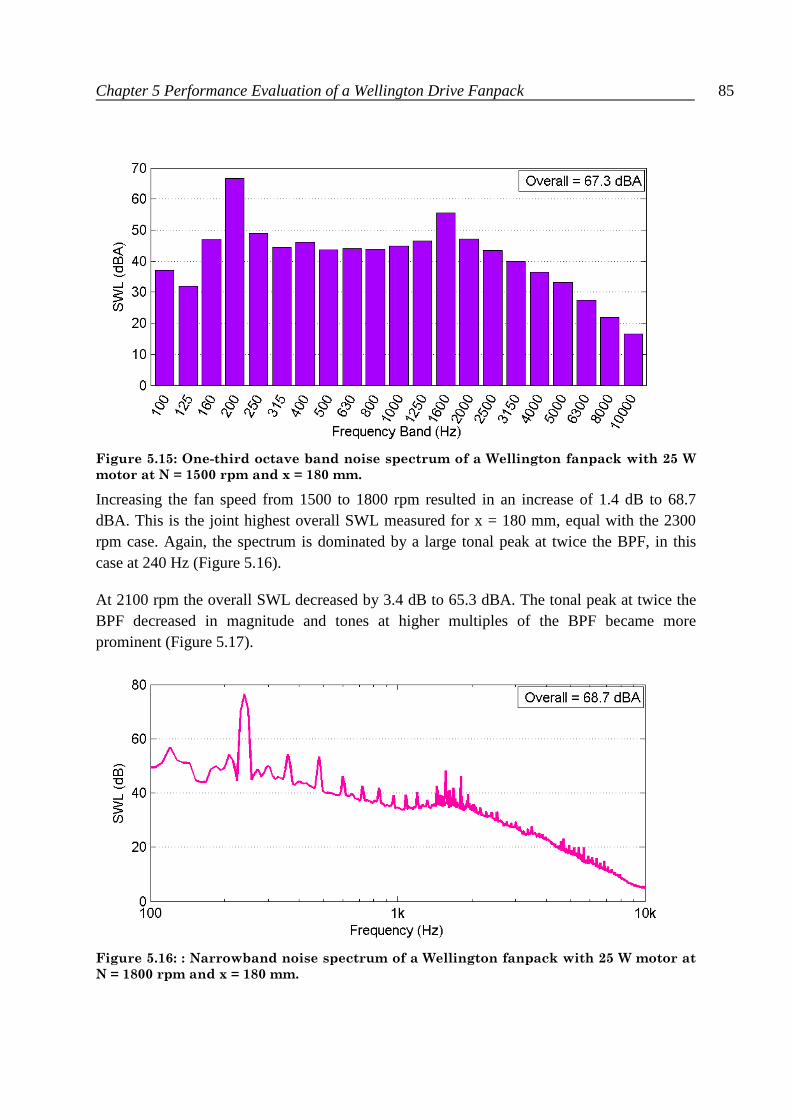
Chapter 5 Performance Evaluation of a Wellington Drive Fanpack 85
Figure 5.15: One-third octave band noise spectrum of a Wellington fanpack with 25 W
motor at N = 1500 rpm and x = 180 mm.
Increasing the fan speed from 1500 to 1800 rpm resulted in an increase of 1.4 dB to 68.7 dBA. This is the joint highest overall SWL measured for x = 180 mm, equal with the 2300 rpm case. Again, the spectrum is dominated by a large tonal peak at twice the BPF, in this case at 240 Hz (Figure 5.16).
At 2100 rpm the overall SWL decreased by 3.4 dB to 65.3 dBA. The tonal peak at twice the BPF decreased in magnitude and tones at higher multiples of the BPF became more prominent (Figure 5.17).
Figure 5.16: : Narrowband noise spectrum of a Wellington fanpack with 25 W motor at
N = 1800 rpm and x = 180 mm.

Chapter 5 Performance Evaluation of a Wellington Drive Fanpack 86
Figure 5.17: : Narrowband noise spectrum of a Wellington fanpack with 25 W motor at
N = 2100 rpm and x = 180 mm.
The one-third octave band spectrum at 2100 rpm shows a much more balanced broadband source (Figure 5.18). The spectrum is not dominated by any particular frequency band, which is ideal for achieving a low SWL.
Figure 5.18: One-third octave band noise spectrum of a Wellington fanpack with 25 W
motor at N = 2100 rpm and x = 180 mm.
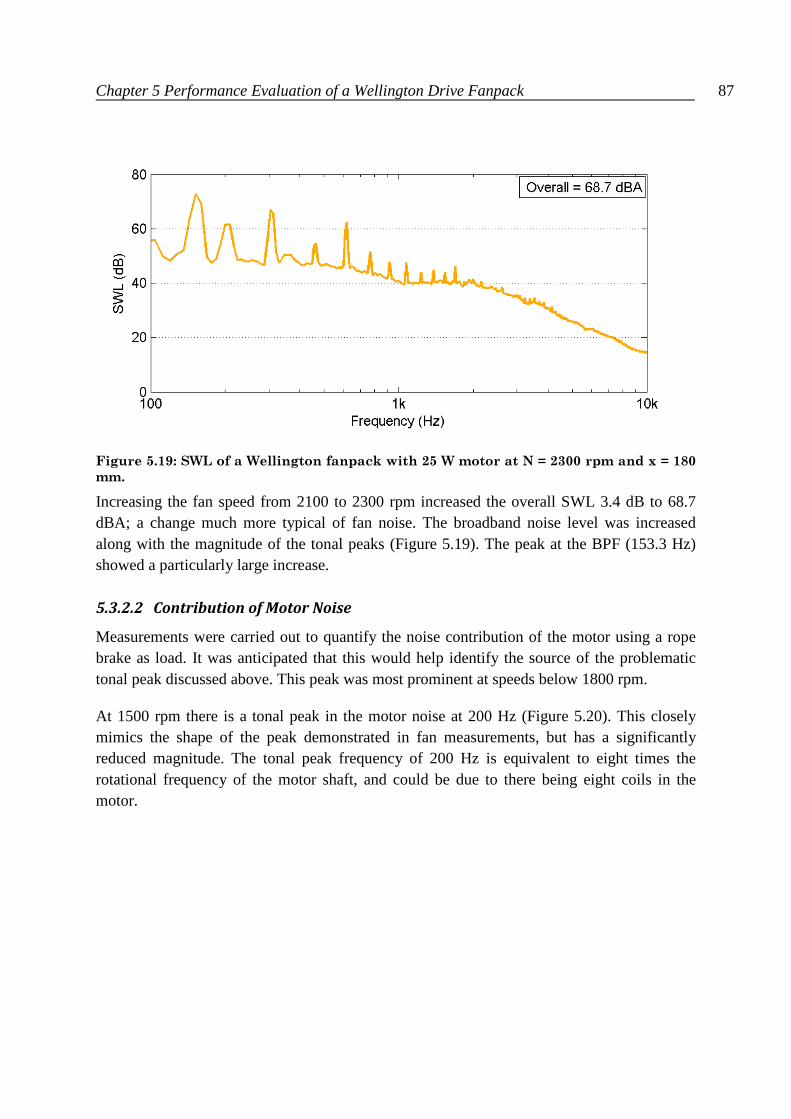
Chapter 5 Performance Evaluation of a Wellington Drive Fanpack 87
Figure 5.19: SWL of a Wellington fanpack with 25 W motor at N = 2300 rpm and x = 180
mm.
Increasing the fan speed from 2100 to 2300 rpm increased the overall SWL 3.4 dB to 68.7 dBA; a change much more typical of fan noise. The broadband noise level was increased along with the magnitude of the tonal peaks (Figure 5.19). The peak at the BPF (153.3 Hz) showed a particularly large increase.
5.3.2.2 Contribution of Motor Noise
Measurements were carried out to quantify the noise contribution of the motor using a rope brake as load. It was anticipated that this would help identify the source of the problematic tonal peak discussed above. This peak was most prominent at speeds below 1800 rpm.
At 1500 rpm there is a tonal peak in the motor noise at 200 Hz (Figure 5.20). This closely mimics the shape of the peak demonstrated in fan measurements, but has a significantly reduced magnitude. The tonal peak frequency of 200 Hz is equivalent to eight times the rotational frequency of the motor shaft, and could be due to there being eight coils in the motor.
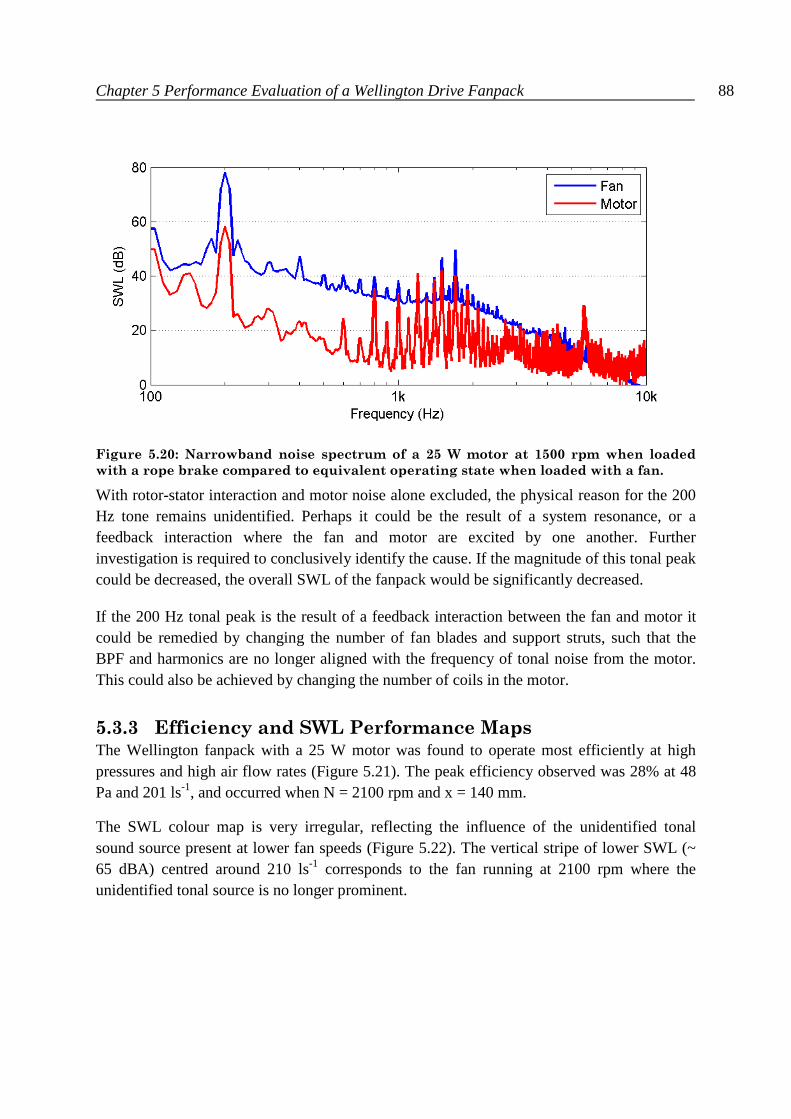
Chapter 5 Performance Evaluation of a Wellington Drive Fanpack 88
Figure 5.20: Narrowband noise spectrum of a 25 W motor at 1500 rpm when loaded
with a rope brake compared to equivalent operating state when loaded with a fan.
With rotor-stator interaction and motor noise alone excluded, the physical reason for the 200 Hz tone remains unidentified. Perhaps it could be the result of a system resonance, or a feedback interaction where the fan and motor are excited by one another. Further investigation is required to conclusively identify the cause. If the magnitude of this tonal peak could be decreased, the overall SWL of the fanpack would be significantly decreased.
If the 200 Hz tonal peak is the result of a feedback interaction between the fan and motor it could be remedied by changing the number of fan blades and support struts, such that the BPF and harmonics are no longer aligned with the frequency of tonal noise from the motor. This could also be achieved by changing the number of coils in the motor.
5.3.3 Efficiency and SWL Performance Maps The Wellington fanpack with a 25 W motor was found to operate most efficiently at high pressures and high air flow rates (Figure 5.21). The peak efficiency observed was 28% at 48 Pa and 201 ls-1, and occurred when N = 2100 rpm and x = 140 mm.
The SWL colour map is very irregular, reflecting the influence of the unidentified tonal sound source present at lower fan speeds (Figure 5.22). The vertical stripe of lower SWL (~ 65 dBA) centred around 210 ls-1 corresponds to the fan running at 2100 rpm where the unidentified tonal source is no longer prominent.
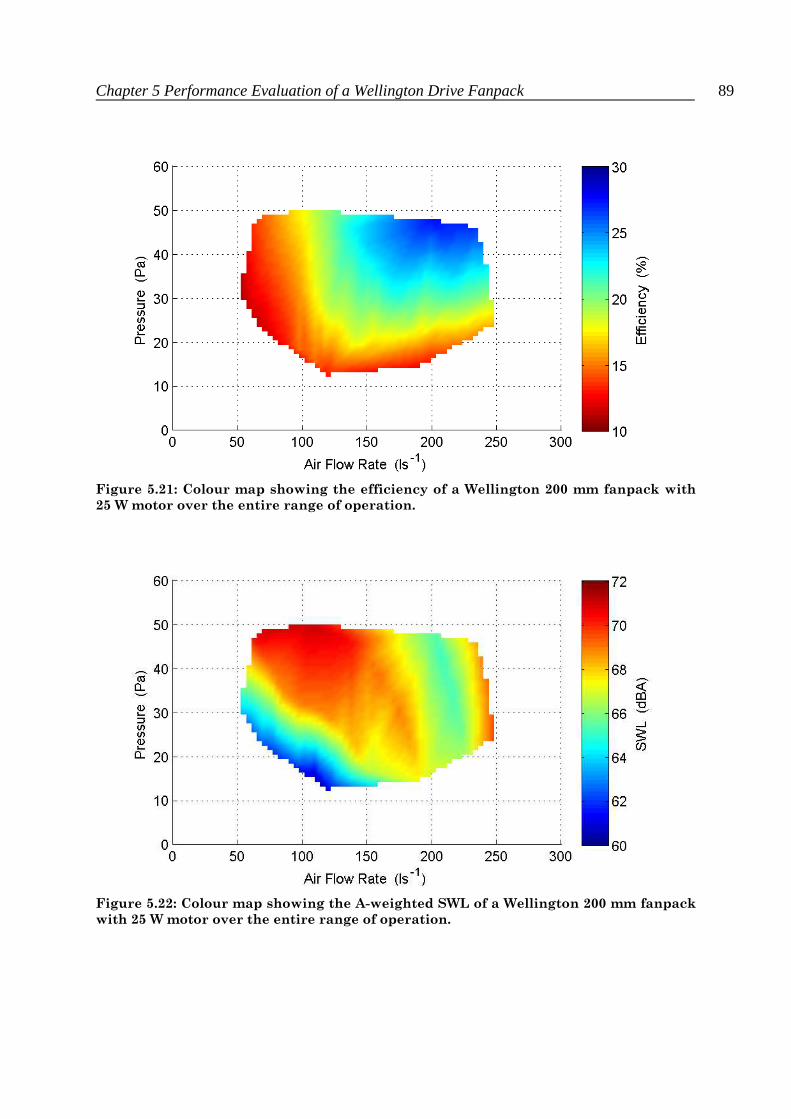
Chapter 5 Performance Evaluation of a Wellington Drive Fanpack 89
Figure 5.21: Colour map showing the efficiency of a Wellington 200 mm fanpack with
25 W motor over the entire range of operation.
Figure 5.22: Colour map showing the A-weighted SWL of a Wellington 200 mm fanpack
with 25 W motor over the entire range of operation.

90
Chapter 6
Development and Performance of
Prototype Fans
Summary
Four prototype fans were developed to explore improvement opportunities for the current Wellington fan. The prototype fans were all modified versions of the moulded plastic Wellington fan investigated in Chapter 5. In this chapter the aerodynamic and acoustic performance of each of the prototype fans is evaluated and discussed.
Chapter 6 Development and Performance of Prototype Fans 92
Table of Contents
Summary .................................................................................................................................. 91
List of Figures .......................................................................................................................... 93
6.1 Introduction ................................................................................................................... 95
6.2 Prototype Fan P1 ........................................................................................................... 95
6.2.1 Suction Side Winglets ........................................................................................... 95
6.2.2 Performance of P1 ................................................................................................. 96
6.2.3 Frequency Spectrum Analysis of P1 ..................................................................... 98
6.3 Prototype Fan P2 ......................................................................................................... 101
6.3.1 Suction Side Winglets ......................................................................................... 101
6.3.2 Performance of P2 ............................................................................................... 102
6.3.3 Frequency Spectrum Analysis of P2 ................................................................... 104
6.4 Prototype Fan P3 ......................................................................................................... 107
6.4.1 Pressure Side Winglets ........................................................................................ 107
6.4.2 Performance of P3 ............................................................................................... 108
6.4.3 Frequency Spectrum Analysis of P3 ................................................................... 110
6.5 Prototype Fan P4 ......................................................................................................... 113
6.5.1 Serrated Trailing Edges ....................................................................................... 113
6.5.2 Performance of P4 ............................................................................................... 115
6.5.3 Frequency Spectrum Analysis of P4 ................................................................... 116
6.6 Conclusion .................................................................................................................. 119
6.7 References ................................................................................................................... 119

Chapter 6 Development and Performance of Prototype Fans 93
List of Figures
Figure 6.1: Plan view of a P1 winglet ...................................................................................... 95
Figure 6.2: Prototype fan P1 as tested. .................................................................................... 96
Figure 6.3: Fan curve comparing P1 to the original Wellington fan. ...................................... 97
Figure 6.4: Efficiency comparison of P1 and the original Wellington fan. ............................. 97
Figure 6.5: SWL comparison of P1 and the original Wellington fan. ..................................... 98
Figure 6.6: Narrowband noise spectrum comparison of P1 and the original Wellington fan for N = 2100 rpm and x = 140 mm. ............................................................................................... 99
Figure 6.7: One-third octave band noise comparison of P1 and the original Wellington fan for N = 2100 rpm and x = 140 mm. ............................................................................................... 99
Figure 6.8: Narrowband noise spectrum comparison of P1 and the original Wellington fan for N = 2100 rpm and x = 300 mm. ............................................................................................. 100
Figure 6.9: One-third octave band noise comparison of P1 and the original Wellington fan for N = 2100 rpm and x = 300 mm. ............................................................................................. 100
Figure 6.10: Close up view of tones at second and third multiples of the BPF. .................... 101
Figure 6.11: Plan view of a P2 winglet .................................................................................. 101
Figure 6.12: Prototype fan P2 as tested. ................................................................................ 102
Figure 6.13: Fan curve comparing P2 to the original Wellington fan. .................................. 103
Figure 6.14: Efficiency comparison of P2 and the original Wellington fan. ......................... 103
Figure 6.15: SWL comparison of P2 and the original Wellington fan. ................................. 104
Figure 6.16: Narrowband noise spectrum comparison of P2 and the original Wellington fan for N = 2100 rpm and x = 140 mm. ....................................................................................... 105
Figure 6.17: One-third octave band noise comparison of P2 and the original Wellington fan for N = 2100 rpm and x = 140 mm. ....................................................................................... 105
Figure 6.18: Narrowband noise spectrum comparison of P2 and the original Wellington fan for N = 2100 rpm and x = 300 mm. ....................................................................................... 106
Figure 6.19: One-third octave band noise comparison of P2 and the original Wellington fan for N = 2100 rpm and x = 300 mm. ....................................................................................... 106
Figure 6.20: Tip platform extensions as investigated by Akturk ........................................... 107
Figure 6.21: Plan view of a P3 winglet .................................................................................. 107
Figure 6.22: Prototype fan P3 as tested. ................................................................................ 108
Figure 6.23: Fan curve comparing P3 to the original Wellington fan. .................................. 109
Chapter 6 Development and Performance of Prototype Fans 94
Figure 6.24: Efficiency comparison of P3 and the original Wellington fan. ......................... 109
Figure 6.25: SWL comparison of P3 and the original Wellington fan. ................................. 110
Figure 6.26: Narrowband noise spectrum comparison of P3 and the original Wellington fan for N = 2100 rpm and x = 140 mm. ....................................................................................... 111
Figure 6.27: One-third octave band noise comparison of P3 and the original Wellington fan for N = 2100 rpm and x = 140 mm. ....................................................................................... 111
Figure 6.28: Narrowband noise spectrum comparison of P3 and the original Wellington fan for N = 2100 rpm and x = 300 mm. ....................................................................................... 112
Figure 6.29: One-third octave band noise comparison of P3 and the original Wellington fan for N = 2100 rpm and x = 300 mm. ....................................................................................... 112
Figure 6.30: Prototype fan P4 as tested. ................................................................................ 113
Figure 6.31: Plan view of a P4 fan blade showing trailing edge serrations ........................... 114
Figure 6.32: Fan curve comparing P4 to the original Wellington fan. .................................. 115
Figure 6.33: Efficiency comparison of P4 and the original Wellington fan. ......................... 116
Figure 6.34: SWL comparison of P4 and the original Wellington fan. ................................. 116
Figure 6.35: Narrowband noise spectrum comparison of P4 and the original Wellington fan for N = 2100 rpm and x = 140 mm. ....................................................................................... 117
Figure 6.36: One-third octave band noise comparison of P4 and the original Wellington fan for N = 2100 rpm and x = 140 mm. ....................................................................................... 118
Figure 6.37: Narrowband noise spectrum comparison of P4 and the original Wellington fan for N = 2100 rpm and x = 300 mm. ....................................................................................... 118
Figure 6.38: One-third octave band noise comparison of P4 and the original Wellington fan for N = 2100 rpm and x = 300 mm. ....................................................................................... 119
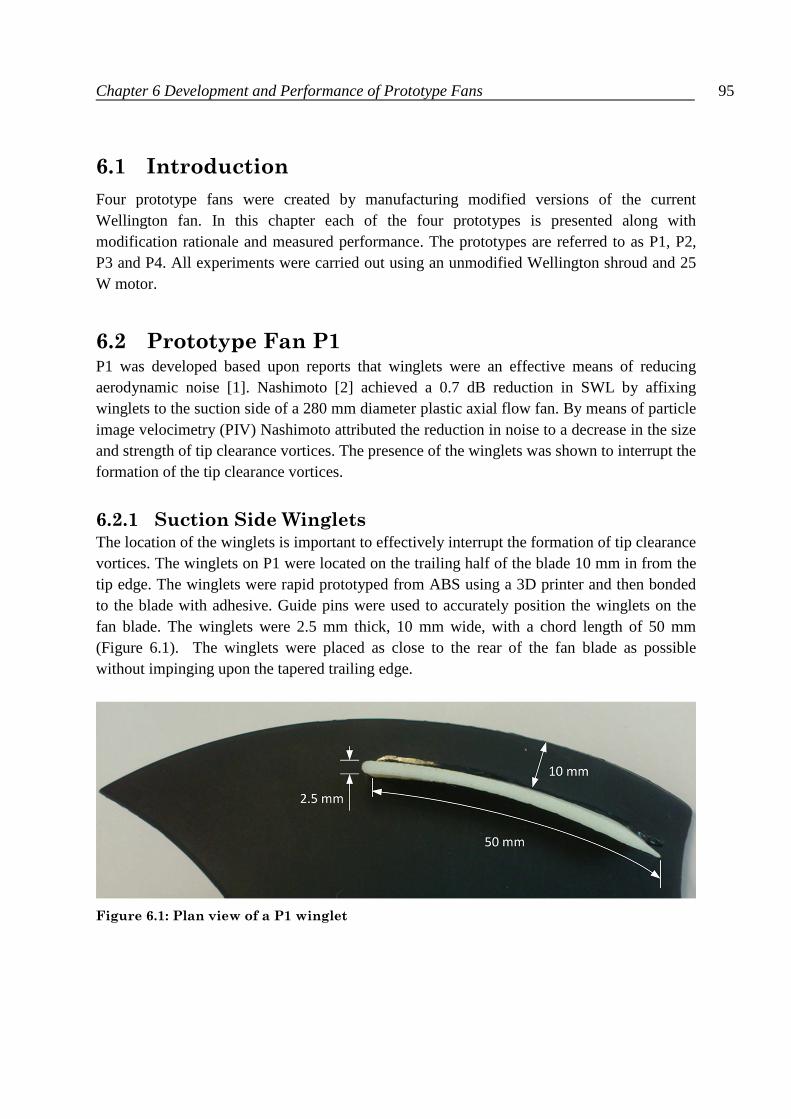
Chapter 6 Development and Performance of Prototype Fans 95
6.1 Introduction
Four prototype fans were created by manufacturing modified versions of the current Wellington fan. In this chapter each of the four prototypes is presented along with modification rationale and measured performance. The prototypes are referred to as P1, P2, P3 and P4. All experiments were carried out using an unmodified Wellington shroud and 25 W motor.
6.2 Prototype Fan P1 P1 was developed based upon reports that winglets were an effective means of reducing aerodynamic noise [1]. Nashimoto [2] achieved a 0.7 dB reduction in SWL by affixing winglets to the suction side of a 280 mm diameter plastic axial flow fan. By means of particle image velocimetry (PIV) Nashimoto attributed the reduction in noise to a decrease in the size and strength of tip clearance vortices. The presence of the winglets was shown to interrupt the formation of the tip clearance vortices.
6.2.1 Suction Side Winglets The location of the winglets is important to effectively interrupt the formation of tip clearance vortices. The winglets on P1 were located on the trailing half of the blade 10 mm in from the tip edge. The winglets were rapid prototyped from ABS using a 3D printer and then bonded to the blade with adhesive. Guide pins were used to accurately position the winglets on the fan blade. The winglets were 2.5 mm thick, 10 mm wide, with a chord length of 50 mm (Figure 6.1). The winglets were placed as close to the rear of the fan blade as possible without impinging upon the tapered trailing edge.
Figure 6.1: Plan view of a P1 winglet
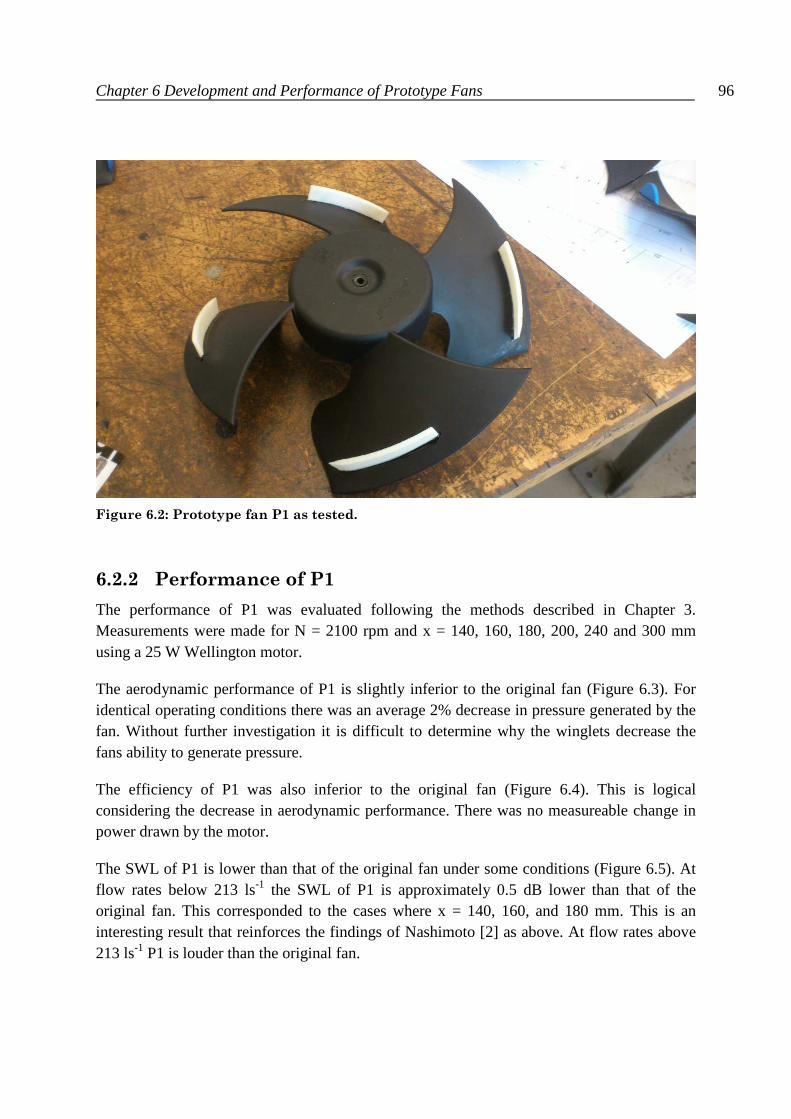
Chapter 6 Development and Performance of Prototype Fans 96
Figure 6.2: Prototype fan P1 as tested.
6.2.2 Performance of P1
The performance of P1 was evaluated following the methods described in Chapter 3. Measurements were made for N = 2100 rpm and x = 140, 160, 180, 200, 240 and 300 mm using a 25 W Wellington motor.
The aerodynamic performance of P1 is slightly inferior to the original fan (Figure 6.3). For identical operating conditions there was an average 2% decrease in pressure generated by the fan. Without further investigation it is difficult to determine why the winglets decrease the fans ability to generate pressure.
The efficiency of P1 was also inferior to the original fan (Figure 6.4). This is logical considering the decrease in aerodynamic performance. There was no measureable change in power drawn by the motor.
The SWL of P1 is lower than that of the original fan under some conditions (Figure 6.5). At flow rates below 213 ls-1 the SWL of P1 is approximately 0.5 dB lower than that of the original fan. This corresponded to the cases where x = 140, 160, and 180 mm. This is an interesting result that reinforces the findings of Nashimoto [2] as above. At flow rates above 213 ls-1 P1 is louder than the original fan.
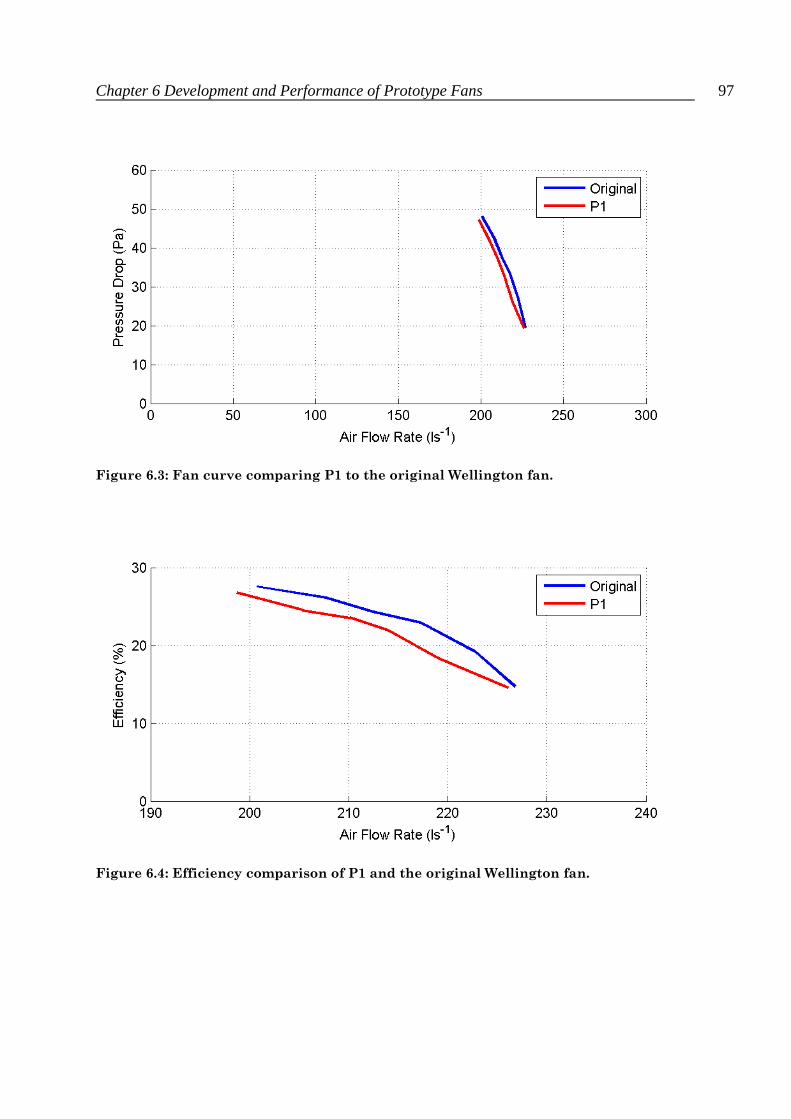
Chapter 6 Development and Performance of Prototype Fans 97
Figure 6.3: Fan curve comparing P1 to the original Wellington fan.
Figure 6.4: Efficiency comparison of P1 and the original Wellington fan.
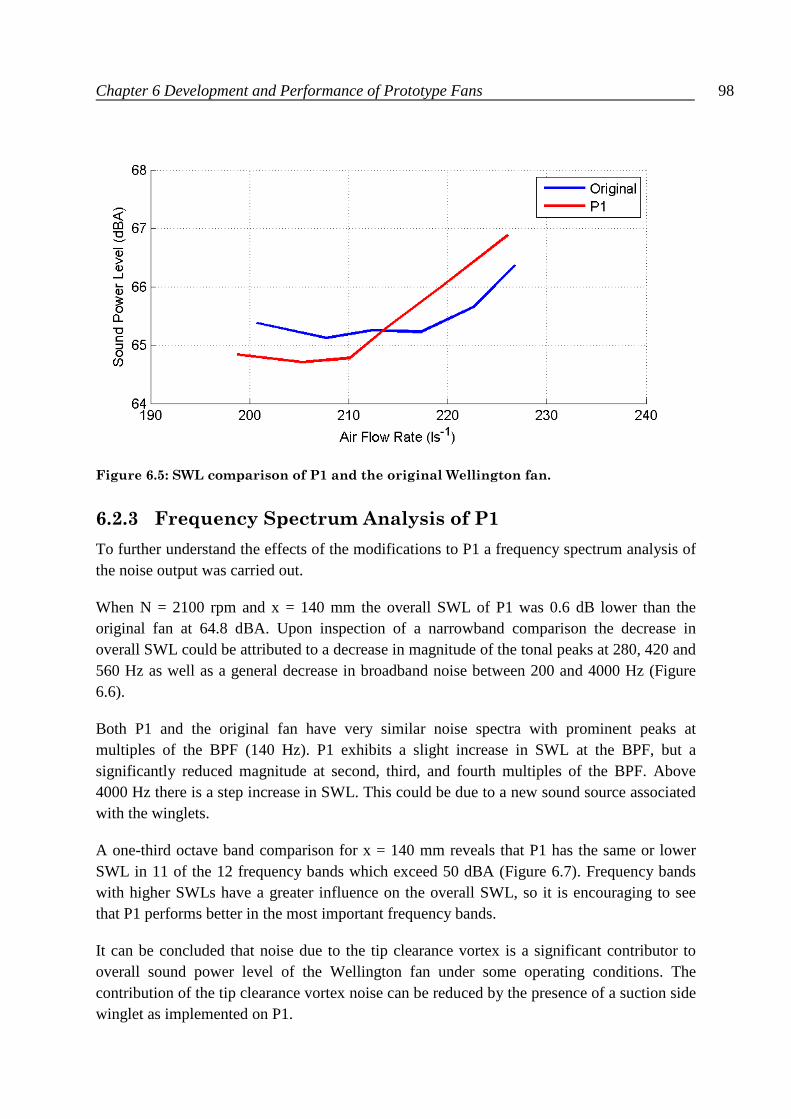
Chapter 6 Development and Performance of Prototype Fans 98
Figure 6.5: SWL comparison of P1 and the original Wellington fan.
6.2.3 Frequency Spectrum Analysis of P1
To further understand the effects of the modifications to P1 a frequency spectrum analysis of the noise output was carried out.
When N = 2100 rpm and x = 140 mm the overall SWL of P1 was 0.6 dB lower than the original fan at 64.8 dBA. Upon inspection of a narrowband comparison the decrease in overall SWL could be attributed to a decrease in magnitude of the tonal peaks at 280, 420 and 560 Hz as well as a general decrease in broadband noise between 200 and 4000 Hz (Figure 6.6).
Both P1 and the original fan have very similar noise spectra with prominent peaks at multiples of the BPF (140 Hz). P1 exhibits a slight increase in SWL at the BPF, but a significantly reduced magnitude at second, third, and fourth multiples of the BPF. Above 4000 Hz there is a step increase in SWL. This could be due to a new sound source associated with the winglets.
A one-third octave band comparison for x = 140 mm reveals that P1 has the same or lower SWL in 11 of the 12 frequency bands which exceed 50 dBA (Figure 6.7). Frequency bands with higher SWLs have a greater influence on the overall SWL, so it is encouraging to see that P1 performs better in the most important frequency bands.
It can be concluded that noise due to the tip clearance vortex is a significant contributor to overall sound power level of the Wellington fan under some operating conditions. The contribution of the tip clearance vortex noise can be reduced by the presence of a suction side winglet as implemented on P1.
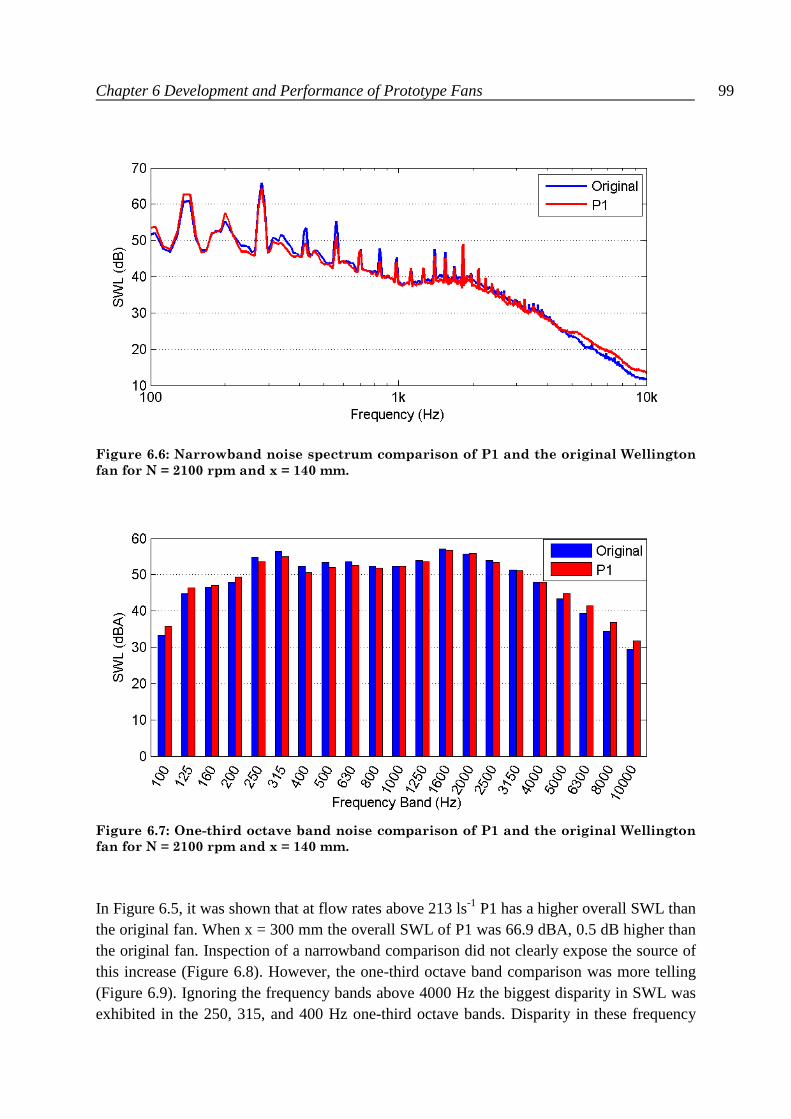
Chapter 6 Development and Performance of Prototype Fans 99
Figure 6.6: Narrowband noise spectrum comparison of P1 and the original Wellington
fan for N = 2100 rpm and x = 140 mm.
Figure 6.7: One-third octave band noise comparison of P1 and the original Wellington
fan for N = 2100 rpm and x = 140 mm.
In Figure 6.5, it was shown that at flow rates above 213 ls-1 P1 has a higher overall SWL than the original fan. When x = 300 mm the overall SWL of P1 was 66.9 dBA, 0.5 dB higher than the original fan. Inspection of a narrowband comparison did not clearly expose the source of this increase (Figure 6.8). However, the one-third octave band comparison was more telling (Figure 6.9). Ignoring the frequency bands above 4000 Hz the biggest disparity in SWL was exhibited in the 250, 315, and 400 Hz one-third octave bands. Disparity in these frequency

Chapter 6 Development and Performance of Prototype Fans 100
bands was crucial as they had greatest magnitude. Noise above 4000 Hz was ignored because it was of considerably lower magnitude, and thus less influential on the overall SWL.
Closer inspection of the narrowband comparison revealed that the increase in the 250, 315, and 400 Hz bands was due to increased magnitude of the second and third multiples of the BPF (Figure 6.10). It was not expected that the winglets would affect this type of tonal noise as they do not alter the clearance between the fan and support structure.
Figure 6.8: Narrowband noise spectrum comparison of P1 and the original Wellington
fan for N = 2100 rpm and x = 300 mm.
Figure 6.9: One-third octave band noise comparison of P1 and the original Wellington
fan for N = 2100 rpm and x = 300 mm.

Chapter 6 Development and Performance of Prototype Fans 101
Figure 6.10: Close up view of tones at second and third multiples of the BPF.
6.3 Prototype Fan P2 P2 was developed as a variation of P1 to assess the importance of the location of suction side winglets.
6.3.1 Suction Side Winglets For P2, the winglets were located on the trailing half of the blade flush with the tip edge. The winglets were manufactured and affixed in the same manner as P1. The winglets were 2.5 mm thick, 10 mm wide, with a chord length of 50 mm (Figure 6.11).
Figure 6.11: Plan view of a P2 winglet
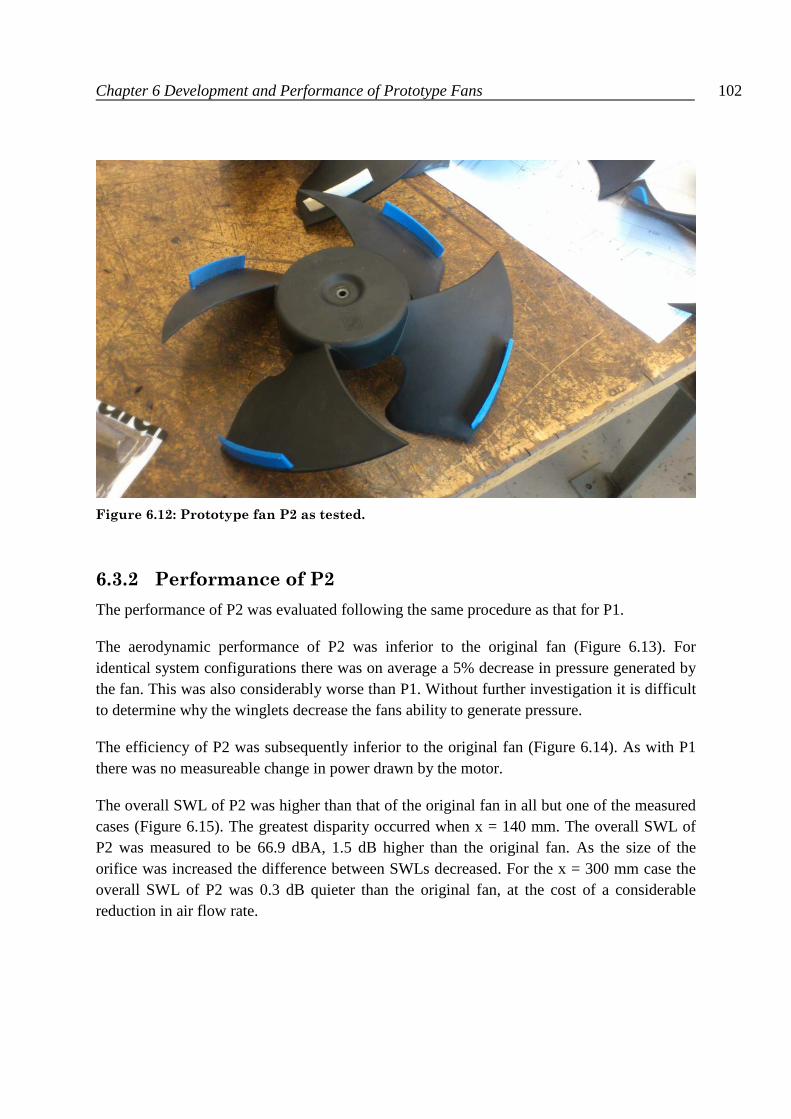
Chapter 6 Development and Performance of Prototype Fans 102
Figure 6.12: Prototype fan P2 as tested.
6.3.2 Performance of P2
The performance of P2 was evaluated following the same procedure as that for P1.
The aerodynamic performance of P2 was inferior to the original fan (Figure 6.13). For identical system configurations there was on average a 5% decrease in pressure generated by the fan. This was also considerably worse than P1. Without further investigation it is difficult to determine why the winglets decrease the fans ability to generate pressure.
The efficiency of P2 was subsequently inferior to the original fan (Figure 6.14). As with P1 there was no measureable change in power drawn by the motor.
The overall SWL of P2 was higher than that of the original fan in all but one of the measured cases (Figure 6.15). The greatest disparity occurred when x = 140 mm. The overall SWL of P2 was measured to be 66.9 dBA, 1.5 dB higher than the original fan. As the size of the orifice was increased the difference between SWLs decreased. For the x = 300 mm case the overall SWL of P2 was 0.3 dB quieter than the original fan, at the cost of a considerable reduction in air flow rate.

Chapter 6 Development and Performance of Prototype Fans 103
Figure 6.13: Fan curve comparing P2 to the original Wellington fan.
Figure 6.14: Efficiency comparison of P2 and the original Wellington fan.

Chapter 6 Development and Performance of Prototype Fans 104
Figure 6.15: SWL comparison of P2 and the original Wellington fan.
6.3.3 Frequency Spectrum Analysis of P2
To further understand the effects of the modifications to P2 a frequency spectrum analysis of the noise output was carried out.
When N = 2100 rpm and x = 140 mm the overall SWL of P2 was 1.5 dB higher than the original fan at 66.9 dBA. Upon inspection of a narrowband comparison the increase in overall SWL can be attributed to a general increase in broadband noise at all frequencies (Figure 6.16). This suggests that winglets located at the blade tip do not effectively interrupt the tip clearance vortices.
P2 had a lower peak at the second multiple of the BPF, but it was not great enough to offset the increases in SWL observed at almost all other frequencies. A particularly large increase in SWL was exhibited at high frequencies (above 4000 Hz). A similar trend was observed in the case of P1. As P2’s winglets were located closer to the blade tip than P1’s winglets they would travel at a greater tangential velocity. This would result in an increased Reynolds’ number which indicates a greater likelihood of turbulence effects. It is possible that the increase in high frequency noise was due to turbulence associated with flow around the winglets.
A one-third octave band comparison for x = 140 mm reveals that P2 had a higher SWL in all of the frequency bands apart from the 250 and 315 Hz bands, which are straddled by the tone at twice the BPF (Figure 6.17). Both bands are affected by this tone as the border frequency is 282 Hz.
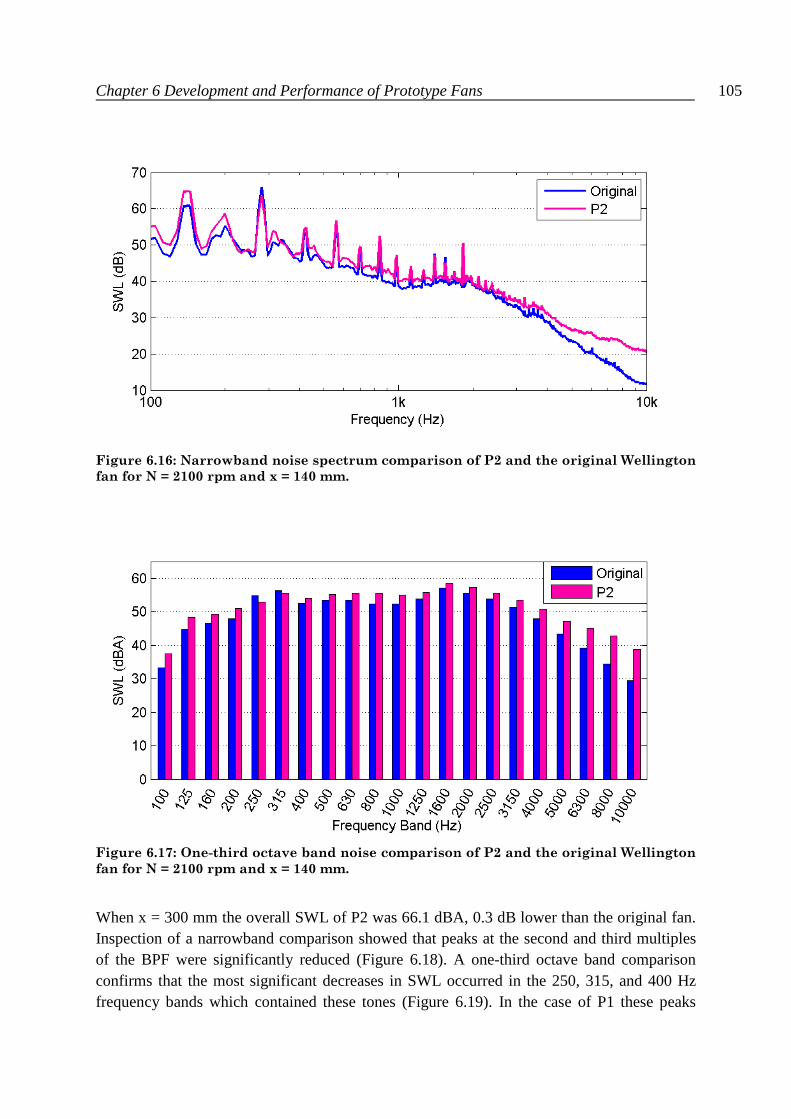
Chapter 6 Development and Performance of Prototype Fans 105
Figure 6.16: Narrowband noise spectrum comparison of P2 and the original Wellington
fan for N = 2100 rpm and x = 140 mm.
Figure 6.17: One-third octave band noise comparison of P2 and the original Wellington
fan for N = 2100 rpm and x = 140 mm.
When x = 300 mm the overall SWL of P2 was 66.1 dBA, 0.3 dB lower than the original fan. Inspection of a narrowband comparison showed that peaks at the second and third multiples of the BPF were significantly reduced (Figure 6.18). A one-third octave band comparison confirms that the most significant decreases in SWL occurred in the 250, 315, and 400 Hz frequency bands which contained these tones (Figure 6.19). In the case of P1 these peaks

Chapter 6 Development and Performance of Prototype Fans 106
were higher than those of the original fan. This suggests that flow conditions could affect the way in which the fan and motor supports struts interact and subsequently influence the magnitude of BPF tones.
Figure 6.18: Narrowband noise spectrum comparison of P2 and the original Wellington
fan for N = 2100 rpm and x = 300 mm.
Figure 6.19: One-third octave band noise comparison of P2 and the original Wellington
fan for N = 2100 rpm and x = 300 mm.
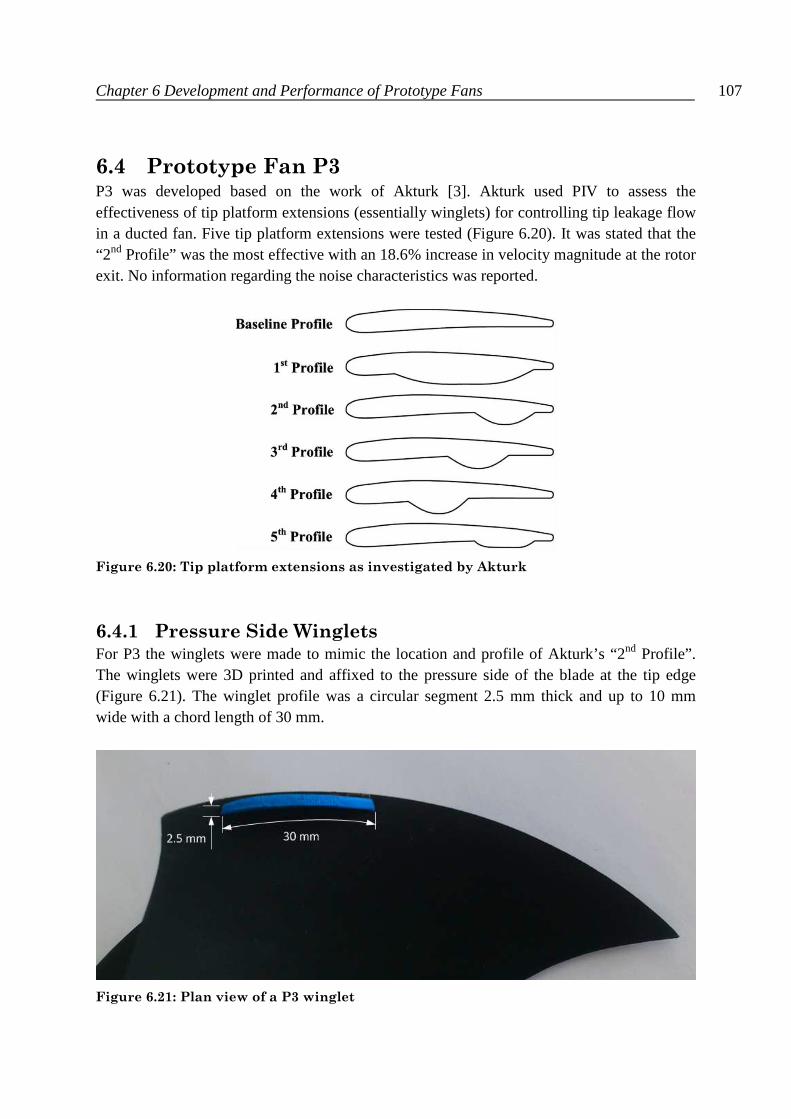
Chapter 6 Development and Performance of Prototype Fans 107
6.4 Prototype Fan P3 P3 was developed based on the work of Akturk [3]. Akturk used PIV to assess the effectiveness of tip platform extensions (essentially winglets) for controlling tip leakage flow in a ducted fan. Five tip platform extensions were tested (Figure 6.20). It was stated that the “2nd Profile” was the most effective with an 18.6% increase in velocity magnitude at the rotor exit. No information regarding the noise characteristics was reported.
Figure 6.20: Tip platform extensions as investigated by Akturk
6.4.1 Pressure Side Winglets For P3 the winglets were made to mimic the location and profile of Akturk’s “2nd Profile”. The winglets were 3D printed and affixed to the pressure side of the blade at the tip edge (Figure 6.21). The winglet profile was a circular segment 2.5 mm thick and up to 10 mm wide with a chord length of 30 mm.
Figure 6.21: Plan view of a P3 winglet
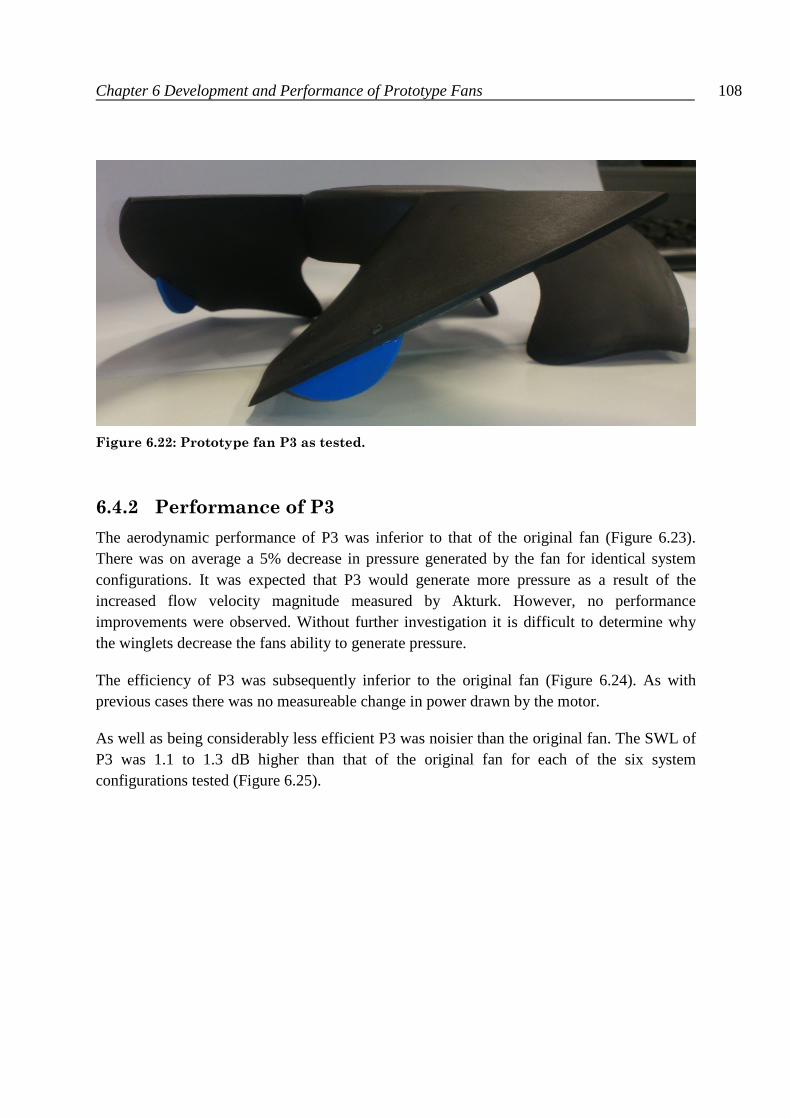
Chapter 6 Development and Performance of Prototype Fans 108
Figure 6.22: Prototype fan P3 as tested.
6.4.2 Performance of P3
The aerodynamic performance of P3 was inferior to that of the original fan (Figure 6.23). There was on average a 5% decrease in pressure generated by the fan for identical system configurations. It was expected that P3 would generate more pressure as a result of the increased flow velocity magnitude measured by Akturk. However, no performance improvements were observed. Without further investigation it is difficult to determine why the winglets decrease the fans ability to generate pressure.
The efficiency of P3 was subsequently inferior to the original fan (Figure 6.24). As with previous cases there was no measureable change in power drawn by the motor.
As well as being considerably less efficient P3 was noisier than the original fan. The SWL of P3 was 1.1 to 1.3 dB higher than that of the original fan for each of the six system configurations tested (Figure 6.25).
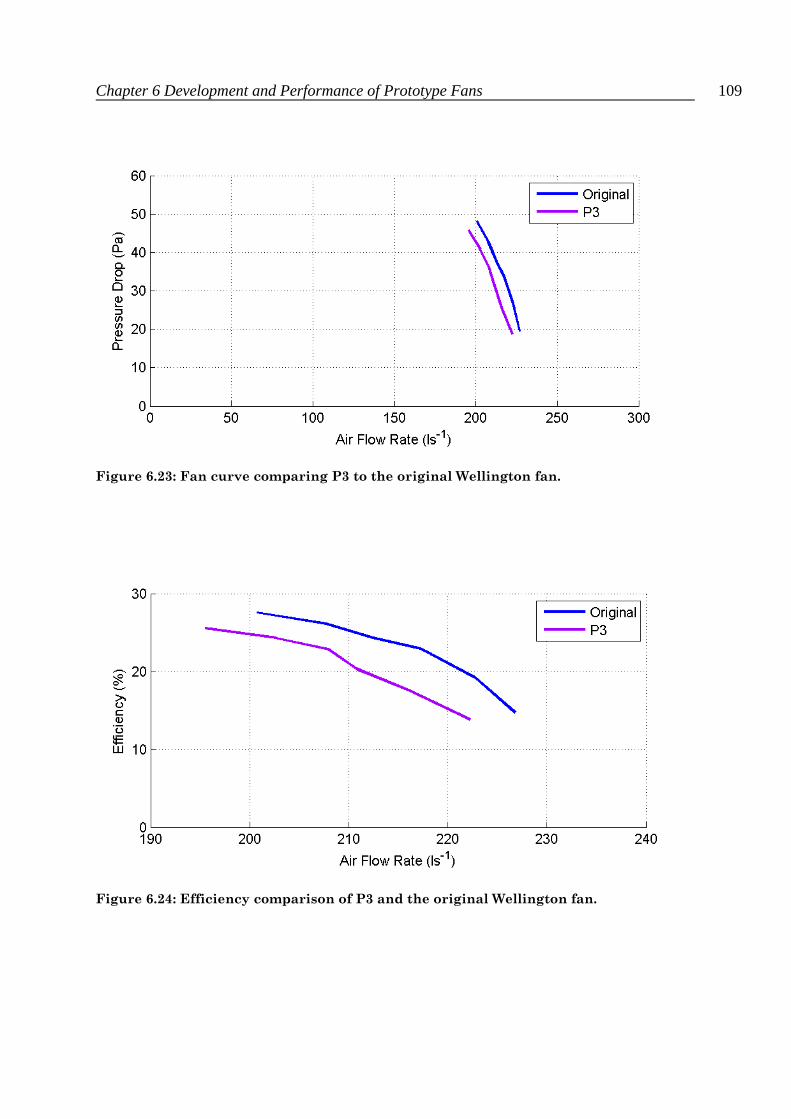
Chapter 6 Development and Performance of Prototype Fans 109
Figure 6.23: Fan curve comparing P3 to the original Wellington fan.
Figure 6.24: Efficiency comparison of P3 and the original Wellington fan.
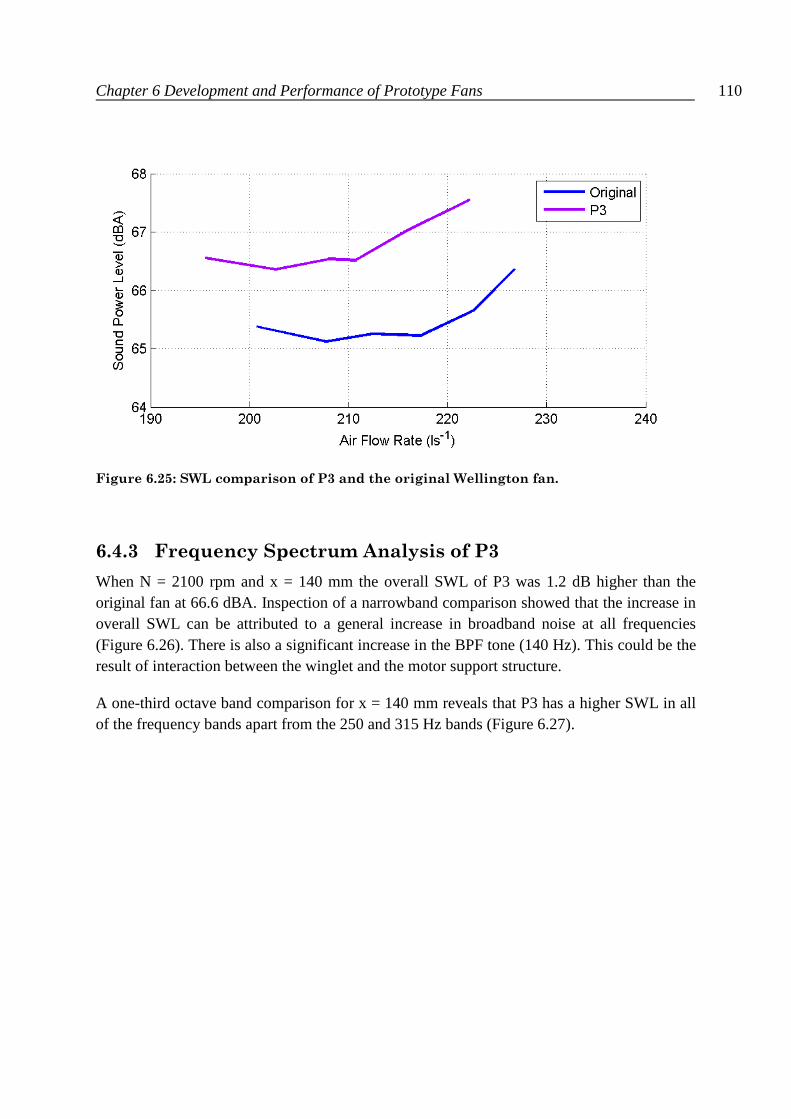
Chapter 6 Development and Performance of Prototype Fans 110
Figure 6.25: SWL comparison of P3 and the original Wellington fan.
6.4.3 Frequency Spectrum Analysis of P3
When N = 2100 rpm and x = 140 mm the overall SWL of P3 was 1.2 dB higher than the original fan at 66.6 dBA. Inspection of a narrowband comparison showed that the increase in overall SWL can be attributed to a general increase in broadband noise at all frequencies (Figure 6.26). There is also a significant increase in the BPF tone (140 Hz). This could be the result of interaction between the winglet and the motor support structure.
A one-third octave band comparison for x = 140 mm reveals that P3 has a higher SWL in all of the frequency bands apart from the 250 and 315 Hz bands (Figure 6.27).

Chapter 6 Development and Performance of Prototype Fans 111
Figure 6.26: Narrowband noise spectrum comparison of P3 and the original Wellington
fan for N = 2100 rpm and x = 140 mm.
Figure 6.27: One-third octave band noise comparison of P3 and the original Wellington
fan for N = 2100 rpm and x = 140 mm.
When x = 300 mm the overall SWL of P3 was 67.5 dBA, 1.1 dB higher than the original fan. Inspection of a narrowband comparison shows a general increase in broadband noise is responsible for the increased SWL (Figure 6.28). However, there is one anomaly of particular interest. The tonal peak near 420 Hz has been reduced by almost 5 dB. This tone coincides
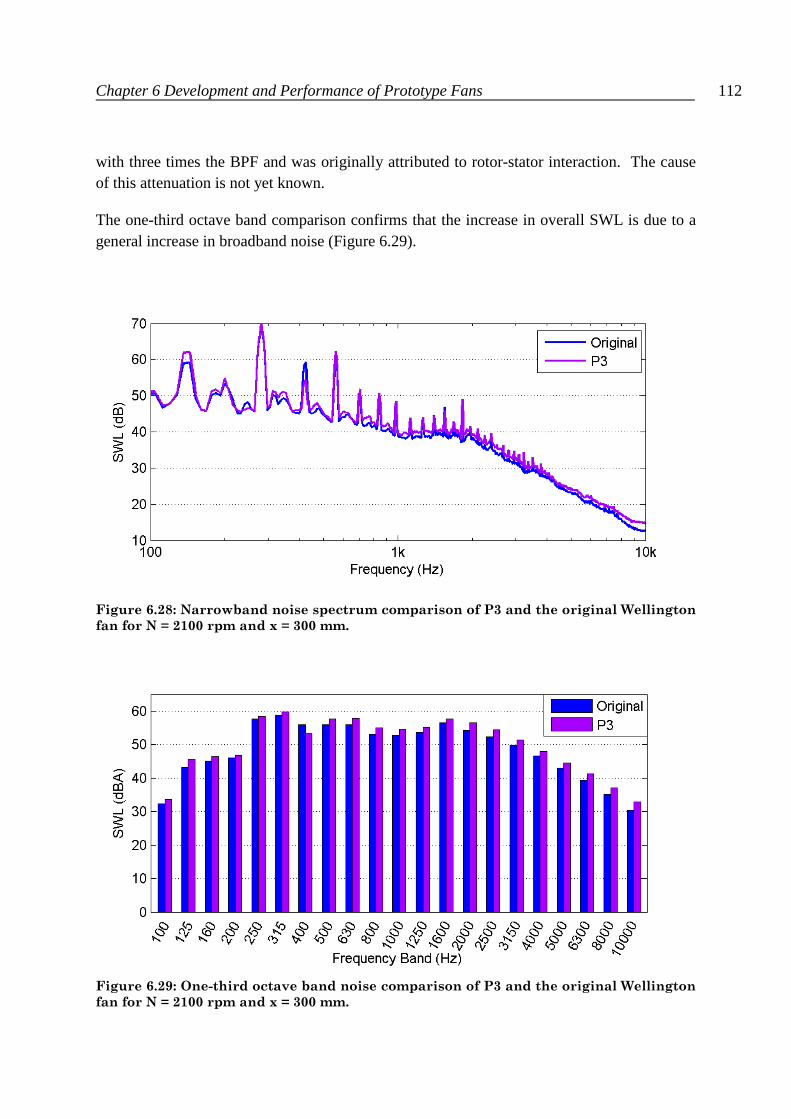
Chapter 6 Development and Performance of Prototype Fans 112
with three times the BPF and was originally attributed to rotor-stator interaction. The cause of this attenuation is not yet known.
The one-third octave band comparison confirms that the increase in overall SWL is due to a general increase in broadband noise (Figure 6.29).
Figure 6.28: Narrowband noise spectrum comparison of P3 and the original Wellington
fan for N = 2100 rpm and x = 300 mm.
Figure 6.29: One-third octave band noise comparison of P3 and the original Wellington
fan for N = 2100 rpm and x = 300 mm.
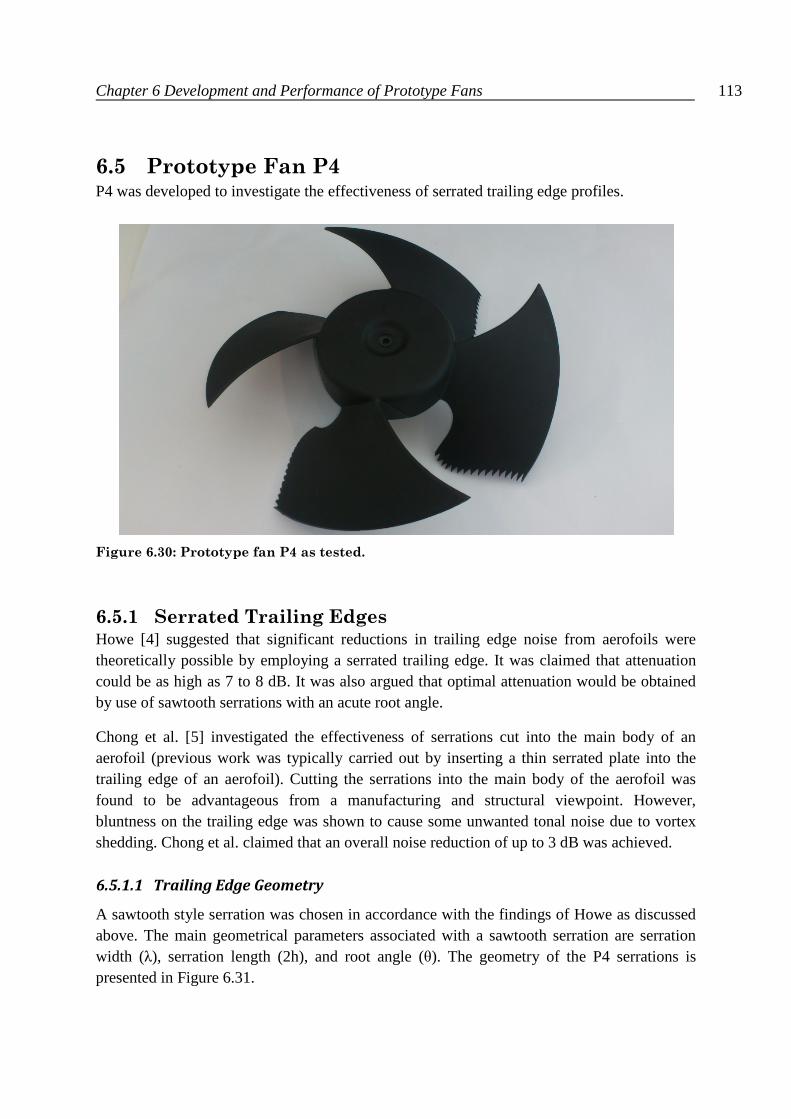
Chapter 6 Development and Performance of Prototype Fans 113
6.5 Prototype Fan P4 P4 was developed to investigate the effectiveness of serrated trailing edge profiles.
Figure 6.30: Prototype fan P4 as tested.
6.5.1 Serrated Trailing Edges Howe [4] suggested that significant reductions in trailing edge noise from aerofoils were theoretically possible by employing a serrated trailing edge. It was claimed that attenuation could be as high as 7 to 8 dB. It was also argued that optimal attenuation would be obtained by use of sawtooth serrations with an acute root angle.
Chong et al. [5] investigated the effectiveness of serrations cut into the main body of an aerofoil (previous work was typically carried out by inserting a thin serrated plate into the trailing edge of an aerofoil). Cutting the serrations into the main body of the aerofoil was found to be advantageous from a manufacturing and structural viewpoint. However, bluntness on the trailing edge was shown to cause some unwanted tonal noise due to vortex shedding. Chong et al. claimed that an overall noise reduction of up to 3 dB was achieved.
6.5.1.1 Trailing Edge Geometry
A sawtooth style serration was chosen in accordance with the findings of Howe as discussed above. The main geometrical parameters associated with a sawtooth serration are serration width (λ), serration length (2h), and root angle (θ). The geometry of the P4 serrations is presented in Figure 6.31.
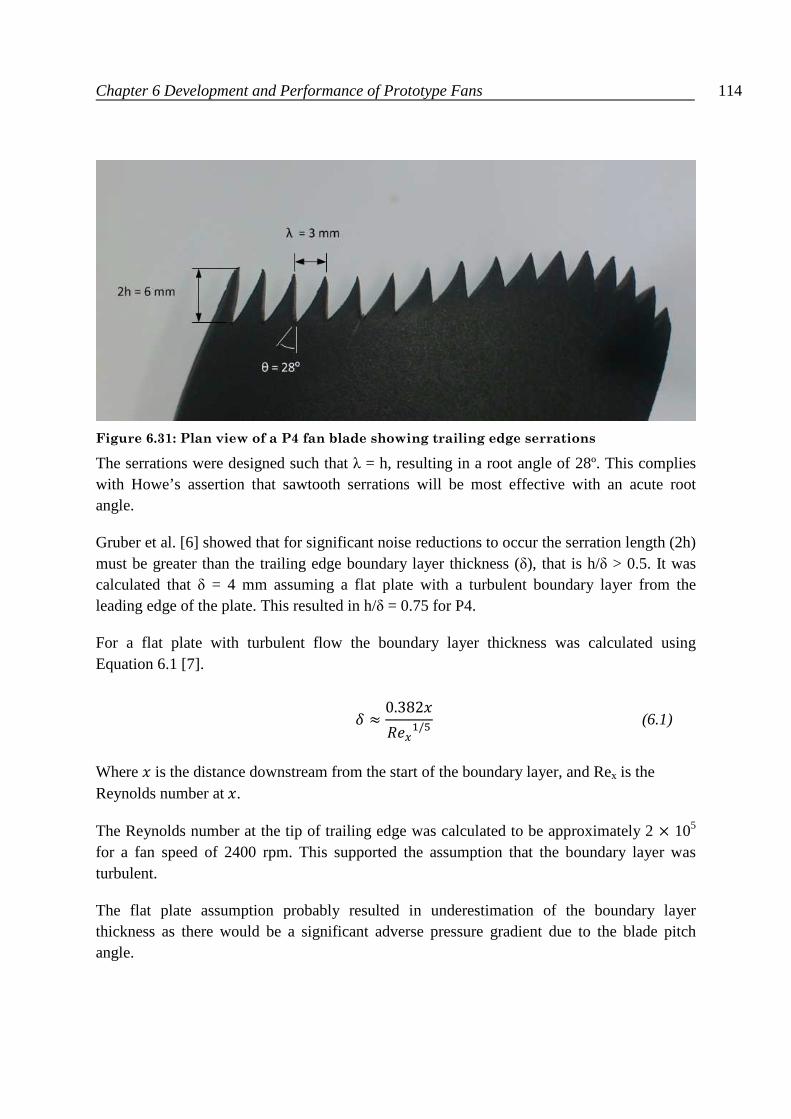
Chapter 6 Development and Performance of Prototype Fans 114
Figure 6.31: Plan view of a P4 fan blade showing trailing edge serrations
The serrations were designed such that λ = h, resulting in a root angle of 28º. This complies with Howe’s assertion that sawtooth serrations will be most effective with an acute root angle.
Gruber et al. [6] showed that for significant noise reductions to occur the serration length (2h) must be greater than the trailing edge boundary layer thickness (δ), that is h/δ > 0.5. It was calculated that δ = 4 mm assuming a flat plate with a turbulent boundary layer from the leading edge of the plate. This resulted in h/δ = 0.75 for P4.
For a flat plate with turbulent flow the boundary layer thickness was calculated using Equation 6.1 [7].
� ≈0.382�
��/� (6.1)
Where � is the distance downstream from the start of the boundary layer, and Rex is the Reynolds number at�.
The Reynolds number at the tip of trailing edge was calculated to be approximately 2 × 10⁵ for a fan speed of 2400 rpm. This supported the assumption that the boundary layer was turbulent.
The flat plate assumption probably resulted in underestimation of the boundary layer thickness as there would be a significant adverse pressure gradient due to the blade pitch angle.
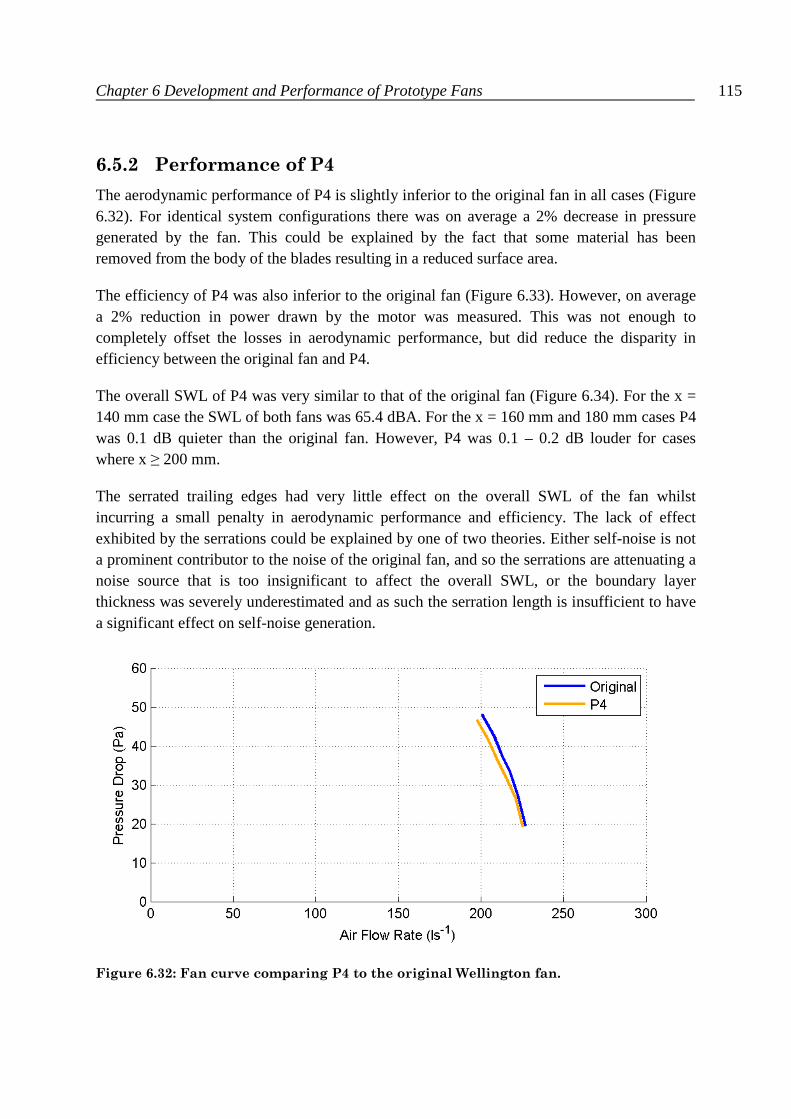
Chapter 6 Development and Performance of Prototype Fans 115
6.5.2 Performance of P4
The aerodynamic performance of P4 is slightly inferior to the original fan in all cases (Figure 6.32). For identical system configurations there was on average a 2% decrease in pressure generated by the fan. This could be explained by the fact that some material has been removed from the body of the blades resulting in a reduced surface area.
The efficiency of P4 was also inferior to the original fan (Figure 6.33). However, on average a 2% reduction in power drawn by the motor was measured. This was not enough to completely offset the losses in aerodynamic performance, but did reduce the disparity in efficiency between the original fan and P4.
The overall SWL of P4 was very similar to that of the original fan (Figure 6.34). For the x = 140 mm case the SWL of both fans was 65.4 dBA. For the x = 160 mm and 180 mm cases P4 was 0.1 dB quieter than the original fan. However, P4 was 0.1 – 0.2 dB louder for cases where x ≥ 200 mm.
The serrated trailing edges had very little effect on the overall SWL of the fan whilst incurring a small penalty in aerodynamic performance and efficiency. The lack of effect exhibited by the serrations could be explained by one of two theories. Either self-noise is not a prominent contributor to the noise of the original fan, and so the serrations are attenuating a noise source that is too insignificant to affect the overall SWL, or the boundary layer thickness was severely underestimated and as such the serration length is insufficient to have a significant effect on self-noise generation.
Figure 6.32: Fan curve comparing P4 to the original Wellington fan.
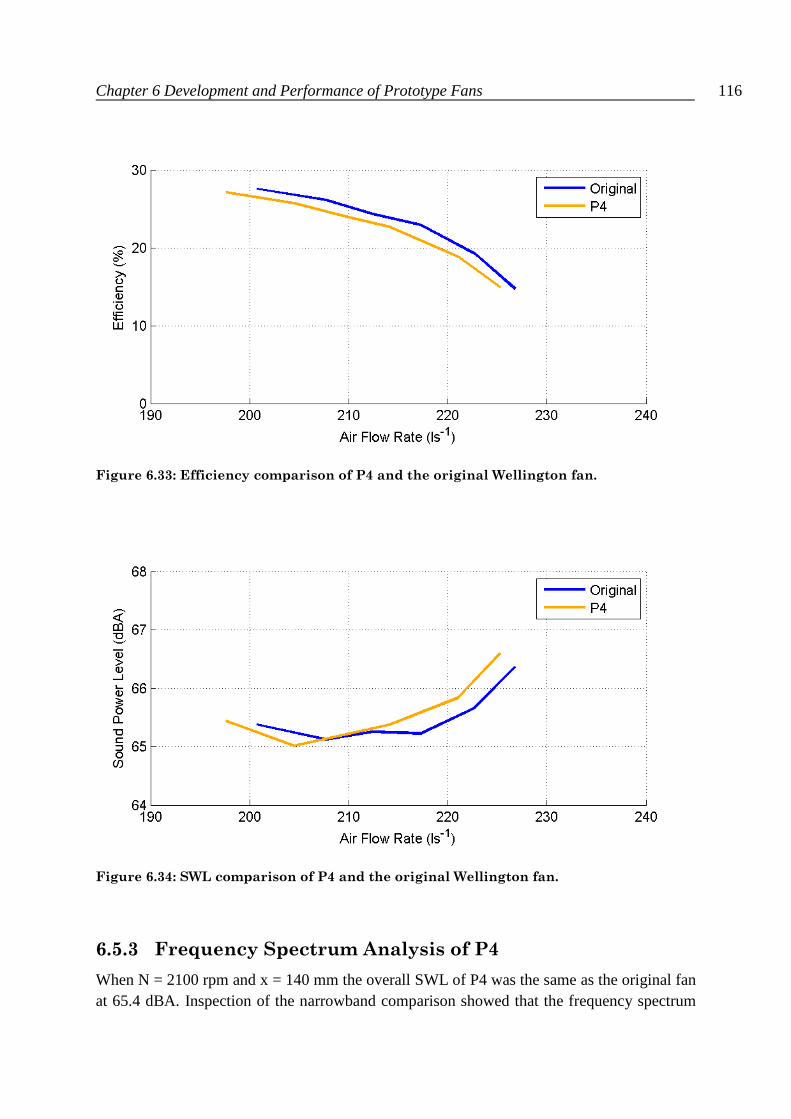
Chapter 6 Development and Performance of Prototype Fans 116
Figure 6.33: Efficiency comparison of P4 and the original Wellington fan.
Figure 6.34: SWL comparison of P4 and the original Wellington fan.
6.5.3 Frequency Spectrum Analysis of P4
When N = 2100 rpm and x = 140 mm the overall SWL of P4 was the same as the original fan at 65.4 dBA. Inspection of the narrowband comparison showed that the frequency spectrum
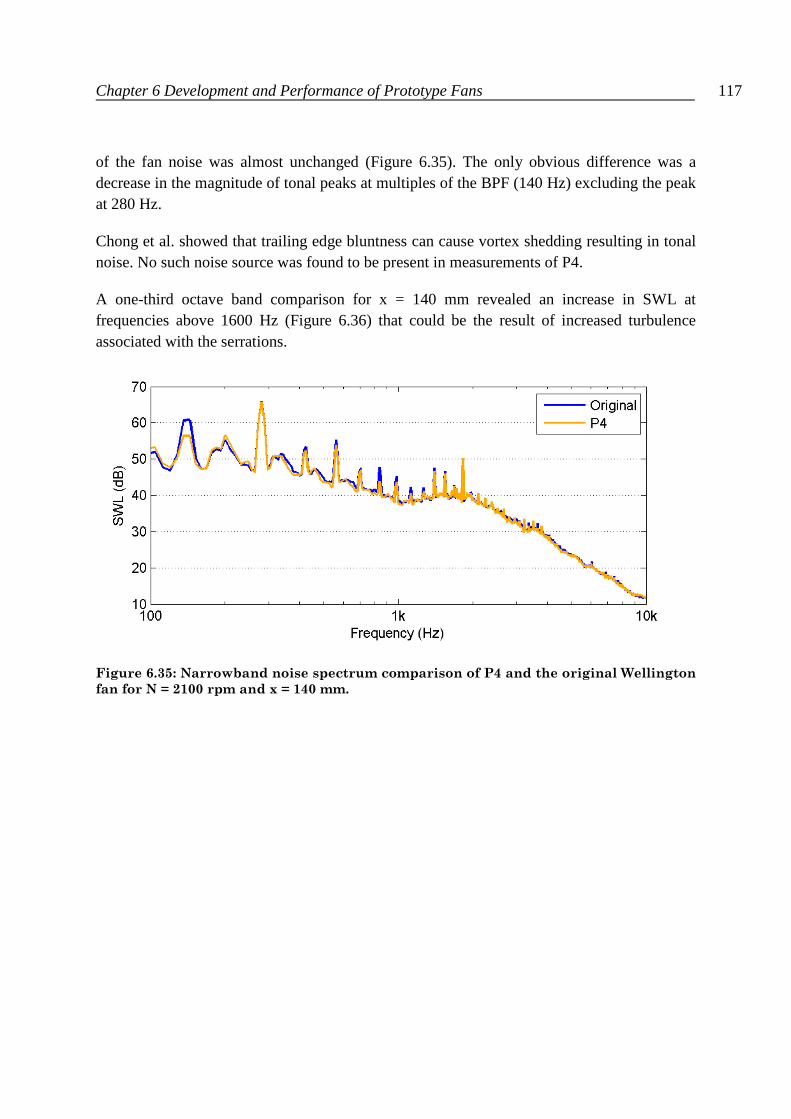
Chapter 6 Development and Performance of Prototype Fans 117
of the fan noise was almost unchanged (Figure 6.35). The only obvious difference was a decrease in the magnitude of tonal peaks at multiples of the BPF (140 Hz) excluding the peak at 280 Hz.
Chong et al. showed that trailing edge bluntness can cause vortex shedding resulting in tonal noise. No such noise source was found to be present in measurements of P4.
A one-third octave band comparison for x = 140 mm revealed an increase in SWL at frequencies above 1600 Hz (Figure 6.36) that could be the result of increased turbulence associated with the serrations.
Figure 6.35: Narrowband noise spectrum comparison of P4 and the original Wellington
fan for N = 2100 rpm and x = 140 mm.
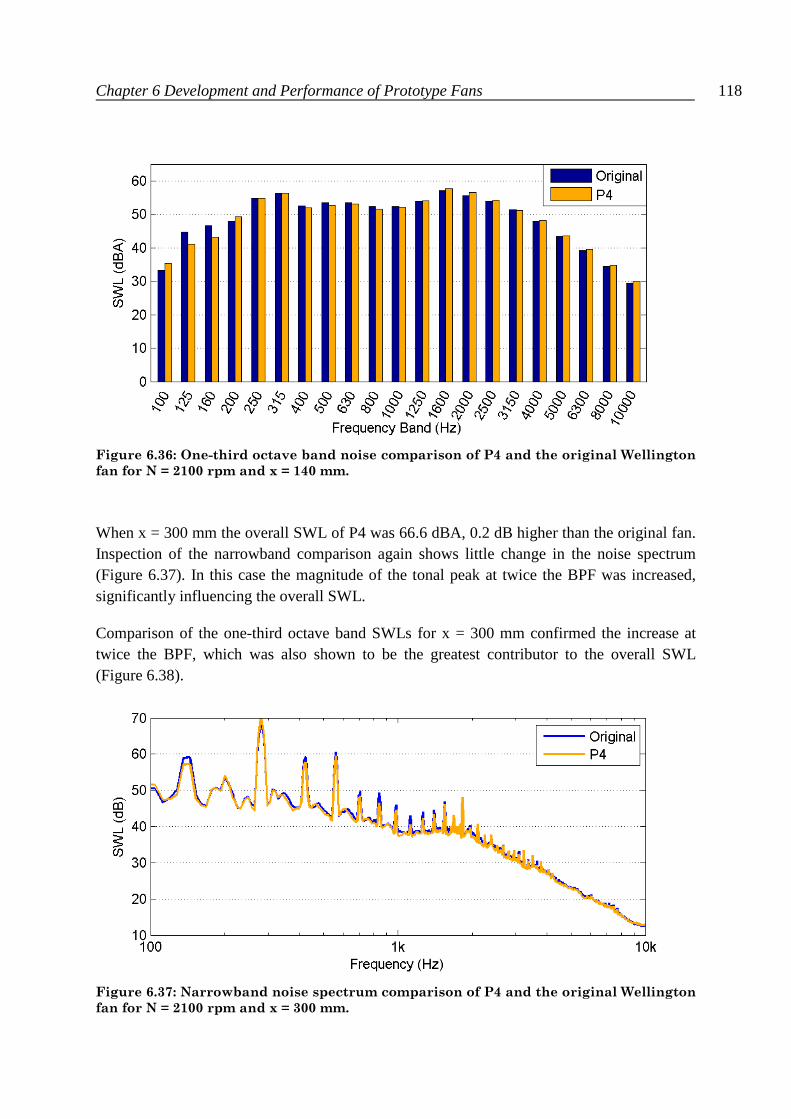
Chapter 6 Development and Performance of Prototype Fans 118
Figure 6.36: One-third octave band noise comparison of P4 and the original Wellington
fan for N = 2100 rpm and x = 140 mm.
When x = 300 mm the overall SWL of P4 was 66.6 dBA, 0.2 dB higher than the original fan. Inspection of the narrowband comparison again shows little change in the noise spectrum (Figure 6.37). In this case the magnitude of the tonal peak at twice the BPF was increased, significantly influencing the overall SWL.
Comparison of the one-third octave band SWLs for x = 300 mm confirmed the increase at twice the BPF, which was also shown to be the greatest contributor to the overall SWL (Figure 6.38).
Figure 6.37: Narrowband noise spectrum comparison of P4 and the original Wellington
fan for N = 2100 rpm and x = 300 mm.
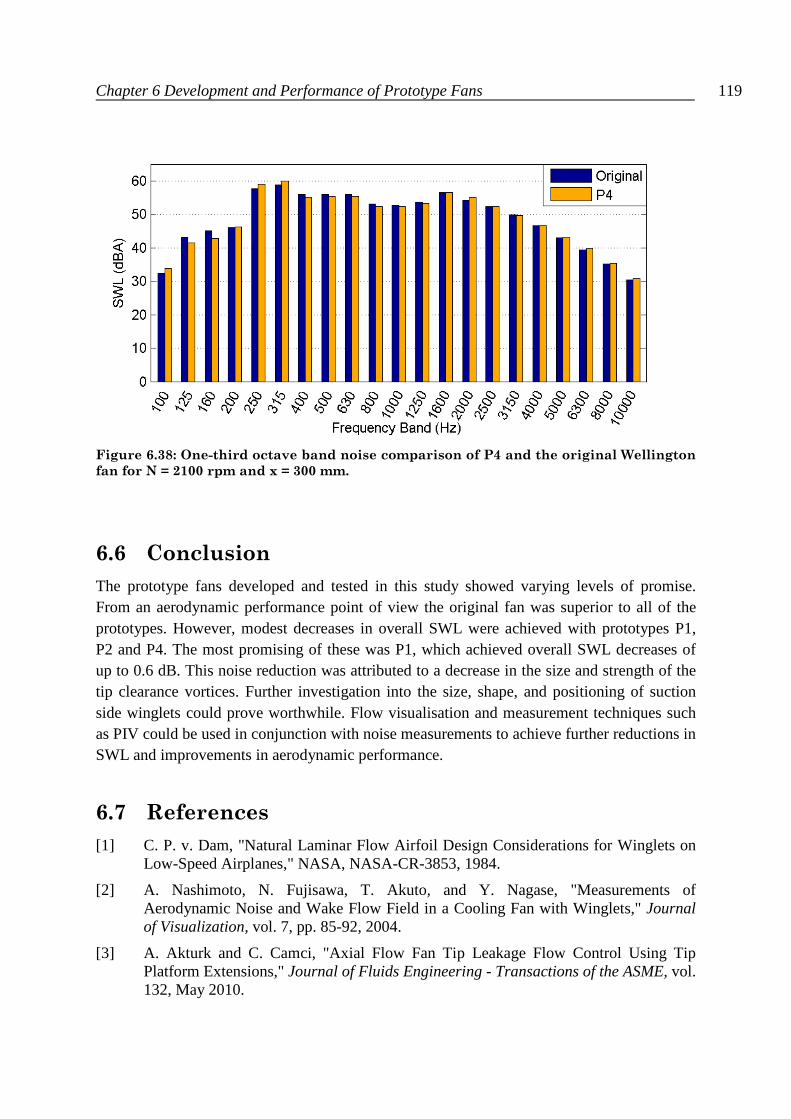
Chapter 6 Development and Performance of Prototype Fans 119
Figure 6.38: One-third octave band noise comparison of P4 and the original Wellington
fan for N = 2100 rpm and x = 300 mm.
6.6 Conclusion
The prototype fans developed and tested in this study showed varying levels of promise. From an aerodynamic performance point of view the original fan was superior to all of the prototypes. However, modest decreases in overall SWL were achieved with prototypes P1, P2 and P4. The most promising of these was P1, which achieved overall SWL decreases of up to 0.6 dB. This noise reduction was attributed to a decrease in the size and strength of the tip clearance vortices. Further investigation into the size, shape, and positioning of suction side winglets could prove worthwhile. Flow visualisation and measurement techniques such as PIV could be used in conjunction with noise measurements to achieve further reductions in SWL and improvements in aerodynamic performance.
6.7 References
[1] C. P. v. Dam, "Natural Laminar Flow Airfoil Design Considerations for Winglets on Low-Speed Airplanes," NASA, NASA-CR-3853, 1984.
[2] A. Nashimoto, N. Fujisawa, T. Akuto, and Y. Nagase, "Measurements of Aerodynamic Noise and Wake Flow Field in a Cooling Fan with Winglets," Journal of Visualization, vol. 7, pp. 85-92, 2004.
[3] A. Akturk and C. Camci, "Axial Flow Fan Tip Leakage Flow Control Using Tip Platform Extensions," Journal of Fluids Engineering - Transactions of the ASME, vol. 132, May 2010.
Chapter 6 Development and Performance of Prototype Fans 120
[4] M. S. Howe, "Aerodynamic Noise of a Serrated Trailing Edge," Journal of Fluids and
Structures, vol. 5, pp. 33-45, Jan 1991.
[5] T. P. Chong, P. F. Joseph, and M. Gruber, "Airfoil Self Noise Reduction by non-Flat Plate Type Trailing Edge Serrations," Applied Acoustics, vol. 74, pp. 607-613, Apr 2013.
[6] M. Gruber, P. F. Joseph, and T. P. Chong, "On the Mechanism of Serrated Airfoil Trailing Edge Noise Reduction.," presented at the 17th AIAA/CEAS aeroacoustic conference and exhibit, Portland, Oregon, 2011.
[7] M. C. Potter, D. C. Wiggert, and M. Hondzo, Mechanics of fluids, 3rd ed. Pacific Grove, CA: Brooks Cole /Thompson Learning, 2002.

121
Chapter 7
Conclusions and Future Work
Chapter 7 Conclusions and Future Work 122
7.1 Conclusions
The field of fan noise has been extensively studied in both industry and academia. Despite this, some areas of fan noise, particularly surrounding broadband noise generation, are not well understood.
ISO 10302-1 was found to provide an effective and practical method for measuring the acoustic and aerodynamic performance of small fan systems. However, the plenum chamber has limitations regarding the precision of aerodynamic performance measurements. A more precise system, such as a flow bench, would be required to evaluate subtle performance changes in an optimisation study.
The noise output of a series of Air-Drive fans was found to vary greatly with fan speed and load. The fan noise increases exponentially with fan speed. However, the relationship between fan noise and load was found to be more complex. For a fan at a given speed there exists an optimal system impedance where the overall sound power level (SWL) is lowest. In a high impedance system, where the fan is heavily loaded, stall may occur resulting in an increased noise output. In a low impedance system there is significantly more air flow, resulting in increased broadband noise. The optimal operating point is a compromise where the flow rate is reduced, but stall onset has not occurred. Different blade pitch angles were shown to suit different system impedances.
The fan efficiency was also shown to vary with fan speed and load. As with noise output, each fan has an optimal system impedance for efficiency. This was consistently found to be similar to, but not the same as, the optimal impedance for reducing noise output.
Rotating stall was found to be a prominent sound source for Air-Drive fans in high impedance systems. This was demonstrated by significant broadband noise paired with tones at a fraction of the blade passing frequency. The rotational speed of rotating stall cells was found to vary with system impedance. In cases of more severe stall (higher system impedance) the rotational speed of the stall cells decreased. This was in agreement with relevant literature.
The Wellington fanpack has significant tonal noise issues, particularly at lower operating speeds (below 1800 rpm). It is possible that this noise results from an interaction between operating frequencies common to both the motor and the fan. This arises from the fanpack design, where the number of motor poles (8) and number of fan blades (4) are integer multiples of one another. Changing the fan to a five bladed design would alleviate this problem.
The addition of winglets was found to have a subtle effect on the noise output of the fanpack. The positioning of the winglet was critical with winglet effects ranging from a 0.6 dB
Chapter 7 Conclusions and Future Work 123
decrease to a 1.3 dB increase in overall SWL. The best performing case was a suction side winglet located 10 mm in from the tip edge of the blade.
Adding a serrated trailing edge to the Wellington fan was found to have almost no effect on performance. However, only one serrated trailing edge design was tested and the sawtooth depth may have been too small for a significant effect to be observed.
7.2 Future Work
The characterisation data for the range of Air-Drive fans could be manipulated to provide a powerful resource for use during the design and specification of new refrigerator systems. A software package could be developed to select the quietest or most efficient fan for a given set of operating conditions. The program would need to be supplied with the system impedance characteristic and required flow rate for which it would return the blade pitch angle and fan speed of the most appropriate fan. Furthermore, manufacturers’ requirements could be built into the selection rationale. For example, it could identify the fan which would provide the highest possible flow rate with an overall SWL less than 63 dBA. Unfortunately, system impedance characteristics of refrigerator systems are not easily measured and subsequently manufacturers often do not know the exact requirements of their systems. This makes precise specification of fans difficult.
The cause of the tonal noise from the Wellington fanpack is not yet fully understood. Further investigation into this area could provide significant insight. Alternate versions of the Wellington motor should be tested in the fanpack to evaluate the influence of the motor on the measured tonal noise. A prototype five bladed fan could also be tested to evaluate the strength of interaction between fan tones and motor tones. Findings of this testing should provide strong practical guidelines for refinement of the fanpack.
The shape of the Wellington motor introduces an unnecessary case of rotor-stator interaction and leaves a significant gap for flow recirculation. A modified motor housing could be usefully developed for manufacture. Also, a clip on motor housing cover could be fitted to existing installations to improve both acoustic and aerodynamic performance.
A parameter study on the position, size and shape of winglets could be carried out to further refine the fanpack design. This investigation should be of lower priority than the investigation of tones and the motor housing shape. A serrated trailing edge with deeper sawtooth serrations could also be investigated.

124

Appendix A
Plenum Chamber Drawing

Appendix A Plenum Chamber Drawing 126
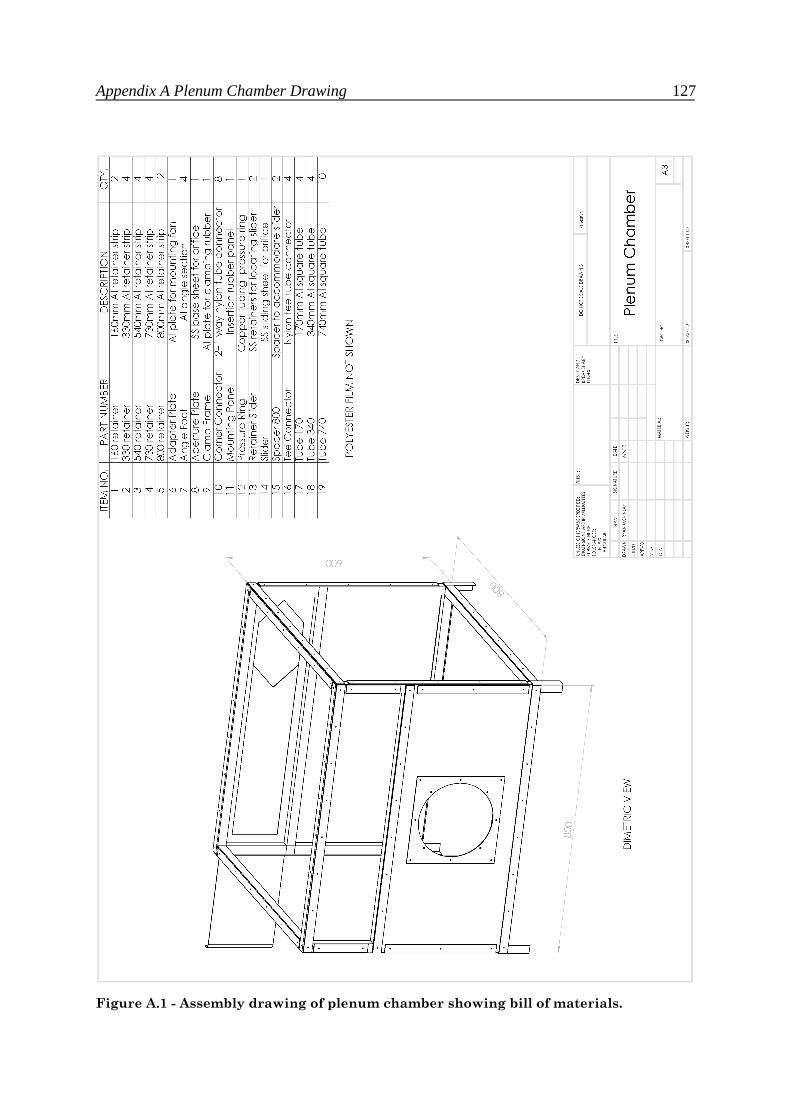
Appendix A Plenum Chamber Drawing 127
Figure A.1 - Assembly drawing of plenum chamber showing bill of materials.

Appendix A Plenum Chamber Drawing 128

Appendix B
Fan Performance Data

Appendix B Fan Performance Data 130
Table of Contents
B.1 Air-Drive Fans ............................................................................................................ 131
B.1.1 20 Degree ............................................................................................................. 131
B.1.2 23 Degree ............................................................................................................. 132
B.1.3 26 Degree ............................................................................................................. 133
B.1.4 30 Degree ............................................................................................................. 135
B.1.5 37 Degree ............................................................................................................. 136
B.2 Wellington Drive Fanpack .......................................................................................... 137
B.2.1 Fanpack with 25 W motor ................................................................................... 137
B.3 Prototype Fans ............................................................................................................ 138
B.3.1 Prototype Fan P1 ................................................................................................. 138
B.3.2 Prototype Fan P2 ................................................................................................. 139
B.3.3 Prototype Fan P3 ................................................................................................. 139
B.3.4 Prototype Fan P4 ................................................................................................. 139
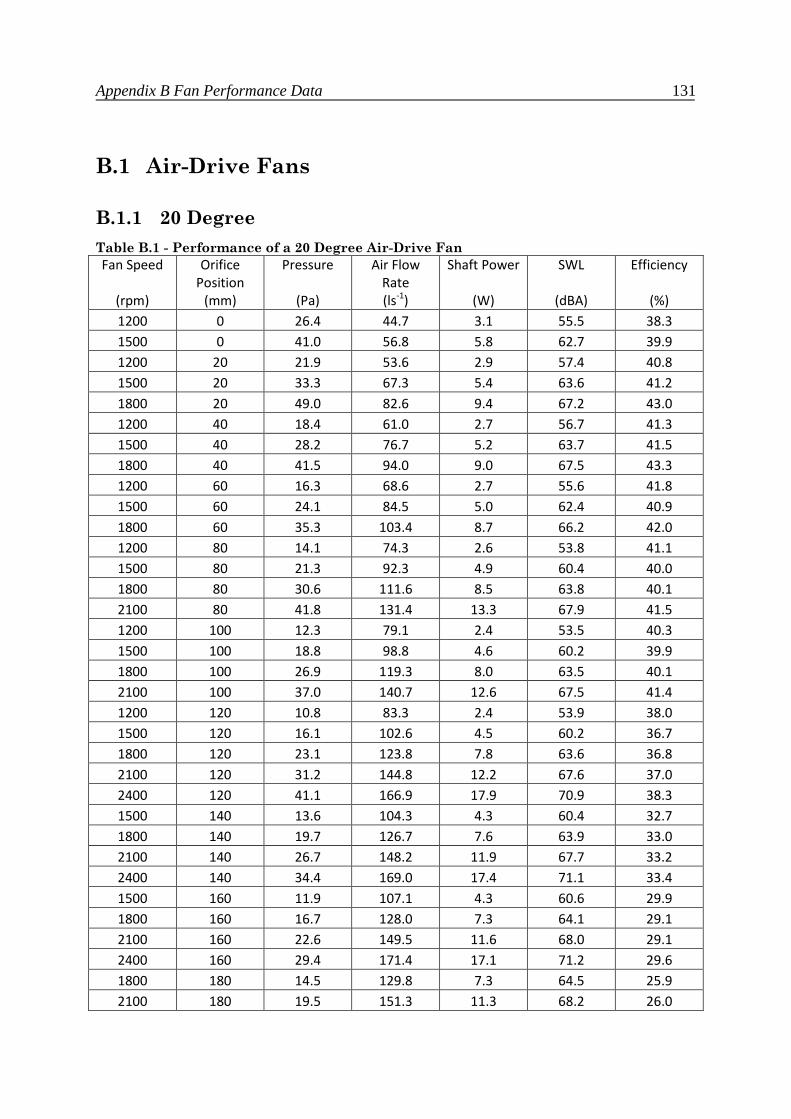
Appendix B Fan Performance Data 131
B.1 Air-Drive Fans
B.1.1 20 Degree
Table B.1 - Performance of a 20 Degree Air-Drive Fan
Fan Speed
(rpm)
Orifice
Position
(mm)
Pressure
(Pa)
Air Flow
Rate
(ls-1
)
Shaft Power
(W)
SWL
(dBA)
Efficiency
(%)
1200 0 26.4 44.7 3.1 55.5 38.3
1500 0 41.0 56.8 5.8 62.7 39.9
1200 20 21.9 53.6 2.9 57.4 40.8
1500 20 33.3 67.3 5.4 63.6 41.2
1800 20 49.0 82.6 9.4 67.2 43.0
1200 40 18.4 61.0 2.7 56.7 41.3
1500 40 28.2 76.7 5.2 63.7 41.5
1800 40 41.5 94.0 9.0 67.5 43.3
1200 60 16.3 68.6 2.7 55.6 41.8
1500 60 24.1 84.5 5.0 62.4 40.9
1800 60 35.3 103.4 8.7 66.2 42.0
1200 80 14.1 74.3 2.6 53.8 41.1
1500 80 21.3 92.3 4.9 60.4 40.0
1800 80 30.6 111.6 8.5 63.8 40.1
2100 80 41.8 131.4 13.3 67.9 41.5
1200 100 12.3 79.1 2.4 53.5 40.3
1500 100 18.8 98.8 4.6 60.2 39.9
1800 100 26.9 119.3 8.0 63.5 40.1
2100 100 37.0 140.7 12.6 67.5 41.4
1200 120 10.8 83.3 2.4 53.9 38.0
1500 120 16.1 102.6 4.5 60.2 36.7
1800 120 23.1 123.8 7.8 63.6 36.8
2100 120 31.2 144.8 12.2 67.6 37.0
2400 120 41.1 166.9 17.9 70.9 38.3
1500 140 13.6 104.3 4.3 60.4 32.7
1800 140 19.7 126.7 7.6 63.9 33.0
2100 140 26.7 148.2 11.9 67.7 33.2
2400 140 34.4 169.0 17.4 71.1 33.4
1500 160 11.9 107.1 4.3 60.6 29.9
1800 160 16.7 128.0 7.3 64.1 29.1
2100 160 22.6 149.5 11.6 68.0 29.1
2400 160 29.4 171.4 17.1 71.2 29.6
1800 180 14.5 129.8 7.3 64.5 25.9
2100 180 19.5 151.3 11.3 68.2 26.0
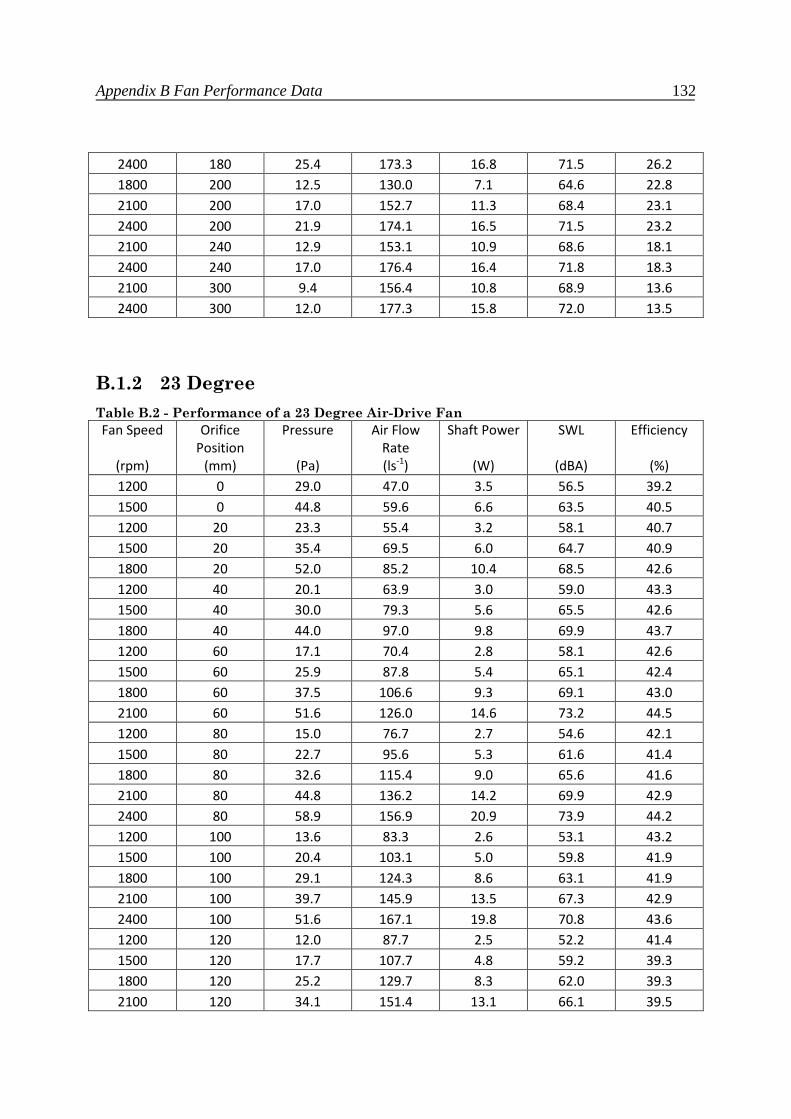
Appendix B Fan Performance Data 132
2400 180 25.4 173.3 16.8 71.5 26.2
1800 200 12.5 130.0 7.1 64.6 22.8
2100 200 17.0 152.7 11.3 68.4 23.1
2400 200 21.9 174.1 16.5 71.5 23.2
2100 240 12.9 153.1 10.9 68.6 18.1
2400 240 17.0 176.4 16.4 71.8 18.3
2100 300 9.4 156.4 10.8 68.9 13.6
2400 300 12.0 177.3 15.8 72.0 13.5
B.1.2 23 Degree
Table B.2 - Performance of a 23 Degree Air-Drive Fan
Fan Speed
(rpm)
Orifice
Position
(mm)
Pressure
(Pa)
Air Flow
Rate
(ls-1
)
Shaft Power
(W)
SWL
(dBA)
Efficiency
(%)
1200 0 29.0 47.0 3.5 56.5 39.2
1500 0 44.8 59.6 6.6 63.5 40.5
1200 20 23.3 55.4 3.2 58.1 40.7
1500 20 35.4 69.5 6.0 64.7 40.9
1800 20 52.0 85.2 10.4 68.5 42.6
1200 40 20.1 63.9 3.0 59.0 43.3
1500 40 30.0 79.3 5.6 65.5 42.6
1800 40 44.0 97.0 9.8 69.9 43.7
1200 60 17.1 70.4 2.8 58.1 42.6
1500 60 25.9 87.8 5.4 65.1 42.4
1800 60 37.5 106.6 9.3 69.1 43.0
2100 60 51.6 126.0 14.6 73.2 44.5
1200 80 15.0 76.7 2.7 54.6 42.1
1500 80 22.7 95.6 5.3 61.6 41.4
1800 80 32.6 115.4 9.0 65.6 41.6
2100 80 44.8 136.2 14.2 69.9 42.9
2400 80 58.9 156.9 20.9 73.9 44.2
1200 100 13.6 83.3 2.6 53.1 43.2
1500 100 20.4 103.1 5.0 59.8 41.9
1800 100 29.1 124.3 8.6 63.1 41.9
2100 100 39.7 145.9 13.5 67.3 42.9
2400 100 51.6 167.1 19.8 70.8 43.6
1200 120 12.0 87.7 2.5 52.2 41.4
1500 120 17.7 107.7 4.8 59.2 39.3
1800 120 25.2 129.7 8.3 62.0 39.3
2100 120 34.1 151.4 13.1 66.1 39.5
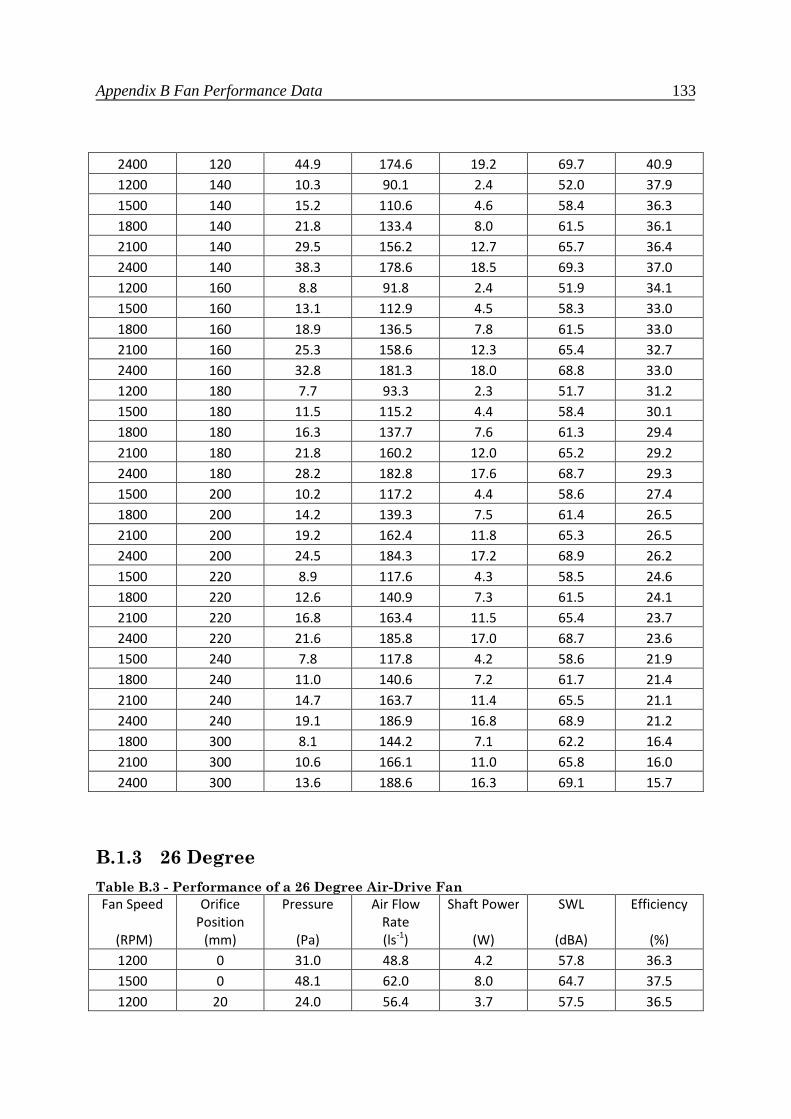
Appendix B Fan Performance Data 133
2400 120 44.9 174.6 19.2 69.7 40.9
1200 140 10.3 90.1 2.4 52.0 37.9
1500 140 15.2 110.6 4.6 58.4 36.3
1800 140 21.8 133.4 8.0 61.5 36.1
2100 140 29.5 156.2 12.7 65.7 36.4
2400 140 38.3 178.6 18.5 69.3 37.0
1200 160 8.8 91.8 2.4 51.9 34.1
1500 160 13.1 112.9 4.5 58.3 33.0
1800 160 18.9 136.5 7.8 61.5 33.0
2100 160 25.3 158.6 12.3 65.4 32.7
2400 160 32.8 181.3 18.0 68.8 33.0
1200 180 7.7 93.3 2.3 51.7 31.2
1500 180 11.5 115.2 4.4 58.4 30.1
1800 180 16.3 137.7 7.6 61.3 29.4
2100 180 21.8 160.2 12.0 65.2 29.2
2400 180 28.2 182.8 17.6 68.7 29.3
1500 200 10.2 117.2 4.4 58.6 27.4
1800 200 14.2 139.3 7.5 61.4 26.5
2100 200 19.2 162.4 11.8 65.3 26.5
2400 200 24.5 184.3 17.2 68.9 26.2
1500 220 8.9 117.6 4.3 58.5 24.6
1800 220 12.6 140.9 7.3 61.5 24.1
2100 220 16.8 163.4 11.5 65.4 23.7
2400 220 21.6 185.8 17.0 68.7 23.6
1500 240 7.8 117.8 4.2 58.6 21.9
1800 240 11.0 140.6 7.2 61.7 21.4
2100 240 14.7 163.7 11.4 65.5 21.1
2400 240 19.1 186.9 16.8 68.9 21.2
1800 300 8.1 144.2 7.1 62.2 16.4
2100 300 10.6 166.1 11.0 65.8 16.0
2400 300 13.6 188.6 16.3 69.1 15.7
B.1.3 26 Degree
Table B.3 - Performance of a 26 Degree Air-Drive Fan
Fan Speed
(RPM)
Orifice
Position
(mm)
Pressure
(Pa)
Air Flow
Rate
(ls-1
)
Shaft Power
(W)
SWL
(dBA)
Efficiency
(%)
1200 0 31.0 48.8 4.2 57.8 36.3
1500 0 48.1 62.0 8.0 64.7 37.5
1200 20 24.0 56.4 3.7 57.5 36.5
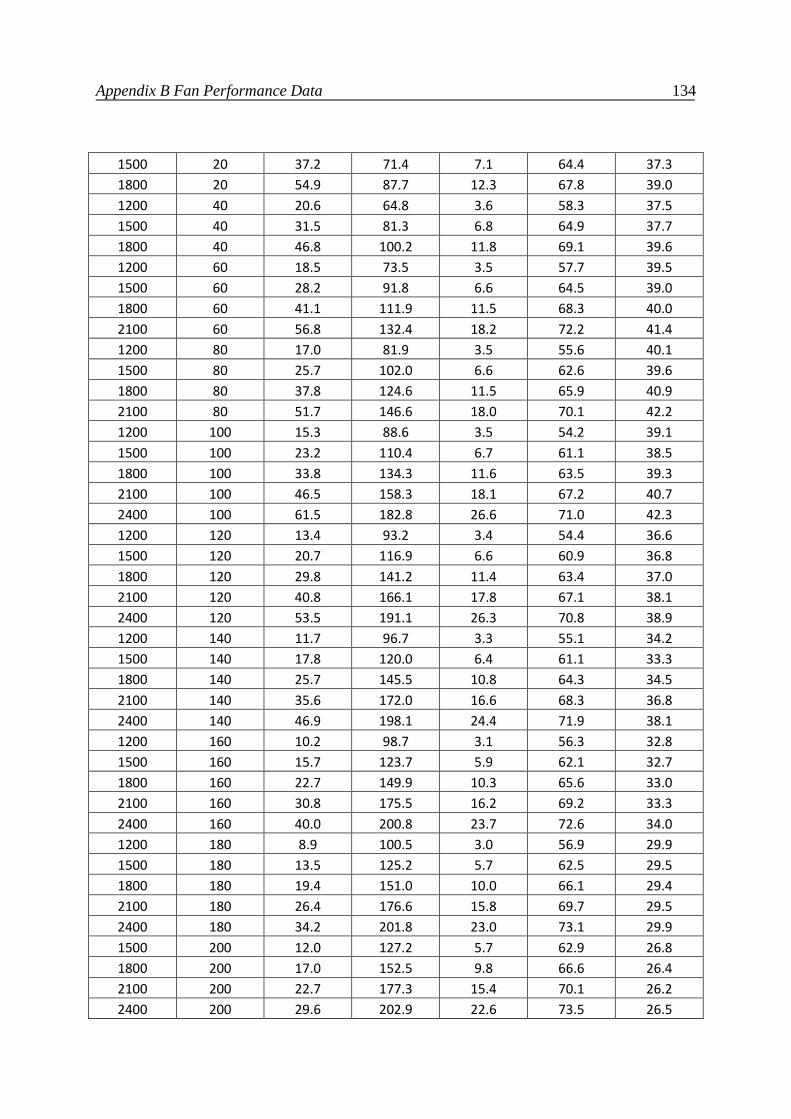
Appendix B Fan Performance Data 134
1500 20 37.2 71.4 7.1 64.4 37.3
1800 20 54.9 87.7 12.3 67.8 39.0
1200 40 20.6 64.8 3.6 58.3 37.5
1500 40 31.5 81.3 6.8 64.9 37.7
1800 40 46.8 100.2 11.8 69.1 39.6
1200 60 18.5 73.5 3.5 57.7 39.5
1500 60 28.2 91.8 6.6 64.5 39.0
1800 60 41.1 111.9 11.5 68.3 40.0
2100 60 56.8 132.4 18.2 72.2 41.4
1200 80 17.0 81.9 3.5 55.6 40.1
1500 80 25.7 102.0 6.6 62.6 39.6
1800 80 37.8 124.6 11.5 65.9 40.9
2100 80 51.7 146.6 18.0 70.1 42.2
1200 100 15.3 88.6 3.5 54.2 39.1
1500 100 23.2 110.4 6.7 61.1 38.5
1800 100 33.8 134.3 11.6 63.5 39.3
2100 100 46.5 158.3 18.1 67.2 40.7
2400 100 61.5 182.8 26.6 71.0 42.3
1200 120 13.4 93.2 3.4 54.4 36.6
1500 120 20.7 116.9 6.6 60.9 36.8
1800 120 29.8 141.2 11.4 63.4 37.0
2100 120 40.8 166.1 17.8 67.1 38.1
2400 120 53.5 191.1 26.3 70.8 38.9
1200 140 11.7 96.7 3.3 55.1 34.2
1500 140 17.8 120.0 6.4 61.1 33.3
1800 140 25.7 145.5 10.8 64.3 34.5
2100 140 35.6 172.0 16.6 68.3 36.8
2400 140 46.9 198.1 24.4 71.9 38.1
1200 160 10.2 98.7 3.1 56.3 32.8
1500 160 15.7 123.7 5.9 62.1 32.7
1800 160 22.7 149.9 10.3 65.6 33.0
2100 160 30.8 175.5 16.2 69.2 33.3
2400 160 40.0 200.8 23.7 72.6 34.0
1200 180 8.9 100.5 3.0 56.9 29.9
1500 180 13.5 125.2 5.7 62.5 29.5
1800 180 19.4 151.0 10.0 66.1 29.4
2100 180 26.4 176.6 15.8 69.7 29.5
2400 180 34.2 201.8 23.0 73.1 29.9
1500 200 12.0 127.2 5.7 62.9 26.8
1800 200 17.0 152.5 9.8 66.6 26.4
2100 200 22.7 177.3 15.4 70.1 26.2
2400 200 29.6 202.9 22.6 73.5 26.5
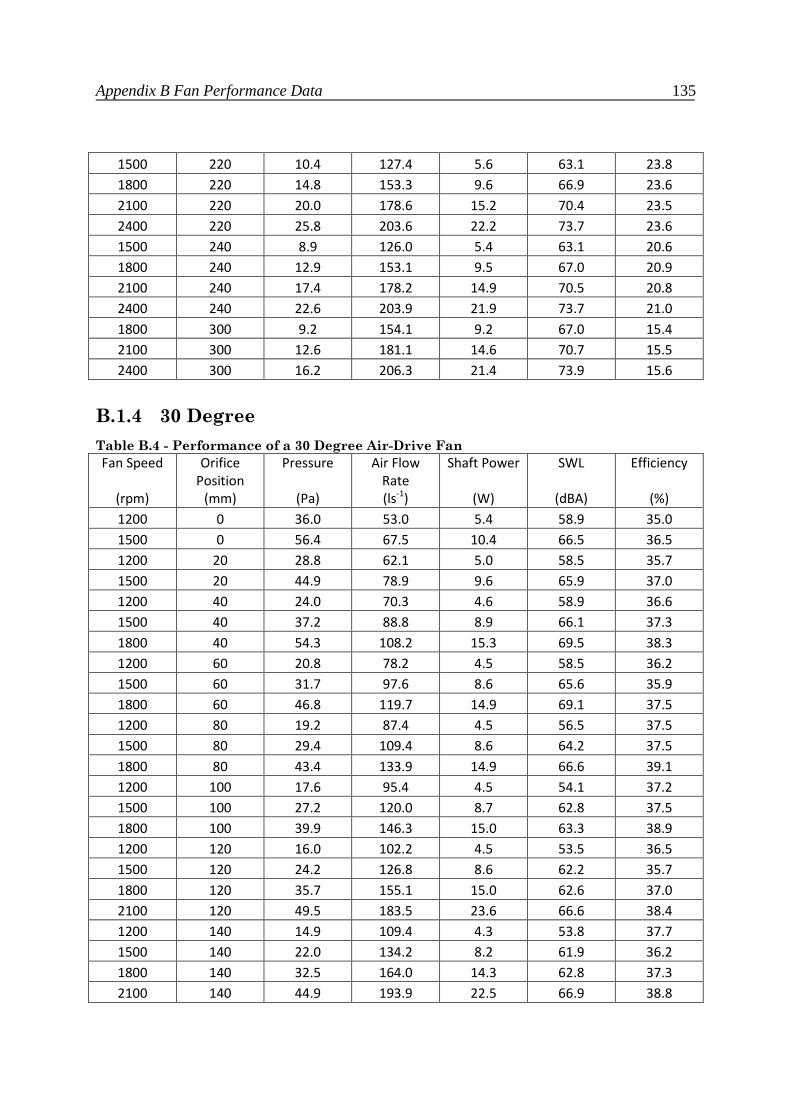
Appendix B Fan Performance Data 135
1500 220 10.4 127.4 5.6 63.1 23.8
1800 220 14.8 153.3 9.6 66.9 23.6
2100 220 20.0 178.6 15.2 70.4 23.5
2400 220 25.8 203.6 22.2 73.7 23.6
1500 240 8.9 126.0 5.4 63.1 20.6
1800 240 12.9 153.1 9.5 67.0 20.9
2100 240 17.4 178.2 14.9 70.5 20.8
2400 240 22.6 203.9 21.9 73.7 21.0
1800 300 9.2 154.1 9.2 67.0 15.4
2100 300 12.6 181.1 14.6 70.7 15.5
2400 300 16.2 206.3 21.4 73.9 15.6
B.1.4 30 Degree
Table B.4 - Performance of a 30 Degree Air-Drive Fan
Fan Speed
(rpm)
Orifice
Position
(mm)
Pressure
(Pa)
Air Flow
Rate
(ls-1
)
Shaft Power
(W)
SWL
(dBA)
Efficiency
(%)
1200 0 36.0 53.0 5.4 58.9 35.0
1500 0 56.4 67.5 10.4 66.5 36.5
1200 20 28.8 62.1 5.0 58.5 35.7
1500 20 44.9 78.9 9.6 65.9 37.0
1200 40 24.0 70.3 4.6 58.9 36.6
1500 40 37.2 88.8 8.9 66.1 37.3
1800 40 54.3 108.2 15.3 69.5 38.3
1200 60 20.8 78.2 4.5 58.5 36.2
1500 60 31.7 97.6 8.6 65.6 35.9
1800 60 46.8 119.7 14.9 69.1 37.5
1200 80 19.2 87.4 4.5 56.5 37.5
1500 80 29.4 109.4 8.6 64.2 37.5
1800 80 43.4 133.9 14.9 66.6 39.1
1200 100 17.6 95.4 4.5 54.1 37.2
1500 100 27.2 120.0 8.7 62.8 37.5
1800 100 39.9 146.3 15.0 63.3 38.9
1200 120 16.0 102.2 4.5 53.5 36.5
1500 120 24.2 126.8 8.6 62.2 35.7
1800 120 35.7 155.1 15.0 62.6 37.0
2100 120 49.5 183.5 23.6 66.6 38.4
1200 140 14.9 109.4 4.3 53.8 37.7
1500 140 22.0 134.2 8.2 61.9 36.2
1800 140 32.5 164.0 14.3 62.8 37.3
2100 140 44.9 193.9 22.5 66.9 38.8
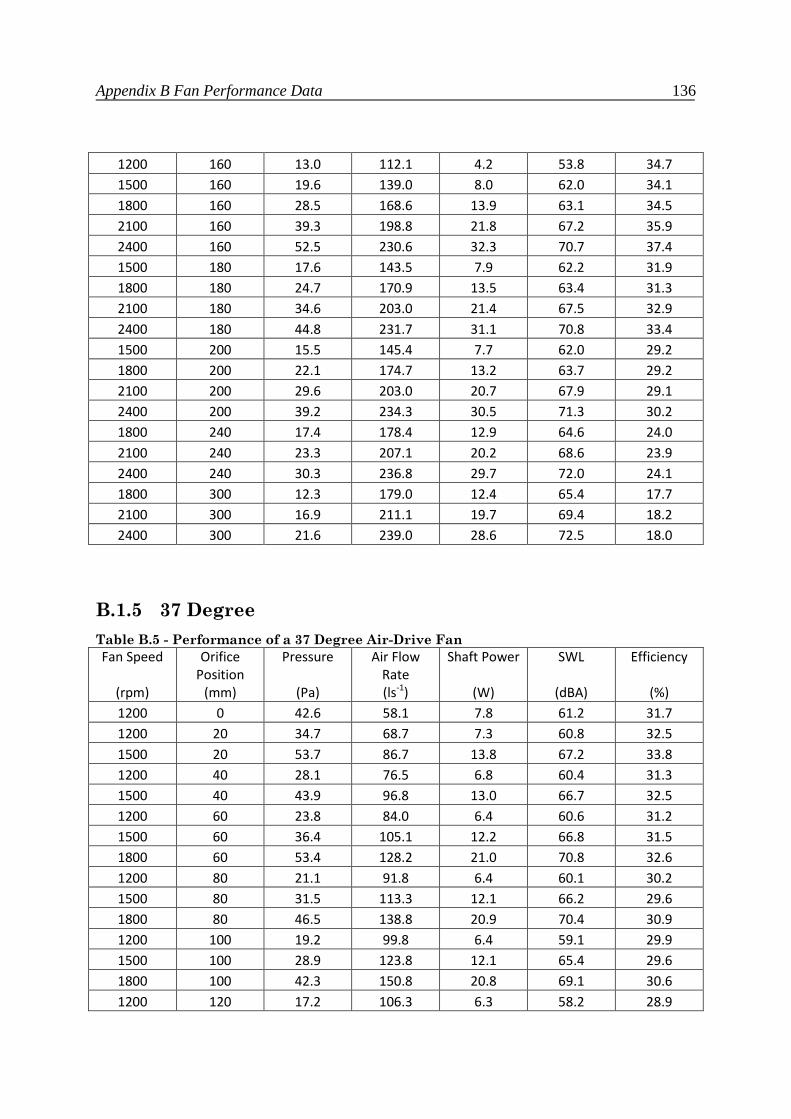
Appendix B Fan Performance Data 136
1200 160 13.0 112.1 4.2 53.8 34.7
1500 160 19.6 139.0 8.0 62.0 34.1
1800 160 28.5 168.6 13.9 63.1 34.5
2100 160 39.3 198.8 21.8 67.2 35.9
2400 160 52.5 230.6 32.3 70.7 37.4
1500 180 17.6 143.5 7.9 62.2 31.9
1800 180 24.7 170.9 13.5 63.4 31.3
2100 180 34.6 203.0 21.4 67.5 32.9
2400 180 44.8 231.7 31.1 70.8 33.4
1500 200 15.5 145.4 7.7 62.0 29.2
1800 200 22.1 174.7 13.2 63.7 29.2
2100 200 29.6 203.0 20.7 67.9 29.1
2400 200 39.2 234.3 30.5 71.3 30.2
1800 240 17.4 178.4 12.9 64.6 24.0
2100 240 23.3 207.1 20.2 68.6 23.9
2400 240 30.3 236.8 29.7 72.0 24.1
1800 300 12.3 179.0 12.4 65.4 17.7
2100 300 16.9 211.1 19.7 69.4 18.2
2400 300 21.6 239.0 28.6 72.5 18.0
B.1.5 37 Degree
Table B.5 - Performance of a 37 Degree Air-Drive Fan
Fan Speed
(rpm)
Orifice
Position
(mm)
Pressure
(Pa)
Air Flow
Rate
(ls-1
)
Shaft Power
(W)
SWL
(dBA)
Efficiency
(%)
1200 0 42.6 58.1 7.8 61.2 31.7
1200 20 34.7 68.7 7.3 60.8 32.5
1500 20 53.7 86.7 13.8 67.2 33.8
1200 40 28.1 76.5 6.8 60.4 31.3
1500 40 43.9 96.8 13.0 66.7 32.5
1200 60 23.8 84.0 6.4 60.6 31.2
1500 60 36.4 105.1 12.2 66.8 31.5
1800 60 53.4 128.2 21.0 70.8 32.6
1200 80 21.1 91.8 6.4 60.1 30.2
1500 80 31.5 113.3 12.1 66.2 29.6
1800 80 46.5 138.8 20.9 70.4 30.9
1200 100 19.2 99.8 6.4 59.1 29.9
1500 100 28.9 123.8 12.1 65.4 29.6
1800 100 42.3 150.8 20.8 69.1 30.6
1200 120 17.2 106.3 6.3 58.2 28.9

Appendix B Fan Performance Data 137
1500 120 26.4 132.8 12.1 64.8 29.1
1800 120 38.7 161.7 20.8 68.5 30.1
1200 140 16.6 115.7 6.4 58.0 29.8
1500 140 24.7 142.6 12.1 64.2 29.1
1800 140 36.0 172.9 21.0 67.8 29.6
1200 160 14.5 118.8 6.3 57.3 27.4
1500 160 22.2 148.4 12.1 63.7 27.2
1800 160 32.2 179.5 21.1 67.4 27.3
1200 200 12.6 130.5 6.0 57.5 27.4
1500 200 19.2 162.6 11.5 63.8 27.1
1800 200 26.9 193.3 19.9 67.5 26.2
1500 240 15.5 168.0 11.3 64.1 23.0
1800 240 22.7 204.6 19.7 68.7 23.6
1500 300 11.6 173.6 11.1 64.8 18.1
1800 300 16.3 207.2 19.1 69.1 17.7
2100 300 21.7 239.9 29.8 72.8 17.5
B.2 Wellington Drive Fanpack
B.2.1 Fanpack with 25 W motor
Table B.6 - Performance of a Wellington Drive Fanpack with 25 W Motor
Fan Speed
(rpm)
Orifice
Position
(mm)
Pressure
(Pa)
Air Flow
Rate
(ls-1
)
Power
Drawn
(W)
SWL
(dBA)
Efficiency
(%)
1200 0 30.7 48.6 14 63.7 10.7
1500 0 48.7 62.4 22 71.0 13.8
1200 20 25.7 58.5 13 62.2 11.6
1500 20 40.6 74.8 21 69.2 14.5
1200 40 22.1 67.3 13 62.1 11.4
1500 40 34.3 85.1 20 68.7 14.6
1800 40 50.6 104.3 29 71.1 18.2
1200 60 20.5 77.6 13 61.8 12.3
1500 60 32.0 98.1 20 69.0 15.7
1800 60 48.3 121.6 29 70.8 20.2
1200 80 19.3 87.7 13 62.2 13.0
1500 80 30.7 111.9 19 68.9 18.1
1800 80 45.9 137.9 28 70.3 22.6
1200 100 18.2 97.3 12 62.5 14.8
1500 100 28.3 122.5 18 68.6 19.3
1800 100 42.4 150.9 27 69.0 23.7
1200 120 16.4 103.5 12 61.3 14.1
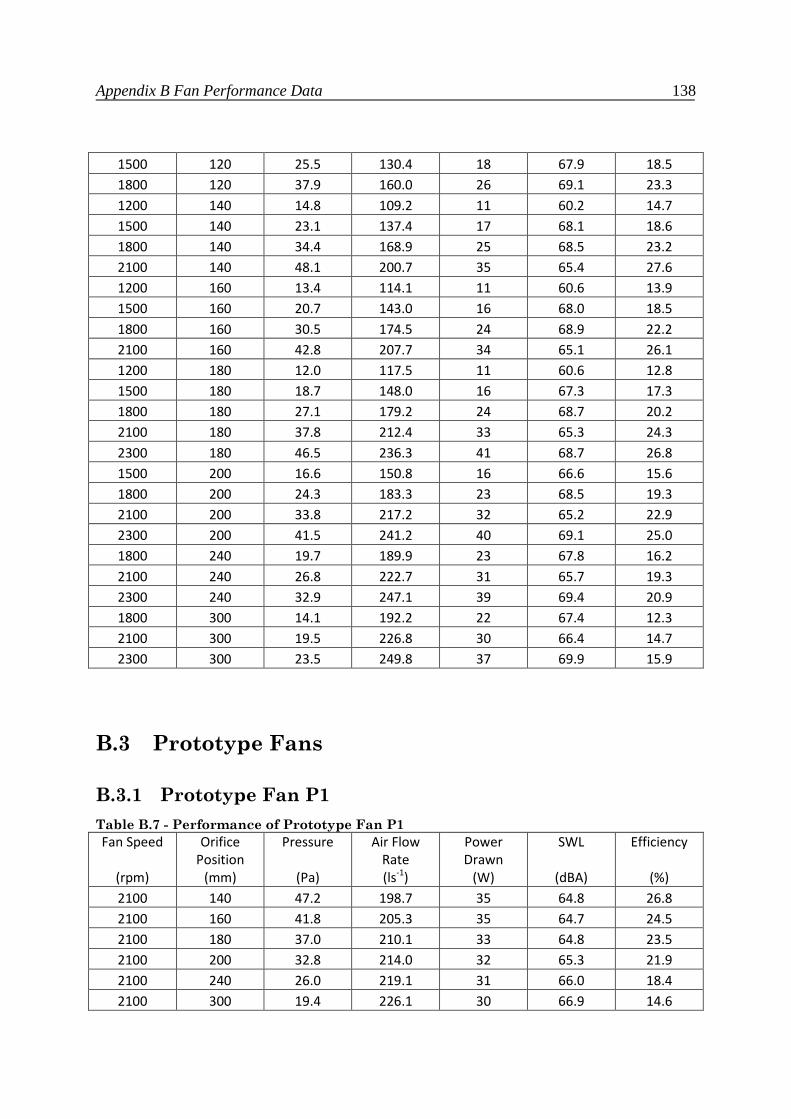
Appendix B Fan Performance Data 138
1500 120 25.5 130.4 18 67.9 18.5
1800 120 37.9 160.0 26 69.1 23.3
1200 140 14.8 109.2 11 60.2 14.7
1500 140 23.1 137.4 17 68.1 18.6
1800 140 34.4 168.9 25 68.5 23.2
2100 140 48.1 200.7 35 65.4 27.6
1200 160 13.4 114.1 11 60.6 13.9
1500 160 20.7 143.0 16 68.0 18.5
1800 160 30.5 174.5 24 68.9 22.2
2100 160 42.8 207.7 34 65.1 26.1
1200 180 12.0 117.5 11 60.6 12.8
1500 180 18.7 148.0 16 67.3 17.3
1800 180 27.1 179.2 24 68.7 20.2
2100 180 37.8 212.4 33 65.3 24.3
2300 180 46.5 236.3 41 68.7 26.8
1500 200 16.6 150.8 16 66.6 15.6
1800 200 24.3 183.3 23 68.5 19.3
2100 200 33.8 217.2 32 65.2 22.9
2300 200 41.5 241.2 40 69.1 25.0
1800 240 19.7 189.9 23 67.8 16.2
2100 240 26.8 222.7 31 65.7 19.3
2300 240 32.9 247.1 39 69.4 20.9
1800 300 14.1 192.2 22 67.4 12.3
2100 300 19.5 226.8 30 66.4 14.7
2300 300 23.5 249.8 37 69.9 15.9
B.3 Prototype Fans
B.3.1 Prototype Fan P1
Table B.7 - Performance of Prototype Fan P1
Fan Speed
(rpm)
Orifice
Position
(mm)
Pressure
(Pa)
Air Flow
Rate
(ls-1
)
Power
Drawn
(W)
SWL
(dBA)
Efficiency
(%)
2100 140 47.2 198.7 35 64.8 26.8
2100 160 41.8 205.3 35 64.7 24.5
2100 180 37.0 210.1 33 64.8 23.5
2100 200 32.8 214.0 32 65.3 21.9
2100 240 26.0 219.1 31 66.0 18.4
2100 300 19.4 226.1 30 66.9 14.6
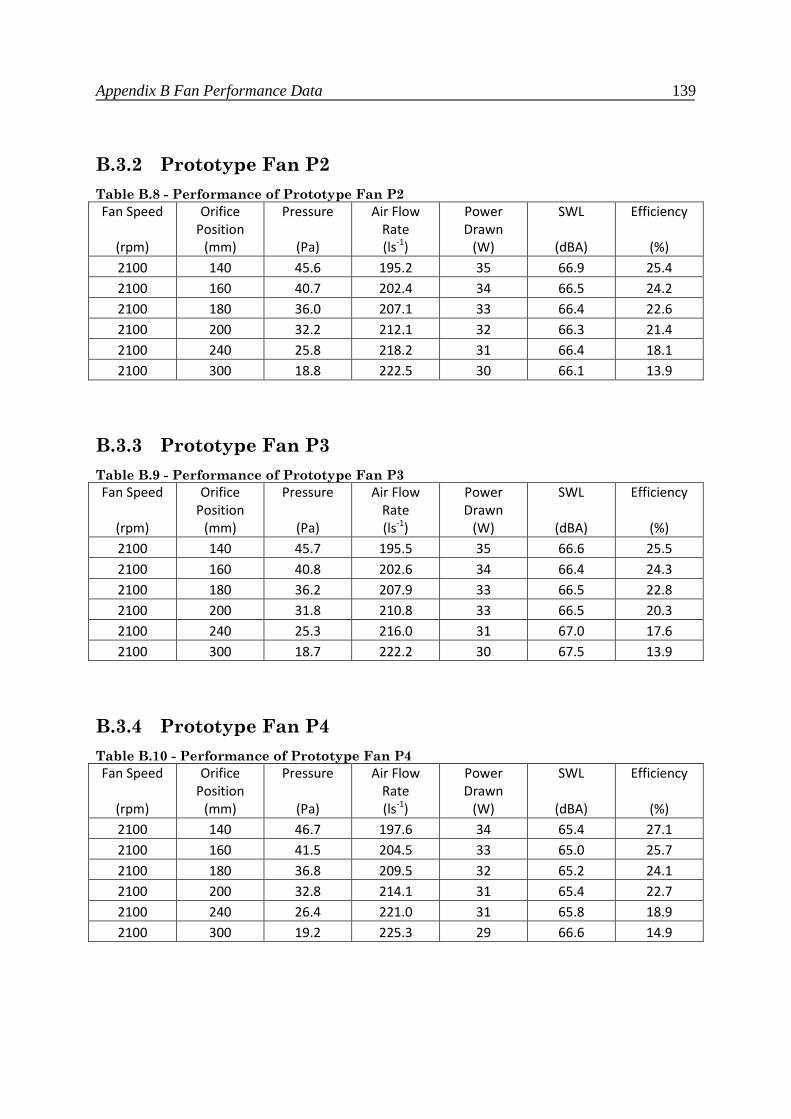
Appendix B Fan Performance Data 139
B.3.2 Prototype Fan P2
Table B.8 - Performance of Prototype Fan P2
Fan Speed
(rpm)
Orifice
Position
(mm)
Pressure
(Pa)
Air Flow
Rate
(ls-1
)
Power
Drawn
(W)
SWL
(dBA)
Efficiency
(%)
2100 140 45.6 195.2 35 66.9 25.4
2100 160 40.7 202.4 34 66.5 24.2
2100 180 36.0 207.1 33 66.4 22.6
2100 200 32.2 212.1 32 66.3 21.4
2100 240 25.8 218.2 31 66.4 18.1
2100 300 18.8 222.5 30 66.1 13.9
B.3.3 Prototype Fan P3
Table B.9 - Performance of Prototype Fan P3
Fan Speed
(rpm)
Orifice
Position
(mm)
Pressure
(Pa)
Air Flow
Rate
(ls-1
)
Power
Drawn
(W)
SWL
(dBA)
Efficiency
(%)
2100 140 45.7 195.5 35 66.6 25.5
2100 160 40.8 202.6 34 66.4 24.3
2100 180 36.2 207.9 33 66.5 22.8
2100 200 31.8 210.8 33 66.5 20.3
2100 240 25.3 216.0 31 67.0 17.6
2100 300 18.7 222.2 30 67.5 13.9
B.3.4 Prototype Fan P4
Table B.10 - Performance of Prototype Fan P4
Fan Speed
(rpm)
Orifice
Position
(mm)
Pressure
(Pa)
Air Flow
Rate
(ls-1
)
Power
Drawn
(W)
SWL
(dBA)
Efficiency
(%)
2100 140 46.7 197.6 34 65.4 27.1
2100 160 41.5 204.5 33 65.0 25.7
2100 180 36.8 209.5 32 65.2 24.1
2100 200 32.8 214.1 31 65.4 22.7
2100 240 26.4 221.0 31 65.8 18.9
2100 300 19.2 225.3 29 66.6 14.9