
piv investigation of the internal flow structure in a centrifugal ...
11
PIV INVESTIGATION OF THE INTERNAL FLOW STRUCTURE IN A CENTRIFUGAL PUMP IMPELLER N. Pedersen ([email protected]) 1 and C.B. Jacobsen 2 1 Dept. of Energy Engineering, Fluid Mechanics Section Building 403, Technical University of Denmark DK-2800 Lyngby, Denmark 2 Fluid Dynamics Engineering Grundfos A/S, DK-8500 Bjerringbro, Denmark ABSTRACT The internal flow structure in a centrifugal pump impeller is investigated using Particle Image Velocimetry (PIV). The measurements are performed in a perspex model of an industrial centrifugal impeller employing fluorescent seeding particles to give full access to near-wall flows. A large number of velocity vector maps are acquired by conditional sampling in a horizontal constant-height plane between hub and shroud of the impeller, with the 93*94 mm field-of-view in effect covering a full impeller passage. Instantaneous and ensemble averaged vector maps are transformed to the moving frame and analysed for the purpose of identifying steady and unsteady flow phenomena at different flow rates, with the main focus on severe off-design conditions. At the nominal design point, the mean field of relative velocity is vane congruent in the predominant parts of the impeller passage, showing well-behaved flow with no separation. High levels of turbulence are confined to near- wall regions along the suction side. At the one-quarter load, results show every second blade passage being stalled while the adjacent blade passage performed well, as indicated in the instantaneous vector map shown in Error! Unknown switch argument. . A large recirculation bubble formed on the suction side, in effect blocking most of the entrance to the stalled passage. Furthermore, a strong component of backflow was found at the pressure side near the impeller outlet. The detected stall phenomenon is stationary and non-rotating, and is not initiated via the interaction with any stationary components outside the impeller. In these respects, it differs from the phenomena commonly known as rotating stall. The experimental setup and technique has proved to be efficient in providing reliable data over a full blade passage, also in the close vicinity of walls. 10 20 30 40 50 60 70 80 90 0 10 20 30 40 50 60 70 x [mm] y [mm] Figure Error! Unknown switch argument. : Multi- stage centrifugal pump showing the tested impeller geometry (Grundfos A/S). Figure Error! Unknown switch argument. : Sample instantaneous PIV vector map of the relative velocity w r
-
Upload
khangminh22 -
Category
Documents
-
view
5 -
download
0
Transcript of piv investigation of the internal flow structure in a centrifugal ...
PIV INVESTIGATION OF THE INTERNAL FLOW STRUCTUREIN A CENTRIFUGAL PUMP IMPELLER
N. Pedersen ([email protected])1 and C.B. Jacobsen2
1Dept. of Energy Engineering, Fluid Mechanics SectionBuilding 403, Technical University of Denmark
DK-2800 Lyngby, Denmark
2Fluid Dynamics EngineeringGrundfos A/S, DK-8500 Bjerringbro, Denmark
ABSTRACT
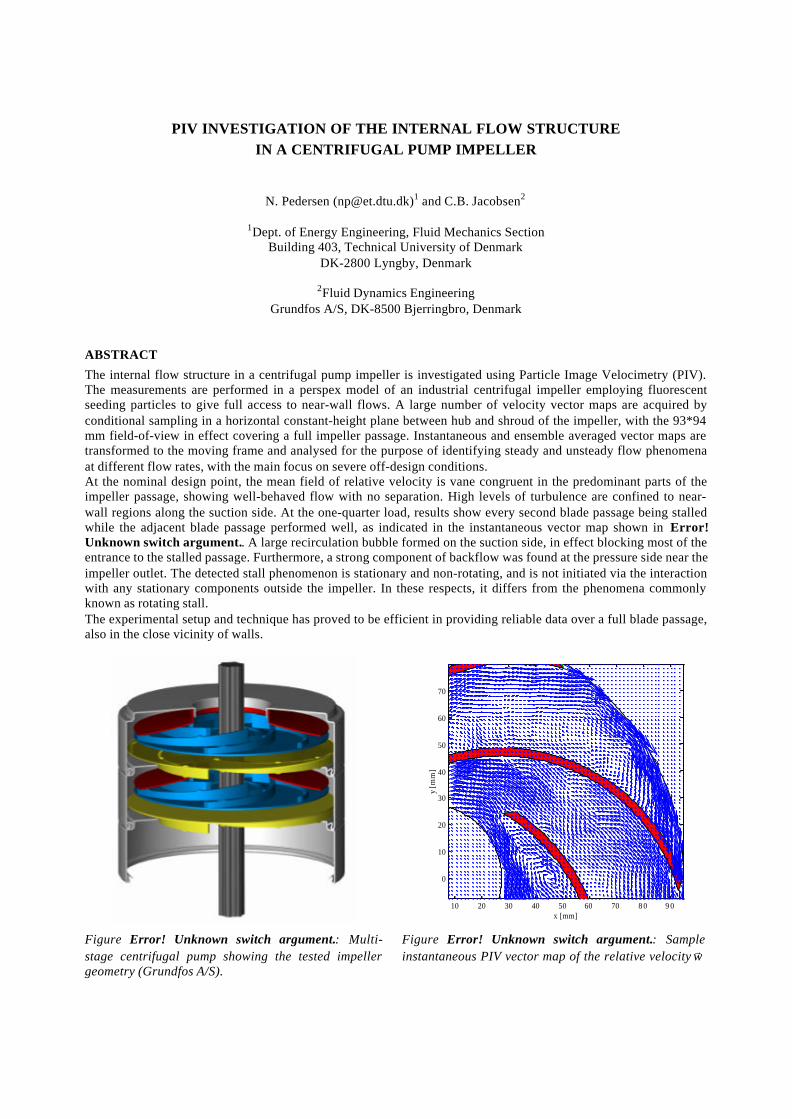
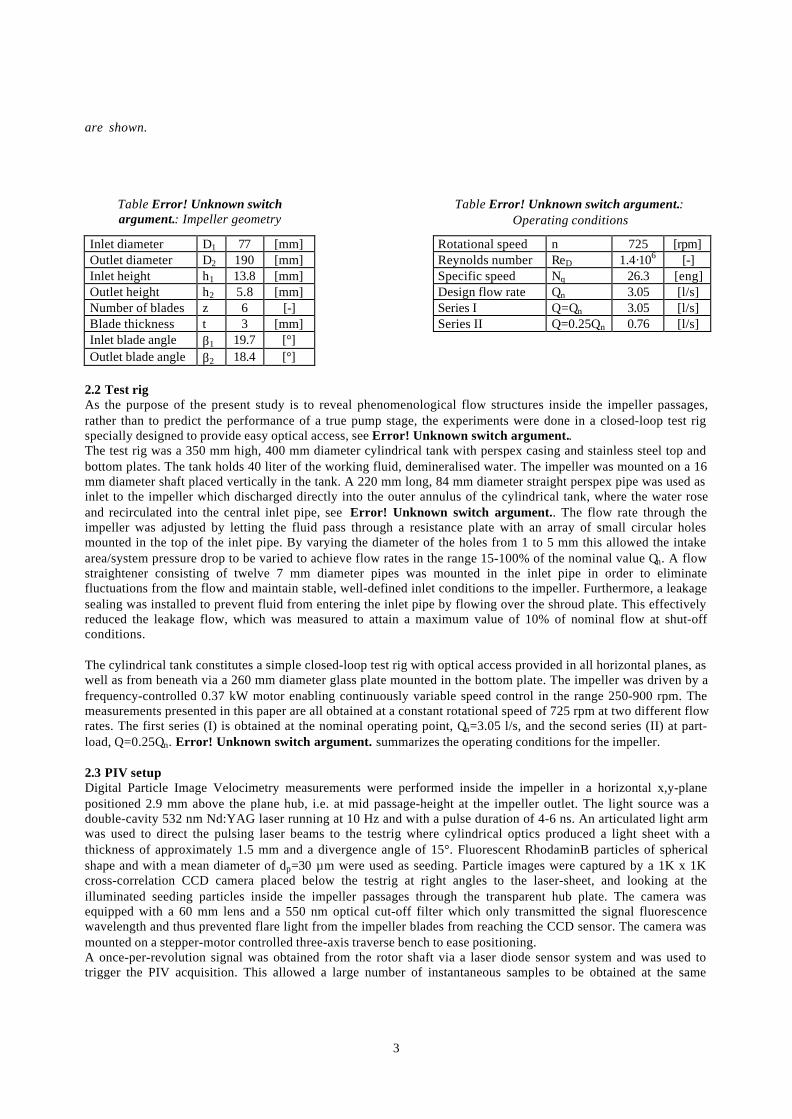
The internal flow structure in a centrifugal pump impeller is investigated using Particle Image Velocimetry (PIV).The measurements are performed in a perspex model of an industrial centrifugal impeller employing fluorescentseeding particles to give full access to near-wall flows. A large number of velocity vector maps are acquired byconditional sampling in a horizontal constant-height plane between hub and shroud of the impeller, with the 93*94mm field-of-view in effect covering a full impeller passage. Instantaneous and ensemble averaged vector maps aretransformed to the moving frame and analysed for the purpose of identifying steady and unsteady flow phenomenaat different flow rates, with the main focus on severe off-design conditions.At the nominal design point, the mean field of relative velocity is vane congruent in the predominant parts of theimpeller passage, showing well-behaved flow with no separation. High levels of turbulence are confined to near-wall regions along the suction side. At the one-quarter load, results show every second blade passage being stalledwhile the adjacent blade passage performed well, as indicated in the instantaneous vector map shown in Error!Unknown switch argument.. A large recirculation bubble formed on the suction side, in effect blocking most of theentrance to the stalled passage. Furthermore, a strong component of backflow was found at the pressure side near theimpeller outlet. The detected stall phenomenon is stationary and non-rotating, and is not initiated via the interactionwith any stationary components outside the impeller. In these respects, it differs from the phenomena commonlyknown as rotating stall.The experimental setup and technique has proved to be efficient in providing reliable data over a full blade passage,also in the close vicinity of walls.
10 20 30 40 50 60 70 8 0 9 0
0
10
20
30
40
50
60
70
x [mm]
y [m
m]
Figure Error! Unknown switch argument.: Multi-stage centrifugal pump showing the tested impellergeometry (Grundfos A/S).
Figure Error! Unknown switch argument.: Sampleinstantaneous PIV vector map of the relative velocity wr

2
in the impeller at part-load conditions. Q=0.25Qn
1. INTRODUCTIONDetailed knowledge of the flow field occurring inside impeller channels are important for further improvements inthe design of centrifugal pumps. To this end, instantaneous data as given by PIV have proven a valuable supplementto mean data as a tool for the identification of unsteady and secondary flow phenomena. Several PIV studies havefocused on the flow in the non-rotating components of a centrifugal pump stage. Akin and Rockwell (1994) usedPIV to study the wake from a model impeller and its interaction with a stationary diffuser blade. They characterizedflow separation and reattachment events using instantaneous streamline patterns and vorticity contours. Eisele et al.(1997) used PTV (Particle Tracking Velocimetry) in a vaned diffuser and found several unsteady flow features, i.e. arecirculating back flow from the diffuser into the impeller at part-load conditions. Other studies measured the flowin volutes, e.g. Dong et al. (1992a,b) who showed that the entire flow in the volute is pulsating, and that meanproperties therefore cannot be used for estimating conditions near the exit from the impeller.Fewer studies have been concerned with the internal flow in centrifugal impellers. Most rotor investigations havedealt with centrifugal compressors, e.g. Fowler (1968) and Eckardt (1976), who revealed the presence of a jet-wakestructure at the discharge of the rotor. Measurements of the instantaneous internal flow in centrifugal pumpimpellers are scarce, and have only recently been reported done with PIV, see e.g. Oldenburg and Pap (1996) andAramaki and Hayami (1999). Wernet (2000) provides an overview of the current state-of-the-art.The objective of the present study is to investigate the flow inside the passages of a centrifugal pump impeller byPIV. The focus is on the use of instantaneous data to identify steady and unsteady flow phenomena at differentoperating conditions. Such data also serve to evaluate computational model studies such as Large Eddy Simulations.
2. EXPERIMENTAL SETUP
2.1 ImpellerThe impeller under investigation was a medium specific speed shrouded impeller of industrial design, representingthe rotor part of a multi-stage centrifugal pump, see Figure Error! Unknown switch argument. . The test impellerhad a diameter of 190 mm and consisted of 6 simple curvature blades of constant thickness between a plane hub anda curved shroud plate. The axial height of the impeller passages was tapered from 13.8 mm at the inlet to 5.8 mm atthe outlet. To facilitate optical measurements inside the impeller passages, the entire test impeller was manufacturedin perspex which was subsequently polished on all internal and external surfaces. Error! Unknown switchargument. shows a plan view of the test impeller and the main dimensions are given in Error! Unknown switchargument..
-100 -80 -60 -40 -20 0 2 0 4 0 6 0 80 100 120-100
-80
-60
-40
-20
0
2 0
4 0
6 0
8 0
100
x [mm]
y [m
m]
Field-of-view I
Field-of-view II
plateFlowstraightener
Resistance
Leakagesealing
Figure Error! Unknown switch argument.: Plan viewof the 190 mm diameter test impeller. The locations ofthe two 93*94 mm fields-of-view measured with PIV
Figure Error! Unknown switch argument.: Closed-loop test-rig with optical access provided from the sidesas well as from beneath.
3
are shown.
Table Error! Unknown switchargument.: Impeller geometry
Table Error! Unknown switch argument.:Operating conditions
Inlet diameter D1 77 [mm] Rotational speed n 725 [rpm]Outlet diameter D2 190 [mm] Reynolds number ReD 1.4·106 [-]Inlet height h1 13.8 [mm] Specific speed Nq 26.3 [eng]Outlet height h2 5.8 [mm] Design flow rate Qn 3.05 [l/s]Number of blades z 6 [-] Series I Q=Qn 3.05 [l/s]Blade thickness t 3 [mm] Series II Q=0.25Qn 0.76 [l/s]Inlet blade angle β1 19.7 [°]Outlet blade angle β2 18.4 [°]
2.2 Test rigAs the purpose of the present study is to reveal phenomenological flow structures inside the impeller passages,rather than to predict the performance of a true pump stage, the experiments were done in a closed-loop test rigspecially designed to provide easy optical access, see Error! Unknown switch argument..The test rig was a 350 mm high, 400 mm diameter cylindrical tank with perspex casing and stainless steel top andbottom plates. The tank holds 40 liter of the working fluid, demineralised water. The impeller was mounted on a 16mm diameter shaft placed vertically in the tank. A 220 mm long, 84 mm diameter straight perspex pipe was used asinlet to the impeller which discharged directly into the outer annulus of the cylindrical tank, where the water roseand recirculated into the central inlet pipe, see Error! Unknown switch argument.. The flow rate through theimpeller was adjusted by letting the fluid pass through a resistance plate with an array of small circular holesmounted in the top of the inlet pipe. By varying the diameter of the holes from 1 to 5 mm this allowed the intakearea/system pressure drop to be varied to achieve flow rates in the range 15-100% of the nominal value Qn. A flowstraightener consisting of twelve 7 mm diameter pipes was mounted in the inlet pipe in order to eliminatefluctuations from the flow and maintain stable, well-defined inlet conditions to the impeller. Furthermore, a leakagesealing was installed to prevent fluid from entering the inlet pipe by flowing over the shroud plate. This effectivelyreduced the leakage flow, which was measured to attain a maximum value of 10% of nominal flow at shut-offconditions.
The cylindrical tank constitutes a simple closed-loop test rig with optical access provided in all horizontal planes, aswell as from beneath via a 260 mm diameter glass plate mounted in the bottom plate. The impeller was driven by afrequency-controlled 0.37 kW motor enabling continuously variable speed control in the range 250-900 rpm. Themeasurements presented in this paper are all obtained at a constant rotational speed of 725 rpm at two different flowrates. The first series (I) is obtained at the nominal operating point, Qn=3.05 l/s, and the second series (II) at part-load, Q=0.25Qn. Error! Unknown switch argument. summarizes the operating conditions for the impeller.
2.3 PIV setupDigital Particle Image Velocimetry measurements were performed inside the impeller in a horizontal x,y-planepositioned 2.9 mm above the plane hub, i.e. at mid passage-height at the impeller outlet. The light source was adouble-cavity 532 nm Nd:YAG laser running at 10 Hz and with a pulse duration of 4-6 ns. An articulated light armwas used to direct the pulsing laser beams to the testrig where cylindrical optics produced a light sheet with athickness of approximately 1.5 mm and a divergence angle of 15°. Fluorescent RhodaminB particles of sphericalshape and with a mean diameter of dp=30 µm were used as seeding. Particle images were captured by a 1K x 1Kcross-correlation CCD camera placed below the testrig at right angles to the laser-sheet, and looking at theilluminated seeding particles inside the impeller passages through the transparent hub plate. The camera wasequipped with a 60 mm lens and a 550 nm optical cut-off filter which only transmitted the signal fluorescencewavelength and thus prevented flare light from the impeller blades from reaching the CCD sensor. The camera wasmounted on a stepper-motor controlled three-axis traverse bench to ease positioning.A once-per-revolution signal was obtained from the rotor shaft via a laser diode sensor system and was used totrigger the PIV acquisition. This allowed a large number of instantaneous samples to be obtained at the same

4
circumferential position of the impeller in order to calculate ensemble averages. Error! Unknown switchargument. shows the locations of the two 93 x 94 mm fields-of-view which was measured, in effect covering a fullimpeller passage. The corresponding magnification factor was M=0.098.
2.4 Data acquisition and processingCare was taken to optimize the quality of the PIV data, both at the recording and at the processing stage. The entirecylindrical tank was flooded with particles to give a uniform and sufficiently high seeding concentration to ensure aminimum of 5-10 particles in each interrogation region. In order to minimize the displacement estimation error, thenumerical aperture of the recording lens was chosen so diffracted particle images covered at least 1-2 pixels on theCCD sensor (Westerweel 1998). Based on M and the particle diameter dp, this requirement imposed an f-number off# = 8. The pulse delay ∆t was set as according to the ¼ displacement rule (Keane and Adrian 1990) to 150 and 110µs for series I and II, respectively.The conditionally sampled PIV images were processed into vector maps using the cross-correlation method andinterrogation areas of 32 by 32 pixels and 50% overlap. This yielded 60 x 60 vectors per vector map with a distanceof 1.5 mm between each vector. Due to the use of high-density fluorescent seeding a good signal-to-noise ratio wereobtained even in the close proximity of the impeller blades. Therefore the number of spurious vectors (outliers) didnot exceed 1-3% which is significantly lower than if non-fluorescent seeding were used. Subsequently, the onlyvalidation procedure applied was a removal of vectors with a correlation peak signal-to-noise ratio below 1.20. Nointerpolation or data filling was applied.Experimental uncertainties include variations in the impeller speed, estimated to ± 1.5%, and an uncertainty of± 3% in the flow rate specification. The errors inherent to the instantaneous PIV velocity estimates themselves areestimated to be of the order of 1% (Westerweel 1997). Sample sizes of 2000 vector maps were collected to ensurean accuracy of 0.7% and 4.5% (c.i. = 95%) on the mean and fluctuating components of velocity, respectively. Thetotal recording time of 2000 conditionally sampled images was in the order of 0.6h, which corresponds to a meanacquisition rate of 0.8 Hz.
3. RESULTS AND DISCUSSION
Error! Unknown switch argument. shows a sample of the particle images acquired in the impeller in field-of-viewII (see Figure Error! Unknown switch argument.). The rotation sense is anti-clockwise and the laser-sheetdirection is from upper right to lower left as indicated by the weak shadow behind the trailing edge of the vane in thetop of the image. Error! Unknown switch argument. shows a sample instantaneous vector map of the absolutevelocity cr , which is readily obtained in the fixed camera reference frame. The flare of the assembly screws visiblein Figure Error! Unknown switch argument. was used for referencing.
10 20 30 40 50 60 70 8 0 9 0
0
10
20
30
40
50
60
70
x [mm]
y [m
m]
Figure Error! Unknown switch argument.: Sampleparticle image of the impeller. The rotation sense isanti-clockwise. The laser sheet direction is from upper
Figure Error! Unknown switch argument.: Sampleinstantaneous velocity vector map of the absolutevelocity cr . Corresponding relative velocity vector map

5
right to lower left. is shown in Error! Unknown switch argument..Q=0.25Qn
In order to interpret the flow structures inside the impeller passages, the velocity wr relative to the rotating impellerwas calculated. This is given by ucw rrr −= , i.e. by vectorial subtraction of the local circumferential impeller speedfrom the measured data. Figure Error! Unknown switch argument. shows the instantaneous relative velocitycorresponding to the absolute vector map in Figure Error! Unknown switch argument. .
3.1 Full-loadFigure Error! Unknown switch argument. shows the ensemble average of 2000 instantaneous realizationsacquired at the nominal flow rate Qn in field-of-view I (see Figure Error! Unknown switch argument.). It is seenthat the mean field of relative velocity is close to vane congruent in the predominant parts of the impeller passage.The flow increases along the suction side without separation due to the low dynamic loading at this operating point.Only a careful investigation of the results indicate that the sharp leading edge of the impeller vanes slightly perturbsthe flow on the blade pressure side.
30 40 50 6 0 70 80 90 100 110
-40
-30
-20
-10
0
10
20
30
40
x [mm]
y [m
m]
Figure Error! Unknown switch argument.:Ensemble average of 2000 instantaneous PIVvector maps. Q=Qn
Figure Error! Unknown switch argument.: Contour plot ofthe measured portion k2D of the turbulent kinetic energy.Q=Qn
A quantitative measure of the extent of random unsteady velocity fluctuations is the measured portion k2D of theturbulent kinetic energy k, defined as the mean deviation of instantaneous data from the ensemble-averaged results
( )2221
2 yxD 'c'ck += (1)
where ' denote a velocity fluctuation, an ensemble average, and cx and cy are the planar absolute velocity
components. It is noted that this quantity does not account for the span-wise velocity fluctuations, not measured. Acontour plot of k2D is given in Figure Error! Unknown switch argument. and demonstrates an even distribution ofturbulent kinetic energy, with higher levels of turbulence confined to near-wall areas along the vane suction side.Based on k2D, a turbulence intensity may be defined as 22 U/kTu D= where U2 is the impeller speed at the outlet.
Values of turbulence intensity reach a maximum of 4% at the suction side, but are otherwise much lower confirmingthe persistence of an inviscid potential flow core in the impeller passage at full-load conditions.
3.2 Part-loadThe main focus of the present work was to investigate the flow characteristics of the centrifugal impeller operatingat severe off-design conditions. Figure Error! Unknown switch argument. shows a snapshot of the flow measuredin field-of-view II at a flow rate of 0.25Qn. The ensemble average based on 2000 vector maps is presented in Figure

6
Error! Unknown switch argument.. Both vector maps show a clear departure from the well-behaved, non-separated flow field present at full-load. A large recirculation bubble has formed at the suction side of the vane inthe lower part of the field-of-view. Furthermore, a low-velocity zone with an array of counter-rotating vortices hasemerged in the upper passage, extending over half the passage-width on almost the entire pressure side. A strongcomponent of backflow into the upper passage is also seen on the ensemble average, reducing the through-flow inthis passage. In contrast, the center passage shows no evidence of separated flow, but is fairly well-behaved,although exhibiting fluctuations in the relative flow angle along the passage.In order to highlight instantaneous flow structures, the deviation of a sample instantaneous velocity cr from theensemble average cr is shown in Figure Error! Unknown switch argument. . This gives evidence of a highly
fluctuating flow. Note that these fluctuating velocities also represent those of the relative field, i.e. ww rr − .
1 0 20 30 4 0 50 60 70 80 9 0
0
10
20
30
40
50
60
70
x [mm]
y [m
m]
10 20 30 40 50 60 70 80 90
0
1 0
2 0
3 0
4 0
5 0
6 0
7 0
x [mm]
y [m
m]
Figure Error! Unknown switch argument.: Ensembleaverage of 2000 instantaneous PIV vector maps.Q=0.25Qn
Figure Error! Unknown switch argument.: Sampleinstantaneous deviation cc rr − from the ensemble
average. Q=0.25Qn
The fact that adjacent impeller passages exhibit such distinct flow characteristics suggests that every secondimpeller passage is stalled at quarter-load. To explore this further, a supplementary series of PIV data were acquiredwith the camera in the same location, but with an additional delay of T/6=13.8 ms, i.e. the passage time of oneimpeller blade, added to the trigger signal from the rotor shaft. Because of the stationary appearance of the detectedstall phenomena, this allowed us to collect data in a region that effectively covered two full adjacent passages.Following this procedure, another 2000 samples were collected. The results are shown in Figure Error! Unknownswitch argument.. The last series, although acquired at the same location, has been rotated 60 degrees to reflect theeffective field-of-view.

7
-60 -40 -20 0 20 4 0 60 8 0
0
20
40
60
80
x [mm]
y [m
m]
A
B
AB
A
B
AB
Figure Error! Unknown switch argument.: Two ensemble averages of each 2000 vector maps acquired separately.One set of data has been rotated 60 degrees to facilitate comparison. Only every second vector is shown to avoidcrowding. The well-behaved passage is denoted A and the stalled one B. Q=0.25Qn
It is apparent from Figure Error! Unknown switch argument. that the two different ensemble averages fitperfectly together and therefore fully correspond with the result obtained had the two series been acquiredsimultaneously. For the aid of discussion, the impeller passage without flow separation has been denoted A and thestalled one B. The large extent of the suction side recirculation zone in passage B is notable, with flow reattachingnot taking place until half-way down the blade. The recirculation bubble effectively blocks three-quarters of theentrance to passage B, which in return gives rise to the low-velocity zone inside the passage, and furthermoreapparently unstalls passage A.
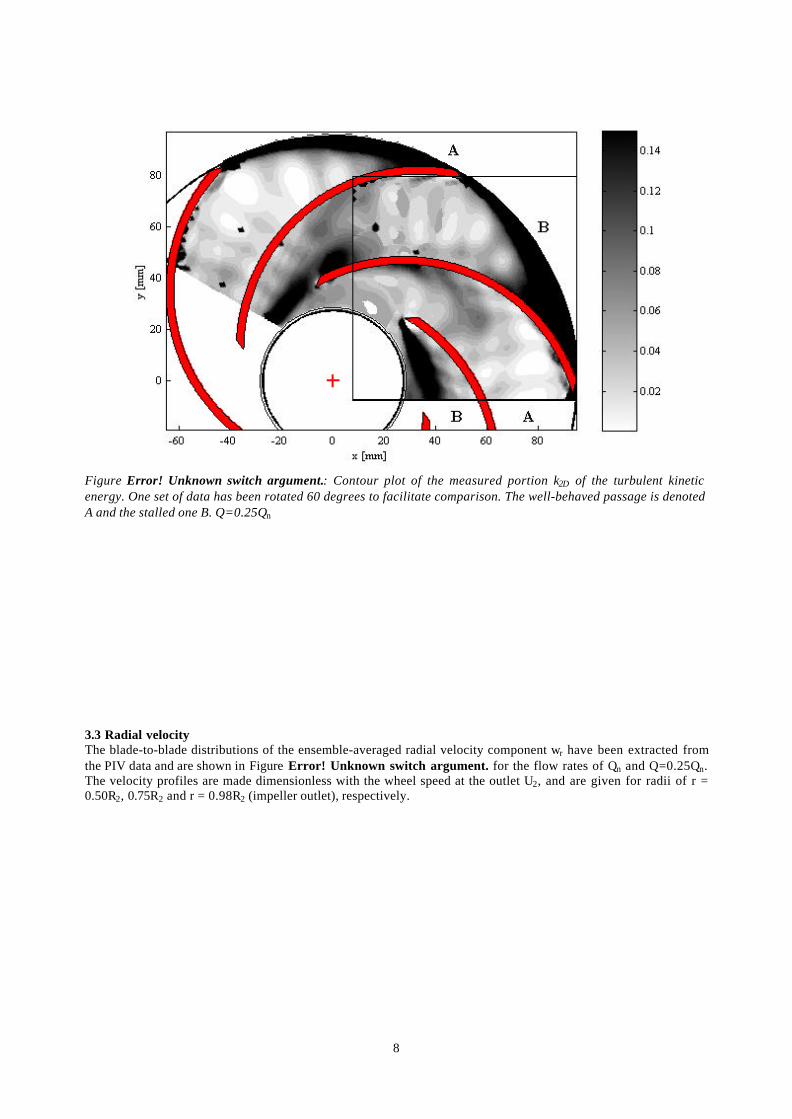
A contour plot of the turbulent kinetic energy measured at Q=0.25Qn is given in Figure 12. The contours show ahighly elevated level of k2D in a region extending from the leading edge along the core of the suction side separationbubble towards the leading edge of the next arriving impeller vane. High levels of turbulence also exist on thepressure side near the outlet of passage B, coinciding with the location of strong backflow. Generally, k2D attainsvalues more than twice the level measured at full-load conditions. Expressed in terms of Tu, local values as high as10% are found in the regions described. In addition to this, it should be noted that if referred to local relativevelocities instead of the outlet wheel speed U2, the turbulence intensities could be even higher.
8
Figure Error! Unknown switch argument.: Contour plot of the measured portion k2D of the turbulent kineticenergy. One set of data has been rotated 60 degrees to facilitate comparison. The well-behaved passage is denotedA and the stalled one B. Q=0.25Qn
3.3 Radial velocityThe blade-to-blade distributions of the ensemble-averaged radial velocity component wr have been extracted fromthe PIV data and are shown in Figure Error! Unknown switch argument. for the flow rates of Qn and Q=0.25Qn.The velocity profiles are made dimensionless with the wheel speed at the outlet U2, and are given for radii of r =0.50R2, 0.75R2 and r = 0.98R2 (impeller outlet), respectively.

9
a)
0 20 40 60
-0.04
0
0.04
0.08
0.12
0.16
0.2
0.24
SSPS
Wr /
U2
0 20 40 60 80 100 120
-0.04
0
0.04
0.08
0.12
0.16
0.2
0.24
P SP S SS
Passage B
SS
Passage A
Wr /
U2
b)
0 20 40 60
-0.04
0
0.04
0.08
0.12
Wr /
U2
0 20 40 60 80 100 120
-0.04
0
0.04
0.08
0.12
Wr /
U2
c)
0 20 40 60
-0.04
0
0.04
0.08
0.12
P S SS
Wr /
U2
Circumferential position [deg]0 20 40 60 80 100 120
-0.04
0
0.04
0.08
0.12
P S SS
Passage BPassage A
Wr /
U2
Circumferential position [deg]
Figure Error! Unknown switch argument.: Blade-to-blade distribution of the ensemble-averaged normalizedradial velocity component rw measured with PIV at flow rates of Q=Qn (left) and Q=0.25Qn (right). a) r=0.50R2 b)
r=0.75R2 c) r=0.98R2.
The left column of Figure 13 shows the results for full-load, and the right column for quarter-load. The latter showstwo pressure-to-suction side intervals in order to represent the unstalled and stalled passages A and B, respectively.All graphs show one or two lines on top of each other depending on the available data at the individual radialstation, demonstrating the high degree of reproducibility of the measurements.At full-load, the profile at r=0.50R2 is shifted markedly towards the suction side (SS), indicating a somewhatprerotated inlet flow. Travelling outwards through the impeller passage the radial velocity profile evens out, and atthe outlet the highest velocity has shifted to the pressure side (PS). This pattern is in accordance with classicalstreamline theory.

10
Moving on to the quarter-load data, passage A exhibits the same main features as seen at full-load, with the additionof local flow features such as backflow at the inner radial station. In contrast, the inlet profile of passage B is shiftedtowards the pressure side with backflow velocities at the suction side reaching a magnitude of 55% of the maximumoutward component. In both passages a persistent wavy profile is seen at the r=0.75R2 station. This is also visible onthe vector map in Figure 11. The outer radial station of channel B gives evidence of a stalled passage with almost nothrough-flow. Comparing the inner and outer radial stations of channel B suggests that three-dimensional effects arepresent in this industrial-type impeller. To elaborate further on this, LDA data obtained at the same operatingconditions, but at different axial positions, are presently being analysed.
4. CONCLUSIONS
Detailed particle image velocimetry measurements using fluorescent seeding have been performed inside thepassages of a perspex centrifugal impeller of industrial design. The main focus of the investigation has been to studysteady and unsteady flow features at severe off-design conditions. The experimental setup and technique has provedto be efficient in providing reliable data over a full blade passage, also in the close vicinity of walls.Measurements performed at the nominal operating point Qn show a well-behaved vane congruent flow with noseparation occurring. At part-load at a flow rate of Q=0.25Qn stall is detected in every second passage, while theadjacent passages are unstalled and exhibit well-behaved flow. High levels of turbulence are found in the stalledpassage in a strong separation bubble at the suction side at inlet, and at the pressure side at outlet.The stall phenomenon detected is stationary and non-rotating. This may be due to the even number of vanes and thefact that the stall is not initiated via the interaction with any stationary components outside the impeller. In theserespects, the present stall phenomenon differs from the periodic unsteadiness of the relative flow commonly knownas rotating stall, which typically moves in the direction of rotation at a lower speed than the impeller.
ACKNOWLEDGEMENTSThe study was partially supported by grants from Grundfos A/S, Bjerringbro, Denmark and Technical University ofDenmark.
REFERENCES
O. Akin and D. Rockwell (1994). Flow structure in a radial flow pumping system using high-image-density ParticleImage Velocimetry. J. Fluids Engng., 116, 538-544.
S. Aramaki and H. Hayami (1999). Unsteady flow measurement in a rotating impeller using PIV. In Proceedings ofthe 3rd International Workshop on PIV, Santa Barbara, California, USA, 16-18 September.
R. Dong, S. Chu, and J. Katz (1992a). Quantitative visualization of the flow within the volute of a centrifugal pump.Part A: Technique. J. Fluids Engng., 114, 390-395.
R. Dong, S. Chu, and J. Katz (1992b). Quantitative visualization of the flow within the volute of a centrifugal pump.Part B: Results and analysis. J. Fluids Engng., 114, 396-403.
D. Eckardt (1976). Detailed flow investigations within a high-speed centrifugal compressor impeller. J. FluidsEngng., 390-402, 1976.
K. Eisele, Z. Zhang, and M. Casey (1997). Flow analysis in a pump diffuser - Part 1: LDA and PTV measurementsof the unsteady flow. J. of Turbomachinery, 119, 968-977.
H. Fowler (1968). The distribution and stability of flow in a rotating channel. J. Eng. Power, 229-236.
R.D. Keane and R.J. Adrian (1999). Optimization of particle image velocimeters. Part I: Double pulsed systems.Meas. Sci. Technology, 1, 1202-1215.

11
M. Oldenburg and E. Pap (1996). Velocity measurements in the impeller and in the volute of a centrifugal pump byParticle Image Displacement Velocimetry. Proceedings of the 8th International Symposium on Applications ofLaser Techniques to Fluid Mechanics, pages 8.2.1-8.2.5.
M.P. Wernet (2000). Development of digital particle imaging velocimetry for use in turbomachinery. Exp. Fluids,28, 97-115.
J. Westerweel (1997). Fundamentals of digital particle image velocimetry. Meas. Sci. Technology, 8, 1379-1392.
J. Westerweel (1998). Effect of sensor geometry on the performance of PIV interrogation. Proceedings of the 9thInternational Symposium on Applications of Laser Techniques to Fluid Mechanics, pages 1.2.1-1.2.8.