
Optical investigation of electrical spin injection into semiconductors
Upload
khangminh22Category
view
0download
0
I
Investigation into the potential of MgSO4 for
interseasonal domestic thermochemical energy
storage
By
Daniel Mahon
Doctoral Thesis
Submitted in partial fulfillment of the requirements
for the award of
Doctor of Philosophy of Loughborough University
June 2018
© by Daniel Mahon 2018

II
I. Abstract
Approximately 26% of the UK’s primary energy consumption is used specifically for
Domestic Space Heating (DSH) and Domestic Hot Water (DHW) production [1]. The
majority of this, 88%, comes directly from gas and oil with only 2% coming from renewable
energy sources [1]. Decarbonising DSH and DHW represents a huge challenge for the UK’s
government which is targeting a reduction of CO2 emissions of 80% by 2050 [2].
The amount of energy utilised from renewable sources can be increased by effective
Thermal Energy Storage (TES). In a domestic environment thermal energy is typically
required when the energy supplied from renewable sources is low (i.e. thermal energy
demand is high in the winter and low in the summer), interseasonal Thermochemical Energy
Storage (TCES) offers a solution to this problem. TCES has the ability to store thermal
energy from the summer months within chemical bonds and release the stored heat when
required with heat losses of only around 15%.
Magnesium sulphate heptahydrate (MgSO4.7H2O) has the potential to store 2.8GJ/m3 of
energy, is a low cost, non-toxic, safe material that can be dehydrated to MgSO4.0.1H2O (fully
charged) at 150˚C making it suitable for domestic integration. Research has shown that when
MgSO4 is used for TCES it suffers from problematic issues such as agglomeration. However,
more research is needed to understand the characteristics of MgSO4 further, develop high
energy density TCES materials containing MgSO4 and to understand if MgSO4 should be
used within a domestic interseasonal TCES system on a large scale, which is the aim of this
research.
Throughout this research several thermal analysis devices were used to characterise
TCES materials. The devices used include a Differential Scanning Calorimeter (DSC),
Thermogravimetric Analyser (TGA), Residual Gas Analyser (RGA), Scanning Electron
Microscope (SEM), Energy Dispersive X-ray Spectrometer (EDX) and several custom built
laboratory experimental rigs.
MgSO4 and novel composite materials containing MgSO4 were characterised at a small
(10mg) scale to investigate their energy density and what impact the dehydration heating rate
and particle size had on the charging of MgSO4. The results have shown that MgSO4 has a
dehydration enthalpy of 1118J/g that is not impacted by the heating rate used.
III
MgSO4 was dehydrated and hydrated at a larger (100g+) scale and it was shown to have
significant agglomeration and permeability problems. To solve the problems caused when
using pure MgSO4 a novel sample preparation method to create TCES pellets from powdered
materials was developed. The novel pellet preparation methodology was optimised and the
results showed that the initial dehydration heating rate and preparation methodology used
(mix or impregnation) did have an impact on the TCES potential of the synthesised pellets.
A high energy density novel TCES material (ZMK) was synthesised and experimentally
tested. The ZMK had a dehydration enthalpy of 715J/g and a performance of 85%. The
dehydration enthalpy and TCES performance of 13X absorbent pellets were improved
through an ion exchange process.
A large scale (40kg) modular TCES experimental test rig was designed and built to test
TCES materials at a larger scale for experimental investigations into optimisation of efficient
charge and discharge cycles.
This research shows the future potential of interseasonal domestic TCES through
experimental results. Novel composite energy dense TCES materials containing MgSO4 have
been shown to have potential for larger scale testing. Future work is required to optimise the
novel ZMK material developed and also test TCES materials at a larger scale to understand
the associated scaling losses of TCES materials and understand better their role in future
domestic TES systems.
IV
II. Table of contents
I. Abstract ...................................................................................................................... II
II. Table of contents ....................................................................................................... IV
III. List of tables .......................................................................................................... XI
IV. List of figures...................................................................................................... XIII
V. Nomenclature ..................................................................................................... XXIII
VI. List of symbols ..................................................................................................... XXV
VII. Acknowledgements ......................................................................................... XXVI
1 Chapter 1 - Introduction .............................................................................................. 1
2 Chapter 2 - Literature Review ..................................................................................... 6
2.1 Introduction to the literature review .................................................................... 6
2.1.1 Social cost of CO2............................................................................................ 6
2.1.2 Flooding due to increased atmospheric Green House Gases (GHG) ............... 6
2.1.3 Energy sources and energy linked problems .................................................. 11
2.1.4 Thermal energy storage .................................................................................. 14
2.1.5 Sorption and chemical energy storage terminology ....................................... 15
2.2 The reason TCES has potential for domestic interseasonal thermal energy
storage 18
2.3 Possible domestic TCES material candidates .................................................... 20
2.3.1 Summary of possible TCES material candidates ........................................... 22
2.4 The characteristics of MgSO4 for TES .............................................................. 22
V
2.4.1 The dehydration of MgSO4 ............................................................................ 22
2.4.2 The hydration of MgSO4 ................................................................................ 27
2.4.3 Summary of MgSO4 characteristics section ................................................... 34
2.5 Promising host materials for TCES ................................................................... 34
2.5.1 Zeolites ........................................................................................................... 35
2.5.2 The structure of zeolites ................................................................................. 35
2.5.3 Attapulgite and vermiculite for use as TCES materials ................................. 44
2.5.4 Carbon fibres and activated carbons for use as TCES materials .................... 45
2.5.5 Silica gel for use as a TCES material ............................................................. 45
2.5.6 Summary of promising host materials for TCES ........................................... 48
2.6 Sample preparation methodologies for creating TCES materials ...................... 49
2.6.1 Monoliths and bricks for TCES ..................................................................... 49
2.6.2 Beads for TCES .............................................................................................. 49
2.6.3 Honeycombs for TCES .................................................................................. 52
2.7 Possible ways to create composite materials ..................................................... 54
2.7.1 Simple mixture for creating TCES composite materials ................................ 54
2.7.2 Impregnation for creating TCES composite materials ................................... 54
2.7.3 Mixture or impregnation and consolidation for creating TCES composite
materials 54
2.7.4 Summary of the different preparation methodologies discussed ................... 55
2.8 Reactor designs and theory for TCES ................................................................ 55
2.8.1 Reactor design theory for TCES .................................................................... 55
VI
2.8.2 Reactor designs for TCES .............................................................................. 59
2.8.3 Summary of discussed potential reactor designs for TCES ........................... 62
2.9 Larger scale experimental results of TCES systems .......................................... 63
2.9.1 Summary of the large scale experimental results of TCES systems .............. 64
2.10 Conclusions of this literature review ................................................................. 65
3 Chapter 3 - Methodology .......................................................................................... 66
3.1 Introduction to the methodology ........................................................................ 66
3.2 Methodology used for the ~10mg scale tests of the TCES materials ................ 67
3.2.1 Small hydration chamber – Hydration of DSC, TGA + RGA and SEM+EDX
samples 67
3.2.2 DSC dehydration enthalpy analysis methodology ......................................... 71
3.2.3 TGA (+ RGA) mass loss methodology .......................................................... 75
3.2.4 SEM + EDX analysis methodology ............................................................... 81
3.2.5 Nitrogen vapour sorption testing methodology .............................................. 85
3.3 200g Scale testing of the TCES materials.......................................................... 89
3.3.1 Custom built 200g dehydration hydration chamber. ...................................... 89
3.3.2 Bulk density measurements ............................................................................ 92
3.4 Sample preparation methodology ...................................................................... 94
3.4.1 Introduction to the sample preparation methodology .................................... 94
3.4.2 Incipient wetness impregnation method ......................................................... 94
3.4.3 Modified wetness impregnation method ........................................................ 95
3.4.4 Ion exchange methodology for the 13x pellets .............................................. 96
VII
3.4.5 Pellet creation from powders using the pellet press ....................................... 97
3.5 Summary of methodology chapter ..................................................................... 99
4 Chapter 4 – Characterization of MgSO4, zeolite-Y and composite materials ......... 100
4.1 Initial DSC, TGA and RGA characterization of MgSO4.7H2O ....................... 100
4.2 MgSO4.7H2O heating rate effects and cycle stability investigations ............... 101
4.2.1 Sudden dehydration peaks from MgSO4.xH2O with high heating rates ...... 101
4.2.2 Using lower temperatures for the dehydration of MgSO4............................ 103
4.2.3 Structural changes of MgSO4 following de/hydration cycles ...................... 104
4.2.4 High hydration levels of MgSO4 using 1.3kPa pH2O .................................. 105
4.2.5 Heating rate effect on the cycle stability and dehydration enthalpy of MgSO4
106
4.2.6 Slow kinetics of MgSO4 ............................................................................... 110
4.3 Zeolite cycle stability investigations ................................................................ 110
4.3.1 Thermal storage potential of zeolite-Y......................................................... 111
4.4 Composite TCES materials analysis ................................................................ 112
4.4.1 Composite TCES materials enthalpy analysis ............................................. 112
4.4.2 Composite TCES materials dehydration heating rate effects ....................... 115
4.5 Nitrogen vapour sorption measurements ......................................................... 117
4.6 Introduction to further slow kinetics tests ........................................................ 120
4.6.1 MgSO4-90˚C slow kinetics analysis ............................................................. 122
4.6.2 MgSO4-150˚C-75%RH slow kinetics measurements .................................. 126
4.6.3 MgSO4 dehydration enthalpy analysis without an isothermal period .......... 127
VIII
4.6.4 MgSO4 particle size effect on slow kinetics................................................. 130
4.7 Conclusions from chapter 4 ............................................................................. 136
4.7.1 Slow kinetics section conclusions ................................................................ 137
5 Chapter 5 – Understanding the larger scale (100g+) characteristics of MgSO4 and
investigating sample preparation methods for MgSO4 for use as a TCES material. ............. 139
5.1 Introduction to chapter 5 .................................................................................. 139
5.2 Issues using MgSO4 and zeolite as TCES materials ........................................ 139
5.2.1 MgSO4 agglomeration issues ....................................................................... 139
5.2.2 MgSO4 permeability issues .......................................................................... 141
5.2.3 Zeolite permeability issues ........................................................................... 145
5.3 Initial investigations into sample preparation methodologies ......................... 146
5.3.1 Investigation into the potential of using a pelletizing disc for TCES sample
preparation 146
5.3.2 Investigation into the potential of hand rolling beads for TCES sample
preparation 149
5.3.3 Investigation into the potential of using a pellet press for TCES sample
preparation 150
5.4 Conclusions of chapter 5 .................................................................................. 162
6 Chapter 6 - Investigation into potential host materials for impregnating with MgSO4
163
6.1 Introduction to chapter 6 .................................................................................. 163
6.2 13x pellet investigation results......................................................................... 164
IX
6.2.1 Comparison of 13x powder, 13x pellets and zeolite-Y powder absorbents . 164
6.2.2 Comparison of 13x materials with different absorbed quantities of MgSO4
prepared using the wetness impregnation method .......................................................... 166
6.2.3 Analysis of DSC plots for composite 13x + MgSO4 materials to determine
cause of lower than expected dehydration enthalpies .................................................... 167
6.2.4 200g dehydration/hydration cycle testing results of the 13x materials and
ZMK 169
6.2.5 Comparison of dehydration/hydration cycle results from theory, DSC
measurements and 200g sample size measurements ...................................................... 170
6.2.6 Theoretical dehydration enthalpy, excluding MgSO4.xH2O enthalpy,
compared to DSC and 200g sample measured tests ....................................................... 171
6.3 13x Mg2+
ion exchange pellet testing results ................................................... 172
6.3.1 SEM and EDX analysis of 13x ion exchanged pellets ................................. 174
6.4 Additional potential host materials for MgSO4 ............................................... 177
6.4.1 Activated Alumina measurements ............................................................... 178
6.4.2 Activated Carbon measurements .................................................................. 183
6.5 Conclusions of chapter 6 .................................................................................. 187
7 Large scale testing of TCES materials .................................................................... 189
7.1 Introduction and purpose of the custom built modular 40kg rig ..................... 189
7.2 Custom built modular 40kg rig system design ................................................ 190
7.2.1 Arduino microcontroller control of the custom built modular 40kg rig ...... 191

X
7.3 Experimental operating procedure for the custom built modular 40kg rig
methodology ....................................................................................................................... 192
7.3.1 Default microcontroller data logger program of the custom built modular
40kg rig 193
7.3.2 Data collection for the custom built modular 40kg rig ................................ 193
7.4 Conclusions from the custom built 40kg reactor design .................................. 194
8 Thesis conclusions................................................................................................... 195
8.1 Conclusions from Chapter 4 – Characterisation of MgSO4, zeolite-Y and
composite materials ............................................................................................................ 195
8.2 Conclusions from chapter 5 - Understanding the larger scale (100g+)
characteristics of MgSO4 and investigation of sample preparation methods for MgSO4 for
use as a TCES material....................................................................................................... 196
8.3 Conclusions from chapter 6 - Investigation into potential host materials for
impregnating with MgSO4 ................................................................................................. 197
8.4 Conclusions from chapter 7 - Large scale testing of TCES materials ............. 198
9 Recommendations for future work .......................................................................... 199
9.1 Identified future work from chapter 4 .............................................................. 200
9.2 Identified future work from chapter 5 .............................................................. 200
9.3 Identified future work from chapter 6 .............................................................. 200
9.4 Identified future work from chapter 7 .............................................................. 201
10 Research .................................................................................................................. 202
11 References ............................................................................................................... 203

XI
XII
III. List of tables
Table 2-1 Comparison of different TES mechanisms based on various performance
factors [22] ............................................................................................................................... 19
Table 2-2 Promising materials for thermochemical energy storage [22] .......................... 20
Table 2-3 Important thermodynamic characteristics of candidate salt hydrates after
dehydration under a water partial vapour pressure (pH2O = 21mbar, 105˚C) (references in
table refer to references within the paper by N’Tsoukpoe et al. [45]). .................................... 21
Table 2-4 Energy densities and prices of selected salt hydrates for use as TCES materials
[24] ........................................................................................................................................... 22
Table 2-5 Variables used and delta T achieved in 6 hydration experiments of MgSO4
monohydrate [54]. .................................................................................................................... 31
Table 2-6 Comparison of the specific heat storage density of absorbent materials
compared to the heat capacity of water at different temperatures [92] .................................... 46
Table 2-7 Advantages and disadvantaged of absorbent host materials ............................. 48
Table 2-8 Comparison of the desorption capacities in g/g of binderless and ordinary
zeolite types A and X [77] ....................................................................................................... 49
Table 2-9 Advantages and disadvantages of the different composite preparation methods
.................................................................................................................................................. 55
Table 3-1 Example EDX data showing elemental analysis of 13x pellets ........................ 84
Table 3-2 Normalised Mg and Na EDX example for 13x pellets ...................................... 84
Table 3-3 Numerical values used for heat output calculations .......................................... 91
Table 3-4 The amounts of MgSO4 added in each impregnated 13x pellet. ....................... 95
Table 4-1 Average dehydration enthalpy compared to the maximum dehydration
temperature for MgSO4.xH2O. ............................................................................................... 104

XIII
Table 4-2 Enthalpy data showing dehydration enthalpy (after a 150ᵒC dehydration) and
cycle stability of MgSO4 ........................................................................................................ 106
Table 4-3 Description of the different particles of MgSO4.7H2O used ........................... 130
Table 6-1 DSC determined averaged enthalpies of absorbent zeolite materials over the
temperature range of 20 - 150˚C ............................................................................................ 165
Table 6-2 Calculated theoretical dehydration enthalpies for samples, not accounting for
the MgSO4.xH2O dehydration enthalpy, compared to the measured DSC and 200g enthalpy
results over the temperature range 20-150˚C. ........................................................................ 172
Table 6-3 DSC and TGA Energy output of AA samples ................................................. 182
Table 6-4 200g Energy output of AA samples ................................................................ 183
Table 6-5 A summary of the results from the AC and AC+MgSO4 DSC and TGA analysis
................................................................................................................................................ 186
XIV
IV. List of figures
Figure 2-1 Topographic map of London [6] ........................................................................ 7
Figure 2-2 Temperature predictions for SRES scenarios and the RCP’s [10] ..................... 9
Figure 2-3 Diagram showing sources of energy for production and storage [14] ............. 11
Figure 2-4 Final energy consumption (EU-28), 2015 [15]. ............................................... 13
Figure 2-5 Energy consumption in EU households for 2016 [16] .................................... 13
Figure 2-6 Energy density with temperature of different energy storage materials [29] ... 15
Figure 2-7 Chemical and sorption energy storage classification [29] ............................... 17
Figure 2-8 An indication of volume of storage material needed to store 6.7GJ/year of
thermal energy for an average household [24] ........................................................................ 18
Figure 2-9 The screening process used for the salt hydrates assessed by N’Tsoukpoe et al.
[45] ........................................................................................................................................... 21
Figure 2-10 TGA mass loss data and DSC enthalpy measurements for the dehydration of
MgSO4.7H2O [50] .................................................................................................................... 23
Figure 2-11 TGA mass loss measurements for the dehydration of MgSO4.7H2O [23] ..... 23
Figure 2-12 The changing XRD diffraction patterns of MgSO4.7H2O as it is dehydrated
[51] ........................................................................................................................................... 24
Figure 2-13 TGA measurements showing the mass loss of a zeolite and three zeolite +
MgSO4 composite materials [23] ............................................................................................. 25
Figure 2-14 SEM images of MgSO4.7H2O before (a) after dehydration (b) and after
rehydration (C) [50] ................................................................................................................. 25
Figure 2-15 DSC dehydration measurements of MgSO4 ᵒ 7H2O. Squares and triangles
represent particles of size (20-38µm) and (200-500µm) respectively [50] ............................. 27
Figure 2-16 TGA & DSC hydration measurements of MgSO4 with varying particle sizes
[50] ........................................................................................................................................... 28
XV
Figure 2-17 Micrographs of the hydration of NaSO4 at 92% RH and 23˚C after 2 hours
(a), 3 hours (b) and 6 hours (c). Red arrows point to NaSO4 green arrows to NaSO4.10H2O
and blue arrows to Na2SO2 (aq) [46] ....................................................................................... 29
Figure 2-18 Simultaneous Thermal Analysis (STA) measurements showing the water
uptake of MgSO4 as it is hydrated under different conditions [50] ......................................... 30
Figure 2-19 Equilibrium curves for the hydration of MgSO4 [54] .................................... 30
Figure 2-20 Water uptake hydration curves for MgSO4 against time with different
hydration humidity’s (Red lines = below DRH of MgSO4.H2O, Blue lines = above DRH of
MgSO4.H2O, green lines = above DRH of MgSO4.6H2O, light blue lines = above DRH of
MgSO4.7H2O) [46]. ................................................................................................................. 32
Figure 2-21 TGA & exothermic DSC hydration measurements for MgSO4 showing the
heat output with varying layer thickness [50] .......................................................................... 33
Figure 2-22 Experimental hydration measurements of zeolite/MgSO4 [23] ...................... 34
Figure 2-23 Zeolite Structures - Image 1 shows the sodalite cage (β-cage), image 2 shows
the unit cell of zeolite A, image 3 the unit cell of zeolite X and Y, image 4 the ion exchange
sites on zeolite A and image 5 the ion exchange sites on zeolite X and Y [71] ...................... 36
Figure 2-24 Diagram showing the building blocks of different zeolite structures [68] ..... 37
Figure 2-25 3-D representation of zeolite A (left) and Zeolite X and Y (right) showing
their cage structure [73] ........................................................................................................... 38
Figure 2-26 DSC-TGA measurements of various tested zeolite impregnated composites
(H-Y, Na-Y, MOR and Na-X from top left to bottom right) [48]. .......................................... 39
Figure 2-27 Pore size against amount of water uptake in porous glass impregnated with
MgSO4 [46] .............................................................................................................................. 40
Figure 2-28 Temperature lift measurements of the hydration of various composite
materials- SM16 = silica gel/MgSO4, ZM15 – zeolite/MgSO4[23] ......................................... 41
XVI
Figure 2-29 Amount of water absorbed vs. Mg ion exchange degree for Zeolite NaA and
NaA .......................................................................................................................................... 42
Figure 2-30 Measurements showing how salt content affects the heat of sorption of the
impregnated material [49] ........................................................................................................ 44
Figure 2-31 Effects of CaCl2 concentration on the dynamic sorption characteristics of
water on composite sorbents showing the absorbed amounts [42] .......................................... 46
Figure 2-32 Moisture vapour sorption isotherms for the selective materials studied SIM-
2a = silica gel + CaCl2, SIM-3a = Vermiculite + CaCl2. [36] .................................................. 47
Figure 2-33 An example pelletizing disc (letters A, B, C and D represent locations of
where nozzles are located on this specific pelletizing disc). [101] .......................................... 52
Figure 2-34 Inlet and outlet change in temperature with time for different honeycomb
filters [103]............................................................................................................................... 53
Figure 2-35 The trends in pressure drop and bed height with superficial velocity for a
fluidised bed reactor (A = part of the curve where the Ergun equation can be used to describe
the increasing pressure drop with increasing velocity, B = bed starts to expand while pressure
drop remains constant. The force on the particles balances the net weight of the particles and
separation of the particles begins, C = bed expands further but pressure drop remains
constant, D = bed decreases with velocity but pressure drop remains constant, E = after the
velocity is decreased below the superficial velocity the bed height remains constant but the
pressure drop decreases with velocity. The bed height is higher than the original bed height
after fluidization due to the particles becoming less packed, if left alone, over time the
particles will return to the packed bed height.) [107] .............................................................. 57
Figure 2-36 The different types of fluidisation [108] ........................................................ 58
Figure 2-37 Powder classification diagram for fluidization by air [109] .......................... 59
Figure 2-38 Charging and discharging diagrams of a zeolite system, respectively [110] . 60

XVII
Figure 2-39 Integrated reactor design(left), Closed separate reactor design (right) [86] . 61
Figure 2-40 Three possible reactor designs for the use of powdered TCESM (screw
reactor, fluidized bed reactor, gravity assisted bulkflow reactor) [86]. ................................... 61
Figure 2-41 Reactor size against four constraints: dehydration time, hydration time,
power output (of a screw reactor) and heat transfer (of a screw reactor) [86]. ........................ 62
Figure 2-42 Modular thermochemical reactor design (left) Central reactor with vessel
design (right) [112] .................................................................................................................. 62
Figure 2-43 Novel salt hydrate tray reactor system [113] ................................................. 63
Figure 2-44 Open sorption drum reactor [114] .................................................................. 64
Figure 3-1 A schematic diagram of the small hydration chamber system ......................... 69
Figure 3-2 Example DSC temperature profile program .................................................... 73
Figure 3-3 TA instruments discovery TGA balance [122] ................................................ 76
Figure 3-4 TGA Temperature Profile ................................................................................ 79
Figure 3-5 An example overlay of DSC, RGA and TGA data, showing the dehydration of
MgSO4.7H2O ........................................................................................................................... 80
Figure 3-6 Image 1: Example EDX dot analysis, Image 2: Composition from dot analysis,
Image 3: Example of an EDX atomic spectrum from the dot analysis. ................................... 83
Figure 3-7 Types of adsorption isotherms [129] ................................................................ 87
Figure 3-8 200g dehydration hydration setup .................................................................... 90
Figure 4-1 MgSO4.7H2O dehydration to 300°C overlay showing measurements from
TGA, RGA and DSC showing the dehydration process ........................................................ 101
Figure 4-2 DSC measurements for several heating rates, showing volatile behaviour with
increasing heating rates. ......................................................................................................... 102
Figure 4-3 Ion current as a function of temperature for MgSO4.7H2O at 4 different
heating rates ........................................................................................................................... 102
XVIII
Figure 4-4 TGA dehydration measurements for MgSO4.xH2O dehydrated with several
heating rates and isothermal periods, showing little difference in mass loss between
dehydration temperatures of 110˚C and 150˚C. ..................................................................... 103
Figure 4-5 SEM Images of MgSO4 after dehydration with different heating rates and
images of MgSO4 after rehydration ....................................................................................... 105
Figure 4-6 TGA measurements showing cycle stability of MgSO4 using a 1˚C/min heating
rate.......................................................................................................................................... 107
Figure 4-7 TGA measurements showing cycle stability of MgSO4 using a 5˚C/min heating
rate.......................................................................................................................................... 108
Figure 4-8 TGA measurements showing cycle stability of MgSO4 using a 10˚C/min
heating rate ............................................................................................................................. 108
Figure 4-9 DSC measurements showing cycle stability of MgSO4 using a 1˚C/min heating
rate.......................................................................................................................................... 109
Figure 4-10 DSC measurements showing cycle stability of MgSO4 using a 5˚C/min
heating rate ............................................................................................................................. 109
Figure 4-11 DSC measurements showing cycle stability of MgSO4 using a 10˚C/min
heating rate ............................................................................................................................. 110
Figure 4-12 DSC measurements used for evaluating the dehydration enthalpy of hydrated
zeolite-Y ................................................................................................................................. 112
Figure 4-13 DSC dehydration measurements for the hydrated composite materials ...... 113
Figure 4-14 Achieved dehydration enthalpy for each composite material. ..................... 113
Figure 4-15 Dehydration enthalpy and performance of composite materials and zeolite-Y
................................................................................................................................................ 114
Figure 4-16 TGA dehydration measurements for the composite materials ..................... 115
Figure 4-17 DSC dehydration measurements for the 35wt% composite sample ............ 116
XIX
Figure 4-18 Differential TGA dehydration data for 35wt% composite sample .............. 116
Figure 4-19 Comparison of slow kinetics of each composite sample. ............................ 117
Figure 4-20 Cumulative pore volume of each composite sample, zeolite-Y and MgSO4
................................................................................................................................................ 119
Figure 4-21 BET surface area and average pore diameter of each composite sample,
zeolite-Y and MgSO4 ............................................................................................................. 119
Figure 4-22 Cumulative pore volume against pore diameter of MgSO4, zeolite-Y and the
composite materials ............................................................................................................... 120
Figure 4-23 Illustration of an example isotherm enthalpy analysis conducted on a sample
dehydrated to 90°C ................................................................................................................ 122
Figure 4-24 Enthalpy analysis for each of the heating rates tested .................................. 123
Figure 4-25 Isotherm enthalpy for each of the MgSO4.xH2O samples when dehydrated to
90°C at different heating rates ............................................................................................... 123
Figure 4-26 Mass loss of MgSO4.xH2O against cycle number with different dehydration
heating rates ........................................................................................................................... 124
Figure 4-27 Enthalpy per mass loss for each MgSO4.xH2O sample dehydrated with
different heating rates ............................................................................................................ 124
Figure 4-28 Isothermal mass loss % of the MgSO4.xH2O samples dehydrated with
different heating rates ............................................................................................................ 125
Figure 4-29 Total average enthalpy values for MgSO4.xH2O dehydrated with different
heating rates ........................................................................................................................... 126
Figure 4-30 Percentage isothermal enthalpy is of total dehydration enthalpy for MgSO4
samples dehydrated to 150°C within the DSC ....................................................................... 127
Figure 4-31 Dehydration of MgSO4.7H2O to 90˚C with a heating rate of 1˚C/min and 5
minute isothermal period ....................................................................................................... 128

XX
Figure 4-32 Dehydration of MgSO4.7H2O to 90˚C with a heating rate of 5˚C/min and 5
minute isothermal period ....................................................................................................... 129
Figure 4-33 Dehydration of MgSO4.7H2O to 90˚C with a heating rate of 10˚C/min and 5
minute isothermal period ....................................................................................................... 129
Figure 4-34 Samples used for particle size tests – Images show each of the samples used.
Large, medium and small from left to right (see Table 4-3 for details of particles). ............. 130
Figure 4-35 DSC plots for the three different grain sizes dehydrated to 90°C with a
heating rate of 5°C/min. ......................................................................................................... 131
Figure 4-36 Average DSC enthalpy measurements for each grain size .......................... 132
Figure 4-37 Average TGA mass loss data for the different grain sizes ........................... 132
Figure 4-38 Enthalpy per % mass loss for each of the grain sizes (J/%) ......................... 133
Figure 4-39 Isothermal enthalpy for each grain size ....................................................... 134
Figure 4-40 Isothermal mass loss and isothermal mass loss % for small and medium/large
grain sizes............................................................................................................................... 134
Figure 4-41 TGA plots for small grain sizes showing the similar dehydration cycles for all
samples and runs .................................................................................................................... 135
Figure 4-42 TGA plots for larger grain sizes showing the similar dehydration cycles for
all samples except for the first dehydration cycle. ................................................................. 135
Figure 5-1 Image of MgSO4.7H2O in a beaker after a heating to 150˚C, with a 3h
isotherm, showing the solid structure which was formed ...................................................... 140
Figure 5-2 Ground MgSO4.xH2O in the reaction chamber after being heated to 150˚C . 141
Figure 5-3 MgSO4.xH2O after hydration in reactor showing agglomeration .................. 141
Figure 5-4 Image of empty plunger hydration chamber .................................................. 142
Figure 5-5 Delta T vs. time for the hydration of MgSO4 ................................................. 144
XXI
Figure 5-6 Stills from a video of MgSO4 hydration showing the fluidisation effect caused.
................................................................................................................................................ 145
Figure 5-7 Image of material in pelletizing disc showing the anticlockwise agglomerating
motion of particles into beads ................................................................................................ 147
Figure 5-8 Image of pellets created with the pelletizing disc .......................................... 148
Figure 5-9 Image of beads created with pelletizing disc after an oven bake at 150°C .... 148
Figure 5-10 Image of sausage rolling table (left) and sausage gun (right) ...................... 149
Figure 5-11 Three SEM images of the mix 1˚C/min pellets ............................................ 152
Figure 5-12 Three SEM images of the mix 5˚C/min pellets ............................................ 153
Figure 5-13 Three SEM images of the impreg 1˚C/min pellets....................................... 153
Figure 5-14 Three SEM images of the impreg 5˚C/min pellets....................................... 154
Figure 5-15 EDX elemental data for each of the different sample preparation methods 155
Figure 5-16 Total cumulative pore volume for each of the different preparation methods
................................................................................................................................................ 156
Figure 5-17 BET surface area and average pore diameter for each of the different
preparation methods ............................................................................................................... 156
Figure 5-18 DSC dehydration enthalpy and performance ratio for each sample preparation
method.................................................................................................................................... 158
Figure 5-19 DSC dehydration enthalpy and average pore size for each sample preparation
method.................................................................................................................................... 159
Figure 5-20 DSC dehydration enthalpy and 200g hydration enthalpy for each sample
preparation method ................................................................................................................ 160
Figure 5-21 DSC dehydration enthalpy and scaling losses for each sample preparation
method.................................................................................................................................... 161
XXII
Figure 5-22 200g hydration enthalpy and energy density for each sample preparation
method.................................................................................................................................... 161
Figure 6-1 DSC dehydration plots of zeolite-Y, 13x powder and 13x pellets showing the
dehydration enthalpy and sensible enthalpy. ......................................................................... 165
Figure 6-2 Graph showing average dehydration enthalpy, mass loss and predicted
dehydration enthalpy for 13x samples with different wt% of MgSO4 created using the
wetness impregnation method................................................................................................ 167
Figure 6-3 DSC plots showing the endothermic dehydration heat flow for 13x samples,
ZMK, 13xMK and MgSO4. ................................................................................................... 168
Figure 6-4 200g hydration tests Delta T (outlet air – inlet air temperature) output cycle
results for 13x pellets, 13xMK, 13x+MgSO4(12.9wt%) and ZMK ...................................... 170
Figure 6-5 Comparison of loss in performance percentage between tested samples at
different tested mass. ............................................................................................................. 171
Figure 6-6 DSC dehydration enthalpy and TGA dehydration mass loss results of 13x ion
exchanged pellets ................................................................................................................... 173
Figure 6-7 Sensible enthalpy and performance (dehydration enthalpy / total enthalpy) of
13x ion exchanged pellets ...................................................................................................... 174
Figure 6-8 EDX analysis of normalised Mg vs Na content of the internal structure of the
13x ion exchanged pellets ...................................................................................................... 175
Figure 6-9 EDX external surface analysis of normalised Mg vs Na content of the 13x ion
exchanged pellets ................................................................................................................... 176
Figure 6-10 SEM images of the 24 hour ion exchanged 13x pellets ............................... 177
Figure 6-11 DSC dehydration measurements of hydrated activated alumina ................. 178
Figure 6-12 Activated alumina DSC results when dehydrated to different temperatures179
XXIII
Figure 6-13 DSC dehydration results of activated alumina and activated alumina
impregnated with MgSO4 ...................................................................................................... 180
Figure 6-14 Comparison of AA and AA+MgSO4 dehydration enthalpy ........................ 181
Figure 6-15 TGA dehydration of AA showing differential weight with temperature ..... 181
Figure 6-16 24h 200g hydration results of AA ................................................................ 182
Figure 6-17 DSC dehydration measurements of activated carbon .................................. 183
Figure 6-18 TGA differential weight loss showing the dehydration of activated carbon 184
Figure 6-19 TGA differential weight loss showing the dehydration of activated carbon
over the temperature range of 30-67.5˚C ............................................................................... 185
Figure 6-20 DSC dehydration plots of activated carbon and activated carbon with 6.9wt%
of impregnated MgSO4.......................................................................................................... 186
Figure 7-1 Image of the 40kg modular reactor ................................................................ 191
Figure 7-2 Microcontroller data logger............................................................................ 192

XXIV
V. Nomenclature
AA Activated Alumina
AC Activated Carbon
BET Brunauer Emmett Teller
DHW Domestic Hot Water
DI Deionised
DRH Deliquescence Relative Humidity
DSC Differential Scanning Calorimeter
DSH Domestic Space Heating
EDX Energy Dispersive X-ray Spectrometer
FCC Fluid Catalytic Cracking
GHG Green House Gases
GMSLR Global Mean Sea Level Rise
IPCC Inter-governmental Panel on Climate Change
JRC Joint Research Centre
LTES Latent Thermal Energy Storage
MAC Marginal Abatement Cost
MET Meteorological office
PM Particulate Matter
RCP Representative Concentration Pathways

XXV
RGA Residual Gas Analyser
RH Relative Humidity
RPM Revolutions Per Minute
SCC Social Cost of Carbon
SEM Scanning Electron Microscope
SSA Specific Surface Area
STC Solar Thermal Collector
STES Sensible Thermal Energy Storage
TCES Thermochemical Energy Storage
TCESM Thermochemical Energy Storage Materials
TES Thermal Energy Storage
TGA Thermogravimetric Analyser
VFPC Vacuum Flat Plate Collector
WHO World Health Organization
WSS Wakkanai Siliceous Shale
XRD X-ray Diffraction
XXVI
VI. List of symbols
𝑄 Heat
𝑚 Mass
𝐶𝑝 Specific heat capacity
∆ Delta
𝐿 Latent heat
𝐻 Enthalpy
𝑇 Temperature
𝑆 Entropy
𝐺 Gibbs free energy
𝐾 Permeability
𝑛 Porosity
𝑑 Diameter of grains
𝑛𝑐𝑟 Critical revolutions per minute
𝐷 Disc diameter
∆𝐻𝑇 Total dehydration enthalpy
∆𝐻𝐷 Dehydration enthalpy
∆𝐻𝑆 Sensible enthalpy
𝑞𝑚 Monolayer capacity of the sample
𝜎 Surface area occupied by one molecule at analysis temperature
𝑁𝑎 Avogadro's number
𝐸𝑜𝑢𝑡 Energy out
𝑃 Power
�̇� Mass flow rate
𝜌 Density
𝑡0 Start time
𝑣 Volume

XXVII
VII. Acknowledgements
I would like to acknowledge both of my PhD supervisors Professor Philip Eames and Dr
Gianfranco Claudio for their continuous support of my PhD studies, guidance, motivation and
knowledge.
This work was supported in full by the UK Engineering and Physical Sciences Research
Council (EPSRC) (grant number: EP/K011847/1), i-STUTE and a Loughborough University
PhD studentship.

1
1 Chapter 1 - Introduction
Almost half of the UK’s energy consumption is used for heating purposes and 26% used
for Domestic Hot Water (DHW) and Domestic Space Heating (DSH). The issue with DHW
and DSH in the UK is currently almost all of the energy comes from fossil fuels (88% from
gas and oil) [1]. For this reason DSH and DHW energy sources need to be sourced from
cleaner and ideally renewable energy sources if the UK is to meet its 2050 goal of an 80%
reduction of CO2 emissions [2].
The sun delivers enough energy to the earth in one hour than the whole of humanity uses
in an entire year. The energy the sun delivers to the earth is referred to as solar energy. An
issue in the UK, and most of the world, is typically solar irradiance is high when demand for
DSH and DHW is low. For example, in the summer times the UK’s demand for DSH and
DHW is low however; the incoming solar irradiance is typically at its highest. Currently, this
results in a lot of unutilized solar thermal energy from the incoming day time solar irradiance.
To bridge the offset between supply and demand a Thermal Energy Storage (TES)
mechanism should be utilized. The large amount of unutilized day time solar thermal energy
should be stored ready for use when demand is high and supply is low (i.e. evening times). If
done successfully this would reduce the need for the current typical energy sources used (i.e.
fossil fuels) to supply thermal energy in times of demand. Storing thermal energy from the
sun ready for later use offers a solution to help decarbonise DSH and DHW. In the UK the
demand for DSH and DHW is highest in the winter months and lowest in the summer
months.
TES has the potential to store the unutilized day time solar irradiance as thermal energy
and then release the thermal energy when required on demand. Using this method there is no
need to convert and store the solar thermal energy as a different energy source (i.e. electrical
or mechanical) for it to be used later as thermal energy thus, reducing the energy losses
through conversion.
There are three main types of thermal energy storage, Sensible Thermal Energy Storage
(STES), Latent Thermal Energy Storage (LTES) and Thermochemical Energy Storage
(TCES). STES stores heat by increasing the temperature of a material (i.e. rocks). This TES

2
method suffers from large thermal losses making it suitable for short term TES and not
suitable for long term TES (i.e. interseasonal TES).
LTES stores thermal energy within a material but also takes advantage of the large
amounts of energy required for phase transitions of materials (i.e. the melting of a wax).
LTES keeps the material in a phase-changed state while storing the thermal energy. When the
thermal energy is required the LTES material reduces in temperature causing a phase
transition which releases the stored latent heat. LTES typically has a higher energy density
than STES however, it suffers from heat losses making this technology short term and again
not suitable for interseasonal thermal energy storage.
TCES stores thermal energy as chemical potential energy. A material is heated to a
temperature causing it to break into working reactants. These reactants are stored separate
from one another to store the thermal energy. When the thermal energy is required the
reactants are recombined causing a chemical reaction, which releases the stored thermal
energy. As the thermal energy is stored in chemical bonds TCES only suffers from sensible
enthalpy losses when the energy is stored, which typically accounts for 10-15% of the total
energy input to the TCES material (i.e. assuming a domestic interseasonal storage system
where all of the sensible heat is lost). Once the thermal energy is stored and the sensible
enthalpy is lost there are no further energy losses, meaning this technology is suitable for
interseasonal TES.
TCES materials can be classified as physisorption or chemisorption materials.
Physisorption refers to a process where a sorbate bonds to the surface of or within the bulk of
a sorbent. This process typically involves Van der Waals forces and as a result this process
typically has the weakest formed bonds with the lowest energy density. Chemisorption
involves the process of a sorbate bonding with the bulk of a sorbent and involves stronger
bonds such as covalent and ionic bonding. The stronger bonds result in a higher energy
density material. These classifications are explained in more detail in Chapter 2 – Literature
Review.
Within composite TCES materials there are typically several different physical processes
taking place including adsorption and absorption meaning throughout this work the materials
are all referred to as TCES materials.
3
If a TCES material is to be used in a domestic environment for DSH and DHW it needs to
meet specific requirements. First the TCES material is required to have a reversible chemical
reaction making it suitable for multiple energy storage cycles. The materials need to be safe
and non-toxic to humans as they are to be integrated into a domestic environment. It is
assumed that the TCES materials will be charged using a Solar Thermal Collector (STC) and
hence, the maximum charging temperature for the TCES materials is required to be around
150°C. Also, the materials used need to be energy dense and cost effective to ensure they are
an attractive technology and competitive with current energy sources for DSH and DHW.
There are two types of TCES reactor systems, open and closed. Each of these two
systems can be further classified as integrated or separate making a total of four different
reactor types. Each type of reactor has advantages and disadvantages which make them
suitable for different applications. Separate and integrated reactors refer to where the TCES
materials are stored and reacted. For an integrated reactor the materials are stored within the
same location to where the reaction takes place (i.e. no transportation of chemicals is
required). A separate reactor stores the chemicals in a location different to where the reaction
takes place (i.e. the chemicals have to be transported to enable the reaction to take place). A
closed system does not involve any materials entering or leaving the system where as an open
system does involve chemicals leaving and entering the system. An example of an open
integrated system would involve using outside humid air pumped into an absorbent packed
bed of material causing a hydration reaction to take place.
There are advantages and disadvantages with each type of reactor configuration, which
will be explained in more detail in Chapter 2 – Literature Review of this thesis. However, the
research conducted in this thesis uses an open integrated reactor system due to the simplicity
of the reactor and the suitability for the domestic environment.
A chemical, which meets the specifications required of a domestic TCES material, is
MgSO4.xH2O. MgSO4.xH2O is a salt hydrate and is used for many different purposes
including bath salts. This material is non-toxic, cost effective (£61/ton), can be charged at
150°C and reacts with water resulting in a theoretical energy output of 2.8GJ/m3. However,
recent research has shown that there are some practical problems when using MgSO4 for
domestic TCES. These problems include i) agglomeration upon rehydration (discharging)
which results in a low vapour transportation throughout the material, reduced energy and
power output ii) cycle stability issues.
4
Recently there have been studies which attempt to take advantage of the high energy
density of MgSO4 while alleviating its issues. Research conducted has looked at the
impregnation of MgSO4 into porous host materials. This impregnation is done to spread the
MgSO4 over a thin surface within a porous host material to reduce agglomeration and
increase vapour transportation. For example, zeolites have recently been used as host
materials for salt hydrates. Zeolites are crystalline materials which have large surface areas
and are typically very porous.
There has been recent research which investigates the potential of MgSO4 composite
TCES materials. However, no material has been developed which meets all of the required
specifications and has an energy density large enough to be an economically feasible option
for integration into a domestic system. Therefore, more research is needed in the
development of MgSO4 composite TCES materials.
The aim of this thesis was to research the potential of MgSO4 and develop a composite
material which could take advantage of the high energy density of MgSO4 and have a final
energy density large enough to be competitive with current energy sources used for DSH and
DHW.
This research investigated novel host materials and novel methods to develop composite
TCES materials. The potential of improving host materials ready for MgSO4 impregnation
was investigated.
The thesis was structured so that the following chapter builds upon the questions or issues
raised by the previous one.
Chapter 2 presents a review of the current literature concerning domestic TCES,
presenting the potential of using MgSO4 for domestic TCES but also the issues and areas that
need to be researched further.
Chapter 3 presents the methodology used throughout this thesis for conducting all of the
experimental and analytical work.
Chapter 4 presents experimental research carried out on a small scale (10mg) with
MgSO4 zeolite-Y and composite materials consisting of zeolite-Y and MgSO4. This research
used many thermal analysis devices including a Differential Scanning Calorimeter (DSC),
5
Thermogravimetric Analyser (TGA), Residual Gas Analyser (RGA), Scanning Electron
Microscope (SEM) and Energy Dispersive X-ray spectrometer (EDX). The research in this
chapter was important for identifying some of the issues while also highlighting the potential
of both pure MgSO4 and composite materials comprised of MgSO4 and zeolite-Y.
Chapter 5 investigated the potential of TCES materials being utilized at a scale larger than
10mg. If TCES + STC systems are to be realized TCES materials need to be tested on a
larger more practical scale as the issues on a larger (100g+) scale may be completely different
and new relative to the issues on a small (10mg) scale. Chapter 5 first presents the problems
when using pure MgSO4 at a larger scale (on the order of 10’s of grams). Once it was
established that the application of pure MgSO4 within an open integrated TCES reactor
system for domestic use was problematic sample preparation investigations were conducted.
The investigations highlighted one potential method of producing composite TCES pellets.
Next this chapter carried out experiments to optimise the methodology for producing these
novel pellets.
Chapter 6 explored the possibility of using the developed methodology in chapter 5 to
produce high energy density TCES materials with the use of zeolite-Y and 13X molecular
sieves. The results from 13x molecular sieve composite materials were unexpected. These
results lead to the investigations of modifying 13x molecular sieves using an ion exchange
process to increase the energy density of 13x molecular sieves for domestic TCES. This
chapter also considered other methods to create large scale batches of TCES composite
materials with the use of activated alumina beads and activated carbon pellets as host
materials for MgSO4.
Chapter 7 describes a designed and built large scale custom 40kg modular TCES test rig.
This test rig should experimental enable work to be conducted into the optimisation of
efficient charge and discharging of a TCES material store at a large scale using a novel
reactor.
Chapter 8 presents the conclusions from the research presented within this thesis.
Chapter 9 presents recommendations for future work.

6
2 Chapter 2 - Literature Review
2.1 Introduction to the literature review
Throughout this chapter key concepts and literature for the field of domestic
thermochemical energy storage are explored and explained. The purpose of this chapter is to
give sufficient background knowledge as well as highlight the key research in the field and
highlight areas for future research.
2.1.1 Social cost of CO2
The social cost of CO2 is the societal cost of each additional ton of CO2 which is emitted
into the environment [3]. The cost is the sum of all the damage caused by the CO2 over its
lifetime in the atmosphere [4]. This cost is not localized to a region or country because the
impact or damage to the climate from CO2 emissions has a worldwide impact.
2.1.2 Flooding due to increased atmospheric Green House Gases (GHG)
Increased CO2 emissions will lead to a Global Mean Sea Level Rise (GMSLR).
According to the Inter-governmental Panel on Climate Change (IPCC) a likely range of
GMSLR for 2081-2100 is 0.4m (0.26-0.55) and 0.63m (0.45-0.82) for RCP2.6 and RCP8.5,
respectively (i.e. RCP’s are Representative Concentration Pathways which, are possible
according to the IPCC, and are used for modelling climate changes due to greenhouse gas
emissions (see Figure 2-2). Due to the elevation of London being very low in some areas (see
Figure 2-1), flooding is a real problem for the city. If a GMSLR of 0.5m is seen then it is
predicted that London’s sea defences and the Thames barrier would be breached on average
once every 100 years [5]. If a GMSLR of 1.0m is seen then the flood protection in London
would be breached on average once every 10 years [5].

7
Figure 2-1 Topographic map of London [6]
The UK climate change risk assessment published in 2012 states that the annual cost of
flooding in England and Wales is projected to increase from the current value of £1.2 billion
to £1.6-£6.8 billion by the 2050s and £2.1-£12 billion by 2080s [7]. The purpose of that
report, published in 2012, was to examine the potential changes to flooding and coastal
erosion risk as a result of climate change [7]. Flooding is one potential issue and associated
social cost of increased CO2 emissions.
2.1.2.1 Uncertainty in the Social Cost of Carbon (SCC)
The Social Cost of Carbon (SCC) is a relatively new consideration in the global move to
reduce CO2 emissions. The SCC is used to allow governments to evaluate the benefits and
drawbacks of implementing different energy technologies which reduce or emit GHG’s.
The cost of carbon to the end user typically does not include the cost of damage that
carbon has on the environment which ultimately has to be paid by the government (i.e. no
carbon tax). If the cost of carbon included the SCC it would likely result in a reduction in the
consumption of carbon fuel sources [3]. If there is a reduction in carbon emissions the
damage caused by carbon emissions would be reduced meaning the UK government would
save money. If a carbon tax was put in place the revenue created could be used to prevent the
damage caused from increased GHG emissions, such as improved flood defences for the UK.
8
However, the SCC varies significantly with different sources, due to uncertainty in the
methods used to calculate an SCC. There are two common methodologies used to estimate
the SCC.
1. Attempting to value all of the damage caused by the emissions of GHG’s
2. Setting a threshold of warming and using economics to value the cost of GHG
emissions.
The first methodology at first appears to be the most logical method to put a price on the
cost of carbon. However, this methodology requires consideration of all the damage caused
by each t/CO2 emitted, which is very difficult to value. As the carbon emitted today will be in
the atmosphere for thousands of years many different considerations need to be taken into
account to calculate the SCC this way. The variables include, but are not limited to,
population growth, future CO2 emission, economic growth, the rate of sea level rise (which
has been discussed above and has a significant uncertainty within the next 100 years),
prediction of extreme weather incidents and the economic impact they will have, the cost of
wildlife damage and extinction. Predicting these future events is very difficult and some
issues (e.g. wildlife damage and extinction) will be valued differently depending upon
opinion, which causes uncertainty in the SCC when calculated in this way.
The SCC, calculated with method 1, is said to not account for all of the damage caused
from increases in CO2 outputs [8]. For example ocean acidification, which increases with
increased amounts of absorbed CO2 and causes damage to sea life and ecosystems, is not
accounted for in any models used to estimate the SCC [8].
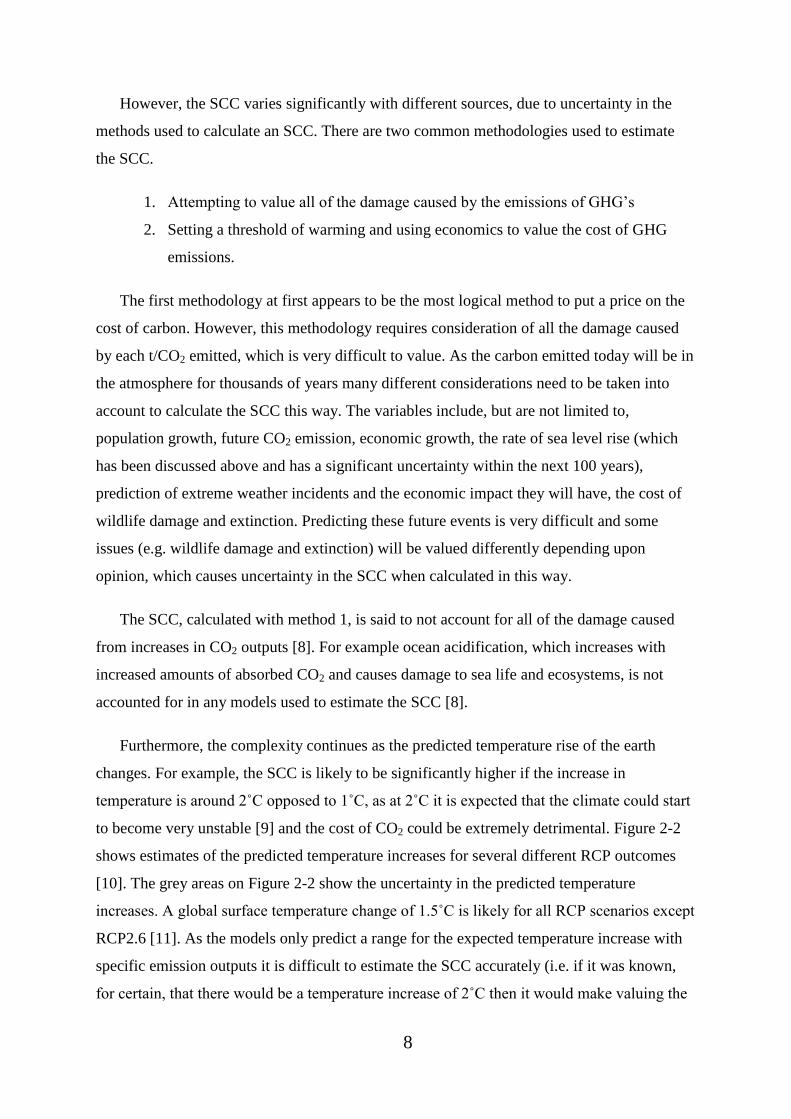
Furthermore, the complexity continues as the predicted temperature rise of the earth
changes. For example, the SCC is likely to be significantly higher if the increase in
temperature is around 2˚C opposed to 1˚C, as at 2˚C it is expected that the climate could start
to become very unstable [9] and the cost of CO2 could be extremely detrimental. Figure 2-2
shows estimates of the predicted temperature increases for several different RCP outcomes
[10]. The grey areas on Figure 2-2 show the uncertainty in the predicted temperature
increases. A global surface temperature change of 1.5˚C is likely for all RCP scenarios except
RCP2.6 [11]. As the models only predict a range for the expected temperature increase with
specific emission outputs it is difficult to estimate the SCC accurately (i.e. if it was known,
for certain, that there would be a temperature increase of 2˚C then it would make valuing the
9
SCC simpler, as the damage could be more accurately predicted). The temperature rise
uncertainty calculated in models (see Figure 2-2) again causes uncertainty in the SCC value.
If emissions stay at current levels the CO2 levels are likely to reach over three times that
of the preindustrial levels by 2100 [8]. If this was to happen then the temperature increase
would be extremely high and the SCC would also need to be extremely high as the damages
caused by a temperature increase of +4.5˚C would be extreme. However, these are estimates
of possible events with uncertainty.
Figure 2-2 Temperature predictions for SRES scenarios and the RCP’s [10]
The “tipping point” events which are triggered due to global warming and in turn can
release large amounts of GHG’s can be irreversible [9]. For example: the melting of ice
sheets (such as the Greenland ice sheet), the reduction of the Amazon rainforest and the
melting of the permafrost in the arctic. If these three events happen they will all release a
large amount of GHG’s (i.e. the Amazon would also not absorb the CO2 it does now) which
some scientists predict would cause damage that is irreversible [8]. These tipping point events
10
would clearly be disastrous for ecosystems but also from an economic standpoint. However,
very few SCC predictions, using method 1, take into account these tipping point events. A
recent study has taken into account tipping points and found the SCC increased by around
50% with conservative assumptions and by over 200% when using plausible rapid and high
impacting tipping points [12].
The reality is that current models which predict the SCC, using method 1, are not detailed
enough to take into account all of the complex issues and all of the damage caused from
GHG emissions. Although, the scientific understanding of these issues is improving it is
taking time and the SCC is likely to only increase once all of the damages are understood and
accounted for. Furthermore, it is a very uncertain time in regards to GHG emissions and
something needs to be done very soon to put a price on GHG emissions before a tipping point
event occurs.
There is an alternative method for calculating the SCC which is method 2. This is a
method which has been employed by many, including the UK, after the Paris Agreement
[13]. The agreed maximum temperature increase which is believed to be safe is 1.5˚C. In
order for the planet to stay below this threshold each country has a CO2 “quota” which it
needs to meet. To meet these emissions targets the UK has set an SCC which it believes will
ensure the emissions target is met, the method used for valuing the SCC is via a marginal
abatement cost (MAC). With an increased SCC the carbon emissions are expected to
decrease. This method reduces the need to calculate the cost of damage caused by increased
CO2 emissions and tipping points. Obviously this assumes that the 1.5˚C threshold
temperature increase is safe for the planet and the damage caused from this rise is minimal, if
wrong the damages could again be disastrous. This method of calculating the SCC is likely to
be more accurate to allow the UK to achieve its carbon emissions goal, and is calculated
using economics opposed to attempting to value all of the variables required when using
method 1.
The monetary carbon values used for the UK are significantly higher than the USA and
the difference in cost between the two countries increases further for the future [13]. For
example the USA and UK have a monetary carbon value used in ex post assessments of
policies and projects of around $40 and $95 for 2014 and around $75 and $350 for 2050,
respectively.
11
Clearly from the description of the methodologies used for calculating the SCC there are
many negative impacts caused from increased GHG emissions such as flooding caused by
rising sea levels, the melting of ice sheets (such as the Greenland ice sheet), the reduction of
the Amazon rainforest and the melting of the permafrost in the arctic. If these negative
environmental and economic impacts of increased CO2 emissions are to be avoided or
reversed a significant reduction in CO2 emissions is required very soon.
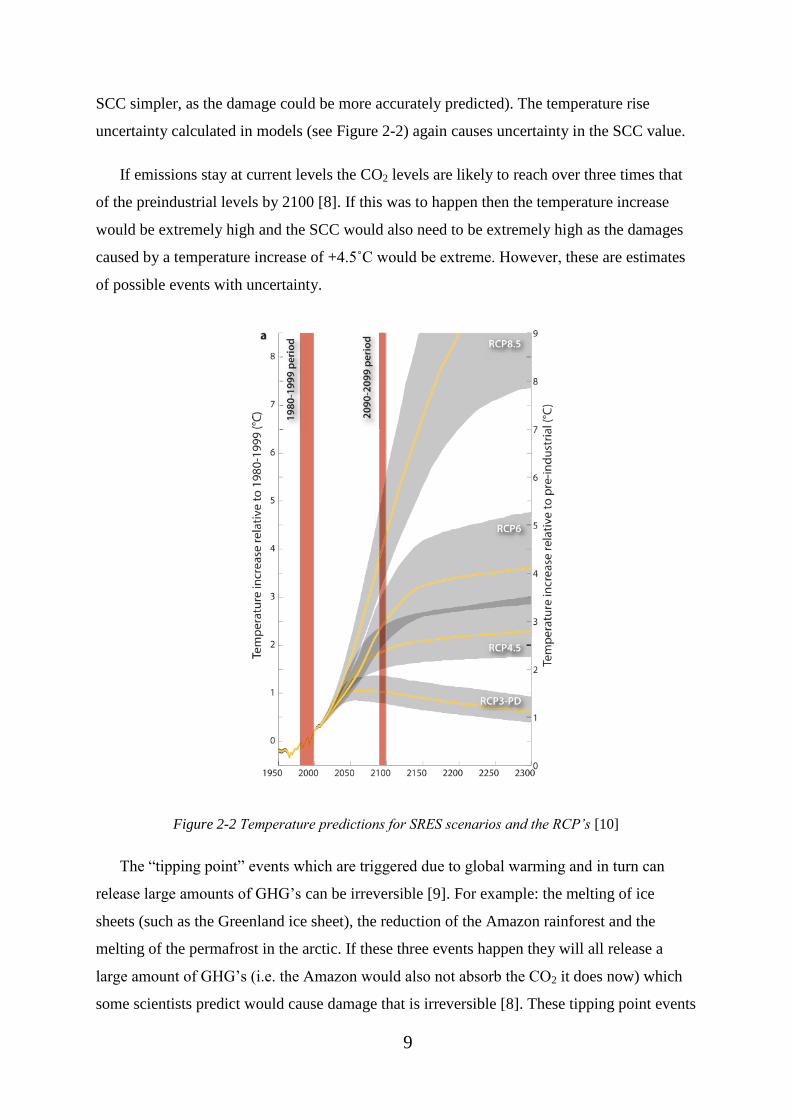
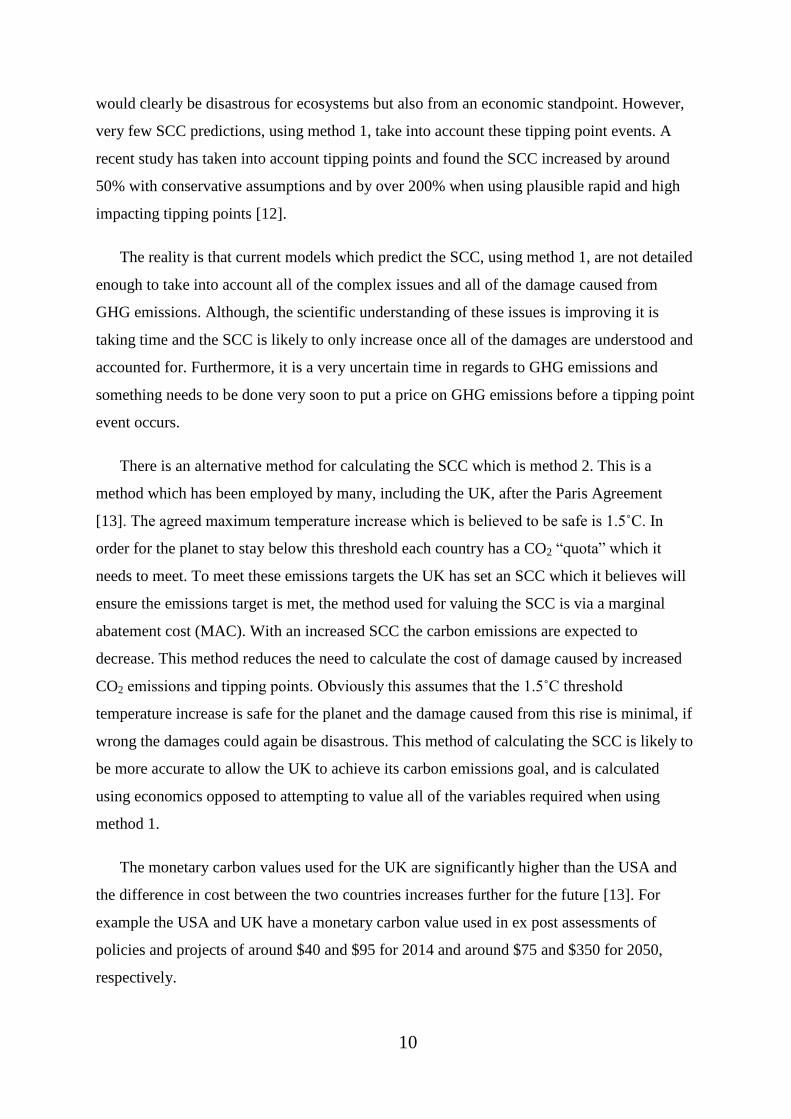
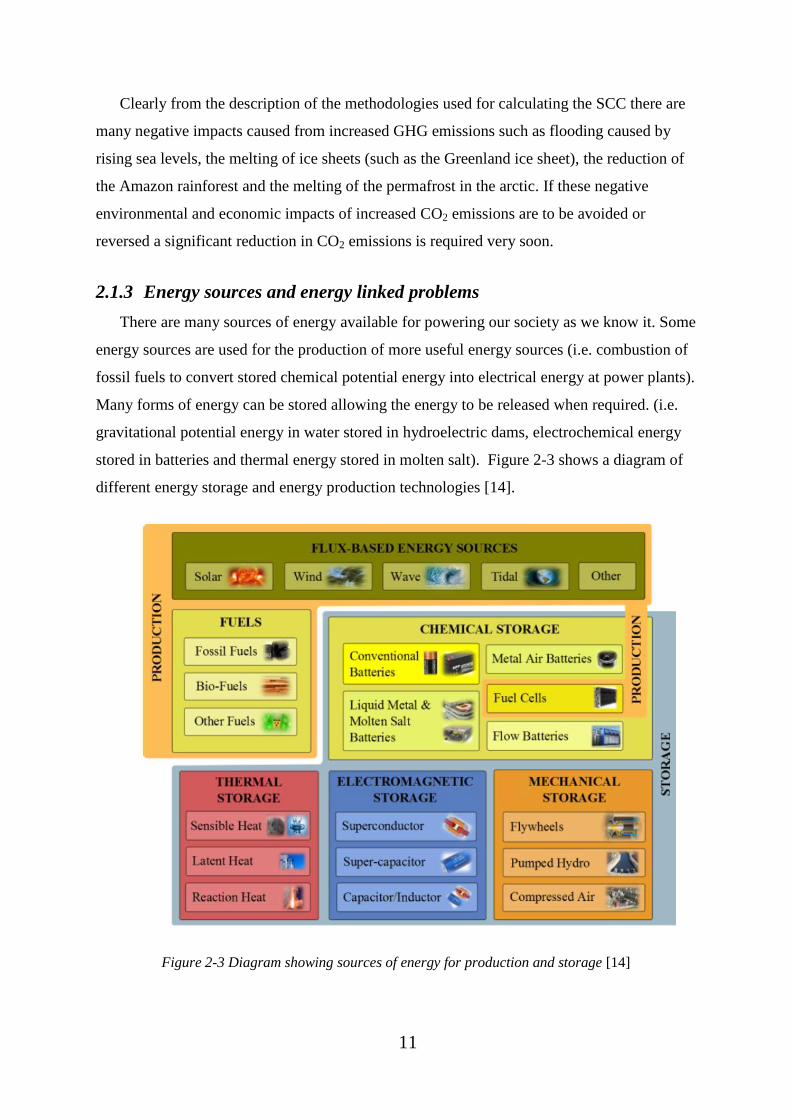
2.1.3 Energy sources and energy linked problems
There are many sources of energy available for powering our society as we know it. Some
energy sources are used for the production of more useful energy sources (i.e. combustion of
fossil fuels to convert stored chemical potential energy into electrical energy at power plants).
Many forms of energy can be stored allowing the energy to be released when required. (i.e.
gravitational potential energy in water stored in hydroelectric dams, electrochemical energy
stored in batteries and thermal energy stored in molten salt). Figure 2-3 shows a diagram of
different energy storage and energy production technologies [14].
Figure 2-3 Diagram showing sources of energy for production and storage [14]
12
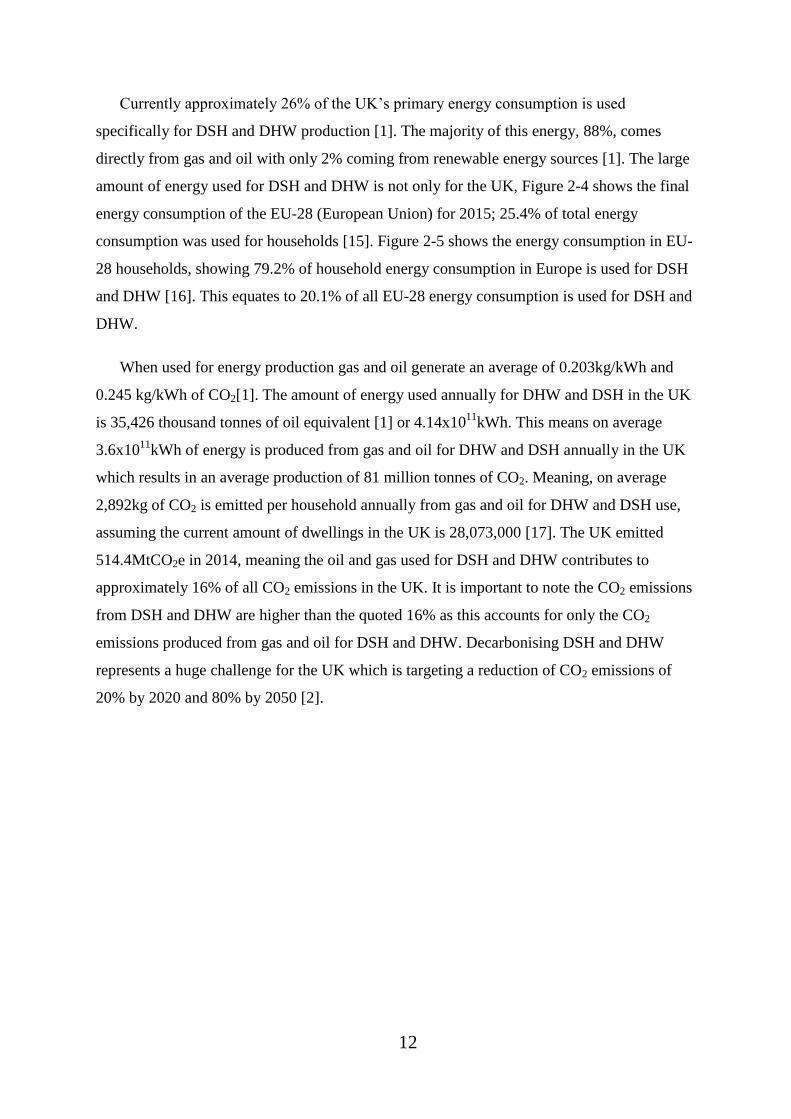
Currently approximately 26% of the UK’s primary energy consumption is used
specifically for DSH and DHW production [1]. The majority of this energy, 88%, comes
directly from gas and oil with only 2% coming from renewable energy sources [1]. The large
amount of energy used for DSH and DHW is not only for the UK, Figure 2-4 shows the final
energy consumption of the EU-28 (European Union) for 2015; 25.4% of total energy
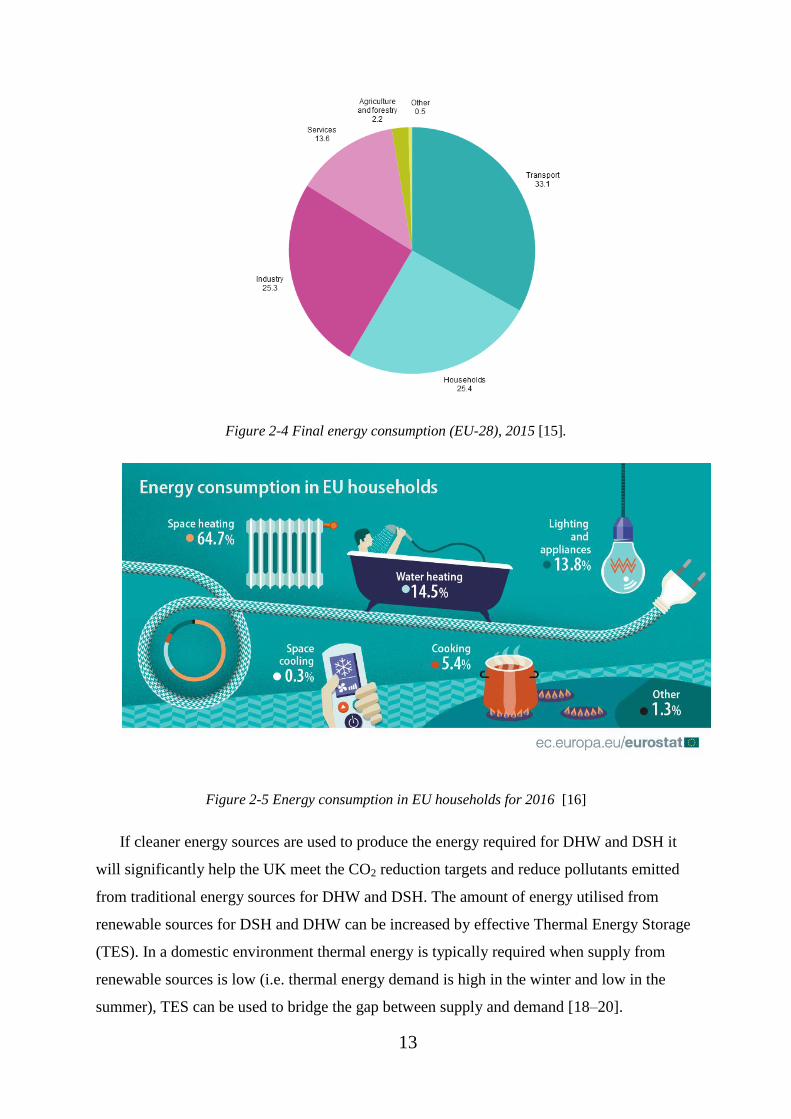
consumption was used for households [15]. Figure 2-5 shows the energy consumption in EU-
28 households, showing 79.2% of household energy consumption in Europe is used for DSH
and DHW [16]. This equates to 20.1% of all EU-28 energy consumption is used for DSH and
DHW.
When used for energy production gas and oil generate an average of 0.203kg/kWh and
0.245 kg/kWh of CO2[1]. The amount of energy used annually for DHW and DSH in the UK
is 35,426 thousand tonnes of oil equivalent [1] or 4.14x10¹¹
kWh. This means on average
3.6x10¹¹
kWh of energy is produced from gas and oil for DHW and DSH annually in the UK
which results in an average production of 81 million tonnes of CO2. Meaning, on average
2,892kg of CO2 is emitted per household annually from gas and oil for DHW and DSH use,
assuming the current amount of dwellings in the UK is 28,073,000 [17]. The UK emitted
514.4MtCO2e in 2014, meaning the oil and gas used for DSH and DHW contributes to
approximately 16% of all CO2 emissions in the UK. It is important to note the CO2 emissions
from DSH and DHW are higher than the quoted 16% as this accounts for only the CO2
emissions produced from gas and oil for DSH and DHW. Decarbonising DSH and DHW
represents a huge challenge for the UK which is targeting a reduction of CO2 emissions of
20% by 2020 and 80% by 2050 [2].
13
Figure 2-4 Final energy consumption (EU-28), 2015 [15].
Figure 2-5 Energy consumption in EU households for 2016 [16]
If cleaner energy sources are used to produce the energy required for DHW and DSH it
will significantly help the UK meet the CO2 reduction targets and reduce pollutants emitted
from traditional energy sources for DHW and DSH. The amount of energy utilised from
renewable sources for DSH and DHW can be increased by effective Thermal Energy Storage
(TES). In a domestic environment thermal energy is typically required when supply from
renewable sources is low (i.e. thermal energy demand is high in the winter and low in the
summer), TES can be used to bridge the gap between supply and demand [18–20].

14
2.1.4 Thermal energy storage
TES is a way of storing heat in a medium or material so that it can be used at a later time.
Research suggests that the use of solar thermal energy storage has the potential to supply
around 50% of the heat demand in Europe [21]. There are three main types of TES STES,
LTES and TCES [14,22–25].
STES stores or releases heat by heating or cooling material. The amount of energy input
is related to the mass, specific heat capacity of the storage material and the temperature
difference of the storage medium between its initial and final states [14,22,26]. The storage
mediums insulation dictates the success of STES. STES has a relatively low storage density
(0.85 – 1.15 kJ/kg [14]) (Figure 2-6) and a high energy loss relative to latent and
thermochemical energy storage. STES is a simple and cost effective method for storing heat
[14] but it is not space efficient. The heat stored in STES materials can be expressed as
𝑄 = 𝑚𝐶𝑝∆𝑇 [22].
Energy is stored during the phase change of a material for LTES [14]. Heat is lost from
the LTES material when the heat is being stored, resulting in unwanted energy losses [24].
LTES does not obtain the same energy density (100-340 kJ/kg for LTES [14]) as TCES
(Figure 2-6) and the cost of LTES materials is relatively expensive [24]. The equation for the
amount of heat stored in LTES materials is 𝑄 = 𝑚𝐿 [22].
TCES stores energy via a reversible chemical reaction (i.e. 𝐶 + ℎ𝑒𝑎𝑡 ↔ 𝐴 + 𝐵) [22]. For
domestic use, when material A (typically an anhydrate salt or a sorption material) reacts with
material B (typically water) the products are energy (heat) along with product C which is
typically a hydrated salt or sorption material (e.g. magnesium sulphate heptahydrate). When
material C is exposed to heat, energy is absorbed and material C dissociates into material A +
B [24,27]. This principle, in theory, allows two materials (i.e. A + B) to be stored separately
for an indefinite amount of time without degradation or energy loss and recombine to release
stored energy [25]. Preliminary calculations show that sensible heat losses comprise to
approximately 10% of total energy stored; this means the remaining 90% of energy can be
stored loss-free [27,28].

15
Figure 2-6 Energy density with temperature of different energy storage materials [29]
2.1.5 Sorption and chemical energy storage terminology
Adsorption occurs between two phases (i.e. solid and gas) with the occurrence of certain
fields which are saturated with intermolecular forces, such as Van der Waals forces [30].
Typically adsorption is an exothermic process as the adsorbed material has lost a degree of
freedom (i.e. ΔS < 0). This then relates to the Gibbs free energy equation (see Equation 2-1).
∆𝐺 = ∆𝐻 − 𝑇∆𝑆 Equation 2-1 [31]
Where ∆𝐺 = change in Gibbs free energy, ∆𝐻 = change in enthalpy, 𝑇 = temperature in
Kelvin and ∆𝑆 = change in entropy. In order for a reaction to be spontaneous ΔG < 0 hence,
ΔH = (<0) + T(<0) must be negative, assuming T is temperature in kelvin and cannot be
negative. As ΔH is negative this is an exothermic process.
Typically [29,32–34] adsorption is split into two types, physical (physisorption) and
chemical (chemisorption).
Physisorption is a non-specific loose binding of the adsorbate on to the surface of the
solid or liquid, Van der Waals type interactions. Multi layered adsorption is possible and
physisorption is strongly dependent upon temperature. One physisorption molecule has two

16
degrees of freedom allowing for movement on the surface. The energy released in this
reaction is generally less than chemisorption [30,35,36].
Chemisorption involves a more specific binding of the adsorbate to the solid or liquid.
The bonding is through valence forces (i.e. covalent, ionic or electronic bonding of a gas or
liquid onto the surface of the liquid or solid) [29,33,34].The adsorbed molecules have zero
degrees of freedom. It involves a chemical reaction and hence, only monolayer adsorption is
possible. Chemisorption is often irreversible due to the large amount of energy required to
break the chemical bonding [30,35,36].
2.1.5.1 Ambiguity in defining the processes taking place in sorption energy storage
materials
The definition of adsorption and absorption is clear. Adsorption being the process of a
substance binding to the surface of another [22,29,37,38]. Absorption is the process where a
gas or liquid enters into the bulk of a liquid or solid binding with the material[22,29,32,37].
However, there appears to be some ambiguity or confusion in attempting to categorise the
processes taking place in thermochemical energy storage materials. N’Tsoukpoe et al. [29]
states the use of chemical storage, thermochemical storage, sorption storage, differs from one
author to another creating a difficulty in finding a clear boundary between them. Yu et al.
[32] states there is a difficulty distinguishing clear boundaries between terms
(thermochemical, compact, sorption, chemical etc.). Ding et al. [37] states there is difficulty
in making clear boundary distinctions between chemical storage, thermochemical storage and
sorption storage. Figure 2-7 gives a classification of chemical and sorption storage however,
the author (N’Tsoukpoe et al.) [29] does not give any definition of thermochemical without
sorption.
There also does not appear to be any clear definitions of chemical absorption or
chemical adsorption. The definition of physisorption and chemisorption is clear [33] [34].
Although, it is apparently difficult to establish exactly which process is taking place and, both
may be occurring simultaneously within a material [32] [33]. This may be why it is difficult
to define which process is occurring in a thermochemical energy storage system. This
becomes even more difficult in the case of composite materials (i.e. salt hydrates within
porous host matrixes). This may be the reason, for simplicity, why most authors simply refer

17
to the process as “sorption” energy storage [29] [37] [22] to include chemical absorption,
physical absorption, chemical adsorption and physical adsorption processes.
In the case of heat of hydration from MgSO4 there is also ambiguity which process is
occurring. N’Tsoukpoe et al. [29] classes the process as chemisorption (chemical
adsorption). Yu et al. [32] states chemical reactions corresponding to sorption mainly
consists of two kinds of reactions: “co-ordination reaction of ammoniate with ammonia” and
“hydration reaction of salt hydrate with water”. Yu et al. further states that both reactions are
technically co-ordination reactions as molecules of ammonia or water vapour are attracted by
metal ions to form co-ordinate bonds [32]. Moreover, it is still not clear if this should be
classed as adsorption or absorption and many authors simple refer to it as a chemical
reaction [32]. Aristov et al. [39] Investigates salt hydrates in host materials, more specifically
CaCl2 in silica gel. The paper refers to the water sorption of this material as solid absorption
(chemical reaction) and liquid absorption which account for 10-15% and ~80% water
sorption, respectively. It appears due to the complex nature of the sorption process, which
may or may not include physical and chemical ad/absorption, it is best to simply refer to the
process as a sorption reaction or whichever term is used it should be taken with reservations
unless explicitly defined.
Figure 2-7 Chemical and sorption energy storage classification [29]
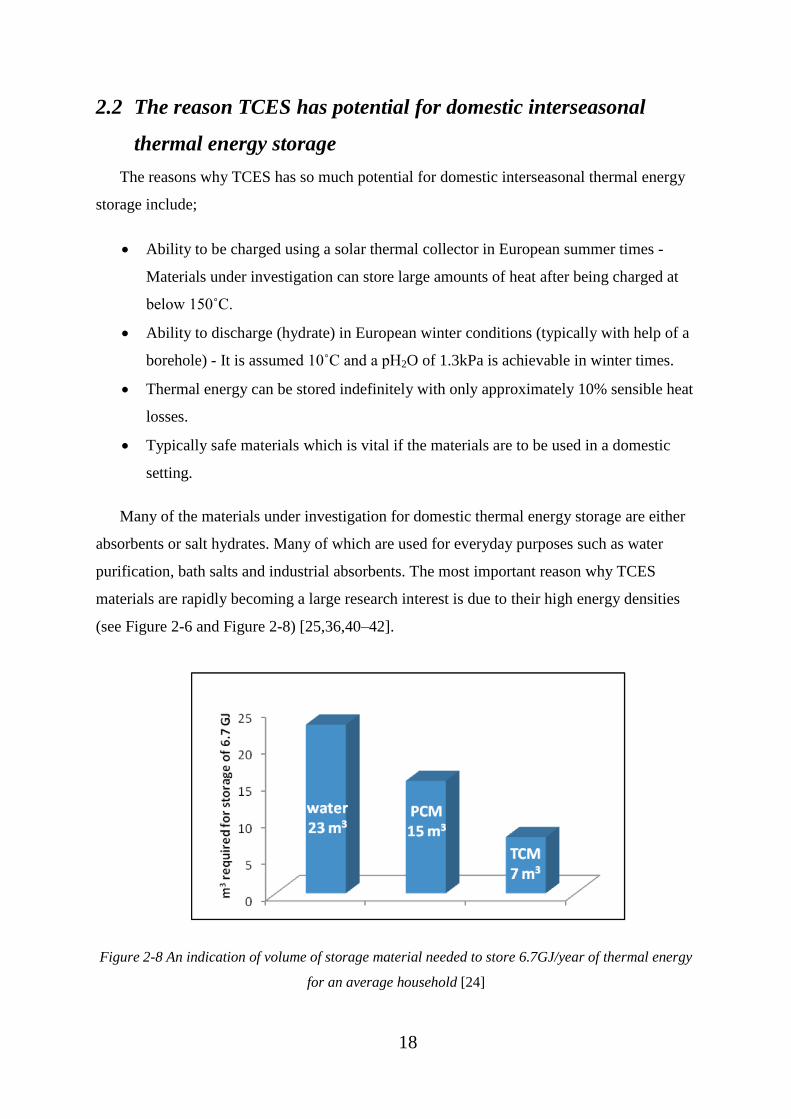
18
2.2 The reason TCES has potential for domestic interseasonal
thermal energy storage
The reasons why TCES has so much potential for domestic interseasonal thermal energy
storage include;
Ability to be charged using a solar thermal collector in European summer times -
Materials under investigation can store large amounts of heat after being charged at
below 150˚C.
Ability to discharge (hydrate) in European winter conditions (typically with help of a
borehole) - It is assumed 10˚C and a pH2O of 1.3kPa is achievable in winter times.
Thermal energy can be stored indefinitely with only approximately 10% sensible heat
losses.
Typically safe materials which is vital if the materials are to be used in a domestic
setting.
Many of the materials under investigation for domestic thermal energy storage are either
absorbents or salt hydrates. Many of which are used for everyday purposes such as water
purification, bath salts and industrial absorbents. The most important reason why TCES
materials are rapidly becoming a large research interest is due to their high energy densities
(see Figure 2-6 and Figure 2-8) [25,36,40–42].
Figure 2-8 An indication of volume of storage material needed to store 6.7GJ/year of thermal energy
for an average household [24]
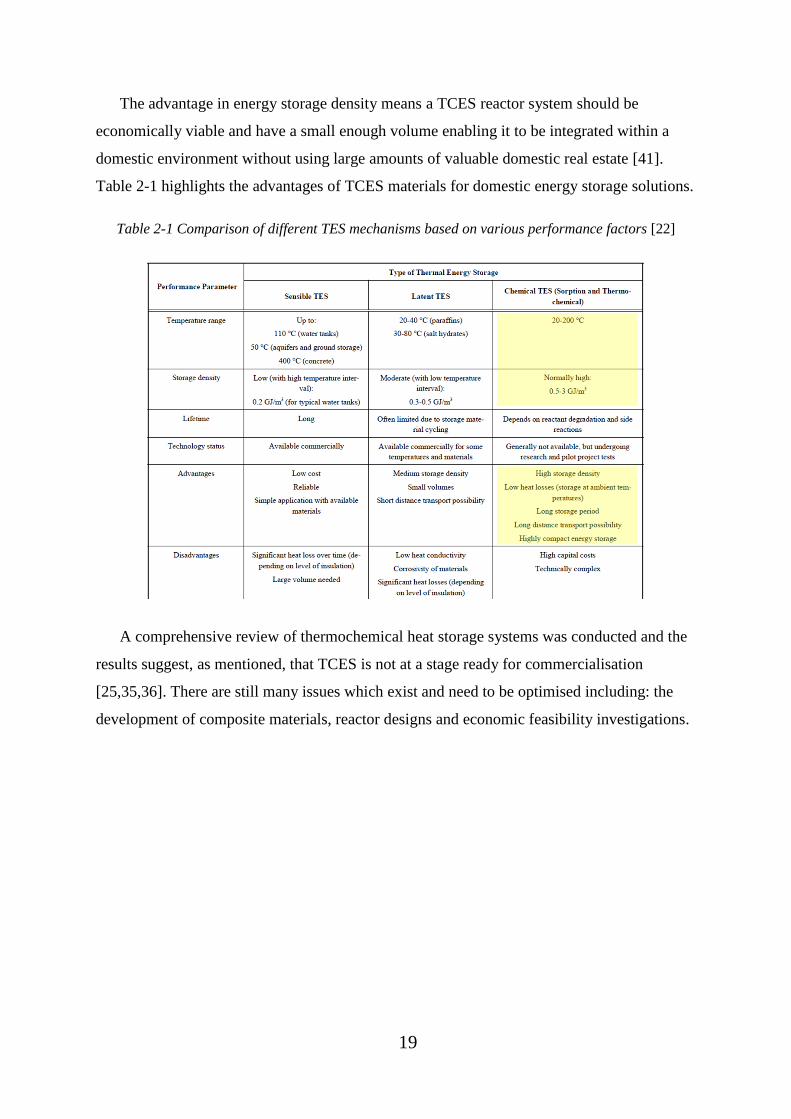
19
The advantage in energy storage density means a TCES reactor system should be
economically viable and have a small enough volume enabling it to be integrated within a
domestic environment without using large amounts of valuable domestic real estate [41].
Table 2-1 highlights the advantages of TCES materials for domestic energy storage solutions.
Table 2-1 Comparison of different TES mechanisms based on various performance factors [22]
A comprehensive review of thermochemical heat storage systems was conducted and the
results suggest, as mentioned, that TCES is not at a stage ready for commercialisation
[25,35,36]. There are still many issues which exist and need to be optimised including: the
development of composite materials, reactor designs and economic feasibility investigations.
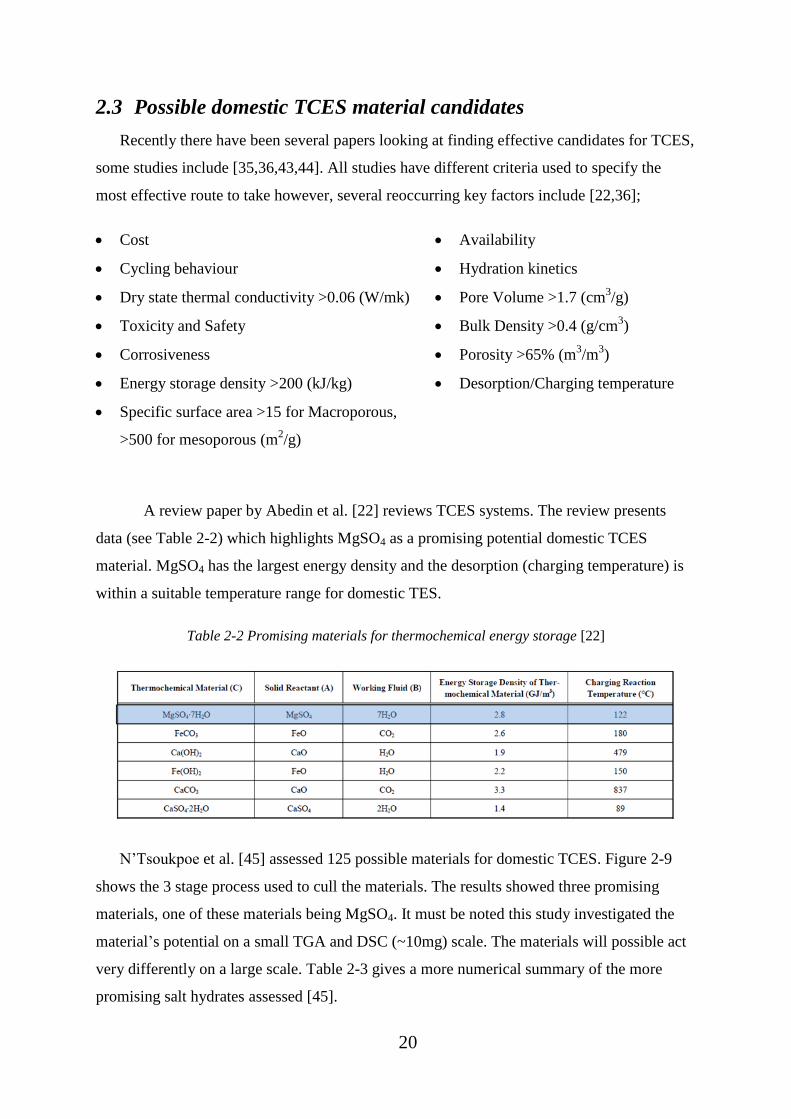
20
2.3 Possible domestic TCES material candidates
Recently there have been several papers looking at finding effective candidates for TCES,
some studies include [35,36,43,44]. All studies have different criteria used to specify the
most effective route to take however, several reoccurring key factors include [22,36];
Cost Availability
Cycling behaviour Hydration kinetics
Dry state thermal conductivity >0.06 (W/mk) Pore Volume >1.7 (cm3/g)
Toxicity and Safety Bulk Density >0.4 (g/cm3)
Corrosiveness Porosity >65% (m3/m
3)
Energy storage density >200 (kJ/kg) Desorption/Charging temperature
Specific surface area >15 for Macroporous,
>500 for mesoporous (m2/g)
A review paper by Abedin et al. [22] reviews TCES systems. The review presents
data (see Table 2-2) which highlights MgSO4 as a promising potential domestic TCES
material. MgSO4 has the largest energy density and the desorption (charging temperature) is
within a suitable temperature range for domestic TES.
Table 2-2 Promising materials for thermochemical energy storage [22]
N’Tsoukpoe et al. [45] assessed 125 possible materials for domestic TCES. Figure 2-9
shows the 3 stage process used to cull the materials. The results showed three promising
materials, one of these materials being MgSO4. It must be noted this study investigated the
material’s potential on a small TGA and DSC (~10mg) scale. The materials will possible act
very differently on a large scale. Table 2-3 gives a more numerical summary of the more
promising salt hydrates assessed [45].
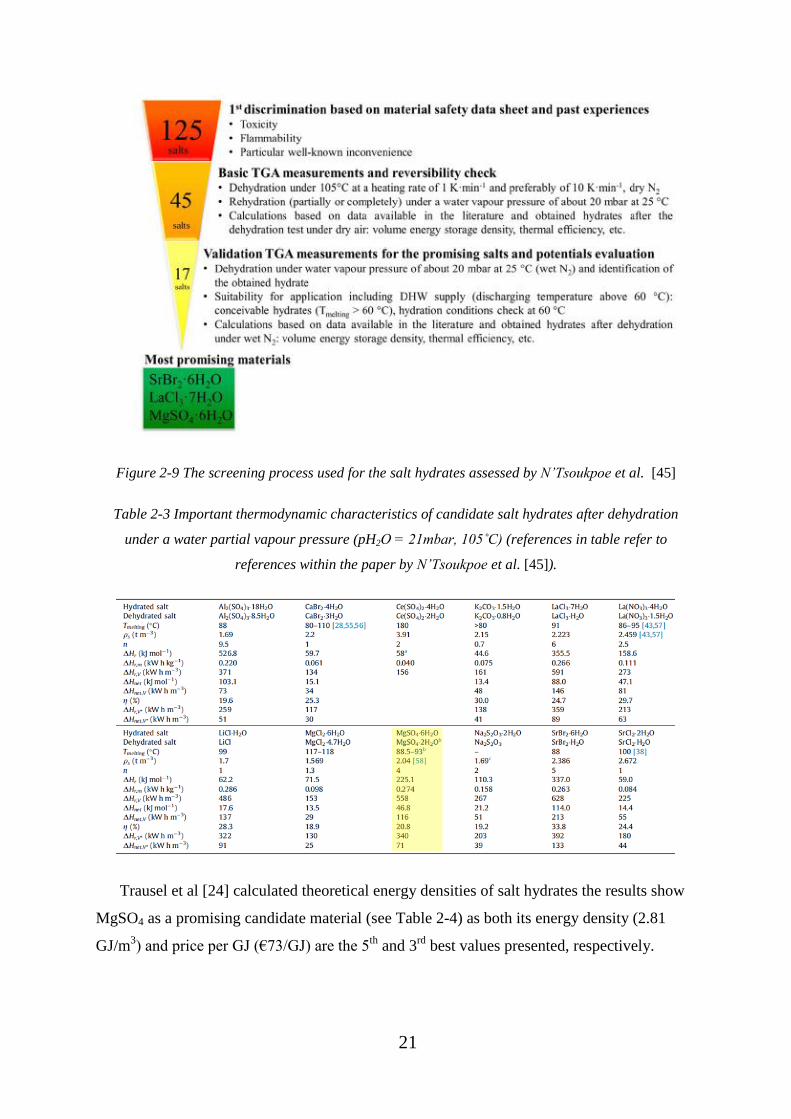
21
Figure 2-9 The screening process used for the salt hydrates assessed by N’Tsoukpoe et al. [45]
Table 2-3 Important thermodynamic characteristics of candidate salt hydrates after dehydration
under a water partial vapour pressure (pH2O = 21mbar, 105˚C) (references in table refer to
references within the paper by N’Tsoukpoe et al. [45]).
Trausel et al [24] calculated theoretical energy densities of salt hydrates the results show
MgSO4 as a promising candidate material (see Table 2-4) as both its energy density (2.81
GJ/m3) and price per GJ (€73/GJ) are the 5
th and 3
rd best values presented, respectively.
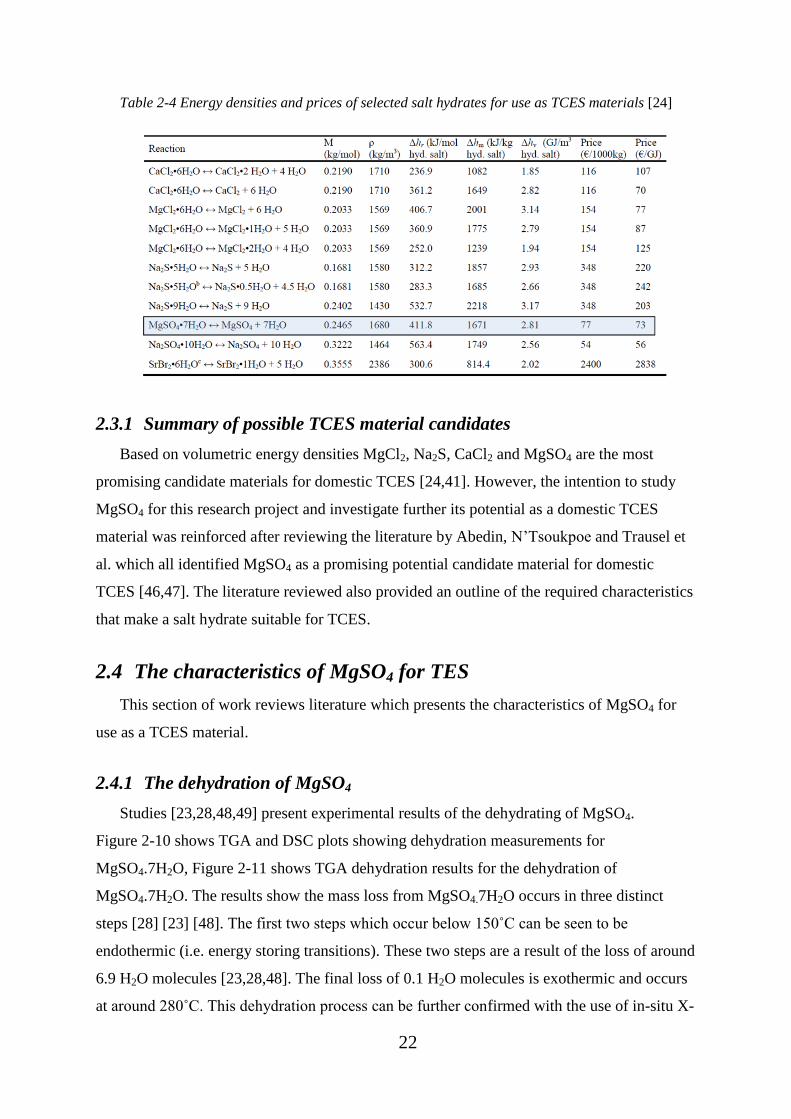
22
Table 2-4 Energy densities and prices of selected salt hydrates for use as TCES materials [24]
2.3.1 Summary of possible TCES material candidates
Based on volumetric energy densities MgCl2, Na2S, CaCl2 and MgSO4 are the most
promising candidate materials for domestic TCES [24,41]. However, the intention to study
MgSO4 for this research project and investigate further its potential as a domestic TCES
material was reinforced after reviewing the literature by Abedin, N’Tsoukpoe and Trausel et
al. which all identified MgSO4 as a promising potential candidate material for domestic
TCES [46,47]. The literature reviewed also provided an outline of the required characteristics
that make a salt hydrate suitable for TCES.
2.4 The characteristics of MgSO4 for TES
This section of work reviews literature which presents the characteristics of MgSO4 for
use as a TCES material.
2.4.1 The dehydration of MgSO4
Studies [23,28,48,49] present experimental results of the dehydrating of MgSO4.
Figure 2-10 shows TGA and DSC plots showing dehydration measurements for
MgSO4.7H2O, Figure 2-11 shows TGA dehydration results for the dehydration of
MgSO4.7H2O. The results show the mass loss from MgSO4.7H2O occurs in three distinct
steps [28] [23] [48]. The first two steps which occur below 150˚C can be seen to be
endothermic (i.e. energy storing transitions). These two steps are a result of the loss of around
6.9 H2O molecules [23,28,48]. The final loss of 0.1 H2O molecules is exothermic and occurs
at around 280˚C. This dehydration process can be further confirmed with the use of in-situ X-
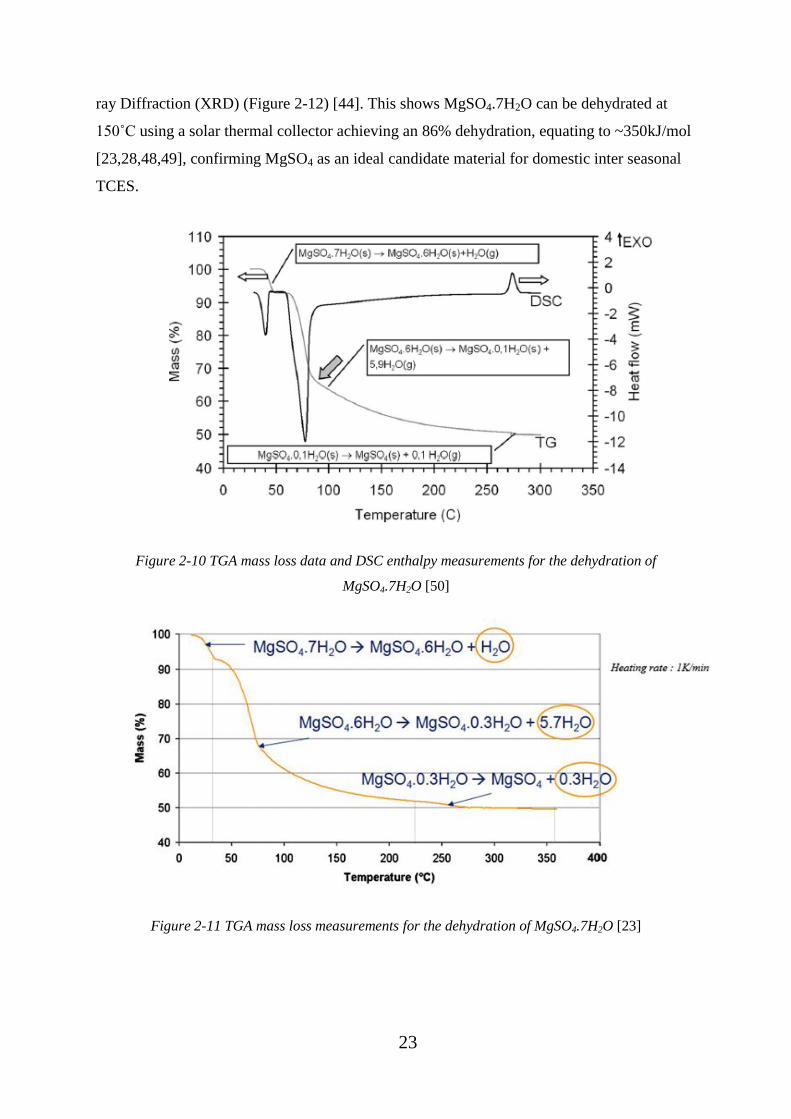
23
ray Diffraction (XRD) (Figure 2-12) [44]. This shows MgSO4.7H2O can be dehydrated at
150˚C using a solar thermal collector achieving an 86% dehydration, equating to ~350kJ/mol
[23,28,48,49], confirming MgSO4 as an ideal candidate material for domestic inter seasonal
TCES.
Figure 2-10 TGA mass loss data and DSC enthalpy measurements for the dehydration of
MgSO4.7H2O [50]
Figure 2-11 TGA mass loss measurements for the dehydration of MgSO4.7H2O [23]
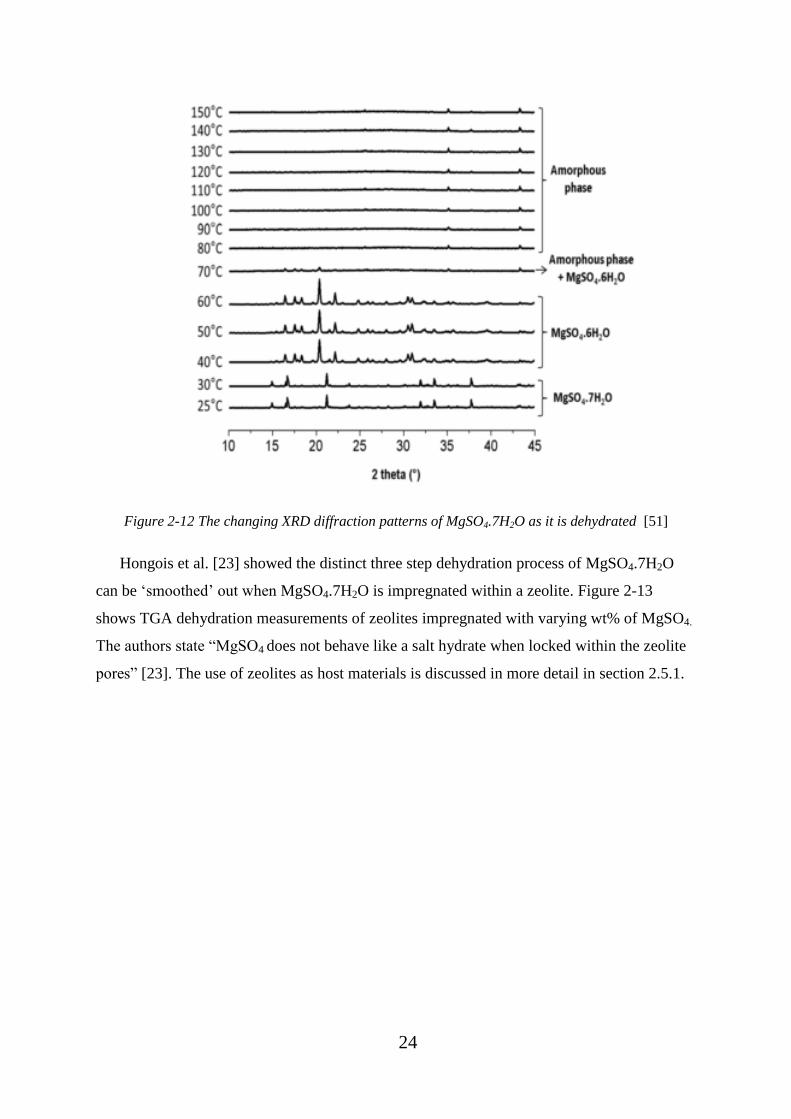
24
Figure 2-12 The changing XRD diffraction patterns of MgSO4.7H2O as it is dehydrated [51]
Hongois et al. [23] showed the distinct three step dehydration process of MgSO4.7H2O
can be ‘smoothed’ out when MgSO4.7H2O is impregnated within a zeolite. Figure 2-13
shows TGA dehydration measurements of zeolites impregnated with varying wt% of MgSO4.
The authors state “MgSO4 does not behave like a salt hydrate when locked within the zeolite
pores” [23]. The use of zeolites as host materials is discussed in more detail in section 2.5.1.
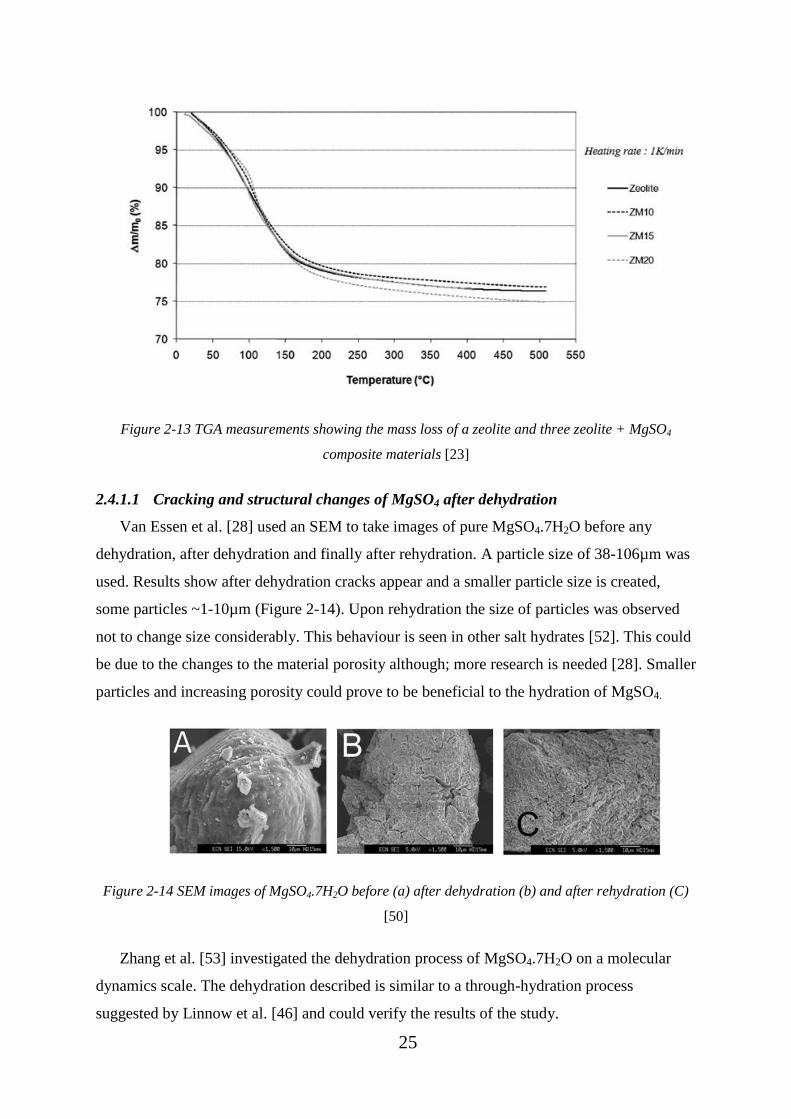
25
Figure 2-13 TGA measurements showing the mass loss of a zeolite and three zeolite + MgSO4
composite materials [23]
2.4.1.1 Cracking and structural changes of MgSO4 after dehydration
Van Essen et al. [28] used an SEM to take images of pure MgSO4.7H2O before any
dehydration, after dehydration and finally after rehydration. A particle size of 38-106µm was
used. Results show after dehydration cracks appear and a smaller particle size is created,
some particles ~1-10µm (Figure 2-14). Upon rehydration the size of particles was observed
not to change size considerably. This behaviour is seen in other salt hydrates [52]. This could
be due to the changes to the material porosity although; more research is needed [28]. Smaller
particles and increasing porosity could prove to be beneficial to the hydration of MgSO4.
Figure 2-14 SEM images of MgSO4.7H2O before (a) after dehydration (b) and after rehydration (C)
[50]
Zhang et al. [53] investigated the dehydration process of MgSO4.7H2O on a molecular
dynamics scale. The dehydration described is similar to a through-hydration process
suggested by Linnow et al. [46] and could verify the results of the study.

26
The MgSO4 is said to become porous. The material becoming porous has been identified
by other studies [28]. Zhang et al. [53] suggests for quicker dehydration kinetics a large
surface area /volume ratio should be utilised, possibly explaining why zeolites enhance the
kinetics of MgSO4 [48,49].
2.4.1.2 Melting of MgSO4 upon dehydration
Upon dehydration of MgSO4.7H2O a melting point of 50˚C is observed [28] (seen in
Figure 2-15, indicated by a grey circle). This melting point is problematic as it causes a
reduction in the bed porosity of the material and the ability for vapour to travel through the
material [23,28,48,49,52,54], which limits the hydration ability. Essen et al [28] investigated
this problem by varying heating rates, sample and particle sizes. Results revealed low heating
rates (≤1˚C/min), small particle size (≤200µm) and or small sample sizes (≤5 mg) all
prevented melting from being observed. These constraints would be difficult to meet in
practical applications. Figure 2-15 shows smaller particles result in a faster dehydration [50].
Whiting [48] and Hongois [23] used zeolite + MgSO4 composite materials. In both cases
no signs or mention of melting occurred while dehydrating the material to 150˚C. If the use
of host materials can diminish or eliminate all signs of melting this would reduce the
constraints of particle size, heating rate and sample size, possibly simplifying the application
of MgSO4 as a TCES material in practical situations. More research is needed to assess the
impact melting and hence, high heating rates have on the cycle stability and energy storing
potential of MgSO4.
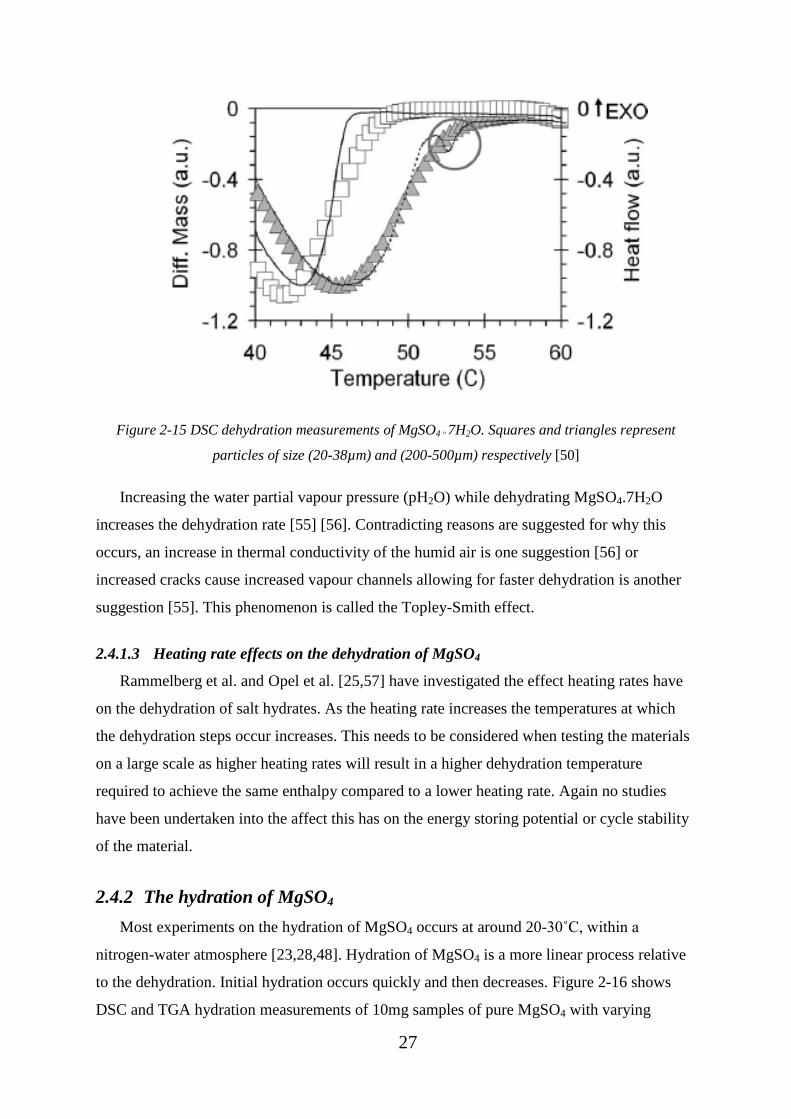
27
Figure 2-15 DSC dehydration measurements of MgSO4 ᵒ 7H2O. Squares and triangles represent
particles of size (20-38µm) and (200-500µm) respectively [50]
Increasing the water partial vapour pressure (pH2O) while dehydrating MgSO4.7H2O
increases the dehydration rate [55] [56]. Contradicting reasons are suggested for why this
occurs, an increase in thermal conductivity of the humid air is one suggestion [56] or
increased cracks cause increased vapour channels allowing for faster dehydration is another
suggestion [55]. This phenomenon is called the Topley-Smith effect.
2.4.1.3 Heating rate effects on the dehydration of MgSO4
Rammelberg et al. and Opel et al. [25,57] have investigated the effect heating rates have
on the dehydration of salt hydrates. As the heating rate increases the temperatures at which
the dehydration steps occur increases. This needs to be considered when testing the materials
on a large scale as higher heating rates will result in a higher dehydration temperature
required to achieve the same enthalpy compared to a lower heating rate. Again no studies
have been undertaken into the affect this has on the energy storing potential or cycle stability
of the material.
2.4.2 The hydration of MgSO4
Most experiments on the hydration of MgSO4 occurs at around 20-30˚C, within a
nitrogen-water atmosphere [23,28,48]. Hydration of MgSO4 is a more linear process relative
to the dehydration. Initial hydration occurs quickly and then decreases. Figure 2-16 shows
DSC and TGA hydration measurements of 10mg samples of pure MgSO4 with varying
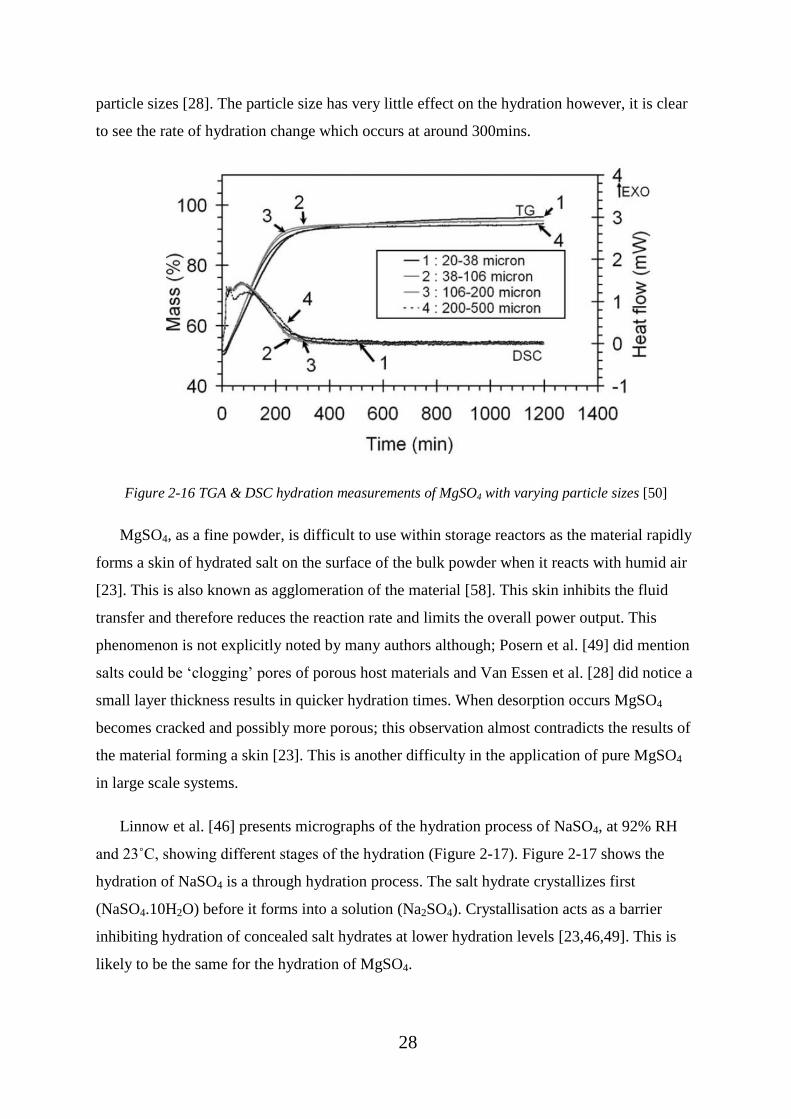
28
particle sizes [28]. The particle size has very little effect on the hydration however, it is clear
to see the rate of hydration change which occurs at around 300mins.
Figure 2-16 TGA & DSC hydration measurements of MgSO4 with varying particle sizes [50]
MgSO4, as a fine powder, is difficult to use within storage reactors as the material rapidly
forms a skin of hydrated salt on the surface of the bulk powder when it reacts with humid air
[23]. This is also known as agglomeration of the material [58]. This skin inhibits the fluid
transfer and therefore reduces the reaction rate and limits the overall power output. This
phenomenon is not explicitly noted by many authors although; Posern et al. [49] did mention
salts could be ‘clogging’ pores of porous host materials and Van Essen et al. [28] did notice a
small layer thickness results in quicker hydration times. When desorption occurs MgSO4
becomes cracked and possibly more porous; this observation almost contradicts the results of
the material forming a skin [23]. This is another difficulty in the application of pure MgSO4
in large scale systems.
Linnow et al. [46] presents micrographs of the hydration process of NaSO4, at 92% RH
and 23˚C, showing different stages of the hydration (Figure 2-17). Figure 2-17 shows the
hydration of NaSO4 is a through hydration process. The salt hydrate crystallizes first
(NaSO4.10H2O) before it forms into a solution (Na2SO4). Crystallisation acts as a barrier
inhibiting hydration of concealed salt hydrates at lower hydration levels [23,46,49]. This is
likely to be the same for the hydration of MgSO4.
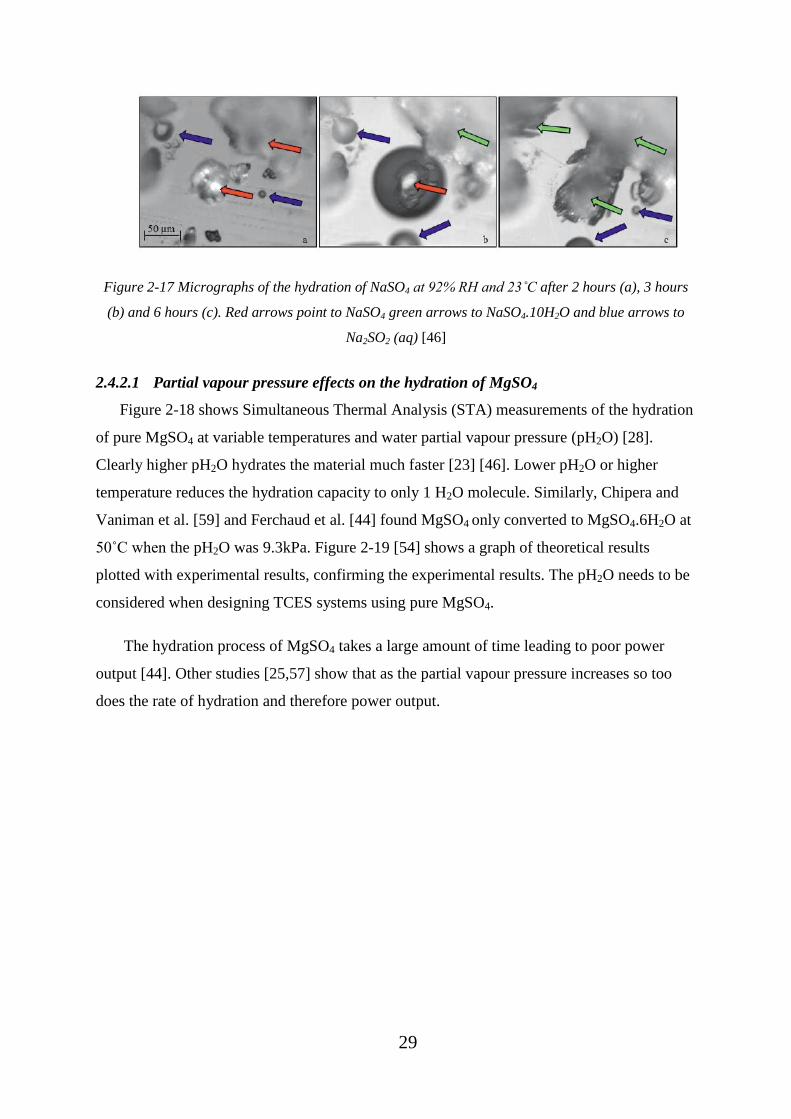
29
Figure 2-17 Micrographs of the hydration of NaSO4 at 92% RH and 23˚C after 2 hours (a), 3 hours
(b) and 6 hours (c). Red arrows point to NaSO4 green arrows to NaSO4.10H2O and blue arrows to
Na2SO2 (aq) [46]
2.4.2.1 Partial vapour pressure effects on the hydration of MgSO4
Figure 2-18 shows Simultaneous Thermal Analysis (STA) measurements of the hydration
of pure MgSO4 at variable temperatures and water partial vapour pressure (pH2O) [28].
Clearly higher pH2O hydrates the material much faster [23] [46]. Lower pH2O or higher
temperature reduces the hydration capacity to only 1 H2O molecule. Similarly, Chipera and
Vaniman et al. [59] and Ferchaud et al. [44] found MgSO4 only converted to MgSO4.6H2O at
50˚C when the pH2O was 9.3kPa. Figure 2-19 [54] shows a graph of theoretical results
plotted with experimental results, confirming the experimental results. The pH2O needs to be
considered when designing TCES systems using pure MgSO4.
The hydration process of MgSO4 takes a large amount of time leading to poor power
output [44]. Other studies [25,57] show that as the partial vapour pressure increases so too
does the rate of hydration and therefore power output.
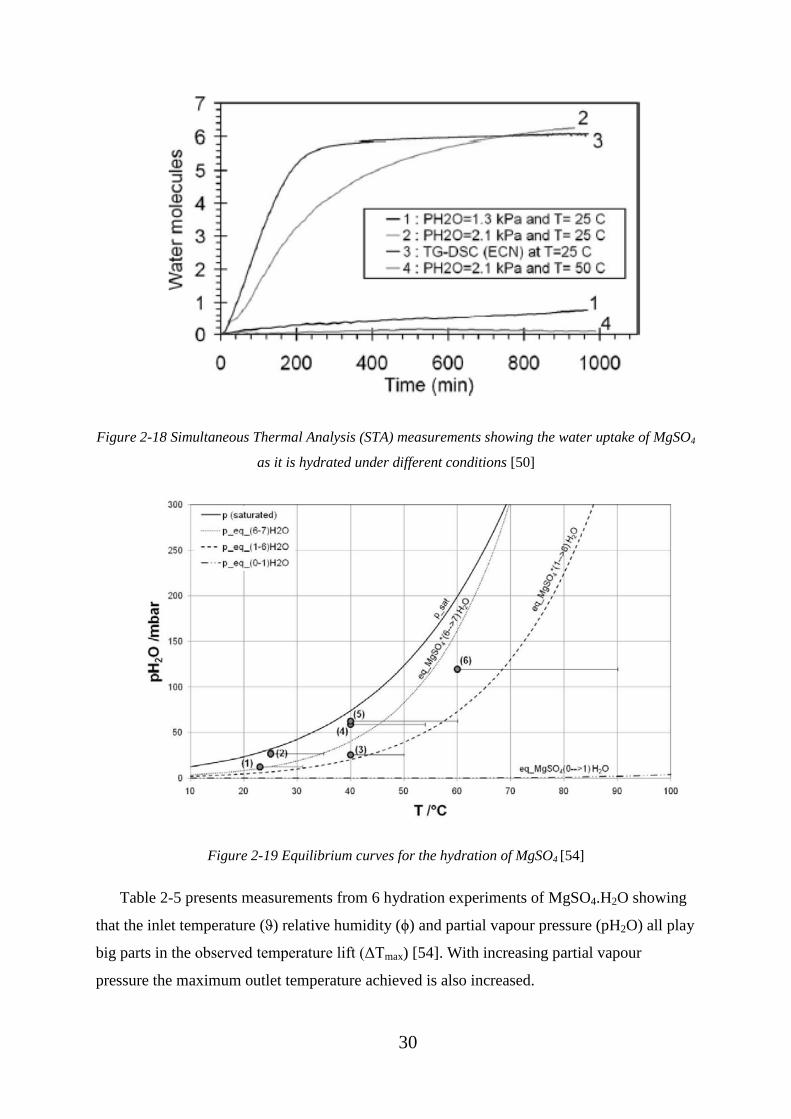
30
Figure 2-18 Simultaneous Thermal Analysis (STA) measurements showing the water uptake of MgSO4
as it is hydrated under different conditions [50]
Figure 2-19 Equilibrium curves for the hydration of MgSO4 [54]
Table 2-5 presents measurements from 6 hydration experiments of MgSO4.H2O showing
that the inlet temperature (ϑ) relative humidity (ϕ) and partial vapour pressure (pH2O) all play
big parts in the observed temperature lift (ΔTmax) [54]. With increasing partial vapour
pressure the maximum outlet temperature achieved is also increased.

31
Table 2-5 Variables used and delta T achieved in 6 hydration experiments of MgSO4 monohydrate
[54].
Figure 2-20 shows hydration curves of MgSO4 [46]. Red plots represent hydration
humidity below the Deliquescence Relative Humidity (DRH) of MgSO4.H2O, blue plots
represent hydration humidity above the DRH of MgSO4.H2O, green lines represent hydration
humidity above the DRH of MgSO4.6H2O and the light blue plot represents hydration
humidity above the DRH of MgSO4.7H2O. The results show the RH is required to be above
the DRH of the required salt hydrate for that salt hydrate to form which is in agreement with
Bertsch et al. [54]. Due to the high DRH of the magnesium sulphate heptahydrate the
theoretical storage density of MgSO4 changes from 2.3 to 2.1GJ/m3 [46]. To achieve a
hydration up to the hexahydrate the RH% needs to be above ‘about’ 85% [46].

32
Figure 2-20 Water uptake hydration curves for MgSO4 against time with different hydration
humidity’s (Red lines = below DRH of MgSO4.H2O, Blue lines = above DRH of MgSO4.H2O, green
lines = above DRH of MgSO4.6H2O, light blue lines = above DRH of MgSO4.7H2O) [46].
2.4.2.2 Sample size and layer thickness effects on the hydration of MgSO4
Figure 2-21 shows hydration results of various sample sizes of pure MgSO4 [28]. All
layer thicknesses hydrate fully however, smaller layer thicknesses hydrate faster. This faster
hydration results in higher power output. This is seen with other salt hydrates including
MgCl2 [25]. Using small sample sizes and thin layer thickness will be difficult in practical
applications of pure MgSO4.
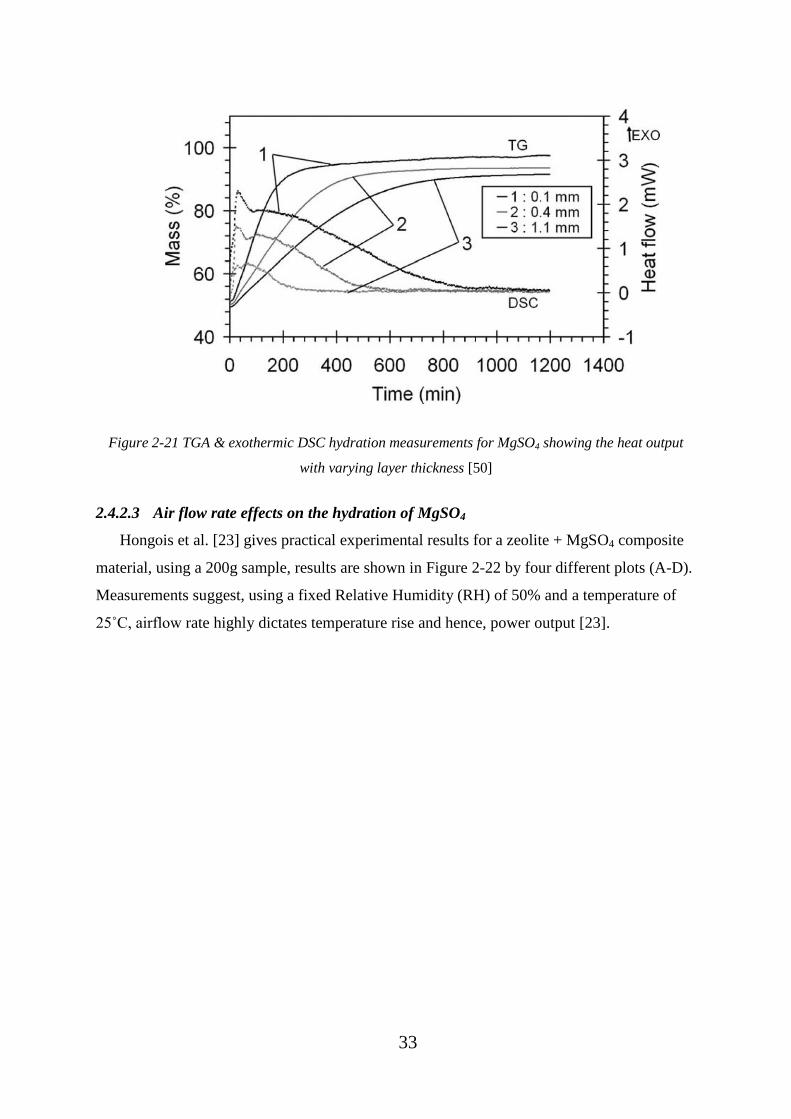
33
Figure 2-21 TGA & exothermic DSC hydration measurements for MgSO4 showing the heat output
with varying layer thickness [50]
2.4.2.3 Air flow rate effects on the hydration of MgSO4
Hongois et al. [23] gives practical experimental results for a zeolite + MgSO4 composite
material, using a 200g sample, results are shown in Figure 2-22 by four different plots (A-D).
Measurements suggest, using a fixed Relative Humidity (RH) of 50% and a temperature of
25˚C, airflow rate highly dictates temperature rise and hence, power output [23].
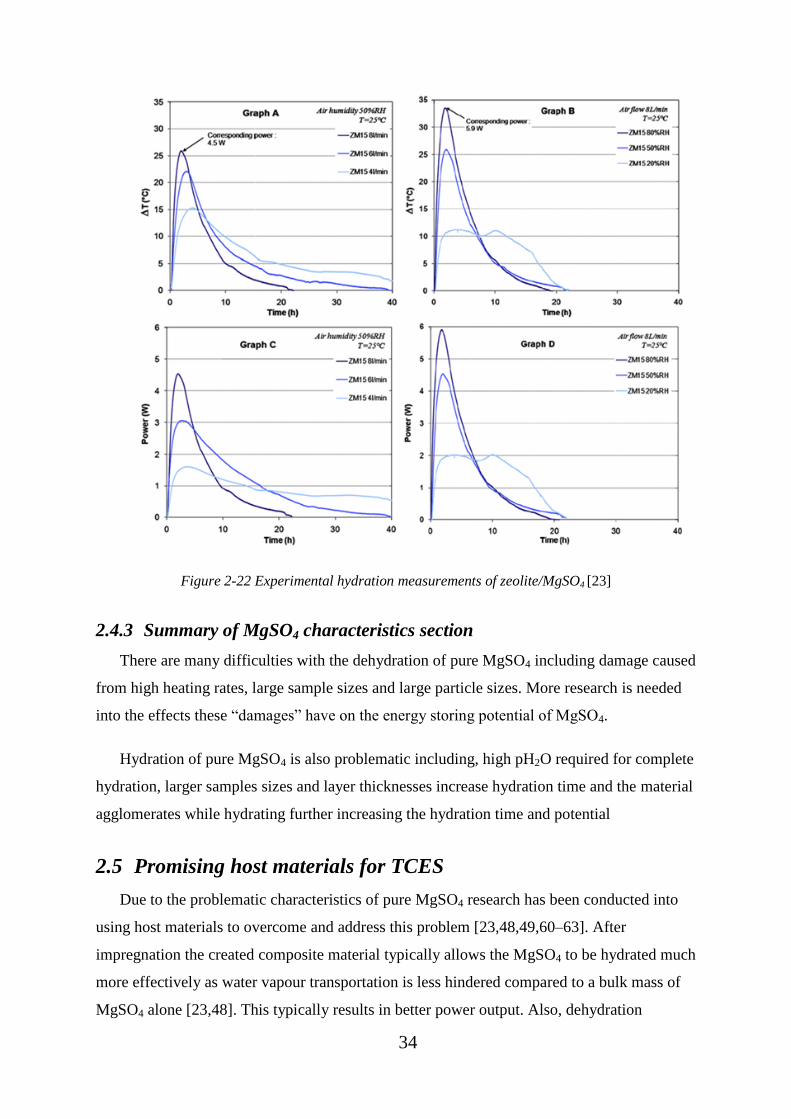
34
Figure 2-22 Experimental hydration measurements of zeolite/MgSO4 [23]
2.4.3 Summary of MgSO4 characteristics section
There are many difficulties with the dehydration of pure MgSO4 including damage caused
from high heating rates, large sample sizes and large particle sizes. More research is needed
into the effects these “damages” have on the energy storing potential of MgSO4.
Hydration of pure MgSO4 is also problematic including, high pH2O required for complete
hydration, larger samples sizes and layer thicknesses increase hydration time and the material
agglomerates while hydrating further increasing the hydration time and potential
2.5 Promising host materials for TCES
Due to the problematic characteristics of pure MgSO4 research has been conducted into
using host materials to overcome and address this problem [23,48,49,60–63]. After
impregnation the created composite material typically allows the MgSO4 to be hydrated much
more effectively as water vapour transportation is less hindered compared to a bulk mass of
MgSO4 alone [23,48]. This typically results in better power output. Also, dehydration

35
becomes more linear and does not occur in stages as MgSO4 dehydration does. The Specific
Surface Area (SSA) of a material plays an important role in the hydration kinetics. If the SSA
is large typically the hydration kinetics will be fast [64].
2.5.1 Zeolites
Zeolites are naturally occurring crystalline aluminosilicate materials with a three
dimensional framework structure [65] [66]. Zeolites typically have very large surface areas
and high porosity [67]. However, the naturally occurring zeolites tend to have many issues
for use in practical applications such as impurities and varying composition [68]. For this
reason zeolites are synthesized in laboratories to produce crystalline materials with a high
purity, these are typically referred to as molecular sieves. The reason for this name is due to
the structure of the zeolites. They have a cage like structure which can be used to “filter” out
molecules from solutions [65].
Zeolites are used for many purposes [66] including water softening in washing powders
(due to their ion exchange properties), adsorption heat storage, heavy metal removal [69] and
petroleum cracking. The petroleum industry benefits significantly from the use of synthesized
zeolites. Synthesized zeolites are orders of magnitude more active than the amorphous silica-
alumina catalysts used before 1962 in the Fluid Catalytic Cracking (FCC) of heavy
petroleum, the use of synthesized zeolites allows for a significantly higher yield of gasoline
compared to the silica-alumina materials which were used before synthetic zeolites [68].
2.5.2 The structure of zeolites
The structure of zeolites gives them their characteristic high porosity and large surface
area. The chemical composition of zeolites can be written as:
𝐴𝑦/𝑚𝑚+ [(𝑆𝑖𝑂2)𝑥 . (𝐴𝑙𝑂2
−)𝑦]. 𝑧𝐻2𝑂 Equation 2-2
Equation 2-2 shows the generic zeolite equation [68], where A is a cation which has a
charge of m, x+y is the amount of tetrahedral in each unit cell and this number is basically the
Si/Al ratio and gives rise to the charge of the zeolite unit cell.
The main types of zeolites used in adsorption heat storage are types A, X and Y
Figure 2-23 shows the unit cell of type A and X/Y zeolites. Image 1 shows the sodalite cage
(β-cage), image 2 shows the unit cell of zeolite A, image 3 the unit cell of zeolite X and Y,

36
image 4 the ion exchange sites on zeolite A (eight 1, three 2 and twelve 3 sites per unit cell)
and image 5 the ion exchange sites on zeolite X and Y (16 – 1 sites, 32 – 1’ sites, 32 - 2 sites,
32 – 2’ sites, 48 – 3 sites and 32 – 3’ sites per unit cell). The sodalite cages in the corners of
the zeolite structures have a hexagonal face which is the opening to the interior of the zeolite
structures [70]. The FAU zeolite has a Si/Al ratio of 1.5 [68].
Figure 2-23 Zeolite Structures - Image 1 shows the sodalite cage (β-cage), image 2 shows the unit cell
of zeolite A, image 3 the unit cell of zeolite X and Y, image 4 the ion exchange sites on zeolite A and
image 5 the ion exchange sites on zeolite X and Y [71]
If 24 tetrahedra are linked together you get the sodalite cage for FAU (zeolite X and Y)
shown below Figure 2-24. This sodalite cage is sometimes referred to as a β-cage [68]. The
main void in the centre of the FAU structure is called the supercage or the α-cage. This α-
cage has a diameter of 13.0x10⁻¹⁰
m [68,72]. It is difficult to picture the 3-dimensional layout
of the FAU supercage as only 7 of the β-cages are visible in Figure 2-24 however, the
supercage is surrounded by 10 β-cages. Figure 2-25 (right) shows a representation of the
FAU supercage showing each of the 10 sodalite cages. The openings to the supercage are
then connected to 4 more supercages through the windows on each supercage. The size of the
openings to the centre of the super cage is 7.4x10⁻¹⁰
m [68,72]. The super cages are connected
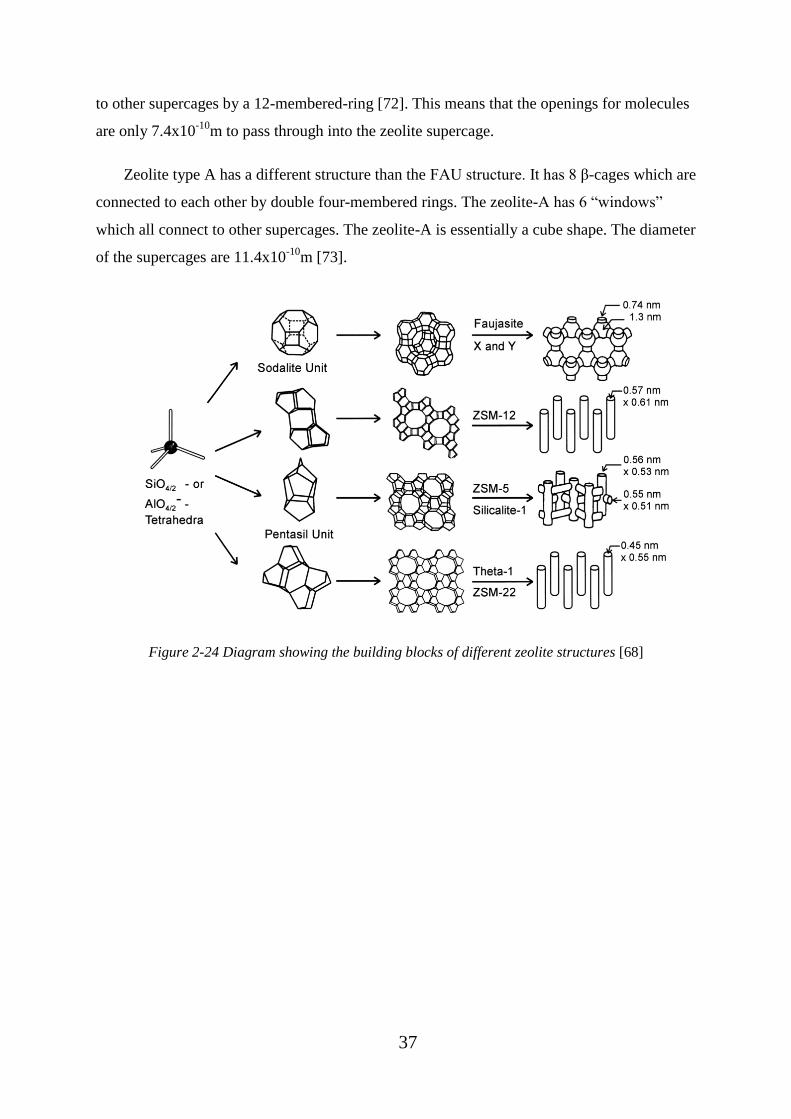
37
to other supercages by a 12-membered-ring [72]. This means that the openings for molecules
are only 7.4x10⁻¹⁰
m to pass through into the zeolite supercage.
Zeolite type A has a different structure than the FAU structure. It has 8 β-cages which are
connected to each other by double four-membered rings. The zeolite-A has 6 “windows”
which all connect to other supercages. The zeolite-A is essentially a cube shape. The diameter
of the supercages are 11.4x10⁻¹⁰
m [73].
Figure 2-24 Diagram showing the building blocks of different zeolite structures [68]
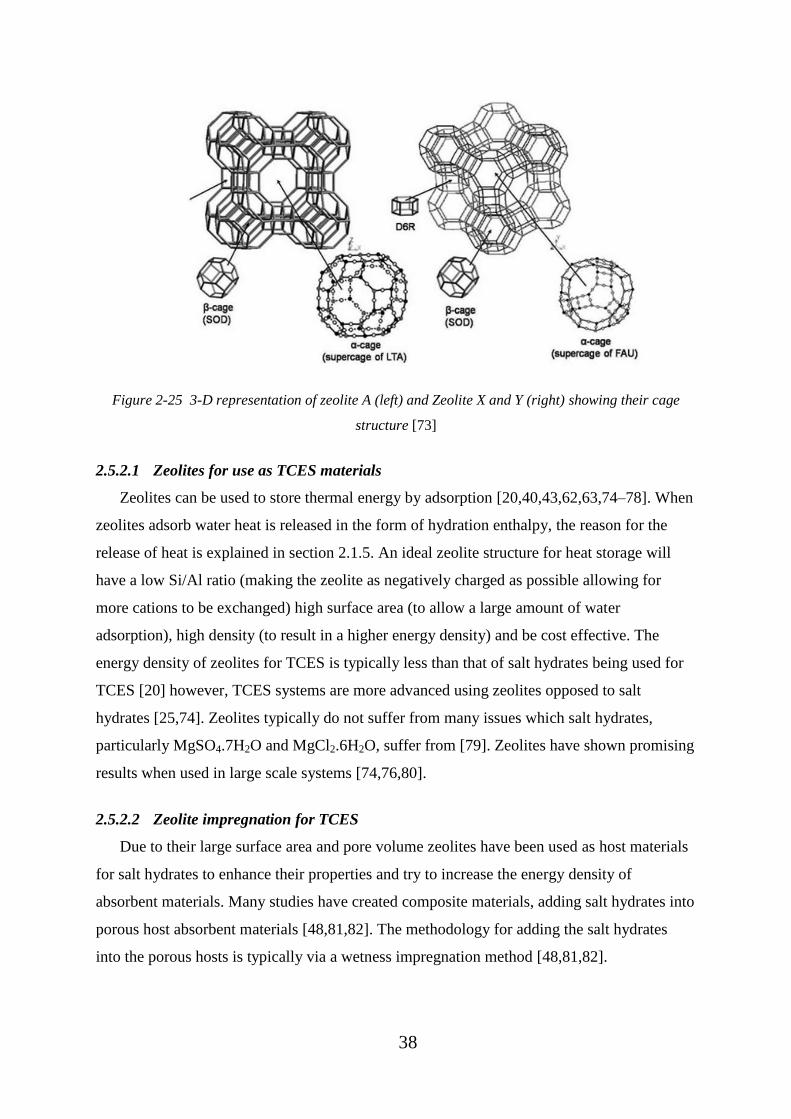
38
Figure 2-25 3-D representation of zeolite A (left) and Zeolite X and Y (right) showing their cage
structure [73]
2.5.2.1 Zeolites for use as TCES materials
Zeolites can be used to store thermal energy by adsorption [20,40,43,62,63,74–78]. When
zeolites adsorb water heat is released in the form of hydration enthalpy, the reason for the
release of heat is explained in section 2.1.5. An ideal zeolite structure for heat storage will
have a low Si/Al ratio (making the zeolite as negatively charged as possible allowing for
more cations to be exchanged) high surface area (to allow a large amount of water
adsorption), high density (to result in a higher energy density) and be cost effective. The
energy density of zeolites for TCES is typically less than that of salt hydrates being used for
TCES [20] however, TCES systems are more advanced using zeolites opposed to salt
hydrates [25,74]. Zeolites typically do not suffer from many issues which salt hydrates,
particularly MgSO4.7H2O and MgCl2.6H2O, suffer from [79]. Zeolites have shown promising
results when used in large scale systems [74,76,80].
2.5.2.2 Zeolite impregnation for TCES
Due to their large surface area and pore volume zeolites have been used as host materials
for salt hydrates to enhance their properties and try to increase the energy density of
absorbent materials. Many studies have created composite materials, adding salt hydrates into
porous host absorbent materials [48,81,82]. The methodology for adding the salt hydrates
into the porous hosts is typically via a wetness impregnation method [48,81,82].
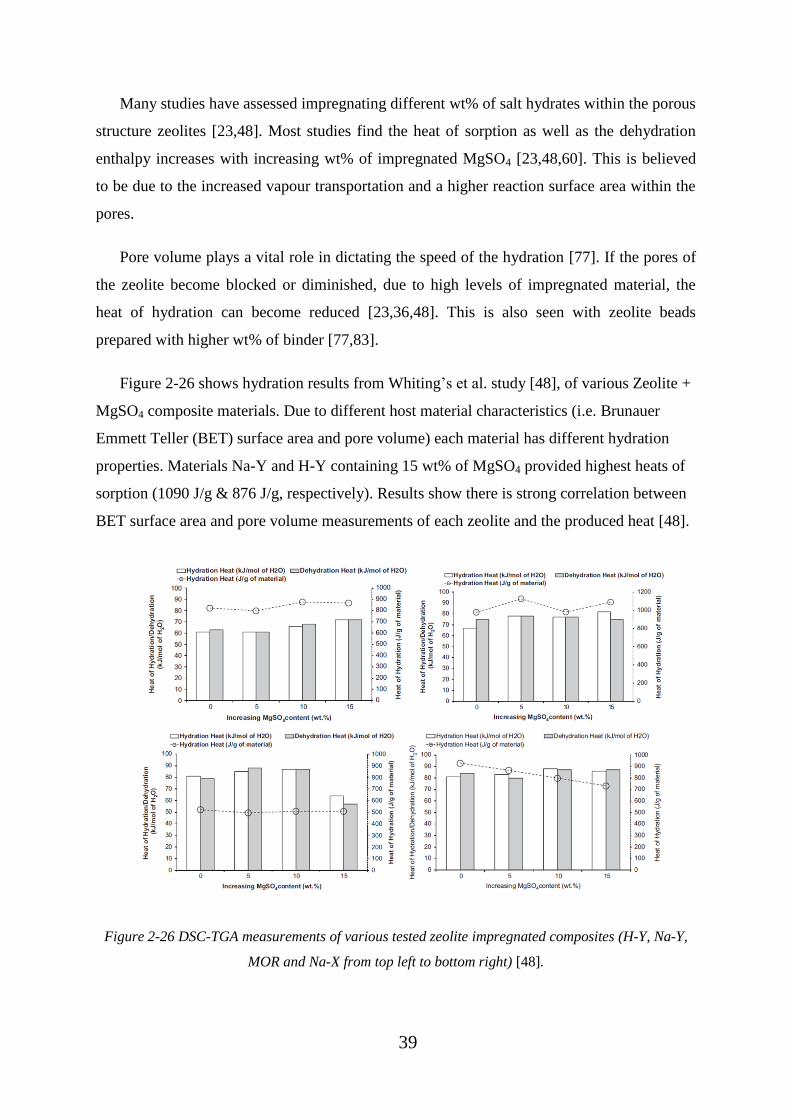
39
Many studies have assessed impregnating different wt% of salt hydrates within the porous
structure zeolites [23,48]. Most studies find the heat of sorption as well as the dehydration
enthalpy increases with increasing wt% of impregnated MgSO4 [23,48,60]. This is believed
to be due to the increased vapour transportation and a higher reaction surface area within the
pores.
Pore volume plays a vital role in dictating the speed of the hydration [77]. If the pores of
the zeolite become blocked or diminished, due to high levels of impregnated material, the
heat of hydration can become reduced [23,36,48]. This is also seen with zeolite beads
prepared with higher wt% of binder [77,83].
Figure 2-26 shows hydration results from Whiting’s et al. study [48], of various Zeolite +
MgSO4 composite materials. Due to different host material characteristics (i.e. Brunauer
Emmett Teller (BET) surface area and pore volume) each material has different hydration
properties. Materials Na-Y and H-Y containing 15 wt% of MgSO4 provided highest heats of
sorption (1090 J/g & 876 J/g, respectively). Results show there is strong correlation between
BET surface area and pore volume measurements of each zeolite and the produced heat [48].
Figure 2-26 DSC-TGA measurements of various tested zeolite impregnated composites (H-Y, Na-Y,
MOR and Na-X from top left to bottom right) [48].
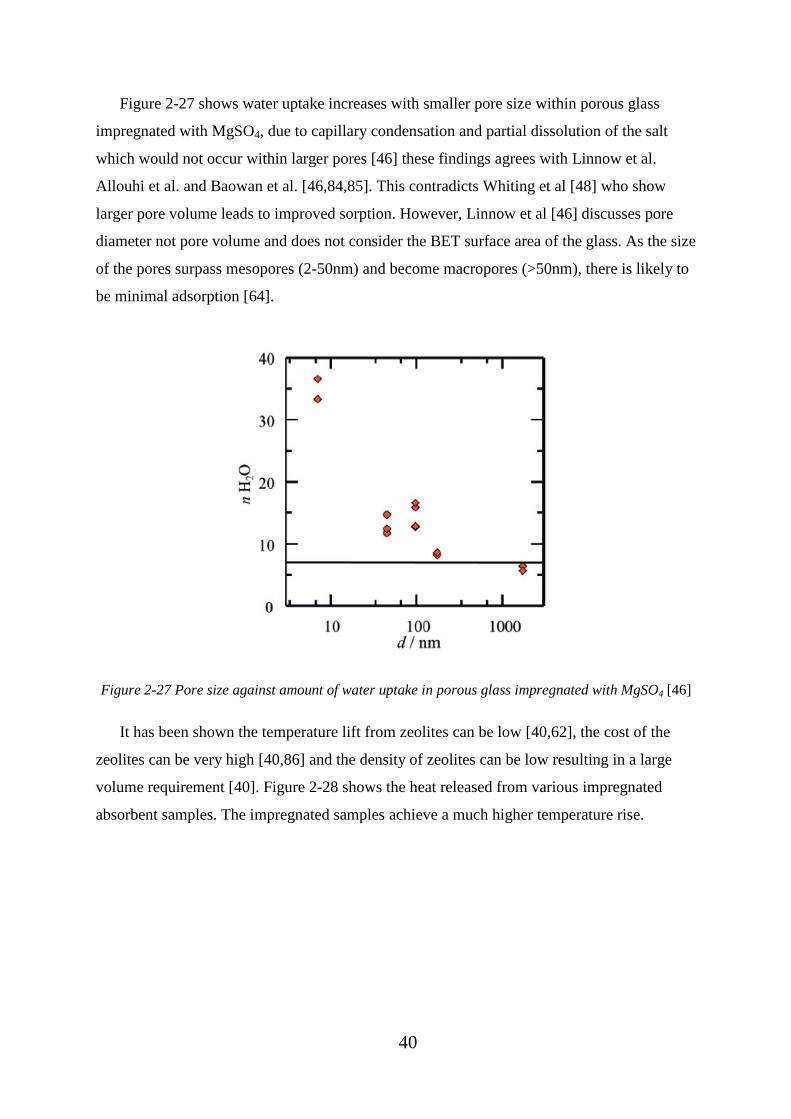
40
Figure 2-27 shows water uptake increases with smaller pore size within porous glass
impregnated with MgSO4, due to capillary condensation and partial dissolution of the salt
which would not occur within larger pores [46] these findings agrees with Linnow et al.
Allouhi et al. and Baowan et al. [46,84,85]. This contradicts Whiting et al [48] who show
larger pore volume leads to improved sorption. However, Linnow et al [46] discusses pore
diameter not pore volume and does not consider the BET surface area of the glass. As the size
of the pores surpass mesopores (2-50nm) and become macropores (>50nm), there is likely to
be minimal adsorption [64].
Figure 2-27 Pore size against amount of water uptake in porous glass impregnated with MgSO4 [46]
It has been shown the temperature lift from zeolites can be low [40,62], the cost of the
zeolites can be very high [40,86] and the density of zeolites can be low resulting in a large
volume requirement [40]. Figure 2-28 shows the heat released from various impregnated
absorbent samples. The impregnated samples achieve a much higher temperature rise.

41
Figure 2-28 Temperature lift measurements of the hydration of various composite materials- SM16 =
silica gel/MgSO4, ZM15 – zeolite/MgSO4[23]
2.5.2.3 Zeolite ion exchange for TCES
Another method used to try to improve the energy density of zeolites is through ion
exchange. Zeolites can be put through an ion exchange process to replace the current ions
with ions of higher selectivity to the absorbed material. The hydration energy of zeolites
depends on the amount of cations which are accessible to the adsorbed material which, for
TES, is commonly water [87].
Water absorbed by zeolites is bonded in two main ways, weakly bound water on the
surface and within the voids of the zeolite and secondly through strong interactions with the
ions within the zeolite material [88]. The amount of ions within a zeolite type material and
thus, the amount of ions which can be exchanged depends on the Si/Al ratio of the material
[88], due to the cations balancing the net negative charge of the alumina silicate structure
[87]. A lower Si/Al ratio also results in a more hydrophilic zeolite [89].
Molecular sieves adsorption properties, crystal cage and hydration can be altered by ion
exchange [90]. Research has shown that ion exchange changes the water uptake of zeolites
[91]. Zeolites characteristics can be enhanced using cation exchange[60,61,92]. Janchen et al.
[61] used powdered zeolites while Stach et al [92] used 1g of an undisclosed form of zeolites
and replaced Na+
ions for Mg2+
ions. As a result the zeolites show an increased water sorption
amount (see Figure 2-29) [60,61,92]. Other studies have also reported an increase in
hydration heat from zeolites after a Mg ion exchange [93,94].
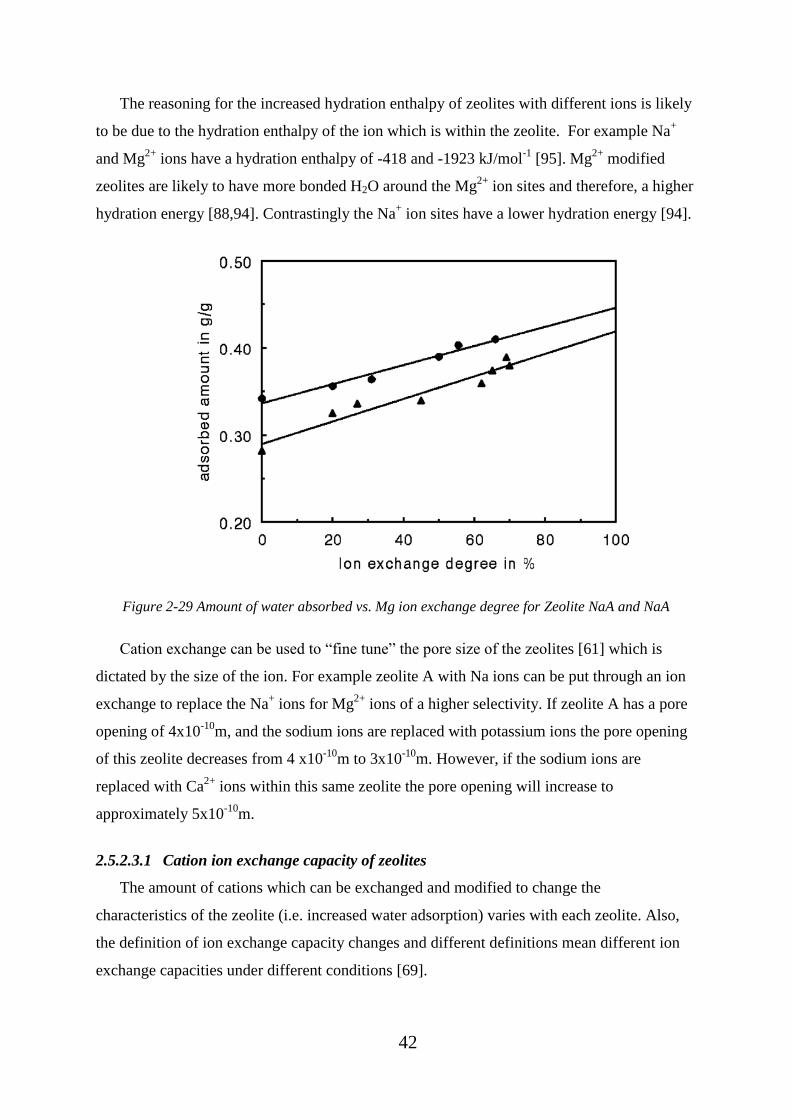
42
The reasoning for the increased hydration enthalpy of zeolites with different ions is likely
to be due to the hydration enthalpy of the ion which is within the zeolite. For example Na+
and Mg2+
ions have a hydration enthalpy of -418 and -1923 kJ/mol-1
[95]. Mg2+
modified
zeolites are likely to have more bonded H2O around the Mg2+
ion sites and therefore, a higher
hydration energy [88,94]. Contrastingly the Na+ ion sites have a lower hydration energy [94].
Figure 2-29 Amount of water absorbed vs. Mg ion exchange degree for Zeolite NaA and NaA
Cation exchange can be used to “fine tune” the pore size of the zeolites [61] which is
dictated by the size of the ion. For example zeolite A with Na ions can be put through an ion
exchange to replace the Na+ ions for Mg
2+ ions of a higher selectivity. If zeolite A has a pore
opening of 4x10⁻¹⁰
m, and the sodium ions are replaced with potassium ions the pore opening
of this zeolite decreases from 4 x10⁻¹⁰
m to 3x10⁻¹⁰
m. However, if the sodium ions are
replaced with Ca2+
ions within this same zeolite the pore opening will increase to
approximately 5x10⁻¹⁰
m.
2.5.2.3.1 Cation ion exchange capacity of zeolites
The amount of cations which can be exchanged and modified to change the
characteristics of the zeolite (i.e. increased water adsorption) varies with each zeolite. Also,
the definition of ion exchange capacity changes and different definitions mean different ion
exchange capacities under different conditions [69].
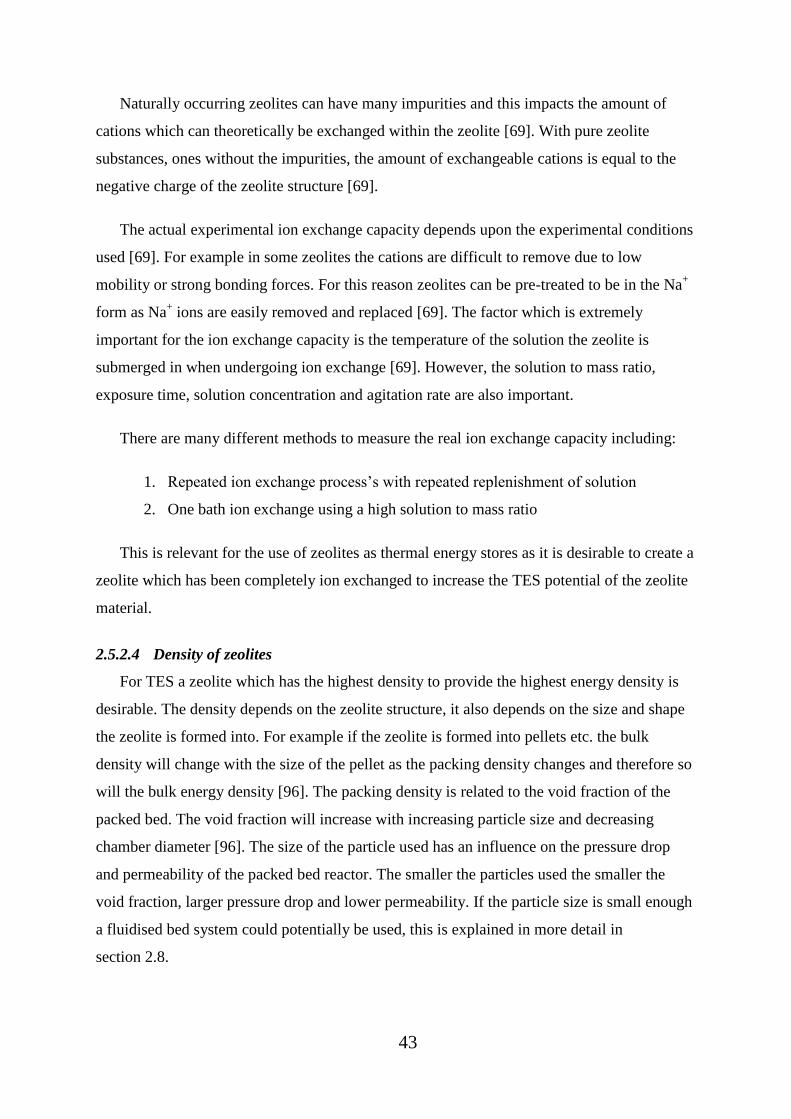
43
Naturally occurring zeolites can have many impurities and this impacts the amount of
cations which can theoretically be exchanged within the zeolite [69]. With pure zeolite
substances, ones without the impurities, the amount of exchangeable cations is equal to the
negative charge of the zeolite structure [69].
The actual experimental ion exchange capacity depends upon the experimental conditions
used [69]. For example in some zeolites the cations are difficult to remove due to low
mobility or strong bonding forces. For this reason zeolites can be pre-treated to be in the Na+
form as Na+ ions are easily removed and replaced [69]. The factor which is extremely
important for the ion exchange capacity is the temperature of the solution the zeolite is
submerged in when undergoing ion exchange [69]. However, the solution to mass ratio,
exposure time, solution concentration and agitation rate are also important.
There are many different methods to measure the real ion exchange capacity including:
1. Repeated ion exchange process’s with repeated replenishment of solution
2. One bath ion exchange using a high solution to mass ratio
This is relevant for the use of zeolites as thermal energy stores as it is desirable to create a
zeolite which has been completely ion exchanged to increase the TES potential of the zeolite
material.
2.5.2.4 Density of zeolites
For TES a zeolite which has the highest density to provide the highest energy density is
desirable. The density depends on the zeolite structure, it also depends on the size and shape
the zeolite is formed into. For example if the zeolite is formed into pellets etc. the bulk
density will change with the size of the pellet as the packing density changes and therefore so
will the bulk energy density [96]. The packing density is related to the void fraction of the
packed bed. The void fraction will increase with increasing particle size and decreasing
chamber diameter [96]. The size of the particle used has an influence on the pressure drop
and permeability of the packed bed reactor. The smaller the particles used the smaller the
void fraction, larger pressure drop and lower permeability. If the particle size is small enough
a fluidised bed system could potentially be used, this is explained in more detail in
section 2.8.
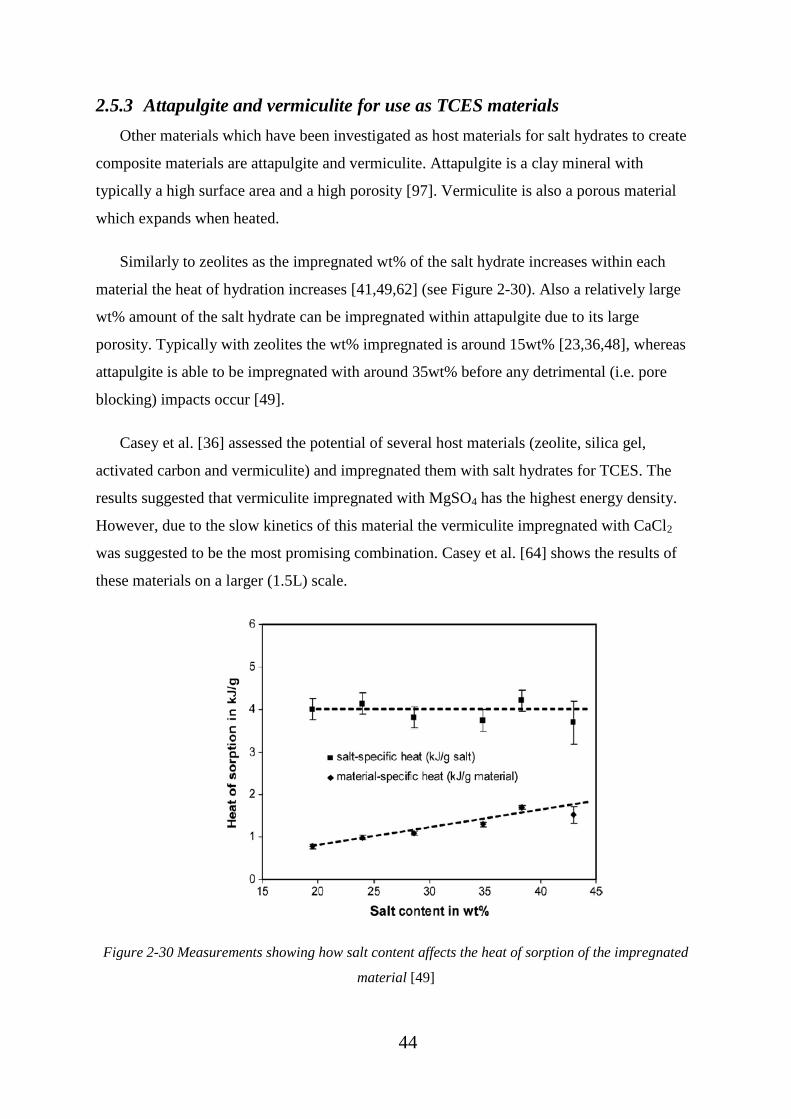
44
2.5.3 Attapulgite and vermiculite for use as TCES materials
Other materials which have been investigated as host materials for salt hydrates to create
composite materials are attapulgite and vermiculite. Attapulgite is a clay mineral with
typically a high surface area and a high porosity [97]. Vermiculite is also a porous material
which expands when heated.
Similarly to zeolites as the impregnated wt% of the salt hydrate increases within each
material the heat of hydration increases [41,49,62] (see Figure 2-30). Also a relatively large
wt% amount of the salt hydrate can be impregnated within attapulgite due to its large
porosity. Typically with zeolites the wt% impregnated is around 15wt% [23,36,48], whereas
attapulgite is able to be impregnated with around 35wt% before any detrimental (i.e. pore
blocking) impacts occur [49].
Casey et al. [36] assessed the potential of several host materials (zeolite, silica gel,
activated carbon and vermiculite) and impregnated them with salt hydrates for TCES. The
results suggested that vermiculite impregnated with MgSO4 has the highest energy density.
However, due to the slow kinetics of this material the vermiculite impregnated with CaCl2
was suggested to be the most promising combination. Casey et al. [64] shows the results of
these materials on a larger (1.5L) scale.
Figure 2-30 Measurements showing how salt content affects the heat of sorption of the impregnated
material [49]

45
2.5.4 Carbon fibres and activated carbons for use as TCES materials
Carbon fibre and activated carbons typically have large porosity measurements [34].
Activated carbons are very absorbent and typically have a large surface area (500-1500m2/g)
[34]. Carbon materials typically have a large thermal conductivity. These reasons are why
carbon fibre and activated carbon are considered for use as host materials for salt hydrates to
be used as TCES materials [36,98,99].
The disadvantage of carbon fibre is its poor thermal conductivity in the fibres radial
direction[34], which can be further diminished if the absorbed material (i.e. MgSO4) swells
during absorption. More graphitized carbon fibre has a higher thermal conductivity however,
higher graphitization results in a higher cost [100]
These materials have been shown to increase the thermal conductivity of salt hydrates
significantly [98,99]. Aidoun et al. [98] investigated the effect of impregnating carbon fibres
with NH3-CoCl2, the carbon fibre increased the power densities to a level comparable to
chloride salts intercalated into graphite, which is a much more complex method of creating
composite materials.
Although the thermal conductivity may be increased is has been shown that there are host
materials which provide much better characteristics (energy density, lower cost) relative to
activated carbons [36].
2.5.5 Silica gel for use as a TCES material
Silica gel is a commonly known mesoporous absorbent [42]. Due to its pore volume it has
been investigated for use as a host material for salt hydrates [23,36,42,92]. Research shows
that silica gel, relative to zeolite, can allow for lower desorption (charging) temperatures
(~90˚C) [42,92]. Table 2-6 shows data for a composite zeolite (NaLiX) and composite silica
gel (KG5-88 + CaCl2). The results show the silica gel performs better than the zeolite even
though the silica gel was dehydrated (charged) with a lower temperature.
46
Table 2-6 Comparison of the specific heat storage density of absorbent materials compared to the
heat capacity of water at different temperatures [92]
Alone silica gel does not absorb large amounts of water [36,42]. Although, as with many
of the host materials discussed above, the silica gel absorbs more water with increasing
impregnation wt% of salt hydrates. As the wt% of salt hydrate impregnated increases, the
pore volume is shown to decrease, as expected, but with a relatively large amount of
impregnated material (40wt%) the composite materials do not show signs of degradation or
pore blocking. Wu et al. [42] suggests 30wt% to be an optimal amount as above this value
degradation is seen over several cycles suggesting a leakage of the salt from the pores, this
study was also on a large (40kg) scale.
Figure 2-31 Effects of CaCl2 concentration on the dynamic sorption characteristics of water on
composite sorbents showing the absorbed amounts [42]

47
Although silica gel can be used as a host for composite materials its absorption capacities
are not as promising as some other host materials [36]. Figure 2-32 shows vermiculite
impregnated with CaCl2 absorbed more water than silica gel impregnated with CaCl2. The
majority of water is absorbed at a RH% which is below ~55% for the vermiculite composite.
This is beneficial for domestic applications. Pure silica gel has much better sorption
characteristics than pure vermiculite however, once impregnated with a salt hydrate this
changes dramatically.
Figure 2-32 Moisture vapour sorption isotherms for the selective materials studied SIM-2a = silica
gel + CaCl2, SIM-3a = Vermiculite + CaCl2. [36]

48
2.5.6 Summary of promising host materials for TCES
Table 2-7 shows the advantages and disadvantages of each of the potential host materials
for TCES.
Table 2-7 Advantages and disadvantaged of absorbent host materials
Material Advantages Disadvantages
Zeolite Most developed TCES
systems
High surface area and
pore volume
Energy density of systems
Cost of material
Lack of large scale sample
preparation feasibility
Attapulgite
&
Vermiculite
Very porous material
and good hosts
Cheap
Widely available
Lack of large scale research
Lack of research on sample
preparation (i.e. particle / bead
size to improve slow kinetics
of MgSO4 impregnated within
vermiculite [36], [64])
Silica Gel Allows for typically
lower desorption
temperatures relative to
zeolites.
Accommodates high
impregnation amounts
Poor sorption characteristics
when impregnated, relative to
other materials [42]
Lack of research into varying
beads size of silica gel.
Carbon
Fibre &
Activated
Carbon
Typically high thermal
conductivity
Other hosts shown to be more
promising
Typically very high cost
Minimal work on
impregnation of salt hydrates
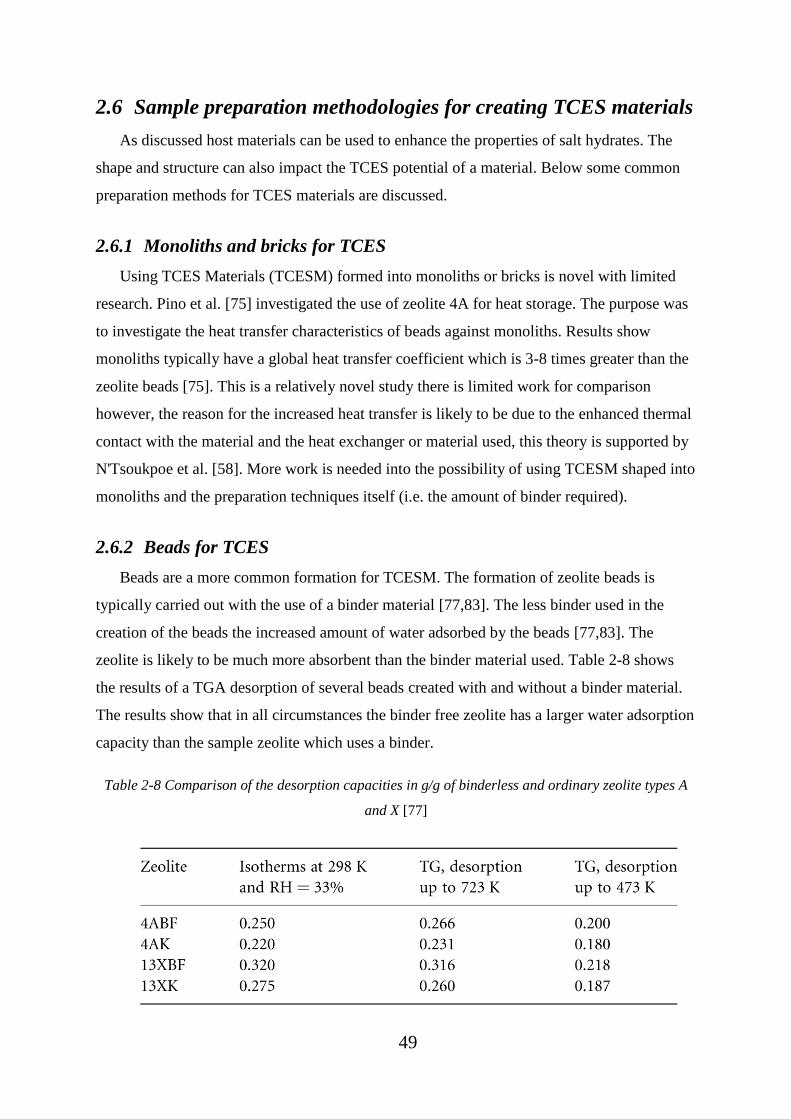
49
2.6 Sample preparation methodologies for creating TCES materials
As discussed host materials can be used to enhance the properties of salt hydrates. The
shape and structure can also impact the TCES potential of a material. Below some common
preparation methods for TCES materials are discussed.
2.6.1 Monoliths and bricks for TCES
Using TCES Materials (TCESM) formed into monoliths or bricks is novel with limited
research. Pino et al. [75] investigated the use of zeolite 4A for heat storage. The purpose was
to investigate the heat transfer characteristics of beads against monoliths. Results show
monoliths typically have a global heat transfer coefficient which is 3-8 times greater than the
zeolite beads [75]. This is a relatively novel study there is limited work for comparison
however, the reason for the increased heat transfer is likely to be due to the enhanced thermal
contact with the material and the heat exchanger or material used, this theory is supported by
N'Tsoukpoe et al. [58]. More work is needed into the possibility of using TCESM shaped into
monoliths and the preparation techniques itself (i.e. the amount of binder required).
2.6.2 Beads for TCES
Beads are a more common formation for TCESM. The formation of zeolite beads is
typically carried out with the use of a binder material [77,83]. The less binder used in the
creation of the beads the increased amount of water adsorbed by the beads [77,83]. The
zeolite is likely to be much more absorbent than the binder material used. Table 2-8 shows
the results of a TGA desorption of several beads created with and without a binder material.
The results show that in all circumstances the binder free zeolite has a larger water adsorption
capacity than the sample zeolite which uses a binder.
Table 2-8 Comparison of the desorption capacities in g/g of binderless and ordinary zeolite types A
and X [77]

50
Janchen et al. [77] states that the use of binder free beads also results in faster hydration
kinetics. Likely due to the increased pore volume which is not hindered by the binder
material, this agrees with [23,36,48]. In contradiction, Janchen et al. [43] states the
temperature rise achieved from zeolite beads prepared with and without binder is not vastly
different. Suggesting although there is less zeolite the rate at which the beads hydrate is
unchanged and possibly improved. This suggests the vapour transportation is not hindered by
the binder. More work is required to understand this further.
Fakin et al. [83] states the size of the bead used does not impact the amount of water
absorbed by the material. However, the size of the bead does impact the rate in which the
material hydrates, the larger the bead the slower the hydration. This is due to the resistance
against the moisture transfer into the centre of the beads. Larger diameter beads have more
resistance to the moisture from the porous media. This is important as smaller beads typically
result in a larger pressure drop when used in a packed bed reactor design.
N'Tsoukpoe et al. [58] discusses the correlation between bead size and permeability. This
is an important consideration especially when working with powders which have a very small
particle size. Mass transfer in adsorbent beds is usually considered through permeability
analysis. Equation 2-3 is used to calculate the permeability of a bed.
𝐾 = 𝑛3
1− 𝑛2 .
𝑑2
180 Equation 2-3 [58]
Where 𝐾 = permeability of the bed, 𝑛 = its porosity and 𝑑 (m) diameter of the grains. The
recommended values for an adsorbent bed are:
Permeability = 10-12
m2
Effective thermal conductivity: 1 Wm-1
k-1
Heat transfer coefficient at interface between heat exchanger tube and adsorbents bed:
200Wm-2
K-1
A reasonable amount of research has been conducted into the use of beads for TCES.
More research is required into larger scale testing as small testing can be misleading [58].

51
2.6.2.1 Pelletization for TCES
Many absorbents are made in a fine powder form and not easily sourced in a pellet or
bead. A method for creating beads from powders is with the use of a pelletizing disc.
Pelletization is an agglomeration technique that uses a spinning disc held at an angle where
fine particles are added gradually. Moisture is added to the spinning particles and this causes
the particles to agglomerate and form beads/pellets [101]. Figure 2-33 shows an example of a
pelletizing disc. As the disc spins this carries the fine particles up, the angle of the disc, the
size of the particles and the friction between the disc and the particles all dictate where the
particles fall back down under gravitational forces. As the particles fall they roll in moisture
and agglomerate with other particles forming larger particles. The size of the particles should
be less than 150 µm in size and more than 60% of the particles should be less than 45 µm in
size [101] which will lead to pellets with the maximum surface tension and capillary forces
locking them together.
𝑛𝑐𝑟 = 42.3
√𝐷√𝑠𝑖𝑛 𝑥 Equation 2-4 [102]
Where 𝒏𝒄𝒓 = critical Revolutions Per Minute (RPM), 𝑫 = disc diameter and 𝒙 = disc
inclination angle. Equation 2-4 is used to calculate the optimum angle and rpm ratio [102].
Gu et al. [102] shows that due to the friction created by the pan these value are not always
correct and some trial and error is required depending upon the material used. Furthermore,
optimizing the rpm and disc inclination can change the crushing pressure of the pellets
produced. The larger the particle diameter the lower the crushing pressure required [102]. Gu
et al. used a 40cm disc and found the optimum rpm and disc inclination to be 45 and 43˚,
respectively [102]. The amount of water added to the powder solution will dictate the size of
the pellets created.
Pandey et al. [101], attempted to optimize agglomeration pelletisers for a steel company
hence, this is a full scale assessment. The study made several conclusions.
The time the material spends in the pelletiser increases the size of the pellets formed.
Lower RPM causes larger pellets to be formed.
Smaller particle size leads to pellets with a higher mechanical interlocking force which
creates pellets with a higher crushing force.
If the amount of moisture added to the material is above the critical amount the growth
rate increases but the pellets are liable to become deformed.

52
Over a specific RPM the amount of “undersized” pellets formed increases. This is
accounted to the impact of pellets on pellets causing them to break.
A higher feed rate requires a higher RPM which in turn leads to a reduction of pellets in
the required size range.
From both of these studies it is apparent different materials and conditions require some
trial and error to optimise the pellets created. However, there are several reoccurring themes
from both studies;
Increasing the moisture content will increase the pellet size.
A smaller particle size will result in pellets with a higher crushing force.
Figure 2-33 An example pelletizing disc (letters A, B, C and D represent locations of where nozzles
are located on this specific pelletizing disc). [101]
2.6.3 Honeycombs for TCES
It is possible to form absorbent powders into honeycomb structures for TES [43,103–
106]. Studies [103–105] investigate Wakkanai Siliceous Shale (WSS) based honeycombs
impregnated with CaCl2 and LiCl, whereas Jänchen et al. [43] looks at zeolite based
honeycombs with and without a binder. The pore volume and surface area of the WSS
honeycombs are dramatically reduced with increasing wt% of the impregnated materials.

53
The reason for the creation of the honeycomb is an attempt to increase the hydration rates
which should in turn increase the power output [103–106]. MgSO4 suffers from slow
hydration characteristics, possibly a honeycomb structure could improve this.
Figure 2-34 shows the hydration characteristics of different honeycomb structures. It is
obvious as the wt% of CaCl2 increases so does the energy output.
Figure 2-34 Inlet and outlet change in temperature with time for different honeycomb filters [103]
Jänchen et al. [43] concludes by stating the use of a honeycomb formation is more
promising than beads, there does not appear to be any studies supporting this statement.
Zondag et al. [106] states honeycombs cause increased adsorption.
The use of honeycombs is shown to be advantageous. Limited studies have been
conducted and more are required comparing different formations. Investigations into the
feasibility of creating honeycombs compared with other formations is required as the
preparation methods for honeycombs is likely to be more costly [106].
54
2.7 Possible ways to create composite materials
The way in which composite materials are prepared should be considered for many
reasons, including cost, simplicity and advantageous TCES characteristics. Below are
commonly used ways to create composite materials [34].
2.7.1 Simple mixture for creating TCES composite materials
A simple mixture is the simplest method for creating composite materials. The ratio of
each, the host material and absorbent (i.e. MgSO4) are calculated and the selected mass of
both materials are mixed together. This method is generally used when each material is in a
granular form [34]. This method has been used by Posern [49] to investigate the TCES
potential of MgSO4 and MgCl2 at varying wt% mixing levels.
2.7.2 Impregnation for creating TCES composite materials
Impregnation is typically used for activated carbons, carbon fibre, graphite fibre or
expanded graphite [34]. This process typically dehydrates the host material to ensure all
water content is lost. The host material is then exposed to an aqueous solution of the TCES
material (i.e. MgSO4). The composite material is then dehydrated to ensure removal of all
water content from the salt solution. This leaves dehydrated TCES material fragments
impregnated onto the host material. Impregnation is much simpler than Intercalation [98].
This method has been used in many studies for TCES [48,81,82].
Wu et al. [42] specifically investigates the impact the impregnation characteristics have
on the sorption properties of the material. The variables which are changed are the
impregnation temperature (25-80˚C) and the impregnation time (1-8h). The results show
significant changes in the water sorption amount, up to 18%. Most studies do not appear to
consider these variables. This highlights the need for further studies to confirm these results.
2.7.3 Mixture or impregnation and consolidation for creating TCES
composite materials
This method uses a mixture of TCES materials or impregnated composite TCES materials
and compresses them. The compression can happen before the impregnation although; the
compressed materials after impregnation would need to be dehydrated once more. More
research is needed on this method.
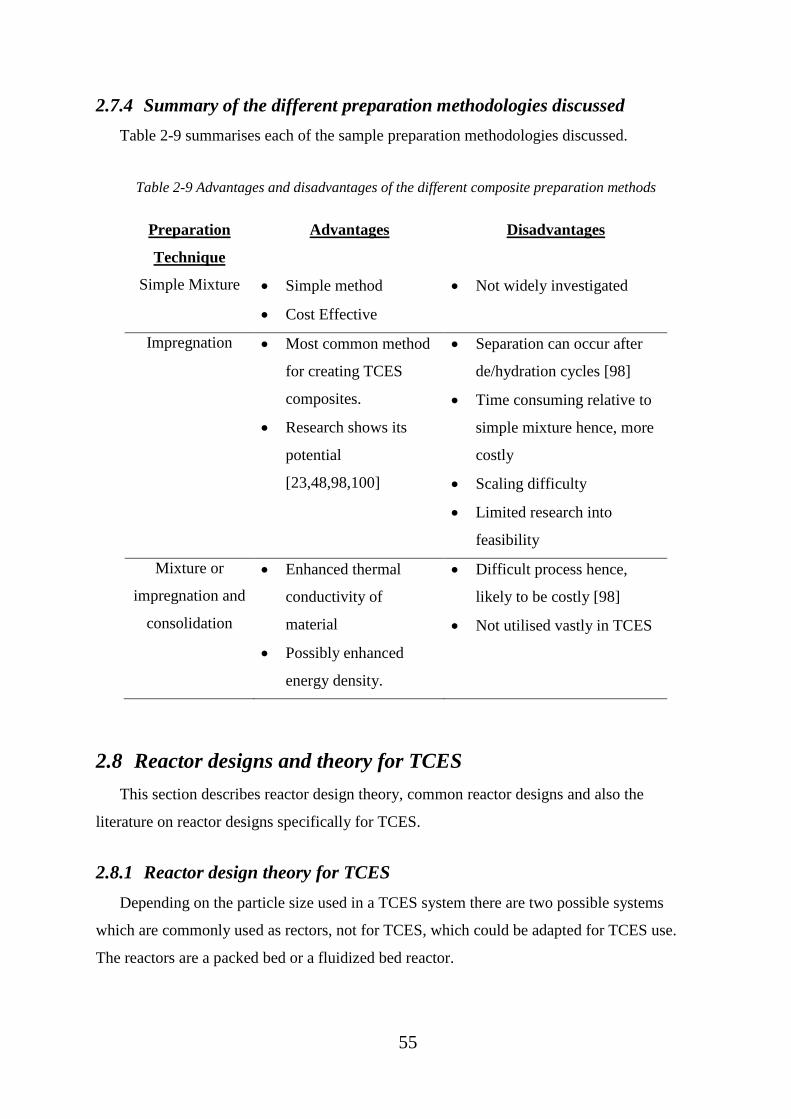
55
2.7.4 Summary of the different preparation methodologies discussed
Table 2-9 summarises each of the sample preparation methodologies discussed.
Table 2-9 Advantages and disadvantages of the different composite preparation methods
Preparation
Technique
Advantages Disadvantages
Simple Mixture Simple method
Cost Effective
Not widely investigated
Impregnation Most common method
for creating TCES
composites.
Research shows its
potential
[23,48,98,100]
Separation can occur after
de/hydration cycles [98]
Time consuming relative to
simple mixture hence, more
costly
Scaling difficulty
Limited research into
feasibility
Mixture or
impregnation and
consolidation
Enhanced thermal
conductivity of
material
Possibly enhanced
energy density.
Difficult process hence,
likely to be costly [98]
Not utilised vastly in TCES
2.8 Reactor designs and theory for TCES
This section describes reactor design theory, common reactor designs and also the
literature on reactor designs specifically for TCES.
2.8.1 Reactor design theory for TCES
Depending on the particle size used in a TCES system there are two possible systems
which are commonly used as rectors, not for TCES, which could be adapted for TCES use.
The reactors are a packed bed or a fluidized bed reactor.
56
2.8.1.1 Packed bed reactor for TCES
If the particle size is relatively large (i.e. 3mm beads) it is likely the reactor would be a
packed bed. A packed bed is a reactor which has a cylindrical column packed with material.
Typically a liquid is passed into the reactor at the top and a gas enters at the bottom of the
reactor and passes back out of the top [107]. However, in a TCES system it would be likely
that the packed material would be an absorbent (i.e. zeolite or salt hydrate) and then the gas,
likely humid air, will pass through the system hydrating the material and realising the heat of
adsorption.
With a packed bed the important characteristics are the pressure drop through the reactor
which depends upon the flow rate required and also achieving a uniform fluid flow to avoid
areas of stagnation. The pressure drop of the fluid through the reactor is calculated using a
friction factor correlation attributed to Ergun [107].
2.8.1.2 Fluidised bed reactor for TCES
If the particle size is small, for example a powder absorbent or salt hydrate, there is a
possibility of using a fluidised bed reactor design. A fluidised bed is similar to a packed bed
reactor however; the velocity of the fluid flowing through the packed bed is large enough to
overcome the gravitational forces on the particles causing them to lift. This causes the
particles to act like a fluid and if desired the particles can be transported like a fluid when in
this state. This method allows for very good contact between the fluid and the solids. As the
velocity of the fluid through the bed of particles is increased two things happen:
1. The pressure drop within the system increases up to the fluidisation point. After the
point of fluidisation the pressure drop decreases slightly and becomes constant with
increasing velocity.
2. The height of the bed stays constant up until the fluidisation velocity, at which
point the bed height starts to increase with increasing velocity. Each of these two
phenomenons is depicted in Figure 2-35.

57
Figure 2-35 The trends in pressure drop and bed height with superficial velocity for a fluidised bed
reactor (A = part of the curve where the Ergun equation can be used to describe the increasing
pressure drop with increasing velocity, B = bed starts to expand while pressure drop remains
constant. The force on the particles balances the net weight of the particles and separation of the
particles begins, C = bed expands further but pressure drop remains constant, D = bed decreases
with velocity but pressure drop remains constant, E = after the velocity is decreased below the
superficial velocity the bed height remains constant but the pressure drop decreases with velocity. The
bed height is higher than the original bed height after fluidization due to the particles becoming less
packed, if left alone, over time the particles will return to the packed bed height.) [107]
If a circumstance takes place where the superficial velocity is very high and small
particles are carried out of the reactor then they can be recovered either by filters or cyclone
separators and returned to the reactor. This may be desirable to take advantage of high
superficial velocities.
The type of fluidisation the particles within the bed are experiencing can be categorised as
either particulate or bubbling fluidisation.

58
Particulate fluidisation occurs in liquids as the velocity of the liquid exceeds the
minimum fluidisation velocity. The bed height increases uniformly with velocity.
Bubbling fluidisation takes place in gas systems. Large gas bubbles flow through
the packed bed and with increasing velocity they grow in size until they are the
same size as the reactor cross section. When the bubbles are the same size as the
reactor cross section this state is known as slugging, see Figure 2-36.
Figure 2-36 The different types of fluidisation [108]
The size and density of the particle impacts the fluidisation. Figure 2-37 shows a diagram
with the classification of different powders and the way they act under fluidisation. Group A
particles experience a large bed expansion before and after fluidisation as the velocity of the
gas increases. Group B particles bubble as soon as the minimum fluidisation velocity is
achieved. Group C particles have difficulty fluidising and group D particles spout readily
[109].

59
Figure 2-37 Powder classification diagram for fluidization by air [109]
2.8.2 Reactor designs for TCES
This section identifies and discusses possible reactor designs from previous studies. This
ultimately helped identify and understand the advantages and disadvantages of each design.
This section was used to deduce which design shows most promise and provide ideas for
investigation and implementation for MgSO4 into a large scale reactor.
TCES Reactor designs can be categorised into four main types: Open with integrated
reactor, Open with separator reactor, closed with integrated reactor and closed with separate
reactor.
Open reactors store material in one “bulk” store. Material is hydrated by external
ambient conditions. Figure 2-38 shows a diagram of an open reactor design which has been
implemented into a domestic environment. Abedin et al. [110] shows results from this open
reactor. The advantages [110] include simple engineering as the reactor operates at
atmospheric pressure. Simple design allows for minimal parts increasing effective energy
density. Limited heat exchanger use, working fluid (typically air) operates as the heat transfer
fluid exhausting hot air to the ambient. The working fluid is supplied from ambient. The
disadvantages are they have less control on the hydration (discharge) process as hydration
conditions are dictated by the ambient.

60
Closed Reactors store fluids and materials separate from the heat transfer fluid [110].
The TCES material is hydrated via internal substances (i.e. water vapour). Advantages [64]
are the hydration conditions are more controlled as working fluid or vapour is created within
the system. Enhanced control can allow for improved vapour transportation resulting in
higher ΔT outputs. A Disadvantage [110] is that extra energy is required to create the
working fluid or water vapour. The effective energy density is decreased as there is a working
fluid store.
Integrated reactors store the TCESM in the same location to where the reaction takes
place [86]. Figure 2-39 (left) shows an example of an integrated reactor design. Advantages,
[86,111] are no material transportation is required and there are less engineering difficulties
due to the simple design. Disadvantages, [86,111] are the hydration is less controlled and
they typically have to discharge the complete material store.
Separate reactors store the TCESM within a different location to where the reaction
takes place. Figure 2-39 (right) shows a schematic of a closed separate reactor design.
Advantages [86,111] are they can optimize vapour and heat transfer from controlling the
amount of material de/hydrated. There are minimal energy losses and there is no need to
hydrate the whole energy store wasting sensible heat. All but the reaction chamber can be
made from cost effective materials [111]. Disadvantages [86,111] are that energy is wasted
transporting material the materials and there is more engineering difficulty.
Figure 2-38 Charging and discharging diagrams of a zeolite system, respectively [110]

61
Figure 2-39 Integrated reactor design(left), Closed separate reactor design (right) [86]
Mette et al. [111] and Zondag et al. [86] investigated separate reactor designs, both
stating the advantageous properties of separate reactors. Both studies investigated the
characteristics of each reactor via numerical studies.
After a preliminary inventory research Zondag et al. [86] highlighted three possible
designs shown in Figure 2-40 [86]. Results show the screw reactor has the most promise (see
Figure 2-41) [86]. De Jong et al. [112] presents several novel designs (see Figure 2-42). They
provide possible future designs which could be implemented.
Figure 2-40 Three possible reactor designs for the use of powdered TCESM (screw reactor, fluidized
bed reactor, gravity assisted bulkflow reactor) [86].

62
Figure 2-41 Reactor size against four constraints: dehydration time, hydration time, power output (of
a screw reactor) and heat transfer (of a screw reactor) [86].
Figure 2-42 Modular thermochemical reactor design (left) Central reactor with vessel design (right)
[112]
2.8.3 Summary of discussed potential reactor designs for TCES
Separate reactor designs appear to be the best choice, specifically a screw reactor. Studies
highlight the possible engineering difficulty in transporting the material especially if it is a
powder.
Reactor designs will be a vital component of the success of a TCES system. However,
there does not appear to be vast amounts of research conducted comparing various
configurations and their characteristics. This is believed to be because the current state of the

63
research appears to be focused more on material development, a logical choice due to the
infancy of the subject.
2.9 Larger scale experimental results of TCES systems
TCES is in its infancy however, there are some large (~100kg+) notable investigations
[27,74,80,110,113,114]. Some of the important findings are discussed below.
De Boer et al. [74], Abedin et al. [110], Finck et al. [80] all investigate the potential of a
TCES system using zeolites. The systems from Abedin et al. [110] and Finck et al. [80]
provide around 0.2 and 0.07kWh/kg, respectively. De Boer et al. [74] use a 150kg system and
it is stated to provide 0.03kWh/kg. The oldest system (1996) is the one which achieves the
highest kWh/kg, it is understood there are many other constraints to be considered (i.e.
energy density, cost etc.). This 1996 system from Abedin et al. [110] is a functional zeolite
open sorption system which provides a school with heating and air conditioning. The other
two studies are lab prototypes.
Michel et al. [113] investigates a large scale (400kg) lab prototype and uses a salt hydrate
(SrBr2). It uses a novel modular tray system in attempt to enhance the permeability and
hydration kinetics of the material. This is different from most open systems [74] which
simply use a bulk store of material. The design can be seen in Figure 2-43. The system is
shown to have an impressive power output 0.75-2W/kg which is significantly more than the
required 0.3-0.8W/kg to achieve 3-4kW.
Figure 2-43 Novel salt hydrate tray reactor system [113]

64
Figure 2-44 is a large scale open sorption system, using a revolving drum filled with 70L
of zeolite in granular form (1.6-2.5mm). The drum mixes the material while it is hydrating in
attempt to increase the hydration kinetics. This is similar to the screw reactor proposed by
Zondag et al. [86] where the mixing process was shown to improve the hydration kinetics
[86]. The results are impressive with the system producing 1500W of power with 50kg of
material which is significantly higher than other studies [74,80,110]. This system was
dehydrated at 180˚C, significantly higher than the maximum target dehydration value for use
in a domestic environment of 150°C. Also, obviously with this system energy is required to
“mix” the material.
Figure 2-44 Open sorption drum reactor [114]
2.9.1 Summary of the large scale experimental results of TCES systems
Minimal large scale systems have been tested although they show potential. The majority
of the large scale experiments use a material which has had minimal sample preparation. The
material of choice for the larger scale systems is clearly zeolites, possibly due to their robust
de/hydration characteristics.
Clearly further work is needed in large scale systems. Composite materials on a large
scale should be promising. Reactor designs tested are all fairly simple and no closed or
vacuum systems have been assessed on a large scale, possibly due to cost constraints. The use
of MgSO4 has not been used on a large scale, possibly due to its poor characteristics when
used in a pure form. As research into TCES progresses the size and scale of the prototypes
and systems will increase.
65
2.10 Conclusions of this literature review
It is clear to see, with all the studies discussed, that TCES is becoming an area with high
interest. Research is being conducted into all different aspects of the process and is proving
that there is potential. Also apparent are the gaps in research which need to be filled in order
to make advances to TCES implementation into domestic environments.
The use of MgSO4 as a TCES material has been shown to have potential but seems likely
that it will be used within a host material due to its problematic hydration results.
From this literature review areas that are in need of further work, some of which were studied
in this research project, are;
Possibility of lower desorption temperatures and how this affects heat of sorption.
It is shown [49] that a lower desorption temperature (110˚C opposed to 130˚C)
has little effect on heat of sorption results.
Establishing the true potential of MgSO4 by investigating varying heating rates
and cycle stability of the material.
Development of composite materials, in attempt to reduce the problematic
practical constraints of MgSO4 [23,46,48,49]. Considering the host material and
sample preparation.
Experimental results for various reactor designs using MgSO4 with an enhancing
host material [28,86,110,112].
Investigations into the affect sample formations (i.e. beads) have on the porosity
and energy storage potential.
Novel, lab scale, sample preparation techniques.

66
3 Chapter 3 - Methodology
3.1 Introduction to the methodology
This chapter describes the experimental methods used throughout this research for
evaluation of the properties of the TCES materials tested. Each method was used to evaluate
the TCESM at different mass which is important as the performance of TCES materials can
change when tested at different scales as seen in chapter 2 (literature review).
This chapter is separated into 3 distinct sections. Each section explains the methodologies
used for the practical experimentation and techniques used for characterising the TCES
materials at different mass scales. These sections describe the methodology used for
evaluating the performance of TCES materials at two distinct sizes ~10mg and 200g. This
section also contains the preparation methodology used for the creation of the different
samples tested.
Section 1 - Understanding the potential of TCES materials from lab experimentation on a
small scale (~10mg)
The 10mg scale includes the methodology used for testing the TCES materials with
different thermal analysis (DSC, TGA + RGA) and imaging (SEM + EDX) equipment to
provide an understanding of the characteristics including composition, dehydration enthalpy,
dehydration mass loss and dehydration decomposition analysis. This scale provided a
baseline for the TCES materials potential which was compared to the larger scale size.
Section 2 - Understanding the potential of thermochemical materials from lab
experimentation on a medium scale (200g)
The 200g scale includes the methodology used for testing the materials on a larger
practical scale to understand characteristics such as power output, dehydration and hydration
enthalpy and bulk density.
Section 3 - Sample preparation used for creating the composite TCES materials.
The sample preparation section examines the different methods used to create the
composite TCESM and the ion exchange methodology used.
67
Five specific parts have been considered throughout this chapter for each methodology
used.
1. Introduction and purpose of methodology –briefly introduces the methodology being
used and the purpose for its use.
2. Instrumentation used – describes any equipment used for the methodology and
explain any relevant background information on the methodology.
3. Experimental procedure – explains the methodology of the experiments with enough
detail to allow the experiments to be reproduced.
4. Data collection – the data obtained from the experiments and how the data was used.
5. Justification – give reasons for the methodology used and explain the reasoning
behind any explicit values used to justify the validity of the data collected.
3.2 Methodology used for the ~10mg scale tests of the TCES
materials
To understand the potential of the TCES materials they were initially tested on a small
scale. By testing a small sample size of the materials (<10mg) it was possible to understand
the potential of the materials without the need for large amounts of material or consideration
into the performance loss of the materials which can take place as the TCES materials are
tested on a larger scale size (200g). To test the potential of the TCES materials at this scale
several experimental methods were utilised, all of which are explained below in
sections 3.2.1 - 3.2.5.
3.2.1 Small hydration chamber – Hydration of DSC, TGA + RGA and
SEM+EDX samples
3.2.1.1 Introduction and purpose of the small hydration chamber methodology
If samples needed to be hydrated prior to the TGA+RGA, DSC or SEM+EDX testing
they were hydrated using a custom built hydration chamber. The chamber allows for
simultaneous hydration of both DSC and TGA samples. The hydration RH% and air flow rate
can be controlled. The temperature of the humid air stream which hydrates the samples is
controlled by a programmed microcontroller system.
3.2.1.2 Instrumentation used for the small hydration chamber methodology

68
Figure 3-1 shows a schematic of the small hydration chamber. First an air source was split
and passed through two flow meters. The air source pressure was regulated to ensure the
same flow rate was maintained.
Flow meter 1 controlled the flow of a dry air stream (the air was not completely dry
however; it is referred to as dry for understanding). Flow meter 2 controlled the flow of the
humid air stream. The output of flow meter 2 passed into a water container where it passed
through a body of water to create a high humidity air stream. This air stream was then mixed
with the air stream of flow meter 1. This mixed air stream then passed into the hydration
chamber to hydrate the TCES samples. If a lower RH% air stream was desired the flow of
flow meter 1 could be increased and the flow of flow meter 2 reduced.
The water container had a semi-submerged aluminium heat sink. The “cold” side of a
TEC Peltier plate (40mm x 40mm) was attached to the centre of the heat sink and cooled the
heat sink which in turn cooled the water. The outside of the Peltier plate was sealed with high
strength sealant to prevent any leaks from the water container. The “hot” side of the Peltier
plate was attached to an aluminium block which then connected to an air cooled heat sink.
This heat sink had a fan and was used to cool the hot side of the Peltier plate. The Peltier
plate was connected to a 12v regulated power supply which was connected to a relay. The
relay was connected to an Arduino microcontroller. Connected to the Arduino
microcontroller was a temperature sensor located at the entrance of the hydration chamber.
This temperature sensor was monitored by the Arduino and if the humid air stream was above
a set point temperature the Arduino activated a relay which turned on the Peltier plate which
in turn cooled the water. The temperature sensor connected to the Arduino was a TMP36
analogue temperature sensor, in the same location was a thermocouple which was connected
to a Datataker DT85 data logger which logged the temperature. At the entrance of the
hydration chamber was a HIH-4000 series Honeywell humidity sensor which was also
connected to the Datataker and logged the humidity of the humid air stream. The hydration
chamber was constructed from 316 stainless steel and was insulated with Armaflex foam
insulation. Between the lid and base of the hydration chamber was a sheet of silicone to
reduce air leaks.

69
Figure 3-1 A schematic diagram of the small hydration chamber system
3.2.1.3 Experimental procedure used for the small hydration chamber methodology
The samples were hydrated at a partial vapour pressure of ~1.3kPa at 20˚C for a
minimum of 18 hours unless otherwise stated. Once the samples were hydrated they were
moved to the piece of equipment required for testing i.e. DSC or TGA.
3.2.1.4 Data collection for the small hydration chamber methodology
The data was collected from the sensors and stored on the Datataker. The data was
unloaded and formatted within a spreadsheet. Average values of RH% and partial vapour
pressure were calculated and tabulated to ensure the hydration was carried out as required.
3.2.1.5 Justification of the small hydration chamber methodology
This partial vapour pressure (1.3kPa pH2O) was chosen as it is a vapour pressure which
can easily be achieved in the UK winter. The hydration chamber was built and used for the
hydration of small TCES material samples prior to testing. As the thermal analysis equipment
(TGA or DSC) did not allow for hydration of the TCES samples an external device was
required for the hydration prior to dehydration testing (i.e. the small hydration chamber). 18
hours of hydration time was assumed to be an ample amount of time for the hydration to
reach the chosen hydration chamber conditions for the small (<10mg) samples.
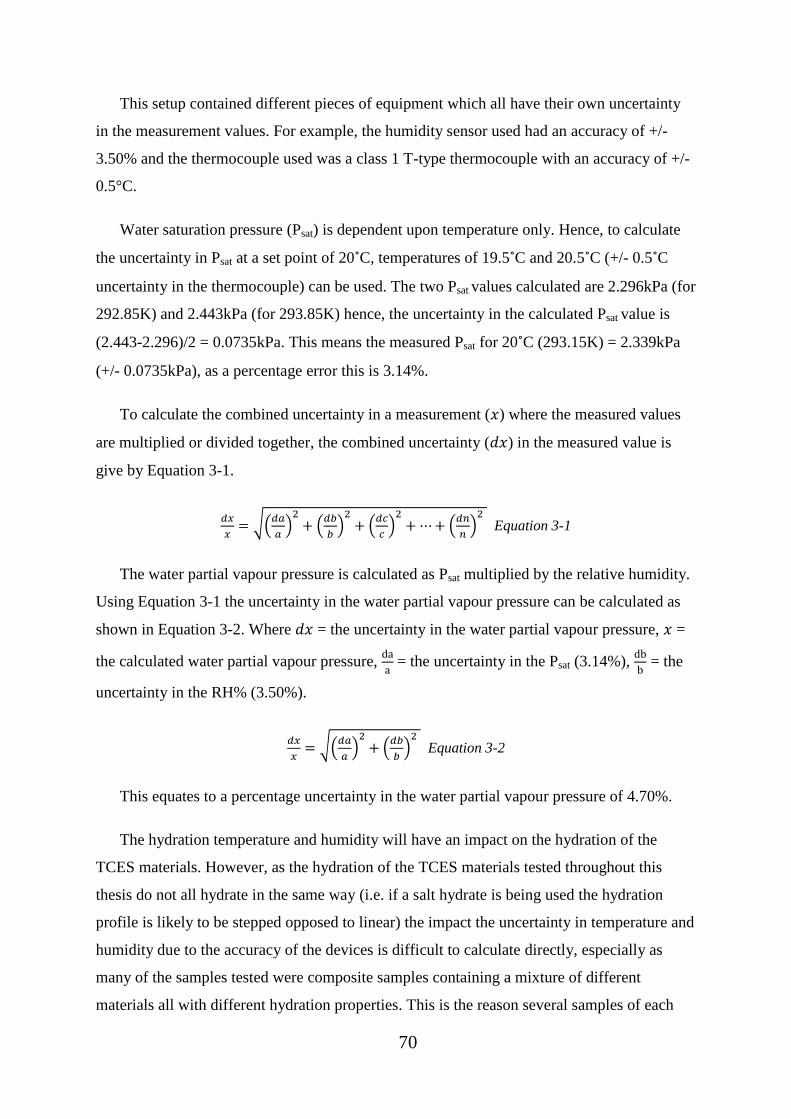
70
This setup contained different pieces of equipment which all have their own uncertainty
in the measurement values. For example, the humidity sensor used had an accuracy of +/-
3.50% and the thermocouple used was a class 1 T-type thermocouple with an accuracy of +/-
0.5°C.
Water saturation pressure (Psat) is dependent upon temperature only. Hence, to calculate
the uncertainty in Psat at a set point of 20˚C, temperatures of 19.5˚C and 20.5˚C (+/- 0.5˚C
uncertainty in the thermocouple) can be used. The two Psat values calculated are 2.296kPa (for
292.85K) and 2.443kPa (for 293.85K) hence, the uncertainty in the calculated Psat value is
(2.443-2.296)/2 = 0.0735kPa. This means the measured Psat for 20˚C (293.15K) = 2.339kPa
(+/- 0.0735kPa), as a percentage error this is 3.14%.
To calculate the combined uncertainty in a measurement (𝑥) where the measured values
are multiplied or divided together, the combined uncertainty (𝑑𝑥) in the measured value is
give by Equation 3-1.
𝑑𝑥
𝑥= √(
𝑑𝑎
𝑎)
2+ (
𝑑𝑏
𝑏)
2+ (
𝑑𝑐
𝑐)
2+ ⋯ + (
𝑑𝑛
𝑛)
2 Equation 3-1
The water partial vapour pressure is calculated as Psat multiplied by the relative humidity.
Using Equation 3-1 the uncertainty in the water partial vapour pressure can be calculated as
shown in Equation 3-2. Where 𝑑𝑥 = the uncertainty in the water partial vapour pressure, 𝑥 =
the calculated water partial vapour pressure, da
a = the uncertainty in the Psat (3.14%),
db
b = the
uncertainty in the RH% (3.50%).
𝑑𝑥
𝑥= √(
𝑑𝑎
𝑎)
2+ (
𝑑𝑏
𝑏)
2 Equation 3-2
This equates to a percentage uncertainty in the water partial vapour pressure of 4.70%.
The hydration temperature and humidity will have an impact on the hydration of the
TCES materials. However, as the hydration of the TCES materials tested throughout this
thesis do not all hydrate in the same way (i.e. if a salt hydrate is being used the hydration
profile is likely to be stepped opposed to linear) the impact the uncertainty in temperature and
humidity due to the accuracy of the devices is difficult to calculate directly, especially as
many of the samples tested were composite samples containing a mixture of different
materials all with different hydration properties. This is the reason several samples of each

71
materials were tested several times in the devices (i.e. TGA and DSC). From this the
experimental deviation in measurement could be established. The device used for testing the
dehydration enthalpy of the TCES materials is very accurate and precise (i.e. DSC =
temperature accuracy of +/- 0.025˚C and enthalpy precision of 0.04% [115]). Throughout this
thesis error bars have been added to graphs which show experimental data, where
appropriate.
3.2.2 DSC dehydration enthalpy analysis methodology
3.2.2.1 Introduction and purpose of the DSC dehydration methodology
To analyse the dehydration enthalpy of each of the TCESM and understand the amount of
energy required for dehydration (charging) and therefore interpret the expected amount of
enthalpy released on hydration (discharging) a DSC was used.
3.2.2.2 Instrumentation used for the DSC dehydration methodology
A DSC is a device which is able to measure the heat flow of a sample, typically of around
10mg, when it is exposed to thermal changes in a controlled atmosphere and environment.
The thermal changes are programmed into the device via software. Thermal changes include
temperature ramps, isotherms and equilibrations [116].
A DSC measures the heat flow of a sample within a pan and the heat flow of a known
empty reference pan when put through a thermal program. A known empty pan, identical to
the sample pan, is used as a reference pan. The difference in heat flow between the sample
and the reference is due to transitions within the sample, such as melts, crystalisations or
dehydrations.
The DSC used throughout this work was a TA instruments Discovery DSC. The device
has a temperature accuracy of +/- 0.025˚C, an enthalpy precision of 0.04% and is capable of a
temperature range of -180 - 725˚C [115]. The software used to analyse the data from the DSC
and programme the device is TRIOS, a programme developed by TA Instruments. The
Discovery DSC uses a chromel and constantan diffusion bond for the sample and reference
stage to create a perfect thermocouple which is less sensitive to sample pan placement [115].
The sample pans used in this work were aluminium T-Zero pans with lids. The DSC used for
this research has an auto sampler which allowed for loading and setting a test sequence for up
to 50 samples. Once a sample was finished a robotic arm unloaded the complete sample and

72
loaded the next sample to be tested without the need for human intervention. To create an
inert atmosphere for the samples nitrogen was used as a purge gas which was generated by a
Genius 3051 Nitrogen & Air generator [117].
3.2.2.3 Experimental procedure used for the DSC dehydration methodology
Throughout this work a DSC heating rate of 5˚C/min was used unless otherwise stated.
The sample size used was approximately 5-10mg. In all tests the lid of the sample pans were
punched with 5 holes to allow the escape of volatiles from the samples.
Once hydrated the samples were placed in the auto sampler of the DSC. As the hydration
enthalpy of the samples could not be analysed directly a temperature program was used
which measured the dehydration enthalpy and allowed for prediction of the hydration
enthalpy. The temperature program dehydrated a hydrated sample twice. The enthalpy from
the first dehydration minus the enthalpy from the second dehydration was used as a
prediction for the hydration enthalpy value. The enthalpy from the first dehydration is a sum
of the enthalpy for the dehydration process of the TCESM and also the enthalpy required for
heating the sample (sensible heat). The second dehydration cycle is only a result of the
sensible heat, as the material is already in a dehydrated state. An example of the temperature
program profile used is shown in Figure 3-2. The enthalpy required for both the first and
second dehydration was calculated using a sigmoidal integration between the 5 minutes
isothermal period at 20˚C and the 60 minutes isothermal period at 150˚C to ensure the
integration took place between two stable heat flow points.
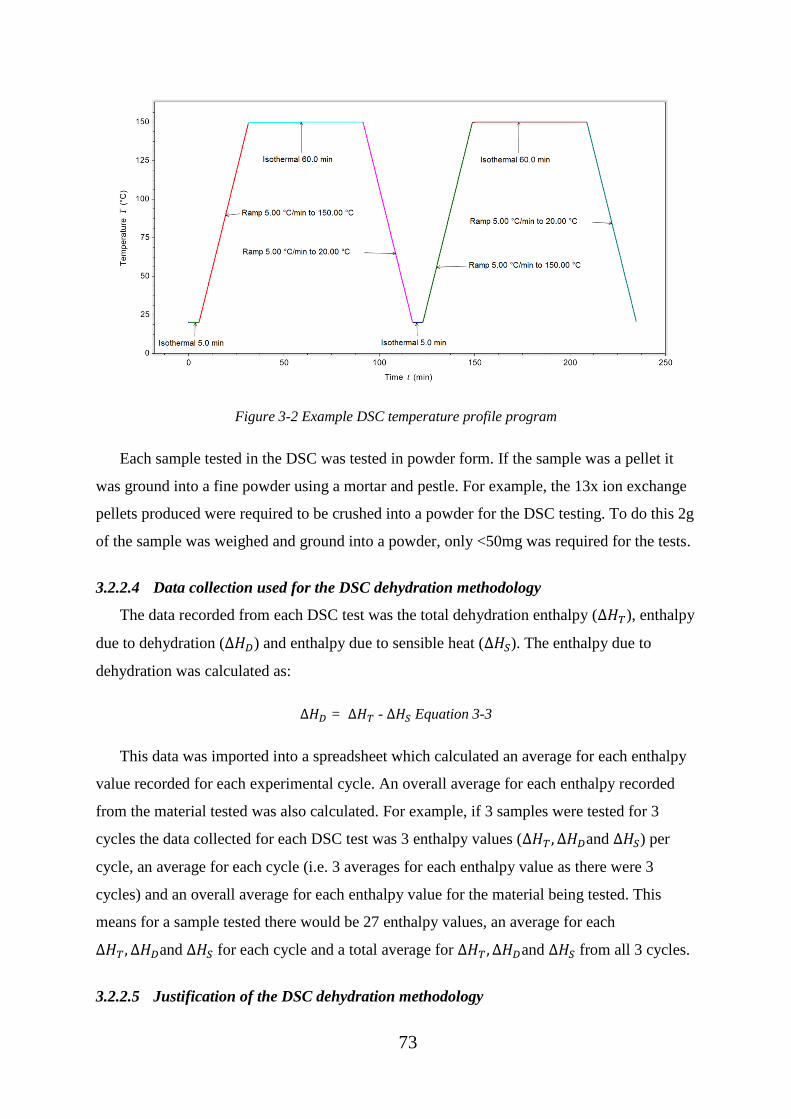
73
Figure 3-2 Example DSC temperature profile program
Each sample tested in the DSC was tested in powder form. If the sample was a pellet it
was ground into a fine powder using a mortar and pestle. For example, the 13x ion exchange
pellets produced were required to be crushed into a powder for the DSC testing. To do this 2g
of the sample was weighed and ground into a powder, only <50mg was required for the tests.
3.2.2.4 Data collection used for the DSC dehydration methodology
The data recorded from each DSC test was the total dehydration enthalpy (∆𝐻𝑇), enthalpy
due to dehydration (∆𝐻𝐷) and enthalpy due to sensible heat (∆𝐻𝑆). The enthalpy due to
dehydration was calculated as:
∆𝐻𝐷 = ∆𝐻𝑇 - ∆𝐻𝑆 Equation 3-3
This data was imported into a spreadsheet which calculated an average for each enthalpy
value recorded for each experimental cycle. An overall average for each enthalpy recorded
from the material tested was also calculated. For example, if 3 samples were tested for 3
cycles the data collected for each DSC test was 3 enthalpy values (∆𝐻𝑇 , ∆𝐻𝐷and ∆𝐻𝑆) per
cycle, an average for each cycle (i.e. 3 averages for each enthalpy value as there were 3
cycles) and an overall average for each enthalpy value for the material being tested. This
means for a sample tested there would be 27 enthalpy values, an average for each
∆𝐻𝑇 , ∆𝐻𝐷and ∆𝐻𝑆 for each cycle and a total average for ∆𝐻𝑇 , ∆𝐻𝐷and ∆𝐻𝑆 from all 3 cycles.
3.2.2.5 Justification of the DSC dehydration methodology
74
The DSC was used to find the dehydration enthalpy of the TCESM on a small scale
(~10mg). It has been used in many studies for this purpose [23,44,48]. The DSC data can be
used to identify potential candidate materials which are likely to have good characteristics on
a larger scale.
The need for calculation of ∆𝐻𝑇 and ∆𝐻𝑆 of the material opposed to only ∆𝐻𝑇 was for
two reasons. First the hydration enthalpy cannot be directly measured in the current DSC
setup up and ∆𝐻𝐷 gives an indication of the hydration enthalpy. Secondly, ∆𝐻𝑆 is an
important characteristic of the sample and must not be ignored. ∆𝐻𝑆 of the sample is
essentially wasted energy when considering the use of TCES materials in an interseasonal
system. It is intended the dehydration (charging) of the TCESM will take place when heat is
not in demand within a domestic environment the sensible heat (∆𝐻𝑆) of the material will be
dissipated into the surroundings and wasted.
A heating rate of 5˚C/min was used as it provides high sensitivity (higher heating rates
provide higher sensitivity) and also a good resolution (lower heating rates provide better
resolution) [118].
The sample size used was large enough to provide a good sensitivity while also being
small enough to provide good resolution and reduce the chance of thermal gradients in the
sample [118].
Initially when a DSC is starting a test there can be anomalies in the recorded heat flow
known as “start-up hooks”. To overcome these anomalies the isothermal periods are required
if the enthalpy from the start of the test needs to be analysed, which it was for the tests in this
research. The isothermal periods stabilise the heat flow which is useful for analysis. The
integration to find the dehydration enthalpy was conducted between the isothermal points as
this gives two linear heat flow points to integrate between.
The 60 minute isothermal period was used to stabilise the heat flow at 150˚C and allow
for the completion of dehydration at 150˚C. Due to dehydration kinetics it takes time for the
samples to dehydrate at each temperature point. If the isothermal period was not sufficiently
long enough to allow the dehydration to happen it would result in the sample not being
completely dehydrated and give less accurate results. A 60 minute isothermal period was
used as it is sufficiently long enough for the samples to complete dehydration at 150˚C with
the used heating rate.

75
The samples were dehydrated from 20 - 150˚C because vacuum solar thermal collectors
can efficiently operate at 150˚C [119]. It is important to evaluate the materials potential
within this temperature range.
If the sample needed to be ground into a powder an ample amount (>2g) of the sample
was ground in an attempt to provide an even distribution of the sample and reduce the chance
of testing a sample which was not indicative of the whole sample created.
Several samples of each material were used in the DSC testing, this was done to identify
any anomalous data and stop it being recorded and used as well as to identify experimental
error.
3.2.2.6 Limitations of the DSC dehydration methodology
When the DSC samples were hydrated and placed within the DSC auto sampler ready for
testing there was a chance that the samples could start to dehydrate or further hydrate in the
ambient. Further hydration will not happen as the hygrothermal properties of the laboratory
are regulated by large air conditioning units. The laboratory is regulated to around 20˚C with
a RH% <50%. Dehydration in the auto sampler did not happen as the samples are hydrated at
20˚C at ambient pressure.
3.2.3 TGA (+ RGA) mass loss methodology
3.2.3.1 Introduction and purpose of the TGA (+ RGA) mass loss methodology
To analyse the dehydration mass loss with temperature of the TCESM a TGA was used.
This information allowed for an understanding of the amount of water dehydrated from the
TCESM tested. The data obtained from the TGA can be overlaid with the DSC data to
confirm that endothermic DSC peaks are results of dehydrations as TGA mass loss peaks will
be seen at the same temperatures. In this work the RGA was used predominantly for
comparing water loss peaks from the TGA sample with TGA mass loss peaks.
3.2.3.2 Instrumentation used for the TGA (+ RGA) mass loss methodology
The TGA used in this work was a TA Instruments Discovery TGA. Attached to the outlet
of the furnace of the TGA was an RGA. An RGA allows for analysis of gases released from
the TGA sample with temperature. This allows for an understanding of the materials being

76
dehydrated or decomposed from the TGA samples. The RGA used in this work was a MKS
Cirrus 2 RGA [120].
A TGA is a device which measures the changing mass of a sample with changing
temperature and time. The Discovery TGA uses a proprietary thermobalance see Figure 3-3.
The Discovery TGA is capable of a temperature range of ambient to 1200˚C with a
temperature precision of +/- 1˚C [121]. The TGA can have temperature profiles programmed
to it, similar to the DSC (see section 3.2.2), using the TRIOS software.
Figure 3-3 TA instruments discovery TGA balance [122]
An RGA allows the user to measure the gases released from the TGA samples. The way
an RGA measures the gases present is as follows [123];
1. Gas molecules are passed into the RGA (via the capillary tube at the output of the
TGA furnace) where they become ionised.
Within the RGA are filaments. These filaments are heated to high temperatures, when
heated hot enough electrons within the filament gain enough energy to escape the metal work
function [123] of the filament wire into the surrounding vacuum.

77
These electrons which have now escaped are accelerated using a potential difference. The
energy the electrons gain is the potential difference value in eV. These electrons can now
collide with gas molecules and ionise them.
2. Electrostatic lens
This part of the RGA is used for “directing” the created gas ions towards the quadruple
mass filter, the lenses are a doughnut shape. When a potential difference is applied to a lens
of this shape an electric field is produced which directs and accelerates the gas ions through
the lens in a beam towards the quadruple mass filter.
3. Quadruple mass filter
The quadruple mass filter consists of 4 rods that are electrically biased. Due to the
placement of the rods this creates a path through the electric field for specific M/e ions (mass
to charge ratio) and all other ions which do not have the correct M/e ratio collide with and are
neutralised by the 4 rods.
4. Ion detection
Now that only ions with a specific M/e ratio have passed through the mass filter they can
be detected to give an indication of the amount of ions present. This process of detection can
be done with a faraday cup. A faraday cup is simply a piece of metal which has a negative
potential. When the ions pass over the faraday cup they are attracted to this negative potential
and collide with the metal. This collision neutralises the ions and also induces a current
within the faraday cup which is detected. This current is known and recorded as the ion
current from the RGA. The higher the ion current the larger the number of ions present and
therefore the higher amount of those gas molecules present in the gas released from the TGA
sample.
3.2.3.3 Experimental procedure used for the TGA (+ RGA) mass loss methodology
In this research the RGA allowed measurement of the gases which were released from the
TGA sample. Before the RGA could be used several things needed to happen;
1. The RGA needed to be pumped down to create a low pressure environment
78
2. A filament needed to be switched on – the MKS RGA used in this work had two
filaments. Both filaments served the same purpose, there are two because the
filaments burn out with time and the replacement can be time consuming.
3. Capillary heater needed to be switched on – This capillary heater reduces the chance
of gases from condensing in the capillary tube and blocking it.
4. System bake needed to be switched on – this process “baked” the RGA in attempt to
remove any condensed gas and reduce the background content of gases. This process
is started before each RGA test.
The MKS software, Process Eye, was used along with add-on software from TA
instruments. This add-on software allowed for several sample tests to be set up within the
RGA software and be triggered automatically via the TGA software trigger. For example
once sample 1 had completed a trigger was sent the RGA to stop recording data, next the
TGA would unload sample 1 and load sample 2. Once sample 2 was loaded by the auto
sampler and ready for testing the TGA software sent a trigger to the RGA software that
sample 2 testing was about to begin and the RGA software started to record data.
The sample pans used in the TGA were open platinum pans of 100µL. The sample mass
used was 2-4mg. The Discovery TGA also had an auto sampler which allowed for loading of
multiple samples and the TGA would load and unload samples automatically.
In order to keep testing consistent to the DSC and to ensure comparison of data was
possible the heating rate used in this work was 5˚C/min. The purge gas used for the TGA was
nitrogen which was produced by a Genius 3051 nitrogen and air generator [117].
The temperature program methodology was very similar to the DSC method. However,
the TGA ramps the sample up to 150˚C at 5˚C/min, holds the sample isothermally for 120
minutes and then cools back to 35˚C at 5˚C/min. An example of the temperature profile used
is seen in Figure 3-4.
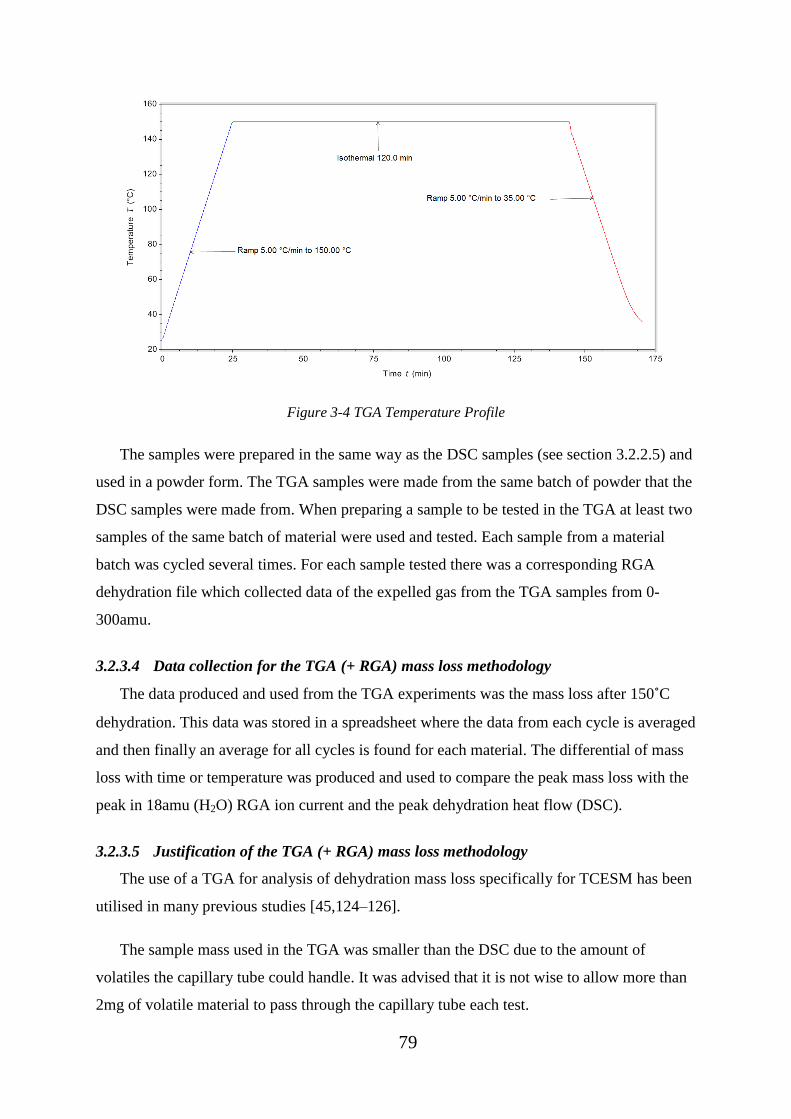
79
Figure 3-4 TGA Temperature Profile
The samples were prepared in the same way as the DSC samples (see section 3.2.2.5) and
used in a powder form. The TGA samples were made from the same batch of powder that the
DSC samples were made from. When preparing a sample to be tested in the TGA at least two
samples of the same batch of material were used and tested. Each sample from a material
batch was cycled several times. For each sample tested there was a corresponding RGA
dehydration file which collected data of the expelled gas from the TGA samples from 0-
300amu.
3.2.3.4 Data collection for the TGA (+ RGA) mass loss methodology
The data produced and used from the TGA experiments was the mass loss after 150˚C
dehydration. This data was stored in a spreadsheet where the data from each cycle is averaged
and then finally an average for all cycles is found for each material. The differential of mass
loss with time or temperature was produced and used to compare the peak mass loss with the
peak in 18amu (H2O) RGA ion current and the peak dehydration heat flow (DSC).
3.2.3.5 Justification of the TGA (+ RGA) mass loss methodology
The use of a TGA for analysis of dehydration mass loss specifically for TCESM has been
utilised in many previous studies [45,124–126].
The sample mass used in the TGA was smaller than the DSC due to the amount of
volatiles the capillary tube could handle. It was advised that it is not wise to allow more than
2mg of volatile material to pass through the capillary tube each test.

80
Two dehydration cycles were required for analysis of different endothermic heat flows of
the DSC samples however, for the TGA samples only one dehydration cycle was needed to
analyse the mass loss.
When testing samples in the DSC an initial equilibrate and isothermal period (5 minutes)
was used to stabilise the heat flow in the DSC. The TGA did not need this initial isothermal
stage as the “start-up hooks” were not a problem when analysing the TGA data. The
isothermal period at 150˚C was required and was used for the same purpose as in the DSC, to
allow any excess water to be dehydrated at the set point temperature.
The dehydration temperature used in the TGA tests (up to 150˚C) was to allow for
comparison of the TGA and RGA data to the DSC and also due to 150˚C being a temperature
which is towards the upper most value to achieve efficient supply heat from a vacuum flat
plate collector [119].
A full scan (0-300amu) for each RGA test was conducted as the scans did not take much
time (~5 seconds) relative to the time taken for each sample test.
The comparison of the TGA differential peaks to the DSC and RGA data was to confirm
each peak was due to a dehydration peak. An example of this data overlaid is shown in
Figure 3-5 which shows how all of the peaks are at similar temperatures verifying the peaks
are due to a dehydration transition.
Figure 3-5 An example overlay of DSC, RGA and TGA data, showing the dehydration of
MgSO4.7H2O
81
3.2.3.6 Limitations of the TGA (+ RGA) mass loss methodology
The TGA did not have cooling to allow it to be cooled sub ambient and the tests needed
to be started at around 30˚C. This means that the data points for the first ~10 degrees of
temperature (20-30˚C) were lost. This is not a major problem as the materials still lost the
same amount of mass but there was no data for temperatures below the start point of the tests.
3.2.4 SEM + EDX analysis methodology
3.2.4.1 Introduction and purpose of the SEM + EDX analysis techniques used
Throughout this work SEM and EDX analysis was conducted for analysing the
composition and structure of the TCESM. EDX is a method which allows for elementary
analysis without much sample preparation. It allows the analysis of the TCESM to ensure the
composition of the samples and ion exchange took place satisfactory along with allowing the
imaging of the samples structure.
3.2.4.2 Instrumentation used for the SEM + EDX analysis methodology
The device used throughout this research for SEM and EDX analysis was a Hitachi
TM3030 table top SEM with attached EDX. This device is capable of magnifications up to
30,000x and requires minimal sample preparation.
3.2.4.2.1 The workings of Scanning Electron Microscopes (SEM)
SEM works by beaming electrons onto a sample and using a detector to detect the x-rays
and electrons produced or scattered from the electron bombardment [127].
Electron microscopes work as described below [127];
1. Electrons are produced by an electron gun.
2. The electrons travel towards the sample through a vacuum. While travelling towards
the sample the electrons are focused into a beam using electromagnetic lenses.
3. The electron beams hit the sample which causes electrons or x-rays to be ejected from
the sample. The ejection is detected by different sensors and used to create and image
of the sample. The different types of ejection are as follows;
a. X-rays – are produced when an electron collides with an atom within the
sample and causes an electron to be ejected from the atom from a lower level
shell causing a hole. An electron from a higher level shell drops down to the

82
lower energy level to fill this electron hole and releases energy in the form of
an x-ray when it fills the hole. This type of emission is used for EDX analysis
and is explained in more detail in section 3.2.4.2.2.
b. Backscattered electrons - Electrons produced from the electron beam after
colliding with the sample and being reflected off the atoms and not absorbed.
The backscattered electrons can come from deeper within the sample giving
more depth of the sample. A separate detector is used to detect these electrons.
c. Secondary electrons – This takes place when the electrons from the electron
beam hit the atoms in the sample and are absorbed. When the electrons are
absorbed secondary electrons are ejected from the atoms in the sample. The
detector for these electrons typically has a faraday cage with a large positive
potential difference to attract the electrons towards the detector where the
image is formed. These electrons are good for providing surface features.
3.2.4.2.2 Workings of the EDX
EDX allows for elemental composition analysis. EDX bombards the sample typically
with electrons or X-rays. This process may excite the electrons of an atom within the sample.
This excitation can result in the ejection of an electron from the inner shell of the atom. To
fill the hole created by the ejected electron, an electron from a higher energy level shell fills
the hole. This movement of electron from a higher to lower energy level results in the
emission of energy from the atom. The difference in the energy between the lower and higher
shells is the value of the emitted energy. This energy may be released in the form of an x-ray
[127,128].
The energy released can be measured by an energy dispersive spectrometer. As the
energy levels of the electron shells are quantised (i.e. they are restricted to specific energy
level values and not continuous) and discrete to specific elements the composition of the
sample can be found.
3.2.4.3 Experimental procedure used for the SEM + EDX analysis
The sample preparation for the SEM and EDX analysis was relatively simple for the
TM3030. The samples needed to be adhered to a carbon stub (a thin layer of adhesive
carbon). The stub is either 10 or 25mm in diameter. The carbon stub was first stuck to a metal
disc, the sample was then placed on the carbon stub. Then using low pressure air the sample
was blown to adhere the sample to the stub. The samples used throughout this research were

83
either powder or pellets. The pressure of the air was increased slowly to apply more pressure
to the sample and ensure the sample was firmly stuck to the stub but also to remove any
excess powder or loose particles from the sample. The sample was then placed on a sample
stage and the height of the stage was adjusted to ensure the sample was the correct height
within the SEM to produce an in focus image. The SEM was then pumped down to a low
pressure to create an evacuated environment. Once pumped down the sample could start to be
analysed.
When analysing the samples a 15kV potential difference was used for the SEM. For
analysing the composition of a sample the TM3030 EDX software was used. The analysis
used within the software was a dot scan. This scan allows the user to place a circle of
different sizes on an image of the sample. The software then scans the composition within the
defined circle area. Figure 3-6 shows an example of the circle used in a dot analysis, the
atomic composition of the sample and an example EDX atomic spectrum from the dot
analysis.
Figure 3-6 Image 1: Example EDX dot analysis, Image 2: Composition from dot analysis, Image 3:
Example of an EDX atomic spectrum from the dot analysis.
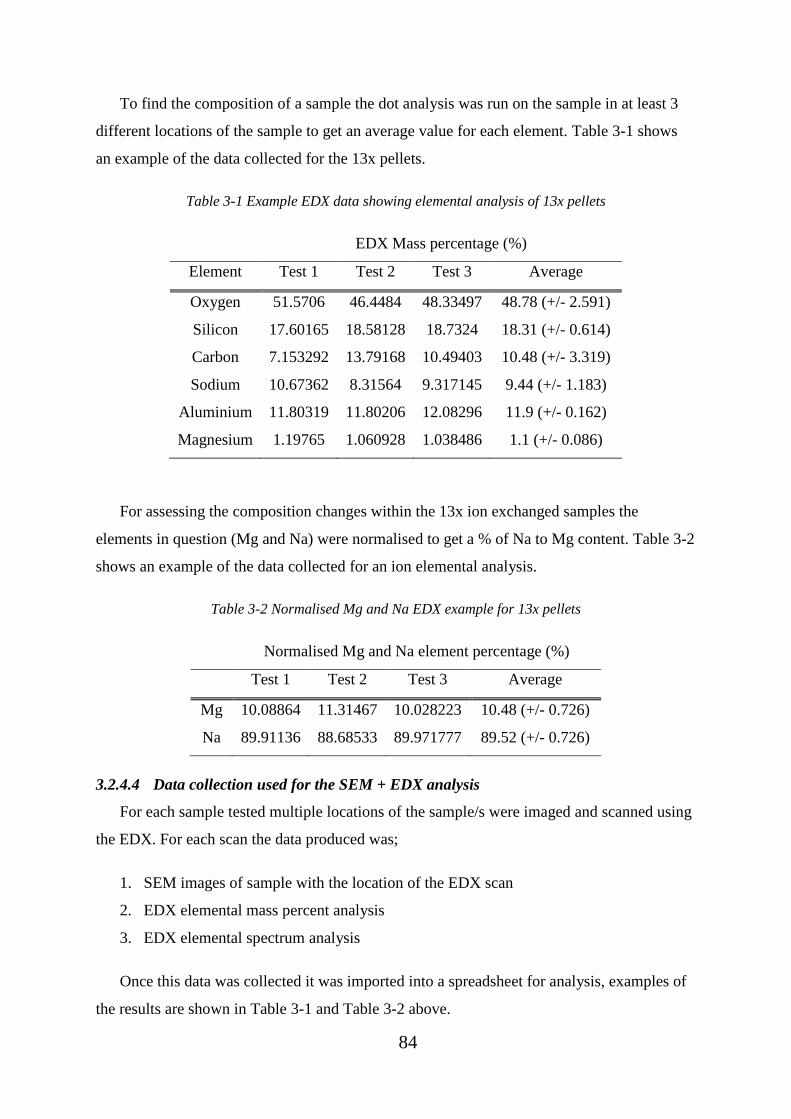
84
To find the composition of a sample the dot analysis was run on the sample in at least 3
different locations of the sample to get an average value for each element. Table 3-1 shows
an example of the data collected for the 13x pellets.
Table 3-1 Example EDX data showing elemental analysis of 13x pellets
EDX Mass percentage (%)
Element Test 1 Test 2 Test 3 Average
Oxygen 51.5706 46.4484 48.33497 48.78 (+/- 2.591)
Silicon 17.60165 18.58128 18.7324 18.31 (+/- 0.614)
Carbon 7.153292 13.79168 10.49403 10.48 (+/- 3.319)
Sodium 10.67362 8.31564 9.317145 9.44 (+/- 1.183)
Aluminium 11.80319 11.80206 12.08296 11.9 (+/- 0.162)
Magnesium 1.19765 1.060928 1.038486 1.1 (+/- 0.086)
For assessing the composition changes within the 13x ion exchanged samples the
elements in question (Mg and Na) were normalised to get a % of Na to Mg content. Table 3-2
shows an example of the data collected for an ion elemental analysis.
Table 3-2 Normalised Mg and Na EDX example for 13x pellets
Normalised Mg and Na element percentage (%)
Test 1 Test 2 Test 3 Average
Mg 10.08864 11.31467 10.028223 10.48 (+/- 0.726)
Na 89.91136 88.68533 89.971777 89.52 (+/- 0.726)
3.2.4.4 Data collection used for the SEM + EDX analysis
For each sample tested multiple locations of the sample/s were imaged and scanned using
the EDX. For each scan the data produced was;
1. SEM images of sample with the location of the EDX scan
2. EDX elemental mass percent analysis
3. EDX elemental spectrum analysis
Once this data was collected it was imported into a spreadsheet for analysis, examples of
the results are shown in Table 3-1 and Table 3-2 above.
85
3.2.4.5 Justification of the SEM + EDX analysis
SEM and EDX analysis has been used in previous research by many authors for analysis
of surface structure and composition of TCESM [23,36,67]. This method allows for the
testing of samples without much preparation meaning the samples are not contaminated
which could result in anomalous results.
3.2.4.6 Limitations of the SEM + EDX analysis
The air used to adhere the samples to the carbon stub may cause a hydration to some of
the samples. However, this method reduced the damage to the samples which could be caused
from applying pressure to them to stick them firmly to the carbon stub. Also, it was advised
the samples used would need to be blown by air to remove any excess particles because if
there were any loose particles when the sample was pumped down the loose particles could
damage the SEM.
3.2.5 Nitrogen vapour sorption testing methodology
3.2.5.1 Introduction and purpose of the nitrogen vapour sorption testing methodology
To understand the porosity of the TCESM a nitrogen vapour sorption technique was used.
This method allows for analysis of pore size, pore surface area, pore volume and surface area
of a sample. This was important for this research as the performance of a TCESM has been
shown to be impacted by its porosity characteristics. It was shown in the literature review
(chapter 2) that samples with higher surface area and a larger pore volume perform better.
One reason for the increased performance from higher pore volume is increased vapour
transportation which results in faster hydration and higher power output.
3.2.5.2 Instrumentation used for the nitrogen vapour sorption testing methodology
For the nitrogen sorption analysis a Micromeritics Tristar 2 3030 was used. This device
uses physical adsorption and capillary condensation principles to acquire porosity data on the
sample being tested.
3.2.5.2.1 Nitrogen sorption theory
The procedure first evacuates a sample and then exposes it to low cryogenic temperatures.
Then the sample is exposed to a testing gas (in this case nitrogen) at different pressures. For
each pressure the amount of gas adsorbed by the sample is measured. With increasing
pressure the amount of gas adsorbed increases.
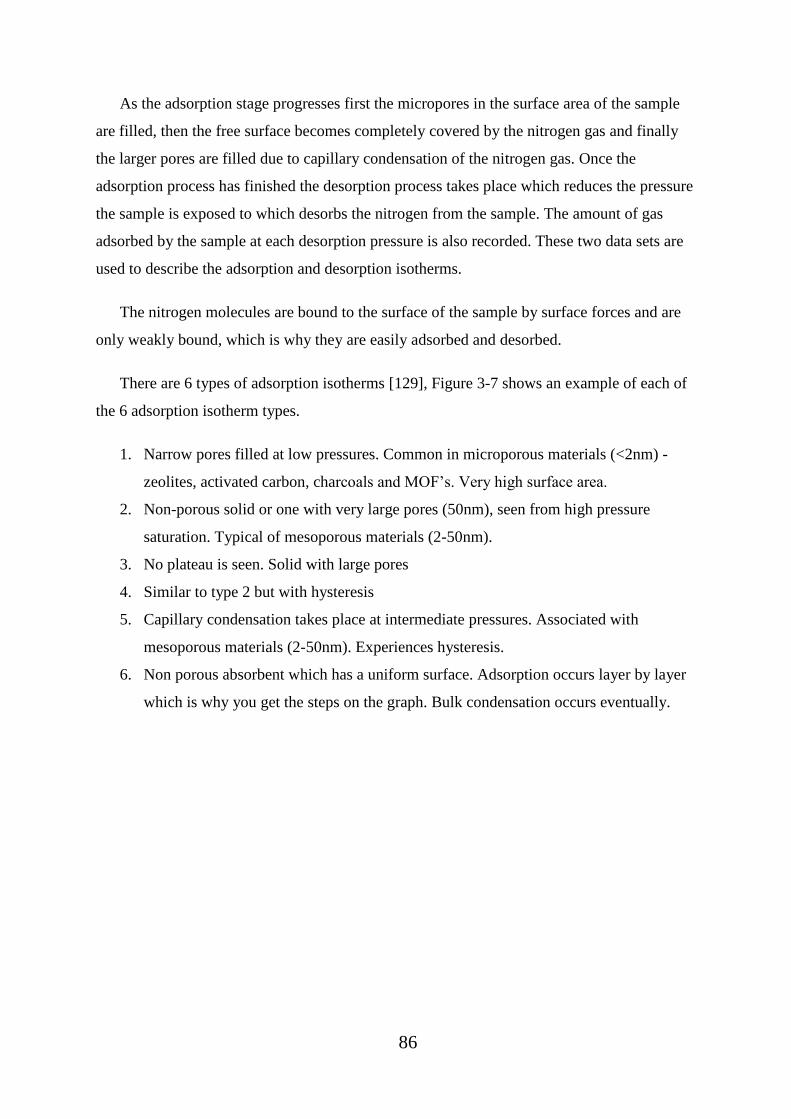
86
As the adsorption stage progresses first the micropores in the surface area of the sample
are filled, then the free surface becomes completely covered by the nitrogen gas and finally
the larger pores are filled due to capillary condensation of the nitrogen gas. Once the
adsorption process has finished the desorption process takes place which reduces the pressure
the sample is exposed to which desorbs the nitrogen from the sample. The amount of gas
adsorbed by the sample at each desorption pressure is also recorded. These two data sets are
used to describe the adsorption and desorption isotherms.
The nitrogen molecules are bound to the surface of the sample by surface forces and are
only weakly bound, which is why they are easily adsorbed and desorbed.
There are 6 types of adsorption isotherms [129], Figure 3-7 shows an example of each of
the 6 adsorption isotherm types.
1. Narrow pores filled at low pressures. Common in microporous materials (<2nm) -
zeolites, activated carbon, charcoals and MOF’s. Very high surface area.
2. Non-porous solid or one with very large pores (50nm), seen from high pressure
saturation. Typical of mesoporous materials (2-50nm).
3. No plateau is seen. Solid with large pores
4. Similar to type 2 but with hysteresis
5. Capillary condensation takes place at intermediate pressures. Associated with
mesoporous materials (2-50nm). Experiences hysteresis.
6. Non porous absorbent which has a uniform surface. Adsorption occurs layer by layer
which is why you get the steps on the graph. Bulk condensation occurs eventually.

87
Figure 3-7 Types of adsorption isotherms [129]
For calculating the surface area of the samples the BET model is used. For calculation of
the pore volume the BJH model is used.
Specific surface area from monolayer adsorption can be calculated from nitrogen
adsorption with Equation 3-4
𝑆𝑆𝐴 = 𝑞𝑚𝜎𝑁𝑎
𝑚 Equation 3-4
Where 𝑞𝑚 = the monolayer capacity of the sample (moles), 𝜎 = surface area occupied by
one molecule at analysis temperature (0.16nm2 per molecule of nitrogen), 𝑁𝑎 = Avagadro’s
number and 𝑚 = mass of sample.
3.2.5.2.2 Experimental procedure for the nitrogen vapour sorption testing
For the nitrogen sorption testing a small amount of sample was tested, typically around
1g. The sample was loaded into a glass sample container with a spherical bottom; the mass of
sample added was recorded.

88
The samples were then exposed to a nitrogen purge gas at a temperature of 170˚C, to
degas and remove any excess water from the samples, for a period of 4 hours. A
Micromeritics Flowprep 060 was used for the degassing process. The sample was then
weighed to check the degassing did not cause a change in mass due to dehydration. A glass
filler rod and seals were attached to the glass sample container and the sample was sealed
with a rubber bung to stop the sample coming into contact with the humid air.
When ready to be tested the rubber bung was removed from the sample container and the
sample was then attached to the Tristar sorption apparatus. The device control software then
lifted the Dewar tank filled with liquid nitrogen to cool the sample to 77K. The testing then
began by evacuating the sample tube and measuring the amount of nitrogen adsorbed by the
sample with increasing pressure.
3.2.5.3 Data collection for the nitrogen vapour sorption testing
The data collected from the Tristar software included data for each relative pressure
(P/P0) point tested. This included Isotherm linear plot vs absorbed quantity, BET surface area
and BJH adsorption and desorption pore distribution. This gave data for;
Surface area (cm2/g)
Cumulative surface area of pores (cm2/g)
Cumulative pore volume (cm3/g)
Average pore width (nm)
Once collected this data was imported into a spreadsheet where the values were tabulated
and compared to all samples tested.
3.2.5.4 Justification of the nitrogen vapour sorption testing
This method for measuring the porosity characteristics of the TCESM has been used in
many previous studies [42,48,103,105]. It provided valuable data which could be used to
assess the impact the impregnation of salt hydrates has on the porosity and therefore energy
and power output of the materials.

89
3.3 200g Scale testing of the TCES materials
3.3.1 Custom built 200g dehydration hydration chamber.
3.3.1.1 Introduction and purpose of the 200g dehydration hydration chamber
To test the TCES materials on a practical scale, a 200g scale dehydration and hydration
chamber was built in the lab.
3.3.1.2 Instrumentation used for the 200g dehydration hydration chamber tests
The reactor chamber of the system is cylindrical and 75mm in diameter and 155mm in
height. When testing TCES material pellets it is able to contain 200g of material. All of the
tests conducted within the chamber were with 200g of TCES material. A schematic of the
system is shown in Figure 3-8.
The humidity generation cylinder shown in Figure 3-8 is the same setup as shown in
Figure 3-1 however; the output goes into the 200g chamber not the small hydration chamber.
The TA temperature shown in Figure 3-8 goes to the Arduino microcontroller to regulate the
humid air stream temperature. Between the 316 stainless steel plates and the 75mm cylinder
there is a sheet of silicone, to create an air tight seal between the TCESM and the ambient.
Wrapped around the 75mm cylinder is wool insulation of 20mm and a thermal conductivity
of 0.04W/mK. Thermocouple temperature sensors are placed at the inlet and outlet of the
75mm cylinder and also next to each of the humidity sensors. There are additional
temperature sensors next to the humidity sensors to calculate the partial vapour pressure of
the air at the point of RH% measurement. The humidity sensors used are HIH-4000 series
Honeywell humidity sensors. All of the sensors, other than the temperature sensor which
feeds into the arduino, are connected to a DT85 Datataker data logger.
At the inlet of the 75mm cylinder there is a fine mesh base which is raised off the bottom
of the cylinder and this is where the TCESM sit. This mesh is used to achieve an even air
flow distribution through the TCESM.
3.3.1.3 Experimental procedure used for the 200g dehydration hydration chamber tests
The 200g system dehydrated the samples using a temperature controlled hot air gun. All
of the materials were dehydrated with an inlet temperature of approximately 145˚C which
resulted in an outlet temperature of approximately 125˚C (+/- 5˚C). When the material was

90
being dehydrated the ball valves closest to the hot air gun and the output of the TCESM
chamber were opened and the ball valve closest to the humidity generator was sealed. This
was to direct the hot air flow into the TCESM chamber but also protect the humidity sensors
and equipment around the humidity generator, as this equipment did not have a temperature
rating up to 150˚C. The humidity sensors were not placed in the same location as the
thermocouples within the 75mm cylinder as they were not rated up to 150˚C. The top
humidity sensor was removed when the TCESM were being dehydrated. The materials were
all dehydrated for 3.5 hours. Once dehydration was complete all ball valves were sealed to
provide air tight containment for the TCESM and allow the TCESM to cool down.
Figure 3-8 200g dehydration hydration setup
The hydration of the TCESM took place after the TCESM had cooled down to ambient
temperature after a dehydration process. First all of the sensors which were disconnected for
the dehydration were reconnected, including the output temperature and humidity sensors.
Next the valve which connects the humid air line input to the chamber was opened and the air
output valve at the top of the chamber was opened. Unless otherwise stated the TCESM were
hydrated with a flow rate of 10L/min at ~1.3kPa partial vapour pressure at 20˚C. Each of the
samples was hydrated for 24 hours.
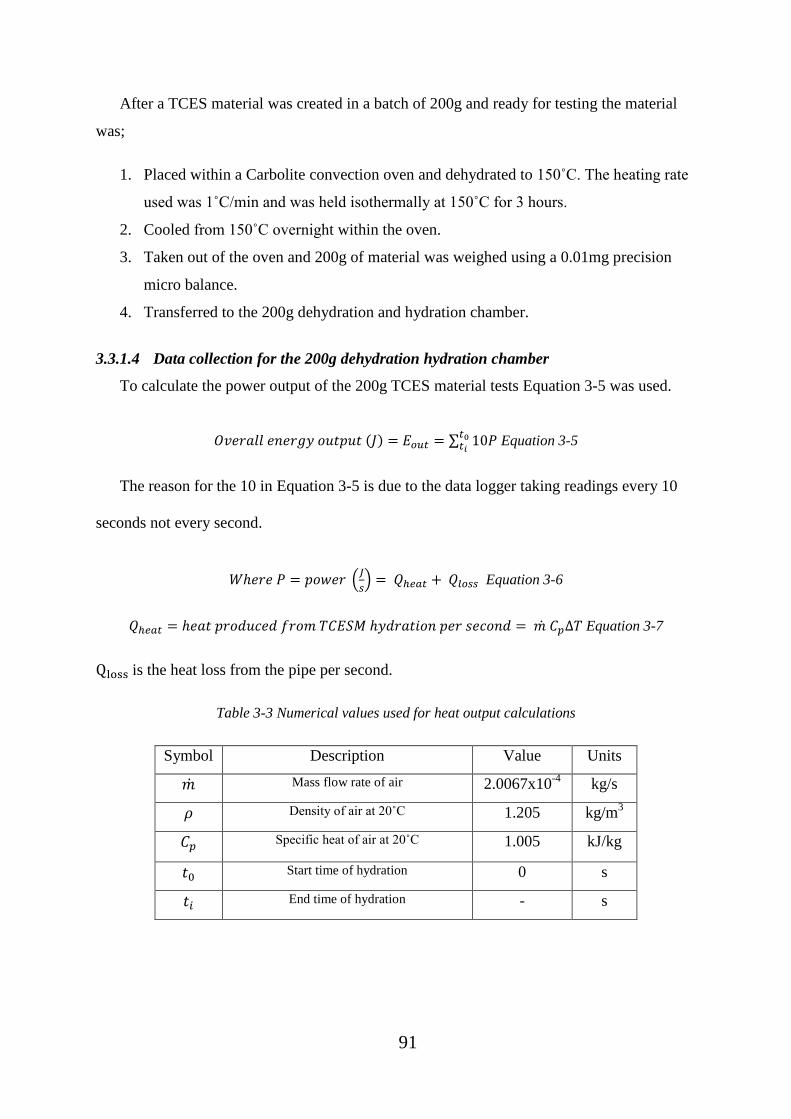
91
After a TCES material was created in a batch of 200g and ready for testing the material
was;
1. Placed within a Carbolite convection oven and dehydrated to 150˚C. The heating rate
used was 1˚C/min and was held isothermally at 150˚C for 3 hours.
2. Cooled from 150˚C overnight within the oven.
3. Taken out of the oven and 200g of material was weighed using a 0.01mg precision
micro balance.
4. Transferred to the 200g dehydration and hydration chamber.
3.3.1.4 Data collection for the 200g dehydration hydration chamber
To calculate the power output of the 200g TCES material tests Equation 3-5 was used.
𝑂𝑣𝑒𝑟𝑎𝑙𝑙 𝑒𝑛𝑒𝑟𝑔𝑦 𝑜𝑢𝑡𝑝𝑢𝑡 (𝐽) = 𝐸𝑜𝑢𝑡 = ∑ 10𝑃𝑡0𝑡𝑖
Equation 3-5
The reason for the 10 in Equation 3-5 is due to the data logger taking readings every 10
seconds not every second.
𝑊ℎ𝑒𝑟𝑒 𝑃 = 𝑝𝑜𝑤𝑒𝑟 (𝐽
𝑠) = 𝑄ℎ𝑒𝑎𝑡 + 𝑄𝑙𝑜𝑠𝑠 Equation 3-6
𝑄ℎ𝑒𝑎𝑡 = ℎ𝑒𝑎𝑡 𝑝𝑟𝑜𝑑𝑢𝑐𝑒𝑑 𝑓𝑟𝑜𝑚 𝑇𝐶𝐸𝑆𝑀 ℎ𝑦𝑑𝑟𝑎𝑡𝑖𝑜𝑛 𝑝𝑒𝑟 𝑠𝑒𝑐𝑜𝑛𝑑 = 𝑚 ̇ 𝐶𝑝∆𝑇 Equation 3-7
Qloss is the heat loss from the pipe per second.
Table 3-3 Numerical values used for heat output calculations
Symbol Description Value Units
�̇� Mass flow rate of air 2.0067x10⁻⁴
kg/s
𝜌 Density of air at 20˚C 1.205 kg/m3
𝐶𝑝 Specific heat of air at 20˚C 1.005 kJ/kg
𝑡0 Start time of hydration 0 s
𝑡𝑖 End time of hydration - s

92
3.3.1.5 Justification of the 200g dehydration hydration chamber methodology
This 200g testing system gave an understanding of how an open TCES system would
work under the test conditions on a small scale. The workings would be very similar to a
large scale open TCES system.
The majority of the hydration for all samples happened within the first 10 hours, meaning
most of the power and energy output was within the first 10 hours. For continuity each
sample was hydrated for the same length of time (24 hours). This was also important because
even though the majority of the energy output was in the first 10 hours the TCESM become
more loaded with water over the 24 hour hydration. Meaning the dehydration process will
require more energy if the samples are more hydrated. All of the samples were dehydrated for
3.5 hours which was found to ensure all samples were dehydrated to the same state.
The initial oven dehydration, before the testing within the 200g chamber, was done to
ensure the samples were all weighed in the same dehydrated state. 150˚C was used as this
temperature allows for dehydration of 6.9 of the 7 water molecules from magnesium sulphate
heptahydrate [28].
The 150˚C oven dehydration was also used before weighing the samples for the bulk
density calculations (see section 3.3.2). The bulk density and 200g hydration data was used to
calculate the energy density of the samples. If the initial oven dehydration was not conducted
to the same temperature, for both the 200g testing and the bulk density tests the results would
not be accurate. This is because the samples being measured could be to a different initial
hydration level leading to different amounts of material being tested because the density of
the material changes with different hydration levels.
3.3.2 Bulk density measurements
3.3.2.1 Introduction and purpose of the Bulk density measurements methodology
An important characteristic for TCES materials is the bulk density. This is important as
the bulk density of TCES materials can be significantly different to the density of the same
material. This is because TCES materials are typically used in a pellet form which creates
voids in the packing of the material reducing the bulk density. TCES material A may have a
higher energy output in (J/g) than TCES material B but depending upon the way in which the
materials are used in a reactor the energy density (J/m3) of TCES material B may be higher
93
than TCES material A. The space the material takes up is vitally important for domestic
environments due to the lack of free space.
3.3.2.2 Experimental procedure for the Bulk density measurements
Each TCES material was first dehydrated to 150˚C within a Carbolite convection oven.
The materials were heated at a rate of 1˚C/min and held isothermally for 3h, before cooling
naturally within the oven. Once cooled 200g of the samples were weighed. The 200g of
sample was then placed in a 30mm internal diameter x 1m long acrylic pipe. This pipe was
used as it has smooth uniform sides. Once filled the height of the sample within the tube was
recorded. The sample was then removed from the tube and then refilled and the height was
again recorded. This was repeated for at least 5 times for each sample and an average for the
height was recorded. Then using the equation for density 𝜌 =𝑚
𝑣 the bulk density for each
sample was calculated.
3.3.2.3 Justification of the Bulk density measurements methodology
Although the samples were unlikely to change in size significantly if they were in a
hydrated or dehydrated state the reason for the 150˚C dehydration before testing was to be
consistent with the 200g dehydration hydration tests (see section 3.3.1). In the dehydration
hydration tests the samples were first dehydrated in the same way they were for the bulk
density tests. The mass of sample used in the 200g tests and the bulk density tests was the
same. The bulk density tests and the 200g dehydration hydration tests were then used to
calculate the energy density of the TCESM.
If the oven dehydration did not take place the mass of material within the bulk density
tests may be significantly different from the mass of material within the 200g dehydration
hydration testing resulting in wrong energy density values. This is due to the ambient
hydration of the TCESM which can be significant >20% mass change. This would mean
when calculating the bulk density of a hydrated sample only 80% of the mass of the sample
could be the material and the other 20% could be water taken up from the ambient hydration.
This would result in a higher bulk density value because less material is actually being tested,
which would result in a higher energy density value (J/m3).
Each of the material’s bulk density was measured at least five times and averaged. This
ensured that experimental error could be established from the tests and included within the
values.
94
3.4 Sample preparation methodology
3.4.1 Introduction to the sample preparation methodology
Throughout this research several different sample preparation methods were utilised to
create composite materials for TCES. The sample preparation methods consist of creating
composite materials by impregnating a commercially produced pellet with a solution,
creating composite materials using a custom methodology and creating composite materials
using a pellet press. The preparation used for TCESM can impact their performance and
characteristics (see chapter 2).
3.4.2 Incipient wetness impregnation method
3.4.2.1 Experimental procedure for the incipient wetness impregnation
An incipient wetness impregnation was used for the 13x pellets + MgSO4 pellets and also
for the activated carbon and activated alumina materials. First 13x pellets were dried, with a
heating rate of 1˚C/min, to 150˚C within a Carbolite convection oven and held isothermally at
150˚C for 3h. The pellets were then allowed to cool. The pellets were then weighed using a
0.01mg precision balance. Once the weight of the pellets was established a saturated MgSO4
solution was added to the pellets. The saturated MgSO4 solution was created by adding
MgSO4.7H2O to Deionised (DI) water at 20˚C while being mixed with a magnetic stirrer. The
salt was added slowly to allow it to dissolve; the amount dissolved was 71g in 100ml of DI
water. The solution was slowly added to the dried 13x pellets which absorbed the solution.
The maximum amount of solution which was absorbed by the 13x pellets was 5.9ml per 10g.
This volume of solution was used for all of the impregnation of the different wt% 13x pellets.
Different concentrations of MgSO4.7H2O + H2O (DI water) solutions were mixed. Each
of the solutions was made to be 40g in weight. The mass of MgSO4.7H2O added to the
solutions was calculated from knowing that the 12.9wt% 13x sample absorbed a maximum of
5.9ml of solution. From this three different solutions, to create different wt% below 12.9wt%,
were calculated to find the amount of MgSO4.7H2O required to be added to each solution.
For each impregnation 10g of dried 13x pellets were used. Table 3-4 shows the amount of
MgSO4 which was added to each solution. The mass of MgSO4 used was calculated knowing
that MgSO4.7H2O has an amu of 246.52 g/mol, MgSO4 = 120.4 g/mol hence, 120.4/246.52 =
0.488x of MgSO4.7H2O is MgSO4. The 5.9ml of solution mass was a measured value and

95
weighed using a 0.01mg precision balance. From this measurement and the % amount of
MgSO4 in each solution the wt% of each impregnated 13x pellet was calculated.
Table 3-4 The amounts of MgSO4 added in each impregnated 13x pellet.
Mass of
MgSO4.7H2O
(g)
MgSO4
mass
(g)
Mass of H2O
added
(g)
MgSO4 %
in solution
5.9ml of
solution mass
(g)
Calculated wt% of
MgSO4 within 13x
pellets
12.880 6.285 27.120 15.71% 6.439 9.2
10.277 5.015 29.723 12.54% 6.324 7.3
6.440 3.143 33.560 7.86% 5.882 4.4
The different concentration solutions were added to the pellets and mixed and then left for
90 minutes to maximise the absorption.
Once absorbed the samples were then placed back in the oven where they were heated, at
a ramp rate of 1˚C/min, to 150˚C and held isothermally for 3h at 150˚C until being cooled
slowly within the oven.
3.4.2.2 Justification of the incipient wetness impregnation methodology
40g of solution was made as this is a large enough volume to allow for a satisfactory
mixing of the solution to dissolve all of the MgSO4 added.
The 13x pellets were impregnated in this way to create different wt% samples, and not by
varying the amount of saturated MgSO4 solution absorbed by the 13x pellets, to create a
sample of even consistency. 5.9ml was the maximum amount absorbed by the pellets, this
amount was used for each impregnation. If less was used the even consistency of the pellets
may have changed and some pellets may have had a higher wt% than others in the same
sample batch which could lead to errors when analysing the samples.
3.4.3 Modified wetness impregnation method
3.4.3.1 Experimental procedure for the modified wetness impregnation
Zeolite-Y powder was dried in a Carbolite convection oven, using a ramp rate of 1˚C/min,
to 150˚C. The powder was then held isothermally for 3 hours until being cooled. Once cooled
the desired mass powder was weighed using a 0.01mg precision balance. The desired mass of

96
MgSO4.7H2O needed depending upon the wt% required was calculated, accounting for the
loss of 7 H2O molecules, and weighed. Once weighed DI water was added to the
MgSO4.7H2O and the MgSO4.7H2O was dissolved into a solution. This MgSO4 solution was
then mixed with the zeolite-Y powder. As the MgSO4 was dissolved it was able to
impregnate the pores of the zeolite-Y. Once mixed the solution was dried in the oven with the
same drying procedure used for the zeolite-Y.
The excess water from the solution was removed when dried in the oven. The material
when dried in the oven formed into a flaky substance. For testing the material was ground
back into a fine powder.
3.4.3.2 Justification of the modified wetness impregnation methodology
Throughout this research absorbent powders, namely zeolite-Y, have been impregnated
with MgSO4 and their properties have been tested. The way in which the absorbent was
impregnated with the MgSO4 was different to the incipient wetness impregnation described in
section 3.4.2. As the zeolite material was in a powder form it was not possible to assess the
amount of solution the material could absorb in the same way it was for the 13x pellets. For
this reason the methodology for impregnation was different.
When the MgSO4 solution was made from MgSO4.7H2O, Mg2+
ions were formed in the
solution. These ions could ion exchange with the ions in the zeolite. However, if this did take
place the ions which were displaced by the Mg2+
ions would still be present in the finished
powder.
3.4.4 Ion exchange methodology for the 13x pellets
3.4.4.1 Experimental procedure for the Ion exchange of the 13x pellets
13x pellets were put through an ion exchange process to replace the Na+ ions with Mg
2+
ions. The ion exchange tests were conducted with 10g of 13x pellets (3.2mm). A saturated
solution of MgSO4 was created using 100ml of DI water and 71g of MgSO4.7H2O at 20˚C.
The MgSO4.7H2O was mixed with the DI water using a magnetic stirrer until completely
dissolved. The 10g of 13x pellets were then added to the solution. Initially a lot of the pellets
floated in the solution, to encourage the pellets to sink they were mixed with a magnetic
stirrer on the slowest stir speed for around 5 minutes, after stirring all of the pellets had sunk
in the solution. The solution and pellets were not stirred again.
97
The solution with the sunk pellets was then left for the desired time period for the ion
exchange to occur. Once the time period was over the pellets were filtered out of the MgSO4
solution using filter paper. For every 10g of 13x pellets 100ml of DI water was used to wash
the pellets. Once washed any excess water was dried and the pellets were then placed in a
Carbolite convection oven. The pellets were heated, with a ramp rate of 1˚C/min, to 150˚C.
They were held isothermally at 150˚C for 3 hours until being slowly cooled.
3.4.4.2 Justification of the ion exchange methodology for the 13x pellets
10g of pellets were left in a saturated MgSO4 solution and mixed overnight, 24 hours later
all of the pellets had broken down into the solution and no pellets remained. For this reason,
all future ion exchange tests were completed with minimal stirring of the pellets to reduce the
chance of damage to the 13x pellets.
The washing of the pellets was performed to remove any excess salt solution which was
on the pellets to avoid salt recrystallisation within the pores or on the surface of the 13x
pellets which could cause pore blocking and ultimately reduce their performance.
3.4.5 Pellet creation from powders using the pellet press
3.4.5.1 Experimental procedure for pellet creation from powders using the pellet press
For explanation purposes the method for creating the ZMK material, which consists of
45wt% Zeolite-Y, 35wt% of MgSO4 and 20wt% of binder has been explained. First the
absorbent material (zeolite-Y) was dried using a Carbolite convection oven, using a ramp rate
of 1˚C/min, to 150˚C. The sample was held isothermally at 150˚C for 3 hours until being
cooled slowly within the oven. The required amount of zeolite-Y absorbent was then weighed
out. The amount of each component could vary depending on the composition of the sample
being made. The binder material used was an attapulgite clay material (Tygris KU20). This
material was also dried in the same way as the zeolite-Y. After both the clay and the zeolite-
Y had been weighed the materials were mixed. The clay material needed to be ground into a
fine powder before mixing; to do this a blender was used. The zeolite-Y was then mixed with
ground clay in the blender. Next, the amount of MgSO4 required was calculated and the
correct amount of MgSO4.7H2O was weighed, accounting for the loss of 7H2O molecules,
using a 0.01mg precision balance. The MgSO4.7H2O was then blended and mixed with the
zeolite-Y and clay. Once mixed DI water was added to this mixture to form a slurry and
allow the MgSO4 to impregnate the zeolite-Y.
98
After the solution was mixed it was placed in a Carbolite convection oven and heated,
with a heating rate of 1˚C/min, to 150˚C. The material was held isothermally for 3 hours
before being cooled within the oven. Once cooled the material was removed from the oven.
The material formed into a hard “slab” like structure. The material was the broken down and
ground, using the blender, back into a fine powder. DI water was then added; the amount of
DI water added depended on the material and was done to allow the powder to be worked
into a soft clay consistency. The water was added gradually to ensure none of the material
became saturated which could have resulted in the MgSO4 dissolving and being washed out
of the zeolite-Y pores.
To form the pellets a custom pellet press was built. The press had a worm drive which
forced the material through the end of the press which had many 4mm diameter holes in. The
soft clay consistency material was added to the pellet press to be formed into pellets. When
initially formed the pellets were still wet and were not handled for this reason. The formed
pellets dropped from the pellet press on to a tray and were then placed within the oven. They
were dried within a Carbolite convection oven, using a heating rate of 1˚C/min, to 150˚C. The
pellets were then held isothermally for 3 hours until being cooled. The drying process
removed any excess water from the pellets and dried them ready for use. The dried pellets
were hard and brittle.
3.4.5.2 Justification of the pellet creation from powders using the pellet press
methodology
Throughout this research it was found that some materials were difficult to source in
pellet form but can be sourced in powder form more readily. One example of this was the
zeolite-Y (ammonium) powder. This material was sourced in a powder but was difficult to
source in a pellet or bead form. For this reason a methodology which enabled the creation
impregnated pellets from powder absorbents was developed.
A blender was used to grind the materials into powders, it was seen as a better choice than
a mortar and pestle as it was quicker and created a fine and even consistency powder.
The process of adding DI water to the mixture dissolved the MgSO4.7H2O and allowed
the MgSO4 to enter the pores of the zeolite mix. When the MgSO4.7H2O was dissolved Mg2+
ions were formed in the solution. These ions could ion exchange with the ions in the zeolite.
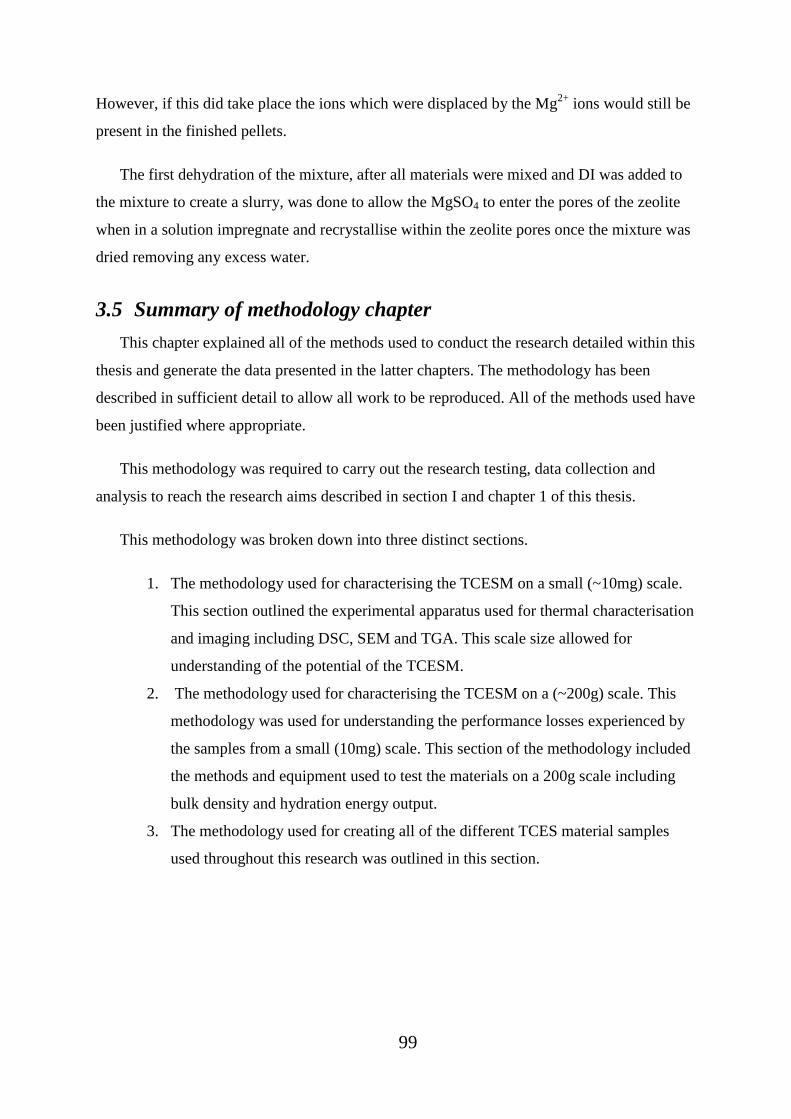
99
However, if this did take place the ions which were displaced by the Mg2+
ions would still be
present in the finished pellets.
The first dehydration of the mixture, after all materials were mixed and DI was added to
the mixture to create a slurry, was done to allow the MgSO4 to enter the pores of the zeolite
when in a solution impregnate and recrystallise within the zeolite pores once the mixture was
dried removing any excess water.
3.5 Summary of methodology chapter
This chapter explained all of the methods used to conduct the research detailed within this
thesis and generate the data presented in the latter chapters. The methodology has been
described in sufficient detail to allow all work to be reproduced. All of the methods used have
been justified where appropriate.
This methodology was required to carry out the research testing, data collection and
analysis to reach the research aims described in section I and chapter 1 of this thesis.
This methodology was broken down into three distinct sections.
1. The methodology used for characterising the TCESM on a small (~10mg) scale.
This section outlined the experimental apparatus used for thermal characterisation
and imaging including DSC, SEM and TGA. This scale size allowed for
understanding of the potential of the TCESM.
2. The methodology used for characterising the TCESM on a (~200g) scale. This
methodology was used for understanding the performance losses experienced by
the samples from a small (10mg) scale. This section of the methodology included
the methods and equipment used to test the materials on a 200g scale including
bulk density and hydration energy output.
3. The methodology used for creating all of the different TCES material samples
used throughout this research was outlined in this section.

100
4 Chapter 4 – Characterization of MgSO4, zeolite-Y and
composite materials
Chapter 4 investigates the small scale characteristics of MgSO4, zeolite-Y and composite
materials of zeolite-Y impregnated with MgSO4. It is important to understand the small scale
(~10mg) characteristics of these materials because when the materials are used at a larger
scale (i.e. 200g+) the characteristics may change due to scaling losses. When testing at a
small scale the energy output of the materials will be close to the theoretical potential of the
materials. By understanding the materials potential and properties on a small scale it allows a
prediction of the materials characteristics on a larger scale to be made.
For testing the material on a small scale thermal analysis devices were used. The
devices used were a DSC, TGA+RGA and SEM+EDX. The characterization throughout this
chapter will consider the following;
Dehydration enthalpy which allows for predicted hydration energy output of the
materials
Cycle stability of the materials to understand if there are any degradation impacts of
repeated cycling
Heating rate impacts to assess if higher or lower dehydration heating rates impact the
energy output characteristics of the materials
Slow kinetics to understand how the heating rate impacts the rate of dehydration and
therefore the way in which the energy is stored and also the amount of energy which
is stored.
4.1 Initial DSC, TGA and RGA characterization of MgSO4.7H2O
Figure 4-1 shows overlaid measurements from the DSC, TGA and RGA showing the
dehydration of MgSO4.7H2O to 300°C. It is seen that all of the DSC, TGA & RGA
measurements agree on the dehydration temperatures and hence, temperatures required to
charge and store energy within MgSO4. From the TGA measurements it is difficult to
distinguish the three step loss of water however, the DSC and RGA measurements show the
three step process clearly. The loss 1H2O molecule takes place at a peak temperature of 45°C,
the loss of 5.9 H2O molecules takes place at a peak temperature of 86°C. The last 0.1 H2O

101
molecules are lost at around 277°C and can be seen on the DSC measurements to be
exothermic and not endothermic like the previous 6.9 H2O molecules.
Figure 4-1 shows the change in mass from 110-150°C is only (2.6%) and is unlikely to
have a great effect on the energy density if the MgSO4.xH2O if only dehydrated to 110°C
opposed to 150°C (see section 4.2.2 for more details).
Figure 4-1 MgSO4.7H2O dehydration to 300°C overlay showing measurements from TGA, RGA and
DSC showing the dehydration process
4.2 MgSO4.7H2O heating rate effects and cycle stability
investigations
To assess the effect the dehydration heating rate has on MgSO4.xH2O several samples
were dehydrated at various heating rates within both a TGA (with attached RGA) and a DSC.
The chosen heating rates used were 1, 2, 5 and 10˚C/min.
4.2.1 Sudden dehydration peaks from MgSO4.xH2O with high heating rates
Figure 4-2 shows the DSC dehydration data of MgSO4.7H2O for each heating rate.
Figure 4-3 shows the dehydration RGA data showing 18amu (H2O) volatiles leaving the
MgSO4.7H2O. The first endothermic peak on each DSC plot is a result of the loss of 1 H2O
molecule. The second large endothermic peak, taking into account the TGA data, is due to a
calculated loss of around 5.9 H2O molecules. From Figure 4-3 it is seen the peak temperature
for H2O leaving the MgSO4.7H2O increases with increasing heating rate, the plots also appear
to become more volatile with higher heating rates. This phenomenon is due to the
dehydration kinetics of the MgSO4.xH2O and is explained in more detail in section 4.6.

102
It is clear from Figure 4-2 as the dehydration heating rate increases the heat flow has
many more sharp endothermic peaks. From the RGA data (Figure 4-3) it is seen that the
peaks are a result of water suddenly leaving the material.
Figure 4-2 DSC measurements for several heating rates, showing volatile behaviour with increasing
heating rates.
Figure 4-3 Ion current as a function of temperature for MgSO4.7H2O at 4 different heating rates
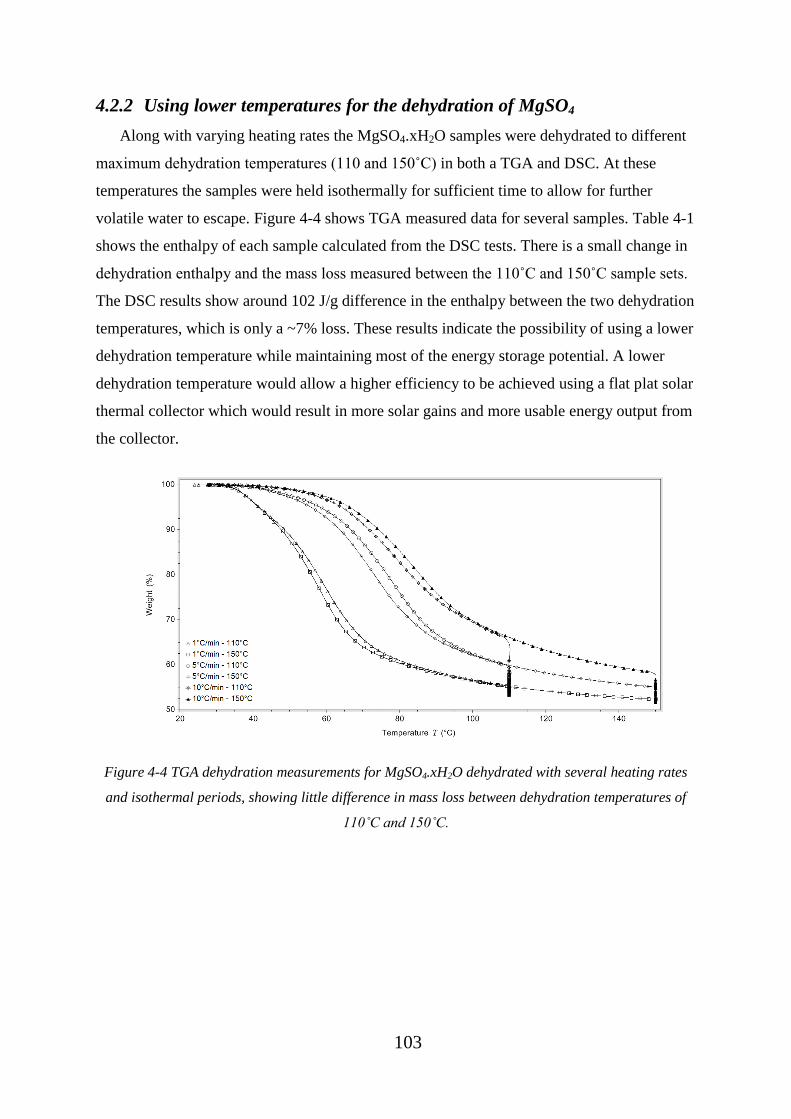
103
4.2.2 Using lower temperatures for the dehydration of MgSO4
Along with varying heating rates the MgSO4.xH2O samples were dehydrated to different
maximum dehydration temperatures (110 and 150˚C) in both a TGA and DSC. At these
temperatures the samples were held isothermally for sufficient time to allow for further
volatile water to escape. Figure 4-4 shows TGA measured data for several samples. Table 4-1
shows the enthalpy of each sample calculated from the DSC tests. There is a small change in
dehydration enthalpy and the mass loss measured between the 110˚C and 150˚C sample sets.
The DSC results show around 102 J/g difference in the enthalpy between the two dehydration
temperatures, which is only a ~7% loss. These results indicate the possibility of using a lower
dehydration temperature while maintaining most of the energy storage potential. A lower
dehydration temperature would allow a higher efficiency to be achieved using a flat plat solar
thermal collector which would result in more solar gains and more usable energy output from
the collector.
Figure 4-4 TGA dehydration measurements for MgSO4.xH2O dehydrated with several heating rates
and isothermal periods, showing little difference in mass loss between dehydration temperatures of
110˚C and 150˚C.
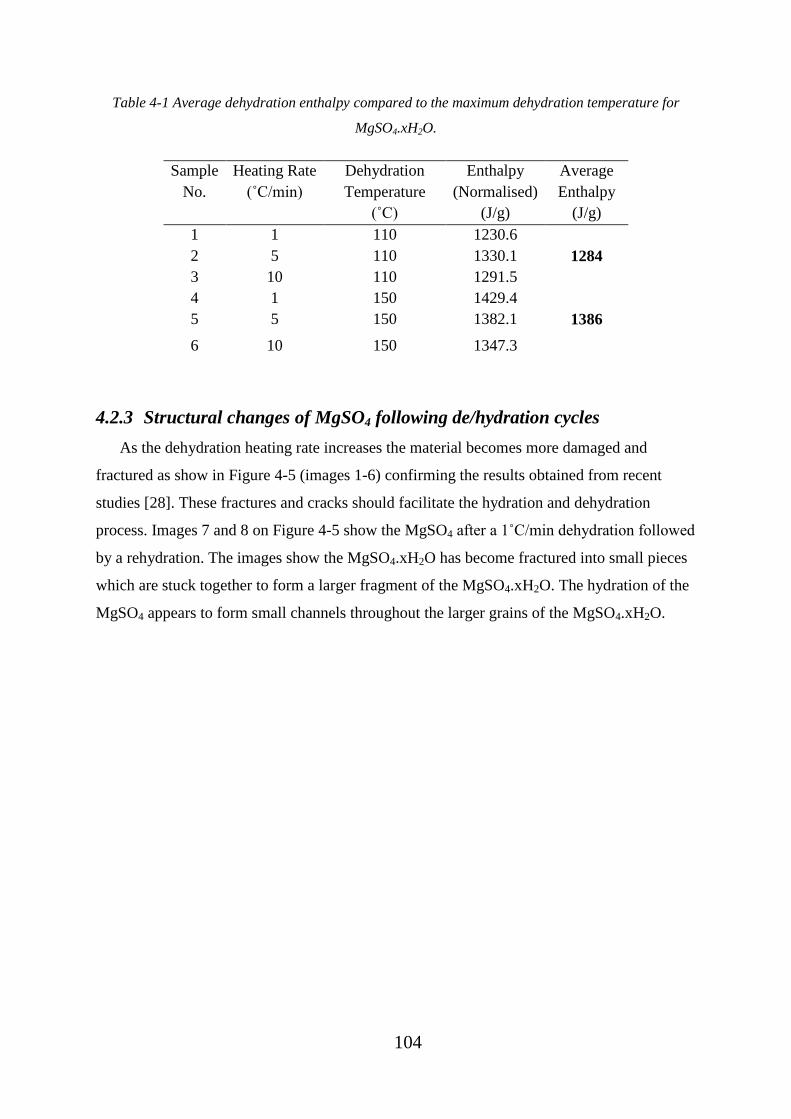
104
Table 4-1 Average dehydration enthalpy compared to the maximum dehydration temperature for
MgSO4.xH2O.
Sample
No.
Heating Rate
(˚C/min)
Dehydration
Temperature
(˚C)
Enthalpy
(Normalised)
(J/g)
Average
Enthalpy
(J/g)
1 1 110 1230.6
2 5 110 1330.1 1284
3 10 110 1291.5
4 1 150 1429.4
5 5 150 1382.1 1386
6 10 150 1347.3
4.2.3 Structural changes of MgSO4 following de/hydration cycles
As the dehydration heating rate increases the material becomes more damaged and
fractured as show in Figure 4-5 (images 1-6) confirming the results obtained from recent
studies [28]. These fractures and cracks should facilitate the hydration and dehydration
process. Images 7 and 8 on Figure 4-5 show the MgSO4 after a 1˚C/min dehydration followed
by a rehydration. The images show the MgSO4.xH2O has become fractured into small pieces
which are stuck together to form a larger fragment of the MgSO4.xH2O. The hydration of the
MgSO4 appears to form small channels throughout the larger grains of the MgSO4.xH2O.

105
Figure 4-5 SEM Images of MgSO4 after dehydration with different heating rates and images of
MgSO4 after rehydration
4.2.4 High hydration levels of MgSO4 using 1.3kPa pH2O
Figure 4-6, Figure 4-7 and Figure 4-8 shows the TGA dehydration data of MgSO4.xH2O
after heating rates of 1, 5 and 10ᵒC/min, respectively. The first plot (highest starting mass) on
each figure shows the initial dehydration of MgSO4.7H2O. The following plots show the
dehydration of MgSO4.xH2O after a rehydration. It is clear that after each cycle the
MgSO4.xH2O hydrates to the same level of ~MgSO4.5.5H2O. This is a much higher level
than has been suggested by other studies, which show the material only hydrates to
MgSO4.H2O using the same hydration conditions. The hydration level of the MgSO4.xH2O
shown in Figure 4-7 increases with successive cycles until cycle 6. At this point the material
106
rehydrates to the same level with each cycle. This observation suggests the increased
de/hydration cycles may improve the hydration characteristics of the MgSO4.xH2O. It must
be noted that these test are on a small (4-10mg) scale and may not scale to large systems and
material quantities. From Figure 4-6, Figure 4-7, Figure 4-8 and Table 4-2 it appears using
the hydration conditions, which are readily achievable during the UK winter, a dehydration
enthalpy of ~1200J/g is achievable.
4.2.5 Heating rate effect on the cycle stability and dehydration enthalpy of
MgSO4
To assess the impact varying dehydration heating rates have on the cycle stability and
energy storage potential of MgSO4 cycle stability testing was conducted. Each sample was
hydrated with the same conditions (pH2O = ~1.3kPa) for the same time and then dehydrated
within both a TGA and a DSC. This de/hydration was repeated several times. For this
experiment 1, 5, and 10˚C/min heating rates were used.
Table 4-2 shows the DSC dehydration enthalpy results of MgSO4.xH2O after being
dehydrated with three dehydration heating rates (1, 5 and 10ᵒC/min). From the TGA data
(Figure 4-6, Figure 4-7 and Figure 4-8) and Table 4-2 it is apparent that MgSO4.xH2O is very
stable with no observable cycle degradation. This stability does not appear to be influenced
by the dehydration heating rate used as each MgSO4.xH2O sample has very similar
dehydration enthalpy. This confirms that for a small (4-10mg) scale sample size the
MgSO4.xH2O de/hydration levels are unchanged when using a heating rate of 1, 5 or
10˚C/min.
Table 4-2 Enthalpy data showing dehydration enthalpy (after a 150ᵒC dehydration) and cycle
stability of MgSO4
Heating Rate (˚C/min) 1 5 10
Enthalpy (normalized) (J/g) Cycle No.1 1429.4 1382.1 1347.3
Enthalpy (normalized) (J/g) Cycle No.2 1268.1 1284.4 1340.3
Enthalpy (normalized) (J/g) Cycle No.3 1315.8 1244.9 1094.2
Enthalpy (normalized) (J/g) Cycle No.4 1303.7 1052.5 1275.8
Enthalpy (normalized) (J/g) Cycle No.5 1279.6 1216.4 1218.0
Enthalpy (normalized) (J/g) Cycle No.7 1296.3 1217.9 1208.2
Average (J/g) – not including erroneous values 1292.7 1240.9 1260.6
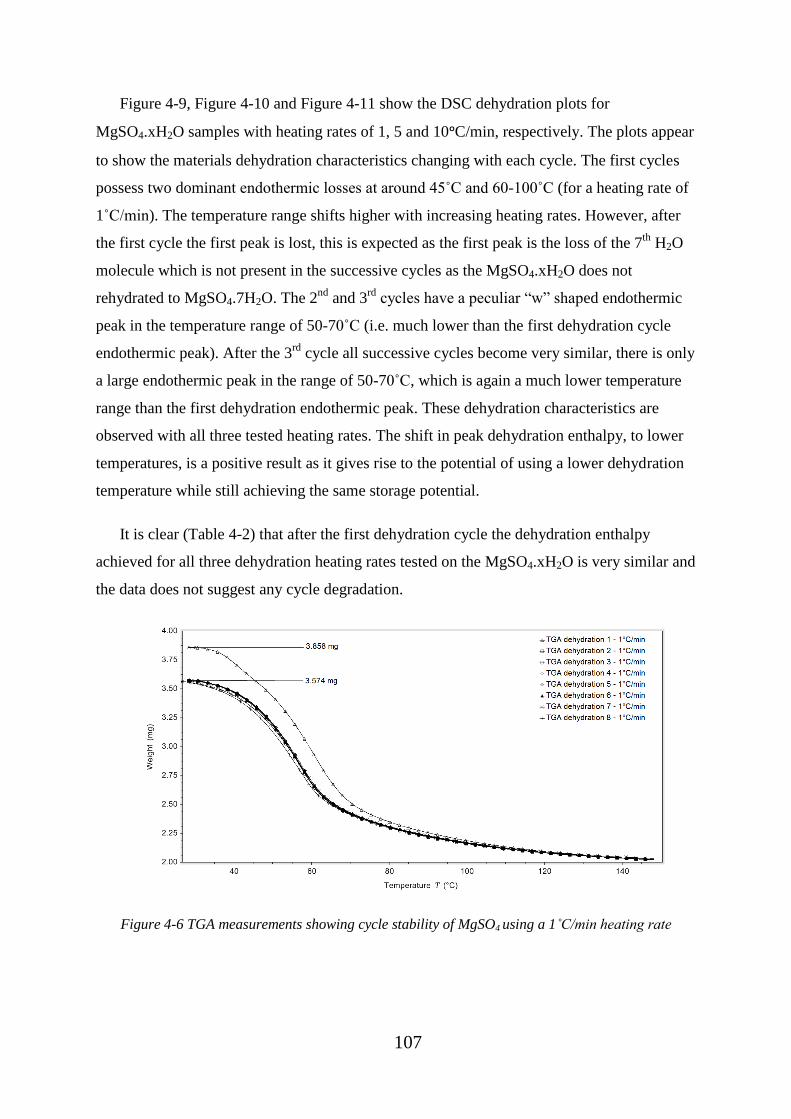
107
Figure 4-9, Figure 4-10 and Figure 4-11 show the DSC dehydration plots for
MgSO4.xH2O samples with heating rates of 1, 5 and 10ᵒC/min, respectively. The plots appear
to show the materials dehydration characteristics changing with each cycle. The first cycles
possess two dominant endothermic losses at around 45˚C and 60-100˚C (for a heating rate of
1˚C/min). The temperature range shifts higher with increasing heating rates. However, after
the first cycle the first peak is lost, this is expected as the first peak is the loss of the 7th
H2O
molecule which is not present in the successive cycles as the MgSO4.xH2O does not
rehydrated to MgSO4.7H2O. The 2nd
and 3rd
cycles have a peculiar “w” shaped endothermic
peak in the temperature range of 50-70˚C (i.e. much lower than the first dehydration cycle
endothermic peak). After the 3rd
cycle all successive cycles become very similar, there is only
a large endothermic peak in the range of 50-70˚C, which is again a much lower temperature
range than the first dehydration endothermic peak. These dehydration characteristics are
observed with all three tested heating rates. The shift in peak dehydration enthalpy, to lower
temperatures, is a positive result as it gives rise to the potential of using a lower dehydration
temperature while still achieving the same storage potential.
It is clear (Table 4-2) that after the first dehydration cycle the dehydration enthalpy
achieved for all three dehydration heating rates tested on the MgSO4.xH2O is very similar and
the data does not suggest any cycle degradation.
Figure 4-6 TGA measurements showing cycle stability of MgSO4 using a 1˚C/min heating rate
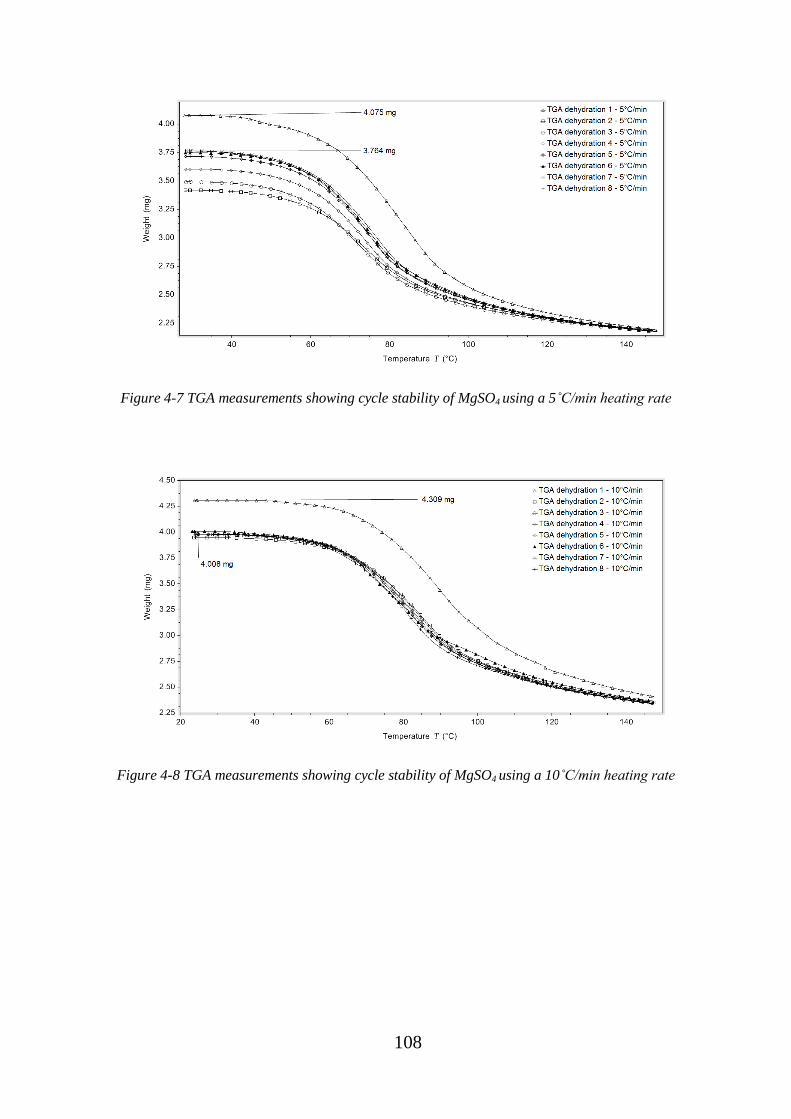
108
Figure 4-7 TGA measurements showing cycle stability of MgSO4 using a 5˚C/min heating rate
Figure 4-8 TGA measurements showing cycle stability of MgSO4 using a 10˚C/min heating rate
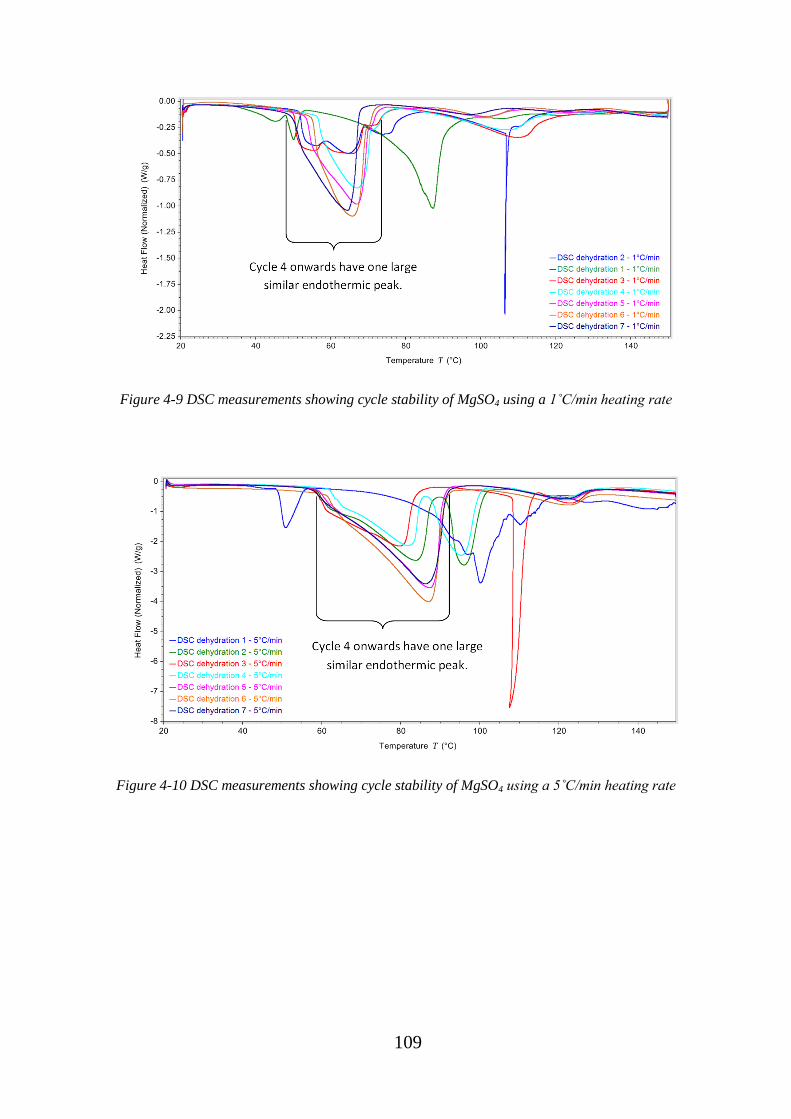
109
Figure 4-9 DSC measurements showing cycle stability of MgSO4 using a 1˚C/min heating rate
Figure 4-10 DSC measurements showing cycle stability of MgSO4 using a 5˚C/min heating rate

110
Figure 4-11 DSC measurements showing cycle stability of MgSO4 using a 10˚C/min heating rate
4.2.6 Slow kinetics of MgSO4
The only apparent discrepancy between the TGA dehydration of the MgSO4.xH2O in
Figure 4-6, Figure 4-7 and Figure 4-8 was the temperature range for peak mass loss. As the
heating rate increases the peak dehydration temperature shifts to a higher range. This was
also observed from the RGA data (Figure 4-3). The shift in dehydration temperature is due to
the dehydration kinetics of the MgSO4.xH2O.
The dehydration kinetics of the MgSO4 increases with successive cycles due to increased
vapour channels. The reasons for this were believed to be;
The peak dehydration temperature of the MgSO4.xH2O decreases with successive
dehydration cycles, shown in Figure 4-9, Figure 4-10 and Figure 4-11.
The SEM data (Figure 4-5) shows increased amount of “cracks” with increasing
heating rate.
The vapour sorption results (Figure 4-20, Figure 4-21 and Figure 4-22) show
higher pore volume for MgSO4 after extra dehydration cycles.
The results of a more detailed investigation of the changing dehydration kinetics of the
MgSO4.xH2O are presented in section 4.6.
4.3 Zeolite cycle stability investigations
Zeolite-Y (SiO2:Al2O3 ,mole ratio 5.1:1) was chosen for composite material creation due
to previous studies indicating of the potential of zeolites for adsorption heat storage [67,130]
111
but more specifically as this material has a large BET surface area (925m2/g). Before the
composite materials (zeolite impregnated with MgSO4) were created the zeolite was
subjected to a cycle stability analysis, similar to the analysis performed for the MgSO4
samples.
4.3.1 Thermal storage potential of zeolite-Y
Figure 4-12 shows the DSC data for several dehydration cycles of zeolite-Y up to 150˚C.
The zeolite was hydrated using the same conditions used for the MgSO4 samples and
dehydrated using a heating rate of 5˚C/min. Figure 4-12 shows the endothermic heat flow for
the zeolite starts at around -0.2W/g at 20˚C and gradually increases to -0.55W/g at 120˚C.
After 120˚C the endothermic heat flow decreases until around 150˚C.
After each dehydration the zeolite was put through another dehydration to 150˚C without
any exposure to the environment, this ensured no hydration could occur. This was done to
measure the zeolites heat flow which was due to the specific heat capacity of the material. It
was seen that the heat flow which was due to the specific heat of the zeolite had an average
value of 165J/g.
After conducting a dehydration enthalpy analysis on the zeolite-Y samples the average
achieved enthalpy was 615J/g. This means that the zeolite-Y had a performance of 79%
(performance = dehydration enthalpy/ total enthalpy * 100). As the material is to be
dehydrated (charged) in the summer months and discharged in the winter all of the sensible
heat will be lost. For the zeolite-Y the amount of energy stored in chemical bonds was 79%
of the original total enthalpy required for dehydration. This result along with the low
temperature range, in which the materials dehydration enthalpy peaks at 120˚C, highlights the
materials potential for use as a domestic TCES material itself.

112
Figure 4-12 DSC measurements used for evaluating the dehydration enthalpy of hydrated zeolite-Y
4.4 Composite TCES materials analysis
The composite materials created consisted of varying weight ratios of MgSO4 and zeolite-
Y. The selected wt% ratios of MgSO4 and zeolite-Y were 15,20,25,30 and 35wt%.
4.4.1 Composite TCES materials enthalpy analysis
Figure 4-13 shows the DSC dehydration data for all composite materials. For these tests a
heating rate of 1˚C/min was used. The materials appear to exhibit characteristics from both
the MgSO4 and the zeolite-Y. The two sharp endothermic peaks from the MgSO4 and the
slowly decreasing endothermic heat flow from the zeolite-Y. As the wt% of magnesium
sulphate increases within the composite materials so does the negative heat flow of the two
distinct endothermic peaks seen at around 60-100˚C. This is a characteristic of the
magnesium sulphate and was also seen in Figure 4-9, Figure 4-10 and Figure 4-11.

113
Figure 4-13 DSC dehydration measurements for the hydrated composite materials
Figure 4-14 shows the averaged DSC dehydration enthalpy results for the composite
materials and zeolite-Y. It was apparent with increasing wt% the dehydration enthalpy
increases. Also with increasing wt% of MgSO4 the sensible component does not increase,
resulting in less wasted energy. No degradation was observed with increasing wt% as
expected [23,99].
Figure 4-14 Achieved dehydration enthalpy for each composite material.
Figure 4-15 presents the DSC averaged dehydration enthalpy and the performance of each
composite material and the zeolite-Y. As the wt% of MgSO4 in the composite samples
increased so too did the performance %. This was due the increased dehydration enthalpy of

114
the composite samples with increasing wt% and was also due to the sensible component
staying very similar or even possibly decreasing with increasing wt%. This means the
percentage of wasted energy for the higher wt% samples is reduced. For comparison the
sensible component for the 35wt% and 15wt% material was approximately 17% and 20%,
respectively. The sensible component of the sample was likely to decrease with increasing
wt% as the sensible component of MgSO4 was lower than the zeolite-Y’s sensible
component.
Figure 4-15 Dehydration enthalpy and performance of composite materials and zeolite-Y
The TGA data (Figure 4-16) shows the decreasing mass loss with increasing wt% of the
magnesium sulphate in the composite materials. The tests were conducted using a heating
rate of 1˚C/min. The results were expected as the magnesium sulphate lost significantly more
mass relative to the zeolite. No degradation was evident due to the high wt% of the material
which was expected to be observed due to a pore blocking effect [23,99] from the high levels
of magnesium sulphate. This was a positive result for the composite materials and was also in
agreement with DSC results (Figure 4-14).

115
Figure 4-16 TGA dehydration measurements for the composite materials
4.4.2 Composite TCES materials dehydration heating rate effects
Too assess the impact high heating rates have on the composite samples a heating rate
test, similar to the MgSO4 tests was carried out. Using DSC, TGA+RGA samples 15, 25 and
35wt% were dehydrated using heating rates 1, 5 and 10˚C/min. As the MgSO4 shown
increasing volatile behaviour with increasing dehydration heating rates it was expected as the
wt% of each composite sample increased there would be an increasing volatile behaviour.
Figure 4-17 shows the DSC dehydration data using a 10˚C/min heating rate for each
composite sample tested. It was expected as the wt% of the sample increased the DSC plot
would become more volatile similar to that seen in Figure 4-2. The results show as the wt%
increased the plots do not become any more volatile. Figure 4-17 shows the highest, expected
to be the most volatile, 10˚C/min heating rate. This was a positive result and suggests the
composite material was unaffected by high heating rates, behaving in a similar way to the
pure zeolite.
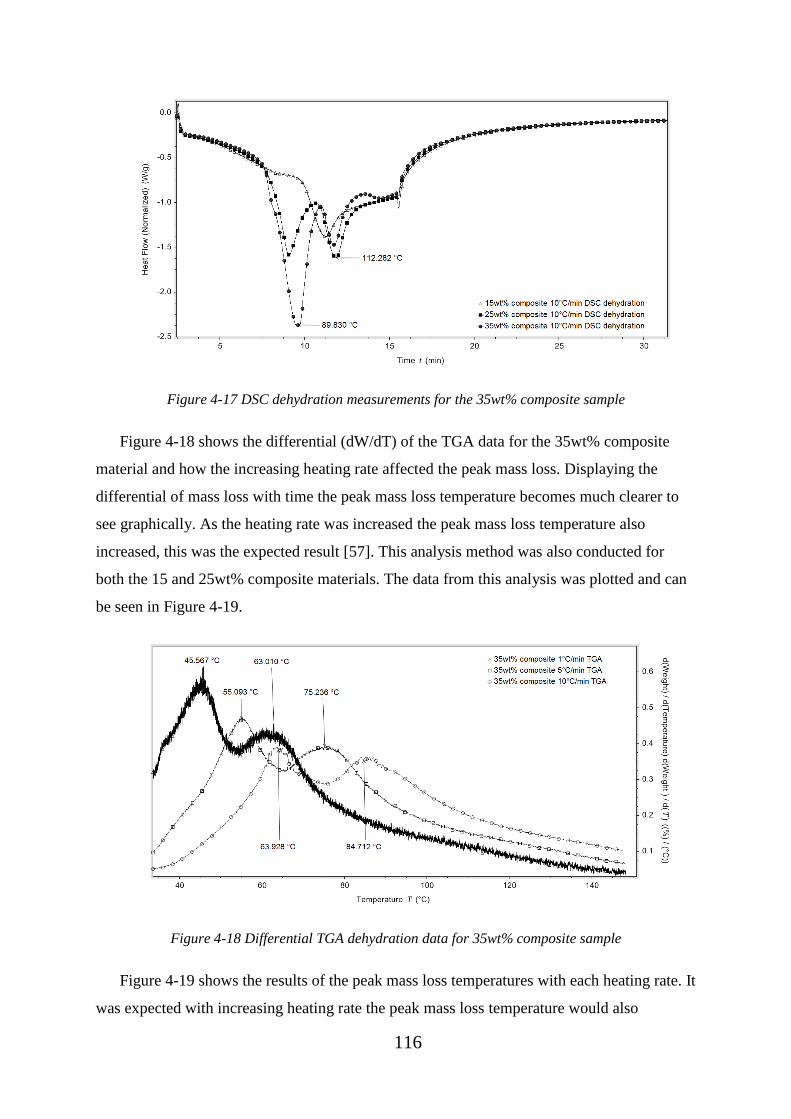
116
Figure 4-17 DSC dehydration measurements for the 35wt% composite sample
Figure 4-18 shows the differential (dW/dT) of the TGA data for the 35wt% composite
material and how the increasing heating rate affected the peak mass loss. Displaying the
differential of mass loss with time the peak mass loss temperature becomes much clearer to
see graphically. As the heating rate was increased the peak mass loss temperature also
increased, this was the expected result [57]. This analysis method was also conducted for
both the 15 and 25wt% composite materials. The data from this analysis was plotted and can
be seen in Figure 4-19.
Figure 4-18 Differential TGA dehydration data for 35wt% composite sample
Figure 4-19 shows the results of the peak mass loss temperatures with each heating rate. It
was expected with increasing heating rate the peak mass loss temperature would also

117
increase. However, depending upon the materials this change in peak mass loss temperature
will change in magnitude. For example (Figure 4-2) shows MgSO4 was greatly affected by
increasing heating rates. For this reason with increasing wt% within the composite materials
the peak mass loss temperature was expected to rise. However, from Figure 4-19 this was not
seen. The use of the zeolite within the material appears to have reduced the volatility of the
material caused by high heating rates, this was a positive result. This means a higher wt%
material, with a higher dehydration enthalpy, can be used and extract its energy while using
the same peak dehydration temperature as a lower wt% material. For example the peak mass
loss temperature for the 15wt% and 35wt% material when using a 10˚C/min heating rate was
very similar at 85.2˚C and 85.7˚C, respectively.
Figure 4-19 Comparison of slow kinetics of each composite sample.
From the experiments performed heating rates appeared to have a minimal impact on the
dehydration characteristics of the composite materials. One possible suggestion as to why this
occurred was due to the superior surface area of the zeolite which increased the dehydration
kinetics of the material nullifying the expected heating rate effects.
4.5 Nitrogen vapour sorption measurements
Figure 4-20, Figure 4-21 and Figure 4-22 show the results of the nitrogen vapour sorption
tests of MgSO4, zeolite-Y and composite materials. The results show as the wt% of MgSO4
increased within the composite materials the pore volume (Figure 4-20) and BET surface area
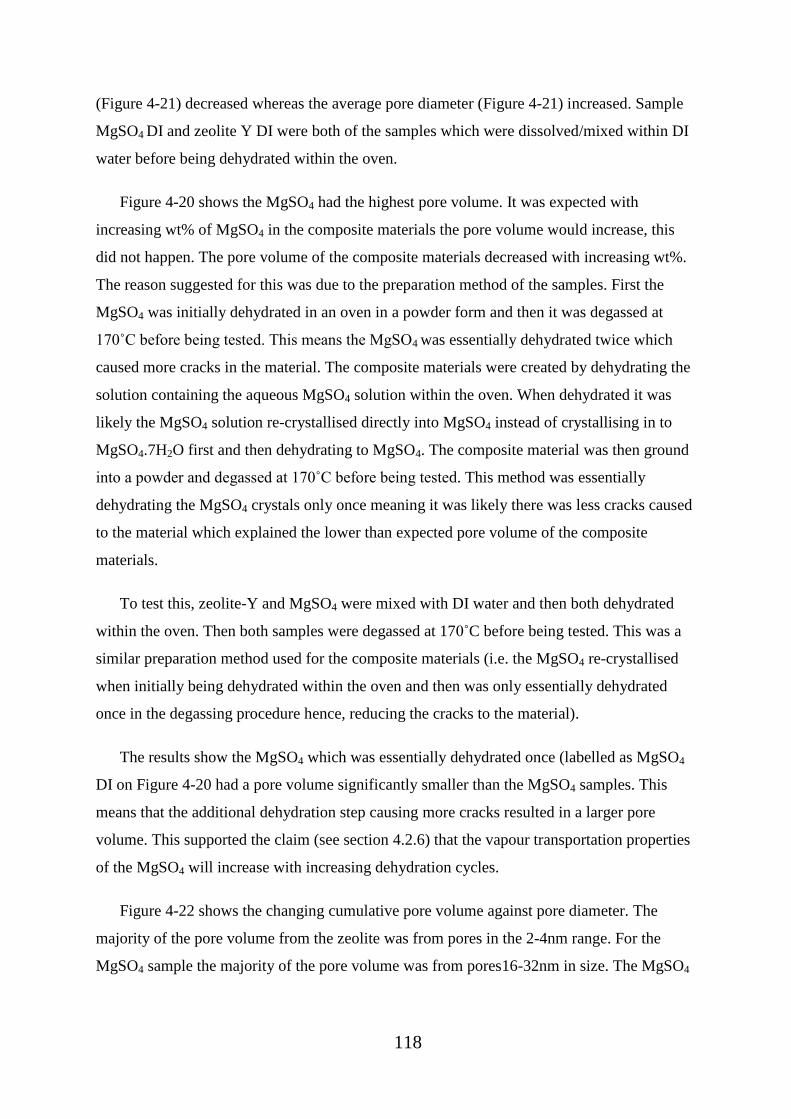
118
(Figure 4-21) decreased whereas the average pore diameter (Figure 4-21) increased. Sample
MgSO4 DI and zeolite Y DI were both of the samples which were dissolved/mixed within DI
water before being dehydrated within the oven.
Figure 4-20 shows the MgSO4 had the highest pore volume. It was expected with
increasing wt% of MgSO4 in the composite materials the pore volume would increase, this
did not happen. The pore volume of the composite materials decreased with increasing wt%.
The reason suggested for this was due to the preparation method of the samples. First the
MgSO4 was initially dehydrated in an oven in a powder form and then it was degassed at
170˚C before being tested. This means the MgSO4 was essentially dehydrated twice which
caused more cracks in the material. The composite materials were created by dehydrating the
solution containing the aqueous MgSO4 solution within the oven. When dehydrated it was
likely the MgSO4 solution re-crystallised directly into MgSO4 instead of crystallising in to
MgSO4.7H2O first and then dehydrating to MgSO4. The composite material was then ground
into a powder and degassed at 170˚C before being tested. This method was essentially
dehydrating the MgSO4 crystals only once meaning it was likely there was less cracks caused
to the material which explained the lower than expected pore volume of the composite
materials.
To test this, zeolite-Y and MgSO4 were mixed with DI water and then both dehydrated
within the oven. Then both samples were degassed at 170˚C before being tested. This was a
similar preparation method used for the composite materials (i.e. the MgSO4 re-crystallised
when initially being dehydrated within the oven and then was only essentially dehydrated
once in the degassing procedure hence, reducing the cracks to the material).
The results show the MgSO4 which was essentially dehydrated once (labelled as MgSO4
DI on Figure 4-20 had a pore volume significantly smaller than the MgSO4 samples. This
means that the additional dehydration step causing more cracks resulted in a larger pore
volume. This supported the claim (see section 4.2.6) that the vapour transportation properties
of the MgSO4 will increase with increasing dehydration cycles.
Figure 4-22 shows the changing cumulative pore volume against pore diameter. The
majority of the pore volume from the zeolite was from pores in the 2-4nm range. For the
MgSO4 sample the majority of the pore volume was from pores16-32nm in size. The MgSO4
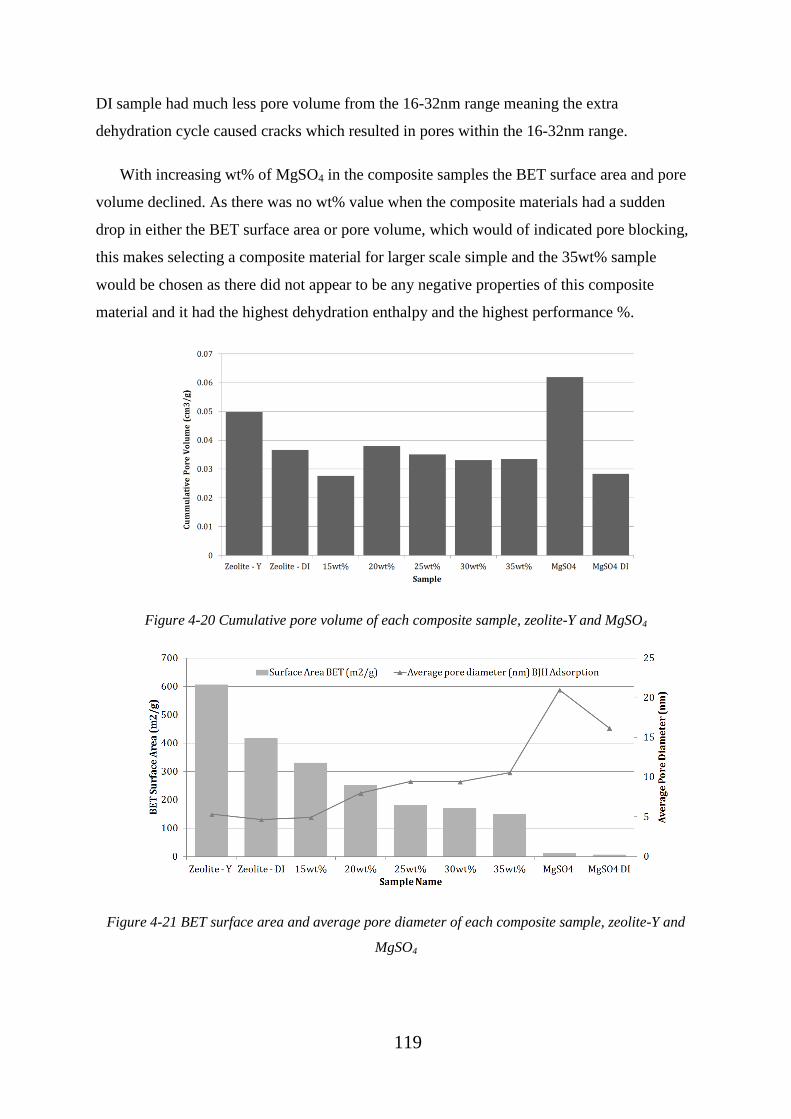
119
DI sample had much less pore volume from the 16-32nm range meaning the extra
dehydration cycle caused cracks which resulted in pores within the 16-32nm range.
With increasing wt% of MgSO4 in the composite samples the BET surface area and pore
volume declined. As there was no wt% value when the composite materials had a sudden
drop in either the BET surface area or pore volume, which would of indicated pore blocking,
this makes selecting a composite material for larger scale simple and the 35wt% sample
would be chosen as there did not appear to be any negative properties of this composite
material and it had the highest dehydration enthalpy and the highest performance %.
Figure 4-20 Cumulative pore volume of each composite sample, zeolite-Y and MgSO4
Figure 4-21 BET surface area and average pore diameter of each composite sample, zeolite-Y and
MgSO4

120
Figure 4-22 Cumulative pore volume against pore diameter of MgSO4, zeolite-Y and the composite
materials
4.6 Introduction to further slow kinetics tests
The dehydration of salt hydrates is a kinetic process and with increasing heating rate the
point at which the dehydration takes place will be shifted to a higher temperature. This
kinetic process is seen in section 4.1 where the peak dehydration temperature of the MgSO4
shifted to a higher temperature.
To investigate this further additional tests have been conducted to look at the impact the
dehydration kinetics of MgSO4.xH2O had on the energy storage potential of the material.
This is an important consideration and may change the way in which MgSO4 is charged when
utilised in a thermal energy storage system. To test the dehydration kinetics of MgSO4
several investigations were conducted:
MgSO4.7H2O-90˚C. MgSO4.7H2O was dehydrated within the DSC and TGA up to 90˚C
with varying heating rates (1, 5 and 10˚C/min). The samples were rehydrated at 56%RH.
These experiments were conducted to assess the enthalpy of the samples when they were
not completely dehydrated (complete dehydration occurs at around 150˚C) and also to
assess the isothermal enthalpy and isothermal mass loss of the samples.
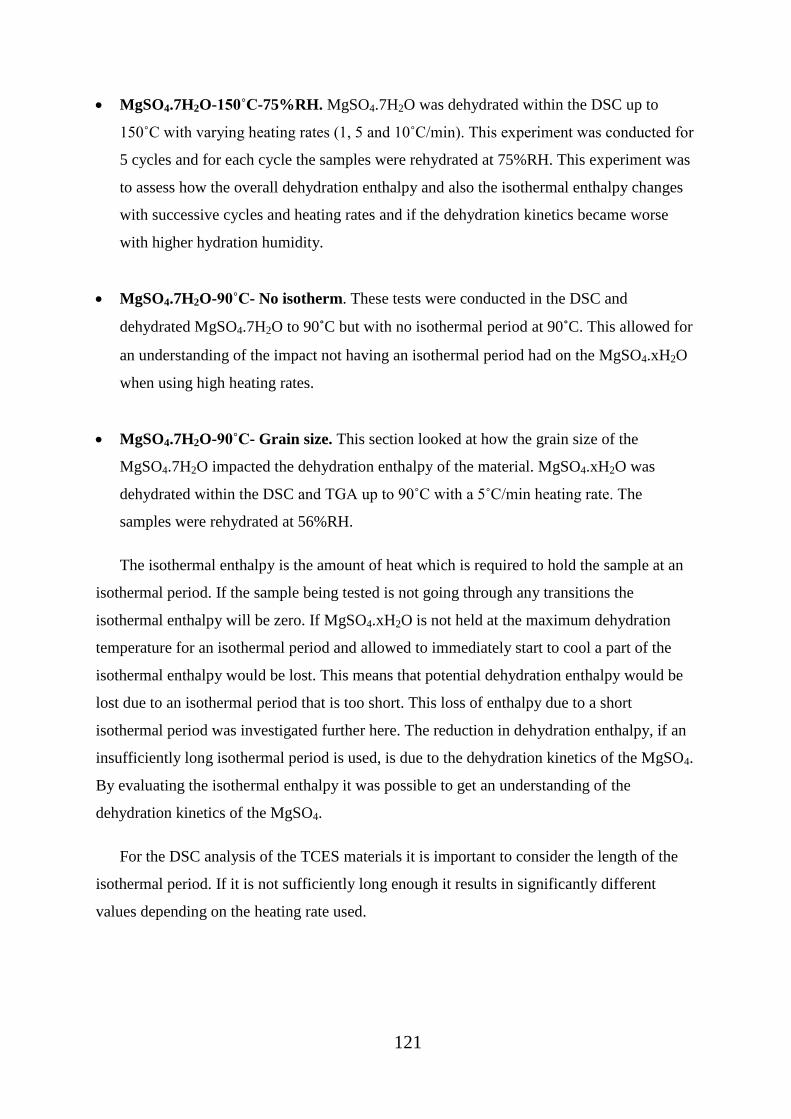
121
MgSO4.7H2O-150˚C-75%RH. MgSO4.7H2O was dehydrated within the DSC up to
150˚C with varying heating rates (1, 5 and 10˚C/min). This experiment was conducted for
5 cycles and for each cycle the samples were rehydrated at 75%RH. This experiment was
to assess how the overall dehydration enthalpy and also the isothermal enthalpy changes
with successive cycles and heating rates and if the dehydration kinetics became worse
with higher hydration humidity.
MgSO4.7H2O-90˚C- No isotherm. These tests were conducted in the DSC and
dehydrated MgSO4.7H2O to 90˚C but with no isothermal period at 90˚C. This allowed for
an understanding of the impact not having an isothermal period had on the MgSO4.xH2O
when using high heating rates.
MgSO4.7H2O-90˚C- Grain size. This section looked at how the grain size of the
MgSO4.7H2O impacted the dehydration enthalpy of the material. MgSO4.xH2O was
dehydrated within the DSC and TGA up to 90˚C with a 5˚C/min heating rate. The
samples were rehydrated at 56%RH.
The isothermal enthalpy is the amount of heat which is required to hold the sample at an
isothermal period. If the sample being tested is not going through any transitions the
isothermal enthalpy will be zero. If MgSO4.xH2O is not held at the maximum dehydration
temperature for an isothermal period and allowed to immediately start to cool a part of the
isothermal enthalpy would be lost. This means that potential dehydration enthalpy would be
lost due to an isothermal period that is too short. This loss of enthalpy due to a short
isothermal period was investigated further here. The reduction in dehydration enthalpy, if an
insufficiently long isothermal period is used, is due to the dehydration kinetics of the MgSO4.
By evaluating the isothermal enthalpy it was possible to get an understanding of the
dehydration kinetics of the MgSO4.
For the DSC analysis of the TCES materials it is important to consider the length of the
isothermal period. If it is not sufficiently long enough it results in significantly different
values depending on the heating rate used.

122
4.6.1 MgSO4-90˚C slow kinetics analysis
For each of the samples the slow kinetics were investigated using an isotherm enthalpy
analysis, which is a method developed by the author of this thesis. Figure 4-23 shows an
integration of the 60 minute isothermal period at 90˚C used to evaluate the isothermal
enthalpy.
Figure 4-23 Illustration of an example isotherm enthalpy analysis conducted on a sample dehydrated
to 90°C
Figure 4-24 shows the complete enthalpy, dehydration enthalpy and sensible enthalpy for
MgSO4.xH2O when dehydrated to 90°C using different heating rates. The second cycle for
each sample resulted in a reduction of enthalpy as the MgSO4 did not hydrate back to
MgSO4.7H2O. Each of the sensible components was very similar for each heating rate
suggesting that the state of dehydration was the same for each sample (i.e. if the samples
were more hydrated than another sample the sensible enthalpy would be measured higher as
there would be enthalpy required to further dehydrate the sample).

123
Figure 4-24 Enthalpy analysis for each of the heating rates tested
Figure 4-25 shows the dehydration isotherm enthalpy of MgSO4.xH2O when dehydrated
to 90°C. The isothermal enthalpy increased with increasing heating rate. The isotherm
enthalpy for the second cycle decreased for the 5 and 10˚C/min samples but increased for the
1˚C/min samples. Also, it was seen that the % of total enthalpy which is accounted to the
isothermal period increased with increasing heating rate. This means due to the slow
dehydration kinetics of the MgSO4.xH2O when using higher heating rates the MgSO4.xH2O
dehydrates more in the isothermal period than when using lower heating rates, which was
expected as the dehydration is a kinetic process.
Figure 4-25 Isotherm enthalpy for each of the MgSO4.xH2O samples when dehydrated to 90°C at
different heating rates
Figure 4-26 shows the MgSO4.xH2O total mass loss (%) when dehydrated to 90°C, using
3 different heating rates tested over 4 cycles. The MgSO4.xH2O appeared to lose a similar
mass % independent of the heating rate used. This was important as it confirmed that the total

124
enthalpy was the same (Figure 4-24) and the total mass loss was the same (Figure 4-26) for
the MgSO4.xH2O samples dehydrated to 90°C independent of the heating rate used.
Figure 4-26 Mass loss of MgSO4.xH2O against cycle number with different dehydration heating rates
Figure 4-27 shows the average enthalpy required per % mass loss for MgSO4.xH2O when
dehydrated to 90°C with different heating rates. The enthalpy per mass loss was very similar
for each heating rates tested. With this information it was suggested that the isotherm
enthalpy increase for increasing heating rates was a result of slow dehydration kinetics (see
Figure 4-25) and not a result of higher heating rates requiring more enthalpy to dehydrate the
material to the same level.
Figure 4-27 Enthalpy per mass loss for each MgSO4.xH2O sample dehydrated with different heating
rates
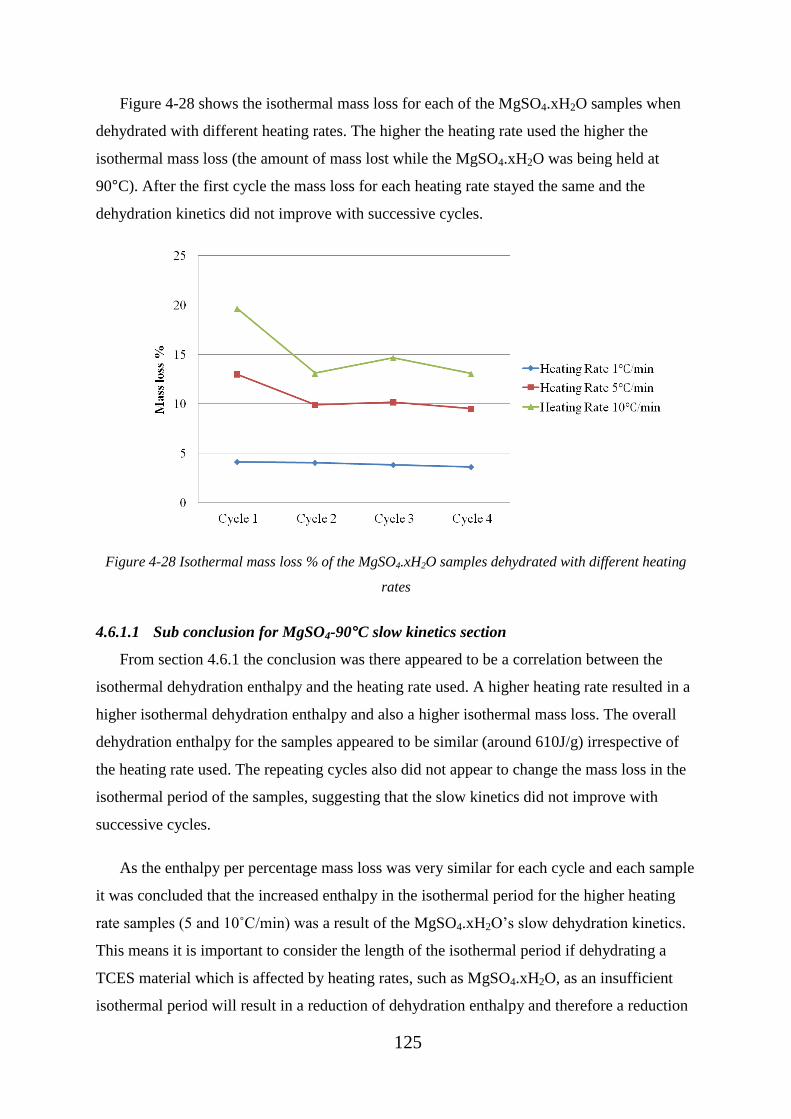
125
Figure 4-28 shows the isothermal mass loss for each of the MgSO4.xH2O samples when
dehydrated with different heating rates. The higher the heating rate used the higher the
isothermal mass loss (the amount of mass lost while the MgSO4.xH2O was being held at
90°C). After the first cycle the mass loss for each heating rate stayed the same and the
dehydration kinetics did not improve with successive cycles.
Figure 4-28 Isothermal mass loss % of the MgSO4.xH2O samples dehydrated with different heating
rates
4.6.1.1 Sub conclusion for MgSO4-90°C slow kinetics section
From section 4.6.1 the conclusion was there appeared to be a correlation between the
isothermal dehydration enthalpy and the heating rate used. A higher heating rate resulted in a
higher isothermal dehydration enthalpy and also a higher isothermal mass loss. The overall
dehydration enthalpy for the samples appeared to be similar (around 610J/g) irrespective of
the heating rate used. The repeating cycles also did not appear to change the mass loss in the
isothermal period of the samples, suggesting that the slow kinetics did not improve with
successive cycles.
As the enthalpy per percentage mass loss was very similar for each cycle and each sample
it was concluded that the increased enthalpy in the isothermal period for the higher heating
rate samples (5 and 10˚C/min) was a result of the MgSO4.xH2O’s slow dehydration kinetics.
This means it is important to consider the length of the isothermal period if dehydrating a
TCES material which is affected by heating rates, such as MgSO4.xH2O, as an insufficient
isothermal period will result in a reduction of dehydration enthalpy and therefore a reduction

126
in the amount of energy that is stored even through the material is at the same temperature as
a material dehydrated with a lower heating rate.
4.6.2 MgSO4-150˚C-75%RH slow kinetics measurements
The average MgSO4.xH2O enthalpy values seen in Figure 4-29 were an average of all the
cycles neglecting the first cycle. This was because the MgSO4.xH2O was initially
MgSO4.7H2O and the MgSO4 does not hydrate back to this state. Some variation in the
enthalpy values could be seen, without TGA data the reason for this could be additional water
leaving the 1˚C/min sample opposed to the 10˚C/min sample. However, the sensible
component of each sample is the same suggesting after the dehydration each sample was
dehydrated to the same level.
Figure 4-29 Total average enthalpy values for MgSO4.xH2O dehydrated with different heating rates
Figure 4-30 shows the percentage the isothermal enthalpy was of the total enthalpy (i.e.
isothermal enthalpy / total enthalpy * 100). There was a trend for the higher heating rates (5
and 10˚C/min) the % decreased with increasing cycles.

127
Figure 4-30 Percentage isothermal enthalpy is of total dehydration enthalpy for MgSO4 samples
dehydrated to 150°C within the DSC
4.6.2.1 Sub conclusion of the MgSO4-150°C-75% RH slow kinetics section
Section 4.6.2 showed how increased heating rates resulted in increased dehydration
enthalpy in the isothermal periods. However, the percentage did appear to decrease with
successive cycles suggesting the dehydration kinetics improved this was also suggested from
the MgSO4 dehydration plots (see Figure 4-9, Figure 4-10 and Figure 4-11). This was likely
due to the repeated dehydration to 150°C which caused fractures in the MgSO4.xH2O
resulting in faster dehydration kinetics.
4.6.3 MgSO4 dehydration enthalpy analysis without an isothermal period
It has been shown in the previous sections ( 4.6.1 & 4.6.2) with an increasing dehydration
heating rate the percentage of dehydration enthalpy and mass loss in the isothermal period, of
the overall dehydration enthalpy and mass loss increased. To further assess if the isothermal
period does impact the dehydration enthalpy and therefore the energy storage potential of
MgSO4 a dehydration of MgSO4.xH2O was performed with a small isothermal period of 5
minutes. The reason for the isothermal period was to allow analysis of the DSC data, which
would be difficult to do accurately if there was no isothermal period.
Figure 4-31, Figure 4-32 and Figure 4-33 show the dehydration of MgSO4.7H2O within
the DSC up to 90˚C after an initial dehydration up to 90˚C, with i) a normal isothermal period
(60 minutes) and ii) a 5 minute isothermal period, with heating rates of 1˚C/min, 5˚C/min and
10˚C/min, respectively.

128
For Figure 4-31 the endothermic heat flow for each of the samples was very similar with
no apparent dehydrations. This was expected as the sample heated with a heating rate of
1˚C/min had enough time to dehydrate completely at 90˚C before the material was then
cooled back down. The plot was expected to look as it did and the endothermic heat flow was
due to the samples sensible heat. The difference in the two sets of heat flow in Figure 4-31
was due to shifting baseline in the samples. Figure 4-32 and Figure 4-33 had a different heat
flow plot compared to Figure 4-31.
Figure 4-32 has a dehydration peak at around 71˚C, this peak when integrated only
accounted for 2.5J/g. Figure 4-33 has a much more distinct dehydration peak which peaked at
around 69˚C but starts at around 30˚C. This peak, when integrated, was around 45J/g.
The reason for these peaks seen in Figure 4-32 and Figure 4-33 was because of the slow
dehydration kinetics of the MgSO4. When the material was dehydrated with a high heating
rate the material does not have enough time to dehydrate completely before being cooled, this
means on the second dehydration when the sample should only exhibit endothermic heat flow
due to its specific heat capacity the material was still being dehydrated.
This is an important consideration for charging TCES materials and specifically MgSO4.
If too high a heating rate is used with an insufficient isothermal period the material could be
partially dehydrated (charged) which will result in reduced energy density from the material
and also a reduced performance percentage.
Figure 4-31 Dehydration of MgSO4.7H2O to 90˚C with a heating rate of 1˚C/min and 5 minute
isothermal period

129
Figure 4-32 Dehydration of MgSO4.7H2O to 90˚C with a heating rate of 5˚C/min and 5 minute
isothermal period
Figure 4-33 Dehydration of MgSO4.7H2O to 90˚C with a heating rate of 10˚C/min and 5 minute
isothermal period
4.6.3.1 Sub conclusion from the MgSO4 dehydration enthalpy analysis without an
isothermal period
Section 4.6.3 showed clearly the length of the isothermal period is important to “extract”
as much of the dehydration enthalpy from the MgSO4.xH2O. The lower the dehydration
enthalpy the lower the amount of energy (heat) input into the material. However, if the
MgSO4.xH2O does not have enough time to dehydrate then the MgSO4.xH2O is not
completely charged essentially becoming a less energy dense material. Also, the efficiency of
the material will essentially decrease as the sensible enthalpy stays the same, which is lost in
a system, meaning a higher percentage of the energy input will be lost if the MgSO4.xH2O is
only partly dehydrated.
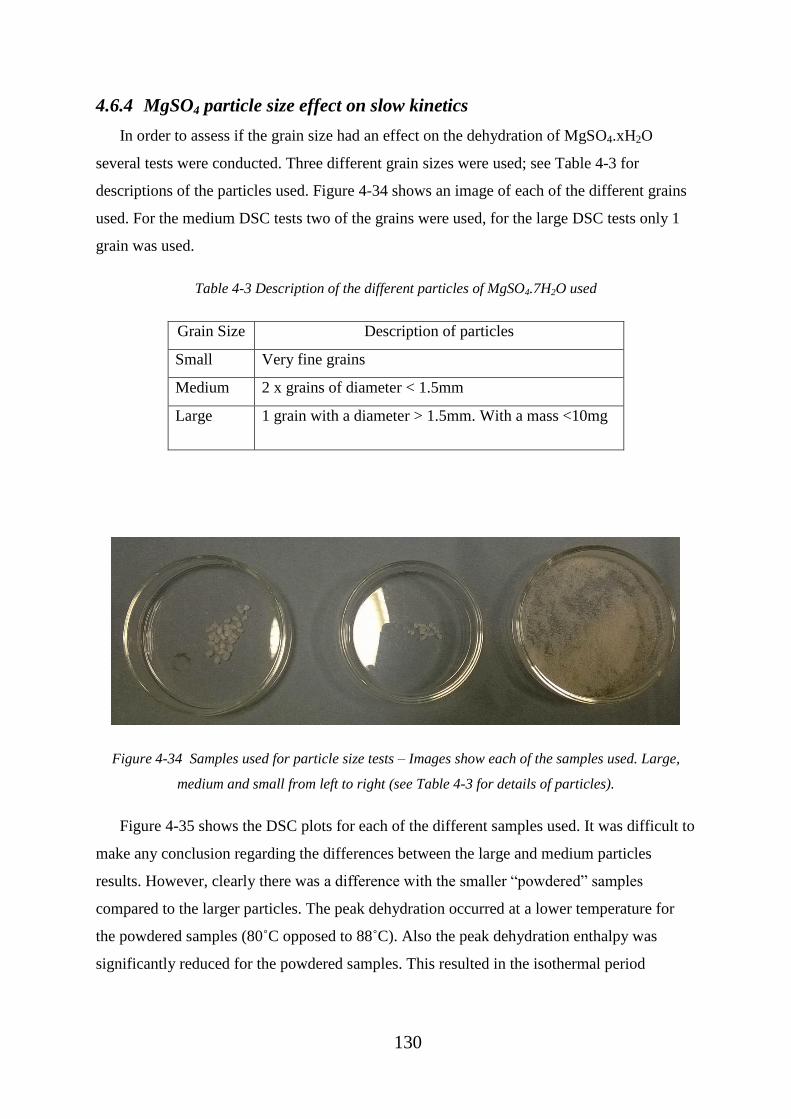
130
4.6.4 MgSO4 particle size effect on slow kinetics
In order to assess if the grain size had an effect on the dehydration of MgSO4.xH2O
several tests were conducted. Three different grain sizes were used; see Table 4-3 for
descriptions of the particles used. Figure 4-34 shows an image of each of the different grains
used. For the medium DSC tests two of the grains were used, for the large DSC tests only 1
grain was used.
Table 4-3 Description of the different particles of MgSO4.7H2O used
Grain Size Description of particles
Small Very fine grains
Medium 2 x grains of diameter < 1.5mm
Large 1 grain with a diameter > 1.5mm. With a mass <10mg
Figure 4-34 Samples used for particle size tests – Images show each of the samples used. Large,
medium and small from left to right (see Table 4-3 for details of particles).
Figure 4-35 shows the DSC plots for each of the different samples used. It was difficult to
make any conclusion regarding the differences between the large and medium particles
results. However, clearly there was a difference with the smaller “powdered” samples
compared to the larger particles. The peak dehydration occurred at a lower temperature for
the powdered samples (80˚C opposed to 88˚C). Also the peak dehydration enthalpy was
significantly reduced for the powdered samples. This resulted in the isothermal period

131
starting as a much lower heat flow value for the powdered samples than for the medium and
larger samples.
As the difference between the medium and large samples was difficult to distinguish
their DSC values were averaged together. Also the TGA tests were run with either small
grains or “grains” which meet the medium criteria or are larger. This was one of the
limitations of the grain size study, as the samples can be reasonably different and not
uniformly prepared samples, this can result in more uncertainty in the measured data.
Figure 4-35 DSC plots for the three different grain sizes dehydrated to 90°C with a heating rate of
5°C/min.
Figure 4-36 shows the average enthalpy for small and medium/large grains. It was
unknown why the medium/large grains have such a significantly higher enthalpy than the
small grains however, it was clear that the grain size was having an impact on the
dehydration kinetics.
Figure 4-37 shows the average TGA mass loss for both of the grain sizes. The variation in
mass loss (water loss) overlaps and no conclusion could be made regarding if one grain size
loses more or less mass. This means that because both small and large grain sizes loose the
same amount of mass (water loss) they should have the same dehydration enthalpy as they
are the same chemical.
Figure 4-38 shows the enthalpy per percentage mass loss (J/%). For the first cycle the
energy per percentage mass loss was higher for the larger grain samples compared to the

132
small grain size. This means that for the first dehydration more energy was required to
dehydrate the larger grains to the same dehydration level as the small grains. For the second
cycle the energy per percentage mass loss for both the small and the larger grains overlaps.
This means the energy was considered to be the same for these samples.
Figure 4-36 Average DSC enthalpy measurements for each grain size
The reason for the higher enthalpy for the larger grains for the first cycle was not known.
One explanation may be extra enthalpy was required for the breaking of the larger grains to
allow the water to escape the MgSO4 which also explains the slow kinetics phenomenon
seen. If this was true the extra enthalpy will not be released in the form of hydration heat
when the material is rehydrated which makes the charge discharge efficiency decrease.
Figure 4-37 Average TGA mass loss data for the different grain sizes
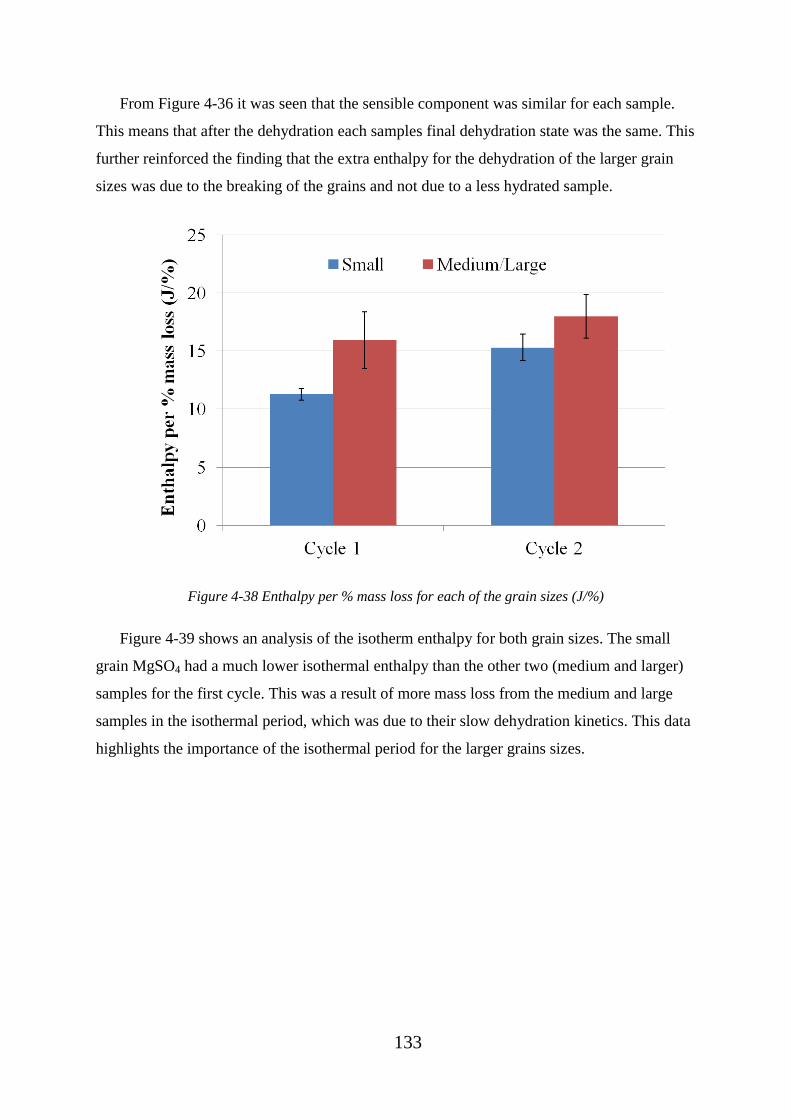
133
From Figure 4-36 it was seen that the sensible component was similar for each sample.
This means that after the dehydration each samples final dehydration state was the same. This
further reinforced the finding that the extra enthalpy for the dehydration of the larger grain
sizes was due to the breaking of the grains and not due to a less hydrated sample.
Figure 4-38 Enthalpy per % mass loss for each of the grain sizes (J/%)
Figure 4-39 shows an analysis of the isotherm enthalpy for both grain sizes. The small
grain MgSO4 had a much lower isothermal enthalpy than the other two (medium and larger)
samples for the first cycle. This was a result of more mass loss from the medium and large
samples in the isothermal period, which was due to their slow dehydration kinetics. This data
highlights the importance of the isothermal period for the larger grains sizes.

134
Figure 4-39 Isothermal enthalpy for each grain size
Figure 4-40 shows the isothermal mass loss of the small and larger grain sizes and also
the percentage of mass loss in the isothermal period relative to the overall mass loss of the
samples. It was seen that the isothermal mass loss was significantly higher for the larger grain
sizes in the first dehydration cycle, which explains the high isothermal enthalpy for the larger
grains in the first dehydration cycle (seen in Figure 4-39).
However, after the first cycle the isothermal enthalpy (Figure 4-39) and the isothermal
mass loss (Figure 4-40) for both the small and the larger grains became very similar. This
means that the slower kinetics which were seen in the larger grains are only an issue for the
first dehydration cycle. Although, the isothermal period was still critical for all grain sizes as
a significant percentage of mass loss and dehydration enthalpy take place in this period
(around 25% of the mass loss and 45% of the dehydration enthalpy was in the isothermal
period after the first dehydration cycle).
Figure 4-40 Isothermal mass loss and isothermal mass loss % for small and medium/large grain sizes

135
Figure 4-41 and Figure 4-42 show the TGA dehydration cycle plots for the small
(Figure 4-41) and the larger grains (Figure 4-42). The TGA dehydration plots for the small
grain sizes (Figure 4-41) were very similar for all samples and all cycles. The TGA
dehydration plots for the larger grain sizes (Figure 4-42) were the same for all samples and
cycles except for cycle 1. Cycle 1 had a significantly different dehydration mass loss profile
and significantly more of the mass was lost at higher temperatures and in the 90˚C isothermal
period. This data allows for visualization of the data shown in Figure 4-40 which shows the
first dehydration cycle of the larger grains was very different from the following dehydration
cycles and also very different from all of the small grain dehydration cycles.
Figure 4-41 TGA plots for small grain sizes showing the similar dehydration cycles for all samples
and runs
Figure 4-42 TGA plots for larger grain sizes showing the similar dehydration cycles for all samples
except for the first dehydration cycle.
136
4.6.4.1 Sub conclusion from this section on MgSO4 particle sizes effect on slow kinetics
The data from section 4.6.4 shows that larger grains of MgSO4.7H2O require more
enthalpy for dehydration to the same level (same % mass loss) as smaller grain sizes when
being dehydrated to 90˚C. Also, the larger grain sizes have slower dehydration kinetics than
the smaller grain size. This means that the isothermal period at 90˚C is more critical for the
larger grain sizes. These conclusions are only seen for the first cycle of the samples.
For the second cycle the characteristics are very similar for both grain sizes. The amount
of enthalpy required per percentage mass loss was the same and the isothermal stage enthalpy
and isothermal stage mass loss percentage was the same for both the small and larger
samples.
If MgSO4 is to be used in a large scale system consideration of the grain size used is
needed as in a larger system the grain size characteristics may not be the same after only one
cycle and may require several cycles to break the grains down to allow them to have the same
dehydration characteristics as the smaller grains shown in this research. This means it is
advisable to use small grain sizes in larger systems to avoid any delay in achieving the faster
dehydration kinetics and higher dehydration to hydration efficiency seen for the smaller grain
sizes.
4.7 Conclusions from chapter 4
The hydration conditions used for all samples in, sections 4.1 to 4.4 are achievable in
winter conditions in the UK. These conditions have been shown to allow both zeolite and
MgSO4 to hydrate to a level which allows for relatively large total dehydration enthalpies
(781J/g and 1265J/g for zeolite and MgSO4, respectively). The main findings of this section
of research are:
TGA and DSC de/hydration cycles show the MgSO4 dehydration enthalpy achieved for
each cycle was very similar and there are no signs of degradation. This was also the case
for 1, 5 and 10˚C/min dehydration heating rates.
As MgSO4 is de/hydrated multiple times the materials apparent slow kinetics improve.
With the use of the TGA and connected RGA the sharp volatile peaks shown on DSC
dehydration plots of MgSO4 are shown to likely be volatile water leaving the sample.
The heating rates used have very limited effect on the composite materials peak
dehydration temperature.

137
This research has shown MgSO4 has characteristics which appear to improve with
successive de/hydration cycles and shows potential for use as a domestic inter-seasonal
TCES material. The use of zeolite-Y to create a composite material further enhances the
characteristics of MgSO4. To further confirm these findings hydration tests are required.
Higher dehydration heating rates cause more cracks to occur in the MgSO4 which should
result in better dehydration kinetics. This is likely to be the same for the hydration
kinetics although the DSC setup used will not allow for hydration testing.
4.7.1 Slow kinetics section conclusions
Section 4.6.1 shows a correlation between isothermal stage dehydration enthalpy and the
heating rate used when dehydrating MgSO4.xH2O to 90˚C. A higher heating rate results in a
higher isothermal stage dehydration enthalpy and also a higher isothermal stage mass loss.
The overall dehydration enthalpy for the samples appears to be similar (around 610J/g)
irrespective of the heating rate used. The repeating cycles also do not appear to change the
mass loss in the isothermal period from the samples, suggesting that the slow kinetics do not
improve with successive cycles. The enthalpy per percentage mass loss is very similar for
each cycle meaning the increased enthalpy in the isothermal period for the higher heating rate
samples (5 and 10˚C/min) is a result of the samples dehydration.
Section 4.6.2 shows the increased heating rates result in an increased dehydration
enthalpy in the isothermal periods when MgSO4.xH2O is dehydrated to 150˚C following 75%
RH hydration. These were similar results of those found in section 4.6.1. The isothermal
stage enthalpy does appear to decrease with successive cycles at the higher heating rates,
suggesting the dehydration kinetics improve this was also suggested from the MgSO4
dehydration plots (see Figure 4-9, Figure 4-10 and Figure 4-11).
Section 4.6.3 shows clearly the length of the isothermal period is important to “extract” as
much of the dehydration enthalpy from the material at a set dehydration temperature (i.e.
90˚C). Tests were conducted to show the impact and importance of the isothermal period
when using higher heating rates. The 1˚C/min samples were not impacted by a short
isothermal period (5 minutes) however, the 5˚C/min and 10˚C/min samples were impacted by
a short isothermal period (5 minutes) and a 5 minutes isothermal period was too short to
completely dehydrate the MgSO4.xH2O due the slow dehydration kinetics of the MgSO4.
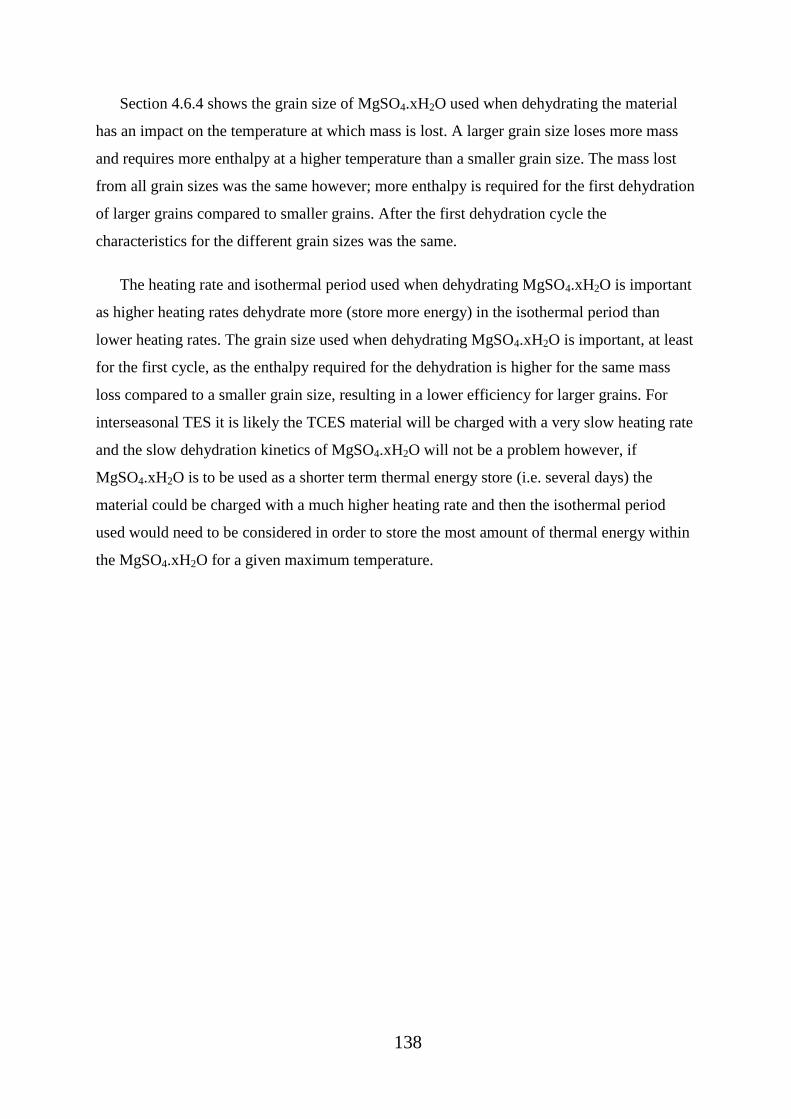
138
Section 4.6.4 shows the grain size of MgSO4.xH2O used when dehydrating the material
has an impact on the temperature at which mass is lost. A larger grain size loses more mass
and requires more enthalpy at a higher temperature than a smaller grain size. The mass lost
from all grain sizes was the same however; more enthalpy is required for the first dehydration
of larger grains compared to smaller grains. After the first dehydration cycle the
characteristics for the different grain sizes was the same.
The heating rate and isothermal period used when dehydrating MgSO4.xH2O is important
as higher heating rates dehydrate more (store more energy) in the isothermal period than
lower heating rates. The grain size used when dehydrating MgSO4.xH2O is important, at least
for the first cycle, as the enthalpy required for the dehydration is higher for the same mass
loss compared to a smaller grain size, resulting in a lower efficiency for larger grains. For
interseasonal TES it is likely the TCES material will be charged with a very slow heating rate
and the slow dehydration kinetics of MgSO4.xH2O will not be a problem however, if
MgSO4.xH2O is to be used as a shorter term thermal energy store (i.e. several days) the
material could be charged with a much higher heating rate and then the isothermal period
used would need to be considered in order to store the most amount of thermal energy within
the MgSO4.xH2O for a given maximum temperature.
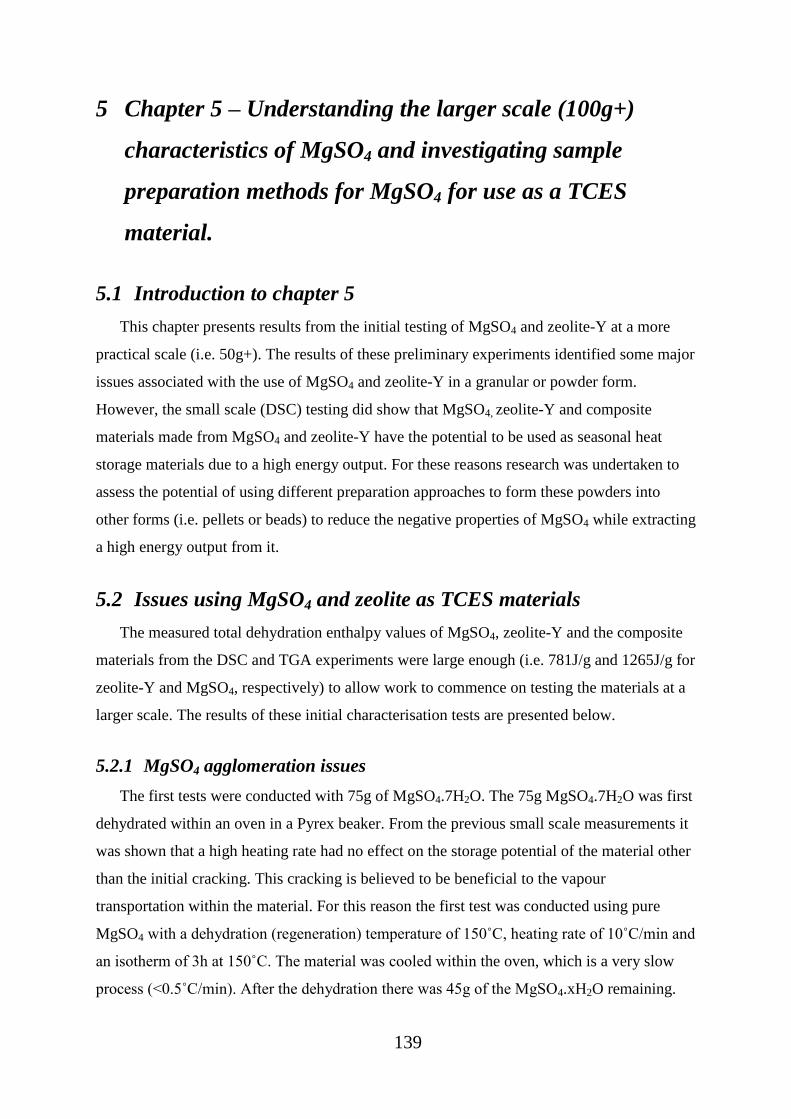
139
5 Chapter 5 – Understanding the larger scale (100g+)
characteristics of MgSO4 and investigating sample
preparation methods for MgSO4 for use as a TCES
material.
5.1 Introduction to chapter 5
This chapter presents results from the initial testing of MgSO4 and zeolite-Y at a more
practical scale (i.e. 50g+). The results of these preliminary experiments identified some major
issues associated with the use of MgSO4 and zeolite-Y in a granular or powder form.
However, the small scale (DSC) testing did show that MgSO4, zeolite-Y and composite
materials made from MgSO4 and zeolite-Y have the potential to be used as seasonal heat
storage materials due to a high energy output. For these reasons research was undertaken to
assess the potential of using different preparation approaches to form these powders into
other forms (i.e. pellets or beads) to reduce the negative properties of MgSO4 while extracting
a high energy output from it.
5.2 Issues using MgSO4 and zeolite as TCES materials
The measured total dehydration enthalpy values of MgSO4, zeolite-Y and the composite
materials from the DSC and TGA experiments were large enough (i.e. 781J/g and 1265J/g for
zeolite-Y and MgSO4, respectively) to allow work to commence on testing the materials at a
larger scale. The results of these initial characterisation tests are presented below.
5.2.1 MgSO4 agglomeration issues
The first tests were conducted with 75g of MgSO4.7H2O. The 75g MgSO4.7H2O was first
dehydrated within an oven in a Pyrex beaker. From the previous small scale measurements it
was shown that a high heating rate had no effect on the storage potential of the material other
than the initial cracking. This cracking is believed to be beneficial to the vapour
transportation within the material. For this reason the first test was conducted using pure
MgSO4 with a dehydration (regeneration) temperature of 150˚C, heating rate of 10˚C/min and
an isotherm of 3h at 150˚C. The material was cooled within the oven, which is a very slow
process (<0.5˚C/min). After the dehydration there was 45g of the MgSO4.xH2O remaining.

140
Only 49% of the initial mass of MgSO4.7H2O should remain after a dehydration to 150˚C
hence, the 45g of MgSO4.xH2O which remained was higher than expected which means the
MgSO4.7H2O did not dehydrate to MgSO4.
When removed from the oven the MgSO4.xH2O was very solid and it took some force to
remove it from the beaker (see Figure 5-1). Once removed it was in several large “clumps”
which were not ideal for use within the reaction chamber. To solve this it was ground into a
powder using a mortar and pestle. This is one of the issues when using pure MgSO4.xH2O as
a TCES material in an open reactor in a powder form. The material becomes solid and bonds
to itself when dehydrated.
Figure 5-1 Image of MgSO4.7H2O in a beaker after a heating to 150˚C, with a 3h isotherm, showing
the solid structure which was formed
Once the MgSO4.xH2O had been ground into a powder it was placed in the reaction
chamber (see Figure 5-2). The chamber used was a stainless steel container (316) which had
an inlet at the bottom on the left hand side and the outlet near the top of the container on the
right hand side, the inlet and outlet are shown in Figure 5-2. This design was an attempt to
ensure the air flows through all of the MgSO4.xH2O to allow all of the material to hydrate.
The MgSO4.xH2O was hydrated with humid air with a partial vapour pressure of 1.3kPa at
20˚C.
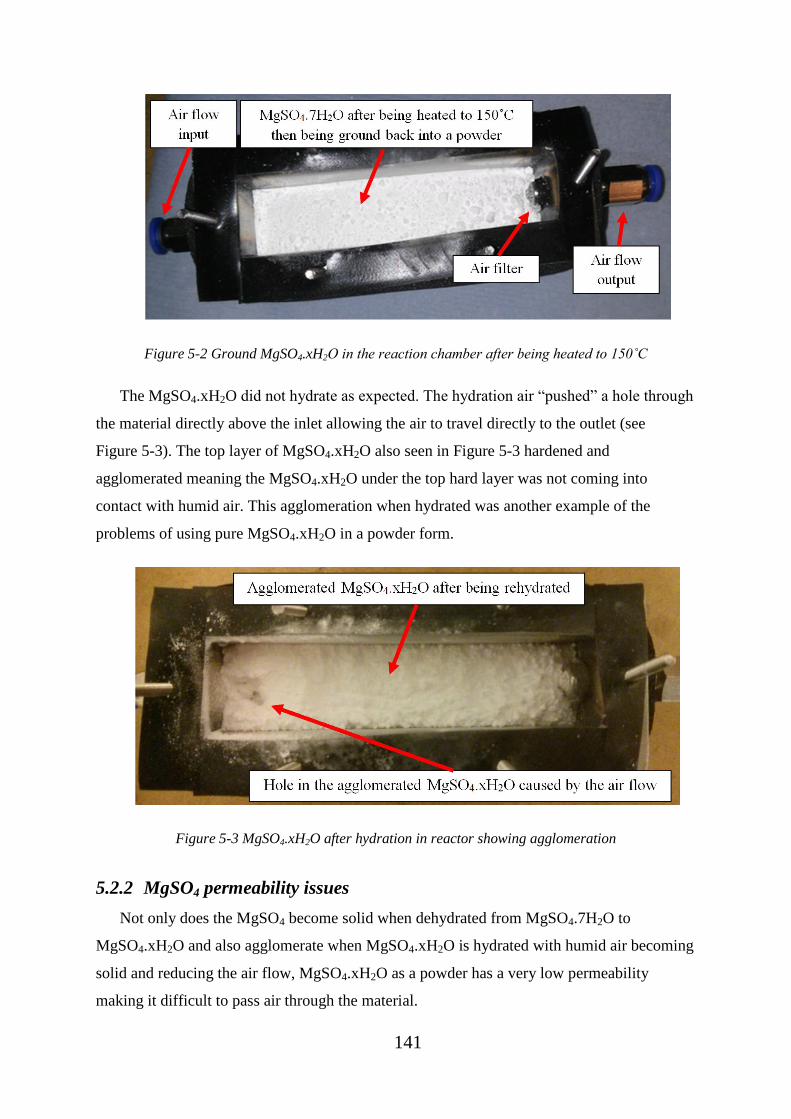
141
Figure 5-2 Ground MgSO4.xH2O in the reaction chamber after being heated to 150˚C
The MgSO4.xH2O did not hydrate as expected. The hydration air “pushed” a hole through
the material directly above the inlet allowing the air to travel directly to the outlet (see
Figure 5-3). The top layer of MgSO4.xH2O also seen in Figure 5-3 hardened and
agglomerated meaning the MgSO4.xH2O under the top hard layer was not coming into
contact with humid air. This agglomeration when hydrated was another example of the
problems of using pure MgSO4.xH2O in a powder form.
Figure 5-3 MgSO4.xH2O after hydration in reactor showing agglomeration
5.2.2 MgSO4 permeability issues
Not only does the MgSO4 become solid when dehydrated from MgSO4.7H2O to
MgSO4.xH2O and also agglomerate when MgSO4.xH2O is hydrated with humid air becoming
solid and reducing the air flow, MgSO4.xH2O as a powder has a very low permeability
making it difficult to pass air through the material.
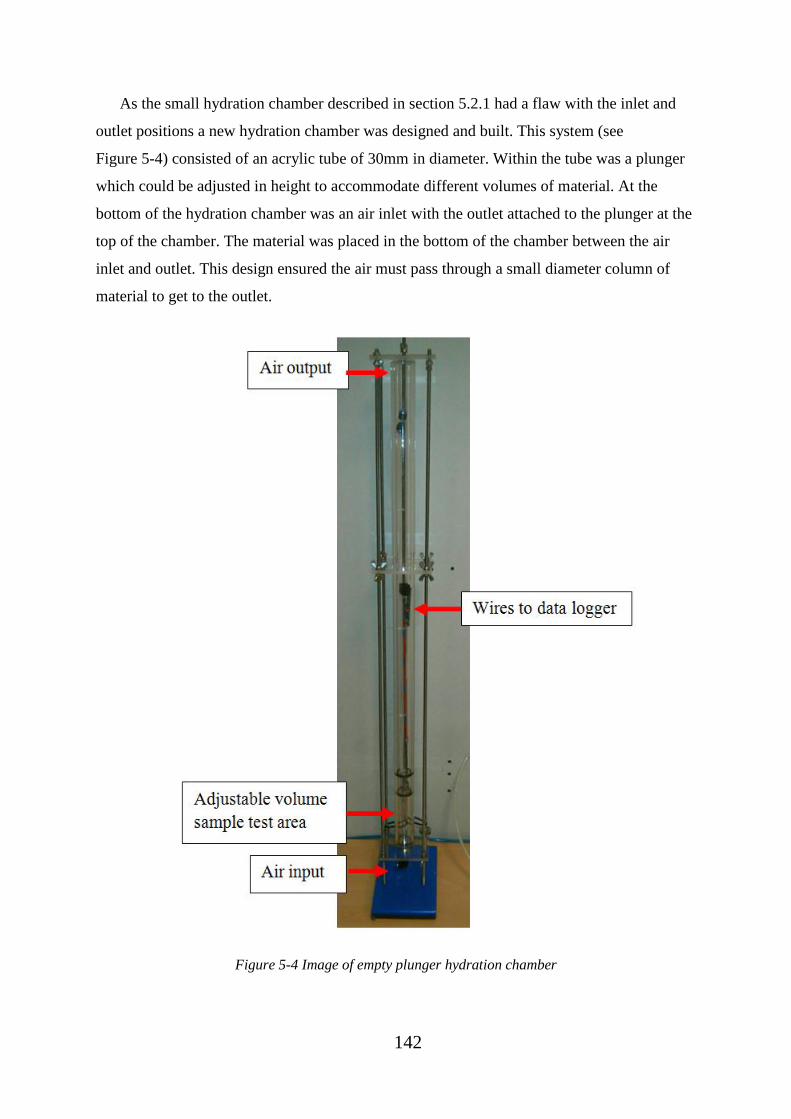
142
As the small hydration chamber described in section 5.2.1 had a flaw with the inlet and
outlet positions a new hydration chamber was designed and built. This system (see
Figure 5-4) consisted of an acrylic tube of 30mm in diameter. Within the tube was a plunger
which could be adjusted in height to accommodate different volumes of material. At the
bottom of the hydration chamber was an air inlet with the outlet attached to the plunger at the
top of the chamber. The material was placed in the bottom of the chamber between the air
inlet and outlet. This design ensured the air must pass through a small diameter column of
material to get to the outlet.
Figure 5-4 Image of empty plunger hydration chamber

143
200g of MgSO4.xH2O was dehydrated to 150˚C, at a heating rate of 1˚C/min, and held
isothermally for 3 hours. The material was then taken out of the oven, re-weighed (to ensure
100g was being used) and then crushed into a powder. The material was then placed back
into the oven and dehydrated again using the same conditions. After the oven had cooled to
50˚C the container with the MgSO4.xH2O in was plugged with a rubber stopper to provide an
air tight seal. The material was left to cool for 4 ½ hours in ambient conditions to ensure the
material was at ambient temperature before any hydration occurred. Once cooled the material
was placed within the plunger reactor for the hydration to begin. The MgSO4.xH2O powder
was hydrated with humid air (5L/min flow rate, 1.3kPa pH2O).
To achieve the 5 L/min flow rate through the hydration chamber and the MgSO4.xH2O
powder a pressure of around 10psig was required. This was very high for such a small flow
rate and results in a permeability of 1.8x10⁻¹⁴
m2 through the chamber when the MgSO4
powder was inside, much lower than the suggested permeability for absorbent beds of 10-12
m2
[58].
The MgSO4.xH2O powder packed itself densely and stuck to itself within the chamber.
This means when the 5 L/min flow rate was put through the material the bed of MgSO4.xH2O
powder became fluidised (see Figure 5-6). This is another problem when using MgSO4
powder. It is not ideal for the bed to be fluidised with such small flow rates as fluidised beds
require larger chamber volumes for the material to expand into.
Figure 5-5 shows the increase in temperature seen from the MgSO4.xH2O powder
hydration. It was seen that the MgSO4.xH2O initially hydrated and reached its maximum
power output at around 1h into the hydration. After reaching its maximum power output the
materials power slowly decreased over time.

144
Figure 5-5 Delta T vs. time for the hydration of MgSO4
Even though the material was essentially a fluidised bed when being hydrated the
MgSO4.xH2O still agglomerated and became very hard. This agglomeration resulted in
further permeability issues and the flow rate through the bed decreased with time over the
hydration period. The peak at around 20h seen on Figure 5-5 was due to the pressure being
turned up to 20psig which was needed to achieve a flow rate of 5 L/min at this stage in the
hydration. This suggests that the material had not completely hydrated but the vapour
transportation became so poor the MgSO4.xH2O hydrated slowly. Another explanation was
the agglomeration of the MgSO4 encapsulated the dehydrated MgSO4 stopping the humid air
from coming into contact with the dehydrated MgSO4 reducing the material available for
hydration.

145
Figure 5-6 Stills from a video of MgSO4 hydration showing the fluidisation effect caused.
After the MgSO4.xH2O hydration the powder was very hard and difficult to remove from
the chamber.
5.2.3 Zeolite permeability issues
Zeolite-Y powder was used in the plunger reactor also. The zeolite was first dehydrated to
150˚C the same as the MgSO4. Once dehydrated it was transferred into the plunger reactor
where the 100g of zeolite required 410mm of height in the chamber (i.e. a bulk density of
345kg/m3).
Although the zeolite did not agglomerate while being dehydrated or hydrated the material
had very poor permeability which was lower than the permeability for the MgSO4 powder.
The zeolite was considered for use due to its large surface area however, the zeolite was
sourced as a very fine powder and packed very tightly in the hydration chamber. This packing
formed an almost impenetrable seal for the air. When the hydration began the zeolite powder
was forced upward within the reactor and the air failed to leave the reactor, hence the
permeability could not be assessed. This caused a pressure build up in the hydration chamber.
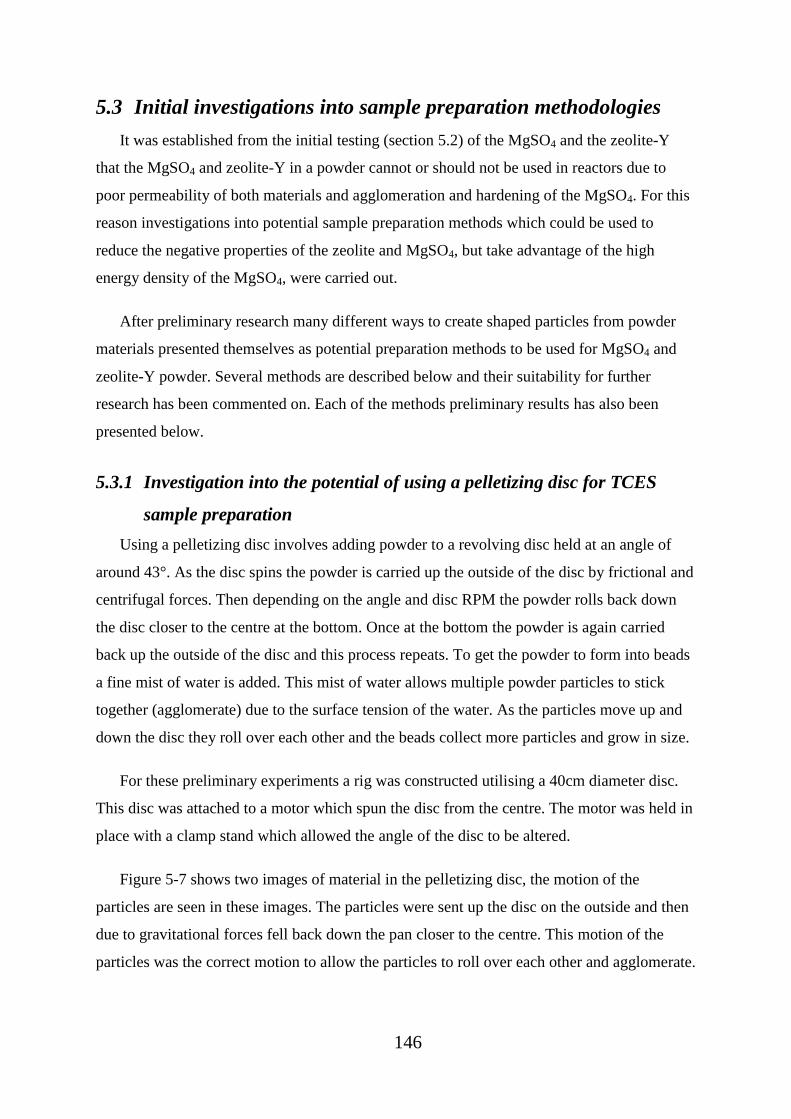
146
5.3 Initial investigations into sample preparation methodologies
It was established from the initial testing (section 5.2) of the MgSO4 and the zeolite-Y
that the MgSO4 and zeolite-Y in a powder cannot or should not be used in reactors due to
poor permeability of both materials and agglomeration and hardening of the MgSO4. For this
reason investigations into potential sample preparation methods which could be used to
reduce the negative properties of the zeolite and MgSO4, but take advantage of the high
energy density of the MgSO4, were carried out.
After preliminary research many different ways to create shaped particles from powder
materials presented themselves as potential preparation methods to be used for MgSO4 and
zeolite-Y powder. Several methods are described below and their suitability for further
research has been commented on. Each of the methods preliminary results has also been
presented below.
5.3.1 Investigation into the potential of using a pelletizing disc for TCES
sample preparation
Using a pelletizing disc involves adding powder to a revolving disc held at an angle of
around 43°. As the disc spins the powder is carried up the outside of the disc by frictional and
centrifugal forces. Then depending on the angle and disc RPM the powder rolls back down
the disc closer to the centre at the bottom. Once at the bottom the powder is again carried
back up the outside of the disc and this process repeats. To get the powder to form into beads
a fine mist of water is added. This mist of water allows multiple powder particles to stick
together (agglomerate) due to the surface tension of the water. As the particles move up and
down the disc they roll over each other and the beads collect more particles and grow in size.
For these preliminary experiments a rig was constructed utilising a 40cm diameter disc.
This disc was attached to a motor which spun the disc from the centre. The motor was held in
place with a clamp stand which allowed the angle of the disc to be altered.
Figure 5-7 shows two images of material in the pelletizing disc, the motion of the
particles are seen in these images. The particles were sent up the disc on the outside and then
due to gravitational forces fell back down the pan closer to the centre. This motion of the
particles was the correct motion to allow the particles to roll over each other and agglomerate.
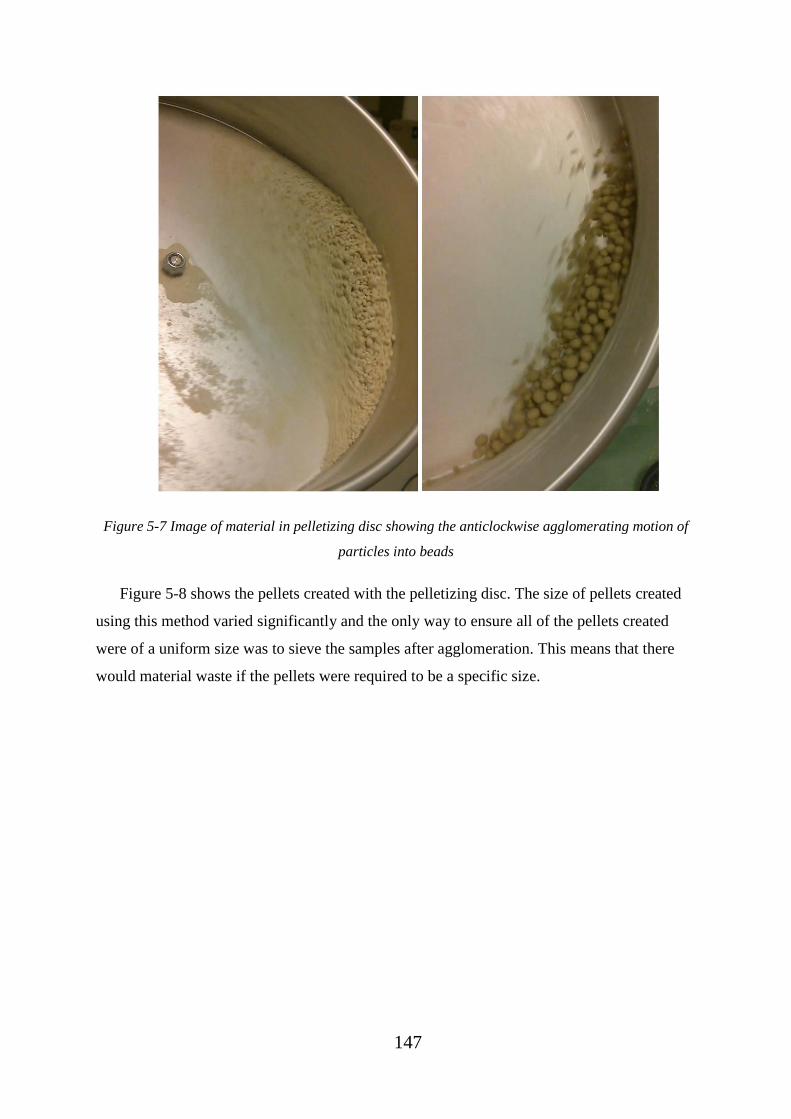
147
Figure 5-7 Image of material in pelletizing disc showing the anticlockwise agglomerating motion of
particles into beads
Figure 5-8 shows the pellets created with the pelletizing disc. The size of pellets created
using this method varied significantly and the only way to ensure all of the pellets created
were of a uniform size was to sieve the samples after agglomeration. This means that there
would material waste if the pellets were required to be a specific size.

148
Figure 5-8 Image of pellets created with the pelletizing disc
Figure 5-9 shows beads created using the pelletizing disc after a 3 hour bake in the oven
at 150°C. The beads, once baked, became very hollow and almost became shells. This was
not ideal as it would result in a lot of wasted space in a reaction chamber and a low density
material.
Figure 5-9 Image of beads created with pelletizing disc after an oven bake at 150°C
Due to the time constraints, variation in the size of the beads produced and the poor
quality and low density beads produced after the baking process this method was not used for
further testing.

149
5.3.2 Investigation into the potential of hand rolling beads for TCES sample
preparation
As the agglomerated beads were shown to be very soft and fragile, which allows them to
break down to a powder easily; it was necessary to consider a new way to create the beads.
One possible solution was to create a “paste” and then use a rolling tray to roll the paste into
beads. The beads created using this method, as they are formed using more force than the
beads created using the pelletizing disc, may be denser and be a better method for creating
the beads.
This process used a sausage gun to compress the paste and extrude it in the desired
diameters as a “sausage” of paste. This sausage was then rolled using a rolling table. The
rolling table and sausage gun used is shown below.
Figure 5-10 Image of sausage rolling table (left) and sausage gun (right)
To test if this technique was a possibility a small batch (~10g) of MgSO4 + KU20
(50wt%) paste was created, hand rolled into beads and then baked. It was possible to create a
“paste” from this composite material. The paste was hand rolled into beads and then
dehydrated. The initial results were very promising. However, the paste was too dense to be
used in a sausage gun and blocked the gun. Furthermore, trying to use the rolling table with a
rolled sausage did not work as the material stuck to the rolling table. For this reason this
preparation method was not taken any further.

150
5.3.3 Investigation into the potential of using a pellet press for TCES sample
preparation
For the next preparation methodology tested a modified aluminium meat grinder was used
to form pellets from a paste. Paste of the TCES composite material was passed through the
meat grinder. At the end of the grinder the standard plate was replaced with one which had
~50 x 4mm holes. This method created consistent pellets which were fairly strong and did not
break down, like the agglomeration pellets, once baked. This was the method which was
chosen for creating composite pellets for the rest of this chapter.
To optimise the methodology for creating the pellets using the pellet press several
experiments were carried out. The composite material which was chosen to be used was
50wt% MgSO4 and 50wt% binder material (KU20). This composition was chosen as it had
been shown from smaller scale tests that it created robust pellets and also this material
contains the binder and MgSO4 which would both be used in the final composite material
choice.
The pellet preparation optimisation experiments which were carried out considered the
heating rate used to dehydrate the pellets after they had been formed and also the
methodology used to create the pellets (i.e. mixture or impregnation). The samples created
were named as followed Mix 1, Mix 5, Impreg 1 and Impreg 5 which are pellets formed
using a mixture method and dehydrated at 1°C/min or 5°C/min and pellets created using an
impregnation method and dehydrated at 1°C/min or 5°C/min, respectively. The impregnation
and mixture methodologies used are briefly described below.
Mixture methodology
• Dry Products (MgSO4.7H2O and KU20) ground into a powder and mixed.
• DI water added to the ground powder to form a paste.
• Paste formed into 4mm pellets using the modified pellet press.
• 4mm pellets were baked to 150˚C using the appropriate (dependant on the sample
required) heating rate.

151
Impregnation methodology
• KU20 ground into a powder and dried to 150°C within an oven.
• DI water added to MgSO4.7H2O to form an aqueous solution.
• MgSO4 aqueous solution added to the dry KU20 powder and mixed.
• Mixed solution baked to 150˚C using the appropriate (dependant on the sample required)
heating rate.
• Oven dried material re-ground into a fine powder.
• DI water added to the fine powder to form a paste.
• Paste formed into 4mm pellets using the modified pellet press.
• 4mm pellets were baked to 150˚C using the appropriate (dependant on the sample
required) heating rate.
As can be seen from the two different preparation methodologies above the impregnation
method had many more steps and was a more time consuming method. The amount of time
required for each method would need to be taken into consideration when selecting which
method is preferred. The time for each method was not considered in this research and only
the TCES properties of the materials were considered.
Once created the different pellets samples were then tested in the DSC, SEM+EDX and
characterised using nitrogen sorption analysis.
The reason these two different preparation variables (dehydration heating rate and
impregnation or mixture) were chosen was because the changing initial dehydration heating
rate should change the pore characteristics (i.e. pore size and volume) and the mixture (Mix)
or impregnation (Impreg) variables may change where the majority of the MgSO4 was
located. It was postulated that more of the MgSO4 would be located within the pores of the
host material when using the impregnation method than when using the mix method.

152
However, if there was no energy density difference between the Mix and Impreg samples it
will be beneficial to use the Mix method as this required less preparation steps.
5.3.3.1 SEM analysis of pellets created with different preparation methods
To visually analyse each of the pellets prepared with the different preparation methods an
SEM analysis was conducted. If any changes had occurred due to the preparation method
used (Impreg or Mix) or due to the initial dehydration temperature used (1 or 5°C/min) the
SEM analysis would allow for visual confirmation.
5.3.3.1.1 SEM analysis of the mix1˚C/min pellets
All of the various locations imaged show a densely packed structure. There appeared to
be limited vapour channels or high levels of porosity. On most, if not all of the images, there
was the presence of dolomite. These results were expected as a higher heating rate should
have caused a higher porosity.
Figure 5-11 Three SEM images of the mix 1˚C/min pellets
5.3.3.1.2 SEM analysis of the mix5˚C/min pellets
Locations appeared much less “fluffy” relative to the 1˚C/min samples. Locations
appeared to be much more cracked with small fractures. Locations appeared to have a
rougher surface with possibly a high surface area.
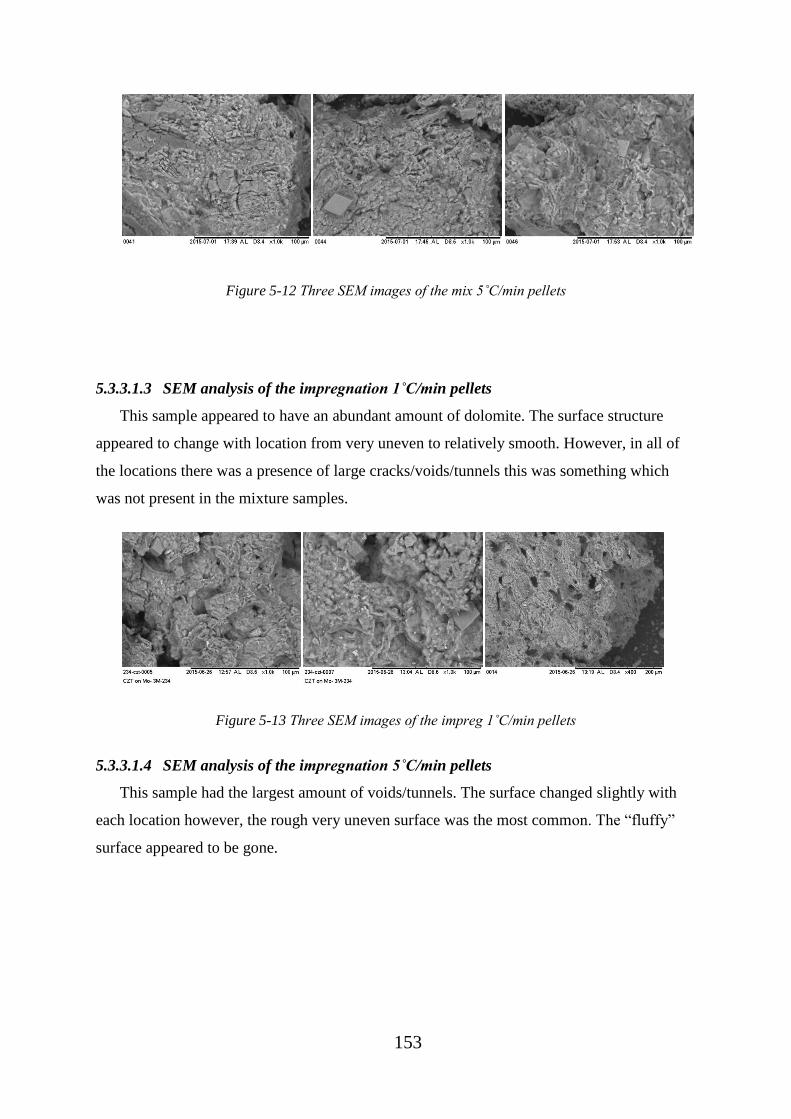
153
Figure 5-12 Three SEM images of the mix 5˚C/min pellets
5.3.3.1.3 SEM analysis of the impregnation1˚C/min pellets
This sample appeared to have an abundant amount of dolomite. The surface structure
appeared to change with location from very uneven to relatively smooth. However, in all of
the locations there was a presence of large cracks/voids/tunnels this was something which
was not present in the mixture samples.
Figure 5-13 Three SEM images of the impreg 1˚C/min pellets
5.3.3.1.4 SEM analysis of the impregnation5˚C/min pellets
This sample had the largest amount of voids/tunnels. The surface changed slightly with
each location however, the rough very uneven surface was the most common. The “fluffy”
surface appeared to be gone.
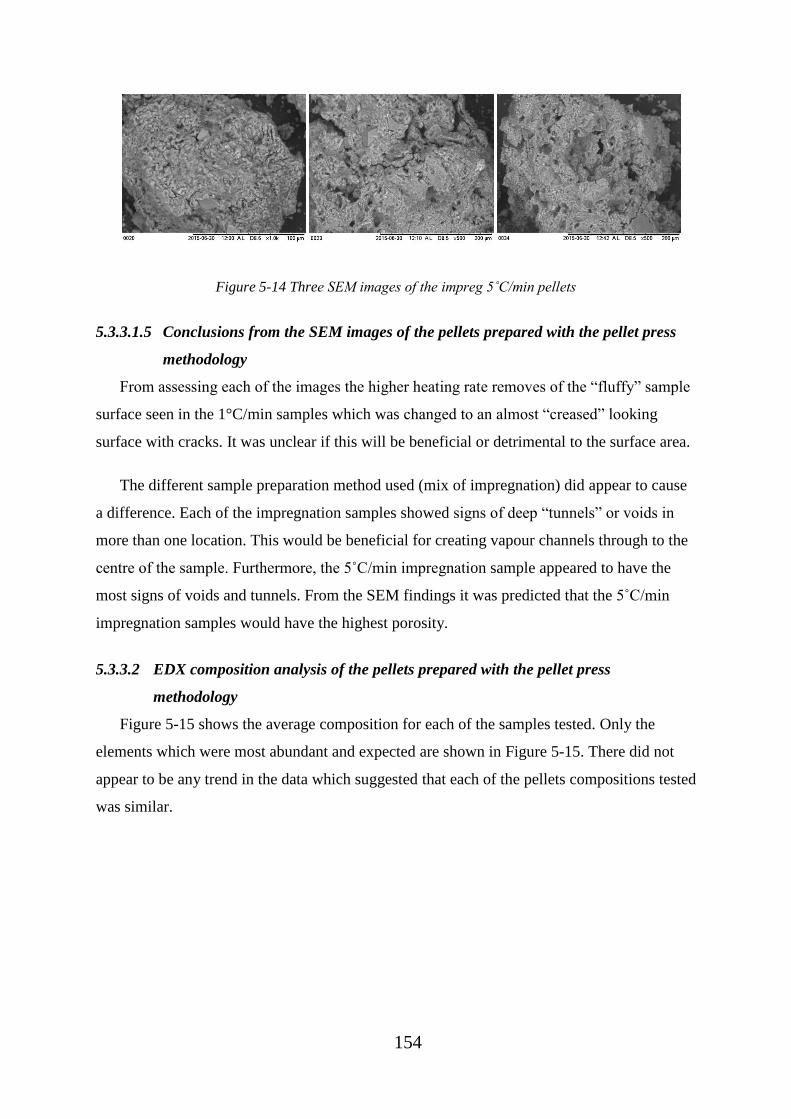
154
Figure 5-14 Three SEM images of the impreg 5˚C/min pellets
5.3.3.1.5 Conclusions from the SEM images of the pellets prepared with the pellet press
methodology
From assessing each of the images the higher heating rate removes of the “fluffy” sample
surface seen in the 1°C/min samples which was changed to an almost “creased” looking
surface with cracks. It was unclear if this will be beneficial or detrimental to the surface area.
The different sample preparation method used (mix of impregnation) did appear to cause
a difference. Each of the impregnation samples showed signs of deep “tunnels” or voids in
more than one location. This would be beneficial for creating vapour channels through to the
centre of the sample. Furthermore, the 5˚C/min impregnation sample appeared to have the
most signs of voids and tunnels. From the SEM findings it was predicted that the 5˚C/min
impregnation samples would have the highest porosity.
5.3.3.2 EDX composition analysis of the pellets prepared with the pellet press
methodology
Figure 5-15 shows the average composition for each of the samples tested. Only the
elements which were most abundant and expected are shown in Figure 5-15. There did not
appear to be any trend in the data which suggested that each of the pellets compositions tested
was similar.

155
Figure 5-15 EDX elemental data for each of the different sample preparation methods
5.3.3.3 Nitrogen vapour sorption test results of the pellets prepared with the pellet press
methodology
To characterise the surface area, pore volume and pore diameter of the different
preparation methods a nitrogen sorption analysis was conducted. The data from these tests
allowed for a quantitative comparison of the different materials physical characteristics and
also the potential corroborate the SEM analysis.
Figure 5-16 shows the cumulative pore volume for each of the preparation methods. It
appeared that the increased heating rate (i.e. 5˚C/min) increased the pore volume, as
expected. This was due to the increased rate of initial dehydration which forces larger pores
in the material as the water was driven off. However, the change in the pore volume between
the impregnation samples was much less relative to the change in the mix samples. The Mix
5˚C/min sample had the highest overall pore volume.

156
Figure 5-16 Total cumulative pore volume for each of the different preparation methods
Figure 5-17 shows the average pore size for each sample increased with increasing initial
dehydration heating rate. Both the Mix and Impregnation 5˚C/min samples had very similar
average pore size. Regarding the BET surface area this was slightly inconclusive. It was
expected as the heating rate was increased so too would the surface area however, the
Impregnation 5˚C/min sample had a lower surface area than the impregnation 1˚C/min
sample.
Figure 5-17 BET surface area and average pore diameter for each of the different preparation
methods
Taking all of the vapour sorption data into consideration it appeared, assuming the energy
density was unaffected; that the 5˚C/min Mix preparation method had the most promising
properties with the largest pore volume and also the largest average pore diameter. Although,

157
the BET surface area was slightly lower than the Impreg 1 sample the two former
characteristics were assumed to outweigh the slight surface area reduction. This data
suggested that the sample preparation method did have an impact of the characteristics of the
material.
5.3.3.4 200g enthalpy results and 10mg DSC analysis results for the different pellets
created
This section of work presents the 200g hydration enthalpy results and the DSC
dehydration enthalpy results to compare how the samples reacted at different scales.
The four differently prepared composite pellets were put through DSC dehydration cycle
tests. The samples were first hydrated and then dehydrated to 150°C within the DSC. The
DSC tests were conducted to evaluate the dehydration enthalpy of the materials and verify if
the preparation method had an impact on the energy storage characteristics.
In order to compare each of the preparation methods (Mix 1, Mix 5, Impreg 1 and Impreg
5) two samples of each preparation method were prepared for DSC testing. All 8 of the
samples were then hydrated together and then dehydrated within the DSC. Once all were
dehydrated this process was repeated and the 8 samples were put through another hydration
followed by another DSC dehydration. The DSC dehydration results for each preparation
method were then averaged.
The DSC analysis conducted on each of the samples was the standard DSC enthalpy
analysis used throughout this research. The samples were first hydrated with an air stream
with 1.3kPa of pH2O (56%RH at 20°C). The samples were then dehydrated from 20°C to
150°C with a heating rate of 5°C/min. The samples were then cooled back to 20°C. This
dehydration followed by a cooling step was then repeated again. This allowed for
measurement of the total enthalpy required to dehydrate the sample, the dehydration enthalpy
(enthalpy required for the dehydration process) and the sensible enthalpy component (the
enthalpy required to heat the sample in a hydrated state to, in this case 150°C, not taking into
account the enthalpy required for the dehydration process).
Figure 5-18 shows the dehydration enthalpy of each of the different sample preparation
methods. Also shown on Figure 5-18 is the performance ratio. The performance ratio is the
ratio of energy which is output from the material compared to the energy input. The
performance ratio in turn allows for deduction of the wasted energy. The samples with the

158
highest performance ratio were both of the samples which were initially dehydrated with a
heating rate of 1°C/min. The difference between Mix 1 and Impreg 1 was 41 J/g.
Interestingly the Mix 5 and Impreg 5 samples had an average difference of 6 J/g. The
performance ratio of these samples followed the same trend as the dehydration enthalpy. Mix
1 had the higher performance ratio followed closely by Impreg 1 then Mix 5 and Impreg 5
were very similar and within 3% of each other. Hence, it appeared the sample preparation
change which had the biggest impact on the dehydration enthalpy and performance of the
samples was the initial dehydration temperature and not the preparation method (i.e. mix or
impregnation).
Figure 5-18 DSC dehydration enthalpy and performance ratio for each sample preparation method
Figure 5-19 shows the dehydration enthalpy of each prepared pellet overlaid with the
average pore diameter of each prepared pellet. As the dehydration enthalpy increased the
average pore diameter decreased. The pore diameter will have an impact on the rate of
hydration and dehydration as it will change the vapour transportation throughout the material.
A paper authored by Linnow et al. [131] investigated the hydration of MgSO4 in porous
glass with different pore sizes. This paper reported that with increasing pore size a higher
RH% is required to hydrate the MgSO4 to the same level as a smaller pore size. The
difference in pore sizes tested varied from 7nm to 1700nm which is a large range and the
difference in the pore size of the samples tested in this research is between 7.7 and 9.5nm so
the difference in the hydration level would likely be small. However, this work could explain
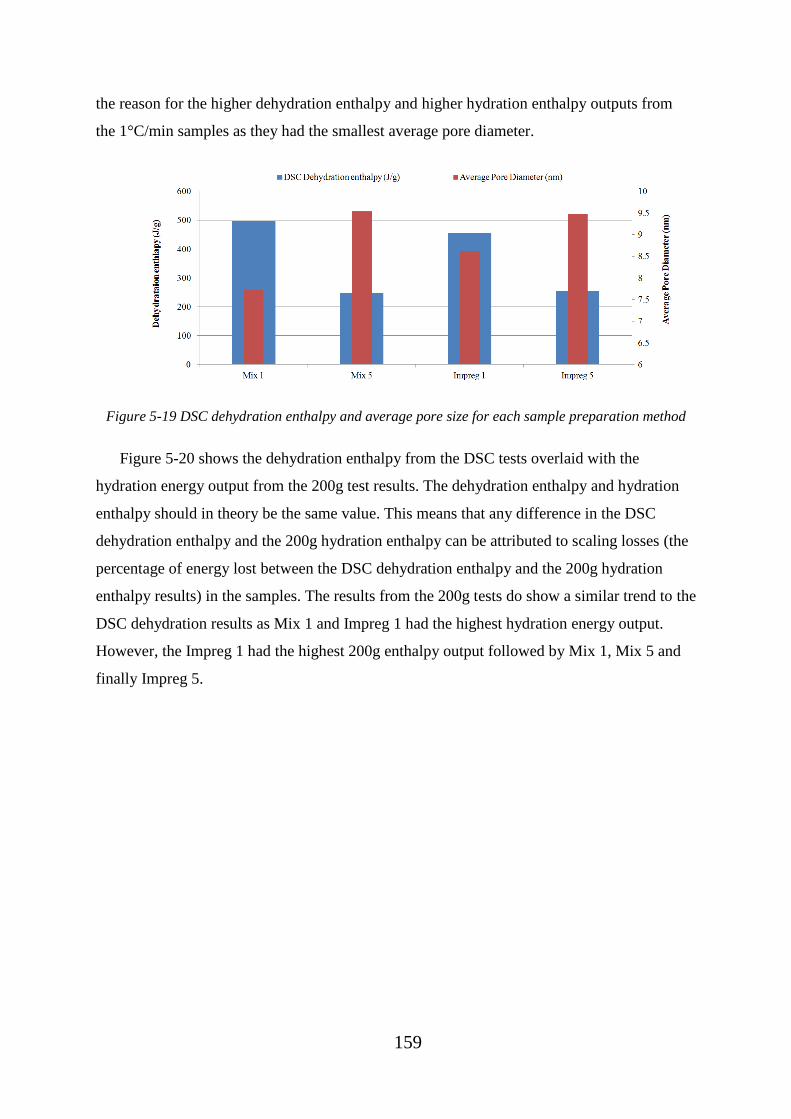
159
the reason for the higher dehydration enthalpy and higher hydration enthalpy outputs from
the 1°C/min samples as they had the smallest average pore diameter.
Figure 5-19 DSC dehydration enthalpy and average pore size for each sample preparation method
Figure 5-20 shows the dehydration enthalpy from the DSC tests overlaid with the
hydration energy output from the 200g test results. The dehydration enthalpy and hydration
enthalpy should in theory be the same value. This means that any difference in the DSC
dehydration enthalpy and the 200g hydration enthalpy can be attributed to scaling losses (the
percentage of energy lost between the DSC dehydration enthalpy and the 200g hydration
enthalpy results) in the samples. The results from the 200g tests do show a similar trend to the
DSC dehydration results as Mix 1 and Impreg 1 had the highest hydration energy output.
However, the Impreg 1 had the highest 200g enthalpy output followed by Mix 1, Mix 5 and
finally Impreg 5.
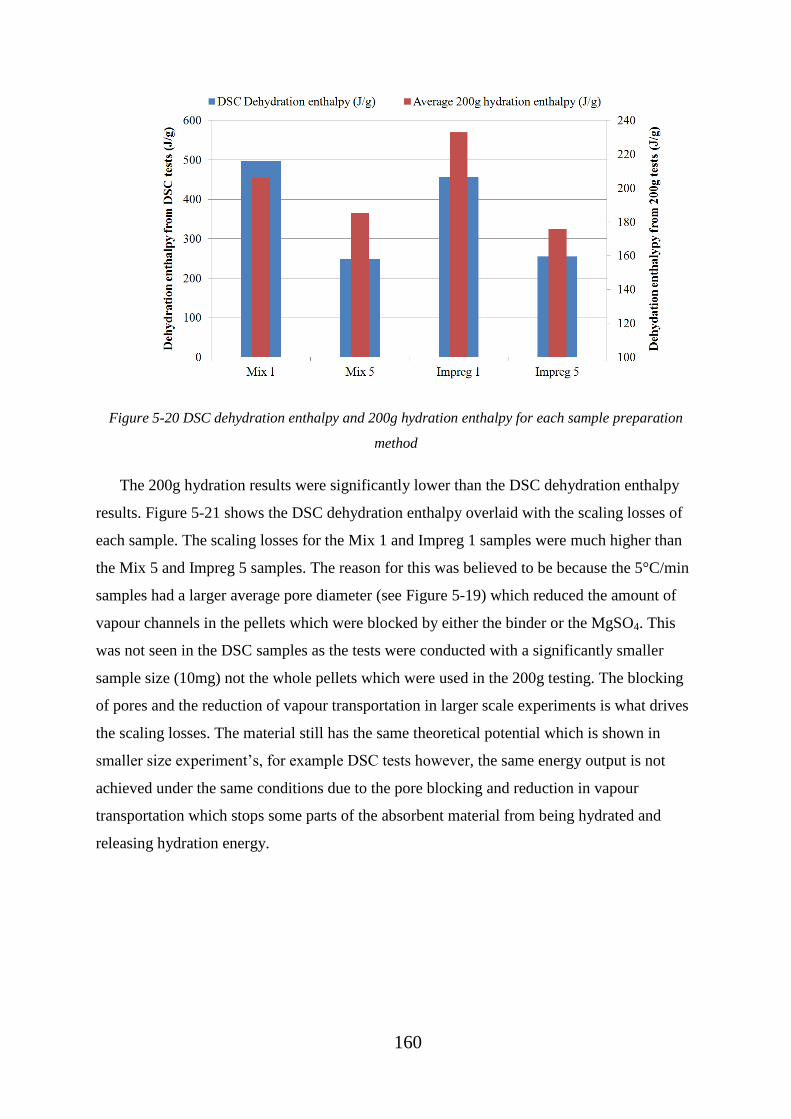
160
Figure 5-20 DSC dehydration enthalpy and 200g hydration enthalpy for each sample preparation
method
The 200g hydration results were significantly lower than the DSC dehydration enthalpy
results. Figure 5-21 shows the DSC dehydration enthalpy overlaid with the scaling losses of
each sample. The scaling losses for the Mix 1 and Impreg 1 samples were much higher than
the Mix 5 and Impreg 5 samples. The reason for this was believed to be because the 5°C/min
samples had a larger average pore diameter (see Figure 5-19) which reduced the amount of
vapour channels in the pellets which were blocked by either the binder or the MgSO4. This
was not seen in the DSC samples as the tests were conducted with a significantly smaller
sample size (10mg) not the whole pellets which were used in the 200g testing. The blocking
of pores and the reduction of vapour transportation in larger scale experiments is what drives
the scaling losses. The material still has the same theoretical potential which is shown in
smaller size experiment’s, for example DSC tests however, the same energy output is not
achieved under the same conditions due to the pore blocking and reduction in vapour
transportation which stops some parts of the absorbent material from being hydrated and
releasing hydration energy.

161
Figure 5-21 DSC dehydration enthalpy and scaling losses for each sample preparation method
Although the Mix 1 and Impreg 1 had the highest scaling losses they still output the
highest hydration enthalpy. To calculate the energy density, a very important characteristic
for domestic interseasonal heat storage as space is a constraint, the bulk density of each of the
samples was measured. Figure 5-22 shows the 200g hydration enthalpy output overlaid with
the energy density of the samples. The energy density was calculated using the 200g
hydration enthalpy data not the DSC dehydration enthalpy as this gave an energy density
value which the materials were expected to achieve when used at a large scale.
Figure 5-22 200g hydration enthalpy and energy density for each sample preparation method
Throughout this chapter the experiments were conducted with an average air water partial
vapour pressure of 1.3kPa which equates to (56%RH at 20°C). If this value could be
increased to 68%RH at 20°C then the hydration enthalpy (energy output) would increase and
result in the energy density of the sample effectively increasing. If a higher water partial

162
vapour pressure was to be used it is likely a separate water tank would be required in the
system to increase the humidity of the ambient air. This obviously would increase the size of
a system and therefore reduce the effective energy density of the system. However, if the
material used can now output more energy but requires a water tank the amount of energy
which is able to be stored in the system may still be higher than that of a system which only
hydrates the material to a lower, for example 1.3kPa of air water partial vapour pressure.
5.4 Conclusions of chapter 5
The Impreg 1 sample had the highest 200g hydration energy output and also the largest
bulk density which resulted in the Impreg 1 having the highest energy density. The Mix 1
sample had the highest performance ratio. The best sample to use at a larger scale would
depend on the cost of the volume in the household, where the system is being installed and
the cost of energy for that household. If the space of the household is at a very high premium
then it is likely that the Impreg 1 material would be chosen. However, if the system was to be
placed in an area with plenty of space (i.e. under a back garden) then it is likely that the best
material to choose would be the one that has the highest conversion of input energy to output
energy (i.e. Mix 1). The decision would also depend on the cost of the preparation method
which will ultimately change the cost of the material. These materials all had the same
composition and hence the cost of the materials would be the same however, the Impreg
samples had a preparation method which required more steps, which would likely mean the
cost of using the Impreg samples would be higher.
There are many different variables which need to be considered and adapted to best fit the
needs of each user when planning on installing an interseasonal TCES system such as cost of
space in the domestic environment.

163
6 Chapter 6 - Investigation into potential host materials for
impregnating with MgSO4
6.1 Introduction to chapter 6
The research presented in this chapter considers potential host materials for MgSO4.
However, the purpose was to consider potential host materials which can be readily
purchased in a pellet or bead form. This was important as it enables the possibility of
impregnating MgSO4 into the host matrix and the material to be used on a large scale without
the time constraints of producing the materials using the novel pellet preparation method.
Composite materials have been studied for their property to increase the energy density of
porous absorbent materials with the addition of salt hydrates [48,81,82]. The methodology
used for adding the salt hydrates into the porous hosts is typically the wetness impregnation
method [48,81,82].
Another method used to improve the energy density of absorbent materials is through an
ion exchange process. Absorbent materials, particular zeolites can be put through an ion
exchange process to replace the current ions with other ions having higher selectivity to the
material. The hydration energy of zeolites depends on the amount of cations which are
accessible to the adsorbed material which, for domestic TCES, is commonly water [87].
Molecular sieves adsorption properties, crystal cage and hydration can be altered by ion
exchange [90]. Research has shown that ion exchange changes the water uptake of zeolites
[91].
The materials considered in this chapter were 13x molecular sieve pellets (a zeolite
material), activated alumina beads and activated carbon pellets. The 13x molecular sieve
powder and zeolite-Y powder was also used to create composite pellets using the pellet
preparation method for comparison purposes. Finally the 13x pellets were also put through an
ion exchange process to assess how this changed their TCES properties.
The objective of this chapter was to understand the performance of 13x molecular sieves,
activated alumina and activated carbon for domestic TCES after MgSO4 impregnation. The
research presented in this chapter also investigated MgSO4 which was impregnated within
different absorbent materials (13x molecular sieve and zeolite-Y), using the novel pellet
164
preparation method, for comparison. When impregnated with MgSO4 the energy storage
density of these materials should have increased.
The effect of Mg2+
ion exchange with Na+ ions within the 13x crystal lattice was also
investigated. The ion exchange enhancement was shown to provide an improvement to the
energy output of the 13x molecular sieves. This chapter reports the methods used to create the
composite materials and the effect that it has on the thermochemical properties of the
materials.
The pellets formed using the novel pellet preparation method are referred to as 13xMK.
This methodology was also used to create the zeolite-Y pellets from powder and this material
is referred to as ZMK. The 13x pellets which were prepared using the ion exchange
methodology are referred to as 13x Mg Ion zh, where z is the ion exchange time period length
in hours. The activated alumina and activated carbon materials are referred to as AA+MgSO4
and AC+MgSO4, respectively. The activated alumina and activated carbon samples were
impregnated with the maximum amount of MgSO4 which was possible after one wetness
impregnation method using a saturated MgSO4 solution and subsequently dried to 150°C to
remove excess water.
6.2 13x pellet investigation results
The first part of this chapter focuses on the results from the 13x material. It compares the
13x pellets and powders against the zeolite-Y powder used previously in this thesis. Next the
13x pellets are impregnated with MgSO4 using the wetness impregnation method. 13x
powder and MgSO4 were formed into pellets using the pellet preparation method and the
results of both 13x pellets were compared. This section also discusses the 200g hydration and
dehydration results of the 13x + MgSO4 composite materials. Finally the 13x pellets were put
through an ion exchange under different conditions.
6.2.1 Comparison of 13x powder, 13x pellets and zeolite-Y powder absorbents
Initial experimental tests assessed the dehydration heat flow and energy storage
characteristics of the 13x powder, 13x pellets and zeolite-Y powder with the DSC plots
presented in Figure 6-1. The endothermic heat flow was due to the enthalpy required for
dehydration (water loss) and the sensible heat required for heating the samples up to 150˚C.
Sigmoidal integration of the DSC measurements was used to estimate the average total

165
enthalpies reported in Table 6-1. It was clear that zeolite-Y had the highest dehydration
enthalpy (total enthalpy minus the sensible heat enthalpy).
Table 6-1 DSC determined averaged enthalpies of absorbent zeolite materials over the temperature
range of 20 - 150˚C
13x
pellets
13x
powder
Zeolite-Y
powder
Dehydration enthalpy + sensible enthalpy
(J/g)
626 725 781
Dehydration enthalpy only
(J/g)
479 589 615
The lower endothermic heat flow and dehydration enthalpy measured for the 13x pellets
compared to the 13x powder was due to the binding material used to bind and hold the
powder in pellet form. The binding material reduced the total amount of 13x material per unit
weight, available for water sorption.
Figure 6-1 DSC dehydration plots of zeolite-Y, 13x powder and 13x pellets showing the dehydration
enthalpy and sensible enthalpy.
166
6.2.2 Comparison of 13x materials with different absorbed quantities of
MgSO4 prepared using the wetness impregnation method
The wt% of MgSO4 absorbed by 13x pellets was varied using the wetness impregnation
method, leading to different dehydration enthalpies. The DSC calculated dehydration
enthalpy (first cycle enthalpy minus second cycle enthalpy) measurements and TGA
determined mass loss for 13x samples with varying wt% of MgSO4 are shown in Figure 6-2.
It was evident that increasing wt% of MgSO4 leads to a decrease in dehydration enthalpy.
This was corroborated by the TGA mass loss data which also decreased with increasing wt%
of MgSO4.
The predicted enthalpy for each sample is indicated by the green bars in Figure 6-2. The
predicted values were calculated based on the DSC determined dehydration enthalpies for
both pure MgSO4.7H2O and 13x pellets. MgSO4.7H2O had a dehydration enthalpy of 1118J/g
when dehydrated with the same temperature program used for the 13x pellets (ramp rate
5˚C/min and maximum temperature of 150˚C). The dehydration enthalpy of the 13x pellets
was determined to be 479J/g. Due to the significantly higher dehydration enthalpy of
MgSO4.7H2O it was expected that the dehydration enthalpy of the impregnated pellets would
increase with increasing wt% of MgSO4, leading to a more energy dense material with higher
dehydration enthalpy. The mass loss (water loss) of the samples with impregnated MgSO4 did
not increase with increasing MgSO4 content. However, the MgSO4 and the 13x materials do
not hydrate (discharge) and dehydrate (charge) as anticipated when combined in a composite
form, as explained in section 6.2.3 of this chapter. Similar research has also reported lower
than expected heats of sorption from MgSO4 impregnated zeolites. [48].
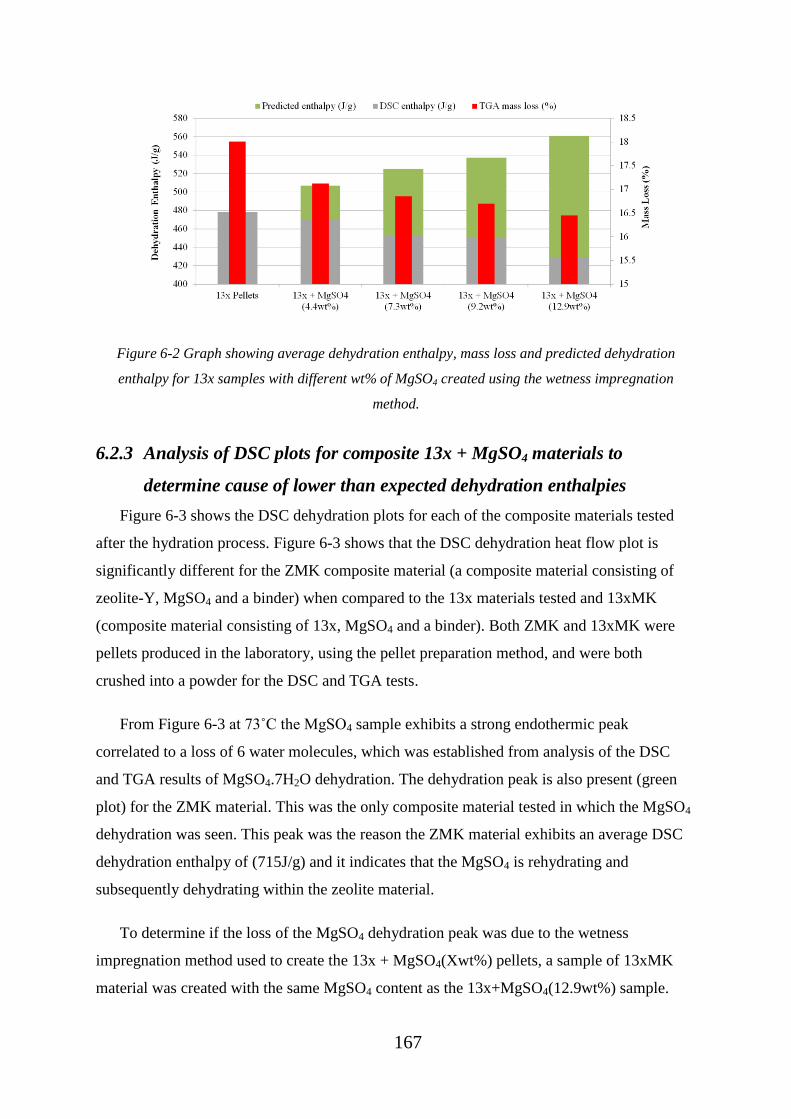
167
Figure 6-2 Graph showing average dehydration enthalpy, mass loss and predicted dehydration
enthalpy for 13x samples with different wt% of MgSO4 created using the wetness impregnation
method.
6.2.3 Analysis of DSC plots for composite 13x + MgSO4 materials to
determine cause of lower than expected dehydration enthalpies
Figure 6-3 shows the DSC dehydration plots for each of the composite materials tested
after the hydration process. Figure 6-3 shows that the DSC dehydration heat flow plot is
significantly different for the ZMK composite material (a composite material consisting of
zeolite-Y, MgSO4 and a binder) when compared to the 13x materials tested and 13xMK
(composite material consisting of 13x, MgSO4 and a binder). Both ZMK and 13xMK were
pellets produced in the laboratory, using the pellet preparation method, and were both
crushed into a powder for the DSC and TGA tests.
From Figure 6-3 at 73˚C the MgSO4 sample exhibits a strong endothermic peak
correlated to a loss of 6 water molecules, which was established from analysis of the DSC
and TGA results of MgSO4.7H2O dehydration. The dehydration peak is also present (green
plot) for the ZMK material. This was the only composite material tested in which the MgSO4
dehydration was seen. This peak was the reason the ZMK material exhibits an average DSC
dehydration enthalpy of (715J/g) and it indicates that the MgSO4 is rehydrating and
subsequently dehydrating within the zeolite material.
To determine if the loss of the MgSO4 dehydration peak was due to the wetness
impregnation method used to create the 13x + MgSO4(Xwt%) pellets, a sample of 13xMK
material was created with the same MgSO4 content as the 13x+MgSO4(12.9wt%) sample.
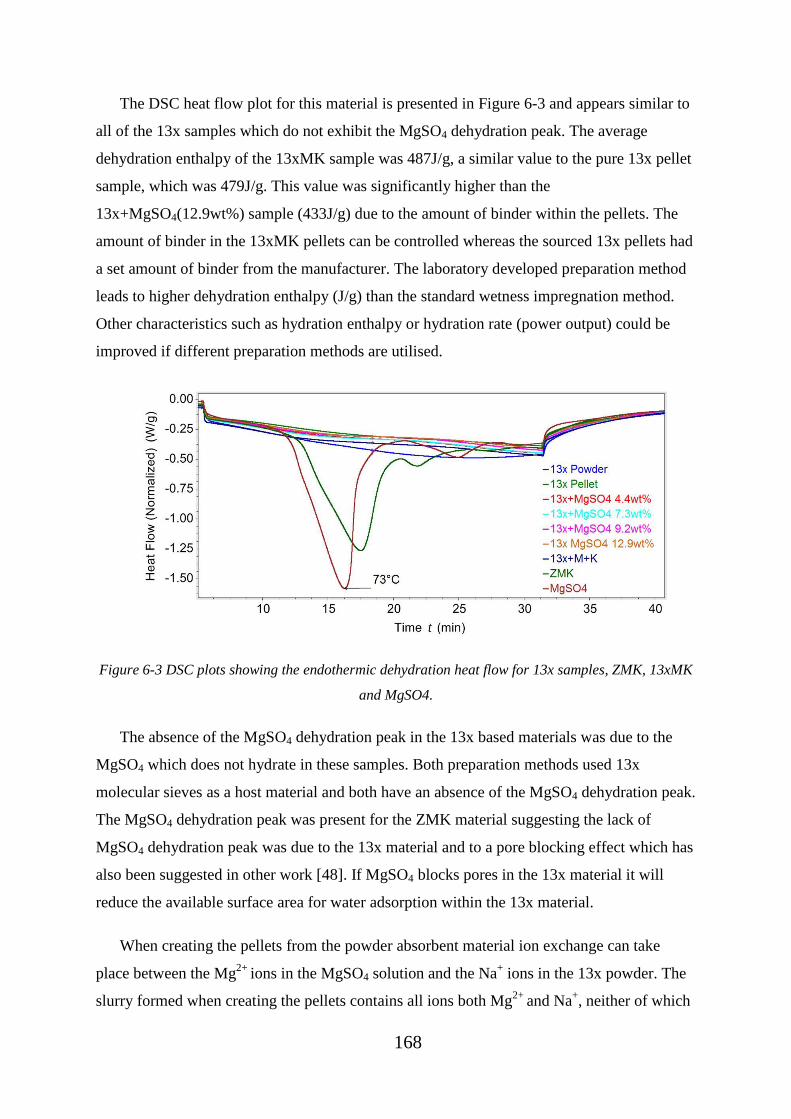
168
The DSC heat flow plot for this material is presented in Figure 6-3 and appears similar to
all of the 13x samples which do not exhibit the MgSO4 dehydration peak. The average
dehydration enthalpy of the 13xMK sample was 487J/g, a similar value to the pure 13x pellet
sample, which was 479J/g. This value was significantly higher than the
13x+MgSO4(12.9wt%) sample (433J/g) due to the amount of binder within the pellets. The
amount of binder in the 13xMK pellets can be controlled whereas the sourced 13x pellets had
a set amount of binder from the manufacturer. The laboratory developed preparation method
leads to higher dehydration enthalpy (J/g) than the standard wetness impregnation method.
Other characteristics such as hydration enthalpy or hydration rate (power output) could be
improved if different preparation methods are utilised.
Figure 6-3 DSC plots showing the endothermic dehydration heat flow for 13x samples, ZMK, 13xMK
and MgSO4.
The absence of the MgSO4 dehydration peak in the 13x based materials was due to the
MgSO4 which does not hydrate in these samples. Both preparation methods used 13x
molecular sieves as a host material and both have an absence of the MgSO4 dehydration peak.
The MgSO4 dehydration peak was present for the ZMK material suggesting the lack of
MgSO4 dehydration peak was due to the 13x material and to a pore blocking effect which has
also been suggested in other work [48]. If MgSO4 blocks pores in the 13x material it will
reduce the available surface area for water adsorption within the 13x material.
When creating the pellets from the powder absorbent material ion exchange can take
place between the Mg2+
ions in the MgSO4 solution and the Na+ ions in the 13x powder. The
slurry formed when creating the pellets contains all ions both Mg2+
and Na+, neither of which
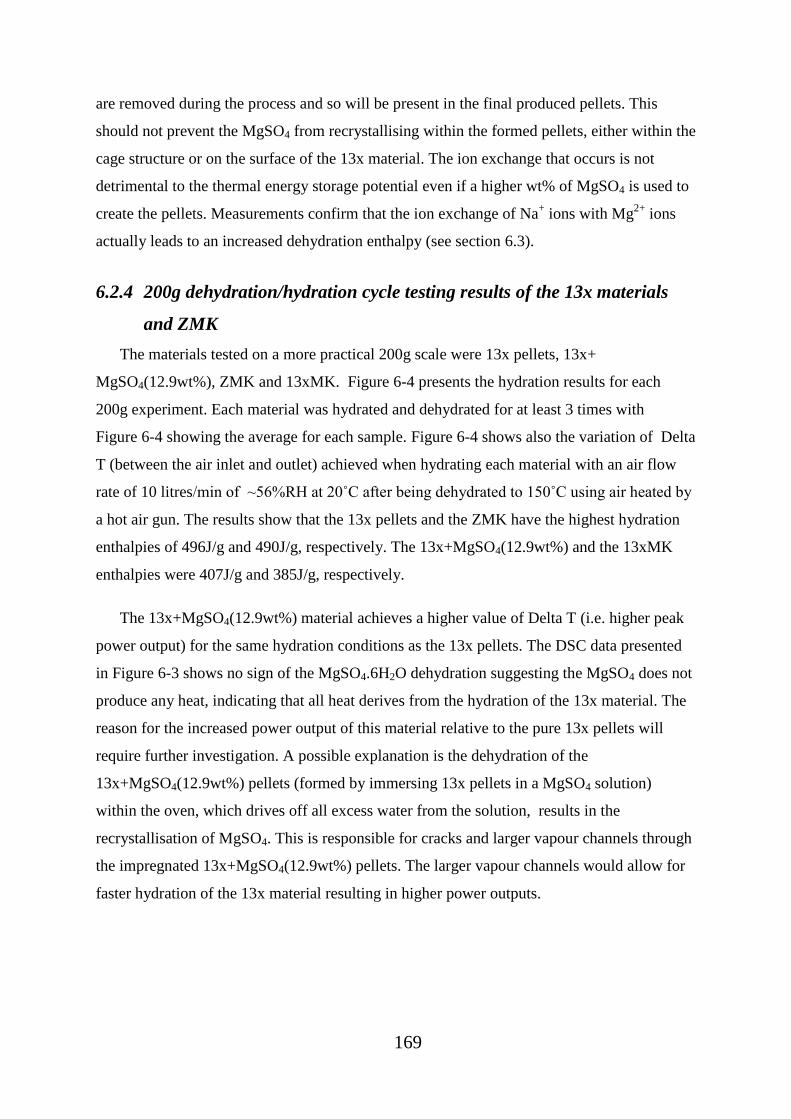
169
are removed during the process and so will be present in the final produced pellets. This
should not prevent the MgSO4 from recrystallising within the formed pellets, either within the
cage structure or on the surface of the 13x material. The ion exchange that occurs is not
detrimental to the thermal energy storage potential even if a higher wt% of MgSO4 is used to
create the pellets. Measurements confirm that the ion exchange of Na+ ions with Mg
2+ ions
actually leads to an increased dehydration enthalpy (see section 6.3).
6.2.4 200g dehydration/hydration cycle testing results of the 13x materials
and ZMK
The materials tested on a more practical 200g scale were 13x pellets, 13x+
MgSO4(12.9wt%), ZMK and 13xMK. Figure 6-4 presents the hydration results for each
200g experiment. Each material was hydrated and dehydrated for at least 3 times with
Figure 6-4 showing the average for each sample. Figure 6-4 shows also the variation of Delta
T (between the air inlet and outlet) achieved when hydrating each material with an air flow
rate of 10 litres/min of ~56%RH at 20˚C after being dehydrated to 150˚C using air heated by
a hot air gun. The results show that the 13x pellets and the ZMK have the highest hydration
enthalpies of 496J/g and 490J/g, respectively. The 13x+MgSO4(12.9wt%) and the 13xMK
enthalpies were 407J/g and 385J/g, respectively.
The 13x+MgSO4(12.9wt%) material achieves a higher value of Delta T (i.e. higher peak
power output) for the same hydration conditions as the 13x pellets. The DSC data presented
in Figure 6-3 shows no sign of the MgSO4.6H2O dehydration suggesting the MgSO4 does not
produce any heat, indicating that all heat derives from the hydration of the 13x material. The
reason for the increased power output of this material relative to the pure 13x pellets will
require further investigation. A possible explanation is the dehydration of the
13x+MgSO4(12.9wt%) pellets (formed by immersing 13x pellets in a MgSO4 solution)
within the oven, which drives off all excess water from the solution, results in the
recrystallisation of MgSO4. This is responsible for cracks and larger vapour channels through
the impregnated 13x+MgSO4(12.9wt%) pellets. The larger vapour channels would allow for
faster hydration of the 13x material resulting in higher power outputs.
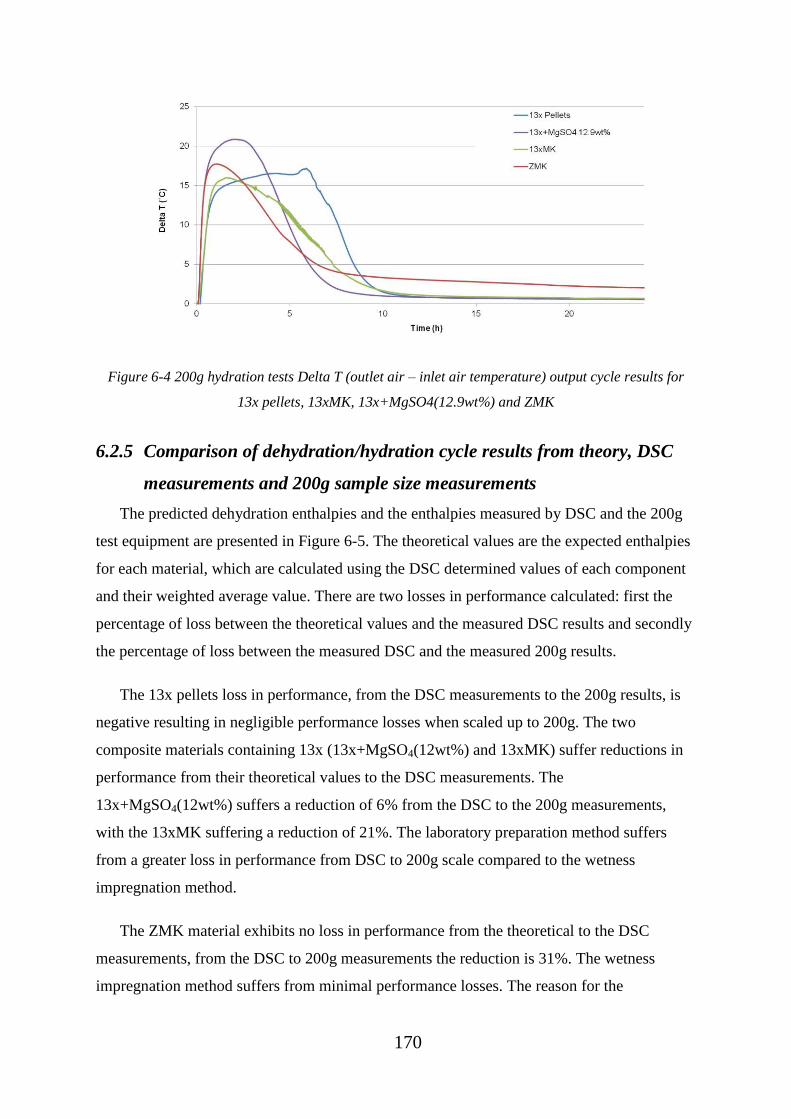
170
Figure 6-4 200g hydration tests Delta T (outlet air – inlet air temperature) output cycle results for
13x pellets, 13xMK, 13x+MgSO4(12.9wt%) and ZMK
6.2.5 Comparison of dehydration/hydration cycle results from theory, DSC
measurements and 200g sample size measurements
The predicted dehydration enthalpies and the enthalpies measured by DSC and the 200g
test equipment are presented in Figure 6-5. The theoretical values are the expected enthalpies
for each material, which are calculated using the DSC determined values of each component
and their weighted average value. There are two losses in performance calculated: first the
percentage of loss between the theoretical values and the measured DSC results and secondly
the percentage of loss between the measured DSC and the measured 200g results.
The 13x pellets loss in performance, from the DSC measurements to the 200g results, is
negative resulting in negligible performance losses when scaled up to 200g. The two
composite materials containing 13x (13x+MgSO4(12wt%) and 13xMK) suffer reductions in
performance from their theoretical values to the DSC measurements. The
13x+MgSO4(12wt%) suffers a reduction of 6% from the DSC to the 200g measurements,
with the 13xMK suffering a reduction of 21%. The laboratory preparation method suffers
from a greater loss in performance from DSC to 200g scale compared to the wetness
impregnation method.
The ZMK material exhibits no loss in performance from the theoretical to the DSC
measurements, from the DSC to 200g measurements the reduction is 31%. The wetness
impregnation method suffers from minimal performance losses. The reason for the
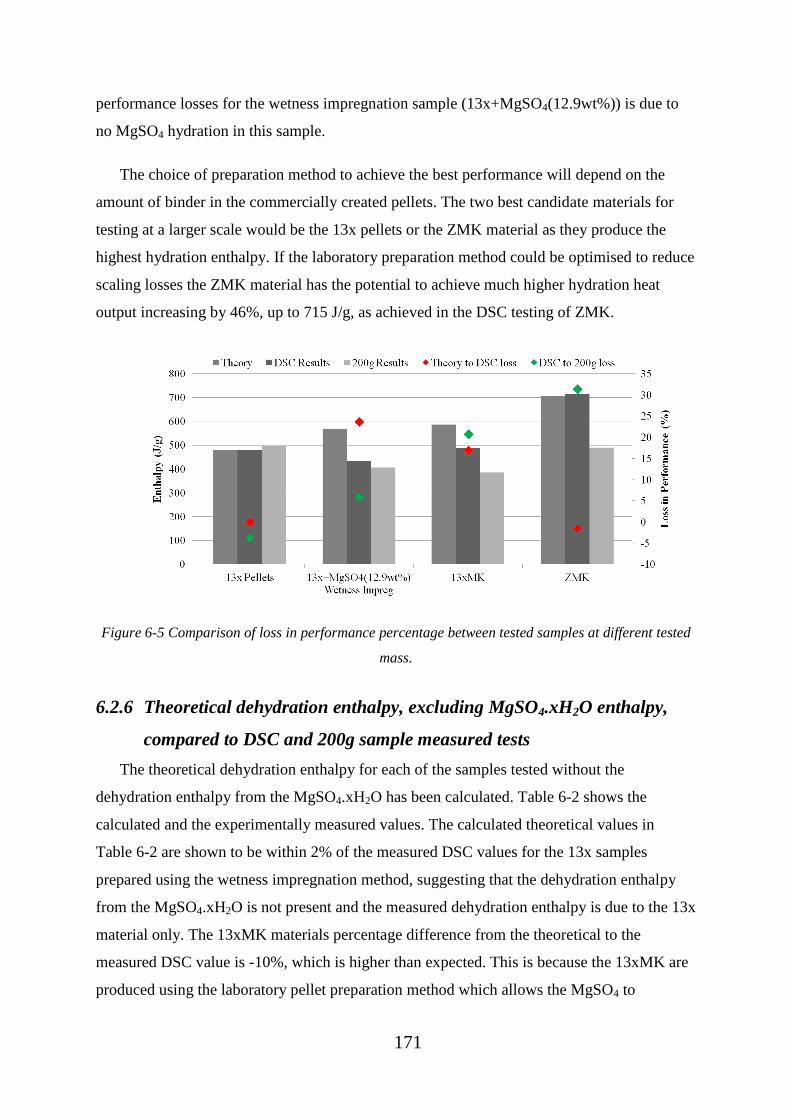
171
performance losses for the wetness impregnation sample (13x+MgSO4(12.9wt%)) is due to
no MgSO4 hydration in this sample.
The choice of preparation method to achieve the best performance will depend on the
amount of binder in the commercially created pellets. The two best candidate materials for
testing at a larger scale would be the 13x pellets or the ZMK material as they produce the
highest hydration enthalpy. If the laboratory preparation method could be optimised to reduce
scaling losses the ZMK material has the potential to achieve much higher hydration heat
output increasing by 46%, up to 715 J/g, as achieved in the DSC testing of ZMK.
Figure 6-5 Comparison of loss in performance percentage between tested samples at different tested
mass.
6.2.6 Theoretical dehydration enthalpy, excluding MgSO4.xH2O enthalpy,
compared to DSC and 200g sample measured tests
The theoretical dehydration enthalpy for each of the samples tested without the
dehydration enthalpy from the MgSO4.xH2O has been calculated. Table 6-2 shows the
calculated and the experimentally measured values. The calculated theoretical values in
Table 6-2 are shown to be within 2% of the measured DSC values for the 13x samples
prepared using the wetness impregnation method, suggesting that the dehydration enthalpy
from the MgSO4.xH2O is not present and the measured dehydration enthalpy is due to the 13x
material only. The 13xMK materials percentage difference from the theoretical to the
measured DSC value is -10%, which is higher than expected. This is because the 13xMK are
produced using the laboratory pellet preparation method which allows the MgSO4 to

172
recrystallise within the pellets outside of the 13x lattice. The percentage difference for the
ZMK material from theoretical to the measured DSC is -129%, due to the hydration of
MgSO4 within the zeolite which has a significant dehydration enthalpy within the ZMK
material.
When comparing the theoretical dehydration enthalpy to the 200g sample results the same
trend in percentage difference is seen. The percentage difference between the theoretical
values and the 200g hydration results are 4%, 13% and -56% for 13x+MgSO4 (12.9wt %),
13xMK and ZMK, respectively.
Table 6-2 Calculated theoretical dehydration enthalpies for samples, not accounting for the
MgSO4.xH2O dehydration enthalpy, compared to the measured DSC and 200g enthalpy results over
the temperature range 20-150˚C.
6.3 13x Mg2+
ion exchange pellet testing results
To improve the energy output of the 13x pellets, they were exposed to an ion exchange
process where each Mg2+
ion replaced two Na+
ions. Figure 6-6 shows the DSC dehydration
enthalpy and TGA mass loss of the 13x Mg ion exchanged pellets and for 13x pellets which
have not been put through an ion exchange process. The ion exchanged pellets have a higher
dehydration enthalpy and a greater mass loss.
The reason for the increased dehydration enthalpy and the mass loss of the 13x ion
exchanged samples is due to the bonding of H2O to the Mg2+
ions within the 13x pellets. Due
to the high hydration energy of Mg2+
ions the modified 13x pellets have more bonded H2O
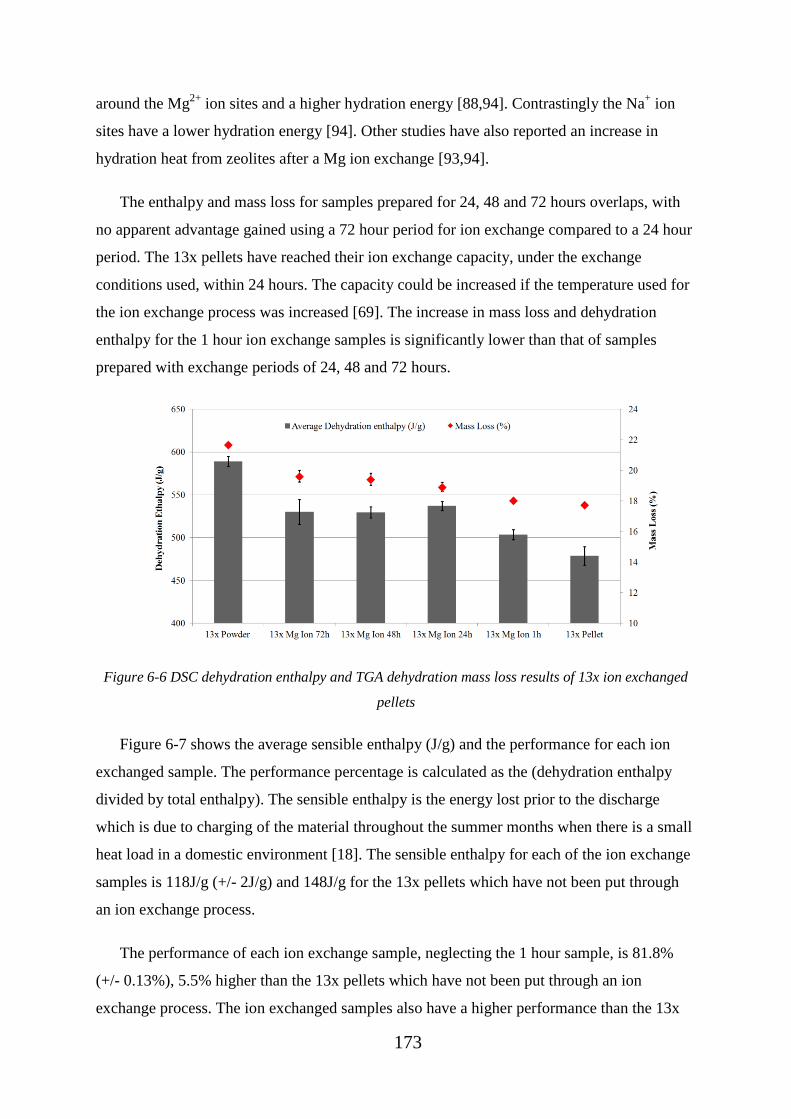
173
around the Mg2+
ion sites and a higher hydration energy [88,94]. Contrastingly the Na+ ion
sites have a lower hydration energy [94]. Other studies have also reported an increase in
hydration heat from zeolites after a Mg ion exchange [93,94].
The enthalpy and mass loss for samples prepared for 24, 48 and 72 hours overlaps, with
no apparent advantage gained using a 72 hour period for ion exchange compared to a 24 hour
period. The 13x pellets have reached their ion exchange capacity, under the exchange
conditions used, within 24 hours. The capacity could be increased if the temperature used for
the ion exchange process was increased [69]. The increase in mass loss and dehydration
enthalpy for the 1 hour ion exchange samples is significantly lower than that of samples
prepared with exchange periods of 24, 48 and 72 hours.
Figure 6-6 DSC dehydration enthalpy and TGA dehydration mass loss results of 13x ion exchanged
pellets
Figure 6-7 shows the average sensible enthalpy (J/g) and the performance for each ion
exchanged sample. The performance percentage is calculated as the (dehydration enthalpy
divided by total enthalpy). The sensible enthalpy is the energy lost prior to the discharge
which is due to charging of the material throughout the summer months when there is a small
heat load in a domestic environment [18]. The sensible enthalpy for each of the ion exchange
samples is 118J/g (+/- 2J/g) and 148J/g for the 13x pellets which have not been put through
an ion exchange process.
The performance of each ion exchange sample, neglecting the 1 hour sample, is 81.8%
(+/- 0.13%), 5.5% higher than the 13x pellets which have not been put through an ion
exchange process. The ion exchanged samples also have a higher performance than the 13x

174
powder sample. A higher performance is beneficial for materials and will result in higher
efficiency if used in a seasonal heat storage system. The increase in performance of the ion
exchanged pellets is firstly due to the increased dehydration enthalpy (explained in
section 6.3) and also due to a decreased sensible enthalpy.
The performance and the sensible enthalpy for the samples prepared for 24 hours, 48
hours and 72 hours are within 0.13% and 2J/g, respectively which means that the ion
exchange reaches its maximum percentage between 1 hour and 24 hours. The quantification
of the optimum ion exchange time period will require further investigation.
Figure 6-7 Sensible enthalpy and performance (dehydration enthalpy / total enthalpy) of 13x ion
exchanged pellets
6.3.1 SEM and EDX analysis of 13x ion exchanged pellets
13x pellets and each ion exchanged sample were analysed using SEM and EDX. To
collect the data for the EDX and SEM results presented (Figure 6-8, Figure 6-9 and
Figure 6-10) several different samples of each pellet were tested and also data was collected
for several locations within each pellet. The EDX composition values obtained were then
averaged and normalized for Mg and Na content to determine the changing composition of
the pellets. Figure 6-8 shows the EDX determined changing composition of the interior of the
13x pellets before and after different periods of the ion exchange process. After the 24 hour
ion exchange process 60% (+/- 4%) of the sodium had been replaced by magnesium. The
results show that the ion exchange methodology has successfully replaced Na+ ions with
Mg2+
ions within the 13x pellets. Figure 6-8 shows that the Mg2+
and Na+ ion contents of the
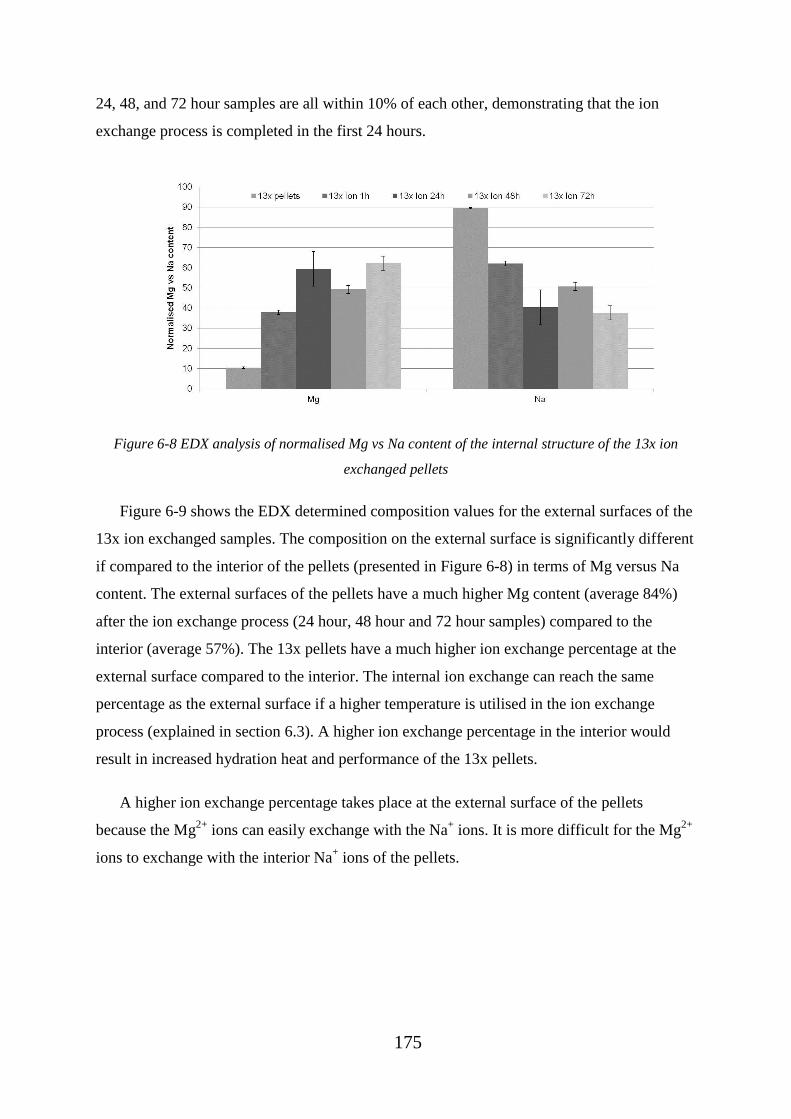
175
24, 48, and 72 hour samples are all within 10% of each other, demonstrating that the ion
exchange process is completed in the first 24 hours.
Figure 6-8 EDX analysis of normalised Mg vs Na content of the internal structure of the 13x ion
exchanged pellets
Figure 6-9 shows the EDX determined composition values for the external surfaces of the
13x ion exchanged samples. The composition on the external surface is significantly different
if compared to the interior of the pellets (presented in Figure 6-8) in terms of Mg versus Na
content. The external surfaces of the pellets have a much higher Mg content (average 84%)
after the ion exchange process (24 hour, 48 hour and 72 hour samples) compared to the
interior (average 57%). The 13x pellets have a much higher ion exchange percentage at the
external surface compared to the interior. The internal ion exchange can reach the same
percentage as the external surface if a higher temperature is utilised in the ion exchange
process (explained in section 6.3). A higher ion exchange percentage in the interior would
result in increased hydration heat and performance of the 13x pellets.
A higher ion exchange percentage takes place at the external surface of the pellets
because the Mg2+
ions can easily exchange with the Na+ ions. It is more difficult for the Mg
2+
ions to exchange with the interior Na+ ions of the pellets.

176
Figure 6-9 EDX external surface analysis of normalised Mg vs Na content of the 13x ion exchanged
pellets
EDX data and SEM images of the interior and external surface structure of the pellets
were taken. Figure 6-10 shows SEM images of the 13x pellets after a 24 hour ion exchange
process. Image 1 shows an image of a pellet fragment, images 2-4 show enlargements of
image 1 and images 5 and 6 compare the different structures of the internal and the external
surfaces of the pellet. The images show that the external surface of the 13x pellets, after a 24
hour ion exchange process, is very different from the internal surface. The internal surface
consists of regular sphere shaped objects (zeolite structures) connected with voids in-between
creating a porous structure whereas the external surface is less regular and less porous. There
is a reduction in the ion exchange percentage within the interior of the pellets especially if
compared with the external surface; this is due to the external surface of the pellets being less
porous than the interior. A less porous external surface will reduce the ability of the Mg2+
ions to ion exchange with the Na+ ions in the interior core of the pellets.
The pellet samples were broken into fragments to perform EDX and SEM analysis, to
allow the interior structure as well as the exterior surface of the pellets to be analysed.
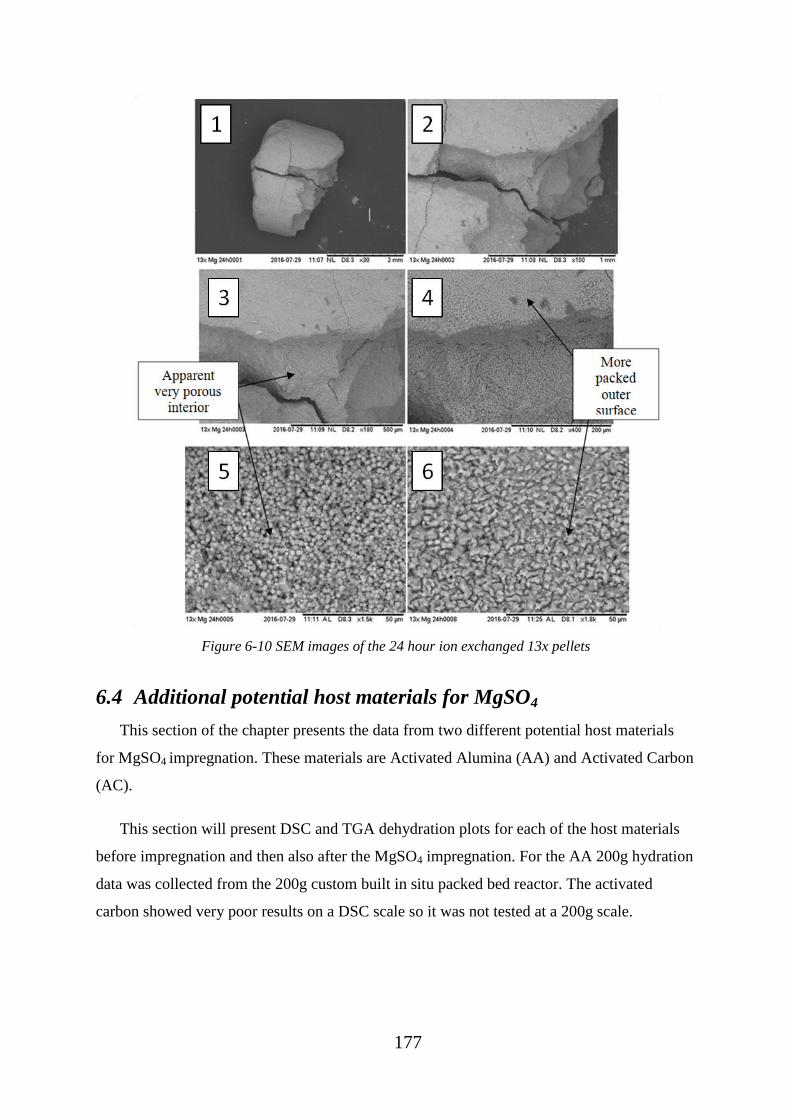
177
Figure 6-10 SEM images of the 24 hour ion exchanged 13x pellets
6.4 Additional potential host materials for MgSO4
This section of the chapter presents the data from two different potential host materials
for MgSO4 impregnation. These materials are Activated Alumina (AA) and Activated Carbon
(AC).
This section will present DSC and TGA dehydration plots for each of the host materials
before impregnation and then also after the MgSO4 impregnation. For the AA 200g hydration
data was collected from the 200g custom built in situ packed bed reactor. The activated
carbon showed very poor results on a DSC scale so it was not tested at a 200g scale.

178
6.4.1 Activated Alumina measurements
6.4.1.1 DSC measurements of activated alumina
Figure 6-11 shows the DSC dehydration of 3 cycles of hydrated activated alumina up to
150°C. It is seen that there is a peak of endothermic heat flow at around 75°C. The
endothermic heat flow gradually increases from 20°C up to 75°C then starts to reduce up to
150°C. This suggests that the peak mass loss (i.e. water loss) is at 75°C which gives rise to
the potential of using a lower dehydration temperature than 150°C while still achieving the
majority of the energy storage potential of the activated alumina.
Figure 6-11 DSC dehydration measurements of hydrated activated alumina
Figure 6-12 shows the averaged enthalpies from the DSC dehydration tests. The
dehydration enthalpy for the activated alumina was 286J/g and 429J/g for dehydration
temperatures of 150°C and 300°C, respectively. The dehydration enthalpy for activated
alumina was not as high as zeolite-Y which had a dehydration enthalpy of 615J/g when
dehydrated to 150°C and has been used in chapter 4 as a host material for MgSO4.
Although activated alumina had a higher dehydration enthalpy when dehydrated to
300°C, Figure 6-12 also shows the performance percentage for both dehydration
temperatures. The performance percentage when dehydrated to 150°C and 300°C was 76%
and 63%, respectively. This means the energy storage is less efficient when dehydrating
(charging) the activated alumina to 300°C opposed to 150°C. Also, 150°C is the maximum
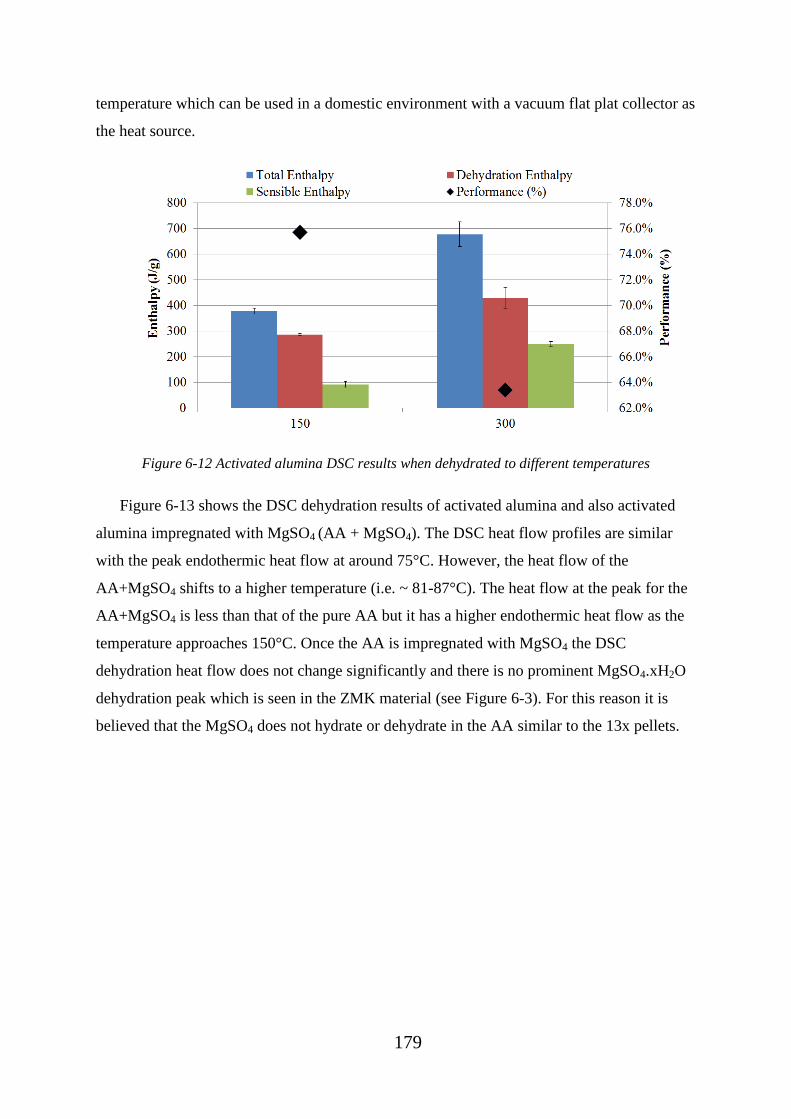
179
temperature which can be used in a domestic environment with a vacuum flat plat collector as
the heat source.
Figure 6-12 Activated alumina DSC results when dehydrated to different temperatures
Figure 6-13 shows the DSC dehydration results of activated alumina and also activated
alumina impregnated with MgSO4 (AA + MgSO4). The DSC heat flow profiles are similar
with the peak endothermic heat flow at around 75°C. However, the heat flow of the
AA+MgSO4 shifts to a higher temperature (i.e. ~ 81-87°C). The heat flow at the peak for the
AA+MgSO4 is less than that of the pure AA but it has a higher endothermic heat flow as the
temperature approaches 150°C. Once the AA is impregnated with MgSO4 the DSC
dehydration heat flow does not change significantly and there is no prominent MgSO4.xH2O
dehydration peak which is seen in the ZMK material (see Figure 6-3). For this reason it is
believed that the MgSO4 does not hydrate or dehydrate in the AA similar to the 13x pellets.
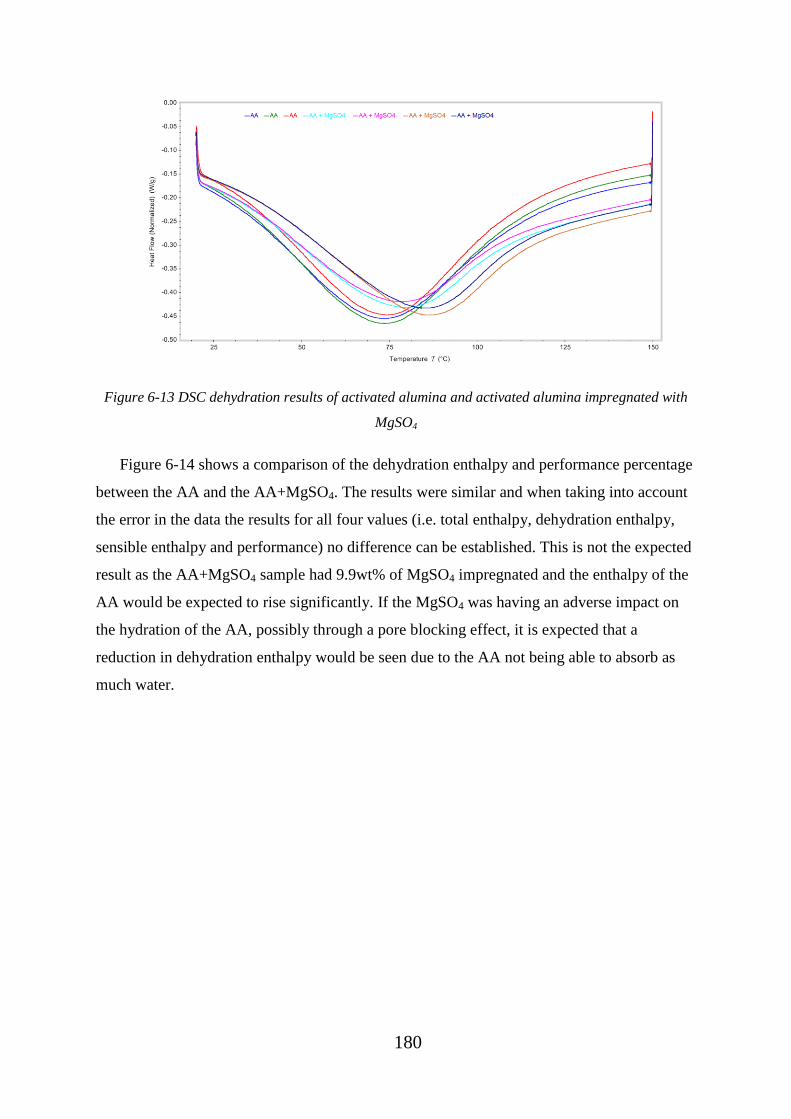
180
Figure 6-13 DSC dehydration results of activated alumina and activated alumina impregnated with
MgSO4
Figure 6-14 shows a comparison of the dehydration enthalpy and performance percentage
between the AA and the AA+MgSO4. The results were similar and when taking into account
the error in the data the results for all four values (i.e. total enthalpy, dehydration enthalpy,
sensible enthalpy and performance) no difference can be established. This is not the expected
result as the AA+MgSO4 sample had 9.9wt% of MgSO4 impregnated and the enthalpy of the
AA would be expected to rise significantly. If the MgSO4 was having an adverse impact on
the hydration of the AA, possibly through a pore blocking effect, it is expected that a
reduction in dehydration enthalpy would be seen due to the AA not being able to absorb as
much water.

181
Figure 6-14 Comparison of AA and AA+MgSO4 dehydration enthalpy
6.4.1.2 TGA Tests of activated alumina
TGA tests were conducted to assess the mass loss with temperature of the AA and AA +
MgSO4. Figure 6-15 shows the differential weight with temperature. The peak of the plot is at
~31°C. After 31°C the differential weight loss reduced to a plateau with temperature. As the
DSC dehydration of the AA has a large endothermic heat flow at 75°C it was expected that
the endothermic heat flow would correspond to a mass loss. Clearly from Figure 6-15 there
was no peak mass loss at around 75°C.
Figure 6-15 TGA dehydration of AA showing differential weight with temperature

182
Table 6-3 shows a summary of all of the small scale (DSC and TGA testing) results. It is
seen that all of the characteristics of the materials are similar; this includes (dehydration
enthalpy, Sensible enthalpy, performance, TGA mass loss and Enthalpy/mass loss).
Table 6-3 DSC and TGA Energy output of AA samples
Sample AA AA+MgSO4
Dehydration Enthalpy (J/g) 287 303
Sensible Enthalpy (J/g)
92 96
Performance (%) 76 76
TGA mass Loss (%) 9 10
Enthalpy/mass loss (J/g.%) 32 31
6.4.1.3 200g tests of activated alumina
200g of AA and AA+MgSO4 was tested in the in-situ reactor to allow 24h dehydration
and hydration testing of the samples and give hydration data at a practical size scale and give
an understanding of how the materials react when they are in there pellet form and the form
in which they would be used at a large scale.
Figure 6-16 24h 200g hydration results of AA
Table 6-4 shows the energy output from 200g of AA and AA+MgSO4 after a 24h
hydration. The results show that the energy output of both samples is similar with a variation
of only 11J/g. This is what was expected as the DSC dehydration enthalpy of both samples
was also similar (see Figure 6-14). However, the 200g results have a higher hydration
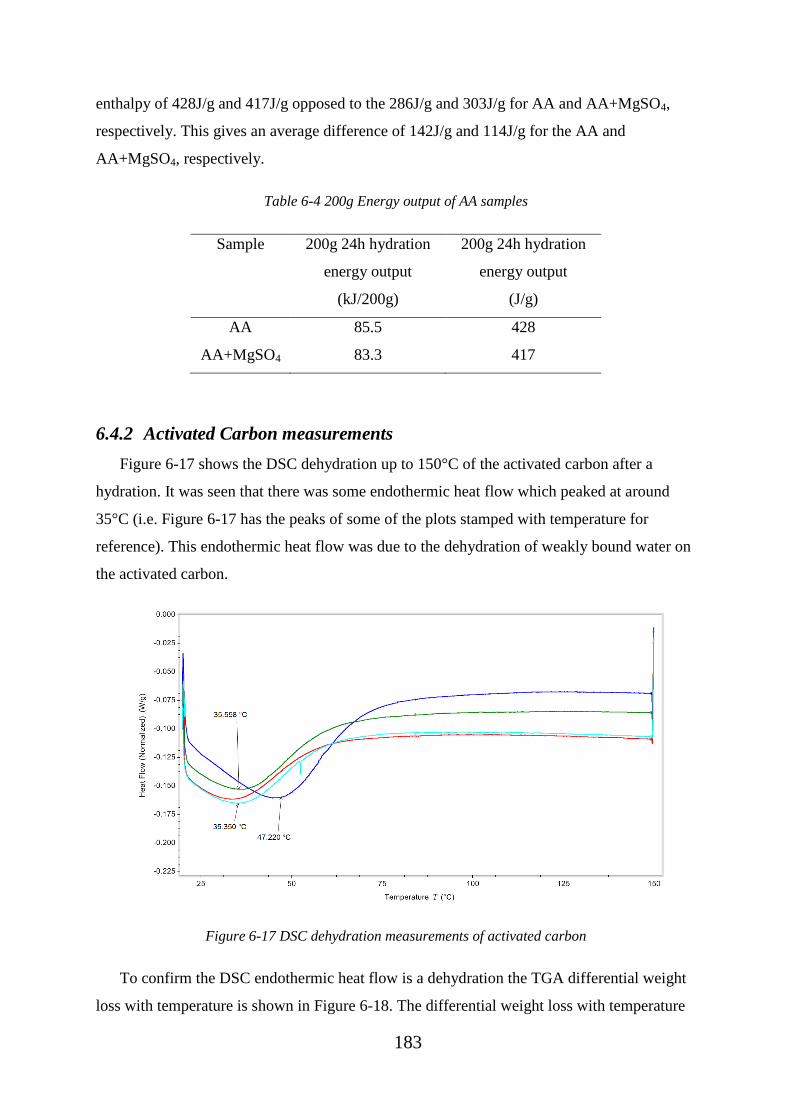
183
enthalpy of 428J/g and 417J/g opposed to the 286J/g and 303J/g for AA and AA+MgSO4,
respectively. This gives an average difference of 142J/g and 114J/g for the AA and
AA+MgSO4, respectively.
Table 6-4 200g Energy output of AA samples
Sample 200g 24h hydration
energy output
(kJ/200g)
200g 24h hydration
energy output
(J/g)
AA 85.5 428
AA+MgSO4
83.3 417
6.4.2 Activated Carbon measurements
Figure 6-17 shows the DSC dehydration up to 150°C of the activated carbon after a
hydration. It was seen that there was some endothermic heat flow which peaked at around
35°C (i.e. Figure 6-17 has the peaks of some of the plots stamped with temperature for
reference). This endothermic heat flow was due to the dehydration of weakly bound water on
the activated carbon.
Figure 6-17 DSC dehydration measurements of activated carbon
To confirm the DSC endothermic heat flow is a dehydration the TGA differential weight
loss with temperature is shown in Figure 6-18. The differential weight loss with temperature

184
shows the peaks of mass loss clearer opposed to the mass loss with temperature plots.
Figure 6-18 appears quite noisy due to only a small amount of mass loss over a relatively
large temperature range. Figure 6-19 is the same data as Figure 6-18 but over a smaller
temperature range and it allows for the peak weight loss to be seen more clearly. The peak
weight loss has also been stamped with a temperature for two of the samples and it was seen
the peak weight loss was around 33°C which confirms that the endothermic heat flow from
the DSC plots is due to a dehydration.
Figure 6-18 TGA differential weight loss showing the dehydration of activated carbon
Although there was some dehydration from the activated carbon and therefore there must
have been dehydration enthalpy for this dehydration it was very difficult to evaluate from the
DSC data due to the relatively large sensible enthalpy of the material (i.e. the enthalpy is
evaluated and shown in Table 6-5).

185
Figure 6-19 TGA differential weight loss showing the dehydration of activated carbon over the
temperature range of 30-67.5˚C
Figure 6-20 shows the DSC dehydration of activated carbon and activated carbon with
6.9wt% of impregnated MgSO4 (AC+MgSO4). At around 75°C there was an endothermic
peak. This peak was due to the dehydration of the MgSO4.xH2O within the AC+MgSO4
sample. This peak was not seen in the pure activated carbon DSC dehydration plots
confirming this was due to the impregnated MgSO4. The impregnated MgSO4 in the AC
increased the dehydration enthalpy of the AC significantly (see Table 6-5). However, due to
the very poor dehydration enthalpy of the AC even with the addition of the MgSO4 the
performance and overall dehydration enthalpy of the AC+MgSO4 is low.
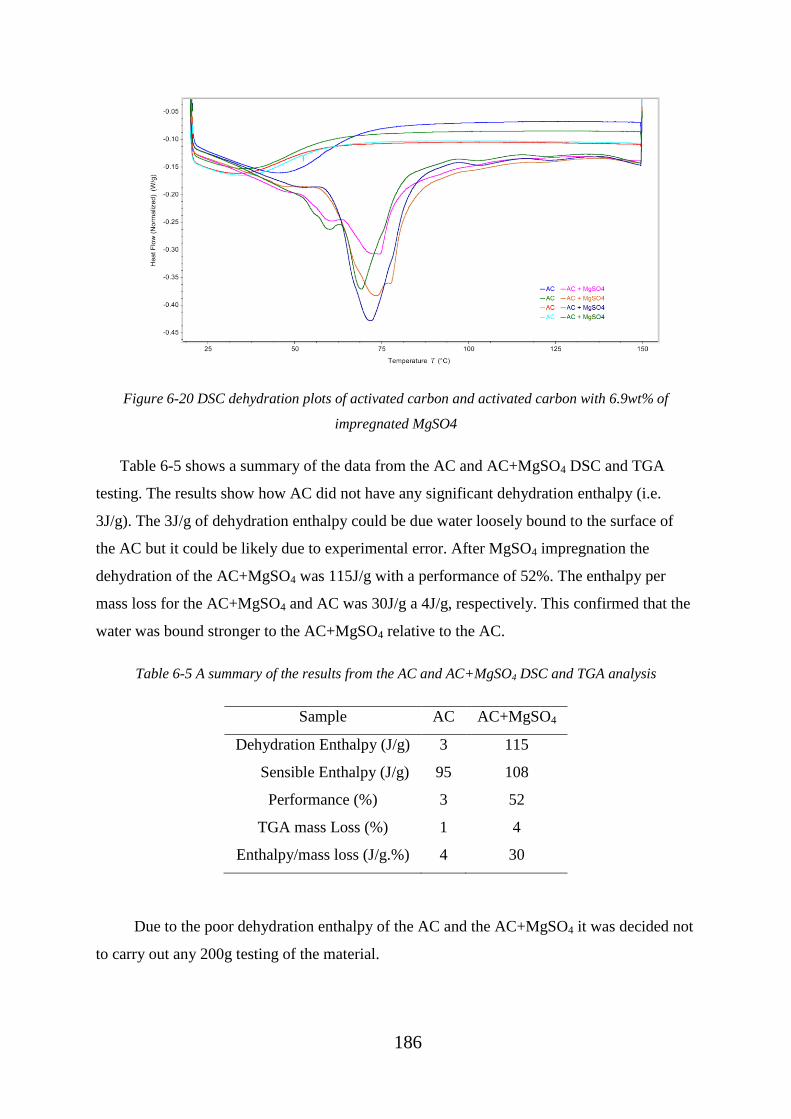
186
Figure 6-20 DSC dehydration plots of activated carbon and activated carbon with 6.9wt% of
impregnated MgSO4
Table 6-5 shows a summary of the data from the AC and AC+MgSO4 DSC and TGA
testing. The results show how AC did not have any significant dehydration enthalpy (i.e.
3J/g). The 3J/g of dehydration enthalpy could be due water loosely bound to the surface of
the AC but it could be likely due to experimental error. After MgSO4 impregnation the
dehydration of the AC+MgSO4 was 115J/g with a performance of 52%. The enthalpy per
mass loss for the AC+MgSO4 and AC was 30J/g a 4J/g, respectively. This confirmed that the
water was bound stronger to the AC+MgSO4 relative to the AC.
Table 6-5 A summary of the results from the AC and AC+MgSO4 DSC and TGA analysis
Sample AC AC+MgSO4
Dehydration Enthalpy (J/g) 3 115
Sensible Enthalpy (J/g)
95 108
Performance (%) 3 52
TGA mass Loss (%) 1 4
Enthalpy/mass loss (J/g.%) 4 30
Due to the poor dehydration enthalpy of the AC and the AC+MgSO4 it was decided not
to carry out any 200g testing of the material.

187
6.5 Conclusions of chapter 6
Two different absorbents, 13x and zeolite-Y, were shown to exhibit similar dehydration
properties through thermal analysis. The 13x material was shown to be a poor host for
MgSO4 as there were no signs of MgSO4.6H2O dehydration in DSC and 200g tests for any of
the 13x materials impregnated with MgSO4. Two materials with the same MgSO4 wt%
(13xMK and 13x+MgSO4(12.9wt%)) were created and tested using different pellet
preparation methods. Both of them did not show signs of MgSO4 hydration.
The 200g hydration cycle experiments showed that the 13x pellets and the ZMK pellets
have the best properties for use in thermochemical heat storage systems from the materials
tested. Zeolite-Y was shown to be a suitable host material for MgSO4 because of the high
energy density reported in the experiments. The pellet preparation method, used to create
pellets from absorbent powders, suffered performance losses when moving from DSC
measurements to 200g scale system measurements. If this method is optimised the hydration
heat of the ZMK could be increased by 46%.
After Mg2+
ion exchange with the 13x pellets the properties for heat storage improved.
The pellets, after a 24 hour ion exchange period, had a higher DSC dehydration enthalpy and
a lower sensible enthalpy component. This resulted in an improved performance by 5.5%.
Two other desiccants AA and AC were characterised and then impregnated with MgSO4
and characterised again. The results showed that the AC has an average measured
dehydration enthalpy of 3J/g. After impregnation the AC+MgSO4 material had an averaged
measured dehydration enthalpy of 115J/g. However, although the MgSO4 was able to hydrate
and dehydrate in the AC the dehydration enthalpy from the AC was too small and the
performance of the AC+MgSO4 was very low (52%) relative to the other composite materials
characterised in this chapter.
The AA had a measured dehydration enthalpy of 287J/g which was low relative to the
13x and zeolite-Y absorbents. Due to the sensible enthalpy of AA (92J/g) and its low
dehydration enthalpy the performance of AA was 76%. After impregnation with MgSO4 the
dehydration of the AA increased to 303J/g however, the performance of the AA+MgSO4 was
the same as the AA (76%). The hydration energy output, at a 200g scale, from the AA and
AA+MgSO4 was higher than the DSC results, which was not expected. The AA beads have a

188
hydration enthalpy output of 428J/g however; this was not as high as the ZMK composite
material.

189
7 Large scale testing of TCES materials
7.1 Introduction and purpose of the custom built modular 40kg rig
To understand the large scale potential of TCESM a custom 8 module automated reactor
was designed developed and built which can house ~40kg of TCESM (5kg per module). The
system is an open TCES system which serves as a laboratory prototype of a reactor which
could be implemented into a domestic environment.
This large scale laboratory rig has been specifically designed in a way which enables
flexibility to the charging and discharging of the TCES material. This design has 8 modules
which can be opened and closed in any order as required. The connected microcontroller
reads the inputs from the modules temperature sensors and can be programmed to open or
close any module dependent on module temperature.
The experimental testing using this rig will enable simulation of charging a TCES store
with changing weather and irradiances. Currently most TCES reactors use a large packed
bed, if this was to be used in a household and charged over the summer months using a STC a
packed bed reactor design may result in significant energy losses. For example, if there was a
very bright hot period throughout the summer which resulted in significant solar gains from
the STC to the TCES material store the TCES material store would increase in temperature.
However, assume the TCES material store was heated to 50% of the charging temperature
required for complete dehydration (fully charged). After this very bright period if the weather
changed to provide minimal solar gains to the TCES material store the TCES material could
significantly reduce in temperature. This significant reduction in temperature is wasted
thermal energy.
Alternatively, if a modular TCES system was implemented in the household and the same
weather patterns were experienced, instead of the whole TCES material store increasing to
50% of the required maximum charge temperature several of the modules could be
completely charged and the remaining modules not charged at all throughout the bright
weather period. When the weather changes, resulting in minimal solar gains, the charged
TCES modules can cool to ambient temperature and not require reheating to complete their
charging. This methodology of using a modular system and charging the modules
individually could result in saved thermal energy.

190
Using this novel modular reactor design experimental investigations into the discharge
process can be investigated. A modular store allows for segmented discharge. Assume the
maximum possible temperature lift (x) from a TCES is required for a short period and a
single module could be discharged to supply this temperature lift. As each module is a
fraction of the whole TCES there is less thermal energy, supplied through hydration enthalpy,
required to bring a single module up to the desired output temperature x and therefore, less
wasted thermal energy once the demand for heat has stopped, compared to a packed bed
system.
Alternatively, if a packed bed reactor design was used to supply this temperature lift of x for
a short period a greater amount of hydration enthalpy would be required to heat the TCES
material to the desired output temperature. Once this short demand for heat has stopped all of
the sensible enthalpy stored in the TCES material will dissipate to the surroundings
potentially resulting in a large amount of wasted thermal energy.
The system presented here will enable experimental research to be conducted into the
optimisation of the charging of a TCES material store under unpredictable weather patterns
on a large scale.
7.2 Custom built modular 40kg rig system design
An image of the system built can be seen in Figure 7-1. The system used a Huber unistat
510 heat source which pumped oil into a custom built heat exchanger enclosure which houses
two oil-air finned heat exchangers. When in dehydration mode the heat source was set to
170˚C which allowed for an input air temperature of 150˚C. Regulated compressed air would
be passed into the system and through one of two gate valves. Gate valve 1 would allow the
air to pass directly into the heat exchanger, gate valve 2 would allow the air to pass through
the water container first and then into the heat exchanger. The gate valves could be adjusted
to change the percentage of air flow that would pass along each path (i.e. either directly into
the heat exchanger or through the water container first) this would control the humidity of the
air stream. On the input and output of the TCES material modules were gate valves. The gate
valves could be opened or closed allowing the air to enter the modules or seal off the modules
from the air. The gate valves were controlled by servos which were connected to a
microcontroller datalogger and could be programmed to open or close dependant on the
output a temperature sensor or other external input.
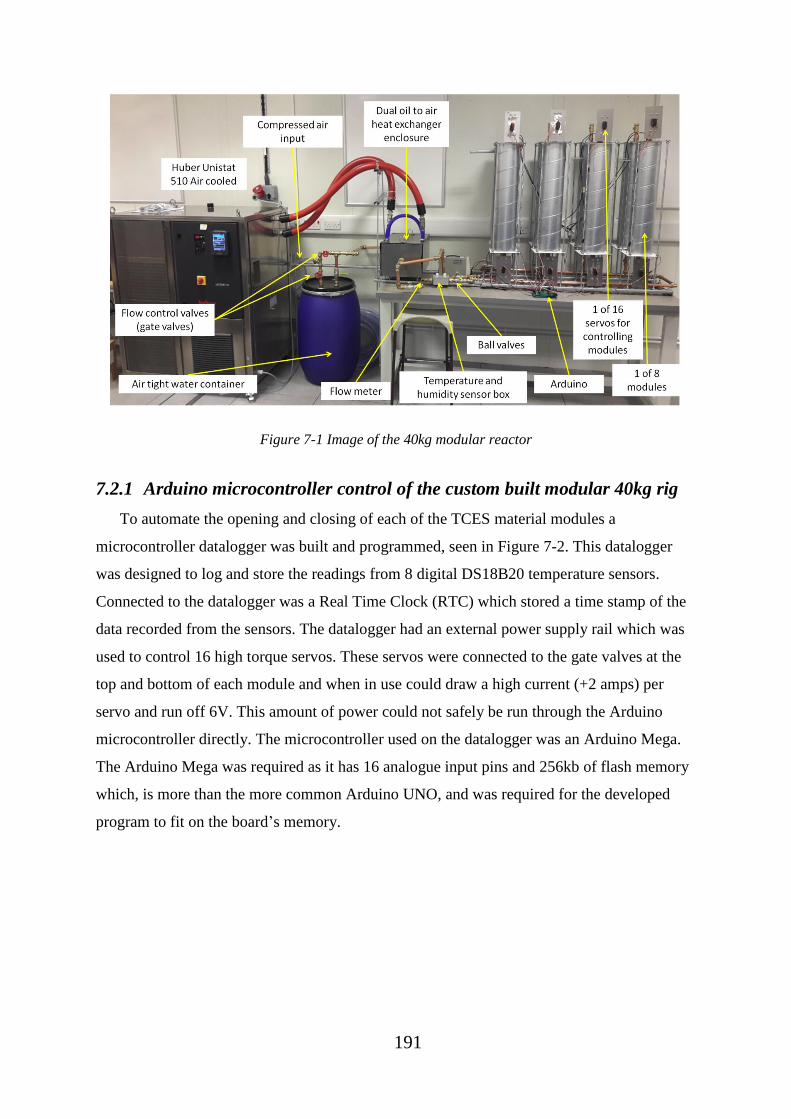
191
Figure 7-1 Image of the 40kg modular reactor
7.2.1 Arduino microcontroller control of the custom built modular 40kg rig
To automate the opening and closing of each of the TCES material modules a
microcontroller datalogger was built and programmed, seen in Figure 7-2. This datalogger
was designed to log and store the readings from 8 digital DS18B20 temperature sensors.
Connected to the datalogger was a Real Time Clock (RTC) which stored a time stamp of the
data recorded from the sensors. The datalogger had an external power supply rail which was
used to control 16 high torque servos. These servos were connected to the gate valves at the
top and bottom of each module and when in use could draw a high current (+2 amps) per
servo and run off 6V. This amount of power could not safely be run through the Arduino
microcontroller directly. The microcontroller used on the datalogger was an Arduino Mega.
The Arduino Mega was required as it has 16 analogue input pins and 256kb of flash memory
which, is more than the more common Arduino UNO, and was required for the developed
program to fit on the board’s memory.
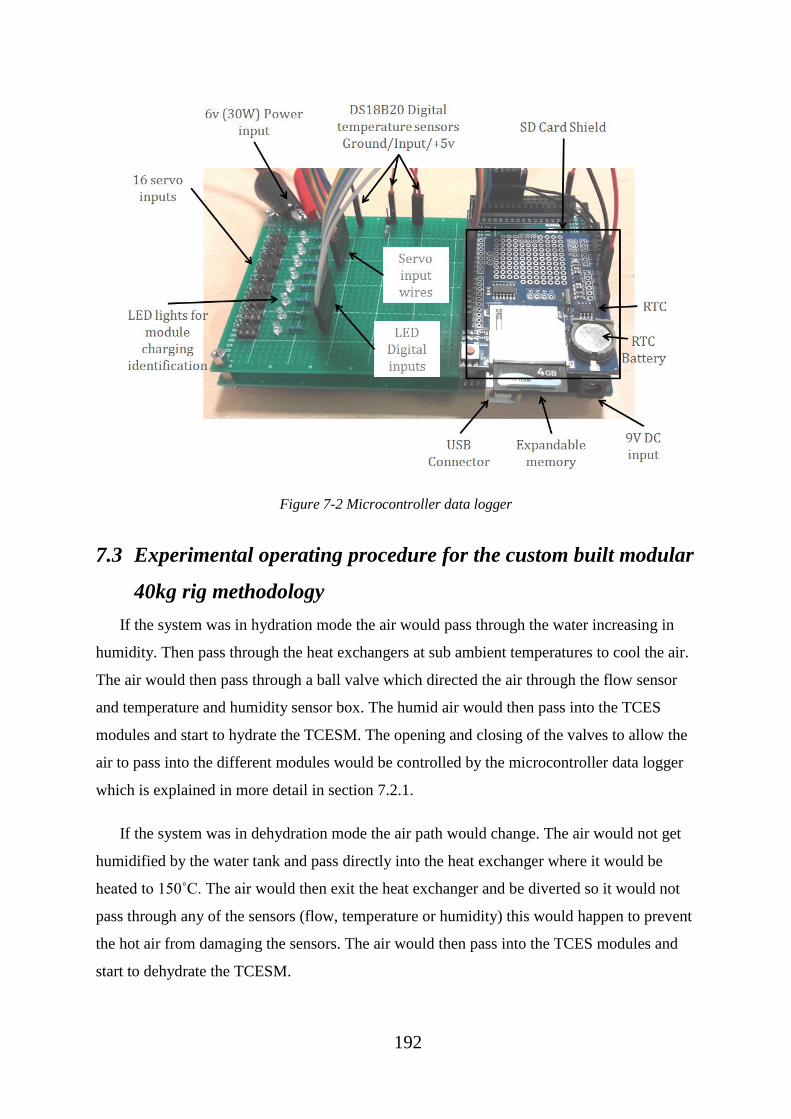
192
Figure 7-2 Microcontroller data logger
7.3 Experimental operating procedure for the custom built modular
40kg rig methodology
If the system was in hydration mode the air would pass through the water increasing in
humidity. Then pass through the heat exchangers at sub ambient temperatures to cool the air.
The air would then pass through a ball valve which directed the air through the flow sensor
and temperature and humidity sensor box. The humid air would then pass into the TCES
modules and start to hydrate the TCESM. The opening and closing of the valves to allow the
air to pass into the different modules would be controlled by the microcontroller data logger
which is explained in more detail in section 7.2.1.
If the system was in dehydration mode the air path would change. The air would not get
humidified by the water tank and pass directly into the heat exchanger where it would be
heated to 150˚C. The air would then exit the heat exchanger and be diverted so it would not
pass through any of the sensors (flow, temperature or humidity) this would happen to prevent
the hot air from damaging the sensors. The air would then pass into the TCES modules and
start to dehydrate the TCESM.

193
7.3.1 Default microcontroller data logger program of the custom built
modular 40kg rig
The default program set on the microcontroller data logger had two different programs, a
dehydration program and a hydration program.
The dehydration program starts by opening the valves on module 1 while the air output
temperature was being monitored. Once the air output temperature reached the set point
temperature, the microcontroller would open the valves on module 2. Once module 2 was
open the valves on module 1 would be sealed. This process would repeat dehydrating each
module sequentially. Once all modules had been dehydrated all valves would be shut and the
TCES material would be allowed to cool.
The hydration program first opened the valves on reactor 1. The hydration of reactor 1
would then begin. To ensure the hydration was not ended prematurely, there was a delay at
this point in the program. The delay allowed enough time for the TCES material to create an
air output temperature above the air input temperature. Once the time delay was over the
output temperature would be monitored. Once the output air temperature dropped below a set
point delta T the valves on the next module would be opened. Then the module which would
have just been hydrated would have its valves closed. This process would be repeated
sequentially until all modules were hydrated.
7.3.2 Data collection for the custom built modular 40kg rig
As no experimental data from the 40kg rig containing TCES material was collected in this
research project the methodology presented here is an anticipation of what would happen
when the 40kg system is used.
The data collected from these experiments would be imported into a spreadsheet. The
data collected would include; input air RH%, input air temperature, air flow rate, temperature
of air at RH% measurement, output air temperature and time when each valve was opened or
closed. This data would be used to calculate the power and energy output of the TCESM for
each module. Each material test would be conducted at least 3 times and an average for each
module as well as an average for all modules would be calculated. The RH% and temperature
measurements would also be used to calculate the partial vapour pressure of the air.

194
The data collected would give an insight to any performance losses experienced from
200g to 40kg scale and also the overall energy density of the prototype TCES system.
7.4 Conclusions from the custom built 40kg reactor design
This system allows for large scale prototype testing and understanding of the workings of
an open TCES system. The modular feature allows for flexibility in the testing of the system.
A modular system allows for singular charging and discharging of TCES material stores,
opposed to bulk charging and discharging, which could potentially be a more energy efficient
way to operate a TCES interseasonal open TES system.
This system was designed and developed for utilisation and testing in future research
potentially by other researchers.

195
8 Thesis conclusions
The conclusions derived from the research conducted for this thesis are described below.
The conclusions are split into the conclusions derived from each chapter.
8.1 Conclusions from Chapter 4 – Characterisation of MgSO4,
zeolite-Y and composite materials
Chapter 4 investigated the small scale (~10mg) potential of MgSO4.xH2O, zeolite-Y and
composite materials made from zeolite-Y and MgSO4.xH2O. MgSO4.xH2O was tested and
shown to have cycle characteristic which make the material an ideal candidate for domestic
seasonal heat storage. The materials characteristics improved with successive cycles and the
enthalpy of the material remained high (average 1,265J/g).
MgSO4.7H2O was dehydrated within the DSC and the TGA+RGA using several
different heating rates. The measurements showed the dehydration of the MgSO4.7H2O had
more sharp endothermic peaks when using higher dehydration heating rates due to the sudden
loss of water from the MgSO4.
MgSO4.7H2O was dehydrated to a maximum temperature of 110˚C and 150˚C within
the DSC. The results showed that there was only a 7% difference in dehydration enthalpy
between the two maximum dehydration temperatures used.
The charging and discharging of MgSO4.xH2O was cycled within the DSC and
TGA+RGA using three different dehydration heating rates. The dehydration enthalpy of
MgSO4 was not impacted by the dehydration heating rate used and MgSO4 did not have any
cycle stability degradation.
MgSO4.xH2O was dehydrated with different heating rates and then imaged within the
SEM to inspect the structure of the material after the dehydrations. From the SEM images
and the DSC, TGA+ RGA measurements it was shown that higher dehydration heating rates
cause more cracks to occur in the MgSO4 which results in improved dehydration kinetics.
This is likely to be the same for the hydration kinetics although the DSC setup used would
not allow for hydration testing.
Composite materials were created from zeolite-Y with up to 35wt% of impregnated
MgSO4. The results have shown that the composite materials did not experience any

196
degradation with increasing wt% of MgSO4 with the 35wt% composite material having a
dehydration enthalpy of 708J/g.
MgSO4.xH2O was dehydrated within the DSC using different maximum dehydration
temperatures and also different dehydration heating rates. It was shown that the length of the
dehydration isothermal period is important to “extract” as much of the dehydration enthalpy
from MgSO4. If the isothermal period used is not sufficiently long enough the dehydration
enthalpy of the material is reduced leading to less thermal energy being stored. However, the
isothermal stage enthalpy does appear to decrease with successive cycles at the higher
heating rates, suggesting the dehydration kinetics improve with successive cycles.
Three different grain sizes of MgSO4.xH2O were dehydrated within the DSC and TGA
+ RGA. It was shown that the grain size of MgSO4.xH2O used when dehydrating the material
had an impact on the temperature at which mass was lost and on the dehydration kinetics of
the MgSO4.xH2O. The larger grain size had slower dehydration kinetics and lost more mass
at a higher temperature relative to the smaller grain size.
8.2 Conclusions from chapter 5 - Understanding the larger scale
(100g+) characteristics of MgSO4 and investigation of sample
preparation methods for MgSO4 for use as a TCES material
Chapter 5 investigated the larger scale (100g+) behaviour of MgSO4 through hydration
and dehydration experiments within custom built experimental configurations.
It was found that the use of pure MgSO4 at larger scales was problematic due to
agglomeration of the material when hydrated and low permeability. Research was undertaken
to investigate novel methods to develop composite TCES materials incorporating
MgSO4.xH2O to reduce the agglomeration issues and create an energy dense TCES material.
Several methodologies were tested and the one which was identified to have the best
characteristics was the pellet preparation methodology.
To optimise the pellet preparation methodology two key variables of the methodology
were changed and four different batches of pellets were produced. The pellets were created
with either a mixture or impregnation composite creation method and then they were initially
dehydrated with either a 1°C/min or 5°C/min dehydration heating rate. The names of the four
197
different pellet batches produced were Mix 1, Mix 5, Impreg 1 and Impreg 5. These four
different pellets were tested with a DSC, TGA + RGA, SEM + EDX, nitrogen sorption
analyser and cycled in a 200g custom built hydration and dehydration chamber. The results
showed that the Impreg 1 pellets synthesized had the highest 200g hydration energy output
and also the largest bulk density which resulted in the Impreg 1 pellets having the highest
energy density. The Mix 1 pellets had the highest performance ratio.
8.3 Conclusions from chapter 6 - Investigation into potential host
materials for impregnating with MgSO4
Chapter 6 investigated several different potential host materials for impregnating with
MgSO4. Tests were conducted within the DSC, TGA + RGA, SEM + EDX and the custom
built 200g hydration and dehydration chamber. The materials tested were ZMK, 13x,
Activated Alumina (AA) and Activated Carbon (AC).
The 13x absorbent was shown to be a poor host for MgSO4 as there were no signs of
MgSO4.xH2O dehydration from the 13x material impregnated with MgSO4.xH2O. This
resulted in significant loss of expected dehydration enthalpy and specific energy density from
the composite materials.
To improve the dehydration enthalpy of the 13x pellets they were put through an ion
exchange process to replace the Na+
ions with Mg2+
ions. The methodology for the ion
exchange process was investigated to find the optimum ion exchange time length. After an
Mg2+
ion exchange on the 13x pellets their properties for heat storage improved. The ion
exchanged 13x pellets had an increased specific energy density and an improved performance
ratio.
It was found that the optimal ion exchange time length for the 13x pellets was between 1
and 24 hours. However, after SEM and EDX analysis it was shown that the ion exchange had
completed to a higher level on the exterior of the 13x pellets compared to the interior of the
pellets. This means that further ion exchange was possible within the 13x pellets which
would lead to an increase in dehydration enthalpy and an increase in specific energy density.
Zeolite-Y was shown to be a suitable host material for MgSO4 because of the high energy
density reported in the experiments and the MgSO4.xH2O dehydration peaks seen in the DSC

198
dehydration heat flow measurements indicating the MgSO4.xH2O was charging and
discharging within the zeolite-Y composite materials.
The ZMK material was shown to have the highest dehydration enthalpy at DSC scale
(715J/g) and a hydration enthalpy of 490J/g at a 200g scale. The ZMK pellets were developed
using the novel pellet preparation methodology.
The pellet preparation method, used to create pellets from absorbent powders, suffered
significant performance losses when moving from DSC measurements to 200g scale system
measurements. The best performing ZMK pellet suffered a 31% loss in performance from
DSC scale to 200g scale.
Two other desiccants AA and AC were characterised, within the DSC, TGA + RGA and
then impregnated with MgSO4. The results showed that AC+MgSO4 had a low dehydration
enthalpy of 115J/g and a low performance of 52%. The AA beads were better performing
than that AC pellets. AA+MgSO4 had a DSC dehydration enthalpy of 303J/g and a
performance of 76%. The results from both the AA and AC do not make them ideal candidate
host materials for MgSO4.
ZMK has a specific energy density ~3.8 times higher than water being used to store
thermal energy for DSH and DHW (assumed water delta T of 45˚C and a dehydration
enthalpy of 715J/g for ZMK). If ZMK is used in a large scale TCES system and charged
throughout the summer months with a STC, storing typically unutilised thermal energy when
demand is low the system has the potential to be financially viable to the user and reduce the
CO2 emissions produced from generating energy for DSH and DHW.
8.4 Conclusions from chapter 7 - Large scale testing of TCES
materials
Chapter 7 presents a designed and built large scale TCES modular reactor. This reactor
was designed to allow future experimental work to be conducted using a flexible modular
reactor. The future experimental work conducted using this reactor will help provide an
understanding of how to efficiently charge a modular open TCES reactor.
This reactor has been designed, built and described to give future researchers the
opportunity to use a novel large scale TCES test rig.
199
9 Recommendations for future work
Some of the novel TCES materials developed, throughout this research project, have
characteristics (i.e. specific energy density) which should make them a feasible choice to be
integrated into a system with a STC to help decarbonise DSH and DHW. However, For
TCES + STC systems to be realised in a domestic environment more research is required.
The specific future work identified from each chapter is presented below. However, more
broad future work goals have been identified from this research, these future goals are as
follows;
1. The methodology used for creating energy dense TCES materials needs to be
economically scalable to be viable for mass manufacture. If TCES materials are to be
deployed on a large scale in a domestic environment the TCES materials need to be able
to be produced quickly and cost effectively on a large scale. For this to be realised
research into the manufacturing techniques and a techno-economical evaluation of the
cost per J (£/J) needs to be conducted. The methodology used to create the most energy
dense TCES materials may not be the most economical method for large scale production.
This research should identify which method and materials are most suited for mass
manufacture.
2. The TCES materials developed throughout this research project should be tested at a large
scale (40kg+) within a system using a STC for charging the TCES materials (a Vacuum
Flat Plate Collector (VFPC) would be the best choice). This system would provide
valuable data which could be used to develop the charging and discharging management
hardware and software of future TCES + STC systems. If successful this work would help
progress the large scale deployment of TCES + STC systems within the domestic
environment.
3. Once a TCES + STC system has been experimentally tested, developed and optimised the
next step should be integration into an occupied test household. This research would
highlight any engineering challenges associated with the integration of a TCES + STC
system into a household and also the challenges involved in designing management
controls for a heating system that is controlled by humans. This research would produce
valuable data which would further help the engineering development of a TCES + STC
system for domestic integration and also help the development of an effective and
intuitive TCES + STC system control interface suitable for human use.

200
4. Research into other potential different reactor designs for different applications should be
considered. It was decided for this research that an open packed bed reactor was the most
suitable choice for domestic implementation however; different reactor designs may be
more suited to different applications. For example, the use of the TCES materials
developed throughout this research project could be used for industrial applications to
store heat over a shorter amount of time. For this application the use of a fluidised bed
reactor to output higher power from the TCES materials may be the most suitable reactor
design. This research would help identify potential sectors where TCES materials could
be used to help reduce the CO2 emissions from that sector.
9.1 Identified future work from chapter 4
Further work is required to confirm if the rate of hydration improves with successive
dehydration hydration cycles of MgSO4 due to higher heating rates causing more cracking
within the MgSO4. This should be tested through DSC/TGA hydration and dehydration
testing.
To understand the impact the zeolite-Y has on the hydration of the composite materials
containing MgSO4 hydration and dehydration cycling experiments should be conducted
within a TGA/DSC with a humid flow.
To confirm the importance of the dehydration isothermal period length hydration tests
should be conducted on MgSO4.xH2O after different isothermal periods within a TGA/DSC
with a humid flow to quantify the hydration enthalpy.
9.2 Identified future work from chapter 5
More batches of the samples (Mix 1, Mix 5, Impreg 1, Impreg 5) should be synthesised
and tested to assess if the sample preparation method produces consistent composition pellets
with the same TCES properties.
Hydration and dehydration testing of the different samples (Mix 1, Mix 5, Impreg 1,
Impreg 5) would give an understanding of how the changing pore size and surface area
affects the speed of hydration and therefore power output. This should be tested through
DSC/TGA hydration and dehydration testing.
9.3 Identified future work from chapter 6
201
The ion exchanged 13x pellets should be tested at a larger scale (200g+) to assess their
scaling losses. Optimisation of the ion exchange process should be performed to increase the
ion exchange percentage within the 13x pellets to further increase the dehydration enthalpy.
Further work should also be conducted investigating the potential of using other ions for the
ion exchange process to increase the energy density of 13x pellets.
The pellet preparation method suffered significant scaling losses and work should be
conducted to reduce these losses and improve the energy density of the ZMK pellets. The
hydration heat from the ZMK pellets could potentially be increased by 46%.
The mechanical strength of the ZMK pellets should be assessed before and after repeated
dehydration and hydration cycles to quantify if any mechanical breakdown is apparent.
9.4 Identified future work from chapter 7
Further work should be conducted on the characteristics of the developed TCES materials
at larger scales and on the design of the TCES reactors to further verify the potential of the
developed TCES materials at a large scale. The 40kg modular reactor built throughout this
research project would be an ideal experimental test rig to conduct these larger scale tests as
well as investigations into the potential of modular TCES reactors.
202
10 Research
D Mahon, P Henshall, P C Eames, (2015), MgSO4 + Zeolite based composite thermo-
chemical energy stores integrated with vacuum flat plate solar thermal collectors for seasonal
thermal energy storage. Presented at: UKES2015 conference, Birmingham UK.
D. Mahon, G. Claudio, and P. Eames, “An experimental investigation to assess the potential
of using MgSO4 impregnation and Mg2+ ion exchange to enhance the performance of 13x
molecular sieves for interseasonal domestic thermochemical energy storage,” Energy
Convers. Manag., 2017.
D. Mahon, G. Claudio, and P. Eames, “How does MgSO4 impregnation and Mg2+ ion
exchange impact the energy storage characteristics of 13x molecular sieves for use in
domestic thermochemical energy storage?,” in SusTEM2017, 2017.
D. Mahon, G. Claudio, and P. C. Eames, “A study of novel high performance and energy
dense zeolite composite materials for domestic inter-seasonal thermochemical energy
storage,” Accepted to ICAE2018 for oral presentation and publication in Energy Procedia
D. Mahon, P. Henshall, G. Claudio, and P. Eames, “Feasibility study on MgSO4 + Zeolite
based composite thermo-chemical energy stores integrated with vacuum flat plate solar
thermal collectors for seasonal thermal energy storage,” Submitted to Solaris 2018 for oral
presentation and publication

203
11 References
[1] UK.GOVERNMENT. Estimates of heat use in the United Kingdom in 2012, 2013, p.
73–80.
[2] Department of Energy and Climate Change. UK progress towards GHG emissions
reduction targets Statistical release: Official Statistics 2015.
[3] Van den Bergh J, Botzen WJW. Monetary valuation of the social cost of CO 2
emissions: a critical survey. Ecol Econ 2015;114:33–46.
[4] Price R, Thornton S, Nelson S. The social cost of carbon and the showdow price of
carbon: what are they, and how to use them in ecomonic appraisal in the UK. 2008.
[5] Ice2sea.eu. London: A city under threat. Ice2Sea 2014.
http://www.ice2sea.eu/policy/case-study-london/.
[6] Topographic-map.com. Londong topographic map n.d. http://en-gb.topographic-
map.com/places/London-92172/.
[7] Defra. Climate Change Risk Assessment for the Floods and Coastal Erosion Sector.
2012.
[8] CarbonBreif. Q & A : The social cost of carbon. CarbonBreif 2017:1–33.
https://www.carbonbrief.org/qa-social-cost-carbon.
[9] Drijfhout S, Bathiany S, Beaulieu C, Brovkin V, Claussen M, Huntingford C, et al.
Catalogue of abrupt shifts in Intergovernmental Panel on Climate Change climate
models. Proc Natl Acad Sci 2015:201511451. doi:10.1073/pnas.1511451112.
[10] Collins M, Knutt R, Arblaster J, Dufresne J-L, Fichefet T, Friedlingstein P, et al.
Long-term climate change: projections, commitments, and irreversibility. Clim Chang
2013 Phys Sci Basis Contrib Work Gr I to Fifth Assess Rep Intergov Panel Clim
Chang 2013. doi:10.1017/CBO9781107415324.024.
[11] Stocker T, Dahe Q. The WGI contribution to the IPCC 5th Assessment Report. 2013.
[12] Lontzek T., Cai Y, Judd K., Lenton T. Stochastic integrated assessment of climate
tipping points indicates the need for strict climate policy. Nat Clim Chang 2015;5:441–
4. doi:10.1038/nclimate2570.
[13] Smith S, Braathen NA. Monetary Carbon Values in Policy Appraisal: An Overview of
Current Practice and Key Issues. OECD Environ Work Pap 2015.
204
[14] Sabihuddin S, Kiprakis A, Mueller M. A Numerical and Graphical Review of Energy
Storage Technologies. Energies 2014;8:172–216. doi:10.3390/en8010172.
[15] Eurostat Statistics Explained. Consumption of energy. Eurostat Stat Explain 2018.
https://ec.europa.eu/eurostat/statistics-explained/index.php/Consumption_of_energy.
[16] Eurostat. Energy consumption in households 2018.
https://ec.europa.eu/eurostat/statistics-
explained/index.php/Energy_consumption_in_households.
[17] UK.GOVERNMENT. Live tables on dwelling stock 2017.
https://www.gov.uk/government/statistical-data-sets/live-tables-on-dwelling-stock-
including-vacants (accessed February 24, 2017).
[18] Mette B, Kerskes H, Drück H. Concepts of long-term thermochemical energy storage
for solar thermal applications – Selected examples. Energy Procedia 2012;30:321–30.
doi:10.1016/j.egypro.2012.11.038.
[19] Weber A, Herzog N, Bergmann T. Numerical simulations of gas-liquid flow in thermal
sorption processes. Comput Chem Eng 2016;84:171–9.
doi:10.1016/j.compchemeng.2015.09.003.
[20] Pal S, Hajj MR, Wong WP, Puri IK. Thermal energy storage in porous materials with
adsorption and desorption of moisture. Int J Heat Mass Transf 2014;69:285–92.
doi:10.1016/j.ijheatmasstransfer.2013.10.023.
[21] Kerskes H, Mette B, Bertsch F, Asenbeck S, Drück H. Chemical energy storage using
reversible solid/gas-reactions (CWS) - Results of the research project. Energy Procedia
2012;30:294–304. doi:10.1016/j.egypro.2012.11.035.
[22] Abedin AH, Rosen MA. A Critical Review of Thermochemical Energy Storage
Systems. Open Renew Energy J 2011;4:42–6. doi:10.2174/1876387101004010042.
[23] Hongois S, Kuznik F, Stevens P, Roux JJ. Development and characterisation of a new
MgSO4-zeolite composite for long-term thermal energy storage. Sol Energy Mater Sol
Cells 2011;95:1831–7. doi:10.1016/j.solmat.2011.01.050.
[24] Trausel F, de Jong A-J, Cuypers R. A Review on the Properties of Salt Hydrates for
Thermochemical Storage. Energy Procedia 2014;48:447–52.
doi:10.1016/j.egypro.2014.02.053.
[25] Opel O, Rammelburg H., Gerard M, Ruck W. THERMOCHEMICAL STORAGE
205
MATERIALS RESEARCH - TGA / DSC-HYDRATION STUDIES. 2006.
[26] Balasubramanian G, Ghommem M, Hajj MR, Wong WP, Tomlin J a., Puri IK.
Modeling of thermochemical energy storage by salt hydrates. Int J Heat Mass Transf
2010;53:5700–6. doi:10.1016/j.ijheatmasstransfer.2010.08.012.
[27] Quinnell J a., Davidson JH. Mass transfer during sensible charging of a hybrid
absorption/sensible storage tank. Energy Procedia 2012;30:353–61.
doi:10.1016/j.egypro.2012.11.042.
[28] van Essen VM, Zondag HA, Gores JC, Bleijendaal LPJ, Bakker M, Schuitema R, et al.
Characterization of MgSO4 Hydrate for Thermochemical Seasonal Heat Storage. J Sol
Energy Eng 2009;131. doi:10.1115/1.4000275.
[29] N’Tsoukpoe KE, Liu H, Le Pierrès N, Luo L. A review on long-term sorption solar
energy storage. Renew Sustain Energy Rev 2009;13:2385–96.
doi:10.1016/j.rser.2009.05.008.
[30] Maciąg K, Olszowka M, Klein A, editors. Biotechnology Progress – The Polish
students ’ scientific interests. Cracow: Academic Society of Biotechnology Students;
2014.
[31] Lin W. Clean Chemical Energy and Sustainability Module n.d.
[32] Yu N, Wang RZ, Wang LW. Sorption thermal storage for solar energy. Prog Energy
Combust Sci 2013;39:489–514. doi:10.1016/j.pecs.2013.05.004.
[33] Robert L, Burwell J. Manual of symbol and terminology for physicochemical
quantities and units - appendix 2. Pure Appl Chem 1976;46:71–90.
[34] Wang LW, Wang RZ, Oliveira RG. A review on adsorption working pairs for
refrigeration. Renew Sustain Energy Rev 2009;13:518–34.
doi:10.1016/j.rser.2007.12.002.
[35] Aydin D, Casey SP, Riffat S. The latest advancements on thermochemical heat storage
systems. Renew Sustain Energy Rev 2015;41:356–67.
[36] Casey SP, Elvins J, Riffat S, Robinson A. Salt impregnated desiccant matrices for
‘open’ thermochemical energy storage—Selection, synthesis and characterisation of
candidate materials. Energy Build 2014;84:412–25.
doi:10.1016/j.enbuild.2014.08.028.
[37] Ding Y, Riffat SB. Thermochemical energy storage technologies for building
206
applications: a state-of-the-art review. Int J Low-Carbon Technol 2012;8:106–16.
doi:10.1093/ijlct/cts004.
[38] Xu J, Wang RZ, Li Y. A review of available technologies for seasonal thermal energy
storage. Sol Energy 2014;103:610–38. doi:10.1016/j.solener.2013.06.006.
[39] Aristov YI. New family of solid sorbents for adsorptive cooling: Material scientist
approach. J Eng Thermophys 2007;16:63–72. doi:10.1134/S1810232807020026.
[40] Cuypers R, Maraz N, Eversdijk J, Finck C, Henquet E, Oversloot H, et al.
Development of a Seasonal Thermochemical Storage System. Energy Procedia
2012;30:207–14. doi:10.1016/j.egypro.2012.11.025.
[41] Ferchaud J, Zondag A, Rubino A, de Boer R. Seasonal Sorption Heat Storage –
Research On Thermochemical Materials And Storage Performance. 2012.
[42] Wu H, Wang S, Zhu D. Effects of impregnating variables on dynamic sorption
characteristics and storage properties of composite sorbent for solar heat storage. Sol
Energy 2007;81:864–71. doi:10.1016/j.solener.2006.11.013.
[43] Jänchen J, Herzog TH, Gleichmann K, Unger B, Brandt A, Fischer G, et al.
Performance of an open thermal adsorption storage system with Linde type A zeolites:
Beads versus honeycombs. Microporous Mesoporous Mater 2015;207:179–84.
doi:10.1016/j.micromeso.2015.01.018.
[44] Ferchaud C, Zondag H, Veldhuis J, Boer R De. Study of the reversible water vapour
sorption process of MgSO4 .7H2O and MgCl2.6H2O under the conditions of seasonal
solar heat storage. J Phys Conf Ser 2012;395. doi:10.1088/1742-6596/395/1/012069.
[45] N’Tsoukpoe KE, Schmidt T, Rammelberg HU, Watts BA, Ruck WKL. A systematic
multi-step screening of numerous salt hydrates for low temperature thermochemical
energy storage. Appl Energy 2014;124:1–16. doi:10.1016/j.apenergy.2014.02.053.
[46] Linnow K, Niermann M, Bonatz D, Posern K, Steiger M. Experimental Studies of the
Mechanism and Kinetics of Hydration Reactions. Energy Procedia 2014;48:394–404.
doi:10.1016/j.egypro.2014.02.046.
[47] Bales C. Thermal Properties of Materials for Thermo-chemical Storage of Solar Heat.
2005.
[48] Whiting G, Grondin D, Bennici S, Auroux A. Heats of water sorption studies on
zeolite-MgSO4 composites as potential thermochemical heat storage materials. Sol
207
Energy Mater Sol Cells 2013;112:112–9. doi:10.1016/j.solmat.2013.01.020.
[49] Posern K, Kaps C. Calorimetric studies of thermochemical heat storage materials
based on mixtures of MgSO4 and MgCl2. Thermochim Acta 2010;502:73–6.
doi:10.1016/j.tca.2010.02.009.
[50] van Essen VM, Gores JC, Bleijendaal LPJ, Zondag HA, Schuitema R, van Helden
WGJ. Characterization of salt hydrates for compact seasonal thermochemical storage.
2009.
[51] Dellero T, Touzain P. A chemical heat pump using carbon ® bers as additive . Part II :
study of constraint parameters 1999;19:1001–11.
[52] Ferchaud C, Zondag H, Boer R De, Rindt C. Characterization of the sorption process
in thermochemical materials for seasonal solar heat storage application. Innostock
2012 12th Int. Conf. Energy Storage, 2012, p. 1–10.
[53] Zhang H, Iype E, Nedea S V., Rindt CCM. Molecular dynamics study on thermal
dehydration process of epsomite (MgSO 4 ·7H 2 O). Mol Simul 2013:1–10.
doi:10.1080/08927022.2013.854891.
[54] Bertsch F, Mette B, Asenbeck S, Kerskes H. Low temperature chemical heat storage –
an investigation of hydration reactions. Effstock 2009, 2010, p. 1–8.
[55] Ferchaud CJ, Scherpenborg R a. a., Zondag H a., de Boer R. Thermochemical
Seasonal Solar Heat Storage in Salt Hydrates for Residential Applications – Influence
of the Water Vapor Pressure on the Desorption Kinetics of MgSO4.7H2O. Energy
Procedia 2014;57:2436–40. doi:10.1016/j.egypro.2014.10.252.
[56] L’vov, Boris V. Chapter 7 - The Topley-smith effect. Therm. Decompos. solids melts,
2007, p. 99–109.
[57] Rammelberg HU, Schmidt T, Ruck W. Hydration and dehydration of salt hydrates and
hydroxides for thermal energy storage - kinetics and energy release. Energy Procedia
2012;30:362–9. doi:10.1016/j.egypro.2012.11.043.
[58] N’Tsoukpoe KE, Restuccia G, Schmidt T, Py X. The size of sorbents in low pressure
sorption or thermochemical energy storage processes. Energy 2014.
doi:10.1016/j.energy.2014.10.013.
[59] Vaniman DT, Bish DL, Chipera SJ, Fialips CI, Carey JW, Feldman WC. Magnesium
sulphate salts and the history of water on Mars. Nature 2004;431:663–5.

208
doi:10.1038/nature02973.
[60] Cindrella L, Dyer A. Ion-exchanged and salt hydrates-encapsulated zeolites for solar
refrigeration. Sol Energy Mater Sol Cells 2009;93:161–6.
doi:10.1016/j.solmat.2008.09.057.
[61] Janchen J, Brosicke W, Ackermann D, Stach H. Studies of the water adsorption on
Zeolites and modified mesoporous materials for seasonal storage of solar heat. Sol
Energy 2004;76:339–44. doi:10.1016/j.solener.2003.07.036.
[62] Jänchen J, Ackermann D, Weiler E, Stach H, Brösicke W. Calorimetric investigation
on zeolites, AlPO4’s and CaCl2 impregnated attapulgite for thermochemical storage of
heat. Thermochim Acta 2005;434:37–41. doi:10.1016/j.tca.2005.01.009.
[63] Jänchen J, Stach H. Adsorption properties of porous materials for solar thermal energy
storage and heat pump applications. Energy Procedia 2012;30:289–93.
doi:10.1016/j.egypro.2012.11.034.
[64] Casey SP, Aydin D, Riffat S, Elvins J. Salt impregnated desiccant matrices for ‘open’
thermochemical energy storage—Hygrothermal cyclic behaviour and energetic
analysis by physical experimentation. Energy Build 2015;92:128–39.
doi:10.1016/j.enbuild.2015.01.048.
[65] Bekkum HV, Flanigen E. Introduction to zeolite science and practice. 2nd ed. Elsevier;
2001.
[66] Zheng Y, Li X, Dutta PK. Exploitation of unique properties of zeolites in the
development of gas sensors. Sensors 2012;12:5170–94. doi:10.3390/s120405170.
[67] Li X, Narayanan S, Michaelis VK, Ong T-C, Keeler EG, Kim H, et al. Zeolite Y
adsorbents with high vapor uptake capacity and robust cycling stability for potential
applications in advanced adsorption heat pumps. Microporous Mesoporous Mater
2015;201:151–9. doi:10.1016/j.micromeso.2014.09.012.
[68] Weitkamp J. Zeolites and catalysis. Solid State Ionics 2000;131:175–88.
doi:10.1016/S0167-2738(00)00632-9.
[69] Inglezakis VJ. The concept of “capacity” in zeolite ion-exchange systems. J Colloid
Interface Sci 2005;281:68–79. doi:10.1016/j.jcis.2004.08.082.
[70] Schaller C. Network Solids and Related Materials 2017.
[71] Padin J, Munson CL, Yang RT. Method for selective adsorption of dienes, 2001.

209
[72] Rios R. CA, Oviedo V. JA, Henao M. JA, Macias L. MA. A NaY zeolite synthesized
from Colombian industrial coal by-products: Potential catalytic applications. Catal
Today 2012;190:61–7. doi:10.1016/j.cattod.2012.02.025.
[73] Ríos C a, Williams CD, Castellanos OM. Crystallization of low silica Na-A and Na-X
zeolites from transformation of kaolin and obsidian by alkaline fusion. Ing y Compet
2012;14:125–37.
[74] de Boer R, Smeding SF, Zondag HA, Krol G. Development of a prototype system for
seasonal solar heat storage using an open sorption process. Eurotherm Semin. #99,
2014, p. 1–9.
[75] Pino L, Aristov Y, Cacciola G, Restuccia G. Composite Materials Based on Zeolite 4A
for Adsorption Heat Pumps. Adsorption 1996;3:33–40.
[76] Lass-Seyoum A, Blicker M, Borozdenko D, Friedrich T, Langhof T. Transfer of
laboratory results on closed sorption thermo-chemical energy storage to a large-scale
technical system. Energy Procedia 2012;30:310–20.
doi:10.1016/j.egypro.2012.11.037.
[77] Janchen J, Schumann K, Thrun E, Brandt A, Unger B, Hellwig U. Preparation,
hydrothermal stability and thermal adsorption storage properties of binderless zeolite
beads. Int J Low-Carbon Technol 2012;00:1–5. doi:10.1093/ijlct/cts037.
[78] Johannes K, Kuznik F, Hubert J-L, Durier F, Obrecht C. Design and characterisation
of a high powered energy dense zeolite thermal energy storage system for buildings.
Appl Energy 2015;159:80–6. doi:10.1016/j.apenergy.2015.08.109.
[79] Zondag HA, Essen VM Van, Bleijendaal LPJ, Kikkert BWJ, Bakker M. Application of
MgCl 2 · 6H 2 O for thermochemical seasonal solar heat storage. 5th Int. Renew.
Energy Storage Conf. IRES 2010, 2010, p. 22–4.
[80] Finck C, Henquet E, van Soest C, Oversloot H, de Jong A-J, Cuypers R, et al.
Experimental Results of a 3 kWh Thermochemical Heat Storage Module for Space
Heating Application. Energy Procedia 2014;48:320–6.
doi:10.1016/j.egypro.2014.02.037.
[81] Jabbari-Hichri A, Bennici S, Auroux A. Enhancing the heat storage density of silica–
alumina by addition of hygroscopic salts (CaCl2, Ba(OH)2, and LiNO3). Sol Energy
Mater Sol Cells 2015;140:351–60. doi:10.1016/j.solmat.2015.04.032.
210
[82] Gordeeva LG, Aristov YI. Composites “salt inside porous matrix” for adsorption heat
transformation: a current state-of-the-art and new trends. Int J Low-Carbon Technol
2012:1–15. doi:10.1093/ijlct/cts050.
[83] Fakin T, Ristić A, Horvat A, Kaučič V. WATER ADSORPTION STUDY ON THE
ZEOLITE LTA GRANULES. 5th Serbian-Croatian-Slovenian Symp. Zeolites, 2013,
p. 56–9.
[84] Allouhi A, Kousksou T, Jamil A, Rha T El, Mourad Y, Zeraouli Y. Optimal working
pairs for solar adsorption cooling applications 2014:1–13.
doi:10.1016/j.energy.2014.11.010.
[85] Baowan D, Thamwattana N. Modelling adsorption of a water molecule into various
pore structures of silica gel. J Math Chem 2011;49:2291–307. doi:10.1007/s10910-
011-9887-3.
[86] Zondag HA, Essen VM Van, Schuitema R, Kalbasenka A, Bakker M, Bleijendaal LPJ,
et al. ENGINEERING ASSESSMENT OF REACTOR DESIGNS FOR
THERMOCHEMICAL STORAGE OF SOLAR HEAT. 2009.
[87] Bobonich FM, Forbek G, Voloshina YG. RELATIONSHIP BETWEEN
HYDRATION ENERGY OF ZEOLITES AND CATION DISTRIBUTION IN THEIR
CRYSTALS. Theor Exp Chem 1993;29:120–3.
[88] Kirov G, Filizova L. Cationic hydration impact on zeolite formation and properties: А
review and discussion. Geochemistry, Mineral Petrol 2012;49:65–82.
[89] Tsutsumi K, Mizoe K. Heats of Adsorption of Water on Hydrophobic Zeolites.
Colloids and Surfaces 1989;37:29–38.
[90] Da-ming S. The effect of ion exchange on adsorption properties of a 13x molecular
sieve. Vacuum 1991;42:845–8.
[91] Benaliouche F, Hidous N, Guerza M, Zouad Y, Boucheffa Y. Microporous and
Mesoporous Materials Characterization and water adsorption properties of Ag- and
Zn-exchanged A zeolites. Microporous Mesoporous Mater 2014.
doi:http://dx.doi.org/10.1016/j.micromeso.2014.10.039.
[92] Stach H, Mugele J, Jänchen J, Weiler E. Influence of cycle temperatures on the
thermochemical heat storage densities in the systems water/microporous and
water/mesoporous adsorbents. Adsorption 2005;11:393–404.

211
[93] Mizota T, Matsui K, Kasai T, Nakayama N. Hydration enthalpies of synthetic Na-A,
cation-exchanged-A and some natural zeolites for evaluating as heat exchange
absorbents. Thermochim Acta 1995;266:331–41. doi:10.1016/0040-6031(95)02442-5.
[94] Petrova N, Mizota T, Fujiwara K. Hydration heats of zeolites for evaluation of heat
exchangers. J Therm Anal Calorim 2001;64:157–66. doi:10.1023/A:1011537029569.
[95] RSC: Advancing the Chemical Sciences : Hydration Enthalpies of Selected Ions n.d.
[96] Dorai F, Rolland M, Wachs a., Marcoux M, Climent E. Packing fixed bed reactors
with cylinders: Influence of particle length distribution. Procedia Eng 2012;42:1335–
45. doi:10.1016/j.proeng.2012.07.525.
[97] Haden WL. Attapulgite: properties and uses. Proc. 10th Conf. Clays Clay Miner.,
1963, p. 284–90.
[98] Aidoun Z, Ternan M. Salt impregnated carbon fibres as the reactive medium in a
chemical heat pump : the NH 3 – CoCl 2 system. Appl Therm Eng 2002;22:1163–73.
[99] Druske M, Fopah-lele A, Korhammer K, Rammelberg HU, Wegscheider N, Ruck W,
et al. Developed materials for thermal energy storage : synthesis and characterization.
Energy Procedia 2014.
[100] Dellero T, Sarmeo D, Touzain P. A chemical heat pump using carbon ® bers as
additive . Part I : enhancement of thermal conduction 1999;19.
[101] Pandey P, Lobo NF, Kumar P. Optimization of Disc Parameters Producing More
Suitable Size Range of Green Pellets 2012;1:48–59. doi:10.5923/j.ijmee.20120104.02.
[102] Gu A. Utilization of fly ash by pelletization process ; theory , application areas and
research results 2000;30:59–77.
[103] Liu H, Nagano K, Sugiyama D, Togawa J, Nakamura M. Honeycomb filters made
from mesoporous composite material for an open sorption thermal energy storage
system to store low-temperature industrial waste heat. Int J Heat Mass Transf
2013;65:471–80. doi:10.1016/j.ijheatmasstransfer.2013.06.021.
[104] Liu H, Nagano K. Numerical simulation of an open sorption thermal energy storage
system using composite sorbents built into a honeycomb structure. Int J Heat Mass
Transf 2014;78:648–61. doi:10.1016/j.ijheatmasstransfer.2014.07.034.
[105] Liu H, Nagano K, Togawa J. A composite material made of mesoporous siliceous
shale impregnated with lithium chloride for an open sorption thermal energy storage

212
system. Sol Energy 2015;111:186–200. doi:10.1016/j.solener.2014.10.044.
[106] Zondag H, Essen M Van, He Z, Schuitema R, Helden W Van.
CHARACTERISATION OF MgSO 4 FOR THERMOCHEMICAL STORAGE 2007.
[107] Subramanian R. Flow through Packed Beds and Fluidized Beds. 2004.
[108] Rovero G, Curti M, Cavaglià G. Optimization of Spouted Bed Scale-Up by Square-
Based Multiple Unit Design. Adv Chem Eng 2012. doi:10.5772/33395.
[109] Geldart D. Types of gas fluidization. Powder Technol 1973;7:285–92.
doi:10.1016/0032-5910(73)80037-3.
[110] Abedin AH, Rosen MA. Energy and Exergy Analyses of an Open Thermochemical
Energy Storage System : Methodology and Illustrative Application 2012:41–8.
[111] Mette B, Kerskes H. PROCESS AND REACTOR DESIGN FOR THERMO-
CHEMICAL ENERGY STORES. ISES Sol. World Congr., Kassel: 2011, p. 1–12.
[112] de Jong A-J, Trausel F, Finck C, van Vliet L, Cuypers R. Thermochemical Heat
Storage – System Design Issues. Energy Procedia 2014;48:309–19.
doi:10.1016/j.egypro.2014.02.036.
[113] Michel B, Mazet N, Neveu P. Experimental investigation of an innovative
thermochemical process operating with a hydrate salt and moist air for thermal storage
of solar energy: Global performance. Appl Energy 2014;129:177–86.
doi:10.1016/j.apenergy.2014.04.073.
[114] Zettl B, Englmair G, Steinmaurer G. Development of a revolving drum reactor for
open-sorption heat storage processes. Appl Therm Eng 2014;70:42–9.
doi:10.1016/j.applthermaleng.2014.04.069.
[115] TA Instruments Discovery DSC 2011.
[116] PerkinElmer. Thermogravimetric Analysis ( TGA ) A Beginner ’ s Guide. PerkinElmer
2015. http://www.perkinelmer.co.uk/CMSResources/Images/44-
74556GDE_TGABeginnersGuide.pdf (accessed February 26, 2015).
[117] Genius nitrogen generator 2016.
[118] Verdonck E. Strategies for Better DSC Data 2016.
[119] Henshall P, Eames P, Arya F, Hyde T, Moss R, Shire S. Constant temperature induced
stresses in evacuated enclosures for high performance flat plate solar thermal

213
collectors. Sol Energy 2016;127:250–61.
[120] MKS. MKS Cirrus 2 Data Sheet 2011.
[121] Ta instruments TGA 2010:2500.
[122] TA Instruments. TA Instruments Discovery TGA n.d.
http://www.tainstruments.com/the-powerful-discovery-tga/ (accessed November 14,
2017).
[123] Texus U of. Lab 7 : Residual Gas Analyzers 2002:1–15.
[124] Zondag HA, Essen VM Van, Bakker M. Application of MgCl 2 · 6H 2 O for
thermochemical seasonal solar heat storage. IRES 2010, 2010, p. 22–4.
[125] Ruiz-Agudo E, Martín-Ramos JD, Rodriguez-Navarro C. Mechanism and kinetics of
dehydration of epsomite crystals formed in the presence of organic additives. J Phys
Chem B 2007;111:41–52. doi:10.1021/jp064460b.
[126] Yu N, Wang RZ, Lu ZS, Wang LW. Study on consolidated composite sorbents
impregnated with LiCl for thermal energy storage. Int J Heat Mass Transf
2015;84:660–70. doi:10.1016/j.ijheatmasstransfer.2015.01.065.
[127] Heath J. Energy Dispersive Spectroscopy. Essent Knowl Briefings 2015;Second
Edi:32. doi:10.1007/978-1-4615-4919-2_12.
[128] University of California Riverside. Introduction to Energy Dispersive X-ray
Spectrometry (EDS). Cent Facil Adv Microsc Microanal Manuals 2011;2013:1–12.
[129] Alothman Z a. A review: Fundamental aspects of silicate mesoporous materials.
Materials (Basel) 2012;5:2874–902. doi:10.3390/ma5122874.
[130] Jänchen J, Ackermann D, Weiler E, Stach H, Brösicke W. Calorimetric investigation
on zeolites, AlPO4’s and CaCl 2 impregnated attapulgite for thermochemical storage
of heat. Thermochim Acta 2005;434:37–41. doi:10.1016/j.tca.2005.01.009.
[131] Linnow K, Niermann M, Kaps C, Steiger M, Posern K, Talreja T. Calorimetric
Investigation of Magnesium Sulfate Hydration in Porous Glasses. Proc. EuroSun 2014
Conf., 2015, p. 1–7. doi:10.18086/eurosun.2014.10.15.
Copyright © 2022 FDOKUMEN