
Methylphenidate administration determines enduring changes in neuroglial network in rats
Upload
independentCategory
view
5download
0
Nucleic Acids Research, 2014 1doi: 10.1093/nar/gku701
An intensity ratio of interlocking loops determinescircadian period lengthJie Yan1,2,†, Guangsen Shi2,†, Zhihui Zhang2,†, Xi Wu2, Zhiwei Liu2, Lijuan Xing2,Zhipeng Qu2, Zhen Dong2, Ling Yang1,3,* and Ying Xu1,2,4,*
1Center for Systems Biology, Soochow University, Suzhou 215006, China, 2MOE Key Laboratory of Model Animal forDisease Study, Model Animal Research Center, Medical School of Nanjing University, Nanjing 210061, China,3School of Mathematical Sciences, Soochow University, Suzhou 215006, China and 4Collaborative Innovation Centerfor Genetics and Development, Fudan University, Shanghai 200433, China
Received March 11, 2014; Revised July 20, 2014; Accepted July 21, 2014
ABSTRACT
Circadian clocks allow organisms to orchestrate thedaily rhythms in physiology and behaviors, and dis-ruption of circadian rhythmicity can profoundly affectfitness. The mammalian circadian oscillator consistsof a negative primary feedback loop and is asso-ciated with some ‘auxiliary’ loops. This raises thequestions of how these interlocking loops coordi-nate to regulate the period and maintain its robust-ness. Here, we focused on the REV-ERB�/Cry1 aux-iliary loop, consisting of Rev-Erb�/ROR-binding el-ements (RORE) mediated Cry1 transcription, coor-dinates with the negative primary feedback loop tomodulate the mammalian circadian period. The sili-con simulation revealed an unexpected rule: the in-tensity ratio of the primary loop to the auxiliary loopis inversely related to the period length, even whenpost-translational feedback is fixed. Then we mea-sured the mRNA levels from two loops in 10-mutantmice and observed the similar monotonic relation-ship. Additionally, our simulation and the experimen-tal results in human osteosarcoma cells suggest thata coupling effect between the numerator and denom-inator of this intensity ratio ensures the robustnessof circadian period and, therefore, provides an effi-cient means of correcting circadian disorders. Thisratio rule highlights the contribution of the transcrip-tional architecture to the period dynamics and mightbe helpful in the construction of synthetic oscillators.
INTRODUCTION
Circadian clocks are self-sustained oscillators that regulatethe temporal organization of physiology, metabolism and
behavior to adapt to the 24-h solar day. In many organ-isms, mutants conferring altered circadian period are as-sociated with physiological disorders and decreased lifes-pan (1–3). The central mechanism of the mammalian cir-cadian clock is a negative primary feedback loop that in-volves the transcriptional activator genes Clock and Bmal1,and three Period (Per1–Per3) and two Cryptochrome (Cry1and Cry2) repressor genes (4). CLOCK and BMAL1 are ba-sic helix-loop-helix periodic acid-Schiff-domain-containingtranscription factors that activate Per and Cry gene tran-scription (5–9). The resulting PER and CRY proteins ac-cumulate in the cytosol, and following various modifica-tions, are then translocated into the nucleus in which theyinhibit CLOCK/BMAL1-mediated transcription, therebyestablishing a negative feedback loop (10). Thus, the de-layed nuclear accumulation of PERs and CRYs is thoughtto be the primary factor that determines the period length.
Various auxiliary loops (ALs) also participate in the reg-ulation of mammalian circadian clocks. Previous studiesvalidated the existence of the REV-ERB/ROR-binding el-ement (RORE) in the first intron of Cry1 (11,12). Thus,Cry1 expression is positively autoregulated via the inhibi-tion of its repressor Rev-erbα, which forms a positive AL(RORE loop). Some nuclear receptors, exhibiting circadian-like patterns of expression (13), may contribute to the cir-cadian clock via other ALs. These ALs provide multiple en-try points to modulate the circadian clock to adapt to en-vironmental variations which may affect the oscillation pe-riod. However, when deprived of a rhythmic input, the free-running period can usually maintain the period close to 24 hover a wide range of situations, including environmental di-versity and gene mutations. Therefore, two important ques-tions arise: (i) how do these ALs coordinate with the pri-mary loop to modulate the period length? (ii) How does thesystem with more than one loop maintain the robustness ofthe free-running period?
*To whom correspondence should be addressed. Tel: +86 512 65883781; Fax: +86 512 65884028; Email: [email protected] may also be addressed to Ling Yang. Tel: +86 139 13152842; Fax: +86 512 65884028; Email: [email protected]†The authors wish it to be known that, in their opinion, the first three authors should be regarded as Joint First Authors.
C© The Author(s) 2014. Published by Oxford University Press on behalf of Nucleic Acids Research.This is an Open Access article distributed under the terms of the Creative Commons Attribution License (http://creativecommons.org/licenses/by/4.0/), whichpermits unrestricted reuse, distribution, and reproduction in any medium, provided the original work is properly cited.
Nucleic Acids Research Advance Access published August 13, 2014

2 Nucleic Acids Research, 2014
Mathematical modeling is a powerful tool to both inter-pret the circadian networks of various organisms (14–19)and to obtain a general understanding of how biological os-cillators function (20,21). Here, to address the above ques-tions, we used a combined mathematical-experimental ap-proach to explore how the positive RORE loop, which isa typical AL (RORE loop) in circadian systems, coordi-nates with the primary loop to modulate the period throughtranscriptional regulation. Previous models addressing therole of RORE loop have substantially contributed to sev-eral aspects of the circadian clock. Nevertheless, the mod-els developed here differ from other models in two ma-jor respects. First, we used a currently identified positiveloop through the Cry1, instead of widely used negative ALthrough Bmal1, to study the mechanism of period determi-nation. The negative AL through Bmal1 is usually thoughtto stabilize the oscillation of the circadian clock (16,22).Second, according to the recent experimental evidence (11),we used the addition rule to describe the co-regulation ofthe cis-elements. This addition rule can provide the accu-rate description of the amplitude contribution, which is notavailable under the traditional multiply rule (17,22–24). Theabove differences enabled our model to illustrate the roleof amplitudes in period dynamics and achieve reasonablyqualitative predictions.
MATERIALS AND METHODS
Mathematical models
Supplementary information provides detailed informationabout conceptual models, comprehensive models, the nu-merical simulations and theoretical analysis.
Generation of single- and double-mutant mice
ClockΔ19 (25) were originally obtained from the Takahashilaboratory at Northwestern University. Rev-erbα knockoutmice (26) were obtained from Ueli Schibler lab in Universityof Geneva. Per2 knockout mice (27) were obtained from theJackson laboratory. All other mutant mice were described inour previous works (28–30).
Animal care and behavioral analysis
All of the animals were backcrossed at least six generationsprior to the first pilot study to assure their C57BL/6J back-grounds. Measurements of the free running period were per-formed as previously described in (32). Mice were placed inindividual cages that were equipped with running wheels inlight-tight ventilation chambers with timer-controlled light-ing. Wheel running activities were monitored over a 12:12-hLD cycle for 7 days and followed in constant darkness (DD)for up to 4 weeks. Analysis of circadian parameters was per-formed using ClockLab, and the period was calculated from8 days to 21 days after constant darkness (Actimetrics Soft-ware).
All animal studies were carried out in an Associa-tion for Assessment and Accreditation of Laboratory An-imal Care (AAALAC International)-accredited SpecificPathogen Free animal facility, and all animal protocols wereapproved by the Animal Care and Use Committee of the
Model Animal Research Center, the host for the NationalResource Center for Mutant Mice in China, Nanjing Uni-versity.
Tissue collection, RNA isolation, mRNA quantitative poly-merase chain reaction analyses
Mice of the indicated genotypes were entrained to a 12–12-h light-dark cycle for at least 7 days before being trans-ferred to DD. Tissues were collected at 4-h intervals on thefirst day of DD at circadian times (CTs) 0, 4, 8, 12, 16, 20and 24, where CT12 corresponds with the onset of a sub-jective night. Each time point has an average three to fourmice for each genotype. RNA isolation and quantitative re-verse transcriptase-polymerase chain reaction (qRT-PCR)(including primers for mRNA profiling) were carried outessentially as previously described (30).
The amplitude of Per1 mRNA and Bmal1 mRNA
The amplitude of Per1 mRNA is the difference between thepeak and the trough of the Per1 expression profile. To com-pare the amplitudes of Per1 mRNA in different genotypes,the amplitude of Per1 mRNA in WT was normalized to 1,and the expression levels of other genotypes were plotted aspercentages of WT. This also was done for the amplitude ofBmal1. The formula was written as Amplitude = {mutantpeak/wild type (peak – trough)} – {mutant trough/wildtype (peak – trough)}.
Transfection and luminescence recording
U2OS-Luciferase reporter cells were cultured in Dul-becco’s modified Eagle’s medium containing 10% serumand penicillin–streptomycin in 35 mm plates. Expressionplasmids for Rev-erbα, Cry1 and Per2 genes were de-scribed previously (29). Lipofectamine 2000 (Invitrogen)and Genescort (Wisegen) were used for transfection, ac-cording to the manufacturer’s instructions. 60 hours post-transfection, we replaced this media with an HEPES-buffered medium supplemented with luciferin (1 �M)(Promega) and B-27 supplements (Invitrogen), and theplates were sealed with an optically clear film (AppliedBiosystems). Luminescence was recorded by LumiCycle.
We then used the LumiCycle circadian data analysis pro-gram (Actimetrics) to analyze the bioluminescence data.The data were first detrended by subtracting a baseline (24-h running average), and, subsequently, fit to a sine wave toobtain the period length of the oscillation.
RESULTS
Constructing a conceptual model of period dynamics
To gain a system-level understanding of transcriptional pe-riod regulation, we first refined the core circadian networkas a schematic model (Figure 1A and B) rather than spec-ifying individual genes. By comparing conditions with orwithout a positive AL, the conceptual model has indicatedthat an AL can markedly contribute to the mammalian cir-cadian period (see Sections 1.1 and 1.2 of the Supplemen-tary Information, and Supplementary Table S1). We were
Nucleic Acids Research, 2014 3
Ebox
0.0
0.2
0.4
0.6
0.8
1.0
0.0 0.2 0.4 0.6 0.8 1.0
0.0
0.2
0.4
0.6
0.8
1.0
R1
bind
ing
to P
LBS
Protein Peak
mRNA Peak
CR
Y1
bind
ing
to E
box
PLBS R1
R1
PLBS
R2
R2
ALBS
R1 mRNA R1 mRNA Cry1 mRNA
Post-transcrptional delay τP
τP
τT
R1
Auxiliary Loop
Protein Trough
mRNA Trough
R1
bind
ing
to P
LBS
R1
PLBS R1
A B
C D F
τP
τT
0.0
0.2
0.4
0.6
0.8
1.0
0.0 0.2 0.4 0.6 0.8 1.0 0.0 0.2 0.4 0.6 0.8 1.0
Cry1HDAC3
0 4 8 12 16 20 240.00.2
0.4
0.6
0.8
1.0
1.2
1.4
Time
Rel
ativ
e in
tens
ity
Cry1 mRNA
CT
E
mRNA Peak
Protein Trough
Protein PeakmRNA Trough
Protein Trough
Protein Peak
mRNA Trough
Negative Primary Loop
Negative Primary Loop
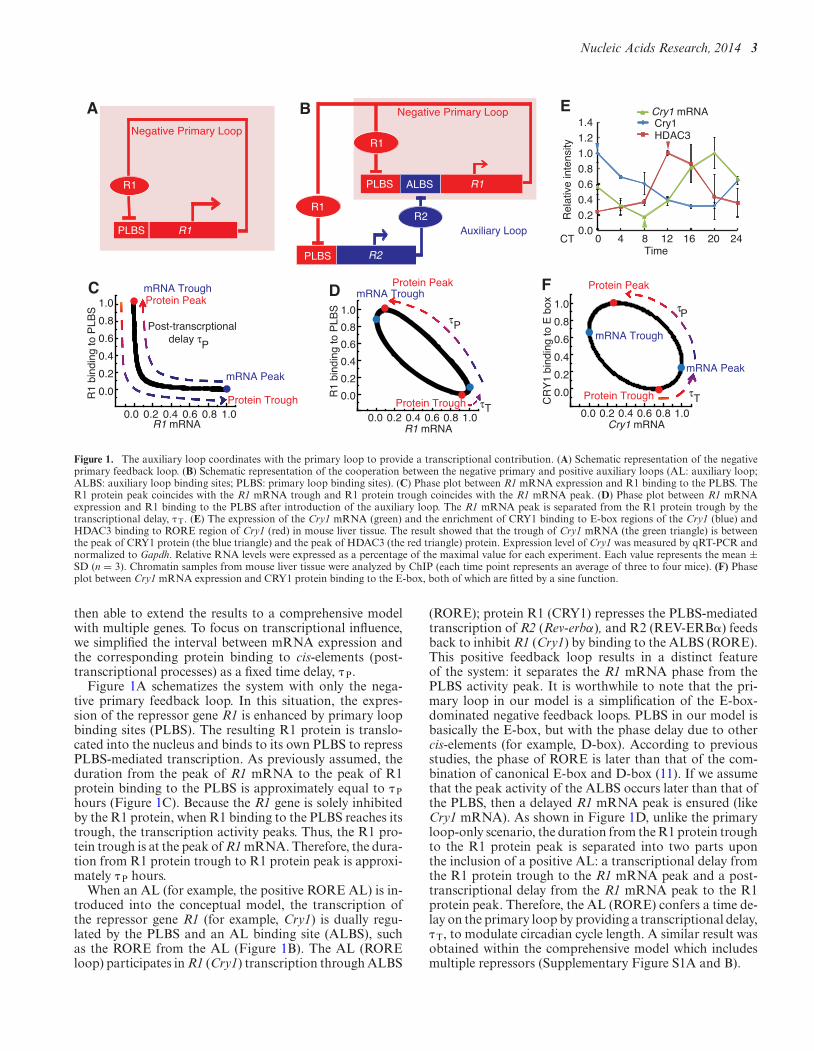
Figure 1. The auxiliary loop coordinates with the primary loop to provide a transcriptional contribution. (A) Schematic representation of the negativeprimary feedback loop. (B) Schematic representation of the cooperation between the negative primary and positive auxiliary loops (AL: auxiliary loop;ALBS: auxiliary loop binding sites; PLBS: primary loop binding sites). (C) Phase plot between R1 mRNA expression and R1 binding to the PLBS. TheR1 protein peak coincides with the R1 mRNA trough and R1 protein trough coincides with the R1 mRNA peak. (D) Phase plot between R1 mRNAexpression and R1 binding to the PLBS after introduction of the auxiliary loop. The R1 mRNA peak is separated from the R1 protein trough by thetranscriptional delay, � T. (E) The expression of the Cry1 mRNA (green) and the enrichment of CRY1 binding to E-box regions of the Cry1 (blue) andHDAC3 binding to RORE region of Cry1 (red) in mouse liver tissue. The result showed that the trough of Cry1 mRNA (the green triangle) is betweenthe peak of CRY1 protein (the blue triangle) and the peak of HDAC3 (the red triangle) protein. Expression level of Cry1 was measured by qRT-PCR andnormalized to Gapdh. Relative RNA levels were expressed as a percentage of the maximal value for each experiment. Each value represents the mean ±SD (n = 3). Chromatin samples from mouse liver tissue were analyzed by ChIP (each time point represents an average of three to four mice). (F) Phaseplot between Cry1 mRNA expression and CRY1 protein binding to the E-box, both of which are fitted by a sine function.
then able to extend the results to a comprehensive modelwith multiple genes. To focus on transcriptional influence,we simplified the interval between mRNA expression andthe corresponding protein binding to cis-elements (post-transcriptional processes) as a fixed time delay, � P.
Figure 1A schematizes the system with only the nega-tive primary feedback loop. In this situation, the expres-sion of the repressor gene R1 is enhanced by primary loopbinding sites (PLBS). The resulting R1 protein is translo-cated into the nucleus and binds to its own PLBS to repressPLBS-mediated transcription. As previously assumed, theduration from the peak of R1 mRNA to the peak of R1protein binding to the PLBS is approximately equal to � Phours (Figure 1C). Because the R1 gene is solely inhibitedby the R1 protein, when R1 binding to the PLBS reaches itstrough, the transcription activity peaks. Thus, the R1 pro-tein trough is at the peak of R1 mRNA. Therefore, the dura-tion from R1 protein trough to R1 protein peak is approxi-mately � P hours.
When an AL (for example, the positive RORE AL) is in-troduced into the conceptual model, the transcription ofthe repressor gene R1 (for example, Cry1) is dually regu-lated by the PLBS and an AL binding site (ALBS), suchas the RORE from the AL (Figure 1B). The AL (ROREloop) participates in R1 (Cry1) transcription through ALBS
(RORE); protein R1 (CRY1) represses the PLBS-mediatedtranscription of R2 (Rev-erbα), and R2 (REV-ERB�) feedsback to inhibit R1 (Cry1) by binding to the ALBS (RORE).This positive feedback loop results in a distinct featureof the system: it separates the R1 mRNA phase from thePLBS activity peak. It is worthwhile to note that the pri-mary loop in our model is a simplification of the E-box-dominated negative feedback loops. PLBS in our model isbasically the E-box, but with the phase delay due to othercis-elements (for example, D-box). According to previousstudies, the phase of RORE is later than that of the com-bination of canonical E-box and D-box (11). If we assumethat the peak activity of the ALBS occurs later than that ofthe PLBS, then a delayed R1 mRNA peak is ensured (likeCry1 mRNA). As shown in Figure 1D, unlike the primaryloop-only scenario, the duration from the R1 protein troughto the R1 protein peak is separated into two parts uponthe inclusion of a positive AL: a transcriptional delay fromthe R1 protein trough to the R1 mRNA peak and a post-transcriptional delay from the R1 mRNA peak to the R1protein peak. Therefore, the AL (RORE) confers a time de-lay on the primary loop by providing a transcriptional delay,� T, to modulate circadian cycle length. A similar result wasobtained within the comprehensive model which includesmultiple repressors (Supplementary Figure S1A and B).
4 Nucleic Acids Research, 2014
We experimentally explored the conceptual model to vi-sualize the contribution of the AL to the period length. Wemeasured the profiles of CRY1 binding to the E-box of theCry1 gene and histone deacetylase 3 (HDAC3) binding tothe RORE of Cry1 using chromatin immunoprecipitation(ChIP). HDAC3 has been shown to recruit (REV-ERB�)-containing complexes to the RORE and repress the tran-scription of Cry1 expression (31). Cry1 mRNA was mea-sured using qPCR in mouse liver tissues to characterize thefeatures of the separation of the repressor binding troughfrom the peak of R1 mRNA expression in the mammaliancircadian clock. The results indicated that the Cry1 mRNApeak falls between the troughs of CRY1 and HDAC3 (Fig-ure 1E). CRY1 and HDAC3, respectively, inhibit the ac-tivity of the E-box and RORE. Therefore, the troughs ofCRY1 and HDAC3 correspond to the peaks of E-box ac-tivity and RORE activity. Since the peak of Cry1 mRNA isbetween the peaks of E-box and RORE, it is reasonable tospeculate that this delay in Cry1 expression reflects the par-ticipation of circadian RORE behavior in the expression ofCry1. Therefore, the RORE-mediated transcriptional loopcontributes to the period length by regulating the time du-ration between the trough of CRY1 protein binding to theE-box and peak of Cry1 mRNA expression (which is sym-metric to the peak of CRY1 protein binding to the E-boxand the trough of Cry1 mRNA expression) (Figure 1F).
The theoretical analysis and experimental results supportthe hypothesis that the AL facilitates a phase change in re-pressor expression in the primary loop through which a timedelay of its self-inhibition can be regulated. This action thencontributes to the period.
The intensity ratio between the primary loop and the AL mod-ulates the cycle length
To explain how the interplay between the primary and ALsinfluences the circadian period, we used the conceptualmodel shown in Figure 1B to demonstrate the kinetics ofcircadian rhythms. Although this model is simple, it retainsthe basic architecture of multiple loops and gives rise to anovel property of period dynamics: the intensity ratio be-tween the primary and ALs is strongly associated with thetranscriptional delay, � T, and, in turn, contributes to the pe-riod length.
We first used a theoretical analysis to deduce the lengthof transcriptional delay. It turns out to be approximatelydetermined by the amplitude ratio of PLBS activity (de-noted as AmpPLBS, i.e. the intensity of the primary loop)to ALBS (RORE) activity (denoted as AmpALBS, i.e. the in-tensity of the AL), as follows: � T = f (AmpPLBS/AmpALBS),where f is a decreasing function (see Section 1.3 of the Sup-plementary Information). To intuitively link the intensitiesof the primary and ALs to the period length, we manipu-lated the PLBS and ALBS (RORE) activity in silicon. Therelationship between the period and the amplitudes of thebinding element activity is illustrated in Figure 2A. Thevertical axis indicates the period length (H), and the twohorizontal axes represent the oscillation amplitudes of thebinding element (PLBS and ALBS) activity. The surface ex-hibits a spiral staircase-like shape, in which the height ofthe surface (period length) increases as the rotation angle
increases, and any radial line approximates a contour lineon the surface (where all points on the line share a com-mon altitude). For example, the green vertical plane, whoseslope equals 4.2888, intersects with the surface at the hori-zontal green line (about 22.55 h). Similarly, the yellow andblue vertical planes, whose slopes are 1.3764 and 0.6682, in-tersect with the surface at the yellow horizontal line (about23.92 h) and the blue horizontal line (about 25.4 h), re-spectively. The schematic diagram in Figure 2B intuitivelyindicates the relationship between the period length andthe amplitude ratio: the rotation angle � is determined bycot (�) = AmpPLBS/AmpALBS, and the period length in-creases as the rotation angle increases. Figure 2C and Dillustrates that when AmpPLBS = 0.5, T varies from 21.94h to 26.11 h, whereas when AmpALBS = 0.2, T varies from22.53 h to 26.97 h. The following two concepts arise fromthis model. (i) The circadian period can be approximatedby AmpPLBS/AmpALBS under the assumption that the post-transcriptional delay is a constant. (ii) A single-activity am-plitude is not sufficient to regulate the period.
To investigate whether the ratio-regulating prediction stillholds within other possible biological oscillators, we per-formed the silicon simulations in a broader range of param-eter space. The results show that the ratio law still works ina wide range of period length (Supplementary Figure S2).It implies that the oscillator with this topological structureshould have a similar ratio-regulating pattern.
Because the analysis and simulation presented herein arebased on a minimalist model, we further extended our anal-ysis under more realistic conditions. We performed com-putational simulations in a comprehensive model involv-ing Bmal1, Per1, Cry1, Per2, Cry2 and Rev-erbα to verifythe ratio hypothesis (Supplementary Figure S3; see Sections2.1 and 2.2 of the Supplementary Information, Supplemen-tary Table S2). Also, our comprehensive model generatedautonomous circadian oscillations and reproduced the pe-riod length well under different conditions (SupplementaryTable S3). The comprehensive model places the expressionsof the genes approximately in-phase in WT case (Supple-mentary Table S4). Therefore, we believe that this validatedmodel can provide a qualitatively predictive tool for study-ing the properties of the circadian clock.
Similar to the conceptual model, the simulation re-sults indicated a clear negative relationship, i.e. the circa-dian period increases as the amplitude ratio of PLBS ac-tivity (denoted as AmpPLBS) to RORE activity (denotedas AmpRORE) decreases (Figure 3A). However, neitherAmpPLBS nor AmpRORE alone exhibits any clear monotonicrelationship to the period (Figure 3B and C). These resultssuggest that the participation of AL provides the possibilityto fine-tune the period of an oscillator.
Negative relationship between AmpPer1/AmpBmal1 and the pe-riod length
We then analyzed 10 strains of mutant mice to experimen-tally test the simulated ratio hypothesis. In this study, wefocus on how the positive RORE loop affects the periodlength through the repressor genes in the negative primaryfeedback loop. According to previous studies, the ROREcan delay the expression of Cry1, because the phase of

Nucleic Acids Research, 2014 5
A
AmpALBS
27
26
25
24
23
0.9 0.6 0.40.20.6
22
Amp PLBS
Per
iod
(H
)
0.3
AmpALBS
27
26
25
24
23
0.9 0.6 0.40.2 0.6
22
AmpP
erio
d
(H)
0.3
PLBS
C
DB
AmpPLBS
Am
pA
LBS
2726
25
24
23
22
T =
25.4
h
T = 23
.92
T = 22.55
θ
AmpPLBS
Am
p ALB
S
2726
25
24
23
22T = 26.97~22.53
T =
26.
11~
21.9
4
Figure 2. The intensity ratio between feedback loops regulates the period length. (A) This surface exhibits a spiral staircase-like shape in which the height(period length) increases as the rotation angle increases. The x-axis and the y-axis represent the amplitudes of PLBS activity and ALBS activity, respectively.Three vertical planes, which represent AmpPLBS / AmpALBS = 4.2888 (green), AmpPLBS / AmpALBS = 1.3764 (yellow) and AmpPLBS / AmpALBS = 0.6682(blue), intersect with the surface in three horizontal lines at periods of ∼22.55 h (green), 23.92 h (yellow) and 25.4 h (blue). (B) The color bar indicates theperiod variation in the PLBS–ALBS amplitude plane. The rotation angle � is determined by the amplitude ratio of PLBS activity to ALBS activity (cot(�) = AmpPLBS /AmpALBS). The period length increases as � increases. (C) Two vertical planes, which represent PLBS = 0.5 (blue) and ALBS = 0.2 (red),intersect with the period surface in two curves (black curve). These two curves exhibit large height variations (from 21.94 h to 26.11 h when PLBS = 0.5and from 22.53 h to 26.97 h when ALBS = 0.2). (D) The vertical arrow crosses over several color zones (from 21.94 h to 26.11 h), which indicate that afixed PLBS cannot determine the period length. Also, the horizontal arrow crosses over several color zones (from 22.53 h to 26.97 h), which indicate thata fixed ALBS cannot determine the period length.
RORE is later than that of the combination of canonicalE-box and D-box (11,12). Similar to their studies, we usedthe canonical E-box and D-box as a whole to stand forthe negative primary feedback loop (PLBS) in our simu-lation. Since Per1 is driven by both the canonical E-boxand D-box (32,33), the amplitude of Per1 mRNA is suitedto be the intensity indicator of the negative primary feed-back loop. We thus selected Per1 as a biomarker for the in-tensity of primary loop. The amplitude of Bmal1 mRNAwhich is driven by RORE activity can be used as the in-dicator to represent the intensity of the positive auxiliaryfeedback loop (AL). The oscillations of Per1 and Bmal1were approximately antiphase in wild-type liver tissue, andthe pattern alterations in each mutant mouse strain weresimilar to those from previous reports (Figure 3D). Theamplitudes (the difference between trough and peak val-ues) of Per1 (denoted as AmpPer1) and Bmal1 (denoted asAmpBmal1) were calculated for each mutant mouse strain,and their ratios correlated with the wheel-running period(Figure 3E), which is consistent with the model predictions(Figure 3A). This result demonstrates that there is a clearnegative relationship between AmpPer1/AmpBmal1 and the
period length. Furthermore, neither the amplitude of Per1nor Bmal1 mRNA alone exhibited any clear monotonic re-lationship to the periods (Figure 3F and G). In some casesuch as Maged1 knockout mice, there is a wide range of er-ror bars. One interpretation is that error bars stem from thefact that the amplitude that is the difference between themaximal expression level and minimal expression level hasthe double relative error, the ratio of the amplitudes furtherexpands the relative error and, in the end, overestimates thestrength of unreliability. Even though, these error bars donot disrupt our conclusions. As shown in Figure 3E–G, thepoints having large error bars are located in the short periodarea, where the period length does not have notable changein a wide range of amplitude ratios (from 1.5 to 3.75). Also,from the simulation results, the short period is not sensitiveto the intensity ratio.
These results confirm that the balance between the pri-mary loop and the AL (i.e. the RORE loop through Cry1)determines the period length. The only exception is the ra-tio observed in Cry1−/− mice. However, this trend was ex-pected because the removal of Cry1 destroys the AL ofREV-ERB�/Cry1. In this study, our prediction is based on

6 Nucleic Acids Research, 2014
Per
iod
Per
iod
PLBS RORE
Bmal1
WT -/-Fbxl3 Fbxl3 ;Rev-erbα-/- -/- Fbxl3 ;Cry1-/- -/- Rev-erbα-/-
Per2-/-MageD1-/-Clock 19Cry2-/-Cry1-/-
Amp /AmpPer1 Bmal1 Amp
Amp /AmpPLBS RORE Amp Amp
High Per2
00.20.40.60.81.01.2 WT
0 4 8 121620 240
0.20.40.60.81.01.2
-/-Fbxl3 Fbxl3 ;Rev-erbα-/- -/-
0
0.4
0.8
1.2
1.6
00.20.40.60.81.0 Fbxl3 ;Cry1-/- -/- Rev-erbα-/-
00.40.81.2
0.20.40.60.81.01.2 Cry1-/-
00.20.40.60.81.01.2 Cry2-/- MageD1-/-
00.20.40.60.81.01.2
00.20.40.60.81.0
1.21.4
Per2-/-
00.20.40.60.81.01.21.41.6 Clock 19
Per1 mRNA Bmal1 mRNA
Rel
ativ
e m
RN
A in
tens
ity 1.62.0
00.51.01.52.02.53.03.5 High Per2
0 4 8 121620 24 0 4 8 121620 24
00 4 8 121620 24 0 4 8 121620 24 0 4 8 121620 24
0 4 8 121620 24 0 4 8 121620 24
0 4 8 121620 24 0 4 8 121620 24
0 4 8 121620 24
C D
E F G
0.0 0.2 0.4 0.6 0.8
BA
22232425262728
0 2 4 6 8 10 1.0 0.0 0.2 0.4 0.6 0.8 1.0
AmpPer1
0.25 0.75 1.25 1.75 0 0.5 1 1.5 2 2.5 3 3.52223
24
25
26
27
28
0.25 1.25 2.25 3.25
1.6
2.4
Figure 3. Validation of the ratio hypothesis using a comprehensive model and experimental results. (A–C) Computational simulations in a comprehensivemathematical model. The periods are shown as a function of the amplitude ratio of PLBS activity to RORE activity (A), the amplitude of PLBS activity(B) and the amplitude of RORE activity (C). (D) The expression profiles of the Per1 (blue) and Bmal1 (red) clock genes in liver tissues from wild-type,Fbxl3−/−, Fbxl3−/−; Rev-erbα−/−, Fbxl3−/−; Cry1−/−, Rev-erbα −/−, Cry1−/−, Cry2−/−, Maged1−/−, Per2−/−, ClockΔ19 and high copy Per2 mice weredetermined using qRT-PCR and were normalized to Gapdh. We calculated the relative amplitude of Bmal1 or Per1 between liver tissues from the indicatedgenotypes and wild-type mice, and the expression levels were plotted as percentages of the WT amplitude in each paired experiment. Each value representsthe mean ± SD (n = 3). (E–G) Summary of the experimental studies. The free running periods are shown as a function of the amplitude ratio of Per1mRNA to Bmal1 mRNA (E), the amplitude of Per1 mRNA (F) and the amplitude of Bmal1 mRNA (G). The amplitude of Per1 mRNA or Bmal1 mRNAmeans the difference between the maximal expression level and the minimal expression level. Each genotype is represented by the indicated symbol. Theeach error bar indicates the standard deviation.
the interaction between the negative primary feedback loopand the positive RORE loop (REV-ERB�/Cry1 loop). InCry1−/− mice, this positive RORE loop (REV-ERB�/Cry1loop) vanishes due to the knockout of Cry1 gene. There-fore, the point which represents Cry1−/− mice is not locatedright on the decreasing curve. In fact, REV-ERB�/Cry1loop may not be the only positive RORE loop, and re-sults from systems biology studies have suggested that Per1,Per2 and Cry2 might also contain ROREs (34) and beable to form additional positive ALs with REV-ERB� (asthe structure of REV-ERB�/Cry1 loop). The role of theREV-ERB�/Cry1 loop in the period determination can becompensated by these ALs. Therefore, destroying the REV-ERB�/Cry1 AL will result in only partial deviation from,rather than complete disruption of the ratio rule.
Manipulating the circadian period in a predictable fashion
In the above cases, we did observe variations of the pe-riod due to the changes in the amplitude ratio. However,
the regulation of the ratio between the PLBS and ROREcan aid in ensuring period robustness because of a couplingeffect between loops. In the integrated loops, the activityof the PLBS and RORE are partially associated with eachother. This association indicates that the amplitude varia-tion of one binding element results in a responding changein the other elements. If a change occurs in the strength ofPLBS inhibition, the resultant amplitude variation for thePLBS can be completely transmitted to the RORE ampli-tude (Figure 4A); correspondingly, the change in the ampli-tude of the RORE, which results from the variation of theinhibition to the RORE, can be partially transmitted to thePLBS amplitude (Figure 4B). Therefore, the ratio modula-tion is a robust feature, implying that the oscillation periodcannot be dramatically altered through one binding elementalone. Subsequently, we observed the association betweenthe period and the strengths of inhibition to binding ele-ment activity (Figure 4C). In the figure, the vertical axis rep-resents the period length, and the two horizontal axes rep-

Nucleic Acids Research, 2014 7
012
34
1.52.5
3.54.5
0.5
222324252627
Relative inhibitionstrength to RORE
Relat
ive in
hibi
tion
stre
ngth
to P
LBS
C
Period
0.20.40.60.8
11.2
0 0.4 0.8 1.20
WT
0.8 1.210.8
1.2
1WT
PLBSWTAmp /AmpPLBS
RO
RE
WT
Am
p
/Am
pR
OR
EA B
PLB
SW
TA
mp
/A
mp P
LBS
ROREWTAmp /AmpRORE
Figure 4. Period robustness through a coupling effect. (A) The amplitude of PLBS activity (x-axis) is transmitted to the amplitude of RORE activity (y-axis) as the strength of inhibition to the PLBS is manipulated. The blue point represents the WT case, and the red line indicates 1:1 complete transmission.AmpPLBS and AmpRORE represent the resultant amplitudes of PLBS and RORE activity. AmpPLBS
WT and AmpROREWT represent the amplitudes of PLBS
and RORE activity in the WT case. (B) The amplitude of RORE activity (x-axis) is partially transmitted to the amplitude of PLBS activity (y-axis) as thestrength of inhibition to the RORE is manipulated. (C) The relationship between the period length (z-axis) and the strengths of inhibition to the PLBS(x-axis) and RORE (y-axis). If the mutation only alters the strength of inhibition in one loop (the yellow line indicates the negative primary loop, and theblack line indicates the RORE auxiliary loop), the period is not greatly altered (the cyan bar and the purple bar). If the mutation alters both loops, theperiod can be significantly altered (the red dashed line on the ridge, the red bar). The yellow bar indicates the WT.
resent the individual strengths of the inhibition to the PLBSand RORE. When change is applied to the inhibition to thePLBS, the period of oscillation remains approximately con-stant (the yellow line). Similarly, the period is slightly al-tered (the black line) if variation of the inhibition only oc-curs for the RORE. Thus, this intensity–balance modula-tion provides the period robustness via loop coupling effect.
The simulation results also indicate that if the strengths ofinhibition to both the PLBS and RORE increase, the periodwill significantly increase along a ridge (the red dashed line)(Figure 4C).
To confirm that targeting both the PLBS and RORE canmodulate the period, we used U2OS (human osteosarco-mas) circadian reporter cells that had previously been suc-cessfully employed in various circadian period assays (35).We were particularly interested in understanding the com-bined effect of CRY1 and REV-ERB� overexpression be-cause we anticipated that this effect might alter the inten-sity ratio of the primary loop to the AL, thereby leadingto period elongation. Notably, overexpression of CRY1 (1.5�g) or REV-ERB� (1.5 �g) alone did not affect the period;only the expression of CRY1 and REV-ERB� in combi-nation elongated the period length (Figure 5A and B), asmeasured using LumiCycle assays. We further examined theprofiles of Per1 and Bmal1 mRNA in each evaluated groupover the course of the day because LumiCycle data did notwell reflect a real amplitude value (Figure 5C). The Per1 andBmal1 amplitude ratios were negatively related to the pe-riod length (Figure 5D), suggesting that the ratio controlsthe period length, as qualitatively predicted by the modeland discussed above.
To extend this hypothesis to the other potential AL, weexamined the combined effect of PER2 and PPAR� onU2OS cell lines. Pparα transcription is induced by CLOCKand BMAL1 via an intronic E-box-rich region (36), and thisrhythmic nuclear receptor (13) regulates lipid metabolism
and energy homeostasis (37). Per2 promoter contains thePPAR�-binding element PPRE, which activates Per2 tran-scription (38), implying the existence of an AL between Per2and PPARα. We, therefore, predicted a similar scenario asobserved for CRY1 and REV-ERB�, although an AL be-tween PER2 and PPAR� has not yet been confirmed. Wefound that a combination of PER2 and PPAR� agonistsenhanced the variation of the period (Figure 5E and Sup-plementary Figure S4), suggesting that targeting multipleloops may aid in altering the period length, as indicated bythe model prediction.
This ratio-regulating pattern can also provide flexibilityfor circadian period recovery and suggests that the circa-dian period can be restored through adjustments in the am-plitude ratio. Fbxl3 knockout mice have an extremely longperiod (29), and it can be restored by knocking out Rev-erbα or Cry1. To observe the period recovery routes fromFbxl3−/− (27.5 h) to Fbxl3−/−; Rev-erbα−/− (23.7 h) andFbxl3−/−; Cry1−/− (24.5 h) mice, we plotted their ampli-tudes in the Per1 mRNA–Bmal1 mRNA amplitude plane(Figure 6A and B). Points lying on a given radical linein the amplitude plane exhibit an identical ratio. Accord-ing to the aforementioned ratio hypothesis, the oscillatorsthat correspond to these points exhibit a similar period.For example, phenotypes with amplitudes located near theblack radical line will exhibit periods similar to that ofWT mice. Theoretically, restoring the amplitudes of a de-stroyed clock to any point on the black radical line shouldbe sufficient to rescue the period. Experimentally, the am-plitudes observed in both Fbxl3−/−; Rev-erbα−/− (23.7 h)and Fbxl3−/−; Cry1−/− (24.5 h) mice were close to the blackradical line, and their periods were also similar to that ofWT mice. Moreover, note that the recovery directions (ar-row in Figure 6A and arrow in Figure 6B) of theamplitude ratios in the rescue cases differed from the de-struction direction (arrow in Figure 6A and B) observed

8 Nucleic Acids Research, 2014
2222.523
23.524
21.5
24.5
Agonist Per2 ove
r
expressi
on
2222.523
23.524
21.5
24.5
Cry1 ove
r
express
ionRev-erbα over expression
22.6
3+ -
0.06
23.2
3+ -
0.12
23+ -
0.2
23.8
+ -0.
17
22.6
+ -0.
17
23.4
3+ -
0.57
22.3
+ -0.
3
22.4
6+ -
0.15
1 2 3 4 5 6 7
Control CRY1
REV-ERBα CRY1&REV-ERBα
Per1 mRNA Bmal1 mRNA
00.20.40.60.81.01.21.41.6
24 28 32 36 40 44 24 28 32 36 40 44
00.20.40.60.81.01.21.41.6
0
0.5
1.5
1.0
2.5
22.0
23.0
22.4
23.2
22.8
23.423.6
22.6
22.20.6 0.8 1.0 1.2 1.4 1.6
ControlCRY1REV-ERBαCRY1&REV-ERBα
Per1Amp /AmpBmal1
1.81.82.0
2.0
00.20.40.60.81.01.21.41.61.82.0
01020
405060708090
30
ControlREV-ERBα
CRY1CRY1&REV-ERBα
22.6 +- 0.1723.43+- 0.5722.3+- 0.3
22.46+- 0.15
Luci
fera
se c
ount
sX10
0
Day
Rel
ativ
e m
RN
A in
tens
ity
A B
C
D E
Period
Period
Period
Figure 5. Manipulating the circadian period through the disruption of thetransmitting effect. (A) Bioluminescence results from a representative ex-periment 36 h after cells were cotransfected with the indicated expressionvectors. All experiments were repeated at least three times, and at least threereplicates were performed for each group. (B) The relationship between pe-riod length (z-axis), and REV-ERB� overexpression (x-axis) and CRY1overexpression (y-axis). The yellow bar indicates the period of the controlgroup with blank vectors (22.6 h). Upon CRY1 or REV-ERB� overex-pression, the period remains at 22.46 h (the cyan bar) or 22.3 h (the purplebar). Upon the overexpression of both CRY1 and REV-ERB�, the periodincreases to 23.46 h (the red bar). (C) Expression profiles of the Bmal1 (red)and Per1 (blue) clock genes in U2OS cells with the indicated vectors weremeasured by qPCR and normalized to Gapdh. The expression levels wereplotted as percentages of the control amplitude in each paired experiment.Each value represents the mean ± SD (n = 3). (D) The periods of cellstransfected with the indicated vectors are shown versus the amplitude ra-tio of Per1 mRNA to Bmal1 mRNA. Each period represents the mean ofthree experiments. (E) The relationship between period length (z-axis), andPPAR� agonist overexpression (x-axis) and PER2 overexpression (y-axis).The period of the control group is 22.63 h, which is indicated by the yellowbar. Upon PER2 overexpression or agonist added only, the period remainsat 23 h (cyan bar) or 23.23 h (the purple bar). Upon the overexpression ofboth PER2 and agonist, the period increases to 23.8 h (the red bar).
A
Per1
0.0 0.5 1.0
0.5
1.0 (0.42, 0.92)
(0.55, 0.65)
(1, 1)
T=23.7
T=27.5
0.0
T=27.5
T=23.7
(0.42,0.92)
(0.62,0.74)
0.0 0.5 1.0
B
Amp Per1Amp
Bm
al1
Am
p
1 1
23
Rescue the
auxiliary loop Res
cue
the
pim
ary
loop
22232425262728
Inhibition to
primary
loopInhibition to auxiliary loop
C 27.6
23.7
23.724.5
21(1, 1)
(Period)
Figure 6. The circadian period can be restored by adjusting the amplituderatio via transmitting-effect. (A) The blue arrows represent the direction ofdestruction from WT (black square) to Fbxl3−/− (red circle) mice and thedirection of rescue from Fbxl3−/− to Fbxl3−/−; Rev-erbα−/− (blue trian-gle) mice within the Per1 mRNA-Bmal1 mRNA amplitude plane. (B) Theblue arrows represent the direction of destruction from WT (black square)to Fbxl3−/− (red circle) mice and the direction of rescue from Fbxl3−/− toFbxl3−/−; Cry1−/− (green triangle) mice within the Per1 mRNA-Bmal1mRNA amplitude plane. (C) The circadian period can be restored by rescu-ing only one loop. The yellow bar indicates the period of the WT mice. Ar-
row represents the rescue way from Fbxl3−/− (the red bar) to Fbxl3−/−;Rev-erbα−/- (the cyan bar), by releasing the compulsions in the auxiliary
loop. Arrow represents the rescue way from Fbxl3−/− (the red bar) toFbxl3−/−; Cry1−/− (the purple bar), by releasing the compulsions in thenegative primary feedback loop.
in Fbxl3−/− mice. This pattern provides flexibility for circa-dian period recovery and suggests that the circadian periodcan be restored through adjustments in the amplitude ratiorather than through the wholesale recovery in all destructvariations.
Our previous studies indicated that the negative primaryfeedback loop and the auxiliary feedback loop were knownto be simultaneously targeted in Fbxl3 knockout mice (29).The improper period is due to the destruct occurred inboth loops. Releasing the destruct in the negative primaryfeedback loop (the deletion of Cry1 in an Fbxl3-null back-ground) or the auxiliary feedback loop (the deletion of Rev-erbα) can rescue the amplitude ratio through the couplingeffect followed by the recovery of the period. Arrow inFigure 6C illustrates the recovery of the period through res-cuing the auxiliary loop (Fbxl3−/−; Rev-erbα−/− mice, 23.7h). Similarly, releasing the primary loop (Fbxl3−/−; Cry1−/−mice, 24.5 h) can also partially rehabilitate the period length(Arrow in Figure 6C). Furthermore, if the improper pe-riod is caused by unclear reasons, targeting both the pri-mary and ALs may aid in destructing the amplitude ra-tio and thus rescuing the period. Therefore, rescuing or de-structing the intensity ratios of the primary loop to the ALbecomes an important issue in designing strategies to cor-rect circadian rhythmic disorders.
DISCUSSION
In this study, we mainly focus on the mechanism of perioddetermination and find an unexpected and non-intuitiverule that the intensity ratio of the negative primary loopto the positive AL can regulate the period length. To in-vestigate whether this loop-coupling topological structuredetermines the ratio-regulating pattern, we performed thecomputational simulations within a broader range of period

Nucleic Acids Research, 2014 9
length. We randomly disturbed the parameter sets with dif-ferent post-transcription time delays and manipulated thePLBS and ALBS (RORE) activity. As shown in Supplemen-tary Figure S2, the monotonic relationship between the in-tensity ratio and the period length is not disrupted due tothe disturbance of parameters and period ranges. This re-sult indicates that if other oscillatory systems have a simi-lar coupling structure in transcriptional level, the ratio rulemay also exist. Furthermore, we can apply this topologi-cal structure in some synthetic oscillators, which requirescertain period features. Therefore, these simulation resultslead to a more general conclusion that it is the topologicalstructure rather than the specified parameters served in thisratio-regulating pattern.
It should be noted that in this study we used the circadianperiod of locomotor assay and the mRNA expression in theliver to test our ratio hypothesis, and we do not exclude thehierarchical natures of the clock system between locomotorperiod and mRNA expression level in liver tissue. However,overall, a correlation between locomotor period and periph-eral tissue period was seen in many studies (39,40). Thiscorrelation was especially striking in the period direction ofshort or long period. In this study, we are more concernedabout the variation trend of the period length rather thanthe absolute value. Taken together, we speculated that therule of the intensity ratio represents a general design prin-ciple underpinning the ratio-period regulating system.
The circadian clock can regulate the expression of mul-tiple clock-controlled genes, and clock genes themselvescontain many binding sites for clock-controlled genes intheir promoters. Our results indicate that the combinationof PER2-PPAR� results in period alteration (Figure 5E).Although the underlying mechanism remains elusive, thisinformation is of interest because more than half of nu-clear receptors follow rhythmic cycles in key metabolic tis-sues (13), which has biological implications for the clock-receptor signal network. Some of these nuclear receptorsmay contribute to the circadian clock via other ALs. A re-cent genome-wide small interfering RNA-based study indi-cated that more than 200 genes play roles in clock biologyby regulating clock amplitude and period (35), suggestingan unexpected level of reciprocal regulation between knownsignaling modules and the circadian network. This designprinciple provides multiple entry points to modulate the cir-cadian clock to adapt to local environments. Meanwhile, thecircadian clock should remain robust free-running periodlength due to its physiological role. Thus, there might be atrade-off between adaption and robustness. However, ourstudy shows that variations in a single loop can only changethe period length slightly. The intensity–balance propertywith the coupling effects in integrated loops provides a safe-guard of the mammalian circadian system to maintain theperiod close to 24 h. Therefore, the circadian clock withmultiple ALs can both meet the needs for adaptation androbustness.
This model not only facilitates the interpretation of re-sults from existing experiments but also guides further ex-periments aimed at understanding the multiple interlockingwheels involved in clock coupling. Furthermore, it also pro-vides an important clue for maintaining robustness in otherbiological regulatory networks with coupled loops.
SUPPLEMENTARY DATA
Supplementary Data are available at NAR Online.
ACKNOWLEDGMENT
We thank Professor Chao Tang (UCSF/PKU) for givinginsightful comments on this study.Authors Contributions. Y.X. and L.Y. are responsiblefor the infrastructure, project direction and planning.L.Y. designed the mathematical models and Y.X. de-signed the biological experiments. J.Y. performed themathematical analysis and interpreted experimental data.G.-S.S. and Z.-H.Z. carried out the most biological ex-periments and data analyses. Y.X., L.Y. and J.Y. co-wrotethe paper. Z.-W.L., L.-J.X., Z.-P.Q. and Z.D. performedsome experiments or contributed to mouse models.All authors discussed and commented on the manuscript.
FUNDING
Ministry of Science and Technology [2010CB945100,2013CB945203 to Y.X.]; National Science Foundation ofChina [31171343, 31230049 to Y.X.; 61271358 to L.Y.].Funding for open access charge: Ministry of Science andTechnology [2010CB945100, 2013CB945203 to Y.X.]; Na-tional Science Foundation of China [31171343, 31230049to Y.X.; 61271358 to L.Y.] .Conflict of interest statement. None declared.
REFERENCES1. Ouyang,Y., Andersson,C.R., Kondo,T., Golden,S.S. and
Johnson,C.H. (1998) Resonating circadian clocks enhance fitness incyanobacteria. Proc. Natl Acad. Sci. U.S.A., 95, 8660–8664.
2. Scheer,F.A., Hilton,M.F., Mantzoros,C.S. and Shea,S.A. (2009)Adverse metabolic and cardiovascular consequences of circadianmisalignment. Proc. Natl Acad. Sci. U.S.A., 106, 4453–4458.
3. Martino,T.A., Oudit,G.Y., Herzenberg,A.M., Tata,N., Koletar,M.M.,Kabir,G.M., Belsham,D.D., Backx,P.H., Ralph,M.R. and Sole,M.J.(2008) Circadian rhythm disorganization produces profoundcardiovascular and renal disease in hamsters. Am. J. Physiol. Regul.Integr. Comp. Physiol., 294, R1675–R1683.
4. Zhang,E.E. and Kay,S.A. (2010) Clocks not winding down:unravelling circadian networks. Nat. Rev. Mol. Cell Biol., 11, 764–776.
5. Lowrey,P.L. and Takahashi,J.S. (2004) Mammalian circadianbiology: elucidating genome-wide levels of temporal organization.Annu. Rev. Genomics Hum. Genet., 5, 407–441.
6. Reppert,S.M. and Weaver,D.R. (2002) Coordination of circadiantiming in mammals. Nature, 418, 935–941.
7. Schibler,U. and Naef,F. (2005) Cellular oscillators: rhythmic geneexpression and metabolism. Curr. Opin. Cell Biol., 17, 223–229.
8. Menet,J.S., Rodriguez,J., Abruzzi,K.C. and Rosbash,M. (2012)Nascent-Seq reveals novel features of mouse circadian transcriptionalregulation. eLife, 1, e00011.
9. Rey,G., Cesbron,F., Rougemont,J., Reinke,H., Brunner,M. andNaef,F. (2011) Genome-wide and phase-specific DNA-bindingrhythms of BMAL1 control circadian output functions in mouseliver. PLoS Biol., 9, e1000595.
10. Gallego,M. and Virshup,D.M. (2007) Post-translationalmodifications regulate the ticking of the circadian clock. Nat. Rev.Mol. Cell Biol., 8, 139–148.
11. Ukai-Tadenuma,M., Yamada,R.G., Xu,H., Ripperger,J.A., Liu,A.C.and Ueda,H.R. (2011) Delay in feedback repression by cryptochrome1 is required for circadian clock function. Cell, 144, 268–281.
12. DeBruyne,J.P. and Hogenesch,J.B. (2011) A CRY in the night. Dev.Cell, 20, 144–145.
10 Nucleic Acids Research, 2014
13. Yang,X., Downes,M., Yu,R.T., Bookout,A.L., He,W., Straume,M.,Mangelsdorf,D.J. and Evans,R.M. (2006) Nuclear receptorexpression links the circadian clock to metabolism. Cell, 126,801–810.
14. Forger,D.B. and Peskin,C.S. (2003) A detailed predictive model of themammalian circadian clock. Proc. Natl Acad. Sci. U.S.A., 100,14806–14811.
15. Goldbeter,A. (1995) A model for circadian oscillations in theDrosophila period protein (PER). Proc. Biol. Sci., 261, 319–324.
16. Leloup,J.C. and Goldbeter,A. (2003) Toward a detailedcomputational model for the mammalian circadian clock. Proc. NatlAcad. Sci. U.S.A., 100, 7051–7056.
17. Mirsky,H.P., Liu,A.C., Welsh,D.K., Kay,S.A. and Doyle,F.J. III(2009) A model of the cell-autonomous mammalian circadian clock.Proc. Natl Acad. Sci. U.S.A., 106, 11107–11112.
18. Mondragon-Palomino,O., Danino,T., Selimkhanov,J., Tsimring,L.and Hasty,J. (2011) Entrainment of a population of synthetic geneticoscillators. Science, 333, 1315–1319.
19. Tigges,M., Marquez-Lago,T.T., Stelling,J. and Fussenegger,M. (2009)A tunable synthetic mammalian oscillator. Nature, 457, 309–312.
20. Ferrell,J.E. Jr, Tsai,T.Y. and Yang,Q. (2011) Modeling the cell cycle:why do certain circuits oscillate? Cell, 144, 874–885.
21. Tsai,T.Y., Choi,Y.S., Ma,W., Pomerening,J.R., Tang,C. andFerrell,J.E. Jr (2008) Robust, tunable biological oscillations frominterlinked positive and negative feedback loops. Science, 321,126–129.
22. Relogio,A., Westermark,P.O., Wallach,T., Schellenberg,K.,Kramer,A. and Herzel,H. (2011) Tuning the mammalian circadianclock: robust synergy of two loops. PLoS Comput. Biol., 7, e1002309.
23. Kim,J.K. and Forger,D.B. (2012) A mechanism for robust circadiantimekeeping via stoichiometric balance. Mol. Syst. Biol., 8, 630.
24. Korencic,A., Bordyugov,G., Kosir,R., Rozman,D., Golicnik,M. andHerzel,H. (2012) The interplay of cis-regulatory elements rulescircadian rhythms in mouse liver. PloS ONE, 7, e46835.
25. Lowrey,P.L., Shimomura,K., Antoch,M.P., Yamazaki,S.,Zemenides,P.D., Ralph,M.R., Menaker,M. and Takahashi,J.S. (2000)Positional syntenic cloning and functional characterization of themammalian circadian mutation tau. Science, 288, 483–492.
26. Preitner,N., Damiola,F., Lopez-Molina,L., Zakany,J., Duboule,D.,Albrecht,U. and Schibler,U. (2002) The orphan nuclear receptorREV-ERBalpha controls circadian transcription within the positivelimb of the mammalian circadian oscillator. Cell, 110, 251–260.
27. Bae,K., Jin,X., Maywood,E.S., Hastings,M.H., Reppert,S.M. andWeaver,D.R. (2001) Differential functions of mPer1, mPer2, andmPer3 in the SCN circadian clock. Neuron, 30, 525–536.
28. Gu,X., Xing,L., Shi,G., Liu,Z., Wang,X., Qu,Z., Wu,X., Dong,Z.,Gao,X., Liu,G. et al. (2012) The circadian mutation PER2(S662G) is
linked to cell cycle progression and tumorigenesis. Cell Death Differ.,19, 397–405.
29. Shi,G., Xing,L., Liu,Z., Qu,Z., Wu,X., Dong,Z., Wang,X., Gao,X.,Huang,M., Yan,J. et al. (2013) Dual roles of FBXL3 in themammalian circadian feedback loops are important for perioddetermination and robustness of the clock. Proc. Natl Acad. Sci.U.S.A., 110, 4750–4755.
30. Wang,X., Tang,J., Xing,L., Shi,G., Ruan,H., Gu,X., Liu,Z., Wu,X.,Gao,X. and Xu,Y. (2010) Interaction of MAGED1 with nuclearreceptors affects circadian clock function. EMBO J., 29, 1389–1400.
31. Alenghat,T., Meyers,K., Mullican,S.E., Leitner,K., Adeniji-Adele,A.,Avila,J., Bucan,M., Ahima,R.S., Kaestner,K.H. and Lazar,M.A.(2008) Nuclear receptor corepressor and histone deacetylase 3 governcircadian metabolic physiology. Nature, 456, 997–1000.
32. Ueda,H.R., Hayashi,S., Chen,W., Sano,M., Machida,M.,Shigeyoshi,Y., Iino,M. and Hashimoto,S. (2005) System-levelidentification of transcriptional circuits underlying mammaliancircadian clocks. Nat. Genet., 37, 187–192.
33. Yamajuku,D., Shibata,Y., Kitazawa,M., Katakura,T., Urata,H.,Kojima,T., Nakata,O. and Hashimoto,S. (2010) Identification offunctional clock-controlled elements involved in differential timing ofPer1 and Per2 transcription. Nucleic Acids Res., 38, 7964–7973.
34. Cho,H., Zhao,X., Hatori,M., Yu,R.T., Barish,G.D., Lam,M.T.,Chong,L.W., DiTacchio,L., Atkins,A.R., Glass,C.K. et al. (2012)Regulation of circadian behaviour and metabolism byREV-ERB-alpha and REV-ERB-beta. Nature, 485, 123–127.
35. Zhang,E.E., Liu,A.C., Hirota,T., Miraglia,L.J., Welch,G.,Pongsawakul,P.Y., Liu,X., Atwood,A., Huss,J.W. III, Janes,J. et al.(2009) A genome-wide RNAi screen for modifiers of the circadianclock in human cells. Cell, 139, 199–210.
36. Oishi,K., Amagai,N., Shirai,H., Kadota,K., Ohkura,N. andIshida,N. (2005) Genome-wide expression analysis reveals 100adrenal gland-dependent circadian genes in the mouse liver. DNARes., 12, 191–202.
37. Evans,R.M., Barish,G.D. and Wang,Y.X. (2004) PPARs and thecomplex journey to obesity. Nat. Med., 10, 355–361.
38. Schmutz,I., Ripperger,J.A., Baeriswyl-Aebischer,S. and Albrecht,U.(2010) The mammalian clock component PERIOD2 coordinatescircadian output by interaction with nuclear receptors. Genes Dev.,24, 345–357.
39. Brown,S.A., Kunz,D., Dumas,A., Westermark,P.O., Vanselow,K.,Tilmann-Wahnschaffe,A., Herzel,H. and Kramer,A. (2008)Molecular insights into human daily behavior. Proc. Natl Acad. Sci.U.S.A., 105, 1602–1607.
40. Liu,A.C., Welsh,D.K., Ko,C.H., Tran,H.G., Zhang,E.E., Priest,A.A.,Buhr,E.D., Singer,O., Meeker,K., Verma,I.M. et al. (2007)Intercellular coupling confers robustness against mutations in theSCN circadian clock network. Cell, 129, 605–616.
Copyright © 2022 FDOKUMEN