An integrative systems biology approach for analyzing liver hypermetabolism
6
An Integrative Systems Biology Approach for Analyzing Liver Hypermetabolism Eric Yang a , Francois Berthiaume b , Martin L.Yarmush a,b , Ioannis P. Androulakis a≠ a Biomedical Engineering Department, Rutgers University, Piscataway, NJ, USA b Center for Engineering in Medicine, Harvard Medical School, Boston, MA, USA Abstract Severe injury and other disease conditions (cancer, diabetes) lead to a hypermetabolic state featuring increased turnover of proteins, fatty acids and carbohydrates. Prolonged hypermetabolism is accompanied by progressive organ failure and serious complications. Understanding the biochemical underpinnings of the hypermetabolic response will lead to a better understanding of the changes at the systemic level and ultimately provide clues for limiting its harmful consequences. We examine integrated bioinformatics approaches combining novel modeling and computational techniques, animal injury models, and gene expression measurements for analyzing hypermetabolic states. We demonstrate how integrative systems biology developments upgrade the information content of diverse biological data and ultimately advance our fundamental biological understanding Keywords: hypermetabolism, gene expression, regulation. 1. Introduction Severe injury, such as trauma, burns and other common disease conditions such as cancer and diabetes, leads to a hypermetabolic state which features increased turnover of proteins, fatty acids and carbohydrates in the whole body. Prolonged hypermetabolism is typically accompanied by a severe loss of lean body mass and progressive organ failure, and predisposes patients to complications such as infections and multiple organ dysfunction syndrome (MODS), which threatens recovery and survival (Evans and Smithies 1999). An important player in systemic hypermetabolism is the liver, which is the organ that is responsible for detoxification processes and maintaining circulating levels of important metabolites, such as glucose, ketone bodies, amino acids, and many plasma proteins including clotting factors. Thus, understanding the biochemical underpinnings of the hypermetabolic response of the liver may lead to a better understanding of the changes at the systemic level and ultimately provide clues for limiting the harmful, if not lethal, consequences of hypermetabolism. Metabolic changes following severe injury, such as burns, have been studied using biochemical and physiological techniques (Lee, Berthiaume et al. 2000) and many laboratories have undertaken organ-specific studies that involve the administration of a thermal injury to an animal followed by perfusion of the organ for determining net rates of production and uptake of a large number of metabolites. This systems-based approach has been used to describe changes in metabolite levels and establish a ≠ Corresponding author: [email protected] and 9th International Symposium on Process Systems Engineering W. Marquardt, C. Pantelides (Editors) © 2006 Published by Elsevier B.V. 16th European Symposium on Computer Aided Process Engineering 1655
Transcript of An integrative systems biology approach for analyzing liver hypermetabolism
An Integrative Systems Biology Approach for Analyzing Liver Hypermetabolism Eric Yanga, Francois Berthiaumeb, Martin L.Yarmusha,b, Ioannis P. Androulakisa≠ aBiomedical Engineering Department, Rutgers University, Piscataway, NJ, USA bCenter for Engineering in Medicine, Harvard Medical School, Boston, MA, USA
Abstract Severe injury and other disease conditions (cancer, diabetes) lead to a hypermetabolic state featuring increased turnover of proteins, fatty acids and carbohydrates. Prolonged hypermetabolism is accompanied by progressive organ failure and serious complications. Understanding the biochemical underpinnings of the hypermetabolic response will lead to a better understanding of the changes at the systemic level and ultimately provide clues for limiting its harmful consequences. We examine integrated bioinformatics approaches combining novel modeling and computational techniques, animal injury models, and gene expression measurements for analyzing hypermetabolic states. We demonstrate how integrative systems biology developments upgrade the information content of diverse biological data and ultimately advance our fundamental biological understanding Keywords: hypermetabolism, gene expression, regulation.
1. Introduction Severe injury, such as trauma, burns and other common disease conditions such as cancer and diabetes, leads to a hypermetabolic state which features increased turnover of proteins, fatty acids and carbohydrates in the whole body. Prolonged hypermetabolism is typically accompanied by a severe loss of lean body mass and progressive organ failure, and predisposes patients to complications such as infections and multiple organ dysfunction syndrome (MODS), which threatens recovery and survival (Evans and Smithies 1999). An important player in systemic hypermetabolism is the liver, which is the organ that is responsible for detoxification processes and maintaining circulating levels of important metabolites, such as glucose, ketone bodies, amino acids, and many plasma proteins including clotting factors. Thus, understanding the biochemical underpinnings of the hypermetabolic response of the liver may lead to a better understanding of the changes at the systemic level and ultimately provide clues for limiting the harmful, if not lethal, consequences of hypermetabolism. Metabolic changes following severe injury, such as burns, have been studied using biochemical and physiological techniques (Lee, Berthiaume et al. 2000) and many laboratories have undertaken organ-specific studies that involve the administration of a thermal injury to an animal followed by perfusion of the organ for determining net rates of production and uptake of a large number of metabolites. This systems-based approach has been used to describe changes in metabolite levels and establish a
≠ Corresponding author: [email protected]
and 9th International Symposium on Process Systems EngineeringW. Marquardt, C. Pantelides (Editors) © 2006 Published by Elsevier B.V.
16th European Symposium on Computer Aided Process Engineering
1655
metabolic basis for the liver response to burn injury (Chen, Fei et al. 2003). However, these techniques are limited by the number of metabolic reactions that can be studied simultaneously and hence lack the ability to comprehensively describe a disease state. Furthermore, these studies do not address the underlying mechanisms that drive hypermetabolic changes, since the observed metabolic alterations are only one component of the overall liver response, and other aspects such as changes in liver gene expression following burn injury have not yet been fully characterized. Furthermore, understanding the genetic basis of the disease state may provide clues for the development of improved therapeutics. Therefore, in addition to characterizing the metabolic states by collecting metabolic profile data, the incorporation of gene expression profiles would generate a more complete picture and enhance our understanding of the mechanisms that control the onset, maintenance, and resolution of the hypermetabolic response. Although numerous studies have been previously undertaken to assess global gene expression patterns in cancer and other malignancies, (Alon, Barkai et al. 1999; Golub, Slonim et al. 1999), very few studies have used transcriptional profiling in the context of inflammation and sepsis, (Kaminski, Allard et al. 2000; Chinnaiyan, Huber-Lang et al. 2001). In order to elucidate the transcriptional characteristics of hypermetabolism following severe injury, various animal models have been proposed to induce and quantify in vivo the appropriate gene expression response (Chinnaiyan, Huber-Lang et al. 2001; Vemula, Berthiaume et al. 2004). However, very few studies have focused on global expression analysis for characterizing transient alterations in the context of severe trauma on the liver. In this paper we address issues related to the development of integrative systems biology approaches in terms of characterizing temporal events in transcriptional profiles. Gene expression dynamics of inflammation-stimulated hepatocytes and the potential for genetic reprogramming of the underlying gene expression is evaluated. We propose novel unsupervised computational approaches, based on proximity preserving hashing, for the identification of critical motifs of gene expression and demonstrate how an integrative framework combining transcriptional data, bioinformatics tools and regulatory models can be put together to quantify the observations and initiate the process of hypothesis generation in a systematic way.
2. Characterization of Temporal Events in Transcriptional Profiles
2.1. Experimental system. We present our analysis in the context of the experiments described in (Vemula, Berthiaume et al. 2004). Animal studies were performed with male Sprague-Dawley rats. Rats were anesthetized, and a cutaneous 3rd degree burn injury over ~20% of the rat’s total body surface area was induced by scalding for 10 s. Animals were sacrificed at 5 time points (0, 1, 4, 8, and 24h), total RNA harvested from livers was isolated and was hybridized to a U34A GeneChip that had 8,799 probes represented on each chip. The data are available at http://www.ncbi.nlm.nih.gov/geo (accession number GSE802). 2.2. Classification of temporal expression patterns. In order to characterize the expression waveforms we follow the basic formalism for time-series analysis presented in (Keogh, Lin et al. 2005). The Symbolic Aggregate approXimation (SAX) of time series is based on the premise of transforming a time series into a corresponding sequence of symbols. The normalized time series are piece-wise averaged thus transforming the time series to a lower dimensional space. An equiprobable discretization technique is applied to transform the series to a sequence of symbols. The symbolic representation makes it possible to further analyze the time
E. Yang et al.1656

series in an order to uniquely characterize the overall dynamic response of each transcriptional profile. In order to assign a unique identifier to each profile, we explore the concept of hashing where the sequence of symbols is mapped onto a single integer
ww j
jj 1
h(c, w,a) 1 [ord(c ) 1] a −
=
= + − ×∑ where a is the size of the alphabet, w is length of the
word, and c is the “letter” sequence to which the expression profile is assigned to, where w is a time window within the duration of the experiment. Genes with similar normalized expression profiles “hash” to similar motif values. As a result, we generate a distribution of such motif values and identify (i) overpopulated motifs, (ii) genes sharing similar motif values, i.e., similar expression profiles. The basic ideas were recently presented in (Androulakis, Vitolo et al. 2005). Figure 1 depicts the results for the burn data in terms of the distribution of motifs values and characteristic, average, profiles for the most abundant expression motifs. 2.3. Definition of transcriptional state and selection of informative expression patterns. The cellular system at the beginning of the experiment is assumed to be at some state of equilibrium. Once an external disturbance is introduced the system starts to deviate from its original homeostatic state. Excursions from this distribution are the result of the transcriptional changes in response to the external stimulus. Thus, we define the transcriptional state as the distribution of gene expression levels at any given time from the distribution at the control state. With an informative subset of genes, we should see time points where the transcriptional state is both non-Gaussian, and deviating significantly from their initial set point before the perturbation. We use the Kolmogorov-Smirnov statistic to determine just how far from the basis curve (distribution at time t=0 hr) our subset deviates during the course of the experiment (Rassokhin and Agrafiotis 2000) with the assumption that maximally informative genes will be the ones whose transcriptional activity is being maximally modified. This statistic allows us to compute a metric that defines just how different the two distributions of expression levels are. Given the quantitative metric for establishing a deviation from the control transcriptional state we have implemented a rudimentary selection mechanism by which we incorporate peaks from the distribution in an attempt to identify the ensemble of profiles that maximized the deviation from the original distribution of expression values while maximizing the maximum point deviation relative to the distribution at time t=0, that is i it 1 i n
max max F(Y (t)) F(Y (0))≤ ≤
− . Motifs
(peaks) are sequentially introduced as long as the KS metric increases. Figure 2 depicts the deviation from the t=0 distribution for the informative genes belonging to six most
Figure 1: Motif distribution and characteristic average motifs
An Integrative Systems Biology Approach for Analyzing Liver Hypermetabolism 1657
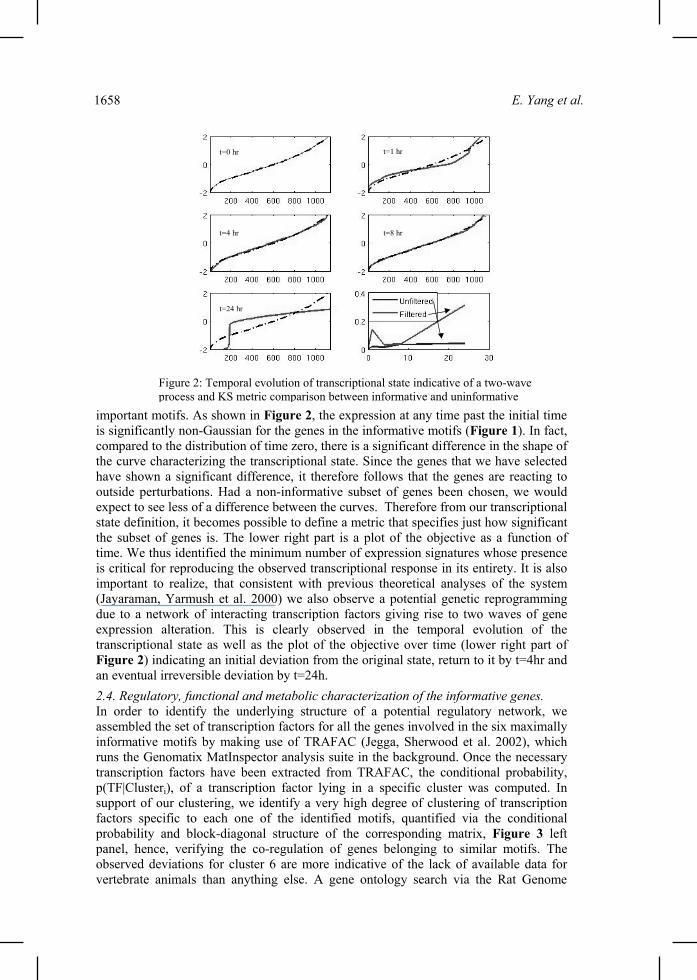
important motifs. As shown in Figure 2, the expression at any time past the initial time is significantly non-Gaussian for the genes in the informative motifs (Figure 1). In fact, compared to the distribution of time zero, there is a significant difference in the shape of the curve characterizing the transcriptional state. Since the genes that we have selected have shown a significant difference, it therefore follows that the genes are reacting to outside perturbations. Had a non-informative subset of genes been chosen, we would expect to see less of a difference between the curves. Therefore from our transcriptional state definition, it becomes possible to define a metric that specifies just how significant the subset of genes is. The lower right part is a plot of the objective as a function of time. We thus identified the minimum number of expression signatures whose presence is critical for reproducing the observed transcriptional response in its entirety. It is also important to realize, that consistent with previous theoretical analyses of the system (Jayaraman, Yarmush et al. 2000) we also observe a potential genetic reprogramming due to a network of interacting transcription factors giving rise to two waves of gene expression alteration. This is clearly observed in the temporal evolution of the transcriptional state as well as the plot of the objective over time (lower right part of Figure 2) indicating an initial deviation from the original state, return to it by t=4hr and an eventual irreversible deviation by t=24h. 2.4. Regulatory, functional and metabolic characterization of the informative genes. In order to identify the underlying structure of a potential regulatory network, we assembled the set of transcription factors for all the genes involved in the six maximally informative motifs by making use of TRAFAC (Jegga, Sherwood et al. 2002), which runs the Genomatix MatInspector analysis suite in the background. Once the necessary transcription factors have been extracted from TRAFAC, the conditional probability, p(TF|Clusteri), of a transcription factor lying in a specific cluster was computed. In support of our clustering, we identify a very high degree of clustering of transcription factors specific to each one of the identified motifs, quantified via the conditional probability and block-diagonal structure of the corresponding matrix, Figure 3 left panel, hence, verifying the co-regulation of genes belonging to similar motifs. The observed deviations for cluster 6 are more indicative of the lack of available data for vertebrate animals than anything else. A gene ontology search via the Rat Genome
t=0 hr t=1 hr
t=4 hr t=8 hr
t=24 hr
Figure 2: Temporal evolution of transcriptional state indicative of a two-wave process and KS metric comparison between informative and uninformative
E. Yang et al.1658
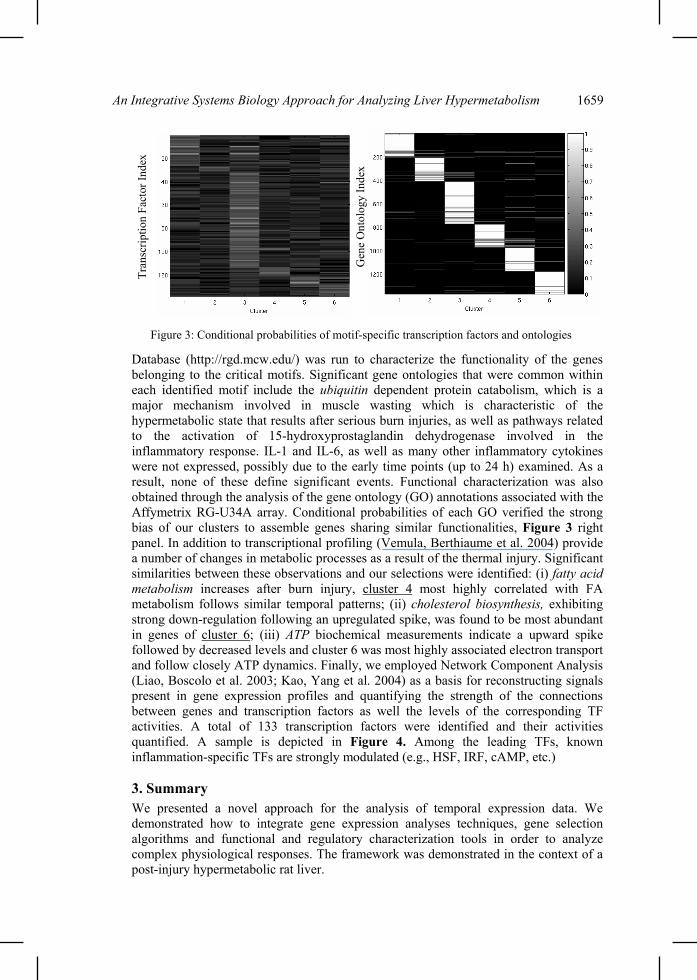
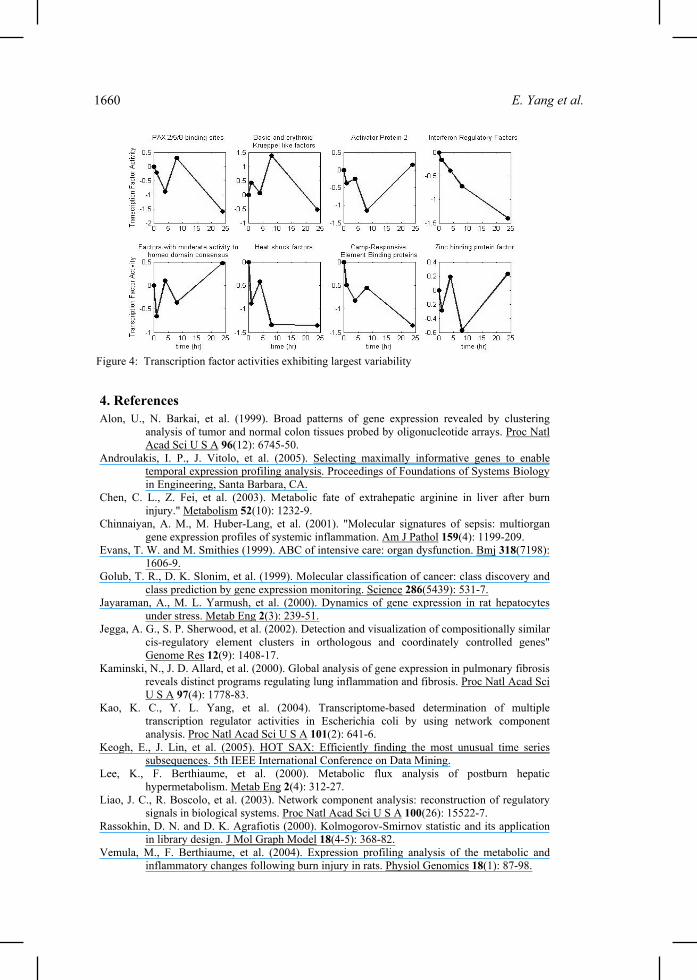
Database (http://rgd.mcw.edu/) was run to characterize the functionality of the genes belonging to the critical motifs. Significant gene ontologies that were common within each identified motif include the ubiquitin dependent protein catabolism, which is a major mechanism involved in muscle wasting which is characteristic of the hypermetabolic state that results after serious burn injuries, as well as pathways related to the activation of 15-hydroxyprostaglandin dehydrogenase involved in the inflammatory response. IL-1 and IL-6, as well as many other inflammatory cytokines were not expressed, possibly due to the early time points (up to 24 h) examined. As a result, none of these define significant events. Functional characterization was also obtained through the analysis of the gene ontology (GO) annotations associated with the Affymetrix RG-U34A array. Conditional probabilities of each GO verified the strong bias of our clusters to assemble genes sharing similar functionalities, Figure 3 right panel. In addition to transcriptional profiling (Vemula, Berthiaume et al. 2004) provide a number of changes in metabolic processes as a result of the thermal injury. Significant similarities between these observations and our selections were identified: (i) fatty acid metabolism increases after burn injury, cluster 4 most highly correlated with FA metabolism follows similar temporal patterns; (ii) cholesterol biosynthesis, exhibiting strong down-regulation following an upregulated spike, was found to be most abundant in genes of cluster 6; (iii) ATP biochemical measurements indicate a upward spike followed by decreased levels and cluster 6 was most highly associated electron transport and follow closely ATP dynamics. Finally, we employed Network Component Analysis (Liao, Boscolo et al. 2003; Kao, Yang et al. 2004) as a basis for reconstructing signals present in gene expression profiles and quantifying the strength of the connections between genes and transcription factors as well the levels of the corresponding TF activities. A total of 133 transcription factors were identified and their activities quantified. A sample is depicted in Figure 4. Among the leading TFs, known inflammation-specific TFs are strongly modulated (e.g., HSF, IRF, cAMP, etc.)
3. Summary We presented a novel approach for the analysis of temporal expression data. We demonstrated how to integrate gene expression analyses techniques, gene selection algorithms and functional and regulatory characterization tools in order to analyze complex physiological responses. The framework was demonstrated in the context of a post-injury hypermetabolic rat liver.
Figure 3: Conditional probabilities of motif-specific transcription factors and ontologies
Gen
e O
ntol
ogy
Inde
x
Tran
scrip
tion
Fact
or In
dex
An Integrative Systems Biology Approach for Analyzing Liver Hypermetabolism 1659
4. References Alon, U., N. Barkai, et al. (1999). Broad patterns of gene expression revealed by clustering
analysis of tumor and normal colon tissues probed by oligonucleotide arrays. Proc Natl Acad Sci U S A 96(12): 6745-50.
Androulakis, I. P., J. Vitolo, et al. (2005). Selecting maximally informative genes to enable temporal expression profiling analysis. Proceedings of Foundations of Systems Biology in Engineering, Santa Barbara, CA.
Chen, C. L., Z. Fei, et al. (2003). Metabolic fate of extrahepatic arginine in liver after burn injury." Metabolism 52(10): 1232-9.
Chinnaiyan, A. M., M. Huber-Lang, et al. (2001). "Molecular signatures of sepsis: multiorgan gene expression profiles of systemic inflammation. Am J Pathol 159(4): 1199-209.
Evans, T. W. and M. Smithies (1999). ABC of intensive care: organ dysfunction. Bmj 318(7198): 1606-9.
Golub, T. R., D. K. Slonim, et al. (1999). Molecular classification of cancer: class discovery and class prediction by gene expression monitoring. Science 286(5439): 531-7.
Jayaraman, A., M. L. Yarmush, et al. (2000). Dynamics of gene expression in rat hepatocytes under stress. Metab Eng 2(3): 239-51.
Jegga, A. G., S. P. Sherwood, et al. (2002). Detection and visualization of compositionally similar cis-regulatory element clusters in orthologous and coordinately controlled genes" Genome Res 12(9): 1408-17.
Kaminski, N., J. D. Allard, et al. (2000). Global analysis of gene expression in pulmonary fibrosis reveals distinct programs regulating lung inflammation and fibrosis. Proc Natl Acad Sci U S A 97(4): 1778-83.
Kao, K. C., Y. L. Yang, et al. (2004). Transcriptome-based determination of multiple transcription regulator activities in Escherichia coli by using network component analysis. Proc Natl Acad Sci U S A 101(2): 641-6.
Keogh, E., J. Lin, et al. (2005). HOT SAX: Efficiently finding the most unusual time series subsequences. 5th IEEE International Conference on Data Mining.
Lee, K., F. Berthiaume, et al. (2000). Metabolic flux analysis of postburn hepatic hypermetabolism. Metab Eng 2(4): 312-27.
Liao, J. C., R. Boscolo, et al. (2003). Network component analysis: reconstruction of regulatory signals in biological systems. Proc Natl Acad Sci U S A 100(26): 15522-7.
Rassokhin, D. N. and D. K. Agrafiotis (2000). Kolmogorov-Smirnov statistic and its application in library design. J Mol Graph Model 18(4-5): 368-82.
Vemula, M., F. Berthiaume, et al. (2004). Expression profiling analysis of the metabolic and inflammatory changes following burn injury in rats. Physiol Genomics 18(1): 87-98.
Figure 4: Transcription factor activities exhibiting largest variability
E. Yang et al.1660