Environmentally responsive nanoparticle-based luminescent optical resonators
Upload
khangminh22Category
view
1download
0
An integrated assessment of nanoparticle exposures in the ceramic industry
Apostolos Salmatonidis
ADVERTIMENT. La consulta d’aquesta tesi queda condicionada a l’acceptació de les següents condicions d'ús: La difusió d’aquesta tesi per mitjà del servei TDX (www.tdx.cat) i a través del Dipòsit Digital de la UB (diposit.ub.edu) ha estat autoritzada pels titulars dels drets de propietat intelꞏlectual únicament per a usos privats emmarcats en activitats d’investigació i docència. No s’autoritza la seva reproducció amb finalitats de lucre ni la seva difusió i posada a disposició des d’un lloc aliè al servei TDX ni al Dipòsit Digital de la UB. No s’autoritza la presentació del seu contingut en una finestra o marc aliè a TDX o al Dipòsit Digital de la UB (framing). Aquesta reserva de drets afecta tant al resum de presentació de la tesi com als seus continguts. En la utilització o cita de parts de la tesi és obligat indicar el nom de la persona autora. ADVERTENCIA. La consulta de esta tesis queda condicionada a la aceptación de las siguientes condiciones de uso: La difusión de esta tesis por medio del servicio TDR (www.tdx.cat) y a través del Repositorio Digital de la UB (diposit.ub.edu) ha sido autorizada por los titulares de los derechos de propiedad intelectual únicamente para usos privados enmarcados en actividades de investigación y docencia. No se autoriza su reproducción con finalidades de lucro ni su difusión y puesta a disposición desde un sitio ajeno al servicio TDR o al Repositorio Digital de la UB. No se autoriza la presentación de su contenido en una ventana o marco ajeno a TDR o al Repositorio Digital de la UB (framing). Esta reserva de derechos afecta tanto al resumen de presentación de la tesis como a sus contenidos. En la utilización o cita de partes de la tesis es obligado indicar el nombre de la persona autora. WARNING. On having consulted this thesis you’re accepting the following use conditions: Spreading this thesis by the TDX (www.tdx.cat) service and by the UB Digital Repository (diposit.ub.edu) has been authorized by the titular of the intellectual property rights only for private uses placed in investigation and teaching activities. Reproduction with lucrative aims is not authorized nor its spreading and availability from a site foreign to the TDX service or to the UB Digital Repository. Introducing its content in a window or frame foreign to the TDX service or to the UB Digital Repository is not authorized (framing). Those rights affect to the presentation summary of the thesis as well as to its contents. In the using or citation of parts of the thesis it’s obliged to indicate the name of the author.

Faculty of Chemistry
Doctoral program “Analytical Chemistry and the Environment”
An integrated assessment of nanoparticle
exposures in the ceramic industry
Apostolos Salmatonidis
PhD Thesis
Barcelona, July 2019
Supervisors Tutor
Dr. María del Mar Viana Rodríguez
(IDAEA-CSIC) Dr. Ángeles Sahuquillo Estrugo
(UB, Faculty of Chemistry) Prof. Dr. Eliseo Monfort Gimeno
(ITC-UJI)

To the beacons of my life
Artemis, Konstantinos, Mar
“ἕν οἶδα, ὅτι οὐδέν οἶδα”
free interpretation: “I know one thing, that I know nothing”
attributed to: Socrates (Greek philosopher, ca. 470-399 BC)
iv
Summary
Exposure to nanoparticles has been associated with adverse effects on human health. When the
exposure route is inhalation, nanoparticles can cause pulmonary inflammation which may be more
severe than from fine particles, while significant associations between nanoparticles and
cardiovascular morbidity have also been also observed. Consequently, industrial processes which
release airborne nanoparticles into workplace air have become an issue of growing concern with
regard to occupational exposure and potential health hazards for workers. Nanoparticles emitted by
industrial activities may be engineered and used as input/output in a process, or formed
unintentionally as a result of a given industrial activity and are referred to as process-generated
nanoparticles. The latter have high probability to be released from high energy processes (e.g.
thermal) and to impact exposure in various scenarios at diverse industrial settings.
The present PhD Thesis has three main objectives: to identify nanoparticle sources in industrial
settings and characterize their release mechanisms, to characterize the different exposure scenarios,
and to assess the effectiveness of mitigation strategies for exposure reduction. These objectives were
addressed by applying an integrated assessment of nanoparticle exposures in real-world scenarios.
All of the industrial scenarios studied were related to the ceramic industry (e.g. laser ablation of
ceramic tiles, thermal spraying of ceramic coatings). The results obtained are presented in the form
of four scientific papers.
The first scientific publication (1) identified pulsed laser ablation of ceramic tiles as a source of
process-generated nanoparticles. This work studied the mechanisms controlling nanoparticle
formation and release during ablation of different types of ceramic tiles. High particle number
concentrations were detected (3.5×10⁴ to 2.5×106 cm-3) for all of the tiles and with both lasers
assessed (near- and mid-infrared). Different particle release mechanisms were identified: during
ablation with the near-IR laser particles were emitted through melting and nucleation, while
emissions from the mid-IR laser were attributed to melting and mechanical shockwaves. Particle
number and mass emissions were dependent on the tile surface characteristics as well as the laser
parameters.
The second publication (2) characterized nanoparticle emissions and their impact on exposure
during thermal spraying of ceramic coatings in a real-world industrial scenario. High particle number
(>106 cm−3; 30–40 nm) and mass (60–600 μgPM1 m−3) concentrations were recorded inside the
spraying booths, which impacted exposure in the worker area (104–105 cm−3, 40–65 nm; 44–87
μgPM1 m−3). Irregularly-shaped, metal-containing particles (Ni, Cr, W) were sampled from the worker

v
area and a direct link between the spraying activity and exposure was established. In terms of particle
number count, 90% of the particles were nanoparticles with sizes 26–90 nm. The third publication
(3) discussed the hygroscopic properties of these nanoparticles, which were monitored online with
an HTDMA. The nanoparticles emitted were found to take up moderate amounts of water when
exposed to elevated relative humidity (87% RH), with their hygroscopicity being distinguishably
lower compared to that of the atmospheric background aerosol particles present in the workplace
air. Thus, particle hygroscopicity was identified as a useful metric to discriminate process-generated
from background particles in workplace air.
Finally, the fourth scientific publication (4) quantified the effectiveness of mitigation strategies
implemented during four different exposure scenarios under real-world settings. The nanoparticle
removal efficiency of source enclosure combined with local exhaust ventilation was quantified to
range between 65-99%, The highest efficiency was achieved by the combined use of a strong local
exhaust ventilation with full enclosure (99.8%), tested during thermal spraying. Source substitution
achieved a 91.5% reduction of exposure concentrations in the worker breathing zone, lower than the
expected 100% due to interference from simultaneous sources. Mask respirators managed to reduce
worker exposure by 86.7%, whereas source isolation reached maximum efficiency of 84.4%. The
results highlight the interdependence of different mitigation strategies (e.g., LEV and source
enclosure), which are frequently implemented simultaneously in real-world industrial scenarios. The
mitigation measures for exposure reduction have proven to be more efficient when tailored to each
specific industrial scenario.
The combination of key information and analyses deriving from the experimental scenarios assessed
allowed to extract conclusions and recommendations with direct application to the industrial sector
under study.

vi
Resumen
La exposición a nanopartículas se asocia con efectos adversos en la salud humana. En consecuencia,
las actividades industriales que liberan nanopartículas al aire en entornos laborales se han
convertido en un problema de creciente relevancia desde el punto de vista de salud ocupacional y de
los riesgos potenciales para la salud de los trabajadores. Las nanopartículas emitidas por actividades
industriales pueden diseñarse y utilizarse como materia prima en procesos industriales, o formarse
involuntariamente como resultado de una actividad industrial dada (estas últimas, denominadas con
frecuencia nanopartículas de proceso). Las nanopartículas de proceso tienen una alta probabilidad
de liberarse durante actividades altamente energéticas (por ejemplo, procesos térmicos) y de
generar situaciones de exposición laboral en diversos escenarios y entornos industriales.
La presente tesis doctoral tiene tres objetivos principales: identificar fuentes de emisión de
nanopartículas en entornos industriales y caracterizar sus mecanismos de liberación, caracterizar
los diferentes escenarios de exposición, y evaluar la efectividad de las estrategias de mitigación para
la reducción de la exposición. Estos objetivos se abordaron mediante la aplicación de una evaluación
integrada de la exposición a nanopartículas en escenarios industriales reales (no en laboratorio).
Todos los escenarios industriales estudiados estaban relacionados con procesos térmicos asociados
a la industria cerámica (por ejemplo, ablación por láser de baldosas cerámicas, proyección térmica
de recubrimientos cerámicos). Los resultados obtenidos se presentan en forma de cuatro
publicaciones científicas.
La primera publicación científica (1) identificó la ablación por láser pulsado de baldosas cerámicas
como una fuente de nanopartículas de proceso. La segunda publicación (2) describió las emisiones
de nanopartículas y su impacto en la exposición durante la proyección térmica de recubrimientos
cerámicos en un escenario industrial. La tercera publicación (3) analizó las propiedades
higroscópicas de estas nanopartículas, que se monitorearon en línea con un HTDMA. Finalmente, la
cuarta publicación científica (4) cuantificó la efectividad de las estrategias de mitigación
implementadas en cuatro escenarios de exposición diferentes, en entornos industriales bajo
condiciones reales de operación.
La combinación de información clave y de los análisis derivados de los escenarios experimentales
evaluados permitió extraer conclusiones y recomendaciones con aplicación directa al sector
industrial cerámico.
vii
Contents
Table of Contents
Summary .................................................................................................................................................................................. iv
Resumen .................................................................................................................................................................................. vi
Contents .................................................................................................................................................................................. vii
1. Introduction ........................................................................................................................................................................1
1.1. Air pollution and health ...................................................................................................................................... 2
1.1.1. Air pollution – history and health effects .......................................................................................... 2
1.1.2. Aerosols inhalation and toxicological response ............................................................................. 3
1.2. Nanoparticles – definition and classification ............................................................................................. 6
1.2.1. Definition of nanoparticles particles based on their size ............................................................ 6
1.2.2. Origin and types of nanoparticles in the air – anthropogenic & natural .............................. 7
1.2.3. Nanoparticle sources and impacts on occupational exposure .................................................. 9
1.2.4. Exposure assessment & characterization ....................................................................................... 11
1.3. Nanoparticle exposure in the ceramic industry .................................................................................... 12
1.4. Mitigation measures & risk management ................................................................................................ 13
1.4.1. Mitigation strategies ................................................................................................................................ 13
1.4.2. Occupational risk management & hierarchy of controls .......................................................... 14
1.5. Legislation & Regulations ............................................................................................................................... 15
1.6. Gap analysis and motivation .......................................................................................................................... 16
2. Scope, objectives and structure ............................................................................................................................ 18
2.1. Scope and objectives .......................................................................................................................................... 19
2.2 Thesis structure .................................................................................................................................................... 21
3. Methodology .................................................................................................................................................................... 24
3.1. Measurement principles, instrumentation, and particle characterization techniques ......... 25
3.1.1. Real-time aerosol measurements – Online instruments ................................................................ 25
3.1.2. Characterization techniques – offline measurements ...................................................................... 33
3.2. Monitoring strategy ............................................................................................................................................ 36
4. Results ................................................................................................................................................................................. 38
4.1. Scientific publication 1 ...................................................................................................................................... 40
viii
4.2. Scientific publication 2 ...................................................................................................................................... 75
4.3. Scientific publication 3 ................................................................................................................................... 107
4.4. Scientific publication 4 ................................................................................................................................... 145
5. Discussion ...................................................................................................................................................................... 169
5.1. Nanoparticle formation and emission mechanisms .......................................................................... 170
5.2. Exposure scenarios characterization ....................................................................................................... 174
5.2.1. Exposure assessment ............................................................................................................................ 174
5.2.2. Particle characterization ..................................................................................................................... 176
5.3. Exposure mitigation ....................................................................................................................................... 180
6. Conclusions ................................................................................................................................................................... 184
6.1. Particle formation and release mechanisms ........................................................................................ 185
6.2. Exposure scenarios ......................................................................................................................................... 187
6.3. Mitigation measures ....................................................................................................................................... 189
7. Limitations and future work ............................................................................................................................... 190
7.1. Limitations .......................................................................................................................................................... 191
7.1.1. Technical limitations ............................................................................................................................ 191
7.1.2 Operational and methodological limitations ............................................................................... 191
7.2. Particle characterization ............................................................................................................................... 192
7.2.1. Application of the data to models ................................................................................................... 192
7.2.2. Application of the results to health risks and prevention .................................................... 192
References .......................................................................................................................................................................... 194
Annex: Abbreviations and Acronyms .................................................................................................................. 212
Acknowledgments .......................................................................................................................................................... 215

1
Chapter 1. Introduction

Chapter 1. Introduction
2
1. Introduction
1.1. Air pollution and health
1.1.1. Air pollution – history and health effects
Air pollution has been accompanying human activity since the ancient times, when concerns were
raised by Roman philosopher and statesman Seneca1 in A.D. 61. Lawsuits over smoke pollution were
presented in Roman courts, when the jurist Titus Aristo declared that “a cheese shop could not
discharge smoke into the buildings above it”. The first legislative action against pollution was adopted
in Constantinople by the Byzantine emperor Justinian in 535 AD, where clean air was declared as a
birthright: “by the law of nature these things are common to mankind – the air, running water, the sea”.
“Fumifugium” was the first systematic report written by John Evelyn in 1661, which explicitly
associated the burning of coal in London with poor air quality and health effects: “the capital’s
‘otherwise wholesome and excellent Aer' is corrupted by a 'Hellish cloud of seacoal' and so its
inhabitants 'breathe nothing but an impure and thick Mist accompanied with a fulginous and filthy
vapor' corrupting the lungs and provoking coughs and catarrh”. Furthermore, drastic mitigation
measures were proposed, such as the relocation of industrial buildings from the center of the city to
regions where smoke could be diverted from urban areas by wind currents (Jenner, 1995). More
recent events such as the infamous London Smog in 1952 led to the implementation of air quality
limit values such as the UK Clean Air Act in 1956.
Environmental factors, in particular ambient air pollution pose risks with health implications. At
present, ambient air pollution is associated with millions of premature deaths globally every year
(WHO, 2016). In areas of the globe with high levels of ambient air pollution, such as India, one out of
every eight deaths could be attributed to air pollution (Balakrishnan et al., 2019). Recent studies
demonstrated that chronic exposure to high levels of airborne particulate matter impairs vascular
function, which can lead to myocardial infarction, arterial hypertension, stroke, and heart failure
(Lelieveld et al., 2019). Air pollution was responsible in 2015 for 19% of all cardiovascular deaths
worldwide, 24% of ischemic heart disease deaths, 21% of stroke deaths, and 23% of lung cancer
deaths (Landrigan, 2017). Sensitive population groups such as children and infants are most
vulnerable to air pollutants (Kim and American Academy of Pediatrics Committee on Environmental
Health, 2004). There is evidence linking air pollution with adverse effects on different birth outcomes
1 Seneca the Younger (c. 4 BC-65 AD)
Chapter 1. Introduction
3
(Šrám et al., 2005), whereas respiratory symptoms, preterm birth, infant mortality, deficits in lung
growth and asthma are also associated with air pollution (Kim and American Academy of Pediatrics
Committee on Environmental Health, 2004). Lelieveld et al. (2015) predicted that under the current
circumstances premature mortality will increase in Europe and the Americas mainly in urban areas;
while large increases are estimated in Southeast Asia and the Western Pacific, will lead to a global
growth of premature mortality to 6.6 million in 2050.
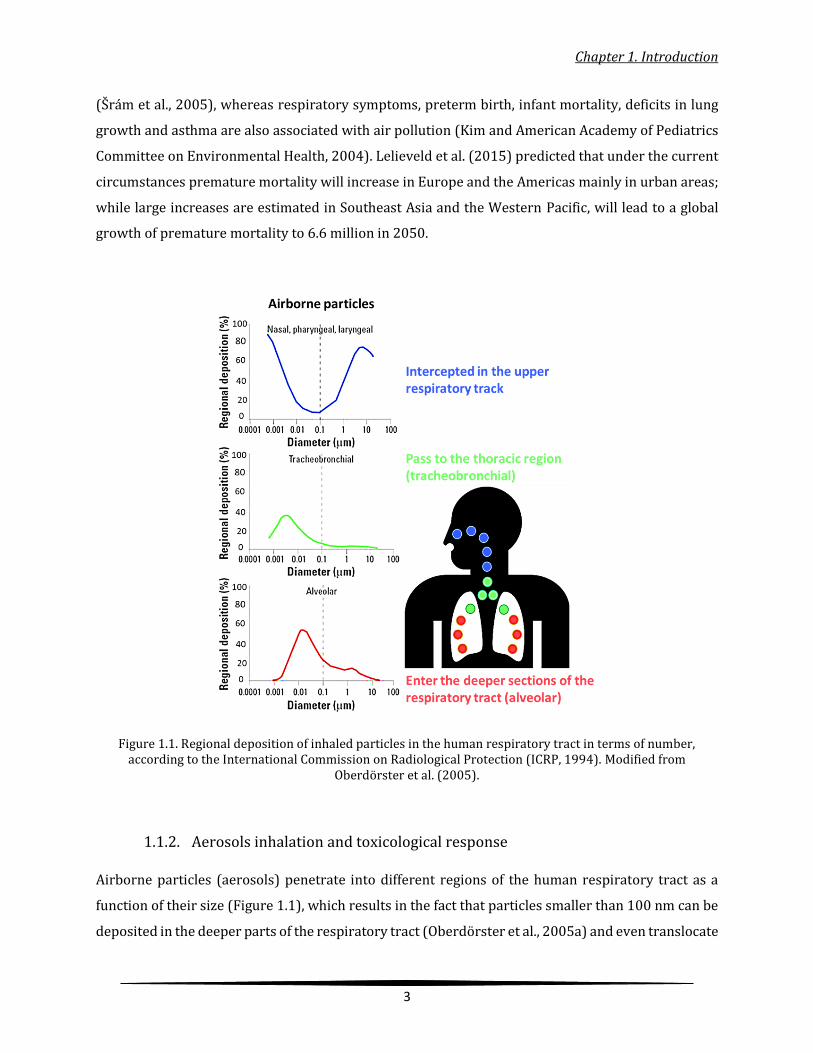
Figure 1.1. Regional deposition of inhaled particles in the human respiratory tract in terms of number, according to the International Commission on Radiological Protection (ICRP, 1994). Modified from
Oberdörster et al. (2005).
1.1.2. Aerosols inhalation and toxicological response
Airborne particles (aerosols) penetrate into different regions of the human respiratory tract as a
function of their size (Figure 1.1), which results in the fact that particles smaller than 100 nm can be
deposited in the deeper parts of the respiratory tract (Oberdörster et al., 2005a) and even translocate
Chapter 1. Introduction
4
to other organs through the bloodstream. Pope et al. (1995) associated air pollution with respiratory
disease and cardiopulmonary mortality based on epidemiological evidence. Ferin et al. (1992)
demonstrated that particles below 2.5 µm are responsible for pulmonary retention in rats, while
Donaldson et al. (2002) reported that inhalation of particles smaller than 100 nm could lead to
attacks of airways disease and systemic effects. Thereafter, numerous studies linked these particles
(i.e. smaller than 100 nm) to adverse health effects mainly due to exposure through inhalation
(Araujo et al., 2008; Hoek et al., 2010; Ibald-Mulli et al., 2002; Knibbs et al., 2011; Landrigan et al.,
2017; Oberdörster and Utell, 2002). Inhaled nanoparticles are deposited in the respiratory tract
mainly through diffusion (displacement due to collisions); whereas other mechanisms such as
inertial impaction, gravitational sedimentation, interception affect larger particles and do not
contribute to nanoparticle deposition (Oberdörster et al., 2005a).
Toxicological assessments of particles were carried out to understand the mechanisms leading to
different morbidity cases (Donaldson et al., 2001b). The mechanism driving toxicological response
to particles smaller than 100 nm can be summarized in different stages (Donaldson et al. (2001a):
Impaired phagocytosis, when alveolar macrophage molecules are unable to clear lungs from
particles, leads to particle accumulation.
Increased interaction of the accumulated particles with the epithelium and the high oxidative
stress due to particles’ large surface area.
Mediators (cytokine and chemokine) released due to oxidative stress, is considered a pro-
inflammatory state which may lead to inflammation.
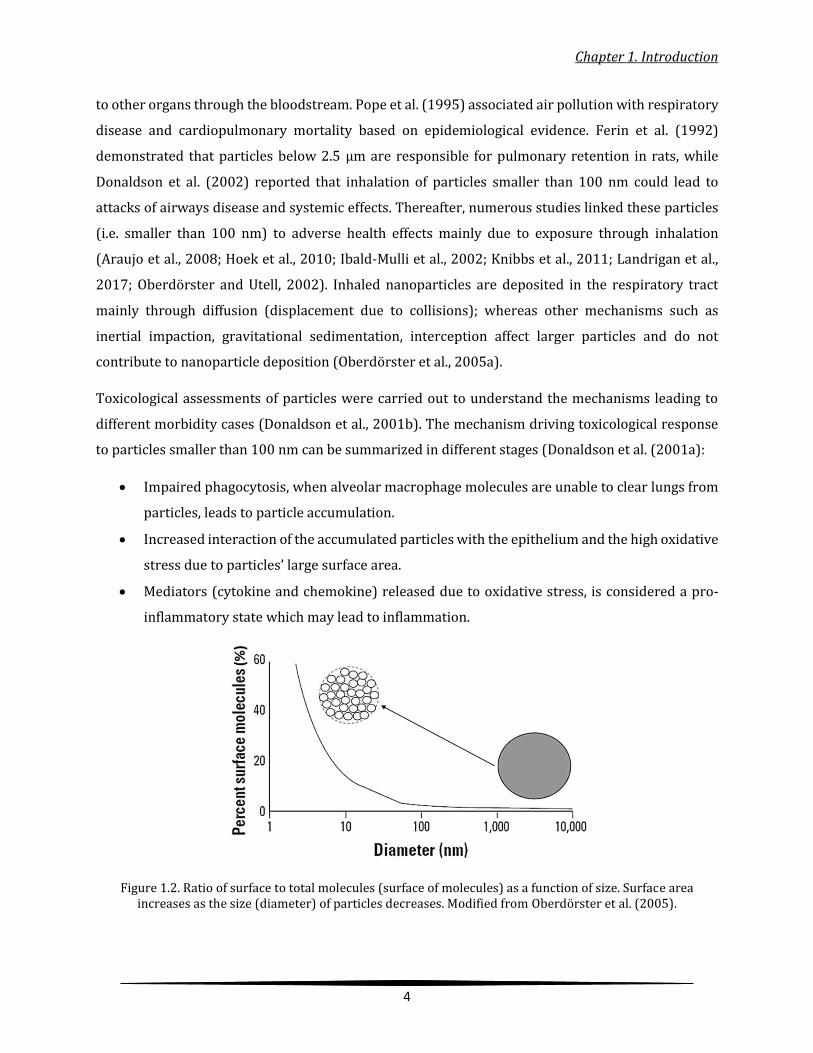
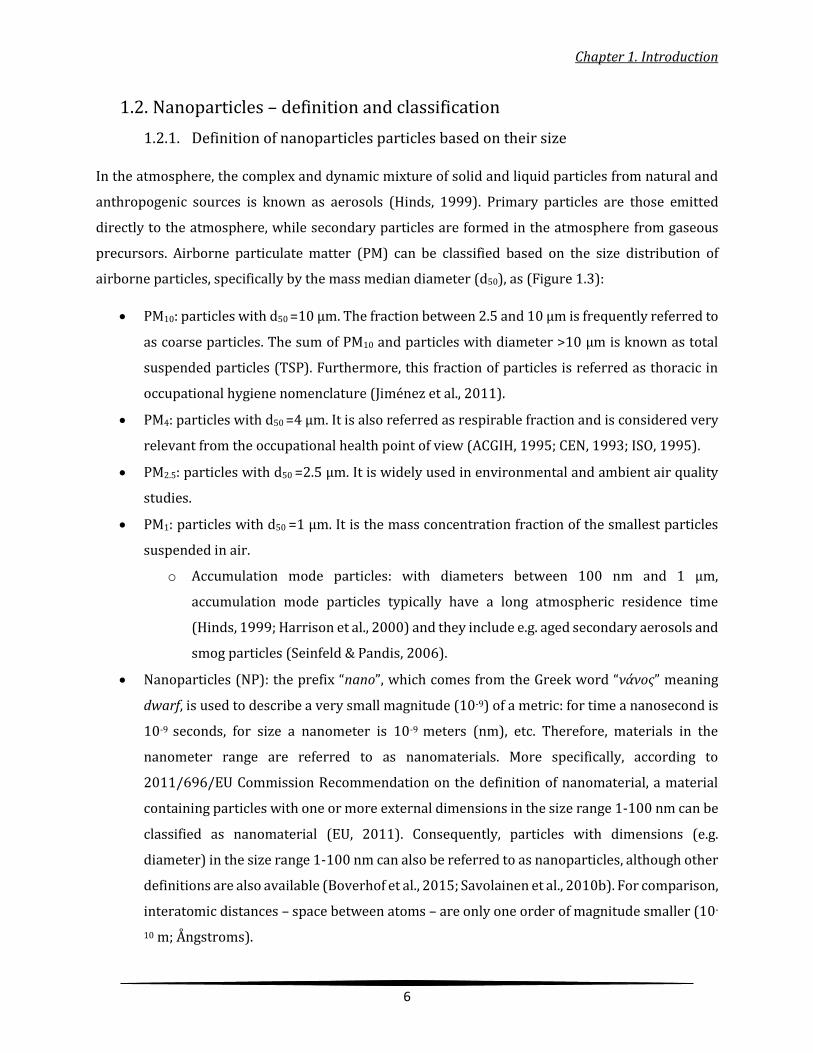
Figure 1.2. Ratio of surface to total molecules (surface of molecules) as a function of size. Surface area increases as the size (diameter) of particles decreases. Modified from Oberdörster et al. (2005).
Chapter 1. Introduction
5
Particle surface area increases exponential below 100 nm (Figure 1.2), and may significantly affect
toxicity responses and induction of oxidative stress (Oberdörster et al., 2005b). Although it can be
very challenging to measure particles bellow 10 nm, it is also very relevant because the surface area
of particles >10 nm increases sharply (Figure 1.2). The deposited surface area can be a predictor of
pulmonary inflammation (Donaldson et al., 2002). Particle inhalation is related with risk of
cardiovascular disease through inflammation and with induced acute phase response (Saber et al.,
2014). The acute phase response is the systemic response to acute and chronic inflammatory states
caused by e.g. bacterial infection. Drivers of acute phase response are associated with risk of
cardiovascular disease, including asthma and air pollution exposure (Gabay and Kushner, 1999). A
direct connection between particle inhalation and acute phase response was also proven in
experiments with human volunteers (Monsé et al., 2018).
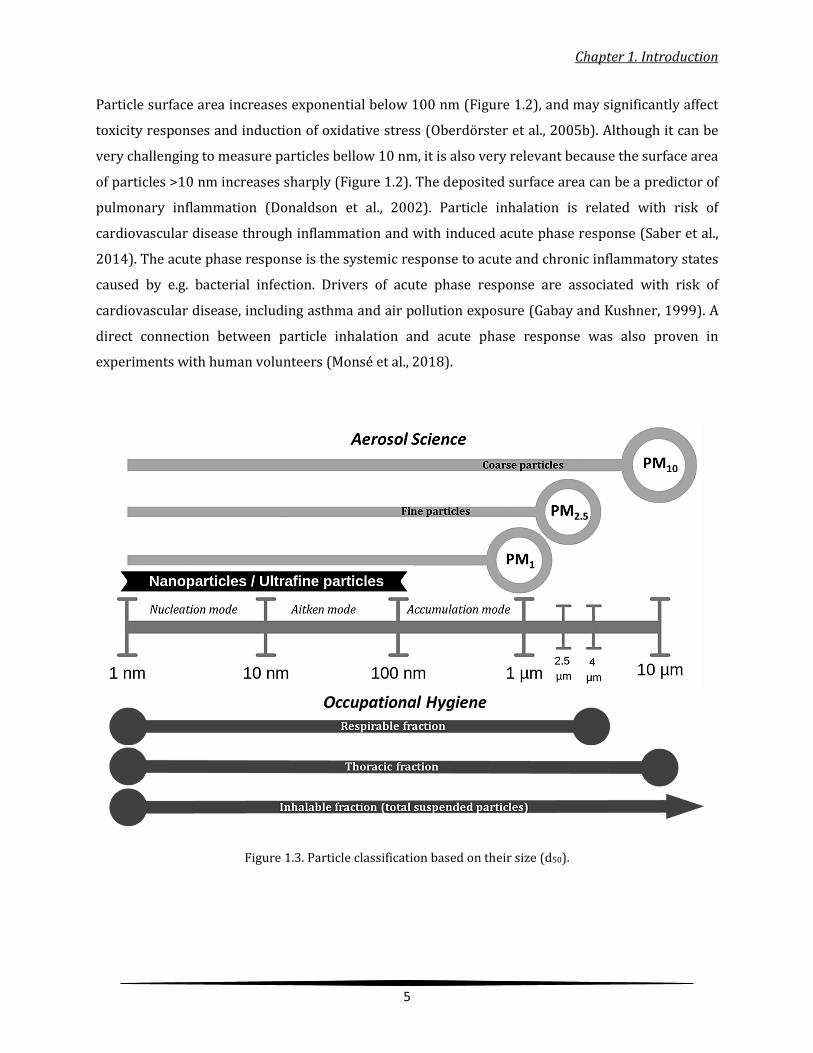
Figure 1.3. Particle classification based on their size (d50).
Chapter 1. Introduction
6
1.2. Nanoparticles – definition and classification
1.2.1. Definition of nanoparticles particles based on their size
In the atmosphere, the complex and dynamic mixture of solid and liquid particles from natural and
anthropogenic sources is known as aerosols (Hinds, 1999). Primary particles are those emitted
directly to the atmosphere, while secondary particles are formed in the atmosphere from gaseous
precursors. Airborne particulate matter (PM) can be classified based on the size distribution of
airborne particles, specifically by the mass median diameter (d50), as (Figure 1.3):
PM10: particles with d50 =10 µm. The fraction between 2.5 and 10 µm is frequently referred to
as coarse particles. The sum of PM10 and particles with diameter >10 µm is known as total
suspended particles (TSP). Furthermore, this fraction of particles is referred as thoracic in
occupational hygiene nomenclature (Jiménez et al., 2011).
PM4: particles with d50 =4 µm. It is also referred as respirable fraction and is considered very
relevant from the occupational health point of view (ACGIH, 1995; CEN, 1993; ISO, 1995).
PM2.5: particles with d50 =2.5 µm. It is widely used in environmental and ambient air quality
studies.
PM1: particles with d50 =1 µm. It is the mass concentration fraction of the smallest particles
suspended in air.
o Accumulation mode particles: with diameters between 100 nm and 1 µm,
accumulation mode particles typically have a long atmospheric residence time
(Hinds, 1999; Harrison et al., 2000) and they include e.g. aged secondary aerosols and
smog particles (Seinfeld & Pandis, 2006).
Nanoparticles (NP): the prefix “nano”, which comes from the Greek word “νάνος” meaning
dwarf, is used to describe a very small magnitude (10-9) of a metric: for time a nanosecond is
10-9 seconds, for size a nanometer is 10-9 meters (nm), etc. Therefore, materials in the
nanometer range are referred to as nanomaterials. More specifically, according to
2011/696/EU Commission Recommendation on the definition of nanomaterial, a material
containing particles with one or more external dimensions in the size range 1-100 nm can be
classified as nanomaterial (EU, 2011). Consequently, particles with dimensions (e.g.
diameter) in the size range 1-100 nm can also be referred to as nanoparticles, although other
definitions are also available (Boverhof et al., 2015; Savolainen et al., 2010b). For comparison,
interatomic distances – space between atoms – are only one order of magnitude smaller (10-
10 m; Ångstroms).
Chapter 1. Introduction
7
Ultrafine particles (UFPs): particles with diameter <100 nm, therefore including the Aitken
(10-100 nm) and nucleation modes (1-10 nm).
o Aitken mode particles: with diameters between 10-100 nm, Aitken mode particles
originate from primary emissions (e.g., soot) and from coagulation/condensation of
nucleation mode particles (Hinds, 1999; Kulmala et al., 2004; Seinfeld & Pandis,
2006).
o Nucleation mode particles: particles with diameters <10 nm and formed from
gaseous precursors, and which rapidly grow by condensation or coagulation with
other particles (Hinds, 1999; Kulmala et al., 2004; Seinfeld & Pandis, 2006).
Thus, it is noticeable that ultrafine particles (UFPs) and nanoparticles (NPs) are equivalent in terms
of particle diameter. Each term is used typically in a different research field: while the term UFPs is
frequently used in aerosol research, e.g. covering ambient air quality, the term “nanoparticle” is often
used in nanotechnology, indoor/workplace studies and regulation (e.g., EU, 2011). In the present
Thesis the term nanoparticle (NP) will be used to refer to particles with diameter <100 nm.
1.2.2. Origin and types of nanoparticles in the air – anthropogenic & natural
Aerosols deriving from natural sources are dominant in the atmosphere at global scale in terms of
mass concentration (<80%), while human activities contribute with a relatively small fraction
(Deepshikha and Srinivasan, 2010; Voiland, 2010). Natural phenomena can produce nanoparticles,
which are then released to the environment, with varying chemical composition and morphology
depending on their sources. A large portion of atmospheric coarse and fine aerosols originate from
dust transport; specifically, African mineral dust contributes to increased PM concentrations in
southern Europe (Pey et al., 2013; Viana et al., 2014). Volcanic eruptions release gases (CO2, SO2 and
HCl) and water vapors (von Glasow, 2010), but also significant amounts of particulate matter
including nanoparticles (Buzea et al., 2007). Wildfires are an increasingly relevant phenomenon,
during which carbonaceous emissions including nanoparticles are generated (Buzea et al., 2007).
Secondary aerosols (<100nm; from nucleation processes) are emitted from seas and oceans around
the world (O’Dowd and De Leeuw, 2007). All of the above natural sources are potential nanoparticle
emitters (Sadik, 2013).
Anthropogenic2 nanoparticle sources, on the other hand, involve human activities. When
nanoparticles are intentionally manufactured they are known as engineered nanoparticles (ENPs;
2 Anthropos – Greek word for human ( Άνθρωπος)

Chapter 1. Introduction
8
Table 1.1), which are particles synthesized with specific characteristics (i.e. size, shape, chemical
composition) and properties (e.g. optical, catalytic, surface chemistry) and for defined purpose or
application. At the nanoscale, quantum-mechanical phenomena, Brownian motion, surface and
interface interactions are much more pronounced than in the case of the macroscale, hence, the novel
properties of nanomaterials. Nowadays, nanotechnology is a growing field and is gradually
transforming a broad range of industrial sectors (cosmetics, electronics, automotive, construction,
pharmaceutical and biomedicine; Schaming and Remita, 2015).
Aside from nanotechnology, nanoparticles may be formed and released unintentionally as a result of
human activities, e.g., during high-energy thermal or mechanical industrial activities (mechanical
machining of surfaces, thermal processes, combustion; Table 1.1). These particles are known as
incidental, process-generated (PGNPs) or non-engineered (n-ENPs), and as a result of their
unintentional formation they have no predetermined size, morphology or chemical composition. The
vast variability of physical and chemical characteristics of these nanoparticles is not fully understood
yet, because they strongly depend on the emission source and on the respective activity; and
therefore, create a knowledge gap. Examples are diesel exhaust (soot) and combustion particles
(BéruBé et al., 2007; D’Anna, 2009; Mills et al., 2011), fumes from different welding processes (Brand
et al., 2013b; Cena et al., 2015; Graczyk et al., 2015; Jenkins et al., 2005; Lehnert et al., 2012; Sowards
et al., 2008; Zimmer and Biswas, 2001) and rubber vulcanization (van Broekhuizen, 2017). In
addition, mechanical processes such abrasion (Bello et al., 2009), gridding (Zimmer and Maynard,
2002), shredding (Raynor et al., 2012), drilling (van Broekhuizen et al., 2011) and sanding (van
Broekhuizen, 2017) release PGNPs. Moreover, PGNPs are emitted by printing technologies e.g. during
laser printing (Koivisto et al., 2010; Morawska et al., 2009) and 3D-printing (Gu et al., 2019; Stephens
et al., 2013; Zhou et al., 2015). Furthermore, PGNPs are released during asphalt working (Elihn et al.,
2008), metal casting (Evans et al., 2008) and also from high energy processes (Fonseca et al., 2016a,
2015; Salmatonidis et al., 2019a, 2018). The emission mechanisms and the physical-chemical
properties of unintentionally-released nanoparticles are strongly dependent on the features of the
industrial process generating them. Consequently, the broad variety of industrial activities and
potential nanoparticle emission sources result in a large variability of potential nanoparticle
emissions and associated health hazards.
Chapter 1. Introduction
9
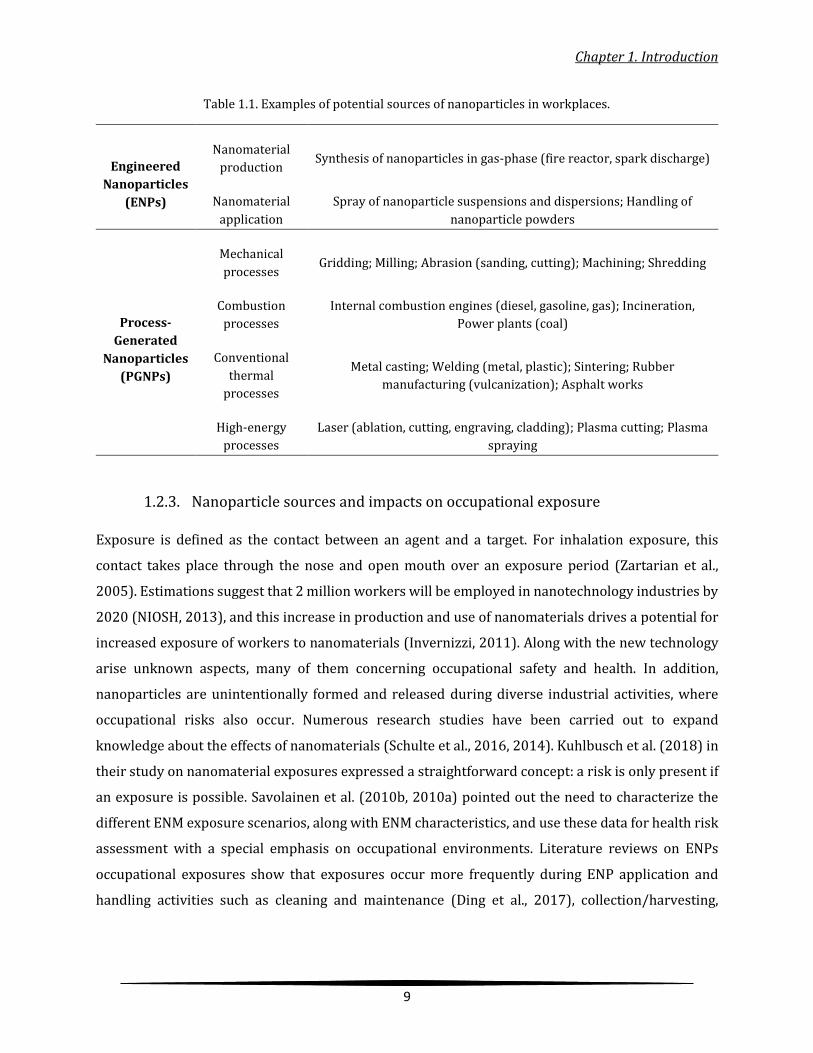
Table 1.1. Examples of potential sources of nanoparticles in workplaces.
Engineered
Nanoparticles
(ENPs)
Nanomaterial
production Synthesis of nanoparticles in gas-phase (fire reactor, spark discharge)
Nanomaterial
application
Spray of nanoparticle suspensions and dispersions; Handling of
nanoparticle powders
Process-
Generated
Nanoparticles
(PGNPs)
Mechanical
processes Gridding; Milling; Abrasion (sanding, cutting); Machining; Shredding
Combustion
processes
Internal combustion engines (diesel, gasoline, gas); Incineration,
Power plants (coal)
Conventional
thermal
processes
Metal casting; Welding (metal, plastic); Sintering; Rubber
manufacturing (vulcanization); Asphalt works
High-energy
processes
Laser (ablation, cutting, engraving, cladding); Plasma cutting; Plasma
spraying
1.2.3. Nanoparticle sources and impacts on occupational exposure
Exposure is defined as the contact between an agent and a target. For inhalation exposure, this
contact takes place through the nose and open mouth over an exposure period (Zartarian et al.,
2005). Estimations suggest that 2 million workers will be employed in nanotechnology industries by
2020 (NIOSH, 2013), and this increase in production and use of nanomaterials drives a potential for
increased exposure of workers to nanomaterials (Invernizzi, 2011). Along with the new technology
arise unknown aspects, many of them concerning occupational safety and health. In addition,
nanoparticles are unintentionally formed and released during diverse industrial activities, where
occupational risks also occur. Numerous research studies have been carried out to expand
knowledge about the effects of nanomaterials (Schulte et al., 2016, 2014). Kuhlbusch et al. (2018) in
their study on nanomaterial exposures expressed a straightforward concept: a risk is only present if
an exposure is possible. Savolainen et al. (2010b, 2010a) pointed out the need to characterize the
different ENM exposure scenarios, along with ENM characteristics, and use these data for health risk
assessment with a special emphasis on occupational environments. Literature reviews on ENPs
occupational exposures show that exposures occur more frequently during ENP application and
handling activities such as cleaning and maintenance (Ding et al., 2017), collection/harvesting,
Chapter 1. Introduction
10
spraying and finishing, as well as during those involving feeding into a process and handling of
powders (Basinas et al., 2018; Debia et al., 2016).
In industrial sectors unrelated to nanotechnology, exposures to unintentionally-released
nanoparticles occur during different types of activities (e.g. thermal, combustion, mechanical;
(Fonseca et al., 2014; Salmatonidis et al., 2018, 2019a; Van Broekhuizen et al., 2012b; Viana et al.,
2017). Other examples are mechanical processes such as grinding of bulk materials (e.g. ceramic,
metallic, wood; (Zimmer and Maynard, 2002), sanding operations (Göhler et al., 2010) or even dry
cutting of composite materials (Bello et al. (2009). Conventional heating processes have also been
observed to generate nanoparticle emissions, such as metal casting (Evans et al., 2008), rubber
manufacturing (Kim et al., 2013) and molding of polymers (van Broekhuizen, 2017). The same is true
for welding methods, where high concentrations both in terms of mass and number were released
(Brand et al., 2013a, 2013b), for which significant impacts on exposure were reported (Lehnert et al.,
2012). In ambient air, asphalt workers are exposed to nanoparticles, among other pollutants,
originating from asphalt fumes (Elihn et al., 2008), and nanoparticles are also released as combustion
byproducts from diesel and petrol engines (Burtscher, 2005; Donaldson et al., 2005). A literature
review (Viitanen et al., 2017) presented results according to which occupational exposure to
incidental nanoparticles may be significantly higher than exposure to background concentrations.
In the case of emissions of process-generated nanoparticles, emission mechanisms may differ
significantly between processes and result in the release of markedly different nanoparticle number
concentrations and chemical composition, which are two drivers of health effects along with
exposure duration and frequency. Indoor workplaces vary significantly in terms of infrastructure
(size and geometry of the facilities), mitigation strategies implemented, and number of workers.
Moreover, several activities are frequently carried out simultaneously, increasing the complexity of
source identification. This variety of activities, infrastructure and operating conditions, results in the
need for tailored and dedicated exposure assessments under the different industrial scenarios.
However, case specific exposure assessments are scarce and further research is necessary to fill this
gap. Finally, in ambient air, occupational exposure to nanoparticles may occur during e.g. asphalt
works, welding, or sanding of surfaces, where the effect of background aerosols (e.g. traffic) might be
significant.

Chapter 1. Introduction
11
1.2.4. Exposure assessment & characterization
Two basic conditions define exposure scenarios: (i) the emission source which drives the release
mechanisms; and (ii) the interaction between the particles and the target (worker), in particular
through the breathing air (Zartarian et al., 2005). Once exposure occurs, the characterization of the
exposure scenario becomes the next concern. Typically, exposure assessment strategies and
approaches are based on different aerosol metrics (Table 1.2), in order to address the complexity of
exposure to nanoparticles (Brouwer et al., 2004; Maynard and Aitken, 2007). The measurement of
the particular aerosol metrics can be performed either by real-time monitoring (online) or by
sampling and posterior analysis of the samples (offline). While particle mass concentration is
commonly used for ambient coarse and fine particles (Allen et al., 1997; Chow, 1995; Eleftheriadis et
al., 2014; Manoli et al., 2002; Querol et al., 2007, 2004a, 2004b; Viana et al., 2014, 2008), metrics used
in nanoparticle exposure assessments are biologically-relevant metrics such as surface area
(Oberdörster et al., 2005b; Schmid and Stoeger, 2017; Stoeger et al., 2006; Warheit et al., 2006) and
especially particle number concentration (Brouwer, 2010; Koivisto et al., 2012a; Tsai et al., 2009; Van
Broekhuizen et al., 2012a).
Table 1.2. Particle metrics typically used in particle exposure assessment
Metrics Units Measurement
Particle number concentration # / cm3 online
Mass concentration µg / m3 online / offline
Surface area concentration µg2 / cm3 online
Size & size distribution nm online
Chemical characterization µg/m3, ppm offline
Structural & morphological characterization not standardized offline
A critical point for exposure characterization is the discrimination of nanoparticles emitted by a
specific source from background aerosols (e.g., traffic soot) or from secondary sources (e.g., activities
running in parallel). A typically used approach for this purpose is the near-field/far-field approach
(Koivisto et al., 2015), according to which emissions monitoring takes place simultaneously in two

Chapter 1. Introduction
12
locations: the source (near-filed) and the background (far-field). The comparative analysis of the two
datasets, in terms of a specified metric (particle number/mass concentration) can indicate the
potential impact of the source on worker exposure. An alternative route to identify the potential
exposure risk of a source is based on the concept of statistical significance (Kaminski et al., 2015).
According to the latter, the background particle number concentration is determined during non-
activity periods in the worker area. Subsequently, particle number concentrations in the worker area
are monitored and, if greater than the background concentration plus three times the geometric
standard deviation of the background concentration, then the emissions are considered to
significantly impact exposure. Towards a harmonization of exposure assessments, a tiered approach
comprising of 3 tiers (initial, basic and expert) has been internationally recognized as standard
procedure (OECD, 2015).
1.3. Nanoparticle exposure in the ceramic industry
Ceramic manufacturing is one of the most ancient fabrication practices on the planet. There is
evidence that cobalt nanoparticles were unintentionally used in glass matrix since the Neolithic era
as pigment (Colomban, 2013). Hence, nanoparticles have been present for centuries in ceramic
production processes. Lycurgus Cup3 is a famous glasswork from the Roman period, which takes a
different color when illuminated from outside (green) and from inside (red). This is a combined effect
of metallic nanoparticles (50-100 nm), in particular red transmission due to the absorption of gold
and green reflectance due to the scattering of silver nanoparticles (Schaming and Remita, 2015).
Thus, artisans working with ceramics throughout history were probably unintentionally exposed to
nanoparticles.
Nowadays, as discussed above, the means to monitor and characterize the impact of different
industrial activities on worker exposure have been developed, allowing the identification of potential
health hazards. Sanfélix et al. (2018) demonstrated that a number of processes emit nanoparticles in
the ceramic industry. Incidental nanoparticles can be emitted from different processes applied in the
ceramic industry such as traditional pottery (Voliotis et al., 2014), ceramic tile sintering (Fonseca et
al., 2016a) and novel methods such as thermal spraying (Salmatonidis et al., 2019a), laser ablation of
ceramic tiles (Fonseca et al., 2015; Salmatonidis et al., 2018). Controlled experiments at pilot-plant
scale demonstrated the relevance of adequately implemented mitigation strategies for exposure
3 Fourth century CE
Chapter 1. Introduction
13
reduction in the case of thermal spraying (Viana et al., 2017). Hence, the literature review associated
the processing of ceramic materials at high energy stages with unintentional nanoparticle emissions.
1.4. Mitigation measures & risk management
1.4.1. Mitigation strategies
The efficient implementation of targeted mitigation strategies is key for exposure reduction. When
the emission source is clearly identified, exposure mitigation measures can be designed and applied
with a specific focus. Fonseca et al. (2014) found clear evidence of exposure risk to carbon nanotubes
(CNTs) during their manufacturing without local exhaust ventilation (LEV), while for the same case
no significant exposure was detected when LEV was implemented. Kuhlbusch et al. (2011) describe
several cases of worker exposure in nanotechnology workplaces despite the implementation of
mitigation measures. During application, processing and handling of ENMs the emission sources can
be identified and mitigation measures can be effectively implemented (Fonseca et al., 2018).
Moreover, Koivisto et al. (2017) demonstrated that a library comprising quantitative release data
from the processing of products containing ENMs could help predict exposure through modelling-
based assessments.
Viitanen et al. (2017) assessed publications dealing with industrial sources of PGNPs particles and
exposure concentrations in workplaces, concluded that real exposures (e.g. in welding and metal
industry) were more than hundred times greater than those resulting from background aerosols. The
obtained results of measurements were not conclusive enough to draw general conclusions with
regard to exposure. Hence, addressing PGNPs release is challenging because of the complexity linked
to source identification and isolation. Correspondingly, a number of real-world emission sources are
difficult to be enclosed or contained; thus, implementing effective mitigation strategies becomes
increasingly difficult (van Broekhuizen, 2017). Another limitation for designing efficient mitigation
strategies are the large variability of industrial processes and their diverse implementation in each
specific industrial plant.
A number of studies discussed the efficiency of PPE (e.g. protective gloves, clothes, filtering facepieces
respirators, masks) against nanoparticle exposures (Kim et al., 2006, 2007; Lee et al., 2007; Myojo et
al., 2017; Tsai et al., 2010). A recent review that quantified the efficiency of PPE and engineering
controls (e.g. LEV) for reducing nanoparticle exposures in controlled scenarios such as laboratories,
reported that the available data are inconclusive (Goede et al., 2018). A review of this literature
Chapter 1. Introduction
14
showed that studies focused on PGNPs are less frequent than for engineered nanoparticles, and the
little information about the effectiveness of applied technical measures refers mostly to laboratory-
scale. Consequently, the data regarding the efficiency of nanoparticle exposure mitigation measures
in real world facilities, at an industrial scale, are scarce and not standardized. Thus, a clear research
gap is evidenced regarding the efficiency of mitigation strategies in real-world facilities at industrial
scale.
1.4.2. Occupational risk management & hierarchy of controls
The requirement of the employer to provide a safe and healthy workplace was instructed by different
organizations (EU, 1989; U.S.C., 1970) and defined based on previous experience (Schulte et al.,
2014). In the framework of traditional industrial hygiene, the concept of the hierarchy of controls
was developed (Halperin, 1996). Up-to-date risk management approaches are based on the hierarchy
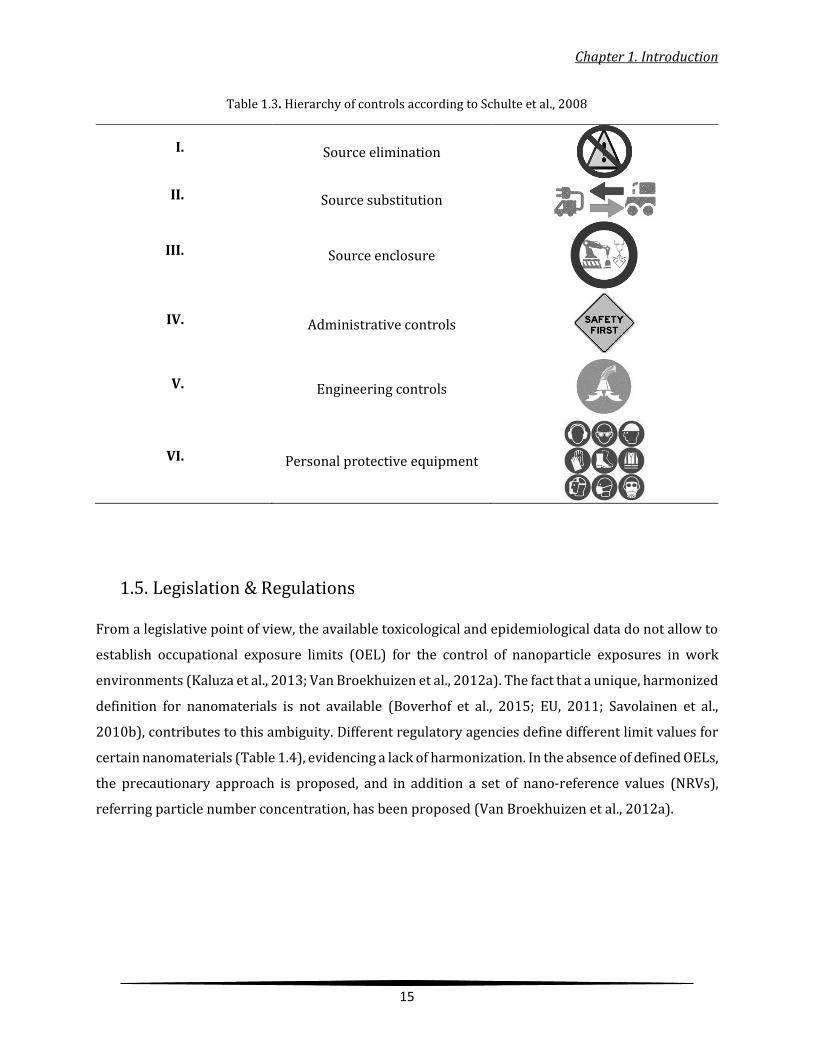
of controls (E.U., 2014; Schulte et al., 2008). In Table 1.3 the different levels of the hierarchy are
classified by priority. The source elimination is the highest in hierarchy and is based rather on a
prevention philosophy, or control of the hazard as close to the source as possible. The substitution of
the source suggests the replacement of the emitter by a non-hazardous counterpart, depending on
the type of the source (process or material) this may include the implementation of a new technology
or a safer substance. The engineering controls include two type of measures: (i) the improvement of
facilities design and the development of safer processes; and (ii) different types of extraction (local,
central), ventilation and dilution (natural, forced). The administrative controls are policies which
intent to limit exposure to a hazard by minimizing the potential duration of exposure, and through
the establishment of good work practices. The use of personal protective equipment (PPE) is the
lowest in the hierarchy because is meant to have complementary application in the cases where
measures higher in the hierarchy cannot be used or where they are only partially effective. PPE
include devices for protection against inhalation exposure (e.g. masks, respirators, helmets), but also
gloves and clothing as protection to dermal exposure.
Chapter 1. Introduction
15
Table 1.3. Hierarchy of controls according to Schulte et al., 2008
I. Source elimination
II. Source substitution
III. Source enclosure
IV. Administrative controls
V. Engineering controls
VI. Personal protective equipment
1.5. Legislation & Regulations
From a legislative point of view, the available toxicological and epidemiological data do not allow to
establish occupational exposure limits (OEL) for the control of nanoparticle exposures in work
environments (Kaluza et al., 2013; Van Broekhuizen et al., 2012a). The fact that a unique, harmonized
definition for nanomaterials is not available (Boverhof et al., 2015; EU, 2011; Savolainen et al.,
2010b), contributes to this ambiguity. Different regulatory agencies define different limit values for
certain nanomaterials (Table 1.4), evidencing a lack of harmonization. In the absence of defined OELs,
the precautionary approach is proposed, and in addition a set of nano-reference values (NRVs),
referring particle number concentration, has been proposed (Van Broekhuizen et al., 2012a).
Chapter 1. Introduction
16
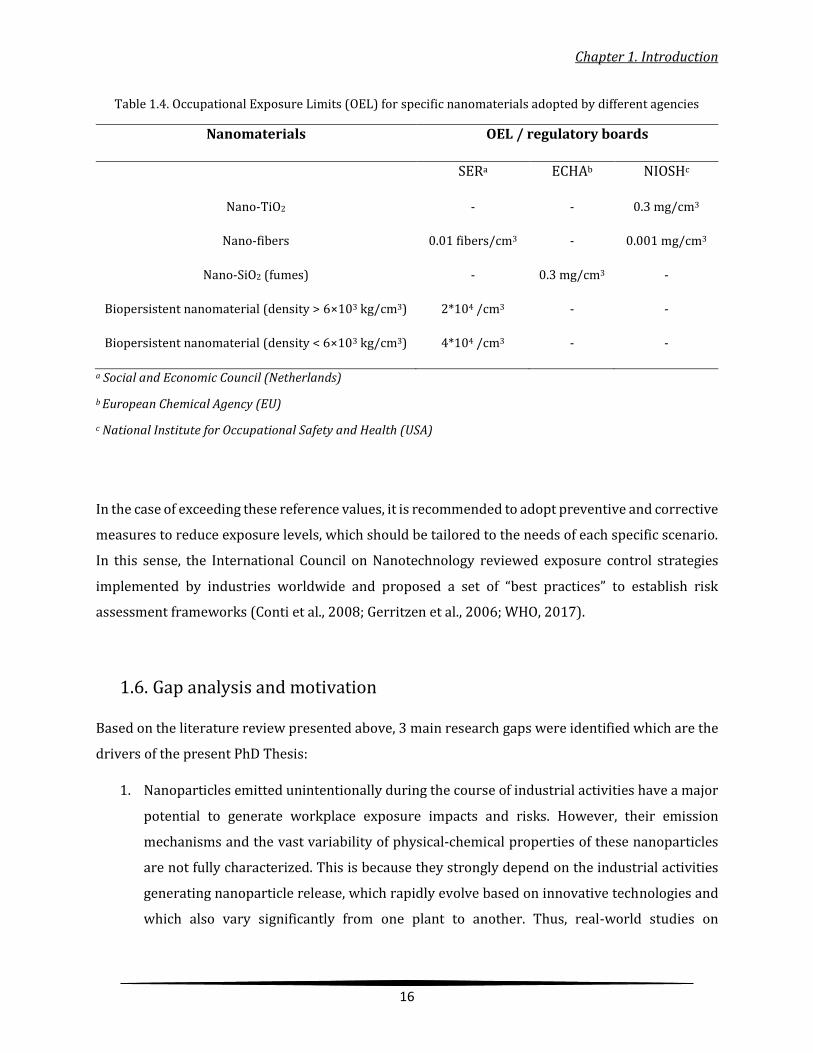
Table 1.4. Occupational Exposure Limits (OEL) for specific nanomaterials adopted by different agencies
Nanomaterials OEL / regulatory boards
SERa ECHAb NIOSHc
Nano-TiO2 - - 0.3 mg/cm3
Nano-fibers 0.01 fibers/cm3 - 0.001 mg/cm3
Nano-SiO2 (fumes) - 0.3 mg/cm3 -
Biopersistent nanomaterial (density > 6×10³ kg/cm3) 2*104 /cm3 - -
Biopersistent nanomaterial (density < 6×10³ kg/cm3) 4*104 /cm3 - -
a Social and Economic Council (Netherlands)
b European Chemical Agency (EU)
c National Institute for Occupational Safety and Health (USA)
In the case of exceeding these reference values, it is recommended to adopt preventive and corrective
measures to reduce exposure levels, which should be tailored to the needs of each specific scenario.
In this sense, the International Council on Nanotechnology reviewed exposure control strategies
implemented by industries worldwide and proposed a set of “best practices” to establish risk
assessment frameworks (Conti et al., 2008; Gerritzen et al., 2006; WHO, 2017).
1.6. Gap analysis and motivation
Based on the literature review presented above, 3 main research gaps were identified which are the
drivers of the present PhD Thesis:
1. Nanoparticles emitted unintentionally during the course of industrial activities have a major
potential to generate workplace exposure impacts and risks. However, their emission
mechanisms and the vast variability of physical-chemical properties of these nanoparticles
are not fully characterized. This is because they strongly depend on the industrial activities
generating nanoparticle release, which rapidly evolve based on innovative technologies and
which also vary significantly from one plant to another. Thus, real-world studies on

Chapter 1. Introduction
17
nanoparticle formation and release mechanisms are necessary to contribute to the
understanding of the drivers of workplace exposure.
2. Similarly, the impacts of such nanoparticle release mechanisms on workplace exposure are
potentially large and highly variable. The combination of operating conditions
(parametrization of the industrial activity under study) and workplace setup (dimensions,
ventilation, air exchange rates, etc.) determine potential exposure risks. As a result, case-
specific and real-world workplace exposure assessments are necessary to contribute to the
growing body of literature on process-generated nanoparticle exposures.
3. Finally, exposures may be mitigated by means of a large variety of technological and non-
technological measures. Their efficiency is, once again, dependent on a large number of
parameters ranging from the design to the implementation of the measures, and their
operating conditions tailored to the specific industrial activity under study. Whereas data are
available in the literature on the effectiveness of mitigation strategies at laboratory scale, data
on their implementation in real-world settings are scarce.
18
Chapter 2. Scope, objectives and structure
Chapter 2. Scope, objectives and structure
19
2. Scope, objectives and structure
2.1. Scope and objectives
A number of processes and activities in the ceramic industry unintentionally release nanoparticles
and their inhalation can lead to potential health hazards. As described in the Gap Analysis (section
1.6), real-world and case-specific approaches are necessary to minimize or prevent nanoparticle
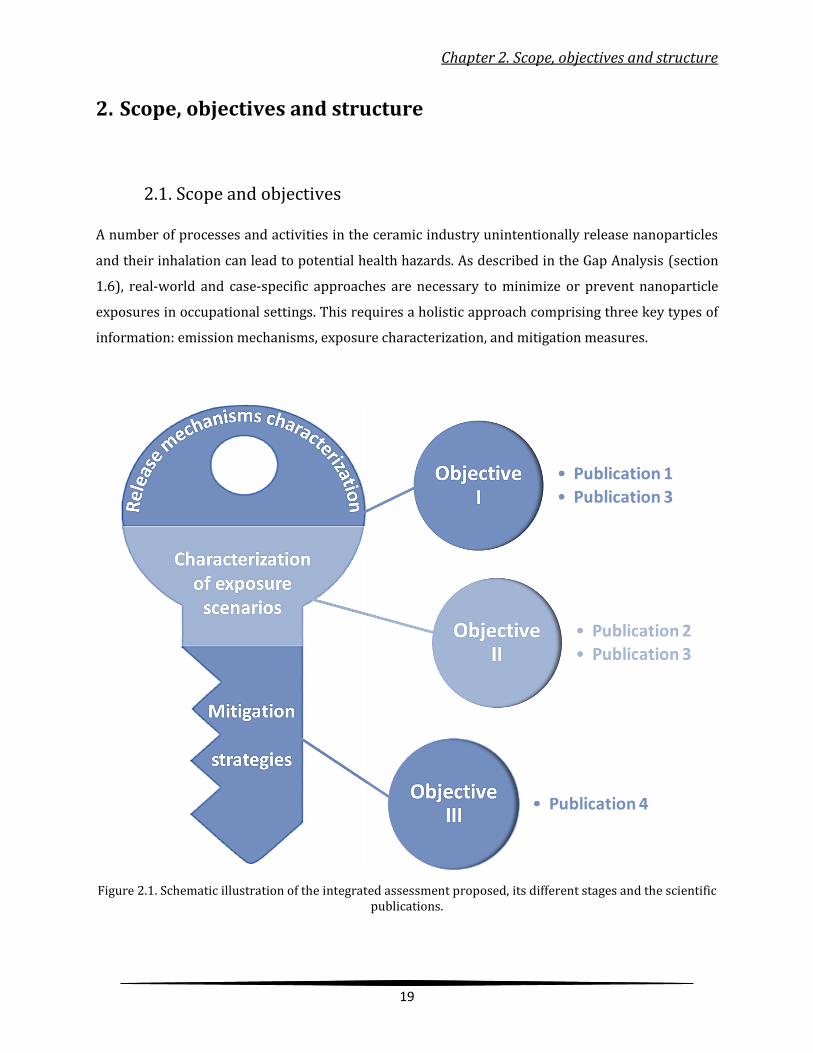
exposures in occupational settings. This requires a holistic approach comprising three key types of
information: emission mechanisms, exposure characterization, and mitigation measures.
Figure 2.1. Schematic illustration of the integrated assessment proposed, its different stages and the scientific publications.
Chapter 2. Scope, objectives and structure
20
An integrated assessment is proposed in this PhD Thesis to reduce the risks and contribute to the
nanosafety of industrial processes by restricting exposure. This assessment comprises three stages
(Figure 2.1), each one covering a distinct research objective:
I. Identification of nanoparticle emission sources followed by the characterization of
nanoparticle formation and release mechanisms. This is greatly depended on the energy
footprint of each industrial activity, as high energy processes (e.g. thermal) are more
probable to release high nanoparticles concentrations and relative low concentrations of
coarse particles. Moreover, the properties (thermal/optical, microstructure, crystallinity,
dustiness, etc.) of the input materials used in each industrial process (raw/target materials,
feedstock, etc.) can influence the emission mechanism and particle release.
II. Identification and characterization of nanoparticle exposure scenarios in terms of particle
size, number, mass concentrations and physicochemical properties. In order to ensure
compatibility across scenarios, harmonized protocols should be implemented. A source
oriented assessment is of importance here to discriminate nanoparticles released from
specific activities from background aerosols, or from emissions originating from secondary
processes. Moreover, additional properties such as the hygroscopicity of the emitted
nanoparticles can be monitored online, providing important information regarding the
behavior of nanoparticles as well as indicating their source. A comprehensive exposure
analysis also includes the characterization of the emitted nanoparticles in terms of
morphology (shape and size), composition, physicochemical properties and microstructure
(e.g. crystallinity). The characterization of aerosols released is usually an offline procedure,
samples are collected on-site and thereafter analyzed. Morphology (shape and size), and
elemental composition are the main nanoparticle characteristics evaluated.
III. Design and implementation of tailored mitigation strategies, with optimal efficiency in
exposure reduction. Different emission sources and diverse exposure scenarios creates the
necessity for tailored mitigation strategies. Assessing and evaluating the information
acquired from the previous stages, appropriate mitigation strategies can be designed The
effectiveness of each mitigation measure applied is evaluated in order to guarantee its
optimal efficiency and assure minimum occupational risks.
Chapter 2. Scope, objectives and structure
21
2.2 Thesis structure
The Introduction chapter (1) provides general information on aerosols, nanoparticle emissions from
industrial process, their associated health impacts, exposure assessment and methods to reduce
occupational risks. The current chapter (2), describes the scope, objective and structure of the
present Thesis. In chapter 3 the methodology followed during experimental measurements,
measurement principles, techniques and data treatment are described. The Results chapter (4) is
comprised of four scientific publications (3 of them published, one of them under review) in peer-
viewed international journals. Subsequently, the Discussion chapter (5) provides an integrated
interpretation of the research findings. The main conclusions are drawn and presented in chapter 6,
while the limitations of the current work and future research needs are discussed in chapter 7. The
References followed by the Acknowledgements concludes this Thesis. Each one of the scientific
publications included in this PhD Thesis addresses at least one research objective as follows:
Scientific publication 1
Nanoparticle formation and emission during laser ablation of ceramic tiles; Apostolos
Salmatonidis, Mar Viana, Noemí Pérez, Andrés Alastuey, Germán F. de la Fuente, Luis Alberto Angurel,
Vicenta Sanfélix, Eliseo Monfort; Journal of Aerosol Science, 126 (2018) 152–168; DOI:
https://doi.org/10.1016/j.jaerosci.2018.09.006
Objective: this publication addresses the first (I) objective of the Thesis.
The mechanisms determining NP emissions during laser ablation of ceramic tiles are characterized
in this publication by correlating fundamental ablation phenomena with particle release. A
parametric study was designed to assess the influence of material properties (composition,
structural characteristics), laser sources (wavelength) as well as process parameters (pulse duration,
frequency) on NP formation and emissions in terms of size, particle number and mass concentration.
The ultimate goal of the present work was to increase the understanding of the mechanisms
governing NP formation during laser ablation, which may provide insights for improved exposure
assessments and facilitate the design of more efficient exposure mitigation measures.
Chapter 2. Scope, objectives and structure
22
Scientific publication 2
Workplace Exposure to Nanoparticles during Thermal Spraying of Ceramic Coatings;
Apostolos Salmatonidis, Carla Ribalta, Vicenta Sanfélix, Spyridon Bezantakos, George Biskos, Adriana
Vulpoi, Simon Simion, Eliseo Monfort and Mar Viana; Annals of work exposures and health, 63, 1
(2019) 91-106; DOI: https://doi.org/10.1093/annweh/wxy094
Objective: this publication addresses the second (II) objective of the Thesis.
In indoor air and more specifically in industrial settings, unintentionally emitted NPs pose an
occupational risk since they are generated and released to the worker area, with potential to impact
workers’ health. Hazards and risks need to be dealt with by means of both technological and non-
technological mitigation strategies. The aim of this work was to assess NP release and characterize
exposure scenarios during thermal spraying of ceramic coatings onto metallic surfaces and their
impact on inhalation exposure, under real-world operating conditions in an industrial setting.
Scientific publication 3
Hygroscopic behavior of ultrafine particles emitted during thermal spraying; Apostolos
Salmatonidis, Mar Viana, George Biskos, Spyridon Bezantakos; Journal of Aerosol Science (under
review)
Objective: this publication addresses the second (II) and first (I) objectives of the Thesis.
A Hygroscopic Tandem Differential Mobility Analyzer was used to probe the hygroscopicity of
nanoparticles (i.e., their ability to take up water upon exposure to elevated humidity) in a thermal
spraying facility. This is an intrinsic aerosol property which define the deposition behavior of inhaled
aerosol particles in the human respiratory system, and consequently the associated health effects.
Emitted NPs could be discriminated from background aerosols based on differences of their
hygroscopicities. Primary particle size and number determined by the HTDMA measurements were
compared with those observed by transmission electron microscopy (TEM). Furthermore, emission
mechanisms during thermal spraying are identified.
Scientific publication 4
Effectiveness of nanoparticle exposure mitigation measures in industrial settings; Apostolos
Salmatonidis, Vicenta Sanfélix, Pablo Carpio, Lech Pawłowski, Mar Viana, Eliseo Monfort;
International Journal of Hygiene and Environmental Health, 222 (2019) 926–935; DOI:
https://doi.org/10.1016/j.ijheh.2019.06.009

Chapter 2. Scope, objectives and structure
23
Objective: this publication addresses the third (III) objective of the Thesis.
The last article aimed to quantify the efficiency of mitigation measures for NP exposure reduction
implemented under real-world operating conditions in the ceramic industry. These measures
included: ventilation, source enclosure, source substitution and source isolation. The efficiency of the
measures was assessed following a case study approach. Exposure reductions were characterized in
terms of particle number concentrations. Thus, this work is expected to fill a current knowledge gap
on exposure mitigation strategies by contributing with quantitative data on the effectiveness of
specific mitigation strategies.
24
Chapter 3. Methodology
Chapter 3. Methodology
25
3. Methodology
3.1. Measurement principles, instrumentation, and particle
characterization techniques
3.1.1. Real-time aerosol measurements – Online instruments
A range of monitoring instruments was used for the experimental sections of the work presented in
this PhD Thesis, and is summarized in Table 3.1. The operating principles of each of the instruments
and techniques used are described.
Condensation Particle Counters
Condensation Particle Counters (CPC) monitor particle number concentrations down to the
nanometer size range, since their detection efficiency for small particles is better than those of optical
particle counters (McMurry, 2000a). Within the instrument, particles are enlarged due to
supersaturation and the subsequent condensation of a vapors to reach the diameter at which they
can be optically detected and the number concentration quantified for particles larger than the
instrument’s lower detection diameter (Liu and Kim, 1977; Wiedensohlet et al., 1997). The lower
detection diameter is determined by the Kelvin diameter, the supersaturation diffusion coefficient of
the condensable gas and the particle material (Stolzenburg and McMurry, 1991). The upper and
lower detection limits are specific for each CPC type. In addition to their environmental applications,
CPCs have been used to detect snorkeling diesel submarines and also as “people sniffer” during the
Vietnam war (McMurry, 2000b).
CPCs operate with continuous aerosol flows which allow them to count each single particle (Agarwal
and Sem, 1980; Wiedensohlet et al., 1997). In alcohol-based CPCs the aerosol flow is saturated with
vapors of a liquid (mainly butanol) in a slightly heated saturator. The temperature of the butanol‐
aerosol mixture is decreased by 17‐27°C in the condenser of the CPC, where vapors supersaturate
and condense onto the particles which grow to droplets of several μm in diameter. The droplet flow
is focused in a nozzle and introduced into a counting optical detector. The droplets pass a laser beam,
each single particle creates a light pulse, and pulses with an amplitude above a certain threshold are
counted. The particle number concentration can be calculated for a given aerosol flow rate. Instead
of alcohol, water can also be used for the measurement of sub‐micrometer aerosol particles following
a slightly different approach but the same principle (Hermann et al., 2007). The aerosol flow is
saturated with water vapor and temperature equilibrated in a cooled saturator. The flow passes
Chapter 3. Methodology
26
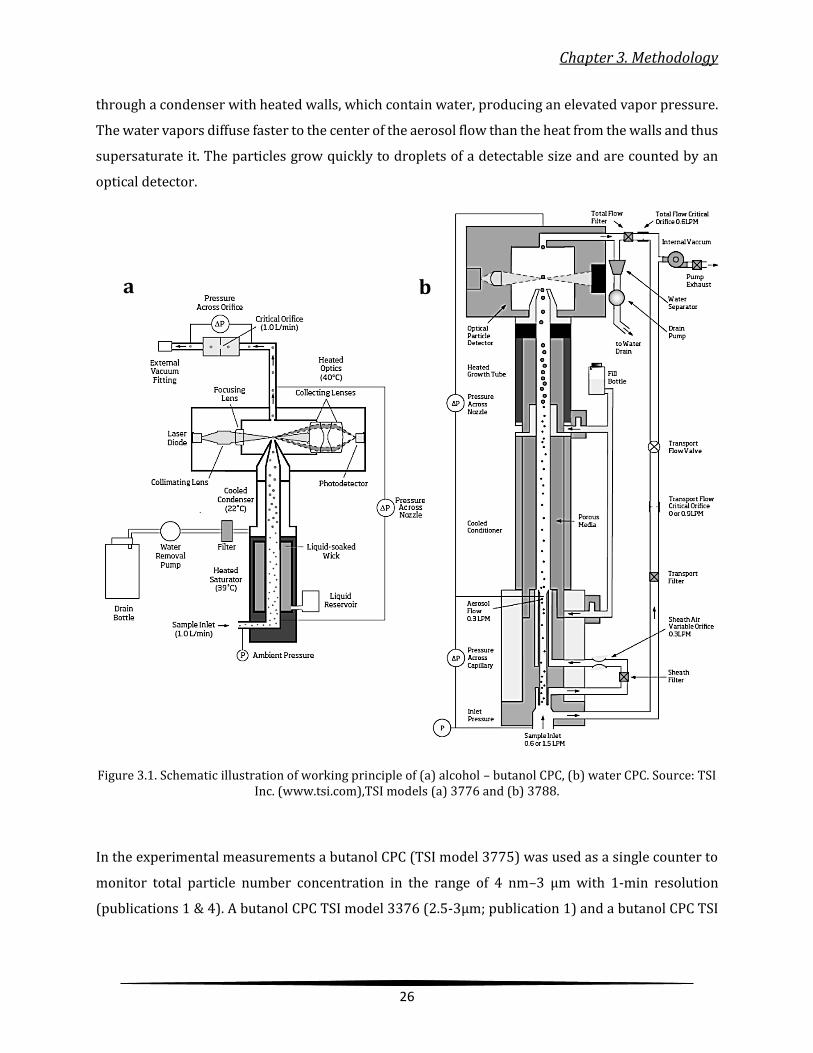
through a condenser with heated walls, which contain water, producing an elevated vapor pressure.
The water vapors diffuse faster to the center of the aerosol flow than the heat from the walls and thus
supersaturate it. The particles grow quickly to droplets of a detectable size and are counted by an
optical detector.
Figure 3.1. Schematic illustration of working principle of (a) alcohol – butanol CPC, (b) water CPC. Source: TSI Inc. (www.tsi.com),TSI models (a) 3776 and (b) 3788.
In the experimental measurements a butanol CPC (TSI model 3775) was used as a single counter to
monitor total particle number concentration in the range of 4 nm–3 μm with 1-min resolution
(publications 1 & 4). A butanol CPC TSI model 3376 (2.5-3µm; publication 1) and a butanol CPC TSI
a b
Chapter 3. Methodology
27
model 3010 (10nm-3µm; publication 3) were also used as part of more complex measurement set-
ups.
Differential Mobility Analyzer
The working principle of a Differential Mobility Analyzer (DMA) is based on the capacity of
electrically charged particles to move in an electric field according to their electrical mobility (Flagan,
1998). The electrical mobility depends mainly on particle size and electrical charge, as smaller
particles have higher electrical mobility (Hinds, 1999; Liu and Pui, 1974b). Higher electrical charge
also leads to higher electrical mobility (Knutson and Whitby, 1975). In constant temperature and
pressure conditions and assuming that all particles carry only one electrical charge, the electrical
mobility is a function of particle size (Flagan, 1998; Liu and Pui, 1974a, 1974b). The fundamental
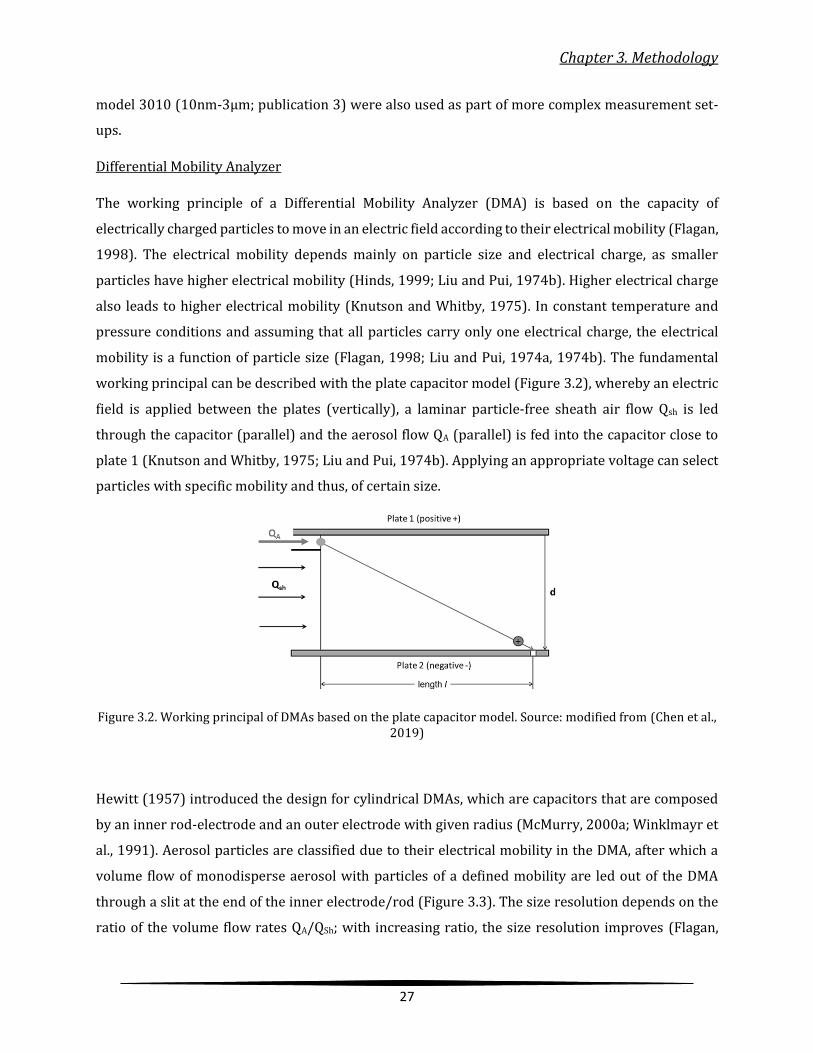
working principal can be described with the plate capacitor model (Figure 3.2), whereby an electric
field is applied between the plates (vertically), a laminar particle‐free sheath air flow Qsh is led
through the capacitor (parallel) and the aerosol flow QA (parallel) is fed into the capacitor close to
plate 1 (Knutson and Whitby, 1975; Liu and Pui, 1974b). Applying an appropriate voltage can select
particles with specific mobility and thus, of certain size.
Figure 3.2. Working principal of DMAs based on the plate capacitor model. Source: modified from (Chen et al., 2019)
Hewitt (1957) introduced the design for cylindrical DMAs, which are capacitors that are composed
by an inner rod-electrode and an outer electrode with given radius (McMurry, 2000a; Winklmayr et
al., 1991). Aerosol particles are classified due to their electrical mobility in the DMA, after which a
volume flow of monodisperse aerosol with particles of a defined mobility are led out of the DMA
through a slit at the end of the inner electrode/rod (Figure 3.3). The size resolution depends on the
ratio of the volume flow rates QA/QSh; with increasing ratio, the size resolution improves (Flagan,

Chapter 3. Methodology
28
1998; Hinds, 1999). DMAs are core components of several measurement instruments such as
generators for monodisperse aerosols, Mobility Particle Size Spectrometers (SMPS, DMPS, TDMPS)
and Tandem DMAs (Volatility, Hygroscopicity). For the experimental measurements carried out in
the framework of this Thesis two custom-made long-DMAs manufactured by the Cyprus Institute
(Salmatonidis et al., 2019b) were used (publication 3). In addition, a nano-DMA TSI Model 3085,
which is optimized for the size range below 20 nm, but it covers a broad range of particle diameters
(2-150 nm) was also used (publication 1).
Figure 3.3. (a) nano-DMA TSI model 3085 and (b) long-DMA TSI model 3081. Source: TSI Inc. (www.tsi.com).
Scanning Mobility Particle Size spectrometer
The main components of a Scanning Mobility Particle Sizer (SMPS) are: the pre‐impactor which
eliminates coarser particles, a bipolar diffusion charger (X-ray or nuclear source) to charge the
particles, a DMA where the voltage is continuously increased and a CPC as a counter. SMPS
spectrometers can measure particle number size distributions for a given size range, which depends
on the DMA‐geometry, the sheath air flow rate and the downstream CPC (Flagan, 1998; Knutson and
a b

Chapter 3. Methodology
29
Whitby, 1975; McMurry, 2000a). Longer DMAs can detect larger particles (10-800 nm) while higher
sheath air flow rates and shorter nano-DMAs can be used to measure smaller particles (3-100 nm)
(Chen et al., 1996). The particle number concentration is monitored as a function of time, while for
each SMPS system the relationship between electrical mobility and time (time between DMA
entrance and CPC detection) must be determined. The metric measured is an electrical mobility
distribution, which is converted to particle number size distribution by a computer inversion routine
(Hagen and Alofs, 1983; Hoppel, 1978). The complete inversion routine must incorporate the bipolar
charge distribution for multiple charge correction, the size dependent DMA transfer function and the
measured electrical mobility distribution (Alofs and Balakumar, 1982; McMurry, 2000a). Finally, the
calculated size distribution has to be corrected for the CPC counting efficiency curve, and the internal
losses due to particle diffusion (inlet and sampling tubes), which can be calculated by the method of
the equivalent pipe length (Wiedensohler et al., 2012). A TSI model 3080 SMPS (Figure 3.4)
comprising a TSI 3776 CPC and a TSI 3085 nano-DMA was used in the experimental measurements
(publication 1) to monitor particle size distribution from 3-100 nm with a 3-min resolution.
Figure 3.4. SMPS TSI model 3080. Source: TSI Inc. (www.tsi.com).
Chapter 3. Methodology
30
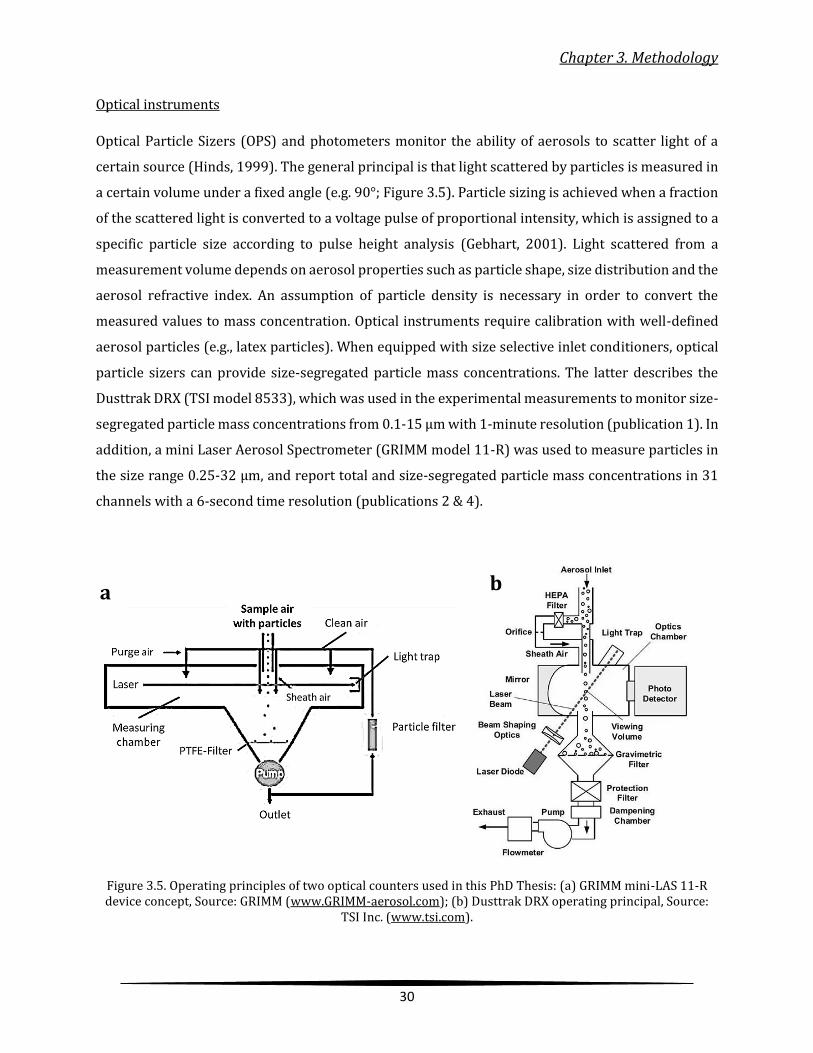
Optical instruments
Optical Particle Sizers (OPS) and photometers monitor the ability of aerosols to scatter light of a
certain source (Hinds, 1999). The general principal is that light scattered by particles is measured in
a certain volume under a fixed angle (e.g. 90°; Figure 3.5). Particle sizing is achieved when a fraction
of the scattered light is converted to a voltage pulse of proportional intensity, which is assigned to a
specific particle size according to pulse height analysis (Gebhart, 2001). Light scattered from a
measurement volume depends on aerosol properties such as particle shape, size distribution and the
aerosol refractive index. An assumption of particle density is necessary in order to convert the
measured values to mass concentration. Optical instruments require calibration with well-defined
aerosol particles (e.g., latex particles). When equipped with size selective inlet conditioners, optical
particle sizers can provide size-segregated particle mass concentrations. The latter describes the
Dusttrak DRX (TSI model 8533), which was used in the experimental measurements to monitor size-
segregated particle mass concentrations from 0.1-15 μm with 1-minute resolution (publication 1). In
addition, a mini Laser Aerosol Spectrometer (GRIMM model 11-R) was used to measure particles in
the size range 0.25-32 μm, and report total and size-segregated particle mass concentrations in 31
channels with a 6-second time resolution (publications 2 & 4).
Figure 3.5. Operating principles of two optical counters used in this PhD Thesis: (a) GRIMM mini-LAS 11-R device concept, Source: GRIMM (www.GRIMM-aerosol.com); (b) Dusttrak DRX operating principal, Source:
TSI Inc. (www.tsi.com).
a b
Chapter 3. Methodology
31
Unipolar diffusion charger (corona-based)
The need for compact, portable, autonomous (battery-operated) instruments and personal monitors
led to the development of unipolar diffusion chargers. The corona charger is a small enough and
energy efficient component to be incorporated in miniaturized particle counters/sizers. It is
implemented in different instruments following diverse designs, with the main function to substitute
radioactive or X-ray neutralizers of the stationary instruments. Such is the case of the NanoScan-
SMPS (TSI 3910; Table 3.1) where particles charged by the corona are classified in 13 channels (10-
420 nm) according to their mobility diameters by a radial DMA (Zhang et al., 1995) and subsequently
counted by an incorporated isopropanol-CPC, resembling the working principle of a standard SMPS
(Fonseca et al., 2016b; Tritscher et al., 2013).
The Diffusion Size Classifier-miniature (DiSCmini by TESTO) used in this Thesis, is a portable
instrument which can also be used as a personal monitor (Asbach et al., 2017). It uses an ion trap to
remove the ion excess of the corona charged particles and subsequently two stages of electrometers
(diffusion, filter) are used. DiSCmini´s monitors particles in the range 10-700 nm (size, number; Table
3.1), as a function of the instrument’s calibration curve for monodisperse aerosols (Fierz et al.,
2011).It can provide data with a range of time resolutions (1 second-1 hour).
The Wide Range Aerosol Spectrometer (MiniWRAS by GRIMM) is a combination of an OPC and an
electrical mobility spectrometer. The OPC measures the size distribution from 250 nm to 32 μm in
31 size channels (Table 3.1). The number of particles is determined by the number of stray light
pulses per period, while the particle size determines the amplitude of the scattered light. For each
size channel the particle number is measured, and under the assumption that particles are spherical
the mass distribution can also be calculated. Smaller particles (10-193 nm) are charged with a corona
charger, after which the particles go into a collecting-precipitation electrode, where they are
separated according to their electrical mobility and finally measured (1-min resolution) with a
Faraday cup electrometer (GRIMM Aerosol Technik GmbH).
Chapter 3. Methodology
32
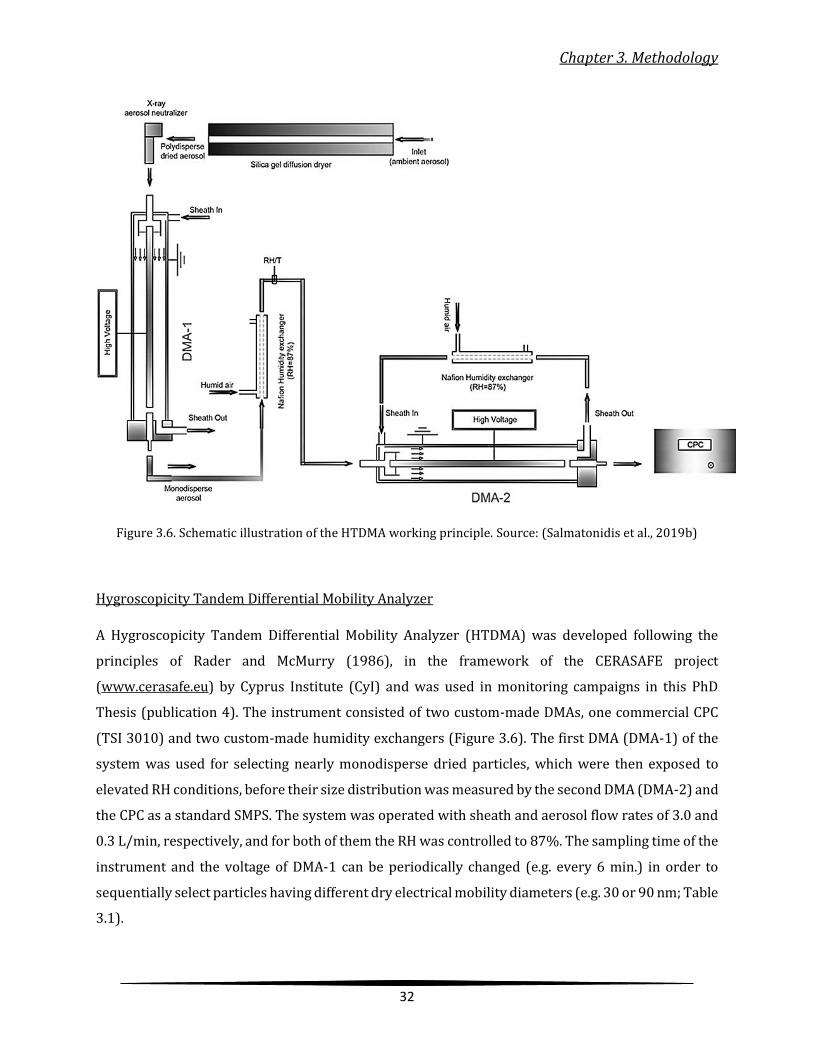
Figure 3.6. Schematic illustration of the HTDMA working principle. Source: (Salmatonidis et al., 2019b)
Hygroscopicity Tandem Differential Mobility Analyzer
A Hygroscopicity Tandem Differential Mobility Analyzer (HTDMA) was developed following the
principles of Rader and McMurry (1986), in the framework of the CERASAFE project
(www.cerasafe.eu) by Cyprus Institute (CyI) and was used in monitoring campaigns in this PhD
Thesis (publication 4). The instrument consisted of two custom-made DMAs, one commercial CPC
(TSI 3010) and two custom-made humidity exchangers (Figure 3.6). The first DMA (DMA-1) of the
system was used for selecting nearly monodisperse dried particles, which were then exposed to
elevated RH conditions, before their size distribution was measured by the second DMA (DMA-2) and
the CPC as a standard SMPS. The system was operated with sheath and aerosol flow rates of 3.0 and
0.3 L/min, respectively, and for both of them the RH was controlled to 87%. The sampling time of the
instrument and the voltage of DMA-1 can be periodically changed (e.g. every 6 min.) in order to
sequentially select particles having different dry electrical mobility diameters (e.g. 30 or 90 nm; Table
3.1).

Chapter 3. Methodology
33
Table 3.1. Characteristics of the online instruments used in the experimental part of this work.
Instrument
type
Size range
(nm) Particle metric
Manufacturer-
Model
Used in PhD
publications
CPC 2.5-3000 Particle number TSI: 3775, 3776, 3010 1, 3, 4
SMPS 3-100 Size distribution TSI 3080 1
NanoScan SMPS 10-420 Size distribution TSI 3910 1, 2, 3, 4
DiSCmini 10-700 Size, Number, LDSA TESTO 1, 2, 3, 4
DustTrak DRX 100-15000 PMx TSI 8533 1
Mini-LAS 250-32000 Mass distribution GRIMM model 11-R 2, 4
Mini-WRAS 10-35000 Size & mass
distribution GRIMM model 1371 1, 2, 4
HTDMA 30 & 90 Particle size Custom – CyI 3
3.1.2. Characterization techniques – offline measurements
Samples were collected on electron microscopy grids (Agar scientific Quantifoil 200 Mesh Au) for
offline morphological and physicochemical characterization. The sampling set-up was composed by
a Leland pump (SKC Inc.) operating at a flowrate of 5 liters/minute, connected to a cassette (SKC inlet
diameter 1/8 inch and filter support pads of diameter 25mm) to which the TEM grid was attached.
Electron Microscopy
Electron microscopy is an advanced characterization method that can provide multiple information
for particles in the micro as well as nanoscale. Morphology (shape and size) of single particles, their
composition, agglomeration/aggregation state, and crystallinity are some of the characteristics
which can be analyzed. Electron microscopy is based on the property of electrons to interact with
matter by generating a variety of excitation phenomena with characteristic radiations and energies,
which, if collected, are a key source of information. The type of interaction is directly related to the
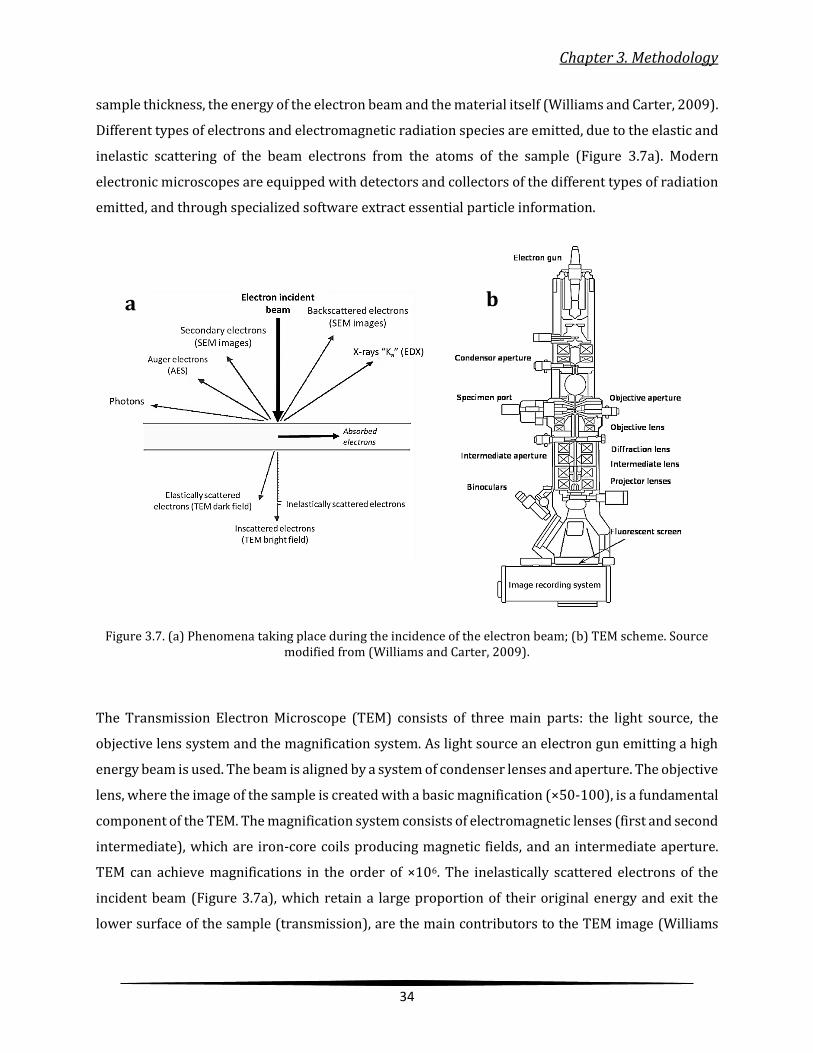
Chapter 3. Methodology
34
sample thickness, the energy of the electron beam and the material itself (Williams and Carter, 2009).
Different types of electrons and electromagnetic radiation species are emitted, due to the elastic and
inelastic scattering of the beam electrons from the atoms of the sample (Figure 3.7a). Modern
electronic microscopes are equipped with detectors and collectors of the different types of radiation
emitted, and through specialized software extract essential particle information.
Figure 3.7. (a) Phenomena taking place during the incidence of the electron beam; (b) TEM scheme. Source modified from (Williams and Carter, 2009).
The Transmission Electron Microscope (TEM) consists of three main parts: the light source, the
objective lens system and the magnification system. As light source an electron gun emitting a high
energy beam is used. The beam is aligned by a system of condenser lenses and aperture. The objective
lens, where the image of the sample is created with a basic magnification (×50-100), is a fundamental
component of the TEM. The magnification system consists of electromagnetic lenses (first and second
intermediate), which are iron-core coils producing magnetic fields, and an intermediate aperture.
TEM can achieve magnifications in the order of ×106. The inelastically scattered electrons of the
incident beam (Figure 3.7a), which retain a large proportion of their original energy and exit the
lower surface of the sample (transmission), are the main contributors to the TEM image (Williams
a b
Chapter 3. Methodology
35
and Carter, 2009). When the energy of the electrons of the incident beam is large enough to excite an
electron in an inner shell, ejecting it, it creates an electron hole. Subsequently, an electron from an
outer shell (higher-energy) fills the hole and the difference in energy between the higher-energy shell
and the lower-energy shell may be released in the form of an X-ray known as Ka (Figure 3.7a). The
energy of the X-ray emitted, equal to the energy difference of the two shells, is characteristic of the
element from which it is emitted. Hence, it can provide information on the composition of the sample
by the stoichiometric Energy Dispersive X-ray analysis (EDX/EDS).
The particles sampled during the experimental campaigns were characterized in terms of
morphology (size, shape) and elemental composition at the Scientific and Technological Centers of
the University of Barcelona (CCiTUB), using JEOL JEM 2100 Transmission Electron Microscope with
a LaB6 thermionic filament., coupled with an EDX spectrometer (Oxford Instruments INCA x-sight),
with Si (Li) detector. The TEM images were acquired using a Gatan Orius CCD camera and processed
with the “ImageJ” software, version 1.52f.
X-ray diffraction
X-ray diffraction (XRD) is used in the study of matter and crystalline solids. The characteristic feature
of crystals is their periodic structure. When an X-ray beam impacts on a crystal surface it is partially
scattered by the atoms of the first crystal plane, another part is scattered from the second plane, and
the process continues resulting in constructive interference (Figure 3.8). Braggs law: nλ=2dsinθ
(where λ is the X-ray wavelength) allows the calculation of lattice spacing (d) when the angles “θ”,
under which the constructively interfering X-rays leave the crystal, are known (Epp, 2016; Warren,
1990). Diffractometers are instruments consisting of an X-ray source, the sample holder (stage) and
a detector (Figure 3.8a). In modern instruments the individual parts can move in a circular trajectory,
in order to perform measurements under a range of angles. X-ray diffraction peaks are formed when
constructive interference of monochromatic X-rays beam scattered at specific angles from each set
of lattice planes in a sample. The peak intensities are determined by the atomic positions within the
lattice planes. Consequently, the X-ray diffraction pattern is the fingerprint of periodic atomic
arrangements in a given material. Information on structures, phases, preferred crystal orientations
(texture), average grain size and crystallinity can be obtained (Kohli, 2012).
The powder XRD data were collected in the IDAEA-CSIC X-Ray laboratory by using a Bruker D8
Advance diffractometer with CuKa1 radiation source (1.5405 Å) and a graphite monochromator. The
diffractograms were obtained from 5° to 120° 2θ with a step of 0.02° and a counting time of 10 s. The
crystalline phase identification was carried out by using the computer program ‘‘EVA’ (Produced by

Chapter 3. Methodology
36
Bruker). The software TOPAS 2.1. (Bruker AXS TOPAS, General profile and structure analysis
software for powder diffraction data, V2.0, Bruker AXS, Karlsruhe, Germany, 2000.) with the
fundamental parameter approach was used for Rietveld refinement. The optimized parameters were
background coefficients, zero-shift error, peak shape parameters, cell parameters and isotropic
thermal factors. The values of the pattern dependents on the disagreement factor (Rwp), and the
statistical reliability factor of Bragg (RB) which were evaluated and they indicated that fits were
satisfactory (Young, 1993).
Figure 3.8. (a) Principal of X-Ray diffraction and Bragg´s law, (b) basic parts and principal of a diffractometer. Source: modified from (Epp, 2016)
3.2 Monitoring strategy
In industrial settings, different activities (i.e., potential particle emission sources) may take place
with diverse periodicity. The combination of production processes and how often are performed
depends on each industry’s production planning (e.g. commercial orders, customer needs, market
behavior, etc.). As a result, exposure monitoring could require time-intensive and costly full-shift
particle monitoring. Alternatively, task-based exposure assessments may be carried out, which
provide specific information on overall worker exposure (Ramachandran, 2008) and can facilitate
the design of appropriate control measures as well as provide necessary data for modeling purposes
(Brouwer et al., 2012).
Task-based exposure assessments focus on a specific activity/process, and should be carried out over
a representative period of time. Assessments may focus on the breathing zone of one individual using
portable instruments (OJIMA, 2012). However, when several workers were affected in a worker area,
a b
Chapter 3. Methodology
37
a stationary monitoring set-up at breathing height (ca. 0.7-1.5 m) is preferable. Other options are the
near field (NF)/far field (FF) approach, described by (Brouwer et al., 2009) and used by (Demou et
al., 2009; Fonseca et al., 2018; Koivisto et al., 2010, 2012b, 2015, 2016; Koponen et al., 2015; Ribalta
et al., 2019) among others, to distinguish nanoparticles from background aerosols (i.e. ambient
particles from other than the studied sources inside or outside the workplace). The impact of the
studied source (near field) on exposure concentrations in the worker area (far field) may be
monitored in real-time. Depending on the scenario, discrimination of background aerosols may be
achieved either by monitoring particle metrics before and after the activity, or by simultaneously
monitoring particle metrics at the source and at a background location. Workplace exposure
monitoring strategies applied in this Thesis followed internationally-recognized standard
procedures (OECD.82, 2017) based on a tiered approach (Brouwer et al., 2012).
A multi–instrument approach was applied for all the exposure scenarios assessed as suggested by
Fonseca (2016) and Brouwer et al., (2012). However, the different instruments can have different
features and specifications (e.g. working principles, measurement ranges and metrics, time
resolutions etc.; Asbach et al., 2016). Therefore, the compatibility of the resulting data needs to be
validated through inter-comparisons of the specific instruments. In this work, inter-comparisons
were carried out prior to the measurements at an air quality monitoring station in Barcelona (Spain),
using ambient air aerosols and stationary instruments as references. The proper functioning of the
instruments was ensured and data were considered compatible when R2 coefficients were ≥0.9.

38
Chapter 4. Results
Chapter 4. Results
39
4. Results
The results of the present PhD Thesis are presented in this section in the form of four scientific
publications as submitted to peer-reviewed journals. The publications follow the order of the
objectives of this PhD Thesis, as presented in Chapter 2. Publication 1 addresses the first objective
“identification of nanoparticle sources and characterization of emission mechanisms” during laser
ablation of ceramic tiles. Publications 2 and 3 tackle the second objective “characterization of
exposure scenarios” by studying thermal spraying at an industrial scale. The third objective
regarding “exposure mitigation strategies” is addressed in publication 4.

Chapter 4. Results
40
4.1. Scientific publication 1
Nanoparticle formation and emission during laser ablation of ceramic
tiles
Apostolos Salmatonidisa,d, Mar Vianaa, Noemí Péreza, Andrés Alastueya, Germán F. de la
Fuenteb, Luis Alberto Angurelb, Vicenta Sanfélixc, Eliseo Monfortc
a Institute of Environmental Assessment and Water Research, Spanish Research Council (IDÆA-CSIC),
08034, Barcelona, Spain.
b Aragón Materials Science Institute (ICMA - Universidad de Zaragoza, CSIC), 50018, Zaragoza, Spain.
c Institute of Ceramic Technology (ITC)- AICE - Universitat Jaume I, 12006 Castellón, Spain.
d University of Barcelona, Faculty of Chemistry, Department of Chemical Engineering and Analytical
Chemistry, 08028, Barcelona, Spain.
Published in: Journal of Aerosol Science, 2018, Volume 126, Pages 152-168
DOI: https://doi.org/10.1016/j.jaerosci.2018.09.006
The following is a pre-print version, which was produced by the author, of an article published in
Journal of Aerosol Science (Elsevier): Submitted on 14 May 2018; revised on 12 July 2018; accepted
on 21 September 2018. Available online at: https://doi.org/10.1016/j.jaerosci.2018.09.006
Chapter 4. Results
41
Nanoparticle formation and emission during laser ablation of ceramic
tiles
Apostolos Salmatonidisa,d*, Mar Vianaa, Noemí Péreza, Andrés Alastueya, Germán F. de la Fuenteb,
Luis Alberto Angurelb, Vicenta Sanfélixc, Eliseo Monfortc
a Institute of Environmental Assessment and Water Research, Spanish Research Council (IDÆA-CSIC), 08034,
Barcelona, Spain.
b Aragón Materials Science Institute (ICMA - Universidad de Zaragoza, CSIC), 50018, Zaragoza, Spain.
c Institute of Ceramic Technology (ITC)- AICE - Universitat Jaume I, 12006 Castellón, Spain.
d University of Barcelona, Faculty of Chemistry, Department of Chemical Engineering and Analytical Chemistry,
08028, Barcelona, Spain.
*corresponding author: Apostolos Salmatonidis, [email protected]
Abstract
Pulsed laser ablation (PLA) is a widely used technology, for surface structuring and tile decoration in
the ceramic industry. During PLA, nanoparticles (NP <100 nm) are unintentionally released and may
impact exposure. This work aims to understand the mechanisms controlling NP formation and
release during ablation of different types of ceramic tiles, using different laser setups (near-IR and
mid-IR). The measurements took place at laboratory and pilot-plant-scale, with varying laser
wavelength, frequency, velocity, and pulse duration. In total, the combination of 4 types of ceramic
tiles and 2 lasers was assessed. Particle number concentration and size distribution (SMPS with
nano-DMA, DiSCmini, butanol-CPC) and particle mass concentration (DustTrak-DRX) were
monitored. Samples were also collected for morphological and chemical characterization
(TEM/EDX). High particle number concentrations were detected (3.5*104/cm3 to 2.5*106/cm3) for
all of the tiles and under both laser setups. Particle formation (<10 nm) by nucleation was detected,
and secondary amorphous SiO2 nanoparticles (>10 nm) were formed and released during ablation of
the porcelain tiles. Different release mechanisms were identified: during ablation with the near-IR
laser particles were emitted through melting and nucleation, while emissions from the mid-IR laser
were attributed to melting and mechanical shockwaves. Particle number and mass emissions were
dependent on the tile surface characteristics (e.g., porosity, crystallinity) and chemical properties.
This work is potentially relevant from the point of view of exposure mitigation strategies in industrial
facilities where PLA is carried out.
Keywords: nanoparticles, ceramic industry, laser ablation, formation mechanisms

Chapter 4. Results
42
1. Introduction Laser ablation is a technology with widespread applications at global scale, examples of which are
precision microfabrication (Sugioka, Meunier, & Pique, 2010), surface structuring (Lahoz, de la
Fuente, Pedra, & Carda, 2011) characterization and analytical techniques (Russo, Mao, Gonzalez,
Zorba, & Yoo, 2013). Pulsed laser ablation (PLA), in particular, is a state-of-the-art method used for
ceramic tile processing in order to achieve designs with enhanced durability and aesthetic properties
(Pascual et al., 2005). However, this technology is known to generate nanoparticle (NP, <100 nm)
emissions to workplace air and the environment (A. S. Fonseca et al., 2015, 2016). Based on current
literature, understanding the sources and mechanisms controlling the formation and release of
process-generated nanoparticles (PGNP) in industrial settings is becoming increasingly relevant, in
order to minimize potential hazards (Hameri, Lahde, Hussein, Koivisto, & Savolainen, 2009; van
Broekhuizen, 2012; Viitanen, Uuksulainen, Koivisto, Hämeri, & Kauppinen, 2017). Adverse health
effects of NPs have been extensively described in the literature (Heal, Kumar, & Harrison, 2012), and
the main exposure route to NPs is inhalation. Specifically, Oberdörster (2001) showed that in certain
cases NP can cause severer pulmonary inflammation than fine particles, while Weichenthal (2012)
observed significant associations between NP and acute cardiovascular morbidity. Consequently,
numerous industrial processes which generate NP emissions have received increasing attention in
recent years (Curwin & Bertke, 2011; Demou, Peter, & Hellweg, 2008; Ana Sofia Fonseca et al., 2014;
Gandra, Miranda, Vilaa, Velhinho, & Teixeira, 2011; Gómez, Irusta, Balas, & Santamaria, 2013;
Koivisto et al., 2012; van Broekhuizen, 2012). Pfefferkorn et al (2009) described the potential for
exposure to ultrafine aerosols during industrial welding operations, and Viana et al. (2017) reported
analogous potential during atmospheric thermal spraying. Additionally, Voliotis et al. (2014) proved
that traditional ceramic production processes emit particles <100 nm, and awareness was raised
towards this specific industrial sector.
In order to characterize and minimize exposure, the mechanisms generating particle emissions must
be understood. During laser ablation intense electromagnetic fields interact with matter and atoms
are selectively driven off by thermal or non-thermal mechanisms (Phipps, 2007). NP emissions
during PLA can be mainly associated with three phenomena:
Nucleation: atoms, ions and clusters which emanate from the plasma plume (Noël, Hermann,
& Itina, 2007), can act as nuclei and through different growth routes (coalescence, diffusional,
coagulation) form secondary particles (Polte, 2015). Gaseous precursors which may originate
from direct sublimation (solid-to-gas) and from evaporation of melt (liquid-to-gas), can
condensate and form new particles (A. S. Fonseca et al., 2015).
Melt expulsion (droplets): Temperature differences between the surface and the body of the
material create localised pressure gradients (Czotscher & Vollertsen, 2016; Zhigilei, Lin, &
Ivanov, 2009), which force droplets of melt to get extruded from the tile, cool down rapidly
and, due to surface tension, form spherical particles.
Shockwaves: Mechanical shockwave cracking of grains can contribute to the emission of
primary particles. Particle removal is associated to ablation and poor thermal resistance,
which is typical for porcelain tiles (Lahoz et al., 2011). Thermal shock and the consequent
ejection of micro-scaled grains occurs due to differences in thermal expansion coefficients

Chapter 4. Results
43
(Pascual-Cosp, Ramírez del Valle, Garciá-Fortea, & Sánchez-Soto, 2002; Pascual-Cosp,
Ramírez Del Valle, García Fortea, & Sánchez Soto, 2001; Pascual et al., 2005).
In addition to these, particle aggregation and agglomeration mechanisms are also determinants of
particle size distribution after formation and emission (Koch & Friedlander, 1989; Lushnikov,
Maksimenko, & Pakhomov, 1989; Sivayoganathan, Tan, & Venkatakrishnan, 2012).
The current study aims to characterize the mechanisms determining NP emissions during PLA of
ceramic tiles by correlating fundamental ablation phenomena with particle release. A parametric
study was designed to assess the influence of material properties (composition, structural
characteristics), laser sources (wavelength) as well as process parameters (pulse duration,
frequency) on NP formation and emissions in terms of size, particle number and mass concentration.
The ultimate goal of the present work was to increase the understanding of the mechanisms
governing NP formation during laser ablation, which may facilitate the design of more efficient
exposure mitigation measures.
2. Materials and methods The laser ablation experiments took place at the Materials Science Institute of Aragón “ICMA” (CSIC-
University of Zaragoza) in Zaragoza (Spain), with an overall duration of 5 working days.
Table 1. Ceramic tiles under study (Abbreviations, 1st letter: Glaze, 2nd letter: Tile, 3rd letter: Colour)
Abbreviation Full Name Tile Porous Main Components**
UPG Unglazed Porcelain Grey Porcelain stoneware no 71% SiO2, 19% Al2O3
UAW Unglazed Alumina White Alumina yes 97% Al2O3
UBW Unglazed Biscuit White Non-sintered/biscuit
porcelain yes 70% SiO2, 20% Al2O3
GER Glazed Earthenware Red Earthenware yes 57% SiO2, 12% ZnO
*The chemical composition refers only to the glaze, and not the body of the GER tile, since that was the part processed by
the laser; **The full chemical characterization can be found in Table S1 in Supplementary material.
Figure 1. Experimental setup of (a) the laboratory-scale with the near-IR laser, and (b) the pilot-plant with
the mid-IR laser. The distribution of the different particle monitoring instrumentation is presented.

Chapter 4. Results
44
2.1 Tile and laser combinations
Four different ceramic tiles were used as target materials (Table 1). Porcelain stoneware (UPG; 71%
SiO2, 19% Al2O3; Table S1 in Supplementary Material) is currently the ceramic tile of highest
commercial interest, as it exhibits higher technical and functional performance and greater
versatility, allowing this tile to be used in both indoor and outdoor environments (International
Organization for Standardization, 2012; Sánchez, García-Ten, Sanz, & Moreno, 2010). Porous
ceramics (e.g. alumina, UAW; 97% Al2O3; Table S1), on the other hand are used in high temperature
applications such as thermal insulation in the cement, steel, aluminium, iron-alloy and petrochemical
industries (Salomão, Bôas, & Pandolfelli, 2011). Glaze is a vitreous coating (56% SiO2, 12% ZnO, 7%
ZrO2; Table S1) that seals the inherent porosity of the tile`s body material and serves as a colorant or
waterproofing agent and it was a component of the earthenware tiles studied in this work. Each
target material has different chemical composition as shown in Table S1 (Supplementary material).
Furthermore, the different optical properties of the tiles result in very different absorbance of the
incident energy, which means that the laser treatment efficiency will vary depending on the material
itself. In addition, this efficiency strongly depends on the laser wavelength. Therefore, two different
laser systems with different wavelengths were used:
A. Near-IR laser (Easy Laser, Model: YLPM-1-4x200-20-20, Ytterbium fiber laser, Wavelength: 1064
nm, nominal power 20 W) at laboratory scale, with which the UPG, UAW and UBW tiles were
processed (Fig. 1a).
B. Mid-IR laser (Easy Laser, Model: 350 Flexi Marcatex, Slab-type CO2 laser, Wavelength: 10.6 µm,
nominal power 350 W) at pilot-plant scale, used to process the UPG, UBW and GER tiles (Fig. 1b).
Although, the UAW tiles were optically compatible with this laser, strong thermal stresses were
generated inducing tile fracture. Hence, the UAW tiles were not processed with this laser.
Mid-IR lasers (i.e. CO2) are widely used in industrial applications for cutting and welding, while n-IR
lasers are generally used for engraving (Andreeta, Cunha, Vales, Caraschi, & Jasinevicius, 2011).
Applications include scribing, engraving, and marking of a wide variety of materials, including glass
and ceramics. Finally, the difference in power between these lasers was considered advantageous as
they allowed for the assessment of NP formation at two different scales (laboratory and pilot plant,
Fig. 1).
2.2 Experimental
In order to ensure the reproducibility of the results all experiments were performed in triplicate and
consisted of 20-minutes ablation followed by a 10-minutes settle-down time. Localized air extraction
was installed close to the target tiles (Fig. 1), both in the laboratory and the pilot plant, at a distance
of approximately 10 centimetres from the initial point of the laser beam. The extraction intensities
for all the experiments were kept at a constant flow speed of 3.5 m/s. The laser beam started marking
from an initial point and covered a rectangular surface with a continuous parallel line movement.
The tile surface treated by the laser was always untreated, i.e., the laser always moved towards the
untreated part of each tile and there was no spatial overlap from one laser shot to another. The
spacing between lines is shown in Table S2 in Supplementary Material.
Laser ablation was carried out under two energy settings with the near-IR laser: high and low,
detailed process parameters are listed in Table S2 in Supplementary material. In the case of “high
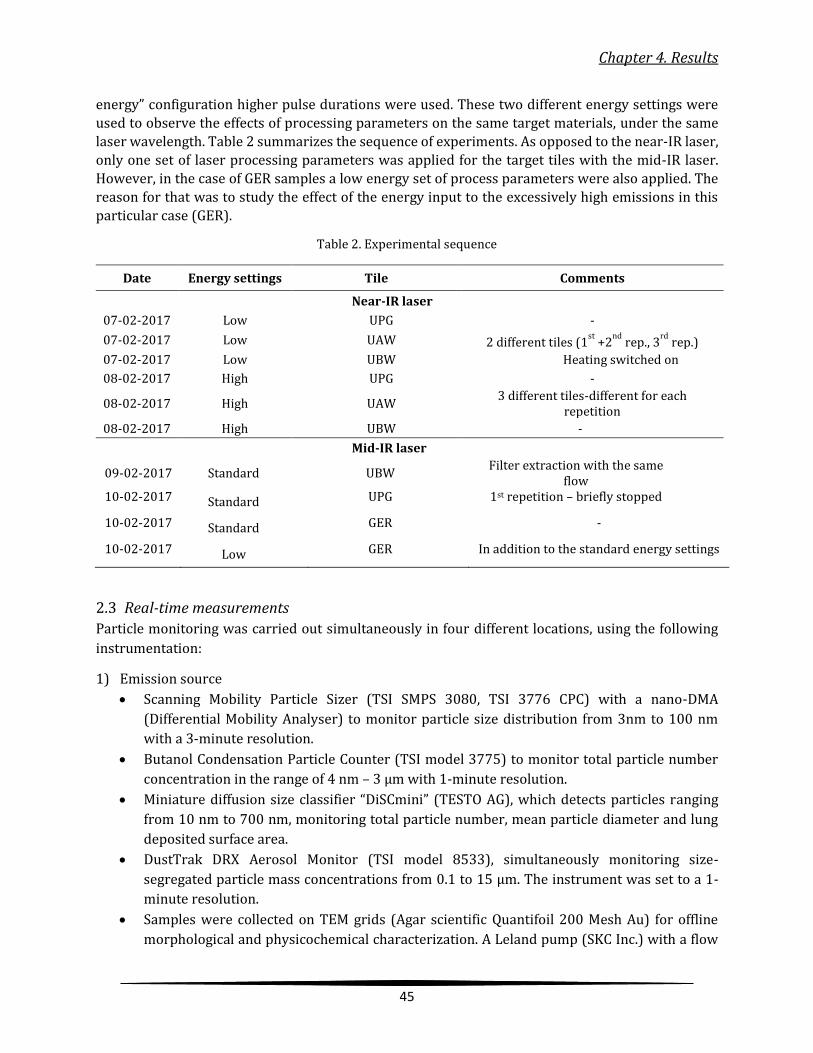
Chapter 4. Results
45
energy” configuration higher pulse durations were used. These two different energy settings were
used to observe the effects of processing parameters on the same target materials, under the same
laser wavelength. Table 2 summarizes the sequence of experiments. As opposed to the near-IR laser,
only one set of laser processing parameters was applied for the target tiles with the mid-IR laser.
However, in the case of GER samples a low energy set of process parameters were also applied. The
reason for that was to study the effect of the energy input to the excessively high emissions in this
particular case (GER).
Table 2. Experimental sequence
Date Energy settings Tile Comments
Near-IR laser
07-02-2017 Low UPG -
07-02-2017 Low UAW 2 different tiles (1st
+2nd
rep., 3rd
rep.)
07-02-2017 Low UBW Heating switched on
08-02-2017 High UPG -
08-02-2017 High UAW 3 different tiles-different for each
repetition
08-02-2017 High UBW -
Mid-IR laser
09-02-2017 Standard UBW Filter extraction with the same
flow 10-02-2017 Standard UPG 1st repetition – briefly stopped
10-02-2017 Standard GER -
10-02-2017 Low GER In addition to the standard energy settings
2.3 Real-time measurements
Particle monitoring was carried out simultaneously in four different locations, using the following
instrumentation:
1) Emission source
Scanning Mobility Particle Sizer (TSI SMPS 3080, TSI 3776 CPC) with a nano-DMA
(Differential Mobility Analyser) to monitor particle size distribution from 3nm to 100 nm
with a 3-minute resolution.
Butanol Condensation Particle Counter (TSI model 3775) to monitor total particle number
concentration in the range of 4 nm – 3 µm with 1-minute resolution.
Miniature diffusion size classifier “DiSCmini” (TESTO AG), which detects particles ranging
from 10 nm to 700 nm, monitoring total particle number, mean particle diameter and lung
deposited surface area.
DustTrak DRX Aerosol Monitor (TSI model 8533), simultaneously monitoring size-
segregated particle mass concentrations from 0.1 to 15 μm. The instrument was set to a 1-
minute resolution.
Samples were collected on TEM grids (Agar scientific Quantifoil 200 Mesh Au) for offline
morphological and physicochemical characterization. A Leland pump (SKC Inc.) with a flow
Chapter 4. Results
46
of 5 litters/minute was connected with a cassette (SKC inlet diameter 1/8 inch and filter
support pads of diameter 25mm) to which the TEM grid was attached.
2) Near Field
Electrical mobility spectrometer (Nanoscan-SMPS, TSI model 3910) to monitor particle size
distribution. The size range of the instrument is 10 nm - 420 nm and the time resolution 1
minute.
Optical Particle Sizer (TSI model 3330) monitoring particle optical size distribution in the
0.3-10 µm range, with 1-minute time resolution.
Miniature diffusion size classifier “DiSCmini” (TESTO AG), see above.
Samples were also collected on TEM grids, see above.
3) Far-Field
Mini Wide Range Aerosol Spectrometer (GRIMM mini-WRAS) monitoring particle size
diameter from 10 nm – 35 µm. This instrument also provides PM1, PM2.5 and PM10 mass
concentrations.
Miniature diffusion size classifier “DiSCmini” (TESTO AG), see above.
DustTrak DRX Aerosol Monitor (TSI model 8533)
4) Outdoor
Miniature diffusion size classifier “DiSCmini” (TESTO AG), see above.
DustTrak DRX Aerosol Monitor (TSI model 8533), see above.
The emission source measurements for both lasers were performed inside the extraction tube at a
distance of approximately 0.5 m from the incident laser beam. It is not possible to provide a precise
distance since the laser beam was moving away from the extraction tube during the process. At the
emission source all the instruments used inlets with tubing no longer than 10 cm. For the DiSCmini
transparent conductive “Tygon” tubing was used (Asbach et al., 2016), while conductive silicone
tubing was used for the rest of the instruments. In the near-field, far-field and outdoor locations no
tubing was used for any of the online instruments. The potential limitations of the Dusttrak monitors
were taken into account (Rivas et al., 2017).
3. Results In this section time series of the different experimental cycles, categorized by laser and energy
settings, are described in terms of particle size distribution, particle number as well as mass
concentration. The results presented correspond to the emission source only, given that the data
collected in the near-field and far-field locations did not show any significant impacts from NP
emissions in the worker area or in the background. The lack of impact was due to the high efficiency
of the exposure mitigation mechanisms in place in this industrial setup (localized extraction). Thus,
under the conditions assessed in this work, no significant impact on worker exposure was detected.

Chapter 4. Results
47
Figure 2. Particle number concentrations (4 nm -3µm) during low energy and high energy ablation of the different tiles with the near-IR laser.
3.1 Near-IR laser
3.1.1 Experiments carried out under low energy settings
The time series of particle number concentration (N) in the size range 4nm-3µm of three different
tiles (UPG, UAW and UBW) are shown in Fig. 2. Emissions in terms of particle number (N) were
evident in all cases as soon as the laser beam hit the target, and for the entire duration of the ablation
run (20 minutes). Likewise, once the laser beam stopped, a rapid drop of N occurred allowing clear
separation of each repetition. The highest emissions were registered during the ablation of UAW tiles
(6.1*105/cm3), which released almost 6 times more particles than UBW (7.6*104/cm3) and 11 times
more than UPG (4.6*104/cm3). The UBW showed higher emissions than UPG, but still in the same
order of magnitude. The mean particle diameters in the range 10-700 nm (DiSCmini) were 59.6, 69.9
and 84.7 nm for the UPG, UAW and UBW tiles respectively.
The UPG and the UBW exhibited a very high reproducibility over their repetitions, while in the case
of UAW the last repetition showed higher emissions in terms of particle number concentration than
the first two. The reason behind this difference is that the two first repetitions were performed on
the two opposite sides of the same tile (front and back), while the third one was performed on a
different tile. Even though tiles of the same material (α-alumina) were used, crystallographic analysis
of different UAW tiles showed that in some cases there was a minor phase of MgAl2O4 (spinel, Fig. S1)
which may have affected the emissions. The ablation of UAW tiles requires melting at 2050ºC
(Nedialkov, Atanasov, Sawczak, & Sliwinski, 2003) which is lower than the MgAl2O4 spinel melting
point (2135ºC). Therefore, it may be concluded that a potentially higher melting temperature
resulted in lower NP emissions.
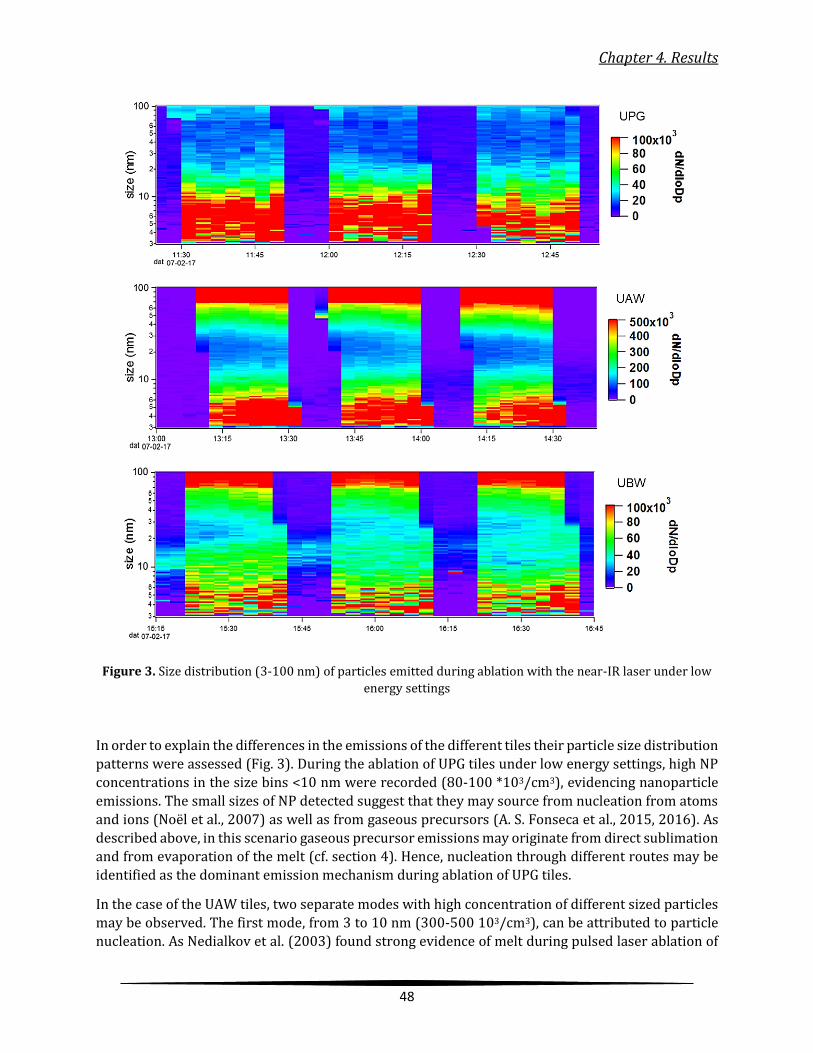
Chapter 4. Results
48
Figure 3. Size distribution (3-100 nm) of particles emitted during ablation with the near-IR laser under low
energy settings
In order to explain the differences in the emissions of the different tiles their particle size distribution
patterns were assessed (Fig. 3). During the ablation of UPG tiles under low energy settings, high NP
concentrations in the size bins <10 nm were recorded (80-100 *103/cm3), evidencing nanoparticle
emissions. The small sizes of NP detected suggest that they may source from nucleation from atoms
and ions (Noël et al., 2007) as well as from gaseous precursors (A. S. Fonseca et al., 2015, 2016). As
described above, in this scenario gaseous precursor emissions may originate from direct sublimation
and from evaporation of the melt (cf. section 4). Hence, nucleation through different routes may be
identified as the dominant emission mechanism during ablation of UPG tiles.
In the case of the UAW tiles, two separate modes with high concentration of different sized particles
may be observed. The first mode, from 3 to 10 nm (300-500 103/cm3), can be attributed to particle
nucleation. As Nedialkov et al. (2003) found strong evidence of melt during pulsed laser ablation of
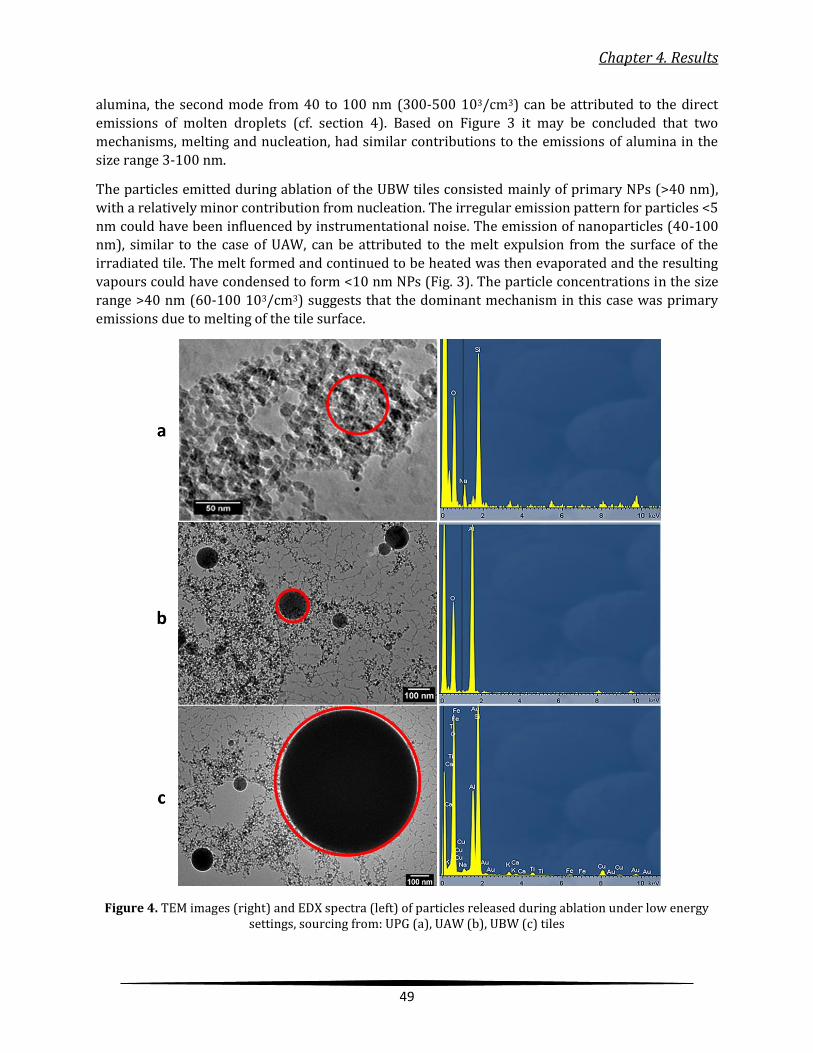
Chapter 4. Results
49
alumina, the second mode from 40 to 100 nm (300-500 103/cm3) can be attributed to the direct
emissions of molten droplets (cf. section 4). Based on Figure 3 it may be concluded that two
mechanisms, melting and nucleation, had similar contributions to the emissions of alumina in the
size range 3-100 nm.
The particles emitted during ablation of the UBW tiles consisted mainly of primary NPs (>40 nm),
with a relatively minor contribution from nucleation. The irregular emission pattern for particles <5
nm could have been influenced by instrumentational noise. The emission of nanoparticles (40-100 nm), similar to the case of UAW, can be attributed to the melt expulsion from the surface of the
irradiated tile. The melt formed and continued to be heated was then evaporated and the resulting
vapours could have condensed to form <10 nm NPs (Fig. 3). The particle concentrations in the size
range >40 nm (60-100 103/cm3) suggests that the dominant mechanism in this case was primary
emissions due to melting of the tile surface.
Figure 4. TEM images (right) and EDX spectra (left) of particles released during ablation under low energy settings, sourcing from: UPG (a), UAW (b), UBW (c) tiles
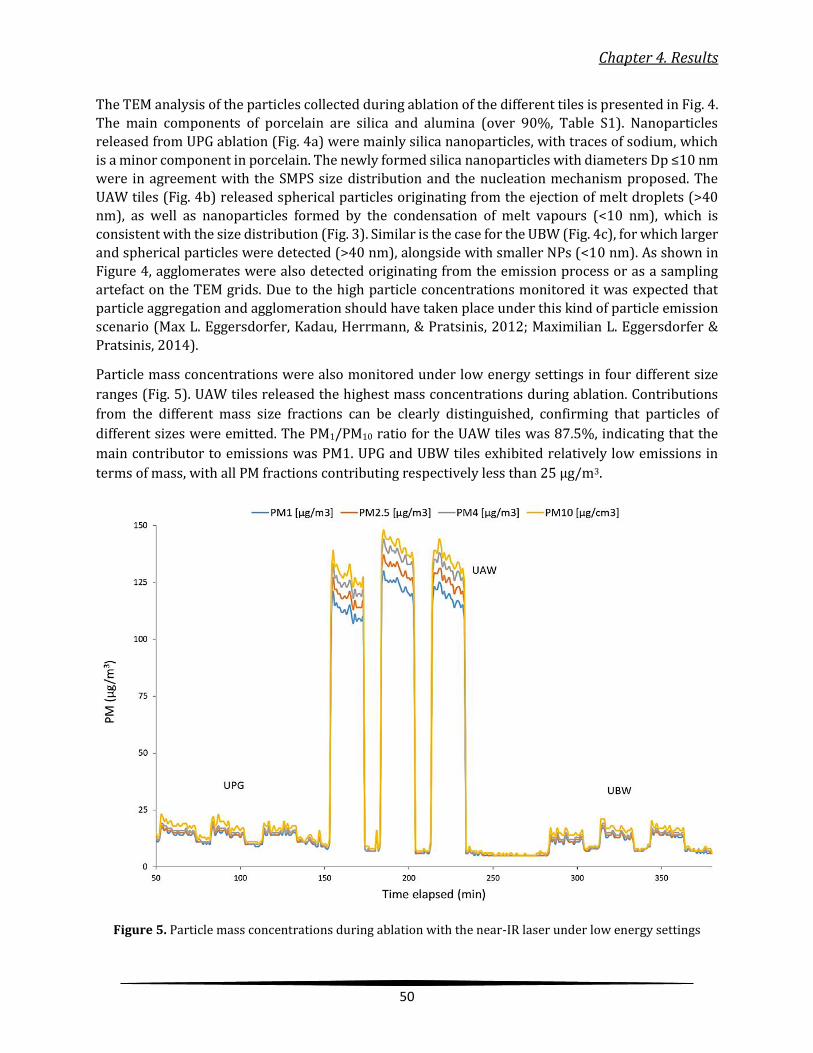
Chapter 4. Results
50
The TEM analysis of the particles collected during ablation of the different tiles is presented in Fig. 4.
The main components of porcelain are silica and alumina (over 90%, Table S1). Nanoparticles
released from UPG ablation (Fig. 4a) were mainly silica nanoparticles, with traces of sodium, which
is a minor component in porcelain. The newly formed silica nanoparticles with diameters Dp ≤10 nm
were in agreement with the SMPS size distribution and the nucleation mechanism proposed. The
UAW tiles (Fig. 4b) released spherical particles originating from the ejection of melt droplets (>40
nm), as well as nanoparticles formed by the condensation of melt vapours (<10 nm), which is
consistent with the size distribution (Fig. 3). Similar is the case for the UBW (Fig. 4c), for which larger
and spherical particles were detected (>40 nm), alongside with smaller NPs (<10 nm). As shown in
Figure 4, agglomerates were also detected originating from the emission process or as a sampling
artefact on the TEM grids. Due to the high particle concentrations monitored it was expected that
particle aggregation and agglomeration should have taken place under this kind of particle emission
scenario (Max L. Eggersdorfer, Kadau, Herrmann, & Pratsinis, 2012; Maximilian L. Eggersdorfer &
Pratsinis, 2014).
Particle mass concentrations were also monitored under low energy settings in four different size
ranges (Fig. 5). UAW tiles released the highest mass concentrations during ablation. Contributions
from the different mass size fractions can be clearly distinguished, confirming that particles of
different sizes were emitted. The PM1/PM10 ratio for the UAW tiles was 87.5%, indicating that the
main contributor to emissions was PM1. UPG and UBW tiles exhibited relatively low emissions in
terms of mass, with all PM fractions contributing respectively less than 25 µg/m3.
Figure 5. Particle mass concentrations during ablation with the near-IR laser under low energy settings
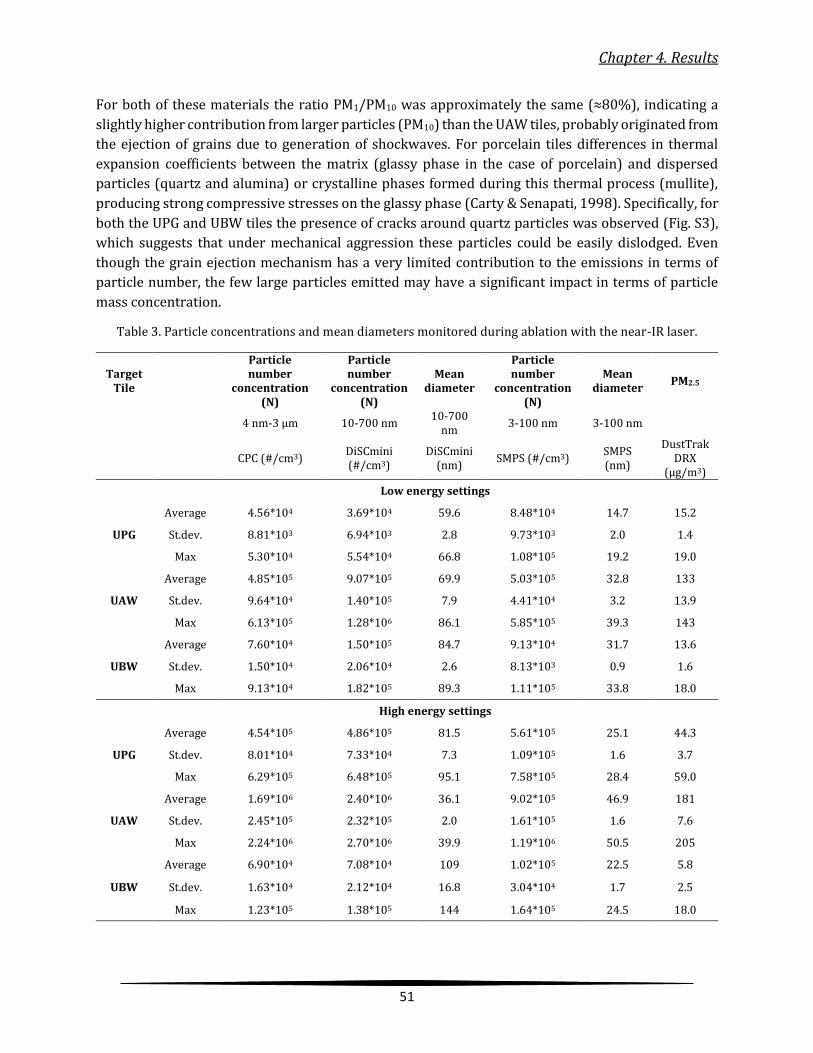
Chapter 4. Results
51
For both of these materials the ratio PM1/PM10 was approximately the same (≈80%), indicating a
slightly higher contribution from larger particles (PM10) than the UAW tiles, probably originated from
the ejection of grains due to generation of shockwaves. For porcelain tiles differences in thermal
expansion coefficients between the matrix (glassy phase in the case of porcelain) and dispersed
particles (quartz and alumina) or crystalline phases formed during this thermal process (mullite),
producing strong compressive stresses on the glassy phase (Carty & Senapati, 1998). Specifically, for
both the UPG and UBW tiles the presence of cracks around quartz particles was observed (Fig. S3),
which suggests that under mechanical aggression these particles could be easily dislodged. Even
though the grain ejection mechanism has a very limited contribution to the emissions in terms of
particle number, the few large particles emitted may have a significant impact in terms of particle
mass concentration.
Table 3. Particle concentrations and mean diameters monitored during ablation with the near-IR laser.
Target Tile
Particle number
concentration (N)
Particle number
concentration (N)
Mean diameter
Particle number
concentration (N)
Mean diameter
PM2.5
4 nm-3 µm 10-700 nm 10-700
nm 3-100 nm 3-100 nm
CPC (#/cm3) DiSCmini (#/cm3)
DiSCmini (nm)
SMPS (#/cm3) SMPS (nm)
DustTrak DRX
(µg/m3)
Low energy settings
UPG
Average 4.56*104 3.69*104 59.6 8.48*104 14.7 15.2
St.dev. 8.81*103 6.94*103 2.8 9.73*103 2.0 1.4
Max 5.30*104 5.54*104 66.8 1.08*105 19.2 19.0
UAW
Average 4.85*105 9.07*105 69.9 5.03*105 32.8 133
St.dev. 9.64*104 1.40*105 7.9 4.41*104 3.2 13.9
Max 6.13*105 1.28*106 86.1 5.85*105 39.3 143
UBW
Average 7.60*104 1.50*105 84.7 9.13*104 31.7 13.6
St.dev. 1.50*104 2.06*104 2.6 8.13*103 0.9 1.6
Max 9.13*104 1.82*105 89.3 1.11*105 33.8 18.0
High energy settings
UPG
Average 4.54*105 4.86*105 81.5 5.61*105 25.1 44.3
St.dev. 8.01*104 7.33*104 7.3 1.09*105 1.6 3.7
Max 6.29*105 6.48*105 95.1 7.58*105 28.4 59.0
UAW
Average 1.69*106 2.40*106 36.1 9.02*105 46.9 181
St.dev. 2.45*105 2.32*105 2.0 1.61*105 1.6 7.6
Max 2.24*106 2.70*106 39.9 1.19*106 50.5 205
UBW
Average 6.90*104 7.08*104 109 1.02*105 22.5 5.8
St.dev. 1.63*104 2.12*104 16.8 3.04*104 1.7 2.5
Max 1.23*105 1.38*105 144 1.64*105 24.5 18.0

Chapter 4. Results
52
3.1.2 Experiments carried out under high energy settings
Higher energy settings were expected to have a major effect on ablation as higher temperatures,
more intense and expanded plasmas, were introduced.
Figure 6. Size distribution (3-100 nm) of particles emitted during ablation with the near-IR laser under high
energy settings
NP emissions in terms of particle number concentration were much higher under high energy
settings in comparison to low energy settings for UAW and UPG tiles, while they were in the same
range for UBW (Fig. 2). A good reproducibility was achieved and the patterns were similar to the ones
obtained from the lower energy settings experiments. Specifically, for UAW tiles particle number
concentrations under high energy settings increased by approximately a factor of three
(1.7*106/cm3) and for UPG by one order of magnitude (4.5*105/cm3) compared to low energy
settings. In the size range 10-700 nm mean diameters for the UPG and UBW tiles (Fig. S2 in
Supplementary material) increased by approximately 20nm from the respective low energy values
(Table 3) indicating a similar change in the particle release mechanisms for this size range.
In terms of particle size distribution (3-100 nm, Fig. 6), different patterns were observed. NPs
released from UPG tiles showed high concentrations in the size range 3-15 nm, which were
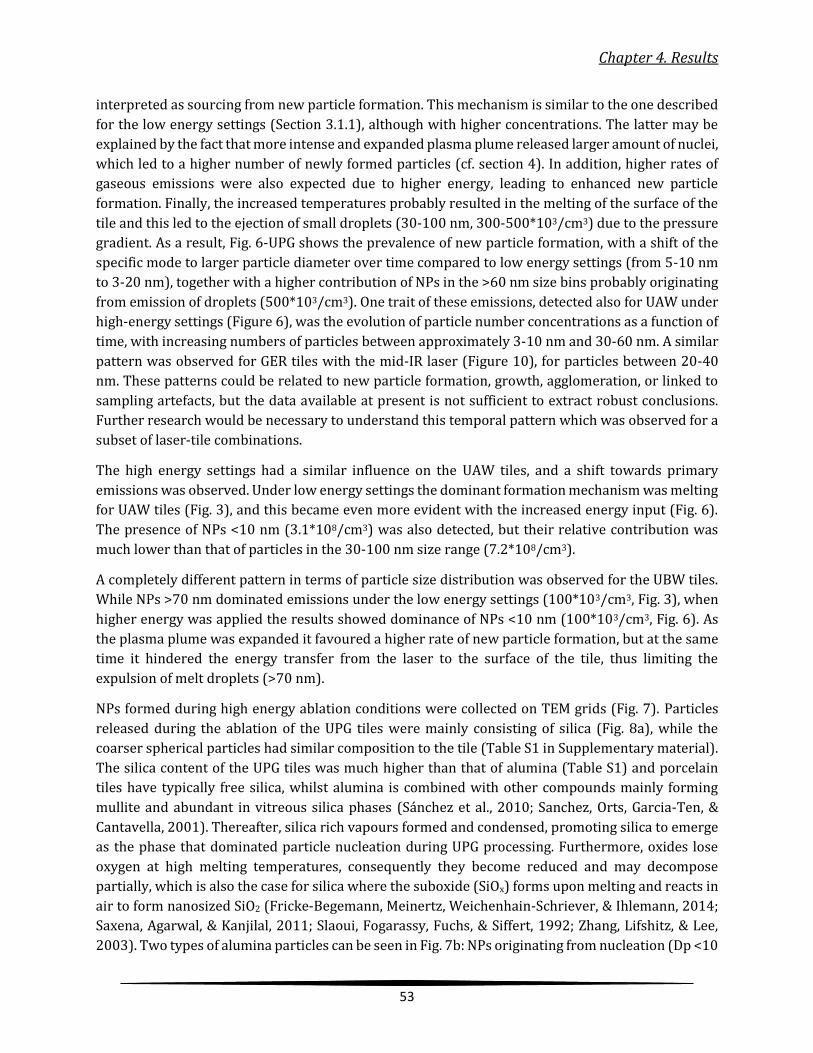
Chapter 4. Results
53
interpreted as sourcing from new particle formation. This mechanism is similar to the one described
for the low energy settings (Section 3.1.1), although with higher concentrations. The latter may be
explained by the fact that more intense and expanded plasma plume released larger amount of nuclei,
which led to a higher number of newly formed particles (cf. section 4). In addition, higher rates of
gaseous emissions were also expected due to higher energy, leading to enhanced new particle
formation. Finally, the increased temperatures probably resulted in the melting of the surface of the
tile and this led to the ejection of small droplets (30-100 nm, 300-500*103/cm3) due to the pressure
gradient. As a result, Fig. 6-UPG shows the prevalence of new particle formation, with a shift of the
specific mode to larger particle diameter over time compared to low energy settings (from 5-10 nm
to 3-20 nm), together with a higher contribution of NPs in the >60 nm size bins probably originating
from emission of droplets (500*103/cm3). One trait of these emissions, detected also for UAW under
high-energy settings (Figure 6), was the evolution of particle number concentrations as a function of
time, with increasing numbers of particles between approximately 3-10 nm and 30-60 nm. A similar
pattern was observed for GER tiles with the mid-IR laser (Figure 10), for particles between 20-40
nm. These patterns could be related to new particle formation, growth, agglomeration, or linked to
sampling artefacts, but the data available at present is not sufficient to extract robust conclusions.
Further research would be necessary to understand this temporal pattern which was observed for a
subset of laser-tile combinations.
The high energy settings had a similar influence on the UAW tiles, and a shift towards primary
emissions was observed. Under low energy settings the dominant formation mechanism was melting
for UAW tiles (Fig. 3), and this became even more evident with the increased energy input (Fig. 6).
The presence of NPs <10 nm (3.1*108/cm3) was also detected, but their relative contribution was
much lower than that of particles in the 30-100 nm size range (7.2*108/cm3).
A completely different pattern in terms of particle size distribution was observed for the UBW tiles.
While NPs >70 nm dominated emissions under the low energy settings (100*103/cm3, Fig. 3), when
higher energy was applied the results showed dominance of NPs <10 nm (100*103/cm3, Fig. 6). As
the plasma plume was expanded it favoured a higher rate of new particle formation, but at the same
time it hindered the energy transfer from the laser to the surface of the tile, thus limiting the
expulsion of melt droplets (>70 nm).
NPs formed during high energy ablation conditions were collected on TEM grids (Fig. 7). Particles
released during the ablation of the UPG tiles were mainly consisting of silica (Fig. 8a), while the
coarser spherical particles had similar composition to the tile (Table S1 in Supplementary material).
The silica content of the UPG tiles was much higher than that of alumina (Table S1) and porcelain
tiles have typically free silica, whilst alumina is combined with other compounds mainly forming
mullite and abundant in vitreous silica phases (Sánchez et al., 2010; Sanchez, Orts, Garcia-Ten, &
Cantavella, 2001). Thereafter, silica rich vapours formed and condensed, promoting silica to emerge
as the phase that dominated particle nucleation during UPG processing. Furthermore, oxides lose
oxygen at high melting temperatures, consequently they become reduced and may decompose
partially, which is also the case for silica where the suboxide (SiOx) forms upon melting and reacts in
air to form nanosized SiO2 (Fricke-Begemann, Meinertz, Weichenhain-Schriever, & Ihlemann, 2014;
Saxena, Agarwal, & Kanjilal, 2011; Slaoui, Fogarassy, Fuchs, & Siffert, 1992; Zhang, Lifshitz, & Lee,
2003). Two types of alumina particles can be seen in Fig. 7b: NPs originating from nucleation (Dp <10

Chapter 4. Results
54
nm), and larger spherical particles from the droplets of molten material. Similar results were
obtained for UBW tiles (Fig. 7c).
Figure 7. TEM images (left) and EDX spectra (right) of particles released during ablation under high energy settings, sourcing from: UPG (a), UAW (b), UBW (c) tiles
To conclude, even though the two porcelain tiles (UPG and UBW) had similar chemical composition
(Table S1), differences in their NP emissions were observed. Specifically, SiO2 NPs were formed and
released in the case of UPG but not from the UBW tiles. This may be explained by the fact that the two
porcelain tiles had different microstructures (Fig. S3 in Supplementary material). While the surface
of the UPG tile shows agglomerates of grains in a vitreous (amorphous) matrix, the UBW tiles exhibit
a more homogenous surface. Based on the above, it was interpreted that as the laser moved onto the
surface of the UPG tile it would have melted and evaporated the different components, and
Chapter 4. Results
55
consequently released species with different chemical composition than the matrix. Conversely, in
the case of UBW tile all of the species emitted – and thus NPs – had the same chemical composition.
Figure 8. Particle mass concentrations during ablation with the near-IR laser under high energy settings
Particle mass concentrations are shown in Fig. 8, where PM2.5 emissions from UPG tiles (44 µg/m3)
were higher by a factor of 3 when compared to the low energy settings (Table 3). Hence, higher
energy laser processing results in increased particle mass as well as number concentrations. The
situation was different for UBW tiles, where a reduction was observed for particle mass
concentrations, and PM2.5 values (5.8 µg/m3) decreased by a factor of two when compared to the low
energy settings (Table 3). The PM1/PM10 ratio also decreased to 64%, indicating a relatively higher
contribution of coarser particles to emissions in particle mass. Due to the high temperatures achieved
with the laser different chemical reactions and transformations were induced: the porous UBW tiles
released nanosized particles from the homogenous melt, while in the case of dense porcelain tiles
(UPG) thermal shock results in ejection of grains due to differences in thermal expansion coefficients
(Lahoz et al., 2011; Pascual-Cosp et al., 2002, 2001). Therefore, the UPG released more particle mass
than the UBW and these results are also in agreement with those obtained for particle number
concentrations (Fig. 2).
Finally, particle mass concentrations for UAW tiles were similar under low and high energy settings,
as was also the PM1/PM10 ratio (86%). The relative shift in particle size distribution observed for NPs
emitted during ablation of this kind of tile did not have an impact on particle mass concentrations,
given that the major concentration of particles monitored had diameters 3-100 nm.
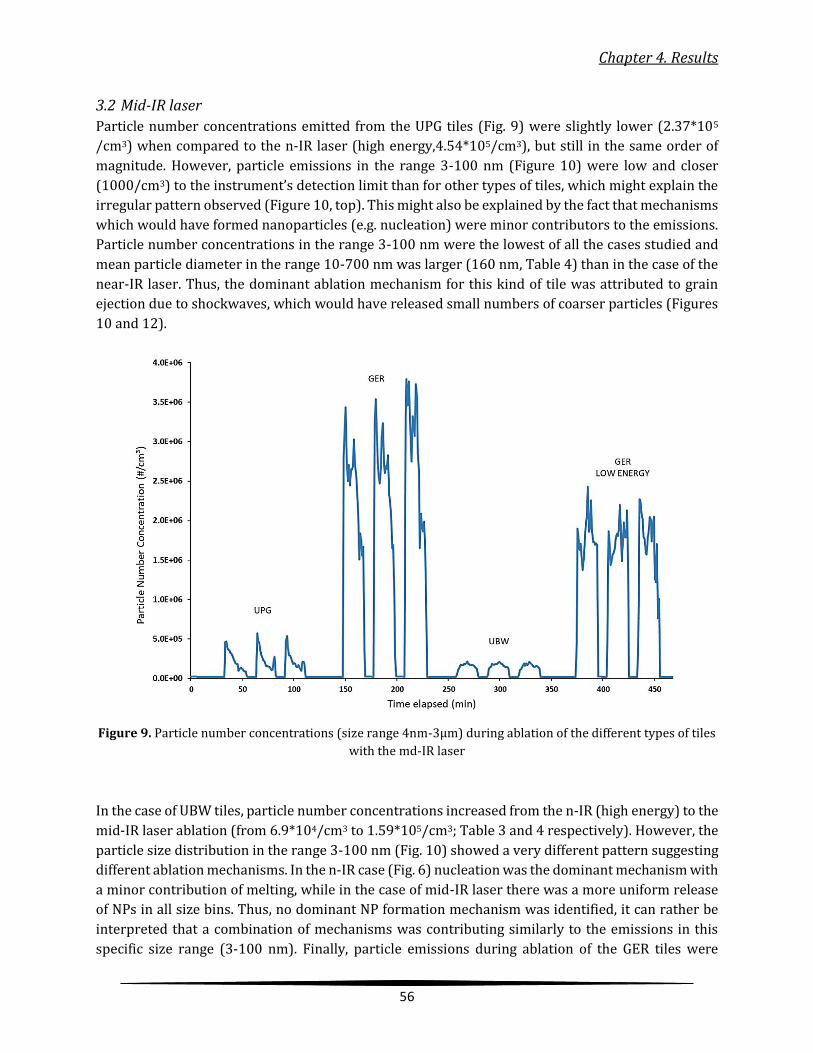
Chapter 4. Results
56
3.2 Mid-IR laser
Particle number concentrations emitted from the UPG tiles (Fig. 9) were slightly lower (2.37*105
/cm3) when compared to the n-IR laser (high energy,4.54*105/cm3), but still in the same order of
magnitude. However, particle emissions in the range 3-100 nm (Figure 10) were low and closer
(1000/cm3) to the instrument’s detection limit than for other types of tiles, which might explain the
irregular pattern observed (Figure 10, top). This might also be explained by the fact that mechanisms
which would have formed nanoparticles (e.g. nucleation) were minor contributors to the emissions.
Particle number concentrations in the range 3-100 nm were the lowest of all the cases studied and
mean particle diameter in the range 10-700 nm was larger (160 nm, Table 4) than in the case of the
near-IR laser. Thus, the dominant ablation mechanism for this kind of tile was attributed to grain
ejection due to shockwaves, which would have released small numbers of coarser particles (Figures
10 and 12).
Figure 9. Particle number concentrations (size range 4nm-3µm) during ablation of the different types of tiles
with the md-IR laser
In the case of UBW tiles, particle number concentrations increased from the n-IR (high energy) to the
mid-IR laser ablation (from 6.9*104/cm3 to 1.59*105/cm3; Table 3 and 4 respectively). However, the
particle size distribution in the range 3-100 nm (Fig. 10) showed a very different pattern suggesting
different ablation mechanisms. In the n-IR case (Fig. 6) nucleation was the dominant mechanism with
a minor contribution of melting, while in the case of mid-IR laser there was a more uniform release
of NPs in all size bins. Thus, no dominant NP formation mechanism was identified, it can rather be
interpreted that a combination of mechanisms was contributing similarly to the emissions in this
specific size range (3-100 nm). Finally, particle emissions during ablation of the GER tiles were
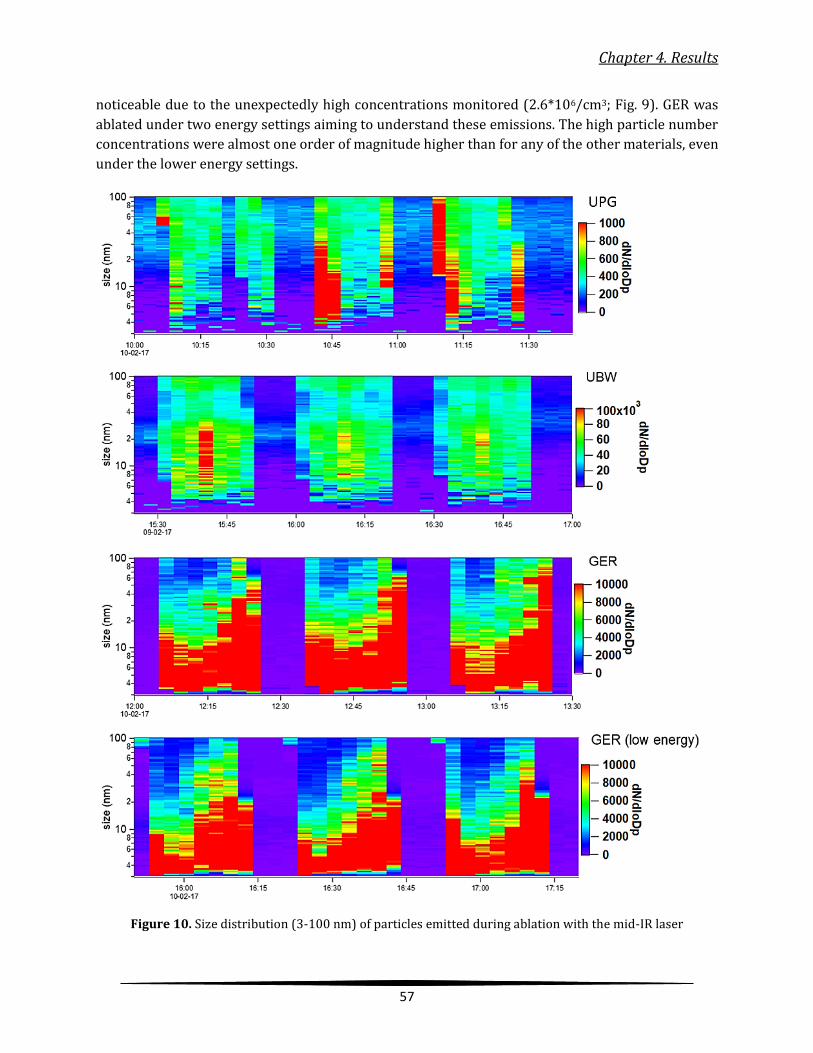
Chapter 4. Results
57
noticeable due to the unexpectedly high concentrations monitored (2.6*106/cm3; Fig. 9). GER was
ablated under two energy settings aiming to understand these emissions. The high particle number
concentrations were almost one order of magnitude higher than for any of the other materials, even
under the lower energy settings.
Figure 10. Size distribution (3-100 nm) of particles emitted during ablation with the mid-IR laser

Chapter 4. Results
58
The particle size distribution patterns (3-100 nm; Fig. 10) were very similar and reproducible for
both energy settings, and dominated by NPs <20 nm with an increasing contribution of <40 nm NPs
as the tile was being ablated. This would suggest a strong influence of nucleation and new particle
formation processes. In addition, during ablation it is expected that the glaze, the main difference
with the previous materials, would have molten and generated the ejection of droplets of different
sizes in this case mainly >100 nm. Thus, these particles would have been outside the scanning range
of the SMPS system used in this work, but not of the CPC (4nm-3µm, Fig. 9). These coarser particles
were detected by TEM and are shown in Fig. 11.
Figure 11. TEM images (left) and EDX spectra (right) of particles released during ablation using mid-IR laser, sourcing from UPG (a), UBW (b), GER (c) tiles

Chapter 4. Results
59
TEM images of particles emitted during ablation with the mid-IR laser are shown in Fig. 11. As
evidenced by the shape and size of the particles emitted (Fig. 11a), coarse grains of UPG tiles were
released due to the mechanical shockwave mechanism. EDX analysis of the smaller spherical
particles (Fig. 11a marked in red) showed that they consist of SiO2, probably originating from the
evaporation of silica, as was described in section 3.1.2. The case is similar for UBW tiles (Fig. 11b),
where spherical particles were also present. The formation of silica particles during the ablation of
the UBW occurred during irradiation with the mid-IR laser, while this effect was not observed with
the near-IR laser. The higher energy transmitted to the surface of the same tiles, as well as the
different wavelength of the radiation, may create a more extensive heat-affected zone and modify the
formation and release mechanisms, a fact that can be observed in the shape and size of the particles
emitted (Fig. 11). Finally, different types of particles were identified during ablation of GER tiles (Fig.
11c): spherical and relatively coarser particles (>200 nm) originating from melt ejection, while
irregular aggregates and NPs <20 nm are attributed to nucleation processes. The majority of the
particles consisted mainly of zinc oxide, which is in the glassy phase of the glaze (Aparici, Moreno,
Escardino, Amoros, & Mestre, 1994).
Table 4. Particle concentrations and mean diameters monitored during ablation with the mid-IR laser
Target Tile
Particle number
concentration (N)
Particle number
concentration (N)
Mean diameter
Particle number
concentration (N)
Mean diameter
PM2.5
4 nm-3 µm 10-700 nm 10-700
nm 3-100 nm 3-100 nm
CPC (#/cm3) DiSCmini (#/cm3)
DiSCmini (nm)
SMPS (#/cm3) SMPS (nm)
DustTrak DRX
(µg/m3)
UPG
Average 2.37*105 1.70*105 97.4 4.94*104 29.4 171
St.dev. 1.24*105 1.16*105 35.6 3.22*104 5.9 134
Max 5.73*105 5.13*105 187 1.49*105 38.6 674
UBW
Average 1.59*105 1.62*105 96.7 6.64*104 28.1 727
St.dev. 3.29*104 3.07*104 8.2 1.28*104 2.1 231
Max 2.14*105 2.20*105 110 1.03*105 32.7 1160
GER
Average 2.62*106 1.47*106 48.5 2.03*106 12.8 4450
St.dev. 6.48*105 5.58*105 7.5 1.96*106 3.9 2259
Max 3.79*106 2.70*106 61.5 6.76*106 18.8 11900
GER (low energy
settings)
Average 1.76*106 8.39*105 68.1 2.63*106 12.4 3119
St.dev. 2.97*105 1.56*105 10.1 5.64*106 4.4 2062
Max 2.43*106 1.45*106 97.1 2.45*107 18.9 10400
High particle mass concentrations (up to PM2.5 11900 µg/m3) with irregular emission patterns were
recorded for the GER tiles, which varied as a function of the energy settings (Figure 12). The
shockwave mechanism was attributed as the main contributor to these emissions. For UBW tiles
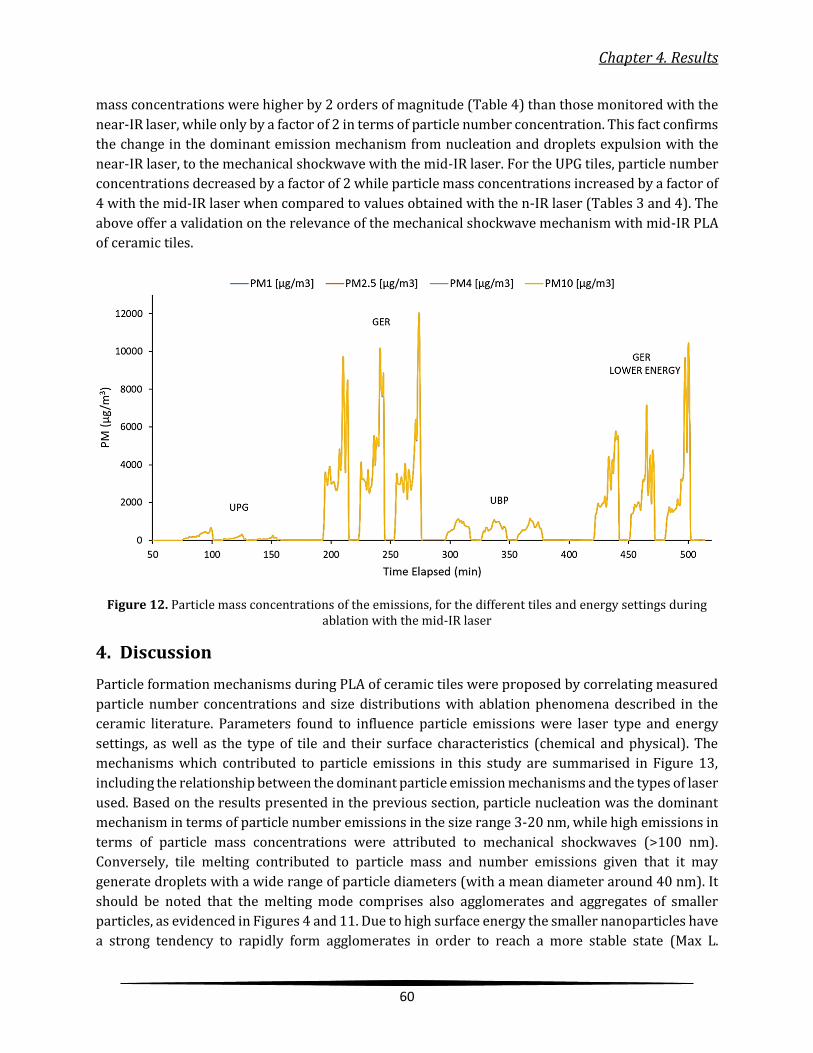
Chapter 4. Results
60
mass concentrations were higher by 2 orders of magnitude (Table 4) than those monitored with the
near-IR laser, while only by a factor of 2 in terms of particle number concentration. This fact confirms
the change in the dominant emission mechanism from nucleation and droplets expulsion with the
near-IR laser, to the mechanical shockwave with the mid-IR laser. For the UPG tiles, particle number
concentrations decreased by a factor of 2 while particle mass concentrations increased by a factor of
4 with the mid-IR laser when compared to values obtained with the n-IR laser (Tables 3 and 4). The
above offer a validation on the relevance of the mechanical shockwave mechanism with mid-IR PLA
of ceramic tiles.
Figure 12. Particle mass concentrations of the emissions, for the different tiles and energy settings during ablation with the mid-IR laser
4. Discussion
Particle formation mechanisms during PLA of ceramic tiles were proposed by correlating measured
particle number concentrations and size distributions with ablation phenomena described in the
ceramic literature. Parameters found to influence particle emissions were laser type and energy
settings, as well as the type of tile and their surface characteristics (chemical and physical). The
mechanisms which contributed to particle emissions in this study are summarised in Figure 13,
including the relationship between the dominant particle emission mechanisms and the types of laser
used. Based on the results presented in the previous section, particle nucleation was the dominant
mechanism in terms of particle number emissions in the size range 3-20 nm, while high emissions in
terms of particle mass concentrations were attributed to mechanical shockwaves (>100 nm).
Conversely, tile melting contributed to particle mass and number emissions given that it may
generate droplets with a wide range of particle diameters (with a mean diameter around 40 nm). It
should be noted that the melting mode comprises also agglomerates and aggregates of smaller
particles, as evidenced in Figures 4 and 11. Due to high surface energy the smaller nanoparticles have
a strong tendency to rapidly form agglomerates in order to reach a more stable state (Max L.
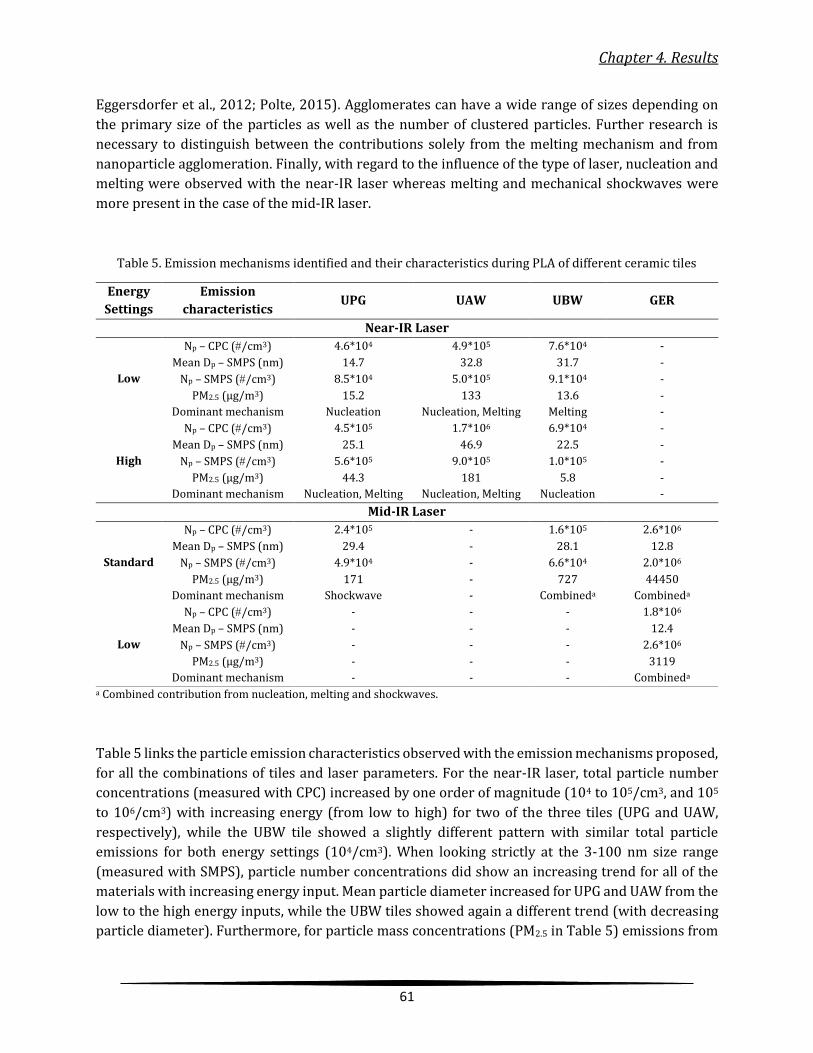
Chapter 4. Results
61
Eggersdorfer et al., 2012; Polte, 2015). Agglomerates can have a wide range of sizes depending on
the primary size of the particles as well as the number of clustered particles. Further research is
necessary to distinguish between the contributions solely from the melting mechanism and from
nanoparticle agglomeration. Finally, with regard to the influence of the type of laser, nucleation and
melting were observed with the near-IR laser whereas melting and mechanical shockwaves were
more present in the case of the mid-IR laser.
Table 5. Emission mechanisms identified and their characteristics during PLA of different ceramic tiles
Energy
Settings
Emission
characteristics UPG UAW UBW GER
Near-IR Laser
Low
Np – CPC (/cm3) 4.6*104 4.9*105 7.6*104 -
Mean Dp – SMPS (nm) 14.7 32.8 31.7 -
Np – SMPS (/cm3) 8.5*104 5.0*105 9.1*104 -
PM2.5 (µg/m3) 15.2 133 13.6 -
Dominant mechanism Nucleation Nucleation, Melting Melting -
High
Np – CPC (/cm3) 4.5*105 1.7*106 6.9*104 -
Mean Dp – SMPS (nm) 25.1 46.9 22.5 -
Np – SMPS (/cm3) 5.6*105 9.0*105 1.0*105 -
PM2.5 (µg/m3) 44.3 181 5.8 -
Dominant mechanism Nucleation, Melting Nucleation, Melting Nucleation -
Mid-IR Laser
Standard
Np – CPC (/cm3) 2.4*105 - 1.6*105 2.6*106
Mean Dp – SMPS (nm) 29.4 - 28.1 12.8
Np – SMPS (/cm3) 4.9*104 - 6.6*104 2.0*106
PM2.5 (µg/m3) 171 - 727 44450
Dominant mechanism Shockwave - Combineda Combineda
Low
Np – CPC (/cm3) - - - 1.8*106
Mean Dp – SMPS (nm) - - - 12.4
Np – SMPS (/cm3) - - - 2.6*106
PM2.5 (µg/m3) - - - 3119
Dominant mechanism - - - Combineda a Combined contribution from nucleation, melting and shockwaves.
Table 5 links the particle emission characteristics observed with the emission mechanisms proposed,
for all the combinations of tiles and laser parameters. For the near-IR laser, total particle number
concentrations (measured with CPC) increased by one order of magnitude (104 to 105/cm3, and 105
to 106/cm3) with increasing energy (from low to high) for two of the three tiles (UPG and UAW,
respectively), while the UBW tile showed a slightly different pattern with similar total particle
emissions for both energy settings (104/cm3). When looking strictly at the 3-100 nm size range
(measured with SMPS), particle number concentrations did show an increasing trend for all of the
materials with increasing energy input. Mean particle diameter increased for UPG and UAW from the
low to the high energy inputs, while the UBW tiles showed again a different trend (with decreasing
particle diameter). Furthermore, for particle mass concentrations (PM2.5 in Table 5) emissions from
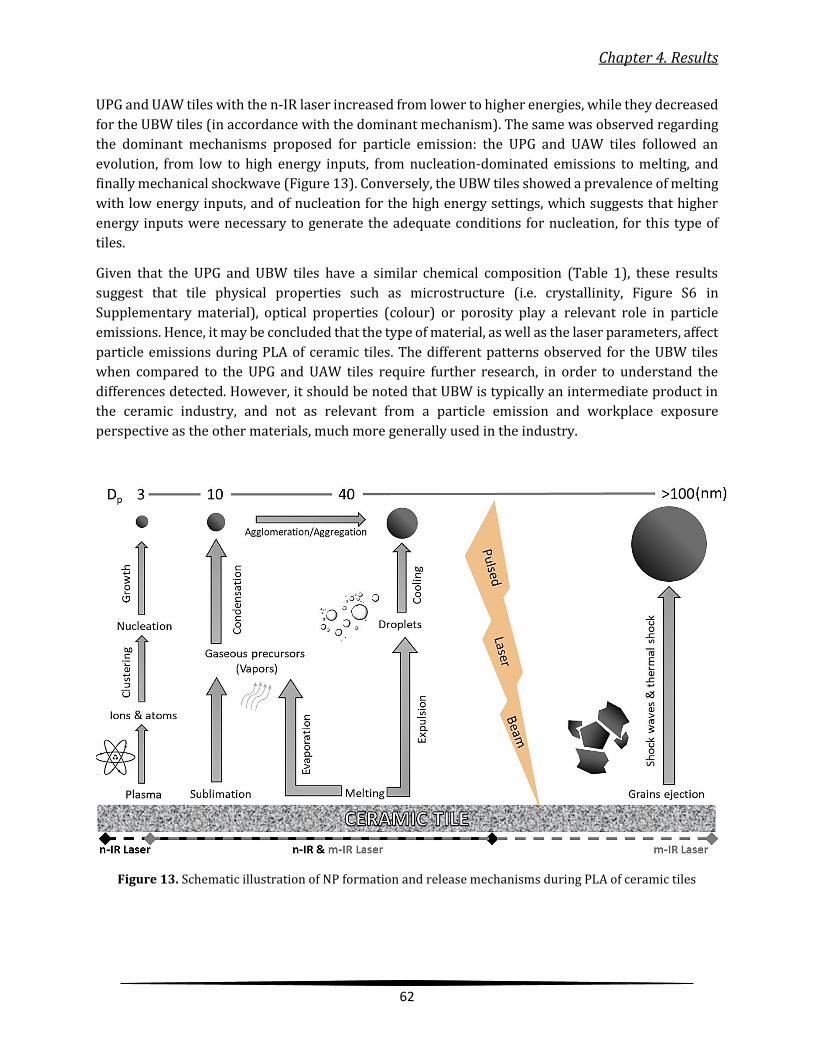
Chapter 4. Results
62
UPG and UAW tiles with the n-IR laser increased from lower to higher energies, while they decreased
for the UBW tiles (in accordance with the dominant mechanism). The same was observed regarding
the dominant mechanisms proposed for particle emission: the UPG and UAW tiles followed an
evolution, from low to high energy inputs, from nucleation-dominated emissions to melting, and
finally mechanical shockwave (Figure 13). Conversely, the UBW tiles showed a prevalence of melting
with low energy inputs, and of nucleation for the high energy settings, which suggests that higher
energy inputs were necessary to generate the adequate conditions for nucleation, for this type of
tiles.
Given that the UPG and UBW tiles have a similar chemical composition (Table 1), these results
suggest that tile physical properties such as microstructure (i.e. crystallinity, Figure S6 in
Supplementary material), optical properties (colour) or porosity play a relevant role in particle
emissions. Hence, it may be concluded that the type of material, as well as the laser parameters, affect
particle emissions during PLA of ceramic tiles. The different patterns observed for the UBW tiles
when compared to the UPG and UAW tiles require further research, in order to understand the
differences detected. However, it should be noted that UBW is typically an intermediate product in
the ceramic industry, and not as relevant from a particle emission and workplace exposure
perspective as the other materials, much more generally used in the industry.
Figure 13. Schematic illustration of NP formation and release mechanisms during PLA of ceramic tiles

Chapter 4. Results
63
5. Conclusions This work presents an interdisciplinary study, which aims to establish a connection between aerosol
research, laser ablation and ceramic technology, with potential implications for human health. NP
emissions were monitored during pulsed laser ablation (PLA) of ceramic tiles with the aim to
understand the mechanisms behind particle formation and release. The assessment of particle
number concentrations and size distributions evidenced that particle formation was directly
connected with ablation phenomena. Four different types of tiles (unglazed porcelain, unglazed
alumina, unglazed biscuit porcelain and glazed earthenware) and two lasers (near-IR and mid-IR)
were used. Irrespective of the combination of laser and tile used, high concentrations of NPs were
released during PLA of ceramic tiles. The ceramic tile composition, physicochemical properties, and
surface microstructure are parameters which affect particle release during PLA. In terms of particle
number, emissions were higher during the ablation of unglazed alumina (UAW) and glazed
earthenware (GER). SiO2 and Al2O3 particles (>10 nm) were formed through different nucleation
pathways during ablation of the ceramic tiles.
Although a combination of mechanisms was seen to contribute to particle number emissions, the
dominant ones were nucleation and melting with the near-IR laser, whereas they were melting and
mechanical shockwaves for the mid-IR laser. Melting and the subsequent ejection of droplets in the
range 40-700 nm were found to have a significant contribution in terms of particle number
concentration. Nucleation generated particles <20 nm, and mechanical shockwaves released
particles >100 nm. Thus, the ablation of tiles for which the dominant mechanism was nucleation
resulted in high particle number concentrations, whereas for tiles dominated by mechanical
shockwaves high particle mass concentrations were monitored. These results are potentially
relevant from the point of view of exposure mitigation strategies in industrial facilities where PLA is
carried out. The localized extraction system implemented in the scenarios assessed proved to be an
efficient mitigation measure, as it prevented particle release to the worker area.
6. Acknowledgements
The authors kindly acknowledge Mr. Carlos Borrell and Mr. Carlos Estepa for their help during the
experimental work and Dr Natalia Moreno for the XRD measurements. The current work was carried
out in the framework of the CERASAFE project (www.cerasafe.eu), with the support of SIINN ERA-
NET (project id: 16), and is funded by the Spanish MINECO (PCIN-2015-173-C02-01). Partial support
from project MAT2016-79866-R (AEI/FEDER, UE) is acknowledged.

Chapter 4. Results
64
REFERENCES
Andreeta, M. R. B., Cunha, L. S., Vales, L. F., Caraschi, L. C., & Jasinevicius, R. G. (2011). Bidimensional codes recorded on an oxide glass surface using a continuous wave CO2 laser. Journal of Micromechanics and Microengineering, 21(2), 025004. https://doi.org/10.1088/0960-1317/21/2/025004
Aparici, J., Moreno, A., Escardino, A., Amoros, J. L., & Mestre, S. (1994). Study of Opacification in Zirconium Ceramic Glazes Used in Single-Fired Wall Tile Manufacture. In Study of Opacification in Zirconium Ceramic Glazes Used in Single-Fired Wall Tile Manufacture (pp. 35–45). Castellon de la plana, Spain: QUALICER 94.
Asbach, C., Kaminski, H., Lamboy, Y., Schneiderwind, U., Fierz, M., & Todea, A. M. (2016). Silicone sampling tubes can cause drastic artifacts in measurements with aerosol instrumentation based on unipolar diffusion charging. Aerosol Science and Technology, 50(12), 1375–1384. https://doi.org/10.1080/02786826.2016.1241858
Carty, W. M., & Senapati, U. (1998). Porcelain - Raw materials, processing, phase evolution, and mechanical behavior. Journal of the American Ceramic Society, 81(1), 3–20. https://doi.org/10.1111/j.1151-2916.1998.tb02290.x
Curwin, B., & Bertke, S. (2011). Exposure characterization of metal oxide nanoparticles in the workplace. Journal of Occupational and Environmental Hygiene, 8(10), 580–587. https://doi.org/10.1080/15459624.2011.613348
Czotscher, T., & Vollertsen, F. (2016). Analysis of melting and melt expulsion during nanosecond pulsed laser ablation. Physics Procedia, 83, 53–61. https://doi.org/10.1016/j.phpro.2016.08.007
Demou, E., Peter, P., & Hellweg, S. (2008). Exposure to manufactured nanostructured particles in an industrial pilot plant. Annals of Occupational Hygiene, 52(8), 695–706. https://doi.org/10.1093/annhyg/men058
Eggersdorfer, M. L., Kadau, D., Herrmann, H. J., & Pratsinis, S. E. (2012). Aggregate morphology evolution by sintering: Number and diameter of primary particles. Journal of Aerosol Science, 46, 7–19. https://doi.org/10.1016/j.jaerosci.2011.11.005
Eggersdorfer, M. L., & Pratsinis, S. E. (2014). Agglomerates and aggregates of nanoparticles made in the gas phase. Advanced Powder Technology, 25(1), 71–90. https://doi.org/10.1016/j.apt.2013.10.010
Fonseca, A. S., Maragkidou, A., Viana, M., Querol, X., Hämeri, K., de Francisco, I., … de la Fuente, G. F. (2016). Process-generated nanoparticles from ceramic tile sintering: Emissions, exposure and environmental release. Science of the Total Environment, 565, 922–932. https://doi.org/10.1016/j.scitotenv.2016.01.106
Fonseca, A. S., Viana, M., Querol, X., Moreno, N., de Francisco, I., Estepa, C., & de la Fuente, G. F. (2015). Ultrafine and nanoparticle formation and emission mechanisms during laser processing of ceramic materials. Journal of Aerosol Science, 88, 48–57. https://doi.org/10.1016/j.jaerosci.2015.05.013
Fonseca, A. S., Viitanen, A. K., Koivisto, A. J., Kangas, A., Huhtiniemi, M., Hussein, T., … Hameri, K. (2014). Characterization of exposure to carbon nanotubes in an industrial setting. Annals of Occupational Hygiene, 59(5), 586–599. https://doi.org/10.1093/annhyg/meu110
Fricke-Begemann, T., Meinertz, J., Weichenhain-Schriever, R., & Ihlemann, J. (2014). Silicon suboxide (SiOx): laser processing and applications. Applied Physics A: Materials Science and Processing, 117(1), 13–18. https://doi.org/10.1007/s00339-014-8236-3
Gandra, J., Miranda, R., Vilaa, P., Velhinho, A., & Teixeira, J. P. (2011). Functionally graded materials produced by friction stir processing. Journal of Materials Processing Technology, 211(11), 1659–1668. https://doi.org/10.1016/j.jmatprotec.2011.04.016
Chapter 4. Results
65
Gómez, V., Irusta, S., Balas, F., & Santamaria, J. (2013). Intense generation of respirable metal nanoparticles from a low-power soldering unit. Journal of Hazardous Materials, 256–257, 84–89. https://doi.org/10.1016/j.jhazmat.2013.03.067
Hameri, K., Lahde, T., Hussein, T., Koivisto, J., & Savolainen, K. (2009). Facing the key workplace challenge: Assessing and preventing exposure to nanoparticles at source. Inhalation Toxicology, 21, 17–24. https://doi.org/10.1080/08958370902942525
Heal, M. R., Kumar, P., & Harrison, R. M. (2012). Particles, air quality, policy and health. Chemical Society Reviews, 41(19), 6606. https://doi.org/10.1039/c2cs35076a
International Organization for Standardization. (2012). International Organization for Standardization 13006: Ceramic tiles - Definitions, classification, characteristics and marking. USA: ISO.
Koch, W., & Friedlander, S. K. (1989). The effect of particle coalescence on the surface area of a coagulating aerosol. Journal of Aerosol Science, 20(8), 891–894. https://doi.org/https://doi.org/10.1016/0021-8502(89)90719-2
Koivisto, A. J., Lyyränen, J., Auvinen, A., Vanhala, E., Hämeri, K., Tuomi, T., & Jokiniemi, J. (2012). Industrial worker exposure to airborne particles during the packing of pigment and nanoscale titanium dioxide. Inhalation Toxicology, 24(12), 839–849. https://doi.org/10.3109/08958378.2012.724474
Lahoz, R., De La Fuente, G. F., Pedra, J. M., & Carda, J. B. (2011). Laser engraving of ceramic tiles. International Journal of Applied Ceramic Technology, 8(5), 1208–1217. https://doi.org/10.1111/j.1744-7402.2010.02566.x
Lushnikov, A. A., Maksimenko, V. V, & Pakhomov, A. V. (1989). Fractal aggregates from laser plasma. Journal of Aerosol Science, 20(8), 865–870. https://doi.org/10.1016/0021-8502(89)90713-1
Nedialkov, N. N., Atanasov, P. A., Sawczak, M., & Sliwinski, G. (2003). Ablation of ceramics with ultraviolet, visible, and infrared nanosecond laser pulses. In Proc. SPIE 5120, XIV International Symposium on Gas Flow, Chemical Lasers, and High-Power Lasers (Vol. 5120, pp. 703–708). https://doi.org/10.1117/12.515847
Noël, S., Hermann, J., & Itina, T. (2007). Investigation of nanoparticle generation during femtosecond laser ablation of metals. Applied Surface Science, 253(15), 6310–6315. https://doi.org/10.1016/j.apsusc.2007.01.081
Oberdörster, G. (2001). Pulmonary effects of inhaled ultrafine particles. International Archives of Occupational and Environmental Health, 74(1), 1–8. https://doi.org/10.1007/s004200000185
Pascual-Cosp, J., Ramírez del Valle, A. J., Garciá-Fortea, J., & Sánchez-Soto, P. J. (2002). Laser cutting of high-vitrified ceramic materials: Development of a method using a Nd:YAG laser to avoid catastrophic breakdown. Materials Letters, 55(4), 274–280. https://doi.org/10.1016/S0167-577X(02)00377-4
Pascual-Cosp, J., Ramírez Del Valle, A. J., García Fortea, J., & Sánchez Soto, P. J. (2001). Thermal evolution of a ceramic material processed using a Nd-YAG laser. Boletin de La Sociedad Espanola de Ceramica y Vidrio.
Pascual, A., Fortanet, E., Carda, J. B., Pavlov, R., Pedra, J. M., De La Fuente, G. F., … Lahoz, R. (2005). Ceramic tile decoration by laser technology. In CFI Ceramic Forum International (Vol. 82). Castellon de la plana, Spain.
Pfefferkorn, F. E., Bello, D., Haddad, G., Park, J. Y., Powell, M., McCarthy, J., … Hoover, M. D. (2009). Characterization of exposures to airborne nanoscale particles during friction stir welding of aluminum. Annals of Occupational Hygiene, 54(5), 486–503. https://doi.org/10.1093/annhyg/meq037
Phipps, C. (2007). Laser Ablation and its Applications. (E. W. T. Rhodes, E. B. a Adibi, T. Asakura, T. W. Hansch, T. Kamiya, F. Krausz, … W. T. Rhodes, Eds.), Springer Series in Optical Sciences (Vol. 129). USA: Springer. https://doi.org/10.1007/978-0-387-30453-3
Chapter 4. Results
66
Polte, J. (2015). Fundamental growth principles of colloidal metal nanoparticles – a new perspective. CrystEngComm, 17(36), 6809–6830. https://doi.org/10.1039/C5CE01014D
Rivas, I., Mazaheri, M., Viana, M., Moreno, T., Clifford, S., He, C., … Querol, X. (2017). Identification of technical problems affecting performance of DustTrak DRX aerosol monitors. Science of the Total Environment, 584–585, 849–855. https://doi.org/10.1016/j.scitotenv.2017.01.129
Russo, R. E., Mao, X., Gonzalez, J. J., Zorba, V., & Yoo, J. (2013). Laser ablation in analytical chemistry. Analytical Chemistry, 85(13), 6162–6177. https://doi.org/10.1021/ac4005327
Salomão, R., Bôas, M. O. C. V., & Pandolfelli, V. C. (2011). Porous alumina-spinel ceramics for high temperature applications. Ceramics International, 37(4), 1393–1399. https://doi.org/10.1016/j.ceramint.2011.01.012
Sánchez, E., García-Ten, J., Sanz, V., & Moreno, A. (2010). Porcelain tile: Almost 30 years of steady scientific-technological evolution. Ceramics International, 36(3), 831–845. https://doi.org/10.1016/j.ceramint.2009.11.016
Sanchez, E., Orts, M. J., Garcia-Ten, J., & Cantavella, V. (2001). Porcelain tile composition effect on phase formation and end products. American Ceramic Society Bulletin, 80(6), 43–49.
Saxena, N., Agarwal, A., & Kanjilal, D. (2011). Effect of thermal annealing on the formation of silicon nanoclusters in SiOXfilms grown by PLD. Physica B: Condensed Matter, 406(11), 2148–2151. https://doi.org/10.1016/j.physb.2011.03.019
Sivayoganathan, M., Tan, B., & Venkatakrishnan, K. (2012). Effect of mega-hertz repetition rate on the agglomerated particle size of femtosecond synthesized nanostructures. Optical Materials Express, 2(8), 987–995. https://doi.org/10.1364/OME.2.000987
Slaoui, A., Fogarassy, E., Fuchs, C., & Siffert, P. (1992). Properties of silicon dioxide films prepared by pulsed-laser ablation. Journal of Applied Physics, 71(2), 590–596. https://doi.org/10.1063/1.350411
Sugioka, K., Meunier, M., & Pique, A. (2010). Laser Precision Microfabrication. (K. Sugioka, M. Meunier, & A. Piqué, Eds.) (Vol. 135). Berlin, Heidelberg: Springer Berlin Heidelberg. https://doi.org/10.1007/978-3-642-10523-4
van Broekhuizen, P. (2012). Nano Matters - Building Blocks for a Precautionary Approach. University of Amsterdam, Amsterdam. Retrieved from https://dare.uva.nl/search?identifier=84997b8a-0640-409e-9017-c716ad8e1995
Viana, M., Fonseca, A. S., Querol, X., López-Lilao, A., Carpio, P., Salmatonidis, A., & Monfort, E. (2017). Workplace exposure and release of ultrafine particles during atmospheric plasma spraying in the ceramic industry. Science of the Total Environment, 599–600, 2065–2073. https://doi.org/10.1016/j.scitotenv.2017.05.132
Viitanen, A. K., Uuksulainen, S., Koivisto, A. J., Hämeri, K., & Kauppinen, T. (2017). Workplace measurements of ultrafine particles-A literature review. Annals of Work Exposures and Health, 61(7), 749–758. https://doi.org/10.1093/annweh/wxx049
Voliotis, A., Bezantakos, S., Giamarelou, M., Valenti, M., Kumar, P., & Biskos, G. (2014). Nanoparticle emissions from traditional pottery manufacturing. Environ. Sci.: Processes Impacts, 16(6), 1489–1494. https://doi.org/10.1039/C3EM00709J
Weichenthal, S. (2012). Selected physiological effects of ultrafine particles in acute cardiovascular morbidity. Environmental Research, 115, 26–36. https://doi.org/10.1016/j.envres.2012.03.001
Zhang, R.-Q., Lifshitz, Y., & Lee, S.-T. (2003). Oxide-Assisted Growth of Semiconducting Nanowires. Advanced Materials, 15(78), 635–640. https://doi.org/10.1002/adma.200301641
Zhigilei, L. V., Lin, Z., & Ivanov, D. S. (2009). Atomistic modeling of short pulse laser ablation of metals:
Chapter 4. Results
67
Connections between melting, spallation, and phase explosion. Journal of Physical Chemistry C, 113(27), 11892–11906. https://doi.org/10.1021/jp902294m

Chapter 4. Results
68
Supplementary material
Nanoparticle formation and emission during laser ablation of ceramic tiles
Apostolos Salmatonidis, Mar Viana, Noemí Pérez, Andrés Alastuey, Germán F. de la Fuente, Luis Alberto
Angurel, Vicenta Sanfélix, Eliseo Monfort
Table S1. Chemical characterisation of the tiles under study.
UBW UAW UPG Glaze*
Component Content
(wt%) Component
Content
(wt%) Component
Content
(wt%) Component
Content
(wt%)
SiO2 70.2 Al2O3 97.3 SiO2 70.6 SiO2 55.7
Al2O3 19.8 SiO2 1.3 Al2O3 18.9 ZnO 12.0
Na2O 5.8 MgO 0.5 Fe2O3 1.0 CaO 10.2
K2O 1.29 Na2O 0.2 Na2O 3.7 ZrO2 7.0
CaO 0.71 CaO 0.04 K2O 1.9 Al2O3 4.3
TiO2 0.62 Fe2O3 0.03 CaO 0.6 K2O 3.9
Fe2O3 0.51 K2O 0.03 MgO 0.2 B2O3 3.6
MgO 0.35 BaO 0.03 TiO2 0.9 MgO 2.5
P2O5 0.13 TiO2 0.01 MnO 0.01 HfO2 0.14
BaO 0.03 MnO 0.01 P2O5 0.3 Na2O 0.10
ZrO2 0.03 P2O5 0.01 Cr2O3 0.3 Fe2O3 0.05
SrO 0.02 ZrO2 1.0 TiO2 0.05
MnO 0.01 PbO 0.03
P2O5 0.03
BaO 0.01
Li2O <0.01
SrO <0.01
*The chemical composition refers only to the glaze, and not the body of the GER tile, since that was the part
processed by the laser

Chapter 4. Results
69
Figure S1. X-ray powder diffraction pattern of UAW α-Alumina tiles, (a) pure α-Alumina and (b) the tile with
dominant phase of α-Alumina and a minor phase (trace) of spinel MgAlO
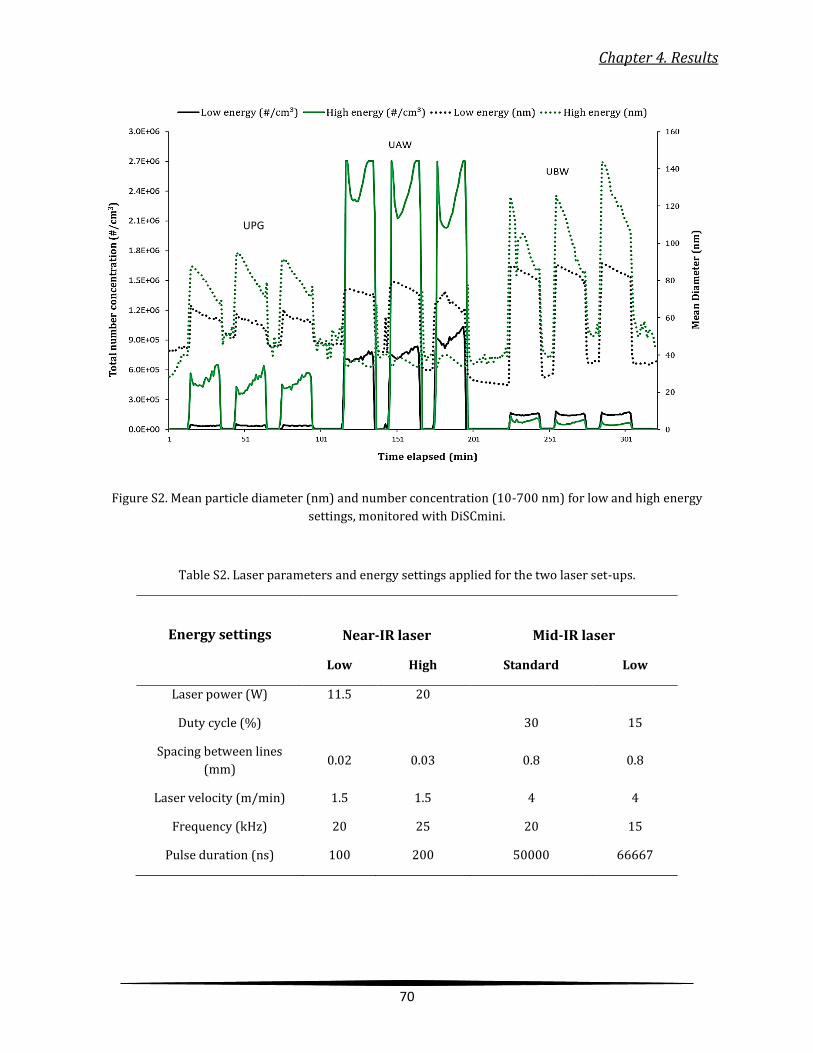
Chapter 4. Results
70
Figure S2. Mean particle diameter (nm) and number concentration (10-700 nm) for low and high energy
settings, monitored with DiSCmini.
Table S2. Laser parameters and energy settings applied for the two laser set-ups.
Energy settings
Near-IR laser Mid-IR laser
Low High Standard Low
Laser power (W) 11.5 20
Duty cycle (%) 30 15
Spacing between lines
(mm) 0.02 0.03 0.8 0.8
Laser velocity (m/min) 1.5 1.5 4 4
Frequency (kHz) 20 25 20 15
Pulse duration (ns) 100 200 50000 66667
a
UPG
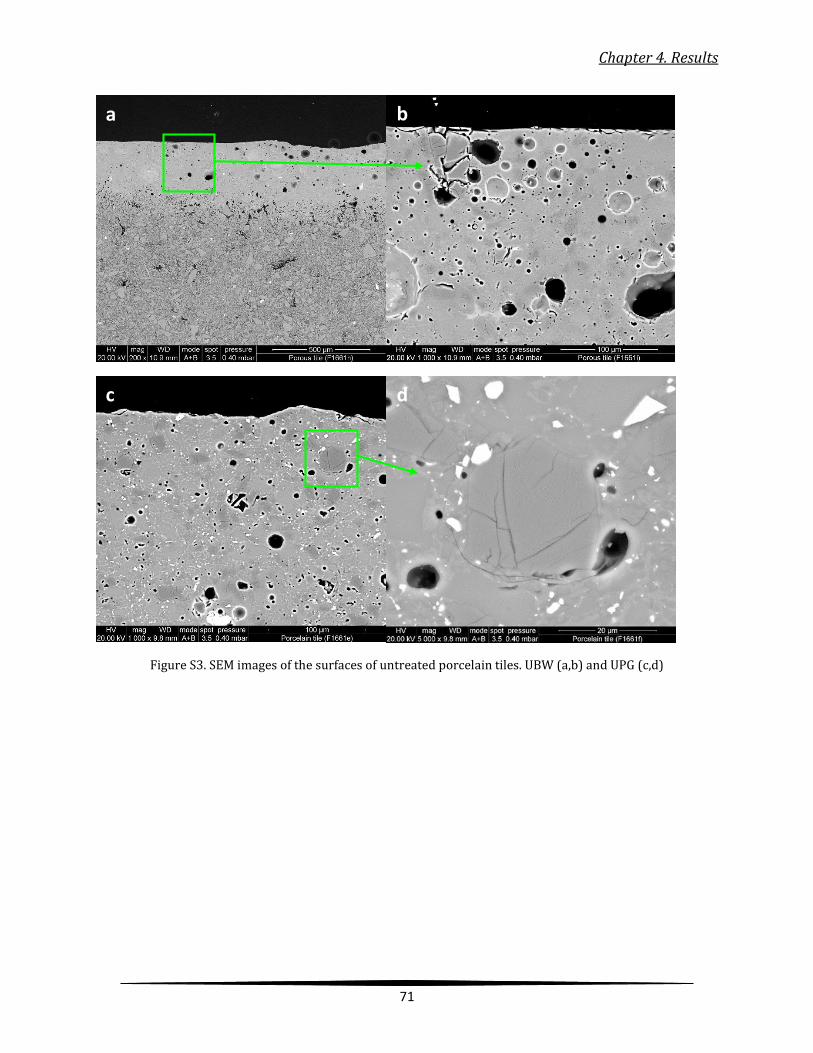
Chapter 4. Results
71
Figure S3. SEM images of the surfaces of untreated porcelain tiles. UBW (a,b) and UPG (c,d)
c
b
d
a

Chapter 4. Results
72
Figure S4. Mean particle diameter (nm) and total particle number concentration (10-700 nm) for the different
tiles and energy settings during ablation with the mid-IR laser.
Figure S5. TEM image and EDX spectra of NPs emitted during GER ablation with the mid-IR laser.
UPG
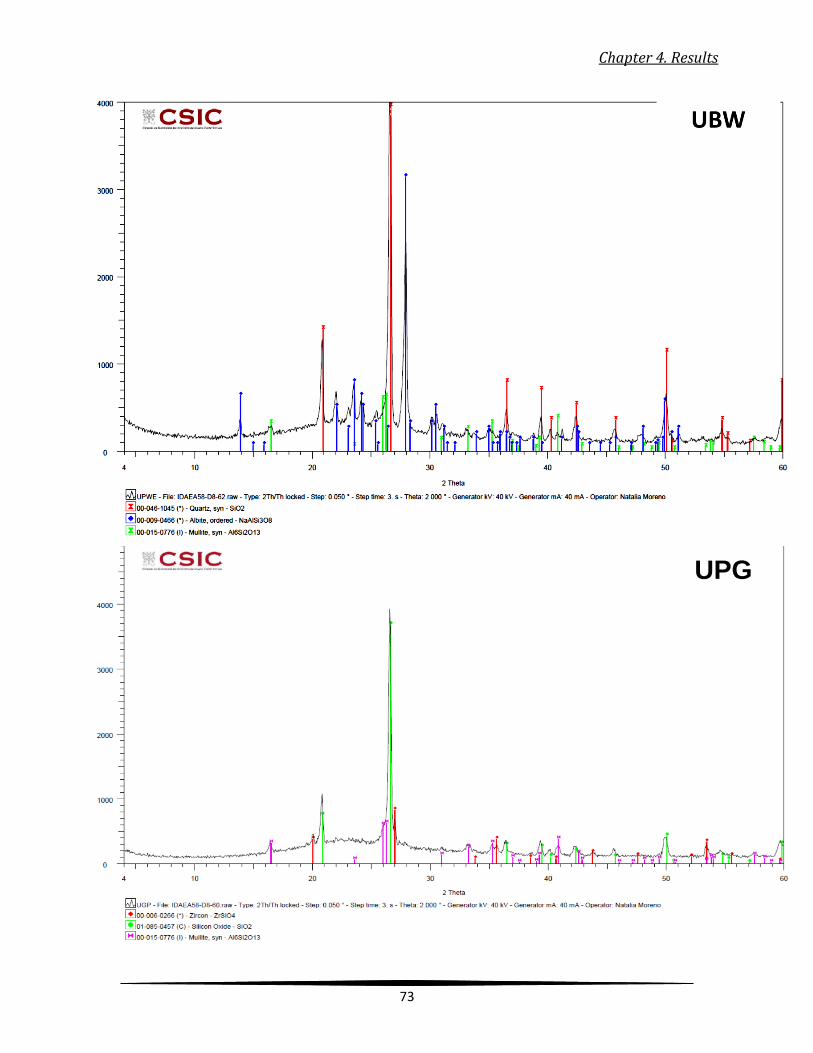
Chapter 4. Results
73
UPG
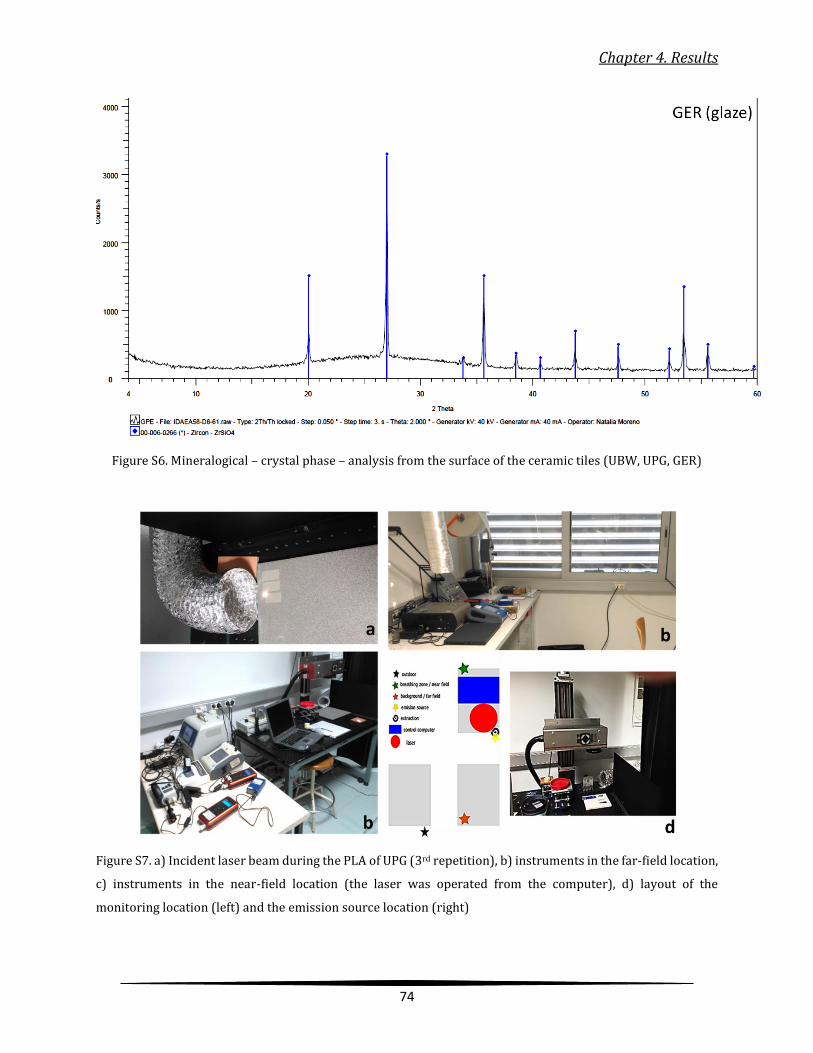
Chapter 4. Results
74
Figure S6. Mineralogical – crystal phase – analysis from the surface of the ceramic tiles (UBW, UPG, GER)
Figure S7. a) Incident laser beam during the PLA of UPG (3rd repetition), b) instruments in the far-field location,
c) instruments in the near-field location (the laser was operated from the computer), d) layout of the
monitoring location (left) and the emission source location (right)
Chapter 4. Results
75
4.2. Scientific publication 2
Workplace exposure to nanoparticles during thermal spraying of
ceramic coatings
Salmatonidis A.1,2, Ribalta C.1,2, Sanfélix V.3, Bezantakos S.5, Biskos G.6, Vulpoi A.4, Simion S.4,
Monfort E.3, Viana M.1
1Institute of Environmental Assessment and Water Research (IDAEA-CSIC),08034 Barcelona, Spain
2 University of Barcelona, Faculty of Chemistry, Department of Chemical Engineering and Analytical
Chemistry, 08028, Barcelona, Spain.
3Institute of Ceramic Technology (ITC), Universitat Jaume I, 12006 Castellón, Spain
4Institute of Interdisciplinary Research in Bio-Nano-Sciences (ICI-BNS), Babeș-Bolyai University,
400000 Cluj-Napoca, Romania
5Université du Littoral Côte d'Opale, 59140 Dunkerque, France
6Energy Environment and Water Research Centre, The Cyprus Institute, 2121 Nicosia, Cyprus
Published in: Annals of Work Exposures and Health, 2019, Volume 63, No. 1, Pages 91–106
DOI: 10.1093/annweh/wxy094
The following is a pre-print version, which was produced by the author, of an article published in
Annals of Work Exposures and Health (Oxford University Press on behalf of the British
Occupational Hygiene Society): Submitted on 5 June 2018; revised on 1 October 2018; accepted on
24 October 2018. Available online at:
https://doi.org/10.1093/annweh/wxy094
Chapter 4. Results
76
Workplace exposure to nanoparticles during thermal spraying of
ceramic coatings Salmatonidis A.1,2*, Ribalta C.1,2, Sanfélix V.3, Bezantakos S.5, Biskos G.6, Vulpoi A.4, Simion S.4,
Monfort E.3, Viana M.1
1Institute of Environmental Assessment and Water Research (IDAEA-CSIC),08034 Barcelona, Spain
2University of Barcelona, Faculty of Chemistry, 08028 Barcelona, Spain
3Institute of Ceramic Technology (ITC), Universitat Jaume I, 12006 Castellón, Spain
4Institute of Interdisciplinary Research in Bio-Nano-Sciences (ICI-BNS), Babeș-Bolyai University, 400000 Cluj-
Napoca, Romania
5Université du Littoral Côte d'Opale, 59140 Dunkerque, France
6Energy Environment and Water Research Centre, The Cyprus Institute, 2121 Nicosia, Cyprus
*Author to whom correspondence should be addressed. e-mail: [email protected]
Abstract
Thermal spraying is widely used for industrial-scale application of ceramic coatings onto metallic
surfaces. The particular process has implications for occupational health, as the high energy process
generates high emissions of metal-bearing nanoparticles. Emissions and their impact on exposure
were characterised during thermal spraying in a work environment, by monitoring size-resolved
number and mass concentrations, lung-deposited surface area, particle morphology and chemical
composition. Along with exposure quantification, the modal analysis of the emissions assisted in
distinguishing particles from different sources, while an inhalation model provided evidence
regarding the potential deposition of particulate matter on human respiratory system. High particle
number (>106/cm3; 30-40 nm) and mass (60-600 µgPM1/m3) concentrations were recorded inside
the spraying booths, which impacted exposure in the worker area (104-105/cm3, 40-65 nm; 44-87
µgPM1/m3). Irregularly-shaped, metal-containing particles (Ni, Cr, W) were sampled from the worker
area, as single particles and aggregates (5-200 nm). Energy dispersive X-ray analysis confirmed the
presence of particles originated from the coating material, establishing a direct link between the
spraying activity and exposure. In particle number count, 90% of the particles were between 26-90
nm. Inhaled dose rates, calculated from the exposure levels, resulted in particle number rates (��)
between 353×106-1024×106/min, with 70% of deposition occurring in the alveolar region. The
effectiveness of personal protective equipment (FPP3 masks) was tested under real working
conditions. The proper sealing of the spraying booths was identified as a key element for exposure
reduction. This study provides high time-resolved aerosol data which may be valuable for validating
indoor aerosol models applied to risk assessment.
Keywords: nanoparticles; exposure assessment; inhalation exposure; inhalation model;
occupational health; modal analysis; process-generated nanoparticles
Chapter 4. Results
77
Introduction
In numerous industrial sectors such as petroleum (Moskowitz 1993), naval (Baiamonte et al 2015),
automobile (Gérard 2006), or aeronautical and space (Pawlowski 2008a, Strangman 1985), metal
structures and mechanical parts are exposed to highly corrosive environments, and subject to
mechanical and chemical abrasion. In these cases, protective ceramic coatings are widely used to
prevent corrosion and wear, as well as to restore damaged surfaces (Lima and Marple 2006, Tan et
al 1999, Toma et al 2010). Such coatings are frequently applied using thermal spraying techniques,
where the feedstock (the coating material) is projected at high temperature and velocity onto the
surface to be protected or repaired. Different types of spraying torches (electric arc, plasma, flame)
define the types of thermal spraying techniques (Pawlowski 2008b).
This industrial process has been reported to generate high concentrations of nanoparticles (NP, with
diameters < 100 nm) at pilot-plant scale (Viana et al 2017), which may result in occupational hazards
(Hériaud-Kraemer et al 2003). Previous studies of thermal spraying emissions using offline
measurements focused on the chemical characterisation of particles collected on filters (Huang et al
2016, Petsas et al 2007), showing also that these sources are associated with high particle mass
concentrations. Furthermore, high NP number concentrations (> 109/cm3) were monitored directly
from electric arc guns (Bémer et al 2010). At pilot-plant scale, Viana et al. (2017) showed that NP
released during atmospheric plasma spraying may impact worker exposure significantly. Despite the
widespread industrial application of thermal spraying, emissions generated under real-world
operating conditions are not well studied. Similarly to thermal spraying, the emissions of NP from
other industrial processes and their impact on worker exposure is a growing topic of research (Ding
et al 2017, Fonseca et al 2015, 2016, 2018, Fujitani et al 2008, Koivisto et al 2018, Koponen et al 2015,
Kuhlbusch et al 2004, Losert et al 2014, Salmatonidis et al 2018, Viitanen et al 2017), and requires
further investigations due to the large variety of processes and exposure scenarios. Awareness for
nanomaterial release was raised (Maynard et al 2006, Poland et al 2008, Seaton et al 2010) since the
use of manufactured nanomaterials (MNMs) in workplaces started. However, NP emissions can arise
from multiple processes that neither produce nor use nanomaterials, which are referred as Process
Generated Nanoparticles (PGNP) (Van Broekhuizen, et al 2012).
Pope et al (1995) associated air pollution with adverse health effects based on epidemiological
evidence. Further epidemiological and toxicological studies showed that PM2.5 (particles with
diameter ≤2.5 µm) is a health hazardous pollutant (Gakidou et al 2017, Landrigan et al 2017, C Pope
et al 2002, C. Pope and Dockery 2006, WHO 2017). More specifically, aerosol particles <100 nm
(ultrafine) are linked to adverse health effects mainly due to exposure through inhalation (Araujo et
al 2008, Hoek et al 2010, Ibald-Mulli et al 2002, Knibbs et al 2011, Landrigan et al 2017, Oberdörster
2001). In indoor air and more specifically in industrial settings, PGNPs pose an occupational risk,
since they are unintentionally generated and released to the worker area, and they are potential
health hazards (Koivisto et al., 2014). Health risks need to be dealt with by means of both
technological and non-technological mitigation strategies (Ganser and Hewett 2017, Hallé et al 2015,
Hewett and Ganser 2017, Shaffer and Rengasamy 2009).
The aim of this work was to assess NP emissions during thermal spraying of ceramic coatings onto
metallic surfaces and their impact on inhalation exposure, under actual operating conditions in a

Chapter 4. Results
78
real-world industrial setting. A near field (NF) / far field (FF) approach as used by Koivisto et
al.(2015), among others, was applied. Workplace exposure monitoring strategies applied followed
good practice as described by Asbach et al. (2015) and Brouwer et al. (2014), which were the base
for internationally-recognised standard procedures (OECD.82, 2017). Modal analysis based on time-
resolved particle number concentrations was used to quantitatively understand the size distribution
and modal dependence of the aerosols generated during thermal spraying (Hussein et al 2005).
Finally, a case study testing the effectiveness of mitigation strategies is presented.
Figure 1. (a): Schematic representation of the thermal spraying section of the investigated facility (Extraction*: data not available). (b): instrument deployment in the near field location. (c): booth
#3, showing the thermal spraying robot and the operator processing one of the work-pieces.
Chapter 4. Results
79
Methods and Materials
Work environment
Monitoring of thermal spraying was carried out at an industrial-scale precision engineering
workshop (T.M. Comas) located in the vicinity of Barcelona, Spain. Measurements were carried out
over a 5-day period in April 2017, and did not interfere with the usual operating conditions in the
plant. The thermal spraying facilities are schematically depicted in Figure 1 (top). Three thermal
spraying booths were located in an area of approximately 240 m2 (14 m wide and 17 m in length),
including also a storage and a central corridor. In all cases the operators of the thermal spraying
equipment worked inside and outside the booths during spraying, and each booth had doors which
were not always closed. Two small-scale sand blasting boxes for polishing the final pieces were
located next to the spraying booths, but they were not operated simultaneously to the activities
reported in this work. A general ventilation system operated constantly in the central area, with three
extractors having a flow of 11800 m3/h each (data provided by the company, not measured directly
in this work). Additionally, in each of the plasma booths individual localised extraction systems were
available (Figure 1a, Table 1). Information regarding the individual extraction air flowrates was only
available for booth #3 (6500 m3/h). The operational characteristics of each of the spraying activities
and booths are summarised in Table 1. Because the duration of the individual spraying activities
varied according to the parts to be coated, mean values of spraying duration and repetitions were
different for each booth (Table 1).
Thermal spraying techniques and feedstock
Two different types of thermal spraying techniques were assessed:
- Atmospheric Plasma Spraying (APS), characterised by high temperatures (5000-20000 ºC)
and projection velocities of 200-500 m/s. This technique was applied in plasma booth #1
(Figure 1). APS is generally used to project oxides and metals, which in this case of our
measurements were a TiO2-Al2O3 blend and a Cr-Ni blend (2 different feedstock materials
that were applied separately).
- High Velocity Oxy-Fuel coating spraying (HVOF), characterised by high velocities (425-1500
m/s) and lower temperatures (2900 ºC). This type of spraying was applied in booths #2 and
#3 (Figure 1b, bottom). Due to the lower temperatures compared to APS, HVOF is frequently
used to project carbides and metals. During our measurements a WC-Co-Cr-Ni blend
feedstock was used in booth #2, and a WC-CrC-Ni blend in booth #3.
Additional information about the feedstock powders is provided in Table S1 (Supplementary Data).

Chapter 4. Results
80
Table 1. Operational characteristics of each of the spraying booths and locations in the thermal spraying
facility.
Characteristics Booth #1 Booth #2 Booth #3 Central area
Thermal spraying technique APS HVOF HVOF None
Spraying duration 20-30 minutes 5-10 minutes 5-10 minutes None
Nr. repetitions/half-day 3 2 7-9 None
Type of parts coated Large, single part Large, single part Small, several
parts None
Door Mostly closed Open Open/closed None
Volume (ca.,m3) 84 114 68 465
Local exhaust/ventilation flow N.A. N.A. 6500 m3/h 3×11800 m3/h
Personal protective equipment
Respirators Pressurised
respirator hood, FPP3 mask
FPP3 mask FPP3 mask None
Cloths Protective jacket None Protective jacket None
Gloves High temperature
gloves None
High temperature gloves
None
N.A.: not available. APS: Atmospheric Plasma Spraying. HVOF: High Velocity Oxy-Fuel coating spraying.
Particle monitoring and sampling
Particle number concentration (N), size-segregated mass concentrations (PMx), size distribution,
mean diameter (Dp) and lung-deposited surface area (LDSA) were monitored at near field (NF) and
far field (FF) locations. The NF location was inside each of the spraying booths, while the FF was next
to the storage area in the case of booth #3 and in the middle of the central area in the case of booths
#2 and #3 (Figure 1a). The monitoring instruments in the FF and their inlets were located between
0.7 and 1.5 m above ground and were not placed directly inside the breathing zone (Ojima, 2012).
The resulting measurements were considered representative of worker exposure, by assuming that
the concentrations in the NF and FF were well-mixed. The online particle monitors deployed were:
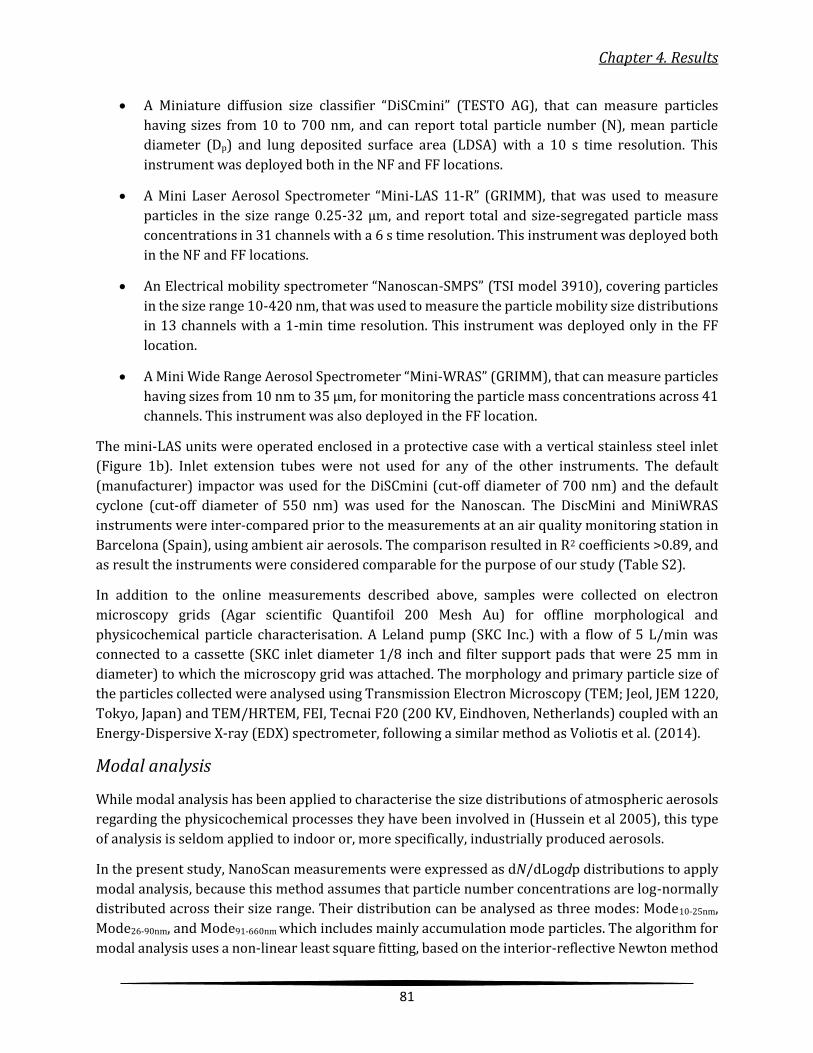
Chapter 4. Results
81
A Miniature diffusion size classifier “DiSCmini” (TESTO AG), that can measure particles
having sizes from 10 to 700 nm, and can report total particle number (N), mean particle
diameter (Dp) and lung deposited surface area (LDSA) with a 10 s time resolution. This
instrument was deployed both in the NF and FF locations.
A Mini Laser Aerosol Spectrometer “Mini-LAS 11-R” (GRIMM), that was used to measure
particles in the size range 0.25-32 µm, and report total and size-segregated particle mass
concentrations in 31 channels with a 6 s time resolution. This instrument was deployed both
in the NF and FF locations.
An Electrical mobility spectrometer “Nanoscan-SMPS” (TSI model 3910), covering particles
in the size range 10-420 nm, that was used to measure the particle mobility size distributions
in 13 channels with a 1-min time resolution. This instrument was deployed only in the FF
location.
A Mini Wide Range Aerosol Spectrometer “Mini-WRAS” (GRIMM), that can measure particles
having sizes from 10 nm to 35 µm, for monitoring the particle mass concentrations across 41
channels. This instrument was also deployed in the FF location.
The mini-LAS units were operated enclosed in a protective case with a vertical stainless steel inlet
(Figure 1b). Inlet extension tubes were not used for any of the other instruments. The default
(manufacturer) impactor was used for the DiSCmini (cut-off diameter of 700 nm) and the default
cyclone (cut-off diameter of 550 nm) was used for the Nanoscan. The DiscMini and MiniWRAS
instruments were inter-compared prior to the measurements at an air quality monitoring station in
Barcelona (Spain), using ambient air aerosols. The comparison resulted in R2 coefficients >0.89, and
as result the instruments were considered comparable for the purpose of our study (Table S2).
In addition to the online measurements described above, samples were collected on electron
microscopy grids (Agar scientific Quantifoil 200 Mesh Au) for offline morphological and
physicochemical particle characterisation. A Leland pump (SKC Inc.) with a flow of 5 L/min was
connected to a cassette (SKC inlet diameter 1/8 inch and filter support pads that were 25 mm in
diameter) to which the microscopy grid was attached. The morphology and primary particle size of
the particles collected were analysed using Transmission Electron Microscopy (TEM; Jeol, JEM 1220,
Tokyo, Japan) and TEM/HRTEM, FEI, Tecnai F20 (200 KV, Eindhoven, Netherlands) coupled with an
Energy-Dispersive X-ray (EDX) spectrometer, following a similar method as Voliotis et al. (2014).
Modal analysis
While modal analysis has been applied to characterise the size distributions of atmospheric aerosols
regarding the physicochemical processes they have been involved in (Hussein et al 2005), this type
of analysis is seldom applied to indoor or, more specifically, industrially produced aerosols.
In the present study, NanoScan measurements were expressed as dN/dLogdp distributions to apply
modal analysis, because this method assumes that particle number concentrations are log-normally
distributed across their size range. Their distribution can be analysed as three modes: Mode10-25nm,
Mode26-90nm, and Mode91-660nm which includes mainly accumulation mode particles. The algorithm for
modal analysis uses a non-linear least square fitting, based on the interior-reflective Newton method
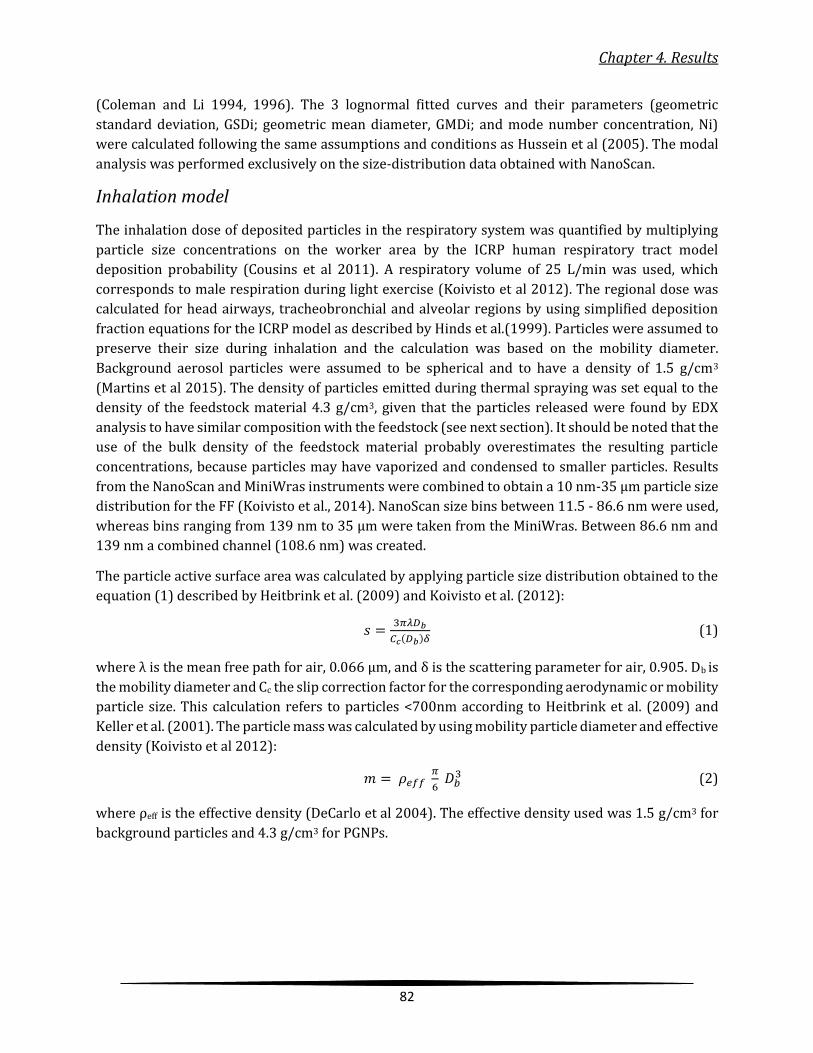
Chapter 4. Results
82
(Coleman and Li 1994, 1996). The 3 lognormal fitted curves and their parameters (geometric
standard deviation, GSDi; geometric mean diameter, GMDi; and mode number concentration, Ni)
were calculated following the same assumptions and conditions as Hussein et al (2005). The modal
analysis was performed exclusively on the size-distribution data obtained with NanoScan.
Inhalation model
The inhalation dose of deposited particles in the respiratory system was quantified by multiplying
particle size concentrations on the worker area by the ICRP human respiratory tract model
deposition probability (Cousins et al 2011). A respiratory volume of 25 L/min was used, which
corresponds to male respiration during light exercise (Koivisto et al 2012). The regional dose was
calculated for head airways, tracheobronchial and alveolar regions by using simplified deposition
fraction equations for the ICRP model as described by Hinds et al.(1999). Particles were assumed to
preserve their size during inhalation and the calculation was based on the mobility diameter.
Background aerosol particles were assumed to be spherical and to have a density of 1.5 g/cm3
(Martins et al 2015). The density of particles emitted during thermal spraying was set equal to the
density of the feedstock material 4.3 g/cm3, given that the particles released were found by EDX
analysis to have similar composition with the feedstock (see next section). It should be noted that the
use of the bulk density of the feedstock material probably overestimates the resulting particle
concentrations, because particles may have vaporized and condensed to smaller particles. Results
from the NanoScan and MiniWras instruments were combined to obtain a 10 nm-35 µm particle size
distribution for the FF (Koivisto et al., 2014). NanoScan size bins between 11.5 - 86.6 nm were used,
whereas bins ranging from 139 nm to 35 µm were taken from the MiniWras. Between 86.6 nm and
139 nm a combined channel (108.6 nm) was created.
The particle active surface area was calculated by applying particle size distribution obtained to the
equation (1) described by Heitbrink et al. (2009) and Koivisto et al. (2012):
𝑠 =3𝜋𝜆𝐷𝑏
𝐶𝑐(𝐷𝑏)𝛿 (1)
where λ is the mean free path for air, 0.066 μm, and δ is the scattering parameter for air, 0.905. Db is
the mobility diameter and Cc the slip correction factor for the corresponding aerodynamic or mobility
particle size. This calculation refers to particles <700nm according to Heitbrink et al. (2009) and
Keller et al. (2001). The particle mass was calculated by using mobility particle diameter and effective
density (Koivisto et al 2012):
𝑚 = 𝜌𝑒𝑓𝑓 𝜋
6 𝐷𝑏
3 (2)
where ρeff is the effective density (DeCarlo et al 2004). The effective density used was 1.5 g/cm3 for
background particles and 4.3 g/cm3 for PGNPs.
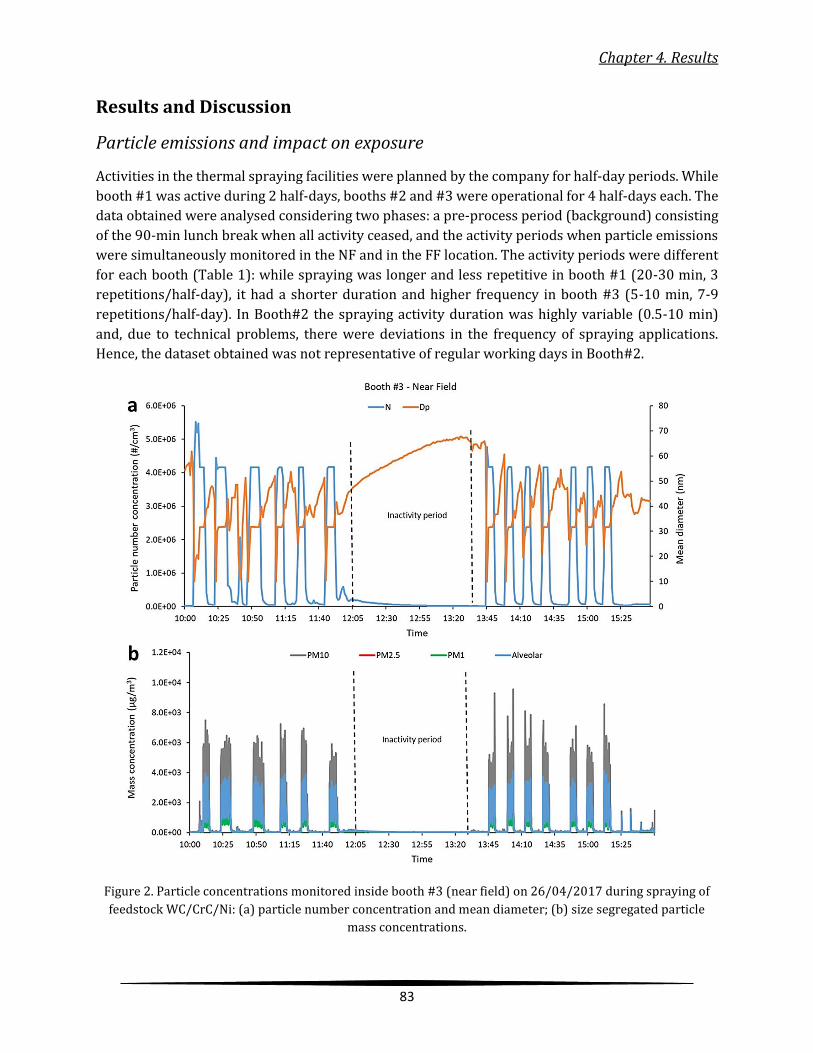
Chapter 4. Results
83
Results and Discussion
Particle emissions and impact on exposure
Activities in the thermal spraying facilities were planned by the company for half-day periods. While
booth #1 was active during 2 half-days, booths #2 and #3 were operational for 4 half-days each. The
data obtained were analysed considering two phases: a pre-process period (background) consisting
of the 90-min lunch break when all activity ceased, and the activity periods when particle emissions
were simultaneously monitored in the NF and in the FF location. The activity periods were different
for each booth (Table 1): while spraying was longer and less repetitive in booth #1 (20-30 min, 3
repetitions/half-day), it had a shorter duration and higher frequency in booth #3 (5-10 min, 7-9
repetitions/half-day). In Booth#2 the spraying activity duration was highly variable (0.5-10 min)
and, due to technical problems, there were deviations in the frequency of spraying applications.
Hence, the dataset obtained was not representative of regular working days in Booth#2.
Figure 2. Particle concentrations monitored inside booth #3 (near field) on 26/04/2017 during spraying of
feedstock WC/CrC/Ni: (a) particle number concentration and mean diameter; (b) size segregated particle
mass concentrations.
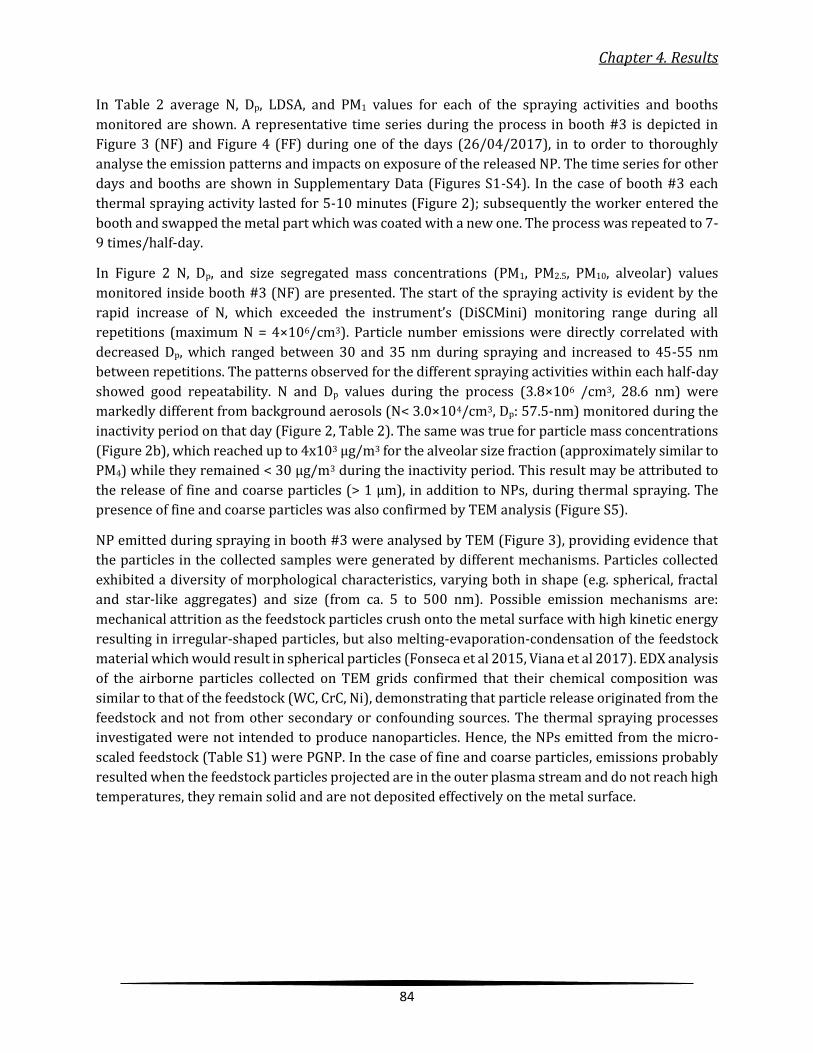
Chapter 4. Results
84
In Table 2 average N, Dp, LDSA, and PM1 values for each of the spraying activities and booths
monitored are shown. A representative time series during the process in booth #3 is depicted in
Figure 3 (NF) and Figure 4 (FF) during one of the days (26/04/2017), in to order to thoroughly
analyse the emission patterns and impacts on exposure of the released NP. The time series for other
days and booths are shown in Supplementary Data (Figures S1-S4). In the case of booth #3 each
thermal spraying activity lasted for 5-10 minutes (Figure 2); subsequently the worker entered the
booth and swapped the metal part which was coated with a new one. The process was repeated to 7-
9 times/half-day.
In Figure 2 N, Dp, and size segregated mass concentrations (PM1, PM2.5, PM10, alveolar) values
monitored inside booth #3 (NF) are presented. The start of the spraying activity is evident by the
rapid increase of N, which exceeded the instrument’s (DiSCMini) monitoring range during all
repetitions (maximum N = 4×10⁶/cm3). Particle number emissions were directly correlated with
decreased Dp, which ranged between 30 and 35 nm during spraying and increased to 45-55 nm
between repetitions. The patterns observed for the different spraying activities within each half-day
showed good repeatability. N and Dp values during the process (3.8×10⁶ /cm3, 28.6 nm) were
markedly different from background aerosols (N< 3.0×10⁴/cm3, Dp: 57.5-nm) monitored during the
inactivity period on that day (Figure 2, Table 2). The same was true for particle mass concentrations
(Figure 2b), which reached up to 4x10³ µg/m3 for the alveolar size fraction (approximately similar to
PM4) while they remained < 30 µg/m3 during the inactivity period. This result may be attributed to
the release of fine and coarse particles (> 1 µm), in addition to NPs, during thermal spraying. The
presence of fine and coarse particles was also confirmed by TEM analysis (Figure S5).
NP emitted during spraying in booth #3 were analysed by TEM (Figure 3), providing evidence that
the particles in the collected samples were generated by different mechanisms. Particles collected
exhibited a diversity of morphological characteristics, varying both in shape (e.g. spherical, fractal
and star-like aggregates) and size (from ca. 5 to 500 nm). Possible emission mechanisms are:
mechanical attrition as the feedstock particles crush onto the metal surface with high kinetic energy
resulting in irregular-shaped particles, but also melting-evaporation-condensation of the feedstock
material which would result in spherical particles (Fonseca et al 2015, Viana et al 2017). EDX analysis
of the airborne particles collected on TEM grids confirmed that their chemical composition was
similar to that of the feedstock (WC, CrC, Ni), demonstrating that particle release originated from the
feedstock and not from other secondary or confounding sources. The thermal spraying processes
investigated were not intended to produce nanoparticles. Hence, the NPs emitted from the micro-
scaled feedstock (Table S1) were PGNP. In the case of fine and coarse particles, emissions probably
resulted when the feedstock particles projected are in the outer plasma stream and do not reach high
temperatures, they remain solid and are not deposited effectively on the metal surface.
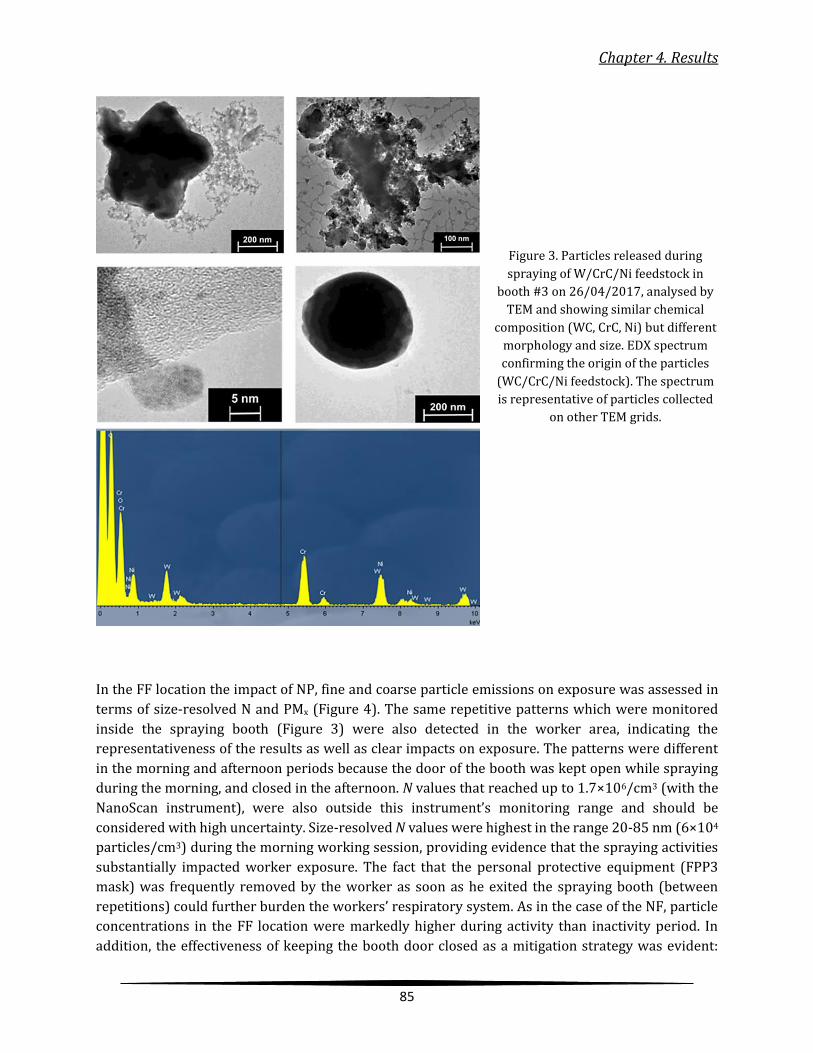
Chapter 4. Results
85
Figure 3. Particles released during
spraying of W/CrC/Ni feedstock in
booth #3 on 26/04/2017, analysed by
TEM and showing similar chemical
composition (WC, CrC, Ni) but different
morphology and size. EDX spectrum
confirming the origin of the particles
(WC/CrC/Ni feedstock). The spectrum
is representative of particles collected
on other TEM grids.
In the FF location the impact of NP, fine and coarse particle emissions on exposure was assessed in
terms of size-resolved N and PMx (Figure 4). The same repetitive patterns which were monitored
inside the spraying booth (Figure 3) were also detected in the worker area, indicating the
representativeness of the results as well as clear impacts on exposure. The patterns were different
in the morning and afternoon periods because the door of the booth was kept open while spraying
during the morning, and closed in the afternoon. N values that reached up to 1.7×10⁶/cm3 (with the
NanoScan instrument), were also outside this instrument’s monitoring range and should be
considered with high uncertainty. Size-resolved N values were highest in the range 20-85 nm (6×10⁴
particles/cm3) during the morning working session, providing evidence that the spraying activities
substantially impacted worker exposure. The fact that the personal protective equipment (FPP3
mask) was frequently removed by the worker as soon as he exited the spraying booth (between
repetitions) could further burden the workers’ respiratory system. As in the case of the NF, particle
concentrations in the FF location were markedly higher during activity than inactivity period. In
addition, the effectiveness of keeping the booth door closed as a mitigation strategy was evident:
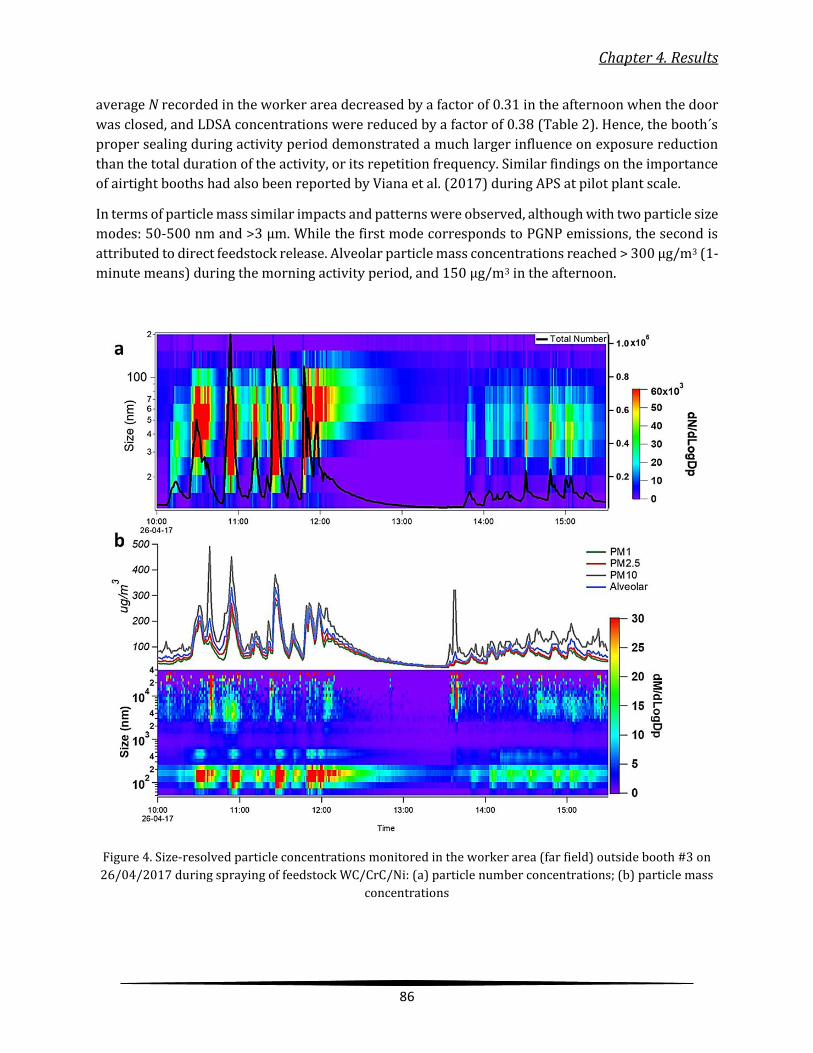
Chapter 4. Results
86
average N recorded in the worker area decreased by a factor of 0.31 in the afternoon when the door
was closed, and LDSA concentrations were reduced by a factor of 0.38 (Table 2). Hence, the booth´s
proper sealing during activity period demonstrated a much larger influence on exposure reduction
than the total duration of the activity, or its repetition frequency. Similar findings on the importance
of airtight booths had also been reported by Viana et al. (2017) during APS at pilot plant scale.
In terms of particle mass similar impacts and patterns were observed, although with two particle size
modes: 50-500 nm and >3 µm. While the first mode corresponds to PGNP emissions, the second is
attributed to direct feedstock release. Alveolar particle mass concentrations reached > 300 µg/m3 (1-
minute means) during the morning activity period, and 150 µg/m3 in the afternoon.
Figure 4. Size-resolved particle concentrations monitored in the worker area (far field) outside booth #3 on
26/04/2017 during spraying of feedstock WC/CrC/Ni: (a) particle number concentrations; (b) particle mass
concentrations
Chapter 4. Results
87
As shown in Table 2, inside the NF concentrations ranged 1.8-3.4×10⁶/cm3 and had a clear impact on
exposure at the FF location, where concentrations in the range of 5.8×10⁴-2.0x10⁵/cm3 were
monitored, and were significantly higher than the background concentrations (average 3.0×10⁴).
Concentrations in the FF were above the nano-reference values (NRV, non-regulatory reference
values for nanomaterials, based on the precautionary approach) 4×10⁴/cm3 (Van Broekhuizen, et al
2012), and orders of magnitude higher inside the spraying booths (NF). This impact was considered
statistically significant following the tiered approach established by Asbach et al. (2012), meaning
that exposure concentrations were higher than the background plus 3 times the standard deviation
of the background concentrations. The N, LDSA and PM values measured were comparable across
the different booths, indicating that NP release is activity-dependent and not related to the specific
feedstock powders applied. Although different spraying temperatures and velocities were applied in
the different booths NP release was evident in all cases. This would indicate that NP emissions are
independent of these parameters or that both of the thermal spraying techniques provide the
necessary conditions for PGNP emissions.
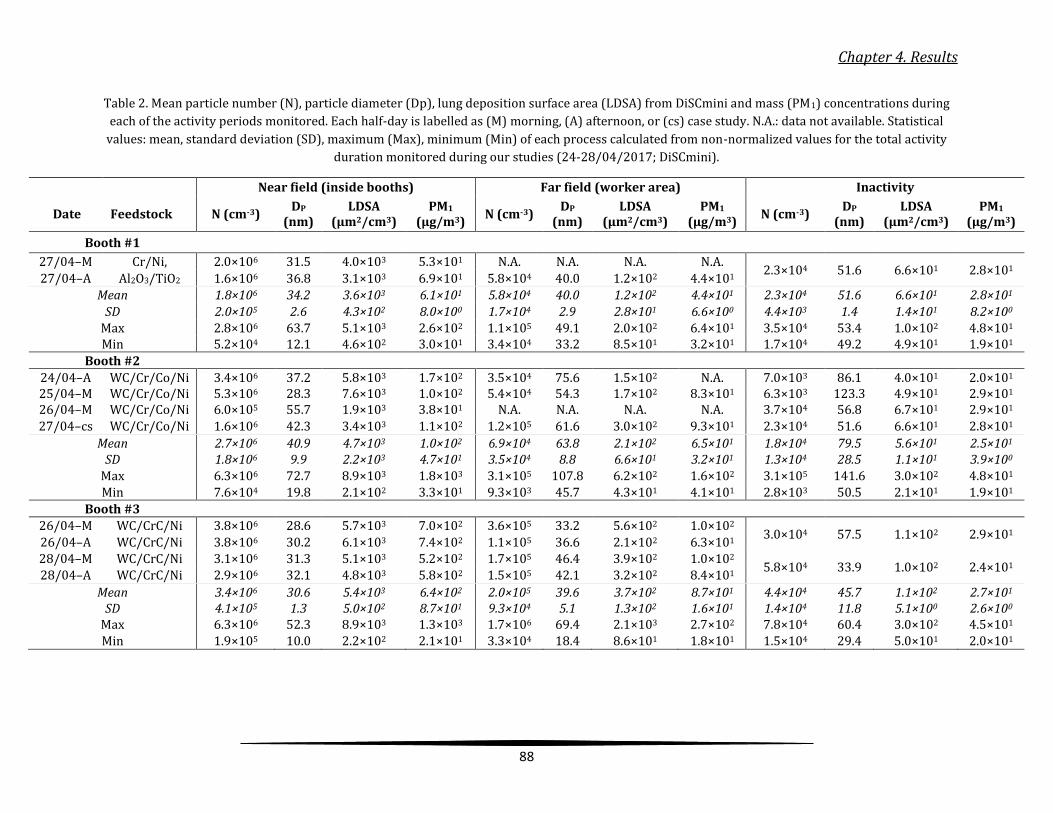
Chapter 4. Results
88
Table 2. Mean particle number (N), particle diameter (Dp), lung deposition surface area (LDSA) from DiSCmini and mass (PM1) concentrations during
each of the activity periods monitored. Each half-day is labelled as (M) morning, (A) afternoon, or (cs) case study. N.A.: data not available. Statistical
values: mean, standard deviation (SD), maximum (Max), minimum (Min) of each process calculated from non-normalized values for the total activity
duration monitored during our studies (24-28/04/2017; DiSCmini).
Near field (inside booths) Far field (worker area) Inactivity
Date Feedstock N (cm-3) DP
(nm) LDSA
(µm2/cm3) PM1
(µg/m3) N (cm-3)
DP
(nm) LDSA
(µm2/cm3) PM1
(µg/m3) N (cm-3)
DP
(nm) LDSA
(µm2/cm3) PM1
(µg/m3)
Booth #1
27/04–M Cr/Ni, 2.0×10⁶ 31.5 4.0×10³ 5.3×101 N.A. N.A. N.A. N.A. 2.3×10⁴ 51.6 6.6×101 2.8×101
27/04–A Al2O3/TiO2 1.6×10⁶ 36.8 3.1×10³ 6.9×101 5.8×10⁴ 40.0 1.2×10² 4.4×101
Mean 1.8×10⁶ 34.2 3.6×10³ 6.1×101 5.8×10⁴ 40.0 1.2×10² 4.4×101 2.3×10⁴ 51.6 6.6×101 2.8×101
SD 2.0×10⁵ 2.6 4.3×10² 8.0×100 1.7×10⁴ 2.9 2.8×101 6.6×100 4.4×10³ 1.4 1.4×101 8.2×100 Max 2.8×106 63.7 5.1×10³ 2.6×10² 1.1×10⁵ 49.1 2.0×10² 6.4×101 3.5×10⁴ 53.4 1.0×10² 4.8×101 Min 5.2×10⁴ 12.1 4.6×10² 3.0×101 3.4×10⁴ 33.2 8.5×101 3.2×101 1.7×10⁴ 49.2 4.9×101 1.9×101
Booth #2
24/04–A WC/Cr/Co/Ni 3.4×10⁶ 37.2 5.8×10³ 1.7×10² 3.5×10⁴ 75.6 1.5×10² N.A. 7.0×10³ 86.1 4.0×101 2.0×101 25/04–M WC/Cr/Co/Ni 5.3×10⁶ 28.3 7.6×10³ 1.0×10² 5.4×10⁴ 54.3 1.7×10² 8.3×101 6.3×10³ 123.3 4.9×101 2.9×101 26/04–M WC/Cr/Co/Ni 6.0×10⁵ 55.7 1.9×10³ 3.8×101 N.A. N.A. N.A. N.A. 3.7×10⁴ 56.8 6.7×101 2.9×101
27/04–cs WC/Cr/Co/Ni 1.6×10⁶ 42.3 3.4×10³ 1.1×10² 1.2×10⁵ 61.6 3.0×10² 9.3×101 2.3×10⁴ 51.6 6.6×101 2.8×101
Mean 2.7×10⁶ 40.9 4.7×10³ 1.0×10² 6.9×10⁴ 63.8 2.1×10² 6.5×101 1.8×10⁴ 79.5 5.6×101 2.5×101 SD 1.8×10⁶ 9.9 2.2×10³ 4.7×101 3.5×10⁴ 8.8 6.6×101 3.2×101 1.3×10⁴ 28.5 1.1×101 3.9×100
Max 6.3×106 72.7 8.9×10³ 1.8×10³ 3.1×10⁵ 107.8 6.2×10² 1.6×10² 3.1×10⁵ 141.6 3.0×10² 4.8×101 Min 7.6×10⁴ 19.8 2.1×10² 3.3×101 9.3×10³ 45.7 4.3×101 4.1×101 2.8×10³ 50.5 2.1×101 1.9×101
Booth #3
26/04–M WC/CrC/Ni 3.8×10⁶ 28.6 5.7×10³ 7.0×10² 3.6×10⁵ 33.2 5.6×10² 1.0×10² 3.0×10⁴ 57.5 1.1×10² 2.9×101
26/04–A WC/CrC/Ni 3.8×10⁶ 30.2 6.1×10³ 7.4×10² 1.1×10⁵ 36.6 2.1×10² 6.3×101 28/04–M WC/CrC/Ni 3.1×10⁶ 31.3 5.1×10³ 5.2×10² 1.7×10⁵ 46.4 3.9×10² 1.0×10²
5.8×10⁴ 33.9 1.0×10² 2.4×101 28/04–A WC/CrC/Ni 2.9×10⁶ 32.1 4.8×10³ 5.8×10² 1.5×10⁵ 42.1 3.2×10² 8.4×101
Mean 3.4×10⁶ 30.6 5.4×10³ 6.4×10² 2.0×10⁵ 39.6 3.7×10² 8.7×101 4.4×10⁴ 45.7 1.1×10² 2.7×101 SD 4.1×10⁵ 1.3 5.0×10² 8.7×101 9.3×10⁴ 5.1 1.3×10² 1.6×101 1.4×10⁴ 11.8 5.1×100 2.6×100
Max 6.3×106 52.3 8.9×10³ 1.3×10³ 1.7×10⁶ 69.4 2.1×10³ 2.7×10² 7.8×10⁴ 60.4 3.0×10² 4.5×101 Min 1.9×10⁵ 10.0 2.2×10² 2.1×101 3.3×10⁴ 18.4 8.6×101 1.8×101 1.5×10⁴ 29.4 5.0×101 2.0×101
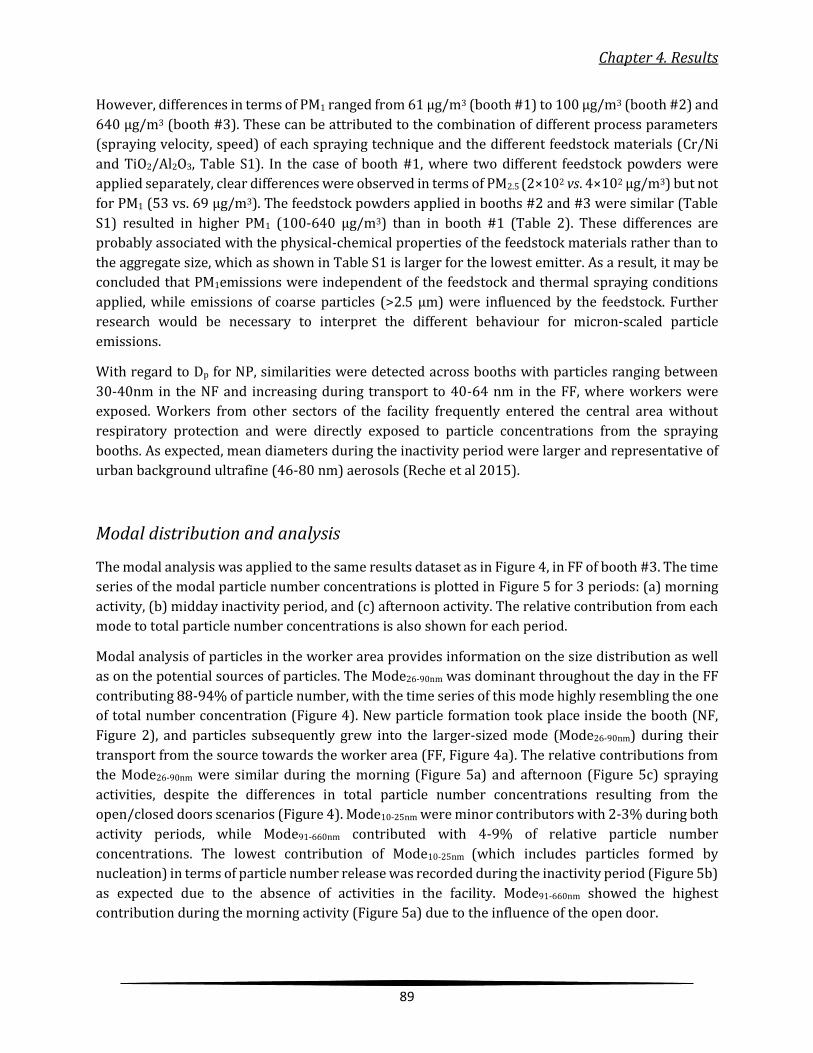
Chapter 4. Results
89
However, differences in terms of PM1 ranged from 61 µg/m3 (booth #1) to 100 µg/m3 (booth #2) and
640 µg/m3 (booth #3). These can be attributed to the combination of different process parameters
(spraying velocity, speed) of each spraying technique and the different feedstock materials (Cr/Ni
and TiO2/Al2O3, Table S1). In the case of booth #1, where two different feedstock powders were
applied separately, clear differences were observed in terms of PM2.5 (2×10² vs. 4×10² µg/m3) but not
for PM1 (53 vs. 69 µg/m3). The feedstock powders applied in booths #2 and #3 were similar (Table
S1) resulted in higher PM1 (100-640 µg/m3) than in booth #1 (Table 2). These differences are
probably associated with the physical-chemical properties of the feedstock materials rather than to
the aggregate size, which as shown in Table S1 is larger for the lowest emitter. As a result, it may be
concluded that PM1emissions were independent of the feedstock and thermal spraying conditions
applied, while emissions of coarse particles (>2.5 µm) were influenced by the feedstock. Further
research would be necessary to interpret the different behaviour for micron-scaled particle
emissions.
With regard to Dp for NP, similarities were detected across booths with particles ranging between
30-40nm in the NF and increasing during transport to 40-64 nm in the FF, where workers were
exposed. Workers from other sectors of the facility frequently entered the central area without
respiratory protection and were directly exposed to particle concentrations from the spraying
booths. As expected, mean diameters during the inactivity period were larger and representative of
urban background ultrafine (46-80 nm) aerosols (Reche et al 2015).
Modal distribution and analysis
The modal analysis was applied to the same results dataset as in Figure 4, in FF of booth #3. The time
series of the modal particle number concentrations is plotted in Figure 5 for 3 periods: (a) morning
activity, (b) midday inactivity period, and (c) afternoon activity. The relative contribution from each
mode to total particle number concentrations is also shown for each period.
Modal analysis of particles in the worker area provides information on the size distribution as well
as on the potential sources of particles. The Mode26-90nm was dominant throughout the day in the FF
contributing 88-94% of particle number, with the time series of this mode highly resembling the one
of total number concentration (Figure 4). New particle formation took place inside the booth (NF,
Figure 2), and particles subsequently grew into the larger-sized mode (Mode26-90nm) during their
transport from the source towards the worker area (FF, Figure 4a). The relative contributions from
the Mode26-90nm were similar during the morning (Figure 5a) and afternoon (Figure 5c) spraying
activities, despite the differences in total particle number concentrations resulting from the
open/closed doors scenarios (Figure 4). Mode10-25nm were minor contributors with 2-3% during both
activity periods, while Mode91-660nm contributed with 4-9% of relative particle number
concentrations. The lowest contribution of Mode10-25nm (which includes particles formed by
nucleation) in terms of particle number release was recorded during the inactivity period (Figure 5b)
as expected due to the absence of activities in the facility. Mode91-660nm showed the highest
contribution during the morning activity (Figure 5a) due to the influence of the open door.

Chapter 4. Results
90
Figure 5. Particle number concentrations for particles in each of the modes identified by modal analysis (top)
for booth #3 data for 26/04/2017. Absolute average number concentration and relative contribution (%) of
each mode (bottom) for time intervals (a) morning, (b) inactivity period, and (c) afternoon.
Certain considerations should be taken into account in the application of modal analysis to the
occupational dataset presented in this work Particles deriving from nucleation can have sizes from 1
nm, while very few instruments are able to measure particles in this size range. The instrumentation
used in this work had a lower cutoff at 10 nm (NanoScan) which results in an underestimation of the
Mode10-25 contributions. The same is probably true for the Mode91-660nm, given that the instruments
had an upper cutoff size at 420 nm. The underestimation of the Mode91-660nm mode was probably
lower since the number of particles in the range 420-660 nm emitted during thermal spraying is low.
Calculated deposited dose during inhalation
Inhalation dose rates for particle number, surface area and mass were estimated for booth #3
(26/04/2017 and 28/04/2017), for each half-day (morning and afternoon) and midday inactivity
period for the FF location (Table 3), where workers carried out different tasks and the use of personal
protection equipment was limited. Particle number dose rates (��) were higher during activity
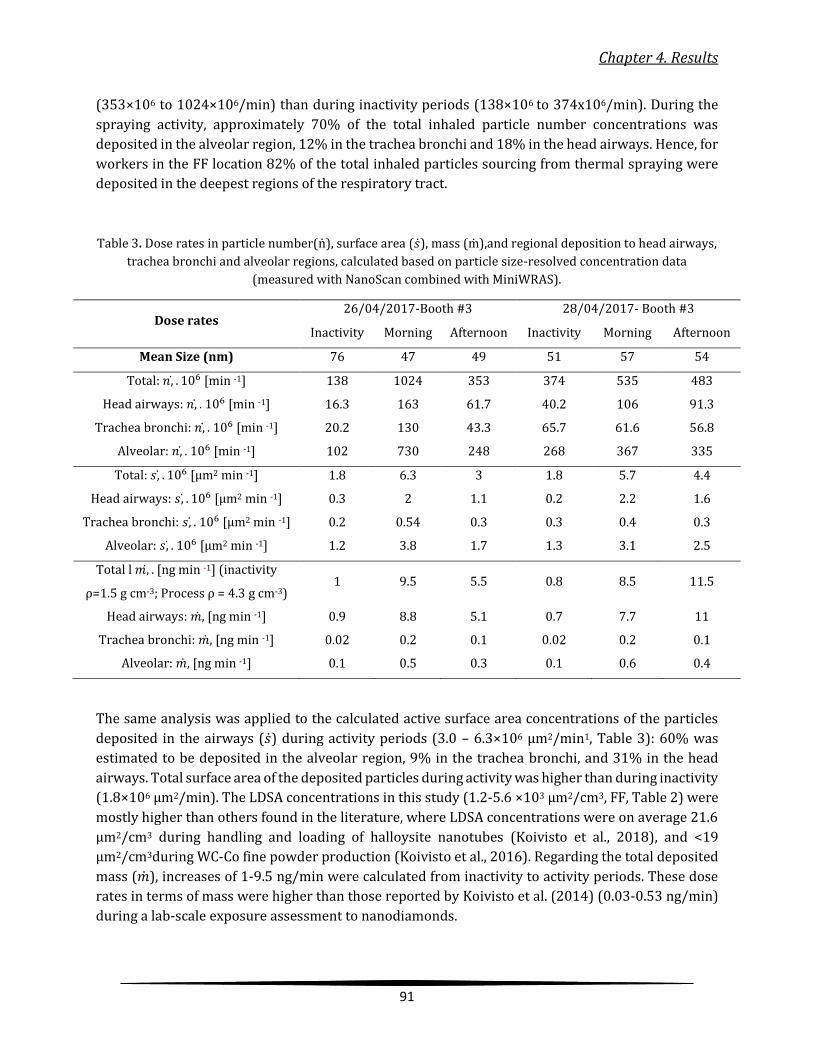
Chapter 4. Results
91
(353×106 to 1024×106/min) than during inactivity periods (138×106 to 374x106/min). During the
spraying activity, approximately 70% of the total inhaled particle number concentrations was
deposited in the alveolar region, 12% in the trachea bronchi and 18% in the head airways. Hence, for
workers in the FF location 82% of the total inhaled particles sourcing from thermal spraying were
deposited in the deepest regions of the respiratory tract.
Table 3. Dose rates in particle number(n), surface area (��), mass (m),and regional deposition to head airways,
trachea bronchi and alveolar regions, calculated based on particle size-resolved concentration data
(measured with NanoScan combined with MiniWRAS).
Dose rates 26/04/2017-Booth #3 28/04/2017- Booth #3
Inactivity Morning Afternoon Inactivity Morning Afternoon
Mean Size (nm) 76 47 49 51 57 54
Total: 𝑛, . 106 [min -1] 138 1024 353 374 535 483
Head airways: 𝑛, . 106 [min -1] 16.3 163 61.7 40.2 106 91.3
Trachea bronchi: 𝑛, . 106 [min -1] 20.2 130 43.3 65.7 61.6 56.8
Alveolar: 𝑛, . 106 [min -1] 102 730 248 268 367 335
Total: 𝑠, . 106 [μm2 min -1] 1.8 6.3 3 1.8 5.7 4.4
Head airways: 𝑠, . 106 [μm2 min -1] 0.3 2 1.1 0.2 2.2 1.6
Trachea bronchi: 𝑠, . 106 [μm2 min -1] 0.2 0.54 0.3 0.3 0.4 0.3
Alveolar: 𝑠, . 106 [μm2 min -1] 1.2 3.8 1.7 1.3 3.1 2.5
Total l 𝑚, . [ng min -1] (inactivity
ρ=1.5 g cm-3; Process ρ = 4.3 g cm-3) 1 9.5 5.5 0.8 8.5 11.5
Head airways: 𝑚, [ng min -1] 0.9 8.8 5.1 0.7 7.7 11
Trachea bronchi: 𝑚, [ng min -1] 0.02 0.2 0.1 0.02 0.2 0.1
Alveolar: 𝑚, [ng min -1] 0.1 0.5 0.3 0.1 0.6 0.4
The same analysis was applied to the calculated active surface area concentrations of the particles
deposited in the airways (��) during activity periods (3.0 – 6.3×106 µm2/min1, Table 3): 60% was
estimated to be deposited in the alveolar region, 9% in the trachea bronchi, and 31% in the head
airways. Total surface area of the deposited particles during activity was higher than during inactivity
(1.8×106 µm2/min). The LDSA concentrations in this study (1.2-5.6 ×103 µm2/cm3, FF, Table 2) were
mostly higher than others found in the literature, where LDSA concentrations were on average 21.6
μm2/cm3 during handling and loading of halloysite nanotubes (Koivisto et al., 2018), and <19
μm2/cm3during WC-Co fine powder production (Koivisto et al., 2016). Regarding the total deposited
mass (��), increases of 1-9.5 ng/min were calculated from inactivity to activity periods. These dose
rates in terms of mass were higher than those reported by Koivisto et al. (2014) (0.03-0.53 ng/min)
during a lab-scale exposure assessment to nanodiamonds.
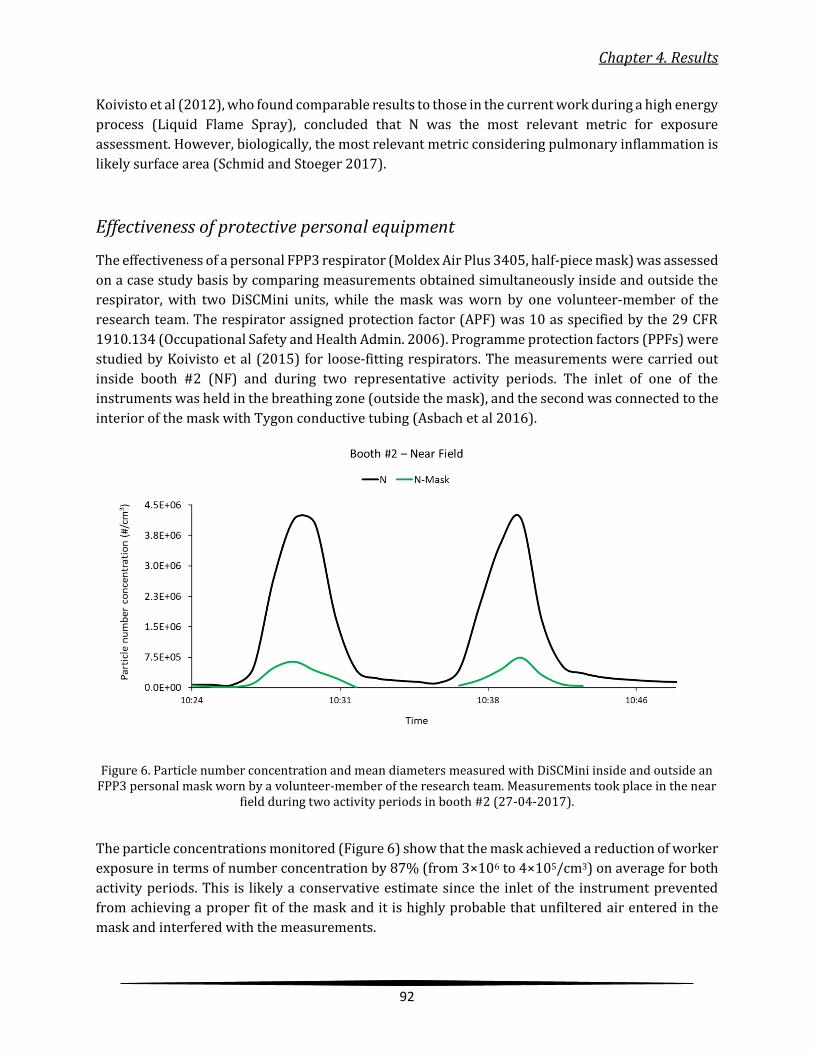
Chapter 4. Results
92
Koivisto et al (2012), who found comparable results to those in the current work during a high energy
process (Liquid Flame Spray), concluded that N was the most relevant metric for exposure
assessment. However, biologically, the most relevant metric considering pulmonary inflammation is
likely surface area (Schmid and Stoeger 2017).
Effectiveness of protective personal equipment
The effectiveness of a personal FPP3 respirator (Moldex Air Plus 3405, half-piece mask) was assessed
on a case study basis by comparing measurements obtained simultaneously inside and outside the
respirator, with two DiSCMini units, while the mask was worn by one volunteer-member of the
research team. The respirator assigned protection factor (APF) was 10 as specified by the 29 CFR
1910.134 (Occupational Safety and Health Admin. 2006). Programme protection factors (PPFs) were
studied by Koivisto et al (2015) for loose-fitting respirators. The measurements were carried out
inside booth #2 (NF) and during two representative activity periods. The inlet of one of the
instruments was held in the breathing zone (outside the mask), and the second was connected to the
interior of the mask with Tygon conductive tubing (Asbach et al 2016).
Figure 6. Particle number concentration and mean diameters measured with DiSCMini inside and outside an FPP3 personal mask worn by a volunteer-member of the research team. Measurements took place in the near
field during two activity periods in booth #2 (27-04-2017).
The particle concentrations monitored (Figure 6) show that the mask achieved a reduction of worker
exposure in terms of number concentration by 87% (from 3×10⁶ to 4×10⁵/cm3) on average for both
activity periods. This is likely a conservative estimate since the inlet of the instrument prevented
from achieving a proper fit of the mask and it is highly probable that unfiltered air entered in the
mask and interfered with the measurements.

Chapter 4. Results
93
Conclusions
Particle emissions and impacts on exposure were monitored for NPs and micron-scaled particles
(fine and coarse) in terms of particle number and mass concentrations, LDSA, mean diameter and
size distributions, during the application of ceramic coatings on metal surfaces by means of thermal
spraying, at industrial scale. The results obtained are representative of the industrial facility under
study, which has unique characteristics as most industrial facilities do, which highlights the need for
additional studies with this kind of focus in the literature. Results may only be generalized once the
body of literature regarding industrial thermal spraying emissions and the influence of different
feedstock materials become available.
High particle number (>106/cm3) and mass (60-600 µgPM1/m3) concentrations were recorded inside
the thermal spraying booths (NF), which were transported towards the worker area (FF) increasing
the FF concentrations by one order of magnitude in terms of N (104-105/cm3) and up to a factor of 4
in PM1 (44-100 µg/m3). NPs were generated through different mechanisms (mechanical, melting-
condensation), resulting in diverse morphologies (irregular, spherical). NPs with small diameters
were detected inside (31-41 nm) and outside (40-64 nm) the spraying booths. Worker exposure
occurred both in the NF and FF locations, given that the workers operated equally inside and outside
the spraying booths. The inhalation model applied showed that particles emitted during thermal
spraying were mainly deposited in the alveolar region (70%).
The high correlation between particle concentrations in the NF and FF suggest that worker exposure
was strongly impacted by NPs, fine and coarse particles emitted during thermal spraying. Whereas
similar NP number concentrations were monitored irrespective of the spraying technique and
feedstock material applied, coarser particle (>2.5 µm) mass concentrations showed differences as a
function of the feedstock material. Additional research is necessary to understand the relationship
between coarse particle emissions and feedstock physical-chemical properties.
The advantages and limitations of applying modal analysis to an occupational dataset were assessed.
This analysis allowed for the identification of a dominant mode (Mode26-90 particles, 89%), the
increased contribution from Mode10-25nm (nucleation) particles during thermal spraying periods, and
the influence of outdoor urban background aerosols during the inactivity period. In spite of the
continuously working local extraction systems, the proper sealing of the spraying booths was
identified as a key element for exposure reduction. Differences in exposure concentrations of one
order of magnitude (from 105/cm3 to 104/cm3) were recorded when doors were open/closed.
Optimising the production routine to prevent the opening of doors during the spraying activity as
well as a delayed door-opening protocol could reduce NP transport from inside the booths and
consequently minimise impacts on exposure in the adjacent worker areas. Furthermore, worker
access in the central area should be restricted during spraying operation, or carried out with
adequate personal protective equipment (PPE). Finally, the use of FPP3 masks (with APF 10) was
also advised, given their high potential for reduction of particle number concentrations.
Chapter 4. Results
94
Acknowledgements
The current work was carried out in the framework of the CERASAFE project (www.cerasafe.eu),
with the support of SIINN ERA-NET (project id: 16), and was funded by the Spanish MINECO (PCIN-
2015-173-C02-01) and the Romanian UEFISCDI (PN-III-P4-ID-PCE-2016-0835). Partial funding from
the “Generalitat de Catalunya” (project number: AGAUR 2017 SGR41) is also acknowledged. The
authors kindly acknowledge TM COMAS (http://www.tmcomas.com) for their committed
cooperation.
Chapter 4. Results
95
REFERENCES
Araujo JA, Barajas B, Kleinman M, Wang X, Bennett BJ, Gong KW, Navab M, Harkema J, Sioutas C, Lusis AJ and
Nel AE (2008) Ambient particulate pollutants in the ultrafine range promote early atherosclerosis and systemic
oxidative stress. Circulation Research 102(5): 589–596.
Asbach C, Kaminski H, Lamboy Y, Schneiderwind U, Fierz M and Todea AM (2016) Silicone sampling tubes can
cause drastic artifacts in measurements with aerosol instrumentation based on unipolar diffusion charging.
Aerosol Science and Technology 50(12): 1375–1384.
Asbach C, Kuhlbusch T a J, Kaminski H, Plitzko S, Götz U, Voetz M and Dahmann D (2012) Authors : SOP-Tiered
Approach Tiered Approach for the assessment of exposure to airborne nanoobjects in work- places. .
Baiamonte L, Marra F, Gazzola S, Giovanetto P, Bartuli C, Valente T and Pulci G (2015) Thermal sprayed coatings
for hot corrosion protection of exhaust valves in naval diesel engines. Surface and Coatings Technology. Elsevier
B.V. 295: 78–87. Available at: http://dx.doi.org/10.1016/j.surfcoat.2015.10.072.
Bémer D, Régnier R, Subra I, Sutter B, Lecler MT and Morele Y (2010) Ultrafine Particles Emitted by Flame and
Electric Arc Guns for Thermal Spraying of Metals. The Annals of Occupational Hygiene 54(6): 607–614.
Van Broekhuizen P, Van Veelen W, Streekstra WH, Schulte P and Reijnders L (2012) Exposure limits for
nanoparticles: Report of an international workshop on nano reference values. Annals of Occupational Hygiene
56(5): 515–524.
Coleman TF and Li Y (1994) On the convergence of interior-reflective Newton methods for nonlinear
minimization subject to bounds. Mathematical Programming 67(1–3): 189–224.
Coleman TF and Li Y (1996) An Interior Trust Region Approach for Nonlinear Minimization Subject to Bounds.
SIAM Journal on Optimization 6(2): 418–445. Available at: https://doi.org/10.1137/0806023.
Cousins C, Boice Jr JD, Cooper UJR, Lee UJ and Lochard KJ (2011) Annals of the ICRP Published on behalf of the
International Commission on Radiological Protection International Commission on Radiological Protection
Members of the 2010–2013 Main Commission of ICRP. . Available at: http://www.icrp.org/docs/P.
DeCarlo PF, Slowik JG, Stainken K, Davidovits P, Williams LR, Jayne JT, Kolb CE, Worsnop DR, Rudich Y and
Jimenez JL (2004) Particle morphology and density characterization by combined mobility and aerodynamic
diameter measurements. Part 2: Application to combustion-generated soot aerosols as a function of fuel
equivalence ratio. Aerosol Science and Technology 38(12): 1206–1222.
Ding Y, Kuhlbusch TAJ, Van Tongeren M, Jiménez AS, Tuinman I, Chen R, Alvarez IL, Mikolajczyk U, Nickel C,
Meyer J, Kaminski H, Wohlleben W, Stahlmecke B, Clavaguera S and Riediker M (2017) Airborne engineered
nanomaterials in the workplace—a review of release and worker exposure during nanomaterial production
and handling processes. Journal of Hazardous Materials 322: 17–28.
Fonseca AS, Kuijpers E, Kling KI, Levin M, Koivisto AJ, Nielsen SH, Fransman W, Fedutik Y, Jensen KA and
Koponen IK (2018) Particle release and control of worker exposure during laboratory-scale synthesis, handling
and simulated spills of manufactured nanomaterials in fume hoods. Journal of Nanoparticle Research. Journal
of Nanoparticle Research 20(2).
Chapter 4. Results
96
Fonseca AS, Maragkidou A, Viana M, Querol X, Hämeri K, de Francisco I, Estepa C, Borrell C, Lennikov V and de
la Fuente GF (2016) Process-generated nanoparticles from ceramic tile sintering: Emissions, exposure and
environmental release. Science of the Total Environment 565: 922–932.
Fonseca AS, Viana M, Querol X, Moreno N, de Francisco I, Estepa C and de la Fuente GF (2015) Ultrafine and
nanoparticle formation and emission mechanisms during laser processing of ceramic materials. Journal of
Aerosol Science 88: 48–57.
Fujitani Y, Kobayashi T, Arashidani K, Kunugita N and Suemura K (2008) Measurement of the physical
properties of aerosols in a fullerene factory for inhalation exposure assessment. Journal of Occupational and
Environmental Hygiene 5(6): 380–389.
Gakidou E, Afshin A, Abajobir AA, Abate KH, Abbafati C, Abbas KM, Abd-Allah F, Abdulle AM, Abera SF, Aboyans
V, Abu-Raddad LJ, Abu-Rmeileh NME, Abyu GY, Adedeji IA, Adetokunboh O, Afarideh M, Agrawal A, Agrawal S,
Ahmad Kiadaliri A, Ahmadieh H, Ahmed MB, Aichour AN, Aichour I, Aichour MTE, Akinyemi RO, Akseer N,
Alahdab F, Al-Aly Z, Alam K, Alam N, Alam T, Alasfoor D, Alene KA, Ali K, Alizadeh-Navaei R, Alkerwi A, Alla F,
Allebeck P, Al-Raddadi R, Alsharif U, Altirkawi KA, Alvis-Guzman N, Amare AT, Amini E, Ammar W, Amoako YA,
Ansari H, Antó JM, Antonio CAT, Anwari P, Arian N, Ärnlöv J, Artaman A, Aryal KK, Asayesh H, Asgedom SW,
Atey TM, Avila-Burgos L, Avokpaho EFGA, Awasthi A, Azzopardi P, Bacha U, Badawi A, Balakrishnan K, Ballew
SH, Barac A, Barber RM, Barker-Collo SL, Bärnighausen T, Barquera S, Barregard L, Barrero LH, Batis C, Battle
KE, Baune BT, Beardsley J, Bedi N, Beghi E, Bell ML, Bennett DA, Bennett JR, Bensenor IM, Berhane A, Berhe DF,
Bernabé E, Betsu BD, Beuran M, Beyene AS, Bhansali A, Bhutta ZA, Bikbov B, Birungi C, Biryukov S, Blosser CD,
Boneya DJ, Bou-Orm IR, Brauer M, Breitborde NJK, Brenner H, Brugha TS, Bulto LNB, Baumgarner BR, Butt ZA,
Cahuana-Hurtado L, Cárdenas R, Carrero JJ, Castañeda-Orjuela CA, Catalá-López F, Cercy K, Chang HY, Charlson
FJ, Chimed-Ochir O, Chisumpa VH, Chitheer AA, Christensen H, Christopher DJ, Cirillo M, Cohen AJ, Comfort H,
Cooper C, Coresh J, Cornaby L, Cortesi PA, Criqui MH, Crump JA, Dandona L, Dandona R, Das Neves J, Davey G,
Davitoiu D V., Davletov K, De Courten B, Degenhardt L, Deiparine S, Dellavalle RP, Deribe K, Deshpande A,
Dharmaratne SD, Ding EL, Djalalinia S, Do HP, Dokova K, Doku DT, Dorsey ER, Driscoll TR, Dubey M, Duncan
BB, Duncan S, Ebert N, Ebrahimi H, El-Khatib ZZ, Enayati A, Endries AY, Ermakov SP, Erskine HE, Eshrati B,
Eskandarieh S, Esteghamati A, Estep K, Faraon EJA, Farinha CSES, Faro A, Farzadfar F, Fay K, Feigin VL,
Fereshtehnejad SM, Fernandes JC, Ferrari AJ, Feyissa TR, Filip I, Fischer F, Fitzmaurice C, Flaxman AD, Foigt N,
Foreman KJ, Frostad JJ, Fullman N, Fürst T, Furtado JM, Ganji M, Garcia-Basteiro AL, Gebrehiwot TT, Geleijnse
JM, Geleto A, Gemechu BL, Gesesew HA, Gething PW, Ghajar A, Gibney KB, Gill PS, Gillum RF, Giref AZ, Gishu MD,
Giussani G, Godwin WW, Gona PN, Goodridge A, Gopalani SV, Goryakin Y, Goulart AC, Graetz N, Gugnani HC, Guo
J, Gupta R, Gupta T, Gupta V, Gutiérrez RA, Hachinski V, Hafezi-Nejad N, Hailu GB, Hamadeh RR, Hamidi S,
Hammami M, Handal AJ, Hankey GJ, Harb HL, Hareri HA, Hassanvand MS, Havmoeller R, Hawley C, Hay SI,
Hedayati MT, Hendrie D, Heredia-Pi IB, Hoek HW, Horita N, Hosgood HD, Hostiuc S, Hoy DG, Hsairi M, Hu G,
Huang H, Huang JJ, Iburg KM, Ikeda C, Inoue M, Irvine CMS, Jackson MD, Jacobsen KH, Jahanmehr N, Jakovljevic
MB, Jauregui A, Javanbakht M, Jeemon P, Johansson LRK, Johnson CO, Jonas JB, Jürisson M, Kabir Z, Kadel R,
Kahsay A, Kamal R, Karch A, Karema CK, Kasaeian A, Kassebaum NJ, Kastor A, Katikireddi SV, Kawakami N,
Keiyoro PN, Kelbore SG, Kemmer L, Kengne AP, Kesavachandran CN, Khader YS, Khalil IA, Khan EA, Khang YH,
Khosravi A, Khubchandani J, Kieling C, Kim D, Kim JY, Kim YJ, Kimokoti RW, Kinfu Y, Kisa A, Kissimova-Skarbek
KA, Kivimaki M, Knibbs LD, Knudsen AK, Kopec JA, Kosen S, Koul PA, Koyanagi A, Kravchenko M, Krohn KJ,
Kromhout H, Kuate Defo B, Kucuk Bicer B, Kumar GA, Kutz M, Kyu HH, Lal DK, Lalloo R, Lallukka T, Lan Q,
Lansingh VC, Larsson A, Lee A, Lee PH, Leigh J, Leung J, Levi M, Li Y, Li Y, Liang X, Liben ML, Linn S, Liu P, Lodha
R, Logroscino G, Looker KJ, Lopez AD, Lorkowski S, Lotufo PA, Lozano R, Lunevicius R, Macarayan ERK, Magdy
Abd El Razek H, Magdy Abd El Razek M, Majdan M, Majdzadeh R, Majeed A, Malekzadeh R, Malhotra R, Malta
DC, Mamun AA, Manguerra H, Mantovani LG, Mapoma CC, Martin R V., Martinez-Raga J, Martins-Melo FR,
Mathur MR, Matsushita K, Matzopoulos R, Mazidi M, McAlinden C, McGrath JJ, Mehata S, Mehndiratta MM, Meier

Chapter 4. Results
97
T, Melaku YA, Memiah P, Memish ZA, Mendoza W, Mengesha MM, Mensah GA, Mensink GBM, Mereta ST,
Meretoja A, Meretoja TJ, Mezgebe HB, Micha R, Millear A, Miller TR, Minnig S, Mirarefin M, Mirrakhimov EM,
Misganaw A, Mishra SR, Mohammad KA, Mohammed KE, Mohammed S, Mohamed Ibrahim N, Mohan MBV,
Mokdad AH, Monasta L, Montañez Hernandez JC, Montico M, Moradi-Lakeh M, Moraga P, Morawska L, Morrison
SD, Mountjoy-Venning C, Mueller UO, Mullany EC, Muller K, Murthy GVS, Musa KI, Naghavi M, Naheed A, Nangia
V, Natarajan G, Negoi I, Negoi RI, Nguyen CT, Nguyen G, Nguyen M, Nguyen Q Le, Nguyen TH, Nichols E, Ningrum
DNA, Nomura M, Nong VM, Norheim OF, Norrving B, Noubiap JJN, Obermeyer CM, Ogbo FA, Oh IH, Oladimeji O,
Olagunju AT, Olagunju TO, Olivares PR, Olsen HE, Olusanya BO, Olusanya JO, Opio JN, Oren E, Ortiz A, Ota E,
Owolabi MO, Pa M, Pacella RE, Pana A, Panda BK, Panda-Jonas S, Pandian JD, Papachristou C, Park EK, Parry CD,
Patten SB, Patton GC, Pereira DM, Perico N, Pesudovs K, Petzold M, Phillips MR, Pillay JD, Piradov MA, Pishgar
F, Plass D, Pletcher MA, Polinder S, Popova S, Poulton RG, Pourmalek F, Prasad N, Purcell C, Qorbani M, Radfar
A, Rafay A, Rahimi-Movaghar A, Rahimi-Movaghar V, Rahman M, Rahman MHU, Rahman MA, Rai RK, Rajsic S,
Ram U, Rawaf S, Rehm CD, Rehm J, Reiner RC, Reitsma MB, Reynales-Shigematsu LM, Remuzzi G, Renzaho AMN,
Resnikoff S, Rezaei S, Ribeiro AL, Rivera JA, Roba KT, Rojas-Rueda D, Roman Y, Room R, Roshandel G, Roth GA,
Rothenbacher D, Rubagotti E, Rushton L, Sadat N, Safdarian M, Safi S, Safiri S, Sahathevan R, Salama J, Salomon
JA, Samy AM, Sanabria JR, Sanchez-Niño MD, Sánchez-Pimienta TG, Santomauro D, Santos IS, Santric Milicevic
MM, Sartorius B, Satpathy M, Sawhney M, Saxena S, Schaeffner E, Schmidt MI, Schneider IJC, Schutte AE,
Schwebel DC, Schwendicke F, Seedat S, Sepanlou SG, Serdar B, Servan-Mori EE, Shaddick G, Shaheen A, Shahraz
S, Shaikh MA, Shamah Levy T, Shamsipour M, Shamsizadeh M, Shariful Islam SM, Sharma J, Sharma R, She J,
Shen J, Shi P, Shibuya K, Shields C, Shiferaw MS, Shigematsu M, Shin MJ, Shiri R, Shirkoohi R, Shishani K, Shoman
H, Shrime MG, Sigfusdottir ID, Silva DAS, Silva JP, Silveira DGA, Singh JA, Singh V, Sinha DN, Skiadaresi E, Slepak
EL, Smith DL, Smith M, Sobaih BHA, Sobngwi E, Soneji S, Sorensen RJD, Sposato LA, Sreeramareddy CT,
Srinivasan V, Steel N, Stein DJ, Steiner C, Steinke S, Stokes MA, Strub B, Subart M, Sufiyan MB, Suliankatchi RA,
Sur PJ, Swaminathan S, Sykes BL, Szoeke CEI, Tabarés-Seisdedos R, Tadakamadla SK, Takahashi K, Takala JS,
Tandon N, Tanner M, Tarekegn YL, Tavakkoli M, Tegegne TK, Tehrani-Banihashemi A, Terkawi AS, Tesssema
B, Thakur JS, Thamsuwan O, Thankappan KR, Theis AM, Thomas ML, Thomson AJ, Thrift AG, Tillmann T, Tobe-
Gai R, Tobollik M, Tollanes MC, Tonelli M, Topor-Madry R, Torre A, Tortajada M, Touvier M, Tran BX, Truelsen
T, Tuem KB, Tuzcu EM, Tyrovolas S, Ukwaja KN, Uneke CJ, Updike R, Uthman OA, Van Boven JFM, Van Donkelaar
A, Varughese S, Vasankari T, Veerman LJ, Venkateswaran V, Venketasubramanian N, Violante FS, Vladimirov
SK, Vlassov VV, Vollset SE, Vos T, Wadilo F, Wakayo T, Wallin MT, Wang YP, Weichenthal S, Weiderpass E,
Weintraub RG, Weiss DJ, Werdecker A, Westerman R, Whiteford HA, Wiysonge CS, Woldeyes BG, Wolfe CDA,
Woodbrook R, Workicho A, Wulf Hanson S, Xavier D, Xu G, Yadgir S, Yakob B, Yan LL, Yaseri M, Yimam HH, Yip
P, Yonemoto N, Yoon SJ, Yotebieng M, Younis MZ, Zaidi Z, El Sayed Zaki M, Zavala-Arciniega L, Zhang X, Zimsen
SRM, Zipkin B, Zodpey S, Lim SS and Murray CJL (2017) Global, regional, and national comparative risk
assessment of 84 behavioural, environmental and occupational, and metabolic risks or clusters of risks, 1990-
2016: A systematic analysis for the Global Burden of Disease Study 2016. The Lancet 390(10100): 1345–1422.
Ganser GH and Hewett P (2017) Models for nearly every occasion: Part II - Two box models. Journal of
Occupational and Environmental Hygiene 14: 58–71.
Gérard B (2006) Application of thermal spraying in the automobile industry. Surface and Coatings Technology
201(5): 2028–2031.
Hallé S, Nadeau S and Fatisson J (2015) Engineered containment and control of airborne nanoparticles: Current
status. International Journal of Safety and Security Engineering 5(4): 336–351.
Heitbrink WA, Evans DE, Ku BK, Maynard AD, Slavin TJ and Peters TM (2009) Relationships among particle
number, surface area, and respirable mass concentrations in automotive engine manufacturing. Journal of
Chapter 4. Results
98
Occupational and Environmental Hygiene 6(1): 19–31. Available at:
http://www.tandfonline.com/doi/abs/10.1080/15459620802530096.
Hériaud-Kraemer H, Montavon G, Coddet C, Hertert S and Robin H (2003) Harmful risks for workers in thermal
spraying: A review completed by a survey in a French company. Journal of Thermal Spray Technology 12(4):
542–554.
Hewett P and Ganser GH (2017) Models for nearly every occasion: Part I - One box models. Journal of
Occupational and Environmental Hygiene. Taylor & Francis 14(1): 49–57.
Hinds WC (1999) Aerosol technology: Properties, Behavior, and Measurement of Airborne Particles. Wiley-
Interscience Publication. Wiley. Available at:
https://books.google.es/books/about/Aerosol_technology.html?id=ORxSAAAAMAAJ&redir_esc=y.
Hoek G, Boogaard H, Knol A, De Hartog J, Slottje P, Ayres JG, Borm P, Brunekreef B, Donaldson K, Forastiere F,
Holgate S, Kreyling WG, Nemery B, Pekkanen J, Stone V, Wichmann HE and Van Der Sluijs J (2010)
Concentration response functions for ultrafine particles and all-cause mortality and hospital admissions:
Results of a European expert panel elicitation. Environmental Science and Technology 44(1): 476–482.
Huang H, Li H and Li X (2016) Physicochemical Characteristics of Dust Particles in HVOF Spraying and
Occupational Hazards: Case Study in a Chinese Company. Journal of Thermal Spray Technology. Springer US
25(5): 971–981.
Hussein T, Hämeri K, Aalto PP, Paatero P and Kulmala M (2005) Modal structure and spatial-temporal
variations of urban and suburban aerosols in Helsinki - Finland. Atmospheric Environment 39(9): 1655–1668.
Hussein T, Maso MD, Petäjä T, Koponen IK, Paatero P, Aalto PP, Hämeri K and Kulmala M (2005) Evaluation of
an automatic algorithm for fitting the particle number size distributions. Boreal Environment Research.
10(October): 337–355.
Ibald-Mulli A, Wichmann H-E, Kreyling W and Peters A (2002) Epidemiological Evidence on Health Effects of
Ultrafine Particles. Journal of Aerosol Medicine 15(2): 189–201. Available at:
http://www.liebertonline.com/doi/abs/10.1089/089426802320282310.
Keller A, Fierz M, Siegmann K, Siegmann HC and Filippov A (2001) Surface science with nanosized particles in
a carrier gas. Journal of Vacuum Science & Technology A 19(1): 1–8. Available at:
https://doi.org/10.1116/1.1339832.
Knibbs LD, Cole-Hunter T and Morawska L (2011) A review of commuter exposure to ultrafine particles and its
health effects. Atmospheric Environment. Elsevier Ltd 45(16): 2611–2622. Available at:
http://dx.doi.org/10.1016/j.atmosenv.2011.02.065.
Koivisto AJ, Aromaa M, Koponen IK, Fransman W, Jensen KA, Mäkelä JM and Hämeri KJ (2015) Workplace
performance of a loose-fitting powered air purifying respirator during nanoparticle synthesis. Journal of
Nanoparticle Research 17(4).
Koivisto AJ, Aromaa M, Mäkelä JM, Pasanen P, Hussein T and Hämeri K (2012) Concept To Estimate Regional
Inhalation Dose of Industrially Synthesized Nanoparticles. ACSNano 6: 1195–1203.
Koivisto AJ, Bluhme AB, Kling KI, Fonseca AS, Redant E, Andrade F, Hougaard KS, Krepker M, Prinz OS, Segal E,
Holländer A, Jensen KA, Vogel U and Koponen IK (2018) Occupational exposure during handling and loading of
halloysite nanotubes – A case study of counting nanofibers. NanoImpact 10(April): 153–160.

Chapter 4. Results
99
Koivisto AJ, Jensen ACØ, Levin M, Kling KI, Maso MD, Nielsen SH, Jensen KA and Koponen IK (2015) Testing the
near field/far field model performance for prediction of particulate matter emissions in a paint factory.
Environmental Science: Processes & Impacts. Royal Society of Chemistry 17(1): 62–73. Available at:
http://xlink.rsc.org/?DOI=C4EM00532E.
Koivisto AJ, Kling KI, Levin M, Fransman W, Gosens I, Cassee FR and Jensen KA (2016) First order risk
assessment for nanoparticle inhalation exposure during injection molding of polypropylene composites and
production of tungsten-carbide-cobalt fine powder based upon pulmonary inflammation and surface area dose.
NanoImpact. The Authors 6: 30–38. Available at: http://dx.doi.org/10.1016/j.impact.2016.11.002.
Koivisto AJ, Palomäki JE, Viitanen AK, Siivola KM, Koponen IK, Yu M, Kanerva TS, Norppa H, Alenius HT, Hussein
T, Savolainen KM and Hämeri KJ (2014) Range-finding risk assessment of inhalation exposure to
nanodiamonds in a laboratory environment. International Journal of Environmental Research and Public Health
11(5): 5382–5402.
Koponen IK, Koivisto AJ and Jensen KA (2015) Worker exposure and high time-resolution analyses of process-
related submicrometre particle concentrations at mixing stations in two paint factories. Annals of Occupational
Hygiene 59(6): 749–763.
Kuhlbusch TAJ, Neumann S and Fissan H (2004) Number Size Distribution, Mass Concentration, and Particle
Composition of PM 1 , PM 2.5 , and PM 10 in Bag Filling Areas of Carbon Black Production. Journal of Occupational
and Environmental Hygiene 1(10): 660–671. Available at:
http://www.tandfonline.com/doi/abs/10.1080/15459620490502242.
Landrigan PJ, Fuller R, Acosta NJR, Adeyi O, Arnold R, Basu N, Baldé AB, Bertollini R, Bose-O’Reilly S, Boufford
JI, Breysse PN, Chiles T, Mahidol C, Coll-Seck AM, Cropper ML, Fobil J, Fuster V, Greenstone M, Haines A,
Hanrahan D, Hunter D, Khare M, Krupnick A, Lanphear B, Lohani B, Martin K, Mathiasen K V., McTeer MA,
Murray CJL, Ndahimananjara JD, Perera F, Potočnik J, Preker AS, Ramesh J, Rockström J, Salinas C, Samson LD,
Sandilya K, Sly PD, Smith KR, Steiner A, Stewart RB, Suk WA, van Schayck OCP, Yadama GN, Yumkella K and
Zhong M (2017) The Lancet Commission on pollution and health. The Lancet 391.
Lima RS and Marple BR (2006) From APS to HVOF spraying of conventional and nanostructured titania
feedstock powders: A study on the enhancement of the mechanical properties. Surface and Coatings Technology
200(11): 3428–3437.
Losert S, von Goetz N, Bekker C, Fransman W, Wijnhoven SWP, Delmaar C, Hungerbuhler K and Ulrich A (2014)
Human Exposure to Conventional and Nanoparticle-Containing Sprays—A Critical Review. Environmental
Science & Technology. American Chemical Society 48(10): 5366–5378.
Martins V, Cruz Minguillón M, Moreno T, Querol X, de Miguel E, Capdevila M, Centelles S and Lazaridis M (2015)
Deposition of aerosol particles from a subway microenvironment in the human respiratory tract. Journal of
Aerosol Science. Elsevier 90: 103–113. Available at: http://dx.doi.org/10.1016/j.jaerosci.2015.08.008.
Maynard AD, Aitken RJ, Butz T, Colvin V, Donaldson K, Oberdörster G, Philbert MA, Ryan J, Seaton A, Stone V,
Tinkle SS, Tran L, Walker NJ and Warheit DB (2006) Safe handling of nanotechnology. Nature. Nature
Publishing Group 444: 267. Available at: http://dx.doi.org/10.1038/444267a.
Moskowitz LN (1993) Application of HVOF thermal spraying to solve corrosion problems in the petroleum
industry-an industrial note. Journal of Thermal Spray Technology 2(1): 21–29.
Oberdörster G (2001) Pulmonary effects of inhaled ultrafine particles. International Archives of Occupational
and Environmental Health 74(1): 1–8. Available at:
Chapter 4. Results
100
http://www.springerlink.com/index/FVM951M11WWCV5JT.pdf%5Cnhttp://www.springerlink.com/openur
l.asp?genre=article&id=doi:10.1007/s004200000185.
Occupational Safety and Health Admin. L (2006) 29 CFR 1910.134. Code of Federal Regulations, 427–451.
Available at: https://www.osha.gov/pls/oshaweb/owadisp.show_document?p_table=standards&p_id=12716.
OJIMA J (2012) Gaseous Contaminant Distribution in the Breathing Zone. Industrial Health 50(3): 236–238.
Available at: https://www.jstage.jst.go.jp/article/indhealth/50/3/50_MS1314/_article.
Pawlowski L (2008a) The Science and Engineering of Thermal Spray Coatings. The Science and Engineering of
Thermal Spray Coatings: Second Edition. Available at: http://doi.wiley.com/10.1002/9780470754085.
Pawlowski L (2008b) The Science and Engineering of Thermal Spray Coatings. The Science and Engineering of
Thermal Spray Coatings: Second Edition.
Petsas N, Kouzilos G, Papapanos G, Vardavoulias M and Moutsatsou A (2007) Worker Exposure Monitoring of
Suspended Particles in a Thermal Spray Industry. Journal of Thermal Spray Technology 16(2): 214–219.
Available at: http://link.springer.com/10.1007/s11666-007-9027-6.
Poland CA, Duffin R, Kinloch I, Maynard A, Wallace WAH, Seaton A, Stone V, Brown S, MacNee W and Donaldson
K (2008) Carbon nanotubes introduced into the abdominal cavity of mice show asbestos-like pathogenicity in
a pilot study. Nature Nanotechnology. Nature Publishing Group 3: 423. Available at:
http://dx.doi.org/10.1038/nnano.2008.111.
Pope C and Dockery DW (2006) Health effects of fine particulate air pollution: Lines that connect. Journal of the
Air and Waste Management Association 56(6): 709–742.
Pope C, RT B, MJ T and Al E (2002) Lung cancer, cardiopulmonary mortality, and long-term exposure to fine
particulate air pollution. JAMA 287(9): 1132–1141. Available at: http://dx.doi.org/10.1001/jama.287.9.1132.
Pope CA, Dockery DW and Schwartz J (1995) Review of Epidemiological Evidence of Health Effects of
Particulate Air Pollution. Inhalation Toxicology 7(1): 1–18.
Reche C, Viana M, Karanasiou A, Cusack M, Alastuey A, Artiñano B, Revuelta MA, López-Mahía P, Blanco-Heras
G, Rodríguez S, Sánchez de la Campa AM, Fernández-Camacho R, González-Castanedo Y, Mantilla E, Tang YS and
Querol X (2015) Urban NH3levels and sources in six major Spanish cities. Chemosphere. Elsevier Ltd 119: 769–
777. Available at: http://dx.doi.org/10.1016/j.chemosphere.2014.07.097.
Salmatonidis A, Viana M, Pérez N, Alastuey A, de la Fuente GF, Angurel LA, Sanfélix V and Monfort E (2018)
Nanoparticle formation and emission during laser ablation of ceramic tiles. Journal of Aerosol Science. Elsevier
Ltd 126(September): 152–168. Available at:
https://linkinghub.elsevier.com/retrieve/pii/S0021850218301897.
Schmid O and Stoeger T (2017) Surface area is the biologically most effective dose metric for acute nanoparticle
toxicity in the lung. Journal of Aerosol Science. Elsevier 113: 276. Available at:
http://dx.doi.org/10.1016/j.jaerosci.2015.12.006.
Seaton A, Tran L, Aitken R and Donaldson K (2010) Nanoparticles, human health hazard and regulation. Journal
of The Royal Society Interface 7(Suppl_1): S119–S129. Available at:
http://rsif.royalsocietypublishing.org/cgi/doi/10.1098/rsif.2009.0252.focus.
Shaffer RE and Rengasamy S (2009) Respiratory protection against airborne nanoparticles: A review. Journal
of Nanoparticle Research 11(7): 1661–1672.
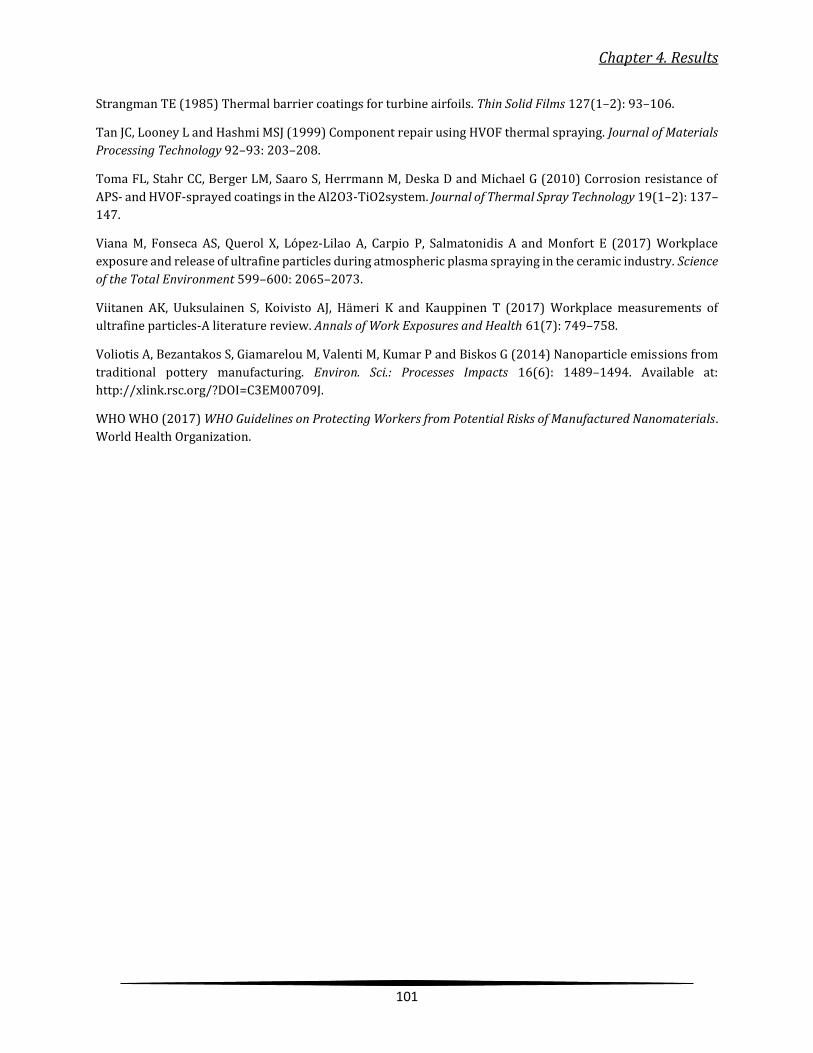
Chapter 4. Results
101
Strangman TE (1985) Thermal barrier coatings for turbine airfoils. Thin Solid Films 127(1–2): 93–106.
Tan JC, Looney L and Hashmi MSJ (1999) Component repair using HVOF thermal spraying. Journal of Materials
Processing Technology 92–93: 203–208.
Toma FL, Stahr CC, Berger LM, Saaro S, Herrmann M, Deska D and Michael G (2010) Corrosion resistance of
APS- and HVOF-sprayed coatings in the Al2O3-TiO2system. Journal of Thermal Spray Technology 19(1–2): 137–
147.
Viana M, Fonseca AS, Querol X, López-Lilao A, Carpio P, Salmatonidis A and Monfort E (2017) Workplace
exposure and release of ultrafine particles during atmospheric plasma spraying in the ceramic industry. Science
of the Total Environment 599–600: 2065–2073.
Viitanen AK, Uuksulainen S, Koivisto AJ, Hämeri K and Kauppinen T (2017) Workplace measurements of
ultrafine particles-A literature review. Annals of Work Exposures and Health 61(7): 749–758.
Voliotis A, Bezantakos S, Giamarelou M, Valenti M, Kumar P and Biskos G (2014) Nanoparticle emissions from
traditional pottery manufacturing. Environ. Sci.: Processes Impacts 16(6): 1489–1494. Available at:
http://xlink.rsc.org/?DOI=C3EM00709J.
WHO WHO (2017) WHO Guidelines on Protecting Workers from Potential Risks of Manufactured Nanomaterials.
World Health Organization.
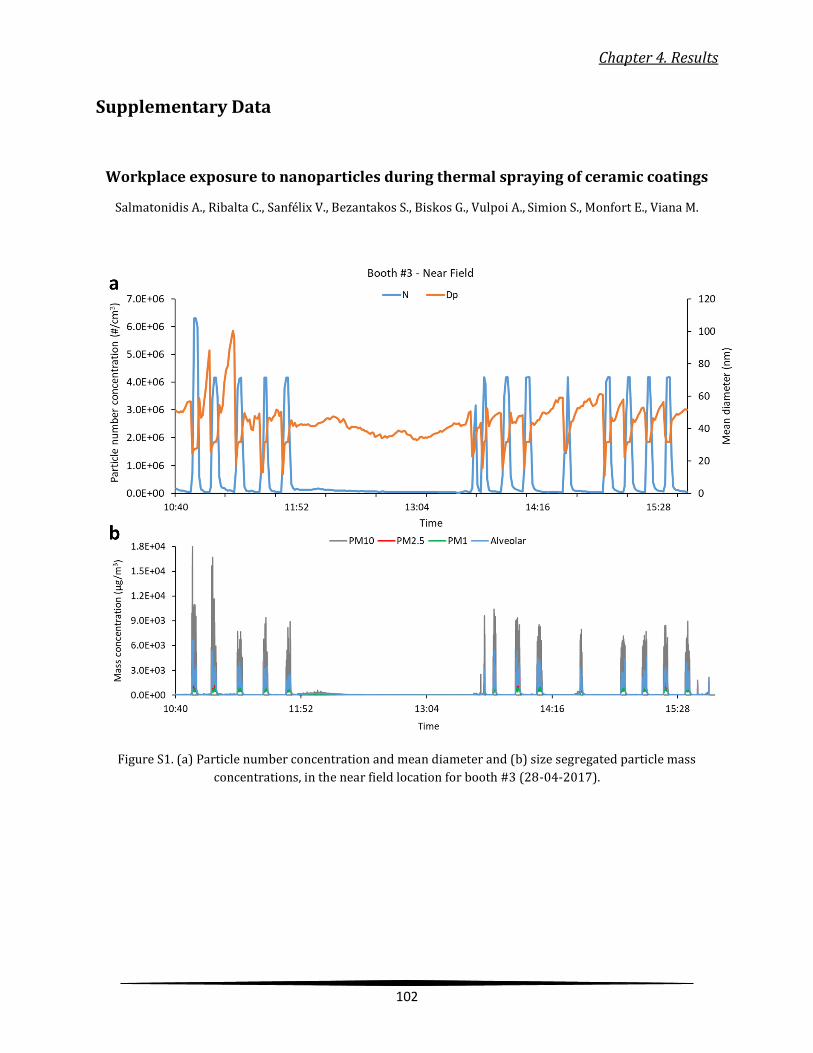
Chapter 4. Results
102
Supplementary Data
Workplace exposure to nanoparticles during thermal spraying of ceramic coatings
Salmatonidis A., Ribalta C., Sanfélix V., Bezantakos S., Biskos G., Vulpoi A., Simion S., Monfort E., Viana M.
Figure S1. (a) Particle number concentration and mean diameter and (b) size segregated particle mass
concentrations, in the near field location for booth #3 (28-04-2017).
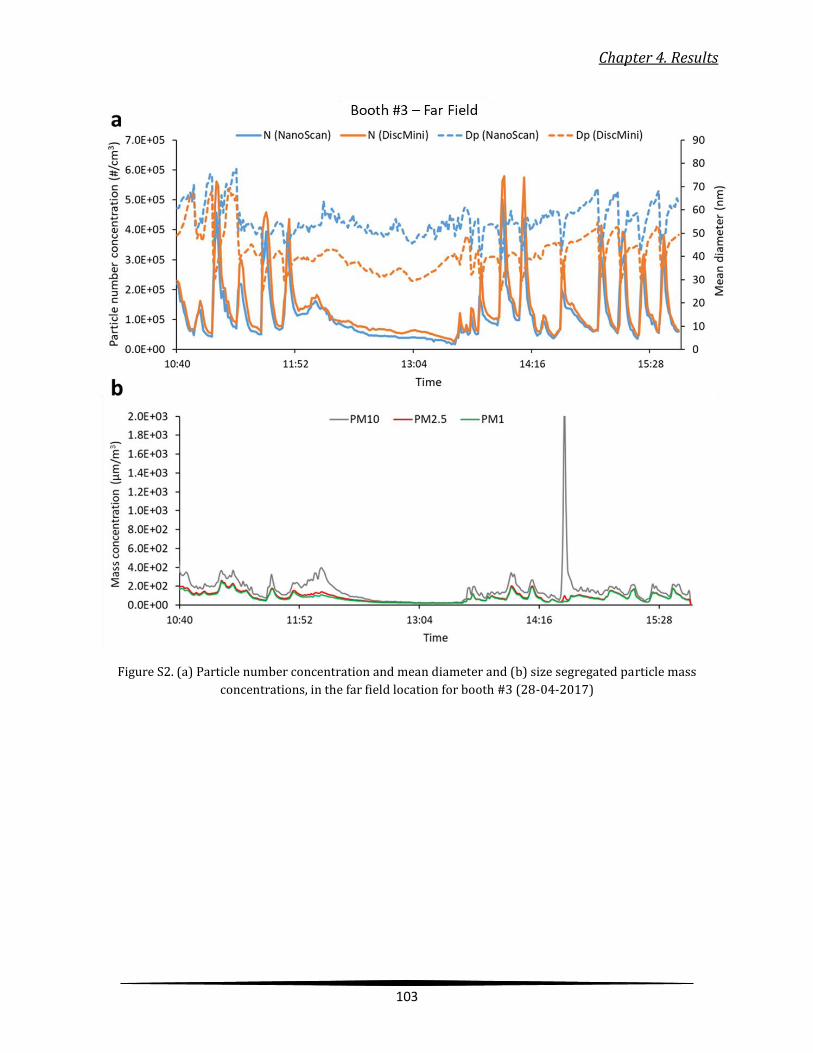
Chapter 4. Results
103
Figure S2. (a) Particle number concentration and mean diameter and (b) size segregated particle mass
concentrations, in the far field location for booth #3 (28-04-2017)
Chapter 4. Results
104
Figure S3 Particle number concentration and mean diameter and (b) size segregated particle mass
concentrations, in the near field location for booth #2 (24-04-2017).
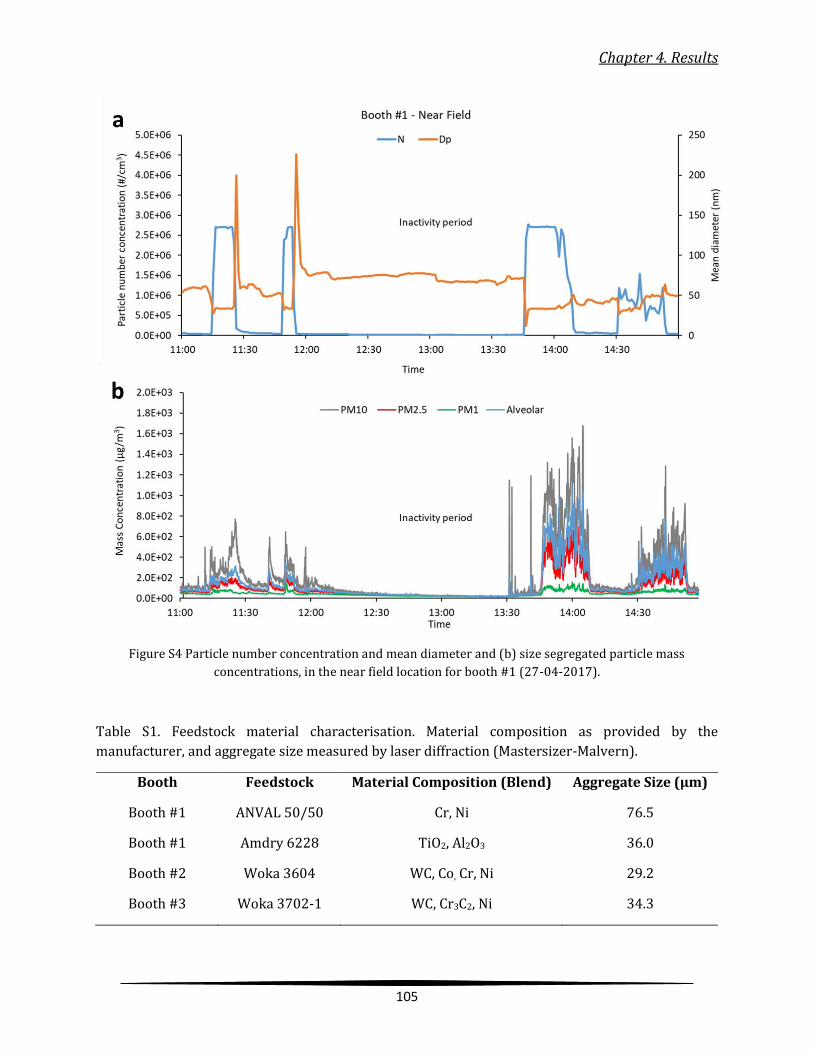
Chapter 4. Results
105
Figure S4 Particle number concentration and mean diameter and (b) size segregated particle mass
concentrations, in the near field location for booth #1 (27-04-2017).
Table S1. Feedstock material characterisation. Material composition as provided by the
manufacturer, and aggregate size measured by laser diffraction (Mastersizer-Malvern).
Booth Feedstock Material Composition (Blend) Aggregate Size (µm)
Booth #1 ANVAL 50/50 Cr, Ni 76.5
Booth #1 Amdry 6228 TiO2, Al2O3 36.0
Booth #2 Woka 3604 WC, Co, Cr, Ni 29.2
Booth #3 Woka 3702-1 WC, Cr3C2, Ni 34.3
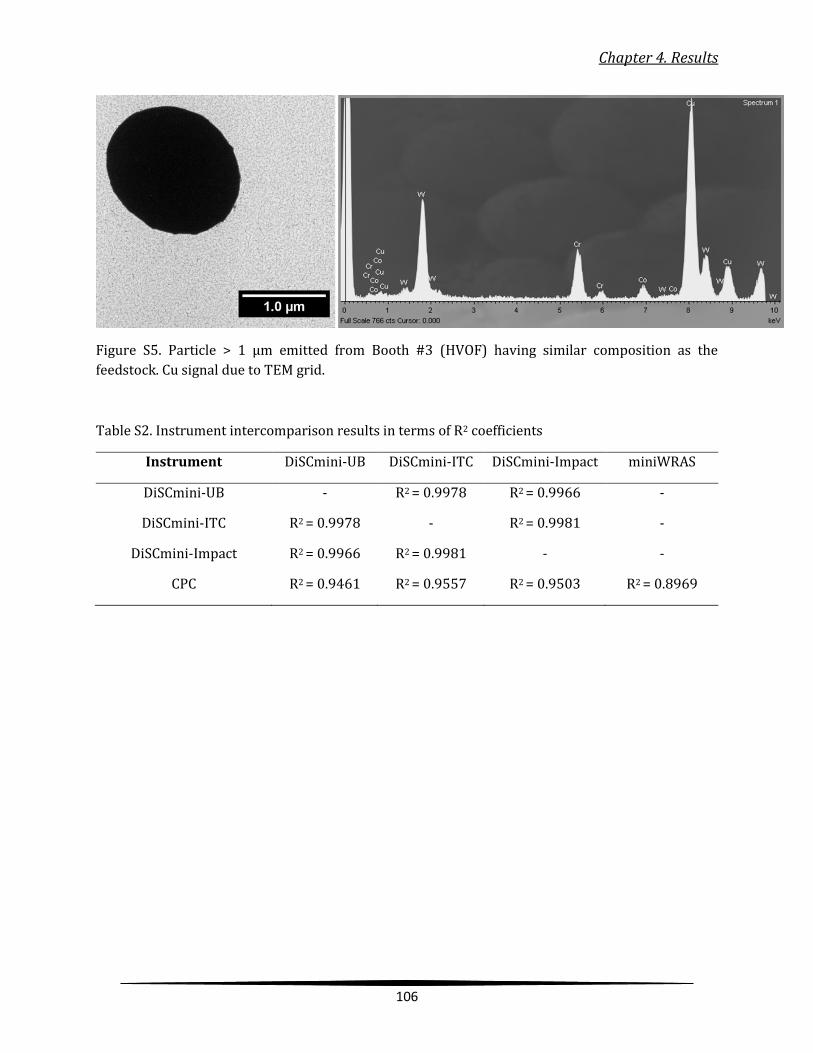
Chapter 4. Results
106
Figure S5. Particle > 1 µm emitted from Booth #3 (HVOF) having similar composition as the
feedstock. Cu signal due to TEM grid.
Table S2. Instrument intercomparison results in terms of R2 coefficients
Instrument DiSCmini-UB DiSCmini-ITC DiSCmini-Impact miniWRAS
DiSCmini-UB - R2 = 0.9978 R2 = 0.9966 -
DiSCmini-ITC R2 = 0.9978 - R2 = 0.9981 -
DiSCmini-Impact R2 = 0.9966 R2 = 0.9981 - -
CPC R2 = 0.9461 R2 = 0.9557 R2 = 0.9503 R2 = 0.8969
Chapter 4. Results
107
4.3. Scientific publication 3
Hygroscopic measurements and derived structural properties of
ultrafine particles emitted during thermal spraying
A. Salmatonidis1,2, M. Viana1, G. Biskos3,4, S. Bezantakos3,5
1Institute of Environmental Assessment and Water Research (IDAEA-CSIC), Barcelona, Spain
2Department of Chemical Engineering and Analytical Chemistry, Faculty of Chemistry, University of
Barcelona, Barcelona, Spain
3Energy Environment and Water Research Centre, The Cyprus Institute, Nicosia, Cyprus
4Faculty of Civil Engineering and Geosciences, Delft University of Technology, Delft, The Netherlands
5Université du Littoral Côte d' 'Opale, Dunkerque, France
Submitted to: Journal of Aerosol Science, under review
The following is the manuscript version, which was produced by the author, and submitted for
publication in the Journal of Aerosol Science (Elsevier): Submitted on 15 February 2019.
Chapter 4. Results
108
Hygroscopic measurements and derived structural properties of
ultrafine particles emitted during thermal spraying
A. Salmatonidis1,2, M. Viana1, G. Biskos3,4, S. Bezantakos3,5*
1Institute of Environmental Assessment and Water Research (IDAEA-CSIC), Barcelona, Spain
2Department of Chemical Engineering and Analytical Chemistry, Faculty of Chemistry, University of Barcelona,
Barcelona, Spain
3Energy Environment and Water Research Centre, The Cyprus Institute, Nicosia, Cyprus
4Faculty of Civil Engineering and Geosciences, Delft University of Technology, Delft, The Netherlands
5Université du Littoral Côte d' 'Opale, Dunkerque, France
*Corresponding author: Spyridon Bezantakos
Abstract
In this work we report measurements of the size, concentration, and hygroscopicity of ultrafine
particles (UFPs) emitted during thermal spraying of ceramic coatings in an industrial setting. High
emissions of agglomerated/aggregated UFPs (exhibiting concentrations higher than 106 cm-3) were
measured inside the spraying booths of the facilities, whereas modal analysis of the recorded size
distributions indicated that the particles had often diameters in the range of 26-90 nm. The emitted
UFPs were found to take up moderate amounts of water when exposed to elevated relative humidity
(87% RH), with their hygroscopicity being distinguishably lower compared to that of the
atmospheric background aerosol particles present in the breathing air. The hygroscopicity
measurements were further used to derive structural information of the aerosol particles emitted
during the thermal spraying process. More specifically, the primary particle number and size of the
emitted agglomerated/aggregated UFPs were derived based on the hygroscopic behaviour of the
sampled particles when exposed to 87% RH. Discrepancies between the primary particle sizes of the
agglomerated/aggregated UFPs estimated by the hygroscopicity measurements and those observed
by electron microscopy were attributed to their incomplete restructuring inside the HTDMA.
Keywords: exposure assessment; health risk; real-time characterization; particle growth; ceramic
nanoparticles.
Chapter 4. Results
109
1. Introduction
Release of airborne particles in the workplace air has become an issue of growing concern with
regard to worker exposure (Pietroiusti et al., 2018; Viitanen et al., 2017), mainly due to the well-
established adverse respiratory and cardiovascular impacts of ultrafine, fine and coarse particles
(Oberdörster, 2001; World Health Organization, 2016; Gakidou et al., 2017; Landrigan, 2017).
Ultrafine particles (UFPs) may be unintentionally emitted during different industrial processes such
as welding (Zhang et al., 2013), ceramic tile sintering (Fonseca et al., 2016), atmospheric plasma
spraying (Salmatonidis et al., 2019), laser ablation (Salmatonidis et al., 2018), or iron casting (van
Broekhuizen, 2017). Thermal spraying processes, such as atmospheric plasma spraying (APS) and
High Velocity Oxy-fuel (HVOF) have been associated with high UFP emissions (Salmatonidis et al.,
2019). Unintentional release of UFPs in industrial settings frequently results in high exposure
concentrations, which contrast with relatively low background particle concentrations (Fonseca et
al., 2015; Dahmann, 2016; van Broekhuizen, 2017). Nevertheless, distinguishing between the two
particle populations based on their intrinsic properties, is of primary importance for assessing their
potential toxicological and health effects (Ganguly et al., 2018; Limbach et al., 2007; Song et al., 2009).
Discriminating unintentionally-released UFPs (also referred to as process-generated or incidental
particles) from background aerosol particles using strategies based on spatially or temporally
distributed data are already reported in the literature (Kuhlbusch et al., 2011, 2009; Schill and
Chosewood, 2013; OECD, 2015; Asbach et al., 2016; Dahmann, 2016). Most of the studies applying
similar approaches quantify background and UFP sources in terms of aerosol metrics such as particle
number or mass concentrations (Ono-Ogasawara et al., 2009; Peters et al., 2009; Asbach et al., 2012),
but not based on intrinsic particle properties. This is mainly due to the fact that most of the
instruments available for exposure monitoring use these metrics (Asbach et al., 2016), posing a
challenge for source identification and distinction of process-generated from background aerosol
particles; something that state-of-the-art aerosol instrumentation can achieve (Kalantzi and Biskos,
2014).
In this work we provide measurements of the size and concentration of aerosol particles in the
breathing air at a thermal spraying facility where UFPs were emitted under real-world operating
conditions. A Hygroscopic Tandem Differential Mobility Analyzer (HTDMA; Rader and McMurry,
1986) was also utilized to probe the hygroscopicity of the UFPs (i.e., their ability to take up water
upon exposure to elevated water vapor concentrations) as well as the mixing state of the sampled
aerosol. These are two intrinsic aerosol properties that define the deposition behavior of inhaled
aerosol particles in the human respiratory system (Löndahl et al., 2007; Ching and Kajino, 2018) and
consequently the associated health effects.
Another application of the HTDMA measurements carried out in this work involves the identification
of particles with irregular morphology (aggregates or/and agglomerates) as their shape can change
to that of more compact structures at elevated relative humidity (RH) conditions during the
measurement. This phenomenon is manifested as an apparent shrinking of the particles when
exposed to elevated RH. Such observations have been reported for non-spherical but hygroscopic
particles (e.g., sodium chloride particles; Krämer et al., 2000; Biskos et al., 2006), as well as for
hydrophobic non-spherical aggregates (e.g., soot particles; Weingartner et al., 1995; Tritscher et al.,
Chapter 4. Results
110
2011). In this work, we connect apparent shrinking (i.e., measured by the HTDMA) of the
aggregated/agglomerated particles emitted by thermal spraying, with the primary particle number
and diameter of the aggregates, and qualitatively compare the results with measurements by
Transmission Electron Microscopy (TEM).
2. Experimental
Particle concentrations were monitored during thermal spraying at an industrial-scale precision
engineering workshop (T.M. Comas, Blanes, Spain). The measurements were carried out over a 4-day
period, and were representative of the usual operating conditions in the plant. The facility had three
thermal spraying booths located in an area of approximately 240 m2 (14 m wide and 17 m in length)
that includes also a storage and a central area (cf. Figure S1 in the Electronic Supplementary
Information; ESI). Different spraying techniques were used in each of the booths (cf. Figure S1). Booth
#1 housed an Atmospheric Plasma Spraying (APS) system, characterised by high temperatures (5-
20×103 ºC) and relatively low projection velocities (200-500 m/s), that was used to spray TiO2-Al2O3
or Cr-Ni powder blends having mean grain diameters of 36.0 and 76.5 µm, respectively. At the very
high temperatures that are developed during APS, the feedstock is melted and driven through the
formed jet towards the workpiece, i.e., the surface being coated (Pawlowski, 2008). Between the
plasma gun and the workpiece, metal vapors are oxidized by entrained air and condense in the cold
zone of the jet (Fauchais et al., 2001; Mauer et al., 2011; Planche et al., 2003), a mechanism that results
in nanoparticle formation (cf. Figure S8a in the ESI). According to this mechanism, the primary
nanoparticles emitted by APS should principally have spherical shapes as they mainly originate from
condensation of gaseous or liquid precursors.
The other spraying booth (located in booth #3; cf. Figure S8b in the ESI) housed a High Velocity Oxy-
Fuel coating spraying (HVOF) system, characterised by high velocities (425-1500 m/s) and lower
temperatures (2.9×10³ ºC), in which a WC-Cr3C2-Ni powder blend (mean grain diameter of 34 µm)
was used as feedstock. During HVOF, feedstock particles with high kinetic energies are sprayed onto
the metal surface of the workpiece. In this case the feedstock material is not entirely melted as the
temperatures are relatively lower, and it is driven with supersonic speeds towards the workpiece
(Pawlowski, 2008). Microscaled particles are in a solid-liquid two-phase droplet state when
impacting on their target, and thus are flattened during deposition (Li et al., 2004). Consequently,
particles from the HVOF mechanism are expected to have irregular shapes. An additional emission
route could be the fugitive emission of submicron particles, which would not be deposited on the
substrate as they would simply disperse inside the booth (Li and Christofides, 2006). We should note
here that booth #2 was not fully operational and its processes were not studied.
2.1. Monitoring locations and instrumentation
Particle concentrations were monitored inside two spraying booths (#1 and #3) where workers used
personal protective equipment (PPE). The following particle monitoring instrumentation was
deployed:
Chapter 4. Results
111
- A custom-made HTDMA (cf. Figure S2 in the ESI) system was used to measure the
hygroscopicity of the sampled particles. The instrument consisted of two custom-made
Differential Mobility Analyzers (DMAs; Knutson and Whitby, 1975) and a Condensation
Particle Counter (CPC; TSI 3010 CPC; Agarwal and Sem, 1980). The first DMA (DMA-1) of the
system was used for selecting nearly monodisperse dried particles, which were then exposed
to elevated RH conditions, before their size distribution was measured by the second DMA
(DMA-2) and the CPC (cf. more details in ESI). The system was operated with sheath and
aerosol flow rates of 3.0 and 0.3 L/min, respectively, and for both of them the RH was
controlled to 87% in order to avoid RH non-uniformities through the systems that can lead
to experimental artefacts (cf. ESI; Biskos et al., 2006; Bezantakos et al., 2016). The sampling
time of the instrument was 180 s, and the voltage of DMA-1 was changed every 6 minutes
(i.e., every two sampling periods) in order to sequentially select particles having dry electrical
mobility diameters of either 30 or 90 nm. These sizes were selected as they are representative
of the particles produced by the plasma spraying processes (Salmatonidis et al., 2019). The
instrument was deployed in the worker area, sampling directly from spraying booths #1 and
#3, except from a short period of ca. 2 hours before the end of the campaign during which it
sampled from the storage area outside booth #3.
- A NanoScan Scanning Mobility Particle Sizer (NanoScan-SMPS; TSI Model 3910), was used to
measure the particle size distribution (10-420 nm) in 13 channels with a 1-min time
resolution. Similarly to the HTDMA, the NanoScan-SMPS was in the worker area but was
sampling inside the spraying booths through 3-m long conductive tubing inlets. The
NanoScan-SMPS data were converted to particle size distributions, based on mobility
diameters.
- A particle sampling system cassette (SKC, inlet diameter 1/8 inch), which housed
transmission electron microscope (TEM) grids attached on filter support pads (25 mm in
diameter), was used to collect particles for offline characterisation. The system employed an
SKC Leland pump that was operated at a flow of 5 L/min. The grids (Agar Scientific Quantifoil
200 Mesh Au) were analysed offline for morphological and physicochemical particle
characterisation using a TEM (Jeol, JEM 1220, Tokyo, Japan) coupled with an Energy-
Dispersive X-ray (EDX; Oxford Instruments) spectrometer, following a similar procedure as
described elsewhere (Voliotis et al., 2014). Samples were collected inside all the spraying
booths, while TEM images were processed by the “ImageJ” software, version 1.52f.
2.2. Deriving the number and size of primary particles from the HTDMA measurements
The hygroscopic behavior of aerosol particles sampled by the HTDMA and exposed to high RH
conditions can be expressedby their hygroscopic factor given by:
g(RH)=𝑑𝑚(RH)
dm,dry , (1)
where dm(RH) and dm,dry are the geometric mean mobility diameters of the sampled particles at the
elevated RH (87%), measured by DMA-2 and the CPC, and at the dry state, measured as the mobility
diameter selected by DMA-1, respectively (cf. ESI for more details). Dried internally mixed particles
Chapter 4. Results
112
sampled by the HTDMA and exposed to the elevated RH conditions in the humidifier of the system
grow (or apparently shrink) to the same sizes as a result of water uptake, exhibiting a unimodal size
distribution when measured by DMA-2 and the CPC of the HTDMA. Externally mixed particles
sampled by the system, on the other hand, may grow (or apparently shrink) to different sizes
exhibiting either a wider unimodal or a bimodal size distribution in the measurements. To distinguish
between internally and externally mixed aerosol particles sampled by the HTDMA we employed the
“TDMAfit” algorithm (Bezantakos et al., 2013; McMurry and Stolzenburg, 1989; cf. Figure S3 in the
ESI).
The factor g is greater than unity when the particles grow upon exposure to the elevated RH
conditions, or less than unity when they exhibit apparent shrinking. Irregularly-shaped and
hydrophobic particles exposed to elevated RH (87%) in the HTDMA will most likely appear to shrink,
having g(RH) < 1 exhibiting an apparent shrinking (cf. Figure S4 in the ESI). The reason for this
behavior is that in the calculation of g(RH), the two electrical mobility diameters (i.e., dm(RH) and
dm,dry) correspond to spherical particles (cf. Equations S1-S3 in the ESI). However, the drag force
acting upon a moving irregularly-shaped particle during classification in the DMA is higher than that
of a spherical particle having the same volume.
Irregurarly-shaped particles produced by high-temperature processes in the gas phase are typically
aggregates or agglomerates of smaller (primary) particles. Here the term primary particle refers to
the smaller particulate component (building block) that forms an aggregate/agglomerate. While both
aggregate and agglomerate are interchangeably used in the literature we adopt the terminology
followed by Eggersdorfer et al., (2012b) depending on the nature of the forces that bind together the
primary particles. Thus an aggregate consists of primary particles that are held together by chemical
forces, while in an agglomerate these forces are of physical nature.
A number of models is available in the literature for relating the electrical mobility (i.e., the properties
of the particles measured at dry and humidified conditions by the HTDMA) of non-spherical, fractal-
like aggregates/agglomerates with their structural properties (i.e., number and size of the primary
particles they consist of; Sorensen, 2011). More established models are available for the free
molecular regime (Chan and Dahneke, 1981; Rogak and Flagan, 1993 Lall and Friedlander, 2006;
Eggersdorfer et al., 2012b), which is defined by the Knudsen number (i.e., ratio between the gas mean
free path to the radius of the primary particles; cf. ESI). Since however, DMAs, which are commonly
used for measuring the electrical mobility of particles operate in the transition regime, the above
mentioned methods most likely will not give accurate results (Thajudeen et al., 2015).
Attempts to develop models for relating the structural properties of fractal-like particles with their
electrical mobility (e.g., Melas et al., 2014; Corson et al., 2017), which were based on the adjusted
sphere method (Dahneke ,1973; Zhang et al., 2012), were introduced in order to cover their behavior
in the transition regime. Among these models, we found more suitable the one proposed by Corson
et al. (2017), the results of which compare well with the adjusted sphere method for a wide range of
primary particle sizes and number (cf. Corson et al., 2017 for more details).
In this analytical equation the friction coefficient of an aggregate/agglomerate (ζagg) is related to the
number of primary particles (N) and the size of the primary particles via:
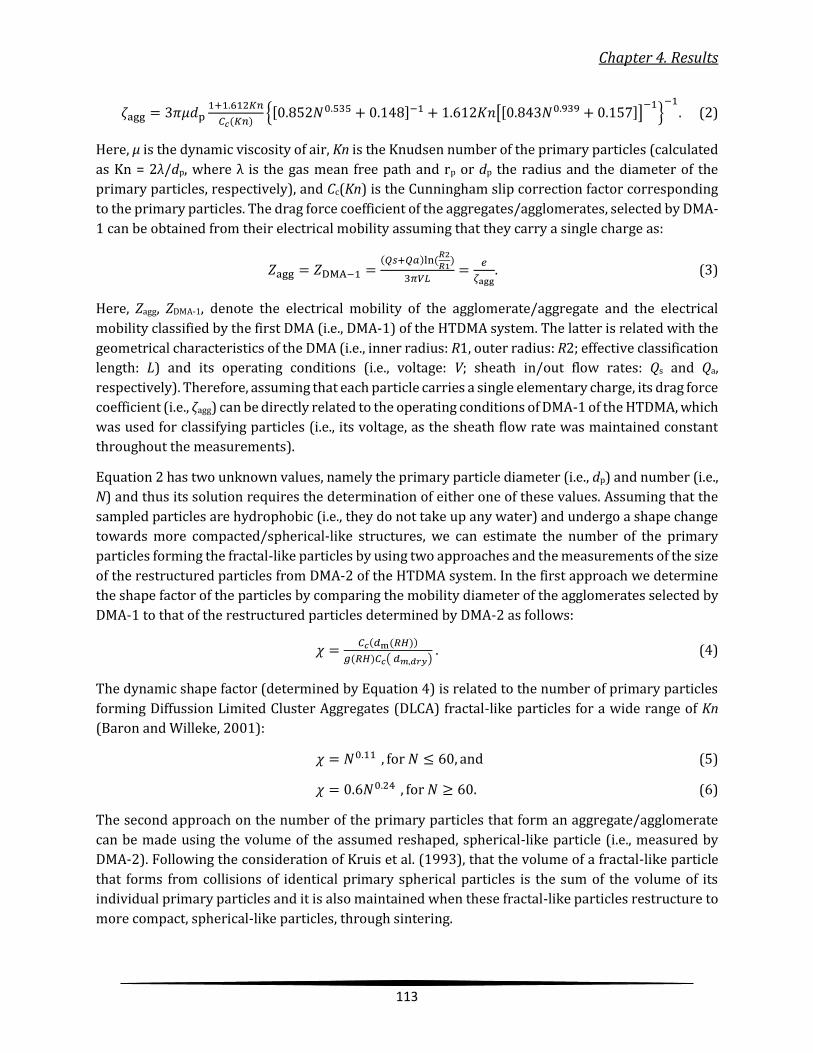
Chapter 4. Results
113
𝜁agg = 3𝜋𝜇𝑑p1+1.612𝐾𝑛
𝐶𝑐(𝐾𝑛){[0.852𝑁0.535 + 0.148]−1 + 1.612𝐾𝑛[[0.843𝑁0.939 + 0.157]]
−1}
−1. (2)
Here, μ is the dynamic viscosity of air, Kn is the Knudsen number of the primary particles (calculated
as Kn = 2λ/dp, where λ is the gas mean free path and rp or dp the radius and the diameter of the
primary particles, respectively), and Cc(Kn) is the Cunningham slip correction factor corresponding
to the primary particles. The drag force coefficient of the aggregates/agglomerates, selected by DMA-
1 can be obtained from their electrical mobility assuming that they carry a single charge as:
𝑍agg = 𝑍DMA−1 =(𝑄𝑠+𝑄𝑎)ln (
𝑅2
𝑅1)
3𝜋𝑉𝐿=
𝑒
𝜁agg. (3)
Here, Zagg, ZDMA-1, denote the electrical mobility of the agglomerate/aggregate and the electrical
mobility classified by the first DMA (i.e., DMA-1) of the HTDMA system. The latter is related with the
geometrical characteristics of the DMA (i.e., inner radius: R1, outer radius: R2; effective classification
length: L) and its operating conditions (i.e., voltage: V; sheath in/out flow rates: Qs and Qa,
respectively). Therefore, assuming that each particle carries a single elementary charge, its drag force
coefficient (i.e., ζagg) can be directly related to the operating conditions of DMA-1 of the HTDMA, which
was used for classifying particles (i.e., its voltage, as the sheath flow rate was maintained constant
throughout the measurements).
Equation 2 has two unknown values, namely the primary particle diameter (i.e., dp) and number (i.e.,
N) and thus its solution requires the determination of either one of these values. Assuming that the
sampled particles are hydrophobic (i.e., they do not take up any water) and undergo a shape change
towards more compacted/spherical-like structures, we can estimate the number of the primary
particles forming the fractal-like particles by using two approaches and the measurements of the size
of the restructured particles from DMA-2 of the HTDMA system. In the first approach we determine
the shape factor of the particles by comparing the mobility diameter of the agglomerates selected by
DMA-1 to that of the restructured particles determined by DMA-2 as follows:
𝜒 =𝐶𝑐(𝑑m(𝑅𝐻))
𝑔(𝑅𝐻)𝐶𝑐( 𝑑𝑚,𝑑𝑟𝑦) . (4)
The dynamic shape factor (determined by Equation 4) is related to the number of primary particles
forming Diffussion Limited Cluster Aggregates (DLCA) fractal-like particles for a wide range of Kn
(Baron and Willeke, 2001):
𝜒 = 𝑁0.11 , for 𝑁 ≤ 60, and (5)
𝜒 = 0.6𝑁0.24 , for 𝑁 ≥ 60. (6)
The second approach on the number of the primary particles that form an aggregate/agglomerate
can be made using the volume of the assumed reshaped, spherical-like particle (i.e., measured by
DMA-2). Following the consideration of Kruis et al. (1993), that the volume of a fractal-like particle
that forms from collisions of identical primary spherical particles is the sum of the volume of its
individual primary particles and it is also maintained when these fractal-like particles restructure to
more compact, spherical-like particles, through sintering.
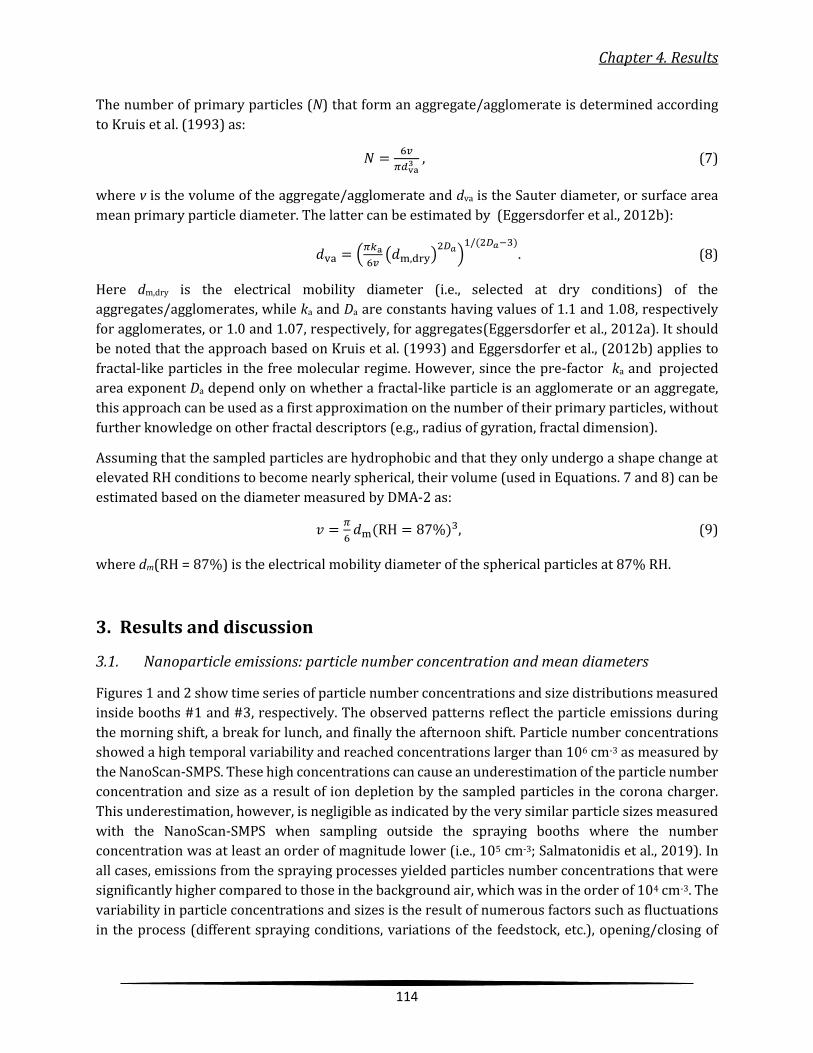
Chapter 4. Results
114
The number of primary particles (N) that form an aggregate/agglomerate is determined according
to Kruis et al. (1993) as:
𝑁 =6𝑣
𝜋𝑑va3 , (7)
where v is the volume of the aggregate/agglomerate and dva is the Sauter diameter, or surface area
mean primary particle diameter. The latter can be estimated by (Eggersdorfer et al., 2012b):
𝑑va = (𝜋𝑘a
6𝑣(𝑑m,dry)
2𝐷𝑎)
1/(2𝐷𝑎−3). (8)
Here dm,dry is the electrical mobility diameter (i.e., selected at dry conditions) of the
aggregates/agglomerates, while ka and Da are constants having values of 1.1 and 1.08, respectively
for agglomerates, or 1.0 and 1.07, respectively, for aggregates(Eggersdorfer et al., 2012a). It should
be noted that the approach based on Kruis et al. (1993) and Eggersdorfer et al., (2012b) applies to
fractal-like particles in the free molecular regime. However, since the pre-factor ka and projected
area exponent Da depend only on whether a fractal-like particle is an agglomerate or an aggregate,
this approach can be used as a first approximation on the number of their primary particles, without
further knowledge on other fractal descriptors (e.g., radius of gyration, fractal dimension).
Assuming that the sampled particles are hydrophobic and that they only undergo a shape change at
elevated RH conditions to become nearly spherical, their volume (used in Equations. 7 and 8) can be
estimated based on the diameter measured by DMA-2 as:
𝑣 =𝜋
6𝑑m(RH = 87%)3, (9)
where dm(RH = 87%) is the electrical mobility diameter of the spherical particles at 87% RH.
3. Results and discussion
3.1. Nanoparticle emissions: particle number concentration and mean diameters
Figures 1 and 2 show time series of particle number concentrations and size distributions measured
inside booths #1 and #3, respectively. The observed patterns reflect the particle emissions during
the morning shift, a break for lunch, and finally the afternoon shift. Particle number concentrations
showed a high temporal variability and reached concentrations larger than 106 cm-3 as measured by
the NanoScan-SMPS. These high concentrations can cause an underestimation of the particle number
concentration and size as a result of ion depletion by the sampled particles in the corona charger.
This underestimation, however, is negligible as indicated by the very similar particle sizes measured
with the NanoScan-SMPS when sampling outside the spraying booths where the number
concentration was at least an order of magnitude lower (i.e., 105 cm-3; Salmatonidis et al., 2019). In
all cases, emissions from the spraying processes yielded particles number concentrations that were
significantly higher compared to those in the background air, which was in the order of 104 cm-3. The
variability in particle concentrations and sizes is the result of numerous factors such as fluctuations
in the process (different spraying conditions, variations of the feedstock, etc.), opening/closing of
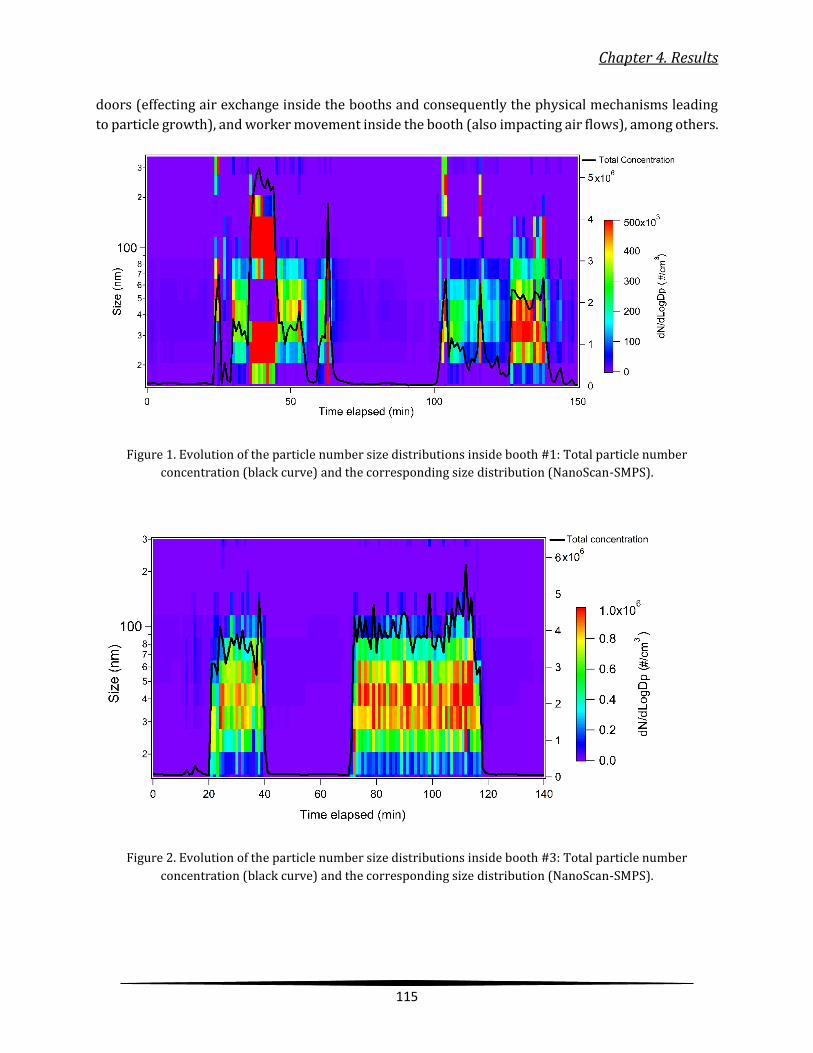
Chapter 4. Results
115
doors (effecting air exchange inside the booths and consequently the physical mechanisms leading
to particle growth), and worker movement inside the booth (also impacting air flows), among others.
Figure 1. Evolution of the particle number size distributions inside booth #1: Total particle number
concentration (black curve) and the corresponding size distribution (NanoScan-SMPS).
Figure 2. Evolution of the particle number size distributions inside booth #3: Total particle number
concentration (black curve) and the corresponding size distribution (NanoScan-SMPS).
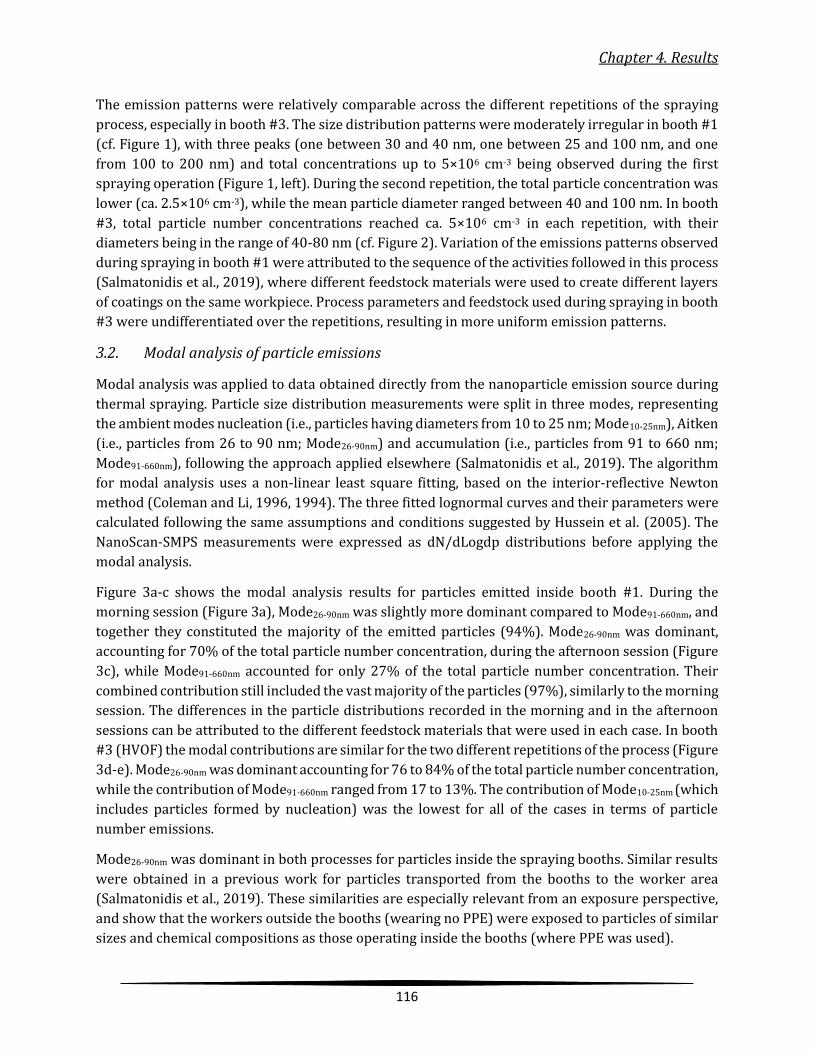
Chapter 4. Results
116
The emission patterns were relatively comparable across the different repetitions of the spraying
process, especially in booth #3. The size distribution patterns were moderately irregular in booth #1
(cf. Figure 1), with three peaks (one between 30 and 40 nm, one between 25 and 100 nm, and one
from 100 to 200 nm) and total concentrations up to 5×106 cm-3 being observed during the first
spraying operation (Figure 1, left). During the second repetition, the total particle concentration was
lower (ca. 2.5×106 cm-3), while the mean particle diameter ranged between 40 and 100 nm. In booth
#3, total particle number concentrations reached ca. 5×106 cm-3 in each repetition, with their
diameters being in the range of 40-80 nm (cf. Figure 2). Variation of the emissions patterns observed
during spraying in booth #1 were attributed to the sequence of the activities followed in this process
(Salmatonidis et al., 2019), where different feedstock materials were used to create different layers
of coatings on the same workpiece. Process parameters and feedstock used during spraying in booth
#3 were undifferentiated over the repetitions, resulting in more uniform emission patterns.
3.2. Modal analysis of particle emissions
Modal analysis was applied to data obtained directly from the nanoparticle emission source during
thermal spraying. Particle size distribution measurements were split in three modes, representing
the ambient modes nucleation (i.e., particles having diameters from 10 to 25 nm; Mode10-25nm), Aitken
(i.e., particles from 26 to 90 nm; Mode26-90nm) and accumulation (i.e., particles from 91 to 660 nm;
Mode91-660nm), following the approach applied elsewhere (Salmatonidis et al., 2019). The algorithm
for modal analysis uses a non-linear least square fitting, based on the interior-reflective Newton
method (Coleman and Li, 1996, 1994). The three fitted lognormal curves and their parameters were
calculated following the same assumptions and conditions suggested by Hussein et al. (2005). The
NanoScan-SMPS measurements were expressed as dN/dLogdp distributions before applying the
modal analysis.
Figure 3a-c shows the modal analysis results for particles emitted inside booth #1. During the
morning session (Figure 3a), Mode26-90nm was slightly more dominant compared to Mode91-660nm, and
together they constituted the majority of the emitted particles (94%). Mode26-90nm was dominant,
accounting for 70% of the total particle number concentration, during the afternoon session (Figure
3c), while Mode91-660nm accounted for only 27% of the total particle number concentration. Their
combined contribution still included the vast majority of the particles (97%), similarly to the morning
session. The differences in the particle distributions recorded in the morning and in the afternoon
sessions can be attributed to the different feedstock materials that were used in each case. In booth
#3 (HVOF) the modal contributions are similar for the two different repetitions of the process (Figure
3d-e). Mode26-90nm was dominant accounting for 76 to 84% of the total particle number concentration,
while the contribution of Mode91-660nm ranged from 17 to 13%. The contribution of Mode10-25nm (which
includes particles formed by nucleation) was the lowest for all of the cases in terms of particle
number emissions.
Mode26-90nm was dominant in both processes for particles inside the spraying booths. Similar results
were obtained in a previous work for particles transported from the booths to the worker area
(Salmatonidis et al., 2019). These similarities are especially relevant from an exposure perspective,
and show that the workers outside the booths (wearing no PPE) were exposed to particles of similar
sizes and chemical compositions as those operating inside the booths (where PPE was used).
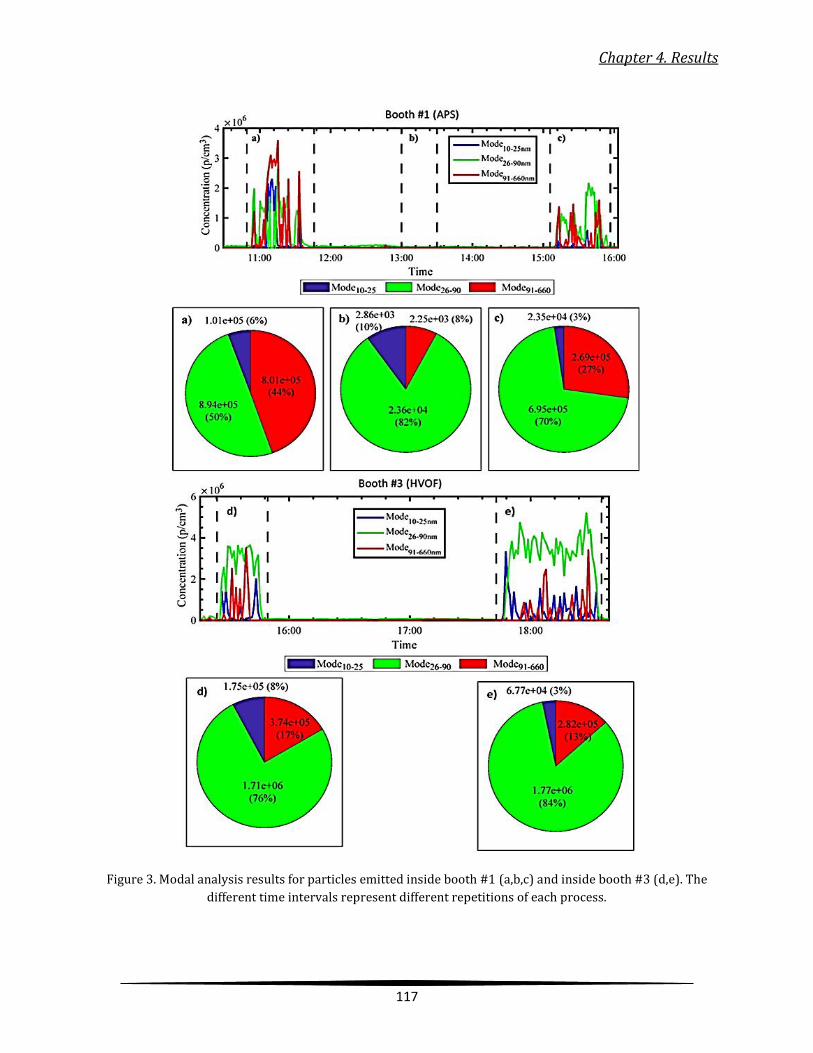
Chapter 4. Results
117
Figure 3. Modal analysis results for particles emitted inside booth #1 (a,b,c) and inside booth #3 (d,e). The
different time intervals represent different repetitions of each process.
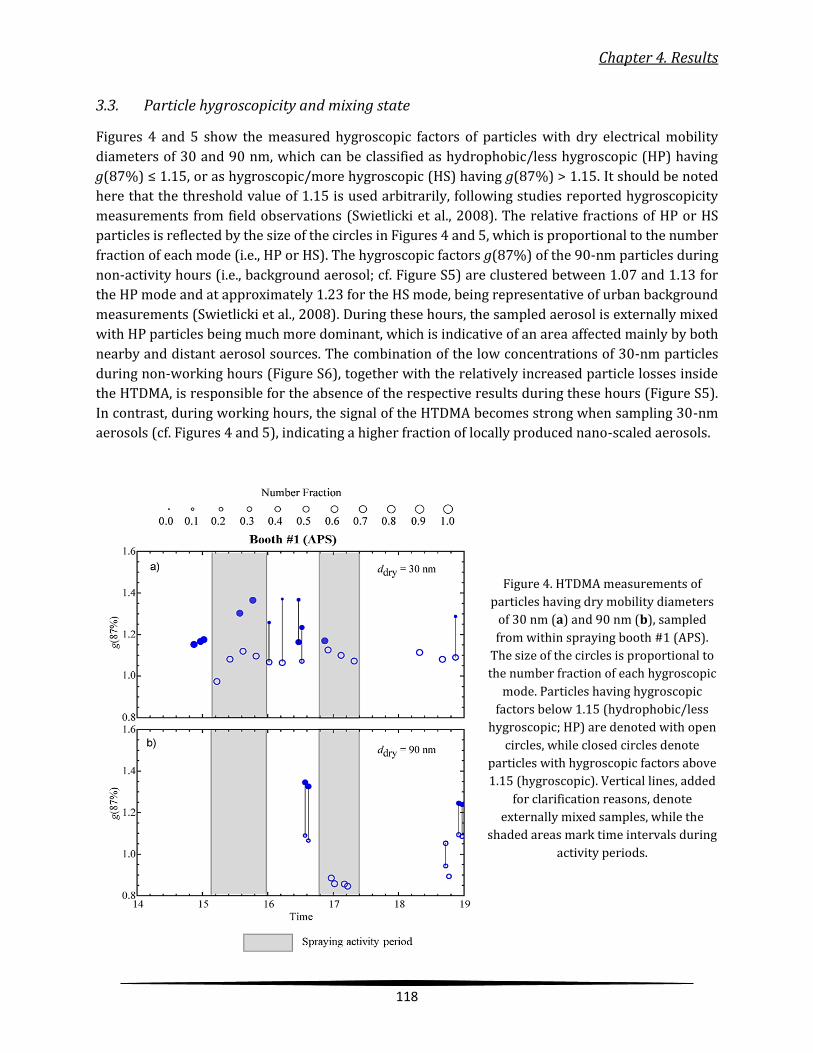
Chapter 4. Results
118
3.3. Particle hygroscopicity and mixing state
Figures 4 and 5 show the measured hygroscopic factors of particles with dry electrical mobility
diameters of 30 and 90 nm, which can be classified as hydrophobic/less hygroscopic (HP) having
g(87%) ≤ 1.15, or as hygroscopic/more hygroscopic (HS) having g(87%) > 1.15. It should be noted
here that the threshold value of 1.15 is used arbitrarily, following studies reported hygroscopicity
measurements from field observations (Swietlicki et al., 2008). The relative fractions of HP or HS
particles is reflected by the size of the circles in Figures 4 and 5, which is proportional to the number
fraction of each mode (i.e., HP or HS). The hygroscopic factors g(87%) of the 90-nm particles during
non-activity hours (i.e., background aerosol; cf. Figure S5) are clustered between 1.07 and 1.13 for
the HP mode and at approximately 1.23 for the HS mode, being representative of urban background
measurements (Swietlicki et al., 2008). During these hours, the sampled aerosol is externally mixed
with HP particles being much more dominant, which is indicative of an area affected mainly by both
nearby and distant aerosol sources. The combination of the low concentrations of 30-nm particles
during non-working hours (Figure S6), together with the relatively increased particle losses inside
the HTDMA, is responsible for the absence of the respective results during these hours (Figure S5).
In contrast, during working hours, the signal of the HTDMA becomes strong when sampling 30-nm
aerosols (cf. Figures 4 and 5), indicating a higher fraction of locally produced nano-scaled aerosols.
Figure 4. HTDMA measurements of
particles having dry mobility diameters
of 30 nm (a) and 90 nm (b), sampled
from within spraying booth #1 (APS).
The size of the circles is proportional to
the number fraction of each hygroscopic
mode. Particles having hygroscopic
factors below 1.15 (hydrophobic/less
hygroscopic; HP) are denoted with open
circles, while closed circles denote
particles with hygroscopic factors above
1.15 (hygroscopic). Vertical lines, added
for clarification reasons, denote
externally mixed samples, while the
shaded areas mark time intervals during
activity periods.
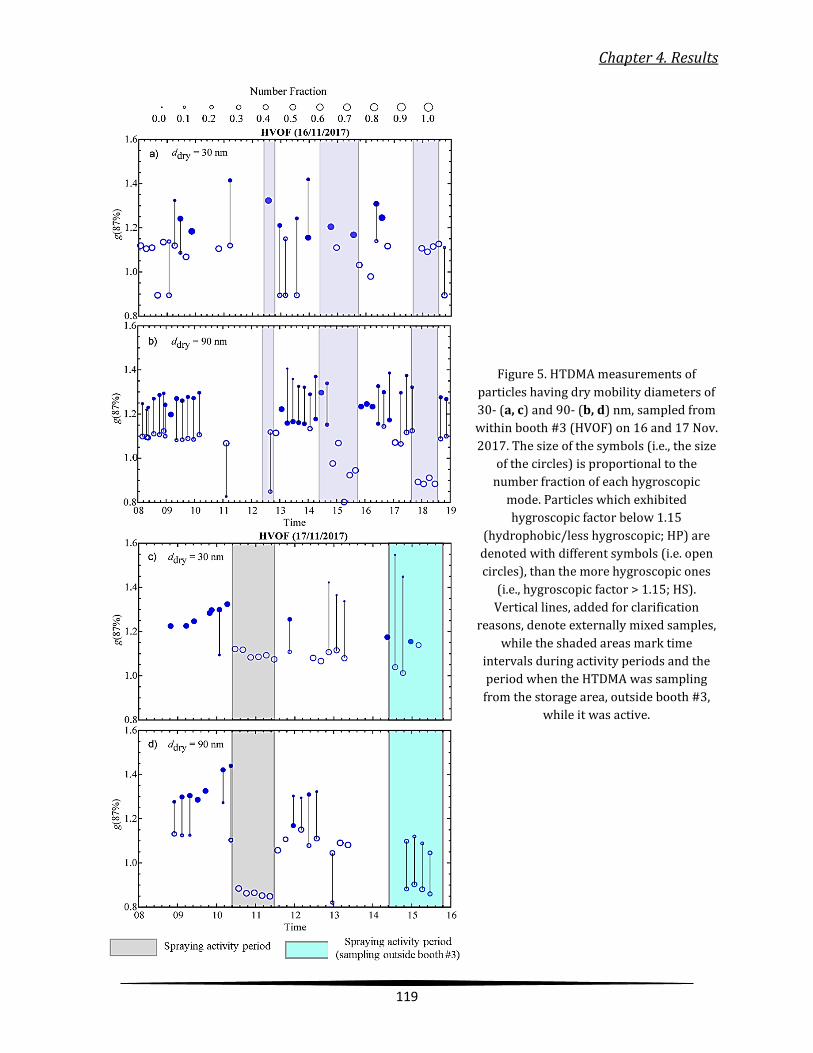
Chapter 4. Results
119
Figure 5. HTDMA measurements of
particles having dry mobility diameters of
30- (a, c) and 90- (b, d) nm, sampled from
within booth #3 (HVOF) on 16 and 17 Nov.
2017. The size of the symbols (i.e., the size
of the circles) is proportional to the
number fraction of each hygroscopic
mode. Particles which exhibited
hygroscopic factor below 1.15
(hydrophobic/less hygroscopic; HP) are
denoted with different symbols (i.e. open
circles), than the more hygroscopic ones
(i.e., hygroscopic factor > 1.15; HS).
Vertical lines, added for clarification
reasons, denote externally mixed samples,
while the shaded areas mark time
intervals during activity periods and the
period when the HTDMA was sampling
from the storage area, outside booth #3,
while it was active.
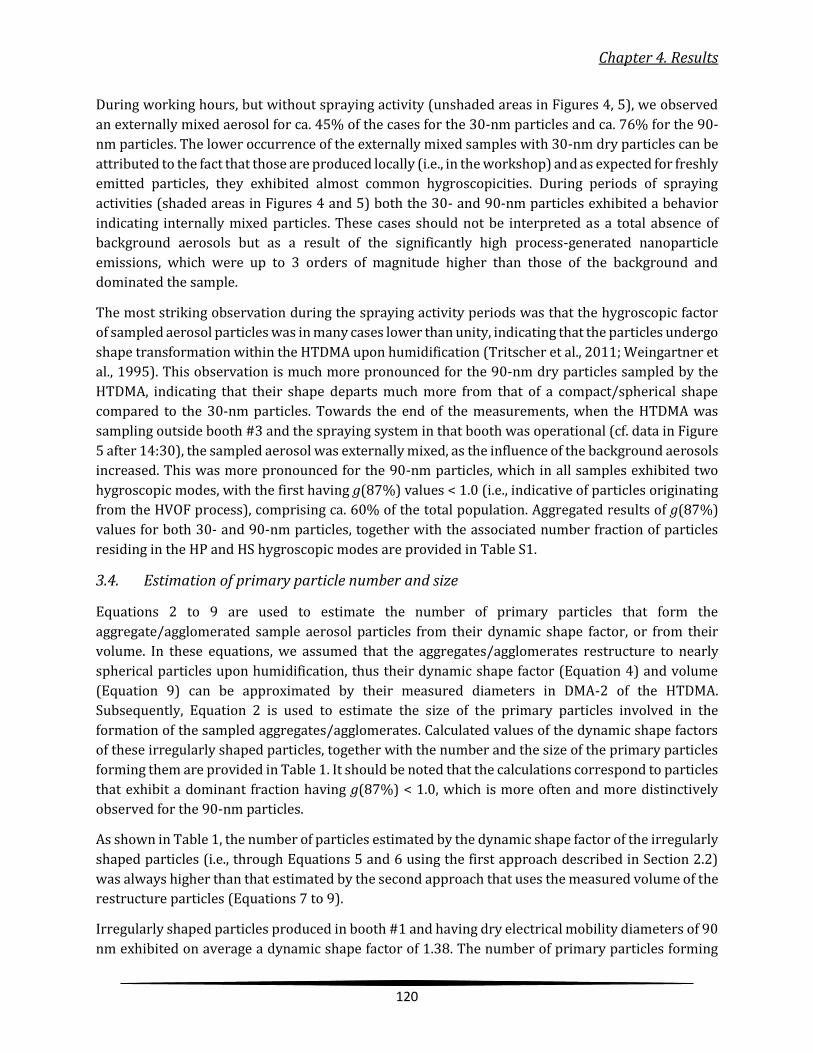
Chapter 4. Results
120
During working hours, but without spraying activity (unshaded areas in Figures 4, 5), we observed
an externally mixed aerosol for ca. 45% of the cases for the 30-nm particles and ca. 76% for the 90-
nm particles. The lower occurrence of the externally mixed samples with 30-nm dry particles can be
attributed to the fact that those are produced locally (i.e., in the workshop) and as expected for freshly
emitted particles, they exhibited almost common hygroscopicities. During periods of spraying
activities (shaded areas in Figures 4 and 5) both the 30- and 90-nm particles exhibited a behavior
indicating internally mixed particles. These cases should not be interpreted as a total absence of
background aerosols but as a result of the significantly high process-generated nanoparticle
emissions, which were up to 3 orders of magnitude higher than those of the background and
dominated the sample.
The most striking observation during the spraying activity periods was that the hygroscopic factor
of sampled aerosol particles was in many cases lower than unity, indicating that the particles undergo
shape transformation within the HTDMA upon humidification (Tritscher et al., 2011; Weingartner et
al., 1995). This observation is much more pronounced for the 90-nm dry particles sampled by the
HTDMA, indicating that their shape departs much more from that of a compact/spherical shape
compared to the 30-nm particles. Towards the end of the measurements, when the HTDMA was
sampling outside booth #3 and the spraying system in that booth was operational (cf. data in Figure
5 after 14:30), the sampled aerosol was externally mixed, as the influence of the background aerosols
increased. This was more pronounced for the 90-nm particles, which in all samples exhibited two
hygroscopic modes, with the first having g(87%) values < 1.0 (i.e., indicative of particles originating
from the HVOF process), comprising ca. 60% of the total population. Aggregated results of g(87%)
values for both 30- and 90-nm particles, together with the associated number fraction of particles
residing in the HP and HS hygroscopic modes are provided in Table S1.
3.4. Estimation of primary particle number and size
Equations 2 to 9 are used to estimate the number of primary particles that form the
aggregate/agglomerated sample aerosol particles from their dynamic shape factor, or from their
volume. In these equations, we assumed that the aggregates/agglomerates restructure to nearly
spherical particles upon humidification, thus their dynamic shape factor (Equation 4) and volume
(Equation 9) can be approximated by their measured diameters in DMA-2 of the HTDMA.
Subsequently, Equation 2 is used to estimate the size of the primary particles involved in the
formation of the sampled aggregates/agglomerates. Calculated values of the dynamic shape factors
of these irregularly shaped particles, together with the number and the size of the primary particles
forming them are provided in Table 1. It should be noted that the calculations correspond to particles
that exhibit a dominant fraction having g(87%) < 1.0, which is more often and more distinctively
observed for the 90-nm particles.
As shown in Table 1, the number of particles estimated by the dynamic shape factor of the irregularly
shaped particles (i.e., through Equations 5 and 6 using the first approach described in Section 2.2)
was always higher than that estimated by the second approach that uses the measured volume of the
restructure particles (Equations 7 to 9).
Irregularly shaped particles produced in booth #1 and having dry electrical mobility diameters of 90
nm exhibited on average a dynamic shape factor of 1.38. The number of primary particles forming

Chapter 4. Results
121
the observed aggregates/agglomerates is estimated on average to be 6, using approach of
Eggersdorfer et al. (2012b) and 23 based on approach using the estimated dynamic shape factors
(Baron and Willeke, 2001). This difference resulted in estimated mean size of these primary particles
of ca. 41 and 27 nm with the first and later approach, respectively. Only one sample of particles with
dry electrical mobility diameters of 30 nm was found to have irregular shape, exhibiting a dynamic
shape factor of 1.05, consisting of 2 primary particles with sizes of ca. 21 nm (i.e., estimated by both
approaches). When the process in booth #1 was active, the majority of the 30-nm particles samples
(6 out of 7) exhibited g(87%) values very close to 1. The latter suggests that 30-nm particles from
booth #1 comprise a low number of primary particles, and have a more compact/spherical shape at
dry conditions. As a result, they do not undergo significant restructuring upon humidification, in
contrast to their 90-nm counterparts.
Table 1. Results showing the average and standard deviation of the estimated dynamic shape factor χ of the
irregularly shaped particles, together with the number N of the primary particles they consist of, derived from
the two approaches described in section 2.2. The primary particle size is then derived using the above
estimated primary particle numbers and the drag force coefficient of the irregular shape aerosols for the
transition regime (Equation 2).
Appr. 1 Appr. 2 Appr. 1 Appr. 2
Booth dm,dry
(nm) χ N N dp dp
Agg
lom
erat
es #1 30 1.05 ± 0.00 2 ± 0 2 ± 0 21.2±0.0 21.2±0.0
#1 90 1.38 ± 0.16 23 ± 25 6 ± 3 26.8±8.6 41.0±7.0
#3 30 1.20 ± 0.08 6 ± 2 3 ± 1 13.8±3.2 18.2±1.4
#3 90 1.28 ± 0.12 13 ± 14 5 ± 2 34.6±12.0 47.4±8.4
Agg
rega
tes
#1 30 1.05 ± 0.00 2 ± 0 1 ± 0 21.2±0.0 28.0±0.0
#1 90 1.38 ± 0.16 23 ± 25 4 ± 2 26.4±8.6 48.6±8.2
#3 30 1.20 ± 0.08 6 ± 2 2 ± 1 13.8±3.6 22.2±2.8
#3 90 1.28 ± 0.13 13 ± 14 3 ± 1 34.6±12.0 56.2±9.8
In booth #3, where the HTDMA sampled for more time, irregularly shaped particles having a dry
diameter of 90 nm exhibited an average dynamic shape factor of 1.28. The estimated number of
primary particles comprising these aggregates/agglomerates is estimated to be 5 and 13 on average,
depending on which approach is used. The respective estimated mean diameter of the primary
particles was ca. 47 and 35 nm. The detection frequency of irregularly shaped particles having dry
electrical mobility diameters of 30 nm, was also lower compared to that of the 90-nm particles when
the spraying process in booth #3 was active. However, the 30-nm aggregates/agglomerates were
detected more frequently in this case compared to when the spraying process in booth #1 was active
during working hours, exhibiting an average dynamic shape factor of 1.20. This yields that on average
the aggregates/agglomerates consist of 6 primary particles, with a mean size of ca. 14 nm, when the

Chapter 4. Results
122
first approach (based on the estimated dynamic shape factors) is used, or of ca. 3 primary particles
with an average size of ca. 18 nm when the second approach (based on the measured volume of the
restructured particles) is employed.
3.5 TEM analysis and comparison with HTDMA results
TEM images of particles collected inside booth #1 are shown in Figure 6a-b. Chain-like agglomerates
were observed across the TEM grid with different sizes and numbers of primary particles. It should
be noted that agglomerates may form on the grid during collection, and thus constitute a sampling
artefact. As a result, comparison of the structural properties of the sampled particles determined by
the TEM images and the HTDMA measurements can only be made in terms of the size of the primary
particles forming the aggregates/agglomerates, and not for the number of primary particles they
consist of.
Spherical or spheroid shape of primary particles, ranging from 5 to 20 nm, can be observed in the
TEM images of aggregates produced in booth #1 (Figure 6a-b), and their composition was found to
be similar to the feedstock material (cf. Figure S9). Compared to the calculations discussed in Section
3.4, the TEM images suggest that the size of primary particles comprising the 90-nm dry
agglomerates/aggregates was overestimated by the HTDMA measurements. Better agreement
between the TEM observations and the estimations of the primary particle size derived by the
HTDMA measurements is achieved when the first approach (based on the estimation of the shape
factor of the particles) is used. For the 30-nm particles, the estimated primary particle diameters
derived from the HTDMA data was similar to the ones observed by the TEM (ca. 20 nm). It should be
noted here, however, that the TEM images show polydisperse (i.e., not size selected)
aggregated/agglomerated particles collected during the spraying process, and thus making a direct
comparison for the case of the 30- and 90-nm particles analyzed by the HTDMA is impossible.
Nevertheless, the information of the size of the primary particles obtained by the two methods is
qualitatively comparable assuming that this does not differ much with the size of the
aggregates/agglomerates.
TEM images of particles sampled inside booth #3 during spraying are shown in Figure 6c-f.
Irregularly-shaped primary particles appear to be strongly aggregated, resembling nanoparticles
which have undergone mild sintering, and therefore it becomes challenging to distinguish them even
in the higher TEM magnification (Figure 6d). This could also be an indication that the particles were
directly emitted as aggregates, formed by high energy collisions, and not as single primary particles
which agglomerated/aggregated after released in the air. The chemical composition of the particles
emitted was similar to that if the micron-sized feedstock used (Figure S9), confirming thermal
spraying was the source of the sampled particles.
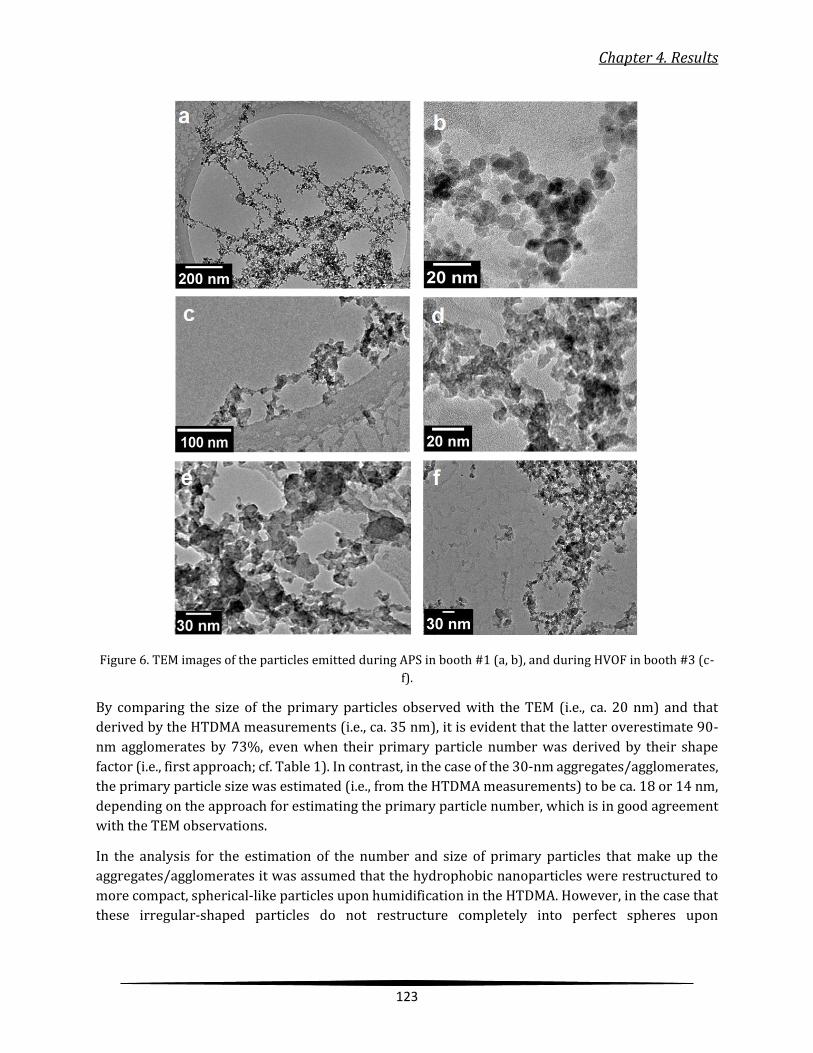
Chapter 4. Results
123
Figure 6. TEM images of the particles emitted during APS in booth #1 (a, b), and during HVOF in booth #3 (c-
f).
By comparing the size of the primary particles observed with the TEM (i.e., ca. 20 nm) and that
derived by the HTDMA measurements (i.e., ca. 35 nm), it is evident that the latter overestimate 90-
nm agglomerates by 73%, even when their primary particle number was derived by their shape
factor (i.e., first approach; cf. Table 1). In contrast, in the case of the 30-nm aggregates/agglomerates,
the primary particle size was estimated (i.e., from the HTDMA measurements) to be ca. 18 or 14 nm,
depending on the approach for estimating the primary particle number, which is in good agreement
with the TEM observations.
In the analysis for the estimation of the number and size of primary particles that make up the
aggregates/agglomerates it was assumed that the hydrophobic nanoparticles were restructured to
more compact, spherical-like particles upon humidification in the HTDMA. However, in the case that
these irregular-shaped particles do not restructure completely into perfect spheres upon
Chapter 4. Results
124
humidification in the HTDMA, their dynamic shape factors would be even higher than the ones
calculated by Equation 4.
3.6 Sensitivity analysis of the primary particle number and size derived by the HTDMA
measurements
In view of the comparison of the results from the TEM analysis and the HTDMA measurements here
we take a more critical view of the number and size of primary particles derived from the
hygroscopicity measurements. To assess the effect that the sampled aggregates/agglomerates do not
undergo full restructuring at the elevated RH within the HTDMA would have in the interpretation of
our results, we carry out a sensitivity analysis showing that an increase in the dynamic shape factor
of the particles will result in an increase of the number and a decrease of the size of primary particles
that form an aggregate/agglomerate. The effects of the dynamic shape factor on both the number and
size of primary particles for agglomerates are provided in the ESI (cf. Figure S7). For the irregularly-
shaped particles observed during the process taking place in booth #1, an increase of the dynamic
shape factor by 0.05 in the calculated average dynamic shape factors (1.10 and 1.43 for the 30- and
90-nm particles, respectively) would result in an estimated primary particle size of 20 nm. This value
is ca. 5% lower compared to that determined from the measurements in section 3.4, and would be in
agreement, within experimental uncertainty, with the TEM analysis. Regarding the 90-nm irregularly
shaped particles observed in booth #3, an absolute increase of 0.15 on their shape factor (i.e., from
ca. 1.28 to 1.43) would be needed in order that the estimate primary particle size to be ca. 20 nm.
This suggests that the assumption that the 90-nm particles were completely restructured to form
spherical particles upon exposure to 87% RH may not be absolutely valid in this particular case.
Based on the above sensitivity analysis it is evident that an incomplete restructuring of the irregular
particles upon humidification in the HTDMA can significantly influence the estimated number and
size of primary particles that form the aggregates/agglomerates. Based on experimental
observations, it has been suggested that for complete restructuring of agglomerated nanoparticles
into compact spherical-like structures, supersaturated conditions (RH > 100%) are necessary
(Kelesidis et al., 2018). The HTDMA, however, cannot operate at such high concentrations of water
vapour, as its main function is to measure the hygroscopicity of particles at certain RH conditions.
Therefore, incomplete restructuring of the irregular particles upon humidification is the most
probable cause for the discrepancies between the observed (TEM) and the estimated (from the
HTDMA measurements) numbers and sizes of the primary particles forming the
aggregates/agglomerates.
3.7 Significance of hygroscopicity as a human health-related particle property
This intrinsic property of aerosols is relevant given that inhaled particles are exposed to relative
humidity (RH) levels close to 99% in the human respiratory system (Anselm et al., 1990; Ferron et
al., 1988), thus any changes in particle size (i.e., due to their hygroscopicity) can change their
deposition patterns (Löndahl et al., 2007). The mixing state of particles plays also a role on their
deposition behavior in the human respiratory system, and consequently on their associated health
effects: in externally mixed aerosols, particles having the same size at dry conditions but are of
different composition, will grow to different sizes, and therefore exhibit different deposition
efficiencies, upon inhalation. Along these lines, it has been shown that the deposition of externally
Chapter 4. Results
125
mixed fresh soot particles (i.e., hydrophobic; found in urban plumes) in the alveolar region can be
underestimated by 5 to 20% if treated as internally mixed with more hygroscopic background
aerosols (Ching and Kajino, 2018).
The hygroscopicity measurements in this work showed that UFPs produced by both the APS and
HVOF plasma processes, having dry electrical mobility diameters of 30 nm, exhibited some water
uptake when exposed to 87% RH (i.e., less hygroscopic), while having a compact shape, close to that
of a sphere. Upon inhalation, these particles will grow, due to the high RH in the human respiratory
system by ca. 28%, reaching sizes of approx. 38.5 nm (cf. ESI). On the other hand, their 90-nm
counterparts were characterized as hydrophobic, clearly exhibited irregular shapes and
restructuring upon humidification (i.e., exhibiting hygroscopic factors less than unity). Due to these
characteristic properties they can be easily distinguished, on a real-time basis with the HTDMA, from
other aerosols of the same electrical mobility. While a incomplete restructuring of these particles at
87% RH may very well be the main reason explaining the differences with TEM observations (cf.
sections 3.4, 3.5 and 3.6), we cannot completely exclude this from happening upon inhalation (i.e.,
99% RH inside the human respiratory system). Our sensitivity analysis indicates that in this case,
these 90-nm electrical mobility diameter UFPs will exhibit aerodynamic diameters of approx. 70 nm
(i.e., having shape factors of 1.43 or more; cf. section 3.6).
It is expected that the deposition behavior of these UFPs inside the human respiratory tract will differ
from those estimated if their hygroscopic properties are not taken into account. This is, however,
beyond the scope of this paper, but warranties further investigation. In addition, other size/shape
related metrics such as their Lung Deposition Surface Area (LDSA) are expected to differ compared
to those of the particles measured/calculated at dry conditions, as they are only valid for spherical
particles which do not grow when exposed to elevated RH conditions (Asbach et al., 2017). Therefore,
in exposure studies the HTDMA provides important additional information which is complementary
to other aerosol parameters (e.g., number concentration, size distribution) in order to better
understand the behavior and health impacts of UFPs. Additionally, despite lacking the accuracy of
off-line methods (e.g., TEM) in determining the morphology and the size of the primary particles, the
HTDMA can be used to identify particles of irregular shape in almost real time, thus allowing fast
identification of particle emission hotspots or accidental releases. This would contribute to
streamlining and tailoring particle exposure assessments in workplace scenarios.
4. Conclusions
High concentrations of process-generated ultrafine particles (UFPs), which were often higher than
106 cm-3, were monitored at an industrial workplace setting during thermal spraying, inside the
spraying booths of the facility. Emission patterns were irregular in the case of the process taking
place in booth #1 (Atmospheric Plasma Spraying; APS) and more uniform during spraying in booth
#3 (High Velocity Oxy-Fuel; HVOF). Modal analysis of the emissions showed that the majority of the
emitted UFPs were in the size range of 26 to 90 nm, regardless of the process and the operating
conditions. Particles were emitted inside the spraying booths where workers were equipped with
Chapter 4. Results
126
personal protective equipment, but they also impacted the area where workers were not equipped
with personal protective equipment.
Measurements were also conducted for providing complementary information on UFP
hygroscopicity and mixing state, as a means to distinguish between process-generated and
background particles, as well as for estimating their structural properties (i.e., the number and size
of primary particles comprising the emitted agglomerates/aggregates). In these measurements we
observed that 30-nm (electrical mobility diameter) particles originating from the plasma processes
exhibited hygroscopicities which did not differ significantly from other aerosols sampled when
thermal spraying was not operational. However, taking into account that 30-nm particles were
observed by the HTDMA only during working hours, their presence has to be attributed to processes
taking place inside the workshop. The shape of these particles was closer to that of a sphere, while
based on their measured hygroscopicities they are expected to grow in size by ca. 28% upon
inhalation (i.e., at 99% RH). The 90-nm particles, on the other hand, were hydrophobic at 87% RH
and underwent a shape change upon humidification (i.e., g(87%) < 1.0). This allowed to clearly
distinguish them from other aerosols of the same dry size that were present in the workplace.
TEM/EDX analysis confirmed that process-generated particles had the same composition as the
feedstock material, verifying that thermal spraying (APS, HVOF) was the dominant UFP source in the
breathing air in the facility. Agglomerates were dominant on the sample grids collected from both
booths, but exhibited different levels of aggregation, shapes and sizes. A qualitative comparison of
the HTDMA measurements and the TEM analysis, showed that the size of spherical particles which
formed chain-like agglomerates was overestimated, while their number was probably
underestimated with the former technique. For the 90-nm agglomerates that exhibited a clear
restructuring, in order for the calculated primary particle size determined using the HTDMA
measurements to match the TEM observations the dynamic shape factors of these particles had to be
ca. 5-10% higher than the measured ones. The latter suggests that the sampled
aggregates/agglomerates do not fully restructure to form perfect spheres when exposed to sub-
saturated conditions of 87% RH. Despite that, it is evident that the aerodynamic diameters of these
particles will be significantly smaller than their electrical mobility diameters (i.e., 90 nm, measured
at dry conditions) as they approach the shape of a sphere when exposed to elevated RH conditions
upon inhalation (i.e., ca. 70 nm if completely restructured at 99% RH). In addition, this information
is obtainable in almost real time by the HTDMA, providing a competitive advantage compared to
other offline techniques.
The additional information provided by the HTDMA can complement existing methods used for an
accurate assessment of the health effect associated to process-generated UFPs, as any changes in
their size/shape upon inhalation can impact on other properties, such as their LDSA, while changing
their deposition patterns inside the human respiratory system.

Chapter 4. Results
127
Acknowledgements
The authors kindly acknowledge TM COMAS (http://www.tmcomas.com) for their committed
cooperation. The current work was carried out in the framework of the CERASAFE project
(www.cerasafe.eu), with the support of SIINN ERA-NET (project id: 16), and was funded by the
Spanish MINECO (PCIN-2015-173-C02-01) and the respective French agency (Region Hauts de
France). Partial funding from the “Generalitat de Catalunya” (project number: AGAUR 2017 SGR41)
is also acknowledged.
Chapter 4. Results
128
References
Agarwal, J.K., Sem, G.J., 1980. Continuous flow, single-particle-counting condensation nucleus counter. J.
Aerosol Sci. 11, 343–357. https://doi.org/https://doi.org/10.1016/0021-8502(80)90042-7
Anselm, A., Heibel, T., Gebhart, J., Ferron, G., Inhalation, P., 1990. of Sodium Chria3Ride Particles in the Human
Respiratory Tract. Growth Factors 21, 427–430.
Asbach, C., Alexander, C., Clavaguera, S., Dahmann, D., Dozol, H., Faure, B., Fierz, M., Fontana, L., Iavicoli, I.,
Kaminski, H., MacCalman, L., Meyer-Plath, A., Simonow, B., van Tongeren, M., Todea, A.M., 2017. Review of
measurement techniques and methods for assessing personal exposure to airborne nanomaterials in
workplaces. Sci. Total Environ. 603–604, 793–806. https://doi.org/10.1016/j.scitotenv.2017.03.049
Asbach, C., Clavaguera, S., Todea, A.M., 2016. Measurement Methods for Nanoparticles in Indoor and Outdoor
Air, in: Viana, M. (Ed.), Indoor and Outdoor Nanoparticles: Determinants of Release and Exposure Scenarios.
Springer International Publishing, Cham, pp. 19–49. https://doi.org/10.1007/698_2015_423
Asbach, C., Kuhlbusch, T. a J., Kaminski, H., Plitzko, S., Götz, U., Voetz, M., Dahmann, D., 2012. Authors : SOP-
Tiered Approach Tiered Approach for the assessment of exposure to airborne nanoobjects in work- places.
Baron P. A and Willeke,K. Aerosol Measurement: Principles, Techniques and Applications. Second Edition, Willey-
InterScience, Inc., 2001.
Bezantakos, S., Barmpounis, K., Giamarelou, M., Bossioli, E., Tombrou, M., Mihalopoulos, N., Eleftheriadis, K.,
Kalogiros, J., Allan, J.D., Bacak, A., Percival, C.J., Coe, H., Biskos, G., 2013. Chemical composition and hygroscopic
properties of aerosol particles over the Aegean Sea. Atmos. Chem. Phys. 13, 11595–11608.
https://doi.org/10.5194/acp-13-11595-2013
Bezantakos, S., Huang, L., Barmpounis, K., Martin, S. T. and Biskos G., 2016. Relative humidity non-uniformities
in hygroscopic tandem differential mobility analyzer measurements. J. Aerosol Sci., 101, 1-9.
Biskos, G., Russell, L.M., Buseck, P.R., Martin, S.T., 2006a. Nanosize effect on the hygroscopic growth factor of
aerosol particles. Geophys. Res. Lett. 33, 2–5. https://doi.org/10.1029/2005GL025199
Biskos, G., Russell, L. M., Buseck, P. R. and Martin S. T., 2006b. Prompt deliquescence and efflorecence of aerosol
nanoparticles. Atmos. Chem. Phys., 6, 4633-4642
Chan, P., Dahneke, B., 1981. Free-molecule drag on straight chains of uniform spheres. J. Appl. Phys. 52, 3106–
3110. https://doi.org/10.1063/1.329173
Ching, J., Kajino, M., 2018. Aerosol mixing state matters for particles deposition in human respiratory system.
Sci. Rep. 8, 8864. https://doi.org/10.1038/s41598-018-27156-z
Coleman, T.F., Li, Y., 1996. An Interior Trust Region Approach for Nonlinear Minimization Subject to Bounds.
SIAM J. Optim. 6, 418–445. https://doi.org/10.1137/0806023
Coleman, T.F., Li, Y., 1994. On the convergence of interior-reflective Newton methods for nonlinear
minimization subject to bounds. Math. Program. 67, 189–224. https://doi.org/10.1007/BF01582221
Chapter 4. Results
129
Corson, J., Mulholland, G. W. and Zachariah, M. R., 2017. Analytical expression for the friction coefficient of DLCA
aggregates based on extended Kirkwood–Riseman theory. Aerosol Sci. Technol., 51:6, 766-777.
https://doi.org/10.1080/02786826.2017.1300635
Dahmann, D., 2016. Exposure Assessment: Methods, in: Viana, M. (Ed.), Indoor and Outdoor Nanoparticles:
Determinants of Release and Exposure Scenarios. Springer International Publishing, Cham, pp. 51–72.
https://doi.org/10.1007/698_2015_436
Dahneke, B. E. 1973c. Slip Correction Factors for Nonspherical Bodies - III: The Form of the General Law. J.
Aerosol Sci., 4:163–170.
Eggersdorfer, M.L., Gröhn, A.J., Sorensen, C.M., McMurry, P.H., Pratsinis, S.E., 2012b. Mass-mobility
characterization of flame-made ZrO 2 aerosols: Primary particle diameter and extent of aggregation. J. Colloid
Interface Sci. 387, 12–23. https://doi.org/10.1016/j.jcis.2012.07.078
Eggersdorfer, M.L., Kadau, D., Herrmann, H.J., Pratsinis, S.E., 2012a. Aggregate morphology evolution by
sintering: Number and diameter of primary particles. J. Aerosol Sci. 46, 7–19.
https://doi.org/10.1016/j.jaerosci.2011.11.005
Fauchais, P., Vardelle, A., Dussoubs, B., 2001. Quo Vadis thermal spraying? J. Therm. Spray Technol. 10, 44–66.
https://doi.org/10.1361/105996301770349510
Ferron, G.A., Kreyling, W.G., Haider, B., 1988. AND DEPOSITION IN THE H U M A N RESPIRATORY TRACT * Ioo
[ 19, 611–631.
Fonseca, A.S., Maragkidou, A., Viana, M., Querol, X., Hämeri, K., de Francisco, I., Estepa, C., Borrell, C., Lennikov,
V., de la Fuente, G.F., 2016. Process-generated nanoparticles from ceramic tile sintering: Emissions, exposure
and environmental release. Sci. Total Environ. 565, 922–932. https://doi.org/10.1016/j.scitotenv.2016.01.106
Fonseca, A.S., Viana, M., Querol, X., Moreno, N., de Francisco, I., Estepa, C., de la Fuente, G.F., 2015. Ultrafine and
nanoparticle formation and emission mechanisms during laser processing of ceramic materials. J. Aerosol Sci.
88, 48–57. https://doi.org/10.1016/j.jaerosci.2015.05.013
Gakidou, E., Afshin, A., Abajobir, A.A., et Al., A., 2017. Global, regional, and national comparative risk assessment
of 84 behavioural, environmental and occupational, and metabolic risks or clusters of risks, 1990–2016: a
systematic analysis for the Global Burden of Disease Study 2016. Lancet 390, 1345–1422.
https://doi.org/10.1016/S0140-6736(17)32366-8
Ganguly, P., Breen, A., Pillai, S.C., 2018. Toxicity of Nanomaterials: Exposure, Pathways, Assessment, and Recent
Advances. ACS Biomater. Sci. Eng. acsbiomaterials.8b00068.
https://doi.org/10.1021/acsbiomaterials.8b00068
Hussein, T., Maso, M., Petäjä, T., Koponen, I., Paatero, P., Aalto, P., Hämeri, K., Kulmala, M., 2005. Evaluation of
an automatic algorithm for fitting the particle number size distributions. Boreal Environ. Res. 10, 337–355.
Kalantzi, O., Biskos G., 2014. Methods for assessing basic particle properties and cytotoxicity of engineered
nanaparticles. Toxics 2 (1), 79-91.
Kelesidis, G.A., Furrer, F.M., Wegner, K., Pratsinis, S.E., 2018. Impact of Humidity on Silica Nanoparticle
Agglomerate Morphology and Size Distribution. Langmuir 34, 8532–8541.
https://doi.org/10.1021/acs.langmuir.8b00576
Chapter 4. Results
130
Knutson, E.O., Whitby, K.T., 1975. Aerosol classification by electric mobility: apparatus, theory, and
applications. J. Aerosol Sci. 6, 443–451. https://doi.org/10.1016/0021-8502(75)90060-9
Krämer, L., Pöschl, U., Niessner, R., 2000. Microstructural rearrangement of sodium chloride condensation
aerosol particles on interaction with water vapor. J. Aerosol Sci. 31, 673–685. https://doi.org/10.1016/S0021-
8502(99)00551-0
Kruis, F.E., Kusters, K.A., Pratsinis, S.E., Scarlett, B., 1993. A Simple Model for the Evolution of the Characteristics
of Aggregate Particles Undergoing Coagulation and Sintering. Aerosol Sci. Technol. 19, 514–526.
https://doi.org/10.1080/02786829308959656
Kuhlbusch, T.A.J., Asbach, C., Fissan, H., Göhler, D., Stintz, M., 2011. Nanoparticle exposure at nanotechnology
workplaces: A review. Part. Fibre Toxicol. 8, 1–18. https://doi.org/10.1186/1743-8977-8-22
Kuhlbusch, T.A.J., John, A.C., Quass, U., 2009. Sources and source contributions to fine particles. Biomarkers 14,
23–28. https://doi.org/10.1080/13547500902965377
Landrigan, P.J., 2017. Air pollution and health. Lancet Public Heal. 2, e4–e5. https://doi.org/10.1016/S2468-
2667(16)30023-8
Lall. A. A. and Friedlander, S.K., 2006. On-line measurement of ultrafine aggregate surface area and volume
distributions by electrical mobility analysis: I. Theoretical analysis. J. Aerosol Sci., 37, 260-271.
Li, C.-J., Wang, Y.-Y., Yang, G.-J., Ohmori, A., Khor, K.A., 2004. Effect of solid carbide particle size on deposition
behaviour, microstructure and wear performance of HVOF cermet coatings. Mater. Sci. Technol. 20, 1087–1096.
https://doi.org/10.1179/026708304225019722
Li, M., Christofides, P.D., 2006. Computational study of particle in-flight behavior in the HVOF thermal spray
process. Chem. Eng. Sci. 61, 6540–6552. https://doi.org/10.1016/j.ces.2006.05.050
Limbach, L.K., Wick, P., Manser, P., Grass, R.N., Bruinink, A., Stark, W.J., 2007. Exposure of Engineered
Nanoparticles to Human Lung Epithelial Cells: Influence of Chemical Composition and Catalytic Activity on
Oxidative Stress. Environ. Sci. Technol. 41, 4158–4163. https://doi.org/10.1021/es062629t
Löndahl, J., Massling, A., Pagels, J., Swietlicki, E., Vaclavik, E., Loft, S., 2007. Size-Resolved Respiratory-Tract
Deposition of Fine and Ultrafine Hydrophobic and Hygroscopic Aerosol Particles During Rest and Exercise.
Inhal. Toxicol. 19, 109–116. https://doi.org/10.1080/08958370601051677
Mauer, G., Vaen, R., Stöver, D., 2011. Plasma and particle temperature measurements in thermal spray:
Approaches and applications. J. Therm. Spray Technol. 20, 391–406. https://doi.org/10.1007/s11666-010-
9603-z
McMurry, P.H., Stolzenburg, M.R., 1989. On the sensitivity of particle size to relative humidity for Los Angeles
aerosols. Atmos. Environ. 23, 497–507. https://doi.org/10.1016/0004-6981(89)90593-3
Melas D. A., Isella, L., Konstadopoulos, A. G., Drossinos, Y., 2014. Friction coefficient and mobility radius of
fractal-like aggregates in the transition regime. Aerosol Sci. Technol., 48, 1320-1331,
https://doi.org/10.1080/02786826.2014.985781.
Oberdörster, G., 2001. Pulmonary effects of inhaled ultrafine particles. Int. Arch. Occup. Environ. Health 74, 1–
8. https://doi.org/10.1007/s004200000185
Chapter 4. Results
131
OECD, 2015. Harmonized Tiered Approach to Measure and Assess the Potential Exposure to Airborne
Emissions of Engineered Nano-Objects and their Agglomerates and Aggregates at Workplaces. Ser. Saf. Manuf.
Nanomater. No.55 55, JT03378848-JT03378848.
Ono-Ogasawara, M., Serita, F., Takaya, M., 2009. Distinguishing nanomaterial particles from background
airborne particulate matter for quantitative exposure assessment. J. Nanoparticle Res. 11, 1651–1659.
https://doi.org/10.1007/s11051-009-9703-1
Pawlowski, L., 2008. The Science and Engineering of Thermal Spray Coatings, The Science and Engineering of
Thermal Spray Coatings: Second Edition. https://doi.org/10.1002/9780470754085
Peters, T.M., Elzey, S., Johnson, R., Park, H., Grassian, V.H., Maher, T., O’Shaughnessy, P., 2009. Airborne
monitoring to distinguish engineered nanomaterials from incidental particles for environmental health and
safety. J. Occup. Environ. Hyg. 6, 73–81. https://doi.org/10.1080/15459620802590058
Pietroiusti, A., Stockmann-Juvala, H., Lucaroni, F., Savolainen, K., 2018. Nanomaterial exposure, toxicity, and
impact on human health. Wiley Interdiscip. Rev. Nanomedicine Nanobiotechnology 1–21.
https://doi.org/10.1002/wnan.1513
Planche, M.P., Bolot, R., Coddet, C., 2003. In-Flight Characteristics of Plasma Sprayed Alumina Particles :
Measurements , Modeling , and Comparison 12, 101–111.
Rader, D.J., McMurry, P.H., 1986. Application of the tandem differential mobility analyzer to studies of droplet
growth or evaporation. J. Aerosol Sci. 17, 771–787. https://doi.org/10.1016/0021-8502(86)90031-5
Rogak, S. N., Flagan, R. C., and Nguyen, H. V., 1993. The mobility and structure of aerosol agglomerates, Aerosol
Sci. Technol. 18:25–47.
Salmatonidis, A., Ribalta, C., Sanfélix, V., Bezantakos, S., Biskos, G., Vulpoi, A., Simion, S., Monfort, E., Viana, M.,
2019. Workplace Exposure to Nanoparticles during Thermal Spraying of Ceramic Coatings. Ann. Work Expo.
Heal. 63, 91–106. https://doi.org/10.1093/annweh/wxy094
Salmatonidis, A., Viana, M., Pérez, N., Alastuey, A., de la Fuente, G.F., Angurel, L.A., Sanfélix, V., Monfort, E., 2018.
Nanoparticle formation and emission during laser ablation of ceramic tiles. J. Aerosol Sci. 126, 152–168.
https://doi.org/10.1016/j.jaerosci.2018.09.006
Schill, A.L., Chosewood, L.C., 2013. The NIOSH total worker health program: An overview. J. Occup. Environ.
Med. 55, 10–13. https://doi.org/10.1097/JOM.0000000000000037
Song, Y., Li, X., Du, X., 2009. Exposure to nanoparticles is related to pleural effusion, pulmonary fibrosis and
granuloma. Eur. Respir. J. 34, 559–567. https://doi.org/10.1183/09031936.00178308
Sorensen, C.M., 2011. The Mobility of Fractal Aggregates: A Review. Aerosol Sci. Technol. 45, 765–779.
https://doi.org/10.1080/02786826.2011.560909
Swietlicki, E., Hansson, H.C., Hämeri, K., Svenningsson, B., Massling, A., Mcfiggans, G., Mcmurry, P.H., Petäjä, T.,
Tunved, P., Gysel, M., Topping, D., Weingartner, E., Baltensperger, U., Rissler, J., Wiedensohler, A., Kulmala, M.,
2008. Hygroscopic properties of submicrometer atmospheric aerosol particles measured with H-TDMA
instruments in various environments - A review. Tellus, Ser. B Chem. Phys. Meteorol. 60 B, 432–469.
https://doi.org/10.1111/j.1600-0889.2008.00350.x
Thajudeen, T., Jeon, S., Hogan Jr. C. J., 2015. The mobilities of flame synthesized aggregates/agglomerates in the
transition regime. J. Aerosol Sci., 80, 45-57.
Chapter 4. Results
132
Tritscher, T., Jurnyi, Z., Martin, M., Chirico, R., Gysel, M., Heringa, M.F., Decarlo, P.F., Sierau, B., Prévt, A.S.H.,
Weingartner, E., Baltensperger, U., 2011. Changes of hygroscopicity and morphology during ageing of diesel
soot. Environ. Res. Lett. 6. https://doi.org/10.1088/1748-9326/6/3/034026
van Broekhuizen, P., 2017. Applicability of provisional NRVs to PGNPs and FCNPs Applicability of provisional
NRVs to PGNPs and FCNPs. Amsterdam. https://doi.org/10.13140/RG.2.2.18241.25445
Voliotis, A., Bezantakos, S., Giamarelou, M., Valenti, M., Kumar, P., Biskos, G., 2014. Nanoparticle emissions from
traditional pottery manufacturing. Environ. Sci. Process. Impacts 16, 1489–1494.
https://doi.org/10.1039/C3EM00709J
Weingartner, E., Baltensperger, U., Burtscher, H., 1995. Growth and Structural Change of Combustion Aerosols
at High Relative Humidity. Environ. Sci. Technol. 29, 2982–2986. https://doi.org/10.1021/es00012a014
World Health Organization, 2016. Ambient Air Pollution: A global assessment of exposure and burden of
disease. World Heal. Organ. 1–131. https://doi.org/9789241511353
Zhang, C., Thajudeen, T., Larriba, C., Schwartzentruber, T. E., and Hogan, Jr, C. J. 2012. Determination of the
Scalar Friction Factor for Nonspherical Particles and Aggregates Across the Entire Knudsen Number Range by
Direct Simulation Monte Carlo (DSMC). Aerosol Sci. Technol., 46:1065–1078.
Zhang, M., Jian, L., Bin, P., Xing, M., Lou, J., Cong, L., Zou, H., 2013. Workplace exposure to nanoparticles from gas
metal arc welding process. J. Nanoparticle Res. 15. https://doi.org/10.1007/s11051-013-2016-4
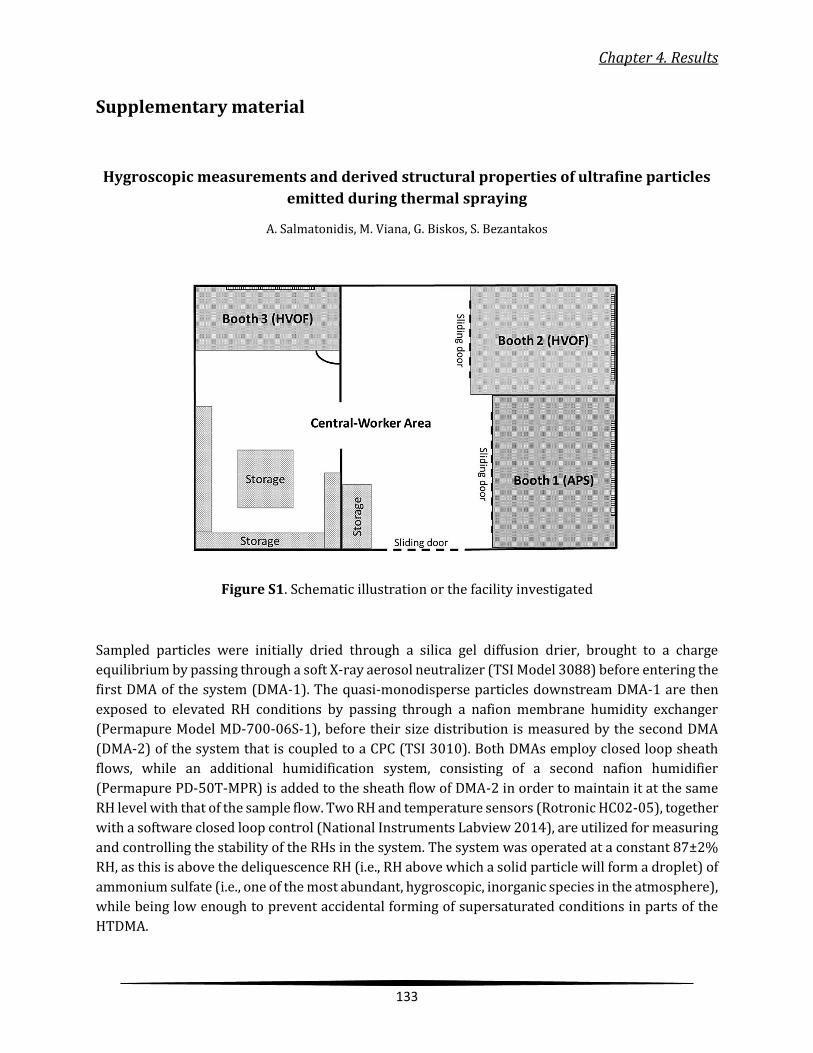
Chapter 4. Results
133
Supplementary material
Hygroscopic measurements and derived structural properties of ultrafine particles
emitted during thermal spraying
A. Salmatonidis, M. Viana, G. Biskos, S. Bezantakos
Figure S1. Schematic illustration or the facility investigated
Sampled particles were initially dried through a silica gel diffusion drier, brought to a charge
equilibrium by passing through a soft X-ray aerosol neutralizer (TSI Model 3088) before entering the
first DMA of the system (DMA-1). The quasi-monodisperse particles downstream DMA-1 are then
exposed to elevated RH conditions by passing through a nafion membrane humidity exchanger
(Permapure Model MD-700-06S-1), before their size distribution is measured by the second DMA
(DMA-2) of the system that is coupled to a CPC (TSI 3010). Both DMAs employ closed loop sheath
flows, while an additional humidification system, consisting of a second nafion humidifier
(Permapure PD-50T-MPR) is added to the sheath flow of DMA-2 in order to maintain it at the same
RH level with that of the sample flow. Two RH and temperature sensors (Rotronic HC02-05), together
with a software closed loop control (National Instruments Labview 2014), are utilized for measuring
and controlling the stability of the RHs in the system. The system was operated at a constant 87±2%
RH, as this is above the deliquescence RH (i.e., RH above which a solid particle will form a droplet) of
ammonium sulfate (i.e., one of the most abundant, hygroscopic, inorganic species in the atmosphere),
while being low enough to prevent accidental forming of supersaturated conditions in parts of the
HTDMA.
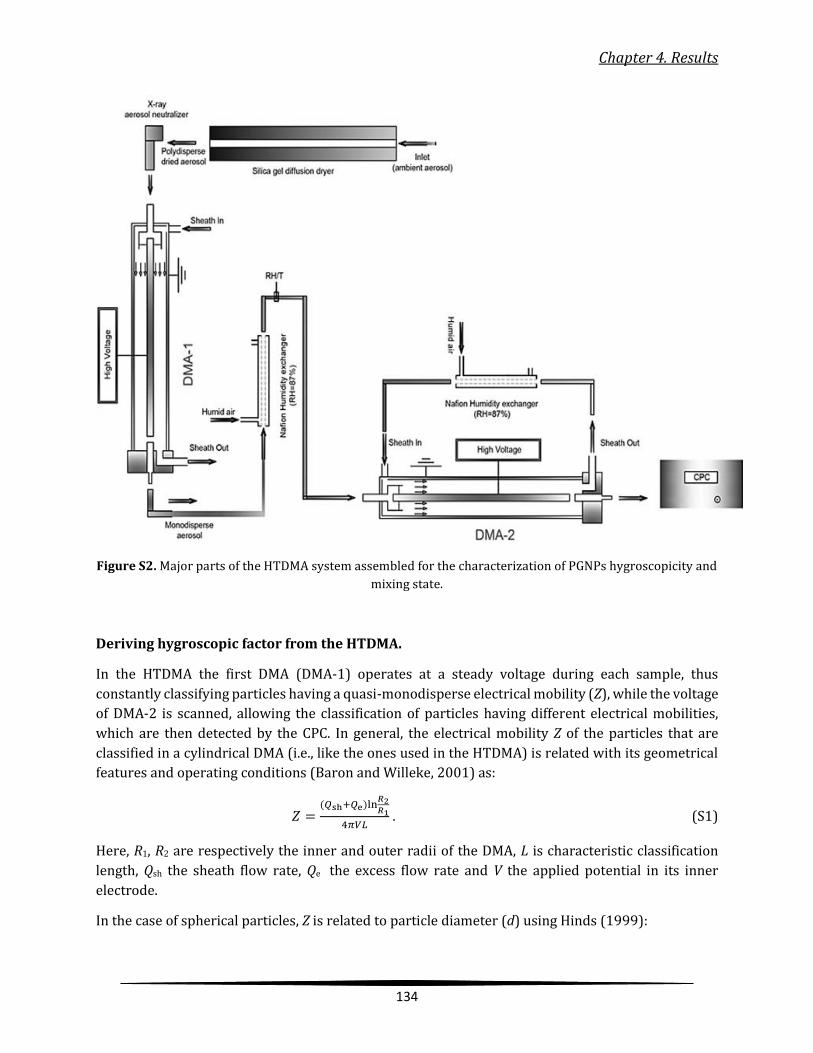
Chapter 4. Results
134
Figure S2. Major parts of the HTDMA system assembled for the characterization of PGNPs hygroscopicity and
mixing state.
Deriving hygroscopic factor from the HTDMA.
In the HTDMA the first DMA (DMA-1) operates at a steady voltage during each sample, thus
constantly classifying particles having a quasi-monodisperse electrical mobility (Z), while the voltage
of DMA-2 is scanned, allowing the classification of particles having different electrical mobilities,
which are then detected by the CPC. In general, the electrical mobility Ζ of the particles that are
classified in a cylindrical DMA (i.e., like the ones used in the HTDMA) is related with its geometrical
features and operating conditions (Baron and Willeke, 2001) as:
𝑍 =(𝑄sh+𝑄e)ln
𝑅2𝑅1
4𝜋𝑉𝐿 . (S1)
Here, R1, R2 are respectively the inner and outer radii of the DMA, L is characteristic classification
length, Qsh the sheath flow rate, Qe the excess flow rate and V the applied potential in its inner
electrode.
In the case of spherical particles, Z is related to particle diameter (d) using Hinds (1999):
Chapter 4. Results
135
𝛧 = 𝑛𝑒𝐶𝑐
3𝜋𝜇𝑑 , (S2)
where n is the number of elementary charges, e the electron charge (1.6e-19 Cb), μ the air viscosity
(1.81e-5 Pa S, at 20 ˚C) and Cc the Cunningham slip correction factor.
The Cunningham slip correction factor, Cc, can be calculated via the empirical formula (Allen and
Raabe, 1985) as:
𝐶𝑐(𝐾𝑛) = 1 + 𝐾𝑛 [𝑎 + 𝑏exp (−𝑐
𝐾𝑛)]. (S3)
Here Kn is the Knudsen number, which is the ratio of the gas mean free path (λ) to the radius of the
spherical particle (r), while a= 1.257, b=0.4, c=1.1, are fitted parameters (Davies, 1945). Note that
the Kn number is used for defining the behavior of a particle while moving inside its surrounding gas
molecules (i.e., its flow regime). For example, a particle much bigger than the gas mean free path (i.e,
Kn<<0) will be subjected to a number of gas molecules collisions while a particle, much smaller than
the gas mean free path (i.e., Kn>>1) will be subjected to significantly lower collisions by the
surrounding gas molecules (i.e., resulting in a reduction in its drag).
Assuming particles of spherical shape, carrying one elementary charge, equations S1 to S3 are used
for inverting the HTDMA measurements and for calculating the geometric mean electrical mobility
diameters of particles selected by DMA-1 and measured by DMA-2 and the CPC, thus deriving their
hygroscopic factor.

Chapter 4. Results
136
Figure S3. Example of inverted HTDMA measurements of particles having dry electrical mobility diameters of
30 (a) and 90 (c) nm and their corresponding distributions, expressed as hygroscopic factor distributions at
87% RH (b, d), respectively. Note that in this example the 30-nm particles exhibited internally mixed
behavior (i.e., unimodal distribution when exposed to 87% RH), while in contrast their 90-nm counterparts
exhibited a wider distribution upon humidification, which can be analyzed in two separate modes (i.e.,
externally mixed), thus having two hygroscopic factors (i.e., g1 and g2, respectively).

Chapter 4. Results
137
Figure S4. Example of inverted HTDMA measurements of particles having an assumed (i.e., if they were
spherical) dry electrical mobility diameter of 90 nm (a) and the corresponding distribution, expressed as
hygroscopic factor distribution at 87% RH (b). Note that in this example the assumed 90-nm particles (i.e.,
based on the operational settings of DMA-1, corresponding for spherical particles) exhibited a unimodal
distribution (i.e., internally mixed) when exposed to 87% RH, with a hygroscopic factor < 1.0. The latter is a
clear indication of hydrophobic particles with irregular shape, that undergo restructuring upon
humidification after exposed to 87% RH.
Calculating particle hygroscopic factor on different than 87% RH.
The water affinity of soluble particulate matter can be represented by the single hygroscopic
parameter κ (Petters and Kreidenweis, 2007), which can be also used for calculating its water uptake
characteristics at various RHs. The value of κ can be calculated from the measured (i.e., by the
HTDMA) hygroscopic factor (Kreidenweis et al., 2008):
κHTDMA= (g(87%)3-1)
aw/(1-aw) , (S4)
where g(87%) is the measured hygroscopic factor (i.e., at 87% RH in our measurements) and aw is
the water activity of the solution droplet, which can be calculated by:
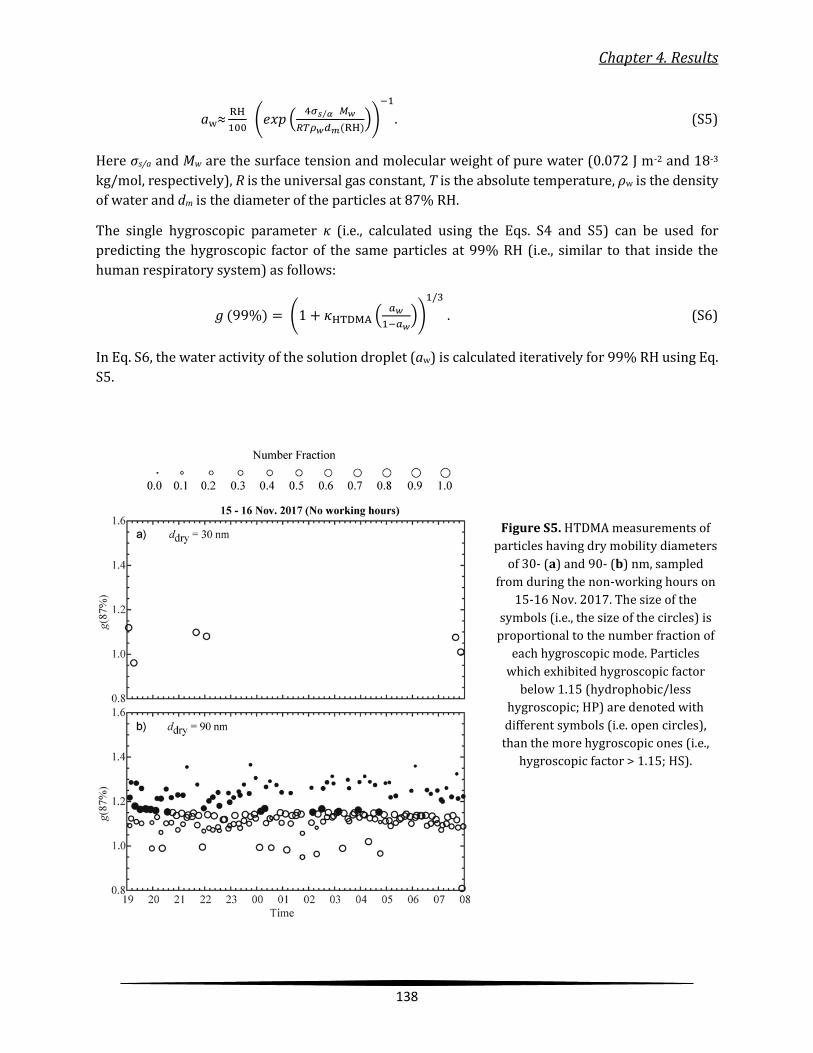
Chapter 4. Results
138
aw≈RH
100 (𝑒𝑥𝑝 (
4𝜎𝑠 𝛼⁄ 𝑀𝑤
𝑅𝑇𝜌𝑤𝑑𝑚(RH)))
−1
. (S5)
Here σs/a and Mw are the surface tension and molecular weight of pure water (0.072 J m-2 and 18-3
kg/mol, respectively), R is the universal gas constant, T is the absolute temperature, ρw is the density
of water and dm is the diameter of the particles at 87% RH.
The single hygroscopic parameter κ (i.e., calculated using the Eqs. S4 and S5) can be used for
predicting the hygroscopic factor of the same particles at 99% RH (i.e., similar to that inside the
human respiratory system) as follows:
g (99%) = (1 + 𝜅HTDMA (𝑎𝑤
1−𝑎𝑤))
1/3
. (S6)
In Eq. S6, the water activity of the solution droplet (aw) is calculated iteratively for 99% RH using Eq.
S5.
Figure S5. HTDMA measurements of
particles having dry mobility diameters
of 30- (a) and 90- (b) nm, sampled
from during the non-working hours on
15-16 Nov. 2017. The size of the
symbols (i.e., the size of the circles) is
proportional to the number fraction of
each hygroscopic mode. Particles
which exhibited hygroscopic factor
below 1.15 (hydrophobic/less
hygroscopic; HP) are denoted with
different symbols (i.e. open circles),
than the more hygroscopic ones (i.e.,
hygroscopic factor > 1.15; HS).
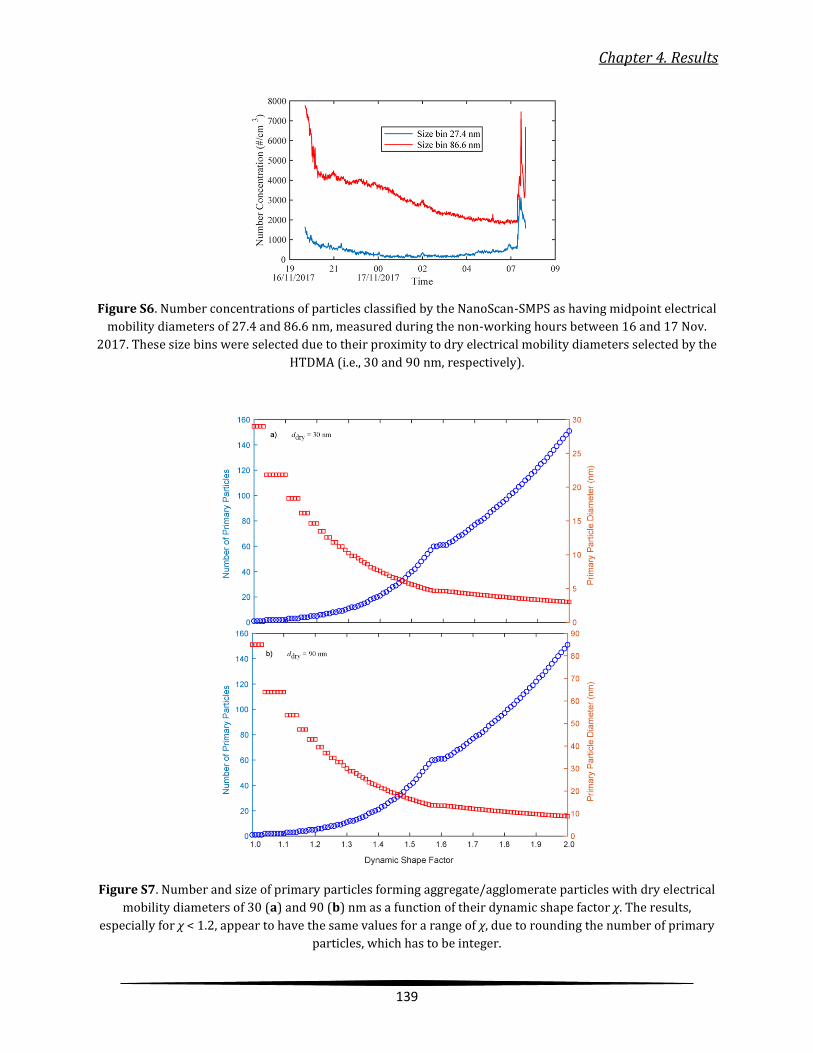
Chapter 4. Results
139
Figure S6. Number concentrations of particles classified by the NanoScan-SMPS as having midpoint electrical
mobility diameters of 27.4 and 86.6 nm, measured during the non-working hours between 16 and 17 Nov.
2017. These size bins were selected due to their proximity to dry electrical mobility diameters selected by the
HTDMA (i.e., 30 and 90 nm, respectively).
Figure S7. Number and size of primary particles forming aggregate/agglomerate particles with dry electrical
mobility diameters of 30 (a) and 90 (b) nm as a function of their dynamic shape factor χ. The results,
especially for χ < 1.2, appear to have the same values for a range of χ, due to rounding the number of primary
particles, which has to be integer.

Chapter 4. Results
140
Figure S8. Schematic illustration of the thermal spraying techniques, (a) APS and (b) HVOF and their
potential particle emission mechanisms.
a
b
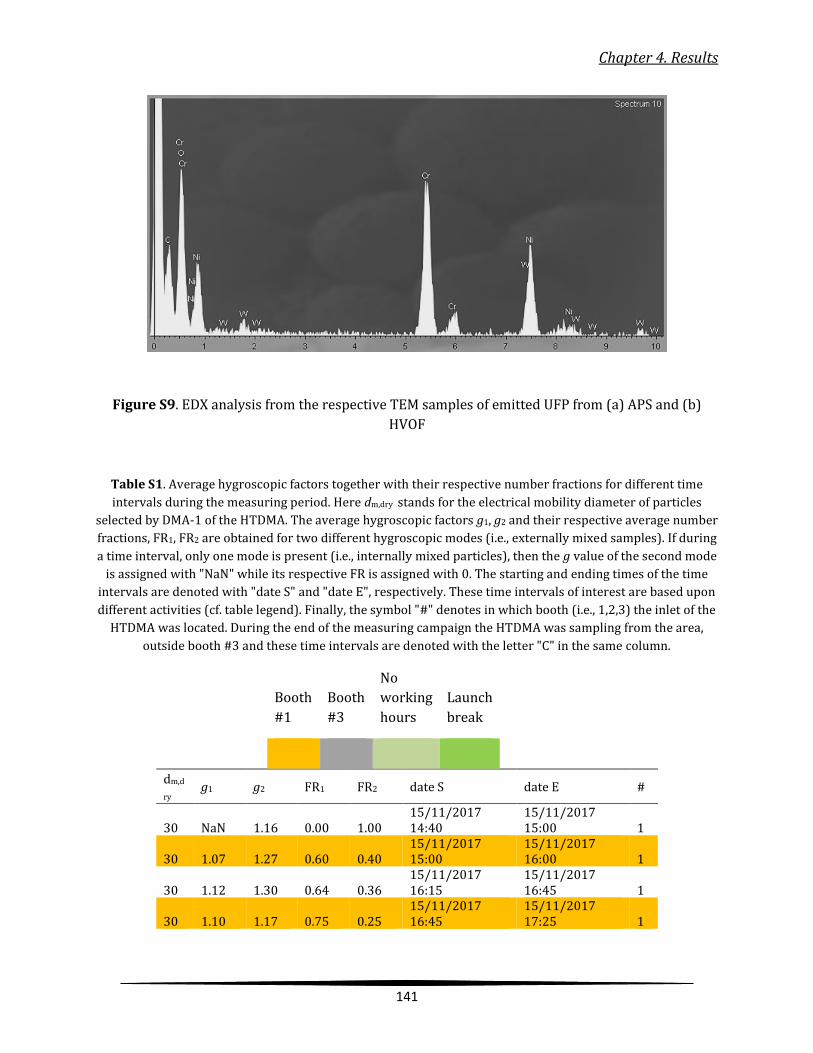
Chapter 4. Results
141
Figure S9. EDX analysis from the respective TEM samples of emitted UFP from (a) APS and (b)
HVOF
Table S1. Average hygroscopic factors together with their respective number fractions for different time
intervals during the measuring period. Here dm,dry stands for the electrical mobility diameter of particles
selected by DMA-1 of the HTDMA. The average hygroscopic factors g1, g2 and their respective average number
fractions, FR1, FR2 are obtained for two different hygroscopic modes (i.e., externally mixed samples). If during
a time interval, only one mode is present (i.e., internally mixed particles), then the g value of the second mode
is assigned with "NaN" while its respective FR is assigned with 0. The starting and ending times of the time
intervals are denoted with "date S" and "date E", respectively. These time intervals of interest are based upon
different activities (cf. table legend). Finally, the symbol "#" denotes in which booth (i.e., 1,2,3) the inlet of the
HTDMA was located. During the end of the measuring campaign the HTDMA was sampling from the area,
outside booth #3 and these time intervals are denoted with the letter "C" in the same column.
dm,d
ry g1 g2 FR1 FR2 date S date E #
30 NaN 1.16 0.00 1.00 15/11/2017 14:40
15/11/2017 15:00 1
30 1.07 1.27 0.60 0.40 15/11/2017 15:00
15/11/2017 16:00 1
30 1.12 1.30 0.64 0.36 15/11/2017 16:15
15/11/2017 16:45 1
30 1.10 1.17 0.75 0.25 15/11/2017 16:45
15/11/2017 17:25 1
Booth
#1
Booth
#3
No
working
hours
Launch
break
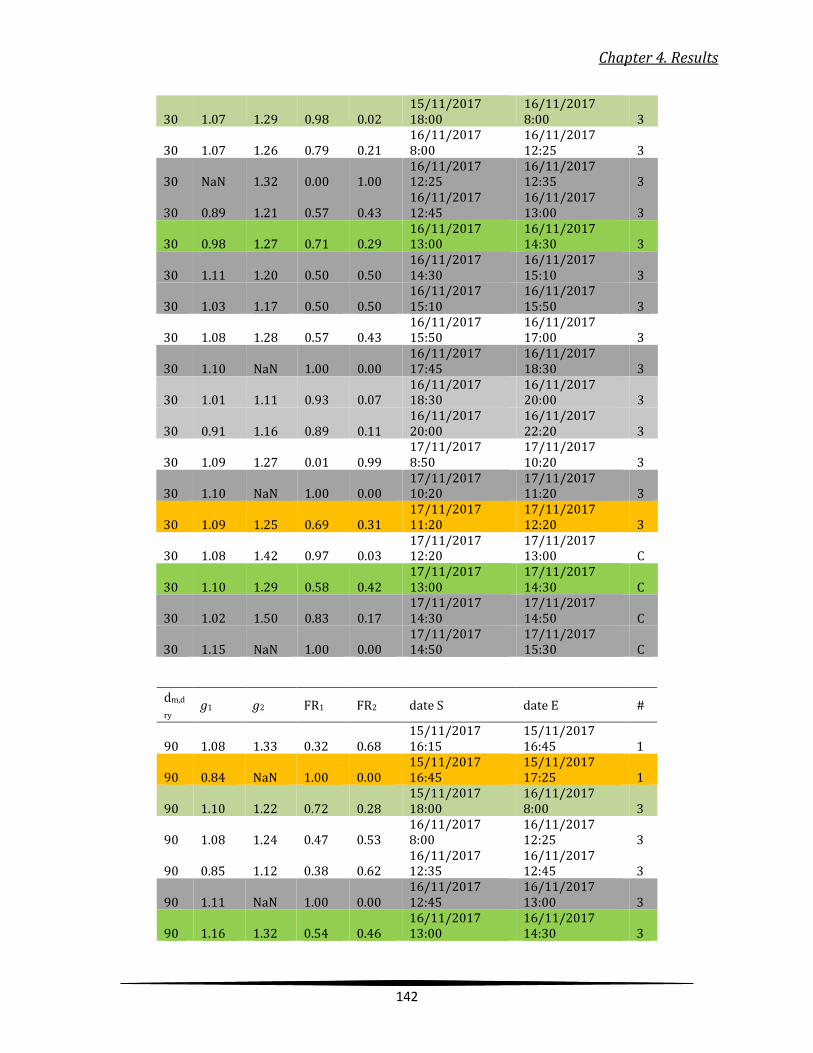
Chapter 4. Results
142
30 1.07 1.29 0.98 0.02 15/11/2017 18:00
16/11/2017 8:00 3
30 1.07 1.26 0.79 0.21 16/11/2017 8:00
16/11/2017 12:25 3
30 NaN 1.32 0.00 1.00 16/11/2017 12:25
16/11/2017 12:35 3
30 0.89 1.21 0.57 0.43 16/11/2017 12:45
16/11/2017 13:00 3
30 0.98 1.27 0.71 0.29 16/11/2017 13:00
16/11/2017 14:30 3
30 1.11 1.20 0.50 0.50 16/11/2017 14:30
16/11/2017 15:10 3
30 1.03 1.17 0.50 0.50 16/11/2017 15:10
16/11/2017 15:50 3
30 1.08 1.28 0.57 0.43 16/11/2017 15:50
16/11/2017 17:00 3
30 1.10 NaN 1.00 0.00 16/11/2017 17:45
16/11/2017 18:30 3
30 1.01 1.11 0.93 0.07 16/11/2017 18:30
16/11/2017 20:00 3
30 0.91 1.16 0.89 0.11 16/11/2017 20:00
16/11/2017 22:20 3
30 1.09 1.27 0.01 0.99 17/11/2017 8:50
17/11/2017 10:20 3
30 1.10 NaN 1.00 0.00 17/11/2017 10:20
17/11/2017 11:20 3
30 1.09 1.25 0.69 0.31 17/11/2017 11:20
17/11/2017 12:20 3
30 1.08 1.42 0.97 0.03 17/11/2017 12:20
17/11/2017 13:00 C
30 1.10 1.29 0.58 0.42 17/11/2017 13:00
17/11/2017 14:30 C
30 1.02 1.50 0.83 0.17 17/11/2017 14:30
17/11/2017 14:50 C
30 1.15 NaN 1.00 0.00 17/11/2017 14:50
17/11/2017 15:30 C
dm,d
ry g1 g2 FR1 FR2 date S date E #
90 1.08 1.33 0.32 0.68 15/11/2017 16:15
15/11/2017 16:45 1
90 0.84 NaN 1.00 0.00 15/11/2017 16:45
15/11/2017 17:25 1
90 1.10 1.22 0.72 0.28 15/11/2017 18:00
16/11/2017 8:00 3
90 1.08 1.24 0.47 0.53 16/11/2017 8:00
16/11/2017 12:25 3
90 0.85 1.12 0.38 0.62 16/11/2017 12:35
16/11/2017 12:45 3
90 1.11 NaN 1.00 0.00 16/11/2017 12:45
16/11/2017 13:00 3
90 1.16 1.32 0.54 0.46 16/11/2017 13:00
16/11/2017 14:30 3
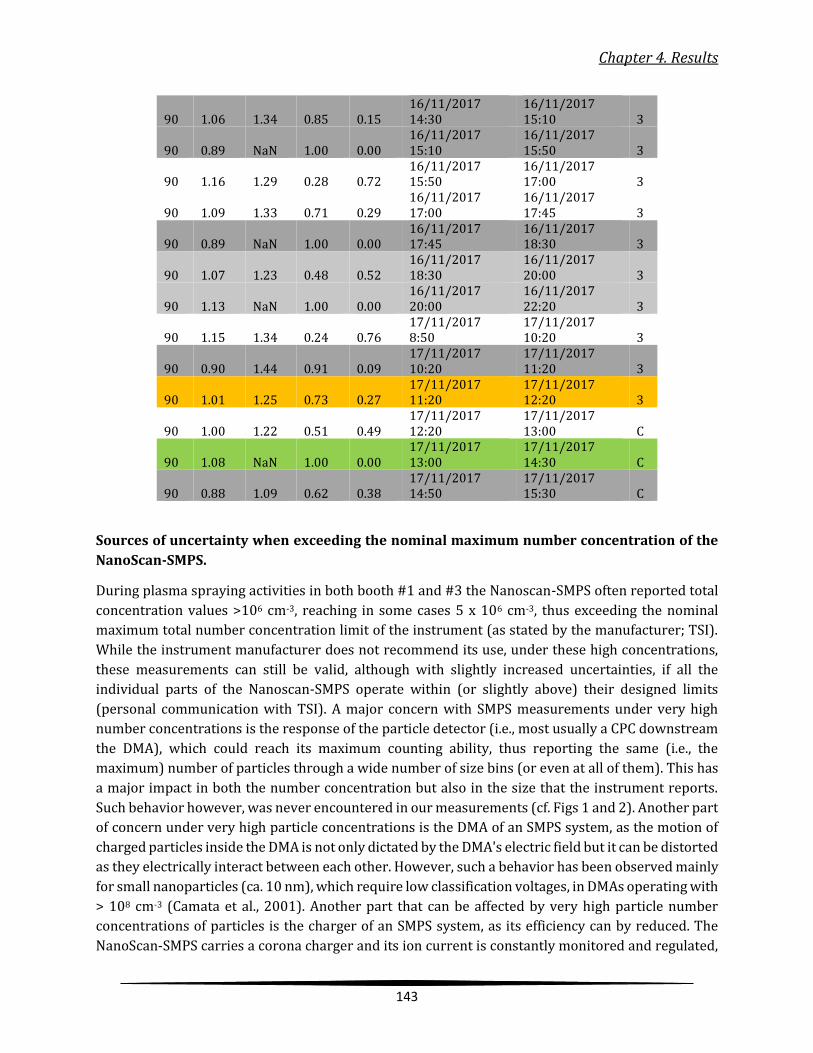
Chapter 4. Results
143
90 1.06 1.34 0.85 0.15 16/11/2017 14:30
16/11/2017 15:10 3
90 0.89 NaN 1.00 0.00 16/11/2017 15:10
16/11/2017 15:50 3
90 1.16 1.29 0.28 0.72 16/11/2017 15:50
16/11/2017 17:00 3
90 1.09 1.33 0.71 0.29 16/11/2017 17:00
16/11/2017 17:45 3
90 0.89 NaN 1.00 0.00 16/11/2017 17:45
16/11/2017 18:30 3
90 1.07 1.23 0.48 0.52 16/11/2017 18:30
16/11/2017 20:00 3
90 1.13 NaN 1.00 0.00 16/11/2017 20:00
16/11/2017 22:20 3
90 1.15 1.34 0.24 0.76 17/11/2017 8:50
17/11/2017 10:20 3
90 0.90 1.44 0.91 0.09 17/11/2017 10:20
17/11/2017 11:20 3
90 1.01 1.25 0.73 0.27 17/11/2017 11:20
17/11/2017 12:20 3
90 1.00 1.22 0.51 0.49 17/11/2017 12:20
17/11/2017 13:00 C
90 1.08 NaN 1.00 0.00 17/11/2017 13:00
17/11/2017 14:30 C
90 0.88 1.09 0.62 0.38 17/11/2017 14:50
17/11/2017 15:30 C
Sources of uncertainty when exceeding the nominal maximum number concentration of the
NanoScan-SMPS.
During plasma spraying activities in both booth #1 and #3 the Nanoscan-SMPS often reported total
concentration values >106 cm-3, reaching in some cases 5 x 106 cm-3, thus exceeding the nominal
maximum total number concentration limit of the instrument (as stated by the manufacturer; TSI).
While the instrument manufacturer does not recommend its use, under these high concentrations,
these measurements can still be valid, although with slightly increased uncertainties, if all the
individual parts of the Nanoscan-SMPS operate within (or slightly above) their designed limits
(personal communication with TSI). A major concern with SMPS measurements under very high
number concentrations is the response of the particle detector (i.e., most usually a CPC downstream
the DMA), which could reach its maximum counting ability, thus reporting the same (i.e., the
maximum) number of particles through a wide number of size bins (or even at all of them). This has
a major impact in both the number concentration but also in the size that the instrument reports.
Such behavior however, was never encountered in our measurements (cf. Figs 1 and 2). Another part
of concern under very high particle concentrations is the DMA of an SMPS system, as the motion of
charged particles inside the DMA is not only dictated by the DMA's electric field but it can be distorted
as they electrically interact between each other. However, such a behavior has been observed mainly
for small nanoparticles (ca. 10 nm), which require low classification voltages, in DMAs operating with
> 108 cm-3 (Camata et al., 2001). Another part that can be affected by very high particle number
concentrations of particles is the charger of an SMPS system, as its efficiency can by reduced. The
NanoScan-SMPS carries a corona charger and its ion current is constantly monitored and regulated,

Chapter 4. Results
144
within some limits, by the instrument itself. In extreme cases (i.e., when the number concentration of
particles exceeds by far the design characteristics of the charger) the ion current drops significantly
and the instrument reports an error. In less extreme conditions, (i.e., the instrument's charger
operates at reduced efficiency but without reporting ion current error), deviations in particle size
and number concentration may appear (i.e., the instrument will report reduced particle size and
number concentration than the actual one). In our measurements a current error was never
encountered, indicating that the NanoScan-SMPS charger was operating within its (ion current)
design limits. In addition, previously published measurements, obtained with the same instrument,
the same technique, outside (i.e., far field) of the spray booths, at the same workplace, where the total
number concentration of particles was <105 cm-3 (i.e., well within the instruments concentration
limit), reported similar sizes of particles as the ones measured in this campaign, during thermal
spraying activities (cf. Salmatonidis et al., 2019). This is a strong indication that the performance of
the instrument was not demoted by the >106 cm-3 particle number concentrations, encountered
within the spraying booths in this campaign.
REFERENCES:
Allen, M. D and Raabe O. G. Slip correction measurements of spherical solid aerosol particles in an
improved Millikan apparatus. Aerosol Sci. Technol., 4:269-286, 1985.
Baron P. A and Willeke,K. Aerosol Measurement: Principles, Techniques and Applications. Second
Edition, Willey-InterScience, Inc., 2001.
Camata, R.P., Atwater, H. A., Flagan, R. C., Space-charge effects in nanoparticle processing using the
differential mobility analyzer. Aerosol Science 32, 583-599, 2001.
Davies, C. N. Definitive Equations for the Fluid Resistance of Spheres. Proc. Phys. Soc., 57:259–270,
1945.
Hinds, W.C. Aerosol Technology. New York: John Willey and Sons, 1999.
Kreidenweis, S.M., Petters, M.D., DeMott, P.J.: Single parameter estimates of aerosol water content,
Environ. Res. Lett., 3, 035002, 2008.
Petters, M.D. & Kreidenweis S.M.: A single parameter representation of hygroscopic growth and cloud
condensation nucleus activity, Atmos. Chem. Phys., 7, 1961-1971, 2007.
Salmatonidis, A., Ribalta, C., Sanfélix, V., Bezantakos, S., Biskos, G., Vulpoi, A. Simion, S., Monfort, E. and
Viana, M. Ann. Work Expo. Heal., 2019, 63, 91–106.
Chapter 4. Results
145
4.4. Scientific publication 4
Effectiveness of nanoparticle exposure mitigation measures in industrial
settings
Salmatonidis A.a,b *, Sanfélix V.c, Carpio P. c,d, Pawłowski L.e, Viana M.a, Monfort E.c
aInstitute of Environmental Assessment and Water Research (IDAEA-CSIC),08034 Barcelona, Spain
bUniversity of Barcelona, Faculty of Chemistry, 08028 Barcelona, Spain
cInstitute of Ceramic Technology (ITC), Universitat Jaume I, 12006 Castellón, Spain
dPolytechnic University of Valencia, 46022 Valencia, Spain
eInstitute of Research on Ceramics (IRCER), UMR CNRS 7315, 97068 Limoges, France
Published in: International Journal of Hygiene and Environmental Health, 2018, Volume
222, Pages 926–935
DOI: 10.1016/j.ijheh.2019.06.009
The following is a pre-print version, which was produced by the author, of an article submitted to
International Journal of Hygiene and Environmental Health (Elsevier): Submitted on 21 February
2019; revised on 27 May 2019; accepted on 24 June 2019. Available online at:
https://doi.org/10.1016/j.ijheh.2019.06.009
Chapter 4. Results
146
Effectiveness of nanoparticle exposure mitigation measures in industrial
settings
Salmatonidis A.a,b *, Sanfélix V.c, Carpio P.c, d, Pawłowski L.e, Viana M.a, Monfort E.c
aInstitute of Environmental Assessment and Water Research (IDAEA-CSIC),08034 Barcelona, Spain
bUniversity of Barcelona, Faculty of Chemistry, 08028 Barcelona, Spain
cInstitute of Ceramic Technology (ITC), Universitat Jaume I, 12006 Castellón, Spain
dPolytechnic University of Valencia, 46022 Valencia, Spain
eInstitute of Research on Ceramics (IRCER), UMR CNRS 7315, 97068 Limoges, France
* Corresponding author: A. Salmatonidis; Present address: Jordi Girona 18, 08034 Barcelona, Spain; email:
Abstract
Inhalation of airborne nanoparticles is a well-known source of potentially health-hazardous
occupational exposures. Effective mitigation measures are necessary to reduce exposure, but also
challenging to implement due to the different characteristics of each individual emission source and
industrial scenario. The present paper describes four different exposure case studies in the ceramic
industry and quantifies the effectiveness of mitigation strategies implemented during: ceramic tile
processing by thermal spraying, laser ablation, the use of diesel engines, and tile firing. The mitigation
measures for exposure reduction were tailored to each industrial scenario. The NP removal efficiency
of source enclosure (partial/full) combined with local exhaust ventilation (LEV) were quantified to
range between 65-85% when the enclosure was partial. The efficiency reached 99% with full
enclosure and vigorous ventilation (Air Change per Hour; ACH =132 h-1). The elimination of the
source was the optimal strategy to minimize exposure in the case of diesel forklifts use. The
conventional ceramic kilns used intensively (>10 years) generated high NP exposure concentrations
(>106 /cm3). Appropriate maintenance and enhanced sealing enabled the reduction of exposure
down to 52% of the initial value. It must be added that technologically advanced kilns, enabled even
greater NP reductions (down to 84%), compared to the conventional ones. This proves technological
improvements can lead to significant reduction of work exposures. This work evidences the need for
tailored mitigation measures due to the broad variety of potential sources and activities in industrial
scenarios. The quantitative efficiency rates reported here may be valuable for the adequate
parametrization of exposure prediction and risk assessment models.
Keywords: risk assessment; worker health; hygiene and safety; non-engineered nanoparticles;
ceramic industry; thermal processes
Chapter 4. Results
147
1. Introduction
The adverse effects of exposure to fine and coarse particles are well described in the literature (Pope
et al., 1995; Pope and Dockery, 2006). Exposure to nanoparticles (<100 nm; NPs) in workplaces has
been an issue of concern for the last decades, and the subject of numerous research studies (Brouwer,
2010; Brouwer et al., 2009, 2004; Hämeri et al., 2009; Seaton et al., 2010; Wiesner et al., 2006). The
health impacts deriving from inhalation of NPs results from their capacity to penetrate into the
deeper sections of the respiratory tract due to their small size has been established (Oberdorster,
2000; Oberdorster et al., 1992). NPs are also able to translocate to other body organs through the
blood stream (Donaldson et al., 2005; Oberdörster et al., 2004). Other health hazardous factors are
their surface area and chemical composition, which determine toxicological responses and
interactions with biological molecules (Schmid and Stoeger, 2017).
Nanoparticles found in industrial workplaces and impacting exposure originate generally from two
sources: (i) emission resulting from industrial activities and (ii) background aerosols. Nanoparticles
in ambient background air, frequently referred to as ultrafine particles (UFPs), result from
anthropogenic emissions (e.g. combustion products from vehicles) and from new particle formation
(e.g., atmospheric nucleation) among other sources (Brines et al., 2015; Kulmala et al., 2014; Pey et
al., 2009). The NPs emitted by industrial activities may be engineered and used as input/output in
the manufacturing process, or non-engineered and formed unintentionally as a result of a given
industrial activity. The latter are also referred to as process-generated (PGNPs; Van Broekhuizen et
al., 2012) and incidental NPs (Viitanen et al., 2017) are the subject of the present study which is
focused on ceramic industry.
A recent literature review, which assessed publications reporting industrial sources of UFPs particles
and exposure concentrations in workplaces (Viitanen et al., 2017) concluded that real exposures (e.g.
in welding and metal industry) were more than hundred times greater than those resulting from
background aerosols. The obtained results of measurements were not conclusive enough to draw
general conclusions with regard to exposure. In particular, NP release in the ceramic industry
resulting in worker exposures can be found in traditional pottery (Voliotis et al., 2014), in ceramic
tiles sintering (Fonseca et al., 2016) and in innovative processes (Fonseca et al., 2015; Salmatonidis
et al., 2018) such as high energy ones (e.g. thermal spraying; Salmatonidis et al., 2019; Viana et al.,
2017). Hence, there is sufficient evidence to conclude that unintentional NP release generates
statistically significant impacts on worker exposure in the ceramic industry.
Consequently, efficient exposure mitigation strategies must be implemented. Certain measures are
based on industrial practices and on the hierarchy of control methods (Conti et al., 2008; E.U., 2014;
Gerritzen et al., 2006; Schulte et al., 2008). The European Council Directive 98/24/EC (E.U., 2014)
recommends the elimination or isolation of sources as methods to minimize exposures to hazardous
substances in workplaces. If these measures are not applicable, engineering controls should be
applied (e.g. dilution and local exhaust ventilation) and finally personal protective equipment (PPE),
such as respirators or masks are recommended. A recent review that quantified the efficiency of PPE
and engineering controls (Goede et al., 2018), especially for engineered NPs in controlled scenarios
such as laboratories, reported that the available data are inconclusive. Previous studies discussed the
efficiency of PPE such as protective gloves, clothes, filtering facepieces respirators and half mask
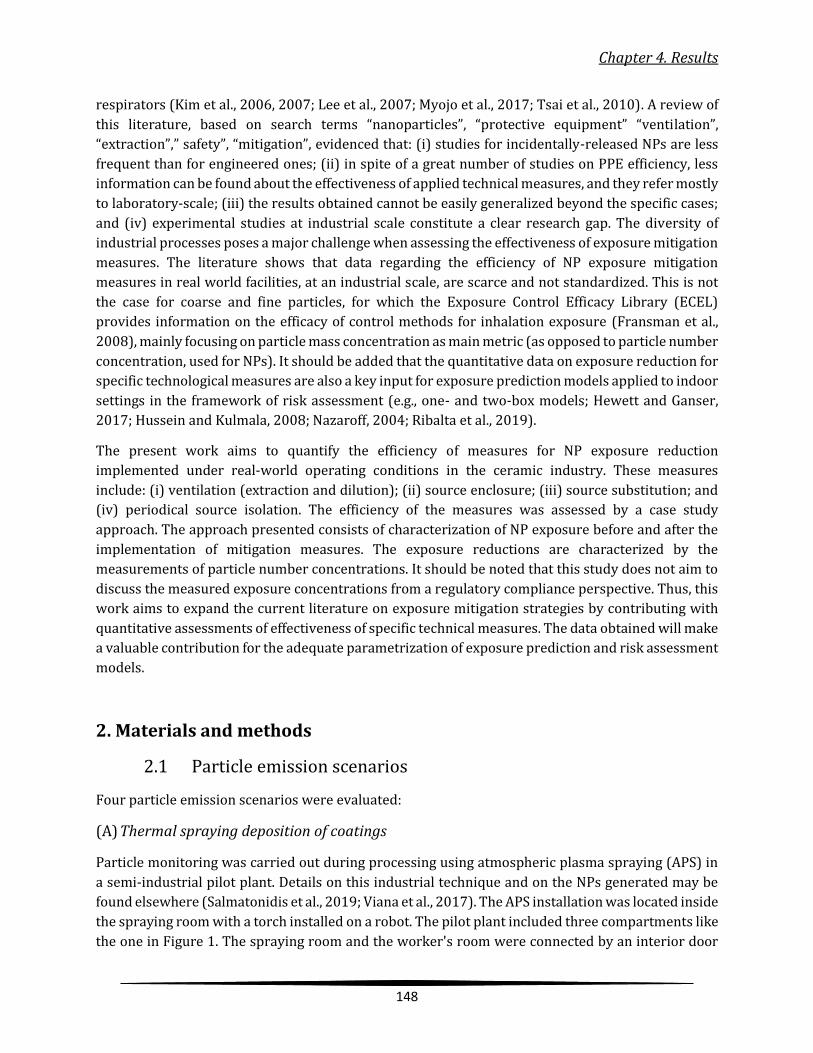
Chapter 4. Results
148
respirators (Kim et al., 2006, 2007; Lee et al., 2007; Myojo et al., 2017; Tsai et al., 2010). A review of
this literature, based on search terms “nanoparticles”, “protective equipment” “ventilation”,
“extraction”,” safety”, “mitigation”, evidenced that: (i) studies for incidentally-released NPs are less
frequent than for engineered ones; (ii) in spite of a great number of studies on PPE efficiency, less
information can be found about the effectiveness of applied technical measures, and they refer mostly
to laboratory-scale; (iii) the results obtained cannot be easily generalized beyond the specific cases;
and (iv) experimental studies at industrial scale constitute a clear research gap. The diversity of
industrial processes poses a major challenge when assessing the effectiveness of exposure mitigation
measures. The literature shows that data regarding the efficiency of NP exposure mitigation
measures in real world facilities, at an industrial scale, are scarce and not standardized. This is not
the case for coarse and fine particles, for which the Exposure Control Efficacy Library (ECEL)
provides information on the efficacy of control methods for inhalation exposure (Fransman et al.,
2008), mainly focusing on particle mass concentration as main metric (as opposed to particle number
concentration, used for NPs). It should be added that the quantitative data on exposure reduction for
specific technological measures are also a key input for exposure prediction models applied to indoor
settings in the framework of risk assessment (e.g., one- and two-box models; Hewett and Ganser,
2017; Hussein and Kulmala, 2008; Nazaroff, 2004; Ribalta et al., 2019).
The present work aims to quantify the efficiency of measures for NP exposure reduction
implemented under real-world operating conditions in the ceramic industry. These measures
include: (i) ventilation (extraction and dilution); (ii) source enclosure; (iii) source substitution; and
(iv) periodical source isolation. The efficiency of the measures was assessed by a case study
approach. The approach presented consists of characterization of NP exposure before and after the
implementation of mitigation measures. The exposure reductions are characterized by the
measurements of particle number concentrations. It should be noted that this study does not aim to
discuss the measured exposure concentrations from a regulatory compliance perspective. Thus, this
work aims to expand the current literature on exposure mitigation strategies by contributing with
quantitative assessments of effectiveness of specific technical measures. The data obtained will make
a valuable contribution for the adequate parametrization of exposure prediction and risk assessment
models.
2. Materials and methods
2.1 Particle emission scenarios
Four particle emission scenarios were evaluated:
(A) Thermal spraying deposition of coatings
Particle monitoring was carried out during processing using atmospheric plasma spraying (APS) in
a semi-industrial pilot plant. Details on this industrial technique and on the NPs generated may be
found elsewhere (Salmatonidis et al., 2019; Viana et al., 2017). The APS installation was located inside
the spraying room with a torch installed on a robot. The pilot plant included three compartments like
the one in Figure 1. The spraying room and the worker's room were connected by an interior door
Chapter 4. Results
149
(Figure 1), which may remain either closed or open (binary condition) during processing. The door
remains closed in routine processing (source enclosure). Sometimes, the operator should intervene
manually and the door was open (source partial enclosure). The APS area was equipped in with a
local exhaust ventilation (LEV) system. The particle monitoring locations were: (i) the spraying room
(emission source); (ii) the worker´s room (exposure area); and (iii) outdoor background (located in
the corridor outside of the worker´s room; Figure 1). The monitoring instruments were placed on a
desk, next to the operator at breathing height but not directly at the worker breathing zone. The
mitigation variables modified were door configuration (closed or open) and extraction flow rate in
the studied APS rooms, these two variables can be expressed in a single parameter: air changes per
hour (ACH).
Figure 1. Schematic illustration of the APS facility (scenario A), spraying room (left) and worker room (right).
(B) Laser ablation of ceramic tiles
The use of this technology in ceramic tile treatment and NP release mechanisms were studied
previously in laboratory (Salmatonidis et al., 2018) and in pilot-plant scales (Fonseca et al., 2015). In
this case study, the NP emissions associated to laser ablation of fired ceramic tiles was studied in an
industrial facility, in which the laser source was located in a partially closed chamber having volume
of 5.6 m3 equipped with a LEV system having ventilation capacity of about ca. 2000 /m3. The laser
processing was carried out discontinuously, with laser working cycle duration of ca. 2 minutes. The
measurements were performed at a distance of ca. 0.5 m from the emission source what is,
representative of the worker exposure area (Figure 2). The efficiency of NP reduction was measured
at: (i) laser inactivity (background); (ii) laser ablation with LEV; and (iii) laser ablation without LEV.

Chapter 4. Results
150
Figure 2. Schematic illustration of the measurement set-up during laser ablation of tiles (scenario B).
(C) Diesel engines emissions
The machines powered by diesel engines are widely used in indoor industrial facilities (Gaines et al.,
2008). The use should be reduced to comply with the upcoming indoor air exposure limit values for
carcinogen contaminants such as diesel soot measured as elemental carbon set by the European
Council Directive 2019/130 (EU, 2019). The directive sets the concentration limits equal to 0.05
mg/m3 after the year 2023., The impacts of the use of two Toyota 2z forklifts having power of 42 kW
(EU stage II clear) was studied inside an industrial workplace. The forklifts were continuously
operating inside the plant performing loading and unloading of material pallets. In this experiment it
was not possible to isolate the source from any secondary ones because of their continuous
movement. However, it could be assumed that diesel forklifts were the main NPs source in the
worker´s breathing zone. The particle concentration monitoring was performed in a stationary
location in the loading and unloading area (worker area). Moreover, a personal monitor was worn
by the forklift operator (breathing zone), working in an open cabin. The mitigation measure studied
was source substitution based on the use of electrically powered forklifts instead of the diesel ones.
(D) Ceramic tile firing in a roller hearth kiln
The study was carried out in an industrial plant for production of ceramic tiles (glazed white-body
earthenware wall tiles) under real operating conditions (peak temperatures around 1150ºC; Ferrer
et al., 2015). The activity included the use of a roller kiln (120 m-long), which is the most frequently-
used technology for firing ceramic tiles (Mezquita et al., 2014). The experimental measures were
performed outside the roller kiln at 1.5m in height and 2m aside from its external walls, every 10 m
Chapter 4. Results
151
along the kiln. The monitoring of NPs was performed in three areas which correspond to the firing
cycle: heating, firing and cooling. Three particle monitoring campaigns were carried out in the
industrial plant. The first campaign monitored a conventional kiln being in an intensive service for
ca. 10 years. The second campaign at the former kiln after having done maintenance works in the
refractory walls. The third campaign was carried out in a new and technologically advanced kiln with
optimized refractory conditions (being less than 2 years in service).
2.2 Mitigation strategies implemented and assessed
The case studies were performed to allow the assessment of three different mitigation strategies. The
strategies were classified following the hierarchy approach (E.U., 2014; Schulte et al., 2008) as:
source substitution/elimination, tested in particle emission scenario (C) in which the diesel
forklifts were substituted by the electric ones.
source isolation, tested in particle emission scenario (D) which comprised maintenance and
sealing improvement for enhancing source enclosure, during the operation of a roller kiln firing
ceramic tiles.
engineering controls, tested in the particle emission scenarios (A) and (B) (thermal spraying
and laser ablation, respectively) in which ventilation and LEV system were combined with source
enclosure.
The particle emission scenarios and the mitigation measures are shown in Table 1. All data were
obtained under real industrial operating conditions. The conditions include the production scale
(from kgs to tons), facility surface area (from tens to thousands m2), the number of workers (from
two to hundreds). The efficiency of mitigations measures was quantitatively determined, but some
practical limitations must be mentioned. Namely, the different mitigation measures overlapped in
some scenarios (e.g., LEV and partial source enclosure were operating in parallel in the APS facility)
or potential influence of external sources resulting from inadequate isolation of studied areas B, C
and D.
Table 1. Particle emission scenarios and applied mitigation measures.
Case study Activity-Source Scale of facility Mitigation measure
A Atmospheric plasma
spraying Semi-industrial
Engineering controls: LEV &
partial/full enclosure
B Laser ablation Industrial Engineering controls: LEV & partial
enclosure
C Diesel forklifts Industrial Source substitution
D Ceramic tile firing Industrial Source isolation: refurbishment &
technology upgrade
Chapter 4. Results
152
2.3 Particle monitoring instrumentation
Workplace exposure assessments were carried out by monitoring particle number concentration and
their mean diameter, using online instrumentation (Table 2). The monitors measured particle
diameters range from 4nm to 32µm. Particle number concentrations were monitored with fixed and
portable instrumentation (TSI CPC 3775; DiSCmini, TESTO) and size distributions were measured
using NanoScan-SMPS (TSI 3910) and a laser spectrometer (Mini WRAS 1371, GRIMM). All
instruments were intercompared prior to the measurements for quality assurance purposes. The
performance of the DiscMini and NanoScan monitors and the intercomparison methodology were
recommended elsewhere (Fonseca et al., 2016; Viana et al., 2015).
Table 2. Instrumentation used for particle monitoring.
Instruments Size range
(nm) Data recorded Sampling locations
NanoScan-SMPS (TSI
3910) 10-420
Size resolved particle number
concentration (#/cm3)
Emission source
Worker area
Condensation Particle
Counter (CPC, TSI 3775) 4-3000
Total particle number
concentration (#/cm3)
Emission source
Worker area
Diffusion Size Classifier
miniature (DiSCmini,
TESTO)
10-700
Particle number concentration
(#/cm3), mean diameter (Dp,
nm)
Emission source
Indoor background
Outdoor background
Mini Laser Aerosol
Spectrometer (Mini-LAS
11R, GRIMM)
250-32000 Size segregated mass
concentration (µg/m3)
Emission source
Indoor background
Outdoor background
Mini Wide Range Aerosol
Spectrometer (Mini WRAS
1371, GRIMM)
10-32000
Size resolved particle number
concentration (#/cm3), Size
segregated mass concentration
(µg/m3)
Indoor background
Outdoor background
Particle number concentrations were monitored at the emission source, in the worker area or in the
breathing zone (depending on the scenario) in indoor and outdoor locations (OECD, 2015;
Ramachandran et al., 2011). The indoor (background) location was located at a distance greater than
2 m from the emission source in each case to avoid potential interferences. The outdoor location was
to evaluate the possible contribution of outdoor sources (e.g., road traffic).
The effectiveness of the exposure mitigation measures (EEMM) was quantified according to Eq. 1:
𝐸𝐸𝑀𝑀 = (1 − 𝐶𝐸𝑀𝑀
𝐶0) × 100 (1)
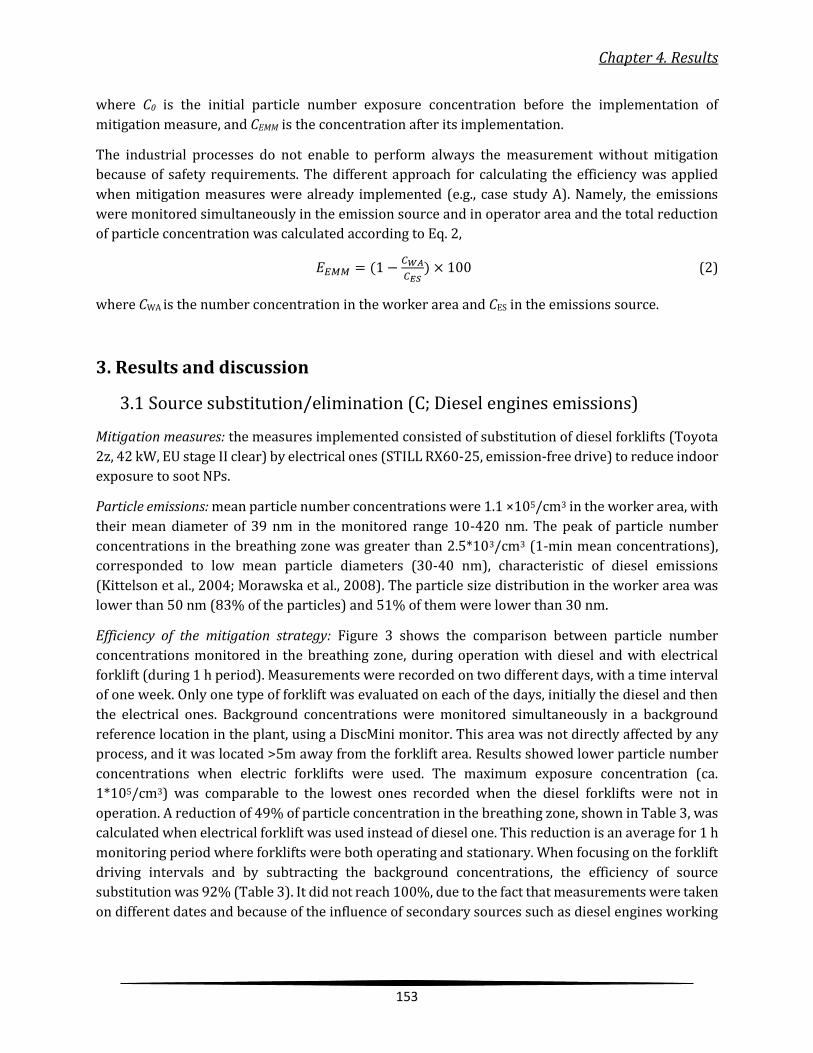
Chapter 4. Results
153
where C0 is the initial particle number exposure concentration before the implementation of
mitigation measure, and CEMM is the concentration after its implementation.
The industrial processes do not enable to perform always the measurement without mitigation
because of safety requirements. The different approach for calculating the efficiency was applied
when mitigation measures were already implemented (e.g., case study A). Namely, the emissions
were monitored simultaneously in the emission source and in operator area and the total reduction
of particle concentration was calculated according to Eq. 2,
𝐸𝐸𝑀𝑀 = (1 −𝐶𝑊𝐴
𝐶𝐸𝑆) × 100 (2)
where CWA is the number concentration in the worker area and CES in the emissions source.
3. Results and discussion
3.1 Source substitution/elimination (C; Diesel engines emissions)
Mitigation measures: the measures implemented consisted of substitution of diesel forklifts (Toyota
2z, 42 kW, EU stage II clear) by electrical ones (STILL RX60-25, emission-free drive) to reduce indoor
exposure to soot NPs.
Particle emissions: mean particle number concentrations were 1.1 ×10⁵/cm3 in the worker area, with
their mean diameter of 39 nm in the monitored range 10-420 nm. The peak of particle number
concentrations in the breathing zone was greater than 2.5*103/cm3 (1-min mean concentrations),
corresponded to low mean particle diameters (30-40 nm), characteristic of diesel emissions
(Kittelson et al., 2004; Morawska et al., 2008). The particle size distribution in the worker area was
lower than 50 nm (83% of the particles) and 51% of them were lower than 30 nm.
Efficiency of the mitigation strategy: Figure 3 shows the comparison between particle number
concentrations monitored in the breathing zone, during operation with diesel and with electrical
forklift (during 1 h period). Measurements were recorded on two different days, with a time interval
of one week. Only one type of forklift was evaluated on each of the days, initially the diesel and then
the electrical ones. Background concentrations were monitored simultaneously in a background
reference location in the plant, using a DiscMini monitor. This area was not directly affected by any
process, and it was located >5m away from the forklift area. Results showed lower particle number
concentrations when electric forklifts were used. The maximum exposure concentration (ca.
1*105/cm3) was comparable to the lowest ones recorded when the diesel forklifts were not in
operation. A reduction of 49% of particle concentration in the breathing zone, shown in Table 3, was
calculated when electrical forklift was used instead of diesel one. This reduction is an average for 1 h
monitoring period where forklifts were both operating and stationary. When focusing on the forklift
driving intervals and by subtracting the background concentrations, the efficiency of source
substitution was 92% (Table 3). It did not reach 100%, due to the fact that measurements were taken
on different dates and because of the influence of secondary sources such as diesel engines working
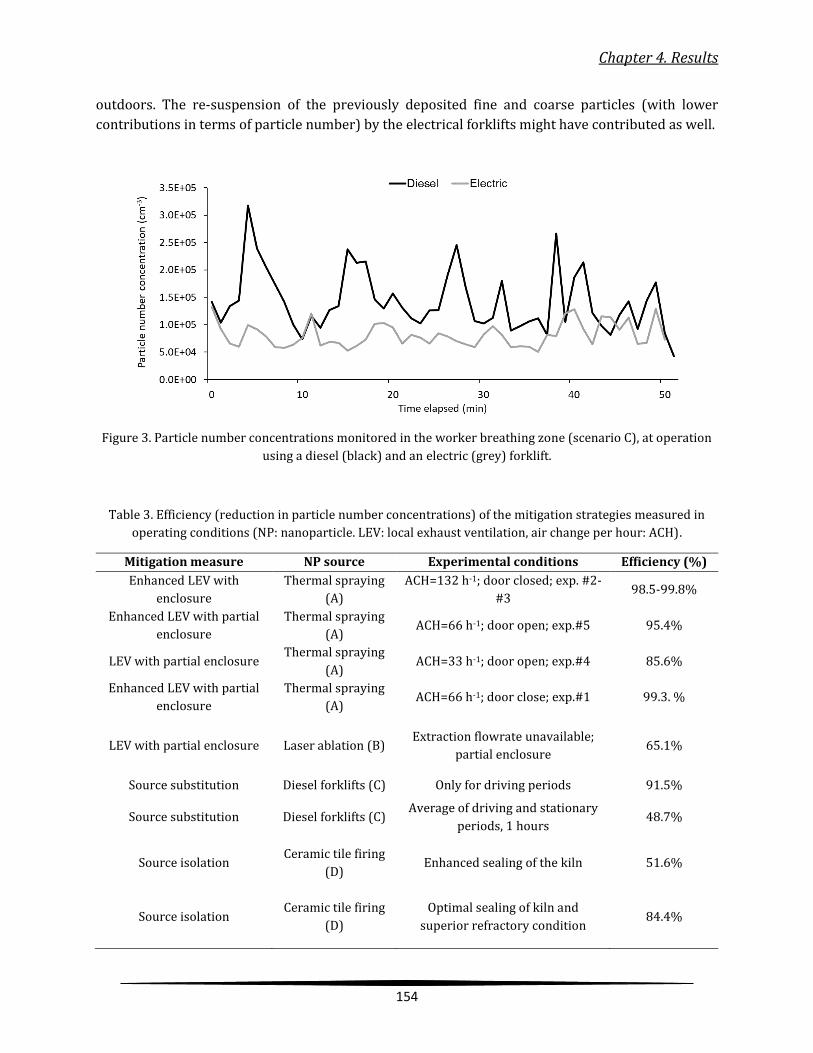
Chapter 4. Results
154
outdoors. The re-suspension of the previously deposited fine and coarse particles (with lower
contributions in terms of particle number) by the electrical forklifts might have contributed as well.
Figure 3. Particle number concentrations monitored in the worker breathing zone (scenario C), at operation
using a diesel (black) and an electric (grey) forklift.
Table 3. Efficiency (reduction in particle number concentrations) of the mitigation strategies measured in
operating conditions (NP: nanoparticle. LEV: local exhaust ventilation, air change per hour: ACH).
Mitigation measure NP source Experimental conditions Efficiency (%)
Enhanced LEV with
enclosure
Thermal spraying
(A)
ACH=132 h-1; door closed; exp. #2-
#3 98.5-99.8%
Enhanced LEV with partial
enclosure
Thermal spraying
(A) ACH=66 h-1; door open; exp.#5 95.4%
LEV with partial enclosure Thermal spraying
(A) ACH=33 h-1; door open; exp.#4 85.6%
Enhanced LEV with partial
enclosure
Thermal spraying
(A) ACH=66 h-1; door close; exp.#1 99.3. %
LEV with partial enclosure Laser ablation (B) Extraction flowrate unavailable;
partial enclosure 65.1%
Source substitution Diesel forklifts (C) Only for driving periods 91.5%
Source substitution Diesel forklifts (C) Average of driving and stationary
periods, 1 hours 48.7%
Source isolation Ceramic tile firing
(D) Enhanced sealing of the kiln 51.6%
Source isolation Ceramic tile firing
(D)
Optimal sealing of kiln and
superior refractory condition 84.4%
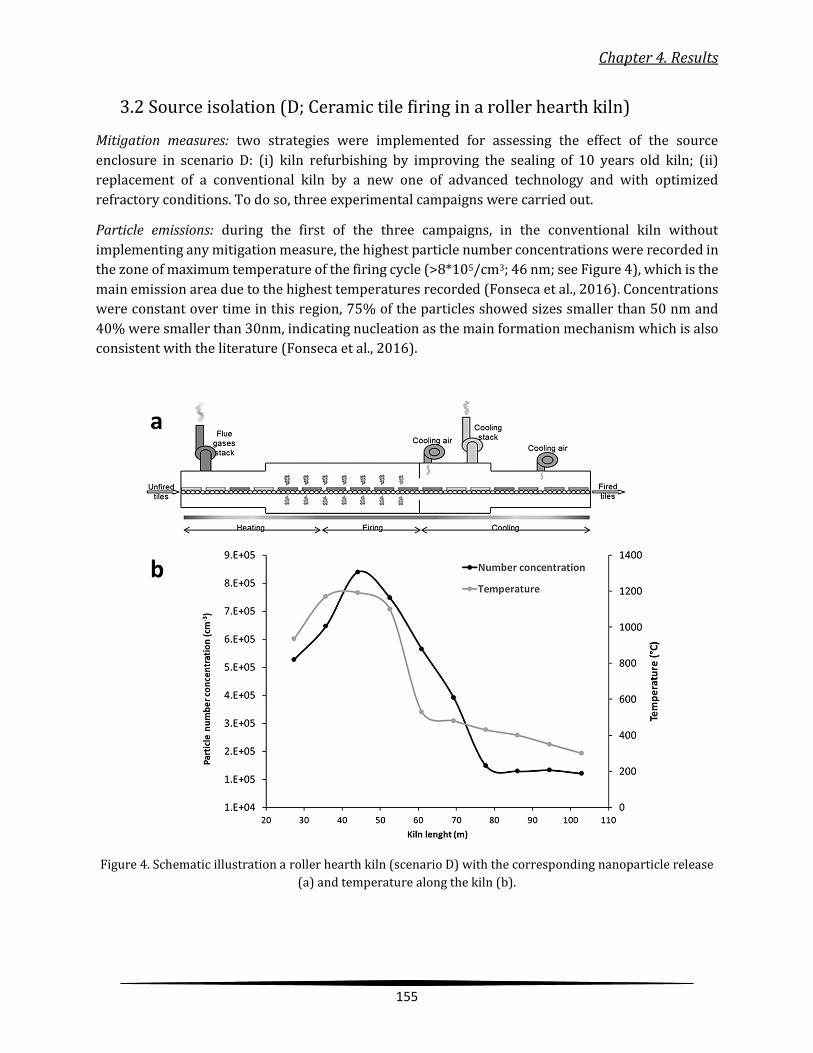
Chapter 4. Results
155
3.2 Source isolation (D; Ceramic tile firing in a roller hearth kiln)
Mitigation measures: two strategies were implemented for assessing the effect of the source
enclosure in scenario D: (i) kiln refurbishing by improving the sealing of 10 years old kiln; (ii)
replacement of a conventional kiln by a new one of advanced technology and with optimized
refractory conditions. To do so, three experimental campaigns were carried out.
Particle emissions: during the first of the three campaigns, in the conventional kiln without
implementing any mitigation measure, the highest particle number concentrations were recorded in
the zone of maximum temperature of the firing cycle (>8*105/cm3; 46 nm; see Figure 4), which is the
main emission area due to the highest temperatures recorded (Fonseca et al., 2016). Concentrations
were constant over time in this region, 75% of the particles showed sizes smaller than 50 nm and
40% were smaller than 30nm, indicating nucleation as the main formation mechanism which is also
consistent with the literature (Fonseca et al., 2016).
Figure 4. Schematic illustration a roller hearth kiln (scenario D) with the corresponding nanoparticle release
(a) and temperature along the kiln (b).

Chapter 4. Results
156
Efficiency of the mitigation strategies: as a first stage to mitigate worker exposure to high NP
concentrations, the maintenance and sealing of the old kiln in the firing zone were carried out. The
efficiency of these measures was evaluated during the second monitoring campaign. Additionally, in
a third stage, a new high-efficiency roller kiln was installed and its emission efficiency was also
assessed. The reduction of NP emissions throughout the three different campaigns was observed
(Figure S1, Supplementary material). The concentration for the old kiln dropped from 1×10⁶/cm3 to
5×10⁵/cm3 for the refurbished kiln and down to 1.6×10⁵/cm3 measured for the new, advanced kiln
(Figure S1).
The adequate maintenance of the old kiln, including enhanced sealing, resulted in 51.6% of NP
concentration reduction (Table 3). The particle number concentration decreased from 1×10⁶ to
5×10⁵/cm3 along the wall of the kiln’s firing zone. The use of new kiln reduced NP concentrations by
84.4%, compared to the old and refurbished one (Table 3). The concentration decreased from 1×10⁶/
cm3 to 1.6×10⁵/ cm3 as shown in Figure 5. These decreases were linked to the different conditions of
the refractory materials, which were used to insulate the firing compartment of the kiln. Whereas the
renovation of the conventional kiln was able to reduce particle release (52%, Table 3), this reduction
was lower than that obtained from the operation of the advanced kiln with superior refractory
sealing and energy efficiency, which proved to be also more efficient in terms of emissions reduction
(84%, Table 3). In the cooling sections of the kilns (Figure 4a), results evidenced that the exposure
concentrations around both kilns (conventional and advanced) were similar. Thus, the effective as
well as targeted enclosure of the firing process, the optimum refractory condition and maintenance
of the insulating materials are key parameters governing workplace exposure in ceramic tile firing
facilities.
Figure 5. Emissions of particle in terms of number concentration along two kilns (scenario D): conventional
(black curve) and advanced (grey curve). The peak at 45 m corresponds to the highest temperature zone
(firing).

Chapter 4. Results
157
3.3 Engineering controls: ventilation and LEV system combined with
source enclosure (A; thermal spraying deposition of coatings, and B; laser
ablation of ceramic tiles)
The efficiency of specific ventilation and LEV combined with source enclosure measures was
assessed in two particle emission scenarios described above, namely during: (A) thermal spraying
deposition of coatings, and (B) laser ablation of ceramic tiles.
(A) Thermal spraying deposition of ceramic coatings
Mitigation measure: a LEV system was located directly above the APS area, extracting 24000 m3/hour
from three spraying rooms. Therefore, the extraction rate of the LEV fluctuated with the number of
APS installations operating simultaneously. It should be noted that the maximum extraction rates can
be considered high for such a pilot plant. The LEV system included a capturing hood covering the
emission source and a duct without flanges with 0.36m diameter. An open hatch on the ceiling
provided air supply to the spraying room when the LEV was active. The air exchange rate (ACH in Eq.
3) varied from 132 to 33 h-1 depending on the extraction flow rate of the LEV system and on the
binary condition of the interior door (open/closed) influencing the total volume of affected area. The
ACH was calculated according to Eq. 3:
𝐸𝑥𝑡𝑟𝑎𝑐𝑡𝑖𝑜𝑛 𝑓𝑙𝑜𝑤 (𝑚3
ℎ)
𝑉𝑜𝑙𝑢𝑚𝑒 𝑜𝑓 𝑎𝑓𝑓𝑒𝑐𝑡𝑒𝑑 𝑎𝑟𝑒𝑎 (𝑚3)= 𝐴𝐶𝐻 (ℎ−1) (3)
Particle emissions: in total there were 30 spraying events, 11 for spraying micro-sized NiCrAlY and
ZrO2+(4mol%)Y2O3 powders and 19 times for spraying liquid precursors Zn(NO3)2·6H2O,
Zn(O2CCH3)2, C8H12O8Zr). Table 4 summarises the details about representative spraying experiments,
as well as the measured exposure concentrations in terms of particle number inside the spraying and
the worker room. Mean particle number concentrations ranged between 3.7*105/cm3 - 1.5*106/cm3
and mean particle sizes were in the range 26-45 nm inside the spraying room, while in the operator
area concentrations ranged from 3.3*103/cm3 to 5.4*104/cm3 (Table 4) and sizes from 32-59 nm. For
all of the experiments, particle number concentrations were orders of magnitude higher inside the
spraying room than in the operator area even when the door was open.
Table 4. Mean particle number concentrations inside the spraying room and in the exposure area (worker
room), and experimental details for each of the experimental runs (scenario A, LEV: local exhaust ventilation,
air change per hour: ACH).
Experiment parameters Particle number concentration (cm-3)
Run Feedstock LEV flowrate
(m3/h) ACH (h-1)
Interior door Spraying room Worker room
#1 NiCrAlY 12000 66 closed 9.2 x 10⁵ 6.9 x 10³
#2 NiCrAlY 24000 132 closed 1.5 x 10⁶ 3.3 x 10³ #3 ZrO2+4mol%Y2O3 24000 132 closed 6.6 x 10⁵ 5.2 x 10³
#4 Zn(NO3)2·6H2O 12000 33 opened 3.7 x 10⁵ 5.4 x 10⁴
#5 Zn(NO3)2·6H2O 24000 66 opened 5.0 x 10⁵ 2.3 x 10⁴
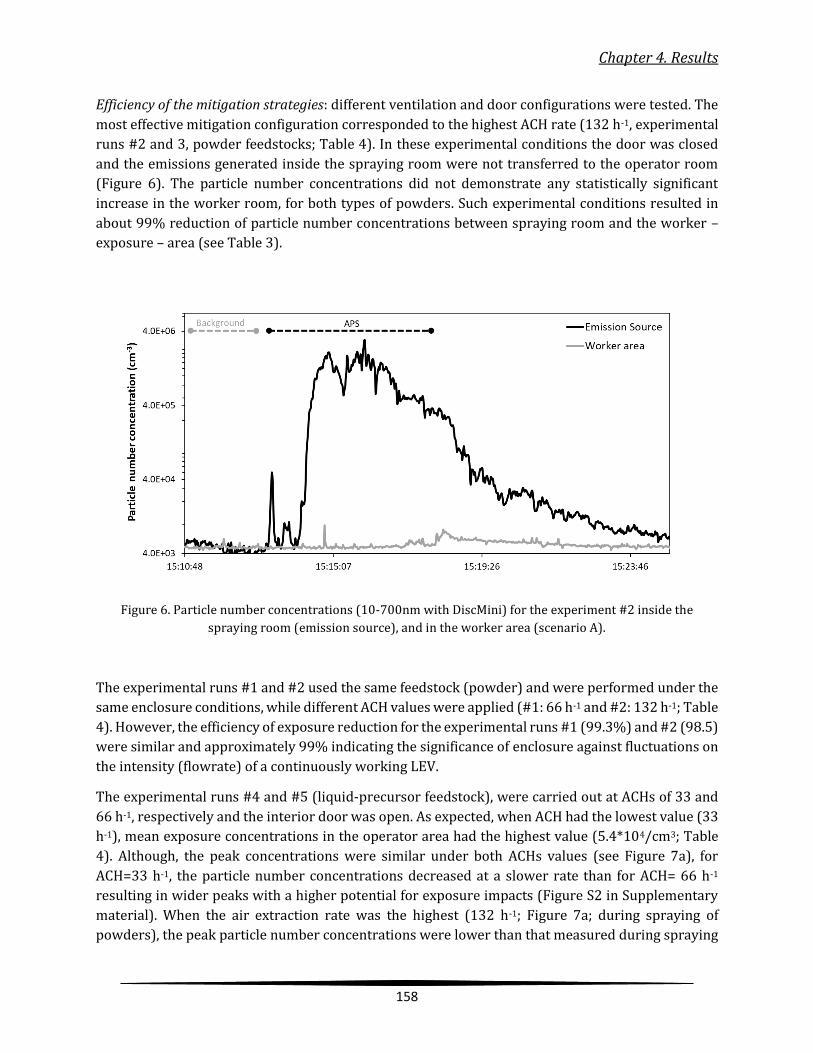
Chapter 4. Results
158
Efficiency of the mitigation strategies: different ventilation and door configurations were tested. The
most effective mitigation configuration corresponded to the highest ACH rate (132 h-1, experimental
runs #2 and 3, powder feedstocks; Table 4). In these experimental conditions the door was closed
and the emissions generated inside the spraying room were not transferred to the operator room
(Figure 6). The particle number concentrations did not demonstrate any statistically significant
increase in the worker room, for both types of powders. Such experimental conditions resulted in
about 99% reduction of particle number concentrations between spraying room and the worker –
exposure – area (see Table 3).
Figure 6. Particle number concentrations (10-700nm with DiscMini) for the experiment #2 inside the
spraying room (emission source), and in the worker area (scenario A).
The experimental runs #1 and #2 used the same feedstock (powder) and were performed under the
same enclosure conditions, while different ACH values were applied (#1: 66 h-1 and #2: 132 h-1; Table
4). However, the efficiency of exposure reduction for the experimental runs #1 (99.3%) and #2 (98.5)
were similar and approximately 99% indicating the significance of enclosure against fluctuations on
the intensity (flowrate) of a continuously working LEV.
The experimental runs #4 and #5 (liquid-precursor feedstock), were carried out at ACHs of 33 and
66 h-1, respectively and the interior door was open. As expected, when ACH had the lowest value (33
h-1), mean exposure concentrations in the operator area had the highest value (5.4*104/cm3; Table
4). Although, the peak concentrations were similar under both ACHs values (see Figure 7a), for
ACH=33 h-1, the particle number concentrations decreased at a slower rate than for ACH= 66 h-1
resulting in wider peaks with a higher potential for exposure impacts (Figure S2 in Supplementary
material). When the air extraction rate was the highest (132 h-1; Figure 7a; during spraying of
powders), the peak particle number concentrations were lower than that measured during spraying
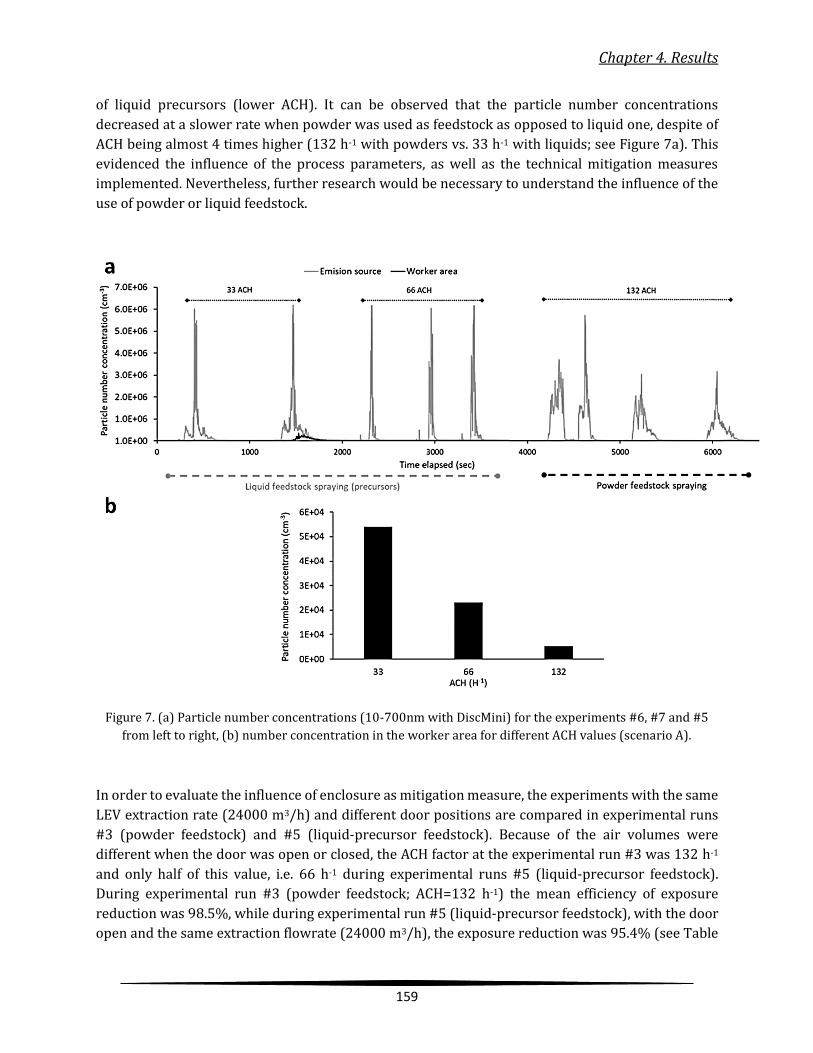
Chapter 4. Results
159
of liquid precursors (lower ACH). It can be observed that the particle number concentrations
decreased at a slower rate when powder was used as feedstock as opposed to liquid one, despite of
ACH being almost 4 times higher (132 h-1 with powders vs. 33 h-1 with liquids; see Figure 7a). This
evidenced the influence of the process parameters, as well as the technical mitigation measures
implemented. Nevertheless, further research would be necessary to understand the influence of the
use of powder or liquid feedstock.
Figure 7. (a) Particle number concentrations (10-700nm with DiscMini) for the experiments #6, #7 and #5
from left to right, (b) number concentration in the worker area for different ACH values (scenario A).
In order to evaluate the influence of enclosure as mitigation measure, the experiments with the same
LEV extraction rate (24000 m3/h) and different door positions are compared in experimental runs
#3 (powder feedstock) and #5 (liquid-precursor feedstock). Because of the air volumes were
different when the door was open or closed, the ACH factor at the experimental run #3 was 132 h-1
and only half of this value, i.e. 66 h-1 during experimental runs #5 (liquid-precursor feedstock).
During experimental run #3 (powder feedstock; ACH=132 h-1) the mean efficiency of exposure
reduction was 98.5%, while during experimental run #5 (liquid-precursor feedstock), with the door
open and the same extraction flowrate (24000 m3/h), the exposure reduction was 95.4% (see Table

Chapter 4. Results
160
3). It can be concluded that, for experimental runs #3 (powder feedstock) and #5 (liquid-precursor
feedstock), the impact of the extraction flowrate on exposure mitigation was stronger than that of
the enclosure (door open/closed). The difference in reduction efficiency becomes wider when
experiments with lower extraction rate (12000 m3/h) and different door positions are compared (#1
vs. #4; powder vs. liquid-precursor feedstock, respectively). The efficiency decreased to 85.6%
during experiment run #4 (liquid-precursor feedstock), which was performed with the door open,
while when the door was closed the efficiency was higher (99.3%; Table 3). According to this
comparison (#1 vs. #4; powder vs. liquid-precursor feedstock, respectively) the enclosure has a
higher influence in reducing exposure than the previous comparison (#3 vs. #5; powder vs. liquid-
precursor feedstock, respectively), which is an indication that enclosure becomes more effective
when LEV is less efficient, and vice versa. Similar conclusions were drawn by Salmatonidis et al.,
(2019) during the exposure assessment of thermal spraying processes at industrial scale; where it
was demonstrated that despite a fully operating LEV, when the enclosure of the spraying booth was
degraded, fugitive emissions significantly impacted exposure in the worker area.
Thus, a combination of different factors (process parameters-feedstock, air flow rate, and enclosure)
should be taken into account to improve the efficiency of mitigation measures under real-world
conditions. Nevertheless, the most efficient measure is the ACH (coupling LEV with enclosure) as can
be observed in Figure 7b, where the reduction of particle number with increase of ACH is evidenced.
(B) Laser ablation of ceramic tiles
Mitigation measure: the laser engraving set up was equipped with a 5.6 m3 capturing hood, partially
enclosed, with an integrated LEV system operating with a fixed extraction flowrate (2000 m3 h-1).
The laser was located in an industrial building of 8000 m3, naturally ventilated, where a previous
screening (not shown) indicated that there were no additional significant NPs sources. Two
experimental conditions were evaluated: with and without extraction.
Particle emissions: particles were generated during a repetitive batch process: each tile was ablated
during approximately two minutes. Mean particle concentrations monitored in the exposure area
reached 6*105/cm3 (maximum). Average concentrations (1-min) during the period with no
extraction were 3.5*104/cm3 and mean particles size 175 nm (range 10-700 nm). When the LEV was
fully operating the above values altered to 1.2*104/cm3 and 109 nm, respectively.
Effectiveness of the mitigation strategy: Figure 8 shows an evident reduction in particle number
exposure concentrations, once the LEV system was activated, with an average efficiency of 65% over
a 30-minute monitoring period (Table 3). The exposure reduction was lower than in case study A
(with efficiency greater than 85%).The lower efficiency, compared to the thermal spraying, was
probably due to worse enclosure in the laser ablation scenario and lower ventilation rate. This result
shows the interdependence between extraction and source enclosure. Salmatonidis et al. (2018)
demonstrated that during the laser ablation of ceramic tiles, lower extraction and no enclosure were
sufficient to mitigate high particle emissions at laboratory-scale. Hence, since the scale of the
scenarios might influence the effectiveness of control measures, the assessment in real industrial
conditions becomes necessary.
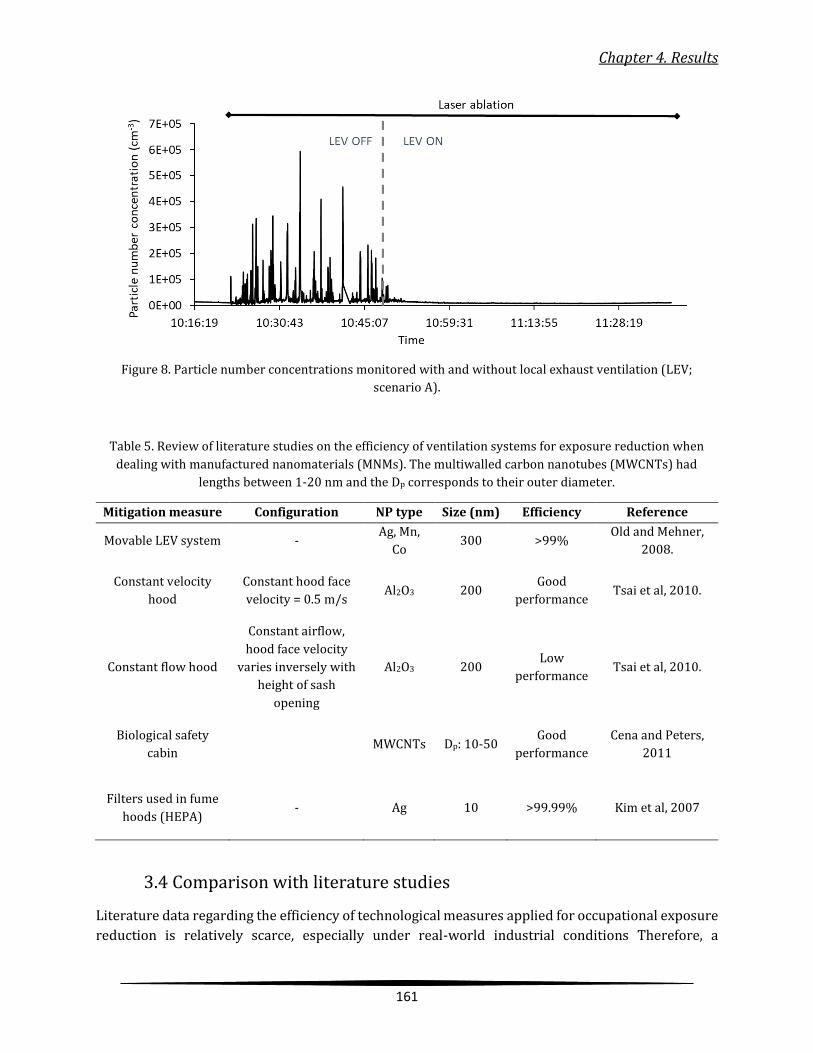
Chapter 4. Results
161
Figure 8. Particle number concentrations monitored with and without local exhaust ventilation (LEV;
scenario A).
Table 5. Review of literature studies on the efficiency of ventilation systems for exposure reduction when
dealing with manufactured nanomaterials (MNMs). The multiwalled carbon nanotubes (MWCNTs) had
lengths between 1-20 nm and the Dp corresponds to their outer diameter.
Mitigation measure Configuration NP type Size (nm) Efficiency Reference
Movable LEV system - Ag, Mn,
Co 300 >99%
Old and Mehner,
2008.
Constant velocity
hood
Constant hood face
velocity = 0.5 m/s Al2O3 200
Good
performance Tsai et al, 2010.
Constant flow hood
Constant airflow,
hood face velocity
varies inversely with
height of sash
opening
Al2O3 200 Low
performance Tsai et al, 2010.
Biological safety
cabin MWCNTs Dp: 10-50
Good
performance
Cena and Peters,
2011
Filters used in fume
hoods (HEPA) - Ag 10 >99.99% Kim et al, 2007
3.4 Comparison with literature studies
Literature data regarding the efficiency of technological measures applied for occupational exposure
reduction is relatively scarce, especially under real-world industrial conditions Therefore, a

Chapter 4. Results
162
comparison of the obtained results was carried out with a number of studies focusing on the
effectiveness of ventilation systems used for exposure reduction to manufactured nanomaterials
(Table 5). The studies shown in Table 5 were carried out at laboratory scale, simulating real operating
conditions. In the present work, the efficiency of LEV systems was strongly depending on the volume
of air in working room and on ventilation rates. The achieved exposure reductions were in the range
65%-99% being lower than 99% reduction reported by Kim et al., (2007) and by Old and Methner
(2008). The studies of Cena and Peters (2011) and of Tsai et al., (2010) reported efficiencies only
qualitatively, as “good” or “low”. This review evidences that quantitative, experimental and real-
world assessments of the efficiency of mitigation strategies is missing in the literature devoted to
occupational exposure and NP safety research. Our results highlight the interdependence of different
mitigation strategies (e.g., LEV and source enclosure), which are frequently implemented
simultaneously in real-world industrial scenarios. Unless this kind of scenarios are characterized in
detail and for an ample number of NP emission sources, the implementation of exposure modelling
tools will be strongly hindered.
4. Conclusions
The effectiveness of different mitigation measures for NP exposure reduction was assessed in four
industrial settings. The following conclusions can be drawn:
- The efficiency of common engineering control mitigation measures such as local exhaust
ventilation (LEV) and source enclosure can vary significantly depending on the intensity of
LEV (flowrate), the total volume of air in the exposure area, the type of enclosure (e.g. partial,
total), and their combinations. Adequate LEV configurations may reduce exposure
concentrations (in terms of particle number) by 65-85% and even reach 99% by combining
higher flow rates and enhanced enclosure.
- Adequate maintenance operations and enhanced sealing were applied to an industrial kiln
used for firing ceramic tiles. Source isolation based on improved sealing in the firing
compartment reduced exposure concentrations by 52%. In addition, a new kiln operating
with an enhanced sealed combustion hearth minimised NP release in the worker area down
to 84% of the measured exposure concentrations. In this case study, however, particle
number concentrations remained high after the implementation of the mitigation strategies
(ca. 105 cm-3). In spite of the fact that the presence of workers in the kiln zone is limited,
additional measures would be required to improve workers’ protection.
- The emissions from diesel engines significantly impact indoor the exposure to NPs.
Substituting diesel with electric forklifts achieved a 92% reduction of particle number
concentrations in breathing zone when the forklifts were in operation.
A review of the literature available evidenced the major need for real-world assessments of the
efficiency of exposure mitigation strategies. One clear challenge identified is the interdependence of
different strategies, which are frequently implemented simultaneously in industrial settings. The
diversity of emission sources (stationary processes, moving vehicles, size of infrastructure, etc.)
Chapter 4. Results
163
contribute to the complexity of this type of assessment. However, these data are necessary as input
for exposure modelling and risk assessment tools.
Conflicts of interest
The authors declare no conflict of interest relating to the material presented in this article. Its
contents, including any opinions and/ or conclusions expressed, are solely those of the authors.
Acknowledgements
The authors gratefully acknowledge the collaboration of the European Ceramics Centre in Limoges.
This work was carried out in the framework of the CERASAFE project (www.cerasafe.eu), with the
support of SIINN ERA-NET (project id: 16), and was funded by the Spanish MINECO (PCIN-2015-173-
C02-01). Partial funding from the “Generalitat de Catalunya” (project number: AGAUR 2017 SGR41)
is also acknowledged.

Chapter 4. Results
164
References
Brines, M., Dall’Osto, M., Beddows, D.C.S., Harrison, R.M., Gómez-Moreno, F., Núñez, L., Art\’\iñano, B.,
Costabile, F., Gobbi, G.P., Salimi, F., Morawska, L., Sioutas, C., Querol, X., 2015. Traffic and nucleation events as
main sources of ultrafine particles in high-insolation developed world cities. Atmos. Chem. Phys. 15, 5929–
5945. https://doi.org/10.5194/acp-15-5929-2015
Brouwer, D., 2010. Exposure to manufactured nanoparticles in different workplaces. Toxicology 269, 120–
127. https://doi.org/10.1016/j.tox.2009.11.017
Brouwer, D., Van Duuren-Stuurman, B., Berges, M., Jankowska, E., Bard, D., Mark, D., 2009. From workplace air
measurement results toward estimates of exposure? Development of a strategy to assess exposure to
manufactured nano-objects. J. Nanoparticle Res. 11, 1867–1881. https://doi.org/10.1007/s11051-009-9772-
1
Brouwer, D.H., Gijsbers, J.H.J., Lurvink, M.W.M., 2004. Personal exposure to ultrafine particles in the
workplace: Exploring sampling techniques and strategies. Ann. Occup. Hyg. 48, 439–453.
https://doi.org/10.1093/annhyg/meh040
Cena, L.G., Peters, T.M., 2011. Characterization and control of airborne particles emitted during production of
epoxy/carbon nanotube nanocomposites. J. Occup. Environ. Hyg. 8, 86–92.
https://doi.org/10.1080/15459624.2011.545943
Conti, J.A., Killpack, K., Gerritzen, G., Huang, L., Mircheva, M., Delmas, M., Harthorn, B.H., Appelbaum, R.P.,
Holden, P.A., 2008. Health and safety practices in the nanomaterials workplace: Results from an international
survey. Environ. Sci. Technol. 42, 3155–3162. https://doi.org/10.1021/es702158q
Donaldson, K., Tran, L., Jimenez, L.A., Duffin, R., Newby, D.E., Mills, N., MacNee, W., Stone, V., 2005.
Combustion-derived nanoparticles: A review of their toxicology following inhalation exposure. Part. Fibre
Toxicol. 2, 1–14. https://doi.org/10.1186/1743-8977-2-10
E.U., 2014. COUNCIL DIRECTIVE 98/24/EC. Off. J. Eur. Communities.
Ferrer, S., Mezquita, A., Gomez-Tena, M.P., Machi, C., Monfort, E., 2015. Estimation of the heat of reaction in
traditional ceramic compositions. Appl. Clay Sci. 108, 28–39. https://doi.org/10.1016/j.clay.2015.02.019
Fonseca, A. S., Maragkidou, A., Viana, M., Querol, X., Hämeri, K., de Francisco, I., Estepa, C., Borrell, C., Lennikov,
V., de la Fuente, G.F., 2016. Process-generated nanoparticles from ceramic tile sintering: Emissions, exposure
and environmental release. Sci. Total Environ. 565, 922–932.
https://doi.org/10.1016/j.scitotenv.2016.01.106
Fonseca, A S, Viana, M., Pérez, N., Alastuey, A., Querol, X., Kaminski, H., Todea, A.M., Monz, C., Asbach, C., 2016.
Intercomparison of a portable and two stationary mobility particle sizers for nanoscale aerosol
measurements. Aerosol Sci. Technol. 50, 653–668. https://doi.org/10.1080/02786826.2016.1174329
Fonseca, A.S., Viana, M., Querol, X., Moreno, N., de Francisco, I., Estepa, C., de la Fuente, G.F., 2015. Ultrafine
and nanoparticle formation and emission mechanisms during laser processing of ceramic materials. J. Aerosol
Sci. 88, 48–57. https://doi.org/10.1016/j.jaerosci.2015.05.013

Chapter 4. Results
165
Fransman, W., Schinkel, J., Meijster, T., Van Hemmen, J., Tielemans, E., Goede, H., 2008. Development and
evaluation of an Exposure Control Efficacy Library (ECEL). Ann. Occup. Hyg. 52, 567–575.
https://doi.org/10.1093/annhyg/men054
Gaines, L.L., Elgowainy, A., Wang, M.Q., 2008. Full fuel-cycle comparison of forklift propulsion systems.
Argonne, IL. https://doi.org/10.2172/946421
Gerritzen, R.G., Huang, L., Killpack, K., Mircheva, M., Conti, J., 2006. Review of Safety Practices in the
Nanotechnology Industry. Saf. Heal. 31.
Goede, H., Christopher-de Vries, Y., Kuijpers, E., Fransman, W., 2018. A Review of Workplace Risk
Management Measures for Nanomaterials to Mitigate Inhalation and Dermal Exposure. Ann. Work Expo. Heal.
1–16. https://doi.org/10.1093/annweh/wxy032
Hämeri, K., Lähde, T., Hussein, T., Koivisto, J., Savolainen, K., 2009. Facing the key workplace challenge:
Assessing and preventing exposure to nanoparticles at source. Inhal. Toxicol. 21, 17–24.
https://doi.org/10.1080/08958370902942525
Hewett, P., Ganser, G.H., 2017. Models for nearly every occasion: Part I - One box models. J. Occup. Environ.
Hyg. 14, 49–57. https://doi.org/10.1080/15459624.2016.1213392
Hussein, T., Kulmala, M., 2008. Indoor Aerosol Modeling: Basic Principles and Practical Applications. Water,
Air, Soil Pollut. Focus 8, 23–34. https://doi.org/10.1007/s11267-007-9134-x
Kim, C.S., Bao, L., Okuyama, K., Shimada, M., Niinuma, H., 2006. Filtration efficiency of a fibrous filter for
nanoparticles. J. Nanoparticle Res. 8, 215–221. https://doi.org/10.1007/s11051-005-9017-x
Kim, S.C., Harrington, M.S., Pui, D.Y.H., 2007. Experimental study of nanoparticles penetration through
commercial filter media. J. Nanoparticle Res. 9, 117–125. https://doi.org/10.1007/s11051-006-9176-4
Kittelson, D.B., Watts, W.F., Johnson, J.P., 2004. Nanoparticle emissions on Minnesota highways. Atmos.
Environ. 38, 9–19. https://doi.org/10.1016/j.atmosenv.2003.09.037
Kulmala, M., Petäjä, T., Ehn, M., Thornton, J., Sipilä, M., Worsnop, D.R., Kerminen, V.-M., 2014. Chemistry of
Atmospheric Nucleation: On the Recent Advances on Precursor Characterization and Atmospheric Cluster
Composition in Connection with Atmospheric New Particle Formation. Annu. Rev. Phys. Chem. 65, 21–37.
https://doi.org/10.1146/annurev-physchem-040412-110014
Lee, M.H., McClellan, W.J., Candela, J., Andrews, D., Biswas, P., 2007. Reduction of nanoparticle exposure to
welding aerosols by modification of the ventilation system in a workplace. J. Nanoparticle Res. 9, 127–136.
https://doi.org/10.1007/s11051-006-9181-7
Mezquita, A., Boix, J., Monfort, E., Mallol, G., 2014. Energy saving in ceramic tile kilns: Cooling gas heat
recovery. Appl. Therm. Eng. 65, 102–110. https://doi.org/10.1016/j.applthermaleng.2014.01.002
Morawska, L., Ristovski, Z., Jayaratne, E.R., Keogh, D.U., Ling, X., 2008. Ambient nano and ultrafine particles
from motor vehicle emissions: Characteristics, ambient processing and implications on human exposure.
Atmos. Environ. 42, 8113–8138. https://doi.org/10.1016/j.atmosenv.2008.07.050
Myojo, T., Nagata, T., Verbeek, J., 2017. The effectiveness of specific risk mitigation techniques used in the
production and handling of manufactured nanomaterials: A systematic review. J. UOEH 39, 187–199.
https://doi.org/10.7888/juoeh.39.187
Chapter 4. Results
166
Nazaroff, W.W., 2004. Indoor particle dynamics. Indoor Air, Suppl. 14, 175–183.
https://doi.org/10.1111/j.1600-0668.2004.00286.x
Oberdorster, G., 2000. Pulmonary effects of inhaled ultrafine particles. Int. Arch. Occup. Environ. Health 74, 1–
8. https://doi.org/10.1007/s004200000185
Oberdorster, G., Ferin, J., Gelein, R., Soderholm, S.C., Finkelstein, J., 1992. Role of the alveolar macrophage in
lung injury: Studies with ultrafine particles. Environ. Health Perspect. 97, 193–199.
https://doi.org/10.1289/ehp.9297193
Oberdörster, G., Sharp, Z., Atudorei, V., Elder, A., Gelein, R., Kreyling, W., Cox, C., 2004. Translocation of Inhaled
Ultrafine Particles to the Brain. Inhal. Toxicol. 16, 437–445. https://doi.org/10.1080/08958370490439597
OECD, 2015. Harmonized Tiered Approach to Measure and Assess the Potential Exposure to Airborne
Emissions of Engineered Nano-Objects and their Agglomerates and Aggregates at Workplaces. Ser. Saf. Manuf.
Nanomater. No.55 55, JT03378848–JT03378848.
Old, L., Methner, M.M., 2008. Effectiveness of local exhaust ventilation (LEV) in controlling engineered
nanomaterial emissions during reactor cleanout operations. J. Occup. Environ. Hyg. 5, D63–D69.
https://doi.org/10.1080/15459620802059393
Pey, J., Querol, X., Alastuey, A., Rodríguez, S., Putaud, J.P., Van Dingenen, R., 2009. Source apportionment of
urban fine and ultra-fine particle number concentration in a Western Mediterranean city. Atmos. Environ. 43,
4407–4415. https://doi.org/10.1016/j.atmosenv.2009.05.024
Pope, C.A., Dockery, D.W., 2006. Health effects of fine particulate air pollution: Lines that connect. J. Air Waste
Manag. Assoc. 56, 709–742. https://doi.org/10.1080/10473289.2006.10464485
Pope, C.A., Dockery, D.W., Schwartz, J., 1995. Review of Epidemiological Evidence of Health Effects of
Particulate Air Pollution. Inhal. Toxicol. 7, 1–18.
Ramachandran, G., Ostraat, M., Evans, D.E., Methner, M.M., O’Shaughnessy, P., D’Arcy, J., Geraci, C.L., Stevenson,
E., Maynard, A., Rickabaugh, K., 2011. A strategy for assessing workplace exposures to nanomaterials. J.
Occup. Environ. Hyg. 8, 673–685. https://doi.org/10.1080/15459624.2011.623223
Ribalta, C., Koivisto, A.J., López-Lilao, A., Estupiñá, S., Minguillón, M.C., Monfort, E., Viana, M., 2019. Testing the
performance of one and two box models as tools for risk assessment of particle exposure during packing of
inorganic fertilizer. Sci. Total Environ. 650, 2423–2436. https://doi.org/10.1016/j.scitotenv.2018.09.379
Salmatonidis, A., Ribalta, C., Sanfélix, V., Bezantakos, S., Biskos, G., Vulpoi, A., Simion, S., Monfort, E., Viana, M.,
2019. Workplace Exposure to Nanoparticles during Thermal Spraying of Ceramic Coatings. Ann. Work Expo.
Heal. 63, 91–106. https://doi.org/10.1093/annweh/wxy094
Salmatonidis, A., Viana, M., Pérez, N., Alastuey, A., de la Fuente, G.F., Angurel, L.A., Sanfélix, V., Monfort, E.,
2018. Nanoparticle formation and emission during laser ablation of ceramic tiles. J. Aerosol Sci. 126, 152–168.
https://doi.org/10.1016/j.jaerosci.2018.09.006
Schmid, O., Stoeger, T., 2017. Surface area is the biologically most effective dose metric for acute nanoparticle
toxicity in the lung. J. Aerosol Sci. 113, 276. https://doi.org/10.1016/j.jaerosci.2017.09.017
Schulte, P., Geraci, C., Zumwalde, R., Hoover, M., Kuempe, E., 2008. Occupational risk management of
engineered nanoparticles. J. Occup. Environ. Hyg. 5, 239–249. https://doi.org/10.1080/15459620801907840

Chapter 4. Results
167
Seaton, A., Tran, L., Aitken, R., Donaldson, K., 2010. Nanoparticles, human health hazard and regulation. J. R.
Soc. Interface 7. https://doi.org/10.1098/rsif.2009.0252.focus
Tsai, S.J., Huang, R.F., Ellenbecker, M.J., 2010. Airborne nanoparticle exposures while using constant-flow,
constant-velocity, and air-curtain-isolated fume hoods. Ann. Occup. Hyg. 54, 78–87.
https://doi.org/10.1093/annhyg/mep074
Union, E., 2019. DIRECTIVE (EU) 2019/130 OF THE EUROPEAN PARLIAMENT AND OF THE COUNCIL.
https://doi.org/http://eur-lex.europa.eu/pri/en/oj/dat/2003/l_285/l_28520031101en00330037.pdf
Van Broekhuizen, P., Van Veelen, W., Streekstra, W.H., Schulte, P., Reijnders, L., 2012. Exposure limits for
nanoparticles: Report of an international workshop on nano reference values. Ann. Occup. Hyg. 56, 515–524.
https://doi.org/10.1093/annhyg/mes043
Viana, M., Fonseca, A.S., Querol, X., López-Lilao, A., Carpio, P., Salmatonidis, A., Monfort, E., 2017. Workplace
exposure and release of ultrafine particles during atmospheric plasma spraying in the ceramic industry. Sci.
Total Environ. 599–600, 2065–2073. https://doi.org/10.1016/j.scitotenv.2017.05.132
Viana, M., Rivas, I., Reche, C., Fonseca, A.S., Pérez, N., Querol, X., Alastuey, A., Álvarez-Pedrerol, M., Sunyer, J.,
2015. Field comparison of portable and stationary instruments for outdoor urban air exposure assessments.
Atmos. Environ. 123, 220–228. https://doi.org/10.1016/j.atmosenv.2015.10.076
Viitanen, A.K., Uuksulainen, S., Koivisto, A.J., Hämeri, K., Kauppinen, T., 2017. Workplace measurements of
ultrafine particles-A literature review. Ann. Work Expo. Heal. 61, 749–758.
https://doi.org/10.1093/annweh/wxx049
Voliotis, A., Bezantakos, S., Giamarelou, M., Valenti, M., Kumar, P., Biskos, G., 2014. Nanoparticle emissions
from traditional pottery manufacturing. Environ. Sci. Process. Impacts 16, 1489–1494.
https://doi.org/10.1039/C3EM00709J
Wiesner, M.R., Lowry, G. V., Alvarez, P., Dionysiou, D., Biswas, P., 2006. Assessing the risks of manufactured
nanomaterials. Environ. Sci. Technol. 40, 4336–4345. https://doi.org/10.1021/es062726m
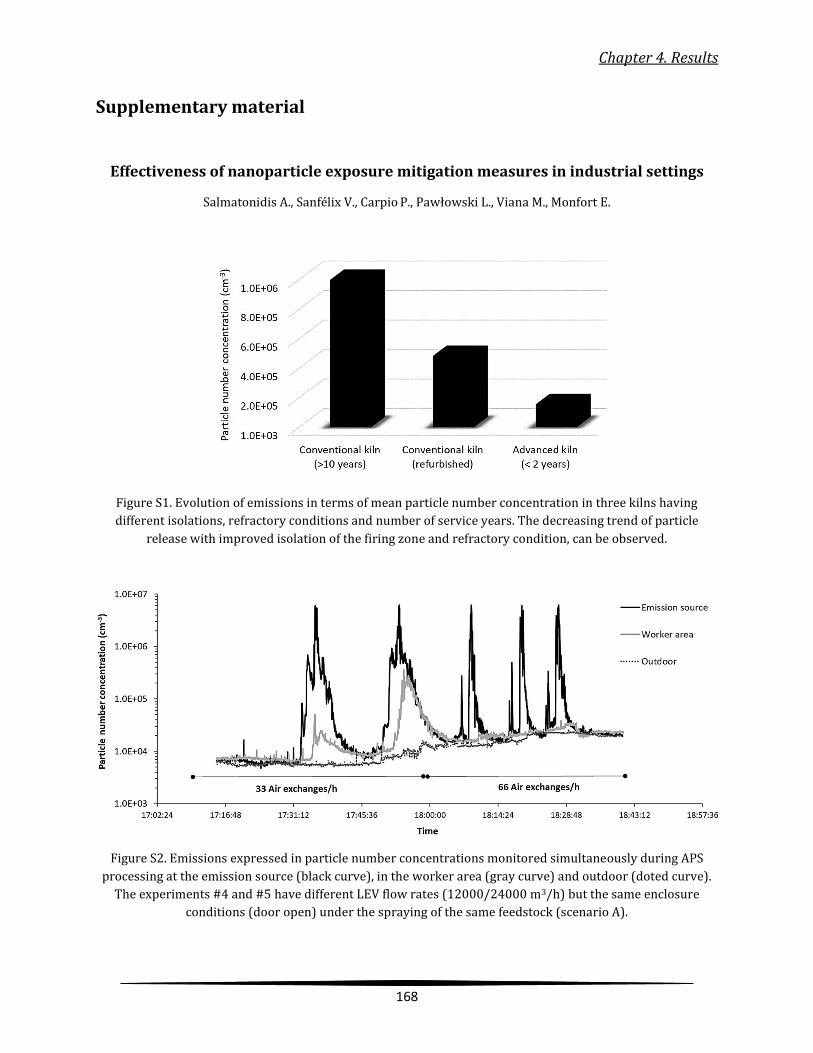
Chapter 4. Results
168
Supplementary material
Effectiveness of nanoparticle exposure mitigation measures in industrial settings
Salmatonidis A., Sanfélix V., Carpio P., Pawłowski L., Viana M., Monfort E.
Figure S1. Evolution of emissions in terms of mean particle number concentration in three kilns having
different isolations, refractory conditions and number of service years. The decreasing trend of particle
release with improved isolation of the firing zone and refractory condition, can be observed.
Figure S2. Emissions expressed in particle number concentrations monitored simultaneously during APS
processing at the emission source (black curve), in the worker area (gray curve) and outdoor (doted curve).
The experiments #4 and #5 have different LEV flow rates (12000/24000 m3/h) but the same enclosure
conditions (door open) under the spraying of the same feedstock (scenario A).
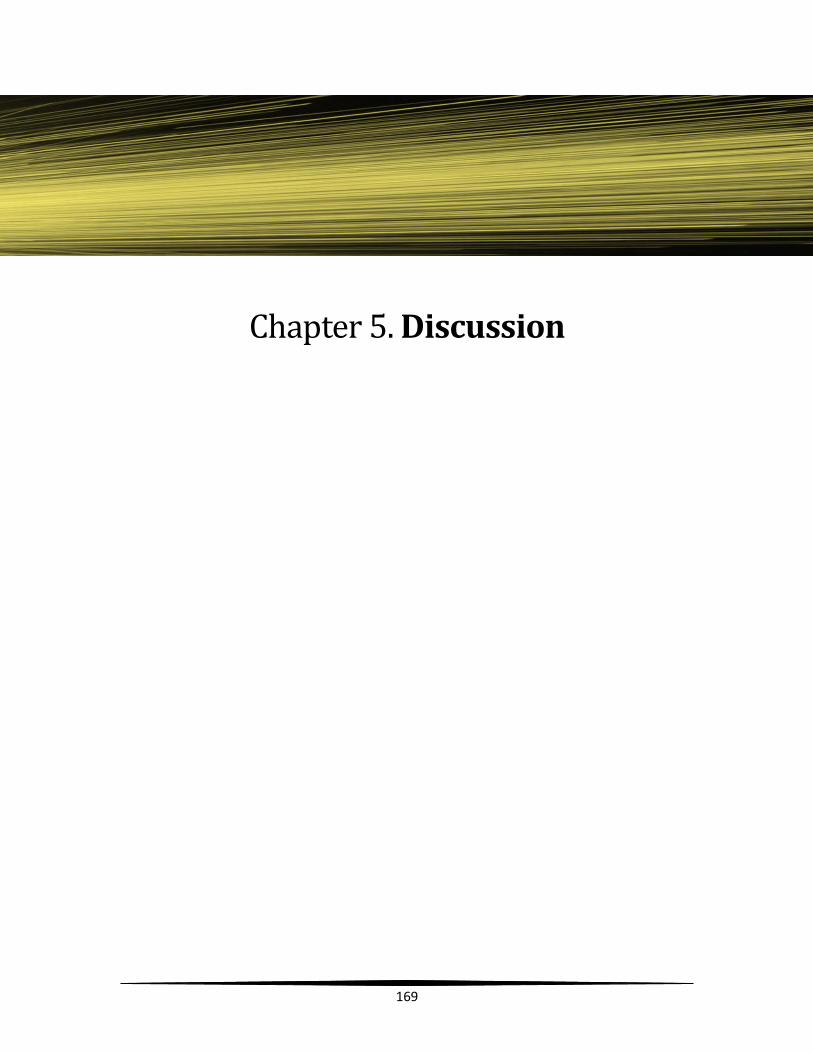
169
Chapter 5. Discussion
Chapter 5. Discussion
170
5. Discussion
This Discussion aims to integrate the results obtained in the scientific publications included in this
PhD Thesis, with the aim to produce targeted and applied research of interest for the ceramic
material processing at an industrial scale. Specifically, this chapter addresses the determinants of
workplace exposure to nanoparticles (NP) by combining in an integrated approach all four research
publications. The nanoparticle formation and release emission mechanisms were assessed, real-
world industrial exposure scenarios were characterized, and the efficiency of mitigation strategies
applicable at an industrial scale was quantified. It should be noted that although the real-world
industrial scenarios are representative of worker exposure, there are certain limitations: no
variations of the production scheduled was possible, several secondary-parallel processes were
taking place simultaneously, and not all of the related information were available due to
confidentiality issues.
5.1 Nanoparticle formation and emission mechanisms
As described in the Introduction, the main driver of workplace exposure is the presence of airborne
pollutants (in this case, particles and NPs) in workplace air. In this work, two industrial activities
were evaluated with a focus on NP emission mechanisms: (i) pulsed laser ablation (PLA; publication
1), and (ii) thermal spraying (Publication 2). PLA is used in the ceramic sector for surface structuring
and decoration of ceramic tiles, and thermal spraying applies ceramic coatings on metallic substrates
to enhance technical performance. Both processes are characterized by a high energy footprint, and
thus have high potential for NP formation and release. NP concentrations were monitored in laser
ablation and thermal spraying facilities in Spain and France, and the potential of these activities to
impact workplace exposure was confirmed in this work. Table 5.1 presents a summary of the NP
formation mechanisms identified during both industrial activities, as well as the nanoparticle
concentration ranges monitored in terms of particle number and mass concentration.
Different particle emission mechanisms were identified for the two industrial activities assessed.
Nanoparticle emissions were characterized by correlating particle release (number & mass
concentration, size distribution) with fundamental ablation phenomena (melting & evaporation, melt
drop expulsion, plasma plume generation, direct sublimation, shockwaves & grains ejection).
Nucleation occurred when atoms, ions and clusters which emanated from the plasma plume (during
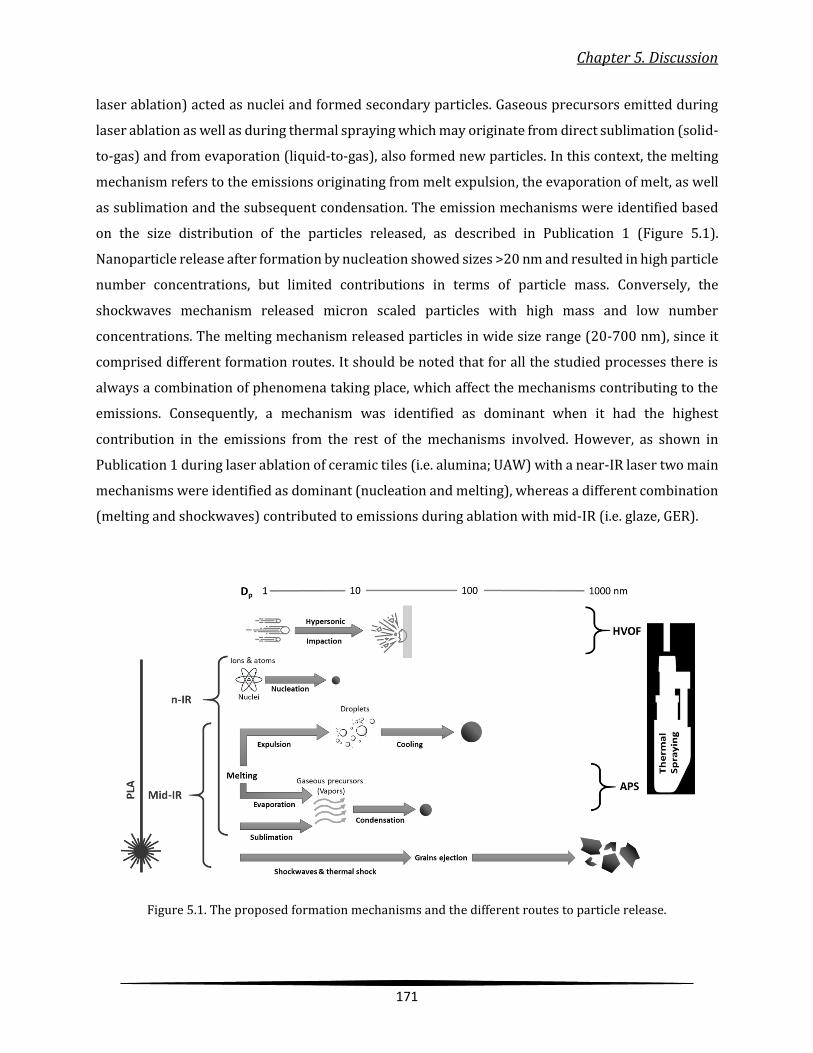
Chapter 5. Discussion
171
laser ablation) acted as nuclei and formed secondary particles. Gaseous precursors emitted during
laser ablation as well as during thermal spraying which may originate from direct sublimation (solid-
to-gas) and from evaporation (liquid-to-gas), also formed new particles. In this context, the melting
mechanism refers to the emissions originating from melt expulsion, the evaporation of melt, as well
as sublimation and the subsequent condensation. The emission mechanisms were identified based
on the size distribution of the particles released, as described in Publication 1 (Figure 5.1).
Nanoparticle release after formation by nucleation showed sizes >20 nm and resulted in high particle
number concentrations, but limited contributions in terms of particle mass. Conversely, the
shockwaves mechanism released micron scaled particles with high mass and low number
concentrations. The melting mechanism released particles in wide size range (20-700 nm), since it
comprised different formation routes. It should be noted that for all the studied processes there is
always a combination of phenomena taking place, which affect the mechanisms contributing to the
emissions. Consequently, a mechanism was identified as dominant when it had the highest
contribution in the emissions from the rest of the mechanisms involved. However, as shown in
Publication 1 during laser ablation of ceramic tiles (i.e. alumina; UAW) with a near-IR laser two main
mechanisms were identified as dominant (nucleation and melting), whereas a different combination
(melting and shockwaves) contributed to emissions during ablation with mid-IR (i.e. glaze, GER).
Figure 5.1. The proposed formation mechanisms and the different routes to particle release.
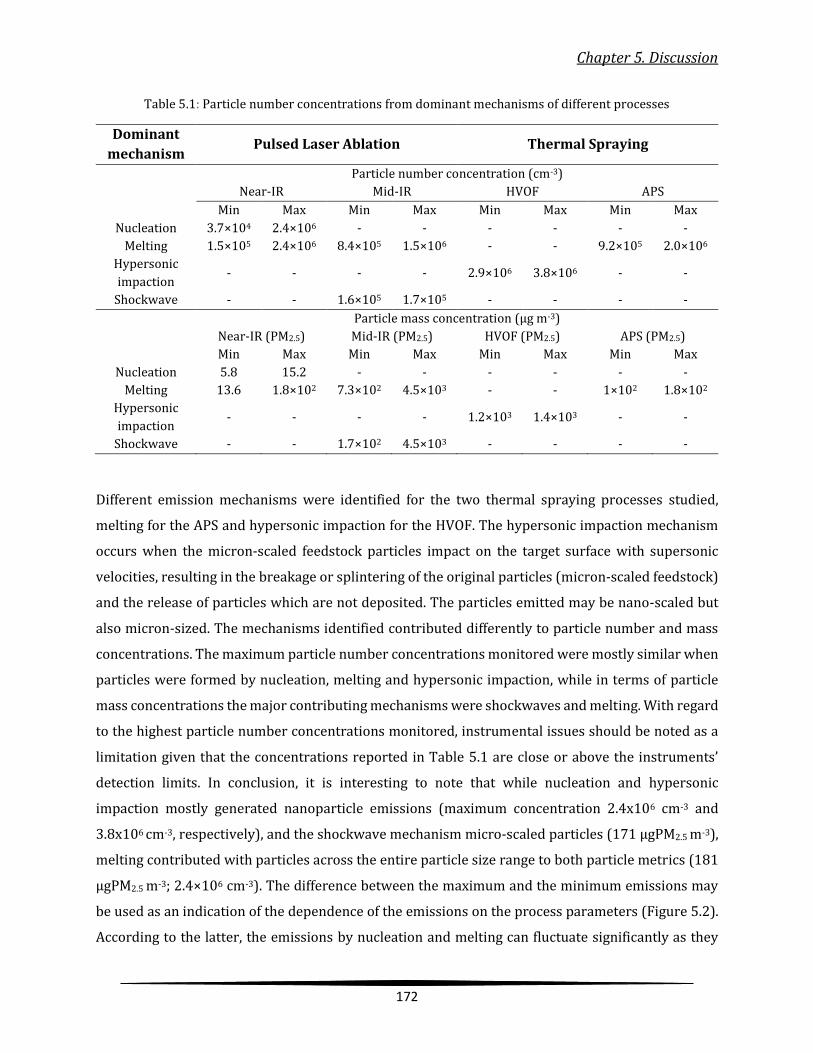
Chapter 5. Discussion
172
Table 5.1: Particle number concentrations from dominant mechanisms of different processes
Dominant
mechanism Pulsed Laser Ablation Thermal Spraying
Particle number concentration (cm-3)
Near-IR Mid-IR HVOF APS
Min Max Min Max Min Max Min Max
Nucleation 3.7×10⁴ 2.4×10⁶ - - - - - -
Melting 1.5×10⁵ 2.4×10⁶ 8.4×10⁵ 1.5×10⁶ - - 9.2×10⁵ 2.0×10⁶
Hypersonic
impaction - - - - 2.9×10⁶ 3.8×10⁶ - -
Shockwave - - 1.6×10⁵ 1.7×10⁵ - - - -
Particle mass concentration (µg m-3)
Near-IR (PM2.5) Mid-IR (PM2.5) HVOF (PM2.5) APS (PM2.5)
Min Max Min Max Min Max Min Max
Nucleation 5.8 15.2 - - - - - -
Melting 13.6 1.8×10² 7.3×10² 4.5×10³ - - 1×10² 1.8×10²
Hypersonic
impaction - - - - 1.2×10³ 1.4×10³ - -
Shockwave - - 1.7×10² 4.5×10³ - - - -
Different emission mechanisms were identified for the two thermal spraying processes studied,
melting for the APS and hypersonic impaction for the HVOF. The hypersonic impaction mechanism
occurs when the micron-scaled feedstock particles impact on the target surface with supersonic
velocities, resulting in the breakage or splintering of the original particles (micron-scaled feedstock)
and the release of particles which are not deposited. The particles emitted may be nano-scaled but
also micron-sized. The mechanisms identified contributed differently to particle number and mass
concentrations. The maximum particle number concentrations monitored were mostly similar when
particles were formed by nucleation, melting and hypersonic impaction, while in terms of particle
mass concentrations the major contributing mechanisms were shockwaves and melting. With regard
to the highest particle number concentrations monitored, instrumental issues should be noted as a
limitation given that the concentrations reported in Table 5.1 are close or above the instruments’
detection limits. In conclusion, it is interesting to note that while nucleation and hypersonic
impaction mostly generated nanoparticle emissions (maximum concentration 2.4x106 cm-3 and
3.8x106 cm-3, respectively), and the shockwave mechanism micro-scaled particles (171 µgPM2.5 m-3),
melting contributed with particles across the entire particle size range to both particle metrics (181
µgPM2.5 m-3; 2.4×106 cm-3). The difference between the maximum and the minimum emissions may
be used as an indication of the dependence of the emissions on the process parameters (Figure 5.2).
According to the latter, the emissions by nucleation and melting can fluctuate significantly as they
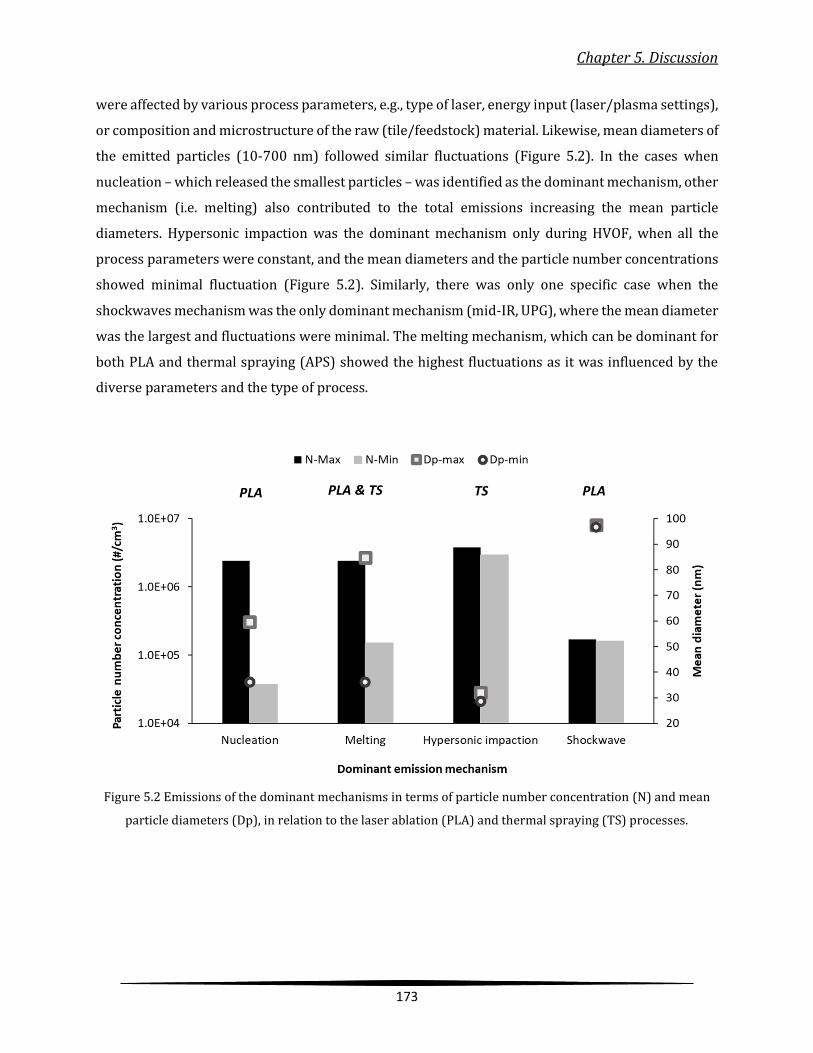
Chapter 5. Discussion
173
were affected by various process parameters, e.g., type of laser, energy input (laser/plasma settings),
or composition and microstructure of the raw (tile/feedstock) material. Likewise, mean diameters of
the emitted particles (10-700 nm) followed similar fluctuations (Figure 5.2). In the cases when
nucleation – which released the smallest particles – was identified as the dominant mechanism, other
mechanism (i.e. melting) also contributed to the total emissions increasing the mean particle
diameters. Hypersonic impaction was the dominant mechanism only during HVOF, when all the
process parameters were constant, and the mean diameters and the particle number concentrations
showed minimal fluctuation (Figure 5.2). Similarly, there was only one specific case when the
shockwaves mechanism was the only dominant mechanism (mid-IR, UPG), where the mean diameter
was the largest and fluctuations were minimal. The melting mechanism, which can be dominant for
both PLA and thermal spraying (APS) showed the highest fluctuations as it was influenced by the
diverse parameters and the type of process.
Figure 5.2 Emissions of the dominant mechanisms in terms of particle number concentration (N) and mean
particle diameters (Dp), in relation to the laser ablation (PLA) and thermal spraying (TS) processes.
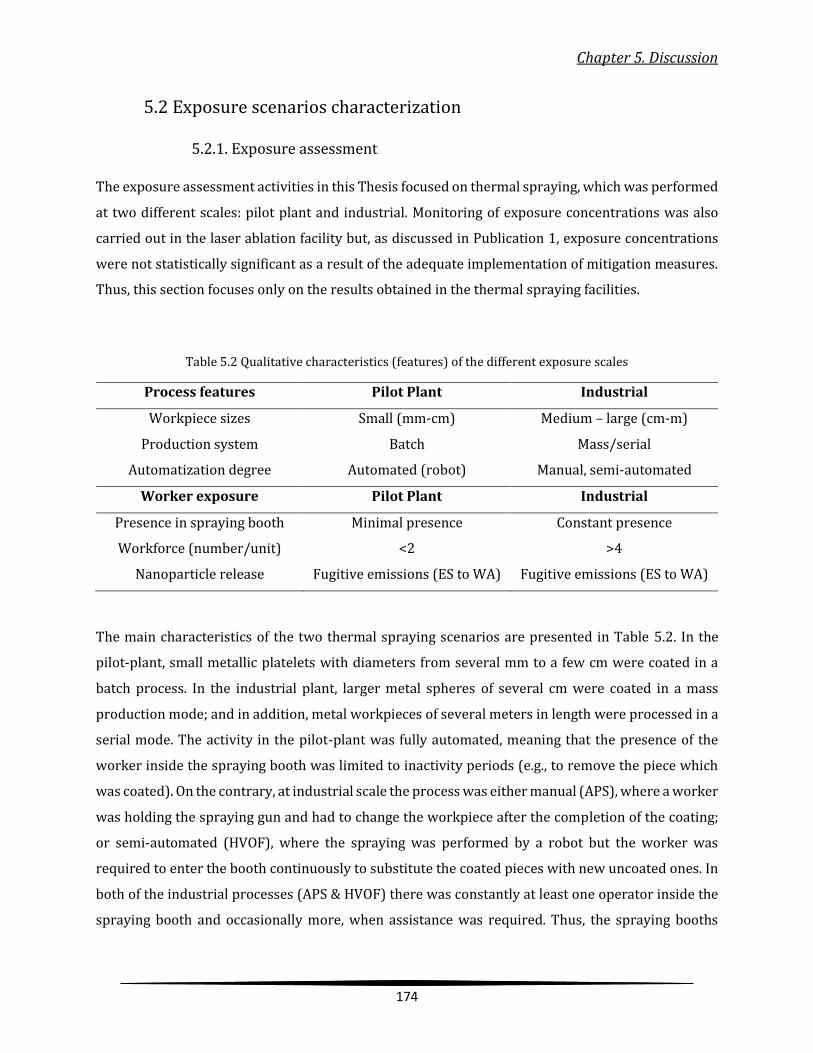
Chapter 5. Discussion
174
5.2 Exposure scenarios characterization
5.2.1. Exposure assessment
The exposure assessment activities in this Thesis focused on thermal spraying, which was performed
at two different scales: pilot plant and industrial. Monitoring of exposure concentrations was also
carried out in the laser ablation facility but, as discussed in Publication 1, exposure concentrations
were not statistically significant as a result of the adequate implementation of mitigation measures.
Thus, this section focuses only on the results obtained in the thermal spraying facilities.
Table 5.2 Qualitative characteristics (features) of the different exposure scales
Process features Pilot Plant Industrial
Workpiece sizes Small (mm-cm) Medium – large (cm-m)
Production system Batch Mass/serial
Automatization degree Automated (robot) Manual, semi-automated
Worker exposure Pilot Plant Industrial
Presence in spraying booth Minimal presence Constant presence
Workforce (number/unit) <2 >4
Nanoparticle release Fugitive emissions (ES to WA) Fugitive emissions (ES to WA)
The main characteristics of the two thermal spraying scenarios are presented in Table 5.2. In the
pilot-plant, small metallic platelets with diameters from several mm to a few cm were coated in a
batch process. In the industrial plant, larger metal spheres of several cm were coated in a mass
production mode; and in addition, metal workpieces of several meters in length were processed in a
serial mode. The activity in the pilot-plant was fully automated, meaning that the presence of the
worker inside the spraying booth was limited to inactivity periods (e.g., to remove the piece which
was coated). On the contrary, at industrial scale the process was either manual (APS), where a worker
was holding the spraying gun and had to change the workpiece after the completion of the coating;
or semi-automated (HVOF), where the spraying was performed by a robot but the worker was
required to enter the booth continuously to substitute the coated pieces with new uncoated ones. In
both of the industrial processes (APS & HVOF) there was constantly at least one operator inside the
spraying booth and occasionally more, when assistance was required. Thus, the spraying booths
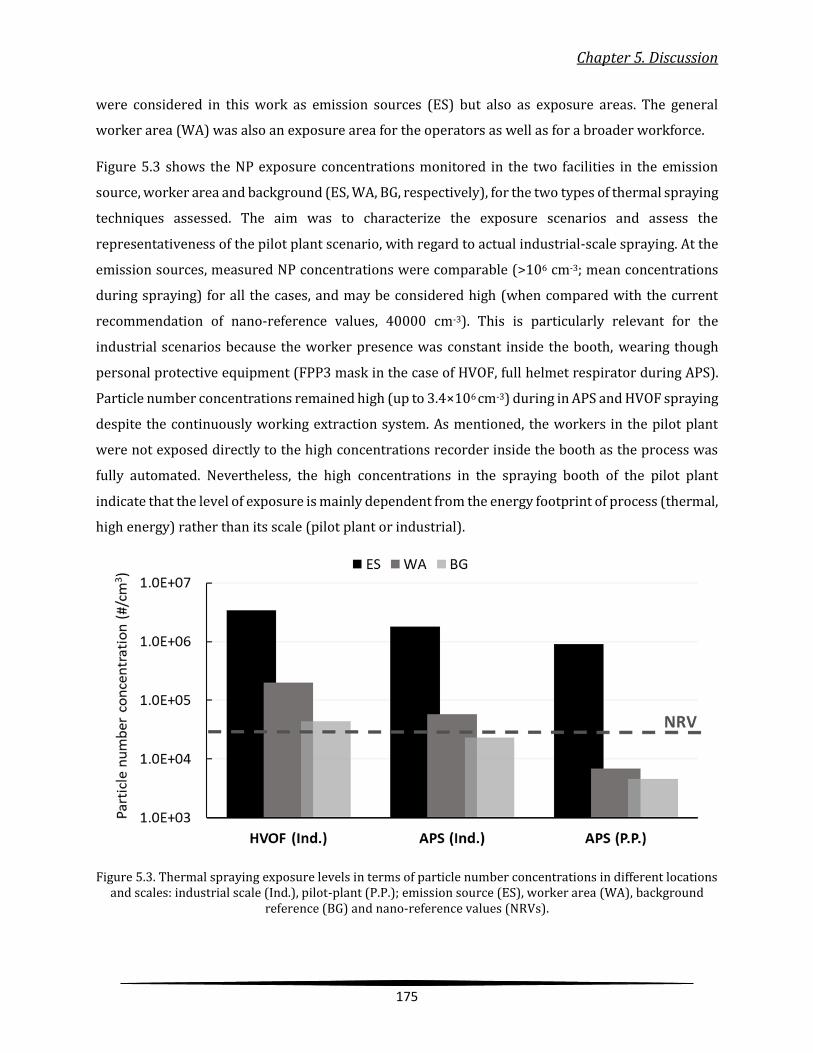
Chapter 5. Discussion
175
were considered in this work as emission sources (ES) but also as exposure areas. The general
worker area (WA) was also an exposure area for the operators as well as for a broader workforce.
Figure 5.3 shows the NP exposure concentrations monitored in the two facilities in the emission
source, worker area and background (ES, WA, BG, respectively), for the two types of thermal spraying
techniques assessed. The aim was to characterize the exposure scenarios and assess the
representativeness of the pilot plant scenario, with regard to actual industrial-scale spraying. At the
emission sources, measured NP concentrations were comparable (>106 cm-3; mean concentrations
during spraying) for all the cases, and may be considered high (when compared with the current
recommendation of nano-reference values, 40000 cm-3). This is particularly relevant for the
industrial scenarios because the worker presence was constant inside the booth, wearing though
personal protective equipment (FPP3 mask in the case of HVOF, full helmet respirator during APS).
Particle number concentrations remained high (up to 3.4×106 cm-3) during in APS and HVOF spraying
despite the continuously working extraction system. As mentioned, the workers in the pilot plant
were not exposed directly to the high concentrations recorder inside the booth as the process was
fully automated. Nevertheless, the high concentrations in the spraying booth of the pilot plant
indicate that the level of exposure is mainly dependent from the energy footprint of process (thermal,
high energy) rather than its scale (pilot plant or industrial).
Figure 5.3. Thermal spraying exposure levels in terms of particle number concentrations in different locations and scales: industrial scale (Ind.), pilot-plant (P.P.); emission source (ES), worker area (WA), background
reference (BG) and nano-reference values (NRVs).

Chapter 5. Discussion
176
In the worker area, on the other hand, particle number concentrations at pilot plant and industrial
scale were lower by at least one order of magnitude due to the application of different mitigation
measures. The workers operating in the worker area, which did not wear protective equipment in
either of the scenarios, were exposed to concentrations in the range of 5.8×10⁴ - 2×105 cm-3 at
industrial scale and lower (6.9×103 cm-3) in the pilot plant. The lower concentrations monitored in
the pilot plant were mainly due to a more efficient enclosure (sealing) of the spraying booth. The
concentrations monitored at industrial scale are still high when compared to the nano-reference
values (Van Broekhuizen et al., 2012), while in the pilot plant they were lower than this
recommendation. Furthermore, the number of workers potentially exposed was higher in the
industrial facility than in the pilot plant (Table 5.2). When compared to background concentrations,
in the case of HVOF the difference between worker area and background concentrations (1.6×10⁵
cm-3) was larger than in the case of APS (3.5×104 cm-3), probably due to differences in the mitigation
measures in place (more information in section 5.3 below) and evidencing larger impacts on
exposure from this type of spraying technique. As for the pilot plant, exposure concentrations
showed lower impacts from the spraying activities, when compared with background concentrations
(2.3×103 cm-3). Overall, the high concentrations monitored in the worker area in the industrial facility
highlights the urgent need to raise awareness regarding nanoparticle exposures in industrial plants,
to promote the use of personal protective equipment in areas which may initially not be considered
as potential exposure scenarios. This work demonstrates that, contrarily to the current working style,
protective equipment should be worn in the worker area and potentially even in other areas of the
industrial facility. Regarding the pilot plant, it was concluded that the operating and exposure
conditions were representative of actual industrial workplaces, and that the mitigation strategies in
place were more efficient than in the specific industrial facility assessed. Finally, considering the
above findings, the presence of workers inside the thermal spraying booths should be strongly
discouraged.
5.2.2. Particle characterization
Physicochemical particle characterization techniques were applied to the airborne particles samples
collected in the laser ablation and thermal spraying scenarios. As a consequence of the particle
formation and release mechanisms described above, certain similarities but also clear differences
were observed between both scenarios, with implications regarding exposure and potential health
risks.
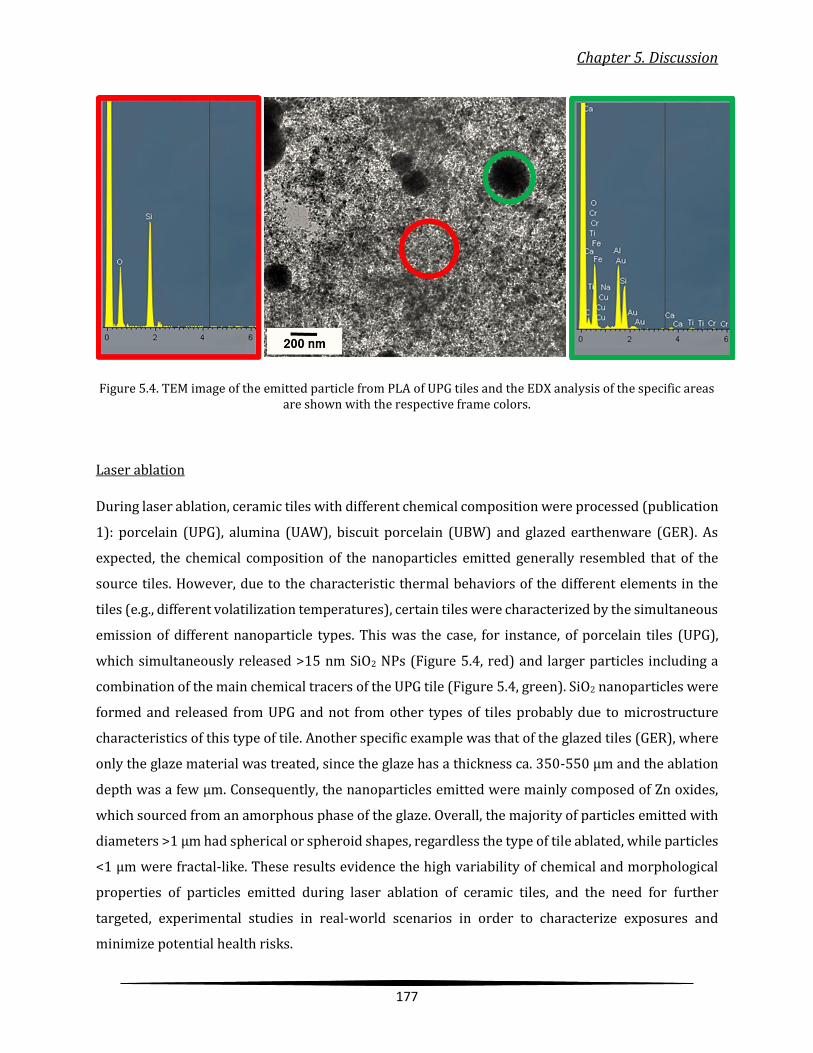
Chapter 5. Discussion
177
Figure 5.4. TEM image of the emitted particle from PLA of UPG tiles and the EDX analysis of the specific areas are shown with the respective frame colors.
Laser ablation
During laser ablation, ceramic tiles with different chemical composition were processed (publication
1): porcelain (UPG), alumina (UAW), biscuit porcelain (UBW) and glazed earthenware (GER). As
expected, the chemical composition of the nanoparticles emitted generally resembled that of the
source tiles. However, due to the characteristic thermal behaviors of the different elements in the
tiles (e.g., different volatilization temperatures), certain tiles were characterized by the simultaneous
emission of different nanoparticle types. This was the case, for instance, of porcelain tiles (UPG),
which simultaneously released >15 nm SiO2 NPs (Figure 5.4, red) and larger particles including a
combination of the main chemical tracers of the UPG tile (Figure 5.4, green). SiO2 nanoparticles were
formed and released from UPG and not from other types of tiles probably due to microstructure
characteristics of this type of tile. Another specific example was that of the glazed tiles (GER), where
only the glaze material was treated, since the glaze has a thickness ca. 350-550 µm and the ablation
depth was a few µm. Consequently, the nanoparticles emitted were mainly composed of Zn oxides,
which sourced from an amorphous phase of the glaze. Overall, the majority of particles emitted with
diameters >1 µm had spherical or spheroid shapes, regardless the type of tile ablated, while particles
<1 µm were fractal-like. These results evidence the high variability of chemical and morphological
properties of particles emitted during laser ablation of ceramic tiles, and the need for further
targeted, experimental studies in real-world scenarios in order to characterize exposures and
minimize potential health risks.

Chapter 5. Discussion
178
Thermal spraying
TEM images of particles collected inside the APS spraying booth are shown in Figure 5.5. Chain-like
agglomerates of primary particles with different particle sizes (5 to 20 nm) can be observed (Figure
5.5). The spherical or spheroid shape of nanoparticles (Figure 5.5), can be an indication that they
might have originated from melting-evaporation and the consequent condensation. Moreover, these
nanoparticles were found to have a composition similar to that of the feedstock, i.e., Ti-Al oxides and
Cr-Ni depending on the coating (two different feedstocks were applied).
a
b
Figure 5.5. TEM image of the emitted particle from APS with (a) Al2O3-TiO2 and (b) Cr-Ni feedstocks
Particles sampled from the other booth (HVOF) are shown in the TEM images in Figure 5.6. The
agglomerates in Figure 5.6 are distinctively different from the ones observed in the case of APS
(Figure 5.5). Irregularly-shaped particles with diameters 5-40 nm appear to be strongly aggregated,
resembling nanoparticles which have undergone collisions. The latter could be an indication that
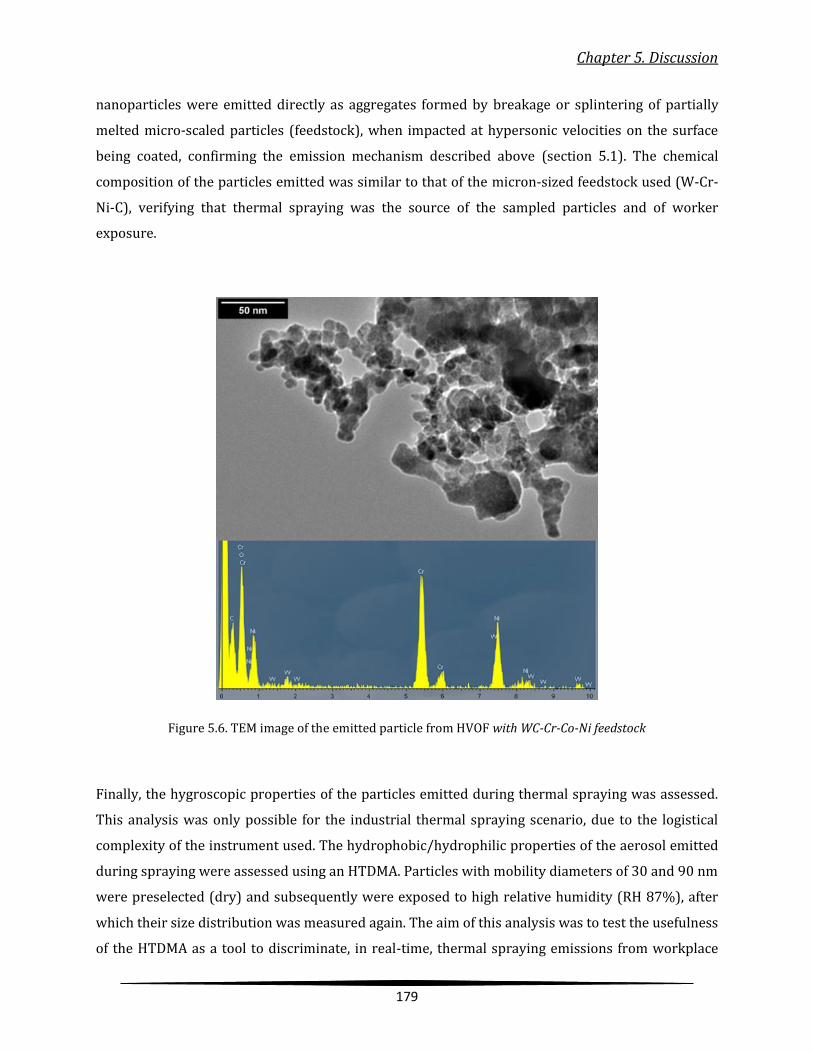
Chapter 5. Discussion
179
nanoparticles were emitted directly as aggregates formed by breakage or splintering of partially
melted micro-scaled particles (feedstock), when impacted at hypersonic velocities on the surface
being coated, confirming the emission mechanism described above (section 5.1). The chemical
composition of the particles emitted was similar to that of the micron-sized feedstock used (W-Cr-
Ni-C), verifying that thermal spraying was the source of the sampled particles and of worker
exposure.
Figure 5.6. TEM image of the emitted particle from HVOF with WC-Cr-Co-Ni feedstock
Finally, the hygroscopic properties of the particles emitted during thermal spraying was assessed.
This analysis was only possible for the industrial thermal spraying scenario, due to the logistical
complexity of the instrument used. The hydrophobic/hydrophilic properties of the aerosol emitted
during spraying were assessed using an HTDMA. Particles with mobility diameters of 30 and 90 nm
were preselected (dry) and subsequently were exposed to high relative humidity (RH 87%), after
which their size distribution was measured again. The aim of this analysis was to test the usefulness
of the HTDMA as a tool to discriminate, in real-time, thermal spraying emissions from workplace
Chapter 5. Discussion
180
background particle concentrations. The basic assumption was that, due to their different chemical
compositions and aging process, the hygroscopic behavior of thermal spraying and background
aerosols would also be different and this would facilitate their discrimination in the workplace.
Results evidenced that 30-nm (electrical mobility diameter) particles originating from the plasma
processes exhibited hygroscopicities which did not differ significantly from other aerosols sampled
when there was no spraying activity. However, taking into account that 30-nm particles were
observed by the HTDMA only during working hours, their presence has to be attributed to
nanoparticle emissions during spraying activity. Nevertheless, further research is necessary in order
to understand the potential influence of soot particles emitted during the HVOF on these
measurements. The 90-nm particles, on the other hand, were hydrophobic at 87% RH. This allowed
to clearly distinguish them from other aerosols of the same dry size, which were present in the
workplace. In conclusion, the information provided by the HTDMA can complement existing methods
for exposure assessment to process-generated nanoparticles, as changes in particle size upon
inhalation may alter their deposition patterns inside the human respiratory system.
Results evidence that exposure in both facilities assessed was driven by nanoparticles formed
unintentionally during thermal spraying, referred to as process-generated nanoparticles. The
concentrations of the released nanoparticles in terms of number were barely affected by the different
sizes of the micro-scaled feedstock material. This result highlights the relevance of process-generated
nanoparticles released during high-energy industrial activities, given their potential for significant
impacts on workplace exposure.
5.3 Exposure mitigation
The results from the experimental work in this Thesis, integrated in the sections above, point to the
need for dedicated and efficient exposure mitigation measures in industrial settings. Specifically, for
the thermal process in the ceramic sector, frequently-applied technologies release (unintentionally)
high concentrations of process-generated nanoparticles, as described above. The variety of industrial
activities results in a wide variety of potential mitigation strategies, which in addition depend on the
specific industrial scenario under assessment. Furthermore, the actual efficiency of each mitigation
strategy depends on its implementation. Because of this complexity, this Thesis aimed to expand the
knowledge on the efficiency and applicability of exposure mitigation strategies for the ceramic sector.

Chapter 5. Discussion
181
The ultimate goal was to provide quantitative estimates of the particle removal efficiency of specific
mitigation strategies implemented in industrial facilities from the ceramic sector.
As described in Publication 4, this work started with a review of the scientific literature available,
which highlighted three major research gaps:
The scientific literature is scarce on exposure assessments for process-generated NPs, when
compared to engineered NPs or fine and coarse particles.
While a significant number of studies on the effectiveness of personal protective equipment
is available for laboratory-scale testing, less information is available on the effectiveness of
technical measures.
Generalizing case-study results is complex, which implies the need for more experimentally
monitored case studies.
Based on these results, four exposure scenarios were assessed in this Thesis, with the aim to quantify
the effectiveness of the mitigation strategies in place:
Thermal spraying deposition of ceramic coatings: local exhaust ventilation (LEV) and source
enclosure (improved sealing of the booth) and personal protective equipment (PPE)
Laser ablation of ceramic tiles: local exhaust ventilation (LEV)
Diesel engine emissions (forklifts): source substitution by using electrically-powered forklifts
Ceramic tile firing in a roller hearth kiln: source enclosure by enhanced sealing of the kiln
The efficiency of mitigation measures was expressed as the reduction of exposure to NPs, before and
after the implementation of the mitigation measures. The exposure reductions were characterized in
terms of particle number concentrations, and for nine different exposure scenarios. Results
evidenced that particle number removal efficiencies, tested in this Thesis, ranged from 48.7% up to
99.8% (Figure 5.7).
The highest efficiency was achieved by the combined use of a strong LEV with an efficient enclosure
(99.8%) during thermal spraying scenario (APS-pilot plant). This efficiency was adequate to limit the
transport of fugitive emissions and prohibit any statistically significant increase of nanoparticles
concentration to the worker area. For the other thermal spraying process (HVOF-industrial) the
application of LEV achieved a lower efficiency (90.5%), since fugitive emissions from the emission
source were transported in the worker area due to the partial enclosure implemented. Partial
enclosure but with a less effective LEV (lower flowrate) showed even lower efficiency (65.1%; Figure
5.7) in an industrial scale laser ablation scenario. The efficiency of masks (PPE) was tested under
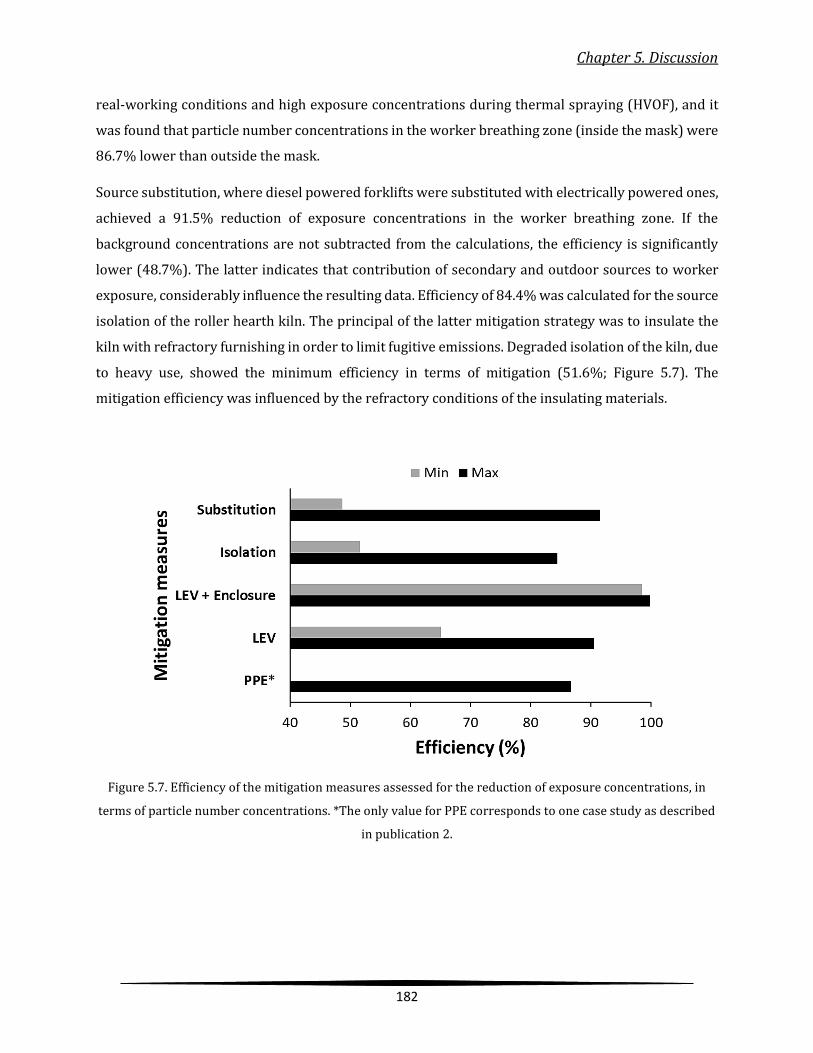
Chapter 5. Discussion
182
real-working conditions and high exposure concentrations during thermal spraying (HVOF), and it
was found that particle number concentrations in the worker breathing zone (inside the mask) were
86.7% lower than outside the mask.
Source substitution, where diesel powered forklifts were substituted with electrically powered ones,
achieved a 91.5% reduction of exposure concentrations in the worker breathing zone. If the
background concentrations are not subtracted from the calculations, the efficiency is significantly
lower (48.7%). The latter indicates that contribution of secondary and outdoor sources to worker
exposure, considerably influence the resulting data. Efficiency of 84.4% was calculated for the source
isolation of the roller hearth kiln. The principal of the latter mitigation strategy was to insulate the
kiln with refractory furnishing in order to limit fugitive emissions. Degraded isolation of the kiln, due
to heavy use, showed the minimum efficiency in terms of mitigation (51.6%; Figure 5.7). The
mitigation efficiency was influenced by the refractory conditions of the insulating materials.
Figure 5.7. Efficiency of the mitigation measures assessed for the reduction of exposure concentrations, in
terms of particle number concentrations. *The only value for PPE corresponds to one case study as described
in publication 2.
Chapter 5. Discussion
183
The results in this work evidence that, even though the hierarchy of controls (Schulte et al., 2008)
dictates the priority for the implementation of risk management strategies, this does not necessarily
mean that the order of the mitigation measures is based on their efficiency. It should be noted that
different measures overlapped in some of the scenarios (e.g., LEV and partial source enclosure were
operating in parallel in the APS scenario), and thus the efficiencies reported are at times
representative of a combination of measures.

184
Chapter 6. Conclusions
Chapter 6. Conclusions
185
6. Conclusions
This PhD Thesis addresses occupational exposure to nanoparticles during selected activities (laser
ablation and thermal spraying) characteristic of the ceramic industry. An integrated approach is
followed, which covers nanoparticle formation and release mechanisms, exposure assessment at
industrial- and pilot-plant scales, and quantifying the efficiency of exposure mitigation measures. The
ultimate goal of this work was to contribute in improving nanosafety of industrial processes by
reducing potential risks. The main conclusions and recommendations extracted are summarized
below.
6.1. Particle formation and release mechanisms
Among the broad variety of activities and characteristic processes of the ceramic industry, laser
ablation and thermal spraying were selected as representative of advanced thermal technologies
applied in this industrial sector. Due to their high energy footprint, these activities are known to
generate high particle (fine and nano) concentrations, with potentially high impacts on worker
exposure. The following particle formation and release mechanisms were identified and
characterized in the framework of this PhD Thesis:
1) Pulsed laser ablation (PLA) of ceramic tiles
PLA is a highly versatile technique with broad applications, which may be carried out with diverse
parametrizations which in turn impact NP formation and release. The main parameters found to
influence particle emissions during ablation of ceramic tiles were the type of laser and the energy
settings, as well as the type of tile and their physico-chemical surface properties. Particle emissions
were driven by:
Particle nucleation, in terms of particle number concentrations in the size range >10 nm.
Mechanical shockwaves, in terms of particle mass concentrations (>100 nm).
Ceramic tile melting and droplet expulsion, in terms of particle mass and number
concentrations, as this mechanism generated droplets with a wide range of particle diameters
(40-700 nm). It should be noted that the melting mode comprised also agglomerates and
Chapter 6. Conclusions
186
aggregates of smaller particles. Agglomerates have a wide range of sizes depending on the
primary size of the particles as well as the number of particles clustered.
Evidently, the chemical composition of the emitted particles depends on the ablated ceramic
tile. However, not all of the emitted particles had the same composition as the respective tile.
Nanoparticles composed only by certain of the tile elements may be released, for instance
SiO2 nanoparticles were emitted during the ablation of porcelain tiles.
Regarding the influence of the type of laser, a combination of mechanisms was found to
contribute to particle number emissions. The near-IR laser generated particles by means of
nucleation and melting, whereas the mid-IR laser produced particles through melting and
mechanical shockwaves.
2) Thermal spraying of ceramic coatings
The thermal spraying processes studied in this work (APS, HVOF) were seen to generate high particle
concentrations in terms of mass and number concentrations:
Atmospheric Plasma Spraying was characterized by high temperatures (5-20×103 °C) and
relatively low projection velocities (200-500 m/s). During APS the feedstock is melted and
metal vapors are oxidized by entrained air and condense in the cold zone of the jet, a
mechanism which results in nanoparticle formation. Nanoparticles emitted by APS mainly
had spherical shapes as they mostly originated from condensation of gaseous or liquid
precursors.
High Velocity Oxy-Fuel spraying was characterized by high velocities (up to 1500 m/s) and
relatively lower temperatures (2.9×10³ °C). In this case the feedstock was not entirely melted,
and particles were driven with supersonic speeds towards the workpiece. Nanoparticles
(mean Dp: ca. 30 nm) with irregular shapes were detected, suggesting that they were formed
during supersonic destructive collisions. An additional emission route could be the fugitive
emission of submicron particles, which would not be deposited on the substrate as they
would simply disperse inside the booth.
The main recommendations extracted regarding particle formation and release mechanisms are:
The size distribution of particles emitted during laser ablation of tiles is dependent on the
type of tile and laser used. Thus, the proper understanding of the link between process
parameters (type of laser and tile) and the resulting size distribution of particles emitted may
aid in the adequate design of exposure mitigation strategies.
Chapter 6. Conclusions
187
While the number and mean particle size of particles emitted during thermal spraying was
mostly similar for both spraying techniques (APS and HVOF), particle morphology was
markedly different depending on the temperature and projection velocity of the spraying
technique. As a result, the morphological characterization of particles in the worker area may
serve as a useful tool to identify the main sources of particle exposures, in thermal spraying
settings.
6.2. Exposure scenarios
Thermal spraying was assessed at pilot plant and industrial scale as a source of workplace exposures
to nanoparticles. Exposures were characterized using online and offline techniques, and with a focus
on different aerosol metrics including particle number and mass concentrations, size distribution,
chemical composition and hygroscopicity. Results evidenced that:
APS (assessed at pilot plant and industrial scale): particle emissions in terms of number
concentration were comparable at both scales (>106 cm-3), evidencing the potential for
occupational exposures generated by this industrial activity. The impact on worker exposure
was markedly lower at pilot plant scale: while exposure levels were high (5.8×10⁴ particles
cm-3) and above the nano-reference values (NRV, 4×104 cm-3) at industrial scale, they were
<NRVs in the pilot plant. Exposures were lower due to two main factors: the absence of
worker presence inside the spraying booths (which was not the case at industrial scale), and
the better implementation of mitigation strategies (mainly, source enclosure) in the pilot
plant.
HVOF (assessed at industrial scale): high particle number concentrations (>106 cm-3) were
recorded inside the thermal spraying booth (ES), which should also be considered an
exposure area given that the operator was frequently present inside the booth. Exposure
concentrations in the worker area (WA) were lower by one order of magnitude in terms of
number (104-105 cm-3) and up to a factor of 4 in terms of PM1 (44-100 µg m-3).
In terms of particle mass concentrations, and at industrial scale, particle mass concentrations
showed differences as a function of the spraying technique: PM1 concentrations were higher
in the HVOF booth (6.4×10² µg m-3) than during APS (6.1 µg m-3). This contrasts with particle
number concentrations, which were similar irrespective of the spraying technique and the
feedstock material applied. Results suggest that particle mass concentrations were mostly
Chapter 6. Conclusions
188
driven by fugitive emissions of the feedstock material under both spraying techniques, and
in addition by impaction mechanisms in the HVOF booth.
A size distribution analysis demonstrated that the majority of particles emitted during APS
and HVOF were between 26-90 nm, evidencing that spraying was a major source of
nanoparticles in terms of total number concentration.
The nanoparticles released exhibited a markedly different hygroscopic behaviour when
compared to background aerosols: nanoparticles emitted during thermal spraying were
found to be hygrophobic, in contrast with more hygrophillic background particles. Due to
these characteristic properties they can be easily distinguished, on a real-time basis with the
HTDMA, allowing fast identification of particle emission hotspots or accidental releases. This
would contribute to streamlining and tailoring particle exposure assessments in workplace
scenarios.
The main recommendations extracted are:
Thermal spraying activities have high potential to for nanoparticle (and fine particle) release
to workplace air. However, guidelines and regulations for occupational health refer mainly to
mass concentrations, and not to particle number concentration which would be a more
relevant metric for nanoparticle exposures. Thus, in order to protect workers against
nanoparticle exposures, risk management measures are of paramount importance.
Exposure may be fully mitigated at laboratory scale with adequately designed and
implemented strategies (e.g., in the case of laser ablation of tiles, a local exhaust ventilation
system). At pilot plant and industrial scales (e.g., during thermal spraying), full mitigation of
exposures is more complex and requires a combination of technological and non-
technological measures.
During thermal spraying, the presence of the operator/worker inside the spraying booth
during the spraying activity should be avoided at all times.
In thermal spraying scenarios, exposure mitigation strategies should cover different particle
size ranges: in both APS and HVOF scenarios strategies should focus on nanoparticles as well
as fine particles (<100 nm and >1 µm).

Chapter 6. Conclusions
189
6.3. Mitigation measures
The effectiveness of different mitigation strategies was assessed under different exposure scenarios:
Source substitution was applied by eliminating diesel engines and exchanging them with
electric ones, resulting to an efficiency of 92%. Based on the concept of substituting or
eliminating a source, the efficiency should have been 100%. However, in real-world industrial
scenarios it is challenging to distinguish one source from secondary and parallel ones, and
also to discriminate it from outdoor and background concentration. Thus, the calculated
efficiencies may be influenced from the above conditions.
Source isolation measures achieved efficiencies from 52% (enhanced sealing) to 84%
(optimal sealing and superior refractory condition); depending on the characteristics of the
insulating (refractory) material, type of kiln (conventional or advanced) and time of service
(new or old).
Engineering controls such as local exhaust ventilation, source enclosure and their
combinations were quantified. Different LEV configurations may reduce exposure
concentrations in terms of particle number by 65-85% and even reach 99% by combining
higher flow rates and enhanced enclosure.
The efficiency of personal protective equipment (PPE; face masks) was evaluated under real-
working conditions. The concentrations in the worker breathing zone (inside the mask) were
reduced by 87% when compared to the emission source ones. However, the breathing zone
concentrations were still high (4×105 cm-3).
The main recommendations extracted are:
Personal protective equipment: offers protection only to the individual wearing it and there
are several variables which may affect the performance of a respirator (e.g. fitting, breathing
rate); therefore, solely PPE may not offer adequate protection and should always be used in
combination with additional mitigation measures.
The diversity of potential sources and activities in industrial workplaces dictates the need for
tailored mitigation measures.

190
Chapter 7. Limitations and future work

Chapter 7. Limitations and future work
191
7. Limitations and future work
7.1. Limitations
7.1.1. Technical limitations
During the experimental campaigns performed in the framework of this Thesis different
instruments were used (SMPS, CPC, DiSCmini, NanoScan-SMPS). These instruments are based
on different measuring principles: SMPS and NanoScan DMAs classify particles based on their
electrical mobility, CPCs count particles by optical detectors; whereas DiSCmini uses an
electrometer to count particles. Furthermore, it was not always possible to have the same
time resolutions, the standard measurement error and the detection limits for each
instrument were different.
Particle number concentrations monitored at the emission sources (near field) were
markedly high (>1×106 cm-3), which meant that the maximum particle number concentration
limit of the instruments – as stated by the manufacturers – were exceeded. This resulted in
inhomogeneous degrees of uncertainty across the different datasets. The solution to this
problem would be the use of a dilution system upstream to all instruments, which would have
reduced uncertainties at high concentrations. However, the application of a dilution system
introduces additional practical difficulties during campaigns in real-world occupational
settings: (i) it can be applied to stationary instruments but it is rather complex for personal
monitors; (ii) portable instruments and monitors can operate autonomously (battery
operated) and the dilutors should be able follow; and (iii) either all the instruments need to
have a common inlet or several dilutors would be needed.
7.1.2. Operational and methodological limitations
In real-world occupational settings and industrial facilities there is a strict
operational/production schedule that needs to be followed and some exposure monitoring
gaps may arise. An approach that combines stationary and personal monitoring may
contribute to a comprehensive monitoring strategy. Nevertheless, such an approach would
require increased number of instruments/monitors.
Exposure monitoring is dependent on the monitoring location: particle concentrations show
high spatial-temporal variability, which means that source representability is a relevant
Chapter 7. Limitations and future work
192
issue. Thus, it is essential to ensure the collection of sufficient case details, including
repetitions to guarantee a representative exposure assessment. Furthermore, it is especially
relevant to focus exposure assessments on the modeling of aerosol processes driving
exposures (sources), so that the understanding of the processes may contribute to the design
of effective and targeted mitigation strategies.
7.2. Future work
7.2.1. Application of the data to models
The research performed in this PhD Thesis produced analytical data on particle exposure,
emission mechanisms, properties of the emitted particles and efficiency of mitigation
measures. These high resolution case-and task-specific data may have added value if used in
modeling approaches. They may be used for validation and calibration of models that predict
exposure (e.g. one/two box models). The information on the hygroscopicity of nanoparticles
could help develop the next generation inhalation-deposition models. Since the
characteristics of the inhaled particles change at the elevated relative humidity within the
human respiratory tract, new models could use this as a new variable in order to increase
their representability and accuracy. Furthermore, risk assessment and control banding tools
could use the available data to update their libraries and databases.
7.2.2. Application of the results to health risks and prevention
In the framework of this PhD Thesis and specifically during the second thermal spraying
experimental campaign (publication 3), process-generated nanoparticle samples were
collected on filters and also in liquid suspension. This was achieved using an aerosol
concentrator (versatile aerosol condensation enrichment system: VACES), with which size
segregated samples were obtained (fine, ultrafine and coarse). Filter samples were
chemically characterized by ICP MS/AES and XRF, while liquid samples were used for
toxicological assessment by means of ALI (air-liquid interface). The results obtained from
these analyses, which are not included in this PhD Thesis, may create an intersection on the
interpretation between exposure and health data combining exposure assessment, chemical
composition and hygroscopicity of aerosols with the toxicological response. This will be a

Chapter 7. Limitations and future work
193
holistic as well comprehensive analysis of a real case of exposure-risk-hazard due to
nanoparticle release.
The data in this Thesis also has potential for application in risk assessment. The case specific
data can indicate hotspots of potential hazards to sectors which are not directly related to
nanomaterials and nanotechnology, but where workers are exposed to high concentrations
of nanoparticles. This can increase understanding of possible symptoms and facilitate risk
identification. Moreover, it may contribute to the definition of relevant OEL values or other
legislative regulations.
Finally, the dissemination of the major findings and their potential health implications to the
workers directly affected can be paramount for their safety. The understanding of the
immediate risks along with the proper training on how to avoid them, can result in safer
operational practices among the workforce.

References
194
References
ACGIH, 1995. Threshold Limit Values for Chemical Substances and Physical Agents and Biological
Exposure Indices. Cincinnati, Ohio.
Agarwal, J.K., Sem, G.J., 1980. Continuous flow, single-particle-counting condensation nucleus
counter. J. Aerosol Sci. 11, 343–357. https://doi.org/https://doi.org/10.1016/0021-
8502(80)90042-7
Allen, G., Sioutas, C., Koutrakis, P., Reiss, R., Lurmann, F.W., Roberts, P.T., 1997. Evaluation of the
TEOM® Method for Measurement of Ambient Particulate Mass in Urban Areas. J. Air Waste
Manag. Assoc. 47, 682–689. https://doi.org/10.1080/10473289.1997.10463923
Alofs, D.J., Balakumar, P., 1982. Inversion to obtain aerosol size distributions from measurements
with a differential mobility analyzer. J. Aerosol Sci. 13, 513–527.
https://doi.org/10.1016/0021-8502(82)90017-9
Araujo, J.A., Barajas, B., Kleinman, M., Wang, X., Bennett, B.J., Gong, K.W., Navab, M., Harkema, J.,
Sioutas, C., Lusis, A.J., Nel, A.E., 2008. Ambient particulate pollutants in the ultrafine range
promote early atherosclerosis and systemic oxidative stress. Circ. Res. 102, 589–596.
https://doi.org/10.1161/CIRCRESAHA.107.164970
Asbach, C., Alexander, C., Clavaguera, S., Dahmann, D., Dozol, H., Faure, B., Fierz, M., Fontana, L.,
Iavicoli, I., Kaminski, H., MacCalman, L., Meyer-Plath, A., Simonow, B., van Tongeren, M., Todea,
A.M., 2017. Review of measurement techniques and methods for assessing personal exposure
to airborne nanomaterials in workplaces. Sci. Total Environ. 603–604, 793–806.
https://doi.org/10.1016/j.scitotenv.2017.03.049
Asbach, C., Clavaguera, S., Todea, A.M., 2016. Measurement Methods for Nanoparticles in Indoor and
Outdoor Air, in: Viana, M. (Ed.), Indoor and Outdoor Nanoparticles: Determinants of Release
and Exposure Scenarios. Springer International Publishing, Cham, pp. 19–49.
https://doi.org/10.1007/698_2015_423
Balakrishnan, K., Dey, S., Gupta, T., Dhaliwal, R.S., Brauer, M., Cohen, A.J., Stanaway, J.D., Beig, G.,
Joshi, T.K., Aggarwal, A.N., Sabde, Y., Sadhu, H., Frostad, J., Causey, K., Godwin, W., Shukla, D.K.,
Kumar, G.A., Varghese, C.M., Muraleedharan, P., Agrawal, A., Anjana, R.M., Bhansali, A.,

References
195
Bhardwaj, D., Burkart, K., Cercy, K., Chakma, J.K., Chowdhury, S., Christopher, D.J., Dutta, E.,
Furtado, M., Ghosh, S., Ghoshal, A.G., Glenn, S.D., Guleria, R., Gupta, R., Jeemon, P., Kant, R., Kant,
S., Kaur, T., Koul, P.A., Krish, V., Krishna, B., Larson, S.L., Madhipatla, K., Mahesh, P.A., Mohan, V.,
Mukhopadhyay, S., Mutreja, P., Naik, N., Nair, S., Nguyen, G., Odell, C.M., Pandian, J.D.,
Prabhakaran, D., Prabhakaran, P., Roy, A., Salvi, S., Sambandam, S., Saraf, D., Sharma, M.,
Shrivastava, A., Singh, V., Tandon, N., Thomas, N.J., Torre, A., Xavier, D., Yadav, G., Singh, S.,
Shekhar, C., Vos, T., Dandona, R., Reddy, K.S., Lim, S.S., Murray, C.J.L., Venkatesh, S., Dandona, L.,
2019. The impact of air pollution on deaths, disease burden, and life expectancy across the
states of India: the Global Burden of Disease Study 2017. Lancet Planet. Heal. 3, e26–e39.
https://doi.org/10.1016/S2542-5196(18)30261-4
Basinas, I., Jiménez, A.S., Galea, K.S., Tongeren, M. van, Hurley, F., 2018. A Systematic Review of the
Routes and Forms of Exposure to Engineered Nanomaterials. Ann. Work Expo. Heal. 62, 639–
662. https://doi.org/10.1093/annweh/wxy048
Bello, D., Wardle, B.L., Yamamoto, N., Guzman DeVilloria, R., Garcia, E.J., Hart, A.J., Ahn, K.,
Ellenbecker, M.J., Hallock, M., 2009. Exposure to nanoscale particles and fibers during
machining of hybrid advanced composites containing carbon nanotubes. J. Nanoparticle Res.
11, 231–249. https://doi.org/10.1007/s11051-008-9499-4
BéruBé, K., Balharry, D., Sexton, K., Koshy, L., Jones, T., 2007. COMBUSTION-DERIVED
NANOPARTICLES: MECHANISMS OF PULMONARY TOXICITY. Clin. Exp. Pharmacol. Physiol. 34,
1044–1050. https://doi.org/10.1111/j.1440-1681.2007.04733.x
Boverhof, D.R., Bramante, C.M., Butala, J.H., Clancy, S.F., Lafranconi, W.M., West, J., Gordon, S.C., 2015.
Comparative assessment of nanomaterial definitions and safety evaluation considerations.
Regul. Toxicol. Pharmacol. 73, 137–150. https://doi.org/10.1016/j.yrtph.2015.06.001
Brand, P., Havlicek, P., Steiners, M., Holzinger, K., Reisgen, U., Kraus, T., Gube, M., 2013a. Exposure of
healthy subjects with emissions from a gas metal arc welding process: Part 1 - Exposure
technique and external exposure. Int. Arch. Occup. Environ. Health 86, 25–30.
https://doi.org/10.1007/s00420-012-0739-7
Brand, P., Lenz, K., Reisgen, U., Kraus, T., 2013b. Number size distribution of fine and ultrafine fume
particles from various welding processes. Ann. Occup. Hyg. 57, 305–313.
https://doi.org/10.1093/annhyg/mes070

References
196
Brouwer, D., 2010. Exposure to manufactured nanoparticles in different workplaces. Toxicology
269, 120–127. https://doi.org/10.1016/j.tox.2009.11.017
Brouwer, D., Berges, M., Virji, M.A., Fransman, W., Bello, D., Hodson, L., Gabriel, S., Tielemans, E.,
2012. Harmonization of measurement strategies for exposure to manufactured nano-objects;
Report of a workshop. Ann. Occup. Hyg. 56, 1–9. https://doi.org/10.1093/annhyg/mer099
Brouwer, D., Van Duuren-Stuurman, B., Berges, M., Jankowska, E., Bard, D., Mark, D., 2009. From
workplace air measurement results toward estimates of exposure? Development of a strategy
to assess exposure to manufactured nano-objects. J. Nanoparticle Res. 11, 1867–1881.
https://doi.org/10.1007/s11051-009-9772-1
Brouwer, D.H., Gijsbers, J.H.J., Lurvink, M.W.M., 2004. Personal exposure to ultrafine particles in the
workplace: Exploring sampling techniques and strategies. Ann. Occup. Hyg. 48, 439–453.
https://doi.org/10.1093/annhyg/meh040
Burtscher, H., 2005. Physical characterization of particulate emissions from diesel engines: a
review. J. Aerosol Sci. 36, 896–932. https://doi.org/10.1016/j.jaerosci.2004.12.001
Buzea, C., Pacheco, I.I., Robbie, K., 2007. Nanomaterials and nanoparticles: Sources and toxicity.
Biointerphases 2, MR17–MR71. https://doi.org/10.1116/1.2815690
CEN, 1993. Workplace Atmospheres - Size Fraction Definitions for Measurement of Airborne
Particles. Belgium.
Cena, L.G., Chisholm, W.P., Keane, M.J., Chen, B.T., 2015. A Field Study on the Respiratory Deposition
of the Nano-Sized Fraction of Mild and Stainless Steel Welding Fume Metals. J. Occup. Environ.
Hyg. 12, 721–728. https://doi.org/10.1080/15459624.2015.1043055
Chen, D., Pui, D.Y.H., Hummes, D., Fissan, H., Quant, F.R., Sem, G.J., 1996. Nanometer differential
mobility analyzer (Nano-DMA): Design and numerical modeling. J. Aerosol Sci. 27, S137–S138.
https://doi.org/10.1016/0021-8502(96)00141-3
Chen, M., Wang, H., Sun, Q., Yu, F., Wang, Y., Wan, W., Wang, C., Gui, H., Liu, J., Lü, L., 2019. Simulation
of Miniature PDMA for Ultrafine-Particle Measurement. Atmosphere (Basel). 10, 116.
https://doi.org/10.3390/atmos10030116
Chow, J.C., 1995. Measurement methods to determine compliance with ambient air quality
standards for suspended particles. J. Air Waste Manag. Assoc. 45, 320–382.
References
197
https://doi.org/10.1080/10473289.1995.10467369
Colomban, P., 2013. The Destructive/Non-Destructive Identification of Enameled Pottery, Glass
Artifacts and Associated Pigments—A Brief Overview. Arts 2, 77–110.
https://doi.org/10.3390/arts2030077
Conti, J.A., Killpack, K., Gerritzen, G., Huang, L., Mircheva, M., Delmas, M., Harthorn, B.H., Appelbaum,
R.P., Holden, P.A., 2008. Health and safety practices in the nanomaterials workplace: Results
from an international survey. Environ. Sci. Technol. 42, 3155–3162.
https://doi.org/10.1021/es702158q
D’Anna, A., 2009. Combustion-formed nanoparticles. Proc. Combust. Inst. 32, 593–613.
https://doi.org/10.1016/j.proci.2008.09.005
Debia, M., Bakhiyi, B., Ostiguy, C., Verbeek, J.H., Brouwer, D.H., Murashov, V., 2016. A Systematic
Review of Reported Exposure to Engineered Nanomaterials. Ann. Occup. Hyg. 60, 916–935.
https://doi.org/10.1093/annhyg/mew041
Deepshikha, S., Srinivasan, J., 2010. Discriminating between natural and anthropogenic aerosol
contributions to optical depth over Afro-Asian region. Atmos. Sci. Lett. 11, 307–312.
https://doi.org/10.1002/asl.299
Demou, E., Stark, W.J., Hellweg, S., 2009. Particle emission and exposure during nanoparticle
synthesis in research laboratories. Ann. Occup. Hyg. 53, 829–838.
https://doi.org/10.1093/annhyg/mep061
Ding Y., Kuhlbusch T.A.J., Van Tongeren M, Jiménez AS, Tuinman I., Chen R., Alvarez I.L, Mikolajczyk
U., Nickel C., Meyer J, Kaminski H, Wohlleben W, Stahlmecke B., Clavaguera S., Riediker M.,
2017. Airborne engineered nanomaterials in the workplace—a review of release and worker
exposure during nanomaterial production and handling processes. J. Hazard. Mat. 322, 17–28.
https://doi.org/10.1016/j.jhazmat.2016.04.075
Donaldson, K., Brown, D., Clouter, A., Duffin, R., MacNee, W., Renwick, L., Tran, L., Stone, V., 2002.
The Pulmonary Toxicology of Ultrafine Particles. J. Aerosol Med. 15, 213–220.
https://doi.org/10.1089/089426802320282338
Donaldson, K., Stone, V., Clouter, A., Renwick, L., MacNee, W., 2001a. Ultrafine particles. Occup.
Environ. Med. 58, 211–216. https://doi.org/10.1136/oem.58.3.211

References
198
Donaldson, K., Stone, V., Seaton, A., Macnee, W., 2001b. Ambient particle inhalation and the
cardiovascular system: potential mechanisms. Environ. Health Perspect. 109, 523–527.
https://doi.org/sc271_5_1835 [pii]
Donaldson, K., Tran, L., Jimenez, L.A., Duffin, R., Newby, D.E., Mills, N., MacNee, W., Stone, V., 2005.
Combustion-derived nanoparticles: A review of their toxicology following inhalation exposure.
Part. Fibre Toxicol. 2, 1–14. https://doi.org/10.1186/1743-8977-2-10
E.U., 2014. COUNCIL DIRECTIVE 98/24/EC. Off. J. Eur. Communities.
Eleftheriadis, K., Ochsenkuhn, K.M., Lymperopoulou, T., Karanasiou, A., Razos, P., Ochsenkuhn-
Petropoulou, M., 2014. Influence of local and regional sources on the observed spatial and
temporal variability of size resolved atmospheric aerosol mass concentrations and water-
soluble species in the Athens metropolitan area. Atmos. Environ. 97, 252–261.
https://doi.org/10.1016/j.atmosenv.2014.08.013
Elihn, K., Ulvestad, B., Hetland, S., Wallén, A., Randem, B.G., 2008. Exposure to ultrafine particles in
asphalt work. J. Occup. Environ. Hyg. 5, 771–779.
https://doi.org/10.1080/15459620802473891
Epp, J., 2016. X-ray diffraction (XRD) techniques for materials characterization, in: Materials
Characterization Using Nondestructive Evaluation (NDE) Methods. Elsevier, pp. 81–124.
https://doi.org/10.1016/B978-0-08-100040-3.00004-3
EU, 2011. RECOMMENDATIONS ON THE DEFINITION OF NANOMATERIAL. Off. J. Eur. Union L
275/38.
EU, 1989. 89/336/EEC. Off. J. Eur. Communities 139, 1–8.
Evans, D.E., Heitbrink, W.A., Slavin, T.J., Peters, T.M., 2008. Ultrafine and respirable particles in an
automotive grey iron foundry. Ann. Occup. Hyg. 52, 9–21.
https://doi.org/10.1093/annhyg/mem056
Ferin, J., Oberdörster, G., Penney, D.P., 1992. Pulmonary Retention of Ultrafine and Fine Particles in
Rats. Am. J. Respir. Cell Mol. Biol. 6, 535–542. https://doi.org/10.1165/ajrcmb/6.5.535
Fierz, M., Houle, C., Steigmeier, P., Burtscher, H., 2011. Design, calibration, and field performance of
a miniature diffusion size classifier. Aerosol Sci. Technol. 45, 1–10.
https://doi.org/10.1080/02786826.2010.516283
References
199
Flagan, R.C., 1998. History of Electrical Aerosol Measurements. Aerosol Sci. Technol. 28, 301–380.
https://doi.org/10.1080/02786829808965530
Fonseca, A.S., 2016. Exposure characterisation and source of nanoparticles in workplace
enviroments. University of Barcelona.
Fonseca, A.S., Kuijpers, E., Kling, K.I., Levin, M., Koivisto, A.J., Nielsen, S.H., Fransman, W., Fedutik, Y.,
Jensen, K.A., Koponen, I.K., 2018. Particle release and control of worker exposure during
laboratory-scale synthesis, handling and simulated spills of manufactured nanomaterials in
fume hoods. J. Nanoparticle Res. 20. https://doi.org/10.1007/s11051-018-4136-3
Fonseca, A.S., Maragkidou, A., Viana, M., Querol, X., Hämeri, K., de Francisco, I., Estepa, C., Borrell, C.,
Lennikov, V., de la Fuente, G.F., 2016a. Process-generated nanoparticles from ceramic tile
sintering: Emissions, exposure and environmental release. Sci. Total Environ. 565, 922–932.
https://doi.org/10.1016/j.scitotenv.2016.01.106
Fonseca, A.S., Viana, M., Pérez, N., Alastuey, A., Querol, X., Kaminski, H., Todea, A.M., Monz, C.,
Asbach, C., 2016b. Intercomparison of a portable and two stationary mobility particle sizers
for nanoscale aerosol measurements. Aerosol Sci. Technol. 50, 653–668.
https://doi.org/10.1080/02786826.2016.1174329
Fonseca, A.S., Viana, M., Querol, X., Moreno, N., de Francisco, I., Estepa, C., de la Fuente, G.F., 2015.
Ultrafine and nanoparticle formation and emission mechanisms during laser processing of
ceramic materials. J. Aerosol Sci. 88, 48–57. https://doi.org/10.1016/j.jaerosci.2015.05.013
Fonseca, A.S., Viitanen, A.K., Koivisto, A.J., Kangas, A., Huhtiniemi, M., Hussein, T., Vanhala, E., Viana,
M., Querol, X., Hameri, K., 2014. Characterization of exposure to carbon nanotubes in an
industrial setting. Ann. Occup. Hyg. 59, 586–599. https://doi.org/10.1093/annhyg/meu110
Gabay, C., Kushner, I., 1999. ACUTE-PHASE PROTEINS AND OTHER SYSTEMIC RESPONSES TO
INFLAMMATION. N. Engl. J. Med. 340, 448–454.
Gebhart, J., 2001. Optical direct-reading techniques: light intensity systems. Wiley-Interscience,New
York, NY, New York.
Gerritzen, R.G., Huang, L., Killpack, K., Mircheva, M., Conti, J., 2006. Review of Safety Practices in the
Nanotechnology Industry. Saf. Heal. 31.
Goede, H., Christopher-de Vries, Y., Kuijpers, E., Fransman, W., 2018. A Review of Workplace Risk

References
200
Management Measures for Nanomaterials to Mitigate Inhalation and Dermal Exposure. Ann.
Work Expo. Heal. 1–16. https://doi.org/10.1093/annweh/wxy032
Göhler, D., Stintz, M., Hillemann, L., Vorbau, M., 2010. Characterization of nanoparticle release from
surface coatings by the simulation of a sanding process. Ann. Occup. Hyg. 54, 615–624.
https://doi.org/10.1093/annhyg/meq053
Graczyk, H., Lewinski, N., Zhao, J., Concha-Lozano, N., Riediker, M., 2015. Characterization of
Tungsten Inert Gas (TIG) Welding Fume Generated by Apprentice Welders. Ann. Occup. Hyg.
60, 205–219. https://doi.org/10.1093/annhyg/mev074
GRIMM Aerosol Technik GmbH, n.d. MINI WIDE RANGE AEROSOL SPECTROMETER-Model 1371
[WWW Document]. www.GRIMM-aerosol.com. URL https://www.grimm-
aerosol.com/products-en/indoor-air-quality/the-wide-range-hybrid/1371/
Gu, J., Wensing, M., Uhde, E., Salthammer, T., 2019. Characterization of particulate and gaseous
pollutants emitted during operation of a desktop 3D printer. Environ. Int. 123, 476–485.
https://doi.org/10.1016/j.envint.2018.12.014
Hagen, D.E., Alofs, D.J., 1983. Linear Inversion Method to Obtain Aerosol Size Distributions from
Measurements with a Differential Mobility Analyzer. Aerosol Sci. Technol. 2, 465–475.
https://doi.org/10.1080/02786828308958650
Halperin, W.E., 1996. The role of surveillance in the hierarchy of prevention. Am. J. Ind. Med. 29,
321–323. https://doi.org/10.1002/(SICI)1097-0274(199604)29:4<321::AID-AJIM8>3.0.CO;2-
R
Hermann, M., Wehner, B., Bischof, O., Han, H.S., Krinke, T., Liu, W., Zerrath, A., Wiedensohler, A.,
2007. Particle counting efficiencies of new TSI condensation particle counters. J. Aerosol Sci.
38, 674–682. https://doi.org/10.1016/j.jaerosci.2007.05.001
Hewitt, G.W., 1957. The charging of small particles for electrostatic precipitation. Trans. Am. Inst.
Electr. Eng. Part I Commun. Electron. 76, 300–306.
https://doi.org/10.1109/TCE.1957.6372672
Hinds, W.C., 1999. Aerosol technology: properties, behavior, and measurement of airborne
particles. John Wiley & Sons.
Hoek, G., Boogaard, H., Knol, A., De Hartog, J., Slottje, P., Ayres, J.G., Borm, P., Brunekreef, B.,
References
201
Donaldson, K., Forastiere, F., Holgate, S., Kreyling, W.G., Nemery, B., Pekkanen, J., Stone, V.,
Wichmann, H.E., Van Der Sluijs, J., 2010. Concentration response functions for ultrafine
particles and all-cause mortality and hospital admissions: Results of a European expert panel
elicitation. Environ. Sci. Technol. 44, 476–482. https://doi.org/10.1021/es9021393
Hoppel, W.A., 1978. Determination of the aerosol size distribution from the mobility distribution of
the charged fraction of aerosols. J. Aerosol Sci. 9, 41–54. https://doi.org/10.1016/0021-
8502(78)90062-9
Ibald-Mulli, A., Wichmann, H.-E., Kreyling, W., Peters, A., 2002. Epidemiological Evidence on Health
Effects of Ultrafine Particles. J. Aerosol Med. 15, 189–201.
https://doi.org/10.1089/089426802320282310
Invernizzi, N., 2011. Nanotechnology between the lab and the shop floor: What are the effects on
labor? J. Nanoparticle Res. 13, 2249–2268. https://doi.org/10.1007/s11051-011-0333-z
ISO, 1995. ISO 7708:1995-Air quality - Particle size fraction definitions for health-related sampling.
Jenkins, N.T., Eagar, T.W., Pierce, G., 2005. Particle Size Distribution of Gas Metal and FLux Cored
Arc Welding Fumes. Scan. Electron Microsc. 156–163.
Jenner, M., 1995. The politics of London air John Evelyn’s Fumifugium and the Restoration. Hist. J.
38, 535–551. https://doi.org/10.1017/S0018246X00019968
Jiménez, A.S., Tongeren, M. Van, Cherrie, J.W., 2011. A review of monitoring methods for inhalable
hardwood dust.
Kaluza, S., Balderhaar, J. kleine, Orthen, B., Honnert, B., Jankowska, E., Pietrowsk, P., Gracia Rosell,
M., Tanarro, C., Tejedor, J., Zugasti, A., 2013. Workplace exposure to nanoparticles, EU-OSHA.
Kaminski, H., Beyer, M., Fissan, H., Asbach, C., Kuhlbusch, T.A.J., 2015. Measurements of nanoscale
TiO2and Al2O3in industrial workplace environments – Methodology and results. Aerosol Air
Qual. Res. 15, 129–141. https://doi.org/10.4209/aaqr.2014.03.0065
Kim, B., Lee, J.S., Choi, B.S., Park, S.Y., Yoon, J.H., Kim, H., 2013. Ultrafine particle characteristics in a
rubber manufacturing factory. Ann. Occup. Hyg. 57, 728–739.
https://doi.org/10.1093/annhyg/mes102
Kim, J.J., American Academy of Pediatrics Committee on Environmental Health, 2004. Ambient air
pollution: health hazards to children. Pediatrics 114, 1699—1707.
References
202
https://doi.org/10.1542/peds.2004-2166
Knibbs, L.D., Cole-Hunter, T., Morawska, L., 2011. A review of commuter exposure to ultrafine
particles and its health effects. Atmos. Environ. 45, 2611–2622.
https://doi.org/10.1016/j.atmosenv.2011.02.065
Knutson, E.O., Whitby, K.T., 1975. Aerosol classification by electric mobility: apparatus, theory, and
applications. J. Aerosol Sci. 6, 443–451. https://doi.org/10.1016/0021-8502(75)90060-9
Kohli, R., 2012. Chapter 3 - Methods for Monitoring and Measuring Cleanliness of Surfaces, in: Kohli,
R., Mittal, K.L. (Eds.), Developments in Surface Contamination and Cleaning. William Andrew
Publishing, Oxford, pp. 107–178. https://doi.org/https://doi.org/10.1016/B978-1-4377-
7883-0.00003-1
Koivisto, A.J., Aromaa, M., Mäkelä, J.M., Pasanen, P., Hussein, T., Hämeri, K., 2012a. Concept To
Estimate Regional Inhalation Dose of Industrially Synthesized Nanoparticles. ACS Nano 6,
1195–1203. https://doi.org/10.1021/nn203857p
Koivisto, A.J., Aromaa, M., Mäkelä, J.M., Pasanen, P., Hussein, T., Hämeri, K., Koivisto, A.J., Aromaa, M.,
Mäkelä, J.M., Hussein, T., 2012b. Concept To Estimate Regional Inhalation Dose of Industrially
Synthesized Nanoparticles. ACS Nano 6, 1195–1203. https://doi.org/10.1021/nn203857p
Koivisto, A.J., Hussein, T., Niemelä, R., Tuomi, T., Hämeri, K., 2010. Impact of particle emissions of
new laser printers on modeled office room. Atmos. Environ. 44, 2140–2146.
https://doi.org/https://doi.org/10.1016/j.atmosenv.2010.02.023
Koivisto, A.J., Jensen, A.C.Ø., Kling, K.I., Nørgaard, A., Brinch, A., Christensen, F., Jensen, K.A., 2017.
Quantitative material releases from products and articles containing manufactured
nanomaterials: Towards a release library. NanoImpact 5, 119–132.
https://doi.org/10.1016/j.impact.2017.02.001
Koivisto, A.J., Jensen, A.C.Ø., Levin, M., Kling, K.I., Maso, M.D., Nielsen, S.H., Jensen, K.A., Koponen, I.K.,
2015. Testing the near field/far field model performance for prediction of particulate matter
emissions in a paint factory. Environ. Sci. Process. Impacts 17, 62–73.
https://doi.org/10.1039/c4em00532e
Koivisto, A.J., Kling, K.I., Levin, M., Fransman, W., Gosens, I., Cassee, F.R., Jensen, K.A., 2016. First
order risk assessment for nanoparticle inhalation exposure during injection molding of
polypropylene composites and production of tungsten-carbide-cobalt fine powder based upon
References
203
pulmonary inflammation and surface area dose. NanoImpact 6, 30–38.
https://doi.org/10.1016/j.impact.2016.11.002
Koponen, I.K., Koivisto, A.J., Jensen, K.A., 2015. Worker exposure and high time-resolution analyses
of process-related submicrometre particle concentrations at mixing stations in two paint
factories. Ann. Occup. Hyg. 59, 749–763. https://doi.org/10.1093/annhyg/mev014
Kuhlbusch, T.A.J., Asbach, C., Fissan, H., Göhler, D., Stintz, M., 2011. Nanoparticle exposure at
nanotechnology workplaces: A review. Part. Fibre Toxicol. 8, 1–18.
https://doi.org/10.1186/1743-8977-8-22
Kuhlbusch, T.A.J., Wijnhoven, S.W.P., Haase, A., 2018. Nanomaterial exposures for worker, consumer
and the general public. NanoImpact 10, 11–25. https://doi.org/10.1016/j.impact.2017.11.003
Landrigan, P.J., 2017. Air pollution and health. Lancet Public Heal. 2, e4–e5.
https://doi.org/10.1016/S2468-2667(16)30023-8
Landrigan, P.J., Fuller, R., Acosta, N.J.R., Adeyi, O., Arnold, R., Basu, N., Baldé, A.B., Bertollini, R., Bose-
O’Reilly, S., Boufford, J.I., Breysse, P.N., Chiles, T., Mahidol, C., Coll-Seck, A.M., Cropper, M.L.,
Fobil, J., Fuster, V., Greenstone, M., Haines, A., Hanrahan, D., Hunter, D., Khare, M., Krupnick, A.,
Lanphear, B., Lohani, B., Martin, K., Mathiasen, K. V., McTeer, M.A., Murray, C.J.L.,
Ndahimananjara, J.D., Perera, F., Potočnik, J., Preker, A.S., Ramesh, J., Rockström, J., Salinas, C.,
Samson, L.D., Sandilya, K., Sly, P.D., Smith, K.R., Steiner, A., Stewart, R.B., Suk, W.A., van Schayck,
O.C.P., Yadama, G.N., Yumkella, K., Zhong, M., 2017. The Lancet Commission on pollution and
health. Lancet 391. https://doi.org/10.1016/S0140-6736(17)32345-0
Lehnert, M., Pesch, B., Lotz, A., Pelzer, J., Kendzia, B., Gawrych, K., Heinze, E., Van Gelder, R.,
Punkenburg, E., Weiss, T., Mattenklott, M., Hahn, J.U., Möhlmann, C., Berges, M., Hartwig, A.,
Brüning, T., 2012. Exposure to inhalable, respirable, and ultrafine particles in welding fume.
Ann. Occup. Hyg. 56, 557–567. https://doi.org/10.1093/annhyg/mes025
Lelieveld, J., Evans, J.S., Fnais, M., Giannadaki, D., Pozzer, A., 2015. The contribution of outdoor air
pollution sources to premature mortality on a global scale. Nature 525, 367–371.
https://doi.org/10.1038/nature15371
Lelieveld, J., Klingmüller, K., Pozzer, A., Pöschl, U., Fnais, M., Daiber, A., Münzel, T., 2019.
Cardiovascular disease burden from ambient air pollution in Europe reassessed using novel
hazard ratio functions. Eur. Heart J. 1590–1596. https://doi.org/10.1093/eurheartj/ehz135
References
204
Liu, B.Y.H., Kim, C.S., 1977. On the counting efficiency of condensation nuclei counters. Atmos.
Environ. 11, 1097–1100. https://doi.org/10.1016/0004-6981(77)90240-2
Liu, B.Y.H., Pui, D.Y.., 1974a. A submicron aerosol standard and the primary, absolute calibration of
the condensation nuclei counter. J. Colloid Interface Sci. 47, 155–171.
https://doi.org/10.1016/0021-9797(74)90090-3
Liu, B.Y.H., Pui, D.Y.H., 1974b. Electrical neutralization of aerosols. J. Aerosol Sci. 5, 465–472.
https://doi.org/10.1016/0021-8502(74)90086-X
Manoli, E., Voutsa, D., Samara, C., 2002. Chemical characterization and source
identificatio/napportionment of fine and coarse air particles in Thessaloniki, Greece. Atmos.
Environ. 36, 949–961.
Maynard, A.D., Aitken, R.J., 2007. Assessing exposure to airborne nanomaterials: Current abilities
and future requirements. Nanotoxicology 1, 26–41.
https://doi.org/10.1080/17435390701314720
McMurry, P.H., 2000a. A review of atmospheric aerosol measurements. Atmos. Environ. 34, 1959–
1999. https://doi.org/10.1016/S1352-2310(99)00455-0
McMurry, P.H., 2000b. The history of condensation nucleus counters. Aerosol Sci. Technol. 33, 297–
322. https://doi.org/10.1080/02786820050121512
Mills, N.L., Miller, M.R., Lucking, A.J., Beveridge, J., Flint, L., Boere, A.J.F., Fokkens, P.H., Boon, N.A.,
Sandstrom, T., Blomberg, A., Duffin, R., Donaldson, K., Hadoke, P.W.F., Cassee, F.R., Newby, D.E.,
2011. Combustion-derived nanoparticulate induces the adverse vascular effects of diesel
exhaust inhalation. Eur. Heart J. 32, 2660–2671. https://doi.org/10.1093/eurheartj/ehr195
Monsé, C., Hagemeyer, O., Raulf, M., Jettkant, B., van Kampen, V., Kendzia, B., Gering, V., Kappert, G.,
Weiss, T., Ulrich, N., Marek, E.-M., Bünger, J., Brüning, T., Merget, R., 2018. Concentration-
dependent systemic response after inhalation of nano-sized zinc oxide particles in human
volunteers. Part. Fibre Toxicol. 15, 8. https://doi.org/10.1186/s12989-018-0246-4
Morawska, L., He, C., Johnson, G., Jayaratne, R., Salthammer, T., Wang, H., Uhde, E., Bostrom, T.,
Modini, R., Ayoko, G., McGarry, P., Wensing, M., 2009. An Investigation into the Characteristics
and Formation Mechanisms of Particles Originating from the Operation of Laser Printers.
Environ. Sci. Technol. 43, 1015–1022. https://doi.org/10.1021/es802193n
References
205
NIOSH, 2013. Protecting the Nanotechnology Workforce. Cincinnati, OH: U.S.
O’Dowd, C.D., De Leeuw, G., 2007. Marine aerosol production: A review of the current knowledge.
Philos. Trans. R. Soc. A Math. Phys. Eng. Sci. 365, 1753–1774.
https://doi.org/10.1098/rsta.2007.2043
Oberdörster, G., Oberdörster, E., Oberdörster, J., 2005a. Nanotoxicology: An Emerging Discipline
Evolving from Studies of Ultrafine Particles. Environ. Health Perspect. 113, 823–839.
https://doi.org/10.1289/ehp.7339
Oberdörster, G., Oberdörster, E., Oberdörster, J., 2005b. Nanotoxicology: An emerging discipline
evolving from studies of ultrafine particles. Environ. Health Perspect. 113, 823–839.
https://doi.org/10.1289/ehp.7339
Oberdörster, G., Utell, J.M., 2002. Ultrafine Particles in the Urban Air: To the Respiratory Tract—
And Beyond? Environ. Health Perspect. 110, 440–441. https://doi.org/10.2788/678452
OECD, 2015. Harmonized Tiered Approach to Measure and Assess the Potential Exposure to
Airborne Emissions of Engineered Nano-Objects and their Agglomerates and Aggregates at
Workplaces. Ser. Saf. Manuf. Nanomater. No.55 55, JT03378848–JT03378848.
OJIMA, J., 2012. Gaseous Contaminant Distribution in the Breathing Zone. Ind. Health 50, 236–238.
https://doi.org/10.2486/indhealth.MS1314
Pey, J., Querol, X., Alastuey, A., Forastiere, F., Stafoggia, M., 2013. African dust outbreaks over the
Mediterranean Basin during 2001–2011: PM10 concentrations, phenomenology and trends,
and its relation with synoptic and mesoscale meteorology. Atmos. Chem. Phys. 13, 1395–1410.
https://doi.org/10.5194/acp-13-1395-2013
Pope, C.A., Dockery, D.W., Schwartz, J., 1995. Review of Epidemiological Evidence of Health Effects
of Particulate Air Pollution. Inhal. Toxicol. 7, 1–18.
Querol, X., Alastuey, A., Ruiz, C.R., Artiñano, B., Hansson, H.C., Harrison, R.M., Buringh, E., Ten Brink,
H.M., Lutz, M., Bruckmann, P., Straehl, P., Schneider, J., 2004a. Speciation and origin of PM10
and PM2.5 in selected European cities. Atmos. Environ. 38, 6547–6555.
https://doi.org/10.1016/j.atmosenv.2004.08.037
Querol, X., Alastuey, A., Viana, M.M., Rodriguez, S., Artiñano, B., Salvador, P., Garcia Do Santos, S.,
Fernandez Patier, R., Ruiz, C.R., De La Rosa, J., Sanchez De La Campa, A., Menendez, M., Gil, J.I.,
References
206
2004b. Speciation and origin of PM10 and PM2.5 in Spain. J. Aerosol Sci. 35, 1151–1172.
https://doi.org/10.1016/j.jaerosci.2004.04.002
Querol, X., Viana, M., Alastuey, A., Amato, F., Moreno, T., Castillo, S., Pey, J., de la Rosa, J., Sánchez de
la Campa, A., Artíñano, B., Salvador, P., García Dos Santos, S., Fernández-Patier, R., Moreno-
Grau, S., Negral, L., Minguillón, M.C., Monfort, E., Gil, J.I., Inza, A., Ortega, L.A., Santamaría, J.M.,
Zabalza, J., 2007. Source origin of trace elements in PM from regional background, urban and
industrial sites of Spain. Atmos. Environ. 41, 7219–7231.
https://doi.org/10.1016/j.atmosenv.2007.05.022
Rader, D.J., McMurry, P.H., 1986. Application of the tandem differential mobility analyzer to studies
of droplet growth or evaporation. J. Aerosol Sci. 17, 771–787. https://doi.org/10.1016/0021-
8502(86)90031-5
Ramachandran, G., 2008. Toward better exposure assessment strategies - The new NIOSH initiative.
Ann. Occup. Hyg. 52, 297–301. https://doi.org/10.1093/annhyg/men025
Raynor, P.C., Cebula, J.I., Spangenberger, J.S., Olson, B.A., Dasch, J.M., D’Arcy, J.B., 2012. Assessing
Potential Nanoparticle Release During Nanocomposite Shredding Using Direct-Reading
Instruments. J. Occup. Environ. Hyg. 9, 1–13. https://doi.org/10.1080/15459624.2012.633061
Ribalta, C., Koivisto, A.J., Salmatonidis, A., López-Lilao, A., Monfort, E., Viana, M., 2019. Modeling of
High Nanoparticle Exposure in an Indoor Industrial Scenario with a One-Box Model. Int. J.
Environ. Res. Public Health 16, 1695. https://doi.org/10.3390/ijerph16101695
Saber, A.T., Jacobsen, N.R., Jackson, P., Poulsen, S.S., Kyjovska, Z.O., Halappanavar, S., Yauk, C.L.,
Wallin, H., Vogel, U., 2014. Particle-induced pulmonary acute phase response may be the
causal link between particle inhalation and cardiovascular disease. Wiley Interdiscip. Rev.
Nanomedicine Nanobiotechnology 6, 517–531. https://doi.org/10.1002/wnan.1279
Sadik, O.A., 2013. Anthropogenic nanoparticles in the environment. Environ. Sci. Process. Impacts
15, 19–20. https://doi.org/10.1039/c2em90063g
Salmatonidis, A., Ribalta, C., Sanfélix, V., Bezantakos, S., Biskos, G., Vulpoi, A., Simion, S., Monfort, E.,
Viana, M., 2019a. Workplace Exposure to Nanoparticles during Thermal Spraying of Ceramic
Coatings. Ann. Work Expo. Heal. 63, 91–106. https://doi.org/10.1093/annweh/wxy094
Salmatonidis, A., Viana, M., Biskos, G., Bezantakos, S., 2019b. Hygroscopic behaviour of UFPs emitted
during thermal spraying, submited to the Journal of Aerosol Science (under review).

References
207
Salmatonidis, A., Viana, M., Pérez, N., Alastuey, A., de la Fuente, G.F., Angurel, L.A., Sanfélix, V.,
Monfort, E., 2018. Nanoparticle formation and emission during laser ablation of ceramic tiles.
J. Aerosol Sci. 126, 152–168. https://doi.org/10.1016/j.jaerosci.2018.09.006
Sanfélix, V., Monfort, E., López-Lilao, A., Estupiñá, S., Viana, M., Salmatonidis, A., Guaita, L., Nácher, F.,
M.C.Bellés, Ribera, A., 2018. Emissions of Nanoparticles Generated in the Ceramic Process, in:
Qualicer 2018. Castellon, pp. 1–11.
Savolainen, K., Alenius, H., Norppa, H., Pylkkänen, L., Tuomi, T., Kasper, G., 2010a. Risk assessment
of engineered nanomaterials and nanotechnologies-A review. Toxicology 269, 92–104.
https://doi.org/10.1016/j.tox.2010.01.013
Savolainen, K., Pylkkänen, L., Norppa, H., Falck, G., Lindberg, H., Tuomi, T., Vippola, M., Alenius, H.,
Hämeri, K., Koivisto, J., Brouwer, D., Mark, D., Bard, D., Berges, M., Jankowska, E., Posniak, M.,
Farmer, P., Singh, R., Krombach, F., Bihari, P., Kasper, G., Seipenbusch, M., 2010b.
Nanotechnologies, engineered nanomaterials and occupational health and safety - A review.
Saf. Sci. 48, 957–963. https://doi.org/10.1016/j.ssci.2010.03.006
Schaming, D., Remita, H., 2015. Nanotechnology: from the ancient time to nowadays. Found. Chem.
17, 187–205. https://doi.org/10.1007/s10698-015-9235-y
Schmid, O., Stoeger, T., 2017. Surface area is the biologically most effective dose metric for acute
nanoparticle toxicity in the lung. J. Aerosol Sci. 113, 276.
https://doi.org/10.1016/j.jaerosci.2017.09.017
Schulte, P., Geraci, C., Zumwalde, R., Hoover, M., Kuempe, E., 2008. Occupational risk management of
engineered nanoparticles. J. Occup. Environ. Hyg. 5, 239–249.
https://doi.org/10.1080/15459620801907840
Schulte, P.A., Geraci, C.L., Murashov, V., Kuempel, E.D., Zumwalde, R.D., Castranova, V., Hoover, M.D.,
Hodson, L., Martinez, K.F., 2014. Occupational safety and health criteria for responsible
development of nanotechnology. J. Nanoparticle Res. 16. https://doi.org/10.1007/s11051-
013-2153-9
Schulte, P.A., Roth, G., Hodson, L.L., Murashov, V., Hoover, M.D., Zumwalde, R., Kuempel, E.D., Geraci,
C.L., Stefaniak, A.B., Castranova, V., Howard, J., 2016. Taking stock of the occupational safety
and health challenges of nanotechnology: 2000–2015. J. Nanoparticle Res. 18, 1–21.
https://doi.org/10.1007/s11051-016-3459-1
References
208
Sowards, J., Lippold, J., Dickinson, D., Ramirez, A., 2008. Characterization of Welding Fume from
SMAW Electrodes — Part I. Weld. JOURNAL-NEW YORK 87.
Šrám, R.J., Binková, B., Dejmek, J., Bobak, M., 2005. Ambient Air Pollution and Pregnancy Outcomes:
A Review of the Literature. Environ. Health Perspect. 113, 375–382.
https://doi.org/10.1289/ehp.6362
Stephens, B., Azimi, P., El, Z., Ramos, T., 2013. Ultra fi ne particle emissions from desktop 3D
printers. Atmos. Environ. 79, 334–339. https://doi.org/10.1016/j.atmosenv.2013.06.050
Stoeger, T., Reinhard, C., Takenaka, S., Schroeppel, A., Karg, E., Ritter, B., Heyder, J., Schulz, H., 2006.
Instillation of six different ultrafine carbon particles indicates a surface area threshold dose
for acute lung inflammation in mice. Environ. Health Perspect. 114, 328–333.
https://doi.org/10.1289/ehp.8266
Stolzenburg, M.R., McMurry, P.H., 1991. An ultrafine aerosol condensation nucleus counter. Aerosol
Sci. Technol. 14, 48–65. https://doi.org/10.1080/02786829108959470
Tritscher, T., Beeston, M., Zerrath, A.F., Elzey, S., Krinke, T.J., Filimundi, E., Bischof, O.F., 2013.
NanoScan SMPS-A novel, portable nanoparticle sizing and counting instrument. J. Phys. Conf.
Ser. 429. https://doi.org/10.1088/1742-6596/429/1/012061
Tsai, S.J., Ada, E., Isaacs, J.A., Ellenbecker, M.J., 2009. Airborne nanoparticle exposures associated
with the manual handling of nanoalumina and nanosilver in fume hoods. J. Nanoparticle Res.
11, 147–161. https://doi.org/10.1007/s11051-008-9459-z
U.S.C., 1970. OCCUPATIONAL SAFETY AND HEALTH ACT OF 1970.
van Broekhuizen, P., 2017. Applicability of provisional NRVs to PGNPs and FCNPs. Amsterdam.
https://doi.org/10.13140/RG.2.2.18241.25445
van Broekhuizen, P., van Broekhuizen, F., Cornelissen, R., Reijnders, L., 2011. Use of nanomaterials
in the European construction industry and some occupational health aspects thereof. J.
Nanoparticle Res. 13, 447–462. https://doi.org/10.1007/s11051-010-0195-9
Van Broekhuizen, P., Van Broekhuizen, F., Cornelissen, R., Reijnders, L., 2012a. Workplace exposure
to nanoparticles and the application of provisional nanoreference values in times of uncertain
risks. J. Nanoparticle Res. 14. https://doi.org/10.1007/s11051-012-0770-3
Van Broekhuizen, P., Van Veelen, W., Streekstra, W.H., Schulte, P., Reijnders, L., 2012b. Exposure

References
209
limits for nanoparticles: Report of an international workshop on nano reference values. Ann.
Occup. Hyg. 56, 515–524. https://doi.org/10.1093/annhyg/mes043
Viana, M., Fonseca, A.S., Querol, X., López-Lilao, A., Carpio, P., Salmatonidis, A., Monfort, E., 2017.
Workplace exposure and release of ultrafine particles during atmospheric plasma spraying in
the ceramic industry. Sci. Total Environ. 599–600, 2065–2073.
https://doi.org/10.1016/j.scitotenv.2017.05.132
Viana, M., Kuhlbusch, T.A.J., Querol, X., Alastuey, A., Harrison, R.M., Hopke, P.K., Winiwarter, W.,
Vallius, M., Szidat, S., Prévôt, A.S.H., Hueglin, C., Bloemen, H., Wåhlin, P., Vecchi, R., Miranda, A.I.,
Kasper-Giebl, A., Maenhaut, W., Hitzenberger, R., 2008. Source apportionment of particulate
matter in Europe: A review of methods and results. J. Aerosol Sci. 39, 827–849.
https://doi.org/10.1016/j.jaerosci.2008.05.007
Viana, M., Pey, J., Querol, X., Alastuey, A., de Leeuw, F., Lükewille, A., 2014. Natural sources of
atmospheric aerosols influencing air quality across Europe. Sci. Total Environ. 472, 825–833.
https://doi.org/10.1016/j.scitotenv.2013.11.140
Viitanen, A.K., Uuksulainen, S., Koivisto, A.J., Hämeri, K., Kauppinen, T., 2017. Workplace
measurements of ultrafine particles-A literature review. Ann. Work Expo. Heal. 61, 749–758.
https://doi.org/10.1093/annweh/wxx049
Voiland, A., 2010. Aerosols: Tiny Particles, Big Impact [WWW Document]. NASA, Earth Obs. URL
https://earthobservatory.nasa.gov/features/Aerosols/page1.php
Voliotis, A., Bezantakos, S., Giamarelou, M., Valenti, M., Kumar, P., Biskos, G., 2014. Nanoparticle
emissions from traditional pottery manufacturing. Environ. Sci. Process. Impacts 16, 1489–
1494. https://doi.org/10.1039/C3EM00709J
von Glasow, R., 2010. Atmospheric chemistry in volcanic plumes. Proc. Natl. Acad. Sci. 107, 6594–
6599. https://doi.org/10.1073/pnas.0913164107
Warheit, D.B., Webb, T.R., Sayes, C.M., Colvin, V.L., Reed, K.L., 2006. Pulmonary Instillation Studies
with Nanoscale TiO2 Rods and Dots in Rats: Toxicity Is not Dependent upon Particle Size and
Surface Area. Toxicol. Sci. 91, 227–236. https://doi.org/10.1093/toxsci/kfj140
Warren, B.E., 1990. X-ray Diffraction. Courier Corporation.
WHO, 2016. Ambient air pollution: A global assessment of exposure and burden of disease. Geneva.
References
210
WHO, W.H.O., 2017. WHO Guidelines on Protecting Workers from Potential Risks of Manufactured
Nanomaterials. World Health Organization, Geneva.
Wiedensohler, A., Birmili, W., Nowak, A., Sonntag, A., Weinhold, K., Merkel, M., Wehner, B., Tuch, T.,
Pfeifer, S., Fiebig, M., Fjäraa, A.M., Asmi, E., Sellegri, K., Depuy, R., Venzac, H., Villani, P., Laj, P.,
Aalto, P., Ogren, J.A., Swietlicki, E., Williams, P., Roldin, P., Quincey, P., Hüglin, C., Fierz-
Schmidhauser, R., Gysel, M., Weingartner, E., Riccobono, F., Santos, S., Grüning, C., Faloon, K.,
Beddows, D., Harrison, R., Monahan, C., Jennings, S.G., O’Dowd, C.D., Marinoni, A., Horn, H.G.,
Keck, L., Jiang, J., Scheckman, J., McMurry, P.H., Deng, Z., Zhao, C.S., Moerman, M., Henzing, B.,
De Leeuw, G., Löschau, G., Bastian, S., 2012. Mobility particle size spectrometers:
Harmonization of technical standards and data structure to facilitate high quality long-term
observations of atmospheric particle number size distributions. Atmos. Meas. Tech. 5, 657–
685. https://doi.org/10.5194/amt-5-657-2012
Wiedensohlet, A., Orsini, D., Covert, D.S., Coffmann, D., Cantrell, W., Havlicek, M., Brechtel, F.J.,
Russell, L.M., Weber, R.J., Gras, J., Hudson, J.G., Litchy, M., 1997. Intercomparison Study of the
Size-Dependent Counting Efficiency of 26 Condensation Particle Counters. Aerosol Sci.
Technol. 27, 224–242. https://doi.org/10.1080/02786829708965469
Williams, D.B., Carter, C.B., 2009. Transmission Electron Microscopy, Second. ed. Springer Science&
Business Media, New York,.
Winklmayr, W., Reischl, G.P., Lindner, A.O., Berner, A., 1991. A new electromobility spectrometer for
the measurement of aerosol size distributions in the size range from 1 to 1000 nm. J. Aerosol
Sci. 22, 289–296. https://doi.org/10.1016/S0021-8502(05)80007-2
Young, R.A., 1993. The rietveld method. Oxford University Press.
Zartarian, V., Bahadori, T., McKone, T., 2005. Adoption of an official ISEA glossary. J. Expo. Anal.
Environ. Epidemiol. 15, 1–5. https://doi.org/10.1038/sj.jea.7500411
Zhang, S.H., Akutsu, Y., Russell, L.M., Flagan, R.C., Seinfeld, J.H., 1995. Radial differential mobility
analyzer. Aerosol Sci. Technol. 23, 357–372. https://doi.org/10.1080/02786829508965320
Zhou, Y., Kong, X., Chen, A., Cao, S., 2015. Investigation of Ultrafine Particle Emissions of Desktop 3D
Printers in the Clean Room. Procedia Eng. 121, 506–512.
https://doi.org/10.1016/j.proeng.2015.08.1099
Zimmer, A.T., Biswas, P., 2001. Characterization of the aerosols resulting from arc welding

References
211
processes. J. Aerosol Sci. 32, 993–1008. https://doi.org/https://doi.org/10.1016/S0021-
8502(01)00035-0
Zimmer, A.T., Maynard, A.D., 2002. Investigation of the aerosols produced by a high-speed, hand-
held grinder using various substrates. Ann. Occup. Hyg. 46, 663–672.
https://doi.org/10.1093/annhyg/mef089
Annex: Abbreviations and Acronyms
212
Annex: Abbreviations and Acronyms
Abbreviation Description
ACGIH American Conference of Governmental Industrial Hygienists
ACH Air Changes per Hour
APS Atmospheric Plasma Spraying
BG Background
BZ Breathing zone
CEN European Committee for Standardization
CPC Condensation Particle Counter
CyI The Cyprus Institute
DiSCmini Diffusion Size Classifier miniature
DMA Differential Mobility Analyzer
Dp Particle Diameter
ECHA European Chemical Agency
EDX Energy Dispersive X-ray
ENP Engineered Nanoparticles
ES Emission Source
EU European Union
GER Glazed Earthenware Red tile
HVOF High Velocity Oxy-Fuel spraying
ICMA Aragon Material Science Institute
Annex: Abbreviations and Acronyms
213
ICRP International Commission on Radiological Protection
Ind. Industrial
ISO International Organization for Standardization
ITC Institute for Ceramic Technology
LDSA Lung Deposited Surface Area
LEV Local Exhaust Ventilation
mid-IR middle Infrared
MNMs Manufactured Nanomaterials
N Total Particle Number Concentration
N.A. Not Available
n-ENP Non-Engineered Nanoparticles
NF Near Field
NIOSH National Institute for Occupational Safety and Health
n-IR near Infrared
NRV Nano-Reference Values
OECD Organization for Economic Cooperation and Development
OEL Occupational Exposure Limits
OPC Optical Particle Counter
OPS Optical Particle Sizer
PGNPs Process Generated Nanoparticles
PLA Pulsed Laser Ablation
PM Particulate Matter
P.P. Pilot Plant
Annex: Abbreviations and Acronyms
214
PPE Personal Protective Equipment
RH Relative Humidity
SER Social Economic Council of Netherland
SMPS Scanning Mobility Particle Sizer
TEM Transmission Electron Microscopy
TS Thermal Spraying
TSP Total Suspended Particles
UAW Unglazed Alumina White tile
UBW Unglazed Biscuit White tile
UFP Ultrafine Particles tile
UPG Unglazed Porcelain Grey
WA Worker Area
WHO World Health Organization
Acknowledgments
215
Acknowledgements
The current PhD Thesis was carried out in the framework of the CERASAFE project
(www.cerasafe.eu), with the support of SIINN ERA-NET (project id: 16), and was funded by the
Spanish MINECO (PCIN-2015-173-C02-01). Additional support from project MAT2016-79866-R
(AEI/FEDER, UE) and from the ‘Generalitat de Catalunya’ (project number: AGAUR 2017 SGR41) is
also acknowledged. Furthermore, the Aragón Materials Science Institute (ICMA - Universidad de
Zaragoza, CSIC), the European Ceramics Centre in Limoges, the Cyprus Institute (CyI) and TM COMAS
(http://www.tmcomas.com) are kindly thanked for their committed cooperation.
I would like to gratefully thank my supervisors, Dr. Mar Viana for the great opportunity that she gave
me and her flawless supervision and unconditioned support; and Prof. Dr. Eliseo Monfort for making
a huge effort to overcome the kilometric distance every time I sought his assistance and guidance
during my PhD candidateship. Thanks to your professionalism and scientific expertise, these last
three years were highly productive as well as educating for me. I would also like to thank my tutor at
the University of Barcelona (Faculty of Chemistry) Dr. Angels Sahuquillo Estrugo for her kind support
and advice every time I requested her assistance.
Kind acknowledgements to all the co-authors of the scientific papers included in this Thesis. My
sincere gratitude to Prof. Dr. George Biskos and to Dr. Spyros Bezantakos from the CyI for their help
and cooperation during the experimental, analytical and scripting part of my PhD. My warmest
appreciations to Prof. Dr. German de la Fuente and Prof. Dr. Luis Alberto Angurel from ICMA, for
substantially supporting my work by providing their scientific expertise as well as the facilities and
means to perform my experimental work. My honest thanks to Prof. Dr. Andres Alastuey and Dr.
Noemi Perez from IDAEA-CSIC, for aiding my work by providing advance equipment (i.e.
instruments), scientific, technical and organizational support. Prof. Dr. Pawlowski and Dr. Pablo
Carpio are also acknowledged for their collaboration. To my trustworthy coworkers Dr. Vicenta
(Tica) Sanfelix from ITC in Castellon and Dr. Carla Ribalta from IDAEA-CSIC, thank you very much for
your constant help and committed cooperation. I would also like to thank Prof. Dr. Simon Simion and
Dr. Adriana Vulpoi from the Babeș-Bolyai University in Romania.
My sincere appreciation to Prof. Dr. Xavier Querol for leading by example and providing inspiration
to carry out scientific research at the top level. Special thanks to my colleague and compatriot Dr.
Acknowledgments
216
Angeliki Karanasiou for all her help before and during my work at IDAEA-CSIC. I would like to express
my thanks to my friends and colleagues Dr. Fulvio Amato and Dr. Maria Izquierdo for their continuous
help and support. Many thanks for all their help to Dr. Cristina Reche and Garay Sosa, two of the most
kind, helpful and generous colleagues one can have. I would also like to acknowledge a team of
specialized colleagues: Natalia Moreno, Mercè Cabañas, Rafael Bartrolí, Silvia Martínez, Rebeca
Vazquez and Diana Blanco for their remarkable technical support in the analytical laboratories. To
all of my fellow colleagues at the EGAR group of IDAEA-CSIC: Dr. Teresa Moreno, Dr. Marco Pandolfi,
Dr. Patricia Córdoba, Marina Ealo, Dr. Aurelio Tobias, Elena Martínez, Dr. Gloria Titos, Amaia
Fernandez, Jesús Yus, Pedro Trechera, Marten in’t Veld, Marta Via, Dr. Maria-Cruz Minguillón, Cristina
Carnerero and whoever I might be forgetting, thank you for creating a wonderful working
environment.
For the artwork on the cover of this Thesis, I thank my friend Akis Hondas (Ink’s_Sins©). I owe
gratitude to my parents for supporting my education throughout the years. Above all, I am entirely
grateful to my family, which I thank for everything.

Copyright © 2022 FDOKUMEN