Occupational Exposures at Nuclear Power Plants - ISOE ...
99
Radiological Protection www.oecd-nea.org O ccupational Exposures at Nuclear Power Plants Twenty-third Annual Report of the ISOE Programme, 2013
-
Upload
khangminh22 -
Category
Documents
-
view
0 -
download
0
Transcript of Occupational Exposures at Nuclear Power Plants - ISOE ...

Radiological Protectionwww.oecd-nea.org
Occupational Exposures at Nuclear Power Plants
Twenty-third Annual Report of the ISOE Programme, 2013

Radiological Protection
Occupational Exposures at Nuclear Power Plants
Twenty-third Annual Report of the ISOE Programme, 2013
© OECD 2017
NUCLEAR ENERGY AGENCY ORGANISATION FOR ECONOMIC CO-OPERATION AND DEVELOPMENT

ORGANISATION FOR ECONOMIC CO-OPERATION AND DEVELOPMENT
The OECD is a unique forum where the governments of 35 democracies work together to address the economic, social and environmental challenges of globalisation. The OECD is also at the forefront of efforts to understand and to help governments respond to new developments and concerns, such as corporate governance, the information economy and the challenges of an ageing population. The Organisation provides a setting where governments can compare policy experiences, seek answers to common problems, identify good practice and work to co-ordinate domestic and international policies.
The OECD member countries are: Australia, Austria, Belgium, Canada, Chile, the Czech Republic, Denmark, Estonia, Finland, France, Germany, Greece, Hungary, Iceland, Ireland, Israel, Italy, Japan, Latvia, Luxembourg, Mexico, the Netherlands, New Zealand, Norway, Poland, Portugal, Korea, the Slovak Republic, Slovenia, Spain, Sweden, Switzerland, Turkey, the United Kingdom and the United States. The European Commission takes part in the work of the OECD.
OECD Publishing disseminates widely the results of the Organisation’s statistics gathering and research on economic, social and environmental issues, as well as the conventions, guidelines and standards agreed by its members.
NUCLEAR ENERGY AGENCY
The OECD Nuclear Energy Agency (NEA) was established on 1 February 1958. Current NEA membership consists of 31 countries: Australia, Austria, Belgium, Canada, the Czech Republic, Denmark, Finland, France, Germany, Greece, Hungary, Iceland, Ireland, Italy, Japan, Luxembourg, Mexico, the Netherlands, Norway, Poland, Portugal, Korea, Russia, the Slovak Republic, Slovenia, Spain, Sweden, Switzerland, Turkey, the United Kingdom and the United States. The European Commission and the International Atomic Energy Agency also take part in the work of the Agency.
The mission of the NEA is: – to assist its member countries in maintaining and further developing, through international co-operation, the
scientific, technological and legal bases required for a safe, environmentally sound and economical use of nuclear energy for peaceful purposes;
– to provide authoritative assessments and to forge common understandings on key issues as input to government decisions on nuclear energy policy and to broader OECD analyses in areas such as energy and the sustainable development of low-carbon economies.
Specific areas of competence of the NEA include the safety and regulation of nuclear activities, radioactive waste management, radiological protection, nuclear science, economic and technical analyses of the nuclear fuel cycle, nuclear law and liability, and public information. The NEA Data Bank provides nuclear data and computer program services for participating countries.
This document, as well as any data and map included herein, are without prejudice to the status of or sovereignty over any territory, to the delimitation of international frontiers and boundaries and to the name of any territory, city or area. Corrigenda to OECD publications may be found online at: www.oecd.org/publishing/corrigenda. © OECD 2017
You can copy, download or print OECD content for your own use, and you can include excerpts from OECD publications, databases and multimedia products in your own documents, presentations, blogs, websites and teaching materials, provided that suitable acknowledgement of the OECD as source and copyright owner is given. All requests for public or commercial use and translation rights should be submitted to [email protected]. Requests for permission to photocopy portions of this material for public or commercial use shall be addressed directly to the Copyright Clearance Center (CCC) at [email protected] or the Centre français d'exploitation du droit de copie (CFC) [email protected].

2
FOREWORD
Throughout the world, occupational exposures at nuclear power plants have steadily decreased since the early 1990s. Regulatory pressures, technological advances, improved plant designs and operational procedures, ALARA culture and experience exchange have contributed to this downward trend. However, with the continued ageing and possible life extensions of nuclear power plants worldwide, ongoing economic pressures, regulatory, social and political evolutions, and the potential of new nuclear build, the task of ensuring that occupational exposures are as low as reasonably achievable (ALARA), taking into account operational costs and social factors, continues to present challenges to radiation protection professionals.
Since 1992, the Information System on Occupational Exposure (ISOE), jointly sponsored by the OECD Nuclear Energy Agency (NEA) and the International Atomic Energy Agency (IAEA), has provided a forum for radiological protection professionals from nuclear power utilities and national regulatory authorities worldwide to discuss, promote and co-ordinate international co-operative undertakings for the radiological protection of workers at nuclear power plants. The objective of ISOE is to improve the management of occupational exposures at nuclear power plants by exchanging broad and regularly updated information, data and experience on methods to optimise occupational radiation protection.
As a technical exchange initiative, the ISOE Programme includes a global occupational exposure data collection and analysis programme, culminating in the world’s largest occupational exposure database for nuclear power plants, and an information network for sharing dose reduction information and experience. Since its launch, the ISOE participants have used this system of databases and communications networks to exchange occupational exposure data and information for dose trend analyses, technique comparisons, and cost-benefit and other analyses promoting the application of the ALARA principle in local radiological protection programmes.
The Twenty-third Annual Report of the ISOE Programme presents the status of the ISOE programme for the year of 2013.

3
“... the exchange and analysis of information and data on ALARA experience, dose-reduction techniques, and individual and collective radiation doses to the personnel of nuclear installations and to the employees of contractors are essential to implement effective dose management programmes and to apply the ALARA principle.” (ISOE Terms and Conditions, 2012-2015).

4
TABLE OF CONTENTS
1. STATUS OF PARTICIPATION IN THE INFORMATION SYSTEM ON OCCUPATIONAL EXPOSURE (ISOE) ............................................................................................................................. 8
2. OCCUPATIONAL EXPOSURE TRENDS ................................................................................... 11
2.1 Occupational exposure trends: Operating reactors .................................................................. 11 2.2 Occupational exposure trends: Definitely shutdown reactors .................................................. 21
3. PRINCIPAL EVENTS IN PARTICIPATING COUNTRIES ........................................................ 25
ARMENIA .......................................................................................................................................... 25 BELGIUM .......................................................................................................................................... 27 BULGARIA ........................................................................................................................................ 28 CANADA ........................................................................................................................................... 29 CHINA ................................................................................................................................................ 32 CZECH REPUBLIC ........................................................................................................................... 33 FINLAND ........................................................................................................................................... 35 FRANCE ............................................................................................................................................ 37 HUNGARY ........................................................................................................................................ 41 ITALY ................................................................................................................................................ 43 JAPAN ................................................................................................................................................ 44 LITHUANIA ...................................................................................................................................... 46 MEXICO ............................................................................................................................................ 48 NETHERLANDS ............................................................................................................................... 51 ROMANIA ......................................................................................................................................... 52 RUSSIA .............................................................................................................................................. 55 SLOVAK REPUBLIC ........................................................................................................................ 58 SLOVENIA ........................................................................................................................................ 60 SPAIN ................................................................................................................................................. 61 SWEDEN ............................................................................................................................................ 64 SWITZERLAND ................................................................................................................................ 66 UKRAINE .......................................................................................................................................... 67 UNITED KINGDOM ......................................................................................................................... 68 UNITED STATES .............................................................................................................................. 69
4. ISOE EXPERIENCE EXCHANGE ACTIVITIES ........................................................................ 73
4.1 ISOE ALARA Symposia ......................................................................................................... 73 4.2 The ISOE website (www.isoe-network.net) ............................................................................ 74 4.3 ISOE benchmarking visits ....................................................................................................... 75 4.4 ISOE management ................................................................................................................... 77
Annex 1 STATUS OF ISOE PARTICIPATION UNDER THE RENEWED ISOE TERMS AND CONDITIONS (2012-2015) ............................................................................................................... 79
Annex 2 ISOE BUREAU, SECRETARIAT AND TECHNICAL CENTRES .................................. 83
Annex 3 ISOE MANAGEMENT BOARD AND NATIONAL CO-ORDINATORS (2013-2014) .. 85
Annex 4 ISOE WORKING GROUPS (2013) .................................................................................... 87
Annex 5 LIST OF ISOE PUBLICATIONS ....................................................................................... 91

5
TABLES Table 1. The Official ISOE Participants and the ISOE Database (as of December 2013) ................... 9 Table 2. Average annual collective dose per reactor, by country and reactor type, 2011-2013 (man·Sv/reactor) ................................................................................................................................. 12 Table 3. 3-year rolling average annual collective dose per reactor, by country and reactor type, 2009-2011 to 2011-2013 (man·Sv/reactor) ........................................................................................ 16 Table 4. Number of units and average annual dose per reactor by country and reactor type for definitely shutdown reactors, 2011-2013 (man·mSv/reactor) ............................................................ 22
FIGURES
Figure 1. 3-year rolling average collective dose per reactor for all operating reactors included in ISOE by reactor type, 1992-2013 (man·Sv/reactor) ........................................................................... 12 Figure 2. 2013 PWR average collective dose per reactor by country (man·Sv/reactor)..................... 13 Figure 3. 2013 VVER average collective dose per reactor by country (man·Sv/reactor) .................. 14 Figure 4. 2013 BWR average collective dose per reactor by country (man·Sv/reactor) .................... 14 Figure 5. 2013 PHWR average collective dose per reactor by country (man·Sv/reactor) .................. 15 Figure 6. 3-Year rolling average collective dose by country from 2000 to 2013 for PWRs (1)......... 17 Figure 7. 3-Year rolling average collective dose by country from 2000 to 2013 for PWRs (2)......... 17 Figure 8. 3-Year rolling average collective dose by country from 2000 to 2013 for PWRs (3)......... 18 Figure 9. 3-Year rolling average collective dose by country from 2000 to 2013 for PWRs (4)......... 18 Figure 10. 3-Year rolling average collective dose by country from 2000 to 2013 for VVERs (1) .... 19 Figure 11. 3-Year rolling average collective dose by country from 2000 to 2013 for VVERs (2) .... 19 Figure 12. 3-Year rolling average collective dose by country from 2000 to 2013 for BWRs (1) ...... 20 Figure 13. 3-Year rolling average collective dose by country from 2000 to 2013 for BWRs (2) ...... 20 Figure 14. 3-Year rolling average collective dose by country from 2000 to 2013 for PHWRs ......... 21 Figure 15. Average annual collective dose by country from 2009 to 2013 for PWRs ....................... 23 Figure 16. Average annual collective dose by country from 2009 to 2013 for VVERs ..................... 23 Figure 17. Average annual collective dose by country from 2009 to 2013 for BWRs ....................... 24 Figure 18. Average annual collective dose by country from 2009 to 2013 for GCRs ........................ 24

6
EXECUTIVE SUMMARY
Since 1992, the Information System on Occupational Exposure (ISOE) has supported the optimisation of worker radiological protection in nuclear power plants through a worldwide information and experience exchange network for radiation protection professionals at nuclear power plants and national regulatory authorities, and through the publication of relevant technical resources for ALARA management. This 23rd Annual Report of the ISOE Programme presents the status of the ISOE programme for the calendar year 2013.
ISOE is jointly sponsored by the NEA and the IAEA, and its membership is open to nuclear electricity utilities and radiation protection regulatory authorities worldwide who accept the programme’s Terms and Conditions. The current ISOE Terms and Conditions for the period 2012-2015 came into force on 1 January 2012. At the end of 2013, the ISOE programme included 59 Participating Utilities in 25 countries (261 operating units; 46 shutdown units), as well as the regulatory authorities of 17 countries. The ISOE occupational exposure database itself included information on occupational exposure levels and trends at 377 operating reactors; covering about 90% of the world’s operating commercial power reactors. Four ISOE Technical Centres (Europe, North America, Asia and IAEA) manage the programme’s day-to-day technical operations.
Based on the occupational exposure data supplied by ISOE members for operating power reactors, the 2013 average annual collective doses per reactor and 3-year rolling averages per reactor (2011-2013) were:
2013 average annual collective dose
(man·Sv/reactor)
3-year rolling average for 2011-2013
(man·Sv/reactor)
Pressurised water reactors (PWR) 0.50 0.55 Pressurised water reactors (VVER) 0.42 0.48 Boiling water reactors (BWR) 0.84 0.96 Pressurised heavy water reactors (PHWR/CANDU) 0.78 1.02
In addition to information from operating reactors, the ISOE database contains dose data from 96 reactors which are shutdown or in some stage of decommissioning. As these reactor units are generally of different type and size, and at different phases of their decommissioning programmes, it is difficult to identify clear dose trends. However, work continued in 2013 to improve the data collection for such reactors in order to facilitate better benchmarking. Details on occupational dose trends for operating reactors, and reactors undergoing decommissioning are provided in Section 2 of the report.
While ISOE is well known for its occupational exposure data and analyses, the programme’s strength comes from its objective to share such information broadly amongst its participants. In 2013, the ISOE Network website (www.isoe-network.net ) continued to provide the ISOE membership with

7
a comprehensive web-based information and experience exchange portal on dose reduction and ISOE ALARA resources.
The annual ISOE ALARA Symposia on occupational exposure management at nuclear power plants continued to provide an important forum for ISOE participants and for vendors to exchange practical information and experience on occupational exposure issues. The technical centres continued to host international/regional symposia, which in 2013 included the ISOE International symposium in Tokyo, Japan, organised by the Asian Technical Centre and the North-American regional symposium in Fort Lauderdale, United States. These regional and international symposia provide a global forum to promote the exchange of ideas and management approaches for maintaining occupational radiation exposures as low as reasonably achievable.
Of importance is the support that the technical centres supply in response to special requests for rapid technical feedback and in the organisation of voluntary site benchmarking visits for dose reduction information exchange between ISOE regions. The combination of ISOE symposia and technical visits provides a means for radiation protection professionals to meet, share information and build links between ISOE regions to develop a global approach to occupational exposure management.
The ISOE Working Group on Data Analysis (WGDA) continued its activities in support of the technical analysis of the ISOE data and experience, focusing largely on the integrity and consistency of the ISOE database.
Principal events in the ISOE participating countries are summarised in Section 3 of this report.

8
1. STATUS OF PARTICIPATION IN THE INFORMATION SYSTEM ON OCCUPATIONAL EXPOSURE (ISOE)
Since 1992, ISOE has supported the optimisation of worker radiological protection in nuclear power plants through a worldwide information and experience exchange network for radiation protection professionals from utilities and national regulatory authorities, and through the publication of relevant technical resources for ALARA management. The ISOE programme includes a global occupational exposure data collection and analysis programme, culminating in the world’s largest database on occupational exposures at nuclear power plants, and a communications network for sharing dose reduction information and experience. Since the launch of ISOE, participants have used these resources to exchange occupational exposure data and information for dose trend analyses, technique comparisons, and cost-benefit and other analyses promoting the application of the ALARA principle in local radiation protection programmes, and the sharing of experience globally.
ISOE Participants include nuclear electricity utilities (public and private), national regulatory authorities (or institutions representing them) and ISOE Technical Centres who have agreed to participate in the operation of ISOE under its Terms and Conditions (2012-2015). Four ISOE Technical Centres (Asia, Europe, North America and IAEA) manage the day-to-day technical operations in support of the membership in the four ISOE regions (see Annex 3 for country-technical centre affiliation). The objective of ISOE is to make available to the Participants:
• broad and regularly updated information on methods to improve the protection of workers and on occupational exposure in nuclear power plants; and
• a mechanism for dissemination of information on these issues, including evaluation and analysis of the data assembled, as a contribution to the optimisation of radiation protection.
Based on feedback received by the ISOE Secretariat as of December 2013, the ISOE programme included: 59 Participating Utilities1 in 25 countries, covering 261 operating units and 46 shutdown units, and the Regulatory Authorities of 17 countries. Table 1 summarises total participation by country, type of reactor and reactor status as of December 2013. A complete list of reactors, utilities and authorities officially participating in ISOE at the time of publication of this report is provided in Annex 1.
In addition to exposure data provided annually by Participating Utilities, Participating Authorities may also contribute with official national data in cases where some of their licensees are not ISOE members. The ISOE database thus includes occupational exposure data and information of 473 reactor units in 29 countries (377 operating; 96 in cold-shutdown or some stage of decommissioning), covering about 90% of the world’s operating commercial power reactors. The ISOE database is made available to all ISOE members, according to their status as a participating utility or authority, through the ISOE Network website and on CD-ROM.
1. Represents the number of leading utilities; in some cases, plants are owned/operated by multiple enterprises.

9
Table 1. The Official ISOE Participants and the ISOE Database (as of December 2013)
Note: The list of the Official ISOE Participants at the time of the publication of this report is provided in Annex 1.
Operating reactors: ISOE Participants
Country PWR VVER BWR PHWR GCR LWGR Total Armenia – 1 – – – – 1 Belgium 7 – – – – – 7 Brazil 2 – – – – – 2 Bulgaria – 2 – – – – 2 Canada – – – 19 – – 19 China 7 2 – – – – 9 Czech Republic - 6 – – – – 6 Finland - 2 2 – – – 4 France 58 – – – – – 58 Germany 7 – 2 – – – 9 Hungary – 4 – – – – 4 Japan 24 – 24 – – – 48 Korea, Republic of 19 – – 4 – – 23 Netherlands 1 – – – – – 1 Romania – – – 2 – – 2 Slovak Republic – 4 – – – – 4 Slovenia 1 – – – – – 1 South Africa, Rep. of 2 – – – – – 2 Spain 6 – 1 – – – 7 Sweden 3 – 7 – – – 10 Switzerland 3 – 2 – – – 5 United Kingdom 1 – – – – – 1 United States 19 – 17 – – – 36 Total 160 21 55 25 – – 261
Operating reactors: Not participating in ISOE, but included in the ISOE database
Country PWR VVER BWR PHWR GCR LWGR Total Mexico – – 2 – – – 2 Pakistan 2 – – 1 – – 3 Russian Federation – 17 – – – – 17 Ukraine – 15 – – – – 15 United Kingdom – – – – 15 – 15 United States 46 – 18 – – – 64 Total 48 32 20 1 15 – 116
Total number of operating reactors included in the ISOE database
PWR/VVER BWR PHWR GCR LWGR Total Total 261 75 26 15 – 377

10
Table 1. The Official ISOE Participants and the ISOE Database (as of December 2013) (Cont’d)
Definitively shutdown reactors: ISOE Participants
Country PWR/ VVER BWR PHWR GCR LWGR Other Total
Bulgaria 4 – – – – – 4 Canada – – 3 – – – 3 France 1 – – 6 – – 7 Germany 4 4 – – – – 8 Italy 1 2 – 1 – – 4 Japan – 8 – 1 – 1 10 Lithuania – – – – 2 – 2 Spain – 1 – – – – 1 Sweden – 2 – – – – 2 United States 3 1 – 1 – – 5 Total 13 18 3 9 2 1 46
Definitively shutdown reactors: Not participating in ISOE but included in the ISOE database
Country PWR/ VVER BWR PHWR GCR LWGR Other Total
Canada – – 2 – – – 2 Germany 3 1 – 2 – – 6 Netherlands – 1 – – – – 1 Russian Federation 2 – – – – – 2 Spain 1 – – 1 – – 2 Ukraine – – – – 3 – 3 United Kingdom – – – 19 – – 19 United States 10 4 – 1 – – 15 Total 16 6 2 23 3 – 50
Total number of definitively shutdown reactors included in the ISOE database
PWR/ VVER BWR PHWR GCR LWGR Other Total
Total 29 24 5 32 5 1 96
Total number of reactors included in the ISOE database
PWR/ VVER BWR PHWR GCR LWGR Other Total
Total 290 99 31 47 5 1 473
Number of Participating Countries 25
Number of Participating Utilities2 59
Number of Participating Authorities3 18
2. Represents the number of lead utilities; in some cases, plants are owned/operated by multiple enterprises. 3. One country participates with two authorities.

11
2. OCCUPATIONAL EXPOSURE TRENDS
A key element of the ISOE is the tracking of occupational exposure trends from nuclear power facilities worldwide for benchmarking, comparative analysis and experience exchange amongst ISOE members. This information is maintained in the ISOE Occupational Exposure Database which contains annual occupational exposure data supplied by Participating Utilities (generally based on operational dosimetry systems). The following dosimetric information from commercial NPPs in operation, shut down or in some stage of decommissioning are available:
− annual collective dose for normal operation, − maintenance/refuelling outage, − unplanned outage periods, and − annual collective dose for certain tasks and worker categories.
Using the ISOE database, ISOE members can perform various benchmarking and trend analyses by country, by reactor type, or by other criteria such as sister-unit grouping. The summary below provides highlights of the general trends in occupational doses at nuclear power plants.
2.1 Occupational exposure trends: Operating reactors
a) Global trends by reactor type
Figure 1 shows the trend in 3-year rolling average collective dose per reactor, by reactor type, for 1992-2013. In spite of some yearly variations, the clear downward dose trend in most reactors has continued, with the exception of PHWRs, which have shown an increasing trend since the lows achieved in the 1996-1998 time period, but is know again decreasing.
Average annual collective dose per reactor by country and reactor type for the period of 2011-2013 and 3 year rolling average annual collective dose per reactor, by country and reactor type for the period of 2009-2011 to 2011-2013, are given in Table 2 and Table 3, respectively. These results are based primarily on data reported and recorded in the ISOE database during 2014, supplemented by the individual country reports (Section 3) as required. Figures 2 to 5 provide information on average collective dose per reactor by country for PWR, VVER BWR and PHWR reactors. In all figures, the “number of units” refers to the number of reactor units for which data has been reported for 2013.

12
Figure 1. 3-year rolling average collective dose per reactor for all operating reactors included in ISOE by reactor type, 1992-2013 (man·Sv/reactor)
b) Average annual collective dose trends by country
Table 2 provides information on average annual collective dose per reactor by country and reactor type for the last three years.
Table 2. Average annual collective dose per reactor, by country and reactor type, 2011-2013 (man·Sv/reactor)
PWR VVER BWR
2011 2012 2013 2011 2012 2013 2011 2012 2013 Armenia 1.25 0.90 0.73 Belgium 0.37 0.33 0.19 Brazil 0.37 0.08 0.48 Bulgaria 0.27 0.18 0.23 Canada China 0.51 0.45 0.86 0.23 Czech Republic 0.12 0.12 0.12 Finland 0.36 0.84 0.27 0.48 0.36 0.32 France 0.72 0.68 0.79 Germany 0.43 0.23 0.32 0.58 1.07 1.09 Hungary 0.59 0.45 0.50 Japan 0.96 0.18 0.23 1.05 0.29 0.20 Korea, Republic of 0.54 0.42 0.53 Mexico 0.83 4.28 0.67 Netherlands 0.28 0.33 0.83 Pakistan 0.26 0.07 0.53 Romania Russian Federation 0.66 0.62 0.52 Slovak Republic 0.14 0.17 0.13 Slovenia 0.07 0.88 1.35 South Africa, Rep. of 0.55 0.77 0.30
0
0.5
1
1.5
2
2.5
3
3.5
4
/92-/94 /94-/96 /96-/98 /98-/00 /00-/02 /02-/04 /04-/06 /06-/08 /08-/10 /10-/12
man·Sv
PWR VVER BWR PHWR GCR LWGR VVER
02468
1012
/92-/94 /95-/97 /98-/00 /01-/03 /04-/06 /07-/09 /10-/12

13
Spain 0.50 0.47 0.39 2.00 0.25 2.25 Sweden 1.43 0.54 0.52 1.07 0.67 0.71 Switzerland 0.36 0.43 0.35 1.07 1.49 1.11 Ukraine 0.59 0.59 0.53 United Kingdom 0.54 0.04 0.39 United States 0.61 0.60 0.36 1.42 1.13 1.27 Average 0.65 0.51 0.50 0.51 0.50 0.42 1.18 0.87 0.84
Note: Data provided directly from country report, rather than calculated from the ISOE database: UK (2011, 2012, and
2013: GCR). BWR dose in 2011, 2012 and in 2013 for Japan does not include Fukushima Daiichi Units 1-6.
PHWR GCR
2011 2012 2013 2011 2012 2013 Canada 1.27 1.24 0.85 Korea, Republic of 0.52 0.64 0.49 Pakistan 4.01 1.31 1.68 Romania 0.20 0.46 0.25 United Kingdom 0.08 0.06 0.03 Average 1.18 1.10 0.78 0.08 0.06 0.03
2011 2012 2013 Average 0.72 0.61 0.51
Figure 2. 2013 PWR average collective dose per reactor by country (man·Sv/reactor)
0
10
20
30
40
50
60
70
0
0.5
1
1.5
Avg. Annual Collective Dose No. of units
man·Sv No. of units

14
Figure 3. 2013 VVER average collective dose per reactor by country (man·Sv/reactor)
Figure 4. 2013 BWR average collective dose per reactor by country (man·Sv/reactor)
0
2
4
6
8
10
12
14
16
18
0
0.5
1
Armenia Ukraine RussianFederation
Hungary Finland China Bulgaria SlovakRepublic
CzechRepublic
Avg. Annual Collective Dose No. of units
man·Sv No. of units
0
5
10
15
20
25
30
35
40
0
0.5
1
1.5
2
2.5
Spain USA Switzerland Germany Sweden Mexico Finland Japan
Avg. Annual Collective Dose No. of units
man·Sv No. of units

15
Figure 5. 2013 PHWR average collective dose per reactor by country (man·Sv/reactor)
c) 3-year rolling average collective dose trends by country
Table 3 provides information on 3-year rolling average annual collective dose per reactor, by country and reactor type for the period of 2009-2011 to 2011-2013. Figures 6-14 present the 3-year rolling average annual collective dose from 2000 to 2013 in different countries by taking into account the reactor types, including PWR, VVER, BWR and PHWR.
0
2
4
6
8
10
12
14
16
18
20
0
0.5
1
1.5
2
Pakistan Canada Korea, Rep. of Romania
Avg. Annual Collective Dose No. of units
man·Sv No. of units

16
Table 3. 3-year rolling average annual collective dose per reactor, by country and reactor type, 2009-2011 to 2011-2013 (man·Sv/reactor)
PWR VVER BWR
/09-/11 /10-/12 /11-/13 /09-/11 /10-/12 /11-/13 /09-/11 /10-/12 /11-/13 Armenia 0.86 0.97 0.96 Belgium 0.34 0.33 0.30 Brazil 0.64 0.32 0.31 Bulgaria 0.33 0.29 0.23 Canada China 0.49 0.46 0.61 0.23 Czech Republic 0.13 0.12 0.12 Finland 0.51 0.67 0.49 0.51 0.43 0.39 France 0.68 0.67 0.73 Germany 0.69 0.42 0.32 0.82 0.85 0.92 Hungary 0.47 0.47 0.51 Japan 1.36 0.88 0.46 1.20 0.85 0.51 Korea, Republic of 0.48 0.47 0.50 Mexico 2.64 3.37 1.93 Netherlands 0.38 0.41 0.48 Pakistan 0.37 0.31 0.28 Romania Russian Federation 0.70 0.64 0.60 Slovak Republic 0.17 0.16 0.15 Slovenia 0.52 0.60 0.77 South Africa, Rep. of 0.60 0.61 0.54 Spain 0.52 0.43 0.45 1.62 0.93 1.50 Sweden 0.94 0.81 0.83 1.14 0.89 0.82 Switzerland 0.42 0.44 0.38 1.16 1.27 1.23 Ukraine 0.66 0.61 0.57 United Kingdom 0.38 0.28 0.32 United States 0.61 0.59 0.52 1.42 1.30 1.27 Average 0.69 0.61 0.55 0.54 0.51 0.48 1.29 1.11 0.96
PHWR GCR
/09-/11 /10-/12 /11-/13 /09-/11 /10-/12 /11-/13 Canada 1.36 1.35 1.12 Korea, Republic of 1.63 1.11 0.55 Lithuania Pakistan 2.78 2.59 2.33 Romania 0.28 0.35 0.30 United Kingdom 0.07 0.05 0.06 Average 1.37 1.29 1.02 0.07 0.05 0.96
/09-/11 /10-/12 /11-/13 Global Average 0.79 0.71 0.61
Note: calculated from the ISOE database, supplemented by data provided directly by country (See Notes, Table 3).

17
Figure 6. 3-Year rolling average collective dose by country from 2000 to 2013 for PWRs (1)
Figure 7. 3-Year rolling average collective dose by country from 2000 to 2013 for PWRs (2)
0
0.2
0.4
0.6
0.8
1
1.2
1.4
1.6
Belgium Brazil China France
man·Sv
0
0.2
0.4
0.6
0.8
1
1.2
1.4
1.6
Germany Japan Pakistan Republic of Korea
man·Sv

18
Figure 8. 3-Year rolling average collective dose by country from 2000 to 2013 for PWRs (3)
Figure 9. 3-Year rolling average collective dose by country from 2000 to 2013 for PWRs (4)
0
0.2
0.4
0.6
0.8
1
1.2
1.4
1.6
Republic of South Africa Slovenia Spain Sweden
man·Sv
0
0.2
0.4
0.6
0.8
1
1.2
1.4
1.6
Switzerland The Netherlands United Kingdom United States of America
man·Sv

19
Figure 10. 3-Year rolling average collective dose by country from 2000 to 2013 for VVERs (1)
Figure 11. 3-Year rolling average collective dose by country from 2000 to 2013 for VVERs (2)
0
0.2
0.4
0.6
0.8
1
1.2
1.4
1.6
Armenia Bulgaria Czech Republic Finland
man·Sv
0
0.2
0.4
0.6
0.8
1
1.2
1.4
1.6
Hungary Russian Federation Slovak Republic Ukraine China
man·Sv

20
Figure 12. 3-Year rolling average collective dose by country from 2000 to 2013 for BWRs (1)
Figure 13. 3-Year rolling average collective dose by country from 2000 to 2013 for BWRs (2)
0
0.5
1
1.5
2
2.5
3
3.5
4
Finland Germany Japan Mexico
man·Sv
0
0.5
1
1.5
2
2.5
3
3.5
4
Spain Sweden Switzerland United States of America
man·Sv

21
Figure 14. 3-Year rolling average collective dose by country from 2000 to 2013 for PHWRs
2.2 Occupational exposure trends: Definitely shutdown reactors
In addition to information from operating reactors, the ISOE database contains dose data from reactors which are shut-down or in some stage of decommissioning. This section provides a summary of the dose trends for those reactors reported during the 2011-2013 period. These reactor units are generally of different type and size, at different phases of their decommissioning programmes, and supply data at various levels of detail. For these reasons, and because these figures are based on a limited number of shutdown reactors, definitive conclusions cannot be drawn. Under the ISOE Working Group on Data Analysis, work continued in 2013 aimed at improving data collection for shut-down and decommissioned reactors in order to facilitate better benchmarking.
Table 4 provides average annual collective doses per unit for definitely shutdown reactors by country and reactor type for 2011-2013, based on data recorded in the ISOE database, supplemented by the individual country reports (Section 3) as required. Figures 15-18 present the average annual collective dose by country for definitely shutdown reactors for 2009-2013 periods by reactor type (PWR, VVER, BWR and GCR). In all figures, the “number of units” refers to the number of units for which data has been reported for the year in question.
0
0.5
1
1.5
2
2.5
3
3.5
4
Canada Pakistan Republic of Korea Romania
man·Sv

22
Table 4. Number of units and average annual dose per reactor by country and reactor type for definitely shutdown reactors, 2011-2013 (man·mSv/reactor)
2011 2012 2013 No. Dose No. Dose No. Dose
PWR France 1 264.1 1 275.6 1 189.3 Germany 3 126.3 7 130.5 7 139.7 Italy 1 1.8 1 3.1 1 5.2 Spain 1 190.0 1 308.0 1 468.9 United States 6 49.4 6 127.1 12 47.3
Average 12 94.3 16 141.4 22 100.4 VVER Bulgaria 4 9.2 4 10.1 4 3.3
Russian Federation 2 66.3 2 79.2 2 49.6 Slovak Republic* 2 10.1 2 4.2
Average 8 23.7 8 25.9 6 18.7 BWR Germany 1 289.5 5 98.5 5 80.2
Italy 2 15.1 2 18.4 2 34.2 Japan** 2 48.4 2 41.2 2 64.2 Netherlands 1 10.0 1 0 1 0 Spain - - - - 1 31.2 Sweden 2 27.2 2 20.0 2 3.5 United States 5 24.5 4 59.1 5 55.7
Average 13 46.4 16 55.5 18 50.8 GCR France 6 2.4 6 7.4 6 8.2
Germany 1 0 1 0 1 0 Italy 1 10.4 1 0.2 1 2.2 Japan 1 50.0 1 70.0 1 10 Spain 1 0 1 0 1 0 United Kingdom 16 49.0 19 56.0 19 57.3
Average 26 33.04 29 40.63 29 39.66
PHWR Canada - - 1 0 3 17.3
LWGR Lithuania 2 304.8 2 264.9 2 304.8
LWCHWR Japan 1 126.6 1 148.8 1 134.1 * Withdrawal of JAVYS NPP ** without Fukushima Daiichi NPP

23
Figure 15. Average annual collective dose by country from 2009 to 2013 for PWRs
Figure 16. Average annual collective dose by country from 2009 to 2013 for VVERs
0
2
4
6
8
10
12
14
0
50
100
150
200
250
300
350
400
450
500
2009
2010
2011
2012
2013
2009
2010
2011
2012
2013
2009
2010
2011
2012
2013
2009
2010
2011
2012
2013
2009
2010
2011
2012
2013
France Germany Italy Spain USA
Average annual collective dose Number of units
No. of unitsNo. of units
0
1
2
3
4
5
0
20
40
60
80
100
120
2009
2010
2011
2012
2013
2009
2010
2011
2012
2013
2009
2010
2011
2012
2013
Bulgaria Russian Federation Slovak Republic
Average annual collective dose Number of units
No. of unitsNo. of units

24
Figure 17. Average annual collective dose by country from 2009 to 2013 for BWRs
Figure 18. Average annual collective dose by country from 2009 to 2013 for GCRs
0
1
2
3
4
5
6
0
50
100
150
200
250
300
350
400
450
2009
2010
2011
2012
2013
2009
2010
2011
2012
2013
2009
2010
2011
2012
2013
2014
2009
2010
2011
2012
2013
2009
2010
2011
2012
2013
2009
2010
2011
2012
2013
2009
2010
2011
2012
2013
Germany Italy Japan Spain Sweden The Netherlands USA
Average annual collective dose Number of units
No. of unitsNo. of units
0
2
4
6
8
10
12
14
16
18
20
0
10
20
30
40
50
60
70
80
2009
2010
2011
2012
2013
2009
2010
2011
2012
2013
2009
2010
2011
2012
2013
2009
2010
2011
2012
2013
2009
2010
2011
2012
2013
France Italy Japan Spain United Kingdom
Average annual collective dose Number of units
No. of unitsNo. of units

25
3. PRINCIPAL EVENTS IN PARTICIPATING COUNTRIES
As with any summary data, the information presented in Section 2: Occupational Dose Studies, Trends and Feedback provides only a general overview of average numerical results from the year 2013. Such information serves to identify broad trends and helps to highlight specific areas where further study might reveal relevant experiences or lessons. However, to help to enhance this numerical data, this section provides a short list of important events which took place in ISOE participating countries during 2013 and which may have influenced the occupational exposure trends. These are presented as reported by the individual countries.1 It is noted that the national reports contained in this section may include dose data arising from a mix of operational and/or official dosimetry systems.
ARMENIA
1) Dose information ANNUAL COLLECTIVE DOSE
OPERATING REACTORS Reactor type Number of
reactors Average annual collective dose per unit and reactor type
[man·mSv/unit] VVER 1 730
REACTORS DEFINITIVELY SHUTDOWN OR IN DECOMMISSIONING Reactor type Number of
reactors Average annual collective dose per unit and reactor type
[man·Sv/unit] VVER 1 No separate data is available
2) Principal events
Summary of national dosimetric trends
For the year of 2013, the dosimetric trends at the Armenian NPP have not essential changed and were mainly contributed with works in controlled area, such as works with spent fuel removal and transportation, works with activated in reactor equipment, nondestructive testing of pipes and other control works during the outage, decontamination works and the works with radioactive wastes. The maximum individual dose was recorded as 15.0 mSv. The collective dose for outside workers was recorded as 0.035 man·Sv, which is quite low. The reason is that the operators perform their repair workers with the utility stuff. The collective dose for repair and outage was planned in terms of dose constraints and the real doses constituted at 86 % of planned doses.
1. Due to various national reporting approaches, dose units used by each country have not been standardised.

26
- Events influencing dosimetric trends No significant events were registered for the impact on dosimetric trends.
- Number and duration of outages For the 2013, one outage (full refuelling) with 83 days was performed.
- New plants on line/plants shut down The new plant construction and siting considerations are currently on-going, however the new safety improvement approaches in relation to Fukushima Daiichi NPP accident were considered on plant design with regulatory requirements and site evaluation. The new regulations on site and design requirement were approved by the Government of Armenia.
- Major evolutions The “Dose reduction program including ALARA culture implementation” for 2013 was established, improvement of old radiation control system was completed. The new radiation control pass system has been put in operation.
- Component or system replacements During the outage in 2013, no components or systems were replaced.
- Safety-related issues Some safety related issues are still existed due to medium activity radioactive waste treatment and storage activities. The concept (policy) on radioactive waste management in Armenia has already been approved by the Government of Armenia and the drafting of National Strategy has been started and will be completed with the EU assistance program at the end of 2015.
- Unexpected events For the year 2013, unexpected events were not registered.
- New/experimental dose-reduction programmes No new/experimental dose-reduction programmes were applied for the year 2013.
- Organisational evolutions The dose planning and the dose constraint approach for the reduction of individual doses of staff is remaining the main tool for the ALARA implementation.
For 2014
- Issues of concern The modification of some safety systems are implemented due to life extension program implementation.
- Technical plans for major work Modernisation of Radiation Control System for airborne and liquid releases, modernisation and safety improvement measures of some safety system.
- Regulatory plans for major work Review of Inspections procedures and special works related new Check list preparation for inspections at Armenian NPPs to control compliance with license conditions and regulatory requirements and follow -up actions.
Review of the safety assessment report (SAR) in terms of radiation protection and safety of radioactive waste management, submitted by Armenian NPP in their yearly reports and preparation of follow up actions.
27
BELGIUM
1) Dose information ANNUAL COLLECTIVE DOSE
OPERATING REACTORS Reactor type Number of
reactors Average annual collective dose per unit and reactor type
[man·mSv/unit] PWR 7 200.4
2) Principal events
- Events influencing dosimetric trends
There were extended outage durations due to the discovery of indications in the Doel 3 and Tihange 2 vessels. Only one normal revision for Doel 1 was performed during the annual period. Concrete conditioning of the radioactive waste at Doel was stopped, after the discovery of an unexpected alkali-silicate reaction.
- New/experimental dose-reduction programmes
It is too early to identify the dosimetric impact of Zinc injection in the primary circuit of Doel 3, taking into account the extended shutdown.

28
BULGARIA
1) Dose information ANNUAL COLLECTIVE DOSE
OPERATING REACTORS Reactor type Number of
reactors Average annual collective dose per unit and reactor type
[man·mSv/unit] VVER-1000 2 228.0
REACTORS IN COLD SHUTDOWN OR IN DECOMMISSIONING Reactor type Number of
reactors Average annual collective dose per unit and reactor type
[man·mSv/unit] VVER-440 4 3.3
2) Principal events
Summary of national dosimetric trends
Number and duration of outages
Unit No. Outage duration - days Outage information Unit 5 39 d Refuelling and maintenance activities Unit 6 37 d Refuelling and maintenance activities
Technical plans for major work
Refuelling and maintenance at unit 5 and 6
29
CANADA
1) Dose information ANNUAL COLLECTIVE DOSE
OPERATING REACTORS Reactor type Number of
reactors Average annual collective dose per unit and reactor type
[man·mSv/unit] PHWR 19 850
REACTORS DEFINITIVELY SHUTDOWN OR IN DECOMMISSIONING Reactor type Number of
reactors Average annual collective dose per unit and reactor type
[man·Sv/unit] PHWR 3 52
Summary of national dosimetric trends for 2013
• 16.12 man·Sv for 19 operating units in 2013 • Average annual dose per unit: 0.85 man·Sv in 2013
The total collective effective doses and the average collective dose per unit at operating Canadian nuclear plants decreased significantly in 2013 compared to previous years. The reduction in occupational dose is due to completion of reactor refurbishment activities at Pt. Lepreau and Bruce Power Units 1, 2 in 2012 and also extensive outage work in some other CANDU units in 2012.
In 2013, outage dose accounted for approximately 87 % of the total collective dose. The implementation of several ALARA initiatives at Canadian nuclear plant played a role in the reduction of annual occupational dose.
The average calculated dose for 2013 includes nineteen (19) units. The Dose associated with activities performed at two units in safe storage (Pickering Units 2 and 3) is negligible and therefore not included in the calculated average. Gentilly-2 transitioned from an operational site to safe storage in 2013.
The implementation of the radiation protection at Canadian Nuclear Power Plants (NPPs) met applicable regulatory requirements and doses to workers are maintained below regulatory dose limits. No reported individual dose above 15 mSv in 2013.
Distribution of annual effective doses to workers at Canadian NPPs showed that approximately 85 percent of the workers received an annual effective dose below 1 mSv.
2) Principal Events
Bruce Power In 2013, all four units were operational at Bruce A. After refurbishment, Unit 1 returned to service on September 19, 2012 and Unit 2 returned to service on October 16, 2012. Bruce A, Units 1-4 routine operations dose for 2013 was 0.334 man·Sv and the maintenance outage dose was 0.954 man·Sv (one planned outage and forced outages). The internal dose for Bruce A Units

30
1-4 was 0.073 man·Sv and the external dose was 1.215 man·Sv. The total collective dose for Bruce A Units 1-4 was 1.288 man·Sv which resulted in an average collective dose 0.334 man·Sv /unit. Bruce B Units 5-8 routine operations dose was 0.525 man·Sv. The outage dose was 5.138 man·Sv in 2013. The internal dose was 0.323 man·Sv. The external dose was 5.340 man·Sv. The total dose was 5.663 man·Sv which resulted in an average collective dose 1.416 man·Sv /unit. Bruce B had increased number of planned outages (three planned outage in 2013) in comparison with one outage in 2012. Darlington Units 1-4 In 2013, all four units were operational at Darlington. Darlington Units 1-4 had routine operations dose of 0.382 man·Sv. The Darlington site had two planned outages (Units 2 & 4) in 2013. The outage dose was 4.067 man·Sv. The routine operation dose was 0.382 man.Sv. The internal dose for 2013 was 0.576 man·Sv. The external dose was 3.873 man·Sv. The total collective dose was 4.449 man·Sv which resulted in an average collective dose 1.112 man·Sv /unit. Darlington site experienced an increase in annual collective dose compared to 2012 due to an increase in the number of planned and forced outages with major scope. Pickering Nuclear In 2013, Pickering A Units 1 and 4, and Units 5-8 were operational, while Units 2 and 3 remained in safe storage state. The routine collective dose for operational units was 0.682 man·Sv in 2013. The outage dose for the operational units was 3.764 man-Sv (accounted for approximatively 84% of the total station dose). The internal dose was 0.696 man·Sv. The external dose was 3.750 man·Sv. The total dose was 4.446 man·Sv which resulted in an average of collective dose 0.741 man·Sv /unit. The dose associated with radiological activities performed at Pickering Units 2 and 3 (in safe storage since 2010) is negligible when compared to collective dose of the operational units. Therefore, this dose is not reported separately but instead included under operational Pickering Units. Point Lepreau Point Lepreau is a single unit CANDU station. In 2013 Point Lepreau was fully operation. The unit was returned to service from extended refurbishment activities in the spring of 2012. The routine collective dose for operational activities was 0.178 man·Sv in 2013. The forced outage dose was 0.047 man·Sv (accounted for approximately 21% of the total station dose). The internal dose was 0.033 man·Sv. The external dose was 0.192 man·Sv. The total dose was 0.225 man·Sv. The reduction in the collective dose is attributed to the reduction in the source term due to the installation of new plant components. 3) Component or system replacements, Unexpected events/incidents, New reactors on line, Reactors definitively shutdown…) Gentilly-2 Gentilly-2 is a single unit CANDU station. In 2013, Gentilly-2 transitioned from operation to safe storage state. The reactor was shut down in December 28, 2012. The station collective dose is only attributed to safe storage transition activities. The internal collective dose in 2013 was 0.015 man·Sv. The external dose was 0.037 man·Sv. The total site collective dose in 2013 was 0.052 man·Sv. The reduction in the collective dose is attributed to the cessation of normal operations. Summary After over four years of extensive plant refurbishment activities at Point Lepreau and Bruce A 1, 2, the Canadian nuclear fleet achieved significant dividends in occupational dose. In fact, the 2013 Canadian

31
average collective dose for the Canadian fleet was 0.85 man·Sv, nearly achieving the CANDU WANO dose target of 0.80 man·Sv. The refurbishment activities executed in 3 of the 19 operational is already showing benefits by providing excellent dose reduction in the units where new plant components were installed. Not only total unit annual dose for 2013 was reduced significantly but internal average collective dose was also reduced (approximately 11% of the total dose with: tritium as the main contributor).

32
CHINA
1) Dose information ANNUAL COLLECTIVE DOSE
OPERATING REACTORS Reactor type Number of
reactors Average annual collective dose per unit and reactor type
[man·mSv/unit] PWR 11 659.61 VVER 2 233.35 PHWR 2 315.00 All types 15 556.83
2) Principal events
- Events influencing dosimetric trends
In 2013, there were no INES 2 or above events in any operational nuclear power plant. The monitoring index over the year showed that the integrity of three safety barriers was sound. Post-Fukushima improvement actions and regulatory requirements imposed by the Chinese NNSA have been implemented smoothly in operational nuclear power plants.
o In operational nuclear power plants, the dose information in the table above is summarised only for 15 reactors operating before the end of 2012. In those reactors, refuelling outages were completed for 10 of 11 PWR units, 1 of 2 PHWR units, and 2 of 2 VVER units in 2013.
o Five new PWR units began to operate in 2013. - New/experimental dose-reduction programmes
o An ALARA programme is well implemented in the design and operation of all nuclear power plants. Particularly, in the operation of nuclear power plants, annual collective dose is mainly from refuelling outages. So, it is very essential to effectively control workforce and work time in the outage workplace, and to optimize the outage work plan and procedures.
- Regulatory requirements After the Fukushima accident, some new safety requirements for nuclear power plants have be imposed by the Chinese NNSA. “General technical requirements of improvement actions for nuclear power plants after the Fukushima accident (Probationary)” was issued and began to be implemented in June 2012. “New regulation requirements for the safety of nuclear power plants during National Twelfth Five-Year Plan period” is planned to be issued in 2014. That is to be applied to siting, design and construction, and review and supervision of new nuclear power plants.

33
CZECH REPUBLIC
1) Dose information ANNUAL COLLECTIVE DOSE
OPERATING REACTORS Reactor type Number of
reactors Average annual collective dose per unit and reactor type
[man·mSv/unit] VVER 6 125
All types 6 125 2) Principal events
- Events influencing dosimetric trends
The main contributions to the collective dose were 6 planned outages.
NPP, Unit Outage information CED [man.mSv] Temelin, Unit 1 60 days, standard maintenance outage with refuelling 61 Temelin, Unit 2 52 days, standard maintenance outage with refuelling 65 Dukovany, Unit 1 26 days, standard maintenance outage with refuelling 108 Dukovany, Unit 2 33 days, standard maintenance outage with refuelling 109 Dukovany, Unit 3 44 days, standard maintenance outage with refuelling 141 Dukovany, Unit 4 31 days, standard maintenance outage with refuelling 168
The collective effective dose (CED) increased slightly in comparison with the previous year mainly due to extended work load during the outage of Unit 4 at Dukovany NPP. The repair work on heterogeneous weld of SG during the outage at Unit 2 also contributed to the increase.
CED stayed nearly at the same level at Temelin NPP.
There were no unusual or extraordinary radiation events in the year 2013 at Temelin NPP or Dukovany NPP.
Very low values of outage and total effective doses represent results of good primary chemistry water regime, well organised radiation protection structure and strict implementation of ALARA principles during the work activities with high radiation risk. All CED values are based on electronic personal dosimeter readings.
- New/experimental dose-reduction programmes
There were no new/experimental dose reduction programmes.
- Organisational evolutions
Two working groups (WG) were established by the RP department managers:
o Personal Contamination Events reduction WG, which aims for overall improvement of personnel perception of PCEs and ultimate reduction of PCE numbers
o Radiation Work Permit WG which is focused on revision of the RWP system, RCA areas classification and EPD alarm settings

34
- Regulatory requirements
Post-Fukushima National Action Plan is implemented progressively at Temelin and Dukovany NPPs.
3) Report from Authority
The State Office for Nuclear Safety (SUJB) carried out 51 inspections of radiation protection at NPPs and contractors in 2013. No serious shortcomings were identified.
The SUJB has started with the evaluation of the implementation of measures set out in the Post-Fukushima National Action Plan. SUJB was provided, among others, with preliminary analyses of the habitability of both main and emergency control rooms of both NPPs during a severe accident. The full analysis should be completed in 2014.
In 2013, the SUJB was reviewed by IAEA’s Integrated Regulatory Review Service (IRRS) with the outcome of 11 good practices, 17 suggestions and 20 recommendations.
A new Atomic Act and its implementing regulations are being prepared. The interdepartmental review procedure was initiated in 2013, and the process continues in 2014.

35
FINLAND
1) Dose information ANNUAL COLLECTIVE DOSE
OPERATING REACTORS Reactor type Number of
reactors Average annual collective dose per unit and reactor type
[man·mSv/unit] VVER 2 270.5 BWR 2 324.5
All types 4 297.5 Summary of national dosimetric trends
The annual collective dose strongly depends on the length and type of annual outages. The 2013 collective dose (1.19 man.Sv) of Finnish NPPs was the lowest in the operating history, mainly due to short refuelling outages at three of four reactors. In the long run the 4-year-rolling average of collective doses shows a slightly decreasing trend since the early 1990's.
2) Principal events Olkiluoto The annual outage of 2013 at Olkiluoto 1 was a short 8-day refuelling outage. In addition to refuelling it included periodic inspections and annual maintenance activities, leak rate tests of isolation valves and replacement of two main seawater pumps. The collective outage dose 0.091 man·Sv was the lowest outage dose ever of a plant unit in Olkiluoto.
The maintenance outage at Olkiluoto 2 took about 18 days including refuelling, replacement of the low voltage switchgears in two subsystems, repair of the generator stator, leak tightness test of the containment and replacement of two main seawater pumps. The replacement of the switchgears is a part of the systematic long-term development of the plant units. The collective dose was 0.466 man·Sv. Just three weeks before the outage a fuel leak was detected at Olkiluoto 2.
On both units a Risk-Informed In-Service Inspection (RI-ISI) approach has been implemented on ASME piping inspection programs. The RI-ISI program is expected to reduce dose in future years.

36
Loviisa
On both units, the 2013 outages were short refuelling outages with durations of 19 and 16 days respectively. Outage collective doses were the lowest in plant operating history; 0.296 and 0.180 man·Sv respectively. Main contributors to collective dose accumulation were reactor related tasks (disassembly, assembly), cleaning/decontamination and auxiliary work such as radiation protection, insulation and scaffolding. During the Lo1 outage a significant operating event was noticed as some lead blankets used as radiation shielding during the outage of 2012 were found inside the reactor's thermal shield. The lead blankets were exposed to intense heat during the operating period and thus the material was partially melted on the primary piping. Cleaning and inspections caused an unplanned exposure of some 0.04 man·Sv to the working group.
Source term reduction: After 5 years of studies, testing and approval, antimony-free mechanical sealing was installed in one of Loviisa 1's six primary coolant pumps in 2012. During the 2013 outage this sealing was inspected and approved. Followed by approval, six additional antimony-free sealing were installed on units 1 and 2. The aim is to replace all five remaining antimony-containing sealing during the 2014 outage. Currently radioactive antimony causes about 50% of doses at both units and after the sealing replacement the dose rates of primary components are expected to decrease by nearly 50% during the following three years as the amount of antimony decreases in the primary coolant.
3) Report from Authority
The renewal process of regulatory guides is completed and the implementation of new requirements will start in 2014.
The implementation process of the new BSS directive has also started, and it will still require some updating of the current legislation.
The power companies of operating plants are planning modernisations as well as safety improvements, some of which are originating from lessons learned from the Fukushima Dai-ichi accident. A periodic safety review will be carried out at Loviisa NPP by the end of 2015.
Olkiluoto 3 is under construction and it is nearing the commissioning and operating license phase. At least one new unit is planned to enter the construction license phase by mid-2015.
In other sectors of the nuclear cycle there are activities. One research reactor will be decommissioned and the final repository for spent fuel is currently in the construction license phase.

37
FRANCE
1) Dose information ANNUAL COLLECTIVE DOSE
OPERATING REACTORS Reactor type Number of
reactors Average annual collective dose per unit and reactor type
[man·mSv/unit] PWR 58 790
REACTORS DEFINITIVELY SHUTDOWN OR IN DECOMMISSIONING Reactor type Number of
reactors Average annual collective dose per unit and reactor type
[man·mSv/unit] PWR 1 189 GCR 6 49
HWGCR 1 16 SFR 1 2
Collective dose
For 2013, the average collective dose of the French nuclear fleet (58 PWR) is 0.79 man·Sv /unit (2013 annual EDF objective: 0.74 man·Sv /unit). The average collective dose for the 900 MWe 3-loop reactors (900 MWe – 34 reactors) is 1.05 man·Sv /unit and the average collective dose for the 4-loop reactors (1300 MWe and 1450 MWe – 24 reactors) is 0.43 man·Sv /unit.
Type and number of outages Type Number
ASR – short outage 22 VP – standard outage 19 VD – ten-year outage 7
No outage 10 Forced outage 1
Specific activities Type Number SGR 2
RVHR 0
The outage collective dose represents 84% of the total collective dose. The collective dose received when the reactor is operating represents 16% of the total collective dose. The collective dose due to neutron is 0.259 man.Sv; 77% of that dose (0.183 man.Sv) is due to spent fuel transport.
Individual doses
In 2013, no worker received an individual dose higher than 16 mSv in 12 rolling months on the EDF fleet. 75% of the exposed workers received a cumulative dose lower than 1 mSv and 99% of the exposed workers received less than 10 mSv.
2) Principal events
The main 2013 events with a dosimetric impact are the following; o RHRS Hydrostatic test:
This activity which is demanded by regulation on nuclear equipment under pressure has been prepared for the first time at Dampierre. The occupational exposure for this activity is relatively high.

38
o Control of braking on valves important in terms of safety: Compliance control of braking on air-operated and electrically-operated valves important in terms of safety have been realised on the fleet. Following these controls, many renewals have been conducted on these valves.
o Controls on 4-loop reactors sumps (P’4 and N4): Controls of the leak tightness of sumps stainless steel liner have been performed on some of the 4-loop reactors. In order to realize these controls, sumps have to be emptied and washed.
o Maintenance issues on replacement of control rod drive mechanism: Some issues were encountered concerning welding on CRDM replacements at Dampierre and Gravelines.
3-loop reactors – 900 MWe
In 2013, Bugey 4 had no outage. Fessenheim 2 had a forced outage with an occupational dose of 39.9 man.mSv.
The 3-loop reactors outage program was composed of 13 short outages, 13 standard outages, and 6 ten-year outages. 2 Steam Generator Replacements were performed. 1 outage of the 2012 program ended in 2013 (standard outage and steam generator replacement at Chinon B2 for 0.950 man·Sv). Moreover 2 outages of the 2013 program ended in 2014: the 3rd ten-year outage with SGR at Blayais 2 (collective dose in 2013: 0.950 man.Sv) and the 3rd ten-year outage at Dampierre 3 (collective dose in 2013: 0 man·Sv).
The lowest collective doses for the various outage types and specific activities were:
o Short outage: 0.169 man·Sv at Chinon B4, o Standard outage: 0.524 man·Sv at Chinon B3, o Ten-year outage: 1.405 man·Sv at Chinon B1, o SGR: 0.481 man·Sv at Blayais 2.
4-loop reactors – 1 300 MWe and 1 450 MWe
In 2013, 8 units had no outage.
The 4-loop reactors outage program was composed of 9 short outages, 6 standard outages, and 1 ten-year outage. 1 outage of the 2012 program ended in 2013 (standard outage at Nogent 2 for 0.166 man.Sv). Moreover 2 outages of the 2013 program ended in 2014: a short outage at Civaux 2 (collective dose in 2013: 0.04 man.Sv) and a standard outage at Cattenom 3 (collective dose in 2013: 0.05 man.Sv).
The lowest collective doses for the various outage types were:
o Short outage: 0.196 man·Sv at Chooz B2, o Standard outage: 0.627 man·Sv at Belleville 2, o Ten-year outage: 1.274 man·Sv at Cattenom 4,
Main radiation protection significant events (ESR)
In 2013, 4 ESR have been classified at the INES scale (3 at level 1 and 1 at level 2). o Belleville NPP (rated level 1 at the INES scale)
1 ESR on unit 1: skin dose to a worker higher than one quarter of the regulatory dose limit during maintenance activity
o Cruas NPP (rated level 1 at the INES scale) 1 ESR on unit 3: a diver received a significant dose (about one quarter of the regularity dose limit) due to inappropriate move in order to avoid being under a moving charge

39
o Cruas NPP (rated level 1 at the INES scale) 1 ESR on unit 4: subcutaneous contamination of a worker, leading after one year with the model used by doctors to an annual dose of 50% of the annual limit to extremities.
o Blayais NPP (rated level 2 at the INES scale) 1 ESR on unit 4: body contamination of a worker occurring during brushing on RHRS filters.
Other events in 2013
Concerning radiographic inspection o Gravelines
1 ESR on unit 1: Presence of two workers in the area of radiographic inspection whereas the exposure was authorised and the source was not ejected.
o Flamanville 1 ESR on unit 2: Intervention of a worker in a radiographic inspection area with a permit covering another area of radiographic inspection.
o Saint Alban 1 ESR on unit 2: No respect of the organisation of radiographic inspection process.
o Blayais 1 ESR on unit 2: Anticipation of a radiographic inspection without prior agreement.
Concerning red zone o Gravelines
1 ESR on unit 2: Absence of double condemnation and regulatory signalisation on red zone access to the reactor cavity.
2014 goals
For 2014, the collective dose objective for the French nuclear fleet is set at 0.82 man.Sv/unit.
For the individual dose, one of the objectives is to reduce the individual dose of the most exposed workers by 10% over 3 years. The other objectives are the following related to dose over 12 rolling months:
o 0 worker with a dose > 18 mSv, o Less than 20 workers with a dose > 14 mSv, o Less than 370 workers with a dose > 10 mSv.
Future activities in 2014
Collective dose: continuation of the activities initiated in 2012 and 2013.
o Implementation of the actions plan on radiography inspection o Source term management (oxygenation and purification during shutdown, management and removal
of hotspots) o Decontamination of the most polluted circuits o Optimisation of biologic shielding (CADOR) o Organisational preparation of the RMS, deployment of the fleet planned from 2016 to 2018.

40
3) Report from Authority
In 2013, ASN conducted, as in 2012, an in-depth inspection of two sites of the same area (Fessenheim and Cattenom) regarding radiation protection and radiological cleanliness. This inspection gave the opportunity to observe discrepancies in implementation of the radiation protection requirements on these sites.
Some events related to radiation protection of personnel should be mentioned:
o contamination on a worker at Blayais NPP (estimated dose received by the worker on his neck above the regulatory limit for the skin which is 500 mSv per cm² of skin ; event rated at level 2 on the INES scale);
o overexposure of a diver in the spent fuel pool of the Cruas NPP (dose higher than one quarter of the annual regulatory limit ; event rated at level 1 on the INES scale);
o contamination on a worker at Belleville NPP (estimated dose received by the worker on his head higher than one quarter of the annual regulatory limit for the skin ; event rated at level 1 on the INES scale);
o contamination on a worker on Cruas NPP following a finger injury (estimated dose received by the worker on his hand higher than one quarter of the annual regulatory limit for “extremities”; event rated at level 1 on the INES scale).
ASN proceeded to inspections to ensure that all the necessary measures had been taken following these events.
Finally, since EDF confirmed the likely rise of individual and collective exposures due to the increase of the volume of maintenance work in the coming years, ASN has requested the Advisory Committee for reactors to issue an opinion on the optimisation principle implemented by EDF (end of 2014).

41
HUNGARY
1) Dose information ANNUAL COLLECTIVE DOSE
OPERATING REACTORS Reactor type Number of
reactors Average annual collective dose per unit and reactor type
[man·mSv/unit] VVER 4 632 (with electronic dosimeters;) 558 (with TLDs)
2) Principal events
Summary of national dosimetric trends
Using the result of operational dosimetry, the collective radiation exposure was 2526 man.mSv for 2013 at Paks NPP (1990 man.mSv with dosimetry work permit and 536 man.mSv without dosimetry work permit). The highest individual radiation exposure was 12.3 mSv, which was well below the dose limit of 50 mSv/year, and the dose constraint of 20 mSv/year.
The collective dose increased in comparison to the previous year. The higher collective exposures were mainly ascribed to the collective dose of investment activities being more in 2013 than in previous years.
The cause of the difference between electronic dosimeters and TLD data was the change in the TLD monitoring by the authorities.
Development of the annual collective dose values at Paks Nuclear Power Plant (using the results of the TLD monitoring by the authorities)
- Events influencing dosimetric trends
There was one general overhaul (long maintenance outage) in 2013. This outage was 105 days long, to repair leakage in the spent fuel storage pool cooling system. The collective dose of the
25
560
1012 1039
2137
1732
2307
3356
4025
3332
2067
1615
2294 2121
1588
2343
2026
3645
2515
2933
3729
1807
2189
1759
2459
1890
2453
2034
3387
2417 2233
0
500
1000
1500
2000
2500
3000
3500
4000
4500
1983
1984
1985
1986
1987
1988
1989
1990
1991
1992
1993
1994
1995
1996
1997
1998
1999
2000
2001
2002
2003
2004
2005
2006
2007
2008
2009
2010
2011
2012
2013
[man.mSv]
From 2000, this data shall be quoted as individual dose equivalent /Hp(10)/

42
outage was 1140 man·mSv on Unit 3 in 2013, but this outage lasted until 1/11/2014, and generated an additional 56 man·mSv collective dose of this outage in 2014. The significant part of the collective dose came from the activities of the lifetime extension, which resulted in 362 man·mSv collective dose.
- Number and duration of outages
The durations of outages were 31 days on Unit 1, 28 days on Unit 2, 105 days on Unit 3 and 27 days on Unit 4.

43
ITALY
1) Dose information ANNUAL COLLECTIVE DOSE
REACTORS DEFINITIVELY SHUTDOWN OR IN DECOMMISSIONING Reactor type Number of
reactors Average annual collective dose per unit and reactor type
[man·mSv/unit] PWR 1 5.16 man.mSv
(1 unit - Trino NPP) BWR 2 34.24 man.mSv
(1 unit Caorso NPP [14.29 man.mSv] and 1 unit Garigliano NPP [54.18 man.mSv])
GCR 1 2.23 man.mSv ( 1 unit – Latina NPP)

44
JAPAN
1) Dose information ANNUAL COLLECTIVE DOSE
OPERATING REACTORS Reactor type Number of
reactors Average annual collective dose per unit and reactor type
[man·mSv/unit] PWR 24 229 BWR 24 203
REACTORS DEFINITIVELY SHUTDOWN OR IN DECOMMISSIONING Reactor type Number of
reactors Average annual collective dose per unit and reactor type
[man·mSv/unit] BWR 8 9,696 GCR 1 10
LWCHWR 1 134 2) Principal events
- Outline of national dosimetric trend
The average annual collective dose for shutdown BWRs increased from 41 man·mSv /unit of the previous year to 9,696 man·mSv /unit due to the inclusion of occupational dose of the Fukushima Daiichi NPP accident response. The average annual collective dose excluding Fukushima Daiichi NPP of this year was 64 man·mSv /unit, and that of Fukushima Daiichi NPP was 12,907 man·mSv /unit. The average annual collective dose of operating reactors was almost the same level as the last year. This is because many nuclear reactors have stopped for a long time after the accident of Fukushima Daiichi NPP.
- Operating status of nuclear power plants
During fiscal year 2013, only two PWRs were operated. From April 1 to September 1: 2 units (Ohi unit 3,4) From September 2 to September 14: 1 unit (Ohi unit 4) From September 15 to March 31, 2014: no unit operated
- Exposure dose distribution of workers in Fukushima Daiichi NPP
Exposure dose distributions at Fukushima Daiichi NPP for cumulative dose until March 2014 and for dose during FY2013 are shown below.

45
- Regulatory requirements
The examination of the new safety standards began in July 2013, and still goes on. On September 10, 2014, the NRA granted permission to make changes to the reactor installation of Sendai NPS Units 1 and 2, Kyushu Electric Power Company. After this step, the NRA will review the detailed design and construction of the nuclear reactors and related facilities as well as Operational Safety Programs including organisation systems and procedures for nuclear accident response.
Classification(mSv)
Cumulative dose(March 2011 – March 2014)
Fiscal year 2013(April 2013 – March 2014)
TEPCO Contractor Total TEPCO Contractor Total>250 6 0 6 0 0 0200 ~ 250 1 2 3 0 0 0150 ~ 200 25 2 27 0 0 0100 ~ 150 118 20 138 0 0 075 ~ 100 268 129 397 0 0 050 ~ 75 318 949 1,267 0 0 020 ~ 50 614 4,457 5,071 31 629 66010 ~ 20 551 4,173 4,724 95 2,067 2,1625 ~ 10 444 3,901 4,345 195 1,897 2,0921 ~ 5 727 7,248 7,975 670 3,739 4,409
<1 1,066 8,245 9,311 702 4,721 5,423Total 4,138 29,126 33,264 1,693 13,053 14,746
Max. (mSv) 678.80 238.42 678.80 41.90 41.40 41.90Ave. (mSv) 23.66 11.04 12.61 3.24 5.51 5.25
As of July 17,2014
* TEPCO use integrated value of APD data that was measured every time when enter into area.These data sometimes fluctuate due to replacing these data to monthly dose data measured by integral dosimeter.
* There has been no significant internal radiation exposure reported since October 2011.* Internal exposure doses may be revised due to the reconfirmation.

46
LITHUANIA
1) Dose information ANNUAL COLLECTIVE DOSE
REACTORS DEFINITIVELY SHUTDOWN OR IN DECOMMISSIONING Reactor type Number of
reactors Average annual collective dose per unit and reactor type
[man·mSv/unit] LWGR 2 327.34
2) Principal events
- Events influencing dosimetric trends
In 2013, the occupational doses at the Ignalina NPP (INPP) were maintained as low as possible, taking into account all economic and social conditions: 933 man·mSv in 2009, 521 man·mSv in 2010, 631 man·mSv in 2011, 587 man·mSv in 2012 and 655 man·mSv (54% of planned dose) in 2013. The collective dose for INPP personnel was 607.4 man·mSv (59% of planned dose) and for outside workers was 47.3 man·mSv (26% of planned dose). The external dosimetry system used was Thermoluminescence dosimeters (TLD).
The 20 mSv individual dose limit was not exceeded. The average annual individual effective dose for INPP staff was 0.38 mSv, and for outside workers was 0.06 mSv. The highest annual individual effective dose for INPP staff was 12.20 mSv, and for outside workers it was 10.25 mSv.
The main work that contributed to the collective dose during the technical service and decommissioning of Units 1 and 2 at the INPP were fuel handling; in-service inspection of DN300 pipeline, repairing of the hot cell, maintenance work at the spent fuel storage pool hall, reactor hall and reactor auxiliary buildings; waste and liquid waste handling; and the radiological monitoring of workplaces.
In 2013, there were no component or system replacements, nor were there any unexpected events.
- New/experimental dose-reduction programmes
The doses were reduced by employing new principles of organisation of work, by doing extensive work on modernisation of plant equipment, and by using automated systems and implementing programs for introduction of the ALARA principle in practice during work activities.
- Organisational evolutions
The year 2013 was significant for Ignalina Nuclear Power Plant; much essential work for safe and world-unique project implementation was performed. Over the year, progress in decommissioning project implementation was reached, dismantling work was ongoing and the Buffer Storage Facility B19/1 was placed into operation. The progress in key INPP decommissioning projects shall be highlighted as well: Project B1 (Interim Spent Fuel Storage Facility) funding was renewed, significant progress in resolving of problematic issues related to spent fuel storage casks and other B1 components was reached, and the Project B2/3/4 (Solid Radioactive Waste Management and Storage Facility) Contract Amendment was signed. Transition to the project management process was commenced in 2013. The aim of the

47
transition is to optimize project management, seeking that planning of activities would help to complete the strategic projects efficiently.
INPP implements its world-unique decommissioning project using in-house staff experience, recognizing that challenges and tasks having no analogue in the world practice are faced constantly. Our goal is not just to shut down the INPP safely, efficiently and effectively, but to gain the experience that will help to be competitive at the international level and to facilitate the staff’s taking part in other international nuclear facilities decommissioning projects as well.
3) Report from Authority
In 2013 VATESI carried out radiation protection inspections at Ignalina NPP in accordance with an approved inspection plan. It was assessed how radiation protection requirements are fulfilled in the following areas and activities: operation of Very Low Level Radioactive Waste Storage Facility (Project B19-1), monitoring of individual occupational exposure and workplaces, dismantling and decontamination of equipment, implementation of measures prescribed in the programme of optimisation of radiation protection (ALARA).
Inspections results showed that Ignalina NPP activities were carried out in accordance with the established radiation protection requirements. During the inspection of implementation of the ALARA programme, areas for improvement were identified, and recommendations regarding review of the corresponding Ignalina NPP procedures were provided. The corrective measures were implemented in due time.
In 2014 VATESI will continue supervision and control of nuclear safety during the decommissioning of INPP, management of radioactive waste, including the construction and operation of new nuclear facilities, as well as the radiation protection of these activities and facilities. To enhance radiation protection during decommissioning of the INPP, review of the legal documents related to radiation protection is foreseen in 2014-2015.
48
MEXICO
1) Dose information ANNUAL COLLECTIVE DOSE
OPERATING REACTORS Reactor type Number of
reactors Average annual collective dose per unit and reactor type
[man·mSv/unit] BWR 2 575
2) Principal events
Summary of national dosimetric trends
The nuclear reactors existing in Mexico are two BWR/GE units at the Laguna Verde Nuclear Power Station located in Laguna Verde, State of Veracruz, Mexico.
Laguna Verde’s historical collective dose both on line and during refuelling outages is higher than the BWRs average. On line collective dose is high because of failures in equipment reliability - some examples are steam leakage, reactor water clean-up system pump failures, radioactive waste treatment systems failures. Refuelling outage collective dose is high mainly because the radioactive source term (60Co), that causes high radiation fields in-plant.
The collective dose in 2013 was relatively low, mostly because there was a LV Vice President’s strong commitment to keep collective dose ALARA.
2013 collective dose was the lowest for on line (normal operation) - for unit 1 it was 0.59175 man.Sv and for unit 2, 0.5585 man.Sv. Despite this achievement, site personnel recognize routine operational dose is high when compared with those from other BWRs.
- Events influencing dosimetric trends
a) Increase of radioactive source term:
This factor was originated by the reactor water chemical instability induced in turn by the application of noble metals and hydrogen since 2006 to prevent the stress corrosion cracking of reactor internals. This factor is still strongly influencing dose rates at the plant and specifically in the drywell during refuelling outages.
Since 2011 LV’s Chemistry Manager took the responsibility for hydrogen injection, iron control in feed water and any other condition that can result in a chemical instability inside the reactor vessel. That year Laguna Verde’s new VP assigned a Source Term Control and Reduction Project Manager (STPM), supported by the Radiological Protection Manager (RPM) and the Chemistry Manager (CM).
In January 2012, in a WANO Technical Support Mission, Laguna Verde’s Source Term Control Team went to Atlanta, and is developing a program focused on reducing the quantity of soluble and insoluble cobalt moving in the primary systems.
Additionally, a weekly average collective dose goal for both units has been established. The trend of this behaviour is shown in the graph

49
Number and duration of outages
o From July 2nd to July 5th a forced outage in Unit 2 was necessary to repair piping leakage inside the drywell. Collective dose was 0.09685 man.Sv.
o From October 1st to October 5th a forced outage in Unit 2 was necessary to repair similar piping leakage inside the drywell. Collective dose was 0.1023 man.Sv.
New/experimental dose-reduction programmes
The main problem associated with the high collective dose at Laguna Verde NPS is the continued increase of the radioactive source term (insoluble Cobalt deposited in internal surfaces of piping, valves and equipment in contact with the reactor water coolant).
Control and optimisation of reactor water chemistry plays a fundamental role in the control and eventual retraction of the source term. The main strategies / actions aiming such purpose are:
o On Line Noble Metal Chemistry (OLNC), 3rd application. o Cobalt selective removal resins, continuous application to reactor water. o Continued application of Zinc to the reactor water. o Iron concentration control in feed water control o Reactor Water Cleanup System (RWCU) continuous operation. o Fuel Pool Cooling and Cleanup System (FPCC) hydrolysing. o Optimisation of continuity and availability of Hydrogen injection to the reactor. o CRUD pumps with high flow (600 gpm) during the outages (2014) o Portable demineralizer during the outages (2014) o RWCU system modifications to improve efficiency o Chemical decontamination of recirculation loops during refuelling outages: to be applied until
all of the other reactor water chemistry parameters become stabilised and optimised, in order to avoid a recontamination next cycle after the decontamination (estimated year 2015).

50
For 2014
Issues of concern in 2014
Two refuelling outages: 16 RFO Unit 1 and 13 RFO Unit 2.
Technical plans for major work in 2014
Work on the mentioned strategies for the radioactive source term reduction.

51
NETHERLANDS
1) Dose information ANNUAL COLLECTIVE DOSE
OPERATING REACTORS Reactor type Number of
reactors Average annual collective dose per unit and reactor type
[man·mSv/unit] PWR 1 830
REACTORS DEFINITIVELY SHUTDOWN OR IN DECOMMISSIONING Reactor type Number of
reactors Average annual collective dose per unit and reactor type
[man·mSv/unit] PWR 1 0
2) Principal events
In 2013, two outages took place (one unplanned) with significantly more work in execution and a higher collective dose than for the previous year.

52
ROMANIA
1) Dose information ANNUAL COLLECTIVE DOSE
OPERATING REACTORS Reactor type Number of
reactors Average annual collective dose per unit and reactor type
[man·mSv/unit] CANDU 2 255
2) Principal events Summary of national dosimetric trends
Occupational exposure at Cernavoda NPP (200-2013) Internal effective dose
[man·mSv] External effective dose [man·mSv]
Total effective dose [man·mSv]
2000 110.81 355.39 466.2 2001 141.42 433.44 574.86 2002 206.43 344.04 550.48 2003 298.02 520.27 818.28 2004 398.26 258.45 656.71 2005 389.3 342.29 731.59 2006 302.27 258.79 561.06 2007 83.34 187.49 270.83 2008 (2 units) 209.3 479.34 688.6 2009 (2 units) 67.6 417.7 485.3 2010 (2 units) 210.3 577 787.3 2011 (2 units) 56.0 337 393 2012 (2 units) 250.8 667.1 917.9 2013 (2 units) 92.3 416.8 509.1
- Events influencing dosimetric trends
Normal operations of the plant (U1 & U2)
At the end of 2013:
o there were 132 employees with individual doses exceeding 1 mSv; 9 with individual doses exceeding 5 mSv; none with individual dose over 10 mSv (unplanned exposure) and none with individual dose over 15 mSv;
o the maximum individual dose for 2013 was 5.81 mSv;
o the contribution of internal dose due to tritium intake is 18.1%.
Planned Outage
A 24 day planned outage was done at Unit#2 between May 10th and June 03rd 2013. Activities with major contribution to the collective dose were as follows:
o Fuel Channel Inspection

53
o Fuelling machine bridge component preventive maintenance; o Fuelling machine bridge permanent extension (installation) o Steam Generator eddy current inspection; o Feeder thickness measurements, feeder clearance measurements, feeder-yoke
measurements, elbow UT examination; o Snubber inspections; piping support inspections. Total collective dose at the end of the planned outage was 235 man.mSv (185.8 man.mSv external dose and 49.2 man.mSv internal dose due to tritium intakes).
This planned outage had a 46% contribution to the collective dose of 2013.
Planned Outages dose history
Year Unit Interval External collective
dose received [man·mSv]
Internal collective dose (3H intakes) received
[man·mSv]
Total collective dose received [man·mSv]
2003 1 15.05-30.06 345 161 506 2004 1 28.08-30.09 153 179 332 2005 1 20.08-12.09 127 129 256 2006 1 9.09-4.10 103 107 210 2007 2 20-29.10 16 0 16 2008 1 10.05 – 03.07 187 111 298 2009 2 09.05 – 01.06 122 11 133 2010 1 08.05 – 01.06 319 95 414 2011 2 07.05 - 01.06 117.2 13 130.2 2012 1 04.05 – 11.06 396.9 177.7 574.6 2013 2 10.05 – 03.06 185.8 49.2 235
Unplanned outages
o Unit 2 from July 1 - 3: The unit was shut down in an orderly manner to repair the Failed Fuel Location System (63105) pipe lines F16 and K12, identified with leaks. (7.11 man.mSv external dose and 2.8 man.mSv internal tritium dose for all the activities performed, including leak searches).
o Unit 2 from December 12 – 14: The unit was shut down in an orderly manner to repair a Shut Down cooling motorised valve, 3341 MV1. (2.52 man.mSv total dose);
o Unit 1 from October 28 – 30: The unit was shut down due to a shutdown System #1 trip. Work was performed on Defective Fuel Location System tubing and piping supports in feeder cabinets for 7.6 man.mSv collective dose.
Radiation protection-related issues
Transuranic (TRU) alpha-emitting radionuclides, which are normally contained within the fuel elements, may contaminate certain areas of a CANDU plant during the transfer of failed fuel or during maintenance activities on some components of the Primary Heat Transfer Circuit or auxiliaries. Identification and quantification of TRU is critical for radiation protection because of high internal dose conversion factors for the inhalation pathway, and of the detection difficulties. Some industry events when alpha contamination monitoring and controls were not consistently performed produced significant radiological consequences which triggered a significant review of contamination control programs in the nuclear industry.

54
Areas and equipment / systems / activities with significant TRU contamination potential have been identified in both Unit#1 and Unit#2. COG research and development research program results and CANDU plant operating experience have been used to do this.
Extensive sampling for TRU contamination identification and quantification was done beginning in 2011. Technical support has been provided by a Romanian research institute to measure low level TRU in contamination samples. Based on these results potentially contaminated areas have been classified using EPRI criteria.
Radiation protection procedures and radiological risks data base have been revised to accommodate alpha contamination monitoring.
The dosimetry program has been revised to include internal dosimetry of TRU and was approved by the regulatory body.
Basic knowledge regarding TRU radiological risks, control and monitoring were introduced in radiation protection training programs for workers and RP technicians.
Issues of concern in 2013
The main concerns for 2013 were important works, with high radiological impact, performed during the Planned Outage of Unit 2.
For 2014
Issues of concern in 2014 The main concerns for 2014 are activities with high radiological impact, to be performed during a 30 day Planned Outage of Unit 1:
o Fuel channel inspections; o Fuelling machine bridge component preventive maintenance; o Reactor Building Leak Rate Test; o Piping support inspections; o Snubber replacements; o Feeder–yoke clearance measurements and correction; o Inspection for tubing and support damages in the feeder cabinets; o Planned outage systematic inspections.

55
RUSSIA
1) Dose information ANNUAL COLLECTIVE DOSE OPERATING REACTORS Reactor type Number of
reactors Average annual collective dose per unit and reactor type [man·mSv/unit]
VVER 17 518.0 REACTORS DEFINITIVELY SHUTDOWN OR IN DECOMMISSIONING Reactor type Number of
reactors Average annual collective dose per unit and reactor type [man·mSv/unit]
VVER 2 49.6 2) Principal events
Collective doses
In 2013, the total effective annual collective dose of utilities employees and contractors at 17 operating VVER type reactors was 8806.5 man·mSv. This result presents 1700.8 man·mSv (16%) decrease from the year 2012 total collective dose of 10507.3 man·mSv.
Comparative analysis shows a considerable difference between average annual collective doses for the groups of VVER-440 MWe and VVER-1000 MWe reactors. In 2013, the results were as follows:
o 992.5 man·mSv/unit with respect to the group of 6 operating VVER-440 reactors. o 259.2 man·mSv/unit with respect to the group of 11 operating VVER-1000 reactors.
- Events influencing dosimetric trends
The principal factors influencing on the total collective dose change at Russian VVERs are annual outages durations and amount of repairing and maintenance works. In 2013, the total planned outages duration of all Russian VVERs-440 and VVERs-1000 was 641 days in comparison to 747 days in 2012. With this, the total planned outages collective dose decreased from 8494.5 man·mSv in 2012 to 7444.6 man·mSv in 2013.
In comparison to the year 2012, next changes should be taken into consideration for the year 2013:
• Balakovo –no outage at Unit 1, beginning of outage in the end of December (10 days) with outage finish in 2014 at Unit 2, major outage in 2013 (standard outage in 2012) at Unit3, standard outage at Unit 4 (for this unit, there was no outage in 2012).
• Kalinin – no maintenance and repairing works with radioactive contaminated equipment at Unit 1 and 2, planned outages at Unit 3 and 4 (for this unit, there was no outage in 2012).
• Kola – standard outages at Unit 1, 3 and 4, collective dose increasing at 98% was caused by major outage at Unit 2 in 2013 (standard outage in 2012).
• Novovoronezh – major outage at Unit 3, standard outages at Units 4 and 5. • Rostov – no outage at Unit 1 and standard outage at Unit 2.

56
Individual doses
In 2013, individual effective doses of all utilities employees and contractors were not exceeded the control dose level of 18 mSv per year at VVER-440 and VVER-1000 reactors.
The maximum recorded individual dose was 16.6 mSv. This dose was gradually received during full-year by the worker of Kola plant maintenance department during repairing of reactor component equipment at Units 1-4.
The maximum annual effective individual doses at other plants with VVER type reactors in 2013 were:
o Balakovo – 11.6 mSv. o Kalinin – 12.1 mSv. o Novovoronezh – 15.8 mSv. o Rostov – 5.5 mSv.
The annual individual doses over 10 mSv received 159 persons (6 persons at Balakovo, 2 persons at Kalinin, 65 persons at Kola, 86 persons at Novovoronezh). Nobody exceeded 5 mSv levels at Rostov NPP.
Planned outages duration and collective doses
Reactor Duration [days] Collective dose [man·mSv] Balakovo 1 no outage -- Balakovo 2 10, finish in 2014 94.5 Balakovo 3 54 683.3 Balakovo 4 37 365.3 Kalinin 1 no outage -- Kalinin 2 no outage -- Kalinin 3 83 408.0 Kalinin 4 68 196.0 Kola 1 36 399.0 Kola 2 57 859.2 Kola 3 88 857.6 Kola 4 65 372.9 Novovoronezh 3 51 1795.7 Novovoronezh 4 35 912.3 Novovoronezh 5 42 464.3 Rostov 1 no outage -- Rostov 2 25 83.4
Unplanned outages duration and collective doses
Reactor Duration [days] Collective dose [man·mSv] Kalinin 1 77 0.0 Rostov 1 7 15.3
Issues of concern in 2013 New documents, manuals and models were developed and implemented:
• New regulation concerning radiation protection management system in Concern Rosenergoatom.
• Manual for providing radiation safety during of NPP operation. • Method of radionuclides determination in human body in the case of radiation accident.

57
• Special model for calculation of internal exposure individual doses. • Software for direct estimation of personal radiation risk coefficients for personal
dosimetry of NPP employees. • Software based on IAEA safe principles and ICRP recommendations for situations of
potential exposure. New dose-reduction programmes planning in 2014
• Estimation of NPP personal radiation risk coefficients. Development of ARMIR programme based on individual and generic risk.
• Development and certification of optimised set of standard sources (phantoms) for whole body monitors calibration based on gamma radiation efficiency registration factor.

58
SLOVAK REPUBLIC
1) Dose information ANNUAL COLLECTIVE DOSE
OPERATING REACTORS Reactor type Number of
reactors Average annual collective dose per unit and reactor type
[man·mSv/unit] VVER 4 130.365
All types 4 130.365 REACTORS DEFINITIVELY SHUTDOWN OR IN DECOMMISSIONING
Reactor type Number of reactors
Average annual collective dose per unit and reactor type [man·mSv/unit]
VVER 2 Not included in ISOE GCR 1 Not included in ISOE
2) Principal events
- Events influencing dosimetric trends
Bohunice NPP (2 units): The total annual effective dose in Bohunice NPP in 2013 calculated from legal film dosimeters was 203.448 man·mSv (employees 103.450 man·mSv, outside workers 99.998 man·mSv). The maximum individual dose was 2.409 mSv (NPP employee) without internal contamination and anomalies in radiation conditions.
Mochovce NPP (2 units): The total annual effective dose in Mochovce NPP in 2013 evaluated from legal film dosimeters and E50 was 317.852 man·mSv (employees 143.235 man·mSv, outside workers 174.617 man·mSv). The maximum individual dose was 5.790 mSv (NPP employee).
Continuing work on Fukushima severe accidents measures on both NPPs
- Number and duration of outages
Bohunice
Unit 3
o 20 day standard maintenance outage. The collective exposure was 112.271 man·mSv from electronic operational dosimetry; 49,164 RWP man-hours.
o 2 day forced outage. The collective exposure was 0.652 man·mSv from electronic operational dosimetry; 268 RWP man-hours.
o 1 day forced outage. The collective exposure was 0.429 man·mSv from electronic operational dosimetry; 255 RWP man-hours
Unit 4 o 19 day standard maintenance outage. The collective exposure was 103.918 man·mSv
from electronic operational dosimetry; 48,827 RWP man-hours. Mochovce
Unit 1 - 23.5 day major maintenance outage. The collective exposure was 141.349 man·mSv from electronic operational dosimetry.

59
Unit 2 - 20 day standard maintenance outage. The collective exposure was 87.130 man·mSv from electronic operational dosimetry.
- New reactors on line Mochovce 3+4, VVER 440MW under construction
- Organisational evolutions – decrease of RP personnel number (Bohunice by 3 workers, Mochovce by 4 workers)

60
SLOVENIA
1) Dose information ANNUAL COLLECTIVE DOSE
OPERATING REACTORS Reactor type Number of
reactors Average annual collective dose per unit and reactor type
[man·mSv/unit] PWR 1 1351
2) Principal events
Summary of national dosimetric trends
The last three years’ collective dose average rose from 0.60 man·Sv to 0.77 man·Sv.
Maximum individual annual dose was 11.28 mSv. The average dose per person was 0.86 mSv.
o Events influencing dosimetric trends o The outage collective dose was 1.28 man·Sv. It was a refuelling outage with RTD by-pass
elimination (0.71 man·Sv). o Number and duration of outages o One planned outage performed in 49 days. o Major evolutions and dose-reduction programme o The RTD by-pass elimination will have future impact on dose reduction.
For 2014
Revision of procedures related to alpha monitoring and control, training and self-assessments. Implementation of a new computer radiological survey programme and preparation for remote control features for outages.

61
SPAIN
1) Dose information ANNUAL COLLECTIVE DOSE
OPERATING REACTORS Reactor type Number of
reactors Average annual collective dose per unit and reactor type
[man·mSv/unit] PWR 6 382.1 BWR 2 1140.80
All types 8 571.77 REACTORS DEFINITIVELY SHUTDOWN OR IN DECOMMISSIONING
Reactor type Number of reactors
Average annual collective dose per unit and reactor type [man·mSv/unit]
PWR 1 468.89 GCR 1 0
2) Principal events Santa María de Garoña
- Events influencing dosimetric trends
Date Event Mean activity (if it exists)
Collective Dose
[man·mSv] 19 Feb to 31 Dec Design modification. Trolley
replacement of the bridge crane and maintenance, in the reactor building
-- 4.965
15 April to 20 Nov
Fuel Pool Cooling System (FPC) maintenance
Pump B-1905A. Engine replacement.
2.263
6 July Reactor definitively shutdown -- -- - Organisational evolutions
New radiation protection manual adapted to the situation of definitive shutdown, from July 6th.
- Regulatory requirements Specific requirements associated with definitive shutdown and pre-decommissioning, from
July 6th.
Cofrentes
- Events influencing dosimetric trends Increase of the term source in the pipes of the reactor water cleanup system (G33), with a tendency to an increase in radiation levels of approximate 30% with regard to the 18th outage. There is foreseen the need for the chemical decontamination of the pipes of system G33 in the dry well in the 20th outage.
The levels of radiation in the pedestal of the vessel in the initial measurements of the 19th outage presented an increase of 33% with regard to those levels seen in the 18th outage. One proceeded to the cleanliness of 15 pipes of the PRM's with major levels of radiation, diminishing the rates of dose to values similar to those of the 17th outage.

62
The source term in the refueling plant after the decontamination of the cavity in the 19th outage presents results lower than in the 18th outage and with the same order of magnitude to those obtained in the 16th outage. The attainment of the objectives of reduction of the source term derived with the workgroup created after the 18th outage has been possible thanks to the action plan carried out in the refueling plant: installation of auxiliary system of filtration, shut down of the plant with the model "soft stop" and the system of cleaning floors using robotics.
Number and duration of outages
o 19th outage o Duraion of 40 days o There was no forced outage. o Reductions in power have been realised for actions in bridle of feedwater pipe .
- New/experimental dose-reduction programmes Decontamination of the reactor cavity Implementation of improvements to minimize the numbers of personal contaminations during the decontamination of the reactor cavity. (Installation of sprayers in the walls north, east and west of cavity to reduce the environmental contamination and to avoid the generation of aerosols by drying of the walls, utilisation of a robot to eliminate deposited activity, assembly of new sheets of protection using materials which are easily decontaminable and filling with 5 cm of water level in the area between bridle of the dry well and bridle of vessel). Cleanliness of platforms and floors of swimming pools Employment of a new system of suction for swimming pool floors, with remote system of monitoring, small size and TV camera, with better results being obtained than for ones using conventional systems for cleaning. Flushing of nozzles being inspecting in the outage Replacement of the flushing methods for the nozzles as used in previous outages with a new and more effective method. Use of remote machinery in inspection of nozzles and pipelines For this outage improved equipment is being used for inspection of nozzles and pipelines, reducing the quantity of necessary tools to realise the adjustments, as well as the quantity of cables associated with the same ones. 3D Modeling of the plant Installation in the door of the dry well of television screens to view work locations from the low radiation area. Additionally, this tool has been used during the early stages of planning of the work. During the 19th outage phase II of 3D modeling of the plant has been implemented. Temporary and permanent shielding The program of implementation of permanent shielding in different zones of the plant has been continued. In the outage temporary shielding was installed in different locations of the plant with an approximate weight of 5 tons.
- Organisational evolutions Reinforcement of the organisation of the Service of Radiological Protection. In the period 2012-2013 two top graduates, a middle graduate and three expert technical personnel have joined the Service of Radiological Protection CN Cofrentes.
- Regulatory requirements Application of the Technical Instruction of the CSN by which there is checking of compliance with the criteria of signposting of the zones of free access.

63
Almaraz
- Events influencing dosimetric trends a) Number and duration of outages :
21st outage of Almaraz Unit 2: o Duration 63 days. o Collective dose 541.948 man·mSv o Maximum individual dose: 4.449 mSv
22nd outage of Almaraz Unit 1: o Duration 60 days. o Collective dose 459.826 man·mSv o Maximum individual dose: 4.735 mSv
b) Component or system replacements − During 21st outage of unit 2 and 22nd outage of unit 1 two reactor coolant pump
motors (one per unit) were replaced. − Replacement during outages of external nuclear instrumentation system.
c) New/experimental dose-reduction programmes − Reduction by 5% is the annual collective dose objective for 2014. − Reduction by 4% in the maximum individual dose is the objective during outage. − Use of Centralised Aspiration Units for contamination control. − Modification and upgrade of the cavity purification system. − Continuous optimisation of radiation protection procedures and measures.
d) Organisational evolutions − Incorporation of a Radiation Protection technician in the Department.
Ascó
- Events influencing dosimetric trends (Outage information (number and duration), Component or system replacements, Unexpected events/incidents, New reactors on line, Reactors definitively shutdown…)
Number and duration of outages
o 21th outage (Ascó 2) o Duration of 46 days o Collective dose: 573.315 man.mSv.
Vandellòs 2
- Events influencing dosimetric trends (Outage information (number and duration), Component or system replacements, Unexpected events/incidents, New reactors on line, Reactors definitively shutdown…) Number and duration of outages
o 19th outage o Duration of 43 days o 18 Special Guide Plates of the upper internals removed. o Vessel head surface Inspection. o Increase of the radiation levels in the reactor cavity during the removal of the special
guide plates. The origin is the drain of SG water in the reactor cavity. o Increase of the radiation level in the vessel head.

64
SWEDEN
1) Dose information ANNUAL COLLECTIVE DOSE
OPERATING REACTORS Reactor type Number of
reactors Average annual collective dose per unit and reactor type
[man·mSv/unit] PWR 3 520 BWR 7 713
All types 10 655 REACTORS DEFINITIVELY SHUTDOWN OR IN DECOMMISSIONING
Reactor type Number of reactors
Average annual collective dose per unit and reactor type [man·mSv/unit]
BWR 2 4 2) Principal events
- Events influencing dosimetric trends Ringhals
The collective dose of Ringhals 1 was dominated by maintenance of RH ball valve repair (158 man.mSv). Conversion to Forward Pump Heat Drain (FPHD) was completed on the second turbine during 2013. Trends in water chemistry and source term have been carefully followed during operation, and the overall image is that the predicted consequences going to FPHD were correct or over-estimated to some extent.
The collective dose for Ringhals 2 was mainly dominated by service work during thermal insulation and scaffolding work related to RH and RCS pressure relief modifications.
In Ringhals 3 there was a major increase of Ag-110m which has been identified as probably caused by leakage from control rods. In some local areas Ag-110m was one of the main contributing nuclides to the CRE.
At Ringhals 4 the collective dose was dominated by periodic and corrective maintenance.
Oskarshamn
In June 2013 the Plant Life Extension (Plex) of Oskarshamn 2 started and will continue to September 2014. The total collective dose for the project was calculated to be 3300 man.mSv. Before the work started a system decontamination was performed of the main primary systems with an average decontamination factor of 50. The dose saving is calculated to be 2000 man.mSv.
At Oskarshamn3 a main contribution to the collective dose was the segmentation of internals and loading into special canisters for dry storage.
Barsebäck
Housekeeping and cleaning of pools in the reactor halls was performed for project HINT, segmentation of internals on both units.

65
Forsmark
In 2013, the collective dose for the whole site was the lowest since the start-up of Forsmark 3 in the mid-eighties.
Forsmark 1 and 2 still benefit from very low moisture content in the steam and hence low dose rates in the steam systems. This is mainly due to new steam separators and steam dryers that were installed some years back in preparation for future possible power uprates.
Forsmark 2 started trial operation at 3253 MWth in March 2013. This power increase equals going from 108% of the original power up to 120%.
Unexpectedly high dose rates were encountered in the containment during outage at Forsmark 2. Very high regrowth of surface activity discovered after the 2012 UV-CORD system decontamination of the cooling system for cold shutdown reactor and the reactor water cleanup system.
- New/experimental dose-reduction programmes As part of the SG replacement at Ringhals 4 in 2011 it was decided to perform High Efficiency Ultrasonic Fuel Cleaning (HEUFC) in 2012 as a measure to reduce source term rebuild and to decrease CRE. In 2013 HEUFC was performed on 101 fuel elements.
- Organisational evolutions In cooperation with ISOE (CEPN) an ALARA- benchmarking was prepared for 2014. The basic reason for planning a benchmarking was to evaluate if Ringhals NPP and Forsmark NPP had optimised ALARA programs which had been implemented in the organisation, from the top to the bottom. This included questions as to how small annual individual doses (<1 mSv) are managed. Large numbers of small doses can significantly contribute to the CRE, as the source terms are showing decrease and the ALARA programme is potentially more well developed for larger-dose jobs.
3) Report from Authority
The Swedish Radiation Safety Authority (SSM) continues working with the development of new regulations. The regulations concerning new buildings are expected to be published in 2015.
SSM performed a series of theme-inspections during 2013. The reason for the theme-inspection is to achieve mutual approach and a comparable assessment and the series will involve all the nuclear power facilities in Sweden.
SSM initiated an assessment of the conformity of dosimeters used to measure dose to the lens of the eye at the Swedish nuclear facilities in April 2013. The assessment was to be completed and reported to SSM by the end of January 2014. SSM is currently in process of reviewing the submitted documents.

66
SWITZERLAND
1) Dose information ANNUAL COLLECTIVE DOSE
OPERATING REACTORS Reactor type Number of
reactors Average annual collective dose per unit and reactor type
[man·mSv/unit] PWR 3 351 BWR 2 1112
2) Principal events
- Events influencing dosimetric trends: In NPP Mühleberg two additional short interim outages in 2013 were necessary in order to repair the floating ring seal of circulation pump B, which gave rise respectively to 9 and 7 man·mSv. The design of the ring seals was modified in the last year with a small change to the prior design, causing higher temperatures of the seal water. The annual outage at the plant started on 11 August and stopped on 8 September (656 man·mSv).
The outage in NPP Leibstadt lasted 25 days and caused 797 man·mSv of dose to be accrued. The average dose rate on the circulation loop increased by a factor of 10% related to last year.
The dose rate on the primary cooling loop of NPP Gösgen decreased by a factor of 2 in relation to the rate in 2005, due to the Zn injection chemistry. However, the accumulated collective dose during the outage rose to 602 man·mSv because of the long outage duration (60 days in contrast to fewer days in recent years).
Collective doses in NPP Beznau were 85 man·mSv in unit KKB 1 for a 12-day short outage (fuel replacement) and 220 man·mSv in unit KKB 2 for a 33-day normal outage (predominantly maintenance).

67
UKRAINE
1) Dose information ANNUAL COLLECTIVE DOSE OPERATING REACTORS Reactor type Number of
reactors Average annual collective dose per unit and reactor type [man·mSv/unit]
VVER 15 580

68
UNITED KINGDOM
1) Dose information ANNUAL COLLECTIVE DOSE
OPERATING REACTORS Reactor type Number of
reactors Average annual collective dose per unit and reactor type
[man·mSv/unit] PWR 1 385.442 GCR 15(Note 1) 33.265
REACTORS DEFINITIVELY SHUTDOWN OR IN DECOMMISSIONING Reactor type Number of
reactors Average annual collective dose per unit and reactor type
[man·mSv/unit] GCR 19(Note 2) 57.307
Notes: (1) 14 Advanced Gas-Cooled Reactors and 1 Magnox Reactor. (2) 19 Magnox Reactors.
2) Principal events
The Collective Radiation Doses for the Advanced Gas Cooled Reactors, operated by EDF Energy, were generally low, ranging from 26.9 man·mSv for Torness NPP to 193.9 man·mSv for Heysham 2 NPP. (All UK gas reactor sites have two reactors.) The highest collective radiation doses were recorded by the AGRs performing inspection and repairs inside the Reactor Vessel.
Sizewell B, the only PWR, recorded an annual collective radiation dose of 385.4 man·mSv. The plant carried out its twelfth refuelling outage, with a duration of 48 days, in the Spring of 2013. Around 90% of the annual collective radiation dose was recorded during this refuelling outage.
Of the first generation gas-cooled reactors in the United Kingdom there is now only one Magnox reactor left operating, Wylfa Unit 1. The reactor is currently licensed to operate until September 2014. The majority of the Magnox reactor sites are now completely defueled and are at various stages of decommissioning.
3) Plans for New Nuclear Build
EDF Energy has plans to construct two new nuclear power plants at Hinkley Point and Sizewell, each with two EPRs. The Generic Design Assessment (GDA) for the EPR has been completed by the regulatory body, allowing an outline nuclear site license to be granted to EDF New Nuclear Build. Work continues to develop a site-specific safety case and to complete the detailed design.
Hitachi UK Ltd has acquired the rights to develop new nuclear build at two existing nuclear licensed sites, at Oldbury and Wylfa. GDA for the Hitachi Advanced Boiling Water Reactor design began in 2013.

69
UNITED STATES
1) Dose information ANNUAL COLLECTIVE DOSE
OPERATING REACTORS Reactor type Number of
reactors Average annual collective dose per unit and reactor type
[man·mSv/unit] PWR 65 353.812 BWR 35 1271.97
REACTORS DEFINITIVELY SHUTDOWN OR IN DECOMMISSIONING Reactor type Number of
reactors Average annual collective dose per unit and reactor type
[man·mSv/unit] PWR 7 565.10 / 7 units = 80.728 man.mSv/unit BWR 3 275.32 / 3 units = 91.77 man.mSv/unit FBR 1 0.07 man.mSv/unit * Fermi 1
Summary of USA Occupational Dose Trends in 2013 The USA PWR and BWR occupational dose averages for 2013 reflected a continued emphasis on dose reduction initiatives at the 100 operating commercial reactors: Also, four (4) units transitioned to the decommissioning phase.
Reactor Type Number of Units Total Collective Dose Avg Dose per Reactor PWR 65 22,998.26 man.mSv 0.35 man.Sv/unit BWR 35 44,518.52 man.mSv 1.27 man. Sv/unit The total collective dose for the 100 reactors in 2013 was 67,516.78 person mSv, a decrease of 16% from the 2012 total. The resulting average collective dose per reactor for USA LWR was 675 person mSv/unit. Only two individuals received between 20-30 mSv in 2013 (within the current 50 mSv annual dose limit in the United States).
US PWRs
The total collective dose for US PWRs in 2013 was 22,998 person mSv for 65 operating PWR units. The 2013 average collective dose per reactor was 350 person mSv/PWR units. US PWR units are generally on 18- or 24-month refueling cycles. The US PWR sites that achieved annual site doses of under 100 person mSv in 2013 were:
o Davis Besse 25 man.mSv Waterford 31 man.mSv o Ginna 34 man.mSv Watts Bar 1 26 man.mSv o Seabrook 24 man.mSv
US BWRs
The total collective dose for US BWRs in 2013 was 44,518 man.mSv for 35 operating BWR units. The 2013 average collective dose per reactor was 1.27 person mSv/BWR unit. Most US BWR units are on 24-month refueling cycles. This level of average collective dose is primarily due to power up-rates and water chemistry challenges at some US BWR units in 2013.

70
2) Principal events of the year 2013
a. New plants on line/plants shut down
o Watts Bar 2 is being prepared to commence initial operations in the near future. Southern Company is continuing the construction of two new PWRs at the Vogtle site in Georgia. South Carolina Electric & Gas is constructing two new PWRs on the V.C. Summer site.
o Zion Units 1 and 2 located on Lake Michigan in Northern Illinois started decommissioning in 2010. Energy Solutions is responsible for the decommissioning of the site. Kewaunee, San Onofre 2, 3 and Crystal River transitioned into the decommissioning phase.
b. Unexpected events
o A tornado struck and disabled power lines providing off-site power to Arkansas ONE Unit 1 which required a shutdown of the unit.
c. New/experimental dose-reduction programmes
o US RPMs continue to participate in the CZT detector measurement program initially used at EDF PWR sites.
o Several RPMs are also implementing the H3D CZT detector system developed by the University of Michigan which achieves individual isotopic identification in plant RP surveys.
d. Organisational evolutions
o Exelon Nuclear completed the merger with Constellation Energy, making Calvert Cliffs 1,2, Nine Mile Point 1,2 and Ginna Exelon fleet units.
e. Technical plans for major work in 2013
o Davis Besse replaced steam generators in 2013. PWRs continue to perform MSIP treatments on plant piping to relieve stress.
3) Regulatory plans for major work in 2013
NRC’s Reactor Oversight Program - Regulatory Framework
The U.S. Nuclear Regulatory Commission’s (NRC) regulatory framework for reactor oversight is shown in the diagram below. It is a risk-informed, tiered approach to ensuring plant safety. There are three key strategic performance areas: reactor safety, radiation safety, and safeguards. Within each strategic performance area are cornerstones that reflect the essential safety aspects of facility operation. Satisfactory licensee performance in the cornerstones provides reasonable assurance of safe facility operation and that the NRC's safety mission is being accomplished.
Within this framework, the NRC's operating reactor oversight process provides a means to collect information about licensee performance, assess the information for its safety significance, and provide for appropriate licensee and NRC response. The NRC evaluates plant performance by analyzing two distinct inputs: inspection findings resulting from NRC's inspection program and performance indicators (PIs) reported by the licensees.

71
Occupational Radiation Safety Cornerstone and 2013 Results
Occupational Radiation Safety - The objective of this cornerstone is to ensure adequate protection of worker health and safety from exposure to radiation from radioactive material during routine civilian nuclear reactor operation. This exposure could come from poorly controlled or uncontrolled radiation areas or radioactive material that unnecessarily exposes workers. Licensees can maintain occupational worker protection by meeting applicable regulatory limits and ALARA guidelines.
Inspection Procedures - There are five attachments to the inspection procedure for the occupational radiation safety cornerstone:
IP 71124 Radiation Safety-Public and Occupational IP 71124.01 Radiological Hazard Assessment and Exposure Controls IP 71124.02 Occupational ALARA Planning and Controls IP 71124.03 In-Plant Airborne Radioactivity Control and Mitigation IP 71124.04 Occupational Dose Assessment IP 71124.05 Radiation Monitoring Instrumentation
Occupational Exposure Control Effectiveness
The performance indicator for this cornerstone is the sum of the following: • Technical specification high radiation area occurrences • Very high radiation area occurrences • Unintended exposure occurrences

72
Occupational Radiation Safety
Indicator
Thresholds (White)
Increased Regulatory
Response Band
(Yellow) Required
Regulatory Response Band
(Red) Unacceptable
Performance Band
Occupational Exposure Control
Effectiveness > 2 > 5 N/A
Those units that do not cross the thresholds receive a green finding or no findings. Of the 103 units evaluated in 2013 only one unit in the first quarter received an elevated finding due to findings found in 2012. The latest ROP Performance Indicator Findings can be found at http://www.nrc.gov/NRR/OVERSIGHT/ASSESS/pi_summary.html.
Additional background information can be found on the Detailed ROP Description page at http://www.nrc.gov/reactors/operating/oversight/rop-description.html

73
4. ISOE EXPERIENCE EXCHANGE ACTIVITIES
While ISOE is well known for its occupational exposure data and analyses, the programme’s strength comes from its efforts to share such information broadly amongst its participants. The combination of ISOE symposia, ISOE Network and technical visits provides a means for radiation protection professionals to meet, share information and build links between ISOE regions to develop a global approach to occupational exposure management. This section provides information on the main information and experience exchange activities within ISOE during 2013.
4.1 ISOE ALARA Symposia
ISOE International ALARA Symposium
The 2013 ISOE International ALARA Symposium, organised by the Asian Technical Centre, was held on 27-28 August 2013 in Tokyo, Japan, and attended by an audience of about fifty participants from NEA, the IAEA and eleven countries including Brazil, China, France, Germany, Republic of Korea, Pakistan, Russia, Spain, Sweden, the United States and Japan.
Mr Wataru Mizumachi (ATC) provided the plenary address on countermeasure for severe
accident in some countries' NPP reflecting lessons learned from the Fukushima accident. Dr David W. Miller (NATC) provided lessons learned from the response to the TMI accident and recovery of the accident. Mr Furukawa (Tokyo Electric Power Company) made a presentation entitled "Mid-to-long Term Policy for on-site Decontamination and the performance", in which he introduced the present situation of the Fukushima Daiichi NPP site, the current decontamination activities and mid- and long-term decontamination plan. Moreover, Mr Frazier Bronson (CANBERRA Industries), who was involved in the response to the Fukushima accident from immediately after the accident, provided his experience in the presentation entitled "Radiation Measurement Experiences and Lessons to be learned in Response to the Fukushima NPP Accident."
Distinguished paper was titled Cook Critical RP Survey Program, presented by Mr, Robert Hite,
Cook Nuclear Plant Radiation Protection Manager (American Electric Power). He mentioned the importance of systematic approach to radiation protection program information capture and indicated that the concept is to:
- Identify certain surveys as “critical”, - Schedule the performance of the surveys with logic, - Ensure surveys are completed the same shift, and - Enhance the level and timeliness of supervisory oversight over their conduct and timely
review and approval. The requirements of the critical survey were summarised as follows: - Designated prior to performance to allow time for planning and discussion. - Includes a pre-job brief from RP supervisor to technician performing survey to include
documentation (template), survey instruments and radiations to be measured. - Survey to be completed by technician who has done survey before or briefed by technician or
supervisor who has done it.

74
- Should be reviewed by supervision before work starts. - Should be documented by technician by end of shift. In connection with the symposium, the participants had the opportunity to participate in a
technical visit at Fukushima Dai-ichi NPP.
ISOE Regional ALARA Symposium
North-American Symposium
The 2013 ISOE North-American ALARA Symposium was held 7-9 January 2013 at Fort Lauderdale, United States. The symposium was organised by the NATC and was attended by 135 registered participants from 12 countries. Distinguished papers selected by the participating technical centres included:
- 2012 Calvert Cliffs Unit 1 Pressurizer Heater Replacement Project, P. Jones, Calvert Cliffs NPP, USA.
- DAEC Torus Recoat Project-2012, Robert L. Porter, Duane Arnold NPP, United States
Proceedings and conclusions of the various Symposia are available on the ISOE website.
4.2 The ISOE website (www.isoe-network.net)
The ISOE Network website is a comprehensive information exchange website on dose reduction and ALARA resources for ISOE participants, providing rapid and integrated access to ISOE resources through a simple web browser interface. The network, containing both public and members-only resources, provides participants with access to a broad and growing range of ALARA resources, including ISOE publications, reports and symposia proceedings, web forums for real-time communications amongst participants, members address books, and online access to the ISOE occupational exposure database.
ISOE Occupational Exposure Database
In order to increase user access to the data within ISOE, the ISOE occupational exposure database is accessible to ISOE participants through the ISOE website.
It has been decided to modify reactor statuses of the database. Only three statuses will be kept: two for operational reactors (pre-operational and operational) and one for shutdown reactors (decommissioning). For decommissioning reactors, three phases have been defined: permanently shutdown, safe storage and decommissioning activities.
Since 2005, the database statistical analysis module, known as MADRAS, has been available on the website. Major categories of pre-defined analyses include:
Benchmarking at unit level; Total annual collective dose; Average annual collective dose per reactor; Rolling average annual collective dose per reactor; Average annual collective dose per energy produced; Plant unit rankings; Quartile rankings;

75
Total outage collective dose; Average outage collective dose per reactor; Trends in the number of reactor units; Dose rates; and Miscellaneous queries.
Outputs from these analyses are presented in graphical and tabular format, and can be printed or saved locally by the user for further use or reference. In 2013, nineteen new analyses have been developed on MADRAS.
RP Library
The RP Library, one of the most used website features, provides ISOE members with a comprehensive catalogue of ISOE and ALARA resources to assist radiation protection professionals in the management of occupational exposures. The RP Library includes a broad range of general and technical ISOE publications, reports, presentations and proceedings. The following types of documents are available:
Benchmarking reports, RP Experience reports, RP Management documents, Plant information related documents, Training documents, ISOE 2 questionnaires, ISOE 3 reports, RP Forum syntheses, Source-term management documents, Severe Accident Management documents, Cavity decontamination documents
RP Forum
In addition to the RP Library, registered ISOE users can access the RP Forum to submit a question, comment or other information relating to occupational radiation protection to other users of the website. In addition to a common user group for all members, the forum contains a dedicated regulators group and a common utilities group. All questions and answers entered in the RP Forum are searchable using the website search engine, increasing the potential audience of any entered information.
4.3 ISOE benchmarking visits
To facilitate the direct exchange of radiation protection practice and experience, the ISOE programme supports voluntary site benchmarking visits amongst the Participating Utilities in the four technical centre regions. These visits are organised at the request of a utility with technical centre assistance. The intent of such visits is to identify good radiation protection practices at the host plant in order to share such information directly with the visiting plant. While both the request for and hosting of such visits under ISOE are voluntary on the utilities and the technical centres, post-visit reports are made available to the ISOE members (according to their status as utility or authority member) through the ISOE website in order to facilitate the broader distribution of this information within ISOE. Highlights of visits conducted during 2013 are summarised below.

76
Benchmarking visits organised by ETC
In 2013, three benchmarking visits have been organised by ETC for the French Utility EDF, using ISOE contacts, but no ISOE/ETC resources. The French team was composed of representatives of EDF and one representative of CEPN.
May 2013: Visit to Asco NPP and Vandellos NPP, Spain. The visit took place from 27th to 31st May 2013. The main topics discussed were: - Radiation protection organisation, - Radiation protection indicators, - Contamination management, - Individual dose management, - Reactor cavity decontamination experiences. The synthesis report is available on the ISOE website in the RP Library.
October 2013: Visit to Comanche Peak NPP and Palo Verde NPP, United States.
The visit took place from 14th to 17th October 2013. The main topics discussed were: - Radiation protection organisation, - Individual dose management, - Remote monitoring system, and - Source-term management and chemistry (Zinc injection). The synthesis report is available on the ISOE website in the RP Library.
October 2013: Visit to Stade NPP, Greifswald NPP, Rheinsberg NPP, Germany. This visit took place from 7th to 9th October 2013 and was devoted to decommissioning plants. The main topic discussed was contamination management.
Benchmarking visits organised by NATC
Below given benchmarking visits were conducted by the NATC.
March 2013: Japan ATC benchmarking trip to Fort Calhoun NPP, United States. December 2013: Duke benchmarking Cook NPP for outage dose reduction initiatives at Cook.

77
4.4 ISOE Management
ISOE Management and Programme Activities
As part of the overall operations of the ISOE programme, ongoing technical and management meetings were held throughout 2013, including:
ISOE Meetings Date ISOE Bureau Apr. 2013; Nov. 2013 Working Group on Data Analysis (WGDA) Apr. 2013; Nov. 2013 23rd ISOE Management Board Meeting Nov. 2013 Expert Group on Water Chemistry and Source-Term Management (EGWC) Feb. 2013 Expert Group on Occupational Radiation Protection in Severe Accident Management and Post-Accident Recovery (EG-SAM)
Apr. 2013; Nov. 2013 Aug. (informal meeting)
ISOE Management Board
The ISOE Management Board continued to focus on the management of the ISOE programme, reviewing the progress of the programme at its annual meeting in 2013 and approving the programme of work for 2014. The 2013 mid-year meeting of the ISOE Bureau focused on the status of the ISOE activities for 2013, the status of the renewal of the ISOE Terms and Conditions, planning for the ISOE annual session 2013.
ISOE Working Group on Data Analysis
The Working Group on Data Analysis (WGDA) met in April and November 2013, continuing its focus on the integrity, completeness and timeliness of the ISOE database and options for improving ISOE data collection and analysis, including the implementation of new pre-defined MADRAS queries.
ISOE Expert Group on Water Chemistry and Source-Term Management (EGWC)
The EGWC met once in 2013. The objective of this group is to develop a report on radiation protection aspects of primary water chemistry and source-term management, in order to reflect the current state of knowledge, technology and experience on radiation protection issues directly related with radiation protection. Under the Working Group on Data Analysis (WGDA), the EGWC will undertake a review and analysis of current knowledge, technology and experience, and produce a summary report.
The EGWC will undertake its work by:
• Collecting information and practical experience available in the nuclear industry on addressing operational aspects of primary water chemistry and source-term management of nuclear reactors with special emphasis on effects on the management of occupational exposures,
• Identifying factors and aspects which play key roles in achieving good practices in water chemistry management and analysing and quantifying their impact on worker doses and operational costs.

78
ISOE Expert Group on Occupational Radiation Protection in Severe Accident Management and Post-accident Recovery (EG-SAM)
The EG-SAM met twice in 2013. The objective this group is to develop a report on best radiation protection management procedures for proper radiation protection job coverage during severe accident initial response and recovery efforts to identify good radiation protection practices and to organize and communicate radiation protection lessons learned from previous reactor accidents.
The EG-SAM will undertake its work by:
• Collecting information on dose management of high radiation area workers and practical experience available in the nuclear industry on addressing operational aspects, dosimetry, etc with special emphasis on procedures to the control of occupational exposures,
• Identifying factors and aspects which play key roles in achieving good practices on occupational radiation protection in severe accident management and post-accident recovery (knowledge, experience, technology, regulatory requirements and guidance, worker involvement, information

79
Annex 1
STATUS OF ISOE PARTICIPATION UNDER THE RENEWED ISOE TERMS AND CONDITIONS (2012-2015)
Note: This annex provides the status of ISOE official participation as of December 2013
Officially Participating Utilities: Operating reactors
Country Utility4 Plant name
Republic of Armenia
Armenian Nuclear Power Plant (CJSC) Medzamor 2
Belgium Electrabel (GDF- SUEZ) Doel 1, 2, 3, 4 Tihange 1, 2, 3
Brazil Electrobras Eletronuclear S.A. Angra 1, 2
Bulgaria Kozloduy NPP Plc. Kozloduy 5, 6 Canada Bruce Power Bruce A1, A2, A3, A4 Bruce B5, B6, B7, B8 New Brunswick Electric Power
Commission Point Lepreau
Ontario Power Generation Darlington 1, 2, 3, 4 Pickering 1, 4 Pickering 5, 6,7, 8
China Daya Bay Nuclear Power Operations and Management Co., Ltd.
Daya Bay 1, 2 Ling Ao 1, 2, 3, 4
CNNC Nuclear Power Operations Management Co., Ltd.
Qinshan 1
Czech Republic
CEZ A.S. Dukovany 1, 2, 3, 4 Temelin 1, 2
Finland Fortum Power and Heat Oy Loviisa 1, 2 Teollisuuden Voima Oyj Olkiluoto 1, 2
France Électricité de France (EDF) Belleville 1, 2 Blayais 1, 2, 3, 4 Bugey 2, 3, 4, 5 Cattenom 1, 2, 3, 4 Chinon B1, B2, B3, B4 Chooz B1, B2 Civaux 1, 2 Cruas 1, 2, 3, 4 Dampierre 1, 2, 3, 4 Fessenheim 1, 2
Flamanville 1, 2 Golfech 1, 2 Gravelines 1, 2, 3, 4, 5, 6 Nogent 1, 2 Paluel 1, 2, 3, 4 Penly 1, 2 Saint-Alban 1, 2 Saint Laurent B1, B2 Tricastin 1, 2, 3, 4
Germany E.ON Kernkraft GmbH Brokdorf Grafenrheinfeld
Grohnde Isar 2
EnBW Kernkraft GmbH Philippsburg 2 Neckarwestheim 2 RWE Power AG Emsland Gundremmingen B, C
Hungary Magyar Villamos Muvek Zrt Paks 1, 2, 3, 4
4 Where multiple owners and/or operators are involved, only Leading Undertakings are listed / En cas de plusieurs propriétaires et/ou
exploitants, seuls les principaux sont mentionnés

80
Country Utility4 Plant name
Japan Chubu Electric Power Co., Inc. Hamaoka 3, 4, 5 Chugoku Electric Power Co. Inc. Shimane 1, 2 Hokkaido Electric Power Co. Inc. Tomari 1, 2, 3 Hokuriku Electric Power Co. Shika 1, 2 Japan Atomic Power Co. Tokai 2 Tsuruga 1, 2 Kansai Electric Power Co., Inc. Mihama 1, 2, 3
Ohi 1, 2, 3, 4 Takahama 1, 2, 3, 4
Kyushu Electric Power Co., Inc. Genkai 1, 2, 3, 4 Sendai 1, 2 Shikoku Electric Power Co., Inc. Ikata 1, 2, 3 Tohoku Electric Power Co., Inc. Onagawa 1, 2, 3 Higashidori 1 Tokyo Electric Power Co. Fukushima Daiichi 5, 6
Fukushima Daini 1, 2, 3, 4 Kashiwazaki Kariwa 1, 2, 3, 4, 5, 6, 7
Korea, Republic of
Korean Hydro and Nuclear Power Co. Ltd. (KHNP)
Kori 1, 2, 3, 4 Shin-Kori 1, 2 Ulchin 1, 2, 3, 4, 5, 6
Yonggwang 1, 2, 3, 4, 5, 6 Wolsong 1, 2, 3, 4 Shin-Wolsong 1
Romania Societatea Nationala Nuclearelectrica Cernavoda 1, 2 Slovak Republic
Slovenské Electrárne A.S. Bohunice 3, 4 Mochovce 1, 2
Slovenia Nuklearna Elektrarna Krško Krško 1 South Africa ESKOM Koeberg 1, 2 Spain UNESA Almaraz 1, 2
Asco 1, 2 Cofrentes
Trillo 1 Vandellos 2
Sweden Forsmarks Kraftgrupp AB (FKA) Forsmark 1, 2, 3 OKG Aktiebolag (OKG) Oskarshamn 1, 2, 3 Ringhals AB (RAB) Ringhals 1, 2, 3, 4
Switzerland BKW FMB Energie AG Mühleberg Kernkraftwerk Gösgen-Däniken AG Gösgen Kernkraftwerk Leibstadt AG Leibstadt Axpo AG Beznau 1, 2
Netherlands N.V. EPZ Borssele United Kingdom
EDF Energy Sizewell B
United States
American Electric Power Co. D.C. Cook 1, 2 Arizona Public Service Co. Palo Verde 1, 2, 3 Constellation Energy Nuclear Group (CENG LLC)
Calvert Cliffs 1, 2 Ginna 1
Nine Mile Point 1, 2
Detroit Edison Co. Fermi 2 Exelon Nuclear Corporation Braidwood 1, 2
Byron 1, 2 Clinton 1 Dresden 2, 3 LaSalle County 1, 2
Limerick 1, 2 Oyster Creek 1 Peach Bottom 2, 3 Quad Cities 1, 2 TMI 1
First Energy Nuclear Operating Co. Beaver Valley 1, 2 Davis Besse 1
Perry 1
South Carolina Electric & Gas Co. Virgil C. Summer 1 XCel Energy Monticello Prairie Island 1, 2

81
Officially Participating Utilities: Definitively shutdown reactors
Country Utility Plant name
Bulgaria Kozloduy NPP Plc. Kozloduy 1, 2, 3, 4 France Électricité de France (EDF) Bugey 1
Chinon A1, A2, A3 Chooz A St. Laurent A1, A2
Germany E.ON Kernkraft GmbH Isar 1 Unterweser EnBW Kernkraft GmbH Philippsburg 1 Neckarwestheim 1 RWE Power AG Biblis A, B Vattenfall Europe Nuclear Energy GmbH Brunsbüttel Krümmel Italy SOGIN Spa Caorso
Garigliano Latina Trino
Japan Chubu Electric Power Co., Inc. Hamaoka 1, 2 Japan Atomic Energy Agency Fugen (LWCHWR)
Japan Atomic Power Co. Tokai 1 Tokyo Electric Power Co. Fukushima Daiichi 1, 2, 3, 4, 5, 6 Lithuania Ignalina Nuclear Power Plant Ignalina 1, 2 Spain UNESA Santa Maria de Garona Sweden Barsebäck Kraft AB (BKAB) Barsebäck 1, 2 United States Dominion Generation Kewaunee Exelon Nuclear Corporation Dresden 1
Peach Bottom 1 Zion 1, 2
Participating Regulatory Authorities
Country Authority Bulgaria Bulgarian Nuclear Regulatory Agency (NRA) Canada Canadian Nuclear Safety Commission (CNSC) China Nuclear and Radiation Safety Centre (MEP) Czech Republic State Office for Nuclear Safety (SÚJB) Finland Säteilyturvakeskus (STUK) France Autorité de Sûreté Nucléaire (ASN);
Direction Générale du Travail (DGT) du Ministère de l'emploi, de la cohésion sociale et du logement, represented by l’Institut de Radioprotection et de Sûreté Nucléaire (IRSN)
Germany Bundesministerium für Umwelt, Naturschutz und Reaktorsicherheit (BMU), represented by Gesellschaft für Anlagen- und Reaktorsicherheit (GRS) mbH
Korea, Republic of Korea Institute of Nuclear Safety (KINS) Lithuania State Nuclear Power Safety Inspectorate (VATESI) Netherlands Ministry of Infrastructure and the Environment, Human Environment and Transport
Inspectorate Slovak Republic Public Health Authority of the Slovak Republic Slovenia Ministry of Health, Slovenian Radiation Protection Administration (SRPA) Spain Consejo de Seguridad Nuclear (CSN) – Nuclear Safety Council Sweden Swedish Radiation Safety Authority (SSM) Switzerland Swiss Federal Nuclear Safety Inspectorate (ENSI) United Kingdom The Office for Nuclear Regulation (ONR) United States U.S. Nuclear Regulatory Commission (US NRC)

82
Country – Technical Centre affiliations
Country Technical Centre* Country Technical Centre
Armenia IAEATC Mexico NATC Belgium ETC Netherlands ETC Brazil IAEATC Pakistan IAEATC Bulgaria IAEATC Romania IAEATC Canada NATC Russian Federation ETC China IAEATC Slovak Republic ETC Czech Republic ETC Slovenia ETC Finland ETC South Africa, Rep. of IAEATC France ETC Spain ETC Germany ETC Sweden ETC Hungary ETC Switzerland ETC Italy ETC Ukraine IAEATC Japan ATC United Kingdom ETC Korea, Republic of ATC United States NATC Lithuania IAEATC
* Note: ATC: Asian Technical Centre, IAEATC: IAEA Technical Centre ETC: European Technical Centre, NATC: North American Technical Centre
ISOE Network and Technical Centre information
ISOE Network web portal
ISOE Network www.isoe-network.net
ISOE Technical Centres
European Region (ETC)
Centre d'étude sur l'évaluation de la protection dans le domaine nucléaire (CEPN) Fontenay-aux-Roses, France
www.isoe-network.net
Asian Region (ATC)
Japan Nuclear Energy Safety Organisation (JNES) Tokyo, Japan
www.jnes.go.jp/isoe/english/index.html
IAEA Region (IAEATC)
International Atomic Energy Agency (IAEA), Vienna, Austria Agence Internationale de l'Energie Atomique (AIEA), Vienne, Autriche
www-ns.iaea.org/tech-areas/rw-ppss/isoe-iaea-tech-centre.asp
North American Region (NATC)
University of Illinois Champagne-Urbana, Illinois, U.S.A.
http://hps.ne.uiuc.edu/natcisoe/
Joint Secretariat
NEA (Paris) www.oecd-nea.org/jointproj/isoe.html
IAEA (Vienna) www-ns.iaea.org/tech-areas/rw-ppss/isoe-iaea-tech-centre.asp
International co-operation
• European Commission (EC) • United Nations Scientific Committee on the Effects of Atomic Radiation (UNSCEAR)

83
Annex 2
ISOE BUREAU, SECRETARIAT AND TECHNICAL CENTRES
Bureau of the ISOE Management Board
2009 2010 2011 2012 2013 2014
Chairperson (Utilities)
SIMIONOV, Vasile Cernavoda NPP ROMANIA
ABELA, Gonzague EDF FRANCE
HARRIS, Willie EXELON UNITED STATES
Chairperson Elect (Utilities)
ABELA, Gonzague EDF FRANCE
HARRIS, Willie EXELON UNITED STATES
HWANG, Tae-Won KHNP REPUBLIC OF KOREA
Vice-Chairperson (Authorities)
HOLAHAN, Vincent US Nuclear Regulatory Commission UNITED STATES
DJEFFAL, Salah Canadian Nuclear Safety Commission CANADA BROCK, Terry US Nuclear Regulatory Commission UNITED STATES
JAHN, Swen-Gunnar ENSI SWITZERLAND
Past Chairperson (Utilities)
MIZUMACHI, Wataru Japan Nuclear Energy Safety Organisation JAPAN
SIMIONOV, Vasile Cernavoda NPP ROMANIA
ABELA, Gonzague EDF FRANCE
ISOE Joint Secretariat
OECD Nuclear Energy Agency (NEA)
OKYAR, Halil Burçin OECD Nuclear Energy Agency Radiation Protection and Radioactive Waste Management 12, boulevard des Îles 92130 Issy-les-Moulineaux, France
Tel: +33 1 45 24 10 45 Eml: [email protected]
International Atomic Energy Agency (IAEA)
MA, Jizeng IAEA Technical Centre Radiation Safety and Monitoring Section International Atomic Energy Agency P.O. Box 100, 1400 Vienna, Austria

84
ISOE Technical Centres
Asian Technical Centre (ATC)
HAYASHIDA, Yoshihisa Principal Officer Asian Technical Centre Japan Nuclear Energy Safety Organisation (JNES) TOKYU REIT Toranomon Bldg. 7th Floor 3-17-1 Toranomon, Minato-ku, Tokyo 105-0001, Japan
Tel: +81 3 4511 1801 Eml: [email protected]
European Technical Centre (ETC)
SCHIEBER, Caroline European Technical Centre CEPN 28, rue de la Redoute 92260 Fontenay-aux-Roses, France
Tel: +33 1 55 52 19 39 Eml: [email protected]
IAEA Technical Centre (IAEATC)
MA, Jizeng IAEA Technical Centre Radiation Safety and Monitoring Section International Atomic Energy Agency P.O. Box 100, 1400 Vienna, Austria
Tel: +43 1 2600 26173 Eml: [email protected]
North American Technical Centre (NATC)
MILLER, David W. NATC Regional Co-ordinator North American ALARA Center Radiation Protection Department Cook Nuclear Plant One Cook Place Bridgman, Michigan 49106, USA
Tel: +1 269 465 5901 x 2305 Eml: [email protected]
ISOE Newsletter Editor
BREZNIK, Borut Radiation Protection Superintendent Nuclear Power Plant Krško Vrbina 12 8270 Krško, Slovenia
Tel: +386 7 4802 287 Eml: [email protected]

85
Annex 3
ISOE MANAGEMENT BOARD AND NATIONAL CO-ORDINATORS (2013-2014) Note: ISOE National Co-ordinators identified in bold.
ARMENIA PYUSKYULYAN Konstantin AVETISYAN, Aida
Medzamor 2 NPP Armenian Nuclear Regulatory Authority
BELGIUM LANCE Benoit SCHRAYEN, Virginie
Electrabel Corporate Nuclear Safety Department FANC - Federal Agency for Nuclear Control
BRAZIL do AMARAL, Marcos Antônio GROMANN DE ARAUJO GOES, Alexandre
Angra NPP CNEN - National Nuclear Energy Commission
BULGARIA NIKOLOV, Atanas KATZARSKA, Lidia
Kozloduy NPP Bulgarian Nuclear Regulatory Agency
CANADA MILLER David E.
DJEFFAL, Salah PRITCHARD, Colin
Bruce Power Canadian Nuclear Safety Commission Bruce Power
CHINA YANG Duanjie YONG, Zhang ZHANG, Jintao
Nuclear and Radiation Safety Center (NSC) Qinshan NPP China National Nuclear Corporation
CZECH REPUBLIC FARNIKOVA, Monika FUCHSOVA, Dagmar
Temelin NPP SUJB - State Office for Nuclear Safety
FINLAND KONTIO, Timo RIIHILUOMA, Veli
Loviisa NPP STUK - Centre for Radiation and Nuclear Safety
FRANCE ABELA, Gonzague
BELTRAMI, Laure-Anne CORDIER, Gerard D’ASCENZO, Lucie
GUZMAN LOPEZ-OCON, Olvido LATIL-QUERREC, Névéna SCHIEBER, Caroline
EDF CEPN (ETC) EDF CEPN (ETC) ASN IRSN CEPN (ETC)
GERMANY JENTJENS, Lena STAHL, Thorsten
STEINEL, Dieter
VGB PowerTech e.V. GRS-Gesellschaft für Anlagen-und Reaktorsicherheit mbH Philippsburg NPP
HUNGARY BUJTAS, Tibor
PAKS NPP
ITALY MANCINI, Francesco
SOGIN Spa
JAPAN HAYASHIDA, Yoshihisa KOBAYASHI, Masahide MIZUMACHI, Wataru SUZUKI, Akiko TSUJI, Masatoshi USUI, Haruo
Japan Nuclear Energy Safety Organization (ATC) Japan Nuclear Energy Safety Organization (ATC) Japan Nuclear Energy Safety Organization (ATC) Japan Nuclear Energy Safety Organization (ATC) METI Japan Nuclear Energy Safety Organization (ATC)
KOREA (REPUBLIC OF) KIM Byeong-Soo HWANG, Tea-Won LEE, Hee-hwan
NA, Seong Ho
Korea Institute of Nuclear Safety (KINS) Korea Hydro and Nuclear Power. Co. Ltd Korea Hydro and Nuclear Power. Co. Ltd Korea Institute of Nuclear Safety (KINS)

86
LITHUANIA TUMOSIENE Kristina PLETNIOV, Victor
VATESI - State Nuclear Power Safety Inspectorate Ignalina NPP
MEXICO ARMENTA Socorro
DELGADO, José Luis
Laguna Verde NPP Comisión Nacional de Seguridad Nuclear y Salvaguardias
NETHERLANDS MEIJER, Hans BREAS, Gerard
Borssele NPP Ministry of Infrastructure and the Environment
PAKISTAN NASIM, Bushra
MUBBASHER, Makshoof
Pakistan Nuclear Regulatory Authority Chasnupp NPP
ROMANIA SIMIONOV, Vasile RODNA, Alexandru
Cernavoda NPP National Commission for Nuclear Activities Control
RUSSIAN FEDERATION BEZRUKOV, Boris GLASUNOV, Vadim POTSYAPUN, Nadezhda
Rosenergoatom Concern OJSC VNIIAES - Russian Research Institute for Nuclear Power Plant Operation Federal Medical-Biological Agency
SLOVAK REPUBLIC DOBIS, Lubomir VIKTORY, Dusan
Bohunice NPP Public Health Institute of the Slovak Republic
SLOVENIA BREZNIK, Borut JUG, Nina
Krsko NPP Slovenian Radiation Protection Administration
SOUTH AFRICA (REPUBLIC OF) MAREE, Marc JUTLE, Kasturi
Koeberg NPP Council for Nuclear Safety
SPAIN ROSELL HERRERA, Borja LABARTA, Teresa
Almaraz NPP Consejo de Seguridad Nuclear
SWEDEN SOLSTRAND, Christer
HANSSON, Petra HENNIGOR, Staffan
Oskarshamn NPP Swedish Radiation Safety Authority (SSM) Forsmark NPP
SWITZERLAND TAYLOR Thomas
JAHN, Swen-Gunnar
Mühleberg NPP Swiss Nuclear Safety Inspectorate (ENSI)
UKRAINE BEREZHNAYA Tatyana
RYAZANTSEV, Viktor
Nuclear Energy Generation Company (NNEGC) SNRCU - State Nuclear Regulatory Committee of Ukraine
UNITED KINGDOM RENN, Guy INGHAM, Grant
Sizewell B NPP Office for Nuclear Regulation (ONR)
UNITED STATES OF AMERICA MILLER, David BROCK, Terry
HARRIS, Willie O. JONES, Patricia NOBLE, Douglas
D.C. Cook Plant (NATC) U.S. Nuclear Regulatory Commission Exelon Nuclear Calvert Cliffs NPP Davis Besse NPP

87
Annex 4
ISOE WORKING GROUPS (2013)
Working Group on Data Analysis (WGDA)
Chair: HENNIGOR, Staffan (Sweden); Vice-Chair: HAGEMEYER, Derek (United States)
CANADA DJEFFAL, Salah
Canadian Nuclear Safety Commission
CZECH REPUBLIC FARNIKOVA, Monika
Temelin NPP
FRANCE ABELA, Gonzague BELTRAMI, Laure-Anne D'ASCENZO, Lucie SCHIEBER, Caroline COUASNON, Olivier ROCHER, Alain
EDF CEPN (ETC) CEPN (ETC) CEPN (ETC) ASN EDF
GERMANY BASCHNAGEL, Michael STAHL, Thorsten JENTJENS, Lena STEINEL, Dieter
Biblis NPP Gesellschaft für Anlagen-und Reaktorsicherheit mbH VGB PowerTech Philippsburg NPP
JAPAN HAYASHIDA, Yoshihisa SUZUKI, Akiko
Japan Nuclear Energy Safety Organization (ATC) Japan Nuclear Energy Safety Organization (ATC)
KOREA (REPUBLIC OF) HWANG, Tae-Won JUNG, Kyu-Hwan KIM, Byeong-Soo KONG, Tae Young DONG-HOON, Kim
KHNP Central Research Institute Korea Institute of Nuclear Safety (KINS) Korea Institute of Nuclear Safety (KINS) Korea Hydro and Nuclear Power Corporation Ltd. (KHNP) Korea Hydro and Nuclear Power Corporation Ltd. (KHNP)
MEXICO ARMENTA, Socorro
Laguna Verde NPP
ROMANIA SIMIONOV, Vasile
Cernavoda NPP
RUSSIAN FEDERATION GLASUNOV, Vadim
Russian Research Institute for Nuclear Power Plant Operation (VNIIAES)
SLOVENIA BREZNIK, Borut
Krsko NPP
SPAIN DE LA RUBIA, Miguel Angel
Consejo de Seguridad Nuclear (CSN)
SWEDEN HENNIGOR, Staffan SVEDBERG, Torgny
Forsmark NPP Ringhals NPP
UNITED STATES OF AMERICA BROCK, Terry HAGEMEYER, Derek HARRIS, Willie O. MILLER, David W. PERKINS, David
US Nuclear Regulatory Commission Oak Ridge Associated Universities (ORAU) Exelon Nuclear D.C. Cook Plant (NATC) Electric Power Research Institute (EPRI)
JOINT SECRETARIAT MA, Jizeng OKYAR, Halil Burçind
IAEA NEA
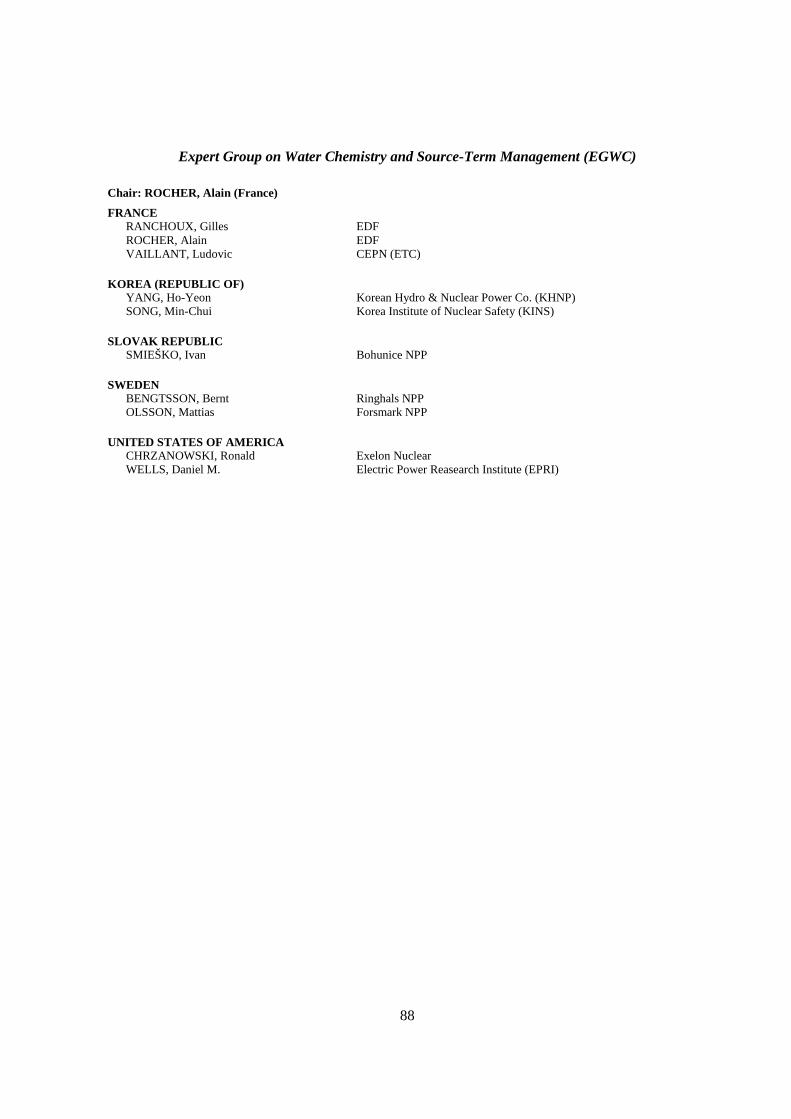
88
Expert Group on Water Chemistry and Source-Term Management (EGWC)
Chair: ROCHER, Alain (France)
FRANCE RANCHOUX, Gilles ROCHER, Alain VAILLANT, Ludovic
EDF EDF CEPN (ETC)
KOREA (REPUBLIC OF) YANG, Ho-Yeon SONG, Min-Chui
Korean Hydro & Nuclear Power Co. (KHNP) Korea Institute of Nuclear Safety (KINS)
SLOVAK REPUBLIC SMIEŠKO, Ivan
Bohunice NPP
SWEDEN BENGTSSON, Bernt OLSSON, Mattias
Ringhals NPP Forsmark NPP
UNITED STATES OF AMERICA CHRZANOWSKI, Ronald WELLS, Daniel M.
Exelon Nuclear Electric Power Reasearch Institute (EPRI)

89
Expert Group on Occupational Radiation Protection in Severe Accident Management & Post-Accident Recovery (EG-SAM)
Chair: ANDERSON, Ellen (United States)
ARMENIA PYUSKYULYAN, Konstantin
Armenian Nuclear Power Plant Company
BELGIUM THOELEN, Els LANCE, Benoit
Electrabel, DOEL NPP Electrabel, Corporate Nuclear Safety Department
BRAZIL DO AMARAL, Marcos Antonio
Eletrobrás Termonuclear S.A.
CANADA DJEFFAL, Salah PRITCHARD, Colin
Canadian Nuclear Safety Commission (CNSC) Bruce Power
CZECH REPUBLIC FUCHSOVA, Dagmar HORT, Milan KOC, Josef
State Office for Nuclear safety (SUJB) State Office for Nuclear safety (SUJB) National Radiation Protection Institute (NRPI)
FINLAND SOVIJARVI, Jukka
Radiation and Nuclear Safety Authority (STUK)
FRANCE ABELA, Gonzague BELTRAMI, Laure-Anne COUASNON, Olivier LECOANET, Olivier SCHIEBER, Caroline
EDF – DIN DQSNR CEPN – ISOE ETC Autorité de sûreté nucléaire (ASN) EDF - DPN / UNIE – GPRE CEPN – ISOE ETC
GERMANY JENTJENS, Lena SCHMIDT, Claudia
VGB PowerTech e.V. GRS
JAPAN HAYASHIDA, Yoshihisa ITOH, Kunio SUZUKI, Akiko USUI, Haruo
JNES – ISOE ATC Japan NUS Co., Ltd. JNES – ISOE ATC JNES – ISOE ATC
KOREA (REPUBLIC OF) KIM, Byeong-Soo KONG, Tae Young
Korea Institute of Nuclear Safety (KINS) KHNP Central Research Institute
ROMANIA SIMIONOV, Vasile
Cernavoda NPP
RUSSIAN FEDERATION GLASUNOV, Vadim
Russian Research Institute for Nuclear Power Plant Operation (VNIIAES)
SLOVAK REPUBLIC GRUBEL, Stefan
Slovenské elektrárne, a.s.
SPAIN ROSELL HERRERA, Borja LABARTA, Teresa
Almaraz NPP Consejo de Seguridad Nuclear (CSN)
SWEDEN FRITIOFF, Karin
Vattenfall Research & Development AB
SWITZERLAND JAHN, Swen-Gunnar WOENKHAUS, Jürgen
Swiss Federal Nuclear Safety Inspectorate (ENSI) Beznau NPP
UKRAINE VITALIEVICH, Zubov Sergei
South Ukraine NPP
UNITED KINGDOM RENN, Guy
Sizewell B NPP

90
UNITED STATES ANDERSON, Ellen BRONSON, Frazier HAGEMEYER, Derek HARRIS, Willie MILLER, David W. TARZIA, James P.
Nuclear Energy Institute (NEI) Canberra Industries Radiation Emergency Assistance Center Training Site (REAC/TS) Exelon Nuclear DC Cook NPP – ISOE NATC Radiation Safety & Control Services Inc.
JOINT SECRETARIAT MA, Jizeng OKYAR, Halil Burçind
IAEA NEA

91
Annex 5
LIST OF ISOE PUBLICATIONS
Reports
- An ALARA Success Story Relying on Strong Individual Commitments, Effective International Feedback and Exchanges, and a Robust Database – 20 Years of Progress, OECD, 2013.
- Occupational Exposures at Nuclear Power Plants: Twenty-Second Annual Report of the ISOE Programme, 2012, OECD, 2012.
- Occupational Exposures at Nuclear Power Plants: Twenty-First Annual Report of the ISOE Programme, 2011, OECD, 2011.
- Occupational Exposures at Nuclear Power Plants: Twentieth Annual Report of the ISOE Programme, 2010, OECD, 2010.
- Occupational Exposures at Nuclear Power Plants: Nineteenth Annual Report of the ISOE Programme, 2009, OECD, 2011.
- L’organisation du travail pour optimiser la radioprotection professionnelle dans les centrales nucléaires, OCDE, 2010.
- Occupational Exposures at Nuclear Power Plants: Eighteenth Annual Report of the ISOE Programme, 2008, OECD, 2010.
- Work Management to Optimise Occupational Radiological Protection at Nuclear Power Plants, OECD, 2009.
- Occupational Exposures at Nuclear Power Plants: Seventeenth Annual Report of the ISOE Programme, 2007, OECD, 2009.
- Occupational Exposures at Nuclear Power Plants: Sixteenth Annual Report of the ISOE Programme, 2006, OECD, 2008.
- Occupational Exposures at Nuclear Power Plants: Fifteenth Annual Report of the ISOE Programme, 2005, OECD, 2007.
- Occupational Exposures at Nuclear Power Plants: Fourteenth Annual Report of the ISOE Programme, 2004, OECD, 2006.
- Occupational Exposures at Nuclear Power Plants: Thirteenth Annual Report of the ISOE Programme, 2003, OECD, 2005.
- Optimisation in Operational Radiation Protection, OECD, 2005. - Occupational Exposures at Nuclear Power Plants: Twelfth Annual Report of the ISOE
Programme, 2002, OECD, 2004. - Occupational Exposure Management at Nuclear Power Plants: Third ISOE European
Workshop, Portoroz, Slovenia, 17-19 April 2002, OECD 2003. - ISOE – Information Leaflet, OECD 2003. - Occupational Exposures at Nuclear Power Plants: Eleventh Annual Report of the ISOE
Programme, 2001, OECD, 2002. - ISOE – Information System on Occupational Exposure, Ten Years of Experience, OECD,
2002. - Occupational Exposures at Nuclear Power Plants: Tenth Annual Report of the ISOE
Programme, 2000, OECD, 2001. - Occupational Exposures at Nuclear Power Plants: Ninth Annual Report of the ISOE
Programme, 1999, OECD, 2000.

92
- Occupational Exposures at Nuclear Power Plants: Eighth Annual Report of the ISOE Programme, 1998, OECD, 1999.
- Occupational Exposures at Nuclear Power Plants: Seventh Annual Report of the ISOE Programme, 1997, OECD, 1999.
- Work Management in the Nuclear Power Industry, OECD, 1997 (also available in Chinese, German, Russian and Spanish).
- ISOE – Sixth Annual Report: Occupational Exposures at Nuclear Power Plants: 1969-1996, OECD, 1998.
- ISOE – Fifth Annual Report: Occupational Exposures at Nuclear Power Plants: 1969-1995, OECD, 1997.
- ISOE – Fourth Annual Report: Occupational Exposures at Nuclear Power Plants: 1969-1994, OECD, 1996.
- ISOE – Third Annual Report: Occupational Exposures at Nuclear Power Plants: 1969-1993, OECD, 1995.
- ISOE – Nuclear Power Plant Occupational Exposures in OECD Countries: 1969-1992, OECD, 1994.
- ISOE – Nuclear Power Plant Occupational Exposures in OECD Countries: 1969-1991, OECD, 1993.
ISOE News
2013 No. 20 (July), No. 21 (December) 2012 No. 19 (July) 2011 No. 17 (September), No. 18 (December) 2010 No. 15 (March), No. 16 (December) 2009 No. 13 (January), No. 14 (July) 2008 No. 12 (October) 2007 No. 10 (July); No. 11 (December) 2006 No. 9 (March) 2005 No. 5 (April); No. 6 (June); No. 7 (October); No. 8 (December) 2004 No. 2 (March); No. 3 (July); No. 4 (December) 2003 No. 1 (December)
ISOE Information Sheets
Asian Technical Centre No. 38: Nov. 2013 Republic of Korea: Summary of National Dosimetric Trends No. 37: Nov. 2013 Japanese Dosimetric Results: FY 2012 data and trends No. 36: Dec. 2012 Japanese Dosimetric Results: FY 2011 data and trends No. 35: Nov. 2011 Japanese Dosimetric Results: FY 2010 data and trends No. 34: Oct. 2009 Republic of Korea: Summary of National Dosimetric Trends No. 33: Oct. 2009 Japanese Dosimetric Results: FY 2008 data and trends No. 32: Jan. 2009 Japanese Dosimetric Results: FY 2007 data and trends No. 31: Nov. 2007 Republic of Korea: Summary of National Dosimetric Trends No. 30: Oct. 2007 Japanese dosimetric results: FY 2006 data and trends

93
No. 29: Nov. 2006 Japanese Dosimetric Results : FY 2005 Data and Trends No. 28: Nov. 2005 Japanese Dosimetric Results : FY 2004 Data and Trends No. 27: Nov. 2004 Achievements and Issues in Radiation Protection in the Republic of Korea No. 26: Nov. 2004 Japanese occupational exposure during periodic inspection at PWRs and
BWRs ended in FY 2003 No. 25: Nov. 2004 Japanese dosimetric results: FY2003 data and trends No. 24: Oct. 2003 Japanese Occupational Exposure of Shroud Replacements No. 23: Oct. 2003 Japanese Occupational Exposure of Steam Generator Replacements No. 22: Oct. 2003 Korea, Republic of; Summary of National Dosimetric Trends No. 21: Oct. 2003 Japanese occupational exposure during periodic inspection at PWRs and
BWRs ended in FY 2002 No. 20: Oct. 2003 Japanese dosimetric results: FY2002 data and trends No. 19: Oct. 2002 Korea, Republic of; Summary of National Dosimetric Trends No. 18: Oct. 2002 Japanese occupational exposure during periodic inspection at PWRs and
BWRs ended in FY 2001 No. 17: Oct. 2002 Japanese dosimetric results: FY2001 data and trends No. 16: Oct. 2001 Japanese occupational exposure during periodical inspection at PWRs and
BWRs ended in FY 2000 No. 15: Oct. 2001 Japanese Dosimetric results: FY 2000 data and trends No. 14: Sept. 2000 Japanese Occupational Exposure During Periodical Inspection at LWRs
Ended in FY 1999 No. 13: Sept. 2000 Japanese Dosimetric Results: FY 1999 Data and Trends No. 12: Oct. 1999 Japanese Occupational Exposure During Periodical Inspection at LWRs
Ended in FY 1998 No. 11: Oct. 1999 Japanese Dosimetric Results: FY 1998 Data and Trends No. 10: Nov. 1999 Experience of 1st Annual Inspection Outage in an ABWR No. 9: Oct. 1999 Replacement of Reactor Internals and Full System Decontamination at a
Japanese BWR No. 8: Oct. 1998 Japanese Occupational Exposure During Periodical Inspection at LWRs
Ended in FY 1997 No. 7: Oct. 1998 Japanese Dosimetric Results: FY 1997 data No. 6: Sept. 1997 Japanese Occupational Exposure during Periodical Inspection at LWRs
ended in FY 1996 No. 5: Sept. 1997 Japanese Dosimetric Results: FY 1996 data No. 4: July 1996 Japanese Occupational Exposure during Periodical Inspection at LWRs
ended in FY 1995 No. 3: July 1996 Japanese Dosimetric Results: FY 1995 data No. 2: Oct. 1995 Japanese Occupational Exposure during Periodical Inspection at LWRs
ended in FY 1994 No. 1: Oct. 1995 Japanese Dosimetric Results: FY 1994 data
European Technical Centre No. 56: Dec. 2012 European dosimetric results for 2011

94
No. 55: Nov. 2012 Man-Sievert Monetary Value Survey (2012 Update) No. 54: Feb. 2012 European dosimetric results for 2010 No. 53: Feb. 2011 European dosimetric results for 2009 No. 52: Apr. 2010 PWR Outage Collective Dose: Analysis per sister unit group for the 2002-
2007 period No. 51: Dec. 2009 European dosimetric results for 2008 No. 50: Sep. 2009 Outage duration and outage collective dose between 1996 – 2006 for VVERs No. 49: Sep. 2009 Outage duration and outage collective dose between 1996 – 2006 for BWRs No. 48: Sep. 2009 Outage duration and outage collective dose between 1996 – 2006 for PWRs No. 47: Feb. 2009 European dosimetric results for 2007 No. 46: Oct. 2007 European dosimetric results for 2006 No. 44: July 2006 Preliminary European dosimetric results for 2005 No. 43: May 2006 Conclusions and recommendations from the Essen Symposium No. 42: Nov. 2005 Self-employed Workers in Europe No. 41: Oct. 2005 Update of the annual outage duration and doses in European reactors (1994-
2004) No. 40: Aug. 2005 Workers internal contamination practices survey No. 39: July 2005 Preliminary European dosimetric results for 2004 No. 38: Nov. 2004 Update of the annual outage duration and doses in European reactors (1993-
2003) No. 37: July 2004 Conclusions and recommendations from the 4th European ISOE workshop
on occupational exposure management at NPPs No. 36: Oct. 2003 Update of the annual outage duration and doses in European reactors (1993-
2002) No. 35: July 2003 Preliminary European dosimetric results for 2002 No. 34: July 2003 Man-Sievert monetary value survey (2002 update) No. 33: March 2003 Update of the annual outage duration and doses in European reactors (1993-
2001) No. 32: Nov. 2002 Conclusions and Recommendations from the 3rd European ISOE Workshop
on Occupational Exposure Management at Nuclear Power Plants No. 31: July 2002 Preliminary European Dosimetric Results for the year 2001 No. 30: April 2002 Occupational exposure and steam generator replacements - update No. 29: April 2002 Implementation of Basic Safety Standards in the regulations of European
countries No. 28: Dec. 2001 Trends in collective doses per job from 1995 to 2000 No. 27: Oct. 2001 Annual outage duration and doses in European reactors No. 26: July 2001 Preliminary European Dosimetric Results for the year 2000 No. 25: June 2000 Conclusions and recommendations from the 2nd EC/ISOE workshop on
occupational exposure management at nuclear power plants No. 24: June 2000 List of BWR and CANDU sister unit groups No. 23: June 2000 Preliminary European Dosimetric Results 1999 No. 22: May 2000 Analysis of the evolution of collective dose related to insulation jobs in some
European PWRs

95
No. 21: May 2000 Investigation on access and dosimetric follow-up rules in NPPs for foreign workers
No. 20: April 1999 Preliminary European Dosimetric Results 1998 No. 19: Oct. 1998 ISOE 3 data base – New ISOE 3 Questionnaires received (since Sept 1998) No. 18: Sept. 1998 The Use of the man-Sievert monetary value in 1997 No. 17: Dec. 1998 Occupational Exposure and Steam Generator Replacements, update No. 16: July 1998 Preliminary European Dosimetric Results for 1997 No. 15: Sept. 1998 PWR collective dose per job 1994-1995-1996 data No. 14: July 1998 PWR collective dose per job 1994-1995-1996 data No. 12: Sept. 1997 Occupational exposure and reactor vessel annealing No. 11: Sept. 1997 Annual individual doses distributions: data available and statistical biases No. 10: June 1997 Preliminary European Dosimetric Results for 1996 No. 9: Dec. 1996 Reactor Vessel Closure Head Replacement No. 7: June 1996 Preliminary European Dosimetric Results for 1995 No. 6: April 1996 Overview of the first three Full System Decontamination No. 4: June 1995 Preliminary European Dosimetric Results for 1994 No. 3: June 1994 First European Dosimetric Results: 1993 data No. 2: May 1994 The influence of reactor age and installed power on collective dose: 1992
data No. 1: April 1994 Occupational Exposure and Steam Generator Replacement
IAEA Technical Centre No. 9: Aug. 2003 Preliminary dosimetric results for 2002 No. 8: Nov. 2002 Conclusions and Recommendations from the 3rd European ISOE Workshop
on Occupational Exposure Management at Nuclear Power Plants No. 7: Oct. 2002 Information on exposure data collected for the year 2001 No. 6: June 2001 Preliminary dosimetric results for 2000 No. 5: Sept. 2000 Preliminary dosimetric results for 1999 No. 4: April 1999 IAEA Workshop on implementation and management of the ALARA
principle in nuclear power plant operations, Vienna 22-23 April 1998 No. 3: April 1999 IAEA technical co-operation projects on improving occupational radiation
protection in nuclear power plants No. 2: April 1999 IAEA Publications on occupational radiation protection No. 1: Oct. 1995 ISOE Expert meeting
North American Technical Centre 2012-13: Sept. 2012 2011 CANDU Occupational Dose Benchmarking Charts 2012-12: July 2012 North American Boiling Water Reactor (BWR)
2008 Occupational Dose Benchmarking Charts 2012-11: July 2012 North American Pressurized Water Reactor (PWR)
2008 Occupational Dose Benchmarking Charts 2012-10: July 2012 North American Boiling Water Reactor (BWR)
2007 Occupational Dose Benchmarking Charts

96
2012-9: July 2012 North American Pressurized Water Reactor (PWR) 2007 Occupational Dose Benchmarking Charts
2012-8: Sept. 2012 North American Boiling Water Reactor (BWR) 2011 Occupational Dose Benchmarking Charts
2012-7: Sept. 2012 North American Pressurized Water Reactor (PWR) 2011 Occupational Dose Benchmarking Charts
2012-6: Sept. 2012 North American Pressurized Water Reactor (PWR) 2011 Occupational Dose Benchmarking Charts
2012-5: July 2012 North American Pressurized Water Reactor (PWR) 2010 Occupational Dose Benchmarking Charts
2012-4: July 2012 North American Boiling Water Reactor (BWR) 2009 Occupational Dose Benchmarking Charts
2012-3: July 2012 North American Pressurized Water Reactor (PWR) 2009 Occupational Dose Benchmarking Charts
2012-2: July 2012 North American Boiling Water Reactor (BWR) 2006 Occupational Dose Benchmarking Charts
2012-1: July 2012 North American Pressurized Water Reactor (PWR) 2006 Occupational Dose Benchmarking Charts
2010-14: June 2010 NATC Analysis of Teledosimetry Data from Multiple PWR Unit Outage CRUD Bursts
2003-8: Aug. 2003 U.S. PWR - Reactor Head Replacement Dose Benchmarking Study 2003-5: July 2003 North American BWR - 2002 Occupational Dose Benchmarking Charts 2003-4: July 2003 U.S. PWR - 2002 Occupational Dose Benchmarking Chart 2003-2: July 2003 3-Year rolling average annual dose comparisons - U.S. BWR 2000-2002
Occupational Dose Benchmarking Charts 2003-1: July 2003 3-Year rolling average annual dose comparisons - U.S. PWR 2000-2002
Occupational Dose Benchmarking Charts 2002-5: July 2002 U.S. BWR - 2001 Occupational Dose Benchmarking Chart 2002-4: July 2002 U.S. PWR - 2001Occupational Dose Benchmarking Chart 2002-2: July 2002 3-Year rolling average annual dose comparisons - U.S. BWR 1999-2001
Occupational Dose Benchmarking Charts 2002-1: Nov. 2002 3-Year rolling average annual dose comparisons - U.S. PWR 1999-2001
Occupational Dose Benchmarking Charts 2001-7: Nov. 2001 US PWR 5-Year Dose Reduction Plan: Donald C. Cook Nuclear Power
Plant 2001-5: Dec. 2001 U.S. BWR - 2000 Occupational Dose Benchmarking Chart 2001-4: Dec. 2001 U.S. PWR - 2000 Occupational Dose Benchmarking Chart 2001-3: Nov. 2001 3-Year rolling average annual dose comparisons - Canada reactors
(CANDU) 1998-2000 Occupational Dose Benchmarking Charts 2001-2: July 2001 3-Year rolling average annual dose comparisons - U.S. BWR 1998-2000
Occupational Dose Benchmarking Charts 2001-1: July 2001 3-Year rolling average annual dose comparisons - U.S. PWR 1998-2000
Occupational Dose Benchmarking Charts

97
ISOE International and Regional Symposia Asian Technical Centre Aug. 2013 (Tokyo, Japan) 2013 ISOE International ALARA Symposium Sept. 2012 (Tokyo, Japan) 2012 ISOE Asian ALARA Symposium Aug. 2010 (Gyeongju, Rep.of Korea) 2010 ISOE Asian ALARA Symposium Sept. 2009 (Aomori, Japan) 2009 ISOE Asian ALARA Symposium Nov. 2008 (Tsuruga, Japan) 2008 ISOE International ALARA Symposium Sept. 2007 (Seoul, Korea) 2007 ISOE Asian Regional ALARA Symposium Oct. 2006 (Yuzawa, Japan) 2006 ISOE Asian Regional ALARA Symposium Nov. 2005 (Hamaoka, Japan) First Asian ALARA Symposium European Technical Centre June 2012 (Prague, Czech Republic) 2012 ISOE European Regional ALARA Symposium Nov. 2010 (Cambridge, UK) 2010 ISOE International ALARA Symposium June 2008 (Turku, Finland) 2008 ISOE European Regional ALARA Symposium March 2006 (Essen, Germany) 2006 ISOE International ALARA Symposium March 2004 (Lyon, France) Fourth ISOE European Workshop on Occupational Exposure
Management at Nuclear Power Plants April 2002 (Portoroz, Slovenia) Third ISOE European Workshop on Occupational Exposure
Management at Nuclear Power Plants April 2000 (Tarragona, Spain) Second EC/ISOE Workshop on Occupational Exposure
Management at Nuclear Power Plants Sept. 1998 (Malmö, Sweden) First EC/ISOE Workshop on Occupational Exposure
Management at Nuclear Power Plants IAEA Technical Centre Oct. 2009 (Vienna, Austria) 2009 ISOE International ALARA Symposium North American Technical Centre Jan. 2013 (Ft. Lauderdale, FL, USA) 2013 ISOE North American ALARA Symposium Jan. 2012 (Ft. Lauderdale, FL, USA) 2012 ISOE International ALARA Symposium Jan. 2011 (Ft. Lauderdale, FL, USA) 2011 ISOE North American ALARA Symposium Jan. 2010 (Ft. Lauderdale, FL, USA) 2010 ISOE North American ALARA Symposium Jan. 2009 (Ft. Lauderdale, FL, USA) 2009 ISOE North American ALARA Symposium Jan. 2008 (Ft. Lauderdale, FL, USA) 2008 ISOE North American ALARA Symposium Jan. 2007 (Ft. Lauderdale, FL, USA) 2007 ISOE International ALARA Symposium Jan. 2006 (Ft. Lauderdale, FL, USA) 2006 ISOE North American ALARA Symposium Jan. 2005 (Ft. Lauderdale, FL, USA) 2005 ISOE International ALARA Symposium Jan. 2004 (Ft. Lauderdale, FL, USA) 2004 North American ALARA Symposium Jan. 2003 (Orlando, FL, USA) 2003 International ALARA Symposium Feb. 2002 (Orlando, FL, USA) North-American National ALARA Symposium Feb. 2001 (Orlando, FL, USA) 2001 International ALARA Symposium Jan. 2000 (Orlando, FL, USA) North-American National ALARA Symposium Jan. 1999 (Orlando, FL, USA) Second International ALARA Symposium March 1997 (Orlando, FL, USA) First International ALARA Symposium