NATIONAL INSTITUTE FOR OCCUPATIONAL HEALTH
33
NATIONAL INSTITUTE FOR OCCUPATIONAL HEALTH Pathology Division Surveillance Report: Demographic Data and Disease Rates for January to December 2007 Ntombizodwa Ndlovu Gill Nelson Tony Davies Jill Murray NIOH Report 14/2008 PO Box 4788 JOHANNESBURG 2000 e-mail: [email protected] http://www.nioh.ac.za/publications/pu blications_pathaut_reports.htm NATIONAL HEALTH LABORATORY SERVICE
-
Upload
khangminh22 -
Category
Documents
-
view
0 -
download
0
Transcript of NATIONAL INSTITUTE FOR OCCUPATIONAL HEALTH

NATIONAL INSTITUTE FOR OCCUPATIONAL HEALTH
Pathology Division Surveillance Report: Demographic Data and Disease Rates for January to December 2007 Ntombizodwa Ndlovu Gill Nelson Tony Davies Jill Murray NIOH Report 14/2008 PO Box 4788 JOHANNESBURG 2000 e-mail: [email protected] http://www.nioh.ac.za/publications/publications_pathaut_reports.htm
NATIONAL HEALTH LABORATORY SERVICE

ACKNOWLEDGEMENTS We thank the following staff members of the NIOH Pathology Department, for their invaluable contribution to the autopsy service: Angeline Zwane Anna Khumalo Avendrin Moodley Estelle Garton Goodman Rani Jemima Cantrell Jim Phillips Johanna Dibedi Joseph Mukhovi Julienne Mthombeni Juliet Buthelezi Patrick Mbhontsi Palesa Mothei Peter Masilo Phyllis Back Rosinah Soko Wilson Mashele Winifred Ramotse
Thanks also to Michelle Kotze (IT Directorate, National Department of Health) for upgrading and maintaining the PATHAUT system. National Institute for Occupational Health, PO Box 4788, Johannesburg, 2000, South Africa ISSN 1812-7681

i
EXECUTIVE SUMMARY
During 2007, 1 724 cases came to autopsy at the NIOH. Of these, 66.4% were black men,
31.3% were white, 1.2% were coloured and 1.2% were submitted without information on
population group.
Overall disease rates (per 1000 autopsies) for 2007 are shown in Figure 1.
FIG.1 OVERALL DISEASE RATES FOR 2007
The overall rate of pulmonary tuberculosis (PTB) in 2007 (274/1000) was higher than that in
2006 (251/1000). The rate in black gold miners increased from 379 per thousand in 2006 to
406 per 1000 in 2007. The rate in black platinum miners increased from 275 per thousand in
2006 to 335 per thousand in 2007.
Over the last few years there has been an overall increase in the prevalence of silicosis.
However, the rate decreased from 237/1000 in 2006 to 229/1000 in 2007.
For the first time, miners have been classified as current and ex-miners. In 2007, 614 cases
(35.6%) were ex-miners, 1017 (59.0%) were current miners and 93 cases (5.4%) could not
be classified.
Massive fibrosis
Mixed dust pneumoconiosis
Coal workers’ pneumoconiosis
274284
229
34 3013 12 3 3
0
50
100
150
200
250
300
Rat
e pe
r 100
0
Mesothelioma
Silicosis
Emphysema
Pulmonary tuberculosis
Primary lung cancer
Asbestosis

ii
Twenty four women came to autopsy in 2007. Two thirds of them had diseases related to
asbestos exposure in mining or in the environment.
The proportion of cases submitted with an incomplete service history (2.7%) was slightly
higher that that in 200 (1.8%).
In recognition of the annual decrease in the numbers of cardio-respiratory organs submitted
for autopsy (Table 2-1), the Pathology Division launched a programme in 2006 to inform
miners and ex-miners of their right to autopsy examination. The division has continued to
engage occupational health units on the mines, mine union representatives, undertakers,
state hospitals and forensic laboratories in some of the provinces of South Africa.
During 2007, four journal articles utilising the PATHAUT data were published and research
findings were presented at a number of fora (see Appendix 2). A PhD based on the
PATHAUT data was registered in 2005 (University of the Witwatersrand) and is on course.

iii
TABLE OF CONTENTS EXECUTIVE SUMMARY i GLOSSARY v SECTION 1: BACKGROUND 1 SECTION 2: DEMOGRAPHIC DATA 2 SECTION 3: ACTIVE TUBERCULOSIS 8 SECTION 4: SILICOSIS 11 SECTION 5: OTHER PNEUMOCONIOSES Massive Fibrosis 13 Coal Workers’ Pneumoconiosis 13 Mixed Dust Pneumoconiosis 13 Asbestosis and pleural plaques 13 SECTION 6: EMPHYSEMA 14 SECTION 7: MESOTHELIOMA 16 SECTION 8: PRIMARY LUNG CANCER 17 SECTION 9: CLINICAL CAUSES OF DEATH 18 SECTION 10: AUTOPSY FINDINGS IN WOMEN 19 LIST OF TABLES Table 2.1 Distribution of autopsies by year and population group (1975-2007) 2 Table 2.2 Number and proportion of autopsies by type and population group (2007) 3 Table 2.3 Number and proportion of autopsies by age and population group (2007) 3 Table 2.4 Number and proportion of autopsies by commodity and population
group (2007) 5 Table 2.5 Number and proportion of autopsies by years of service and population
group (2007) 6 Table 2.6 Mean age by commodity and population group (2007) 7 Table 2.7 Mean duration of service by commodity and population group (2007) 7 Table 3.1 Number of cases and prevalence of active PTB by commodity and
population group (2007) 9 Table 3.2 Number of cases and prevalence of active PTB by age and population
group (2007) 10 Table 4.1 Number of cases and prevalence of silicosis by commodity and population group (2007) 11 Table 4.2 Number of cases and prevalence of silicosis in the gold mining industry, by age and population group (2007) 12 Table 4.3 Number of cases and prevalence of silicosis in the gold mining industry, by years of service and population group (2007) 12 Table 5.1 Number of cases and prevalence of asbestosis by age and population group (2007) 13

iv
Table 6.1 Number of cases and prevalence of emphysema by age and population group (2007) 14 Table 6.2 Number of cases and prevalence of emphysema by commodity and population group (2007) 14 Table 6.3 Number of cases and prevalence of emphysema by years of service and population group (2007) 15 Table 7.1 Number and proportion of mesothelioma cases by age and population group (2007) 16 Table 7.2 Number and proportion of mesothelioma cases by commodity and
population group (2007) 16 Table 8.1 Number of cases and prevalence of primary lung cancer by age and
population group (2007) 17 Table 8.2 Number of cases and prevalence of primary lung cancer by commodity
and population group (2007) 17 Table 9.1 Clinical causes of death by population group (2007) 18 Table 10.1 Number and proportion of autopsies in women by age and
population group (2007) 19 Table 10.2 Number and proportion of autopsies in women by commodity and
population group (2007) 19 Table 10.3 Number and proportion of diseases in women (2007) 20 LIST OF FIGURES Figure 1 Overall disease rates for 2007 i Figure 2.1 Distribution of autopsies by age and population group (2007) 4 Figure 2.2 Distribution of autopsies by commodity and population group (2007) 5 Figure 2.3 Distribution of autopsies by years of service and population group (2007) 6 Figure 3.1 Distribution of active TB by site (2007) 8 Figure 3.2 Active PTB rates in all black miners at autopsy (1975 to 2007) 9 Figure 9.1 Clinical cause of death as given by the clinicians who submit the organs to the NIOH (2007) 18 APPENDICES Appendix 1: Distribution of autopsies according to the last mine where the deceased
worked (2007) 21 Appendix 2: PATHAUT publications and activities (2007) 26

v
GLOSSARY
Asbestosis Lung fibrosis caused by asbestos fibres Coal workers’ Lung fibrosis caused by exposure to coal dust pneumoconiosis Emphysema Lung disease caused by the destruction of the alveolar walls Massive fibrosis Lung fibrosis caused by exposure to dust and measuring more than 1 cm in diameter Mesothelioma A malignant tumour of the pleural cavity of the lungs Miner A person who has worked in a controlled mine or works
Mixed dust Lung fibrosis caused by exposure to multiple dust types pneumoconiosis Prevalence The number of cases in a defined population at a given time
Silicosis Lung fibrosis caused by inhalation of silica dust; detected by the presence of silicotic nodules in the lung tissue
Surveillance The ongoing and systematic collection, analysis and interpretation of
data related to adverse health outcomes
1
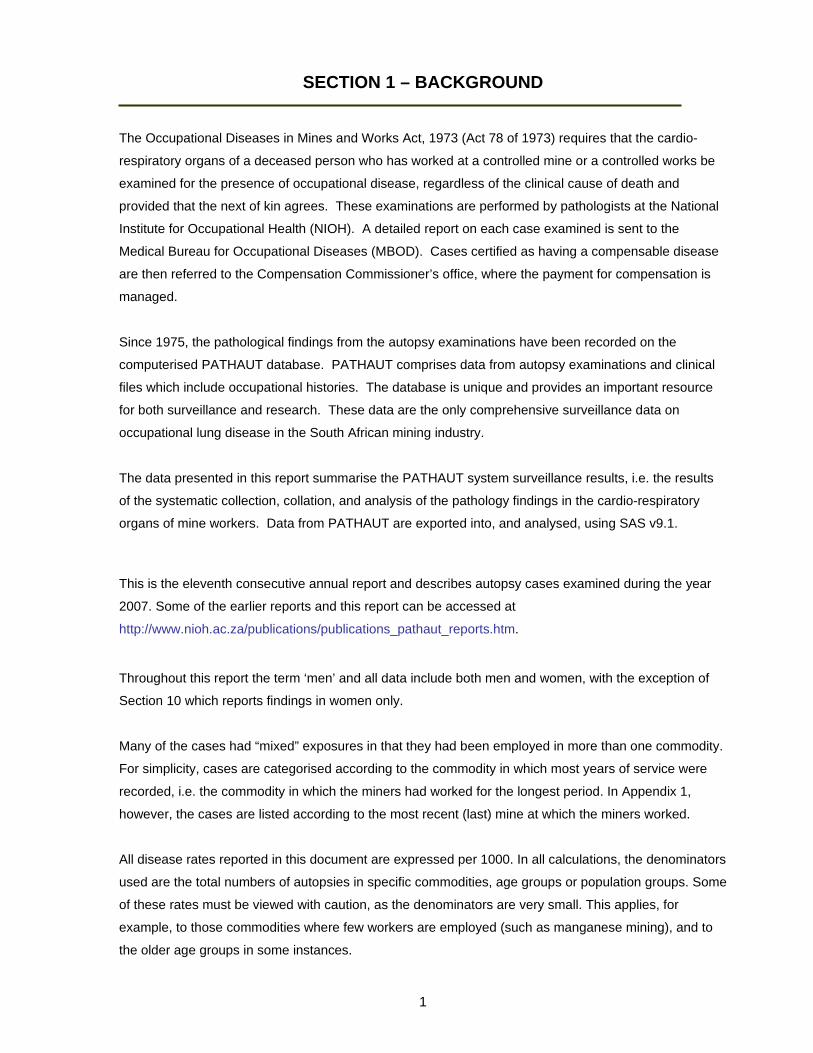
SECTION 1 – BACKGROUND
The Occupational Diseases in Mines and Works Act, 1973 (Act 78 of 1973) requires that the cardio-
respiratory organs of a deceased person who has worked at a controlled mine or a controlled works be
examined for the presence of occupational disease, regardless of the clinical cause of death and
provided that the next of kin agrees. These examinations are performed by pathologists at the National
Institute for Occupational Health (NIOH). A detailed report on each case examined is sent to the
Medical Bureau for Occupational Diseases (MBOD). Cases certified as having a compensable disease
are then referred to the Compensation Commissioner’s office, where the payment for compensation is
managed.
Since 1975, the pathological findings from the autopsy examinations have been recorded on the
computerised PATHAUT database. PATHAUT comprises data from autopsy examinations and clinical
files which include occupational histories. The database is unique and provides an important resource
for both surveillance and research. These data are the only comprehensive surveillance data on
occupational lung disease in the South African mining industry.
The data presented in this report summarise the PATHAUT system surveillance results, i.e. the results
of the systematic collection, collation, and analysis of the pathology findings in the cardio-respiratory
organs of mine workers. Data from PATHAUT are exported into, and analysed, using SAS v9.1.
This is the eleventh consecutive annual report and describes autopsy cases examined during the year
2007. Some of the earlier reports and this report can be accessed at
http://www.nioh.ac.za/publications/publications_pathaut_reports.htm.
Throughout this report the term ‘men’ and all data include both men and women, with the exception of
Section 10 which reports findings in women only.
Many of the cases had “mixed” exposures in that they had been employed in more than one commodity.
For simplicity, cases are categorised according to the commodity in which most years of service were
recorded, i.e. the commodity in which the miners had worked for the longest period. In Appendix 1,
however, the cases are listed according to the most recent (last) mine at which the miners worked.
All disease rates reported in this document are expressed per 1000. In all calculations, the denominators
used are the total numbers of autopsies in specific commodities, age groups or population groups. Some
of these rates must be viewed with caution, as the denominators are very small. This applies, for
example, to those commodities where few workers are employed (such as manganese mining), and to
the older age groups in some instances.

2
SECTION 2 – DEMOGRAPHIC DATA The number of autopsies performed since 1975 is presented in Table 2-1.
TABLE 2-1 DISTRIBUTION OF AUTOPSIES BY YEAR AND POPULATION GROUP (1975 - 2007)
Year of autopsy
Black N %
White N %
Coloured N %
Indian N %
Unknown N %
Total N
1975 1976 1977 1978 1979 1980 1981 1982 1983 1984 1985 1986 1987 1988 1989 1990 1991 1992 1993 1994 1995 1996 1997 1998 1999 2000 2001 2002 2003 2004 2005 2006 2007
2 190 2 335 2 351 2 245 2 118 2 338 2 209 2 312 2 096 1 966 2 275 2 456 2 594 2 518 2 138 2 172 2 143 2 144 1 863 1 737 2 830 2 154 2 223 1 977 1 656 1 798 1 690 1 677 1 536 1 428 1 274 1 165 1 144
71 68 69 67 66 64 66 63 65 64 64 68 68 67 65 64 65 66 65 61 71 67 69 69 65 69 67 67 66 69 68 68
66
854 1 072 1 039 1 090 1 026 1 274 1 117 1 302 1 109 1 098 1 200 1 125 1 168 1 165 1 090 1 155 1 080 1 049 956 1 021 1 062
960 897 836
832 761 813 763 745 596 562 535
539
2831303233353336343634313031333433323336273028293329323032293031 31
32 27 33 32 45 46 33 44 41 28 66 45 78 77 60 51 66 70 65 94 99 56 70 49 29
41 13 50 23 22 22 11
21
11111
1111212222222322221212111
0.6 1.2
1
1 1
12 69 18 17 12 8
13 28 13 8
18 9
20
2.10.60.60.50.30.51.10.60.41.00.5 1.2
3 0763 4343 4233 3673 1893 6583 3593 6583 2463 0923 5413 6263 8403 7603 2883 3783 2893 2632 8842 8524 0033 2393 2082 8802 5292 6082 5292 5182 3182 0551 8761 7201 724
Total 66 752 69 31 891 33 1 539 1.5 3 245 0.2 100 430
It is important to note that a referral bias exists: there is a low autopsy rate for black men who have
left employment at the mines, whereas the majority of white retired miners come to autopsy. The
numbers of miners coming to autopsy has decreased steadily over the years, probably reflecting
the concomitant decrease in the number of miners. In 1994, there were around 344 000 people
employed in the gold mining industry compared to approximately 152 600 in 2007.

3
The pathologists at the NIOH perform two types of autopsy examinations. For men dying distant
from Johannesburg, the cardio-respiratory organs are removed locally, preserved in formalin and
sent to the NIOH. Full autopsies are undertaken on men who die close to Johannesburg.
Table 2-2 shows the distribution of autopsies by population group for 2007. Autopsies of only the
cardio-respiratory organs comprised 96.8% of all examinations.
TABLE 2-2 NUMBER AND PROPORTION OF AUTOPSIES BY TYPE AND POPULATION GROUP (2007)
Autopsy type Black N %
White N %
Coloured N %
Unknown N %
Total N %
Cardiorespiratory organs only Full autopsy
1 142 2
99.8 0.2
485 54
90.010.0
21 0
100 -
20 0
100 -
1 668 56
96.8 3.2
Total 1 144 539 21 20 1 724
The age distribution of autopsies for 2007 is shown in Table 2-3 and Figure 2-1. The mean age at
autopsy of black men was 44.5 years and has remained essentially unchanged for the last 4 years.
The mean age of white men at autopsy decreased from 65.1 years in 2006 to 63.9 years in 2007. TABLE 2-3 NUMBER AND PROPORTION OF AUTOPSIES BY AGE AND
POPULATION GROUP (2007)
Age group Black White Coloured Unknown Total (years) N % N % N % N % N %
20-29 53 4.6 6 1.1 1 4.8 0 - 60 3.530-39 255 22.3 15 2.8 4 19.0 0 - 274 15.940-49 493 43.1 55 10.2 2 9.5 0 - 550 31.950-59 278 24.3 124 23.0 2 9.5 0 - 404 23.460-69 37 3.2 141 26.2 7 33.3 0 - 185 10.770-79 14 1.2 136 25.2 4 19.0 0 - 154 8.980+ 3 0.3 62 11.5 1 4.8 0 - 66 3.8Unknown 11 1.0 0 - 0 - 20 100.0 31 1.8
Total 1 144 539 21 20 1 724

4
FIG 2-1 DISTRIBUTION OF AUTOPSIES BY AGE AND POPULATION GROUP (2007)
Cases were placed in categories according to the commodity in which they had worked for the
longest duration (most exposure). In 2006, a new category called ‘environmental asbestos’
exposure was introduced on the database. Cases with this exposure have been grouped under
‘other’ exposure for analysis and comprise 9 cases in blacks, 2 in whites and 1 in coloureds in
2007. Many men, however, worked in a number of different mining commodities during their
lifetimes and had “mixed” exposures. This was not taken into account in the analysis of exposure
type (commodity).
Table 2-4 and Figure 2-2 show the distributions of autopsies by commodity and population group for
2007. The percentage of autopsies received from the gold mining industry was 66.5%. The
percentage of autopsies from the platinum industry doubled from 8.3% in 1999 to 16% in 2004 and
increased to 18.2% in 2007. As in previous years, the majority of coloured people who came to
autopsy had been exposed to asbestos: 28.6% in the asbestos mines and 14.3% in the
environment.
53
255
493
37
14 36 15
55
124 14
1
136
62
1 4 2 2 7 4 1
278
0
100
200
300
400
500
600
20-29 30-39 40-49 50-59 60-69 70-79 80+
Age group (years)
Num
ber o
f cas
es
Black White Coloured

5
TABLE 2-4 NUMBER AND PROPORTION OF AUTOPSIES BY COMMODITY AND POPULATION GROUP (2007)
Black White Coloured Unknown Total
Commodity N % N % N % N % N % Gold 746 65.2 397 73.7 4 19.0 0 - 1147 66.5Platinum 284 24.8 29 5.4 0 - 0 - 313 18.2Coal 27 2.4 38 7.1 2 9.5 0 - 67 3.9Asbestos 47 4.1 11 2.0 6 28.6 0 - 64 3.7Iscor 3 0.3 13 2.4 1 4.8 0 - 17 1.0Diamond 1 0.1 4 0.7 1 4.8 0 - 6 0.3Copper 3 0.3 3 0.6 3 14.3 0 - 9 0.5Manganese 8 0.7 4 0.7 1 4.8 0 - 13 0.8Industry 2 0.2 6 1.1 0 0.0 0 - 8 0.5Other 17 1.5 13 2.4 3 14.3 0 - 33 1.9Unknown 6 0.5 21 3.9 0 - 20 100.0 47 2.7
Total 1 144 539 21 20 1 724Note: this table shows only those commodities where a total of 6 or more cases were received Black White Coloured
Gold Coal Platinum Asbestos Other* FIG 2-2 DISTRIBUTION OF AUTOPSIES BY COMMODITY AND POPULATION
GROUP (2007) * Includes copper, chrome, diamond, foundry, industry, iron, Iscor, lead, lime, phosphate, quarry,
manganese, steel, railways, Eskom, environmental asbestos, as well as cases where service histories were not obtained.
Detailed information about the years in mining service by population group is presented in Table 2-5
and Figure 2-3. In 2007, the duration of service was obtained for all but 6% of the cases. This
figure is the same as that for 2006.
7.1%
5.4%
2.0%
11.8%
73.7%
9.5%
28.6% 42.9%
19.0%
65.2%
2.4%
24.8%
3.5%
4.1%

6
TABLE 2-5 NUMBER AND PROPORTION OF AUTOPSIES BY YEARS OF SERVICE AND POPULATION GROUP (2007)
Black White Coloured Unknown Total Years of service N % N % N % N % N % <1 40 3.5 3 0.6 2 9.5 0 - 45 2.61-5 165 14.4 29 5.4 2 9.5 0 - 196 11.46-10 158 13.8 56 10.4 5 23.8 0 - 219 12.711-15 181 15.8 63 11.7 4 19.0 0 - 248 14.416-20 244 21.3 85 15.8 2 9.5 0 - 331 19.221-25 200 17.5 81 15.0 2 9.5 0 - 283 16.426-30 89 7.8 73 13.5 0 - 0 - 162 9.431-35 20 1.7 54 10.0 1 4.8 0 - 75 4.436-40 2 0.2 41 7.6 1 4.8 0 - 44 2.641+ 2 0.2 12 2.2 0 - 0 - 14 0.8Unknown 43 3.7 42 7.8 2 9.5 20 100 107 6.2Total 1 144 539 21 20 1 724
Years of service: < 1 1 - 5 6 – 10 11 – 15 16 – 20 21 – 25 26 – 30 31 – 35 36 – 40 41+
FIG 2-3 DISTRIBUTION OF AUTOPSIES BY YEARS OF SERVICE AND POPULATION GROUP (2007)
40
3
165
29
158
56
181
63
244
85
200
8189
73
54
2 2
1220
41
0
50
100
150
200
250
300
Black White
Num
ber
of a
utop
sies

7
The mean age and duration of service by commodity type and population group for those cases for
which information was available are shown in Tables 2-6 and 2-7. TABLE 2-6 MEAN AGE BY COMMODITY AND POPULATION GROUP (2007)
Commodity Black White Mean SD* Mean SD* N
(years) N
(years) Gold 738 44 8 397 64 13 Platinum 283 44 9 29 58 14 Coal 27 46 10 38 64 14 Asbestos 47 61 12 11 68 8 Iscor 3 59 4 13 70 7 Diamond 1 50 - 4 59 13 Copper 3 56 11 3 75 11 Manganese 8 57 8 4 62 13 Industry 2 52 5 6 59 19 Other 17 51 15 13 63 14 Unknown 4 49 9 21 62 19 Total 1 133 45 9 539 64 13
* Standard deviation TABLE 2-7 MEAN DURATION OF SERVICE BY COMMODITY AND POPULATION GROUP (2007)
*Standard deviation
Black White
Mean SD* Mean SD* Commodity N
(years) N
(years) Gold 730 16 8 387 23 10 Platinum 278 14 9 27 17 9 Coal 25 21 10 36 19 10 Asbestos 44 6 6 10 12 11 Iscor 3 11 7 10 18 11 Diamond 1 30 - 4 15 11 Copper 2 22 3 3 20 13 Manganese 7 3 2 4 17 6 Industry 2 20 7 5 23 17 Other 8 9 9 10 18 11 Unknown 1 21 - 1 4 - Total 1 101 15 8 497 21 11

8
SECTION 3 – ACTIVE TUBERCULOSIS The distribution of active tuberculosis (TB) by anatomical site is presented in Figure 3-1 (n=550).
Active pulmonary TB (PTB) was diagnosed in 27.4% (472) of all cases autopsied in 2007,
compared to 16.4% (416) in 2000. Most of the men with PTB were black (89.2%; 421 cases), 9.5%
(45 cases) were white, 0.6% (3 cases) were coloured and in 0.6% (3 cases) the population group
was unknown.
FIG 3-1 DISTRIBUTION OF ACTIVE TB BY SITE (2007)
The overall rate of PTB in 2007 (274/1000) increased from 251/1000 in 2006. The increase in PTB
rates observed in previous years is attributed to the increased rate in black men from 217/1000 in
2000 to 368/1000 in 2007 (Fig 3-2). As indicated previously, cases are assigned to categories
according to the commodity in which the most years of service occurred. In black gold miners, the
rate of PTB increased annually from 171/1000 in 1999 to 406/1000 in 2007. In black platinum
miners the rates increased from 275/1000 in 2006 to 335/1000 in 2007.
2.9%3.1%1.6%
12.6%
23.3%
56.5%
Lungs & nodes (311; 56.6%) Lungs, nodes & pleura (17; 3.1%)
Lungs only (128; 23.3%) Lungs, nodes & pericardium (9; 1.6%)
Nodes only (69; 12.6%) Other combinations (16; 2.9%)

9
0
50
100
150
200
250
300
350
400
1975
1977
1979
1981
1983
1985
1987
1989
1991
1993
1995
1997
1999
2001
2003
2005
2007
Year
PTB
rate
s/10
00
FIG 3-2 ACTIVE PTB RATES IN BLACK MINERS AT AUTOPSY (1975 to 2007)
The distribution of active PTB cases by commodity is shown in Table 3-1. The rates in this and
subsequent tables and figures are expressed per 1000. The majority of active PTB cases (72.7%)
came from the gold mining industry (66.5% of all autopsy cases came from that commodity).
TABLE 3-1 NUMBER OF CASES AND PREVALENCE OF ACTIVE PTB BY COMMODITY AND POPULATION GROUP (2007)
Black White Coloured Unknown Total Commodity N Rate N Rate N Rate N Rate N Rate
Gold 303 406 39 98 1 250 0 - 343 299Platinum 95 335 1 34 0 - 0 - 96 307Coal 3 111 0 - 0 - 0 - 3 45Asbestos 13 277 2 182 1 167 0 - 16 250Iscor 0 1 0 0Copper 1 0 1 0Manganese 2 0 0 0Industry 0 1 0 0
1 2 2 1
Other 2 0 0 0 2 Unknown 2
1
0 3
6
Total 421 368 45 83 3 143 3 150 472 274Note: rates have not been calculated where numbers are small
10
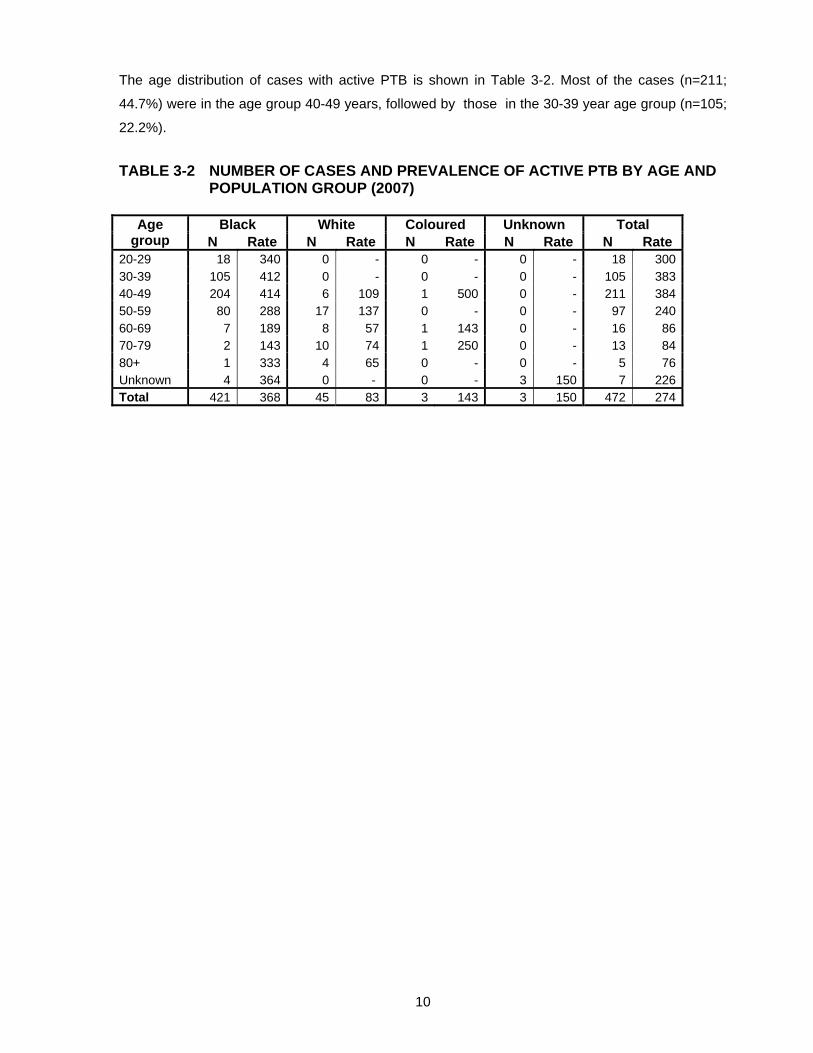
The age distribution of cases with active PTB is shown in Table 3-2. Most of the cases (n=211;
44.7%) were in the age group 40-49 years, followed by those in the 30-39 year age group (n=105;
22.2%).
TABLE 3-2 NUMBER OF CASES AND PREVALENCE OF ACTIVE PTB BY AGE AND POPULATION GROUP (2007)
Black White Coloured Unknown Total Age
group N Rate N Rate N Rate N Rate N Rate20-29 18 340 0 - 0 - 0 - 18 30030-39 105 412 0 - 0 - 0 - 105 38340-49 204 414 6 109 1 500 0 - 211 38450-59 80 288 17 137 0 - 0 - 97 24060-69 7 189 8 57 1 143 0 - 16 8670-79 2 143 10 74 1 250 0 - 13 8480+ 1 333 4 65 0 - 0 - 5 76Unknown 4 364 0 - 0 - 3 150 7 226Total 421 368 45 83 3 143 3 150 472 274
11
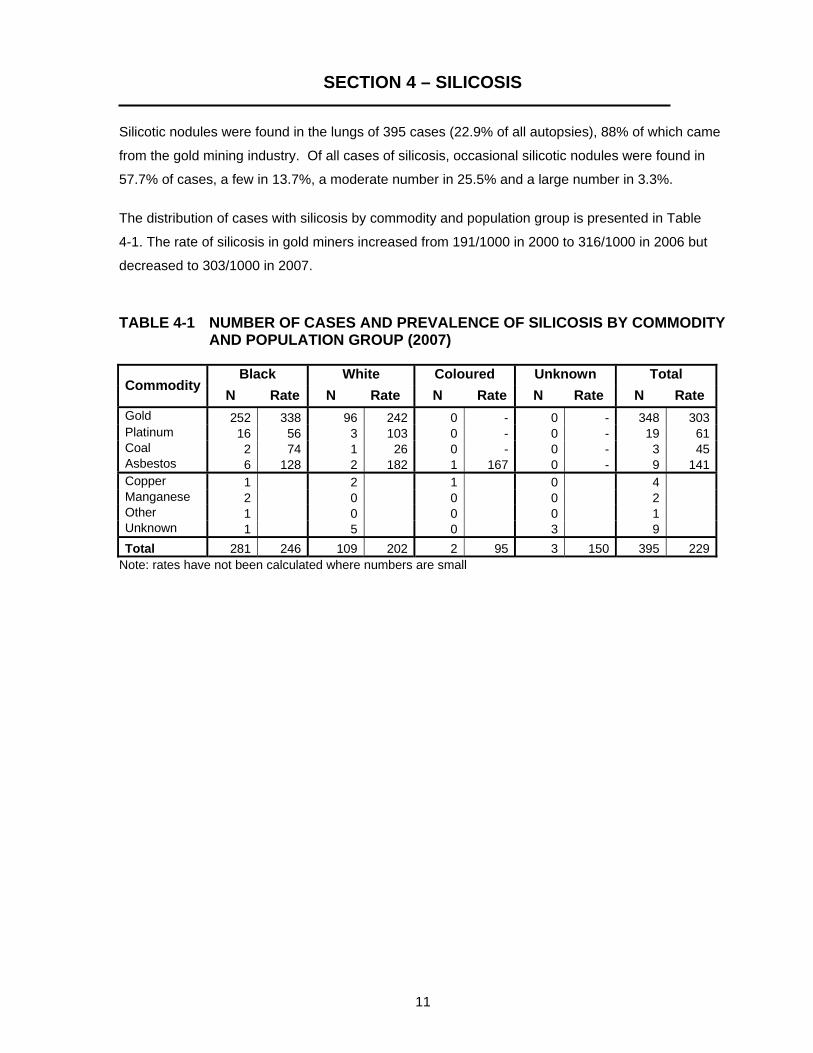
SECTION 4 – SILICOSIS Silicotic nodules were found in the lungs of 395 cases (22.9% of all autopsies), 88% of which came
from the gold mining industry. Of all cases of silicosis, occasional silicotic nodules were found in
57.7% of cases, a few in 13.7%, a moderate number in 25.5% and a large number in 3.3%.
The distribution of cases with silicosis by commodity and population group is presented in Table
4-1. The rate of silicosis in gold miners increased from 191/1000 in 2000 to 316/1000 in 2006 but
decreased to 303/1000 in 2007.
TABLE 4-1 NUMBER OF CASES AND PREVALENCE OF SILICOSIS BY COMMODITY
AND POPULATION GROUP (2007)
Black White Coloured Unknown Total Commodity
N Rate N Rate N Rate N Rate N Rate Gold 252 338 96 242 0 - 0 - 348 303Platinum 16 56 3 103 0 - 0 - 19 61Coal 2 74 1 26 0 - 0 - 3 45Asbestos 6 128 2 182 1 167 0 - 9 141Copper 1 2 1 0 4Manganese 2 0 0 0 2Other 1 0 0 0 1Unknown 1 5 0 3 9Total 281 246 109 202 2 95 3 150 395 229
Note: rates have not been calculated where numbers are small

12
Although the silicosis rates increased with increasing age in both black and white men, the age
distribution of cases with silicosis differed between the two population groups (Table 4-2). Silicosis
was diagnosed in men who were young (<40 years) and in men who were exposed to silica for a
few years (< 10 years) (Table 4-3).
TABLE 4-2 NUMBER OF CASES AND PREVALENCE OF SILICOSIS IN THE GOLD MINING INDUSTRY, BY AGE AND POPULATION GROUP (2007)
Age group Black White Coloured Unknown Total (years) N Rate N Rate N Rate N Rate N Rate
20-29 2 63 0 - 0 - 0 - 2 5630-39 16 95 0 - 0 - 0 - 16 9040-49 145 388 4 103 0 - 0 - 149 36150-59 85 559 18 184 0 - 0 - 103 41260-69 3 273 28 269 0 - 0 - 31 26770-79 0 - 28 286 0 - 0 - 28 28080+ 0 - 18 391 0 - 0 - 18 391Unknown 1 125 0 - 0 - 0 - 1 125Total 252 338 96 242 0 0 348 303
TABLE 4-3 NUMBER OF CASES AND PREVALENCE OF SILICOSIS IN THE GOLD
MINING INDUSTRY, BY YEARS OF SERVICE AND POPULATION GROUP (2007)
Black White Coloured Unknown Total Years of service N Rate N Rate N Rate N Rate N Rate
<1 1 91 0 - 0 - 0 - 1 771-5 12 152 1 63 0 - 0 - 13 1356-10 19 179 3 83 0 - 0 - 22 15511-15 28 203 7 149 0 - 0 - 35 18816-20 76 396 16 239 0 - 0 - 92 35521-25 74 548 15 246 0 - 0 - 89 45426-30 27 529 21 344 0 - 0 - 48 42931-35 11 733 21 412 0 - 0 - 32 47836-40 1 1000 7 189 0 - 0 - 8 21141+ 0 - 2 200 0 - 0 - 2 167Unknown 3 188 3 300 0 - 0 - 6 231Total 252 338 96 242 0 0 348 303

13
SECTION 5 – OTHER PNEUMOCONIOSES MASSIVE FIBROSIS There were 20 (1.1%) cases of massive fibrosis (10 black, 10 white). All were from the gold mining
industry.
COAL WORKERS’ PNEUMOCONIOSIS
There were 5 (0.3%) cases of coal workers’ pneumoconiosis. All were from the coal mining
industry.
MIXED DUST PNEUMOCONIOSIS
There were 5 (0.3%) cases of mixed dust pneumoconiosis. All were from the gold mining industry.
ASBESTOSIS AND PLEURAL PLAQUES
There were 52 cases of asbestosis of which 53.8% (n=28) had slight, 32.7% (n=17) moderate and
13.5% (n=7) marked fibrosis. Forty two (80.8%) of these cases had worked in the asbestos mining
industry at some time in their lives and one (1.9%) had had exposure to asbestos in the
environment. There were 24 cases which had asbestos plaques and of these nine had asbestosis. However, the
parietal pleura (the site where plaque formation usually occurs) is seldom submitted with the lungs.
The distribution of asbestosis by age and population group is shown in Table 5-1. TABLE 5-1 NUMBER OF CASES AND PREVALENCE OF ASBESTOSIS BY AGE
AND POPULATION GROUP (2007)
Black White Coloured Unknown Total Age group (years) N Rate N Rate N Rate N Rate N Rate
40-49 2 4 0 - 0 - 0 - 2 450-59 13 47 2 16 1 500 0 - 16 4060-69 11 297 2 14 4 571 0 - 17 9270-79 8 571 1 7 1 250 0 - 10 6580+ 2 667 1 16 1 1000 0 - 4 61Unknown 0 - 0 - 0 - 3 150 3 97Total 36 31 6 11 7 333 3 150 52 30

14
SECTION 6 – EMPHYSEMA
There were 490 cases of emphysema, the extent of which was mild in 88.6% (n=434), moderate in
9.8% (n=48) and marked in 1.6% (n=8). The overall rate of emphysema was higher (284/100) than
that in 2006 (237/1000). The distribution of emphysema by age and population group is presented
in Table 6-1. TABLE 6-1 NUMBER OF CASES AND PREVALENCE OF EMPHYSEMA BY AGE AND
POPULATION GROUP (2007)
Black White Coloured Unknown Total Age group (years) N Rate N Rate N Rate N Rate N Rate
20-29 2 38 0 - 0 - 0 - 2 3330-39 21 82 0 - 1 250 0 - 22 8040-49 85 172 12 218 1 500 0 - 98 17850-59 84 302 41 331 1 500 0 - 126 31260-69 19 514 72 511 5 714 0 - 96 51970-79 8 571 80 588 4 1000 0 - 92 59780+ 0 - 43 694 1 1000 0 - 44 667Unknown 1 91 0 - 0 - 9 450 10 323Total 220 192 248 460 13 619 9 450 490 284
The majority of black and white men with emphysema were from the gold mining industry (63.9%,
n=313) (Table 6-2).
TABLE 6-2 NUMBER OF CASES AND PREVALENCE OF EMPHYSEMA BY
COMMODITY AND POPULATION GROUP (2007)
Black White Coloured Unknown Total Commodity
N Rate N Rate N Rate N Rate N Rate
Gold 131 176 179 451 3 750 0 - 313 273Platinum 43 151 10 345 0 - 0 - 53 169Coal 12 444 19 500 0 - 0 - 31 463Asbestos 24 511 9 818 3 500 0 - 36 563Diamond 0 0 1 0 1 Copper 0 3 2 0 5 Iscor 3 9 1 0 13 Manganese 3 4 1 0 8 Industry 2 2 0 0 4 Other 0 2 2 0 4 Unknown 2 11 0 9 22
Total 220 192 248 460 13 619 9 450 490 284Note: rates have not been calculated where numbers are small

15
TABLE 6-3 NUMBER OF CASES AND PREVALENCE OF EMPHYSEMA BY YEARS OF SERVICE AND POPULATION GROUP (2007)
Black White Coloured Unknown Total Years of
service N Rate N Rate N Rate N Rate N Rate
<1 5 125 0 - 0 - 0 - 5 111 1 - 5 26 158 13 448 1 500 0 - 40 204 6-10 16 101 26 464 3 600 0 - 45 20511-15 26 144 29 460 4 1000 0 - 59 23816-20 56 230 41 482 1 500 0 - 98 29621-25 53 265 33 407 2 1000 0 - 88 31126-30 23 258 31 425 0 - 0 - 54 33331-35 4 200 29 537 1 1000 0 - 34 45336-40 0 - 20 488 0 - 0 - 20 45541+ 0 - 5 417 0 - 0 - 5 357Unknown 11 256 21 500 1 500 9 450 42 393
Total 220 192 248 460 13 619 9 450 490 284

16
SECTION 7 – MESOTHELIOMA The number of cases of mesothelioma in 2007 (n=22) was similar to 2006 (n=23) but lower than
those in previous years.
TABLE 7-1 NUMBER AND PROPORTION OF MESOTHELIOMA CASES BY AGE AND POPULATION GROUP (2007)
Black White Total Age group (years) N % N % N %
30-39 1 11 0 - 1 5 40-49 1 11 0 - 1 5 50-59 4 44 1 8 5 23 60-69 2 22 5 38 7 32 70-79 0 - 6 46 6 27 80+ 1 11 1 8 2 9
Total 9 13 22 The distribution of mesothelioma by commodity and population group is presented in Table 7.2. Six
(27.3%) of the miners had worked in asbestos mines at some stage in their careers and six (27.3%)
had been exposed to asbestos in the environment.
TABLE 7-2 NUMBER AND PROPORTION OF MESOTHELIOMA CASES BY COMMODITY AND POPULATION GROUP (2007)
Black White Total Commodity N % N % N %
Asbestos 1 11 4 31 5 23 Gold 1 11 3 23 4 18 Platinum 1 11 1 8 2 9 Coal 0 - 1 8 1 5 Copper 1 11 0 - 1 5 Other 5 56 3 23 8 36 Unknown 0 - 1 8 1 5 Total 9 13 22

17
SECTION 8 – PRIMARY LUNG CANCER
Fifty eight cases of primary lung cancer were found at autopsy, 25.9% of which were in black,
62.1% in white, 6.9% in coloured and 5.2% in men whose population group was not known. Most
of the cases were squamous cell lung carcinomas (n = 19; 32.8%), followed by large cell lung
carcinomas (n = 14; 24.1%) and adenocarcinomas (n = 14; 24.1%) and small cell lung carcinomas
(n = 11; 9.0%).
The distribution of primary lung cancer by age and population group is presented in Table 8-1.
TABLE 8-1 NUMBERS OF CASES AND PREVALENCE OF PRIMARY LUNG CANCER
BY AGE AND POPULATION GROUP (2007)
Black White Coloured Unknown Total Age group (years) N Rate N Rate N Rate N Rate N Rate
40-49 6 12 1 18 0 - 0 - 7 1350-59 6 22 6 48 0 - 0 - 12 3060-69 1 27 9 64 2 286 0 - 12 6570-79 2 143 17 125 2 500 0 - 21 13680+ 0 - 3 48 0 - 0 - 3 45Unknown 0 - 0 - 0 - 3 150 3 97
Total 15 13 36 67 4 190 3 150 58 34 The distribution of primary lung cancer by commodity and population group is presented in Table
8-2. The majority of cases came from the gold mining industry.
TABLE 8-2 NUMBER OF CASES AND PREVALENCE OF PRIMARY LUNG CANCER BY COMMODITY AND POPULATION GROUP (2007)
Black White Coloured Unknown Total
Commodity N Rate N Rate N Rate N Rate N Rate
Gold 5 7 25 63 1 250 0 - 31 27Platinum 3 11 1 34 0 - 0 - 4 13Coal 0 - 3 79 0 - 0 - 3 45Asbestos 3 64 0 - 0 - 0 - 3 47Diamond 0 2 0 0 2 Copper 0 0 1 0 1 Iscor 1 0 0 0 1 Manganese 1 2 1 0 4 Industry 1 0 0 0 1 Other 1 2 1 0 4 Unknown 0 1 0 3 4 Total 15 13 36 67 4 190 3 150 58 34

18
SECTION 9 – CLINICAL CAUSES OF DEATH Table 9-1 and Figure 9-1 show the clinical causes of death as stated in the accompanying
documents submitted with the cardio-respiratory organs, by population group. Diseases of the
respiratory system were the most frequent (41.2%) overall. Black men had the highest proportion
of unnatural causes of death (10.8%), similar to that in 2006 (11.3%). In 12.4% of all cases, the
cause of death was not stated.
TABLE 9-1 CLINICAL CAUSES OF DEATH BY POPULATION GROUP (2007)
Black White Coloured Unknown Total System
N % N % N % N % N %
Respiratory 580 50.7 124 23.0 6 28.6 0 - 710 41.2
Cardio-vascular 28 2.4 87 16.1 4 19.0 0 - 119 6.9
Central Nervous System 104 9.1 11 2.0 0 - 0 - 115 6.7
Gastro intestinal 65 5.7 15 2.8 0 - 0 - 80 4.6
Genito urinary 23 2.0 14 2.6 0 - 0 - 37 2.1
Haematological 9 0.8 2 0.4 0 - 0 - 11 0.6
Unnatural 124 10.8 62 11.5 3 14.3 0 - 189 11.0
Miscellaneous 136 11.9 107 19.9 7 33.3 0 - 250 14.5
Not stated 75 6.6 117 21.7 1 4.8 20 100.0 213 12.4
Total 1 144 539 21 20 1 724
FIGURE 9-1 CLINICAL CAUSE OF DEATH AS STATED BY THE CLINICIANS WHO SUBMIT THE ORGANS OF THE DECEASED TO THE NIOH (2007)
12%
16%
23%
3%2%
3%
20%
22%Respiratory
Cardiovascular
CNS
GastrointestinalGenito urinary
Haematological
Unnatural
Miscellaneous
Not stated
Black White
11%
2%
6%
9%2%
51%
1%
12%
7%
19
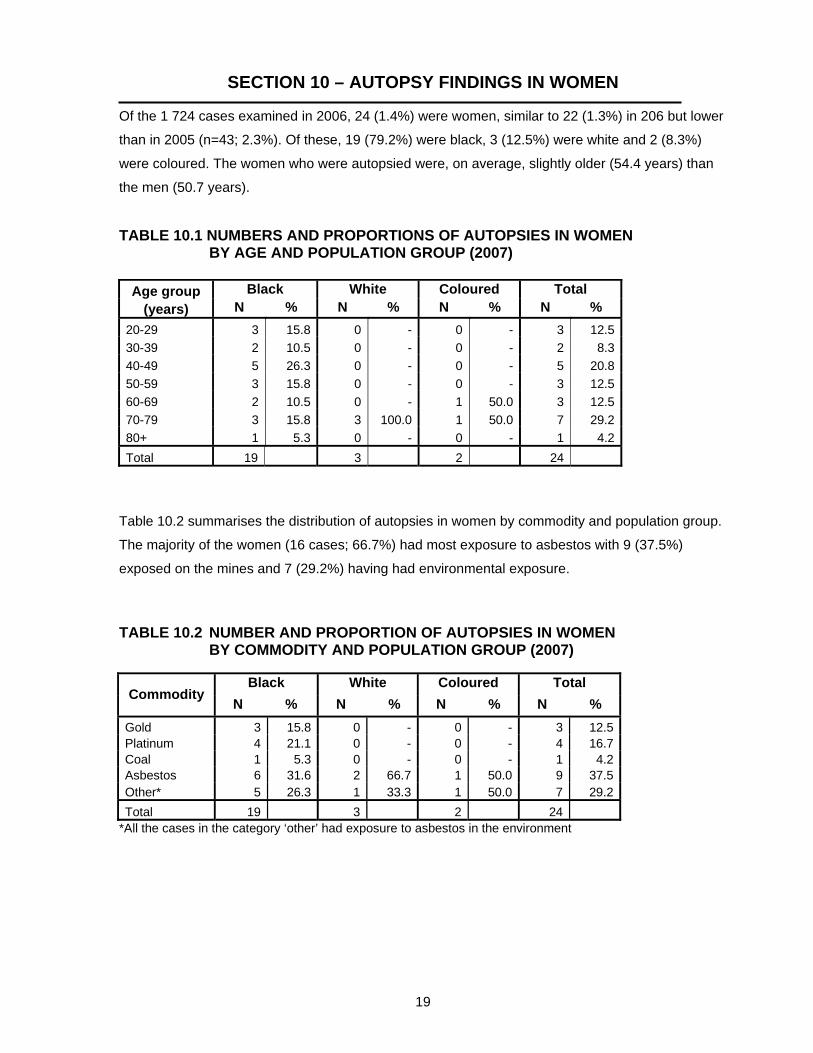
SECTION 10 – AUTOPSY FINDINGS IN WOMEN Of the 1 724 cases examined in 2006, 24 (1.4%) were women, similar to 22 (1.3%) in 206 but lower
than in 2005 (n=43; 2.3%). Of these, 19 (79.2%) were black, 3 (12.5%) were white and 2 (8.3%)
were coloured. The women who were autopsied were, on average, slightly older (54.4 years) than
the men (50.7 years).
TABLE 10.1 NUMBERS AND PROPORTIONS OF AUTOPSIES IN WOMEN BY AGE AND POPULATION GROUP (2007)
Table 10.2 summarises the distribution of autopsies in women by commodity and population group. The majority of the women (16 cases; 66.7%) had most exposure to asbestos with 9 (37.5%)
exposed on the mines and 7 (29.2%) having had environmental exposure.
TABLE 10.2 NUMBER AND PROPORTION OF AUTOPSIES IN WOMEN
BY COMMODITY AND POPULATION GROUP (2007)
Black White Coloured Total Commodity
N % N % N % N % Gold 3 15.8 0 - 0 - 3 12.5 Platinum 4 21.1 0 - 0 - 4 16.7 Coal 1 5.3 0 - 0 - 1 4.2 Asbestos 6 31.6 2 66.7 1 50.0 9 37.5 Other* 5 26.3 1 33.3 1 50.0 7 29.2 Total 19 3 2 24
*All the cases in the category ‘other’ had exposure to asbestos in the environment
Age group Black White Coloured Total (years) N % N % N % N %
20-29 3 15.8 0 - 0 - 3 12.5 30-39 2 10.5 0 - 0 - 2 8.3 40-49 5 26.3 0 - 0 - 5 20.8 50-59 3 15.8 0 - 0 - 3 12.5 60-69 2 10.5 0 - 1 50.0 3 12.5 70-79 3 15.8 3 100.0 1 50.0 7 29.2 80+ 1 5.3 0 - 0 - 1 4.2 Total 19 3 2 24

20
There were 4 cases of asbestosis and 5 of mesothelioma (Table 10.3). None had asbestos
plaques.
TABLE 10.3 NUMBER AND PROPORTION OF DISEASES IN WOMEN (2007)
Disease N %
Mesothelioma 5 20.8Asbestosis 4 16.7Emphysema 5 20.8PTB 5 20.8Silicosis 2 8.3Lung cancer 1 4.2No lung disease 2 8.3Total 24
21
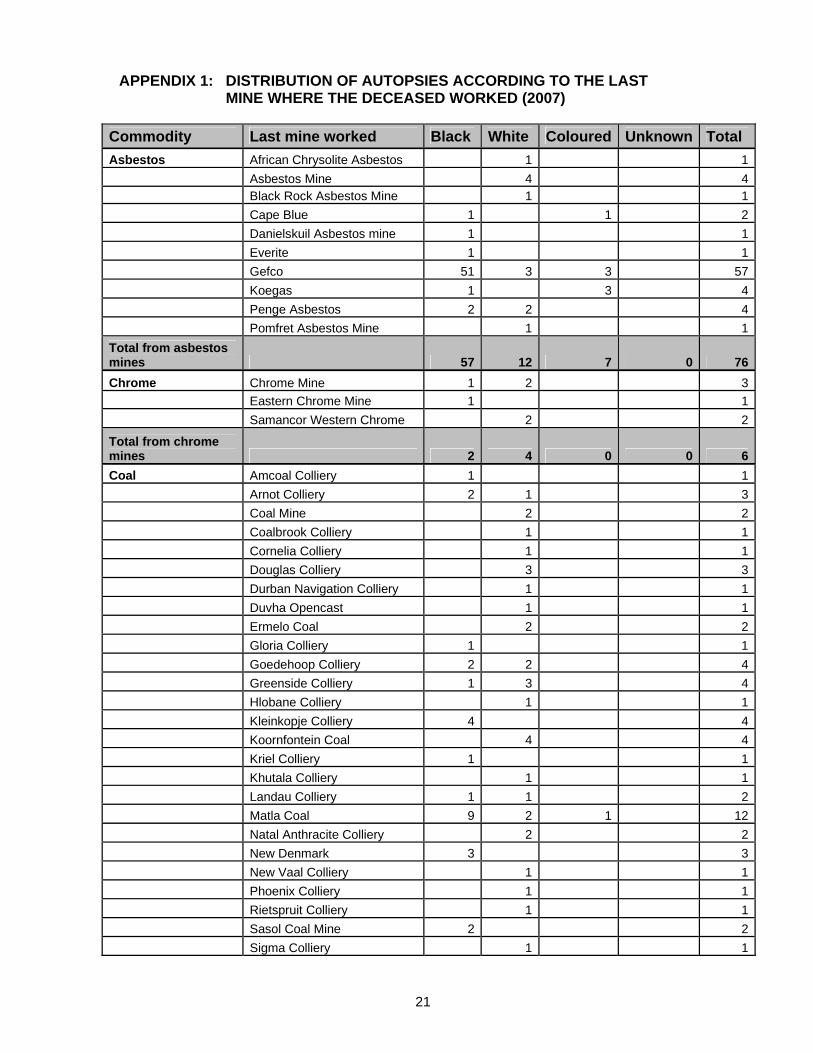
APPENDIX 1: DISTRIBUTION OF AUTOPSIES ACCORDING TO THE LAST MINE WHERE THE DECEASED WORKED (2007)
Commodity Last mine worked Black White Coloured Unknown Total Asbestos African Chrysolite Asbestos 1 1 Asbestos Mine 4 4 Black Rock Asbestos Mine 1 1 Cape Blue 1 1 2 Danielskuil Asbestos mine 1 1 Everite 1 1 Gefco 51 3 3 57 Koegas 1 3 4 Penge Asbestos 2 2 4 Pomfret Asbestos Mine 1 1Total from asbestos mines 57 12 7 0 76Chrome Chrome Mine 1 2 3 Eastern Chrome Mine 1 1 Samancor Western Chrome 2 2
Total from chrome mines 2 4 0 0 6Coal Amcoal Colliery 1 1 Arnot Colliery 2 1 3 Coal Mine 2 2 Coalbrook Colliery 1 1 Cornelia Colliery 1 1 Douglas Colliery 3 3 Durban Navigation Colliery 1 1 Duvha Opencast 1 1 Ermelo Coal 2 2 Gloria Colliery 1 1 Goedehoop Colliery 2 2 4 Greenside Colliery 1 3 4 Hlobane Colliery 1 1 Kleinkopje Colliery 4 4 Koornfontein Coal 4 4 Kriel Colliery 1 1 Khutala Colliery 1 1 Landau Colliery 1 1 2 Matla Coal 9 2 1 12 Natal Anthracite Colliery 2 2 New Denmark 3 3 New Vaal Colliery 1 1 Phoenix Colliery 1 1 Rietspruit Colliery 1 1 Sasol Coal Mine 2 2 Sigma Colliery 1 1

22
Commodity Last mine worked Black White Coloured Unknown Total Coal (continued) Spitzkop 1 1 Springbok Colliery 1 1 Springfield Colliery 2 2 Tselentis Coal Mine 1 1 Tweefontein 1 1 2 Twistdraai 1 1 Usutu Colliery 1 1 Van Dyk’s Drift 1 1 Vierfontein Colliery 1 1 Vryheid Coronation Colliery 2 2 Witbank Collieries 1 1Total from coal mines 28 44 2 0 74Copper Bancroft Copper 2 2 Copper Mine 1 1 O`Kiep Copper 3 3 6 Oamites Copper 1 1 Phalaborwa 1 1Total from copper mines 2 6 3 0 11Diamond Boart Drilling Diamond 2 2 Cullinan Diamond Mine 1 1 De Beers Consolidated 2 2 Diamond Mine 1 1 2Total from diamond mines 1 5 1 0 7
Gold African Rainbow Minerals & Exploration 7 2 9
Anglogold Business Service 1 1
Anglogold Health Service (Free State) 1 1
Anglogold Vaal River Operation 1 1
Bambanani GM 9 2 11 Barberton GM 1 1 2 Beatrix Gold 133 7 140 Blyvoorquizicht 2 9 11 Buffelsfontein Gold 23 23 Cementation 5 1 6 Consolidated Modderfontein 1 1 Crown Mines 1 1 Daggasfontein 2 2 Deelkraal 1 1 Doringkop GM 1 1 Doornfontein 3 3 Driefontein Cons GM 21 2 23 Durban Roodepoort Deep 9 9

23
Commodity Last mine worked Black White Coloured Unknown Total Gold (continued) East Driefontein 3 8 11 East Rand Prop 13 13 Elandsrand 1 6 7 Elsburg GM 4 4 Evander GM 42 1 43 Freddies Gold 20 2 22 Free State Geduld 5 17 1 23 Free State Saaiplaas 1 4 5 Geldenhuys Gold Mine 1 1 Gencor 1 1 Goldfields 1 1 2 Grootvlei Prop 2 8 10 Harmony 125 26 1 152 Hartebeesfontein 14 14 J.I.C. Gold Mine 3 2 5 Joel 2 5 7 Kinross 6 3 9 Kloof 34 13 47 Leeudoorn 1 3 4 Leslie 1 1 Libanon 6 6 Loraine 5 5 Marievale 1 1 Masimong Gold Mine 9 1 10 Middelburg GM 1 1 Oryx 49 1 50 Placer Dome GM 1 1 2 President Brand 2 5 7 President Steyn 10 14 24 Randfontein 65 10 1 76 Robinson Gold Mine 1 1 S A Land 1 1 Sallies 2 2 Savuka GM 2 2 Sheba 1 1 Simmer & Jack GM 25 3 28 South Deep GM 1 1 2 St Helena 12 6 18 Stilfontein 6 6 Sub Nigel 1 1 Tautona GM 1 1 2 Target Gold Mine 1 1 Tshepone GM 2 2 Ubuntu Small Scale GM 1 1 Unisel GM 1 1 Vaal Reefs 112 34 146

24
Commodity Last mine worked Black White Coloured Unknown Total Gold (continued) Ventersport 7 7 Vlakfontein 2 2 Welkom GM 3 3 West Driefontein 1 10 11 West Rand Consolidation 5 5 West Witwatersrand 1 1 Western Areas 1 11 12 Western Deep Levels 3 19 22 Western Holdings 1 5 6 Winkelhaak 4 3 7Total from gold mines 729 368 3 0 1100
Platinum Amadelbult Platinum (Rustenburg) 3 4 7
Barplats Refinery (Platinum) 1 1
Deilmann Haniel SA (Northam) 1 1
Eastern Platinum Mine 1 1 Impala Platinum 161 11 172 Impala Platinum Refinery 2 2 Karee Platinum 1 1 Kroondal Mine, Rustenburg 1 1 2 Lebowa Platinum 7 7 Lonmin Platinum 2 2 Northam Platinum 19 2 21 Rustenburg Platinum 103 21 124 R.U.C. Platinum 1 1 Swartklip Platinum 1 1 Unknown Platinum 2 2 4 Western Platinum 1 1
Total from platinum mines 299 49 0 0 348Manganese Manganese Mine 3 3Aluminium Samrec Annesley Mine 1 1Iron Beeshoek 1 1Iron & Manganese Associated Manganese 1 1 2 S A Manganese 1 1 2Lead & Minerals Blackmountain 1 1 2Lime Union Lime 1 1Quarries Quarry Mine 1 1Refinery Rand Refinery 1 3 4Sinkers Shaft Sinkers 2 1 3Steel & Vanadium Highveld 1 1Steel & Iron Iscor 13 1 14Zinc Maranda Mine 1 1 Zinc Corporation 1 1

25
Commodity Last mine worked Black White Coloured Unknown Total Non-Miner Environmental asbestos 8 2 1 11 Eskom 1 1 Industry 5 5 Non-miner 1 1 2 Spoornet 1 1Unknown Unknown 6 19 20 45
TOTAL 1 144 539 21 20 1 724

26
APPENDIX 2: PUBLICATIONS AND ACTIVITIES EMANATING FROM PATHAUT DATA (2007)
Journal articles Published: Honma K, Murray J, Nelson G. Intrapulmonary lymph nodes in South African miners - an autopsy survey. Am J Ind Med 2007; 50:261-264. Rees D, Murray J. Silica, silicosis and tuberculosis. Int J Tuberc Lung Dis 2007; 11: 474-84. White N, Nelson G, Murray J. South African experience with asbestos related environmental mesothelioma: Is asbestos fiber type important? Regul Toxicol Pharmacol 2007, doi:10.1016/j.yrtph.2007.09.013 Wong ML, Back P, Candy G, Nelson G, Murray J. Cryptococcal pneumonia in African miners at autopsy. Submitted to Int J Tuberc Lung Dis 2007; 11: 528-33. Reports Ndlovu N, Murray J, Candy G, Nelson G. Pathology Division Report: Demographic data and disease rates for January-December 2006. NIOH report 2/2007 ISSN 1812 - 7681. National Institute for Occupational Health, National Health Laboratory Service, South Africa, 2007 Congresses Murray J, Sonnenberg P, Nelson G, Bester A, Shearer S, Glynn JR. Cause of death and respiratory disease at autopsy by duration of HIV infection in goldminers, South Africa. 38th Union World Conference on Lung Health, 8-12 November 2007, Cape Town, South Africa Nelson G, Respiratory health risks of miners due to exposure to associated minerals in South Africa. Environmin 2007 Conference, 22-26 July 2007, Bakgatla, Pilanesberg Ndlovu N, Mining a Database, Webster Memorial Day, 22 November 2007, NIOH, Johannesburg Ndlovu N, Ramotse W, Ex-miners outreach campaign, Research Forum, 31 May 2007, NIOH, Johannesburg Higher degrees Gill Nelson, PhD, Occupational respiratory diseases: rates, trends and risks in platinum and diamond miners coming to autopsy from 1975 to 2004. Started 2005. School of Public Health, University of the Witwatersrand