
December 2014 - Homi Bhabha National Institute
253
INVESTIGATIONS INTO THE MECHANISMS OF NANOPARTICLE SYNTHESIS VIA BIOLOGICAL ROUTES AND THEIR APPLICATIONS By POULOMI MUKHERJEE LIFE01200904004 A thesis submitted to the Board of Studies in Life Sciences In partial fulfilment of requirements For the Degree of DOCTOR OF PHILOSOPHY of HOMI BHABHA NATIONAL INSTITUTE December 2014
-
Upload
khangminh22 -
Category
Documents
-
view
2 -
download
0
Transcript of December 2014 - Homi Bhabha National Institute

INVESTIGATIONS INTO THE MECHANISMS OF NANOPARTICLE SYNTHESIS VIA BIOLOGICAL
ROUTES AND THEIR APPLICATIONS
By
POULOMI MUKHERJEE
LIFE01200904004
A thesis submitted to the
Board of Studies in Life Sciences
In partial fulfilment of requirements
For the Degree of
DOCTOR OF PHILOSOPHY
of
HOMI BHABHA NATIONAL INSTITUTE
December 2014
user
Stamp


Page | i
STATEMENT BY AUTHOR This dissertation has been submitted in partial fulfillment of requirements for an advanced degree at Homi Bhabha National Institute (HBNI) and is deposited in the Library to be made available to borrowers under rules of the HBNI.
Brief quotations from this dissertation are allowable without special permission, provided that accurate acknowledgement of source is made. Requests for permission for extended quotation from or reproduction of this manuscript in whole or in part may be granted by the Competent Authority of HBNI when in his or her judgment the proposed use of the material is in the interests of scholarship. In all other instances, however, permission must be obtained from the author.
Poulomi Mukherjee

Page | ii
DECLARATION
I, hereby declare that the investigation presented in the thesis has been carried out by me. The work is original and has not been submitted earlier as a whole or in part for a degree / diploma at this or any other Institution / University.
Poulomi Mukherjee

Page | iii
List of publications Journal Publications 1. Evolution of Morphology from Nano-Spheres to Triangular nanoprisms; P. Mukherjee, Mainak Roy, B. P. Mandal, Sipra choudhury, R. Tewari, A. K. Tyagi and S. P. Kale; Journal of Colloids and Interface Science 2012 Feb 1;367(1):148-52 2. Biomimetic synthesis of nanocrystalline silver sol using cysteine: stability aspects and antibacterial activities. Mainak Roy, Poulomi Mukherjee, Balaji P Mandal, Rajendra K. Sharma, Avesh K. Tyagi and Sharad P. Kale. RSC Advances, 2, 2012, 6496-6503 Conference Publications 1. Synthesis of Palladium and Platinum Nanoparticles; Encapsulation of Silver Nanorods in
MWCNT: A Novel Fungal Method; Poulomi Mukherjee, Mainak Roy, Balaji P Mandal, A. P. Srivastava, A. K. Tyagi and S. P. Kale; Advances in Electron Microscopy and Related Techniques (EMSI-2010) held at BARC between March 8-10, 2010
2. Green synthesis of nanocrystalline silver sol using cysteine and AgNO3: Stability aspects; Poulomi Mukherjee, Mainak Roy, Balaji P Mandal, Sipra Choudhury, A. K. Tyagi and S. P. Kale;International Conference on Nano Science and Technology (ICONSAT 2010) held at IIT Mumbai between Feb.17-20, 2010
3. Fungus mediated room temperature decoration of carbon nanotubes with silver nanoparticle: Effect of CNT functionalisation and antimicrobial implications. M. Roy, P. Mukherjee, A.K. Tyagi and S. P Kale In 7th biennial National Symposium and Conference on Solid State Chemistry and Allied areas. ISCAS-2011, Nov 24-26. PP10, pp. 72.

Page | iv
4. Bioinspired synthesis of Pd impregnated Nc-TiO2 for efficient Photocatalytic splitting of water. P Mukherjee, M. Roy, A. Banerjee, M. Pai, S. Ehrmann, C. Y. Chiang, A. K. Tyagi, S. R. Bhardwaj & S. P. Kale. Indo Japan Conference on Catalysis: A green Chemistry Approach. UICT-Mumbai. Feb- 2013. pp. 14.
Poulomi Mukherjee

Page | v
Dedicated
To my family

Page | vi
ACKNOWLEDGEMENTS
A student’s dissertation neither has a beginning, nor will ever be completed without a committed and astute mentor. My research guide Dr. S.P. Kale leads by example in setting very high standards of passion and commitment to work. My guide always allowed me the freedom to learn from my mistakes rather than discouraging me from exploring uncharted territories while gently guiding me towards progress.
I earnestly acknowledge the crucial assistance from various scientific officers and technical staff of my section. Particularly, Dr. P.K. Mukherjee, Dr. Ramchandran, Dr S. B. Ghosh, Dr. Manoj Srivastava, Dr. Sayaji Mehetre, Dr. Sonia Chaddha, Mrs. Darshana Salaskar, Mr Pramod Sherkhane, Mr. P.S. Tipre and Mr. A.D. Chavan who have actively cooperated with me in their own niches of activity. I am also appreciative of my ex-colleagues Dr Shubhda Nayak and Dr Geeta who have been a constant source of help at the beginning of my work.During the endeavour of pursuing interdisciplinary research guidance and technical support from researchers in varied fields is absolutely indispensable. I thank my organization, Bhabha Atomic Research Centre for nurturing an environment where experts in every field of science and technology are available.
Though my collaborators are internationally recognized in their own fields, they have been extremely encouraging while guiding me through the nitty gritties of experiments, analysis and documentation. In particular Dr Mainak Roy, Dr A. K. Tyagi, Dr Balaji P. Mandal, Dr G. K. Dey, Dr. R. Tewari, Dr Shipra Chaudhuri, Dr. Shilpa Sawant, Dr. Rajib Ganguly, Dr Soumya Adhikari, Dr Gautam Ghose, Dr R. K. Singhal, Mr. Krishna Kant, Dr Alka Gupta, Mr K. K. Pandey, Dr Atindra M. Banerjee, Dr Mrinal Pai, Dr Dibakar Goswami, Dr. Amit

Page | vii
Prakash Srivastava and Mr Parimal Kulkarni. Through the course of work they have forged long-lasting professional relationships.
While poets write their best poems in times of personal or social crisis, research students need support from home front to unfold their creative abilities. My first words of gratitude I therefore address to my parents, my sister my late brother in law and my nephew who never failed to keep up my morale. I thank my husband for bearing with all the late hours at work, supporting me at the home front as well as offering a helping hand wherever I was stuck. This thesis in true sense embodies their selfless love and affection for me.
Colleagues of Nuclear Agriculture and Biotechnology Division and Bioscience Group who require special mention here are Dr B. K. Das, Dr Upendra Shekhawat, Dr. S. G. Bhagwat, Dr Suprasanna, Dr J. S. Melo, Dr Bhakti Basu, Dr Bhavani Shankar, Dr Deepak Sharma, Dr Anu Ghosh, Mr Shyam Sunder and Mrs Chitra Seetharam.
Last but not the least I thank all those who posed challenges in the scientific front which in hindsight only culminated in personal and professional growth. My spiritual Gurus Lord Ramkrishna, Shubhasji and Shailaji have gone a long way in shaping my character and every activity of life. Gratitude to them and The Almighty for bestowing this wonderful opportunity of pursuing doctoral research
Poulomi Mukherjee

Page | viii
1. Name of the Student: Poulomi Mukherjee 2. Name of the Constituent Institution: B.A.R.C 3. Enrolment No.: LIFE01200904004
4. Title of the Thesis: Investigations Into The Mechanisms Of
Nanoparticle Synthesis Via Biological Routes And Their Applications
5. Board of Studies: Life sciences
Synopsis
Inorganic materials form an integral part of biological systems and exhibit hierarchical ordering from nanoscale to macroscopic levels1 2. These are mainly composites of bio-macro molecules and minerals which are vital for structural, physiological and mechanical functions. Teeth, shells and bones of multicellular organisms are formed by the process of bio-mineralization. Siliceous materials contribute in radiolarians to structural development. Magnetosomes in magnetotactic bacteria play a vital role in cell architecture. These materials are produced by biological systems in required sizes and shapes by the genetic machinery of living systems. Hence biological systems are aptly called as living nano-factories. With evolution across geological time scales, biological systems have firmed up the best processes for synthesis of variety of inorganic biomaterials ranging from nano to macro scales.

Page | ix
Nanotechnology research thus has multi-disciplinary facets and it is not surprising to note that it draws inspiration through biomimetic and biological synthesis of materials at the nano levels. Soil micro-organisms affect their immediate environment by continuously modifying soil particles through weathering of soil, formation of new minerals, soil aggregation, biodegradation of organic particles and forming organo-mineral associations. They have also developed various strategies to respond to stress from pollutants through processes like biosorption, bioprecipitation, transport across membranes, complexation and oxidation reduction reactions3. Hence, the recent interest in nanoscience to harness micro-organisms to synthesize nanomaterials might have significant potential for future technologies. The earliest report on accumulation of inorganic nanomaterials was about gold in Precambrian algal blooms4. Later on different bacteria were exploited for intra cellular synthesis of metallic nanoparticles5 and sulphides6. Since this would require additional treatments for extraction of nanoparticles, extracellular synthesis was initiated. Fungi produce several enzymes and metabolites on a large scale. Hence they were an obvious choice for our studies. While most of the earlier reports in fungal synthesis of nanoparticles were based on potential plant7 or human pathogens8, we initiated an approach to screen agriculturally important organisms for nanoparticle synthesis. The objectives were: Screening and identification of agriculturally important fungi for synthesis of metal nanoparticles, alloys and composites; characterisation of nanoparticles; studying possible mechanism of synthesis; applications of nanoparticles in catalysis, heat conduction, and as antibacterial agents; testing reusability of remnant biomass.
Chapter 1. Introduction
The first chapter of this thesis introduces terminologies used in nanotechnology, and also gives a brief description on the classification of nanomaterials and their stabilisation.

Page | x
Chemical methods provide great versatility in controlling the size, shape and morphology together with possibilities of scale up. However, the environmental implications of such scale up involve large volumes of high boiling solvents, boron hydrides, detergents etc. We therefore decided to follow a biological route for this purpose. The over view of nanoparticle synthesis by microorganisms, fungi and plants have been discussed with reference to mechanisms wherever these have been elucidated.
Chapter 2. Materials and Methods
The second chapter consists of the materials and methods which have been employed during the work of this thesis. The first part deals with screening of agriculturally important fungi for nanoparticle synthesis and is followed by its molecular identification. General method used for extracellular cell free filtrate protocol for synthesizing nanoparticles by filamentous fungi has also been explained. Screening of fungi for nanoparticle synthesis has been carried out through UV visible spectrophotometric measurements. Molecular identification consisted of the steps of DNA extraction, PCR amplification, cloning of the amplified fragment in T/A cloning vector and sequencing with flanking M13 primers. The next part consists of synthesis of silver, gold, platinum, palladium and silver-gold composite nanoparticles. General techniques followed throughout this thesis for characterisation of the identity and morphology of the nanoparticles are: UV visible spectrophotometry, X-ray diffraction, transmission electron microscopy (TEM), dynamic Light scattering (DLS), atomic force microscopy for surface roughness measurements, scanning electron microscopy (SEM) and energy dispersive spectroscopy (EDS). Surface interactions of capping agents with the nanoparticles were probed by FT-IR and Raman spectroscopy. The antibacterial activity of cysteine capped silver nanoparticles, silver nanoparticles produced by biological route and silver-carbon nanotube hybrid was carried out in liquid media in nutrient broth using model

Page | xi
organism Escherichia coli. MIC (minimum inhibitory concentration) and MBC (minimum bactericidal concentration) were determined. Catalytic activity of titania and palladium coated titania nanoparticles was evaluated in a quartz reactor under UV illumination. Quantification of hydrogen evolution was done by gas chromatography. Zeta potential measurements were carried out on cysteine capped silver nanoparticles to assess the surface charge in order to explain their stability against flocculation over other nanoparticles. Ultrafiltration of the cell free filtrate was performed to remove excess solvent, and proteins in the retained fraction were resolved by poly acrylamide gel electrophoresis. Peptide mass fingerprints of the proteins were obtained by MALDI TOF mass spectrometry and further processed by MASCOT analysis. For experiments on biocontrol potential of Trichoderma asperellum biomass, in preventing Pythium induced “damping off” of chilly plantlets, pot culture studies were performed.
Chapter 3. Results and Discussion
The results and discussion is divided into eleven sections. In the first section, cell free filtrates of five agriculturally important fungi were screened for silver nanoparticle formation from silver nitrate by UV visible spectrophotometry. Compared to the other organisms tested, cell free filtrate of a fungus from Trichoderma genus yielded a sharp well defined surface plasmon peak at ~410 nm for silver nanoparticles. The fungus was identified as Trichoderma asperellum by sequencing the Internal Transcribed Spacer region and generating identities from NCBI database. Subsequently, the synthesized silver nanoparticles were characterised. The reaction was completed in 5 days. Diffraction peaks corresponding to FCC lattice of silver were obtained. Average particle size from Scherrer formula was 17 nm. This agreed well with TEM data (obtained after 6 months of synthesis) where most of the particles were

Page | xii
within 10 to 18 nm. The hydrodynamic diameter due to the hydrated capping molecules obtained from dynamic light scattering, was 35.4 nm.
Gold nanoparticles synthesised by the similar route showed the surface plasmon peak at 570 nm but with varied morphologies. In transmission electron microscopy, while most of the particles were spherical with average diameter of 15 nm, careful observation revealed that three or more spherical particles fused to form nanotriangles (~30 nm edge length). Merger of nanotriangles and fusion of spherical nanoparticle with the edges of the nanotriangles resulted in bigger triangles (~100 nm edge length). These bigger triangles fused to form stacks of aligned triangles, hexagonal prisms and other exotic structures. Surface roughness as measured by AFM revealed that the nanotriangles were optically flat. It is worth mentioning that, this was the first detailed demonstration of evolution of morphology by TEM in a biological synthetic process. Platinum and palladium nanoparticles were also synthesised. The next few sections deal with composite materials made through this route. Precursor salts of gold and silver were added in different proportions and the progress of reaction was studied by UV visible spectrophotometry. The plasmon peaks of gold and silver appear at 570 and 410 nm, respectively, as mentioned in the previous sections. No separate peak at the respective plasmon peak positions for either gold or silver could be seen. For all the ratios of gold and silver used, absorbance maxima were found between 531 nm to 561 nm. EDS data revealed that gold always got incorporated in higher proportions in the composites compared to silver over and above the initial concentration ratios. EDS line scans showed the coexistence of gold and silver. From single absorbance maxima and coexistence of gold and silver, it may be assumed that uniform alloying took place. However, in uniform alloys obtained by citrate mediated reduction9, initial ratios reflect in the final ratios of incorporation, which was not the case in the present study. Earlier reports on biological routes

Page | xiii
support such inconsistencies in the initial and final ratios of gold and silver 10 11. Mahl et al 12 have observed similar varying ratios of gold and silver, as one proceeded from the interior of the particle to the periphery. The interior of the particle was richer in gold, with progressive increase in silver approaching the periphery. The more noble nature of gold makes it easier to be reduced compared to silver in presence of biological reducing agents and hence its higher rate of incorporation particularly as we approach the core, which is formed early in the reaction.
Deposition of silver on multi walled carbon nanotube (MWCNT) surfaces to obtain a composite Ag-CNT was also achieved by this method. TEM images revealed the presence of silver on the nanotube surface. Rare occurrences of silver in the lumen of the tube were also observed in the shape of nanorods. For studying antibacterial activity, dispersibility of the carbon nanotubes needed to be improved. Thus, carboxyl groups were introduced on the nanotube surface by treatment with concentrated nitric acid (f-Ag-CNT). With the presence of functional groups on the nanotube surface, silver deposition was improved remarkably, as evident from the electron dense bodies on the CNTs, which are of much lighter contrast in TEM images. The identity of silver, coated on the surface as well as that within the lumen was established by Energy- filtered TEM. The minimum inhibitory concentration and minimum bactericidal concentration of the silver coated CNTs against E.coli BW 25113 was 3.24 µg/ml and 7.56 µg/ml, respectively for an initial inoculum of 105 -106 cfu/ml. Pristine MWCNT or Ag-CNT (without surface carboxyl groups prior to silver deposition) did not inhibit bacterial growth.
Nanocrystalline titania and titania with dispersed palladium (Pd-TiO2) nanoparticles were synthesised by the cell free filtrate in one step process using precursors titanium isopropoxide and palladium chloride. In order to improve crystallinity of the samples, these were further

Page | xiv
calcined for 4 hours at 350ºC. In XRD most intense peaks that appeared were assigned to diffraction from the (101), (004), (200), (211), (204) and (301) planes of anatase TiO2 (JCPDS 21-1272), implying the development of single phasic TiO2 having pure anatase phase. No peak corresponding to reflection from Pd metal could be observed in the XRD patterns due to extremely small percentage of loading. From peak broadening the average crystallite size of the TiO2 and Pd-TiO2 nanoparticles were calculated to be 5 nm and 7 nm, respectively. This was in good agreement with TEM data, where oblong particles within 5-10 nm were observed. From HRTEM of Pd-TiO2 lattice fringes of 111 plane of palladium were observed along with 101 planes of TiO2. Introduction of palladium did not alter the band gap of TiO2 which remained at 3.2 eV. 50 mg of the both the catalysts were used to check for evolution of hydrogen under UV illumination with 10 ml water and 5 ml methanol used as sacrificial reagent. While TiO2 yeilded 1.193 µmoles/mg/hr the same for Pd-TiO2 was 3.14 µmoles/mg/hr. These values were higher than reported earlier from the similar system using indium titanate and commercial titania (P25)13. The extracellular proteins present in the fungal extract are primarily responsible for reducing aqueous PdCl2. The macromolecules may provide hydrolyzing as well as a size confining template for the synthesis of TiO2 or Pd-TiO2 nanoparticles.
The plausible mechanisms of nanoparticle synthesis were explored by different spectroscopic techniques. Cell free filtrate prior to nanoparticle formation assigned as (a) and that after nanoparticle formation assigned as ‘(b)’ (nanoparticles being removed by centrifugation) were analysed by FTIR spectroscopy. The main observations were summarized as follows: 1.Stretching vibrations of S-H shifted to lower wave numbers in (b) compared to (a), 2. Bending vibrations of S-H bonded to CH2 underwent drastic reduction in (b) compared to (a) indicating change of chemical environment around the S-H bond. 3.The spectrum of the

Page | xv
solution (b) exhibited an additional weak feature at ~970cm-1 identified to be the wagging mode of trans-ethylenic moiety which was absent in (a). Absence of this feature in the spectrum of solution (a) clearly indicated the formation of C=C bond after the reduction process. From the discussions above, it was evident that biomolecule containing an amino acid with S-H bond plays a key role in reducing AgNO3 to silver nanoparticles. Since methionine does not contain thiol group, cysteine was implicated in reduction of silver ions to silver. Raman spectroscopy revealed selective enhancements of C=O bond of carboxylate ions and Ag-N bonds. This was indicative of bonding of nano silver with these groups. As a follow up of this finding, it was observed that stable nano silver sols were produced when silver nitrate and cysteine (cys-Ag nps) was allowed to react in the ratio 1:0.1.The stability ensued from protonation of amine groups of cysteine at the prevailing pH of 3.8 (IEP of cysteine is 5.02). This was also reflected in the positive zeta potential values for cysteine capped nanoparticles at the aforementioned ratio. At a higher concentration of cysteine the reaction with silver nitrate was too fast and the nucleation centres coalesced, in spite of the low pH and protonated amine groups. At lower concentrations the pH of the solution was close to the isoelectric point. Hence, enough positively charged amine groups on cysteine were not present to stabilise the silver nanoparticles, which got agglomerated and settled due to gravity in 2 days. Bonding of cysteine to silver occurred through carboxyl, thiol and amine groups as revealed by XPS and Raman spectroscopy. Average particle size estimated from XRD was 17 nm, while, the size distribution from TEM was between 8 to 18 nm. The particles were embedded in an amorphous network of capping molecules. Hydrodynamic diameter estimated from DLS was 110 nm. Antibacterial activity of the cysteine capped nanoparticles and those synthesised by the cell free filtrate were comparable. However, cys-Ag nps remained in solution only for a month as against the dispersibility of 1 year for nanosilver from cell free filtrate of T. asperellum.

Page | xvi
To investigate the role of proteins, ultrafiltration of the cell free filtrate was done to concentrate biomolecules present therein. The concentrated cell free filtrate would hereafter be referred to as the retentate. Simultaneously, the cell free filtrate was also dialysed to remove smaller molecules lower that 10kDa (cofactors and other metabolites). Both the dialysed filtrate and the retentate did not yield silver nanoparticles on incubation with silver nitrate. However replenishment with 0.1 mM of NADH restored nanoparticle formation ability. Controls containing NAD along with dialysed filtrate or retentate did not yield nanoparticles. Thus, the role of NADH in particular was confirmed. Similarly controls with water and without retentate or dialysed filtrate yielded a low intensity feature centred around 430 nm compared to the well-defined SPR peak for silver with retentate or dialysed filtrate with NADH. Through a gel based approach, 5 proteins present in the retentate were found to synthesize silver nanoparticles in presence of NADH. Identities of these proteins were obtained by MALDI TOFF. The proteins resolved in the gel did not yield nanoparticles in a concentration dependent manner. Bands with concentration higher than that of the aforementioned five proteins did not show colour development in the same incubation time. In order to check the specificity of nanoparticle formation by the retentate in presence of NADH as adjudged from UV Visible spectrophotometry, a set of commonly used proteins in the laboratory such as bovine serum albumin, chymotrypsin, lysozyme and casein hydrolysate were similarly treated with silver nitrate and NADH. These proteins did not yield a defined plasmon peak characteristic of silver nanoparticles at comparable protein concentrations.
The biomass that remained, after being suspended in water for 3 days, was tested for its ability to act as a bio-control agent in soil against pathogenic Pythium sps. While disease

Page | xvii
incidence in infected control was 70%, the same in disease inoculated but Trichoderma treated seeds was only 16.7%.
Summary and conclusions
Different types of nanoparticles could be synthesised by cell free filtrate of Trichoderma asperellum at room temperature without using any other external reducing or capping agent. The silver nanoparticles remained in solution for more than a year at room temperature.The photocatalytic activity of titania and palladium coated titania nanoparticles in generating hydrogen by way of photocatalytic water splitting was the first ever report in literature for nanomaterials synthesised by this route. MIC and MBC of silver nanoparticles against E.coli was 3.24 µg/ml and 7.56 µg/ml for a starting inoculum of 107-108 cfu/ml, while silver nanoparticles formed on carbon nanotubes exhibited the same MIC and MBC values at lower starting inoculum of 105-106 cfu/ml. It was established that cysteine was one of the key reducing agents. Capping of the nanoparticles took place by carboxylate amino and thiol groups when cysteine was the sole reducing and capping agent. In the cell free filtrate however, thiol groups did not participate in capping. In this case, carboxylate and amino groups were responsible for efficient capping. It was proposed that peptide linkages underwent cleavage in the reductive milieu of the cell free filtrate and free amino and carboxyl groups are released. Later, this was also verified by from MALDI TOF data where a vacuolar protease was detected. However, the pH of the medium was in between 6.4 to 7.2 and hence, this protease was not fully functional. Silver sol was produced by the reaction of 0.1 mM of cysteine with 1 mM of AgNO3 and was stable for over a month. On a comparative note, MIC and MBC values of Ag-nps synthesized via fungal route were slightly lower by 1.08 g/ml than those of cysteine capped Ag-nps. The small difference in antibacterial efficacies of the two systems is again attributed to the difference in the nature of their capping

Page | xviii
molecules that played a significant role. The particle sizes were also comparable in the two cases, signifying that the products synthesized by cysteine and that obtained by fungal route mimic each other in terms of morphology and properties. The maximum stability of the sol that could be synthesized using cysteine was over 1month as against over 1 year (in darkness) for sols synthesized by T. asperellum.14 This underlined the applicability and significance of biosynthesis. It was demonstrated that 5 proteins from the cell free filtrate were involved in nanoparticle formation in presence of NADH. In the same gel, proteins that were in higher concentrations did not give colour development with silver nitrate and NADH. Non-specific proteins (ones commonly used in the lab) did not exhibit this phenomenon under same or at higher concentrations in the presence of NADH. Though NADH might have been the redox active molecule, but in the absence of a bio-macromolecule nanoparticle formation was hindered. Thus, a cysteine mediated mechanism and a NADH dependent protein mediated mechanism were established. The biomass retained after nanoparticle synthesis could be formulated in talc and manure and was used as a bio-control agent in soil. References 1. C M Niemeyer, C. A. M., Nanobiotechnology. Wiley -VCH: 2004. 2. Lowenstam, H. A., Science 1981, 211, 1126. 3. Bäuerlein, E., Biomineralization of Unicellular Organisms: An Unusual Membrane
Biochemistry for the Production of Inorganic Nano- and Microstructures. Angewandte Chemie International Edition 2003, 42 (6), 614-641.
4. J. E. Zumberg, A. C. S., B. Nagy, Mineral Science Engineering 1978, 10, 223. 5. Southam, G.; Beveridge, T. J., The in vitro formation of placer gold by bacteria.
Geochimica et Cosmochimica Acta 1994, 58 (20), 4527-4530. 6. K L Temple, N. L. R., Economic Geology 1964, 59, 647. 7. Ahmad, A.; Mukherjee, P.; Senapati, S.; Mandal, D.; Khan, M. I.; Kumar, R.; Sastry,
M., Extracellular biosynthesis of silver nanoparticles using the fungus Fusarium oxysporum. Colloids and Surfaces B: Biointerfaces 2003, 28 (4), 313-318.
8. Bhainsa, K. C.; D'Souza, S. F., Extracellular biosynthesis of silver nanoparticles using the fungus Aspergillus fumigatus. Colloids and Surfaces B: Biointerfaces 2006, 47 (2), 160-164.
9. Link, S.; Wang, Z. L.; El-Sayed, M. A., Alloy formation of gold-silver nanoparticles and the dependence of the plasmon absorption on their composition. Journal of Physical Chemistry B 1999, 103 (18), 3529-3533.

Page | xix
10. Nori, N. M.; Abdi, K.; Khoshayand, M. R.; Ahmadi, S. H.; Lamei, N.; Shahverdi, A. R., Microwave-assisted biosynthesis of gold–silver alloy nanoparticles and determination of their Au/Ag ratio by atomic absorption spectroscopy. Journal of Experimental Nanoscience 2012, 8 (4), 442-450.
11. Nair, B.; Pradeep, T., Coalescence of Nanoclusters and Formation of Submicron Crystallites Assisted by Lactobacillus Strains. Crystal Growth & Design 2002, 2 (4), 293-298.
12. Mahl, D.; Diendorf, J.; Ristig, S.; Greulich, C.; Li, Z.-A.; Farle, M.; Köller, M.; Epple, M., Silver, gold, and alloyed silver–gold nanoparticles: characterization and comparative cell-biologic action. J Nanopart Res 2012, 14 (10), 1-13.
13. Mrinal R. Pai, A. M. S., Atindra M. Banerjee, Raghvendra Tewari,; Gautam K. Dey, A. K. T., and Shyamala R. Bharadwaj, Synthesis, characterization and photocatalytic H2 generation over ternary indium titanate nanoparticles. Journal of Nanoscience and Nanotechnology 2012, Vol. 12, 1957–1966.
14. Mukherjee, P.; Roy, M.; Mandal, B. P.; Dey, G. K.; Mukherjee, P. K.; Ghatak, J.; Tyagi, A. K.; Kale, S. P., Green synthesis of highly stabilized nanocrystalline silver particles by a non-pathogenic and agriculturally important fungus T. asperellum. Nanotechnology 2008, 19 (7).

Page | xx
Journal Publications 1. Evolution of Morphology from Nano-Spheres to Triangular nanoprisms; P. Mukherjee, Mainak Roy, B. P. Mandal, Sipra choudhury, R. Tewari, A. K. Tyagi and S. P. Kale; Journal of Colloids and Interface Science 2012 Feb 1;367(1):148-52 2. Biomimetic synthesis of nanocrystalline silver sol using cysteine: stability aspects and antibacterial activities. Mainak Roy, Poulomi Mukherjee, Balaji P Mandal, Rajendra K. Sharma, Avesh K. Tyagi and Sharad P. Kale. RSC Advances, 2, 2012, 6496-6503

Page | xxi
CONTENTS
SYNOPSIS viii-xx LIST OF FIGURES xxiii-xxvi
LIST OF TABLES xxvii CHAPTER 1 INTRODUCTION 1-29 CHAPTER 2 MATERIALS & METHODS 30-62
2.1 Screening of mycelia-free filtrate from agriculturally important fungi for silver nanoparticle formation
31
2.2 Identification of fungi by molecular techniques 32 2.3 Synthesis of silver nanoparticles and their
characterisation 35
2.4 Synthesis of gold nanoparticles and studies on evolution of morphology
39
2.5 Synthesis of platinum and palladium nanoparticles 40 2.6 Synthesis of gold-silver nanocomposite 41 2.7 Synthesis of silver–CNT composites. 43 2.8 Synthesis of titania and palladium dispersed titania 44 2.9 Plausible mechanism of formation of nanoparticles using silver
nitrate 49
2.10 Reusability of T. asperellum biomass in biocontrol 58 2.11 Applications of silver nanoparticles 60
Chapter 3 RESULTS AND DISCUSSION 63-184 3.1 Screening of mycelia-free filtrate from agriculturally
important fungi for silver nanoparticle formation 64
3.2 Identification of fungi by molecular techniques 67 3.3 Synthesis of silver nanoparticles and their
characterization 72
3.4 Synthesis of gold nanoparticles by and studies on evolution of morphology
78
3.5 Synthesis of platinum and palladium nanoparticles 88 3.6 Synthesis of gold-silver nanocomposite 93

Page | xxii
3.7 Synthesis of silver–CNT composites. 104 3.8 Synthesis of titania and palladium dispersed titania 115 3.9 Plausible mechanism of formation of nanoparticles using
silver nitrate 127
3.10 Reusability of biomass used for nanoparticle synthesis in bio-control of soil borne pathogenic fungi
175
3.11 Applications of silver nanoparticles 181 Chapter 4 SUMMARY AND CONCLUSION 185-190 REFERENCES 191-209 Appendix 210

Page | xxiii
List of Figures
Fig No. Description Pg.no 2.7.1 Typical outer irradiation reaction assembly for photocatalysis and
emission spectrum of UV-visible lamp 47 2.11.1 Schematics of experimental facility for studying suppression of flow
instability in natural circulation loop 61
3.1.1 The overlaid spectra showing wavelength scans of mycelia free filtrate of five different fungi treated with 1 mM silver nitrate. 66
3.2.1 Light microscopy of the fungal culture showing conidia and conidiophores 67
3.2.2 Gel photograph showing, positive clones containing the amplified ITS region. 69
3.2.3 Results of BLAST search indicating identity with Trichoderma asperellum. 70
3.2.4 Alignment of the query sequence with 99% identity to a previously deposited sequence from Trichoderma asperellum. 71
3.3.1 Digital photographs of filtrate of T. asperellum (A) control (without AgNO3), (B) sample (with 1 mM AgNO3) & (C) AgNO3 without filtrate after 5 days of incubation.
72
3.3.2 UV-visible spectrum of silver nanoparticles recorded over a period of 5 days. 74
3.3.3 XRD pattern of silver nanoparticle sample 75 3.3.4 High -resolution transmission electron micrograph of silver nanoparticles 76 3.3.5 Histogram of particle size distribution as obtained from dynamic light
scattering of silver nanoparticle solution 78 3.4.1 Digital photographs of gold nanoparticle sol and control 79 3.4.2 UV-vis absorption spectra of the gold nanoparticle sol recorded as a
function of time. 80 3.4.3 TEM image of the gold nanoparticle sol. 82 3.4.4 XRD pattern of a drop-casted gold nanoparticle sample 83 3.4.5 TEM studies on the evolution of morphologies of gold nanoparticles 85 3.4. 6 AFM topography of nanoprisms 86 3.4.7 Size distribution of nanotriangles from AFM topography. 87 3.5.1 Colour of the filtrate (a) before addition of palladium chloride (b) filtrate
after formation of palladium nanoparticles. 88 3.5.2 X –Ray diffractogram of palladium nanoparticles 89

Page | xxiv
3.5.3 Particle size distribution of palladium nanoparticles 90 3.5.4 The colour of filtrate (a) before addition of chloroplatinic acid (b) after
addition (c) after formation of platinum nanoparticles 90 3.5.5 X-Ray diffraction pattern of platinum nanoparticles 91 3.5.6 TEM of platinum nanoparticles. 91 3.5.7 EDS spectra of platinum nanoparticles. 92 3.6.1 The five different initial ratios of gold and silver and their corresponding
surface plasmon absorbance peaks are depicted. 95
3.6.2 The plot of ratio of silver to gold (initial amounts used as precursor) versus ratios of incorporated silver and gold. 96
3.6.3 Plot showing the dependence of the initial amounts of gold with the final amounts incorporated. 97
3.6.4 Plot exhibiting sigmoidal dependence of the incorporation of silver with respect to the initial amounts added 98
3.6.5 TEM image of alloy nanoparticles made from Au :Ag (1:4) and size distribution 98
3.6.6 TEM image of alloy nanoparticles made from Au :Ag (4:1) and size distribution 99
3.6.7 TEM image of alloy nanoparticles made from Au :Ag (1:1) and size distribution 99
3.6.8 X-ray diffractogram of samples with initial equimolar proportions of gold and silver 100
3.6.9 EDS line scan to indicate co-occurrence of gold and silver in the composites for three representative samples 101
3.7.1 Collage of TEM micrographs of silver (Ag) deposited on multiwalled carbon nanotubes (MWCNT) 106
3.7.2 TEM image of silver encapsulated inside the lumen of multiwalled carbon nanotube 107
3.7.3 High resolution TEM revealing the lattice fringes of silver and carbon matrix 107
3.7.4 XRD and SAED pattern of silver-CNT composite 108 3.7.5 Schematic representation of addition of functional groups on CNT surface
followed by deposition of nanosilver 109
3.7.6 Collage of transmission electron micrographs of silver decorated functionalized carbon nanotubes. 110
3.7.7 EFTEM micrograph of silver encapsulated carbon nanotube 111

Page | xxv
3.7.8 Plot showing the decreasing counts of bacteria with increasing concentration of silver in silver-CNT composite. 112
3.8.1 Schematic representation of photocatalytic process in TiO2. 116 3.8.2 Schematic representation of synthesis of palladium dispersed titania with
mycelia free filtrate of T.asperellum.. 118 3.8.3 TEM micrograph for representative titania sample 119 3.8.4 TEM micrograph for representative palladium dispersed titania (PdTiO2) sample. 120
3.8.5 XRD pattern of calcined Pd-TiO2 and TiO2 and same samples “as grown” (before calcination) 121
3.8.6 Band gap values for calcined and as grown/ uncalcined sample of TiO2 and Pd-TiO2. 123
3.8.7 Time dependent evolution of hydrogen via water splitting with TiO2 & Pd-TiO2
124 3.8.8 Raman spectra of as-grown and calcined TiO2 and Pd-TiO2 samples. 125 3.8.9 The XPS spectra of calcined Pd-TiO2 and calcined TiO2 samples 125 3.8.10 EDXRF of Pd-TiO2 sample indicating co presence of the two elements 126 3.9.1.1 FTIR spectra of the cell-free extract (a) before addition of AgNO3 and (b)
after removal of silver nano-particles by centrifugation 128
3.9.1.2 Schematic representation of the mechanism of formation of silver nanoparticles 132
3.9.1.3 Macro-Raman spectrum of silver nanoparticles drop casted on Si(100) single crystals 133
3.9.2.1 UV-Visible spectrum of sample C till completion of reaction 136 3.9.2.2 Kinetics of the reaction of 0.1 mM cysteine with 1 mM silver nitrate
(sample C) 137 3.9.2.3 TEM image of the sample C 138 3.9.2.4 XRD pattern sample C 139 3.9.2.5 Log-linear plot of surviving bacterial colonies relative to that of the
control vs. concentration of Ag nanoparticles synthesized (a) via fungal filtrate route and (b) using cysteine.
140
3.9.2.6 UV-vis spectra of samples A and B (cysteine 0.01, 0.001 mM) recorded after ageing. 142
3.9.2.7 SEM micrograph of the sample D. Inset (a): XRD pattern of the heated and as-synthesized sample D, (b) UV-vis spectrum of the same sample 146
3.9.2.8 XPS spectra of (a) Ag3d, (b) O1s, (c) S2p and (d) N1s for cysteine capped Ag-nps 148
3.9.2.9 Raman spectrum of the sample C drop cast on silicon single crystal. 149 3.9.3 1. Effect of boiling the filtrate on nanoparticle formation compared to non- 152

Page | xxvi
heat treated filtrate 3.9.3.2 Effect of dialysing the filtrate on nanoparticle formation compared to
undialysed filtrate 152
3.9.3.3 Effect of addition of 0.1 mM NADH in restoring nanoparticle formation by dialysed filtrate. 153
3.9.3.4 Effect of addition of 0.1 mM NADH in restoring nanoparticle formation by the concentrated retentate. 154
3.9.3.5 (a) Coomassie stained non-denaturing gel with marker lane (b) Unstained half of the gel exposed to NADH (0.1mM) & AgNO3 (1mM) 156
3.9.3.6 Mascot search result for band 14 159 3.9.3.7 Mascot search result for band 15 160 3.9.3.8 Conserved domain search result for band 15 161 3.9.3.9 Mascot search result for band 16 162 3.9.3.10 Mascot search result for band 17 163 3. 9.3.11 Mascot search result for band 18 164 3.9.3.12 TEM of nanoparticle released from the gel 166
3.9.3.13. The effect of NADH and proteins like casein-hydrolysate, bovine serum albumin, chymotrypsin, lysozyme, and albumin on formation of silver nanoparticles from silver nitrate 171
3.9.3.14. The effect of NAD and proteins like casein-hydrolysate, bovine serum albumin, chymotrypsin, lysozyme, and albumin on formation of silver nanoparticles from silver nitrate 172
3.9.3.15 (A) Oxidation potential of cell free filtrate, (B) Oxidation potential values for retentate, retentate with NADH, dialysed filtrate, dialysed filtrate with NADH.
173
3.10.1 Dual culture assay with Trichoderma asperellum 176 3.10.2 Pots showing Pythium infestation in soil 179 3.10.3 Effect of treatment of T. asperellum biomass to Pythium inoculated soils 180 3.11.1 Schematic diagram of experimental facility for natural circulation loop 182 3.11.2 Flow instability of water and silver nano fluid in natural circulation loop. 183
3.11.3 Healing of maggot infested wound of canine (a) wound before dressing. (b) wound after 3 weeks of healing 184

Page | xxvii
List of Tables
Chapter 2: MATERIALS AND METHODS 2.1.1 Composition of liquid culture medium for fungal growth 31 2.6.1 The molar ratios of gold to silver added initially 42 2.9.2.1 Nomenclature of the samples with different concentrations of cysteine 51 Chapter 3: Results and Discussion 3.6.1 Relative percentage of incorporation of gold & silver w.r.t. initial
concentrations 97
3.9.2.1 The compositions of samples made with different concentrations of cysteine
135
3.9.2.2 Stability assessment of silver sol. 143 3.9.3.1 Summary of Hits obtained from Mascot Analysis of MALDI-TOFF
results for band 14-18 157
3.10.1 Extent of inhibition of plant pathogenic and saprophytic fungi by Trichoderma asperellum
177 3.10.2 The comparative account of various treatments of T. asperellum
biomass and controls 179

Page | 1

Page | 2
Introduction The prefix nano is derived from the Greek word “nanos” meaning dwarf and refers to matter of size in the order of one billionth of the corresponding unit. At the nanometre-scale the number of atoms gets highly restricted. For example, there are 479 atoms of gold in a 3 nm gold particle stabilized by glutathione. This is calculated to be 58% less than bulk gold of the same order of magnitude [1]. Matter restricted to this dimension is known to reveal novel properties for reasons explained later. This idea of atom by atom manipulation of matter was first put forth by Richard Feynman in a lecture entitled “There is plenty of room at the bottom” in 1959. However advancements in this field awaited the development of tools for atomic level investigations which came with the invention of the scanning tunnelling microscope in 1981. Meanwhile, Eric Drexler began to develop his ideas about molecular nanotechnology (MNT) and was inspired when he came across Feynman’s lecture in 1979. Drexler, not knowing the earlier coinage of the term nanotechnology by Prof Norio Taniguchi in 1974, used it in his book “Engines of Creation: The Coming Era of Nanotechnology” (1986). What Drexler went on to describe in this book, later gained recognition as molecular nanotechnology (MNT). Though nanotechnology is hailed as the technology of the future, nano-scale systems have been optimised in nature, through billions of years of evolution. Hence cells, cellular compartments, nucleic acids and proteins can be harnessed to fabricate functional nanostructures and mesoscopic architectures of organic and inorganic materials.
The interest in nano-materials springs from the fact that they exhibit unique properties compared to the bulk. Tailoring the length scale of materials and the structural arrangement of atoms at the nanometer level, leads to variation of properties or introduction novel properties compared to the

Page | 3
bulk. The appearance of new properties can be explained as follows. Atoms have singly occurring discrete energy levels. In crystalline materials many discrete energy levels which are too close together to be resolved, form energy bands. Within a band the number of energy levels is of the order of, the number of atoms in the crystal. Electrons can take on any energy level within an unfilled band. So although electrons are actually restricted to these energies, they appear to be able to take on a continuum of values [2].
Band structure of matter and electronic transitions with-in the levels in the energy bands determine properties of materials. At nanometre scales, the reduction in the number of atoms results in the band structure transforming to more quantized energy levels. Hence this transformation has an important bearing on the properties. Thus, study of nano-materials also gives an insight as to how the properties evolve from the molecular or atomic level to the bulk. Further, the reduction in size, leads to confinement of the electronic motion and affects the physical and chemical properties of the material [3], [4].
One of the readily discernible characteristics in case of certain metal nanoparticles is their colour. The colour of metal nanoparticles originates from the surface plasmons i.e. coherent and collective oscillations of the surface electrons [3], [4], [5]. The excitation of the surface plasmons by the electromagnetic field at an incident wavelength where strong resonance occurs, results in intense light scattering and an enhancement of local electromagnetic fields [6]. Thus an intense surface plasmon resonance band results in spectroscopy. In gold and silver nanoparticles, this lies in the visible range explaining the colours they exhibit. In case of semiconductor nanoparticles quantum size effects are well studied. The energy level spacing for the spherical nanoparticles is predicted to be inversely proportional to the square of the radius of the nanoparticle [7]. Thus with decreasing size, the effective band-gap energy of semiconducting
Page | 4
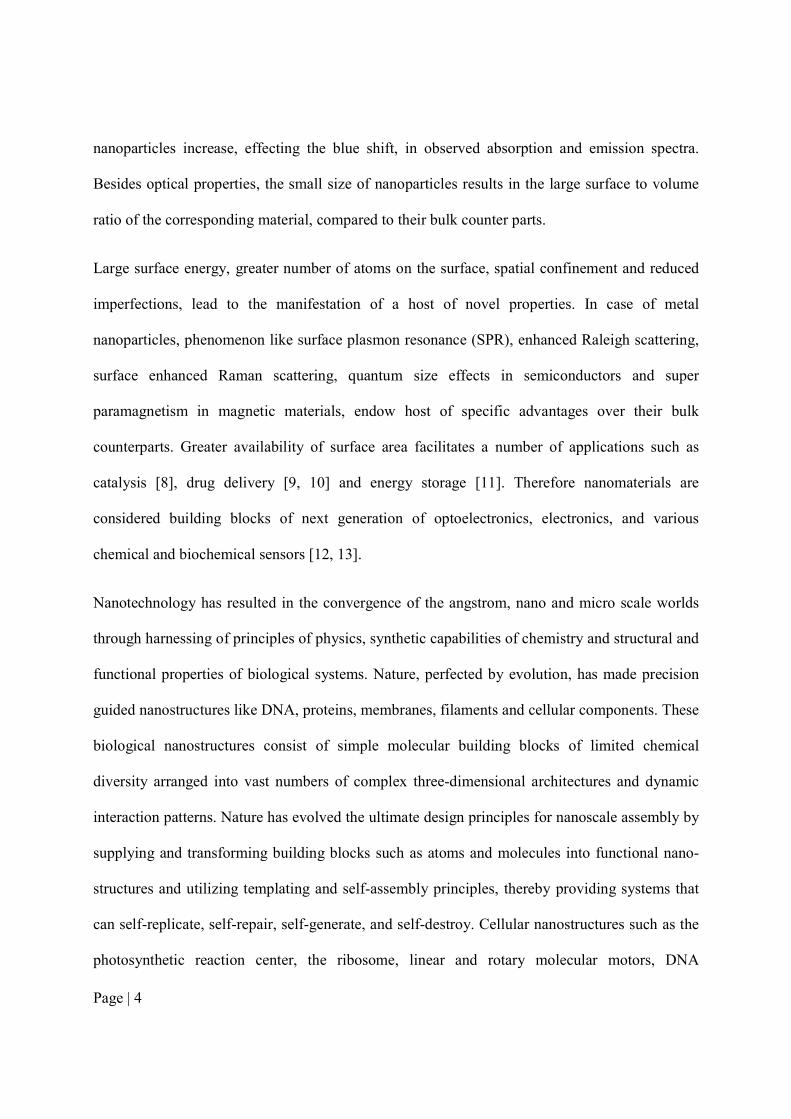
nanoparticles increase, effecting the blue shift, in observed absorption and emission spectra. Besides optical properties, the small size of nanoparticles results in the large surface to volume ratio of the corresponding material, compared to their bulk counter parts.
Large surface energy, greater number of atoms on the surface, spatial confinement and reduced imperfections, lead to the manifestation of a host of novel properties. In case of metal nanoparticles, phenomenon like surface plasmon resonance (SPR), enhanced Raleigh scattering, surface enhanced Raman scattering, quantum size effects in semiconductors and super paramagnetism in magnetic materials, endow host of specific advantages over their bulk counterparts. Greater availability of surface area facilitates a number of applications such as catalysis [8], drug delivery [9, 10] and energy storage [11]. Therefore nanomaterials are considered building blocks of next generation of optoelectronics, electronics, and various chemical and biochemical sensors [12, 13].
Nanotechnology has resulted in the convergence of the angstrom, nano and micro scale worlds through harnessing of principles of physics, synthetic capabilities of chemistry and structural and functional properties of biological systems. Nature, perfected by evolution, has made precision guided nanostructures like DNA, proteins, membranes, filaments and cellular components. These biological nanostructures consist of simple molecular building blocks of limited chemical diversity arranged into vast numbers of complex three-dimensional architectures and dynamic interaction patterns. Nature has evolved the ultimate design principles for nanoscale assembly by supplying and transforming building blocks such as atoms and molecules into functional nano-structures and utilizing templating and self-assembly principles, thereby providing systems that can self-replicate, self-repair, self-generate, and self-destroy. Cellular nanostructures such as the photosynthetic reaction center, the ribosome, linear and rotary molecular motors, DNA

Page | 5
replication complex, membrane channels etc have been studied in vitro and ex vivo. They form examples of living and functioning at the nanoscale [14].
Nanomaterials and their synthesis is at the heart of development of nano-sciences along with tools for their characterisation. They are synthesized using two approaches, top down and bottom up [15]. In the top-down approach nanoparticles are synthesized by physically slicing or by abrasion of the bulk material till the desired size is achieved. This approach was practiced by Neanderthal man almost 300,000 years ago in Paleolithic period, when human race first learnt to fabricate tools [16]. In the course of evolution human being has mastered this art by being able to realize structures of sub-micron level using different sophisticated techniques such as laser induced chemical etching, ball milling etc [17, 18]. The bottom-up approaches mainly involve chemical and biological methods to make nanostructures and nanoparticles. These processes involve controlled condensation of solute molecules that are formed during a chemical reaction. The restriction of the condensation or growth, leads to the formation of particles of desired size and shape [19]. Size, shape and crystallinity determine the optoelectronic, physical and electronic properties. Hence size and shape selective synthesis has been a challenge in nanoscience. Although various physical and chemical modes of synthesis are extensively used to synthesize mono-disperse nanoparticles, they suffer from drawbacks of using high boiling toxic solvents and harsh reaction conditions. Hence development of clean, biocompatible, nontoxic, and eco-friendly methods for nanoparticle production is worth the effort. Though biological methods are environmentally benign and cost effective, they also have some shortcomings of being time consuming, involve steps of culturing microbes and it is difficult to control size and shape. However recent work on optimising culture conditions, pH, incubation temperature, time,

Page | 6
concentration of metal ions, and the amount of biological material has progressed to give hope in the implementation of these approaches for large scale production of nanomaterials.
1.1 Classification of nanomaterials Nanoscaled materials are usually categorized as materials having structured components with atleast one dimension less than 100 nm. Smaller nanoparticles containing 104 or less atoms are referred to as nanoclusters. These clusters are of interest because they explain the transition from atomic properties to bulk material properties. Nano-clusters are further classified as explained below
a) Van der Waals nanoclusters
Inert gas atoms form nanoclusters that are weakly bound by the Van der Waals force. The long-range atomic attraction is due to the induced dipole force.
b) Ionic nanoclusters
Ionic nanoclusters are formed from ions attracted by electrostatic force. NaCl is a typical example of an ionic cluster. The electrostatic bonds in ionic clusters are around 2-4 eV per atom. This is ten times as strong as the bond of a Van der Waals nanocluster.
c) Metal nanoclusters
Metal nanoclusters are more complicated in their bonding. Some metals bond primarily by outer valence sp electrons. Others bond with d orbitals below the valence orbitals. Because of variation in bonds of metal clusters, the strength can vary from about 0.5 to 3 eV per atom [20]. Metal

Page | 7
nanocluster of certain number of atoms possessing extraordinary stability originating from either atomic or electronic shell closing are known as magic clusters [21].
Stabilisation of metal nanoparticles
Nanoparticles have large surface energy and hence coalesce to give thermodynamically favoured bulk particle. In absence of counteractive repulsive forces the Van der Waals forces between the two metal nanoparticles would lead to coagulation. Hence for spatial confinement of the particles in nano range it is essential to stabilize the particles. This can be achieved by either electrostatic or steric stabilization [22, 23] by using a capping agent such as polymer [24, 25], surfactant [26], solid support [27] or ligand [28] having suitable functional groups.
1.2 Overview of biological synthesis of nanoparticles In multicellular living organisms inorganic materials form an integral part of hard tissues. These tissues can be termed as bio-composites containing structural bio-macromolecules and some 60 different kinds of minerals which are necessary for variety of structural, mechanical, and physiological functions [29]. Not only multicellular organisms but also unicellular organisms such as bacteria and algae synthesize inorganic materials, both intra-cellularly and extra-cellularly [30]. Of the many examples in nature a few are magnetotactic bacteria which synthesize magnetite particles [31], [32, 33], diatoms and radiolarians that synthesize siliceous materials [34], and S-layer bacteria that synthesize gypsum and calcium carbonate as surface layers [35]. These bioinorganic materials are not only complex both in structure and function, but also exhibit exquisite hierarchical ordering from the nano-meters to macroscopic length scales. Achieving this type of ordered synthesis and organization is a far cry as far as laboratory-based synthetic protocols are concerned.

Page | 8
At the same time mounting pressure to develop green chemistry for eco-friendly methods of nanomaterial synthesis has motivated researchers to tap the potential of biological systems. It is interesting to note that biotechnological applications for remediation of toxic metals have long employed microorganisms such as bacteria [36, 37] and yeast [38]. The process of detoxification, whether by reduction of the metal ions or by formation of insoluble complexes with the metal ion (eg., metal sulfides) may yield nanomaterials. However the possibility of using such microorganisms for deliberate synthesis of the same is a far more recent application than bioremediation. Among microbes, which include bacteria, actinomycetes (both prokaryotes) and algae, yeasts, and fungi (eukaryotes), bacteria have received the most attention for the biosynthesis of nanoparticles [39-43]. 1.2.1a Intracellular synthesis of nanoparticles by bacteria The various mechanisms employed by microbes for the detoxification of metal ions and consequent synthesis of nanomaterials include alteration of solubility and toxicity by oxidation or reduction, lack of specific metal transport system, biosorption, extracellular complexation or precipitation of metals, bioaccumulation and efflux systems. Intracellular accumulation of nanoparticles by bacteria was observed during recovery of precious metals from mine wastes and leachates. The release of such intracellularly synthesized nanoparticles requires additional processing steps such as ultrasound treatment or reaction with suitable detergents. Though this may be a disadvantage but bio-matrixed metal nanoparticles could also be used as catalysts in various chemical reactions [44]. It was further seen that this helped in retaining the nanoparticles in bioreactors for continuous usage.

Page | 9
In a series of papers, Tanja Klaus and co-workers showed that when metal-resistant bacterium, Pseudomonas stutzeri AG259 (isolated from a silver mine), when challenged with high concentrations of silver during growth, intracellular formation of crystalline silver nanoparticles upto 200 nm in size, resulted [41]. Most of the nanoparticles were found to be composed of elemental silver while occasional formation of Ag2S was observed. Joerger, Klaus and Granqvist showed that heat treatment of the nano silver embedded bacterial biomass yielded hard coatings of a cermet resistant to mechanical scratching with a knife. The optical properties of this material could be tailored by varying the silver loading factor [42, 45]. The cermet material was composed primarily of graphitic carbon and up to 5% by weight (of the dry biomass) of silver [45].
Bacterial activity has been implicated in deposition of mineral ores. Pedomicrobium-like budding bacteria in the Alaskar placer, reported in iron and manganese oxide deposition process was shown to accumulate gold [46]. Bacillus subtilis168 reduced water soluble Au3+ ions to Au0 of octahedral morphology inside the cell walls with dimensions of 5–25 nm [47] [48]. Interestingly, heterotrophic sulphate-reducing bacterial (SRB) enrichment from a gold mine was used to destabilize gold (I)–thiosulfate complex [(Au(S2O3)2]3– to elemental gold (<10 nm) in the bacterial envelope releasing H2S as end product of metabolism [49]. In Fe(III) reducing bacterium, Geobacter ferrireducens, gold was precipitated intracellularly in periplasmic space [50]. Similarly, in anaerobic conditions, in the presence of hydrogen gas, iron(III)-reducing mesophilic bacterial resting cells of Shewanella algae reduced Au3+ ions at 25oC forming particles within 10–20 nm in the periplasmic space (pH 7.0) and with 15–200 nm on bacterial surfaces (pH 2.8) [51]. As in the case of Gram-negative bacteria that produce membranous vesicles containing outer membrane proteins, lipopolysaccharides and phospholipids to protect

Page | 10
itself against toxic chemicals, interaction of Plectonema boryanum UTEX485 with Au(S2O3)23–, promoted the accumulation of gold nanoparticles with 10–25 nm diameter in size, and cubic morphology in membrane bound vesicles. Nanoparticles <10 nm were found to cluster inside the cell. Additionally precipitation of ~10–25 nm particles occurred in solution along with admixed AuS nanoparticles. The interaction of P. boryanum UTEX485 with AuCl4−, resulted in precipitation of octahedral gold platelets of 91 nm to10 μm in solution and with size <10 nm inside the bacterial cells [49, 52]. E. coli DH5α mediated bio-reduction of chloroauric acid to Au nanoparticles was reported [53]. The accumulated particles on the cell surface were mostly spherical with a small number of crystals having other morphologies of triangles and quasi-hexagons. These cell-bound nanoparticles have been reported for promising applications in realizing the direct electrochemistry of hemoglobin and other proteins [53]. Similarly, the bio-reduction of trivalent gold was also reported in photosynthetic bacterium, Rhodobacter capsulatus, which showed bio-sorption capacity of 92.43 mg HAuCl4/g dry weight in the logarithmic phase of its growth [54]. The carotenoids and NADPH-dependent enzymes embedded in plasma membrane and/or secreted extracellularly were found to be involved in the bio-sorption and bio-reduction of Au3+ to Au0 on the plasma membrane and extracellular space [54].
Bio-sorption and bio-reduction of Ag+1 on cell surface was also reported in Lactobacillus sp. A09 at 30oC, pH 4.5 in 24 h [55]. Normally, silver toxicity was alleviated by small periplasmic silver binding proteins and by efflux pumps which propels the incoming metals and protects the cytoplasm from toxicity [56] [57]. It is believed that the organic matrix associated with the biomass contains silver-binding proteins. The amino acid moieties of these proteins, serve as nucleation sites for the formation of silver nanoparticles. Silver peptides were found to have the

Page | 11
capability to precipitate silver from aqueous solution of silver ions and form face-centered cubic (fcc) structured silver crystals [58]. Not only terrestrial bacteria but also an airborne Bacillus sp. isolated from the atmosphere was also found to reduce Ag+ ions to Ag0. This bacterium accumulated metallic silver of 5–15 nm in size in the periplasmic space of the cell [59]. In an interesting study, Nair and Pradeep demonstrated that bacteria not normally exposed to large concentrations of metal ions may also be used to grow nanoparticles [60]. These authors showed that Lactobacillus strains present in buttermilk, when exposed to silver and gold ions, resulted in the production of nanoparticles within the bacterial cells [60]. The exposure of lactic acid bacteria present in the whey of buttermilk to mixtures of gold and silver ions was also used to form nanoparticles of alloys of gold and silver [60]. The UV-visible spectra of the bacterial colloids after exposure to pure silver and gold ions as well as a mixture of the two ions, revealed surface plasmon peaks that were at 547,439, and 537 nm for Au, Ag and Au0.75Ag, respectively. No peak due to Ag colloid in the alloy could be visible. While plasmon for gold could be observed at 547 nm respectively, that for the mixed alloy was centered at 537 nm. By using a series of time-dependent UV-visible spectroscopy and TEM measurements, Nair and Pradeep concluded that the nucleation of the silver and gold nanoparticles occurred outside the bacterium (presumably on the cell surface through sugars and enzymes in the cell wall), following which the metal nuclei are transported into the cell where they aggregated and grew to larger-sized particles. The presence noble metal nanocenters is known to enhance Raman spectroscopic signatures and this feature was used by the authors to probe the internal chemical environment the bacteria [60]. Thus the general mechanism of intracellular accumulation of nanoparticles involves electrostatic interactions of the positively charged metal ions with negative charge on the cell wall. Cell wall

Page | 12
bound enzymes or chemical groups reduce the ions to metallic particles which then diffuse through the cell wall and get capped in the periplasm or cytoplasm. 1.2.1b Extracellular synthesis of nanoparticles by bacteria
When the cell wall localized reductive enzymes or soluble secreted enzymes or secreted biomacromolecules are involved in the reductive process of metal ions then metal nanoparticles are formed extracellularly. The extracellularly produced nanoparticles can be easily purified, in a cost-effective manner. They can be produced in large-scale and have wider applications in optoelectronics, electronics, bio-imaging and sensor technology than intracellular accumulation. Rhodopseudomonas capsulata, a prokaryotic bacterium was found to reduce Au3+ to Au0 at room temperature [61]. At pH 7.0 the synthesized spherical gold nanoparticles were in the size range of 10–20 nm. Change in the pH of the solution resulted in various sizes and shapes of gold nanoparticles. At pH 4.0, triangular gold nanoparticles also appeared along with spherical nanoparticles. These triangular and spherical nanoparticles were in the size range of 50–400 nm and 10–50 nm respectively. Optimization of conditions for the synthesis of anisotropic gold nanostructures with different concentrations of gold ions were also reported [61]. Here, cell-free extract of R. capsulatus when added with lower concentration of gold ions produced spherical gold nanoparticles in the size of 10–20 nm. But highly networked structures of gold nanowires with 50–60 nm were synthesized with higher concentrations of gold ions. Sodium dodecyl sulphate-polyacrylamide gel electrophoretic (SDS–PAGE) analysis revealed the involvement of one or more proteins (14–98 kDa) in the bioreduction and capping the gold nanoparticles. Among hyper-thermophilic and mesophilic dissimilatory Fe(III) reducing bacteria and archea like Pyrobalaculum islandicum, Thermotoga maritime, S. algae, G. sulfurreducens and Pyrococcus furiosus, gold was precipitated by reducing gold(III) to metallic gold in the presence

Page | 13
of hydrogen as electron donor. The precipitation occurred extracellularly due to the presence of Au(III) reductases near the outer cell surfaces of Fe(III) reducers [50]. Husseiny et al. (2007) [62] demonstrated that P. aeruginosa (ATCC 90271, strain1 and strain 2) synthesized gold nanoparticles extracellularly with particle size distribution in the order of 40±10 nm, 25±15 nm and 15±5 nm respectively. As the particle size increased, the colour was found to be shifted from pink to blue due to the SPR of gold nanoparticles. Furthermore, the dried powder of B. megaterium D01 was also used to reduce gold salts into monodispersed gold nanoparticles and dodecanethiol was used as capping ligand to stabilize the particles at 26oC. TEM analysis revealed the effect of thiol on the shape, size and dispersity of gold nanoparticles. The presence of thiol during biosynthesis resulted in the formation of small spherical gold nanoparticles with 1.9±0.8 nm in size [63]. Silver nanoparticles were also found to be produced by dried cells of Aeromonas sp. SH10, which reduced [Ag(NH3)2]+ to Ag0 in 4 h with an average diameter of ~6.4 nm. These particles were monodispersed and uniform in shape and remained stable for more than 6 months without aggregation and precipitation [64]. The culture supernatant of bacterial members of Enterobacteriaceae such as Klebsiella pneumonia, E. coli and Enterobacter cloacae were also found to rapidly synthesize silver nanoparticles in the size range from 28.2 nm to 122 nm with an average size of 52.5 nm. With the addition of piperitone, silver ion reduction was partially inhibited, which implicated the involvement of nitrate reductase enzymes in the reduction process [65]. Similarly, the culture supernatant of non-pathogenic bacteria, B. licheniformis was used for the extracellular synthesis of silver nanoparticles of ~50 nm [66]. Barud et al also demonstrated the formation of homogeneous silver containing bacterial cellulose (BC) membranes obtained from BC hydrated membranes of Acetobacter xylinum cultures soaked on silver ion with triethanolamine solution [67].

Page | 14
Recently, it has been found that the HIV-1 virus binds exclusively to silver nanoparticles in the size range of 1–10 nm. Morganella sp., a silver resistant bacterium isolated from the insect gut belonging to Enterobacteriaceae was reported to produce nanoparticles of 20±5 nm in size with spherical morphology and characteristic d-spacing of 2.02 Ǻ for the [200] plane [68]. Three gene homologues namely silE, silP and silS were identified in silver-resistant Morganella sp. On the basis of partial nucleotide sequencing silE, silP and silS homologues were identified as periplasmic silver binding protein, cation-transporting P-type ATPase and two-component membrane sensor kinase involved in silver resistance mechanism.
A template driven strategy has been widely explored for nanomaterial synthesis. Bacteria exhibit a variety of well defned morphologies like bacillus, coccus, spirillum, fusiform bacilli and star shaped bacteria. Synthesis of template driven hollow microspheres/rods has been realized for metals like Au, Ag, Cu, Fe and Pt. These hollow structures possess superior catalytic properties than their solid counter parts. They can be potentially used in SERS, photoelectronic device, gas adsorption etc.
1.2.2 Biosynthesis of nanoparticles using fungi
Fungi are more advantageous compared to other microorganisms in many ways. Fungal mycelial mesh can withstand flow pressure and agitation and other conditions in bioreactors or other chambers compared to plant materials and bacteria. These are fastidious to grow and easy to handle. The extracellular secretions of reductive proteins are more and can be easily handled in downstream processing. Since the nanoparticles precipitated outside the cell are devoid of unnecessary cellular components, they can be directly used in various applications.

Page | 15
1.2.2a. Intracellular synthesis of nanoparticles using fungi
Intracellularly formed nanoparticles may have a more controlled growth than extracellularly formed ones. The size limit may be related to the particles nucleating inside the organisms. Mukherjee et al. (2001a) demonstrated the use of eukaryotic microorganisms in the biological synthesis of gold nanoparticles using Verticillium sp [69]. Gold nanoparticles were reported on the surface and on the cytoplasmic membrane of fungal mycelium with ~20 nm in diameter. These nanoparticles had well-defined dimensions and good dispersity. On TEM analysis, ultrathin sections of fungal mycelia showed spherical and few triangles and hexagonal nanoparticles on cell wall and quasi-hexagonal morphology on cytoplasmic membrane. Trichothecium sp. was found to accumulate gold nanoparticles intracellularly [70]. In addition, Verticillium luteoalbum produced gold nanoparticles in 24 h. When V. luteoalbum was incubated at pH 3.0, spherical particles of <10 nm diameter resulted but with pH 5.0 spheres and rods were also observed along with triangular and hexagonal morphologies [71, 72]. Phoma PT35 was able to selectively accumulate silver [73] and Phoma sp.3.2883 was a biosorbent suited for preparing silver nanoparticles [74]. Fungal biomass of Verticillium sp. upon exposure to aqueous silver nitrate solution resulted in the accumulation of silver nanoparticles below the fungal cell surface with a negligible amount in solution [75] [76]. Vigneshwaran et al. (2007) also showed that the use of Aspergillus flavus resulted in the accumulation of silver nanoparticles on the surface of its cell wall when incubated with silver nitrate solution for 72 h. The average particle size was found to be 8.92 nm [77].
1.2.2b Extracellular synthesis of nanoparticles using fungi Extracellular synthesis of nanoparticles is regarded as a hassle free procedure since downstream processing is not required. Mostly, fungi are regarded as the organisms that produce

Page | 16
nanoparticles extracellularly because of their enormous secretory components, which participate in the reduction and capping of nanoparticles. Shankar et al.[74] found an endophytic fungus, Colletotrichum sp. isolated from the leaves of geranium plant (Pelargonium graveolens), which rapidly reduced gold ions to zero-valent gold nanoparticles [78]. They were spherical in shape and polydispersed. Glutathiones that bind either through free amine group or through cysteine residues were reported as capping agents of gold nanoparticles [79]. Transmission electron microscopic analysis showed that the size of the gold particles were in the range of 8–40 nm. Similarly, fungus Trichothecium sp. when cultured in static condition, reduced Au3+ to form gold nanoparticles [70]. TEM images showed a variety of shapes like of triangular and hexagonal gold nanoparticles with highly polydispersed spheres and rod-like structures. The average size of these gold nanoparticles was found to be 5–200 nm. The release of some loosely bound specific enzymes or proteins by the fungal mat of Trichothecium sp. in the solution was involved in the synthesis of nanoparticles of different morphology. Bhainsa and D’Souza (2006) reported the use of A. fumigatus in the production of monodispersed silver nanoparticles of size 5–25 nm within 10 min of silver nitrate addition. This is one of the fastest reduction by a biological process and even comparable with physical and chemical processes [80]. Extracellular synthesis of silver nanoparticles of pyramidal morphology was reported in white rot fungus Phaenerochaete chrysosporium when challenged with silver nitrate. Environmental scanning electron microscopic (ESEM) analysis revealed that silver nanoparticles were in the size range of 50–200 nm located on the surface of the mycelium. This was taken as an indirect demonstration of the presence of reductase enzymes on the surface of the mycelium, which reduced silver ions to silver nanoparticles [81]. Also, Basavaraja et al. (2008) demonstrated that when culture filtrate of F. semitectum was treated with silver ions, reduced it to silver nanoparticles with size range of

Page | 17
10–60 nm and with spherical morphology [82]. This was found to be stable for many weeks. Similarly, A. niger isolated from soil produced spherical silver nanoparticles of size ca. 20 nm in diameter. Elemental spectroscopy demonstrated the presence of fungal proteins for the stabilization of nanoparticles. The reduction of Ag+ ions had occurred by the action of nitrate-reductase enzyme and quinone involved in extracellular electron transfer [83]. In addition, F. solani, a phyto-pathogenic fungus of onion produced polydispersed spherical silver nanoparticles in the range of 16-23 nm [84]. The fungal filtrate of Phoma glomerata showed the synthesis of spherical silver nanoparticles in the range of 60–80 nm when challenged with silver nitrate [85]. Fungal proteins by white rot fungus, Coriolus versicolor, have been used as bioreducing and biocapping agents to produce extra- and intracellular silver nanoparticles in alkaline condition [86]. TEM analysis showed that the shape of the silver nanoparticles was spherical. The diameters of the extracellularly and intracellularly formed nanoparticles were 25–75 nm and 444–491 nm respectively. Recently, a rhizospheric fungus, Penicillium fellutanum, isolated from mangrove root-soil of Rhizophora annamalayana (Kathir), was found to produce silver nanoparticles in 24 h [87]. TEM studies revealed spherical nanoparticles with size ranging from 5 nm to 25 nm. The partial purification of a fungal protein of 70 kDa was implicated in the synthesis of nanoparticles. Fayaz et al [88] demonstrated the synthesis of nanoparticles by T. viride and studied the antimicrobial activity of silver nanoparticles produced. Similarly, in the fungus P. brevicompactum WA2315, the biosynthesis of silver nanoparticles was reported to be taking place through compactin (a protein) in 72 h [89]. The synthesized silver particles were in the size range of 23–105 nm. In addition, Balaji et al. (2009) showed the production of extracellular silver nanoparticles by Cladosporium cladosporioides [90]. TEM analysis revealed the presence of polydispersed spherical particles. The proteins, polysaccharides and organic

Page | 18
acids secreted by the fungus were believed to have facilitated the formation of different crystal shapes and directed their growth into spherical crystals. The extract of saprophytic straw mushroom fungus, Volvariella volvacea was used to produce silver, gold, gold-silver nanoparticles [91]. Gold nanoparticles were found to be of different shapes from triangular nanoprisms to spherical and hexagonal. They were within the size range from 20 to 150 nm whereas silver nanoparticles were spherical with a size of ~15 nm. Au–Ag bimetallic nanoparticles were formed by co-reduction of both metal ions. The single SPR band in the Au–Ag bimetallic indicated formation of core–shell structure with thick shell or alloy nanoparticles. As the molar ratio of Au:Ag increased, the SPR became more intense and sharper [91]. Intriguingly, F. oxysporum f. sp. lycopersici, was found to produce platinum nanoparticles intracellularly, on cell wall or membrane and extracellularly in the medium, in the size range between 10 and 100 nm and with varying shapes of triangles, hexagons, squares and rectangles [92]. The plant borne fungus, Verticillum sp., was involved in the formation of cubo-octahedral iron oxide nanoparticles with 100–400 nm size in 24 h. The secretion of cationic proteins with the molecular weight of 55 kDa and 13 kDa were found to be responsible for the hydrolysis of magnetite precursors and/or capping the magnetite nanoparticles [93]. Among fungi, only F. oxysporum has been completely explored and exploited to the maximum for the production of a variety of nanoparticles. It extracellularly synthesized various nanoparticles like gold, silver, and bimetallic Au–Ag alloy. Mukherjee et al. [94] reported the synthesis of spherical and triangular gold nanoparticles in the size range of 20–40 nm. Fourier transform Infrared (FTIR) spectrum showed the presence of amide (I) and (II) bands from carbonyl and amine stretching vibrations in proteins respectively. Electrophoresis revealed that proteins of molecular mass between 66 kDa and 10 kDa were involved in the stabilization of

Page | 19
nanoparticles. Senapati et al. [75, 95] showed the formation of extracellular silver nanoparticles and bimetallic gold-silver (Au–Ag) alloy nanoparticles by F. oxysporum. Because of their unique electronic and structural properties, Au–Ag alloy nanoparticles can be used in biomedical, imaging and tagging applications. Although Fusarium oxysporum can produce variety of nanoparticles, this characteristic was not applicable to all Fusarium species. F. moniliforme, which produces reducing components was not be able to form silver nanoparticles on incubation with silver ions [96].
In microbial bioreduction processes, myriads of proteins, carbohydrates and biomembranes are involved. The enzymatic route of in vitro synthesis of silver hydrosol of 10–25 nm using α–NADPH-dependent nitrate reductase (44 kDa) from F. oxysporum with capping peptide, phytochelatin was demonstrated [97]. The mechanistic aspect was explained by Kumar et al [98] that apart from enzymes, quinone derivatives namely napthoquinones and anthraquinones also act as electron shuttling agents in the reduction of silver nanoparticles. A similar finding was also reported in the reduction of gold(III) chloride to metallic gold by α–NADPH-dependent sulphite reductase of molecular mass of 35.6 kDa and phytochelatin [99].
1.2.3 Actinomycete mediated synthesis of nanoparticles Actinomycetes, though have been classified as prokaryotes, share important characteristics of fungi. A novel extremophilic actinomycete, Thermomonospora sp. was found to synthesize extracellular monodispersed spherical gold nanoparticles at an average size of 8 nm [100]. FTIR analysis confirmed the presence of amide (I) and (II) bands of protein as capping and stabilizing agent on the surface of nanoparticles. These particles were stable for more than 6 months. Electrophoretic analysis showed that the proteins of molecular weight ranging from 80 kDa to 100 kDa were involved in the stabilization of these nanoparticles. In contrast, an alkalotolerant

Page | 20
actinomycete, Rhodococcus sp. intracellularly accumulated gold nanoparticles with a dimension of 5–15 nm. Reductase enzymes on the cell wall acted on Au3+ ions and accumulated as Au0 on the cell wall and cytoplasmic membrane [101]. Although actinomycetes are regarded as the primary sources for the synthesis of secondary metabolites till date, these new discoveries would take a lead in further screening of actinomycetes for the synthesis of nanomaterials. 1.2.4 Yeast mediated synthesis of nanoparticles Detoxification mechanisms in yeast cells are brought about by glutathione, metallothionine and phytochelatins. Adsorped metal ions are stabilised in complex polymeric substances as a means of detoxification. The same set of molecules, also contribute towards formation of nanoparticles as well. Among the eukaryotic microorganisms, baker’s yeast, S. cerevisiae was also reported to biosorb and reduce Au3+ to elemental gold in the peptidoglycan layer of the cell wall in situ by the aldehyde groups present in the reducing sugars [102]. Similarly, another yeast, Pichia jadinii (Candida utilis), intracellularly formed gold nanoparticles of spherical, triangular and hexagonal morphologies throughout the cell, mainly in the cytoplasm with the size of < 100 nm in 24 h [71, 72]. Tropical marine yeast, Yarrowia lipolytica, synthesized gold nanoparticles which were associated with cell wall. The reduction of gold ions occurred in a pH dependent manner. When cells were incubated at pH 2.0, Y. lipolytica produced hexagonal and triangular gold crystals due to the nucleation on the cell surfaces giving rise to a SPR peak in the visible region at 540 nm. At pH 9.0 it developed pink and purple colours with an average size of ~15 nm [103]. Extracellular production of silver nanoparticles was reported only in yeast MKY3, a silver tolerant strain, which synthesized hexagonal silver nanoparticles (2–5 nm) in log phase of growth.

Page | 21
1.2.5 Bioaccumulation of metal nanoparticles by plants
The use of plants in the recovery of noble metals from ore and run-offs of mines is known as phytomining. Compared to the conventional chemical methods, phytomining is cost effective and eco-friendly. It can take-up even very low levels of metals and accumulate in tissues compared to the chemical methods, which is less effective at low levels of metals. The use of nontoxic chelators like thiourea, iodide, bromide, cyanide, thiocyanate and thiosulfate can solubilize the metals from ores and facilitate their efficient uptake by plants. Accumulation of metal ions in plants is largely used in phyto-remediation, which has been regarded as an efficient approach for the clean-up of polluted sites [104]. The formation and accumulation of gold nanoparticles in a living plant was reported for the first time in alfalfa [105]. When seedlings were grown under asceptic conditions in a basal medium containing silver nitrate, silver(I) ions were reduced and accumulated as silver in the form of nanoparticles at physiological pH both in roots and shoots. The small sized silver in the roots was present with a particle size of 9 Å and were transported to shoots and deposited as larger silver nanoparticles. These nanoparticles were icosahedral in morphology and sized between 2–4 nm [106]. Similarly, Rodriguez et al. [107] reported that the seedlings of Chilopsis linearsis (desert willow) in hydroponic solution with gold and thiourea, transformed 64 % of the uptaken gold-thiourea complex into metallic gold and accumulated in stem and leaves with an average size of 1.1 nm. Sharma et al. [108] reported the intracellular accumulation of stable gold nanoparticles in roots and shoots of Sesbania drummondii seedlings, when grown in sterile agar-water medium containing gold ions. The reduction process was presumed to be mediated by the presence of secondary metabolites present in the cells.

Page | 22
1.2.5a. Extracellular synthesis of metal nanoparticles by plant biomasses Biomass derived from living or dead plants is regarded as a green renewable source of energy. They are normally used to generate electricity, biogas and biofuels. Therefore, the utilization of biomass wastes in the synthesis of nanoparticles is promising. Generally, production of biomass from phototrophs is inexpensive as it requires only sunlight, carbondioxide, water and inorganic salts. On the other hand, in the context of alarming increase of global warming, the production of plant biomass is a natural biological process of carbon sequestration from the atmosphere. Alfalfa biomass passively binds and reduces gold(III) ions in a pH-dependent manner to form gold nanoparticles of ~100 nm. The resultant particles were tetrahedral, hexagonal platelet, icosahedral multi-twinned, decahedral multiple-twinned and irregularly shaped particles [105]. Furthermore, Herrera et al. [109] reported the binding of silver (I) ions by alfalfa biomass from aqueous solution in a pH-dependent manner. It was presumed that phosphate and sulfonic groups were mainly involved in the binding of silver (I) ions to the alfalfa biomass between pH 2.0 and 6.0. Similarly, up on incubation of wheat (Triticum aestivum) biomass with Au(III) at different pH of 2.0–6.0, nanostructures of various morphologies were formed such as tetrahedral, decahedral, hexagonal, icosahedral, multiple twinned, rod shaped and some irregular shapes. All these nanostructures exhibited fcc geometry with the particle size ranging from 10 to 30 nm. The functional groups present in the cell wall of wheat biomass were involved in the reduction of gold nanoparticles. This was the first report of anisotropic gold nanoparticles like truncated icosahedral and rod shaped morphologies being synthesized by an agricultural by-product. Heavy metals and other precious elements from mining and electronic leachates, which will otherwise pollute water-bodies and cause several disorders upon accumulation in humans can be removed using plants. In the process of recovery of metals like gold from aqueous solution, cone

Page | 23
hops biomass was used, which had strong binding ability to gold in a pH-dependent manner. The presence of carboxyl (–COOH) group on the surface of the biomass bound gold (III) and reduced it to Au. Here 0.2 M thiourea was used to strip off the gold from the biomass [110]. 1.2.5b Extracellular synthesis of gold nanoparticles by plant extracts Extracts of plants like geranium, Azadirachta indica, Cinnamomum camphora, Indian gooseberry, Eucalyptus, Pelargonium, have been successfully tested for nanoparticle synthesis. Various molecules like flavones terpenoids alkaloids and proteins were presumed to be acting as reducing and stabilising agents. Similarly secondary metabolites like phyllanthin, aloin and apiin demonstrated the formation of nanoparticles. The change in the concentrations of these extracts could be used with some success in tuning shape and size of the nanoparticles. Dried powder of alfalfa was used in the synthesis of novel nanomaterials based on bimetallic particles of rare earth metals, for example, europium–gold (Eu–Au) nanoparticles. When B. juncea was grown in soil containing gold chloride, silver nitrate and copper chloride, it synthesized Au–Ag–Cu alloy. The nanoparticles were in the size ranged from 5 to 50 nm. STEM–EDAX analysis confirmed that the nanoparticles consist of alloy and not as mixed phase of separate elements. 1.2.6 Biosynthesis of nanoparticles by algae Algae are eukaryotic aquatic oxygenic photoautotrophs. Among various algae, Chlorella sp. was found to uptake various heavy metals such as cadmium [111], uranium, copper, and nickel [112]. The extracts of C. vulgaris showed anti-tumor properties [113]. The dried algal cells were found to have strong binding ability towards tetrachloroaurate (III) ions to form algal-bound gold, which was subsequently reduced to form Au. Nearly 88 % of algal-bound gold attained metallic state and the crystals of gold were accumulated in the interior and exterior of cell surfaces with tetrahedral, decahedral and icosahedral structures.

Page | 24
A 28 kDa “gold shape-directing protein (GSP)” present in the extract of green alga, Chlorella vulgaris was used in the bio-reduction, and in the synthesis of size-and shape-controlled distinctive triangular and hexagonal gold nanoparticles. With increase in the concentration of GSP, gold plates with lateral sizes upto micrometres were produced [114]. Single crystalline silver nanoplates were synthesized using the extract of Chlorella vulgaris at room temperature. The proteins present in the extract functioned in the reduction of Ag ions and shape-controlled synthesis of nanosilver. The reduction process by a simple bifunctional tripeptide Asp-Asp-Tyr-OMe was involved in the formation and shaping of Ag nanoplates with low polydispersity. Bio-sorption and bio-reduction of gold(III) was reported in the biomass of Fucus vesiculosus (brown alga). Maximum uptake was at pH 7.0 and hydroxyl groups present in the mucilaginous polysaccharides, polyols and proteins of the algal cell wall were involved in the reduction of gold ions to gold nanoparticles [115]. Eco-friendly recovery of Au from dilute hydrometallurgical solutions and leachates of electronic scraps was possible by bioreduction with Fucus vesiculosus. 1.3 Template bound and Biomimetic synthesis Organic matrix composed of proteins and other biological macromolecules play a decisive role in nucleation and growth of inorganic materials in biological organisms. Proteins from bio-mineralising organisms have been used with some degree of success, in vitro, for synthesizing nanoparticles with specific compositions, sizes and shapes. Some well-studied examples include silica formation by silicateins [116], silaffins [34] and silica precipitating peptides [117]. Silicatein-α, a major filamentous protein associated with the spicules of demosponge Tethya aurantia has been utilized for the synthesis of titania and gallium oxide nanocrystallites [118]. Semiconductor quantum dots have been synthesized using phytochelatin by Mehra and coworkers [119-121]. Aizenberg and coworkers have successfully synthesized complex calcite

Page | 25
nanocrystals of varying morphology using acidic proteins isolated from abalone nacre [122]. In another biological approach for design of inorganic nanomaterials, small peptide molecules with high specificity towards particular inorganic moieties, have been designed by combinatorial phage display library. Though the method is rather cumbersome, it is extremely successful in synthesizing certain inorganic nanoparticles by the ability to identify a specific atomic composition, crystallographic orientation, or morphology of an inorganic entity [123, 124]. Highly stable gold nanoparticles have been synthesized using gold binding peptide in aqueous media [125]. Similarly synthesis of anisotropic structures of silver and their patterning has been demonstrated by using silver binding peptides identified through combinatorial phage display library [58]. Recently, directed synthesis of magnetic and semiconductor nanowires has been shown to occur using peptides isolated by phage display [126]. Similar strategy has been adopted for the synthesis of iron oxide nanoparticles by iron oxide binding peptides isolated from bacterial peptide display technology [127]. Attempts to adopt/utilize the constructional principles of natural materials have acquired the term biomimetics: the art of mimicking biological systems [128]. Inspirations from natural, bioinorganic structures have laid the foundations of a branch of synthetic procedure wherein nature’s architectural skills have been harnessed. Most of the work in this direction has been facilitated by the use of biological structures as templates for the synthesis of nanomaterials with complex morphologies. The reproducible formation of nanoparticle arrays in large scale with predefined lattice spacing and symmetries, is very important for the future development of nanoelectronics. Biomolecular templating can be very helpful in this regard, as the self-assembly of molecules into molecular arrays is an intrinsic property of many biological molecules. Thus bacterial cell surface [128], viruses [129] [130], DNA [131], proteins [132] small peptides [133] and even pollen grains [134] have been used for

Page | 26
the synthesis of nanostructures with a variety of compositions, sizes and shapes. Biological polymers are used as frameworks for the formation of inorganic structures such as calcium carbonates, hydroxyapatite, iron oxide and silica [135]. Douglas and co-workers have successfully employed S- layer of Deionococcus radiodurans for the synthesis of ordered arrays of oxides and magnetic nanoparticles [136]. Further, Sleytr and co-workers have demonstrated the use of bacterial S-layer in the formation of supramolecular structures of metals and semiconductor nanoparticles [136]. In this study ordered array of gold nanoparticles with uniform size of 4 nm was synthesized by the templating action of bacterial S-layer with square lattice symmetry. DNA has also been used for the synthesis of nanowires of metals [137, 138] and semiconductors [139]. Mann and coworkers have demonstrated the formation of super-paramagnetic, monodisperse iron oxide nanoparticles such as magnetite maghaemite and also semiconductor nanocrystallites such as CdS using iron storage protein-Ferritin [140, 141]. Extending their work, they have also synthesized CoPt nanoparticles and films with promising potential in ultra-high density data storage [142]. In recent contribution, an enzyme lumazine synthase has been used to synthesize iron oxide nanoparticles with an average diameter of 8 nm [143]. DNA can be used as an ideal template for the synthesis of nanoparticles due to some key features like: inherent nanoscale dimensions, high specificity exerted towards inorganic materials and structural flexibility to build a programmable assembly [144]. Due to the above-mentioned indigenous properties, DNA has been indeed used for the synthesis of conductive metallic wires [138, 144]. Also, nanowires of the semiconducting quantum dots have been synthesized using double stranded DNA [145]. Furthermore, DNA has been used as a template for the synthesis of nanowires of wide band-gap semiconductor, zinc oxide [146]. Fabrication of ordered nanomaterial superstructure has been demonstrated using DNA as designer templates [145].

Page | 27
Virus particles are yet another type of biological structure that can be applied as a bio-template for synthesis of nanomaterials. Tobacco mosaic virus (TMV) has been demonstrated to synthesize semiconductor nano-crystalline silica nanoparticles with mean diameter of 5 nm and 30 nm respectively [147]. The TMV particles have also been subjected to the synthesis of uniform film of magnetite composed of fine nanoparticles with 2 nm diameter [129]. Furthermore cowpea chlorotic mottle virus and cowpea mosaic virus have been used as nucleation cages for the mineralization of inorganic materials [148]. Besides viruses, protein-protein interactions have been used for organization and the assembly of nanoparticles. Streptavidin-biotin interaction has been used for uniform organization of gold nanoparticles separated by a minimum distance of 4 nm [149]. In a novel biomimetic approach for the fabrication of nanomaterials, Mann and co-workers have demonstrated the use of pollen grains as a biological template for the synthesis of silver and CaCO3 nanoparticles [134]. Thus, in addition to supplying useful materials in their own right, the nature provides endless diverse templates for the design of synthetic materials with sophisticated structure and function. Biomimetic and biological means of nanoparticles synthesis is in a rudimentary stage and far from the ease offered by chemical synthesis protocols. Growing research in this direction would render these methodologies as competent as chemical methods of nanomaterials synthesis. Also, nanomaterials formed by biological systems ranging from biological molecules to biological cells are fine examples of organic-inorganic hybrid materials with unique properties. 1.4 Scope of the work Bio-pesticides and bio-fertilizers are highly in demand for ecologically sustainable agricultural practices. Extensive studies on rock phosphate solubilizing filamentous fungi are undertaken in our laboratory. Similarly, enhancing the bio-fungicide potential of genus Trichoderma which is

Page | 28
used as soil or seed treatment against phyto-pathogenic fungi, is also an area of active research. These saprophytic fungi are copius producers of extracellular secretory products in the form of degradative enzymes, secondary metabolites, elicitors, organic acids and antibiotics [150]. The availability of such diverse molecules in the extracellular milieu may render these organisms the capability of extracellular reduction of metals ions and stabilization of their clusters to form nanomaterials. In addition to an extracellular protocol for synthesis of nanomaterials, the outlook was also to develop a biomass free procedure avoiding any direct contact of metal ions with the biomass. Hence the mycelia free filtrate of the fungi was harvested and in absence of any metal ion contamination the biomass can be used for agricultural purposes.
The mycelia free filtrate was tested for synthesizing a variety of nanomaterials like metallic particles and nano-composites. Among the nano-composites, synthesis of gold silver alloys and carbon nanotube bound silver nanoparticles was attempted. The ability of the mycelia free filtrate to form titania nanoparticles and palladium dispersed titania nanoparticles from precursors titanium isopropoxide and palladium chloride in a single step process was investigated. Catalytic application of these nanoparticles was also probed. The role of biomolecules of the mycelia free filtrate in reduction of metal ions and their stabilisation via capping was elucidated using spectroscopic and electrophoretic analysis. The remnant biomass, after withdrawing the mycelia free filtrate, was tested for efficacy in biological control of Pythium induced “damping off” of chilli seedlings in pot culture studies.
A biomimetic synthesis of silver nanoparticles, by cysteine, as a possible alternative to the mycelia/cell free filtrate was attempted. The nanoparticles produced therein, were compared with the biosynthesized ones in terms of morphology, stability, mechanism of capping and antibacterial properties.

Page | 29
Application of silver nanoparticles obtained by the reaction with the mycelia free filtrate in wound dressings and as nanofluids in suppression of flow instabilities in natural circulation loops was demonstrated.

Page | 30

Page | 31
2.1 Screening of mycelia-free filtrate from agriculturally important fungi for silver nanoparticle formation 2.1.1 Cultures screened for nanoparticle synthesis The following agriculturally important fungi namely Aspergillus niger, Penicillium sp., Trichoderma virens, TPW and Trichoderma sp. were screened for silver nanoparticle formation. They were maintained on slants of Potato Dextrose Agar. 2.1.2 Obtaining the mycelia free filtrate The cultures were inoculated in a defined media, as follows: TABLE 2.1.1.Composition of liquid culture medium for growing fungi
Constituents of Culture Amount (g/l) K2HPO4 2 KH2PO4 7 MgSO4 0.1
(NH4)2SO4 1 Dextrose 10
Yeast Extract 0.6 The fungi listed above were grown separately in the aforementioned liquid culture medium in 500 ml Erlenmyer flasks. The inoculated broth was maintained at 25C under constant agitation at 150 rpm in an orbital shaker for three days. Each of the resultant mycelial mass from different fungi was filtered through sterile Whatman No. 1 filter paper. The harvested mycelial mass on the filter paper was then washed thoroughly with sterile distilled water to remove any adhering media components. Excess water was removed by press drying using paper towels and blotting sheets while retaining the biomass in the sterile Whatman paper. Five grams of the wet fungal mycelia was suspended in 50 ml of sterile deionized water and incubated at 25C for three days while being continuously agitated at 150 rpm. The mycelial suspension so obtained was filtered through Whatman No. 1 filter paper. The filtrate from the mycelial suspension was centrifuged at

Page | 32
11000 rpm (12000g) to remove all suspended materials like mycelial debris. The supernatant was passed through 0.45 µm filter paper in a Millepore vacuum filtration device. Thus mycelia free filtrate or cell free filtrate was obtained. 2.1.3 Screening the mycelia free filtrates of the five fungi for silver nanoparticle formation 10 mM silver nitrate: 0.169 g of silver nitrate (Aldrich ) was dissolved in 100 ml deionized water and the resultant solution was filter sterilized. To 45 ml of the filtrate, 5 ml of 10 mM silver nitrate was added to yield 1 mM concentration of silver. The reaction was allowed to proceed in dark at ambient temperature (~250C) and under constant agitation at 150 rpm in an orbital shaker. Another part from the stock of the mycelia free filtrate, processed under identical conditions but without AgNO3 solution served as a control. UV visible spectrophotometry The filtrates of the fungi were observed for colour change and appearance of the characteristic plasmon peak for silver nanoparticles. This was monitored by UV Visible spectrophotometry (wavelength scan mode from 200-800 nm) in absorbance mode in a JASCO 5300 UV-visible spectrophotometer. The cell free filtrate of the fungi which gave the most well defined peak in UV visible spectrophotometry was further identified using molecular techniques. 2.2 Identification of fungi by molecular techniques Extraction of genomic DNA Composition of extraction buffer: 100 mM Tris HCl pH 8, 50 mM EDTA pH 8, 500 mM NaCl. Fungi were grown in potato dextrose broth at 30°C under shaking condition (150 rpm) for two days. This non sporulating culture was passed through Whatman No. 1 filter paper to retain the fungal mycelia. This mycelial mass was blot dried using paper towels and blotting sheet. The

Page | 33
biomass was ground to fine powder in a mortar and pestle after treating with liquid nitrogen. 2 g of the powder was taken in a 50 ml tube to which 5 ml of extraction buffer (10 mM TrisHCl and 1 mM EDTA pH 8) was added and vortexed. This was followed by addition of 350 ul of 20% SDS and mixed by tapping and inversion. The lysate was incubated at 65oC for 10 mins followed by addition of 170 ul, 5 M potassium acetate. Further incubation of the lysate on ice was carried on for 20 min. 500 ul of chloroform was mixed with the lysate by inversion and centrifuged at 14000 rpm for 10 mins at room temperature. The resultant supernatant was transferred to a fresh tube. 500 ul of isopropanol was added to the supernatant and centrifuged at 10000 rpm for 2 mins. The pellet was washed with 70% ethanol at 10000 rpm for 1 min at room temperature. The washed pellet was dried in a laminar flow and dissolved in 250 ul Tris EDTA buffer (10 mM TrisCl and 1 mM EDTA pH 8) by incubating at 65oC for 5 mins. Aliquot of the extracted DNA sample was run on agarose gel to check the quality of the extracted DNA and to gain a fair idea about the quantity present.
PCR amplification of the ITS region
The extracted DNA was used as a template to amplify the internal transcribed spacer region of the genome by polymerase chain reaction (PCR). The internal transcribed spacer region flanking the 5.8SrRNA was amplified using forward primer ITS 1 (TCTGTAGGTGAACCTGCGG) and ITS 4 (TCCTCCGCTTATTGATGC) [151]. The reaction mixture of 25 µl contained: 100 ng DNA, appropriate primers at 0.8pM, dATP, dCTP, dTTP, dGTP each at 800 µm, 2.5 mM MgCl2, 1X Taq DNA polymerase buffer and 1U of Taq DNA polymerase. The PCR was carried out in a master cycler gradient PCR machine. The thermal cycling programme included an initial denaturation at 94ºC for 5 mins followed by 30 cycles of denaturation at 94ºC, primer annealing at 55°C for 1 min and primer extension at 72ºC for 1.5 min. This was followed by a final

Page | 34
extension step at 72ºC for 10 mins. The tubes were cooled to 4ºC. The PCR products were resolved by electrophoresis on 0.8% agarose gel containing 0.5 µg/ml ethidium bromide, at 80V, 25mA for about 2 hours using 0.5X standard TBE buffer (44.5 mM Tris, 44.5mM boric acid, and 2 mM EDTA), pH 8.3. The fragments amplified from the ITS region, were purified from the gel by using QIA gel extraction kit (QiagenInc, Valencia, CA). Cloning The purified PCR products from the fungal isolate was cloned into pT257R/T vector by using InsT/Aclone PCR product cloning kit (Fermentas, USA). The positive clones were detected by the appearance of white colonies in LB amp plates supplemented with 160 µg/ml IPTG, 80 µg/ml X-gal and 100 mg/ml ampicillin. Colony PCR was done with ITS 1 and ITS 4 primers to check for the presence of the insert in the plasmid. The plasmid was extracted with Roche Hi Pur plasmid extraction kit. Internal Transcribed spacer region sequencing and sequence analysis The insert from the plasmid was sequenced using M13 primers (TGTAAAACGACAGGCCAGT), corresponding to the vector sequence. The cycle sequencing was carried out in a reaction volume of 10 µl with ABI Big dye terminator cycle sequencing ready reaction kit in a Perkin Elmner Geneamp PCR system 9700, as per the protocol suggested by the supplier (Applied Biosystems, CA, USA). The extension products were purified by ethanol and sodium acetate precipitation. The products were stored in -20 ºC deep freezer till further use. The products were reconstituted in TE buffer and were loaded and resolved in a 5 % polyacrylamide gel in a ABI Prism 377 automated DNA sequencer. The nucleotide sequence of the internal transcribed spacer region of the test isolate was carried out online at

Page | 35
http://www.ncbi.nim.nih.gov using the BLAST programme for the nucleotide database maintained in Genbank. 2.3 Synthesis of silver nanoparticles and their characterisation The fungi that yielded the best results (well defined surface plasmon resonance peak) for silver nanoparticle formation in UV visible spectrophotometry was identified to be Trichoderma asperellum. Silver nanoparticles formed by mycelia free filtrate of this fungi was characterised in detail. Trichoderma asperellum biomass was grown in a defined medium as mentioned in and mycelia free filtrate was obtained as described section 2.1. To one part of the filtrate, analytically pure silver nitrate (Aldrich) was added and its concentration was made up to 1mM. The reaction was allowed to proceed in dark at ambient temperature (~250C ) and under constant agitation at 150 rpm in an orbital shaker. Another part from the stock solution, processed under identical conditions but without AgNO3 solution served as a control. Following characterizations were done for ascertaining the formation of silver nanoparticles UV visible spectrophotometry Progress in the reaction in both the sets of solution was monitored continuously using UV-vis spectrophotometry in a JASCO double beam UV-vis spectrophotometer model V-530 with a resolution of 1 nm. Wavelength scan between 200 nm to 800 nm was done in absorbance mode. The same instrument and same settings were used in the case of gold nanoparticles X-Ray diffraction studies X-ray diffraction (XRD) is the most extensively used technique to identify the crystalline phase of a solid material and also to determine its crystal structure. The principle of XRD technique is based on diffraction of X-rays by a crystal consisting of well-defined array of atoms, ions and

Page | 36
molecules. Since the lattice of a crystal consists of parallel arrays of atoms equivalent to the parallel planes of the diffraction grating, the inter-planar spacing could be successfully determined, from the separations of bright fringes of the diffraction pattern. These interplanar spacings (or distances) have nearly the same magnitude as the wavelength of X-rays (0.5 to 2 Å) and hence, crystal planes act as diffraction gratings. Interaction of X-rays reflected by a set of parallel planes satisfying Bragg’s condition lead to constructive interference only at a particular angle. The Bragg condition for the occurrence of such diffraction can be written as: ....2.1 where, is wavelength of X-rays, is the glancing angle (called as Bragg’s angle), d is inter-planar separations, and n is the order of diffraction. Upon completion of the reaction as adjudged from the UV-vis spectrophotometry, 5ml of the same solution was drop cast and dried under IR lamp followed by calcination at ~200C and 400C for XRD measurements. XRD measurements were done on a Philips X'pert Pro XRD unit with CuK radiation at 20 kV & 30 mA under static air condition. In all other sections where XRD analysis was done, the same instrument was used. The approximate size of a crystal can be estimated from broadening of the X-ray peak by the Scherrer’s formula, The Scherrer equation, in X-ray diffraction and crystallography, is a formula that relates the size of sub-micrometer particles, or crystallites, in a solid, to the broadening of a peak in a diffraction pattern. It is named after Paul Scherrer.
sin2dn

Page | 37
The Scherrer equation can be written as:
where:
τ is the mean size of the ordered (crystalline) domains, which may be smaller or equal to the grain size;
K is a dimensionless shape factor, with a value close to unity. The shape factor has a typical value of about 0.9, but varies with the actual shape of the crystallite;
λ is the X-ray wavelength; β is the line broadening at half the maximum intensity (FWHM), after subtracting the
instrumental line broadening, in radians. This quantity is also sometimes denoted as Δ(2θ);
θ is the Bragg angle.
Transmission electron microscopy Transmission Electron Microscopy is used to determine the morphology of particles (can detect particles upto 1 nm or even lower in case of High Resolution TEM). In TEM, a beam of highly focused electrons is directed towards a thin sample where the highly energetic incident electrons interact with the atoms in the sample, producing characteristic radiation and thus provide the necessary information for characterization of various materials. Information is obtained from both transmitted electrons (i.e. image mode) and diffracted electrons (i.e. diffraction mode). The image mode provides the information regarding micro-structural features whereas the diffraction mode is used for crystallographic information. The transmission electron microscopes are

Page | 38
generally operated at voltages as high as 200 kV with a magnification of 300000 X. If the main objective is to resolve the finest possible details in specially prepared specimens, it is advantageous to use the shortest possible wavelength illumination (i.e., high voltage), an objective lens with very low aberrations and a microscope with extremely high mechanical and electrical stabilities, since high resolution requires both high instrumental resolving power and high image contrast. This special technique is termed as high-resolution transmission electron microscopy (HR-TEM). The solution of silver nanoparticle was drop cast on a carbon coated copper grid and allowed to dry in air in a laminar flow cabinet. Transmission electron micrographs and selective area electron diffraction (SAED) patterns were recorded. All the other samples in the following sections were drop casted on carbon coated copper grids, dried and viewed in a JEOL 2000FX microscope at 160 kV, unless specified otherwise. Specimens for high resolution TEM images were also processed. (HR-TEM) images were taken with a FEI-Tecnai T-20 microscope operating at 200 kV unless specified otherwise.
Dynamic Light Scattering Dynamic light scattering (also known as photon correlation spectroscopy or quasi-elastic light scattering) is a technique that can be used to determine the size distribution profile of small particles in suspension or polymers in solution. Since DLS essentially measures fluctuations in scattered light intensity due to diffusing particles undergoing Brownian motion, the diffusion coefficient of the particles can be determined. The hydrodynamic sizes of the particles can be calculated using Stokes Einstein formula.
("Stokes-Einstein equation", for diffusion of spherical particles through a liquid)
D is the diffusion constant

Page | 39
η is the dynamic viscosity; r is the radius of the spherical particle. kB is Boltzmann's constant;
DLS measurements of the solutions were performed using a Malvern 4800 Autosizer employing 7132 digital correlator. The light source was 15mW He–Ne laser operated at 633 nm wavelength. Measurements were done at 90˚ scattering angle. The average decay rates of electric field correlation function [τ(tau)] and the diffusion co-efficient of the nanoparticles were obtained from cumulant method of analysis. 5 ml of the representative sample of silver nanoparticle solution was taken in a cuvette for dynamic light scattering studies. Some experiments were carried out in a photon correlated particle size analyzer developed in house that uses 532 nm line of He-Ne laser as the source for excitation. 2.4 Synthesis of gold nanoparticles and studies on evolution of morphology 10 mM chloroauric acid stock solution: 0.393 g of chloroauric acid (Himedia) was dissolved in 100 ml deionised water. The solution was filter sterilized by passing through 0.45 µm filter membranes. The cell free filtrate of Trichoderma asperellum was obtained as stated before in section 2.1. 45ml of filtrate was then added to 5 ml of 10 mM chloroauric acid (HAuCl4). UV visible spectrophotometry, X-Ray diffraction studies and Transmission electron microscopy were done in the same way as mentioned in the section 2.3

Page | 40
Atomic force microscopy The nanoparticle sol was centrifuged at 5000 g which led to the relative enrichment of larger structures namely nanotriangles and prisms at the bottom of the tube. This fraction was drop cast on the polished side of silicon single crystal wafer as a single layer (~10 µl). Atomic force microscopy was done in contact mode in a NTMDT Solvar 47 equipment. Measurements on morphology and surface roughness were done. 2.5 Synthesis of platinum and palladium nanoparticles Platinum nanoparticles Hexachloroplatinic acid: 1g was dissolved in 100 ml deionised water to give a solution of final concentration of 24.4 mM. 5ml of the salt solution was added to 45 ml of filtrate to give a final concentration of 2.4 mM. The reaction was allowed to proceed in an orbital shaker for 14 days till the colour of the solution turned dark brown from yellow.
X-Ray diffraction studies and Transmission electron microscopy were done in the same way as mentioned in section 2.3 Energy Dispersive Spectroscopy The nanoparticles were washed by repeated centrifugation at 17000 rpm. EDS of the nanoparticles was obtained by depositing in glass and recording the EDS spectrum in an using a VEGA 40, Tescan Scanning Electron Microscope, Czechoslovakia and INCA energy 250 EDX System, Oxford Instrument, United Kingdom. The details of this technique is mentioned in section 2.6

Page | 41
Palladium nanoparticles Palladium chloride: 1g was dissolved in 100 ml deionised water to give a solution of final concentration of 56.4 mM. The solution was filter sterilised. For synthesis of Pd nanoparticles, 1.5 ml of 56.4 mM PdCl2 (from Aldrich) was added to 48.5 ml of the cell free filtrate and incubated an orbital shaker at 25˚C for 4 days. X-Ray diffraction studies and Transmission electron microscopy was done following the same procedure as in section 2.3. As grown sample was used for XRD studies. 2.6 Synthesis of gold-silver nanocomposite 10 mM stock solution of chloroauric acid was prepared by dissolving 0.393 g in 100 ml deionised water. Aliquots of this solution were filter sterilised. Similarly 10 mM stock of silver nitrate was prepared by dissolving 0.169 mg of silver nitrate in 100 ml deionised water and filter sterilised. The aforementioned two salts were added in the following proportions to 45 ml of cell free filtrate Table 2.6.1 The molar ratios of gold to silver added initially has been indicated
10 mM chloroauric acid ml
10 mM Silver nitrate ml
Initial molar ratios of Au:Ag
1 4 1:4 2 3 2:3
2.5 2.5 1:1 3 2 3:2 4 1 4:1
Five different flasks were incubated in an orbital shaker at 150 rpm at ~250C.

Page | 42
UV visible spectrophotometry and X-Ray diffraction and Transmission electron microscopy studies were done in the same way as mentioned in section 2.3
Energy dispersive spectroscopic analysis It is an analytical technique used for the elemental analysis or of a sample. To stimulate the emission of characteristic X-rays from a specimen, a high-energy beam of charged particles such as electrons or protons (see PIXE), or a beam of X-rays, is focussed into the sample being studied. At rest, an atom within the sample contains ground state (or unexcited) electrons in discrete energy levels or electron shells bound to the nucleus. The incident beam may excite an electron in an inner shell, ejecting it from the shell while creating an electron hole where the electron resided. An electron from an outer, higher-energy shell then fills the hole, and the difference in energy between the higher-energy shell and the lower energy shell may be released in the form of an X-ray. The number and energy of the X-rays emitted from a specimen can be measured by an energy-dispersive spectrometer. As the energy of the X-rays are characteristic of the difference in energy between the two shells, and of the atomic structure of the element from which they were emitted, this allows the elemental composition of the specimen to be measured. All the five samples having different proportions of initial amounts of gold and silver were washed by repeated centrifugation at 20000 rpm and made into a thick coating by alternate steps of adding sample and drying. The dried samples was subjected to EDS measurements at 30 keV, VEGA 40, Tescan Scanning Electron Microscope, Czechoslovakia and INCA energy 250 EDX System, Oxford Instrument, United Kingdom. The relative atomic percentages of gold and silver in the composite sample were obtained. In order to find out if there was uniform co-occurrence of silver and gold in the sample EDS recordings was repeated in line scan mode over a distance to approximately 100 µm.

Page | 43
2.7 Synthesis of silver–CNT composites Multi walled carbon nanotubes (MWCNT) were purchased from Monad Technologies. 100 mg of carbon nanotubes was suspended in 25 ml of deionized water. In order to open the caps at the end of the carbon nanotubes the powdery suspension was sonicated for 45 mins. 5 ml of such product was suspended in 40 ml of cell free fungal filtrate containing 5 ml, 10 mM silver nitrate. The resultant mixture was incubated in an orbital shaker for 5 days at 150 rpm at 25˚C. X-Ray diffraction studies The CNT-Ag nano composite was coated on glass for XRD measurement without any heat treatment. Functionalization of the nanotube surfaces 100 mg of carbon nanotubes was added to 25 ml of concentrated nitric acid and the mixture was refluxed at ~125˚C for 5 hours. Thus the nanotubes were rendered dispersible in water. 5ml of this dispersion was added to 40 ml of fungal filtrate together with 5 ml, 10 mM silver nitrate. It was incubated in an orbital shaker at 25˚C for 5 days. Following this, the dispersion was drop cast on carbon coated copper grids for TEM and Energy Filtered TEM studies The solution of functionalised CNT–silver hybrid was drop cast on carbon coated copper grids for TEM in a Carl Zeiss Libra transmission electron microscope at an operating voltage 120 kV. Elemental mapping was performed on the electron dense areas using Energy Filtered Transmission Electron Microscopy (EF-TEM) as described earlier [152]. The slit width of the energy filter was set for silver specific edge of 368 eV and 451 eV peak maxima in the electron energy loss spectrum. Two images were taken using iTEM software, first at 368 eV (before silver specific electron energy loss) and second at 451 eV (at silver specific electron energy loss

Page | 44
maxima). The final elemental map was produced after background subtraction of 451 eV image from 368 eV image.
Antibacterial activity assay
Escherichia coli BW 21153 was grown to an optical density of 0.1 at 600 nm in Luria broth. 10 µl of this culture was inoculated to 5 ml of Luria broth suitably supplemented with various concentration of silver, in the carbon nanotube silver composite (0.54 µg/ml to 8.64 µg/ml). In a previous experiment it was determined that pristine MWCNT and non-functionalized Ag-CNT remained phase separated from the aqueous layer. Non functionalized Ag-CNT composite and pristine CNT were run parallelly as control along with tubes with specified inoculum only. All the treatments were done in triplicates. The inoculated tubes were incubated in an orbital shaker at 37˚C overnight at 150 rpm. The tubes were visually inspected for presence of turbidity to determine the MIC. All the tubes were suitably diluted and plated on Luria agar plates to determine the bacterial counts after overnight incubation. The counts obtained as against various concentration of silver were plot after normalizing the data with counts obtained in control tubes. The lowest concentration of silver in the composite, for which the overnight inoculated liquid cultures did not exhibit any growth when reinoculated in Luria agar plates and incubated overnight, was determined. This concentration was designated as the minimum bactericidal concentration (MBC).
2.8 Synthesis of titania and palladium dispersed titania. Reagents required: Titanium isopropoxide (Sigma) and palladium chloride Palladium chloride: 1g of was dissolved in 100 ml deionised water to give a solution of final concentration of 56.4 mM

Page | 45
Cell free filtrate of Trichoderma asperellum was obtained as mentioned before in section 2.1. 3.6 ml titanium isopropoxide was mixed with 96.4 ml of the filtrate and incubated in an orbital shaker at 150 rpm and ~250C. In order to prepare palladium dispersed titania Pd-TiO2, 3.6 ml of titanium isopropoxide was added to 94.9 ml of cell free filtrate followed by addition of 1.5 ml PdCl2 to achieve (1.5 w/w%) loading of with respect to titania. The resultant suspension was incubated as stated above for 4 days After four days, the suspensions were centrifuged at 10000 rpm. The nanoparticles which formed a pellet were collected and air-dried. Finally, the crystalline samples of the nanoparticles were obtained by calcining at 350˚C for 4 h to be used for further characterization. X-Ray diffraction studies Calcined and uncalcined powders of the respective materials were dropcast on glass and XRD measurements were done as mentioned in section 2.3 Transmission electron microscopy The powdered samples of calcined TiO2 and PdTiO2 were suspended in solvent ethanol by sonication. The sample was drop-cast on carbon coated copper grids the TEM study. TEM images were recorded on JEM 2100 LaB6 TEM system, made in Japan operating under 200 kV. Diffuse reflectance UV-Visible spectrophotometry In UV-Vis reflectance spectroscopy of solids (shown in Fig. 2.10) two types of reflection are encountered: specular or mirror like in which the angles of incidence and angle of reflection are identical. The other mode is diffuse which is reflection from a matte structure and this one serves as the basis of reflectance spectroscopy. It is an effective way for obtaining the UV-visible spectra directly on powdered sample resulting from scattering, transmission and absorption interactions. Reflectance is given by: Reflectance (%) = Is/Ir x 100, where Is is the intensity of the reflected beam and Ir the

Page | 46
intensity of a reference standard usually barium sulphate. It is ideal for characterizing optical and electronic properties of many different materials such as ceramic powders, films, pigments etc. Band gap measurements of samples was estimated by recording their Diffuse reflectance UV-Visible spectra using spectrophotometer of JASCO model V-670, Japan, scanned in range of 200-1000 nm at the scanning speed of 200 nm/min. Kubelka–Munk transformation was applied to obtain the band gap. The band gap energy (Eg) was calculated by spectrophotometric absorbance data using following equation
ℎ = ℎ − g) where is the absorption coefficient, h is the photon energy in eV, and Eg is the band gap energy in eV. A is a constant related to the effective mass of the electrons and holes and n being equal to 0.5 for allowed direct transition and 2 for an allowed indirect transition. The intercept to the tangent of the plot of (Ahv)1/2 vs hv gives an estimate of the indirect band gap. Photocatalytic activity Photocatalytic activity was evaluated in a rectangular quartz reactor of dimensions 10 x 2.1 x 2.1 cm3 equipped with a sampling port provided with a septum through which gas mixture could be removed for analysis. 50 mg of catalyst sample (TiO2 and Pd-TiO2 nanocomposite) was kept in contact with water & methanol mixtures (total volume of 15 ml, 2:1 v/v %) irradiated under water-cooled medium pressure mercury vapour lamp (Hg, Ace Glass Inc., 450W) placed horizontally in a chamber close to the lamp. Figure 2.7.1a displays the typical outer irradiation quartz assembly consisting of photoreactor and the light source along with water circulation jacket to absorb IR irradiation. The lamp exhibits broad range emission spectra (Fig. 2.7.1 b) with maxima at both UV and the visible range (16% UV, rest is visible light). The reaction products were analysed after every 2 h for a period of ~ 6 h using a gas chromatograph (Netel

Page | 47
(Michro-1100), India) equipped with a thermal conductivity detector (TCD), molecular sieve column (4m length) with argon as carrier, in the isothermal temperature mode at 50°C oven temperature. The intensity of the light source was measured using a calibrated precision lux meter (cal-Light 400). The number of photons falling on the reaction cell or flux of the light was determined using a calibrated lux meter (cal-Light 400). It was observed to be 5.34*1017
photons/sec when placed horizontally under UV-visible photoirradiator.
Fig. 2.7.1(a) Representation of the outer irradiation reaction assembly for evaluation of photoactivity under UV-visible light. In the outer irradiation assembly the photoreactor is placed parallel to the source of light. (b) Emission spectra of UV-Visible medium pressure mercury lamp ((Hg, Ace Glass Inc., 450W).

Page | 48
Fig. 2.7.1(c) Actual photograph of the photo-irradiation assembly for evaluation of photoactivity. XPS measurements X-ray photoelectron spectroscopy (XPS) is a semi-quantitative spectroscopic technique that measures the elemental composition, empirical formula, chemical state and electronic state (oxidation state) of the elements that exist within a material. XPS spectra are obtained by irradiating a material with a beam of aluminium or magnesium X-rays while simultaneously measuring the kinetic energy (KE) and number of electrons that escape from the top 1 to 10 nm of the material being analyzed. XPS requires ultra-high vacuum (UHV) conditions. Powdered sample were drop-cast on glass and XPS was done on a system (M/s SPECS make) with Al X-Ray as a source (1486.6 eV). The vacuum of the sample chamber was maintained below 10-
9 Torr. Prior to measurement, calibration was carried out using standard C1s peak at 284.5 eV. Raman spectroscopy Raman spectra were recorded for dropcast powdered samples on a micro-Raman spectrometer LabRam-I (Jobin Yvon Spex make). 488 nm line of the Ar laser was used for excitation and the

Page | 49
scattered light was analysed using a single monochromator and a Peltier cooled CCD detector was used for detection. EDXRF Calcined palladium dispersed titania samples were coated on glass substrates and subjected to EDXRF measurements using EX-3600M EDXRF spectrometer (Jordan Valley, Israel). 2.9 Plausible mechanism of formation of nanoparticles using silver nitrate 2.9.1 Spectroscopic evidences FT-IR measurements The infrared region of the electromagnetic spectrum encompasses radiation with wavelengths ranging from 1 to 1000 microns. From the standpoint of both application and instrumentation, this range is divided into three regions; Near IR (12500 – 4000 cm-1), Mid IR (4000 – 200 cm-1) and Far IR (200 – 10 cm-1). The majority of analytical applications are confined to a portion of the middle region extending from 4000 to 400 cm-1 or 2.5 to 25 μm. The absorption spectra in the infrared region originate from the transitions between vibrational (along with rotational) levels of a molecule present in its ground electronic state, upon irradiation with infrared radiation. Whether for the functional groups or the entire molecule, the vibrations are universally classified either as stretching or as bending types. Stretching vibrations, which correspond to the oscillations leading to change in bond lengths, can be further sub-divided into symmetric or asymmetric stretching vibrations. Bending vibrations are characterized by continuously changing angle between the bonds and is further sub classified as wagging, rocking, twisting, or scissoring

Page | 50
The IR spectra were recorded as thin films. To make a thin film, 1 to 2 drops of the neat liquid sample was placed between two KBr crystals using a Pasteur pipette making sure that bubbles were not there within the thin film. The crystals were pressed together and mounted on a holder. The samples were scanned with a JASCO model 4100 FT-IR spectrophotometer, and were analyzed using Spectra Manager® software. FTIR spectrum of the cell free filtrate (a) before addition of AgNO3 to it and (b) after removal of silver nano-particles by centrifugation were recorded. Raman spectroscopy Raman spectroscopy (named after Sir C. V. Raman) is a spectroscopic technique used to observe vibrational, rotational, and other low-frequency modes in a system. It relies on inelastic scattering, or Raman scattering, of monochromatic light, usually from a laser in the visible, near infrared, or near ultraviolet range. The laser light interacts with molecular vibrations, phonons or other excitations in the system, resulting in the energy of the laser photons being shifted up or down. The shift in energy gives information about the vibrational modes in the system. Infrared spectroscopy yields similar, but complementary, information. Raman spectroscopy is commonly used to provide a fingerprint by which molecules can be identified. The silver nanoparticle sample was drop-cast on Si 100 and dried under an IR lamp. A macro-Raman setup was used for recording Raman spectra of the samples. 532 nm line of a diode laser was used for excitation and the scattered light was analyzed using 0.9 m single stage monochromator and a CCD detector. 2.9.2 Interaction of cysteine with silver nitrate Synthesis of Ag-nps: Stock solution of 10 mM cysteine was prepared by dissolving 121.1 mg of cysteine (from Sigma) in 100 ml of de-ionized (DI) water. Similarly, a 10 mM stock of 169.87

Page | 51
mg of AgNO3 was made in 100 ml DI water. The two stock solutions were mixed very slowly at room temperature (~24C) in varying proportions and samples containing the desired starting concentration of each component were obtained. Table 2.9.2.1 gives the concentrations of cysteine and AgNO3 in the four samples studied, hereafter designated as samples A, B, C and D. Aqueous solutions of the individual reagents were also studied as control. The samples were left (covered with Al foil) at room temperature (~24C) for few days under observation.
Table: 2.9.2.1 Nomenclature of the samples with different concentrations of cysteine
UV-Vis spectrophotometry, XRD, TEM & DLS UV-vis spectrophotometry and X-ray diffraction studies were done as mentioned in section 2.3 TEM images were recorded on samples carbon coated copper grids using a Zeiss LIBRA microscope operated at 120 kV. Dynamic light scattering and zeta potential measurements were carried out on Malvern Zeta Sizer Nano-ZS. Raman spectroscopy Raman spectra was recorded on samples drop cast on silicon single crystal using an indigenously developed confocal micro-Raman setup configured around Horiba JobinYvon spectrograph. 532
Samples Cysteine (mM)
AgNO3 (mM) A 0.001 1 B 0.01 1 C 0.1 1 D 1 1

Page | 52
nm of frequency doubled diode pumped solid state Nd: YAG laser source was used for excitation.
X-ray photoelectron spectroscopy
X-ray photoelectron spectra were obtained with a VG Scienta made spectrometer with single channeltron detector having a resolution of < 1eV using Mgkα radiation of SPECS make XR 50 twin X-ray source. The base pressure of the experimental chamber was < 10-8 mbar during the measurement. All the XPS spectra were corrected for any possible instrumental shift by referencing against the standard C1s peak (at 285eV).
Antibacterial studies Wild type E. coli BW (25113) was cultured in a fresh medium (Luria broth) and was allowed to grow overnight. Under these conditions, cell density was found to be of the order of 109/ml. Fifty micro-litre of the culture containing ~5*108 cfu/ml was added to 5 ml of fresh culture medium supplemented with various dose of Ag-nps ranging from 1.08 µg/ml to 8.64 µg/ml. Antibacterial activity of both cysteine-capped and biologically grown silver nanoparticles was then studied as a function of silver concentration. Two sets of control, one without the Ag sols but with the same quantity of inoculum, and the other with similar concentrations of the Ag sols but with no added inoculum were simultaneously maintained. All studies were done in triplicates. Care was taken to let aerobic environment develop within the snap cap tubes. Overnight incubation of all the tubes was carried out at 37°C in an orbital shaker at 150 rpm. The samples were analysed after overnight incubation for visual monitoring of turbidity and the MIC values for the respective samples were determined. Appropriate serial dilution of the tubes was done and these dilutions were seeded in Luria agar plates. The plates were incubated at 37°C for 18 h and the number of resultant colonies in each plate was counted and recorded for further and determination of

Page | 53
minimum bactericidal concentration (MBC). 2.9.3 Experiments to discern the nature of the bio-macromolecule involved in nanoparticle synthesis
(a) Effect heat treatment (of the filtrate) on its nanoparticle formation ability: The cell free filtrate was boiled till half the volume of the filtrate was evaporated. The loss in volume was compensated for with sterile deionised water. 5 ml of 10 mM silver nitrate was added to the heat treated filtrate after it attained room temperature. Similar amount of silver nitrate was also added to non heat treated filtrate i.e. (filtrate obtained as such). Both the experimental sets were incubated at 25˚C at 150 rpm in an orbital shaker for 5 days. Silver nanoparticle formation was assessed by UV-visible spectrophotometry in wavelength scan mode as mentioned before.
(b) Effect of dialysing the filtrate on its nanoparticle formation ability: 100 ml of the cell free filtrate was dialysed using 10 kDa cut-off dialysis bag against distilled water for eight hours giving 4 changes at 4ºC. 5 ml of 10 mM silver nitrate was added to 45 ml of the dialysed filtrate. Similar amount of silver nitrate was also added to undialysed filtrate i.e. (filtrate obtained as such). Both the experimental sets were incubated at 25˚C at 150 rpm in an orbital shaker for 5 days. Silver nanoparticle formation was assessed by UV-visible spectrophotometry in wavelength scan mode.
(c) Effect of supplementing NADH to the dialysed filtrate on nanoparticle formation. Preparation of stock solutions
10 mM NADH: 7.1 mg NADH (Sigma) was dissolved in 1 ml deionised water. 10 mM NAD: 6.6 mg NAD (Sigma) was dissolved in 1 ml deionised water.
Page | 54
10 mM silver nitrate: 0.169 mg silver nitrate (Aldrich) was dissolved in 100 ml deionised water. In-order to check the effect of replenishing NADH to the dialysed filtrate, the following reaction was set up using the stock solutions prepared above: 200 µl of dialysed filtrate, 50 µl of silver nitrate, 245 µl of deionised water and 5 µl of NADH. A control containing 5 µl of NAD instead of NADH was included. Controls containing water instead of dialysed filtrate, but treated similarly with NADH or NAD and silver nitrate were also set. Silver nanoparticle formation was monitored after 18 h of incubation, by UV visible spectrophotometry.
Ultrafiltration of cell free filtrate:
918 ml of cell free filtrate was concentrated to 40 ml in an Amicon stirred cell device using regenerable cellulose acetate (YM 10) 10 kDa cut-off membrane under positive pressure. The concentrated cell free filtrate obtained at this stage will be termed as retentate. The protein concentration of the retentate was determined using standard BCA kit.
The retentate was tested for silver nanoparticle formation with 1 mM silver nitrate. Since silver nanoparticle formation was not observed, the retentate was replenished with 0.1 mM NADH to check the revival of nanoparticle formation ability. Appropriate controls were run as will be mentioned.
(d) Effect of supplementing NADH to the retentate, on nanoparticle formation. Preparation of stock solutions: 10 mM NADH: 7.1 mg NADH (Sigma) dissolved in 1ml deionised water. 10 mM NAD: 6.6 mg NAD (Sigma) dissolved in 1ml deionised water. 10 mM Silver nitrate: 0.169 mg silver nitrate (Aldrich) was added to 100 ml deionised water Retentate: It was appropriately diluted by ~23 times and 200 µl was used for each treatment.

Page | 55
The following solutions were added from the stocks prepared, as above: 200 µl of diluted retentate, 50 µl of silver nitrate, 245 µl of deionised water and 5 µl of NADH, to add upto a total reaction volume of 500 µl. A control containing 5 µl of NAD instead of NADH was set up. A similar control containing retentate and silver nitrate but without NAD or NADH was also run. Silver nanoparticle formation was monitored after 18 h of incubation, by UV visible spectrophotometry.
Resolving proteins of the retentate by SDS poly acrylamide gel electrophoresis (SDS-PAGE) Sample preparation: 200 ul of the retentate was dried to 10 ul in a vacuum centrifuge at a low drying rate. This sample was reconstituted in Lammaeli buffer which was devoid of β-mercaptoethanol or dithiothreitol. The absence of BME or DTT ensured that the proteins structure remained close to their functionally active forms. It was then centrifuged at 14500 rpm to pellet out the undissolved debris. This sample was loaded on a 12% PAGE gel containing SDS. Voltage was fixed at 75 V for the stacking gel and 150 V for the resolving gel. Retentate samples were run in in five parallel lanes. The gel was cut into two longitudinally. Three lanes were preserved for staining with Coomassie R 250.
The other half of the gel containing retentate samples resolved in 2 lanes was preserved to study nanoparticle development with NADH and silver nitrate.
Page | 56
Post gel run, processing for nanoparticle development
The unstained half of the gel was washed twice with 1% triton-X-100 for 20 minutes each. This was followed by 3 washes in water for 15 minutes each. 1 mM NADH stock solution was made by dissolving 7.1 mg of NADH in 1 ml water. 10 ml of 10 mM silver and 1 ml of 10 mM NADH was added to the gel placed 89 ml of water. The gel was kept on a rocker overnight for nanoparticle development. The Coomassie stained bands corresponding to the area where colour development occurred were excised for mass spectrometry.
Transmission electron microscopy
The areas in the gel where highest colour development had occurred were excised, maserated and sonicated. 1 ul of the liquid was drop cast on TEM grids and observed in a FEI-Tecnai T-20 Transmission electron microscope.
Preparation of samples for MALDI-TOF-MS
Treatment of protein gel plugs for destaining, reduction, alkylation, in-gel trypsin digestion and elution of oligopeptides was performed as explained below. 1 mm3 gel spots were excised and transferred to 1.5 ml centrifuge tubes. The gel piece were washed with deionised water followed by destaining in 50 µl 50 mM NH4HCO3/ACN(1:1).This step led to dehydration of the gel pieces hence they were rehydrated in 50 mM NH4HCO3 (ammonium bicarbonate). After another dehydration step in ACN (acetonitrile), the gel pieces were dried in a vacuum centrifuge for one and a half minutes. Reduction of the disulphides bridges in the proteins was done with 10 mM DTT (dithiothreitol) in 50 mM NH4HCO3 followed by alkylation by 55 mM IAA (iodoacetamide) in ammonium bi-carbonate. IAA was quenched by washing with equal amount of 1:1 50 mM NH4HCO3:ACN. After a step of drying the gel particles in ACN, 2µl of trypsin

Page | 57
was added and incubated in ice for 30 mins. This was followed by overnight incubation in trypsin reaction buffer at 37ºC. The cleaved peptides were extracted in three steps : first in 0.1% TFA (trifluoro acetic acid), second in 0.1% TFA and ACN (1:1) and third in ACN. Approximately 75 µl of extracted peptides were dried in a vacuum centrifuge to 5 µl. Protein samples were subjected to mass spectrometry (UltraFlex III MALDI-TOF/TOF mass spectrometer, Bruker Daltonics, Germany). The oligopeptides were co-crystallized with CHCA (cyano-hydroxycinnamic acid) (5 mg/ml in 0.1% TFA and 30% ACN) on target plate (384-well stainless steel plate, Bruker Daltonics, Germany). The machine was externally calibrated using Peptide calibration mix I (Bruker Daltonics, Germany) or with the trypsin autodigest peptides. The mass spectra were generated in the mass range of 600-4500 Da using standard ToF-MS protocol in positive ion reflection mode. Laser was set to fire 150 times per spot. Peak list was generated using Flex Analysis software 3.0 (Bruker Daltonics, Germany) and mass spectra were imported into the database search engine (BioTools v3.1 connected to Mascot, Version 2.2.04, Matrix Science). Mascot searches were conducted using the NCBI non-redundant database (released in March 2014 or later with minimum of 38032689 entries actually searched) with the following settings: Number of mis-cleavages permitted was 1, fixed modifications such as carbamidomethyl on cysteine, variable modification of oxidation on methionine residue; peptide tolerance as 100 ppm; enzyme used as trypsin and a peptide charge setting as +1. In absence of genome data for Trichoderma asperellum hits for fungal proteins from other genera were accepted. Hits that had a mascot score of more than 65 with minimum of 6 peptide matches was accepted as significant identification [153] (p < 0.05) when sequence coverage was at least 20%.

Page | 58
Testing the nanoparticle formation ability of non-specific proteins. Commonly used proteins in the laboratory like bovine serum albumin (BSA), lysozyme, casein, casein hydrolysate and chymotrypsin were used. As mentioned above stocks of 10 mM NADH, 10 mM NAD and 10 mM silver nitrate were made. 1 mg of each protein was dissolved in 1 ml of deionised water. From the stocks of the protein solution, working standards of 100 µg/ml, 200 µg/ml and 350 µg/ml were made. Reactions for nanoparticle development were set up as follows: 200 µl aliquots of each working standard, 245 ul of deionised water, 5 ul of 10 mM NADH or (5 ul of 10 mM NAD in case of NAD control tubes) and 50 ul of 10 mM silver nitrate. Cyclic Voltammetry studies
Cyclic voltammetry was carried out using potentiostat and galvanostat instrument. Ecochemie, Netherland. Measurements were done using a three electrode system with glassy carbon working electrode, platinum counter electrode and Ag/AgCl, 3M KCl as reference electrode. Measurements were done on 0.1 mM NADH, NADH in presence of retentate or dialysed filtrate, (20 ul), mycelia free filtrate, dialysed filtrate and retentate.
2.10. Reusability of T. asperellum biomass in biocontrol (a) Laboratory study to show antifungal activity of Trichoderma biomass: Antifungal activity of T. asperellum biomass was studied by dual culture technique in petri plates as described by Morton and Stroube (1955) [154]. Petri plates (85 mm) containing potato dextrose agar (Himedia, India) were inoculated with 5 mm diameter mycelial disc of fresh culture of Pythium spp., Fusarium spp., Rhizoctonia solani, Sclerotium rolfsii and Aspergillus

Page | 59
niger on one side and equivalent amount of T. asperellum biomass at other side of the petriplates. The plates were incubated at 30°C. The radial growth was measured after 6 days of incubation. Plates with only Pythium spp., Fusarium spp., Rhizoctonia solani, Sclerotia rolfsii and Aspergillus niger served control. All the plates were taken in triplicates. The radii of the fungal growth were measured and % inhibition was calculated as follows:
where (dc) is radial growth measurement of the test organism (pathogen) in control and (dt) is radial growth of the pathogen in the presence of T. asperellum biomass.
(b) Preparation of Trichoderma asperellum biomass formulation:
After confirmation of antifungal activity by dual culture assay, we made a formulation of Trichoderma biomass for its field applications. T. asperellum biomass was grown in previously described liquid culture medium (section 2.1.1). Subsequently remaining biomass after harvesting the mycelia free filtrate was homogenized using a mixer grinder. The homogenized biomass was made into a formulation using talc powder as a carrier material (Talc: broth culture of T. asperellum in the ratio of 2:1 w/v with 2 ml of Triton X-100 per kg talc powder as adhesive) to obtain 1X10⁶ CFU/g in the final formulation This was used for the experiment after proper drying at room temperature.
(c) Trichoderma asperellum biomass amended biogas manure:
Biogas manure was obtained from Nisargruna biogas plant developed at BARC for processing biodegradable waste [155]. This manure has shown better nutrient content as compared to commonly available farm yard manure and also enhanced crop growth. Remnant biomass of Trichoderma after obtaining the mycelia free filtrate was used for amendment to this manure to
% inhibition of radial mycelial growth = ( − )/

Page | 60
obtain final spore count of 1X10⁶ CFU/g. This was further incubated at room temperature for 24 h before its application to pots.
(d) Pot culture study to show antifungal activity of Trichoderma asperellum biomass.
Disease inoculation and crop growth: To induce damping off disease 5 day-old Pythium spp. multiplied on presoaked autoclaved sorghum grains were mixed with the soil (2 g/kg soil). Total of 20 pots were used each filled with 0.5 kg non-sterile sieved field soil (Laterite red, pH-7.2, clay 60%, sand 10%, silt 30%, organic carbon-0.84% and nitrogen 0.09%) . The pots were watered regularly and observed for disease development up to 4-5 days. After complete growth of Pythium spp. in soil, the soil was again mixed thoroughly to get uniform spread of the disease. These pots were further used to sow chilli seeds. T. asperellum (T1) was applied as a seed treatment in the form of talc-based formulation at the time of sowing (10 g/kg seeds). Trichoderma amended with biogas manure (T2) was applied directly to the pots (5 g/pot). Chemical fungicide benomyl was applied to the third set of pots (T3) at standard application rates. Other two treatments viz. pots having soil with only Pythium spp. (T4) and without Pythium spp. (T5) served as infected and non-infected control respectively. Chilli (Capsicum annum L. var Phule Jyoti. MPKV Rahuri, M.S., India) was sown @ 10 seeds/pot. Germination was recorded soon after sowing and observations were taken up to 10 days
2.11 Applications of silver nanoparticles Biosynthesized silver nanoparticles were tested for two practical field applications.
(a) Suppression of flow instability in natural circulation loops Experiment on suppression of flow instability by nanofluids

Page | 61
Fig. 2.11.1: Schematic of experimental facility for studying suppression of flow instability in natural circulation loop
A natural circulation loop work on laws of buoyancy and gravity. They are used in heat removal system. Nanofluids are able to suppress flow instabilities in water. To substantiate the facts, we conducted experiments in a natural circulation loop with geometry as shown in Figure 2.11.1. The test facility is rectangular in geometry with circular flow cross-section area. The geometry is relevant to that of solar water heaters and nuclear reactors. The pipes are made of glass with inner diameter of around 26 mm. Important dimensions of the loop are shown in the Figure 2.11.1. The loop was heated with electric wire which was wound uniformly on the outer surface of the glass tube in the bottom horizontal leg. It was cooled at the top through a tube-in-tube type heat exchanger with tap water flowing through the annulus. In the experiment, initially water was heated from an initial power of 300 W in steps of 100 W. The experiments were repeated with silver nanofluid.
Cooling water outlet
Cooling water inlet
Heater
Cooler
Expansion Tank
2265.0
1515.0
784.0
1000.0
Locations for temperature measurements
Cooling water outlet
Cooling water inlet
Heater
Cooler
Expansion Tank
2265.0
1515.0
784.0
1000.0
Locations for temperature measurements
Cooling water outlet
Cooling water inlet
Heater
Cooler
Expansion Tank
2265.0
1515.0
784.0
1000.0
Locations for temperature measurements
Cooling water inlet
Heater
Cooler
Expansion Tank
2265.0
1515.0
784.0
1000.0
Locations for temperature measurements
Heater
Cooler
Expansion Tank
2265.0
1515.0
784.0
1000.0
Locations for temperature measurements

Page | 62
(b) Wound healing of canine patients Maggot infested wound of a stray canine patient was cleaned using betadiene. The wounds were dressed with nanosilver coated bandages. The bandages were made by applying 8 ml of 1 mM nanosilver solution to a gauge piece containing at-least 8 layers of bandage. The dimensions of the bandages were ~15X15 cm2. For the first 7 days that dressings were done, changes were given every 48 h. During the next two weeks dressings were changed every 4 days. Complete healing took place in 3 weeks without topical application of ointments that typically contain ofloxacin, clobestasol and myconazole.

Page | 63

Page | 64
3.1 Screening of mycelia-free filtrate from agriculturally important fungi for silver nanoparticle formation Microorganisms are ubiquitous in distribution and occupy all ecological niches [156], soil being an important one. The cycling of nutrients, organic carbon in particular is a major microbial activity that sustains soil health and agriculture [157]. Filamentous fungi occurring in soil play a decisive role in degrading organic matter since they are copious producers of extracellular enzymes and metabolites [158]. Fungi secrete a battery of enzymes to degrade hemicellulose and lignin [159]. In their saprophytic mode of nutrition food is digested outside the mycelium before intake. Thus complex organic substrates and lignin are degraded into much smaller sized colloidal organic matter in multiple steps [160]. In addition to this phosphate solubilizing activity, secretion of secondary metabolites which participate in biocontrol of pathogens are a few aspects over and above saprophytic mode of nutrition that benefit agriculture [161]. Enzymes and exudates from fungi aid in increasing availability of elemental nutrients or precipitating toxic heavy metals reducing their bioavailability. Thus filamentous fungi are promising candidates for exploring the possibilities of extracellular synthesis of metallic nanoparticles and composites. Additionally compared to other micro-organisms like bacteria their biomass is easy to obtain and handle. Fungi which were already being studied for agricultural applications were particularly taken up for screening for production of nanoparticles as this would have been a considerable value addition to its commercialization potential. As stated earlier a biomass free procedure was adopted for nanoparticle synthesis. This further facilitated its use in agriculture later avoiding expensive procedures for discarding the biomass. While Aspergillus niger and Penicillium sp. used in this experiment were phosphate solubilizing

Page | 65
organisms, Trichoderma virens, TPW and another species of Trichoderma. were biocontrol agents extensively used in agriculture. As an extension to the extracellular mode of synthesis, a biomass free procedure was developed for nanosynthesis for the following reason. The presence of biomass in the synthesis milieu complicates downstream processing to harvest the product [80]. Synthesized nanomaterials get adsorped on the cell surface necessitating treatment with detergents or ultrasonication to dislodge them [162]. Thus the idea of minimally energy intensive green synthesis barring the use of harsh chemicals is defeated. Since the biomass does not come in contact of the precursor salts it can be retained for future use as a starter culture or developed as a formulation, which will be demonstrated subsequently in section 3.10. The mycelia free filtrate was obtained by the procedure outlined in section 2.1 of materials and methods. To this filtrate obtained from equal amount of biomass of each fungi, a final concentration of 1 mM silver nitrate was added and processed further as explained in the material methods section. The formation of silver nanoparticles was monitored by UV visible spectrophotometry. Figure 3.1.1 depicts overlaid UV-visible wavelength scans recorded from 200 nm to 800 nm in the absorbance mode for the silver nitrate treated mycelia free filtrates of the different fungi after 5 days. The spectra from silver nitrate treated mycelia free filtrate of Aspergillus niger yielded a curve parallel to the horizontal axis (indicated in red) where surface plasmon peak was not observed. In the same period cell free filtrate from Pencillium sp. (magenta coloured plot) turned slightly brown in colour with a small asymmetric hump centred around 410 nm [163], [164]. The spectra obtained from Trichoderma virens was characterized by a rising background and was featureless except for a kink at 400 nm. The spectra from strain TPW (denoted by blue colour in the overlaid spectra) had similarly generated a low intensity hump at approximately 420 nm. However the aforementioned spectrum had lot of irregular features probably due to presence of

Page | 66
interfering compounds like pigments and secondary metabolites. In comparison to all these spectra obtained from different fungi as mentioned above, mycelia free filtrate of the Trichoderma sp. (denoted by black) had a well-defined absorbance peak at approximately 410 nm. The position of this sharp peak closely matched with that obtained from literature together with the development of a distinct orange colour. Intensity of the absorbance maxima peak as well as colour development increased with the time of incubation. Hence this was taken as a positive result for silver nanoparticle synthesis. All further studies on nanoparticle formation, characterization and applications were carried out with the mycelia free filtrate of this fungus. It was identified by molecular techniques as will be discussed in the following section.
Fig. 3.1.1 The overlaid spectra showing wavelength scans of mycelia free filtrate of five
different fungi incubated with 1 mM silver nitrate.
200 300 400 500 600 700 8000
1
2
3
4
5
Abso
rbanc
e
Wavelength nm
Penicillum Aspergillus niger TPW Trichoderma virens Trichoderma sp.

Page | 67
3.2 Identification of fungi by molecular techniques The fungi that yielded most promising results with respect to nanoparticle formation ability of its mycelia free filtrate was identified till the species level by sequencing the internal transcribed spacer region and generating identities. Microscopic observation of the culture revealed its identity with the genus Trichoderma as seen in the figure 3.2.1
Fig. 3.2.1 Light microscopy of the fungal culture showing conidia and conidiophores
The ITS region is the most widely sequenced DNA region in molecular ecology of fungi [165] and has been recommended as the universal fungal barcode sequence [166]. It has typically been most useful for molecular systematics at the species level, and even within species (e.g., to identify geographic races).
Internal transcribed spacer (ITS) refers to a piece of non-functional RNA situated between structural ribosomal RNAs (rRNA) on a common precursor transcript. Read from 5' to 3', this polycistronic RNA precursor transcript contains the 5' external transcribed sequence (5' ETS),

Page | 68
18S rRNA, ITS1, 5.8S rRNA, ITS2, 28S rRNA and finally the 3' ETS. During rRNA maturation, ETS and ITS pieces are excised and as non-functional maturation by-products rapidly degraded. Genes encoding ribosomal RNA and spacers occur in tandem repeats that are thousands of copies long, each separated by regions of non-transcribed DNA termed intergenic spacer (IGS) or non-transcribed spacer [167]. Sequence comparison of the ITS region is widely used in taxonomy and molecular phylogeny because it is easy to amplify even from small quantities of DNA (due to the high copy number of rRNA genes), and has a high degree of variation even between closely related species. This can be explained by the relatively low evolutionary pressure acting on such non-functional sequences.
Because of its higher degree of variation than other genic regions of rDNA (for small- and large-subunit rRNA), variation among individual rDNA repeats can sometimes be observed within both the ITS and IGS regions. Most labs use standard ITS1+ITS4 primers for amplification.
The 18S rDNA fragment was amplified from the genomic DNA with ITS1 and ITS4 primers. The amplicon was cloned into pT257R/T vector using TA cloning kit from Fermentas. The positive clones containing the insert were selected by blue white selection. The following gel photograph (figure 3.2.2) shows the results of colony PCR of the positive clones alongside a positive control amplified from the genomic DNA.

Page | 69
Fig. 3.2.2 Gel photograph showing (from right to left) 100bp ladder, negative (-) control not containing insert, positive (+) control containing the PCR product amplified from genomic DNA, positive (+) clones containing the amplified ITS region (2 lanes).
Plasmid isolated from a positive clone was used for sequencing. Upon obtaining the sequence it was subjected to BLAST search in NCBI. Figure 3.2.3 tabulates the results obtained from BLAST search. The alignment of the query sequence with an existing entry in the database with 99% identity is shown in the next figure (Figure 3.2.4).

Page | 70
Fig. 3.2.3 Results of BLAST search indicating 99% to 100% identity with Trichoderma asperellum.

Page | 71
Fig. 3.2.4 Alignment of the query sequence with 99% identity to a previously deposited sequence from Trichoderma asperellum.
Microscopic observations had already established the identity of the genus as Trichoderma. With molecular characterisation the organism was identified to be Trichoderma asperellum on the basis the high percentage identity shown with another pre assigned sequence. The sequence was submitted to Genbank and the following accession number was obtained GenBank: EU021220.1. The identity of the fungi having been established, synthesis of nanoparticles of different noble metals, and composites was attempted as will be demonstrated in the following sections

Page | 72
3.3 Synthesis of silver nanoparticles and their characterization Nanosilver is considered one of the most useful commercial products in the group of nanomaterials. Antibacterial coatings in implants and medical devices [168], paints and surface coatings, conductive inks for miniaturization in electronics [169], molecular detection, air conditioning systems for food and pharmaceutical industries are emerging areas of nanosilver usage. Considering the ever increasing demand for nanosilver various environmentally sustainable methods for synthesis are being developed. In one such green protocol nanosilver synthesis by non-pathogenic agriculturally important genus Trichoderma was attempted. The formation of silver nano-particles was easily discernible by the progressive change in the colour of the solution. The colour of the mycelia free filtrate containing 1 mM AgNO3, started changing from the 2nd day of incubation onwards. Staring with a pale yellow colour on the first day of incubation, it progressively turned to dark brown by the end of the fifth day. In contrast, the control remained unchanged during this entire period as could be seen from the photographs (Figure-3.3.1). The gradual progress of the reaction was monitored by UV-vis spectrophotometry.
Fig. 3.3.1 Digital photographs of filtrate of T. asperellum (A) control (without AgNO3) and (B) sample (with 1 mM AgNO3) after 5 days of incubation. (C) AgNO3 without filtrate

Page | 73
Figure 3.3.2 shows series of typical UV-vis spectra of the reaction solution recorded at intervals of 24 h. All the spectra (except for that recorded at 0 h) exhibit definite peak at ~410 nm corresponding to the surface plasmon resonance frequency of nanocrystalline silver particles [163, 164] implying that bio-reduction of the silver nitrate had taken place following incubation of AgNO3 solution in presence of the cell-free filtrate. The intensity of the plasmon peak initially increased with number of days of incubation due to increasing concentration of the silver nanoparticles (since the intensity of the plasmon peak is proportional to the concentration of silver nanoparticles produced) and then upon completion of the reaction it saturated. A slight red shift in the peak position was observed after two days of incubation, suggestive of the initiation of growth phase of nano-crystals at optimized sites following nucleation [163, 168]. The process continued till an optimum particle size was attained whereupon they got capped by suitable capping species [discussed in section 3.9.1]. Thereafter the size did not change much with time. This was evidenced from the successive UV-vis spectra and particle size measurements (from TEM) done after preserving the colloidal solution for months together at room temperature. This will be discussed subsequently. Therefore, it is apparent that the statistical distribution of particle size of silver nano-crystals synthesized was primarily governed by the kinetics of the two competing reactions (a) growth of the nucleation sites and (b) capping of the particles by suitable capping species and hence it depends on the availability of two different species viz. nucleation sites and the capping agents produced from the biological extract. The inset in figure 3.3.2 depicts a plot of the plasmon peak intensity (Amax) at the maximal wavelength of absorbance max (after making necessary corrections for the residual background counts at 0 h) as a function of the number of days of incubation. During the first two days, intensity increased almost linearly with time and then grew exponentially till the graph flattened out after five days. This indicated

Page | 74
that the reaction followed a Michaelis-Menten type of mechanism wherein it initially exhibited a pseudo zero order kinetics and then followed higher order kinetics with respect to the concentration of the reactants. In the beginning, concentration of AgNO3 was significantly higher; therefore its consumption during the course of its reduction was practically negligible, rendering a linear dependence of concentration of the product with time. As the reaction proceeded, concentration of AgNO3 came down drastically. Now its concentration term in the rate equation was no longer negligible compared to the other reactants and that was indeed manifested in the non-linearity of the curve (inset: Figure 3.3.2) after 48 h. The rate constant k0 due to the pseudo zero order reaction as estimated from a linear fit to the data (up to 48 h) was found to be 0.12 h-1. This clearly shows that the reaction was rather slow in its initial phases.
Fig. 3.3.2 UV-visible spectrum of silver nanoparticles recorded over a period of 5 days. Inset: Plot of Amax vs. time of incubation.

Page | 75
Figure 3.3.3a depicts the XRD pattern of powdered silver nanoparticles calcined at ~ 200C recorded in the 2 range 35-70. It exhibits a broad and intense peak at ~38.4 and a hump at ~64.5 corresponding to diffraction from the 111 and 220 planes of silver with FCC lattice (JCPDS no 04-0783). The broadening of the peaks clearly indicated that the particles were in the nano regime. Size of the silver nano-crystallites as estimated from the FWHM (full width at half maxima) of the 111 (i.e. 100%) peak of silver using Scherrer [170] formula was ~17 nm. Apart from these, an unidentified peak at ~46.2 arose, possibly due to organic impurities present in the sample. In order to get rid of the same, the sample was further calcined. Figure 3.3.3(b) depicts the XRD pattern of the sample calcined at ~400C. As expected, here the XRD peaks due to nanocrystalline silver were much more intense and sharper as compared to the previous one due to overgrowth of crystallites following calcination at higher temperature. Moreover, the pattern exhibited an additional peak at ~44.2 corresponding to diffraction from the 200 plane of silver, not observed discernibly in the XRD patterns of the sample calcined at ~200C.
Fig. 3.3.3 XRD pattern of silver nanoparticle sample calcined at (a) 2000C and (b) 4000C

Page | 76
Figure 3.3.4 illustrates a typical transmission electron micrograph of a silver nanoparticle sample preserved for over 6 months, under high-resolution. This had been deliberately done to observe the effect of ageing on the size of the nanoparticles. Homogeneity in contrast clearly indicated that the sample was phase pure and devoid of twins and other dislocations. “d-spacing” as estimated from two consecutive planes (shown by an arrow mark in the figure) was found to be ~0.235 nm. The value corresponded with that of the 111 planes of silver (JCPDS no 04-0783). Inserted within the figure is (a) a low-resolution TEM micrograph that depicts particles with diameter in the range 13-18 nm. The mean particle size obtained as 14.9 nm agrees well with that obtained from Scherrer formula.
Fig. 3.3.4 High -resolution transmission electron micrograph of drop casted silver nanoparticles preserved for over 6 months. Inset: (a) low resolution micrographs the nanoparticles, and (b) SAED pattern recorded on the same sample.(c) TEM of 1 month old sample

Page | 77
Silver nanoparticles synthesized by this route were fairly stable even after prolonged storage since the XRD and TEM measurements were carried out at an interval of over 6 months. The selected area electron diffraction pattern [inset (b) in Fig. 3.3.4] showed concentric rings with intermittent bright dots indicating that the sample was highly crystalline in nature. The rings were attributed respectively to diffraction from 111, 311, 220 planes of silver further corroborating our observations from XRD measurements. There particle size calculated from Schrrer formula and that found from TEM are in good agreement.
In order to find out the extent of agglomeration of silver nanoparticles in the colloidal solution, dynamic light scattering (DLS) measurements were carried out on the same solution preserved for more than 6 months. The histogram of particle size distribution was obtained by cumulant method of analysis using lognormal correlation functions (Figure 3.3.5). From here the diameter of the hydrated nano-particle (along with caps) with maximum frequency of occurrence was estimated to be ~35.4 nm. It may be noted that the particle size obtained from DLS measurements was higher than that estimated from XRD broadening and TEM measurements. This is due to the fact that the particle size so obtained is augmented substantially by contributions from the hydrated capping agents [bio-macromolecules (proteins!!) in this case] and also from solvation effects (hydrodynamic diameter could be as high as 1.2 times the original diameter of the capped particles). Thus it may be concluded that there is not much agglomeration of the silver nanoparticles even after preserving the colloidal solution for extended periods, thereby substantiating utmost stability of these nanoparticles. The potential use of these silver nanoparticles as SERS template has already been demonstrated. This also hints at their probable application as sensors. Additionally the antibacterial activity would also be proven in section 3.9. and as heat conductors in 3.11.

Page | 78
Fig. 3.3.5 Histogram of particle size distribution as obtained from dynamic light scattering of silver nanoparticle solution preserved for over 6 months.
3.4 Synthesis of gold nanoparticles and studies on evolution of morphology
Metal nanoparticles with well-defined morphology like, gold and silver nanotriangles, prisms and cubes in particular, have tremendous potential for applications in bio-sensing ,VOC (volatile organic compound) sensing [171], oncotherapy [172], field emission [173], as wave-guides for electromagnetic radiation [174], substrates for surface enhanced resonance Raman spectroscopy [172, 175], novel conductive tips for scanning tunnelling microscopy (STM) [173] and near-infrared absorbing optical coatings [176]. Sharp tips and vertices of nano-triangles and prisms are particularly responsible for their unique optical and electronic properties. Synthesis of gold nanoparticles by Trichoderma asperellum was studied.

Page | 79
The mycelia free filtrate of T. asperellum was treated with 1 mM chloroauric acid. Formation of gold nanoparticles was apparent from the gradual change in colour of the incubated solution from pale yellow to dark purple. In contrast, colour of the control remained practically unchanged during the entire incubation period (Figure 3.4.1).
Fig. 3.4.1 Digital photographs of control and gold nanoparticle sol.
Figure 3.4.2 shows a series of UV–visible spectra of the solution recorded at room temperature at intervals of 24 h. All the spectra (except that recorded at 0 h) exhibit an intense peak at ~570 nm corresponding to the surface plasmon band of nanocrystalline gold particles. The intensity of this peak increased with time, due to the progressive bio-reduction of HAuCl4 to gold by the cell-free extract. The plasmon band systematically shifted towards lower wavelengths and also grew sharper with increasing incubation time. This systematic blue shift of the plasmon band and gradual decrease in its full width at half maximum (FWHM) were attributed to the formation of either nanoparticle-aggregates, or anisotropic particles whose aspect ratio increased with time, or a combination of both [171], [174], [173]. However, quadrupole and higher order plasmon modes specific to triangular nanoprisms were not observed in the UV-visible spectrum of our samples, except for a rising background leading to the NIR region. This was probably due to the

Page | 80
preponderance of pseudo-spherical nanoparticles or large distribution of shape and size of the anisotropic nanostructures in the solution [177]. Inserted in figure 3.4.2, is a plot of maximum absorbance (Amax) vs. hours of incubation, showing a linear time-dependent increase in its intensity. Assuming pseudo zero order kinetics for the reaction, the rate constant was estimated (from a linear fit to the data) to be 6.9x10⁻⁴/h. Slow kinetics of the reaction and in general of biological processes might impose a bottleneck to their up-scalability but is instrumental in producing metastable phases having exotic morphologies which were otherwise difficult to realise.
Fig. 3.4.2 UV-vis absorption spectra of the gold nanoparticle sol recorded as a function of time. Inset: plot of Amax vs. incubation time exhibiting slow kinetics of the reaction.

Page | 81
A representative transmission electron microscopy image of a drop cast sample (Figure 3.4.3) showed a large number of pseudospherical nanoparticles of uniform diameter along with nanoprisms of different shapes and sizes. Frequency distribution of pseudo-spherical particles (inset Fig. 3.4.3) clearly showed that more than 60% of them have a diameter of less than 15 nm with σ = 0.5 nm. Careful observations revealed that three or more spherical particles fused together to form nanoprisms (see encircled part in Figure 3.4.3), nanotriangles being the most predominant morphology amongst them. The selected-area electron diffraction (SAED) pattern (inset in figure 3.4.3) showed intermittent bright dots, indicating that the sample was highly nanocrystalline in nature. The dots were attributed respectively to Bragg diffraction from 111, 311, 331, 200, 400, 222 and 220 planes of face-centred cubic (FCC) lattice of gold nanoparticles. An additional set of relatively weak spots (shown by red circles) corresponding to diffraction from ⅓{422} and 110 lattice planes were also observed. Reflection from 110 planes is usually absent in a FCC lattice due to structural factors. However, it appears in an ordered crystal having a super lattice structure (as in the case of our gold nanoparticles). Higher order reflection from ⅓{422} planes is detected primarily due to high intensity of the electron beam and contribution from atomically flat surface of the gold nanotriangles [174], which is also evidenced from roughness measurements done on an isolated flat triangle (see Figure 3.4.6). Due to smaller population of triangular prisms, the spots appear rather faint in the SAED pattern. From d-spacings of different lattice planes, cubic cell parameter (a) and volume (v) have been approximately calculated (using a refinement program Powderex) to be a=4.0936 ± 0.0337Å, v= 68.60 ± 0.98Å3. The values within the error limit of SAED analysis is in good agreement with that reported in the JCPDS database (No. 04-0784).

Page | 82
Fig. 3.4.3 TEM image of the gold nanoparticle sol. Inset: (a) SAED pattern of the sample, (b) Frequency distribution of spherical nanoparticles. X-ray diffraction measurements on the samples corroborated the observation from selective area electron diffraction. Figure 3.4.4 depicts the powder XRD pattern recorded in the 2θ range 35°–70° of a typical gold nanoparticle sample drop-casted and calcined at ~400°C to remove the crystalline organic phase in the sample that partly overshadowed the weak features arising from as-grown sample. Peaks at ~38.2°, 44.4°and 64.7° were observed. They were attributed to diffraction from 111, 200 and 220 planes of gold with FCC lattice (JCPDS No. 04-0784).

Page | 83
Broadening of the XRD peaks clearly indicated that the particles were in the nanometre regime. Crystallite size of the gold nanoparticles was calculated to be ~28.8 nm from FWHM of the 111 peak using Scherrer equation. It may be noted that the value was significantly higher than that obtained from TEM micrographs recorded on the as-grown sample. The discrepancy may be readily explained on the basis of rapid grain growth at high calcination temperature. Further, Scherrer equation which is strictly valid for spherical nanoparticles provides a weighted average of crystallite size in a sample containing particles with different morphology and size.
Fig. 3.4.4 XRD pattern of a drop-casted gold nanoparticle sample calcined at ~400°C.

Page | 84
Crystal growth and evolution of morphology:
Crystal growth leading to evolution of morphology (from spherical particles to prismatic nanostructures) was studied by transmission electron microscopy of individual crystallites and is given in Figure 3.4.5 as a collage of TEM images. It is noteworthy that the transformation of morphologies took place at room temperature. As discussed earlier, spherical particles (~15 nm in diameter) first fused to form nanotriangles [see box (i)]. Gradually, the nanotriangles (edge length ~30 nm) grew in size either as a result of the merger of multiple nanotriangles or by overgrowth of nucleation sites [see box (ii) and (iii)]. The bigger triangles (edge length ~100 nm), in turn, combined to form different types of nanoprisms. Stacks of aligned triangles with one or more truncated edges [box (iv)], hexagonal prisms [box (vi)], a combination triangles and hexagons or fractals [box (v) and (vi)] were some of the exotic structures observed. It may be emphasized here that precise control of bio-chemical processes may not be possible. Hence exclusive synthesis of any of these structures may not be achieved by this technique. However, it was possible to isolate the desired products from the reacting masses by centrifugation as discussed subsequently. Micro-diffraction pattern recorded on a single crystal is given in box (vii) of Figure 3.4.5. Intense spots due to reflection from the 1/3{422}, 200, 220, 311, 331 and 400 planes of cubic FCC gold lattice are clearly observed. But reflection from the 111 planes that appears as the strongest X-ray line (see Figure 3.4.4) was not observed in the micro-diffraction pattern of the crystal. This indicated that the crystal is highly oriented along 111 with triangular top lying parallel to the incident electron beam as schematically represented in the inset of Figure 3.4.5. Large structural anisotropy of these nanocrystals should have substantial effect on the optical properties of the samples, including light absorption, scattering and surface enhanced resonance Raman spectroscopy [172].

Page | 85
Fig. 3.4.5 TEM studies on the evolution of morphologies of gold nanoparticles. To increase the concentration of triangular prisms in the gold sol was centrifuged at 5000g. The concentrated dispersion of particles collected at the bottom of the tube had a higher fraction of nanotriangles, prisms and aggregates. Figure 3.4.6 shows AFM topography of the sample largely containing nanoprisms and triangles. Care had been taken to scan an area where there was an excess of triangular structures. From AFM topography (Figure 3.4.6) and frequency distribution bar chart (Figure 3.4.7), it was evident that the nanotriangles exhibited significantly narrow distribution of width and height as compared previous reports. Insert (a) in the figure 3.4.6

Page | 86
shows the 3D image of a single particle zoomed up, showing a smooth heart-shaped contour of a triangular nanoprism with truncated and rounded vertices. Surface profile plot on a typical particle showed that the particle height was ~12 nm and the edge length was ~130 nm. Strikingly, RMS roughness of the particle top surface was almost similar to that of the bare polished silicon substrate (marked by vertical arrows) indicating optical flatness of the nanotriangles, in corroboration with the findings from SAED measurements and earlier reports.
Fig. 3.4.6 AFM topography of nanoprisms. Inset: (a) 3D image of a single particle exhibiting heart-shaped contour of a triangular nanoprism, (b) surface profile plot on an optically flat nanoprism showing its vertical and lateral dimensions.

Page | 87
Fig. 3.4.7 Size distribution of nanotriangles from AFM topography. Green synthesis of uniform pseudospherical gold nanoparticles and optically flat triangular nanoprisms had been demonstrated using cell-free extract from a nonpathogenic and commercially viable bio-control agent for the reduction of HAuCl4. The synthesis required no additional capping or stabilising agents and took place at room temperature. The pseudospherical particles got fused at room temperature to produce different exotic structures including triangular nanoprisms. Slow kinetics of the biological processes was believed to be responsible for the production of such exotic morphologies. Large structural anisotropy of the triangular nanocrystals should have substantial effect on the optical properties of the samples, including light absorption, scattering and surface enhanced resonance Raman spectroscopy and field emission characteristics [173]. Gold nanoparticles of 10 to 40 nm size have been used for laser induced explosion of cancer cells[178]. Radiosensitization has also been studied in gold nanoparticles with 11.9 and 37.5 nm [179].

Page | 88
3.5 Synthesis of palladium and platinum nanoparticles Palladium nanoparticles find use as catalysts in a variety of dehydrogenation reactions [180, 181], as templates for surface enhanced Raman spectroscopy [182] and in environmental clean-up of recalcitrant chemicals like trichloroethylene and atrizoates from water [183]. Green synthesis of palladium nanoparticles are reported from Gardenia sp.[184], Geobacter sulferreducens [185] etc. The synthesis of palladium nanoparticles for catalytic applications was attempted by using the mycelia free filtrate of T. asperellum. A final concentration of approximately 1 mM of palladium chloride was added to the mycelia free filtrate and incubated for 4 days on a shaker at 150 rpm. The formation of nanoparticles was accompanied by change in colour of the filtrate from pale yellow to dark brown.as seen in figure 3.5.1
Fig. 3.5.1 (a) shows filtrate before addition of palladium chloride (b) filtrate after formation of palladium nanoparticles.
The XRD pattern of the of the dropcast sample exhibited peaks at ~40.1 and 46.6 respectively assigned to the reflections from the 111 and 220 planes of palladium (JCPDS No. 46-1043). The average particle size calculated from Scherrer formula was 17.7 nm as observed in figure 3.5.2. The inset in the same figure showed a representative transmission electron micrograph of a drop-cast sample of palladium nanoparticles. The particles were polydisperse in nature and mostly between 11 to 23 nm in diameter. The size distribution of the nanoparticles showed that most of

Page | 89
the particles lie between 14-17 nm (figure 3.5.3). The mean size observed using TEM was 16.6 nm which matched closely with the average size obtained from XRD.
Palladium nanoparticles were synthesized to test the feasibility of reduction of PdCl2 by T. asperellum and stabilization of metal nanoparticles by the bio-macromolecules (probably proteins carbohydrates and other secretory molecules) present in the extract as a first step towards producing Pd impregnated TiO2 nano-composite which will be described in section 3.8.
Fig. 3.5.2 The X –Ray diffractogram for palladium nanoparticles showing peaks at characteristic positions. Inset (a) TEM micrograph of palladium nanoparticles.

Page | 90
Figure 3.5.3 Particle size distribution of palladium nanoparticles Platinum nanoparticles Platinum nanoparticles are used as catalysts [186] and as anticancer therapeutic agent bioplatin [187]. They also augment microwave digestion of biomolecules like proteins for their analysis via MALDI-TOF-MS. In this application they play a three-fold role of a matrix, affinity probe, and accelerate digestion of proteins by absorbing the microwave radiation [188]. Bioreduction of platinum salts has been carried out in Fusarium oxysporum [92], Shewanella sp. [189] and many others. Addition of hexachloroplatinic acid to the mycelia free filtrate resulted in a golden coloured solution that turned progressively brown in 14 days of reaction under shaking conditions as evident from figure 3.5.4.
Fig. 3.5.4 Colour of filtrate (a) before addition of chloroplatinic acid (b) after addition of chloroplatinic acid and (c) after formation of platinum nanoparticles

Page | 91
Figure 3.5.5 X-Ray diffraction pattern of platinum nanoparticles.
The calcined sample of platinum nanoparticles yielded peaks at 39.7°, 46.2° and 67.4° which could be assigned to 111, 200, 220 peaks respectively in the X-Ray diffractogram (JCPDS 46-1043). The average particle size calculated from line broadening data was 17 nm.
Fig. 3.5.6 TEM of platinum nanoparticles. The extended photograph shows a magnified view of the same
40 50 60 700
20
40
(220)(20
0)(11
1)
Inten
sity a
.u.
2/0
Pt-nanoparticles 17nm

Page | 92
TEM images in figure 3.5.6 showed the presence of spherical particles varying between 2 to 10 nm. The higher average particle size of 17 nm calculated using Scherrer formula due to line broadening in the X-Ray diffraction pattern indicated agglomeration of particles at high calcination temperatures. This was done to remove the interfering organic substances and obtain a clean diffraction pattern. This also explained why the actual particle size of the samples obtained by direct dropcasting for TEM was much lower than that calculated from XRD.
Fig. 3.5.7 EDS spectra of platinum nanoparticles.
EDS measurements done on the washed nanomaterial samples, revealed the presence of peaks pertaining to platinum (figure 3.5.7). Associated peaks of chloride could also be seen at very low intensity from adherent negatively charged chloride ions that could not be removed by centrifugation. Peaks of carbon and nitrogen bear their origin to capping molecules from the fungal filtrate. Thus ability of the mycelia free filtrate of T. asperellum to form nanoparticles of platinum was demonstrated. However, considering that the reductive process took almost two

Page | 93
weeks to complete and also the small number of particles visible in TEM, these were not taken up further for any other characterisation or application.
3.6 Synthesis of gold-silver nanocomposite Nanoparticles composed of two different metals have unique catalytic, electronic and optical properties distinct from those of the corresponding individual nanometallic particles [190] [191, 192]. Metals like Au and Ag have almost identical lattice constants (0.408 for Au and 0.409 for Ag) and this characteristic leads to a strong tendency towards alloy formation [190-192]. Combining gold and silver at atomic scales and precisely regulating their compositions to get the desired optical properties have been useful in bio-molecular imaging. The occurrence of new properties when acting in combination, and tuning of compositions for desired characteristics are exemplified below. Presence of silver leads to introduction of antimicrobial properties in gold, which otherwise is benign [193]. It was further reported that the effect of silver and silver-gold alloy nanoparticles on viability of cells was contrastingly different. Compared to silver nanoparticles, the biological effect of silver–gold nanoparticles on cell viability on human mesenchymal cell culture was negligible [194]. Tuning of plasmon resonance condition by way of changing the composition of gold silver alloys to enable transfer of energy to green fluorescent protein (GFP) was attempted by Ling et al [195]. These authors envisaged that even a small enhancement in fluorescence signal of GFP would be of great importance to the field of imaging. Having studied the formation of gold and silver nanoparticles, co-reduction of gold and silver salts was achieved in the presence mycelia free filtrate of Trichoderma asperellum and the

Page | 94
characteristics of the nanoparticles were studied. The progress of the reactions leading to formation of gold-silver nano-composites was monitored by UV Visible spectrophotometry (figure 3.6.1). When salts of gold and silver were added to the cell free filtrate in the molar ratio of 1:4, the plasmon peak appeared at 529 nm on the first day of the reaction, and moved to 531 nm at the end of the fifth day. With increase in concentration of gold, where relative ratio of gold and silver was 2:3, the initial appearance of plasmon peak was at 542 nm, which then stabilized at 535 nm from the 2nd day of the reaction. When gold and silver were added in equal proportion a broad shoulder appeared at 551 nm, which gradually shifted to 544 nm by the end of the reaction. The same trend was observed when concentration of gold was increased and the relative ratio of gold to silver was 3:2. The plasmon peak appearing at 550 nm on the first day, shifted to 547 nm by the fifth day. With further increase in concentration of gold and a relative ratio of gold to silver of 4:1, the shoulder appearing at 559 nm on the first day, shifted to 553 nm by the third day, and centered at around 560 nm by the 5th day. Thus, with the increase in the initial amount of added gold, a red shift (shift to longer wavelengths) in plasmon peak position could be observed.

Page | 95
Fig. 3.6.1 The five different initial molar ratios of gold and silver added to the mycelia free filtrate and their corresponding surface plasmon absorbance peaks are depicted

Page | 96
The aforementioned five samples were studied by EDS (electron dispersive X-ray analysis) for relative composition of gold and silver incorporated in the composite. Figure 3.6.2 indicates a plot of ratios of silver to gold as initial amount added versus the ratio of silver to gold in the final composite. We observed that gold gets incorporated in far greater amount than silver in the resultant composite after the stipulated reaction period. The relative percentages of gold and silver in the nanoparticles along with their initial values are tabulated (table 3.6.1).When equimolar ratios gold and silver were added the resultant composites had approximately 25.12% silver and 74.88% gold. This higher incorporation of gold has been observed in Lactobacillus [60, 196] and in ethanolic extract of tea mediated, alloy formation of gold and silver [196]. Figures 3.6.3 and 3.6.4 show the graphical relation between initial and final amounts of gold and silver respectively. The plot shows a sigmoidal relationship.
Fig. 3.6.2 The plot of ratio of silver to gold (initial amounts used as precursor) versus ratios of incorporated silver and gold (in the composite). The absorbance maxima for surface plasmon are indicated on the bars

Page | 97
Table 3.6.1 Relative percentage of incorporation of gold and silver with respect to their initial concentrations.
% Ag used % Ag incorporated
% Au used % Au incorporated
Standard Deviation
20 7.93 80 92.07 2.4 40 14.72 60 85.28 3.075 50 25.12 50 74.81 2.94 60 44.54 40 55.45 3.75 80 55.45 20 43.58 2.47
Fig. 3.6.3 Plot showing the dependence of the initial amounts of gold with the final amounts incorporated.

Page | 98
Fig. 3.6.4 Plot exhibiting sigmoidal dependence of the incorporation of silver with respect to the initial amounts added.
Fig. 3.6.5 TEM image of nanoparticles made from Au :Ag (1:4) and size distribution
0 10 20 30 40 50 600
10
20
30
40
Frequ
ency
%
particle size nm
Mean= 27.5 nmSD= 0.3
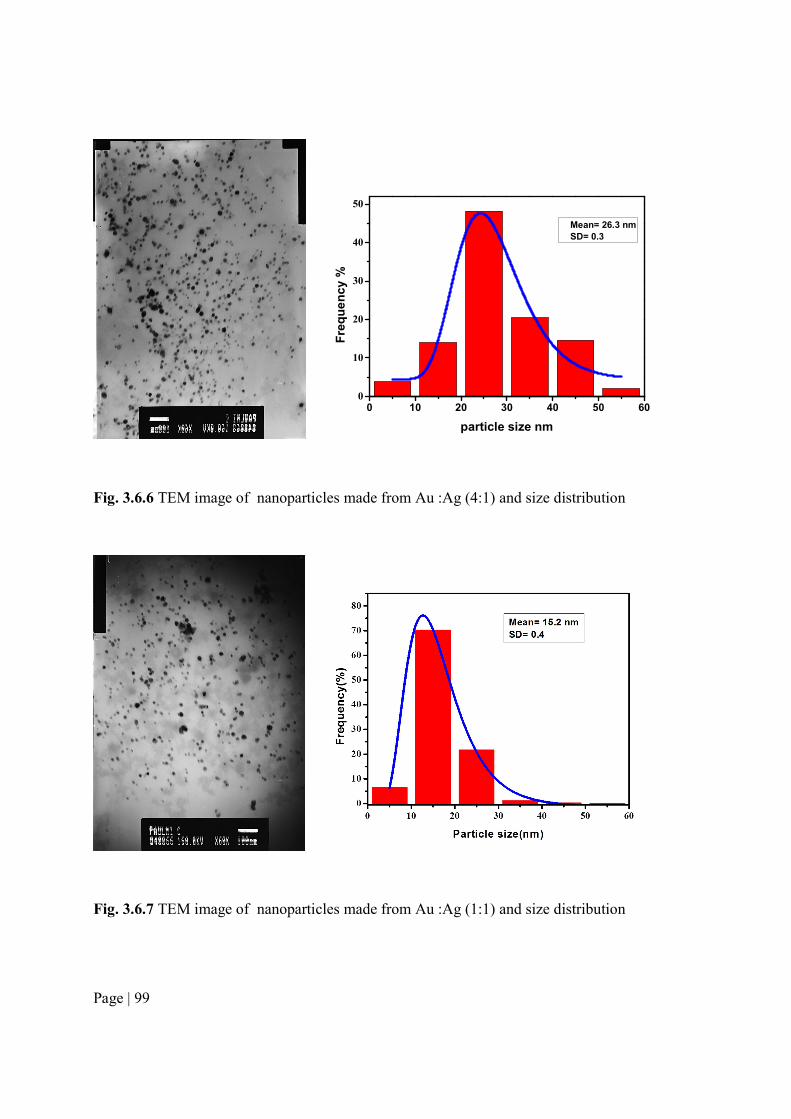
Page | 99
Fig. 3.6.6 TEM image of nanoparticles made from Au :Ag (4:1) and size distribution
Fig. 3.6.7 TEM image of nanoparticles made from Au :Ag (1:1) and size distribution
0 10 20 30 40 50 600
10
20
30
40
50
Mean= 26.3 nmSD= 0.3
Frequ
ency
%
particle size nm

Page | 100
Figures 3.6.5 to 3.6.7 depict the TEM images of three representative samples. Figure 3.6.5 represents the sample with initial ratio of 1:4 (gold and silver). The particle size distribution was between 2 to 60 nm with maximum number of particles found between 20 to 30 nm. The average particle size is 27.5 nm, calculated from a log normal fit of the data. The same distribution was obtained in TEM micrograph for 4:1 ratio of gold and silver (figure 3.6.7). The average size in this case was 26.3 nm. For an initial concentration of gold to silver of 1:1 the particle size distribution was between 5 to 40 nm (figure 3.6.6) with 70% of the particles between 10 to 20 nm. The average particle size obtained was 15.2 nm. In all the micrographs the particles had near uniform contrast.
Fig. 3.6.8 X-ray diffractogram of samples with initial equimolar proportions of gold and silver (1:1). A representative XRD pattern for equimolar proportions of silver and gold (1:1) sample was recorded (figure 3.6.8). The observed peaks were grossly assigned to 111, 200 and 220 being centred around 38.1°, 44.3° and 64.5° respectively. As the respective peak positions for Au and Ag are very close, differing only in the first decimal place, and further due to the broadening of

Page | 101
peaks it is difficult to discern separate peaks for the two elements. The average particle size derived from peak broadening was 15 nm, which was in good agreement with TEM data. For three representative samples of initial Ag to Au ratios of 1:1, 4:1 and 1:4 EDS line scans were taken over a linear distance of ~100 µm (figure 3.6.9 a,b,c). The co-occurrence of gold and silver along the same line could be observed.
Fig. 3.6.9 EDS line scan to indicate co-occurrence of gold and silver in the composites for three representative samples (a) initial ratio 1:4 Au:Ag (b) initial ratio 1:1 Au:Ag (c) initial ratio 4:1 Au:Ag. The Y axis represents counts.

Page | 102
It is note-worthy that the plasmon peaks of gold and silver appear at 570 and 420 nm, respectively in their individual nanostructures as mentioned in the previous sections. However, singly occurring peaks at the aforementioned wavelengths could not be observed in any of the UV Visible spectra depicted in figure 3.6.1. For all the ratios of gold and silver used, distinct peaks between 531 nm to 560 nm (for the varying ratios) were visible. From the observations of a predominant single plasmon peak (inspite of the presence of two different metal salts) it can be assumed that it is a case of alloying rather than singly occurring gold or silver nanoparticles [197]. This is expected as gold and silver have very similar lattice constants of 0.408 and 0.409 nm. In fact, the difference in lattice constants is smaller than the amplitude of thermal vibrations of the atoms [191], [190]. Because of the close similarity in lattice constants alloy formation of these two metals in bulk is prevalent and the same may also be presumed to occur in the nanoscale.
In case of simultaneous reduction of gold and silver ions different possibilities exist which are as follows. Earlier, synthesis of 38 atom gold-silver cluster (Au18Ag20) was reported [193]. The solution of this cluster showed a single absorption peak at 495 nm. Mulvaney et al. and also Sinzig et al prepared silver nanoparticles coated with an overlayer of gold (core-shell nanoparticles) [198], [199]. These particles have two distinct plasmon absorption bands and their relative intensities were seen to depend on the thickness of the shell. Further, alloy formation within the shell was suggested on the basis of the optical absorption spectra. Similarly, gold-silver composite colloids (30-150 nm in diameter) consisting of mixtures of gold and silver domains were obtained by irradiating aqueous solutions of gold and silver ions with 253.7 nm UV light [200]. Nanoparticles produced in this mode also showed two plasmon absorption bands originating from the individual gold and silver domains.

Page | 103
In case of core shell nanoparticles, their formation is marked by progressive disappearance of a strong plasmon peak due to the core forming metal, and appearance of another peak due to the combined effect of the core and the metal contributing towards the development of the shell [201]. This was also not observed in our case. Hence, preliminary observations indicate the possibility of near homogenous solid solutions in the nano regime. In citrate mediated reduction, the relative ratios of incorporation of gold and silver reflect the same composition as the starting materials or initial molar ratios. In the same protocol, the appearance of a single plasmon peak between the positions of gold and silver was a further indication of uniform alloying. A linear shift in gold plasmon absorption maxima with increasing mole fraction of gold was also observed [197] earlier. Coming back to our observations, though a single plasmon peak appeared in all the cases, but in the EDS analysis a wide variation was observed between the initial amounts of silver and gold used, and the final amounts incorporated. In the case of silver, a plot of initial amount of silver added and final amount of silver incorporated in the composite revealed a sigmoidal dependence (Figure 3.6.4). In case of gold, though an approximate sigmoidal dependence was observed (Figure 3.6.3). However the fact remains that final ratio of gold and silver incorporated in the composite did not reflect the initial ratios. Mahl et al reported that it is difficult to distinguish singly occurring patches of silver and gold and their alloys even by HRTEM due to their almost identical lattice parameters [194]. However a closer investigation of local compositional variations in line scan by electron beam in STEM mode with a spatial resolution of 1 nm revealed differences. The composition was analysed at two points designated as 1 and 3 placed diametrically opposite at periphery of a single nanoparticle while position 2 was at the centre of the particle. The molar ratios Ag:Au were 45:55 at 1, 26:74 at 2, and 33:67 at position 3, indicating an enrichment of gold progressively

Page | 104
towards the interior of the nanoparticle [194]. In the light of these observations, we conclude that the non-linear dependence of the starting and final incorporated ratios of the two metals may reflect in a variable distribution of gold and silver within each nanoparticle, as also observed earlier by Mahl et al. Under mild reduction conditions as in biological systems, such variations of compositions is inconsistent with the starting compositions and this has been reported earlier [196] [202]. Gold is more noble that silver and hence easy to reduce. The difference in reduction potentials of gold and silver as well as the nature of the biological reducing agents could have an important consequence on the different incorporation rates of gold and silver. It is most likely to obtain a gold enriched core due to the stronger tendency for reduction of gold compared to silver.
3.7 Synthesis of silver-carbon nanotube composites Carbon nanotubes (CNT) are highly in demand because of their mechanical properties, chemical inertness, potential carrier material for drug delivery [203], etc. The combination of two materials viz. CNT and metallic nanomaterials is particularly useful to integrate different properties [204]. Studies have been devoted to the fabrication of metal nanoparticles filled CNTs for unique electrical, magnetic and optical properties [204-207]. Among them silver decorated CNTs have gained extensive attention due to their potential applications as catalysts [208] optical limiters [209] and filter membrane for water [210]. Addition of silver in form of nano coatings or incorporation into the lumen of the nanotube increases its conductivity, mechanical strength [211] and renders bacteriostatic properties to it [212]. While chemical synthesis can be quite elaborate necessitating multiple steps, microbial synthesis of composites offers several advantages of being less energy intensive, zero waste process that have been discussed at length

Page | 105
earlier. Hence the feasibility of synthesis of carbon nanotube-silver nano-composite, using filtrate from Trichoderma asperellum culture, was checked.
Figure 3.7.1 consists of a collage of TEM photographs where the presence of silver nanoparticles on the nanotube surfaces is observed in the form of dark spots. The dark spots arise due to higher atomic number of silver (49) as compared to carbon, of atomic number (12). A fraction of the silver produced got incorporated into the lumen of the tubes as observed in the TEM micrograph in figure 3.7.2. Due to surface tension, the filtrate seeps inside the lumen of the tube along with the precursor salt which gets reduced in situ, producing nano-crystalline silver with rod-like morphology. High resolution TEM micrograph of silver laden carbon nanotube is depicted in figure 3.7.3. The spots with dark contrasts are due to nano-silver depositions on the carbon nanotubes. The lattice fringes were respectively assigned to the 111 plane of silver and carbon.

Page | 106
Fig. 3.7.1 Collage of TEM micrographs of silver (Ag) deposited on multiwalled carbon
nanotubes (MWCNT)

Page | 107
Fig. 3.7.2 TEM image of silver encapsulated inside the lumen of multi-walled carbon nanotube.
Fig. 3.7.3 High resolution TEM revealing the lattice fringes of silver and carbon matrix assigned to their respective 111 planes. The encircled areas correspond to silver deposition on CNT.
CNT 111
Ag 111

Page | 108
Fig. 3.7.4 (a) XRD pattern of silver-CNT composite with reflections from 111, 200, 220 and 311 planes of silver; 111 and 101 planes of CNT. (b) Selected area electron diffraction pattern due to nano-crystalline silver on CNT.
The XRD of the drop cast sample revealed peaks centered at of 38.4°, 44°, 65° and 78° pertaining to 111, 200, 220, 311 planes of silver. The peak observed at ~26° was attributed to the 111 plane of carbon. Additionally, a small hump due to 010 plane of CNT, was observed. Though the feasibility of deposition of silver nanoparticles onto CNT to form silver-CNT composite without any further modification of the carbon nanotube surfaces was amply demonstrated, the sample could not be dispersed in aqueous medium. This rendered it unsuitable for antimicrobial applications. Hence acid treatment of the same was necessary as previously discussed in the material and methods section. 5 ml of the acid treated CNT dispersion was added to fungal filtrate and processed as stated in the materials methods section(2.7).

Page | 109
Fig. 3.7.5 Schematic representation of addition of functional groups on CNT surface followed by deposition of nanosilver on its surface, mediated by cell free filtrate of T. asperellum The schematic representation of silver nanoparticles decorated on functionalized carbon nanotubes is given in figure 3.7.5. This highly dispersed composite was observed by TEM. Figure 3.7.6 represents a collage of images of acid treated CNT with visibly higher amount of silver deposition on the surfaces and the lumen of the tube compared to the collage in figure 3.7.1. Therefore, it may be concluded that functionalization greatly improved its dispersibility as observed from the appearance of the solution after refluxing with acid [212]. The functionalized sites now acted as preferred nucleation centers that probably lead to the anchorage of Ag nanoparticles at higher concentrations.

Page | 110
Fig. 3.7.6 Collage of transmission electron micrographs of silver decorated functionalized carbon nanotubes.

Page | 111
Fig. 3.7.7. (a) image is a TEM micrograph of silver encapsulated carbon nanotube taken at zero energy loss. (b) Right hand side image top panel represent energy loss images taken at energy loss edge for silver at 368 eV and energy loss image for silver at the peak maxima of 451 eV. The images were digitally subtracted to yield the silver distribution image on the bottom panel.
Elemental mapping was performed on the electron dense areas using Energy Filtered Transmission Electron Microscopy (EF-TEM) as described earlier [152]. The slit width of the energy filter was set for silver specific energy loss edge of 368 eV and 451 eV which is the peak maxima in the electron energy loss spectrum. Figure 3.7.7 (a) is a zero energy loss micrograph showing electron dense region of dark contrast embedded, within a comparatively less electron dense material of lighter contrast. This feature has been further imaged as mentioned above. Figure 3.7.7 (b) in the top EFTEM panel (left) refers to that taken at the energy loss edge (368 eV) and the right hand image refers to the one taken at the energy loss peak (451 eV). Digital subtraction of the two images using iTEM software revealed the deposition of silver, which can be traced to the more electron dense areas on the zero loss TEM image (Figure 3.7.7 a). Thus identity of the element silver was established along with its spatial distribution.

Page | 112
Fig. 3.7.8 Plot showing the decreasing counts of bacteria with increasing concentration of silver in silver-CNT composite. The minimum inhibitory concentration (MIC) was obtained at silver concentration of 3.24 µg/ml and minimum bactericidal concentration (MBC)7.56 µg/ml.
This highly dispersed functionalized carbon nanotube laden with nano silver exhibited remarkable antibacterial activity against wild type Escherichia coli BW 25113 when compared with pristine CNT-silver nanocomposite. With increasing silver concentration the number of surviving bacterial cells decreased. This was adjudged from the serial dilution of aliquots of the inoculated medium (after incubation), treated with the composite and plating of the same. The minimum inhibitory concentration and minimum bactericidal concentration recorded were 3.24µg/ml and 7.56 µg/ml respectively, for an inoculum of 105 to 106cfu/ml.
Therefore, a template bound route of synthesis of silver CNT composites at ambient conditions without the involvement of additional reducing or capping agents was demonstrated.

Page | 113
The first report of protein mediated deposition of nano-silver on CNT was published in Advanced Materials [213]. Sodium borohydride was used as an additional reducing agent, in this study. Silver decorated CNT shows improved conductivities and are endowed with catalytic as well as antibacterial properties arising from silver. Silver CNT nano-hybrids have numerous applications in water filtration owing to the biocidal nature of nano-silver, as energy storage devices (super-capacitors) [214], lead free soldering materials to name a few. They also exhibit pronounced sheet resistance of 106 Ω/sq, mechanical performance, and thermal stability up to 325°C. These properties of the nano-composites mark them as potent antibacterial, thermostable, antistatic and sustainable materials for different advanced applications including coatings, textiles, biomedical electronics etc. [215] . Accordingly synthetic methods for developing these hybrids have also captured the attention of researchers. Dhibar et al have demonstrated the outstanding energy and power density of polyaniline –silver /MWCNT composites. The composite showed better electrical conductivity of 4.24 S/cm at room temperature and also attained nonlinear current-voltage characteristics. They illustrated that silver decorated CNT gave a capacitance of 528 F/g at a scan rate of 5 mV/s, thus paving the way towards development of future energy storage systems. The method involves use of reagents like CTAB, aniline, DBSA and APS [214]. In another case, dendrimers like (PAMAM) polyamidoamine, have also been used as a silver ion trapping and reducing scaffold on f-MWCNT. Silver deposited dendrimer coated CNTs, had significantly enhanced the antibacterial properties, than pristine CNT as well as dendrimer functionalized MWCNT. This was one of the earliest publication in this field. The method adopted here consisted of serial functionalization with carboxyl group by acid treatment, followed by modification of the carboxyl groups to isocyanate via reaction with toluene diisocyanate and finally reaction with excess of ethylene

Page | 114
diamine to obtain amino group modified MWCNT [216]. In a recent publication by Boosheshri et al a relatively simpler route towards nanosilver decoration of CNT was established by heating carboxylated MWCNT to 90ºC in presence of silver acetate. These nanohybrids were applied to hollow fibre membranes used in water filtration. Such application of silver CNT hybrids prevented bacterial infestation, which leads to formation of biofilms and consequent decrease in flow rates of water. These coatings were found to be regenerable, though the extreme slow release of silver ions was a point of concern for long term use [210].
Xin et al demonstrated the effect of decoration of silver on CNT using dimethyl formamide and its further use in polymers like polystyrene and polypropylene. The polymers were found to have better electrical conductivities. The mechanical strength of the polymer materials were favourably affected with 1% by wt loading of both pristine CNT and silver functionalized CNT, with Ag-CNT showing slightly higher modulus of elasticity compared to pristine CNT. It was believed that silver addition improved the dispersibility of CNT within the polymer matrix due to reduced surface energy and impact of Van der Waal’s forces between the CNT fibrils. The tensile strength of Ag-CNT containing polymer was also consistently higher than their counterparts containing equal amounts of pristine CNT [211].
Other methods of synthesis of silver-CNT hybrids were reported, which were multistep processes requiring sequential treatment with SOCl2, tetrahydrofuran and finally phenylenediamine in excess with intermittent steps of washing and vacuum drying [212]. When compared to all these published reports, the mycelia free filtrate mediated route for producing silver CNT composite was much simpler, obfuscating the need of any harsh reducing or stabilizing agent or heat treatment. The rich diversity of biomolecules and functional groups in

Page | 115
the filtrate facilitates the interaction of the same with the CNT surface on one hand and silver ions and nanoparticles on the other.
3.8 Synthesis of titania and palladium dispersed titania There is an upsurge of interest in the field of research on photocatalytic materials either for remediation of industrial wastes or production of clean energy in the form of hydrogen [217, 218]. Efficiency of such photocatalytic processes depends on many factors such as valence and conduction band positions in the catalysts, their stability, surface area, particle size and its distribution, dispersability in the medium etc.
Over 130 materials including oxides, nitrides, sulphides, carbides, and phosphides, have been reported to act as efficient photo-catalysts for hydrogen evolution via water splitting with varying degree of both positive and negative results. Among these titania is a prominent one because of its favourable band gap, high chemical and photochemical stability, biological inertness, low cost, ease of method of preparation etc [219]. Besides, titania (TiO2) possesses interesting optical and dielectric properties and hence may be used in pigments and cosmetic industries for air purification and self-cleaning surfaces etc. A general scheme for photocatalytic water splitting involving a metal co-catalyst is given in figure 3.8.1

Page | 116
Fig. 3.8.1 Schematic representation of photocatalytic process in TiO2 along with a cocatalyst.
Photons with energy equal to or greater than the band gap energy of the semiconductor, excite electrons from the valence band into the conduction band. The resulting electron/hole pairs can then migrate to the surface and initiate redox reactions with adsorbed organic molecules or protons [220] as depicted in the following equations. The introduction of sacrificial organic reagents increases the efficiency of hydrogen production by suppressing the recombination of electrons and holes, through irreversible reactions with photo induced species or by reverse reaction between O2 and H2 [221-224]. Given below is the sequence of reactions leading to hydrogen production from water via photo splitting in the presence of methanol.

Page | 117
Electron hole recombination is a limiting factor in these reactions. The presence of noble metals on titania surface results in the formation of a Schottky barrier at the metal/semiconductor interface, which leads to a decrease in electron-hole recombination rate. Crystallite defects also largely contribute to the efficiency of the photo-catalyst. The defects act as trapping and recombination centres between photo-generated electrons and holes, resulting in a decrease in the photo-catalytic activity. Higher the crystalline quality, smaller is the number of defects. Therefore, a high degree of crystallinity over and above high surface area is often required for a photo-catalyst, especially for an uphill reaction like water splitting [218, 225].
Nanostructured titania has been prepared by different chemical routes that are classified as: liquid processes like (sol–gel [226-228], solvothermal [229, 230], hydrothermal [231-233], solid state processing routes (mechanical alloying/milling ) [229, 234], mechano-chemical [235, 236], RF thermal plasma [237] and others such as laser ablation [238]. Of the above methods, sol–gel method is widely used.
Powders prepared by uncontrolled sol–gel method lack uniform size and shape and often get agglomerated on ageing. The following synthesis parameters viz. concentration of precursors, pH and temperature of the medium are required to be controlled precisely for uniformity of particle

Page | 118
size. Usually, titanium isopropoxide suitably diluted in isopropyl alcohol is added drop wise to chilled water which is agitated vigorously at the same time. In order to circumvent such critical and stringent requirements and avoid using of harsh reagents and temperature, we attempted a one pot simple synthesis of palladium coated titania at ambient temperature and pH.
Fig. 3.8.2 Schematic representation of synthesis of palladium dispersed titania with mycelia free filtrate of T. asperellum.
The reaction of titanium isopropoxide with water was instantaneous leading to formation of titanium hydroxide. The hydroxide then undergoes hydrolysis with time to form amorphous titania (TiO2). Palladium dispersed titania was prepared by in situ reduction of palladium chloride with the cell free filtrate from T. asperellum. The reduced metal was adsorbed on the titania matrix as shown schematically in figure 3.8.2. Bare titania as well as palladium dispersed titania (hereafter named as Pd-TiO2) were subsequently calcined at 350ºC. The samples were thoroughly characterized using the following techniques.

Page | 119
Fig. 3.8.3 (a) Low resolution TEM micrograph for representative titania (TiO2) sample. (b) histogram depicting particle size distribution. (c) the encircled area in red is assigned to 101 plane of anatase TiO2. (d) SAED pattern of titania indexed to planes of anatase phase.
Morphology of TiO2 and Pd-TiO2 nanoparticles were investigated by TEM (Figure 3.8.3 & 3.8.4). A representative image of the TiO2 sample in figure 3.8.3 illustrates that the nanoparticles were oblong in shape and the size varied between 5-11 nm. The high crystallinity as well as the single-crystalline nature of the particles was further confirmed by Selected Area Electron Diffraction pattern (SAED) and High Resolution Transmission Electron Microscopy (HRTEM) investigations. The SAED pattern could be indexed to the anatase phase of TiO2
(inset, Fig. 3.8.3d). In the HRTEM micrograph, lattice fringes corresponding to d-spacing of 3.4655Å due to 101 plane of TiO2 were observed (Fig. 3.8.3c).

Page | 120
Fig 3.8.4 (a) Low resolution TEM micrograph for representative palladium dispersed titania (PdTiO2). (b) Histogram depicting particle size distribution for the same sample. (c) Magnified view of 3(a). (d) HRTEM with lattice fringes assigned to 101 plane of titania and 111 plane of palladium (e) HRTEM with lattice fringes assigned to 101 plane of titania and 200 plane of palladium.
In figure 3.8.4 low resolution images of Pd-TiO2 samples exhibited particles of size between 5 to 10 nm, similar to those exhibited by the bare TiO2. It clearly shows that dispersion of the palladium phase did not bring about significant changes in the size or morphology of the particles. Again, the diffraction rings in the SAED pattern could be indexed to anatase phase of titania. However, presence of palladium could not be discerned due to its low concentration and/

Page | 121
or its amorphous nature. In the high resolution image in 3.8.4d and 3.8.4e along with the most prominent planes of TiO2 viz. 101, additional fringes corresponding to d-spacing of ~ 2.24Å and 1.9Å were observed that could be tentatively attributed to planes 111 and 200 of palladium. However, the assignment may not be unambiguous following very close d-spacings of TiO2 and Pd. It may be noted that presence of palladium dispersed within the TiO2 matrix was clearly confirmed from energy dispersive X ray analysis. Quantification of palladium in both TiO2 and Pd-TiO2 was done by neutron activation analysis in the washed samples. Palladium was estimated to be 7±0.39 mg/g in the Pd-TiO2 sample while it was undetected in the bare TiO2 sample. Therefore, a loading of 0.7 (wt%) of palladium was obtained using the biological route.
Fig. 3.8.5 The XRD patterns of the as-grown & calcined TiO2 and Pd-TiO2 samples

Page | 122
Most intense peaks appear at ~25.6, 38.22°, 48.3, 54.7, 62.8and 69.76º respectively assigned to diffraction from the 101, 004, 200, 211, 204 and 301 planes of anatase TiO2 (JCPDS 21-1272), implying that sample was obtained as a single phasic material [anatase phase with tetragonal crystal symmetry]. As was in the case of SAED pattern, no peaks corresponding to reflection from Pd metal could be observed in the XRD patterns as well. Average crystallite size of the samples as estimated from the broadening of the 101 peak using the Scherrer equation, occurred between 7.2 nm for calcined Pd-TiO2 and 5.7 nm for calcined TiO2. The estimated particle size from XRD agreed well with particle size distribution from TEM. The average size of the as grown TiO2 and Pd-TiO2 nanoparticles were obtained as 4.9 nm and 4.7 nm respectively. Thus calcination didnot cause much agglomeration.
Well-developed phases were not discernible in the as grown samples signifying lack of crystallinity.The peaks in all the samples were significantly broadened indicating their nanocrystalline nature. It was also evident that calcination at 350C for 4 h did not result in significant grain growth. Direct Reflectance UV Visible spectrophotometry measurements were done. From the absorbance obtained, band gap values were determined. Figure 3.8.6 shows a plot of (Ah)1/2 vs. h for the as-grown and calcined nc-TiO2 and Pd-TiO2 nanocomposite samples where from indirect bandgap was estimated using Kubelka-Munk formula. The respective values for the different samples are tagged in the figure 3.8.6. It may be noted that there was practically no change in the bandgap of the Pd-loaded sample as compared to the bare TiO2 nanoparticles. Also the bandgap did not change upon calcination similar to the consistency of particle size even upon calcination as was also observed from TEM studies. Moreover, a single band edge for Pd-doped sample corresponding to the theoretical value of bandgap for pure anatase titania indicated that the concentration of the rutile phase is absent in the sample.

Page | 123
Fig. 3.8.6 Band gap values for calcined and as grown/ uncalcined sample of TiO2and PdTiO2.
Figure 3.8.7 summarizes the effect of the Pd loading on the evolution of H2 from water via photochemical splitting over TiO2 and Pd-TiO2 photo catalysts. It shows the reaction time courses for H2 evolution over a period of 6 h. While only 358 µmol of H2 was collected on the bare TiO2 catalyst, almost four fold amount of H2 (942.5 µmol) was collected over 0.7 wt% Pd-TiO2. Moreover, the rate of H2 generation decreased with time for the TiO2 catalyst while Pd-loaded catalyst showed an increasing rate with time.

Page | 124
0 2 4 60
250
500
750
1000
TiO2
Pd/TiO2
H 2 / mole
s
Time/h
Fig. 3.8.7 Time dependent evolution of hydrogen via water splitting with 50 mg of TiO2 and Pd-TiO2 catalysts obtained using mycelia free filtrate of T. asperellum.
The Raman spectra of TiO2 and Pd-TiO2 samples synthesized by fungal route is depicted in figure 3.8.8. All the spectra exhibit peaks at ~147.8, 399, 516 and 640cm-1 of anatase TiO2 indicating that the anatase phase is retained even after annealing and impregnation with Pd. Although, the Raman peaks were of equal intensity and width for the as-grown samples, they became significantly broadened and decrease in intensity for the calcined Pd-TiO2 as compared to the calcined TiO2 samples indicating that some kind of interaction takes place between the two.

Page | 125
Fig. 3.8.8 Raman spectra of as-grown and calcined TiO2 and Pd-TiO2 samples.
Fig. 3.8.9 shows the XPS spectra of (a) calcined Pd-TiO2 and (b) calcined TiO2samples.
A slow scan in the binding energy range of 455 eV to 480 eV region for Ti2p peaks was performed as seen in the XPS spectra in figure 3.8.9. The doublets for Ti2p3/2 and Ti2p1/2 are observed at 459.6 eV and 465.3 eV. A satellite peak at 472.8 eV is also observed [239]. All these peaks underwent a blue shift in Pd-TiO2 sample. In none of the spectra, presence of Ti3+ state was observed implying that the Ti2O3 phase was not formed. The blue shift of the peaks for calcined TiO2-Pd might have been due to the interaction of Pd with TiO2.

Page | 126
Fig. 3.8.10 EDXRF of Pd-TiO2 sample indicating co presence of the two elements. Presence of palladium in Pd-TiO2 was confirmed by energy dispersive X-Ray fluorescence shown in figure 3.8.10. The K, K and L lines of palladium are clearly observed in the spectrum along with the TiK and TiK. Therefore, it is concluded that cell-free filtrate of T. asperellum was instrumental in reducing Pd2+ to Pd0 and at the same time worked as a size confining template for the titania nanoparticles. Biomolecules in the filtrate also might have a role in the hydrolysis of the hydroxide that resulted from the reaction of titanium isopropoxide and water. Narrow and uniform distribution of TiO2 particles, with size ranging between 5-11 nm was achieved by biological route as evident from the TEM micrographs and corroborated from XRD analysis. The material was also found suitable for photo-catalytic water splitting leading to hydrogen generation. The hydrogen yield was also higher than that reported for indium titanate catalyst and commercial titania (P25) [240].

Page | 127
It is noteworthy that TiO2 synthesized by other biological routes were not of pure anatase phase but a mixture of rutile and anatase. The size distribution obtained was between 8 to 35 nm. The method employed, consisted of heating metatitanic acid along with yeasts and lactobacillus cultures at 60˚C for 10-20 minutes followed by incubation at room temperature [241]. Compared to this report we obtained a much smaller size distribution between 5-11 nm and phase-pure titania. An analgous chemical synthetic procedure where acidified water of pH 1.5 was used instead of mycelia free filtrate along with precursor titanium isopropoxide dissolved in isopropyl alcohol, yeided titania particles of average diameter 15 nm. This further reiterates the yet undeciphered role of the macromolecules of the mycelia free filtrate in restricting grain growth and yielding titania and palladium dispersed titania composites of near uniform size. The superior catalytic activity of these nanoparticles has also been demonstrated indicating a potential application for hydrogen generation studies.
3.9 Plausible mechanism of formation of nanoparticles using silver nitrate It was established that the mycelia free filtrate of Trichoderma asperellum was instrumental in synthesizing nanoparticles of noble metals and composites. We wanted to elucidate the different molecules in the mycelia free filtrate involved in the formation of metal nanoparticles. Fungi of genus Trichoderma are known producers of extracellular enzymes like xylanase, cellulase, chitinase etc. The culture supernatants of these fungi are also dominated by the presence of low molecular weight, possibly non-enzymatic proteins [242]. Their molecular weights range from 6 to 44 kDa and may function as elicitors. Apart from these, secondary metabolites, signaling molecules and compounds related to antibiosis are also present. The mycelia free filtrate may

Page | 128
also reflect the same diversity of biomolecules, albeit in lower concentrations than the culture supernatant. Hence it was not expected to assume that a single mechanism will contribute towards metal ion reduction and capping. Hence our initial attempt was to look for alterations in spectroscopic signatures, in the mycelia free filtrate, before and after formation of nanoparticles. This would help us gain understanding about the chemical moieties associated with silver ion reduction.
Fig. 3.9.1.1 FTIR spectra of the cell-free extract (a) before addition of AgNO3 and (b) after removal of silver nano-particles by centrifugation.
3.9.1 Probable involvement of cysteine in formation of nanoparticles Figure 3.9.1.1 shows the FTIR spectrum of the mycelia free filtrate (a) before addition of AgNO3 to it and (b) after removal of silver nano-particles by centrifugation. Both the spectra exhibit a broad intense band at ~3400cm-1 with overlapping shoulders on either side assigned to

Page | 129
the N-H stretching frequency. This arises from the peptide linkages present in the proteins of the filtrate. Upon deconvolution, the side bands were respectively identified to be the overtone of the amide-II band (~3270cm-1) [243]and stretching frequency of the O-H band (~3600cm-1), possibly arising from the aqueous solvent. It may be observed that the intensity of the first two bands diminished significantly in (b) indicating a probable decrease in the concentration of the peptide linkages in the solution. The spectra also exhibited an intense band at ~1640cm-1 and a broad asymmetric band at ~2100cm-1, the latter assigned to the N-H stretching band in the free amino groups of biomolecules and a very weak feature at ~2600cm-1 due to S-H stretching vibrations. It may be noted that the intensity of the band at ~2100cm-1 remains almost unchanged in the two spectra while that due to S-H stretching, shifts towards lower wave numbers in (b). Upon deconvolution, the band at ~1640cm-1 was found to be a superposition of three different bands centered at ~1550, 1640 and 1670cm-1 respectively, assigned to the amide-II band, carbonyl and carboxylic C=O stretching bands of the peptide linkages. The intensity of these bands also decreased in (b) due to decrease in the concentration of peptide linkages in the solution in conformity with our previous observation. Besides, the spectrum of solution (a) also exhibited two vanishingly weak features at ~2840 and 2900cm-1 respectively assigned to the symmetric and asymmetric stretching vibration of sp3 hybridized -CH2 groups [244] that were not observed in the other spectrum. This suggested that CH2 groups drastically decreased or were probably absent in the solution (b). Moreover, both the spectra exhibited a low frequency band at ~760cm-1 attributed to the bending vibration in S-H bonded to the CH2 moiety [245, 246] and a weak feature at 1020cm-1 assigned to ring vibrations from aromatic fragments. It was observed that although the feature at ~1020cm-1 remained unchanged in intensity in the spectrum (b) as well, the intensity of the band at ~760cm-1 decreased drastically possibly due to the changed

Page | 130
chemical environment and hence symmetry around the S-H bond. This further suggested that there was a change in the bonding of β-CH2 moiety attached to the S-H functional group in solution (b). Apart from these, the spectrum of the solution (b) exhibited an additional weak feature at ~970cm-1 identified to be the wagging mode of trans-ethylenic moiety [247, 248]. Absence of this feature in the spectrum of solution (a) clearly indicated the formation of C=C double bond after the reduction process. From the discussions above, it is evident that an amino acid with S-H bond possibly in a protein or peptide, played a key role in reducing AgNO3 to silver nanoparticles. Since there can be only two sulfur containing amino acids present in the protein containing cell free extract, namely cysteine and methionine, it has to be either of the two. But methionine does not have any S-H linkages, as observed in the FTIR spectra. Hence, cysteine is most likely the amino acid that underwent dehydrogenation upon reaction with mild oxidizing agent AgNO3. The plausible mechanism for reduction is schematically represented in Figure. 3.9.1.2. The β-carbon in cysteine lost one hydrogen radical and one electron in one concerted or two consecutive steps and reduced Ag+ ion to Ag nanoparticles possibly in presence of an enzyme or small elicitor like molecules reported to be secreted by other species of Trichoderma [249]. Formation of an intermediate cation was stabilized by delocalization of the non-bonding electrons on sulfur. In this process, the “CH2” moiety adjacent to S-H functional group was lost and which was manifested in complete disappearance of the FTIR bands at ~ 2840 and 2900cm-1 and lowering of intensity of the band at ~760cm-1. In the next step, α carbon lost one hydrogen to form α-β C=C bond, as was evidenced from the appearance of the FTIR peak at ~970cm-1. The C=C double bond was in conjugation with the lone pair of electrons on sulfur atom. This was supported from the fact that the thiolic hydrogen becomes more acidic as was evidenced from the red-shift of the band at ~2600cm-1due to S-H stretching. The product in

Page | 131
scheme I was preferred over that in scheme II (more commonly observed in case of alcohols). The reason being that formation of C=C bonds is energetically favored over S=C bonds and the latter will invariably impose severe geometrical constraints on the molecule. Moreover thiols, in general, are less acidic as compared to alcohols and that makes elimination of hydrogen attached to sulfur less probable. This also accounted for the fact that tautomeric conversion between products of scheme I and II does not take place so readily under this bio-transformation. The hypothesis was supported by the fact that no peak corresponding to S=C bond vibrations in the spectrum (b) was observed. All FTIR band assignments were done in accordance to reference [244]. Cysteine rich low molecular weight proteins are known to be secreted by fungi. They are a part of cerato-platanin group of proteins [250] and are known to function as elicitors of plant defense responses. These may form a part of the large array of low molecular weight proteins secreted by fungi in the culture supernatant. Their presence in the mycelia free filtrate may play an important role in reduction of silver ions. However the presence of such biomolecules is a part of further investigations.

Page | 132
Fig. 3.9.1.2 Schematic representation of the mechanism of formation of silver nanoparticles.

Page | 133
Fig. 3.9.1.3 Macro-Raman spectrum of silver nanoparticles drop casted on Si(100) single crystals Mechanism of capping of silver nanoparticles In order to explore the plausible mechanism of encapsulation of the silver nanoparticles by suitable capping agent(s), Raman spectrum of as synthesized sample solution drop casted on Si(100) single crystals was recorded and analysed. Since plasma frequency of silver lies in the visible regime, it was presumed that intensity of the Raman bands of the organic molecules (the capping agents, if any) attached to the silver nanoparticles will be selectively enhanced when excited with a visible laser. Fig. 3.9.1.3 shows the aforesaid Raman spectrum which clearly exhibited an intense band at ~240cm-1. This was identified to be due to stretching vibrations of Ag-N bonds [251] and two broad bands at ~1350 and 1565cm-1 attributed respectively to symmetric and asymmetric C=O stretching vibration of the CO2- ions [252] apart from a few

Page | 134
weak features at ~692, 940, 970 and 1050cm-1 assigned respectively to the stretching vibrations of C-S, C-CO2-, C-C and Cα-N bonds [252, 253]. Selective enhancement of these Raman bands clearly indicated that C=O bonds of the carboxylate ions and Ag-N bonds from the free amine groups were lying perpendicular to the nano silver surface. Thus they were directly associated with the capping of the same. This was further supported by the fact, that both symmetric and assymetric stretching bands of CO2- were significantly broadened. This occurred due to distortion in the respective bond angles and bond lengths because of the strain induced, following encapsulation of silver nanoparticles. However, absence of any peak due to Ag-S vibrations (either in FTIR or Raman spectrum) clearly negated any possible role of the disulphide and/ thiolate linkages in stabilising these molecules as has been reported by earlier researchers [254]. The fact that thiolate linkages did not participate in capping was also observed by Halvorson et al [255]. The band at 240cm-1 was a direct evidence of chemical bonding between silver nanoparticles and the nitrogen of the amine group present in the amino acids. The probing technique itself manifested the feasibility of using these nanoparticles as potential templates for surface enhanced resonance Raman spectroscopy.

Page | 135
3.9.2 Interaction of cysteine with silver nitrate Cysteine was found at least partially involved in the formation of silver nanoparticles in our earlier experiments. We wanted to further study this aspect for pinpointing the exact role of cysteine in this process. Table 3.9.2.1 The compositions of samples made with different concentrations of cysteine
Table 3.9.2.1 summarises the observations when varying proportions of cysteine was made to react with fixed concentration of silver nitrate. Sample C containing 0.1 mM cysteine was the only one among the four different concentrations, which remained stable for a month. The silver nanoparticles produced in this sample were characterized in detail.
Samples [Cysteine] (mM)
[AgNO3] (mM)
Observation
A 0.001 1 Very fine precipitation after 2days, transparent supernatant
B 0.01 1 Brownish grey precipitation after 2days, transparent supernatant
C 0.1 1 Yellow sols, colour deepens in 2days remains stable for more than 1month
D 1 1 Instant flocculation followed by precipitation

Page | 136
Fig. 3.9.2.1 UV-visible spectrum of sample C recorded till the completion of reaction. Inset: EDS spectrum of the same sample. 3.9.2.(a) Characterisation of silver sols produced with 0.1 mM cysteine Figure 3.9.2.1 shows the UV-vis spectrum of sample C after ageing for 13 days. It exhibited an asymmetric peak at ~398 nm corresponding to the surface plasmon frequency of nanocrystalline silver [256], indicating that cysteine [257] had reduced AgNO3 to metallic silver. An additional hump at ~280 nm was attributed to the [cysteine-Ag+]n complexes [258] that were also formed along with Ag-nps. Inset of Figure 3.9.2.1 shows the EDS spectrum of the same sample. Peaks due to carbon, nitrogen, sulphur and oxygen were also observed that arose from the capping of Ag-nps by the cysteine molecules.

Page | 137
Fig. 3.9.2.2 Kinetics of the reaction of 0.1 mM cysteine with 1 mM silver nitrate (sample C)
Kinetics of the reaction was studied by drawing aliquots at regular intervals and recording the UV-vis spectra of the sol. Figure 3.9.2.2 shows the corresponding change in absorbance at ~398 nm with time. The reaction rate (adjudged by increase in absorbance) was relatively slower during the first three days marking a phase of induction. Thereafter the reaction rate increased exponentially from the fourth day indicating the growth phase. There was no visible change, of plasmon band intensity of the sample after 12 days. After 1 month, visible precipitation in the sample ensued.

Page | 138
Fig. 3.9.2.3 (a) TEM image of the sample C, (b) bar diagram showing a narrow particle size distribution and (c) estimated hydrodynamic diameter comprising of the nanoparticles and the organic caps. Figure 3.9.2.3 (a) shows a representative TEM image of the sample C. The dark contrasts were due to the Ag-nps. particles with a narrow size distribution ranging between 8-18 nm and mean value of 14.5 nm [as shown by bar diagram in Fig. 3.9.2.3(b)] were observed. The average particle size for sample C as estimated from the TEM image analysis was very much similar to that obtained for silver nanoparticles synthesized by the mycelia free filtrate of T. asperellum. Nano silver could be visualized as dark nearly spherical bodies embedded in a matrix of lighter contrast. The hydrodynamic diameter of the capped nanoparticles comprised of the metal crystals together with the organic moieties (indicated with a black circle) and is often estimated as the

Page | 139
effective particle size by light scattering techniques. The average hydrodynamic diameter was 113 nm taking into account the areas of lighter contrast assumed to be the matrix.
Fig. 3.9.2.4 XRD pattern recorded in the 2θ range 20˚-70˚of sample C drop cast on a glass slide and heated to remove the organic moieties present in the sample. Inset: Particle size estimation from XRD peak broadening of an as-grown sample. Sample C was dropcast on glass slide after the reaction for formation of nano silver attained saturation. Figure 3.9.2.4 shows the XRD pattern recorded in the 2θ range 20˚-70˚. The sample was further heated to remove the organic moieties present in the sample. The capping molecules formed an amorphous network around the metal nanoparticles [see Fig. 3.9.2.3(c)] and hence the smaller XRD peaks of Ag at higher 2 values were obscured. The diffraction pattern exhibited peaks at ~38.1˚, 44.2˚ and 64.4˚ attributed respectively to diffraction from 111, 200 and 220

Page | 140
planes of metallic silver with FCC lattice (JCPDS No. 04-0783). From broadening of the principal XRD peak at ~38.1 of an as-grown sample (shown in the inset), average crystallite size was estimated using Scherrer equation to be ~14.4 nm. The value was in excellent agreement with that obtained from the TEM analysis in figure 3.9.2.3b.
Fig. 3.9.2.5 Log-linear plot of surviving bacterial colonies relative to that of the control vs. concentration of Ag nanoparticles synthesized (a) via fungal filtrate route and (b) using cysteine. Inset: Digital photograph of the controls and culture supplemented with different concentration of Ag nanoparticle Antibacterial activity: Antibacterial activity of Ag-np sols was studied using model organism Escherichia coli BW25113. Fig. 3.9.2.5 shows a log-linear plot of surviving bacterial colonies of E. coli relative to that of the control vs. dose of Ag nanoparticles, synthesized (a) via fungal route

Page | 141
and (b) using cysteine. In either case, the cell numbers dropped steadily with increasing dosage of silver nanoparticles. MIC (minimum inhibitory concentration) & MBC (minimum bactericidal concentration) values were estimated for both the samples and have been pointed out on the respective graphs. MIC and MBC of nanoparticles for E. coli derived from the filtrate were 3.24 µg/ml and 7.56 µg/ml. MIC and MBC for cysteine synthesized silver nanoparticles against E.coli was 4.32 µg/ml and 8.64 µg/ml respectively. Since, the MBC values in either case were within four times of their respective MIC values, both may be classically termed as bactericidal agents according to definition given in the reference [259]. Insert in Figure 3.9.2.5 shows how a typical culture and controls look like after administration of different dosage of Ag nanoparticles. In both the cases, the MIC and MBC values are significantly lower than that published earlier where 25 to 100 µg/ml inhibitory doses were reported [168, 260, 261]. Thus the efficacy of the silver nanoparticles synthesized by these techniques was confirmed. The higher antibacterial activity of cysteine capped and fungal filtrate synthesized Ag-nps was possibly due to the contribution of capping agents of biological origin which might have played a synergistic role in the activity. This observation is in agreement with the reports by Parashar et al on Psidium guajava extract capped Ag-nps [262]. They demonstrated that silver nanoparticles with organic capping agents were able to anchor to the bacterial cell wall more effectively and in shorter time when compared to hydrazine reduced Ag nps [262]
3.9.2(b) Effect of metal: cysteine ratio on the stability of Ag sols It was observed that stability and dispersibility of the silver sols depended strongly on the relative concentration of cysteine and AgNO3. The sol obtained by reacting 0.1 mM of cysteine with 1 mM AgNO3 remained stable for a month. When cysteine concentration was increased from 0.1 to 1 in case of sample D, flocculation started almost instantaneously and silver particles were precipitated within a short time (Table 3.9.2.1). On the other hand, reduction of cysteine

Page | 142
concentration from 0.1 mM to 0.01 mM (sample B) and 0.001 mM (sample A) also decreased the stability of the metal sols. After remaining stable for ~2 days, precipitation of brownish grey particles started in sample B and continued for l week. In contrast, very fine particulates were observed for sample A.
Fig 3.9.2.6 The UV-vis spectra of samples A and B (cysteine 0.01, 0.001 mM) recorded after ageing. Figure 3.9.2.6 shows the UV-vis spectra of samples A and B recorded after ageing. Although both the spectra exhibited the typical silver plasmon peak at ~400 nm due to the formation of Ag-nps, the low absorbance values were indicative of a small amount of the dispersed phase in the sols. The hump at ~540 nm was due to agglomeration of particles. Zeta potential serves as the stability index of a colloidal solution. According to the theory on the stability of colloids, repulsive force between two colloidal particles prevents them from

Page | 143
coming closer and, getting coagulated. This repulsive force is proportional to the square of the zeta potential. Hence, higher the magnitude of zeta potential, higher is the stability of the colloids.To understand how stability of cysteine capped Ag sols got affected by relative concentration of cysteine to AgNO3, zeta potential () and DLS measurements were carried out on all the 4 samples (before the onset of precipitation for samples A, B and C and immediately after mixing the reactants for sample D). pH of the medium was also recorded since it influenced the overall surface charge on the nanoparticles.
Table 3.9.2.2 Stability assessment of silver sol. [AgNO3] = 1mM Table-3.9.2.2 summarizes values and the mean effective particle sizes (hydrodynamic diameter) for the different samples as estimated by DLS. Sample C exhibited the highest value of +18 mV and was most stable in the series. Moreover, the mean particle size estimated from DLS of 110 nm in sample C, was the least among all the sols studied. The average particle size of sample C estimated by light scattering was in good agreement with that obtained from TEM
[Cysteine] (mM)
Zeta potential
(mV) Mean effective
particle size by DLS
(nm)
pH Stability of sol
0.001(A) -9.3 ------ 5.7 poor 0.01(B) -10.6 270 5.1 poor 0.1(C) 18.1 110 3.8 good 1(D) 7.4 420 3.2 Quick
precipitation

Page | 144
image analysis. Other sols had values ranging between -10 mV to 10 mV and hence exhibited poor stability. It may be noted that particle size of sample A could not be recorded with adequate reproducibility due to very low concentration of the Ag-nps in the sol and fluctuations in the scattered light. Bare silver nanoparticles dispersed in water are negatively charged [256] due to their micellar characteristics. Negative surface charge on nanoparticles of samples A and B as adjudged from values hinted on the possibility of these particles being inadequately capped. At low relative concentrations of cysteine, enough capping-molecules were not available to stabilize the silver nanoparticles. Moreover at the pH range of 5.1-5.7, close to IEP (isoelectric point) of cysteine (pH=5.02), low negative values indicated instability of the particles. This was due to low net charge on cysteine close to IEP. With increasing concentration of cysteine, pH of the medium became more and more acidic due to liberation of H+ ions according to the equation given below cysteine + 2AgNO3 cysteine (ox.) + 2Ag + 2HNO3 The high positive value of sample C probably resulted from the protonation of amine groups in the adsorbed cysteine molecules at pH 3.8 well above IEP of cysteine. The net surface charge on capped nanoparticles was adequate to prevent their further growth and agglomeration, thereby resulting in extended stability of the sol for more than 1 month. At a still higher concentration of cysteine and at pH 3.2, sample D exhibited a small positive value indicating that the nanoparticles were still capped by protonated cysteine but the stability of the sol was greatly reduced. Due to rapid reduction of AgNO3 at higher concentration of the reducing agent (here it is cysteine), fewer nucleation centres survived. These nucleation centres rapidly grew in size and the particles so formed coalesced into large lumps of material that tend to settle down under gravity. Aggregation of silver nanoparticles in sample D was reflected in its extremely low

Page | 145
value. Similar observations were reported independently by different research groups for surfactant stabilized silver nanoparticles [256, 263-266]. Of the three sols with limited stability, sample D was particularly interesting because it produced particles with non-spherical morphology and exhibited significant shift in the plasmon peak position as compared to the others. Hence, it was studied in detail. Fig. 3.9.2.7 shows the SEM image of prismatic agglomerates obtained from the precipitation of sample D. The agglomerates exhibited morphology that was entirely different from the pseudo-spherical nanoparticles of sample C (see TEM image in Fig. 3.9.2.3). The principal plasmon band of sample D appeared at ~354 nm [see inset (b) of Fig. 3.9.2.7]. The significant blue shift of the band as compared to the other sols was attributed to non-spherical silver nanoparticles [256, 258, 264-267]. A small hump at ~485 nm was associated with extensive agglomeration of the crystallites [267] that resulted in larger particulates. Inset (a) in the figure shows the XRD pattern of a heated sample D, with characteristic peaks of metallic silver with cubic lattice. Average crystallite size was estimated from the broadening of the 111 peak of the as-synthesized sample using Scherrer equation, to be ~17.5 nm.

Page | 146
Fig. 3.9.2.7 SEM micrograph of the sample D. Inset (a): XRD pattern of the heated and as-synthesized sample D, (b) UV-vis spectrum of the same sample
3.9.2(c) Capping of Ag-nps by cysteine
In absence of a third chemical entity in the system, other than cysteine and AgNO3, stabilization of the Ag-nps must have taken place due to their capping by the cysteine molecules. Presence of organic moiety along with the metal particles was evidenced from the EDS spectrum (see inset of Fig. 3.9.2.1) and TEM image of sample C (see Fig. 3.9.2.3). Capping of nanoparticles may take place either by physisorption of the organic molecules on to the nanoparticle surface or by

Page | 147
chemically bonding with the same. To investigate the possible mode of metal-organic interaction in cysteine-capped Ag-nps, spectroscopic studies were carried out on solid samples. Figure 3.9.2.8 shows the main core level XPS spectra of (a) Ag3d, (b) O1s, (c) S2p and (d) N1s for the cysteine capped Ag-nps. The S2p and N1s spectra were de-convoluted using freely available software XPSPEAK4.1, after smoothening of the raw data with FFT filter, while a single profile was adequate for both Ag3d and O1s. The Ag3d peaks [Fig. 3.9.2.8 (a)] were observed at 366.7 eV with spin orbital splitting of 6 eV. The Ag0 peak is reportedly observed at ~368.2 eV [268]. Significant red shift of the binding energy for the cysteine capped samples clearly indicated that a bonding interaction was there between the Ag-nps and the capping cysteine molecules. The O1s peak [Fig. 3.9.2.8 (b)] was observed at 529.3 eV. This was also downshifted from its reported value for free oxygen atoms, indicating that the bonding of cysteine with Ag-nps possibly took place via carboxylate ions. Fig. 3.9.2.8 (c) shows S2p peak along with its deconvoluted features. Two components were observed at ~162.2 and 163.1 eV. The peak at ~162.2 was tentatively assigned to the thiolate anions that interacted with the metallic silver. The peak at higher binding energy was possibly due to the thiolate anions that might have interacted weakly with the neighbouring cationic amine groups instead of the metal [269] . N1s spectra exhibited two components and have been attributed to the free amino groups (peak at ~400.3 eV) and those bonded to the metal surface (peak at ~399.6 eV).

Page | 148
Fig. 3.9.2.8 XPS spectra of (a) Ag3d, (b) O1s, (c) S2p and (d) N1s for cysteine capped Ag-nps along with the deconvoluted features.

Page | 149
Fig. 3.9.2.9 Raman spectrum of the sample C drop cast on silicon single crystal. Inset: The same spectrum magnified in the range 150-350cm-1 Figure 3.9.2.9 shows the Raman spectrum of sample C drop cast on a silicon single crystal. Inset shows the same spectrum magnified in the range 150-350cm-1. The spectrum exhibited peaks at ~227, 250 and 260cm-1. The peaks at ~227 and 250cm-1 have been attributed to Ag-S and Ag-N [270] stretching vibrations due to the formation of covalent bonds between the Ag-nps and nitrogen atom of the amino group and sulphur atom of the thiolate group.
Earlier, Mandal et.al. reported on the capping of Ag-nps by cysteine molecules via thiolate linkages [271]. Thakur et al. discussed the possibility of all the three Ag-S, Ag-N and Ag-O linkages at the same time [272]. However, all these studies were carried out in the alkaline pH and strong reducing agents like NaBH4 and Na2S were used to produce Ag-nps. In contrast, cysteine was used as the sole reducing and capping agent in our method and Ag-nps were

Page | 150
produced in mildly acidic pH in a green chemical approach. Jing et al. studied extensively on the adsorption of L-cysteine molecules on gold and silver nanoparticles by both surface enhanced resonance Raman spectroscopy and DFT calculations [273]. They showed that interaction of Ag-nps with L-cysteine especially in presence of NO3- took place primarily through carboxylate and amino groups. Based on spectroscopic evidences and inputs from the literature, it may be safely concluded that the capping of Ag-nps by cysteine in our samples took place through either or all the three thiolate, amino and carboxylate linkages. The dual role of cysteine both as a reducing and capping molecule in the preparation of Ag-nps was thus firmly established. To conclude, in this study feasibility of synthesizing stable silver nanoparticles by using cysteine in a biomimetic approach was amply demonstrated. Dual role of cysteine as the reducing and capping molecule was established. Capping of the nanoparticles took place via covalent bonding of either or all the three thiolate, amino and carboxylate groups of the cysteine molecule. Silver sol produced by reacting 0.1 mM of cysteine with 1 mM of AgNO3 was stable for over 1 month. The MIC value registered against E. coli was lower than reports in literature and was comparable with that of Ag-nps obtained via fungal route. The particle sizes were also comparable in the two cases, signifying that the products synthesized by cysteine and that obtained by fungal route mimicked each other in terms of morphology and properties. In spite of the aforementioned advantages of our bio-mimetic approach over the conventional biological syntheses, the maximum stability of the sol that could be synthesized using cysteine was over 1 month as against over 1 year (in darkness) for sols synthesized by T. asperellum [274]. This underlined the applicability and significance of biosynthesis despite it being elaborate and involved.
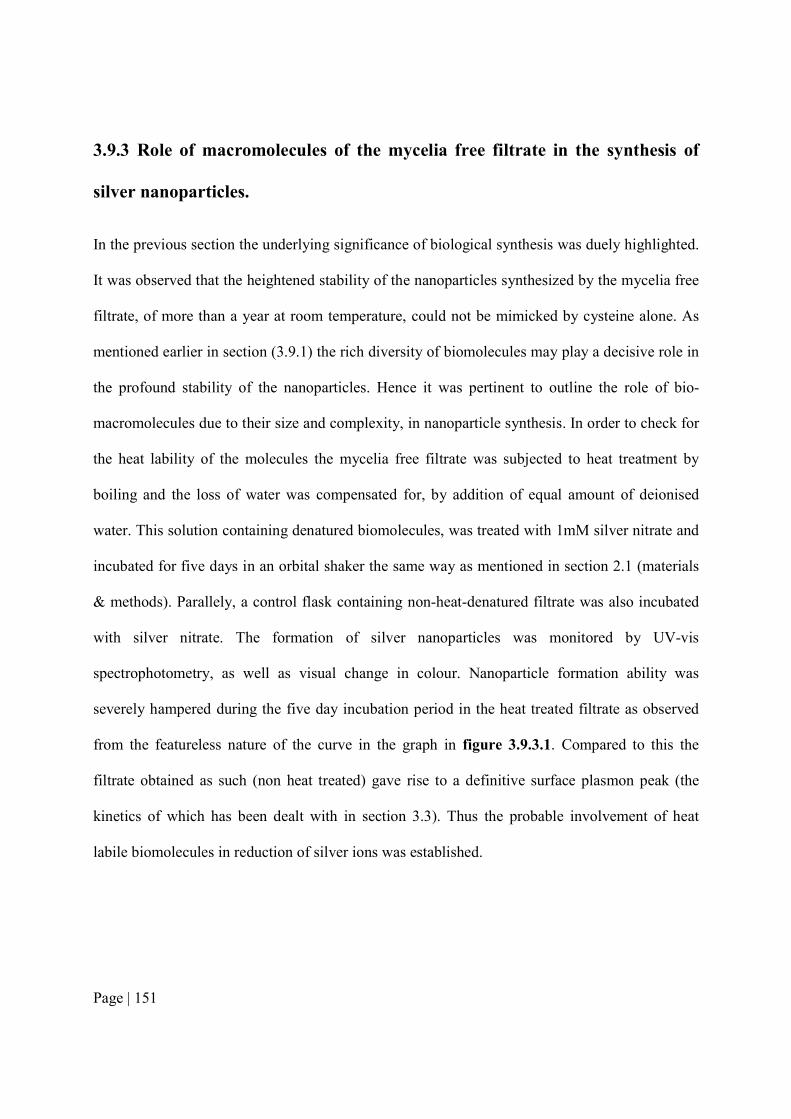
Page | 151
3.9.3 Role of macromolecules of the mycelia free filtrate in the synthesis of silver nanoparticles.
In the previous section the underlying significance of biological synthesis was duely highlighted. It was observed that the heightened stability of the nanoparticles synthesized by the mycelia free filtrate, of more than a year at room temperature, could not be mimicked by cysteine alone. As mentioned earlier in section (3.9.1) the rich diversity of biomolecules may play a decisive role in the profound stability of the nanoparticles. Hence it was pertinent to outline the role of bio-macromolecules due to their size and complexity, in nanoparticle synthesis. In order to check for the heat lability of the molecules the mycelia free filtrate was subjected to heat treatment by boiling and the loss of water was compensated for, by addition of equal amount of deionised water. This solution containing denatured biomolecules, was treated with 1mM silver nitrate and incubated for five days in an orbital shaker the same way as mentioned in section 2.1 (materials & methods). Parallely, a control flask containing non-heat-denatured filtrate was also incubated with silver nitrate. The formation of silver nanoparticles was monitored by UV-vis spectrophotometry, as well as visual change in colour. Nanoparticle formation ability was severely hampered during the five day incubation period in the heat treated filtrate as observed from the featureless nature of the curve in the graph in figure 3.9.3.1. Compared to this the filtrate obtained as such (non heat treated) gave rise to a definitive surface plasmon peak (the kinetics of which has been dealt with in section 3.3). Thus the probable involvement of heat labile biomolecules in reduction of silver ions was established.

Page | 152
Our next objective was to selectively remove molecules below a threshold size and find out the consequent effect on nanoparticle formation. For the same purpose, the mycelia free filtrate was dialysed through a 10 kDa cut off membrane. On incubating the dialysed filtrate with silver nitrate, characteristic surface plasmon peak was not observed when compared to an undialysed control in figure 3.9.3.2. The many possible molecules in a biological system of molecular weight less than 10 kDa are peptides, secondary metabolites and cofactors of enzymes to name a few. It was previously demonstrated by several researchers that NADH in conjunction with enzymes had a key role in nanoparticle synthesis. Hence we supplemented the dialysed filtrate with NADH to check if the loss of nanoparticle synthesis activity in the dialysed filtrate, could be restored. NADH-supplemented, dialysed filtrate regained nanoparticle synthesis function, as can be visualised in the figure 3.9.3.3, by the appearance of a plasmon peak centred at ~420 nm. NADH concentrations ranging from 0.025 mM to 1 mM were checked for nanoparticle synthesis. Among the different concentrations of NADH used to supplement the dialysed filtrate,
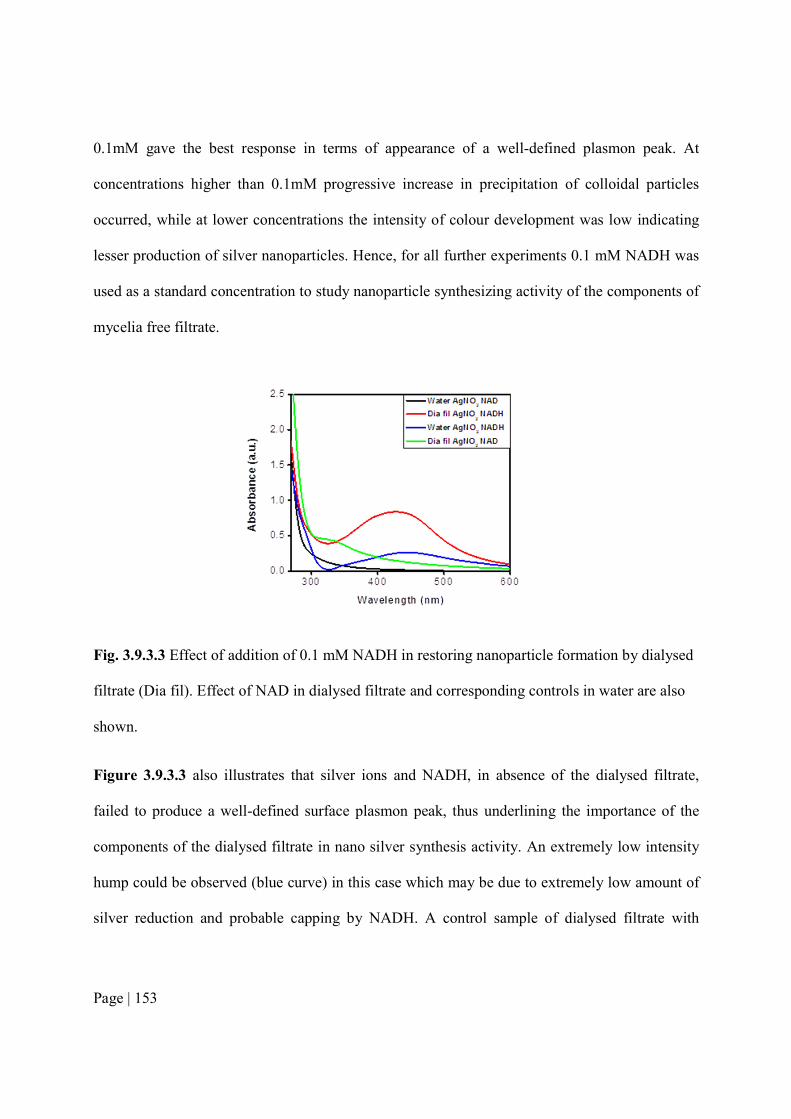
Page | 153
0.1mM gave the best response in terms of appearance of a well-defined plasmon peak. At concentrations higher than 0.1mM progressive increase in precipitation of colloidal particles occurred, while at lower concentrations the intensity of colour development was low indicating lesser production of silver nanoparticles. Hence, for all further experiments 0.1 mM NADH was used as a standard concentration to study nanoparticle synthesizing activity of the components of mycelia free filtrate.
Fig. 3.9.3.3 Effect of addition of 0.1 mM NADH in restoring nanoparticle formation by dialysed filtrate (Dia fil). Effect of NAD in dialysed filtrate and corresponding controls in water are also shown.
Figure 3.9.3.3 also illustrates that silver ions and NADH, in absence of the dialysed filtrate, failed to produce a well-defined surface plasmon peak, thus underlining the importance of the components of the dialysed filtrate in nano silver synthesis activity. An extremely low intensity hump could be observed (blue curve) in this case which may be due to extremely low amount of silver reduction and probable capping by NADH. A control sample of dialysed filtrate with

Page | 154
similar concentration of NAD instead of NADH, also failed to exhibit nanoparticle formation, indicative of the specific role of the reduced form of NAD in the same.
Thus, having established the contribution of components of the dialysed filtrate and NADH towards formation of nanoparticles, the next objective was to find out the macromolecules (above 10 kDa) represented in the dialysed filtrate.
To achieve this, the mycelia free filtrate was concentrated by ultrafiltration using a 10 kDa cut-off membrane. 918 ml of the mycelia free filtrate was concentrated to 40 ml in a centricon stirred cell ultrafiltration assembly. The concentrated filtrate would be termed as retentate here after. The concentration of protein in the retentate was determined to be 2285 µg/ml. The retentate failed to exhibit nanoparticle formation without NADH, in the presence of silver ions (figure 3.9.3.4). However addition of 0.1 mM NADH in the retentate re-established the ability of nanoparticle formation.
Fig. 3.9.3.4 Effect of addition of 0.1 mM NADH in restoring nanoparticle formation by the concentrated retentate. Controls of without NADH or NAD supplementation, and controls with NAD have also been shown
300 400 500 6000.0
0.5
1.0
1.5
2.0
2.5
3.0
Abso
rbanc
e (a.u
.)
Wavelength (nm)
AgNO3 Retentate(1:23) no NAD NADH AgNO3 Retentate(1:23) NAD AgNO3 Retentate(1:23) NADH
Page | 155
Electrophoresis of Proteins in the retentate and Mass Spectrometry There was very high possibility that molecules acting in conjunction with cofactors could be proteins. Hence the retentate sample was electrophoresed on a 12% SDS-polyacrylamide gel to resolve the proteins. Reducing agent was omitted from the sample buffer to retain the disulphide bonds of the proteins intact. SDS in the gel was replaced with triton-X-100 after electrophoresis and further washed with water to allow renaturation of the resolved proteins. Thus the gel bound proteins were brought back to a functionally active form. Samples were run in duplicates. One half of this gel was stained with Coomassie R 250 and the other half was incubated with 0.1 mM NADH and 1mM silver nitrate to mimic conditions used to restore nanoparticle formation ability by the retentate in previous experiments. As is evident from the gel photograph in Fig.3.9.3.5 a particular area of the gel, corresponding to the region between band 14 to band 18 in the stained half of the gel, turned yellow in colour. The other parts of the gel, excluding the lanes in which samples were loaded, served as a negative control indicating that the material of the gel and the reagents did not contribute to nanoparticle formation. It was also found that not all protein bands responded to the presence of silver nitrate and NADH by changing colour to that, characteristic of silver nanoparticles. Another noticeable point was that nanoparticle formation was independent of protein concentration as can be observed in the case of bands 14 and 15. While bands 12, 13,and 19 were of much higher intensity in the Coomassie stained gel (indicating higher amounts of protein) compared to bands 14, 15, 16, 17 & 18, they did not contribute toward NADH dependent silver nanoparticle formation.

Page | 156
Fig. 3.9.3.5.(a): Coomassie stained non-denaturing gel with marker lane (b): Unstained half of the gel exposed to NADH (0.1 mM) & AgNO3 (1 mM) S- sample, M- marker

Page | 157
Table 3.9.3.1: Summary of Hits obtained from Mascot Analysis of MALDI-TOFF results for band 14-18
Band no Identity Organism Score Sequence coverage Peptide matches 14 1st hit Hypothetical protein Fomitopsis pinicola 70 35% 7
2nd hit Hypothetical protein Trichoderma atroviridae 61 9% 23 3rd hit Hypothetical protein Bipolaris oryzae 61 15% 12
15 1st hit ATP dependent RNA helicase Nosema bombycis 76 22% 8 2nd hit Hypothetical protein Postia placenta 61 12% 9
16 1st hit Hypothetical protein Fusarium oxysporum 82 40% 6 2nd hit Hypothetical protein Aspergillus flavus 63 4 3rd hit short - chain dehydrogenase, Cordyceps militaris 53 12% 8
17 1st hit Mixture of proteins Not considered 2nd hit Mixture of proteins Not considered 3rd hit Vacuolar protease A Trichoderma aureoviridae 84 23% 10
18 1st hit CDC 73 family RNA pol II accessory factor Colletotrichum graminicola 78 31% 10 2nd hit Putative ankyrin repeat Togninia minima 68 16% 15 The proteins in the region, corresponding to the area where colour development occurred, were subjected to MALDI-TOF-MS analysis. Mascot searches were conducted using the NCBI non-redundant database with the following settings: Number of mis-cleavages permitted was 1, fixed modifications such as carbamidomethyl on cysteine, variable modification of oxidation on methionine residue; peptide tolerance as 100 ppm; enzyme used as trypsin and a peptide charge setting as +1. In absence of genome data for Trichoderma asperellum, hits for fungal proteins from other genera were accepted to be significant. In Hits that had a MASCOT score of more

Page | 158
than 65, with minimum of 6 peptide matches, the search was accepted as significant identification [153] (p < 0.05) when sequence coverage was at least 20%. The results of the MASCOT search has been indicated in table 3.9.3.1. The information on nominal mass and pI have not been taken into consideration since
(a) The proteins were extracellular and it is expected that some signal peptide would have been cleaved during their localization.
(b) In order to maintain the proteins in a functionally active conformation for subsequent nanoparticle development assay, the reducing agent was omitted from the sample buffer. This would result in the maintenance of homo and hetero multimeric structures. The complex structures would resolve on the gel as per their complex molecular mass.

Page | 159
Fig. 3.9.3.6 Mascot search result for band 14 First hit for band 14 corresponded to hypothetical protein from Fomitopsis pinicola. The entry had an acceptable score of 70 and sequence coverage of 35%. On Phyre server (protein model prediction) it was found to model with a putative Rossman fold containing protein albeit with low confidence of 20%. Rossmann folds typically occur in reductase proteins or in a more general manner in proteins that bind to cofactors like NADH, FADH etc. (NADH binding paper). Due to the low confidence in the model, a biological function of binding to NADH could not be ascribed with certainity to this hit. The second entry for band 14 was unacceptable owing

Page | 160
to the low sequence coverage and score of 8% and 61 respectively, though more number of matches being generated (23 peptide matches). Similarly the third match having a score of 61 also resulted in a low sequence coverage of 15%. Of these 3 entries the first one seems to be more probable due to the higher score and greater sequence coverage as per our established criterion.
Fig. 3.9.3.7 Mascot search result for band 15

Page | 161
First hit for band 15 was ATP dependent RNA helicase eI F4A from Nosema bombycis which had a score of 76. Bioinformatics analysis for conserved domains showed the presence of two ATP binding sites and one nucleotide binding domain. Presence of a nucleotide binding domain was a strong indication that it can bind to NADH. Moreover, since ATP also binds to proteins via Rossman fold, these could also serve as NADH binding sites.
Fig. 3.9.3.8 Conserved domain search result for band 15
2nd entry was a predicted protein from Postia placenta which could not be accepted owing to a low sequence coverage of 12%. The other entries having further lower score were not considered

Page | 162
Fig. 3.9.3.9 Mascot search result for band 16
Band no 16 matched with a hypothetical protein from Fusarium oxysporum with a significant score of 82 and an acceptable sequence coverage of 40% with 8 peptide matches. When modelled using Phyre server, a low confidence model was generated with a beta trefoil containing protein which.is also a nucleic acid binding protein. Thus the biological function could not be predicted to any degree of certainity. The second entry was from Aspergillus flavus

Page | 163
with only four peptide matches. Hence this entry was not considered for further analysis. The third predicted protein could also be a possible identity particularly when it has a relevant redox function of a short chain dehydrogenase. However it had a low score of 53 and sequence coverage of 12% and hence not considered.
Figure 3.9.3.10 Mascot search result for band 17
The 1st and 2nd hits from band no.17 were a mixture of proteins while the 3rd hit was from Trichoderma and hence considered. This was identified as vacuolar protease A with a significant score of 84 from Trichoderma aureoviridae. Substrates of the vacuolar proteases are mostly

Page | 164
imported via endocytosis or autophagocytosis, and vacuolar proteolysis, appear to be important under nutritional stress conditions and sporulation [275]. In order to obtain the mycelia free filtrate the biomass is subjected to both nutritional and osmotic stress. Hence it was physiologically relevant to find this protein in the filtrate. However its role in NADH dependent synthesis of silver nanoparticles could not be explained though observed.
Figure 3.9.3.11 Mascot search result for band 18

Page | 165
Band 18 corresponded to cell division cycle 73 RNA pol II accessory factor from Colletotrichum graminicola with a significant score and acceptable sequence coverage of 22%. The role of this protein, which is a transcription factor, in nanoparticle formation could not be ascertained. However intracellular proteins like histone H4, RuBP carboxylase etc are associated with nanoparticle surface and probably involved in nanoparticle synthesis in Chlamydomonas reinhardtii and were predicted to have redox reaction activity. The other hits were not considered owing to their low sequence coverage. It is indeed intriguing to find proteins like RNA helicase and cdc73 RNA pol accessory factor in the cell free filtrate. It has been reported that vesicle bound fraction of the extracellular proteome of many fungi contain non-secretory proteins, especially those related to protein and carbohydrate metabolism, response to stress, signaling process, cell division, transport, and other/unknown functions. Whether these proteins identities of intracellular proteins that we have obtained, are a part of an extracellular vesicle bound fractions observed in other fungi like Paracoccidioides brasiliensis [276],Cryptococcus neoforman [277], Histoplasma capsulatum [278], remains to be seen.

Page | 166
Fig. 3.9.3.12 TEM of nanoparticle released from the gel
Transmission electron microscopy of the released nanoparticles from the gel
The region of the gel that exhibited colour development with NADH and silver nitrate was maserated to release silver nanoparticles. These could be visualized by TEM as evident in figure 3.9.3.12
The rich diversity of microorganisms that synthesize variety of nanoparticles from inorganic salts, reflects in the equally diverse nature biomolecules that are involved in the process, whether it is an extracellular or intracellular mode of synthesis. Molecules that are involved in the synthesis of nanoparticles range from enzymes, cell wall associated polysaccharides glutathione, cysteine, ligninase, laccase to name a few.
The following discussion aims at elaborating the diverse mechanisms of nanoparticle synthesis in different organisms. Fungi are very well suited for synthesis of nanomaterials for reasons already
Page | 167
explained. The first report on an enzyme based mechanism of silver nanoparticle synthesis was published by Kumar et al. They demonstrated in-vitro synthesis of silver nanoparticle in anaerobic conditions in the presence of cofactor α-NADPH, phytochelatin (stabiliser),electron carrier 4-hydroxyquinoline, and nitrate reductase purified from Fusarium oxysporum [97]. In the absence of any one of these 5 components nanoparticle synthesis did not occur. In vitro, gold ions were reduced by NADPH dependent sulphite reductase in the presence of stabiliser phytochelatin [279]. A 70 kDa protein was implicated in reduction of silver ions to silver in fungus Penicillium fellutanum [87]. Protein compactin was possibly involved in reduction of silver ions in P. brevicompactum [89]. Moteshafi et al demonstrated in case of Fusarium oxysporum, presence of sodium azide, an inhibitor for nitrate reductase, resulted in a 40% reduction in the silver nanoparticle formation. In contrast to this observation, in a bacterial system 90% reduction of nanoparticle formation activity occurred with sodium azide. Hence, it was concluded that biomolecules other than nitrate reductase had a prominent role in nanoparticle synthesis, definitely in fungi. They further demonstrated that biomolecules between 10 to 20 kDa were most effective in nanoparticle synthesis. These could be a part of the large repertoire of low molecular weight proteins which are particularly abundant in culture supernatants of certain filamentous fungi [280]. However in these experiment the biomass was a priori exposed to silver sulphate and silver nitrate. The filtrate obtained after exposure to silver was analysed [281].
It was observed that the activity of extracellular enzymes ligninase and laccase decreased with increasing gold nanoparticle synthesis in Phanerochaete chrysosporium [81]. The decrease of enzymatic activity was an indication of the fact that the enzymes were used up in the process of nanoparticle synthesis. Similarly a cytoplasmic and periplasmic hydrogenase enzyme was

Page | 168
involved in the extracellular synthesis of platinum nanoparticles by Fusarium oxysporum [282]. In case of Colletotrichum nano-gold was formed by glutathione [78]. The peptidoglycan layers of Saccharomyces cerevisiae served to trap gold ions while the aldehyde groups in the reducing sugars participated in the reduction process. A non-enzymatic amino-acid dependant mechanism was also unveiled in Penicillium nalgiovense [283]. In the case of Cladosporium cladosporoides [86] and Coriolus versicolor mycelia free spent medium was used for the synthesis of silver nanoparticles. It was reported that proteins, polysaccharides and organic acids in the medium have the ability form nanoparticles. Phenol oxidases were purified from culture supernatant of nitrogen fixing bacteria Azospirillum brasiliense [284] and the purified enzymes were found to reduce chloroauric acid to gold nanoparticles.
Extracellular reduction of silver ions in culture supernatant of bacteria belonging to Enterobacteriaceae was partially inhibited by addition of piperitone. This implied the role of nitrate reductase in silver reduction [65].
Apart from living organism or biomolecules derived from them, peptide libraries have been generated using combinatorial phage display technique to check for the onset of biomineralization of silver by specific peptide sequences like AYSSGAPPMPPF, NPSSLFRYLPSD in contact with silver nitrate. This study indicated that peptides that are able to bind silver had a preferential enrichment of proline and hydroxyl group containing amino acids [58]. Protein arrays containing multiple repeats of 34 amino acid helix-turn-helix consensus sequence tetratricopeptide repeat have emerged as promising candidates for modular design of biohybrid platforms. The number of helix turn helix motifs (3, 6, 18) had a predictable effect on the shape and size of gold nanoparticles formed upon reaction with chloroauric acid in MOPS buffer (unpublished data).

Page | 169
Since a vast array of proteins and peptides were able to bring about silver ion reduction we aimed at studying the effect of commonly used proteins in the laboratory to generate silver nanoparticles in an NADH dependent manner. The protein concentrations in dialysed filtrate was found to 190 µg/ml while that in the retentate was 2285 µg/ml. The retentate was diluted by 23 times in keeping with the factor by which it was concentrated from the mycelia free filtrate. Hence the concentration of the diluted stock of retentate was approximately 100 µg/ml.
Non-specific protein like bovine serum albumin, albumin, chymotrypsin, casein-hydrolysate and lysozyme were used to check for nanoparticle formation. Protein concentrations equivalent to that present in the dialysed filtrate and dilute retentate were selected. One set of experiments, was also done at a higher concentration of non-specific proteins than that present in retentate and dialysed filtrate. Thus stock solution of non-specific protein containing 100, 200 and 350 µg/ml, of each protein were prepared. Reactions for nanoparticle formation with NADH, silver nitrate and the above mentioned proteins were set up in the same lines as that of dialysed filtrate and retentate. The formation of nanoparticles was determined by UV vis spectrophotometry after an 18 hour incubation period. In none of the following graphs characteristic surface plasmon peak of nano silver could be observed, in contrast with the observations in the dialysed filtrate or retentate treated similarly (Fig. 3.9.3.3 and 4). In case of casein hydrolysate, a broad feature could be seen which increased in intensity with increase in concentration of protein from 200 µg/ml to 350 µg/ml. However this feature was of much lower intensity compared to the plasmon peaks shown in figure 3.9.3.3 and figure 3.9.3.4., of NADH supplemented dialysed filtrate and retentate. In chymotrypsin, BSA, and lysozyme the surface plasmon maxima curve was featureless. In case of albumin a small hump was observable at a much lower wavelength of 340

Page | 170
nm, than that expected for silver nanoparticles, which is close to 400 nm. Controls with nonspecific proteins and NAD failed to yield any plasmon absorbance maxima feature.
Literature review indicates that a wide variety of biomolecules exhibit nanoparticle formation. Our results also showed that more than one protein was involved in nanoparticle formation in conjunction with NADH. Their identities were as varied as RNA helicase, or CDC 73 family RNA pol II accessory factor, vacuolar protease, or hypothetical ones. However the fact that not all proteins could exhibit the same reaction at equivalent or higher concentration, lends a reasonable degree of specificity of function in nanoparticle synthesis, to the few proteins identified from the cell free filtrate of T. asperellum.

Page | 171
Fig.3.9.3.13. The effect of NADH and proteins like casein-hydrolysate, bovine serum albumin, chymotrypsin, lysozyme, and albumin on formation of silver nanoparticles from silver nitrate ; protein concentrations are (a)100 µg/ml, (b) 200 µg/ml and (c) 350 µg/ml

Page | 172
Fig. 3.9.3.14. The effect of NAD and proteins like casein-hydrolysate, bovine serum albumin, chymotrypsin, lysozyme, and albumin on formation of silver nanoparticles from silver nitrate; protein concentrations used were (a)100 µg/ml,(b) 200 µg/ml and (c) 350 µg/ml.
Cyclic Voltametry studies In order to establish the specific role of NADH in nanoparticle synthesis, oxidation potential measurements were done by cyclic voltammetry. Mycelia free filtrate, dialysed filtrate, retentate and NADH supplemented dialysed filtrate and retentate were all taken for these measurements

Page | 173
Fig. 3.9.3.15 (A) Oxidation potential of cell free filtrate, (B) Oxidation potential values for retentate, retentate with NADH, dialysed filtrate, dialysed filtrate with NADH.
Cyclic voltammetry studies (fig. 3.9.3.15 A) revealed that the mycelia free filtrate exhibited an oxidation peak at 720 millivolts versus Ag/AgCl, 3M KCl. Hence the filtrate had a tendency to get oxidized and in turn reduce Ag+ to Ag whereas the dialysed filtrate and the retentate did not exhibit any oxidation peak with-in the range of measurement (fig. 3.9.3.15 B). Thus it was concluded that the mycelia free filtrate had the capacity to reduce Ag+ to Ag in contrast to that of dialysed filtrate or retentate.

Page | 174
We had observed from our experiments that supplementing NADH in the dialysed filtrate and retentate restored its ability to form silver nanoparticles. Hence cyclic voltammetry studies were carried out using 0.1 mM NADH. It was found the NADH exhibited an oxidation peak at 610 mV vs Ag/AgCl, 3M KCl, which was slightly less than that of the mycelia free filtrate. In the presence of dialysed filtrate, oxidation peak for NADH was observed at the same value. The oxidation peak for NADH, shifted slightly in presence of the retentate to 650 mV. From these studies we concluded that NADH is the redox active component which is responsible for reduction of silver ions in case of the NADH supplemented dialysed filtrate and retentate. However, nanoparticle formation not only depends on the reduction of silver ions, but also on the efficient capping of the reduced species. Presence of bio-macromolecules ensures capping and hence stabilisation. However from our previous observations about non-specific proteins, it needs to be reiterated that not all proteins ensure capping. As we have observed before, that compared to several non-specific proteins, the NADH-supplemented retentate and dialysed filtrate showed a well-defined surface plasmon peak (fig. 3.9.3.3 & fig 3.9.3.4) upon reaction with silver ions. Further five proteins from the retentate resolved on SDS page gel, post renaturation, showed colour development when assayed for nano silver synthesis “in gel”, with 0.1 mM NADH. Though not fully elucidated, but the specific role of these five proteins have been experimentally observed over non- specific proteins and other proteins-from the retentate (or mycelia free filtrate) resolved in the same gel.

Page | 175
3.10 Reusability of biomass used for nanoparticle synthesis in bio-control of soil borne pathogenic fungi
Green Chemistry methods in synthesis of nano-particles are pursued both in laboratory and on industrial scale mainly to avoid hazardous waste generation and reduction of use of harsh chemicals which pose a problem for environment. Biological route offers a good substitute especially in synthetic procedures for nano-particles as biological systems at sub-cellular level can operate only in nano-range. Agriculturally active fungi are known to produce a large number and variety of extracellular enzymes required for digestion of complex organic matrices involved in humus formation. Only the mycelia free extract was used in our procedure for formation of nanoparticles, thereby avoiding any direct contact of metal ions with fungal biomass. It is expected that after taking the mycelia free filtrate for nano particle biosynthesis, remaining biomass would not have any contamination and still be used as biocontrol agent. The biomass was found to retain its viability and hence it was tested for any loss of its activity as a biocontrol agent against plant pathogenic fungi in soil. Trichoderma species are used extensively as bio-pesticides for a variety of plant pathogenic fungi in last few decades. They are known to induce systemic resistance against diseases [285, 286] and systemic resistance to plant stresses, including drought, salt and temperature [287, 288]. Trichoderma enhances the vigour of poor-quality seeds [287] and improves nitrogen use efficiency by plants [287, 288]. Bio-control potential of various isolates of Trichoderma asperellum have been studied. They are known to impede colonization of many pathogenic fungi like Sclerotia rolfsii, Phytopthora erythrosepti, Theilaviopsis paradoxa etc. Several volatile and nonvolatile compounds like

Page | 176
harzianic acid, alamethicin, tricholin, viridin, alovirin, gliovirin, glisoprenin, antifungal antibiotics and cell wall hydrolyzing enzymes are secreted by fungi that impede colonization by antagonized microorganisms [150].
Fig. 3.10.1 Dual culture assay with Trichoderma asperellum and 1 Pythium aphanidermatum, 2 Rhizoctonia solanii, 3. Sclerotium rolfsii, 4 Fusarium sp. 5. Aspergillus niger

Page | 177
The biocontrol potential of this isolate was examined in the lab by dual culture technique [154]. The strain was tested against a variety of phyto-pathogens like Pythium aphanidermatum, Fusarium, Sclerotium rolfsii and Rhizoctonia solanii and also against a saprophytic fungus Aspergillus niger. Further pot studies were done to check the effects in suppressing disease of soil borne pathogenic fungi. 3.10(a) Laboratory study to show antifungal activity of Trichoderma asperellum biomass It was observed that T. asperellum suppressed the growth of phyto-pathogens Pythium aphanidermatum, Fusarium sp., Rhizoctonia solani, Sclerotia rolfsii and saprophytic fungi Aspergillus niger in a dual culture study [154] to the extent of 53% – 83.3 % (table 3.10.1) using the formula as mentioned in the materials methods section. Pathogens like Pythium, Rhizoctonia and Sclerotium were fully overgrown by the Trichoderma in ~10 days of incubation demonstrating its biocontrol potential. Table 3.10.1 Extent of inhibition of plant pathogenic and saprophytic fungi by Trichoderma asperellum as measured by dual culture technique
Sl. No.
Name of the fungi % inhibition
1 Pythium aphanidermatum 83.3±1.67
2 Rhizoctonia solani 63.3±4.44
3 Sclerotium rolfsii 53.3±2.3
4 Fusarium sp 70±2.54
5 Aspergillus niger 68.33±3.5

Page | 178
Talc formulations of the remnant biomass were made after obtaining the mycelia free filtrate. The used biomass was also applied as an amendment to Nisargruna biogas manure. The final spore count of the formulations was adjusted to 1X10⁶cfu/g.
3.10(b) Pot studies to check the bio-control efficacy of remnant biomass
The following photograph in Figure 3.10.2 represents soil infested with Pythium which was further used to check efficacy of the formulations and amendments (of the remaining T. asperellum biomass after obtaining the cell free filtrate) in suppressing disease of chilli plants.
After complete growth of Pythium spp. in soil, the soil was again mixed thoroughly to get uniform spread of the disease and further used to sow chilli seeds. T. asperellum (T1) was applied as a seed treatment in talc-based formulation at the time of sowing (10 g/kg seeds). Trichoderma amended with biogas manure (T2) was applied directly to the pots (5 g/pot). A chemical fungicide, benomyl, was used in the next series (T3). The other two treatments were pots having soil with only Pythium spp. (T4) and without Pythium spp. (T5) control). T4 and T5 served as infected control and non infected controls respectively. Chilli (Capsicum annum L. var PhuleJyoti. MPKV Rahuri, M.S., India) was sown at the rate of 10 seeds per pot. Seed germination was observed for 10 days and the results obtained are tabulated below.

Page | 179
Fig. 3.10.2 Pots showing Pythium infestation in soil Table : 3.10.2 The comparative account of various treatments of T. asperellum biomass and controls
No Treatment Seed germination
(%) Disease
incidence (%)
Suppression of disease over infected control (%)
1 Trichoderma biomass (seed treatment)
83.3 0.57 16.7 76.14
2 Biogas manure amended with
Trichoderma biomass 86.6 1.0
13.4 80.85
3 Chemical fungicide 93.3 1.7 6.7 90.42
4 Infected control (Pythium spp.)
30.0 1.15 70.0 --
5 Non-infected control 80.0 0.57 Natural causes of non germination
--

Page | 180
In pot culture studies, there was 76.14%, 80.85% and 90.42% inhibition of Pythium aphanidermatum induced “damping off” with respect to infected control pots with seed treatments of T. asperellum biomass, T. asperellum amended biogas manure and chemical fungicide respectively. Hence the efficacy of the seed treatment and the manure amendment made from Trichoderma asperellum biomass after obtaining the cell free filtrate for nano-particle synthesis, was demonstrated. It proves that the efficacy of biomass of Trichoderma is not at all affected because of stress created by removal of mycelia free filtrate and it can still be used as a biocontrol agent.
Fig. 3.10.3 Effect of treatment of T. asperellum biomass to Pythium inoculated soils, on germination of chilly seed: T1 T. asperellum biomass applied as seed treatment to chilly seed prior to sowing, T2 T. asperellum amended biogas manure applied to soils, T3 Chemical fungicide treated soil, T4 Infected control without T. asperellum or chemical fungicide T5 Non Infected control

Page | 181
3.11 Applications of silver nanoparticles (a) Suppression of flow instability in circulation loops by nano-fluids Natural Circulation systems for removal of heat find applications in engineering fields, viz., solar water heaters, geothermal cooling, cooling of the core of a nuclear reactor, cooling of gas turbine blade and transformers, etc. New-generation nuclear reactors (Generation III) rely on natural circulation for removal of nuclear heat generated due to fission. Natural circulation based convective mode of heat removal has many fold advantages such as simplicity in design, elimination of hazards related to pumps and other accessories commonly used in forced circulation, lower operating cost etc. However, one of the major challenges for incorporation of this mode of heat removal is occurrence of flow instabilities. Although instabilities are common to both forced and natural circulation systems, the latter is inherently more unstable than forced circulation systems due to more nonlinearity of the natural circulation process and its low driving force. Because of this, any disturbance in the driving force affects the flow. This in turn influences the driving force, leading to an oscillatory behaviour. Thus the heat removal capability of the system is degraded. In view of this, it has been over the years a requirement in the art to devise new technologies for suppression of such instabilities in natural circulation system [289]. It was demonstrated experimentally, that with nanofluids, not only the flow instabilities are suppressed but also the natural circulation flow rate is enhanced. To substantiate the facts, we conducted experiments in a natural circulation loop with geometry as shown in figure 3.11.1. The test facility resembles rectangular geometry with circular flow cross-section area. The geometry is relevant to that of solar water heaters and nuclear reactors. The pipes are made of glass with inner diameter of around 26 mm. The schematic diagram of the loop is shown in the figure (Fig. 3.11.1). The loop was heated with electric wire which was

Page | 182
wound uniformly on the outer surface of the glass tube in the bottom horizontal leg. It was cooled at the top through a tube-in-tube type heat exchanger with tap water flowing through the annulus. In the experiment, initially water was heated from an initial power of 300 W in steps of 100 W, and the instabilities were observed even at 300 W. The amplitude of oscillations kept on increasing with rise in power. The experiments were repeated with silver nanofluid (biosynthesized silver nanoparticles in fungal filtrate). The most significant finding was that the flow instabilities were suppressed even with a low concentration of 1 mM (108 µg/ml ~.01% by wt) of Ag nanofluid. Comparing with literature we found that at least 1% by weight of oxide nanoparticles, like alumina was required to yield the same performance like silver nano-fluid [286].
Fig. 3.11.1: Schematic diagram of experimental facility for natural circulation loop
Cooling water outlet
Cooling water inlet
Heater
Cooler
Expansion Tank
2265.0
1515.0
784.0
1000.0
Locations for temperature measurements
Cooling water outlet
Cooling water inlet
Heater
Cooler
Expansion Tank
2265.0
1515.0
784.0
1000.0
Locations for temperature measurements
Cooling water outlet
Cooling water inlet
Heater
Cooler
Expansion Tank
2265.0
1515.0
784.0
1000.0
Locations for temperature measurements
Cooling water inlet
Heater
Cooler
Expansion Tank
2265.0
1515.0
784.0
1000.0
Locations for temperature measurements
Heater
Cooler
Expansion Tank
2265.0
1515.0
784.0
1000.0
Locations for temperature measurements

Page | 183
Fig. 3.11.2: Flow instability of water and silver nano fluid in natural circulation loop. (b) Wound healing of canine patients Antimicrobial activity of nanosilver has been used to make silver based gels for therapeutic use, coated in dressing materials, used in textiles and as surface coatings. The non specific mode of action of nano-silver makes it a broad spectrum anti-microbial substance [168] A nanosilver based dressing material was made as follows and employed for veterinary use.
A maggot infested wound of a stray canine patient was cleaned using betadiene. The wound was dressed with nanosilver coated bandages. The bandages were made by applying 8 ml of 1mM nanosilver solution to a gauge piece containing atleast 8 layers. The dimensions of the bandages were ~ 15X15 cm2. For the first 7 day that dressings were done, changes were given every 48 h. During the next two weeks dressings were changed every 4 days. Complete healing took place in
0 3600 7200 10800 14400-6
-4
-2
0
2
4
6
8
Pressu
re Dro
p
Time (s)
water Ag Nanoparticles

Page | 184
3 weeks without topical application of ointments that typically contain Ofloxacin (antibiotic), clobestasol (steroid) and myconazole (antifungal).
Fig. 3.11.3: Healing of maggot infested wound of canine. (a) wound before dressing. (b) wound after 3 weeks of healing

Page | 185

Page | 186
Summary and Conclusions
Filamentous saprophytic fungi like Fusarium oxysporum and Aspergillus fumigatus were known to produce nanoparticles of noble metals extracellularly. Our laboratory has been extensively working on Trichoderma for its biopesticide properties. A lot of biomass is generated for this purpose. We started with the idea of screening agriculturally important fungi for extracellular synthesis of nanoparticles. Two phosphate solubilizers namely Penicillium spp and Aspergillus niger and three species of Trichoderma were chosen to evaluate their potential to synthesize silver nanoparticles. Important results from this study are summarized as follows:
The mycelia free filtrate of one of these five fungi, later identified as Trichoderma asperellum, yielded a clear surface plasmon peak for nano silver when treated with silver nitrate. This filtrate was later applied for synthesis of a metallic, metallic oxide and composite nanomaterials throughout these studies.
Silver nanoparticles synthesized by this method were spherical with size distribution between 10-20 nm. The particle size obtained from TEM measurements done after 6 months of storage agreed well with average diameter obtained from XRD done within a week of synthesis. The particles remained in solution for more than a year at ambient conditions, thus exhibiting very high stability.
TEM analysis of synthesized gold nanoparticles revealed evolution of exotic morphologies starting from spherical nanoparticles. Three spherical nanoparticles fused to form a triangular structure. Further merger of spherical particles to the edges of the triangular particles resulted in bigger triangles being formed. Stacking and fusion of triangular structures gave rise to prismatic, hexagonal and other exotic structures. The triangular structures had atomically flat surfaces as

Page | 187
revealed from surface roughness measurements done by atomic force microscopy. These structures have potential use in molecular scanning tunnelling microscopy and treatment of tumours.
Nano-template bound synthesis of nanoparticles leading to formation of hybrid materials was demonstrated. In situ synthesis and deposition of nanosilver on multiwalled carbon nanotubes were carried out with the mycelia free filtrate without further modification of the CNT surface. The dispersibility of the composite in aqueous medium could be improved after acid treatment of the pristine CNT. Using functionalized CNT (having surface –COOH groups) silver deposition was found to improve substantially by the same protocol.
MIC and MBC of silver nanoparticles (synthesized by mycelia free filtrate) against E. coli was 3.24 µg/ml and 7.56 µg/ml, respectively for a starting inoculum of 107-108 cfu/ml, while silver nanoparticles formed on carbon nanotubes exhibited the same MIC and MBC values at lower starting inoculum of 105-106 cfu/ml Antibacterial properties was introduced in carbon nanotubes by silver impregnation.
Co-synthesis of oxide template along with dispersed metallic nano particles in a single step (one pot) synthetic method using the mycelia free filtrate was feasible. This scheme of synthesis was applied to obtain titania and palladium dispersed titania nanoparticles for catalytic applications. The particles had a narrow size distribution probably because of the size-confining templates present in the filtrate.
The catalytic activity of titania and palladium coated titania nanoparticles was evaluated. Hydrogen generation by way of photocatalytic water splitting by these biologically synthesized catalysts was the first ever report in literature for biological route. While hydrgen yeilded by

Page | 188
TiO2 was 1.193 µmoles/mg/hr the same for Pd-TiO2 was 3.14 µmoles/mg/hr. On a comparitive note these values were higher than that reported earlier from the similar system using indium titanate. Over a period of 6 h, indium titanate, anatase TiO2 nanoparticles and commercial TiO2 (P25) yeilded 260, 130 and 145 µmoles of hydrogen in contrast to 942.5 µmol by our biologically synthesized samples.
IR spectroscopic studies established that cysteine was one of the reducing molecules in the mycelia free filtrate. Capping mechanism was revealed through Raman spectroscopy where selective enhancement of Ag-N and symmetric and asymmetric stretching vibrations of COO-
ions were observed. From these findings it was inferred that capping of the nanoparticles took place by bonding of nano-silver via carboxylate and amino groups. As reported in previous findings thiol groups did not participate in capping.
Interaction of cysteine with silver nitrate resulted in stable nanoparticles for a very specific ratio of AgNO3 to cysteine (1mM : 0.1mM). It was found, that at this concentration of cysteine the pH of the solution was much lower than the isoelectric point. Hence the resultant positively charged amino groups on the adsorbed cysteine prevented coalescence of particles by way of repulsion. In this case, carboxylate and amino groups as well as thiols were responsible for capping interaction. Silver sol was produced by the reaction of 0.1 mM of cysteine with 1 mM of AgNO3 and was stable for over a month. Antibacterial activity of these silver nanoparticles was studied in E.coli. On a comparative note, MIC and MBC values of Ag-nps synthesized via fungal route were slightly lower by 1.08 g/ml than those of cysteine capped Ag-nps. The small difference in antibacterial efficacies of the two systems was again attributed to the difference in the nature of their capping molecules that probably played a significant role. The particle sizes were also comparable in the two cases, signifying that the products synthesized by cysteine and that

Page | 189
obtained by fungal route mimic each other in terms of morphology and properties. The maximum stability of the sol that could be synthesized using cysteine was over 1 month as against that of over 1 year (in darkness) for sols synthesized by T. asperellum. This highlighted the applicability of the biological route over a chemical bio mimicking method.
Once Raman spectroscopy revealed the presence of carboxyl and amino groups on the surface of silver nanoparticles, role of proteins in the synthesis of silver nanoparticles was probed. It was observed that 5 proteins from the cell free filtrate, resolved on PAGE gel were involved in nanoparticle formation in presence of NADH. In the same gel, other proteins which were in higher concentrations did not give colour development specific to nanosilver, with silver nitrate and NADH. Non specific proteins, did not exhibit this phenomenon under equivalent or higher concentrations, in the presence of NADH. Though NADH might have been the redox active molecule, but in the absence of a bio-macromolecule, nanoparticle formation was hindered. Thus the possible role of these 5 proteins in a specific capping mechanism was evident. While low molecular weight entities were responsible for reduction of silver ions, capping thereof was a function specific to at least a few proteins.
The left-over biomass, after harvesting the cell free filtrate was used as an amendment to organic manure and made into talc formulation. The biomass treated as above was effective in suppression of Pythium induced “damping off” of chilli seedlings. In pot culture studies, there was 76.14%, 80.85% and 90.42% inhibition of Pythium aphanidermatum induced “damping off” with respect to infected control pots, with seed treatments of T. asperellum biomass, T. asperellum amended biogas manure and chemical fungicide respectively.

Page | 190
Two field applications of these nanoparticles were performed. Nano-silver coated bandages were successfully tested for wound healing in a canine patient. Healing occurred without topical application of ointments that typically contain antibiotics, antifungals and steroids.
Suppression of flow instabilities in natural circulation loops was demonstrated with very low concentrations (108 µg/ml) of silver in the form of silver nanoparticles.
The mycelia free filtrate of a biocontrol agent Trichoderma asperellum, was successfully employed in synthesizing metallic, metallic oxide and composite nanomaterials, while its remnant biomass could be reused as a biopesticide in pot culture experiments using nonsterile soil. The nanomaterials were tested for various applications at laboratory as well as field level namely: antibacterial activity, photocatalytic water splitting, animal wound healing and heat dissipation studies for suppressing flow instabilities. Insights were gained on probable molecules or nature of molecules involved in reduction of metal ions like silver and capping thereof to form stable nanomaterials.
Further work:
1. Profiling of low molecular weight proteins from the culture supernatant and mycelia free filtrate of T. asperellum and testing their role in nanoparticle synthesis. 2. Optimization of palladium loading on TiO2 nanoparticles for higher yields of hydrogen. 3. Synthesis of silica and zinc oxide and their composites for catalytic application. 4. Studies on wound healing in collaboration with veterinary doctors and comparative studies on reduction of flow instabilities by various nanoparticles. 5. Heterologous expression of a few of the candidate proteins involved in nanoparticle capping.

Page | 191

Page | 192
1. Lu Y, Wang L, Chen D, Wang G: Determination of the Concentration and the Average Number of Gold Atoms in a Gold Nanoparticle by Osmotic Pressure. Langmuir 2012, 28(25):9282-9287.
2. http://en.wikipedia.org/wiki/Energy_level 3. Raimondi F, Scherer GG, Kötz R, Wokaun A: Nanoparticles in Energy Technology:
Examples from Electrochemistry and Catalysis. Angewandte Chemie International Edition 2005, 44(15):2190-2209.
4. Zhang JZ: Ultrafast Studies of Electron Dynamics in Semiconductor and Metal Colloidal Nanoparticles: Effects of Size and Surface. Accounts of Chemical Research 1997, 30(10):423-429.
5. Kreibieg U, Vollmer, M. : Optical properties of metal clusters. Berlin and New York, : Springer; 1995.
6. Hutter E, Fendler JH: Exploitation of Localized Surface Plasmon Resonance. Advanced Materials 2004, 16(19):1685-1706.
7. El-Sayed MA: Small Is Different: Shape-, Size-, and Composition-Dependent Properties of Some Colloidal Semiconductor Nanocrystals. Accounts of Chemical Research 2004, 37(5):326-333.
8. Lewis LN: Chemical catalysis by colloids and clusters. Chemical Reviews 1993, 93(8):2693-2730.
9. Shukla S, Priscilla A, Banerjee M, Bhonde RR, Ghatak J, Satyam PV, Sastry M: Porous Gold Nanospheres by Controlled Transmetalation Reaction: A Novel Material for Application in Cell Imaging. Chemistry of Materials 2005, 17(20):5000-5005.
10. Joshi HM, Bhumkar DR, Joshi K, Pokharkar V, Sastry M: Gold Nanoparticles as Carriers for Efficient Transmucosal Insulin Delivery. Langmuir 2005, 22(1):300-305.
11. Hagfeldt A, Grätzel M: Molecular Photovoltaics. Accounts of Chemical Research 2000, 33(5):269-277.
12. Wong TS, Schwaneberg U: Protein engineering in bioelectrocatalysis. Current Opinion in Biotechnology 2003, 14(6):590-596.
13. Ramanaviciusa A KA, Ramanaviciene A. :: Biosens Bioelectron 1962., 2005:20. 14. http://www.nanotech-now.com/columns/?article=097 15. Fendler: JH: Nanoparticle and nanostructured films Preparation, characerization
and applications: John Wiley & Son; 1998. 16. http://en.wikipedia.org/wiki/Neanderthal 17. Timp G: Nanotechnology. New Jersy.: Springer; 2004. 18. Schmid G, : Nanoparticles from Theory to Applications,. Weinheim: Wiley-VCH;
2004. 19. Whitesides GM: Nanoscience and chemistry Nanoscience, Nanotechnology, and
Chemistry Small 2005 1( No. 2):172 -175. 20. Alonso JA: “Structure and Properties of Atomic Nanoclusters”. London.: Imperial
College Press; (2005). 21. Poole CP, Owens, F. J.,: “Introduction to nanotechnology”, . New Jersey.: Wiley
Interscience Publication,; (2003). 22. Schmid G: Clusters and Colloids : From Theory to Application: Weinheim, VCH;
(1994). 23. Cao G: “Nanostructures and nanomaterials: synthesis, properties and
applications”,: World scientific publishing Co. Pte. Ltd.; (2004).

Page | 193
24. Shan J, Tenhu, H.,: Chem. Commun. (Camb). . (2007(44,): 4580. 25. Khanna PK, Gokhale, R., Subbarao, V. V. V. S., : J Mater Sci (2004)(39, ):3773. 26. Jana. NR: Small (2005), 1,:875. 27. Yazid H, Adnan, R., Hamid, S. A., Farrukh, M. A.,. . Turk J Chem (2010) 34,:639. 28. Yonezawa T, Kunitake, T.: Colloid Surface A (1999)(149): 193. 29. Lowenstam H: Minerals formed by organisms. Science 1981, 211(4487):1126-1131. 30. Wilbur KSKM: Biomineralization. Cell Biology and Mineral Deposition. San Diego,
New York, Berkeley, Boston, London, Sydney, Tokyo, Toronto: Academic Press; 1989. 31. R. B. Frankel RPB: Iron Biominerals. New York, : Plenum Press; 1991. 32. Philipse AP, Maas D: Magnetic Colloids from Magnetotactic Bacteria: Chain
Formation and Colloidal Stability. Langmuir 2002, 18(25):9977-9984. 33. Roh Y, Lauf RJ, McMillan AD, Zhang C, Rawn CJ, Bai J, Phelps TJ: Microbial
synthesis and the characterization of metal-substituted magnetites. Solid State Communications 2001, 118(10):529-534.
34. Kröger N, Deutzmann R, Sumper M: Polycationic Peptides from Diatom Biosilica That Direct Silica Nanosphere Formation. Science 1999, 286(5442):1129-1132.
35. Schultze-Lam S, Harauz G, Beveridge TJ: Participation of a cyanobacterial S layer in fine-grain mineral formation. Journal of Bacteriology 1992, 174(24):7971-7981.
36. Aiking H, Kok K, van Heerikhuizen H, van 't Riet J: Adaptation to Cadmium by Klebsiella aerogenes Growing in Continuous Culture Proceeds Mainly via Formation of Cadmium Sulfide. Applied and Environmental Microbiology 1982, 44(4):938-944.
37. Stephen JR, Macnaughtont SJ: Developments in terrestrial bacterial remediation of metals. Current Opinion in Biotechnology 1999, 10(3):230-233.
38. Mehra RK, Winge DR: Metal ion resistance in fungi: Molecular mechanisms and their regulated expression. Journal of Cellular Biochemistry 1991, 45(1):30-40.
39. K L Temple NLR: Economic Geology 1964, 59:647. 40. Blakemore RP, Maratea D, Wolfe RS: Isolation and pure culture of a freshwater
magnetic spirillum in chemically defined medium. Journal of Bacteriology 1979, 140(2):720-729.
41. Klaus-Joerger T, Joerger R, Olsson E, Granqvist C-G: Bacteria as workers in the living factory: metal-accumulating bacteria and their potential for materials science. Trends in Biotechnology, 19(1):15-20.
42. Klaus T, Joerger R, Olsson E, Granqvist C-G: Silver-based crystalline nanoparticles, microbially fabricated. Proceedings of the National Academy of Sciences 1999, 96(24):13611-13614.
43. Beveridge TJ, Murray RG: Sites of metal deposition in the cell wall of Bacillus subtilis. Journal of Bacteriology 1980, 141(2):876-887.
44. Sharma NC, Sahi SV, Nath S, Parsons JG, Gardea- Torresde JL, Pal T: Synthesis of Plant-Mediated Gold Nanoparticles and Catalytic Role of Biomatrix-Embedded Nanomaterials. Environmental Science & Technology 2007, 41(14):5137-5142.
45. Joerger R, Klaus T, Granqvist CG: Biologically Produced Silver–Carbon Composite Materials for Optically Functional Thin-Film Coatings. Advanced Materials 2000, 12(6):407-409.
46. Mann S: Bacteria and the Midas touch. Nature 1992, 357(6377):358-360.

Page | 194
47. Beveridge TJ, Murray RGE: Sites of metal deposition in the cell wall of Bacillus subtilis. Journal of Bacteriology 1980, 141(2):876-887.
48. Southam G, Beveridge TJ: The in vitro formation of placer gold by bacteria. Geochimica et Cosmochimica Acta 1994, 58(20):4527-4530.
49. Lengke MF, Fleet ME, Southam G: Morphology of Gold Nanoparticles Synthesized by Filamentous Cyanobacteria from Gold(I)−Thiosulfate and Gold(III)−Chloride Complexes. Langmuir 2006, 22(6):2780-2787.
50. Kashefi K, Tor JM, Nevin KP, Lovley DR: Reductive Precipitation of Gold by Dissimilatory Fe(III)-Reducing Bacteria andArchaea. Applied and Environmental Microbiology 2001, 67(7):3275-3279.
51. Konishi Y, Tsukiyama T, Tachimi T, Saitoh N, Nomura T, Nagamine S: Microbial deposition of gold nanoparticles by the metal-reducing bacterium Shewanella algae. Electrochimica Acta 2007, 53(1):186-192.
52. Lengke M, Southam G: Bioaccumulation of gold by sulfate-reducing bacteria cultured in the presence of gold(I)-thiosulfate complex. Geochimica et Cosmochimica Acta 2006, 70(14):3646-3661.
53. Du L, Jiang H, Liu X, Wang E: Biosynthesis of gold nanoparticles assisted by Escherichia coli DH5α and its application on direct electrochemistry of hemoglobin. Electrochemistry Communications 2007, 9(5):1165-1170.
54. Feng Y, Yu Y, Wang Y, Lin X: Biosorption and bioreduction of trivalent aurum by photosynthetic bacteria Rhodobacter capsulatus. Current Microbiology 2007, 55(5):402-408.
55. J.K. Fu YYL, P.Y. Gu, D. Tang, Z. Lin, B. Yao.: Acta Phys Chim Sin 2000, 16. :779. 56. Li XZ, Nikaido H, Williams KE: Silver-resistant mutants of Escherichia coli display
active efflux of Ag+ and are deficient in porins. Journal of Bacteriology 1997, 179(19):6127-6132.
57. Gupta A, Silver S: Molecular Genetics: Silver as a biocide: Will resistance become a problem? Nat Biotech 1998, 16(10):888-888.
58. Naik RR, Stringer SJ, Agarwal G, Jones SE, Stone MO: Biomimetic synthesis and patterning of silver nanoparticles. Nat Mater 2002, 1(3):169-172.
59. Pugazhenthiran N AS, Kathiravan G, Prakash NKU, Crawford S, Ashokkumar M.: J Nanopart Res 2009;, 11:1811.
60. Nair B, Pradeep T: Coalescence of Nanoclusters and Formation of Submicron Crystallites Assisted by Lactobacillus Strains. Crystal Growth & Design 2002, 2(4):293-298.
61. He S, Guo Z, Zhang Y, Zhang S, Wang J, Gu N: Biosynthesis of gold nanoparticles using the bacteria Rhodopseudomonas capsulata. Materials Letters 2007, 61(18):3984-3987.
62. Husseiny MI, El-Aziz MA, Badr Y, Mahmoud MA: Biosynthesis of gold nanoparticles using Pseudomonas aeruginosa. Spectrochimica Acta - Part A: Molecular and Biomolecular Spectroscopy 2007, 67(3-4):1003-1006.
63. Wen L, Lin Z, Gu P, Zhou J, Yao B, Chen G, Fu J: Extracellular biosynthesis of monodispersed gold nanoparticles by a SAM capping route. J Nanopart Res 2009, 11(2):279-288.
64. F.U. Mouxing LIQ, S.U.N. Daohua, L.U. Yinghua, H.E. Ning, D. Xu, et al.: Chinese J Chem Eng (2006), , 14 , p. 114.

Page | 195
65. Shahverdi AR, Minaeian S, Shahverdi HR, Jamalifar H, Nohi AA: Rapid synthesis of silver nanoparticles using culture supernatants of Enterobacteria: A novel biological approach. Process Biochemistry 2007, 42(5):919-923.
66. Kalishwaralal K, Deepak V, Ramkumarpandian S, Nellaiah H, Sangiliyandi G: Extracellular biosynthesis of silver nanoparticles by the culture supernatant of Bacillus licheniformis. Materials Letters 2008, 62(29):4411-4413.
67. Barud HS, Barrios C, Regiani T, Marques RFC, Verelst M, Dexpert-Ghys J, Messaddeq Y, Ribeiro SJL: Self-supported silver nanoparticles containing bacterial cellulose membranes. Materials Science and Engineering C 2008, 28(4):515-518.
68. Parikh RY, Singh S, Prasad BLV, Patole MS, Sastry M, Schouche YS: Extracellular synthesis of crystalline silver nanoparticles and molecular evidence of silver resistance from Morganella sp.: Towards understanding biochemical synthesis mechanism. ChemBioChem 2008, 9(9):1415-1422.
69. Mukherjee P, Ahmad A, Mandal D, Senapati S, Sainkar SR, Khan MI, Ramani R, Parischa R, Ajayakumar PV, Alam M et al: Bioreduction of AuCl4 - ions by the fungus, Verticillium sp. and surface trapping of the gold nanoparticles formed. Angewandte Chemie - International Edition 2001, 40(19):3585-3588.
70. Ahmad A, Senapati, S., Khan, M.I., Kumar, R., Sastry, M: Extra-/intracellular biosynthesis of gold nanoparticles by an alkalotolerant fungus, Trichothecium sp. J Biomed Nanotechnol 2005, 1 (1): 47-53.
71. Gericke M, Pinches A: Microbial production of gold nanoparticles. Gold Bulletin 2006, 39(1):22-28.
72. Gericke M, Pinches A: Biological synthesis of metal nanoparticles. Hydrometallurgy 2006, 83(1-4):132-140.
73. Pighi L, Pümpel T, Schinner F: Selective accumulation of silver by fungi. Biotechnology Letters 1989, 11(4):275-280.
74. S. Barazzouk SH, K. Vinodgopal and P. V. Kamat,, , , ; T. Hasobe, H. Imahori,, S. Fukuzumi and P. V. Kamat JPCB, 2003, 107,, 12105.: J Phys Chem B 2004, 108(17015).
75. Senapati S, Mandal, D., Ahmad, A., Khan, M.I., Sastry, M., Kumar, R: Fungus mediated synthesis of silver nanoparticles: A novel biological approach Indian J Phys 2004, 78 A (1):101-105.
76. Mukherjee P, Ahmad A, Mandal D, Senapati S, Sainkar SR, Khan MI, Parishcha R, Ajaykumar PV, Alam M, Kumar R et al: Fungus-Mediated Synthesis of Silver Nanoparticles and Their Immobilization in the Mycelial Matrix: A Novel Biological Approach to Nanoparticle Synthesis. Nano Letters 2001, 1(10):515-519.
77. Vigneshwaran N, Ashtaputre NM, Varadarajan PV, Nachane RP, Paralikar KM, Balasubramanya RH: Biological synthesis of silver nanoparticles using the fungus Aspergillus flavus. Materials Letters 2007, 61(6):1413-1418.
78. Shankar SS, Ahmad A, Pasricha R, Sastry M: Bioreduction of chloroaurate ions by geranium leaves and its endophytic fungus yields gold nanoparticles of different shapes. Journal of Materials Chemistry 2003, 13(7):1822-1826.
79. Gole A, Dash C, Soman C, Sainkar SR, Rao M, Sastry M: On the preparation, characterization, and enzymatic activity of fungal protease-gold colloid bioconjugates. Bioconjugate Chemistry 2001, 12(5):684-690.

Page | 196
80. Bhainsa KC, D'Souza SF: Extracellular biosynthesis of silver nanoparticles using the fungus Aspergillus fumigatus. Colloids and Surfaces B: Biointerfaces 2006, 47(2):160-164.
81. Vigneshwaran N, Kathe AA, Varadarajan PV, Nachane RP, Balasubramanya RH: Biomimetics of silver nanoparticles by white rot fungus, Phaenerochaete chrysosporium. Colloids and Surfaces B: Biointerfaces 2006, 53(1):55-59.
82. Basavaraja S, Balaji SD, Lagashetty A, Rajasab AH, Venkataraman A: Extracellular biosynthesis of silver nanoparticles using the fungus Fusarium semitectum. Materials Research Bulletin 2008, 43(5):1164-1170.
83. Gade AK, Bonde, P., Ingle, A.P., Marcato, P.D., Duran, N., Rai, M.K: Explotation of Aspergillus niger for synthesis of silver nanoparticle. J Biol Mater Bioener 2008, Volume 2:Pages 1-5.
84. Ingle A RM, Gade A, Bawaskar M. ;:: J Nanopart Res 2009, 11:2079. 85. Birla SS, Tiwari VV, Gade AK, Ingle AP, Yadav AP, Rai MK: Fabrication of silver
nanoparticles by Phoma glomerata and its combined effect against Escherichia coli, Pseudomonas aeruginosa and Staphylococcus aureus. Letters in Applied Microbiology 2009, 48(2):173-179.
86. R. Sanghi PV: Bioresour Technol (2009), 100:501. 87. Kathiresan K, Manivannan S, Nabeel MA, Dhivya B: Studies on silver nanoparticles
synthesized by a marine fungus, Penicillium fellutanum isolated from coastal mangrove sediment. Colloids and Surfaces B: Biointerfaces 2009, 71(1):133-137. 88. Fayaz M BK, Girilal M, Yadav R, Kalaichelvan PT, Venketesan R. Nanomedicine
2010(6):103. 89. Shaligram NS, Bule M, Bhambure R, Singhal RS, Singh SK, Szakacs G, Pandey A:
Biosynthesis of silver nanoparticles using aqueous extract from the compactin producing fungal strain. Process Biochemistry 2009, 44(8):939-943. 90. Balaji DS, Basavaraja S, Deshpande R, Mahesh DB, Prabhakar BK, Venkataraman A:
Extracellular biosynthesis of functionalized silver nanoparticles by strains of Cladosporium cladosporioides fungus. Colloids and Surfaces B: Biointerfaces 2009, 68(1):88-92.
91. Philip D: Biosynthesis of Au, Ag and Au-Ag nanoparticles using edible mushroom extract. Spectrochimica Acta - Part A: Molecular and Biomolecular Spectroscopy 2009, 73(2):374-381.
92. Riddin TL, Gericke M, Whiteley CG: Analysis of the inter- and extracellular formation of platinum nanoparticles by Fusarium oxysporum f. sp. lycopersici using response surface methodology. Nanotechnology 2006, 17(14):3482-3489.
93. Bharde A, Rautaray D, Bansal V, Ahmad A, Sarkar I, Yusuf SM, Sanyal M, Sastry M: Extracellular biosynthesis of magnetite using fungi. Small 2006, 2(1):135-141.
94. Mukherjee P, Senapati S, Mandal D, Ahmad A, Khan MI, Kumar R, Sastry M: Extracellular synthesis of gold nanoparticles by the fungus Fusarium oxysporum. ChemBioChem 2002, 3(5):461-463.
95. Senapati S, Ahmad A, Khan MI, Sastry M, Kumar R: Extracellular Biosynthesis of Bimetallic Au–Ag Alloy Nanoparticles. Small 2005, 1(5):517-520.
96. Nelson Durán PDM, Oswaldo L Alves, Gabriel IH De Souza and Elisa Esposito: Mechanistic aspects of biosynthesis of silver nanoparticles by several Fusarium oxysporum strains Journal of nanobiotechnology 2005, 3 (8).

Page | 197
97. Anil Kumar S, Abyaneh M, Gosavi SW, Kulkarni S, Pasricha R, Ahmad A, Khan MI: Nitrate reductase-mediated synthesis of silver nanoparticles from AgNO3. Biotechnology Letters 2007, 29(3):439-445.
98. Nelson Durán12 PDM, Oswaldo L Alves, Gabriel IH De Souza and Elisa Esposito: Mechanistic aspects of biosynthesis of silver nanoparticles by several Fusarium oxysporum strains Journal of nanobiotechnology 2005, 3 (8).
99. Kumar SA, Abyaneh MK, Gosavi SW, Kulkarni SK, Ahmad A, Khan MI: Sulfite reductase-mediated synthesis of gold nanoparticles capped with phytochelatin. Biotechnology and Applied Biochemistry 2007, 47(3-4):191-195.
100. Ahmad A, Senapati S, Khan MI, Kumar R, Sastry M: Extracellular biosynthesis of monodisperse gold nanoparticles by a novel extremophilic actinomycete, thermomonospora sp. Langmuir 2003, 19(8):3550-3553.
101. Ahmad A, Senapati S, Khan MI, Kumar R, Ramani R, Srinivas V, Sastry M: Intracellular synthesis of gold nanoparticles by a novel alkalotolerant actinomycete, Rhodococcus species. Nanotechnology 2003, 14(7):824-828.
102. Lin Z, Wu J, Xue R, Yang Y: Spectroscopic characterization of Au3+ biosorption by waste biomass of Saccharomyces cerevisiae. Spectrochimica Acta - Part A: Molecular and Biomolecular Spectroscopy 2005, 61(4):761-765.
103. Agnihotri M, Joshi S, Kumar AR, Zinjarde S, Kulkarni S: Biosynthesis of gold nanoparticles by the tropical marine yeast Yarrowia lipolytica NCIM 3589. Materials Letters 2009, 63(15):1231-1234.
104. Terry N ZAFJW, Engberg RA, eds, . ; . ; pp. : Phytoremediation of selenium. New York:: Marcel Dekker; 1998.
105. Gardea-Torresdey JL TK, Gamez G, Dokken K, Pingitore NE,: Recovery of gold(III) by alfalfa biomass and binding charac-terization using X-ray microfluorescence. . Adv Environ Res 1999, 3:83-93.
106. Gardea-Torresday JL GE, Peralta-Videa JR, Parsons JG, Troiani HE, Yacaman MJ, Alfalfa sprouts: a natural source for the synthesis of silver nanoparticles. Langmuir : 2003, 19:1357-1361.
107. Rodriguez E PJ, Peralta-Videa JR, Cruz-Jimenez G, Romero-Gonzalez J, Sanchez-Salcido BE, Saupe GB, Duarte-Gardea M, Gardea-Torresdey JL.: Potential of Chilopsis linearis for gold phytomining: using XAS to determine gold reduction and nanoparticle formation within plant tissues. Int J Phytoremediation 2007 Mar-Apr;9(2:133-147.
108. Sharma NC G-TJ, Nath S, Pal T, Parsons JG, Sahi SV,: Synthesis of plant mediated gold nanoparticle and catalytic role of biomatrix embedded nanomaterials. Environ Sci Technol 2007., 936:2929-2933.
109. Herrera I, Gardea-Torresdey, J. L., Tiemann, K. J., Peralta-Videa, J. R., Armendariz, , V. and Parsons JG: Binding of silver(I) ions by alfalfa biomass (Medicago sativa): Batch pH, time, temperature, and ionic strength studies. J Haz Substance Res 2003, 4::1-16
110. Lopez ML, Gardea-Torresdey, J. L., Peralta-videa, J. R., de la Rosa, G., Armendariz, , V. H, I., Troiani, H. and Henning, :: Gold binding by native and chemically modified Hops biomasses. J Bioinorg Chem Appl 2005., 3:29-41.
Page | 198
111. Awadalla FTaP, B. Biosorption of cobalt with the AMT metal removing agent. Hydrometallurgy 1992. , 28::65-80.
112. Wilde EWaB, J. R. Bioremoval of heavy metals by the use of microalgae. Biotech Adv 1993.. 11::781-812.
113. Hosea M, Greene, B., Mcpherson, R., Henzl, M., Alexander, M. D. and Darnall, D. W.: Accumulation of elemental gold on the alga Chlorella vulgaris. Inorganics Chimica Acta 1986, 123::161-165.
114. Liu B, Xie J, Lee JY, Ting YP, Paul Chen J: Optimization of high-yield biological synthesis of single-crystalline gold nanoplates. Journal of Physical Chemistry B 2005, 109(32):15256-15263.
115. Mata YN, Torres, E., Blazquez, M. L., Ballester, A., Gonzalez, F. and Munoz, J. A.: Gold(III) biosorption and bioreduction with the brown alga Fucus vesiculosus. J Hazard Mater 2009, 166::612-618.
116. Cha JN, Stucky GD, Morse DE, Deming TJ: Biomimetic synthesis of ordered silica structures mediated by block copolypeptides. Nature 2000, 403(6767):289-292.
117. Belton D, Paine G, Patwardhan SV, Perry CC: Towards an understanding of (bio)silicification: the role of amino acids and lysine oligomers in silicification. Journal of Materials Chemistry 2004, 14(14):2231-2241.
118. Sumerel JL, Yang W, Kisailus D, Weaver JC, Choi JH, Morse DE: Biocatalytically Templated Synthesis of Titanium Dioxide. Chemistry of Materials 2003, 15(25):4804-4809.
119. Reese RN, Mehra RK, Tarbet EB, Winge DR: Studies on the gamma-glutamyl Cu-binding peptide from Schizosaccharomyces pombe. Journal of Biological Chemistry 1988, 263(9):4186-4192.
120. Bae W, Abdullah R, Mehra RK: Cysteine-mediated synthesis of CdS bionanocrystallites. Chemosphere 1998, 37(2):363-385.
121. Bae W, Mehra RK: Properties of glutathione- and phytochelatin-capped CdS bionanocrystallites. Journal of Inorganic Biochemistry 1998, 69(1–2):33-43.
122. Aizenberg J, Addadi L, Weiner S, Lambert G: Stabilization of amorphous calcium carbonate by specialized macromolecules in biological and synthetic precipitates. Advanced Materials 1996, 8(3):222-226.
123. Naik RR BL, Clarson SJ, Stone MO.: Silica-precipitating peptides isolated from a combinatorial phage display peptide library. J Nanosci Nanotechnol 2002, Feb;2(1):95-100.
124. Whaley SR, English DS, Hu EL, Barbara PF, Belcher AM: Selection of peptides with semiconductor binding specificity for directed nanocrystal assembly. Nature 2000, 405(6787):665-668.
125. Slocik JM, Stone MO, Naik RR: Synthesis of Gold Nanoparticles Using Multifunctional Peptides. Small 2005, 1(11):1048-1052.
126. Mao C, Solis DJ, Reiss BD, Kottmann ST, Sweeney RY, Hayhurst A, Georgiou G, Iverson B, Belcher AM: Virus-based toolkit for the directed synthesis of magnetic and semiconducting nanowires. Science 2004, 303(5655):213-217.

Page | 199
127. Douglas T, Strable E, Willits D, Aitouchen A, Libera M, Young M: Protein Engineering of a Viral Cage for Constrained Nanomaterials Synthesis. Advanced Materials 2002, 14(6):415-418.
128. Ball P: Made To Measure: New Materials for the 21st Century. New Jersey: Princeton University Press; 1997.
129. Shenton W, Douglas T, Young M, Stubbs G, Mann S: Inorganic–Organic Nanotube Composites from Template Mineralization of Tobacco Mosaic Virus. Advanced Materials 1999, 11(3):253-256.
130. Dujardin E, Peet C, Stubbs G, Culver JN, Mann S: Organization of Metallic Nanoparticles Using Tobacco Mosaic Virus Templates. Nano Letters 2003, 3(3):413-417.
131. Ongaro A, Griffin F, Beecher P, Nagle L, Iacopino D, Quinn A, Redmond G, Fitzmaurice D: DNA-Templated Assembly of Conducting Gold Nanowires between Gold Electrodes on a Silicon Oxide Substrate. Chemistry of Materials 2005, 17(8):1959-1964.
132. Hall SR, Shenton, W., Engelhardt, H., Mann, S. : Site-specific organization of gold nanoparticles by biomolecular templating. Chem Phys CHem 2001, 3:184.
133. Naik RR, Jones SE, Murray CJ, McAuliffe JC, Vaia RA, Stone MO: Peptide Templates for Nanoparticle Synthesis Derived from Polymerase Chain Reaction-Driven Phage Display. Advanced Functional Materials 2004, 14(1):25-30.
134. Hall SR, Bolger H, Mann S: Morphosynthesis of complex inorganic forms using pollen grain templates. Chemical Communications 2003(22):2784-2785.
135. Bauerlein E, Behrens, P., Matthias, E. . : Handbook of Biomineralization vol. 2: Wiley-VCH; 2007.
136. Sleytr UB, Egelser, E., Pum, D., Schuster, ; 2004. 137. Mertig M, Colombi Ciacchi L, Seidel R, Pompe W, De Vita A: DNA as a Selective
Metallization Template. Nano Letters 2002, 2(8):841-844. 138. Storhoff JJ, Mirkin CA: Programmed Materials Synthesis with DNA. Chemical
Reviews 1999, 99(7):1849-1862. 139. Levina L, Sukhovatkin V, Musikhin S, Cauchi S, Nisman R, Bazett-Jones DP, Sargent
EH: Efficient Infrared-Emitting PbS Quantum Dots Grown on DNA and Stable in Aqueous Solution and Blood Plasma. Advanced Materials 2005, 17(15):1854-1857.
140. Meldrum FC, Wade VJ, Nimmo DL, Heywood BR, Mann S: Synthesis of inorganic nanophase materials in supramolecular protein cages. Nature 1991, 349(6311):684-687.
141. Wong KKW, Mann S: Biomimetic synthesis of cadmium sulfide-ferritin nanocomposites. Advanced Materials 1996, 8(11):928-932.
142. Mayes EL, Mann, S. : Nanobiotechnology:Concepts Applications and Perspectives. Weinheim: Wiley-VCH; 2004.
143. Shenton W, Mann S, Cölfen H, Bacher A, Fischer M: Synthesis of Nanophase Iron Oxide in Lumazine Synthase Capsids. Angewandte Chemie International Edition 2001, 40(2):442-445.
144. Mertig M, Pompe, W. : Nanobiotechnology:Concepts Applications and Perspectives. Weinheim: Wiley-VCH; 2004.

Page | 200
145. Braun PV: Nanocomposite science and Technology. Weinheim: Wiley-VCH; 2004. 146. Adam D Lazareck SGC, Teng-Fang Kuo, Bradford J Taft, Shana O Kelley, Jimmy M Xu:
DNA-directed synthesis of zinc oxide nanowires on carbon nanotube tips.. Nanotechnology 2006, May 5,17.((10)):2661-2664.
147. Fowler CE, Shenton W, Stubbs G, Mann S: Tobacco Mosaic Virus Liquid Crystals as Templates for the Interior Design of Silica Mesophases and Nanoparticles. Advanced Materials 2001, 13(16):1266-1269.
148. Douglas T, Young M: Host-guest encapsulation of materials by assembled virus protein cages. Nature 1998, 393(6681):152-155.
149. Niemeyer CM: Nanoparticles, Proteins, and Nucleic Acids: Biotechnology Meets Materials Science. Angewandte Chemie International Edition 2001, 40(22):4128-4158.
150. A. Vey REH, and T.M. Butt. : Toxic metabolites of fungal biocontrol agents, vol. 311: CAB International, Bristol; 2001.
151. White TJ, T. Bruns, S. Lee, and J. W. Taylor: Amplification and direct sequencing of fungal ribosomal RNA genes for phylogenetics. New York: Academic Press,Inc.; 1990.
152. Saunders M, Shaw, J. A.: Biological applications of energy-filtered TEM. Methods in molecular biology N.J.: Clifton; 2014.
153. Anaganti N, Basu B, Gupta A, Joseph D, Apte SK: Depletion of reduction potential and key energy generation metabolic enzymes underlies tellurite toxicity in Deinococcus radiodurans. PROTEOMICS 2014:n/a-n/a.
154. Morton DJaWHS: Antagonistic and stimulating effects of soil micro-organism of Sclerotium Phytopathol (1955), 45:417-420.
155. S P Kale STM: Biogas Plant based on kitchen waste. BARC News letter 2002, 216:8-12.
156. Esteban BJFGF: UBIQUITOUS MICROBES AND ECOSYSTEM FUNCTION Limnetica : Asociacion Espaiiola dc Limnologia, Madrid Spain ISSN: 021 3-X409 (2001):31-43.
157. Gessner MO, Swan CM, Dang CK, McKie BG, Bardgett RD, Wall DH, Hättenschwiler S: Diversity meets decomposition. Trends in Ecology & Evolution 2010, 25(6):372-380.
158. Allison SDea: Soil enzymes: linking proteomics and ecological processes. Washington, DC:: ASM.; (2007).
159. Dashtban M SH, Syed TA, Qin W.: Fungal biodegradation and enzymatic modification of lignin. International Journal of Biochemistry and Molecular Biology 2010, 1(1):36-50.
160. Levin L, Forchiassin F, Ramos AM: Copper induction of lignin-modifying enzymes in the white-rot fungus Trametes trogii. Mycologia 2002, 94(3):377-383.
161. Frey-Klett P, Burlinson P, Deveau A, Barret M, Tarkka M, Sarniguet A: Bacterial-Fungal Interactions: Hyphens between Agricultural, Clinical, Environmental, and Food Microbiologists. Microbiology and Molecular Biology Reviews 2011, 75(4):583-609.
162. Hao E, Kelly KL, Hupp JT, Schatz GC: Synthesis of silver nanodisks using polystyrene mesospheres as templates. Journal of the American Chemical Society 2002, 124(51):15182-15183.

Page | 201
163. Brause R, Möltgen H, Kleinermanns K: Characterization of laser-ablated and chemically reduced silver colloids in aqueous solution by UV/VIS spectroscopy and STM/SEM microscopy. Appl Phys B 2002, 75(6-7):711-716.
164. Mock JJ, Barbic M, Smith DR, Schultz DA, Schultz S: Shape effects in plasmon resonance of individual colloidal silver nanoparticles. The Journal of Chemical Physics 2002, 116(15):6755-6759.
165. Peay K.G. KPG, Bruns T.D.: Fungal community ecology: a hybrid beast with a molecular master. BioScience (2008), 58:799-810. .
166. Schoch CL, Seifert, K.A., Huhndorf, S., Robert, V., Spouge, J.L., Levesque, C.A., Chen, W., Bolchacova, E., Voigt, K., Crous, P.W., et al. Nuclear Ribosomal Internal Transcribed Spacer (ITS) Region as a Universal DNA Barcode Marker for Fungi. PNAS (2012).
167. Vasilyeva SV, Vorotyntsev MA, Bezverkhyy I, Lesniewska E, Heintz O, Chassagnon R: Synthesis and characterization of palladium nanoparticle/polypyrrole composites. Journal of Physical Chemistry C 2008, 112(50):19878-19885.
168. Sondi I, Salopek-Sondi B: Silver nanoparticles as antimicrobial agent: a case study on E. coli as a model for Gram-negative bacteria. Journal of Colloid and Interface Science 2004, 275(1):177-182.
169. Gittins DI, Bethell D, Schiffrin DJ, Nichols RJ: A nanometre-scale electronic switch consisting of a metal cluster and redox-addressable groups. Nature 2000, 408(6808):67-69.
170. Shankar SS, Rai A, Ahmad A, Sastry M: Rapid synthesis of Au, Ag, and bimetallic Au core-Ag shell nanoparticles using Neem (Azadirachta indica) leaf broth. Journal of Colloid and Interface Science 2004, 275(2):496-502.
171. Vossmeyer T, Guse B, Besnard I, Bauer RE, Müllen K, Yasuda A: Gold nanoparticle/polyphenylene dendrimer composite films: Preparation and vapor-sensing properties. Advanced Materials 2002, 14(3):238-242.
172. Hirsch LR, Stafford RJ, Bankson JA, Sershen SR, Rivera B, Price RE, Hazle JD, Halas NJ, West JL: Nanoshell-mediated near-infrared thermal therapy of tumors under magnetic resonance guidance. Proceedings of the National Academy of Sciences of the United States of America 2003, 100(23):13549-13554.
173. Shankar SS, Rai A, Ankamwar B, Singh A, Ahmad A, Sastry M: Biological synthesis of triangular gold nanoprisms. Nature Materials 2004, 3(7):482-488.
174. Maier SA, Brongersma ML, Kik PG, Meltzer S, Requicha AAG, Atwater HA: Plasmonics - A route to nanoscale optical devices. Advanced Materials 2001, 13(19):1501-1505.
175. Chandran SP, Chaudhary M, Pasricha R, Ahmad A, Sastry M: Synthesis of gold nanotriangles and silver nanoparticles using Aloe vera plant extract. Biotechnology Progress 2006, 22(2):577-583.
176. Shankar SS, Rai A, Ahmad A, Sastry M: Controlling the optical properties of lemongrass extract synthesized gold nanotriangles and potential application in infrared-absorbing optical coatings. Chemistry of Materials 2005, 17(3):566-572.
177. Millstone JE, Hurst SJ, Métraux GS, Cutler JI, Mirkin CA: Colloidal gold and silver triangular nanoprisms. Small 2009, 5(6):646-664.

Page | 202
178. Letfullin RR, Joenathan C Fau - George TF, George Tf Fau - Zharov VP, Zharov VP: Laser-induced explosion of gold nanoparticles: potential role for nanophotothermolysis of cancer. 2007(1748-6963 (Electronic)).
179. McMahon SJ, Hyland WB, Brun E, Butterworth KT, Coulter JA, Douki T, Hirst DG, Jain S, Kavanagh AP, Krpetic Z et al: Energy Dependence of Gold Nanoparticle Radiosensitization in Plasmid DNA. The Journal of Physical Chemistry C 2011, 115(41):20160-20167.
180. Ding L, Guo H, Zhang JQ, Zhang YK, He TC, Mo YJ: Preparation of palladium nanoparticles by laser ablation and its spectral properties study. Guang Pu Xue Yu Guang Pu Fen Xi/Spectroscopy and Spectral Analysis 2008, 28(9):2053-2057.
181. Xu L, Wu XC, Zhu JJ: Green preparation and catalytic application of Pd nanoparticles. Nanotechnology 2008, 19(30).
182. Cui L, Wang A, Wu DY, Ren B, Tian ZQ: Shaping and shelling Pt and Pd nanoparticles for ultraviolet laser excited surface-enhanced Raman scattering. Journal of Physical Chemistry C 2008, 112(45):17618-17624.
183. Tom Hennebel SVNS, Verschuere Simon De Corte, Bart De Gusseme Claude, Cuvelier Jeffrey, P. Fitts, Daniel van der Lelie, Nico Boon, Willy Verstraete: Palladium nanoparticles produced by fermentatively cultivated bacteria as catalyst for diatrizoate removal with biogenic hydrogen Environmental Biotechnology 2011.
184. Jia L, Zhang Q, Li Q, Song H: The biosynthesis of palladium nanoparticles by antioxidants in Gardenia jasminoides Ellis: Long lifetime nanocatalysts for p-nitrotoluene hydrogenation. Nanotechnology 2009, 20(38).
185. Yates MD, Cusick RD, Logan BE: Extracellular Palladium Nanoparticle Production using Geobacter sulfurreducens. ACS Sustainable Chemistry & Engineering 2013, 1(9):1165-1171.
186. Escobar Morales B, Gamboa SA, Pal U, Guardián R, Acosta D, Magaña C, Mathew X: Synthesis and characterization of colloidal platinum nanoparticles for electrochemical applications. International Journal of Hydrogen Energy 2010, 35(9):4215-4221.
187. Paul YBVBS, Bhattacharyya SS: Green synthesis, characterization and anticancer potential of platinum nanoparticles Bioplatin Journal of Chinese Integrative Medicine: Volume IssuePages: 2012, 10,( 6): 681-689.
188. Shrivas K, Agrawal K, Wu H-F: Application of platinum nanoparticles as affinity probe and matrix for direct analysis of small biomolecules and microwave digested proteins using matrix-assisted laser desorption/ionization mass spectrometry. Analyst 2011, 136(13):2852-2857.
189. Konishi Y, Ohno K, Saitoh N, Nomura T, Nagamine S, Hishida H, Takahashi Y, Uruga T: Bioreductive deposition of platinum nanoparticles on the bacterium Shewanella algae. J Biotechnol 2007, 128(3):648-653.
190. Kittel C: Introduction to Solid State Physics: Wiley: New York; 1996. 191. Ashcroft NWaM, N. D. Solid State Physics. Philadelphia: Saunders College, : In: 1976;
Solid State Physics. Philadelphia: Saunders College. 192. Angshuman Pal SSaSD: Preparation of Stable Silver and Silver-Gold Bimetallic
Nanoparticle in W/O Microemulsion Containing TritonX-100. African Physical Review 2007(Special Issue (Microfluidics):0001).

Page | 203
193. Teo BK, Keating K, Kao YH: Observation of plasmon frequency in the optical spectrum of Au18Ag20 cluster: the beginning of the collective phenomenon characteristics of the bulk? Journal of the American Chemical Society 1987, 109(11):3494-3495.
194. Mahl D, Diendorf J, Ristig S, Greulich C, Li Z-A, Farle M, Köller M, Epple M: Silver, gold, and alloyed silver–gold nanoparticles: characterization and comparative cell-biologic action. J Nanopart Res 2012, 14(10):1-13.
195. Ling D: Composite gold silver alloy nanoparticles for GFP interactions. The National High School Journal of Science 2011.
196. Nori NM, Abdi K, Khoshayand MR, Ahmadi SH, Lamei N, Shahverdi AR: Microwave-assisted biosynthesis of gold–silver alloy nanoparticles and determination of their Au/Ag ratio by atomic absorption spectroscopy. Journal of Experimental Nanoscience 2012, 8(4):442-450.
197. Link S, Wang ZL, El-Sayed MA: Alloy formation of gold-silver nanoparticles and the dependence of the plasmon absorption on their composition. Journal of Physical Chemistry B 1999, 103(18):3529-3533.
198. Mulvaney P, Giersig M, Henglein A: Electrochemistry of multilayer colloids: preparation and absorption spectrum of gold-coated silver particles. The Journal of Physical Chemistry 1993, 97(27):7061-7064.
199. Sinzig JR, U.; Quinten, M.; Kreibig, U. Z: Binary Clusters : homogeneous alloys and nucleus-shell structures Atoms, Molecules (Jr Atoms and Clusters) 1993, 26, :242-245.
200. Sato T, Kuroda S, Takami A, Yonezawa Y, Hada H: Photochemical formation of silver-gold (AgAu) composite colloids in solutions containing sodium alginate. Applied Organometallic Chemistry 1991, 5(4):261-268.
201. Pradnya N, Poulomi M, Sudhir K: Triethylamine induced synthesis of silver and bimetallic (Ag/Au) nanoparticles in glycerol and their antibacterial study. Journal of Nanostructure in Chemistry 2014, 4(3).
202. Nair B, Pradeep T: Coalescence of Nanoclusters and Formation of Submicron Crystallites Assisted by Lactobacillus Strains. Crystal Growth and Design 2002, 2(4):293-298.
203. Kulamarva A1 RP, Bhathena J, Chen H, Talapatra S, Ajayan PM, Nalamasu O, Prakash S.: Microcapsule carbon nanotube devices for therapeutic applications. Nanotechnology 2009 Jan, 14;20(2)::025612.
204. Georgakilas V, Gournis D, Tzitzios V, Pasquato L, Guldi DM, Prato M: Decorating carbon nanotubes with metal or semiconductor nanoparticles. Journal of Materials Chemistry 2007, 17(26):2679-2694.
205. Kim B SW: Functionalized multiwall carbon nanotube/gold nanoparticle composites. Langmuir 2004 Sep, 14;20(19:8239-8242.
206. Jiang K, Eitan A, Schadler LS, Ajayan PM, Siegel RW, Grobert N, Mayne M, Reyes-Reyes M, Terrones H, Terrones M: Selective Attachment of Gold Nanoparticles to Nitrogen-Doped Carbon Nanotubes. Nano Letters 2003, 3(3):275-277.
207. Wildgoose GG1 BC, Compton RG: Metal nanoparticles and related materials supported on carbon nanotubes: methods and applications.. Small 2006 Feb, 2(2):182-193.

Page | 204
208. Guo DJ, Li HL: Highly dispersed Ag nanoparticles on functional MWNT surfaces for methanol oxidation in alkaline solution. Carbon 2005, 43(6):1259-1264.
209. Wu HP, Wu XJ, Ge MY, Zhang GQ, Wang YW, Jiang J: Properties investigation on isotropical conductive adhesives filled with silver coated carbon nanotubes. Composites Science and Technology 2007, 67(6):1182-1186.
210. Yoosefi Booshehri A, Wang R, Xu R: The effect of re-generable silver nanoparticles/multi-walled carbon nanotubes coating on the antibacterial performance of hollow fiber membrane. Chemical Engineering Journal 2013, 230(0):251-259.
211. Xin F, Li L: Decoration of carbon nanotubes with silver nanoparticles for advanced CNT/polymer nanocomposites. Composites Part A: Applied Science and Manufacturing 2011, 42(8):961-967.
212. Neelgund GM, Oki A: Deposition of Silver Nanoparticles on Dendrimer Functionalized Multiwalled Carbon Nanotubes: Synthesis, Characterization and Antimicrobial Activity. Journal of Nanoscience and Nanotechnology 2011, 11(4):3621-3629.
213. Shyam Sundhar Bale PA, Sandeep S. Karajanagi, Jonathan S. Dordick,, Kane RS: Protein-Directed Formation of Silver Nanoparticles on Carbon Nanotubes. Adv Mater 2007, 19:3167–3170.
214. Dhibar S, Das CK: Silver Nanoparticles Decorated Polyaniline/Multiwalled Carbon Nanotubes Nanocomposite for High-Performance Supercapacitor Electrode. Industrial & Engineering Chemistry Research 2014, 53(9):3495-3508.
215. Ma PC, Tang BZ, Kim J-K: Effect of CNT decoration with silver nanoparticles on electrical conductivity of CNT-polymer composites. Carbon 2008, 46(11):1497-1505.
216. Yuan W, Jiang G, Che J, Qi X, Xu R, Chang MW, Chen Y, Lim SY, Dai J, Chan-Park MB: Deposition of Silver Nanoparticles on Multiwalled Carbon Nanotubes Grafted with Hyperbranched Poly(amidoamine) and Their Antimicrobial Effects. The Journal of Physical Chemistry C 2008, 112(48):18754-18759.
217. Kamat PV: Meeting the Clean Energy Demand: Nanostructure Architectures for Solar Energy Conversion.. J Phys Chem C 2007, 111:2834-2860.
218. Kudo A, Miseki Y: Heterogeneous photocatalyst materials for water splitting. Chemical Society Reviews 2009, 38(1):253-278.
219. Fox MA, Dulay MT: Acceleration of secondary dark reactions of intermediates derived from adsorbed dyes on irradiated TiO2 powders. Journal of Photochemistry and Photobiology A: Chemistry 1996, 98(1–2):91-101.
220. Hoffmann M R MST, Choi W and Bahnemann D W . : Chem Rev 1995 95 69. 221. Bolton JR: SOLAR PHOTOPRODUCTION OF HYDROGEN. In: IEA Agreement on the
Production and Utilisation of Hydrogen. Department of Chemistry The University of Western Ontario London, Ontario, Canada N6A 5B7; Last edited 21 November 1995.
222. Bard AJ: Design of semiconductor photoelectrochemical systems for solar energy conversion. The Journal of Physical Chemistry 1982, 86(2):172-177.
223. Amy L. Linsebigler GL, John T. Yates, Jr.: Photocatalysis on TiOn Surfaces:Principles, Mechanisms, and Selected Results. Chem Rev 1995,, 95,:735-758.
Page | 205
224. Sakata T: Photocatalysis of irradiated semiconductor surfaces: its application to water splitting and some organic reactions. Journal of Photochemistry 1985, 29(1–2):205-215.
225. H. Kato MH, R. Konta, Y. Shimodaira, and A. Kudo: Construction of Z-Scheme-Type Heterogeneous Photocatalysis Systems for Water Splitting into H2 and O2 under Visible Light Irradiation. Chem Lett, 2004, 33(10):1348-1349.
226. Trung T, Cho WJ, Ha CS: Preparation of TiO2 nanoparticles in glycerol-containing solutions. Materials Letters 2003, 57(18):2746-2750.
227. Arnal P, Corriu RJP, Leclercq D, Mutin PH, Vioux A: A Solution Chemistry Study of Nonhydrolytic Sol - Gel Routes to Titania. Chemistry of Materials 1997, 9(3):694-698.
228. Sugimoto T, Zhou X, Muramatsu A: Synthesis of uniform anatase TiO2 nanoparticles by gel-sol method: 1. Solution chemistry of Ti(OH)n (4-n)+ complexes. Journal of Colloid and Interface Science 2002, 252(2):339-346.
229. Kim CS, Moon BK, Park JH, Chung ST, Son SM: Synthesis of nanocrystalline TiO2 in toluene by a solvothermal route. Journal of Crystal Growth 2003, 254(3-4):405-410.
230. Kim DH, Hong HS, Kim SJ, Song JS, Lee KS: Photocatalytic behaviors and structural characterization of nanocrystalline Fe-doped TiO2 synthesized by mechanical alloying. Journal of Alloys and Compounds 2004, 375(1-2):259-264.
231. Kolen'ko YV, Churagulov BR, Kunst M, Mazerolles L, Colbeau-Justin C: Photocatalytic properties of titania powders prepared by hydrothermal method. Applied Catalysis B: Environmental 2004, 54(1):51-58.
232. Nian JN, Teng H: Hydrothermal synthesis of single-crystalline anatase TiO2 nanorods with nanotubes as the precursor. Journal of Physical Chemistry B 2006, 110(9):4193-4198.
233. Ruiz AM, Sakai G, Cornet A, Shimanoe K, Morante JR, Yamazoe N: Microstructure control of thermally stable TiO2 obtained by hydrothermal process for gas sensors. Sensors and Actuators, B: Chemical 2004, 103(1-2):312-317.
234. P. Xiaoyan MX: Study on the milling-induced transformation in TiO2 powder with different grain sizes. Mater Lett, 2004, 58:513-515.
235. Guimarães JL, Abbate M, Betim SB, Alves MCM: Preparation and characterization of TiO2 and V2O5 nanoparticles produced by ball-milling. Journal of Alloys and Compounds 2003, 352(1-2):16-20.
236. Kamei M, Mitsuhashi T: Hydrophobic drawings on hydrophilic surfaces of single crystalline titanium dioxide: Surface wettability control by mechanochemical treatment. Surface Science 2000, 463(1):L609-L612.
237. Oh SM, Ishigaki T: Preparation of pure rutile and anatase TiO2 nanopowders using RF thermal plasma. Thin Solid Films 2004, 457(1):186-191.
238. Matsubara M, Yamaki T, Itoh H, Abe H, Asai K: Preparation of TiO2 nanoparticles by pulsed laser ablation: Ambient pressure dependence of crystallization. Japanese Journal of Applied Physics, Part 2: Letters 2003, 42(5 A):L479-L481.
239. [http://xpssimplified.com/elements/titanium.php] 240. Mrinal R. Pai AMS, Atindra M. Banerjee, Raghvendra Tewari,, Gautam K. Dey AKT,
and Shyamala R. Bharadwaj: Synthesis, characterization and photocatalytic H2 generation over ternary indium titanate nanoparticles. Journal of Nanoscience and Nanotechnology 2012, Vol. 12:1957–1966.

Page | 206
241. Jha AK, Prasad K, Kulkarni AR: Synthesis of TiO2 nanoparticles using microorganisms. Colloids and Surfaces B: Biointerfaces 2009, 71(2):226-229.
242. DJONOVIC S: ROLE OF TWO SECRETED PROTEINS FROM Trichoderma virens IN MYCOPARASITISM AND INDUCTION OF PLANT RESISTANCE. Texas A&M University; 2005.
243. Socrates G: Infrared and Raman Characteristic Group Frequencies: Tables and Charts, 3rd Edition edn: Wiley; February 2004.
244. Flett MSC: Characteristic Frequencies of Chemical Groups in the Infrared. Oxford: Elsevier; 1963.
245. W JJ: Methods in Crystallography New York: Academic; 1971. 246. Nandy SK, Mukherjee DK, Roy SB, Kastha GS: Vibrational Spectra and Rotational
Isomerism in 2-Mercaptoethanol. Canadian Journal of Chemistry 1973, 51(7):1139-1141.
247. Stacchiola D, Burkholder L, Tysoe WT: Ethylene adsorption on Pd(I) studied using infrared reflection–absorption spectroscopy. Surface Science 2002, 511(1–3):215-228.
248. Calaza F, Gao F, Li Z, Tysoe WT: The adsorption of ethylene on Au/Pd(1) alloy surfaces. Surface Science 2007, 601(3):714-722.
249. Freitas RS, Steindorff AS, Ramada MH, de Siqueira SJ, Noronha EF, Ulhoa CJ: Cloning and characterization of a protein elicitor Sm1 gene from Trichoderma harzianum. Biotechnol Lett 2014, 36(4):783-788.
250. Pazzagli L, Seidl-Seiboth V, Barsottini M, Vargas WA, Scala A, Mukherjee PK: Cerato-platanins: Elicitors and effectors. Plant Science 2014, 228(0):79-87.
251. Chowdhury J, Ghosh M: Concentration-dependent surface-enhanced Raman scattering of 2-benzoylpyridine adsorbed on colloidal silver particles. Journal of Colloid and Interface Science 2004, 277(1):121-127.
252. Podstawka E, Ozaki Y, Proniewicz LM: Adsorption of S& 8211;S Containing Proteins on a Colloidal Silver Surface Studied by Surface-Enhanced Raman Spectroscopy. Applied Spectroscopy 2004, 58(10):1147-1156.
253. Dollish F R FWGaBFF: Characteristic Raman Frequencies of Organic Compounds. New York:: Wiley; 1974.
254. Gole A, Dash C, Ramakrishnan V, Sainkar SR, Mandale AB, Rao M, Sastry M: Pepsin−Gold Colloid Conjugates: Preparation, Characterization, and Enzymatic Activity. Langmuir 2001, 17(5):1674-1679.
255. Lahr RH, Vikesland PJ: Surface-Enhanced Raman Spectroscopy (SERS) Cellular Imaging of Intracellulary Biosynthesized Gold Nanoparticles. ACS Sustainable Chemistry & Engineering 2014, 2(7):1599-1608.
256. Wang W, Gu B: Preparation and Characterization of Silver Nanoparticles at High Concentrations. In: Concentrated Dispersions. Washington, DC: American Chemical Society; 2009: 1-14.
257. Zhang J, Li W, Cheng Y, Zhang X, Huang S, Ma H: A direct and facile synthetic route for micron-scale gold prisms and fabrication of gold prism thin films on solid substrates. Materials Chemistry and Physics 2010, 119(1-2):188-194.
258. Mitrić R, Petersen J, Kulesza A, Bonačić-Koutecký V, Tabarin T, Compagnon I, Antoine R, Broyer M, Dugourd P: Absorption properties of cationic silver cluster-tryptophan

Page | 207
complexes: A model for photoabsorption and photoemission enhancement in nanoparticle-biomolecule systems. Chemical Physics 2008, 343(2-3):372-380. 259. French GL: Bactericidal agents in the treatment of MRSA infections—the potential
role of daptomycin. Journal of Antimicrobial Chemotherapy 2006, 58(6):1107-1117. 260. Jain J, Arora S, Rajwade JM, Omray P, Khandelwal S, Paknikar KM: Silver
Nanoparticles in Therapeutics: Development of an Antimicrobial Gel Formulation for Topical Use. Molecular Pharmaceutics 2009, 6(5):1388-1401. 261. Shrivastava S, Bera T, Roy A, Singh G, Ramachandrarao P, Dash D: Characterization
of enhanced antibacterial effects of novel silver nanoparticles. Nanotechnology 2007, 18(22).
262. Parashar UK, Kumar V, Bera T, Saxena PS, Nath G, Srivastava SK, Giri R, Srivastava A: Study of mechanism of enhanced antibacterial activity by green synthesis of silver nanoparticles. Nanotechnology 2011, 22(41):0957-4484.
263. Lee KJ, Jun BH, Choi J, Lee YI, Joung J, Oh YS: Environmentally friendly synthesis of organic-soluble silver nanoparticles for printed electronics. Nanotechnology 2007, 18(33).
264. Liu F-K, Ko F-H, Huang P-W, Wu C-H, Chu T-C: Studying the size/shape separation and optical properties of silver nanoparticles by capillary electrophoresis. Journal of Chromatography A 2005, 1062(1):139-145.
265. Ahmad A, Mukherjee P, Senapati S, Mandal D, Khan MI, Kumar R, Sastry M: Extracellular biosynthesis of silver nanoparticles using the fungus Fusarium oxysporum. Colloids and Surfaces B: Biointerfaces 2003, 28(4):313-318.
266. Mandal D, Bolander ME, Mukhopadhyay D, Sarkar G, Mukherjee P: The use of microorganisms for the formation of metal nanoparticles and their application. Applied Microbiology and Biotechnology 2006, 69(5):485-492.
267. Popa M, Pradell T, Crespo D, Calderón-Moreno JM: Stable silver colloidal dispersions using short chain polyethylene glycol. Colloids and Surfaces A: Physicochemical and Engineering Aspects 2007, 303(3):184-190.
268. Xue G, Dai Q, Jiang S: Chemical reactions of imidazole with metallic silver studied by the use of SERS and XPS techniques. Journal of the American Chemical Society 1988, 110(8):2393-2395.
269. Furutani M, Kudo K: A trifunctional photopatterning component derived from cysteine: fabrication of a deposited silver micropattern. Journal of Materials Chemistry 2012, 22(7):3139-3147.
270. Shen X-C, Liang H, Guo J-H, Song C, He X-W, Yuan Y-Z: Studies on the interaction between Ag+ and human serum albumin. Journal of Inorganic Biochemistry 2003, 95(2–3):124-130.
271. Mandal S, Gole A, Lala N, Gonnade R, Ganvir V, Sastry M: Studies on the Reversible Aggregation of Cysteine-Capped Colloidal Silver Particles Interconnected via Hydrogen Bonds. Langmuir 2001, 17(20):6262-6268.
272. Thakur P, Joshi SS, Kapoor S, Mukherjee T: Fluorescence Behavior of Cysteine-Mediated Ag@CdS Nanocolloids. Langmuir 2009, 25(11):6377-6384.
273. Jing C, Fang Y: Experimental (SERS) and theoretical (DFT) studies on the adsorption behaviors of l-cysteine on gold/silver nanoparticles. Chemical Physics 2007, 332(1):27-32.

Page | 208
274. Mukherjee P, Roy M, Mandal BP, Dey GK, Mukherjee PK, Ghatak J, Tyagi AK, Kale SP: Green synthesis of highly stabilized nanocrystalline silver particles by a non-pathogenic and agriculturally important fungus T. asperellum. Nanotechnology 2008, 19(7).
275. Van Den Hazel HB K-BM, Winther JR: Review: biosynthesis and function of yeast vacuolar proteases. Yeast Jan 1996, 12((1)):1-16.
276. Vallejo MC, Nakayasu ES, Matsuo AL, Sobreira TJP, Longo LVG, Ganiko L, Almeida IC, Puccia R: Vesicle and Vesicle-Free Extracellular Proteome of Paracoccidioides brasiliensis: Comparative Analysis with other Pathogenic Fungi. Journal of Proteome Research 2012, 11(3):1676-1685.
277. Oliveira DL, Freire-de-Lima CG, Nosanchuk JD, Casadevall A, Rodrigues ML, Nimrichter L: Extracellular Vesicles from Cryptococcus neoformans Modulate Macrophage Functions. Infection and Immunity 2010, 78(4):1601-1609.
278. Albuquerque PC, Nakayasu ES, Rodrigues ML, Frases S, Casadevall A, Zancope-Oliveira RM, Almeida IC, Nosanchuk JD: Vesicular transport in Histoplasma capsulatum: an effective mechanism for trans-cell wall transfer of proteins and lipids in ascomycetes. Cellular microbiology 2008, 10(8):1695-1710.
279. Kumar SA, Abyaneh MK, Gosavi SW, Kulkarni SK, Ahmad A, Khan MI: Sulfite reductase-mediated synthesis of gold nanoparticles capped with phytochelatin. Biotechnology and Applied Biochemistry 2007, 47(4):191-195.
280. Djonović S, Vargas, Walter A.Kolomiets, Michael V.Horndeski, Michelle, Wiest AK, Charles M.: A Proteinaceous Elicitor Sm1 from the Beneficial Fungus Trichoderma virens Is Required for Induced Systemic Resistance in Maize. Plant Physiology 2007, 145(3):875-889.
281. Moteshafi H, Mousavi SM, Shojaosadati SA: The possible mechanisms involved in nanoparticles biosynthesis. Journal of Industrial and Engineering Chemistry 2012, 18(6):2046-2050.
282. Govender Y, Riddin T, Gericke M, Whiteley C: Bioreduction of platinum salts into nanoparticles: a mechanistic perspective. Biotechnology Letters 2009, 31(1):95-100.
283. Maliszewska I, Juraszek A, Bielska K: Green Synthesis and Characterization of Silver Nanoparticles Using Ascomycota Fungi Penicillium nalgiovense AJ12. J Clust Sci 2014, 25(4):989-1004.
284. M. A. Kupryashina EPV, A. M. Burov, E. G. Ponomareva,V. E. Nikitina Biosynthesis of gold nanoparticles by Azospirillum brasilense. Microbiology and Molecular Biology Reviews Jan 2014, 82, ( 6,).
285. Bae H RD, Lim H-S, Strem M, Park S-C, Ryu C-M, Melnick R: EndophyticTrichoderma isolates from tropical environments delay disease and induce resistance against Phytophthora capsici in hot pepper using multiple mechanisms.; 2011.
286. Lorito M WS, Harman GE, Monte E. : Translational research onTrichoderma:from ‘omics to the field. Annual review of Phytopathology 2010, 48:395-417.
287. Mastouri F BT, Harman GE: Seed treatments with Trichoderma harzianum alleviate biotic, abiotic and physiological stresses in germinating seeds and seedlings. Phytopathology 2010, 100:1213–1221.
288. Shoresh M HG: The molecular basis of maize responses toTrichoderma harzianum T22 inoculation: a proteomic approach. Plant Physiology 2008, 147:2147–2163.

Page | 209
289. Arun Kumar Nayak MRG, Krishnan PalliPattu Vijayan,: Stabilizing Natural Circulation Systems With Nanoparticles In., vol. Pub. No.: US 2011/0168355 A1. United States; Jul. 14, 2011.

Page | 210
APPENDIX SDS-polyacrylamide Gel Electrophoresis of proteins
Table 1. Solutions for preparing Linear Resolving Gel (12 %) for Tris-glycine SDS-Polyacylamide Gel Electrophoresis- total volume 40 ml.
Solution components Vol (ml) H2O 13.2 30% acrylamide mix 16.0 1.5M Tris pH(8.8) 10.0 10% SDS 0.4 10% ammonium persulphate 0.4 TEMED 0.016
Table 2. Solutions for preparing 5 % Stacking Gel for Tris-glycine SDS-Polyacylamide Gel Electrophoresis- total volume 10 ml.
Solution components Vol (ml) H2O 6.8 30% acrylamide mix 1.7 1.5M Tris pH(6.8) 1.25 10% SDS 0.1 10% ammonium persulphate 0.1 TEMED 0.01
TEMED (N,N,N’,N’-tetramethylethylenediamine) Coomassie Brilliant Blue Staining Reagents: Fixing solution: 50% methanol and 10% glacial acetic acid) Staining solution: 0.25gm Coomassie Brilliant Blue R-250, 90 ml methanol: H2O (1:1 v/v) and 10% glacial acetic acid) Destaining solution: 40% methanol and 10% glacial acetic acid) Storage solution: water containing 20 % glycerol.

This article appeared in a journal published by Elsevier. The attachedcopy is furnished to the author for internal non-commercial researchand education use, including for instruction at the authors institution
and sharing with colleagues.
Other uses, including reproduction and distribution, or selling orlicensing copies, or posting to personal, institutional or third party
websites are prohibited.
In most cases authors are permitted to post their version of thearticle (e.g. in Word or Tex form) to their personal website orinstitutional repository. Authors requiring further information
regarding Elsevier’s archiving and manuscript policies areencouraged to visit:
http://www.elsevier.com/copyright

Author's personal copy
Synthesis of uniform gold nanoparticles using non-pathogenic bio-control agent:Evolution of morphology from nano-spheres to triangular nanoprisms
P. Mukherjee a, Mainak Roy b, B.P. Mandal b, Sipra Choudhury b, R. Tewari c, A.K. Tyagi b, S.P. Kale a,⇑a NABT Division, Bhabha Atomic Research Centre, Mumbai 400 085, Indiab Chemistry Division, Bhabha Atomic Research Centre, Mumbai 400 085, Indiac Materials Science Division, Bhabha Atomic Research Centre, Mumbai 400 085, India
a r t i c l e i n f o
Article history:Received 1 July 2011Accepted 11 August 2011Available online 19 October 2011
Keywords:Gold nanoparticleGold nanoprismsBiological synthesisNon-pathogenicExotic morphology
a b s t r a c t
Green synthesis of gold nanospheres with uniform diameter and triangular nanoprisms with optically flatsurface was carried out using a non-pathogenic bio-control agent Trichoderma asperellum for reduction ofHAuCl4. Kinetics of the reaction was monitored by UV–Vis absorption spectroscopy. No additional cap-ping/complexing agent was used for stabilizing the gold nanoparticles. Evolution of morphology frompseudospherical nanoparticles to triangular nanoprisms was studied by transmission electron micros-copy (TEM). It revealed that three or more pseudospheres fused to form nanoprisms of different shapesand sizes. Slow rate of reduction of HAuCl4 by constituents of cell-free fungal extract was instrumental inproducing such exotic morphologies. Isolation of gold nanotriangles from the reacting masses wasachieved by differential centrifugation.
� 2011 Elsevier Inc. All rights reserved.
1. Introduction
Metal nanoparticles with well-defined morphology, gold andsilver nanotriangles, prisms and cubes in particular, have tremen-dous potential for applications in bio-sensing , VOC sensing [1],oncotherapy [2], field emission [3], as wave-guides for electromag-netic radiation [4], substrates for surface enhanced resonance Ra-man spectroscopy (SERS) [5], novel conductive tips for scanningtunnelling microscopy (STM) [3] and near-infrared absorbing opti-cal coatings [6]. Sharp tips and vertices of nano-triangles andprisms are particularly responsible for their unique optical andelectronic properties [7]. Millstone et al. provided a comprehensivereview of colloidal gold and silver nanoprisms [8], wherein differ-ent exotic nanostructures of gold and silver including rods andwires [9–14] prisms and discs [3,15–19], cubes [20–25], dog bones[25,24] and hollow structures [26,27] are discussed. But there existonly a few recent reports on the synthesis of gold nano-triangleswith high yield. The chemical methods involve reduction of metalions by strong reducing agents e.g. NaBH4 [15,18], Na2S [28], etc. inpresence of capping agents like surfactants [15,18], polymers [15],or small organic molecules. Alternately, there are processes thatare mediated via addition of plant extracts and biological mole-cules in aqueous solvents. They have been proposed as an environ-mentally benign alternative to the aforementioned chemicalmethods since they do not use any harsh chemicals, high-boiling
solvents and extreme reaction conditions. Biological methods forsynthesis of triangular gold nanoprisms include reduction ofHAuCl4 using extracts from lemon-grass [3], aloe vera [5] andbrown seaweed [29]. Although efforts have been made to controledge length by adjusting metal to reductant ratio, surfactant andseed concentration, pH, etc., it is extremely difficult to obtainnanoprisms with uniform thickness by these approaches. It hasbeen generally observed that slow reduction of gold producesnano-triangles [5,30] in preference to pseudospherical nanoparti-cles. Previously, we reported reduction of Ag+ using cell-free ex-tract from Trichoderma asperellum [31] where the reactioncontinued for several days. T. asperellum, a non-pathogenic fungusfrom the Trichoderma genus is a proven bio-control agent and itsbiomass is utilized in commercial formulations meant for differentagricultural applications [32]. It has been used in the present workfor the reduction of HAuCl4. It was hypothesized that slow reduc-tion of gold by fungal extract, the process which could be furthermanipulated by varying culture and growth conditions, would pro-duce exotic structures including nanotriangles. Moreover, the bio-logical molecules and protein fragments present in the cell-freefungal extract might exhibit shape directing properties in goldnanoparticles as previously observed for Aloe vera extract [5] andPVP molecule [5,15]. Herein, for the first time we report, usingcell-free extract of T. asperellum, room temperature synthesis ofuniform gold nano-triangles with optically flat surface along withpseudospherical nanoparticles. The observation is particularlyinteresting since reduction of AgNO3 by cell-free extract of T. asper-ellum under similar reaction conditions produced only spherical
0021-9797/$ - see front matter � 2011 Elsevier Inc. All rights reserved.doi:10.1016/j.jcis.2011.08.085
⇑ Corresponding author.E-mail address: [email protected] (S.P. Kale).
Journal of Colloid and Interface Science 367 (2012) 148–152
Contents lists available at SciVerse ScienceDirect
Journal of Colloid and Interface Science
www.elsevier .com/locate / jc is

Author's personal copy
nanoparticles [31]. Evolution of prismatic structures from pseudo-spherical nanoparticles was studied using transmission electronmicroscopy (TEM).
Isolation of gold nanotriangles from other nanostructures wasaccomplished by differential centrifugation.
2. Materials and methods
Fungal biomass was grown in a specially prepared liquid culturemedium (composition given in Table 1). The inoculated broth wasmaintained at 30 �C under constant agitation at 150 rpm in an orbi-tal shaker cum incubator for 3 days. It was then filtered throughWhatman No. 1 filter paper. The residue was washed thoroughlywith sterile deionized water to remove any adhering media compo-nents and the excess water was blotted using paper towels. Fivegrams of the material was then suspended in 50 ml of deionizedwater and again incubated under the same conditions for 3 days.The suspension was filtered through Whatman No. 1 filter paper.The filtrate was then centrifuged at 11,000 rpm for 20 min to pelletdown any colloidal suspension. The supernatant was finally filteredunder vacuum through Millipore (pore size 0.22 lm) filter paper.45 ml of sterilized filtrate was then added to 5 ml of 10 mM chloro-auric acid (HAuCl4). Progress and completion of reaction were mon-itored continuously using UV–Vis spectrometry. Powder obtainedby drying an aliquot of the solution was calcined at �200 �C andused for XRD measurements. It may be noted that the reactioncould be easily scaled up to an initial inventory of as high as500 ml of extract without affecting the yield of nanoparticles.
UV–Vis spectra were recorded on a JASCO double-beam UV–Visspectrophotometer model V-530. XRD measurements were donewith Cu Ka radiation on a Philips X’pert Pro XRD unit operatedat 20 kV and 30 mA. Transmission electron micrographs wererecorded on a carbon-coated copper grid using JEOL 2000 FXmachine operated at 200 keV.
3. Results and discussion
Formation of gold nanoparticles is apparent from the gradualchange in colour of the incubated solution from pale yellow to darkpurple. In contrast, colour of the control remained practically un-changed during the entire incubation period (Fig. 1). Fig. 2 showsa series of UV–Vis spectra of the solution recorded at room temper-ature at intervals of 24 h. All the spectra (except that recorded at0 h) exhibit an intense peak at �570 nm corresponding to the sur-face plasmon band of nanocrystalline gold particles1 that increasesin intensity with time due to progressive bio-reduction of HAuCl4
to gold by the cell-free extract. The dipole plasmon band systemat-ically shifts towards lower wavelength and also grows sharperwith increasing incubation time. This systematic blue shift of theplasmon band and gradual decrease in its full width at half maxi-mum (FWHM) are attributed to the formation of either nanoparti-cle-aggregates, or anisotropic particles whose aspect ratioincreases with time, or a combination of both [1,4,6]. However,quadrupole and higher order plasmon modes specific to triangularnanoprisms were not observed in the UV–Vis spectrum of our
samples, except for a rising background leading to the NIR region.This is probably due to the preponderance of pseudosphericalnanoparticles or large distribution of shape and size of the aniso-tropic nanostructures in the solution [8]. Inserted in Fig. 2, is a plotof maximum absorbance (Amax) vs. hours of incubation, showing alinear time-dependent increase in its intensity. Assuming pseudozero order kinetics for the reaction, the rate constant has been esti-mated (from a linear fit to the data) to be 6.9 � 10�4/h. Slow kinet-ics of the reaction and in general of biological processes mightimpose a bottleneck to their up-scalability but is instrumental inproducing metastable phases having exotic morphologies whichwere otherwise difficult to realize. A representative transmissionelectron microscopy (TEM) image of a drop cast sample (Fig. 3)shows a large number of pseudospherical nanoparticles of uniformdiameter along with nanoprisms of different shapes and sizes. Fre-quency distribution of pseudospherical particles (inset Fig. 3)clearly shows that more than 60% of them have a diameter of lessthan 15 nm with r = 0.5 nm. Careful observations reveal that threeor more pseudospherical particles fused together to form nanop-risms (see encircled part in Fig. 3), nanotriangles being the mostpredominant morphology amongst them. The selected-area elec-tron diffraction (SAED) pattern (inset in Fig. 3) shows intermittentbright dots, indicating that the sample is highly nanocrystalline innature. The dots are attributed respectively to Bragg diffractionfrom {111}, {311}, {331}, {200}, {400}, {222} and {220} planesof face-centred cubic (FCC) lattice of gold nanoparticles. An addi-tional set of relatively weak spots (shown by red circles) corre-sponding to diffraction from 1=3{422} and {110} lattice planes arealso observed. Reflection from {110} planes is usually absent in aFCC lattice due to structural factors. However, it appears in an or-dered crystal having a super lattice structure (as in the case of ourgold nanoparticles). Higher order reflection from 1=3{422} planes isdetected primarily due to high intensity of the electron beam andcontribution from atomically flat surface of the gold nanotrian-gles4, which is also evidenced from roughness measurements doneon an isolated flat triangle (see Fig. 6). Due to smaller population oftriangular prisms, the spots appear rather faintly in the SAED pat-tern. From d-spacings of different lattice planes, cubic cell param-eter (a) and volume (v) have been approximately calculated (usinga refinement program Powderex) to be a = 4.0936 ± 0.0337 Å,v = 68.60 ± 0.98 Å3. The values within the error limit of SAED anal-ysis is in good agreement with that reported in the JCPDS database(No. 04-0784). X-ray diffraction measurements on the samples cor-roborate the observation from selective area electron diffraction.Fig. 4 depicts the powder XRD pattern recorded in the 2h range35–70� of a typical gold nanoparticle sample drop-casted on siliconsubstrate and calcined at �400 �C to remove the crystalline organicphase in the sample that partly overshadowed the weak featuresarising from as-grown sample. Peaks at �38.2�, 44.4� and 64.7�are observed. They are attributed to diffraction from (111),(200) and (220) planes of gold with FCC lattice (JCPDS No. 04-0784). Broadening of the XRD peaks clearly indicates that the par-ticles are in the nanometre regime. Crystallite size of the goldnanoparticles was calculated to be �28.8 nm from FWHM of the(111) peak using Scherrer equation. It may be noted that the value
Table 1Composition of liquid culture medium for fungal growth.
Constituents of culture Amount (g/l)
K2HPO4 2KH2PO4 7MgSO4 0.1(NH4)2SO4 1.0Dextrose 10Yeast extract 0.6
Fig. 1. Digital photographs of gold nanoparticle sol and the control.
P. Mukherjee et al. / Journal of Colloid and Interface Science 367 (2012) 148–152 149

Author's personal copy
is significantly higher than that obtained from TEM micrographsrecorded on the as-grown sample. The discrepancy may be readilyexplained on the basis of rapid grain growth at high calcinationtemperature. Further, Scherrer equation which is strictly valid forspherical nanoparticles provides a weighted average of crystallitesize in a sample containing particles with different morphologyand size.
3.1. Crystal growth and evolution of morphology
Crystal growth leading to evolution of morphology (frompseudospherical particles to prismatic nanostructures) was studiedby transmission electron microscopy of individual crystallites andis given in Fig. 5 as a collage of TEM images. It is noteworthy that
the transformation of morphologies took place at room tempera-ture. As discussed earlier, pseudospherical particles (�15 nm indiameter) first fused to form nanotriangles [see box (i)]. Gradually,the nanotriangles (edge length �30 nm) grew in size either as a re-sult of the merger of multiple nanotriangles or by overgrowth ofnucleation sites [see box (ii) and (iii)]. The bigger triangles (edgelength �100 nm), in turn, combined to form different types ofnanoprisms. Stacks of aligned triangles with one or more truncatededges [box (iv)], hexagonal prisms [box (vi)], a combination trian-gles and hexagons or fractals [box (v) and (vi)] are some of the exo-tic structures observed. It may be stressed here that bio-chemicalprocesses may not be controlled precisely. Hence exclusive synthe-sis of any of these structures may not be achieved by this tech-nique. However, it is possible to isolate the desired products
Fig. 2. UV–Vis absorption spectra of the gold nanoparticle sol recorded as a function of time. Inset: plot of Amax vs. incubation time exhibiting slow kinetics of the reaction.
Fig. 3. TEM image of the gold nanoparticle sol. Inset: (a) SAED pattern of the sample and (b) frequency distribution of pseudospherical nanoparticles.
150 P. Mukherjee et al. / Journal of Colloid and Interface Science 367 (2012) 148–152

Author's personal copy
from the reacting masses by differential centrifugation asdiscussed subsequently. Micro-diffraction pattern recorded on asingle crystal is given in box (vii) of Fig. 5. Intense spots due toreflection from the 1/3{422}, {200}, {220}, {311}, {331} and{400} planes of cubic FCC gold lattice are clearly observed. Butreflection from the (111) planes that appears as the strongest X-ray line (see Fig. 4) is not observed in the l-diffraction pattern ofthe crystal. This indicates that the crystal is highly oriented along[111] with triangular top lying parallel to the incident electronbeam as schematically represented in the inset of Fig. 5. Largestructural anisotropy of these nanocrystals should have substantialeffect on the optical properties of the samples, including lightabsorption, scattering and surface enhanced resonance Raman
spectroscopy (SERS). To, the best of our knowledge, it is firstdetailed study based on TEM sequel on fungus mediated biologi-cally synthesized samples, demonstrating clearly in a schematicform step by step formation of triangular gold particles from theaggregation of smaller spherical nanoparticles building blocks.Additionally formation of superstructures (from analysis of SAEDpatterns) and higher order morphologies (see TEM images) byfusion of triangles are also reported.
Fig. 4. XRD pattern of a sample drop-casted on silicon single crystal and calcined at�400 �C.
Fig. 5. TEM studies on the evolution of morphologies.
Fig. 6. AFM topography of the sample obtained by differential centrifugation atlower rotor speed and drop-casted on polished silicon single crystal. Inset: (a) 3Dimage of a single particle exhibiting heart-shaped contour of a triangular nanoprismand (b) surface profile plot on an optically flat nanoprism showing its vertical andlateral dimensions.
P. Mukherjee et al. / Journal of Colloid and Interface Science 367 (2012) 148–152 151

Author's personal copy
To increase the concentration of triangular prisms in the goldsol it was subjected to differential centrifugation. Speed of therotor was optimized at 5000 and 8000 rpm respectively. The frac-tion collected at lower speed contained higher amount of prisms,while that obtained at higher speed contained a mixture of nano-spheres and aggregates. Fig. 6 shows AFM topography of the sam-ple obtained by differential centrifugation at lower rotor speed anddrop-casted on polished silicon single crystal. Care has been takento scan an area where there is an excess of triangular structures.From AFM topography (Fig. 6) and frequency distribution bar chart(Fig. 7), it is evident that the nanotriangles exhibit significantlynarrow distribution of width and height as compared previous re-ports. Insert (a) in the Fig. 6 shows the 3D image of a single particlezoomed up, showing a smooth heart-shaped contour of a triangu-lar nanoprism with truncated and rounded vertices. Surface profileplot on a typical particle shows that the particle height is �12 nmand the edge length is �130 nm. Strikingly, RMS roughness of theparticle top surface is almost similar to that of the bare polishedsilicon substrate (marked by vertical arrows) indicating opticalflatness of the nanotriangles, in corroboration with the findingsfrom SAED measurements and earlier reports.
4. Conclusions
Green synthesis of uniform pseudospherical gold nanoparticlesand optically flat triangular nanoprisms has been demonstratedusing cell-free extract from a non-pathogenic and commerciallyviable bio-control agent for the reduction of HAuCl4. The synthesisrequires no additional capping or stabilizing agents and takes placeat room temperature. The pseudospherical particles got fused atroom temperature to produce different exotic structures includingtriangular nanoprisms. Slow kinetics of the fungus mediated bio-logical processes is believed to be responsible for displaying widespectrum of exotic morphologies over and above to those reportedtill date. Isolation of gold nanotriangles from the reacting masseswas achieved by differential centrifugation. Large structuralanisotropy of the triangular nanocrystals should have substantialeffect on the optical properties of the samples, including lightabsorption, scattering and surface enhanced resonance Ramanspectroscopy.
References
[1] T. Vossmeyer, B. Guse, I. Besnard, R.E. Bauer, K. Müllen, A. Yasuda, Adv. Mater.14 (2002) 238.
[2] L.R. Hirsch, R.J. Stafford, J.A. Bankson, S.R. Sershen, B. Rivera, R.E. Price, J.D.Hazle, N.J. Halas, J.L. West, Proc. Natl. Acad. Sci. USA 100 (2003) 13549.
[3] S.S. Shankar, A. Rai, B. Ankamwar, A. Singh, A. Ahmad, M. Sastry, Nat. Mater. 3(2004) 482.
[4] S.A. Maier, M.L. Brongersma, P.G. Kik, S. Meltzer, A.A.G. Requicha, H.A. Atwater,Adv. Mater. 13 (2001) 1501.
[5] S.P. Chandran, M. Chaudhary, R. Pasricha, A. Ahmad, M. Sastry, Biotechnol.Prog. 22 (2006) 577.
[6] S.S. Shankar, A. Rai, A. Ahmad, M. Sastry, Chem. Mater. 17 (2005) 566.[7] K.L. Shuford, M.A. Ratner, G.C. Schatz, J. Chem. Phys. 123 (2005) 114713.[8] J.E. Millstone, S.J. Hurst, G.S. Métraux, J.I. Cutler, C.A. Mirkin, Small 5 (2009)
646.[9] N.R. Jana, L. Gearheart, C.J. Murphy, J. Phys. Chem. B 105 (2001) 4065.
[10] K.K. Caswell, C.M. Bender, C.J. Murphy, Nano Lett. 3 (2003) 667.[11] C.J. Murphy, A.M. Gole, S.E. Hunyadi, C.J. Orendorff, Inorg. Chem. 45 (2006)
7544.[12] B. Nikoobakht, M.A. El-Sayed, Chem. Mater. 15 (2003) 1957.[13] J. Pérez-Juste, I. Pastoriza-Santos, L.M. Liz-Marzán, P. Mulvaney, Coord. Chem.
Rev. 249 (2005) 1870.[14] M. Liu, P. Guyot-Sionnest, J. Phys. Chem. B 109 (2005) 22192.[15] C.S. Ah, Y.J. Yun, H.J. Park, W.J. Kim, D.H. Ha, W.S. Yun, Chem. Mater. 17 (2005)
5558.[16] S. Chen, D.L. Carroll, Nano Lett. 2 (2002) 1003.[17] R. Jin, Y. Cao, C.A. Mirkin, K.L. Kelly, G.C. Schatz, J.G. Zheng, Science 294 (2001)
1901.[18] J.E. Millstone, S. Park, K.L. Shuford, L. Qin, G.C. Schatz, C.A. Mirkin, J. Am. Chem.
Soc. 127 (2005) 5312.[19] S. Chen, D.L. Carroll, J. Phys. Chem. B 108 (2004) 5500.[20] D. Yu, V.W.W. Yam, J. Am. Chem. Soc. 126 (2004) 13200.[21] B. Wiley, T. Herricks, Y. Sun, Y. Xia, Nano Lett. 4 (2004) 1733.[22] T.K. Sau, C.J. Murphy, J. Am. Chem. Soc. 126 (2004) 8648.[23] R. Jin, S. Egusa, N.F. Scherer, J. Am. Chem. Soc. 126 (2004) 9900.[24] S.H. Im, Y.T. Lee, B. Wiley, Y. Xia, Angew. Chem., Int. Ed 44 (2005) 2154.[25] C. Wang, T. Wang, Z. Ma, Z. Su, Nanotechnology 16 (2005) 2555.[26] G.S. Métraux, Y.C. Cao, R. Jin, C.A. Mirkin, Nano Lett. 3 (2003) 519.[27] T. Cassagneau, F. Caruso, Adv. Mater. 14 (2002).[28] T.J. Norman Jr., C.D. Grant, A.M. Schwartzberg, J.Z. Zhang, Opt. Mater. 27 (2005)
1197.[29] B. Liu, J. Xie, J.Y. Lee, Y.P. Ting, J. Paul Chen, J. Phys. Chem. B 109 (2005) 15256.[30] S. Shiv Shankar, S. Bhargava, M. Sastry, J. Nanosci. Nanotechnol. 5 (2005) 1721.[31] P. Mukherjee, M. Roy, B.P. Mandal, G.K. Dey, P.K. Mukherjee, J. Ghatak, A.K.
Tyagi, S.P. Kale, Nanotechnology 19 (2008).[32] L.V. Kolombet, M.S. Sokolov, V.P. Chuprina, D.A. Schisler, G.J. Samuels, in: 8th
Int. Workshop on Trichoderma and Gliocladium, ‘Trichoderma and theEnvironment’, 2004, p. 394.
Fig. 7. Size distribution of nanotriangles from AFM topography.
152 P. Mukherjee et al. / Journal of Colloid and Interface Science 367 (2012) 148–152

Biomimetic synthesis of nanocrystalline silver sol using cysteine: stabilityaspects and antibacterial activities{
Mainak Roy,a Poulomi Mukherjee,b Balaji P. Mandal,a Rajendra K. Sharma,c Avesh K. Tyagia and
Sharad P. Kale*b
Received 23rd September 2011, Accepted 10th May 2012
DOI: 10.1039/c2ra00785a
The study reports the development of a simple, environmentally benign green chemical route to
produce stable silver nanoparticle (Ag-np) sols with excellent antibacterial properties under ambient
conditions. The method involves the room temperature reduction of AgNO3 by cysteine (aq) and
requires no additional capping/stabilizing agent. It essentially mimics the redox reaction that takes
place during incubation of the cell-free extract from Trichoderma asperellum in the presence of
AgNO3 (aq) (P. Mukherjee, M. Roy, B. P. Mandal, G. K. Dey, P. K. Mukherjee, J. Ghatak, A. K.
Tyagi and S. P. Kale, Nanotechnology, 2008, 19, 075103), wherein cysteine, a biomolecule present in
the fungal extract, acts as a potential reducing agent. Additionally, cysteine acts as a capping molecule
in the present case. Formation of Ag-nps was evidenced from UV-Vis, TEM, XRD and EDS studies.
The stability of Ag sols has been shown to depend strongly on the concentration of cysteine relative to
that of AgNO3. Sols obtained by reacting 0.1 mM of cysteine with 1 mM of AgNO3 remained stable
for more than one month at 24 uC. The role of cysteine as capping molecule and the possible modes of
its linkages with Ag-nps was studied by FT-IR, XPS and Raman spectroscopy. Bonding of Ag with
either or all the three, thiolate, amino and carboxylate groups of the cysteine molecule via stable PH
configuration is believed to have resulted in the stabilization of the Ag-nps. Antibacterial activity of
the cysteine capped Ag sol was studied along with that of the Ag sol obtained by fungal route. Both
the sols exhibited excellent and comparable efficacies as bactericidal agents against gram negative
bacteria E. coli BW (25113), with one of the lowest minimum inhibitory concentration (MIC) and
minimum bactericidal concentration (MBC) values published so far.
1. Introduction
Nanocrystalline silver sols are potential antibacterial agents.
Growth of ampicillin-resistant E. coli and multi-drug resistant
strains of S. typhi is inhibited using 25 mg ml21 or higher
concentrations of silver nanoparticles.1 Apart from therapeutic
applications, nanocrystalline silver particles are used as probes
for high-sensitivity bio-molecular detection,2 in catalysis3 and in
micro-electronics.4
The large scale chemical synthesis of silver sols is carried out
using toxic reagents, surfactants for capping and organic
solvents.4–6 These chemicals are extremely difficult to degrade
and dispose at industrial scales and hence, might be potential
hazards to the environment. Moreover, chemically synthesized
silver sols are not suitable for in vivo bio-medical applications
since the accompanying foreign entities are highly incompatible
with biological systems and/or might even induce thrombosis or
precipitate antigenic/allergic reactions in them. In view of serious
limitations of the chemically synthesized metal sols, there has
been a recent upsurge of interest in synthesizing metal nano-
particles through environmentally benign biochemical routes,
wherein non-hazardous aqueous solvents are used at biological
pH and ambient temperatures.7,8 Both intra and extra cellular
syntheses of metal nanoparticles using different pathogenic
strains have been reported.7,8 We have recently synthesized
extremely stable (stability over 1 year in darkness) silver sols
using a cell-free extract of a non-pathogenic bio-control agent T.
asperellum under ambient conditions.9 In the present manuscript,
these biologically synthesized silver nanoparticles have been
shown to exhibit excellent antibacterial efficacy against Gram
negative wild type E. coli BW (25113).
However, the biological processes are in general slower
compared to chemical routes and the product yield is also
comparatively lower. Moreover, they involve series of compli-
cated steps such as sterilization, filtration, preparation of culture
medium, and maintenance of culture through different gene-
rations etc. These make biological routes of synthesizing
aBhabha Atomic Research Centre - Chemistry Division, Mumbai,Maharashtra, IndiabBhabha Atomic Research Centre - Nuclear Agriculture and BiotechnologyDivision, Mumbai, Maharashtra, IndiacBhabha Atomic Research Centre - Technical Physics Division, Mumbai,Maharashtra, India{ Electronic supplementary information (ESI) available. See DOI:10.1039/c2ra00785a
RSC Advances Dynamic Article Links
Cite this: RSC Advances, 2012, 2, 6496–6503
www.rsc.org/advances PAPER
6496 | RSC Adv., 2012, 2, 6496–6503 This journal is � The Royal Society of Chemistry 2012
Publ
ishe
d on
19
June
201
2. D
ownl
oade
d on
20/
03/2
014
11:2
9:53
. View Article Online / Journal Homepage / Table of Contents for this issue

nanoparticles commercially less attractive despite its tremendous
potential.
Alternately, the active components of the biological systems
may be identified, isolated and/or synthesized separately and
made to react under normal laboratory conditions to get the
desired products. Such an approach may or may not necessarily
work, since it does not take into account synergistic effects of
other bio-components not directly participating in the key
reaction(s). For rest of the cases it is expected to enhance
productivity and also increase the reaction kinetics.
We had previously reported9 that ‘cysteine’, present in the cell-
free extract of T. asperellum, possibly reduced AgNO3 to form
Ag-nps. If it could have stabilized the Ag-nps as well, then
cysteine alone might potentially serve as a substitute for the
fungal extract in our Green recipe. This hypothesis was tested in
the present study. An aqueous solution of cysteine (a common
laboratory bio-chemical) was allowed to react with AgNO3 at
room temperature to produce Ag-nps in a hassle-free, biomi-
metic approach. Relative concentration of cysteine to that of
AgNO3 was varied to optimise the reaction kinetics and a stable
silver sol was obtained for [cysteine]/[Ag] = 0.1. No additional
protective coating and/or capping agents were used to stabilize
the system. The stability of the silver sols as a function of relative
concentration of cysteine was investigated and the role of
cysteine as a capping agent was established. The mode of
stabilization of the Ag-nps by cysteine was investigated by
different spectroscopic techniques that indicated the possible
bonding of silver with either or all three groups of cysteine,
thiolate, amino and carboxylate.
It would be of further interest if the cysteine capped
nanoparticles produced under optimized conditions would
exhibit morphology, particle size and properties similar to the
biologically synthesized nanoparticles. To verify this, the
antibacterial activity of the cysteine capped Ag sol was studied
and its efficacy against Gram negative bacteria E. coli BW
(25113) was compared to that of the biologically synthesized
nanoparticles. Exceedingly low values of MIC and MBC were
registered for both the systems.
2. Experimental
Synthesis of Ag-nps
Stock solution of 10 mM cysteine was prepared by dissolving
121.1 mg of cysteine (purchased from Sigma) in 100 ml of de-
ionized (DI) water. Similarly, a stock solution of 10 mM AgNO3
(from Aldrich) was also prepared by dissolving 169.87 mg of
AgNO3 in 100 ml DI water. The two stock solutions were mixed
very slowly at room temperature (y24 uC) in varying propor-
tions and samples containing the desired starting concentration
of each component were obtained. Table 1 gives the concentra-
tions of cysteine and AgNO3 in the four samples studied,
hereafter designated as samples A, B, C and D. Aqueous
solutions of the individual reagents were also studied as control.
The samples were left (covered with Al foil) at room temperature
(y24 uC) for a few days under observation. The observation for
different samples is given in Table 1. Only sample C was found to
be stable and was characterized extensively. The other samples
were also studied to find out the possible effects of the relative
concentration of cysteine on the nature of Ag-nps produced.
They have been discussed separately at the end of the manu-
script. Silver sols were prepared via the fungal route following
the procedure reported earlier.
Antibacterial studies
Wild type E. coli BW (25113) was cultured in a fresh medium (Luria
broth) and was allowed to grow overnight. Under these conditions,
the cell density was found to be of the order of 109 ml21. Fifty
micro-litres of the culture containing y5 6 108 cfu ml21 was added
to 5 ml of fresh culture medium supplemented with various dose of
Ag-nps ranging from 1.08 mg ml21 to 8.64 mg ml21. The
antibacterial activity of both cysteine-capped and biologically
grown silver nanoparticles was then studied as a function of silver
dosage. Two sets of control, one without the Ag sols but with the
same quantity of inoculum, and the other with similar concentra-
tions of the Ag sols but with no added inoculum were
simultaneously maintained. All studies were done in triplicates.
Care was taken to let the aerobic environment develop within the
snap cap tubes. Overnight incubation of all the tubes was carried
out at 37 uC in an orbital shaker at 150 rpm. The samples were
analysed after overnight incubation for visual monitoring of
turbidity and the MIC values for the respective samples were
determined. Appropriate serial dilution of the tubes was done and
bacteria in the diluted solution were seeded in Luria agar containing
plates. The plates were incubated at 37 uC for 18 h and the number
of resultant colonies in each plate was counted and recorded for
further analysis. A similar study on the antibacterial property of
cysteine capped Ag-nps was carried out by measuring the change in
optical density at 600 nm as a function of nano-silver concentration
in the bacteria inoculated tubes. Further, antibacterial activity of
the cysteine capped Ag sol against different bacterial strains was
investigated and MIC values for the respective bacteria, were
ascertained by visual inspection of the turbidity.
Instrumentation
UV-Vis spectra were recorded on JASCO spectrophotometer
(model: V-530) with fresh aliquots. TEM images were recorded
on carbon coated copper grids using a Zeiss LIBRA microscope
operated at 120 kV. XRD measurements were done on an X-ray
diffractometer with a monochromatized Cu-Ka X-ray source
operated at 20 kV and 30 mA. FTIR spectra of solid samples
obtained by centrifugation were recorded using a diamond ATR
Table 1 Composition of the samples
Samples [Cysteine] (mM) [AgNO3] (mM) Observation
A 0.001 1 Very fine precipitation after 2 days, transparent supernatantB 0.01 1 Brownish grey precipitation after 2 days, transparent supernatantC 0.1 1 Yellow sols, colour deepens in 2 days remains stable for more than 1 monthD 1 1 Instant flocculation followed by precipitation
This journal is � The Royal Society of Chemistry 2012 RSC Adv., 2012, 2, 6496–6503 | 6497
Publ
ishe
d on
19
June
201
2. D
ownl
oade
d on
20/
03/2
014
11:2
9:53
. View Article Online

holder on a Shimadzu Affinity 1 spectrophotometer with air as
reference. Dynamic light scattering and zeta potential measure-
ments were carried out on Malvern Zeta Sizer Nano-ZS.
Raman spectra were recorded using an indigenously developed
confocal micro-Raman setup configured around a Horiba Jobin
Yvon spectrograph. 532 nm of frequency doubled diode
pumped solid state Nd: YAG laser source was used for
excitation. X-ray photoelectron spectra were obtained on a
VG Scienta made spectrometer provided with single channel-
tron detector with a resolution of , 1 eV, using Mg-Ka
radiation of SPECS make XR 50 twin X-ray source. The base
pressure of the experimental chamber was , 1028 mbar during
the measurement. All the XPS spectra were corrected for any
possible instrumental shift by referencing against the standard
C1s peak (@285 eV).
3. Results and discussion
Fig. 1 shows the UV-Vis spectrum of sample C after ageing for
13 days. It exhibits an asymmetric peak at y398 nm
corresponding to the surface plasmon frequency of nanocrystal-
line silver,10 clearly indicating that cysteine (aq) had reduced
AgNO3 to metallic silver. An additional hump at y280 nm is
attributed to the [cysteine-Ag+]n complexes11 that are also
formed along with Ag-nps. The observation is in agreement
with that of our previous report on Ag-nps synthesized by a
fungal route.9 Inset of Fig. 1 shows the EDS spectrum of the
same sample. Apart from that of silver, peaks due to carbon,
nitrogen, sulphur and oxygen are also observed that arise from
the capping of Ag-nps by the cysteine molecules.
The kinetics of the reaction were studied by drawing aliquots
at regular intervals and recording the UV-vis spectra of the sol.
The relative % yield of Ag-nps at a given time t was calculated
according to the equation given below:
% yield = (At/Af) 6 100 (i)
where At and Af respectively denotes the absorbance of the sol
at time t and after saturation. Fig. 2 shows the time dependent
yield of Ag-nps for the sample C. The inset in Fig. 2 shows the
corresponding change in absorbance at y398 nm with time.
During the first 2–3 days, the reaction rate was quite slow which
marked a phase of induction. Thereafter it increased gradually
with time, indicating the growth phase. Finally after 12 days, no
visible change with time of the plasmon band intensity of the
sample could be observed which is also reflected in the saturation
of the % yield vs. time curve. After 1 month, the plasmon band
intensity started decreasing with ensuing visible precipitation.
However, it may be noted that the time dependent absorbance
studies provided only relative estimate of the yield, assuming it to
be 100% at saturation.
The absolute yield was estimated to be y93% from the total
Ag analysis of the spent solution (obtained by decantation) by
atomic absorption spectroscopy (AAS). The nanoparticles
obtained after removal of the spent solution were washed several
times with DI water and acetone and dried at room temperature.
Estimation of the nanoparticles yield was carried out by
gravimetry. An average value of 78.1% was obtained from four
independent runs. The washings were not included for AAS
analysis to avoid dilution error. Hence, estimation by AAS
provided an upper limit of the yield value due to the possibility
that initially a small amount of unreacted Ag salt might have
remained adsorbed on the nanoparticle surface. Conversely,
gravimetry provided a lower limit of the yield value due to the
unavoidable loss of nanoparticles during repeated washings.
Fig. 3 (a) shows a representative TEM image of the sample C.
The dark contrasts are due to the Ag-nps. Particles with a
narrow size distribution ranging between 8–18 nm and a mean
value of 14.5 nm [as shown by bar diagram in Fig. 3 (b)] are
observed. The average particle size for sample C, as estimated
from the TEM image analysis is very much similar to that
obtained for silver nanoparticles synthesized by the biological
route.9 The lighter contrasts are attributed to the organic
capping moieties attached with the metal nanoparticles. This is
clearly illustrated in Fig. 3 (c). The hydrodynamic diameter of
the capped nanoparticles comprises of metal crystals together
with the organic moieties (indicated with a black circle) and is
often estimated as the effective particle size by light scatteringFig. 1 UV-Visible spectrum of sample C after ageing for 13 days. Inset:
EDS spectrum of the same sample.
Fig. 2 Percentage yield vs. time curve exhibiting different phases of
nanoparticle synthesis by cysteine. Inset: Variation in absorbance at
y398 nm with time of incubation for the sample C.
6498 | RSC Adv., 2012, 2, 6496–6503 This journal is � The Royal Society of Chemistry 2012
Publ
ishe
d on
19
June
201
2. D
ownl
oade
d on
20/
03/2
014
11:2
9:53
. View Article Online

techniques. Fig. S1 in the ESI{ shows the distribution of
hydrodynamic diameters of the nanoparticles in sample C,
statistical analysis on the same provides a mean value of 113 nm.
Fig. 4 shows the XRD pattern recorded in the 2h range 20u–70u of sample C after attaining saturation, drop cast on a glass
slide. The sample was further heated to remove organic moieties
present in the sample. The capping molecules form an
amorphous network around the metal nanoparticles [see
Fig. 3(c)] and obscure the small XRD peaks of Ag at higher 2h
values. The diffraction pattern exhibits peaks at y38.1u, 44.2uand 64.4u attributed respectively to diffraction from (111), (200)
and (220) planes of metallic silver with FCC lattice (JCPDS No.
04-0783). From broadening of the principal XRD peak at
y38.1u of an as-grown sample (shown in the inset), the average
crystallite size has been estimated using Scherrer equation to be
y14.4 nm. The value is in excellent agreement with that
obtained from the TEM analysis.
Antibacterial activity
The antibacterial activity of Ag-np sols was studied using the
model organism E.coli BW25113. Fig. 5 shows a log-normal plot
of surviving bacterial colonies of E.coli relative to that of the
control vs. dose of Ag nanoparticles, synthesized (a) via the
fungal route9 and (b) using cysteine. In either case, the cell
numbers dropped steadily with the increasing dosage of silver
nanoparticles. Similar trends were also obtained from the
decreasing saturation-OD values by spectrophotometry (see
ESI{). MIC and MBC values were estimated for both the
samples and have been pointed out on the respective graphs.
Since the MBC values for either case falls within four times of
their respective MIC values, both may be classically termed as
bactericidal agents according to the definition given in ref. 12.
The insert in Fig. 5 shows how a typical culture and control
looks like after administration of different dosage of Ag
nanoparticles. In both cases, the MIC and MBC values are
significantly lower than those published in earlier reports,9,13,14
confirming the efficacy of the silver nanoparticles synthesized by
these techniques. The higher antibacterial activity of cysteine
capped and fungus-synthesized Ag-nps was possibly due to the
contribution of capping agents of biological origin that played a
synergistic role in the activity. This observation is in agreement
with the reports by Parashar et al. on Psidium guajava extract
capped Ag-nps.15 They demonstrated that silver nanoparticles
with organic capping agents were able to anchor to the bacterial
cell wall more effectively and in shorter time compared to
hydrazine reduced Ag nps.15
On a comparative note, MIC and MBC values of Ag-nps
synthesized via a fungal route are slightly lower by 1.08 mg ml21
than those of cysteine capped Ag-nps. The small difference in
antibacterial efficacies of the two systems is again attributed to
the difference in the nature of their capping molecules that
played a significant role. Therefore, we report an exceedingly
high bactericidal potency of Ag-nps synthesized by a novel
fungal route that employs a non-pathogenic bio-control agent T.
asperellum.9 We also report (almost) equally low MIC and MBC
Fig. 3 (a) TEM image of the sample C, (b) bar diagram showing a
narrow particle size distribution and (c) estimated hydrodynamic
diameter comprising of the nanoparticles and the organic caps.
Fig. 4 XRD pattern recorded in the 2h range 20u–70u of sample C drop
cast on a glass slide and heated to remove the organic moieties present in
the sample. Inset: Particle size estimation from XRD peak broadening of
an as-grown sample.
Fig. 5 Log-normal plot of surviving bacterial colonies relative to that of
the control vs. dose of Ag nanoparticles synthesized (a) via a fungal route
and (b) using cysteine. Inset: Digital photograph of the controls and
culture supplemented with different dosage of Ag nanoparticles.
This journal is � The Royal Society of Chemistry 2012 RSC Adv., 2012, 2, 6496–6503 | 6499
Publ
ishe
d on
19
June
201
2. D
ownl
oade
d on
20/
03/2
014
11:2
9:53
. View Article Online

values for cysteine stabilized nano-silver particles prepared by a
hassle-free bio-mimetic chemical route.
Studies on other bacteria
The growth inhibitory effect of cysteine capped Ag-nps was tested
against different bacteria, namely Klebsiella, Pseudomonas, and a
Gram positive organism Staphylococcus. The growth response of
each of these organisms against different doses of Ag sol in terms
of the appearance of turbidity upon overnight incubation at 37 uC,
was noted. MIC values were estimated by visual inspection of
turbidity and were used as an index for comparing the
antibacterial efficacy of Ag-nps against these pathogenic strains.
Fig. 6 shows the MIC values obtained against the different
bacteria. The highest MIC was obtained against Staphylococcus.
This observation may be explained on the basis of thicker
peptidoglycan layer on the cell wall of Gram positive bacteria16
which provided protection and resistance against nanoparticle
mediated toxicity as compared to their Gram negative counter-
parts like E. coli.
Effect of metal : cysteine ratio on the stability of Ag sols. It has
been observed that stability and dispersibility of the silver sols
depends strongly on the relative concentration of cysteine and
AgNO3. The sol obtained by reacting 0.1 mM of cysteine with
1 mM AgNO3 remained stable for more than a month. When
[cysteine]/[Ag] was increased from 0.1 to 1 in the case of sample
D, flocculation started almost instantaneously and silver
particles precipitated within a short time. On the other hand,
the reduction of cysteine concentration from 0.1 mM to 0.01 mM
(sample B) and 0.001 mM (sample A) also decreased the stability
of the metal sols. After remaining stable for y2 days,
precipitation of brownish gray particles started in sample B that
continued for l week. In contrast, very fine particulates were
observed for sample A. Fig. S2 in the ESI{ shows the UV-vis
spectra of samples A and B recorded after ageing. Although both
the spectra exhibit the typical silver plasmon peak at y400 nm
due to the formation of Ag-nps, the low absorbance values are
indicative of a small amount of the dispersed phase in the sols.
The hump at y540 nm is due to agglomeration of particles.
Zeta potential serves as the stability index of a colloidal
solution. According to the DVLO theory on the stability of
colloids, the repulsive force between two colloidal particles
prevents them from coming closer and coagulating. This
repulsive force is proportional to the square of the zeta potential.
Hence, the higher the magnitude of zeta potential, the higher the
stability of the colloids. To understand how the stability of
cysteine capped Ag sols gets affected by relative concentration of
cysteine to AgNO3, zeta potential (f) and DLS measurements
were carried out on all 4 samples (before the onset of
precipitation for samples A, B and C and immediately after
mixing the reactants for sample D). The pH of the medium was
also recorded since it influenced the overall surface charge on the
nanoparticles. Table 2 summarizes the f values and the mean
effective particle sizes (hydrodynamic diameter) for the different
samples as estimated by DLS. Sample C exhibited the highest f
value of +18 mV and was most stable in the series. Moreover, the
mean DLS-estimated particle size of 110 nm in sample C was the
least among all the sols studied. The average particle size of
sample C estimated by light scattering is in good agreement with
that obtained from TEM image analysis (see Fig. S1, ESI{).
Other sols had f values ranging between 210 mV to 10 mV and
hence exhibited poor stability. It may be noted that the particle
size of sample A could not be recorded with adequate
reproducibility due to the very small concentration of Ag-nps
in the sol and fluctuations in the scattered light.
Bare silver nanoparticles dispersed in water are negatively
charged10 due to their micellar characteristics. Negative surface
charge on nanoparticles of samples A and B as adjudged from f
values hinted on the possibility of these particles being
inadequately capped. At low relative concentrations of cysteine,
not enough capping-molecules were available to stabilize the
silver nanoparticles. Moreover at pH range 5.1–5.7, close to IEP
of cysteine (pH = 5.02), low negative f values indicated
instability of the particles. With increasing concentration of
cysteine, the pH of the medium became more and more acidic
due to liberation of H+ according to the equation given below:
cysteine + 2AgNO3 cysteine (ox.) + 2Ag + 2HNO3 (ii)
The high positive f value of sample C probably resulted from
the protonation of amine groups in the adsorbed cysteine
molecules at pH 3.8. The net surface charge on capped
nanoparticles was adequate enough to prevent their further
growth and agglomeration, thereby resulting in extended
stability of the sol for more than 1 month. At a still higher
concentration of cysteine and at pH 3.2, sample D exhibited a
small positive f value indicating that the nanoparticles were still
capped by protonated cysteine but the stability of the sol was
greatly reduced. Due to rapid reduction of AgNO3 at higher
concentrations of the reducing agent (here it is cysteine), fewer
nucleation centres survived that rapidly grew in size and the
particles so formed coalesced into large lumps of material that
tend to settle down under gravity. Aggregation of silver
nanoparticles in sample D was reflected in its extremely low f
value. Similar observations have been reported independently by
different research groups for surfactant stabilized silver nano-
particles.5–8,10 Of the three sols with limited stability, sample D
was particularly interesting because it produced particles with
Fig. 6 Comparison of antibacterial activity of cysteine capped Ag-nps
against different pathogenic strains.
6500 | RSC Adv., 2012, 2, 6496–6503 This journal is � The Royal Society of Chemistry 2012
Publ
ishe
d on
19
June
201
2. D
ownl
oade
d on
20/
03/2
014
11:2
9:53
. View Article Online

completely different non-spherical morphology and exhibited a
significant shift in the plasmon peak position compared to the
others. Hence, it was studied in detail. Fig. 7 shows the SEM image
of prismatic agglomerates obtained from the precipitation of sample
D. The agglomerates exhibit morphology that is entirely different
from the pseudo-spherical nanoparticles of sample C (see TEM
image in Fig. 3). The principal plasmon band of sample D appears at
y354 nm [see inset (b) of Fig. 7]. The significant blue shift of the
band compared to the other sols has been attributed to non-
spherical silver nanoparticles.6–8,10–11,17 A small hump at y485 nm
is associated with extensive agglomeration of the crystallites17 that
resulted in larger particulates. Inset (a) in the figure shows the XRD
pattern of a heated sample D, with characteristic peaks of metallic
silver with a cubic lattice. Average crystallite size has been estimated
from the broadening of the 111 peak of the as-synthesized sample
using the Scherrer equation to be y17.5 nm.
Capping of Ag-nps by cysteine. In the absence of a third
chemical entity in the system, besides cysteine and AgNO3,
stabilization of the Ag-nps must have taken place due to their
capping by the cysteine molecules. Presence of organic moieties
along with the metal particles is evidenced from the EDS
spectrum (see inset of Fig. 1) and TEM image of sample C (see
Fig. 3). Capping of nanoparticles may take place either by
physisorption of the organic molecules on to the nanoparticle
surface or by chemically bonding with the same. To investigate
the possible mode of metal–organic interaction in cysteine-
capped Ag-nps, spectroscopic studies have been carried out on
solid samples. Fig. 8 shows the main core level XPS spectra of (a)
Ag3d, (b) O1s, (c) S2p and (d) N1s for the cysteine capped Ag-
nps. The S2p and N1s spectra were deconvoluted using freely
available software XPSPEAK4.1, after smoothing the raw data
with a FFT filter, while a single profile was adequate for both
Ag3d and O1s. The Ag3d peaks [Fig. 8 (a)] are observed at
366.7 eV with spin orbital splitting of 6 eV. The Ag0 peak is
reportedly observed at y368.2 eV.18 Significant red shift of the
binding energy for the cysteine capped samples clearly indicates
that there is a bonding interaction between the Ag-nps and the
capping cysteine molecules. The O1s peak [Fig. 8 (b)] is observed
at 529.3 eV which is also downshifted from its reported value for
free oxygen atoms, which indicates that bonding of cysteine with
Ag-nps possibly took place via carboxylate ions. [Fig. 8 (c)]
shows S2p peak along with its deconvoluted features. Two
components are observed at y162.2 and 163.1 eV. The peak at
y162.2 is tentatively assigned to the thiolate anions that
interacted with the metallic silver. The peak at higher binding
energy is possibly due to the thiolate anions that might have
interacted weakly with the neighbouring cationic amine groups
instead of the metal.19 N1s spectra exhibits two components
and have been attributed to the free amino groups (peak at
y400.3 eV) and those bonded to the metal surface (peak at
y399.6 eV).
Fig. 9 shows the Raman spectrum of sample C drop cast on a
silicon single crystal. Inset shows the same spectrum magnified in
the range 150–350 cm21. The spectrum exhibits peaks at y227,
250 and 260 cm21. The peaks at y227 and 250 cm21 have been
attributed to Ag–S and Ag–N stretching vibrations20 due to the
formation of covalent bonds between the Ag-nps and nitrogen
atom of the amino group and sulphur atom of the thiolate group.
Further evidence of metal cysteine bonding is derived from the
FTIR spectra recorded on solid nanoparticle samples obtained
Table 2 Stability assessment of silver sol. [AgNO3] = 1 mM, pH of de-ionized H2O = 6.1
[Cysteine] (mM) Zeta potential (mV) Mean effective particle size by DLS (nm) pH Stability of sol
0.001(A) 29.3 — 5.7 poor0.01(B) 210.6 270 5.1 poor0.1(C) 18.1 110 3.8 good1(D) 7.4 420 3.2 Quick precipitation
Fig. 7 SEM micrograph of the sample D. Inset (a): XRD pattern of the
heated and as-synthesized sample D, (b) UV-vis spectrum of the same
sample.
Fig. 8 XPS spectra of (a) Ag3d, (b) O1s, (c) S2p and (d) N1s for
cysteine capped Ag-nps along with the deconvoluted features.
This journal is � The Royal Society of Chemistry 2012 RSC Adv., 2012, 2, 6496–6503 | 6501
Publ
ishe
d on
19
June
201
2. D
ownl
oade
d on
20/
03/2
014
11:2
9:53
. View Article Online

after centrifugation. Fig. 10 shows the FTIR spectra of (a) pure
cysteine powder and (b) cysteine capped Ag-nps. The peak at
y2080 cm21 is assigned to N–H stretching vibrations of the
NH3+ group in the cysteine molecule and that at y2552 cm21 to
S–H vibration in the thiol group. The N–H stretching band of
the amino group shifts to the lower wavenumbers and the peak
due to S–H vibration almost vanishes for the nanoparticle
sample. Absence of the S–H band in the spectrum of the Ag-nps
may be attributed to the deprotonation of the thiol group in the
cysteine molecule that is the pre-requisite for the formation of
Ag–S bonding in the cysteine-capped Ag-nps. Moreover, peaks
due to C–S and COO2 stretching vibrations shift to the lower
wavenumbers and increase in intensity. The shift in the peak
positions and change in their intensity clearly suggests that there
exists a bonding interaction between the Ag-nps and either or all
the three S2, COO2 and NH3+ groups of the capping cysteine
molecules. Earlier, Mandal et.al.21 reported on the capping of
Ag-nps by cysteine molecules via thiolate linkages. Thakur
et al.22 discussed the possibility of all the three Ag–S, Ag–N and
Ag–O linkages at the same time. However, all these studies were
carried out in alkaline pH and strong reducing agents like
NaBH4 and Na2S were used to produce Ag-nps. In contrast,
cysteine has been used as the sole reducing and capping agent in
our method and Ag-nps were produced in mildly acidic pH in a
green chemical approach. Jing et al. extensively studied the
adsorption of L-cysteine molecules on gold and silver nanopar-
ticles by both surface enhanced resonance Raman spectroscopy
and DFT calculations.23 They showed that the interaction of Ag-
nps with L-cysteine, especially in the presence of NO32 takes
place primarily through carboxylate and amino groups.
However, a few molecules may exist in the PH and PN
conformations as well. Based on spectroscopic evidences and
input from the literature, it may be safely concluded that the
capping of Ag-nps by cysteine in our samples took place through
either or all the three thiolate, amino and carboxylate linkages
via PH conformation as shown in the insets of Fig. 10. The dual
role of cysteine both as a reducing and capping molecule in the
preparation of Ag-nps was thus firmly established.
4. Conclusions
The feasibility of synthesizing stable silver nanoparticles using
cysteine in a biomimetic approach has been amply demonstrated
in the manuscript. The dual role of cysteine as the reducing and
capping molecule has been established. Capping of the nano-
particles took place via covalent bonding of either or all the three
thiolate, amino and carboxylate groups of the cysteine molecule.
The silver sol produced by reacting 0.1 mM of cysteine with
1 mM of AgNO3 was stable for over 1 month. It exhibited
excellent antibacterial efficacy against a number of pathogens.
The MIC value registered against E.coli was one of the lowest
reported in the literature and was comparable with that of
Ag-nps obtained via fungal route. The particle sizes are also
comparable in the two cases, signifying that the products
synthesized by cysteine and obtained by the fungal route mimic
each other in terms of morphology and properties.
In spite of the aforementioned advantages of our bio-mimetic
approach over the conventional biological syntheses, the
maximum stability of the sol that could be synthesized using
cysteine was over 1 month as against over 1 year (in darkness)
for sols synthesized by T. asperellum.9 This underlines the
applicability and significance of biosynthesis, despite it being
elaborate and involved. Our immediate outlook is to find an
appropriate water soluble and bio compatible capping agent that
would stabilize silver nanoparticles for longer periods.
Acknowledgements
We graciously acknowledge the support rendered by K. K.
Pandey of High Pressure & Synchrotron Radiation Physics
Division in acquiring Raman spectra, Ms. Alka Gupta of
Molecular Biology Division for transmission electron micro-
scopy, K. K. Singh of Radiation and Photo-Chemistry Division
for taking FTIR measurements and Bhaskar Paul of Materials
Processing Division for EDS measurements. All the above
colleagues are from Bhabha Atomic Research Centre, Mumbai,
India.
Fig. 9 Raman spectrum of the sample C drop cast on silicon single
crystal. Inset: The same spectrum magnified in the range 150–350 cm21.
Fig. 10 FTIR spectra of (a) pure cysteine powder and (b) cysteine
capped Ag-nps. Insets: Magnified region of the spectra showing nC-S and
nCO22 vibrations.
6502 | RSC Adv., 2012, 2, 6496–6503 This journal is � The Royal Society of Chemistry 2012
Publ
ishe
d on
19
June
201
2. D
ownl
oade
d on
20/
03/2
014
11:2
9:53
. View Article Online

References
1 S. Shrivastava, T. Bera, A. Roy, G. Singh, P. Ramachandrarao andD. Dash, Nanotechnology, 2007, 18, 225103.
2 S. Schultz, D. R. Smith, J. J. Mock and D. A. Schultz, Proc. Natl.Acad. Sci. U. S. A., 2000, 97, 996–1001.
3 R. M. Crooks, M. Zhao, L. Sun, V. Chechik and L. K. Yeung, Acc.Chem. Res., 2001, 34, 181–190.
4 D. I. Gittins, D. Bethell, D. J. Schiffrin and R. J. Nichols, Nature,2000, 408, 67–69.
5 K. J. Lee, B. H. Jun, J. Choi, Y. I. Lee, J. Joung and Y. S. Oh,Nanotechnology, 2007, 18, 335601.
6 F.-K. Liu, F.-H. Ko, P.-W. Huang, C.-H. Wu and T.-C. Chu,J. Chromatogr., A, 2005, 1062, 139–145.
7 A. Ahmad, P. Mukherjee, S. Senapati, D. Mandal, M. I. Khan,R. Kumar and M. Sastry, Colloids Surf., B, 2003, 28, 313–318.
8 D. Mandal, M. E. Bolander, D. Mukhopadhyay, G. Sarkar andP. Mukherjee, Appl. Microbiol. Biotechnol., 2006, 69, 485–492.
9 P. Mukherjee, M. Roy, B. P. Mandal, G. K. Dey, P. K. Mukherjee,J. Ghatak, A. K. Tyagi and S. P. Kale, Nanotechnology, 2008, 19,075103.
10 W. Wang and B. Gu, in Concentrated Dispersions, AmericanChemical Society, Washington, DC, 2009, 1–14.
11 R. Mitric, J. Petersen, A. Kulesza, V. Bonacic-Koutecky, T. Tabarin,I. Compagnon, R. Antoine, M. Broyer and P. Dugourd, Chem. Phys.,2008, 343, 372–380.
12 G. L. French, J. Antimicrob. Chemother., 2006, 58, 1107–1117.13 I. Sondi and B. Salopek-Sondi, J. Colloid Interface Sci., 2004, 275,
177–182.14 P. Gong, H. Li, X. He, K. Wang, J. Hu, W. Tan, S. Zhang and X.
Yang, Nanotechnology, 2007, 18, 285604.15 U. K. Parashar, V. Kumar, T. Bera, P. S. Saxena, G. Nath, S. K.
Srivastava, R. Giri and A. Srivastava, Nanotechnology, 2011, 22, 415104.16 R. Y. Stanier, J. L. Ingraham, M. L. Wheelis and P. R. Painter,
General Microbiology, 5th Edn, chapter 6, p. 158.17 M. Popa, T. Pradell, D. Crespo and J. M. Calderon-Moreno, Colloids
Surf., A, 2007, 303, 184–190.18 G. Xue, Q. Dai and S. Jiang, J. Am. Chem. Soc., 1988, 110, 2393–2395.19 M. Furutani and K. Kudo, J. Mater. Chem., 2012, 22, 3139–3147.20 X. Shen, H. Liang, J. Guo, C. Song, Xi-W. He and Yu-Z. Yuan, J.
Inorg. Biochem., 2003, 95(2–3), 124–130.21 S. Mandal, A. Gole, N. Lala, R. Gonnade, V. Ganvir and M. Sastry,
Langmuir, 2001, 17, 6262–6268.22 P. Thakur, S. S. Joshi, S. Kapoor and T. Mukherjee, Langmuir, 2009,
25, 6377–6384.23 C. Jing and Y. Fang, Chem. Phys., 2007, 332, 27–32.
This journal is � The Royal Society of Chemistry 2012 RSC Adv., 2012, 2, 6496–6503 | 6503
Publ
ishe
d on
19
June
201
2. D
ownl
oade
d on
20/
03/2
014
11:2
9:53
. View Article Online