PUNJAB DEVELOPMENT REPORT - National Institute of ...
673
PUNJAB DEVELOPMENT REPORT PLANNING COMMISSION GOVERNMENT OF INDIA
-
Upload
khangminh22 -
Category
Documents
-
view
2 -
download
0
Transcript of PUNJAB DEVELOPMENT REPORT - National Institute of ...

PUNJABDEVELOPMENTREPORT
PLANNING COMMISSION GOVERNMENT OF INDIA

c - i m ^Acc. No, .gi’tg j‘=ll|'7'/oS'/
Date '
l ib r a r y
Contents
Core CommitteePreparation of State Development Report on Punjab Foreword by Deputy Chairman, Planning Commission Introduction by Member, Planning Commission Message by Chief Minister, Punjab Executive Summary
1. Profile of Development and Change
2. Development and Management of Natural Resources
3. Fiscal and Financial Management
4. Development of Agriculture and Allied Sectors
5. Rural Development
6. Industrial Development
7. Infrastructure Development
8. Urban Development
9. Demographic Development
10. Health
11. Education
12. Labour and Employment
13. Information Technology: Growth and Development Strategy
14. Development Perspective
15. Strategy for Development
16. Conclusions and Policy Directions
17. Vision of Punjab 2020 -Present, Future and the Past
List of Tables List of Figures List of Maps

Core Committee
Dr. K. Venktasubramanian Member, Planning Commission
Shri P. K. IVlohantyPrincipal Adviser, Planning Commission
Shri S. P. AryaPrincipal Adviser, Planning Commission
Shri Sudhir MittalSecretary (Planning), Government of Punjab
Shri J. S. KesarSecretary (Planning), Government of Punjab
Shri Rashpal MalhotraFounder Director, CRRID, Chandigarh
Shri T. P. BiswasDirector, Planning Commission
Chairman
Member
Member
Member
Member
Member
Member Secretary
Centre for Research in Rural and Industrial Development (CRRID)Shri Rashpal Malhotra Dr. S. S. Johl Shri T. K. A. Nair Prof. S. K. Ray Shri Subrata Banerjee Shri Anand Sarup
Team Leader Adviser Adviser Adviser Adviser Adviser

PREPARATION OFSTATE DEVELOPMENT REPORT ON PUNJAB
The State Development Report (SDR) on Punjab focuses on the present, future and the past. It has been prepared by members of the faculty of the Centre for Research in Rural and Industrial Development (CRRID). They were individually assigned the chapters based on their experience and expertise. The SDR has gone through a process of evaluation in this period of eleven months. It has also drawn a great deal on the experiences and analyses of the studies carried out by the Centre in the past two decades, covering practically every issue relevant to the SDR.
The process of preparing the SDR began with the first meeting chaired by Dr. K Venkatasubramanian, Member, Planning Commission and Chairman of the SDR, who was ably assisted by Shri P K Mohanty, Principal Adviser and other officers of the Planning Commission. CRRID was represented by the Director and Shri J P Gupta, another colleague, at this meeting which sought to evolve the framework, approach and methodology to be adopted by the team selected for carrying out this assignment. The discussion led to the decision to hold a meeting at Chandigarh with senior officials from the state government and experts from different parts of the country. Both the Member and Principal Adviser, Planning Commission, visited the Centre to participate in the proposed meeting. It was in the form of a brainstorming session led by the Member and the Principal Adviser. The Chief Secretary and all the Secretaries and heads of the departments concerned with the report represented the state government. A few experts, identified by CRRID as advisers, were also invited to participate, together with the members of the team engaged in preparing the report. The brainstorming session helped streamline the framework, approach and methodology of the study and identified the priority areas of development. Shortly after this, an interactive session was held with the Chief Minister, Punjab, who had just taken over, together with his officers. This meeting was organized to have the benefit of the information, advice and priorities identified by the new party government. It was followed by another one to streamline as well as clarify the old and newly identified issues concerning the pattern of development as prioritized and visualized by the state government.
There are many notable features of the SDR. First, is the participation of the beneficiaries, stakeholders, benefactors and even critics, from different political persuasions and disciplines over a period of time.
The second most important feature is the input received from experts and officials of Punjab Government, the Planning Commission of India and several autonomous research institutions. This exercise enabled the team to prepare the first draft of the report. It was circulated to the state government and the Planning Commission for their suggestions and comments. The response on this account, including appreciation of some chapters, that the team received were both instructive and suggestive. Subsequently, two meetings, each lasting more than three hours, were arranged with the Chief Minister, Punjab and Dr. Manmohan Singh, former Union Finance Minister, who is also the Chairman of the Governing Body of CRRID. The Chief Minister, accompanied by eleven senior officers of the state government, acknowledged the relevance as well as importance of the report and also the approach, which, he remarked, the state government was going to adopt.

Dr. Manmohan Singh, who had some apprehensions at the beginning, observed that the team had done commendable work. He also made a few suggestions, which were incorporated.
The first draft, after incorporation of the suggestions and comments, was placed for discussion at a meeting between members of the team and experts who had been associated with the preparation of the report. These included, Shri Anand Sarup, former Education Secretary to the Government of India and author of National Education Policy, 1986; Professor S K Ray, former Professor, Institute of Economic Growth, who has also been Visiting Professor to CRRID; Smt Adarsh Mishra, the then Principal Secretary, Health and Family Welfare, Delhi Administration: Professor S S Johl, well-known agricultural economist; Shri T K A Nair, Chairman, Public Enterprises Selection Board; Professor Rajesh Kochar, Director, National Institute of Science, Technology and Development Studies (NISTAD); Professor Sucha Singh Gill, well-known economist from Punjabi University, Patiala; Dr. Gangadhar Jha, Director, National Institute of Urban Affairs; Professor S K Goyal, former Chairman, Research Advisory Committee of the Prime Minister/Planning Commission and currently Director, Institute of Studies in Industrial Development; Shri K R Lakhanpal, Principal Secretary, Finance, Government of Punjab; Dr. S K Tuteja, the then Development Commissioner, Small Scale Industries and Additional Secretary to the Government of India, who was further assisted by the technical staff from Small Scale Industries, Ludhiana, comprising, Shri Bharat Bhushan, Deputy Director, Small Industries Service institute. Government of India and Shri Viney Malhotra, Small Industries Promotion Officer, Small Industries Service Institute, Government of India. At the technical level the team received suggestions from Shri M L Nikhasi, former Editor, Manpower Journal.
It may be appropriate to record here that the magnitude of the task involved in preparing the SDR was not perceived at the time of bidding for the assignment. The initial time- schedule of six months had to be extended by another two and half to three months. It has in effect taken eleven months. In other words, it would be advisable to suggest that such efforts should be given a minimum of one year’s time to ensure that it serves the purpose of a referral document for many years to planners, scholars and administrators. It can be safely said that the report being presented to the Planning Commission has been prepared with this objective in mind.
A notable feature of the report is something that usually passes unnoticed. This is the quality of its presentation through careful editing. This was in the able hands of Shri Subrata Banerjee, a well-known journalist, veteran editor, political commentator and diplomat, who has been associated with CRRID for the past two decades. He succeeded Shri P N Haksar, as Editor of Man and Development, the international quarterly journal published by CRRID since 1979. He is at present the adviser of CRRID’s research and publications programme.
The other distinctive feature of the report is the contribution of the collective sensitization of the researchers working at CRRID for many years, to changing realities. The environment of cross-fertilization of ideas, free and frank exchange of views, information and analysis between and among the members of the team, during this one year, have helped to give the report an integrated character highlighting the basic issues of the development of the state.

Thanks to the Planning Commission, for funding, working on this report has heipec CRRID in widening the scope of inter-disciplinary and multi-disciplinary research, which has been one of its basic objectives. Another advantage of participation in this project is that the contributors are now in a position to utilize their vast knowledge, perceptions, and comprehension gained, for publishing monographs on their respective areas of work for wider dissemination.
The team had also the rare benefit of listening to the experiences of Shri I K Gujral, former Prime Minister of India and Shri Jagmohan, Union Minister for Tourism and Culture on the issue of ‘Governance’. Shri K C Pant, Deputy Chairman, Planning Commission has emphasized the importance of this subject in his ‘Foreword’ to the National Human Development Report published by the Planning Commission for the year 2001.
The discussions that followed, in which a number of eminent scholars participated, have a bearing on some of the major issues of the report. This is also true, of the week-long programme of lectures, discussions and seminar held recently in memory of the late Shri P N Haksar. it covered practically every single issue discussed in this report, particularly the question of ‘Fiscal and Financial Management’.
After receipt of comments and advice on, and even appreciation of, the first draft submitted by CRRID to the Planning Commission and different departments of the state government, we arranged to have the report released in the presence of the Hon’ble Chief Minister, Punjab by the Chairman of the State Development Report (SDR) Dr. K. Venkatasubramanian, Member Planning Commission, on 27 September 2002 a1 Chandigarh. For some unavoidable reasons, the Chief Minister suggested a change in the date of release. Shri P.K. Mohanty, Principal Advisor, Planning Commission, whc had already reached Chandigarh to participate in the release, according to the earliei scheduled date, took this opportunity to spend considerable time to interact with the members of the faculty engaged in preparing the report. At the end of the session, he suggested that a presentation be made before the Hon’ble Deputy Chairman and othet members and officials of the Planning Commission. Shri Mohanty pointed out that the Deputy Chairman, Planning Commission always made perceptive comments, based on his wide experience, at such meetings. This report would thus have the benefit of his wisdom. I immediately agreed to his very valuable suggestion. He said he would confirm the proposed arrangements and date of presentation.
In the meantime the members of the team had the opportunity to spend several hours with Professor S.R. Hashim, former Member-Secretary, Planning Commission and Shri G.K. Arora, Former Member of the Civil Services and Director, IMF, both members of the Governing Body of CRRID. This proved to be a very rewarding interaction and an additional input to the finalization of the draft report.
After the formal release of the Report at Chandigarh, we propose to have it discussed at the state, national and international levels, in view of its importance as well as relevance for the international funding agencies, groups of NRIs, corporate sector and other stakeholders at home and abroad. Simultaneously, each chapter is going to be updated and developed for publication as a monograph or a book. This will help wider dissemination of this nationally important report, the result of a creative, innovative and educative experience that the Planning Commission has initiated. It brings into focus a creative and productive interaction among and between the states in the region for the

solution of commonly shared problems of socio-cuitural and economic development, on the basis of comparative advantage. This makes development a positive component of national integration.
The multidisciplinary research at the grassroots level, combined with certain experiments in social activism in related areas on a wide range of developmental issues that CRRID has been conducting in the states of this region, could sustain such an approach to development. It could enable planners, policy makers and administrators to resolve some of the issues which have assumed political and conflictual overtones because of failure to provide the input of professional expertise as a part of the developmental process. It is an unfortunate reality that once an issue of socio-cultural and economic development becomes politicized the role of social scientists, intelligentsia and other professionals become irrelevant. It is in this context that the planning process must be strengthened through a continuing and creative interaction with ongoing multidisciplinary research as a part of overall development of the states, in the interest of the nation.
This is one of the missions on CRRID’s agenda which we hope to carry out with the support of the Planning Commission and other nationally important institutions, agencies and the Indian Council of Social Science Research (ICSSR), Ministry of Human Resource Development, in particular, in the years to come.
It IS hoped that the report will serve as a contribution of valuable inputs to policy making by scholars and experts from outside the government. We also hope that the SDR on Punjab will serve the long-felt need for a comprehensive data-based analytical overview of development problems of the state for policy makers, administrators, researchers and the corporate sector, besides international funding agencies.
This major project of CRRID coufd not have been successfully completed without the enthusiastic involvement of the administrative, computer, library and other supporting staff at different levels and at all times. This of course is a characteristic feature of the work culture of CRRID, but bears special mention.
POSTSCRIPT
This post script has been added to this chapter in acknowledgement of the valuable input received at the meeting presided over by Hon’ble Dr. K.C. Pant, Deputy Chairman, Planning Commission, on October 23, 2002. The meeting was fixed by the Planning Commission of India for presentation of the State Development Report (SDR) and its release by the Deputy Chairman. The interaction with some of the members and senior officials of the Planning Commission, who participated at the meeting, was a most rewarding experience for all the members of the faculty and also the advisors who had contributed to the preparation of the SDR.
The Deputy Chairman spent considerable time, in fact, more time than was originally scheduled. The intervention by him was stimulating for everyone present at the meeting. It also helped identify the specific task for the Centre for Research in Rural and Industrial Development (CRRID), as a follow up of this report, of holding seminars on the issue of interconnectiveness and interdependence of the states within the region for identifying and implementing the developmental programmes/projects of common interest and their

benefit to the states. He underlined the importance of formulating projects based on the recommendations of the SDR in agriculture, industry, information technology and infrastructural development.
The Deputy Chairman placed on record the Planning Commission’s appreciation of the SDR. He was supported by the Chairman of the Core Committee, Hon’ble Dr. K. Venkatasubramanian, Member, Planning Commission, who had monitored the preparation of the report right from the beginning. The report was subsequently presented to the Hon’ble Chief Minister, Capt. Amarinder Singh, at a well-represented meeting organized by the CRRID on 2 December, 2002. The Chief Minister who had earlier spent considerable time during his interactive sessions with the members of the faculty, made the following observations:
It is my immense pleasure to acknowledge with great appreciation, the initiative taken by the Planning Commission in involving autonomous research institutions, universities, and non-government organizations in the task of preparing the State Development Reports. This style ensures objectivity in understanding of the evolving scene; it also allows the engagement of experts in the service of the State. Such reports tend to have a wider perspective and invariably stress on interconnectivity of States in realization of development goals, and thereby strengthen the cause of nation building. A time has come when neighbouring States have to co-operate rather than compete for utilization of scarce natural resources. Only such a strategy can harmonize efficiency with equity.
The Chief Minister also placed on record his appreciation of the efforts made by the members of the faculty of CRRID in preparing such a comprehensive document.
The CRRID has set for itself the task of implementing the agenda, that emerged during the interaction with the Planning Commission, by holding discussions, seminars at the regional, national and even international levels to highlight the relevance as well as importance of the paradigm introduced by the Planning Commission under the guidance of the Deputy Chairman. Surely this will strengthen the long-felt need of initiating the process of co-operative development on the one hand and reinforce the nationally held philosophy of unity in diversity on the other.
The present initiative by the Planning Commission provides an opening to widen as well as strengthen the scope of multidisciplinai'y research in social science. As an Institute of National Status, CRRID has been committed to such a programme of multidisciplinary research on issues of multidimensional importance, since its very foundation.
Chandigarh Rashpal MalhotraFounder Director

^ ^K. C. PANT W
^Rc!DEPUTY CHAIRMAN PLANNING COMMISSION INDIA
December 28, 2002FOREWORD
In order to address the development concerns o f State Governments through an independent and analytical framework, Planning Commission decided to have State Development Reports prepared which would serve as credible documents to help set the agenda for the economic growth of States.
The preparation of State Development Reports is a recent initiative taken by the Planning Commission to foster a sense o f partnership between the Centre and the States to jointly assess the development alternatives available keeping in view the financial, human and material resources and the felt needs o f the people. This exercise has also underlined the need to take a re-look at governance issues and policy options which will enable the States to provide a better quality o f life to their people.
I hope that the Punjab State Development Report which has highlighted critical issues for the State will not only stimulate debate regarding the road map for the State but will also help the State Government take a close look at the problems which have hindered the realization o f optimum growth and socio-economic development in the State. The Report rightly underlines the urgent need for restoration of State’s growth rate above or at least at par with the national average.
I look forward lo Punjab, with its vigour and enterprise, attaining the high level o f prosperity and human welfare which v/ill follow in the wake o f its realizing its true potential.
Yojana Bhawan, Parliament Street, New Delhi - 110 001 Phones (Office) : 23096677, 23096688 Fax : 23096699 (t^cnn) : Phones (Resi.) : 23092618, 23094431 Fax : 23092553

Dr. K. VenkatasubramanianMEMBERPLANNING COMMISSION GOVERNMENT OF INDIA
INTRODUCTION
YOJANA BHAWAN PARLIAMENT STREET NEW DELHI-110001 Te! : 23096566(0)
23384606,23388024{Rj Fax : 230965B7 E-mail: [email protected]
28'^ December, 2002
Planning Commission has launched innovative schemes to improve effectively the Governance of the Plans as per the directions of Hon’ble Shri. K.C. Pant, the Deputy Chairman of tne Planning Commission. One such initiative is to draw up State Development Reports, which will lay the road for real development in the States.
In implementation of the Central Plan Scheme of “50'* Year Initiative for Planning”, the Planning Commission has been preparing the State Development Report (SDR) for the States. The salient aim of this Scheme is to compile quality reference documents on development profile and strategy for accelerating the pace of development of the respective States. These SDRs are to act as major inputs in steering the growth process of the respective Stater.
In preparing the Punjab State Development Report, the expertise of the Centre for Research in Rural and Industnal Development (CRRID), Chandigarh was availed of on payment basis. A Core Committee under my chairmanship reviewed various dimensions of current developmental issues in Punjab and decided the scope and coverage of the SDR for the State with active involvement of the Government of Punjab and the selected agency (i.e. the CRRID, Chandigarh). Expert advice of all the Members of the Core Committee is well appreciated.
This exercise is particularly relevant in case of Punjab under the circumstances that during the period from 1993-94 to 1999-2000, Punjab with its satisfactory level of infrastructure support could achieve an annual growth rate of 4.65% against the all India rate of 6.68%. The inputs on developmental problems in the Stat<=" and corrective policy measures suggested in the Report would be extremely useful in directing the growth process of the State at ttiis juncture when the 10‘ Five Year Plan has just started.
1 would like to thank also Shri. Rashpai Malhotra, Founder Director, CRRID and his team of experts for carefully preparing the State Development Report for Punjab on behalf of the Planning Commission.
. VenkatasubramaDxaft)"^ ^

HU H33l,Chief Minister, Punjab
ChandigarhMESSAGE
The State Development Report of Punjab, prepared by the Centre for Research in Rural and Industrial Development, Chandigarh (CRRID), at the behest of the Planning Commission, New Delhi, could not have appeared at a more critical moment than the present one Punjab today requires a correction of its fiscal imbalance, rejuvenation of the socio-economic dynamism, and upgradation of the human resource base. It is faced with the questfons of diversification of its agricultural economy by replacing the wheat-rice rotation by an ecologically viable pattern, and above all, of meeting the challenges posed by globalization. The Report comprehensively and in depth grapples with these issues in a purposeful manner
Soon after taking over the reigns of government,I along with my colleagues and senior officials of the State Government held two interactive sessions with the officials of the Planning Commission, experts and members of the team of the CRRID engaged in carrying out this task assigned to them by the Planning Commission of India. These interactive sessions and my subsequent discussions with the members of the faculty of the CRRID were most educative and rewarding.
It is my immense pleasure to acknowledge with great appreciation, the initiative taken by the Planning Commission in involving autonomous research institutions, universities, and non-government organizations in the task of preparing the State Development Reports. This style ensures objectivity in understanding of the evolving scene; it also allows the engagement of experts in the service of the State. Such reports tend to have a wider perspective and

Hy H3arl, UtTTg Chief Minister, Punjab
Chandigarh- 2 -
invariably stress on interconnectivity of States in realization of development goals, and thereby strengthen the cause of nation building. A time has come when neighbouring States have to cooperate rather than compete for utilization of scarce natural resources. Only such a strategy can harmonize efficiency with equity.
The present exercise achieves this objective admirably. I congratulate the CRRID for carrying out this mission with exemplary zeal. Encouraged by this experience, we are moving on to the next phase of getting prepared 'district development reports', in the spirit o f devolving powers to the village panchayats and urban local bodies under the 73^^ and 74^ Constitutional Amendments, as I believe, that development has to be, not only for the people but also by the people.
(Am arinder Singh)

List of Tables
Chapter 1
1. Status of Punjab on Selected Parameters in India, 1999-2001 2
2. Comparative Picture of Social Infrastructure and Demographic 10Attributes in Punjab and Haryana at the Time of Reorganization and in 2000-2001
3. Economic Performance of States during the 1980s and 1990s 13
4., Per Capita Income in Punjab during 1966-67 to 1998-99 at 1980-81 15Constant Prices
5. Sectoral Rates of Growth in Punjab, 1970-71 to 1998-99 at 1980-81 17Constant Prices
6. Sectoral Distribution of SDP of Punjab during 1966-67 to 1998-99 at 191980-81 Prices (in percent)
7. Different Types of Expenditures in Punjab (in Rs crore and per cent 21shares)
8. Sectoral Expenditure during Plan Periods, Punjab (per cent) 22
9. Population Below Poverty Line in Punjab 1973-74 to 1999-2000 23
10. Area, Production, and Yield of Wheat and Rice Crops, Punjab, 1966-67 27to 2000-01
11. Contribution of Wheat and Rice of Punjab in Central Pool 1980-81 to 292000-01
12. Production and Per Capita Availability of Milk in Punjab 1968-69 to 301999-2000
13. Status of Small-scale Industries in Punjab 1966-67 to 1998-99 32
14. Status of Large/Medium Industries in Punjab 1966-67 to 2000-2001 33
15. Infant Mortality Rates in Selected States in India 1971 to 2000 37
16. Life Expectancy in Selected States during 1970-75 to 1992-96 (years) 39
17. Variation in the Sex Ratio in Selected States during 1971-2001 42(Females per 1,000 males)
18. Average Monthly Expenditure (Rupees) per Person on Selected Group 44of Items of Consumption, 1999
Chapter 2
1. Land Use Pattern in Punjab (‘000 Hectare) 51
2. Extent of Degraded Land in Punjab 52
3. District- wise Progress of Gully Reclamation Work on Agricultural Land 53up to 1999-2000 (Hectare)
4. Percent Distribution of Blocks According to Fertility Status of Soils in 54Punjab (on the basis of per cent deficient samples)

5. Achievements of Soil - and Water Conservation Works during Plan Periods (Hectare)
55
6. Reclamation of Alkaline/Kallar Land during the Plan Period in Punjab (Hectare)
57
7. Expenditure on Soil Conservation Measures during Plan Period (Rs. in Lakhs)
57
8. Net Irrigated Area (‘000 hectare) by Different Sources in Punjab 59
9. Rise and Fall in Underground Water Table in Different Districts of Punjab, 1973 through 1994
60
10. Forest Cover in India and Punjab (2000) 65
11. Forests in Punjab (Hectare) 66
12. Forest Cover in Punjab and Other States (1997-98) 66
13. Forest Produce in Punjab 68
14. Economics of Poplar with Inter cropping (Annual value Rs./ha) 69
15. Runoff and Soil loss from Non-arable and Arable Land of Varying Size in the Shivalik Foothills of Punjab
73
Chapter 3
1. Growth of Large/Medium and Small-scale Industries in Punjab 79
2. Punjab - Deteriorating Revenue and Gross Fiscal Deficits (Rs. in crore) 81
3. Gross Fiscal Deficit as a Ratio of NSDP in Fifteen Major States (in 81percent)
4. Debt of the State Government (Rs. in crore) 82
5. Punjab - Erratic Revenues as a proportion of GSDP 82
6. Revenue Performance of 1997-98 to 2001-02 (Rs. in crore) 83
7. Receipts - GSDP Ratio (Percent); 1990-91 to 1999-2000 (In percent) 84
8. Ratio of Own Tax Revenue to GSDP (In percent) 84
9. Revenue Deficit of Punjab (Rs. in crore) 85
10. Committed Expenditure on Major Items of Punjab State (Rs. in crore) 87
11. Selected Comparative Pay Scales; Government of India, Government 87of Punjab and Government of Haryana
12. GSDP Ratio of Expenditure; 1990-91 to 1999-2000 (In percent) 88
13. Mounting Interest Expenditure 89
14. Year-wise Financial Performance of the Ninth Five Year Plan (Rs. in 90crore)
15. Outlays for Tenth Five Year Plan (2002-07) and the Annual Plan (2002- 9003)
16. Plan Expenditure in the 9‘ Five Year Plan (Rs. in crore) 91

17. The Per Unit Loss of Punjab State Electricity Board 96
18. Additional Power Generation in Tenth Five Year Plan 97
19. Punjab Medium Term Fiscal Plan (Rs. in crore at current prices) 107
20. Growth Rate of Revenue and Expenditure Receipts for the Year 2001- 10802 & 2002-03 (Rs. in Crore)
Chapter 4
1. Some Selected Indicators of Growth of Punjab Agriculture 112
2. Comparative Statement of Operational Holding in Punjab 113
3. District-wise Trend in Number and Size of Operational Holdings in 114Punjab, 1971-1991
4. Shift in Cropping Pattern in Punjab (Area in’ 000 ha.) 116
5. Yield (kg./ha.) of Principal Crops in Punjab 117
6. District-wise Productivity of Crops (1999-2000) (Kg per hectare) 117
7. Yields of Crops in Punjab, India and in Selected Countries (kg/ha) 1181998-99
8. Average Yield of Rice, Wheat and Cotton Crops in Punjab (kg/ha) 119
9. Extent of Degraded Land in Punjab 120
10. Net Irrigated Area (‘000 ha.) by Different Sources in Punjab 121
11. Rise and Fall in Underground Water Table in Different Districts of 121Punjab, 1973 through 1994
12. Distribution of Blocks into Dark, Grey and White on Basis of 122Underground Water Resources in Punjab, 1994
13. Agricultural Machinery and Implements in Punjab and India (in ‘000) 123
14. Consumption of Chemical Fertilizers in Punjab (’000 metric tonne) 124
15. Per cent Distribution of Blocks According to Fertility Status of Soils in 124Punjab (on the basis of per cent deficient samples)
16. Extent of the Spread of Formal Credit Institutions in Punjab (1998-99) 126(in Lakh Rs.)
17. Trend in Public Sector Investments in Punjab Agriculture (Rs. in crore) 130
18. Public and Private Investments in Agriculture during different Plans 131(Unit Rs/ha at 1980-81 prices)
19. Estimated Total Employment in Principal Crops (‘000 Man-Days) in 132Punjab
20. Area of Different Crops Based on Recommendations Made by Johl 135Committee (1986) and Actual Observed Area (Million Ha) in 1999-2000
21. Targets for Different Agricultural Crops for the 10** Five Year Plan 137(2002-07) for Kharif Crops (Area in ‘000 hectares)

22. Targets for Different Agricultural Crops for the 10 Five Year Plan 137(2002-07) for Rabi Crops (Area in ‘000 hectares)
23. Livestock and Poultry in Punjab (in ’000) 138
24. Area (hectare) under Different Fruits and Vegetables in Punjab 142
Chapter 5
1. Government Expenditure on Rural Development Programme in Punjab 151(Rs. in lakh)
2. District-wise Socio-economic Indicators in Punjab 153
3. Rural Infrastructure in Punjab 154
4. District-wise Selected Development Indicators in Rural Punjab-1998-99 157
5. Poverty Ratios in Punjab and India 158
6. Trends in Number of Gram Panchayats in Punjab (1968-1998) 160
7. Total Members of Elected Representatives (Panches and Sarpanches) 160of Gram Panchayats during 1968-1998
8. Total number of Scheduled Caste and Women Sarpanches during 1611978-1998
9. Number of Training Workshops for the Representatives of Panchayati 163Raj Institutions Conducted by CRRID
10. Action Plan for Education, Training and Empowerment of the Elected 163Representatives of PRIs
11. Amount to be Transferred to PRIs/ULBs from Five Divisible State Taxes 165and Amount Actually Given (Rs. in crore)
12. Sector-wise Share of Punjab in Net Domestic Product of India by 167Economic activity (1999-2000) at Current Prices (Rs. in crore)
13. Percentage Distribution of Net State Domestic Product at Factor Cost 167
14. Percentage Shift of Rural Non-farm Employment and Shares of 168Secondary and Tertiary Sectors in Punjab during 1981 and 1991
15. Percentage Distribution of Workers by Category-Punjab 1981 -2001 168
16. Arrivals of Wheat and Paddy (in lakh tonnes) 169
17. Collection of Market Fee during Last Five Years (Rs. in Crore) 169
18. Major Projects Undertaken in Co-ordination with Punjab Agro Industry 172Corporation (PAIC)
19. Rural Development under Five-Year Plans (Actual Expenditure) (Rs. in 175lakh)
20. Financial and Physical Achievement under SGSY Scheme during Ninth 176Five Year Plan (upto February, 2002) (Rs. in lakh)
21. Physical Performance of JGSY under SGRY- 2001-2002 177
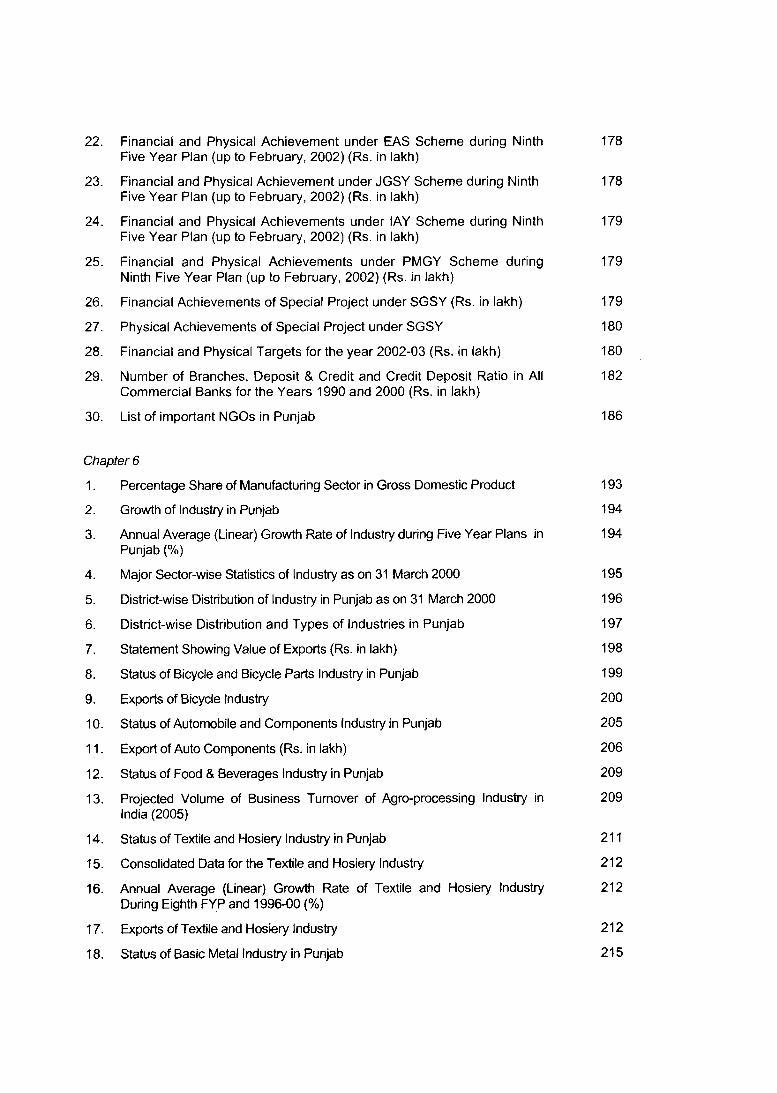
22. Financial and Physical Achievement under EAS Scheme during Ninth Five Year Plan (up to February, 2002) (Rs. in lakh)
178
23. Financial and Physical Achievement under JGSY Scheme during Ninth Five Year Plan (up to February, 2002) (Rs. in lakh)
178
24. Financial and Physical Achievements under lAY Scheme during Ninth Five Year Plan (up to February, 2002) (Rs. in lakh)
179
25. Financial and Physical Achievements under PMGY Scheme during Ninth Five Year Plan (up to February, 2002) (Rs. in lakh)
179
26. Financial Achievements of Special Project under SGSY (Rs. in lakh) 179
27. Physical Achievements of Special Project under SGSY 180
28. Financial and Physical Targets for the year 2002-03 (Rs. in lakh) 180
29. Number of Branches, Deposit & Credit and Credit Deposit Ratio in All Commercial Banks for the Years 1990 and 2000 (Rs. in lakh)
182
30. List of important NGOs in Punjab 186
Chapter 6
1. Percentage Share of Manufacturing Sector in Gross Domestic Product 193
2. Growth of Industry in Punjab 194
3. Annual Average (Linear) Growth Rate of Industry during Five Year Plans in 194Punjab (%)
4. Major Sector-wise Statistics of Industry as on 31 March 2000 195
5. District-wise Distribution of Industry in Punjab as on 31 March 2000 196
6. District-wise Distribution and Types of Industries in Punjab 197
7. Statement Showing Value of Exports (Rs. in lakh) 198
8. Status of Bicycle and Bicycle Parts Industry in Punjab 199
9. Exports of Bicycle Industry 200
10. Status of Automobile and Components Industry in Punjab 205
11. Export of Auto Components (Rs. in lakh) 206
12. Status of Food & Beverages Industry in Punjab 209
13. Projected Volume of Business Turnover of Agro-processing Industry in 209India (2005)
14. Status of Textile and Hosiery Industry in Punjab 211
15. Consolidated Data for the Textile and Hosiery Industry 212
16. Annual Average (Linear) Growth Rate of Textile and Hosiery Industry 212During Eighth FYP and 1996-00 (%)
17. Exports of Textile and Hosiery Industry 212
18. Status of Basic Metal Industry in Punjab 215

19. Status of Metal Products Industry in Punjab 219
20. Annual Average (Linear) Growth Rate of Metal Products Industry during 1997-00 (%)
219
21. Growth of Hand Tools Industry in Punjab 221
22. Exports of Hand Tools from Punjab 221
23. Status of Machinery Other than Electrical Industry in Punjab 223
24. Annual Average (Linear) Growth Rate of Machinery Other than Electrical Industry dunng 1997-00 (%)
223
25. Production in Electronic Hardware Manufacturing Sector during Ninth Plan in India (Rs. in crore)
226
26. Sector-wise Projected Production by 2007 226
27. Status of Electrical and Electronics Industry in Punjab 227
28. Growth of Industries in Rural Areas 228
29. Plan- wise Approved Outlay, Actual Expenditure and Annual Growth Rate of Industry
237
30. Average Employment per Unit, Investment and Production per Employee (Rs.)
238
31. Number of Job Seekers on Live Registers of Employment Exchanges as on 31 December
238
Chapter 7
1. Primary Sources of Energy 244
2. Electrical Energy Availability (in million kwh) 245
3. Electrical Power Availability in India 245
4. Plant Load Factor of Thermal Plants 246
5. Conceptual Framework of Availability of Power from the States’ Own 247Resources by 2010
3. Annual per Capita Consumption of Electricity by States 1999-2000 (million 247kwh)
I. Sub-Sectoral Break-up of Power Consumption in Punjab, 1970-71 to 2482000-01 (Percentage)
Households Using Electricity in Punjab 248
9. Anticipated Demand for Energy (in million kwh) 250
10. Cost and Revenue per unit of Electricity (in Rs.) 251
I I . Status of Power Sector Reform in Some Other States 252
12. Functioning Commodity Exchanges in India 269
13. Sectoral Annual Compound Growth Rate of Gross Domestic Product in 270Punjab
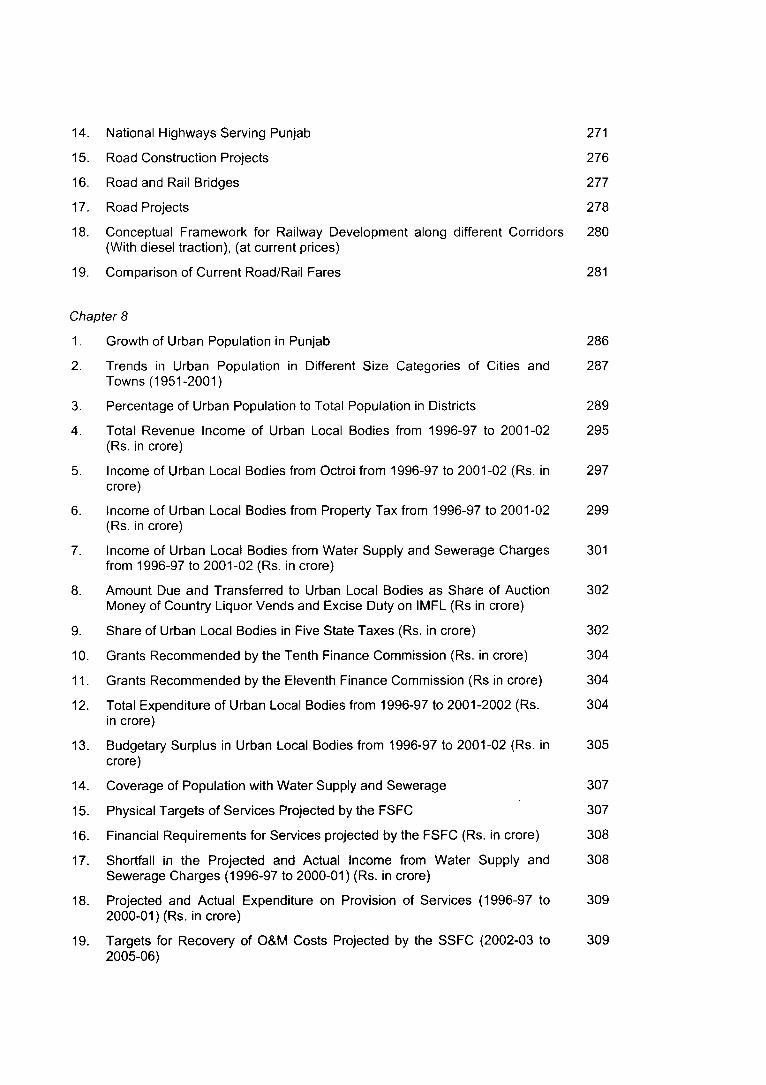
14. National Highways Serving Punjab 271
15. Road Construction Projects 276
16. Road and Rail Bridges 277
17. Road Projects 278
18. Conceptual Framework for Railway Development along different Corridors (With diesel traction), (at current prices)
280
19. Comparison of Current Road/Rail Fares 281
Chapter 8
1. Growth of Urban Population in Punjab 286
2. Trends in Urban Population in Different Size Categories of Cities and 287Towns (1951-2001)
3. Percentage of Urban Population to Total Population in Districts 289
4. Total Revenue Income of Urban Local Bodies from 1996-97 to 2001-02 295(Rs. in crore)
5. Income of Urban Local Bodies from Octroi from 1996-97 to 2001-02 (Rs. in 297crore)
6. Income of Urban Local Bodies from Property Tax from 1996-97 to 2001-02 299(Rs. in crore)
7. Income of Urban Local Bodies from Water Supply and Sewerage Charges 301from 1996-97 to 2001-02 (Rs. in crore)
8. Amount Due and Transferred to Urban Local Bodies as Share of Auction 302Money of Country Liquor Vends and Excise Duty on IMFL (Rs in crore)
9. Share of Urban Local Bodies in Five State Taxes (Rs. in crore) 302
10. Grants Recommended by the Tenth Finance Commission (Rs. in crore) 304
11. Grants Recommended by the Eleventh Finance Commission (Rs in crore) 304
12. Total Expenditure of Urban Local Bodies from 1996-97 to 2001-2002 (Rs. 304in crore)
13. Budgetary Surplus in Urban Local Bodies from 1996-97 to 2001-02 (Rs. in 305crore)
14. Coverage of Population with Water Supply and Sewerage 307
15. Physical Targets of Services Projected by the FSFC 307
16. Financial Requirements for Services projected by the FSFC (Rs. in crore) 308
17. Shortfall in the Projected and Actual Income from Water Supply and 308Sewerage Charges (1996-97 to 2000-01) (Rs. in crore)
18. Projected and Actual Expenditure on Provision of Services (1996-97 to 3092000-01) (Rs. in crore)
19. Targets for Recovery of O&M Costs Projected by the SSFC (2002-03 to 3092005-06)

20. Physical Targets and Financial Requirements for O&M and Creation of 310New Assets Projected by SSFC (2002-03 to 2005-06) (Rs. in crore)
21. Physical Targets and Financial Requirements for Water Supply, Sewerage, 311Solid Waste Management and other Infrastructure Services from 2002-03to 2006-07 (Rs. in crore)
22. Projected Income of Urban Local Bodies from 2002-03 to 2006-07 312
23. Projected Expenditure of Urban Local Bodies from 2002-03 to 2006-07 313(Rs. in crore)
24. Projection of Resource Gap from 2002-03 to 2006-07 (Rs. in crore) 313
25. Water Tariffs in Selected Cities of India* (1998-99) 315
26. Additional Resource Mobilization by Urban Local Bodies 316
27. Proposed Financing of Projected Urban Infrastructure and Services 316
28. Access of Municipal Bond Market in India by Municipal Corporations 317
29. Estimated Housing Shortage in Urban Areas of Punjab in 1995, 1997 and 3252002
30. Approved Plan Outlay and Expenditure on Housing Including Police 326Housing
31. Slum Population in Punjab, 2001 330
32. State-specific Poverty Line in 1999-2000 (Rs. per capita per month) 332
33. Poverty Trend in Punjab (in lakh) 333
34. Distribution of Urban Poor in Different Districts in Punjab, 2002 334
Chapter 9
1. Fertility Decline in Major Indian States (1970-72 to 1996-1998) 340
2. Levels and Trends in Crude Birth Rate (CBR) and Total Fertility Rate 341(TFR), India and Punjab (1971-73 to 1998-2000)
3. Levels and Trends in Age Specific Fertility Rate (ASFR) in Punjab (1971- 3421998)
4. Levels and Trends in Crude Death Rate (CDR) in India and Punjab (1971- 34673 to 1998-2000)
5. Changes in Age Specific Death Rates (ASDR) by Sex in Punjab (1971-98) 348
6. Infant Mortality Rate (IMR) by Selected Background Characteristics in 350Major Indian States
7. Levels, Trends and Sex Composition in IMR in India and Punjab (1971-73 351to 1998-2000)
8. Changing Mortality at Different Stages of Childhood in India and Major 353States
9. Levels and Trends in Neo-natal, Post neo-natal, Infant, Child and Under- 353five Mortality by Sex Differentials in India and Punjab (1992-93 to 1998-99)

10. Levels and Trends in Current Contraceptive Prevalence Rate (CPR) due to 358All Modern Methods in India and Punjab (1973-99)
11. Current Acceptors of Modern Methods by Number of Living Children by 364Sex in Punjab {1996-97 and 1998-99)
12. Levels and Trends in Sex Ratio in India and Punjab (1961-2001) 365
13. Levels and Trends in Sex Ratio at Birth (SRB) in India and Punjab (1972- 36681 to 1999)
14. Levels and Trends in Pregnancy Outcomes for Ever-married Women in 368India and Punjab (1992-93 to 1998-99)
15. Male and Female Life Expectancy (in years) at Birth and at Selected Ages 369in India and Punjab (1970-75 to 1991-95)
16. Trends in the Percent Share of the Persons 60 and above in Rural and 370Urban Areas in India and Punjab (1971 to 1998-99)
17. Average Annual Growth Rate of Aged Population in India and Punjab 371(1971-91)
18. Trends in Interstate Migration into Punjab (1971-91) 376
Chapter 10
1. Proportions of Outlays and Expenditure on Medical and Public Health, 389Nutrition, Social Services in Punjab (as percentage of total), 1969-2007
2. Proportions of Outlays and Expenditure on Medical and Public Health, Social 391Services Excluding MPH in Punjab (as percentage of total), 1980-81 to 2001-2002
3. Institutions Providing Specialized Medical Services 400
4. Incidence and Prevalence Rates of Morbidity per thousand Persons 401
5. Prevalence Rate of Illnesses by Socio-economic Characteristics (per 1000 402Persons)
6. Prevalence Rate and Treatment of Illness by Area and Sex (per 1000 402Persons)
7. Number of Persons Suffering from Chronic Diseases in Punjab by Age, Sex 403and Residential Status (per 100000 Persons)
8. Prevalence Rate of Illness Classified by Type and Duration of Illness (per 4041000 Persons)
9. Acute and Chronic Ailments Classified by Age and Sex (per 1000 Persons) 405
10. Number of Persons Reporting Ailments During a Period of 15 Days per 1,000 405Persons by Fractile Groups of MPCE and Social Groups: Type of Ailment:Any
11. Number of Persons Classified by Age, Sex, MPCE and Social Groups 406Reportedly Receiving Some Medical Treatment for Ailments (Per 1000 Ailing Persons) (type of ailment: any)
12. Distribution of Untreated Spells of Sickness Classified by Reasons for Non- 406Treatment (in Percent)

13. Share of Public and Private Sector in Contraceptive, Preventive, and Curative 407 Services (in Percent)
14. Non-hospitalized Illness Episodes by Type of Treatment (in per cent) 408
15. Non-hospitalized Illness Episodes Classified by Type of Treatment (in 408Percent)
16. Non-hospitalized Ailments Treated by Government Sources (in Percent) 409
17. Distribution of Treatments (not as an in-patient) Classified by Type of 409Institution and Payment Category (in Percent)
18. Distribution of Non-hospitalized Cases (Not treated as In-patients) during the 410last 15 days by Type of Medical Sen/ice and Type of Ward of Governmentand Other Institution (per 1000 ailments)
19. Distribution of Hospitalized Cases (Treated as an In-patient) during Last 365 410Days Classified by Type of Ward of Government and Other Hospital and Residential Status of the Household (per 1000 ailments)
ZO. Average Total Expenditure Per Treatment by Source of Treatment 411
Average Cost of Treatment per Illness Episode Classified by System of 412 Medical Treatment, Type of Treatment, Distance, Sex (in Rupees), and Breakup of the Medical Expenses (in Percent)
22. Average Cost of Treatment per Illness Episode for Non-hospitalized Illnesses 413Classified by System of Medical Treatment, Type of Treatment, Distance, Sex(in Rupees), and Break-up of the Medical Expenses (in Percent)
23. Average Medical and Other Related Expenditure (for Non-hospitalized illness 413Episodes) per Treated Illness during the Last 15 Days Classified by Source of Treatment (in Rupees)
24. Percentage Distribution of Hospitalized Cases by Type of Hospital, Type of 414Ward for Punjab, All-India
25. Percent Distribution of Hospitalized Illness Episodes by Type of Treatment 415
26. Number of Hospitalized Treatment Received from Public Providers per 1000 415Episodes
27. Average Total Expenditure (in Rupees) per Hospitalized Episode Classified by 415Type of Hospital
28. Average Cost of Treatment Per Illness Episode for Hospitalized Illness by 416Type of Treatment
29. Percentage Distribution of Hospitalized Cases Defined by Social Groups and 416Adult Education Classes by Type of Hospital and Type of Ward for Rural and Urban Sectors in Punjab
30. Average Medical and Other Related Expenditure (for Hospitalized Illness 417Episodes) per Treated illness during Last 365 Days Classified by Source of Treatment (in Rupees)
31. Antenatal Care Indicators, Punjab and India (percent) 419
32. Antenatal Care Check-ups and Stage of Pregnancy, Punjab and India (per 420cent)
33. Sources of Antenatal Care during Pregnancy Punjab and India (per cent) 420

34. Place of Delivery by Residence Punjab and India (per cent) 421
35. Natal Care Indicators in Punjab and India (per cent) 422
36. Women Receiving Skilled Attention during Pregnancy (per cent) 422
37. Percentage of Mothers Registered for Post-natal care by Type of Medical 423Institutions in Punjab and India
38. Under Weight Children at the Time of Birth, Punjab and India (per cent) 424
39. Vaccination Coverage in Punjab and India (per cent) 427
40. Prevalence of Acute Respiratory Infection (ARI), Fever and Diarrhoea among 427Children under age Three Years in Punjab and India (per cent)
41. Disthbution of Adults according to Body Mass Index (per cent) 430
42. Prevalence of CED, Normal and Obese at District Level, Punjab (Rural)(in per 430cent)
43. Nutritional Status of Children 431
44. District Level Prevalence of Underweight, Stunting and Wasting among 431Children (1-5 years), Punjab (rural), 1998
45. Per Capita Intake of Calorie, Protein and Fat per diem in Punjab and India 434(NSS rounds)
46. Disability in Punjab and India 437
47. District Wise Handicapped Population by Type of Disability (1981 Census) 437
48 District Wise Disabled Persons in Punjab, 1999-2000 438
Chapter 11
1. Literacy Rate, Punjab (1991-2001) 448
2. States and Union Territories Ranked by Literacy Rate - India 2001 449
3. Total Literacy and Female Literacy by Districts of Punjab, 2001 450
4. Literacy Percentage of the Scheduled Castes and Non-Scheduled Castes 450in Punjab, 1991
5. Adult Literacy Rate, Punjab (15+Population) 451
6. Illiteracy in 15-35 Age-group in Punjab, 1971-91 451
7. Punjab; Outlay and Expenditure in Different Five Year Plans on General 455Education (Rs. in lakh)
8. Expenditure and Budget of School Education in Punjab, 1992-2000 456
9. Educational Attainment in Punjab, 1991 457
10. Number of Institutions in the State of Punjab as on 30.9.99 458
11. Number of Schools, Government and Non-Government (Recognized), 1966- 4582001
12. District-wise Number of Villages with School Education Facilities 459

13. Admission in Schools, 1984-1998 (in lakh) 461
14. Enrollment of Scheduled Caste, Non-Scheduled Caste and Total Students 461 in Recognized Institutions, 2000-2001 (in lakh)
15. Age-specific Enrollment Ratios in Select States, 1999 462
16. Percentage Distribution of Students (6-14 Age-Group) in Government/ 463Government-aided and Private Schools in Select States, 1994
17. Management-wise Enrollment at Primary Level, 1996-2000 (Per cent to 463Total)
18. Per Student Annual Household Expenditure on Elementary Education by 465Select States, 1992 and 1994
19. Dropout Rate in Punjab, 1988-2000 466
20. Out-of-School Children, 2001 467
21. Pass Percentage in Matnculation Examination, 1998-2001 469
22. Disthct-wise (Stage-wise) Teacher-Pupil Ratio, 2001 470
23. Classification of State Primary Schools on the Basis of Sanctioned Posts of 471Teachers/Head Teachers/Centre Head Teachers, 2002
24. Breakup of Senior-Secondary Schools (State Govt), 2000 472
25. Enrollment According to the Type of Courses at 10+2 Stage, 1993-94 472
26. Distribution of Enrollment at Senior Secondary Stage in Select States by 472Course of Study, 1993-94
27. Count of Facilities Required in Primary/Middle/Secondary/Senior 473Secondary Schools, 2000
28. Infrastructure Status Report of Government Primary School Including 474Branch Schools, 1997-98
29. Projected Population and Accelerated Enrollment of 6-17 Age-group in 476Government Schools, 1991-2011 (in thousand)
30. Growth of Universities 485
31. Distribution of Recognized Colleges according to Courses of Study 486
32. Number of Recognized Colleges Located in Rural and Urban Areas 487
33. District-wise Status of Recognized Colleges according to Courses of Study 488(2000-2001)
34. Growth of Students’ Enrollment 489
35. Number of Students in Different Courses of Study 489
35-A Course-wise percentage of Enrollment 490
36. District-wise enrolment of Students in Different Courses of Study (2000) 491
37. Women and Scheduled Castes’ Enrollment in Higher Education 493
38. Educational Facilities in Districts in Relation to Population 494
39. Number of Teachers in Universities and Colleges, 1971-2000 495

40. District-wise Number of Teachers in Recognized Colleges according to 496Courses of Study (2000)
41. Student-teacher Ratio 496
42. Resources Allocation in Education in Punjab during Plan Periods (in lakh) 500
43. Plan and Non-Plan Budget for Higher Education in Punjab (in lakh) 500
44. Distribution of Expenditure on Salaries and other Management (Percent) 501
Chapter 12
1. Labourforce Participation Rates in Punjab 512
2. Worker-population Ratio in Punjab 513
3. Age-specific Usual Worker (UPSS) Population Ratio in Punjab 514
4. Work Participation Rate at the District Level in Punjab, 1991 and 2001 515
5. Annual Compound Growth Rates of Population, Labourforce and 516Workforce, 1993-94/1999-00
6. Per 1000 Distribution of Usually Employed by Status of Employment 517
7. Percentage Share of Estimated Workforce at the Sector Level in Punjab and 518India
8. Percentage of Usually Working Persons in the UPSS by Broad Industry 519Category
9. Growth Rate of Employment (UPSS) at the Sector Level in Punjab 521
10. Unemployment Rates in Punjab 522
11. Unemployment Rates (CDS) in Major States 522
12. Unemployment Rates of the Educated Persons of age 15 years and above 523
13. Unemployment Rates among the Youth (15-29 years) 524
14. District-wise Percentage of Total and Educated Unemployed Persons 525Desirous of Self-Employment in Punjab, 1998
15. Per 1000 Distribution of usually Employed (UPSS) 527
16. Number of Workers (UPS) who did not work more or less regularly per 5271000 workers (UPS)
17. Number of Usually Working Persons of age 15 years and above per 1000 528Usually Employed Persons in the Principal Status (15 years & above) whowere available for additional/ alternative work
18. Growth of Employment in the Organized Sector in Punjab (as on 31st March) 529
19. Annual Compound Growth Rates of Employment in the Organized Sector 529in Punjab
20. Average Daily Wage (Rs.0.00) for Casual Workers of Age 5 Years and above 530Engaged in Public and other than Public Works, 1999-00
21. Financial and Physical Progress of Centrally Sponsored Employment 534Generating Schemes in Punjab during 2001-02

22. Technically Qualified Job Seekers on the Live Register of Employment 538Exchanges in Punjab
23. Percentage Distribution of Main Workers according to Education Level, 1991 539
24. Average Investment Rate and Growth Rate (1993-94/1999-00) 540
25. Trade Unions in Punjab (1968 to 99) 548
26. Trade Unions in Punjab - Size-wise Distribution (1968-99) 550
27. Income and Expenditure of Trade Unions in Punjab (1968-99) 551
28. Affiliations of Trade Unions in Punjab with Central Federations (1968-99) 552
29. Industrial Disputes in Punjab (1968 - 99) 554
30. Disputes Raised by Central Federations of Trade Unions in Punjab (1968- 55699)
31. Work Stoppages by Causes in Punjab (1968-99) 557
32. Resolution of Industrial Disputes in Punjab (1969-99) 558
Chapter 13
1. Indian Software and Service Industry (USb$) 569
2. Projected Turnover of IT Software and Service Industry in India by 2008 570and 2007
3. State-wise Software Exports through STPI* of India during 2000-01 570
4. IT Software and Service Exports through STPI, Mohali 571
5. Projected Category-wise Turnover of IT Software and Service Industry in 572Punjab by 2007
6. Projected IT Manpower Requirements during and by 2007 in Punjab 574

List of Figures
Chapter 1
1. Economic Performance of State During 1980s and 1990s 14
2. Per Capita Income in Selected States 1980-81 to 1996-97 (at 1980-81 16Constant Prices)
3. Sectoral Rates of Growth in Punjab 1970-71 to 1998-99 (at 1980-81 constant 18prices)
4. Net State Domestic Product at Factor Cost by Sectors in Punjab 1970-71 to 201998-99 (Constant Prices 1980-81)
5. Type of Expenditure in Punjab, 1967-68 to 2000-01 21
6. Decline in Percentage of Persons Below Poverty Line (1993-94 over 1973- 2474)
7. Variations in Yield per Hectare of Wheat and Rice 19701-71 to 2000-02 26#
8. Demographic Transition in Punjab, India and Kerala (1971-73 to 1999-00) 36
9. Infant Mortality Rate in Selected States 1971-73 to 1997-99 38
10. Average Radius Served per Health Institution (kms.) 40
11. Population Served per Medical Personnel, Punjab 1966 to 1999 40
12. Literacy Rates in Selected States 1991-2001 41
13. Sex Ratio in Selected States 1991-2001 43
Chapter 8
1. Decennial Variation of Population in Punjab 287
2. Decennial Variation of Class-wise Urban Population in Punjab 288
Chapter 9
1. Trends in Total Fertility Rate in India and Punjab (1971-73 to 1997-98) 341
2. Changes in Age-specific Fertility Rates, Punjab (1971-1998) 343
3. Demographic Transition in Punjab (1971-73 to 1997-99) 347
4. Age and Sex-specific Death Rates in Punjab (1971) 348
5. Age and Sex-specific Death Rates in Punjab (1998) 349
6. Infant Mortality in India and Punjab (1971-93 to 1996-98) 352
7. Female Disadvantage in Infant Mortality in India and Punjab (1971-99) 354
8. Trends in Couple Protection Rate in India and Punjab (1973-1998) 359
9. Method-mix among Current Users of Contraception in Punjab (1992-93) 360
10. Method-mix among Current Users of Contraception in Punjab (1998-99) 360
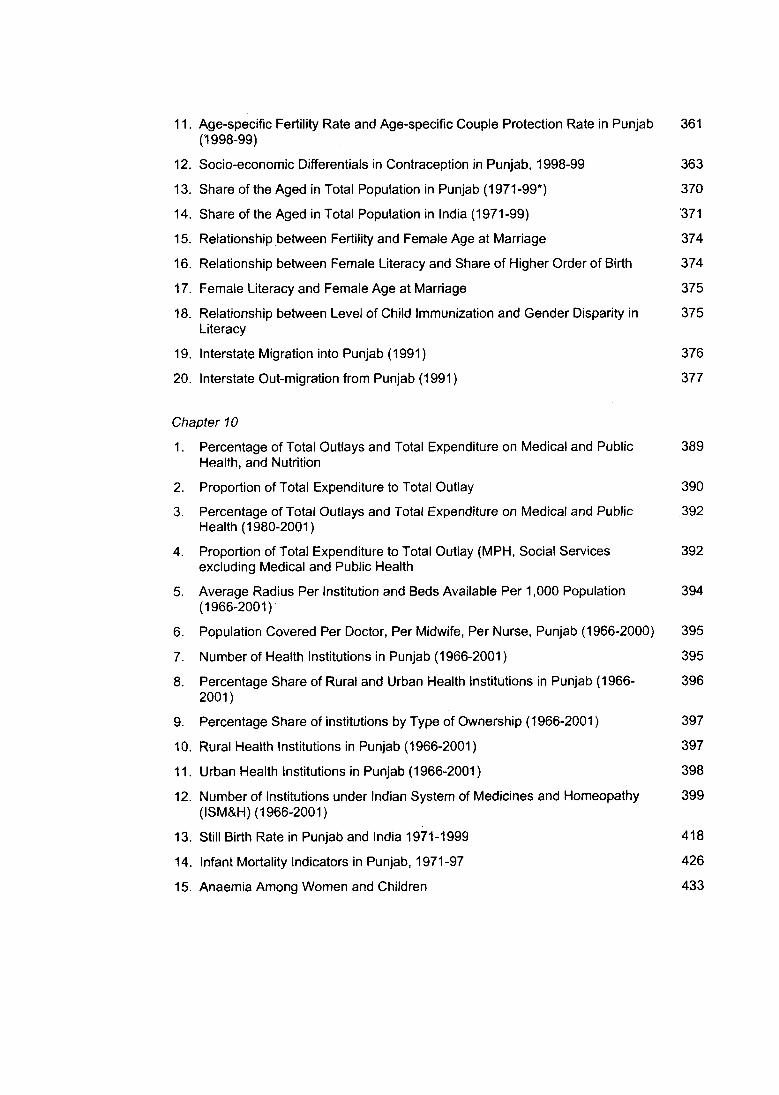
11. Age-Specific Fertility Rate and Age-specific Couple Protection Rate in Punjab 361(1998-99)
12. Socio-economic Differentials in Contraception in Punjab, 1998-99 363
13. Share of the Aged in Total Population in Punjab (1971-99*) 370
14. Share of the Aged in Total Population in India (1971-99) '371
15. Relationship between Fertility and Female Age at Marriage 374
16. Relationship between Female Literacy and Share of Higher Order of Birth 374
17. Female Literacy and Female Age at Marriage 375
18. Relationship between Level of Child Immunization and Gender Disparity in 375Literacy
19. Interstate Migration into Punjab (1991) 376
20. Interstate Out-migration from Punjab (1991) 377
Chapter 10
1. Percentage of Total Outlays and Total Expenditure on Medical and Public 389Health, and Nutrition
2. Proportion of Total Expenditure to Total Outlay 390
3. Percentage of Total Outlays and Total Expenditure on Medical and Public 392Health (1980-2001)
4. Proportion of Total Expenditure to Total Outlay (MPH, Social Services 392excluding Medical and Public Health
5. Average Radius Per Institution and Beds Available Per 1,000 Population 394(1966-2001)
6. Population Covered Per Doctor, Per Midwife, Per Nurse, Punjab (1966-2000) 395
7. Number of Health Institutions in Punjab (1966-2001) 395
8. Percentage Share of Rural and Urban Health Institutions in Punjab (1966- 3962001)
9. Percentage Share of institutions by Type of Ownership (1966-2001) 397
10. Rural Health Institutions in Punjab (1966-2001) 397
11. Urban Health Institutions in Punjab (1966-2001) 398
12. Number of Institutions under Indian System of Medicines and Homeopathy 399(ISM&H) (1966-2001)
13. Still Birth Rate in Punjab and India 1971-1999 418
14. Infant Mortality Indicators in Punjab, 1971-97 426
15. Anaemia Among Women and Children 433

Chapter 11
1. Levels of Educational Attainment in Punjab: 1991 457
2. Management-wise Trends in Enrollment at Primary Schools Level: Punjab 464
3. Dropout Rates at Different Levels of Education 466
4. Growth of Universities and Recognized Colleges in Rural and Urban Areas 487
List of MapsChapter 1
1. Position of Punjab in India 2001 5
2. Punjab Partitioned in 1947 6
3. Reorganization of Punjab in 1966 7
4. Punjab Administrative Divisions 2001 8
Chapter 7
1. Road Network of Punjab 272
2. Railway Network of Punjab 273

Executive Summary
Profile of Development and Change
Punjab is a classic example of a fast developing economy with agnculture at its base. It enjoys the credit of ushering the green revolution in the country. A progressive mix of irrigation, fertilizers and high-yielding variety seeds laid its foundation: a process, which was further strengthened by agricultural credit societies, rural link roads, village electrification, and a variety of extension services. Punjab today contributes nearly 40 per cent of wheat and 60 per cent of rice procured for distribution through the public distribution system. Along with this, the state went in for promoting the white revolution, resulting in the highest per capita availability of milk to the people. A regular agro-based and agro-oriented industrialization has been another prominent feature of the state economy. No less commendable has been the efforts at strengthening the infrastructure, particularly irrigation and power. The cumulative effect of all this is manifest in the highest per capita income of the state, a position of pride which Punjab has been holding for most of the years since its formation in 1966. A paradox may be stated here and explained: Despite its relatively high-income level, the state is noted for considerable outmigration to other parts of India as also emigration to several countries. This is attributed not to any distressful situation at home but to attraction of greater prosperity outside.
Historically, Punjab has experienced many upheavals and turmoil, which, in turn, have influenced its path of development. In fact, the administrative map of Punjab has undergone stupendous changes in the past. At the time of the partition of the Indian subcontinent in 1947, Punjab was bifurcated into two parts: West Punjab (Pakistan) and East Punjab (India). Of its 3,59,179 square kilometres and 29 districts only 1,52,649 square kilometres and 13 districts were left with Indian Punjab. The most prosperous and developed western part went to Pakistan and the relatively backward eastern part remained in India.
Punjab now with an area of 50,362 square kilometres and a population of 2,42,89,296 persons are one of the smaller states of India. The state accounted for 1.5 per cent of the total area of the country and 2.4 per cent of the total population in 2001.
Being a border state, both external as well as internal changes have influenced the path of development. In 1947, the state was partitioned. In 1966, the state was trifurcated into Punjab, Haryana and Himachal Pradesh. The period of militancy, in the recent past due to an internal crisis, had its own influence on shaping the development pattern of the state. Despite all this, it has been able to achieve remarkable success in accomplishing reasonable conditions for a better standard of life.
The development was in accord with the prevailing infrastructure in the state. Its flat physiography has helped laying roads and creating infrastructure at low cost, which is very difficult in a hilly tract. Higher accessibility to services and the strong linkage between rural and urban areas are partly due to this flat physiography. However, its weak points are deteriorating soil health, change in the water table, and lack of minerals and fossil-fuel resources.

The perspective of development that Punjab identified for itself was to boost economic development through the improvement of the rural areas. Rural development was to be achieved through agricultural development, rural electrification, and road connectivity. The state economy has been characterized by the predominance of the agriculture sector, the base for which was available and further developed in a planned manner. Agriculture has been the backbone of the state economy. Even though the share of the agricultural sector has declined, yet two-fifths of the state domestic product is from this sector alone.
The state economy, which was growing at a faster pace than the national economy until the late seventies and was moving ahead almost at the same pace during the eighties, received a setback in the nineties. During the last decade, the annual growth rate of the state economy was slower (4.7%) than that of the national economy (6.9%). Punjab held the top position in per capita income among the major states at the beginning of the nineties, but came down to the fourth place by the end of the decade.
Taking a longer-term view, the share of the primary sector has decreased considerably, from 55.1 per cent to 42 per cent during last three decades or so; the share of the secondary sector on the other hand has increased from 18.1 per cent to 27.5 per cent, and the tertiary sector has recorded a marginal rise from 27 per cent to 30.5 per cent. As required, the major share of expenditure during all the plan periods was reserved for irrigation and power, the critical factors for development of agriculture and industry, respectively. The sad part is that the investment on these two has not given matching returns. There is an unbearable amount of subsidy involved in both. Among other factors, such a situation has led to a considerable decline in the share of development expenditure, from 72 per cent in 1980-81 to 44 per cent in 1999-2001.
Agriculture in the state found a favourable environment in the extensive level topography, sub-tropical continental climate, fertile soils, and favorable conditions of water supply through water bodies and irrigation. All this provided a favorable foundation for the green revolution. The state’s remarkable success in agriculture laid down a base for rapid strides in other sectors of the economy. Today, however, the agricultural sector is going through a crisis. Constraints in respect of a shift from wheat-rice rotation to other crops and difficulties involved in the virtually static level of per hectare yield of rice and wheat are symptoms of the crisis in this sector. There is urgent need to diversify not only the cropping pattern, but also the economy, towards non-farm activities.
Fortunately, for the state, large/medium industries are picking up, as also small-scale industry. This is not to say that industry is free from any problem. These are several, especially those relating to technology upgradation, marketing and foreign investment. These call for speedy resolution, if the problem of rising unemployment among the educated youth, in particular, is to be taken care of,
Despite a strong concern for the development of human capital and a perspective for eliminating the worst forms of human deprivation, the state’s achievements are mixed. Its infant mortality rate of 52 in 2000 was a little less than the world average, but four times more than Kerala. With a sex ratio of only 874 in 2001, the state ranked 27‘ among the 28 states of India. The most telling commentary is that, of the ten districts in India noted for the lowest sex ratio in 0-6 age group, seven are in Punjab. There is something seriously wrong in the social sphere of this economically progressive state.

Punjab now needs to prioritise its requirement^ for making rapid strides. The foremost task ahead is to revive the decelerating rate of its economy. Acceleration must be achieved by the end of the 10 plan. An upgradation of human capital is basic to ensuring a sustained economic development of the state. Improvement in the quality of infrastructure, transport, telecommunication, information technology and irrigation are the prerequisites for achieving sustainable development. It follows that Punjab has the twin task of accelerating economic growth and upgrading human capital by 2020, so as to ensure sustainable development.
Development and Management of Natural Resources
Major natural resources of Punjab are land and water. Both have been over-exploited due to intensive agriculture.
Most of the agricultural soils are nutritionally exhausted and have an all time low level of organic carbon contents.
Over the years the underground water level has gone down by 10 to 15 metres in the central zone. Efficiency of canal irrigation is hardly 40 per cent as against the optimum of 60 per cent in the case of irrigation.
More and more cultivable areas are going out of cultivation due to water-logging and soil salinity, while conservation efforts for reclaiming degraded soils and recharging underground water are slow and inadequate.
The scarce forest cover of Punjab lacks appropriate conservation efforts.
Fiscal and Financial Management
Punjab economy decelerated during the 1990s, after recording the fastest growth in the seventies and mid-nineties. Factors, which seem to have adversely affected the state’s fiscal situation over the past 15 years are a high salaries and wage bill, mounting debt burden, heavily subsidized social and economic services, slow growth of revenue and loss-making PSUs.
Public debt has been a convenient tool for raising resource and the state continues to rely on borrowings to finance its deficit.
The tax base in Punjab continues to be narrow and tax compliance poor.
The ratio of own tax percentage to GSDP has been consistently lower than in the six fast growing states of the country.
Relatively higher revenue expenditure, with lower resources mobilization, indicates scope for improvement in the revenue deficit by improving the tax ratio to GSDP.
Punjab continues to rely heavily on raising funds through the expensive route of small savings. With the reduction of interest rates there is a possibility of swapping expensive loans with cheaper funds.
iti
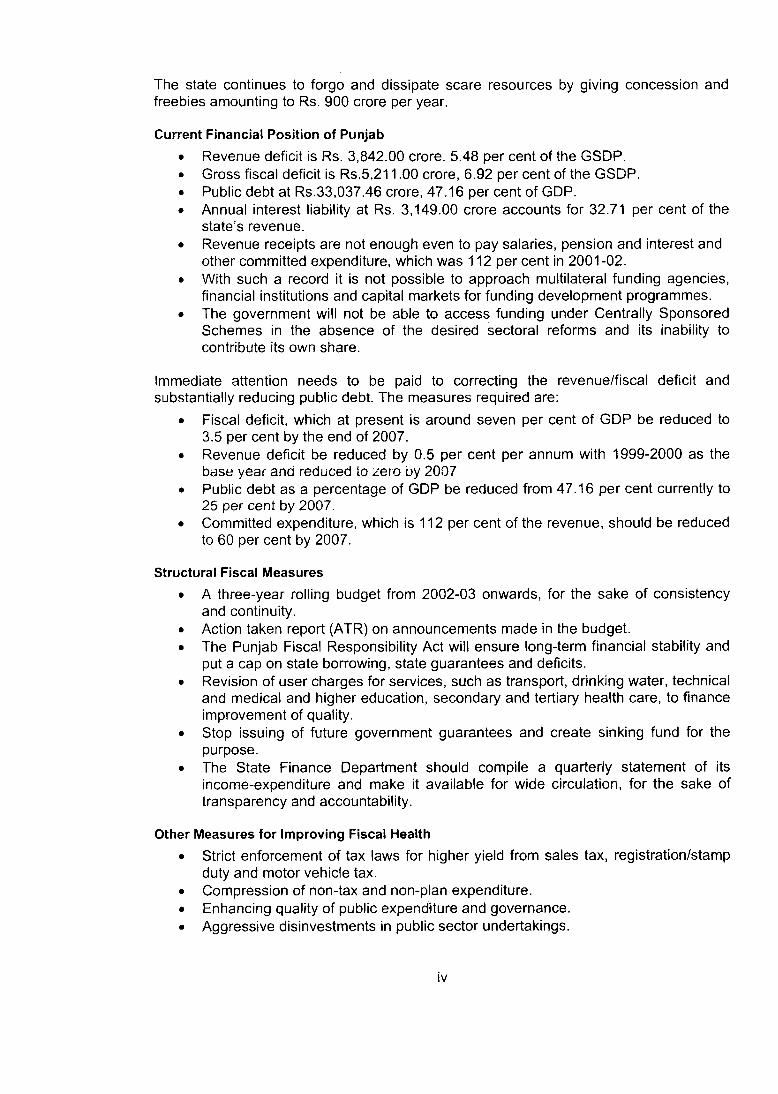
The state continues to forgo and dissipate scare resources by giving concession and freebies amounting to Rs. 900 crore per year.
Current Financial Position of Punjab• Revenue deficit is Rs. 3,842.00 crore. 5.48 per cent of the GSDP.• Gross fiscal deficit is Rs.5,211.00 crore, 6.92 per cent of the GSDP.• Public debt at Rs.33,037.46 crore, 47.16 per cent of GDP.• Annual interest liability at Rs. 3,149.00 crore accounts for 32.71 per cent of the
state’s revenue.• Revenue receipts are not enough even to pay salaries, pension and interest and
other committed expenditure, which was 112 per cent in 2001-02.• With such a record it is not possible to approach multilateral funding agencies,
financial institutions and capital markets for funding development programmes.• The government will not be able to access funding under Centrally Sponsored
Schemes in the absence of the desired sectoral reforms and its inability to contribute its own share.
Immediate attention needs to be paid to correcting the revenue/fiscal deficit and substantially reducing public debt. The measures required are:
• Fiscal deficit, which at present is around seven per cent of GDP be reduced to 3.5 per cent by the end of 2007.
• Revenue deficit be reduced by 0.5 per cent per annum with 1999-2000 as the base year and reduced to zero by 2007.
• Public debt as a percentage of GDP be reduced from 47.16 per cent currently to 25 per cent by 2007.
• Committed expenditure, which is 112 per cent of the revenue, should be reduced to 60 per cent by 2007.
Structural Fiscal Measures• A three-year rolling budget from 2002-03 onwards, for the sake of consistency
and continuity.• Action taken report (ATR) on announcements made in the budget.• The Punjab Fiscal Responsibility Act will ensure long-term financial stability and
put a cap on state borrowing, state guarantees and deficits.• Revision of user charges for services, such as transport, drinking water, technical
and medical and higher education, secondary and tertiary health care, to finance improvement of quality.
• Stop issuing of future government guarantees and create sinking fund for the purpose.
• The State Finance Department should compile a quarterly statement of its income-expenditure and make it available for wide circulation, for the sake of transparency and accountability.
Other Measures for Improving Fiscal Health• Strict enforcement of tax laws for higher yield from sales tax, registration/stamp
duty and motor vehicle tax.• Compression of non-tax and non-plan expenditure.• Enhancing quality of public expenditure and governance.• Aggressive disinvestments in public sector undertakings.

• Power sector reforms and improving the finances of the PSEB by implementing in full the recommendations of the State Electricity Regulatory Commission Report.
• Diversification of agriculture.• Improvement in the quality and delivery of education and health services.• Fast-track disinvestments of PSUs.• Accessing capital market for infrastructure development through bankable
projects.
The economy of Punjab cannot improve in isolation. It should be the outcome of political consensus. The growth of the economy has to be a long-term programme to be continued with the same tempo, zeal and fervour, irrespective of the type or shade of the political party in power.
With these extensive reform measures the budgetary support can be accessed from the World Bank (WB), supported by a ‘Project Report’ highlighting the state’s development and poverty alleviation programmes. The WB prepares a Project Report at its own cost. Ordinarily the World Bank and other international institutions look forward to support development plans, which are growth-oriented and self-sustaining in the long run.
Measures for stabilizing the financial position of the state should be strictly enforced so that growth of revenue income and control of expenditure bring down the revenue deficit to zero and fiscal deficit to 3.5 per cent by the end of 2007. The fiscal scenario in 2012 and 2017 at the end of the 11* and the 12* Five Year Plans respectively, and up to 2020, should generate revenue surplus in each year after 2007-2008, provided the structural fiscal reforms, as suggested, are consistently implemented, particularly the levy of user charges on a cost-plus basis. This will attract support from international financial institutions and the private sector for augmenting non-budgetary funds for accelerated development.
Without tough measures to consolidate the fiscal situation and accelerate structural reforms, including abolition of untargeted subsidies, the fiscal position of the state is not likely to improve. The longer the fiscal deficit goes uncorrected, the greater the risk of steep reduction in the developmental activities.
Development of Agriculture and Allied Sector
Punjab is an agriculturally progressive state producing over eight tonnes per hectare of wheat and rice, with 94 per cent of the cropped area irrigated, and 186 per cent cropping intensity. It uses 184 kg/ha of chemical fertilizers and has 9.35 lakh tractors in use. Lately, agricultural activities have begun to show signs of fatigue, because of:
• Monocropping of paddy and wheat with attended manifestations of stagnatingyields, increase in cost of production and low returns.
• Over-exploitation of water and soil resources.• Declining public and private sector investments.• Inadequacies in marketing, pricing and processing of vegetables, fruits and other
crops.• Dwindling agricultural research and extension inputs.

• Crop diversification with high yielding, remunerative alternative crops, supported by pricing and marketing.
• Soil, water and environmental conservation.• Efficient management of input-use for increasing crop and animal yields.• Facilitating contract, commercial and organic farming.• Introduction of corporate sector in services and agro-processing sectors.• Re-vitalization of research and extension.• Re-orientation of subsidies in the light of WTO.• Strengthening Panchayati Raj and co-operative systems.
Rural Development
The term rural development connotes overall development of rural areas, to improve the quality of life of the people. In the Indian context, rural development assumes greater significance as three-fourths of its population still lives in rural areas. Strategically, the focus of planning was to improve the economic and social conditions of rural society, especially its underprivileged sections, thus, economic growth with social justice became the proclaimed objective of the planning process under rural development.
In the case of Punjab, high priority was given to setting up local-level administrative infrastructure at the block level, to promote agriculture and allied activities to meet the food grains requirements of the nation during 1965-66 to 1980-81. As production increased, expenditure on infrastructure development such as irrigation, communication, pavement of streets, construction of drainage and village betterment also increased. Better infrastructure further helped in increasing production. Although the spread of the green revolution has helped rural society in increasing levels of living considerably, today rural Punjab is facing a peculiar situation arising out of increasing cost of production and stagnating returns in the agricultural sector. Moreover, the value addition of agricultural produce cannot take place because of low investment flow towards agroprocessing activities. This has resulted in less employment avenues for rural unemployed. Despite better rural infrastructural facilities than other Indian states, rural Punjab has lagged behind in terms of social and human development. Moreover, within Punjab there are disparities between rural and urban areas in accessibility of basic facilities in respect of households having pucca houses, toilet facilities, electricity connections and safe drinking water. The situation regarding education, health and demographic indicators too is no different. Punjab has one of the lowest sex ratios in India. In rural areas too the sex ratio is on a lower side. In spite of increasing flow of credit, the share of institutional credit has not expanded at the required level, towards crop diversification and promotion of the rural non-farm sector.
Though decentralized planning under the new Panchayati Raj set-up has also brought with it the decentralization of finances and delegation of powers, however, in actual implementation these are not given to PRIs. Even time-bound action plans have not yet been developed for state, district and block levels, for organizing orientation/education traininglDrogrammes for the representatives of PRIs and development functionaries.

The industrial sector has shown impressive growth during 1980 to 1997, covering the Sixth, Seventh and Eighth Five Year Plans, but declined in 1997 to 2000, the first three years of Ninth Plan. During 1980-2000, employment increased three times, the-^number of industrial units five times, investment and production 18 times, both in the large and medium and small scale sector. Small-scale industry (SSI) accounts for 80 per cent of the total employment, contributes 40 per cent to production and 60 per cent to exports, with 20 per cent investment of the industrial sector.
Regional disparities in industrialization persist. Ludhiana, Patiala and Ropar districts account for half the industrial production in the state. On the other hand, Faridkot, Mansa and Muktsar districts have a share of less than one per cent each.
The SSI sector, the backbone of the industrial economy in the state, is passing through a critical phase, mainly on account of such factors as low level of technology resulting in low industrial productivity and poor quality of products leading to competitive disadvantage both in domestic and global markets. The small-scafe sector has to acquire the capability to produce quality products, to compete in the international market, it has to transform itself from a protective to a competitive environment.
For the survival of industry and to sustain the tempo of growth, the broad measures suggested are modernization and technological upgradation through innovative R&D; product adaptation; human resource development through skills upgradation and training: planned development of quality infrastructure: market-oriented policy and institutional framework.
The state must follow a pro-active policy to promote partnership with industry for both utilizing existing infrastructure and establishing badly required new facilities.
The government’s role should be limited to that of an effective facilitator and co-ordinator of the process of growth, providing transparent, conducive policy framework and efficient delivery mechanism through good governance.
Upgradation of existing research and development centres in the state has been suggested so as to provide the latest design and testing techniques to the industry. Keeping in view the emerging requirements of industry and lack of financial support from central and state governments, the management of these may be entrusted to the relevant associations of industry, on the basis of binding partnership protocols evolved through a consultative process. This approach will ensure effective working of R&D centres to meet their objectives.
Industrial clusters and parks should be set up sector/product-wise, with a focus on agrofood processing, bicycle and bicycle parts, automobile and automobile parts, machines and machine tools, sports goods, leather and leather goods, hosiery and textile industries. This will facilitate building a centralized and modern infrastructure. The private sector and financial institutions should be encouraged to participate in these activities. In addition, infrastructure in all existing industrial areas and focal points should be upgraded.
Agri-export zones (AEZs) for different products should be set up expeditiously. These will facilitate provision of ail export incentives to boost exports, centralized modern

facilities, value addition, better productivity and higher incomes to the farming sector. The Government of India should also set up special economic zone, (SEZ), for linkage with the global market with focus on the export of industrial products.
It is essential to set up industries in the large and medium (L & M) sector in the state for their balanced growth. Appropriate facilities and incentives should be provided to multinational companies (MNCs) to set up manufacturing facilities in the state, especially in agro-food processing, light engineering and electronic hardware industries. NRIs should be encouraged to invest in the state.
An appropriate institutional mechanism, consisting of representatives of the Reserve Bank of India, financial institutions, banks, industry and state government, with adequate powers and the resources, should be created, to provide requisite financial support to small-scale units suffering from sickness or showing symptoms of sickness. A system should be evolved for timely detection of sickness at the initial stages for speedier necessary action.
The tax structure should be simplified and rationalized, compatible with that of the neighbouring states. Easy and timely credit at interest rate equal to prime landing rate (PLR) should be available to the SSI sector.
Infrastructure Development
Societal development uses infrastructure as a base, and therefore, it cannot be allowed to become a limiting factor in the process of development. Analysis of the vision reflected in the various plan documents reveals that the future of Punjab lies in changing the cropping pattern, agro-processing, and development of the service sector. This is in the light of the fact that Punjab is highly urbanized and will emerge as the most urbanized state of India by 2020.
Power
This vital sector is in the doldrums in Punjab. There is free power to agriculture, exorbitant rates for industry, and unpaid bills to both coal suppliers (Coal India) and transporters (Northern Railways). The Goindwal project is stagnating, with lending agencies staying away, because of the unsustainable economic basis of this sector in Punjab.
The possibility of a major increase in power generation in Punjab exists only via the thermal route. This is relatively inefficient, since transmission of electricity from pit-head thermals through grids is cheaper than carrying coal. Increase in thermal generation with attendant problems of ash disposal, is also undesirable ecologically. Punjab is already buying 25 per cent of its requirements, from other agencies, and this will go up to 50 per cent by 2015. The state should immediately act in accordance with the emerging road map in the power sector, and take advantage of trading power on the grid. The measures required include setting up of a functional State Electricity Regulatory Commission, and structural changes in generation, transmission and distribution.
Punjab should involve people in the reforms process. A participative model has been suggested that hands over distribution and user-charge collection to panchayats and

urban local bodies. An innovative scheme to bring about VRS in Punjab State Electricity Board by involving the surplus employees in power maintenance activities at the panchayat could also operate in tandem to further leverage the success of the rationalization of staff.
IT & Telecom
Punjab is treating this sector like any other government function, with 'departments’ 'apex bodies’, '(government) corporations’. This is precisely how IT & Telecom shoulc not be dealt with. Government should stay away from any control aspect and act only as a facilitator. There must be no 'approvals’ in the traditional mould; the emphasis of government should be only on removing bottlenecks.
As a priming aid to the IT services sector, the government should move in inducting IT in the state through two time-bound initiatives:
• e-governance at the government-public interface, such that the total cost of service deliveries goes down.
• bring in virtual 'mandis’ through a State Commodity Exchange, to empower the farmer, and expose his produce to national and international trading.
In inducting IT in the government, it has been emphasized that no new jobs would be created for executives (programme data entry operator, etc.). The new employment will be automatically generated in the non-government IT services sector, in the task of laying down of links, writing software, and network commissioning and management.
Transport
The dominant forms of transport are roads and railways.
The government has laid down a policy for private participation in the road sector, but has made a fundamental error of allowing the bidders to shift the risk to the government. This should be reviewed: othen/vise liabilities are likely to result. The toll-road model has really not taken off well in many states: and what is suggested is a model of petroleum- product taxation for road development. A levy of Rs 1/- per litre on MS / HSD should maintain the funds required for future road projects. The roads should be capable of handling container trucks to move produce for agro-processing. It is also suggested to make cycle tracks between towns and surrounding villages.
Railway infrastructure needs both strengthening and fresh creation. Using the power of the central government to permit taxation, a Punjab Rail Development Fund should be created by levies on passengers to and from Punjab. A large differential exists between road and rail fares, permitting the levying of such a cess. This fund can generate Rs 1,200 crore needed for rail infrastructure over the next decade.
Policy Recommendations
• The state should give up a subsidy-based approach and move towards a techno- commerciai basis for infrastructure projects.
• Realize that users are willing to pay for services, provided their overall quality meets their requirements. People would rather pay for good services, than suffer a defective free service.

• Major reforms should be brought through people’s participation, not governmental diktat.
• Induction of new technologies should not give rise to new bureaucracies, but result in enhanced service deliveries, through process re-engineering.
While the rural sector will remain important, a policy shift emphasizing an increasingly urban character to Punjab should be inbuilt in the decision-making processes.
Urban Development
In Punjab, which is the fifth major urbanized state in India and a highly urbanized state in the northwest region, the growth pattern of urban centres is creating imbalances in infrastructure, housing and level and quality of services. The situation is the worst in small and medium towns. City governments are financially weak and functionally unstable.
There is urgent need of an ‘urbanization strategy’ to cover the entire population with water supply, sewerage, solid-waste management, basic amenities, civic services and infrastructure: strengthen urban local bodies (ULBs) through devolution of functional and financial powers; capacity building of urban administrators: construction of connecting roads, housing in peripheral areas: and efficient transportation facilities with special emphasis on small and medium towns.
Local government, being a state subject, operates under state control. Legislations conforming to the 74* CAA have been passed but there has been no change in the functional and financial domain of ULBs. Fragmented functioning, due to parastatals involvement in municipal affairs, is affecting the functional domain of ULBs. There is need to reduce interference by the state government in municipal affairs. Constitution of Ward Committees, District Planning Committees and Metropolitan Planning Committees is a must for the empowerment of ULBs. The Mayor-in-Council/President in Council System will strengthen functional democracy in the state.
The fiscal domain needs to be strengthened by broadening the taxation powers of ULBs: levying new taxes; improving tax administration of octroi, property tax, water supply and sewerage charges; pricing and cost recovery; local resource mobilization and full implementation of recommendations of State Finance Commissions and Central Finance Commissions.
There are serious deficiencies in the volume as well as quality of municipal services and infrastructure. The task of financing urban infrastructure and services is challenging and needs Rs.6,000 crore at Rs.1,200 crore per annum. With the contributions of Urban Local Bodies at Rs.150 crore per annum, the Punjab Infrastructure Development Board at Rs.75 crore per annum and state government transfers at Rs.75 crore per annum, it will be easy to access Rs.900 crore per annum from the capital market. Additional resource mobilization of Rs.60 crore from property tax, user charges and fees and rents will help improve the fiscal base of ULBs and attract the private sector for financing urban infrastructure.
Raising municipal bonds for financing urban infrastructure calls for reforms, through rationalization of tariffs, pricing and cost recovery, preparation of commercially viable

projects, investment-grade credit rating, effective billing and collection, asset management and upgradation of professional skills of municipal staff. Pooled financing mechanism will enable smaller ULBs to raise funds for financing infrastructure. A state level regulatory body should be created to monitor quality of services, prices charged and involve private sector participation (PSP) in infrastructure development and service delivery.
PSP and people’s involvement in municipal affairs and urban development activities should be promoted to offload financial, functional, managerial and administrative burden of ULBs. PSP in water supply, sewerage, solid-waste management, maintenance of parks/street lights, bill distribution, etc., on the pattern of municipal towns of Hyderabad, Alandur, Tirupur, Rajkot, Pali, CIDCO (Mumbai), Belgaum, Hubli, Mysore and Ludhiana can help ULBs of Punjab to improve O&M of services, pricing and cost recovery and infrastructure development. People’s involvement in municipal affairs on the pattern of Baroda Citizen Council (BCC), EXNORA (Chennai), SRISTHI (Delhi), Muskan Jyoti Scheme (Lucknow), Surat Citizen Council, and Urban Community Development Project (Pune) can dramatically improve sanitation, sensitise people to comply with user charges, urban poverty alleviation and slum development. The Government of India introduced Urban Reform Incentive Fund (URIF), City Challenge Fund (CCF), Pooled Finance Development Scheme (PFDS) and constituted a Task Force in its budget of 2002-03 to promote PSP in urban infrastructure development.
Housing is a must for low-income groups and below-poverty line population. In Punjab, the requirement of funds for this purpose is huge and HUDCO, National Housing Bank (NHB) and BMTPC are not doing much to provide housing to vulnrerable groups. The Government of India, through NHB, introduced ‘Mortgage Guarantee Scheme’ to protect lenders against default and formulated the National Housing and Habitat Policy (1998). It constituted URIF to provide reform-linked assistance as an incentive for reforms in rent control laws, simplification of legal and procedural frameworks for conversion of agricultural land and revision of by-laws. The Punjab Government needs to revamp its institutional set-up for housing, provide housing loans at affordable interest rates, raise funds from the private sector through PIDB, involve ULBs and promote development and use of low cost and locally available material and user-friendly technologies for construction of houses for the poor.
Slums/slum population need immediate attention. Programmes and schemes should be implemented properly for improving the living conditions of slum dwellers. The state must utilize central government grants. Slum dwellers should be involved in slum development activities and assistance from national and international agencies should be mobilized.
In Punjab, urban poverty is an issue but of dimensions different from other states. It manifests itself in various forms such as deprivation of shelter, basic amenities, such civic services as education, health and calories, and miserable living conditions. The poverty level of Punjab, as defined by the Planning Commission of India, is slightly higher than Bihar and considerably lower than U.P., Orissa and Rajasthan. A slight upward revision of the poverty line can raise the number of the poor considerably. District-wise trends of urban poor indicate that Ludhiana and Jalandhar districts have the largest number of urban poor (i.e., more than 50% BPL families), and hence require immediate attention. Poverty alleviation schemes have not had much impact because of the inadequate participation of the poor, lack of convergence of line-departmental

schemes and programmes. Programmes and schemes need to be re-oriented in the pattern of Kerala and Self Employed Women’s Association (SEWA) of Ahmedabad. ULBs should create poverty alleviation funds with special emphasis on employment, security and opportunity as envisaged in the World Development Report 2000-01.
Punjab’s future is urban. By 2020, Punjab will have about 45 per cent urban population or even more. At present, deficiencies in urban infrastructure/services are crucial problems of urban development. The slums/slum population, urban poverty, houseless ness and poor fiscal position of ULBs are inhibiting sustainable urban development. Without a long-term urban development strategy, cities, big and small, will become unmanageable, unlivable and unproductive.
Well managed ‘urbanization’ will facilitate and sustain economic growth, improve service delivery and develop environmental infrastructure to improve the quality of life. The ‘urban development strategy’ should promote good governance, provide cent per cent coverage of basic civic services and adequate housing to the shelter less urban poor, reduce urban poverty and emphasize on efficient management of municipal assets and development of municipal lands for income generation. Protection of urban environment, involving the private sector, for low cost and efficient delivery of services, offloading functional and fiscal responsibilities, ensuring people’s participation in urban affairs and change of current policies and practices including legal and administrative reforms, are the other aspects which constitute essential components of a forward-looking development strategy. The vision for urban areas of Punjab by 2020, or even earlier, is one of sustainable development. In the short term, emphasis should be on full coverage of the population with infrastructure and services as part of a long-term perspective, qualitative improvement of governance, urban basic civic services and environment protection.
Demographic Development
Fertility has been falling consistently in Punjab since the beginning of the 1970s and the state has reduced its total fertility, approximately by half, from the early seventies to the late nineties in a totally different socio-cultural environment. Except for 1977-79 to 1982- 84, during which the decline stalled, the process of fertility transition is reasonably consistent in Punjab. Diminishing crude birth rate (CBR) and total fertility rate (TFR) point tovyards new environment of reproduction in Punjab. The decline in fertility is extensive in the state, and is not confined to any specific community or region. Rural and urban areas are experiencing transition in fertility in different ways in the state, depending on changes in local conditions. The sizeable decrease in fertility, despite some of the key social indicators, such as strong son preference, sizeable presence of socially backward population and relatively higher infant mortality being against the decline, is a manifestation of the primacy of intervention by selected development factors, namely, the family planning programme, female literacy and prosperity at the household level. The age pattern of childbearing in Punjab has undergone a change duhng the last three decades with fertility limitation being increasingly common at relatively old ages. Though fall in fertility has been observed among women in all ages, the contribution to the fertility decline has been mostly from women in the age 35 years and above. Recent indications do not signal the possibility of reaching the replacement level in the state by 2010, and the state’s fertility is estimated to be 5-24 percent above the replacement level, with sharp rural and urban variation. With nearly two-thirds of the

population still living in villages, the prospects of stabilizing the population in the near future in Punjab depends on the success of the population control effort in rural areas. Fertility differentials are sharp, and over tinie, there has been little change in relative positions by social or economic class in terms of the respective contribution to overall fertility, though the major social and economic groups have shown a decline in current pregnancy rates and fertility.
Both rural and urban areas gained consistently from the onset of mortality decline, even if rural death rates continue to exceed urban death rates in Punjab, as elsewhere in India. Gains to males as well as females from mortality decline are distinct over the years, with net gain to females, notwithstanding early-age vulnerability, surpassing the gains to males in the process of mortality transition. In fact, a notable feature of mortality transition between 1971 and 1998 has been the larger gains for the females than for males in general. The narrowing down of sex differential in mortality, characterized by comparatively higher female mortality, has yielded to a reverse, yet, more common pattern, where male crude death rate outstrips female crude death rate. At some specified ages, the sex of the individual is one of the important indicators of exposure to death. While female mortality-disadvantage is greatly pronounced during childhood and adolescence (0-14 years), male vulnerability begins to be high from the age of 20 and onwards. In spite of a seemingly lower infant mortality rate (IMR) in Punjab, than in most of the major states of India, the number of deaths before the first birthday is very high. Mortality, among infants is not showing signs of real decline since the early nineties. Reasons for this merit some investigation, in the context of the link between overall economic deceleration in Punjab and living standards of households, particularly in the rural sector. Infant and childhood mortality in Punjab is characterized by sharp sex- differential between male and female children. Data show comparatively high female mortality in Punjab than in other states of India. In spite of improvements in literacy, expansions in outreach of health care services and overall standards of living in recent times, the sex composition of infant mortality trends in Punjab indicate greater vulnerability of the girl child remains virtually unchanged. On the contrary, more recently, data reveal intensification of gender disparity in mortality in Punjab at every stage of childhood, particularly before the fifth birthday. Rise in female disadvantage in mortality between 1992-93 and 1998-99 is a worrisome sign, implies preponderance of social, cultural and economic rather than health and medical factors, and reinforces the need for corrective measures.
Lack of knowledge about contraceptive methods is no more a barrier to spread of family planning, as knowledge about any method of contraception is most widespread in Punjab (100%). It is interesting to note that among different methods of family limitation- condom, intra-uterine device (lUD) and pill-are most well known in Punjab than in any where in India. In general, modern methods are better known among the eligible women (100%) than the traditional ones (78%). Rural areas almost match urban centres in the knowledge of modern contraceptive methods, but the later have an edge in the awareness of some traditional ones, namely the rhythm or safe period and withdrawal. Social, economic and demographic backgrounds of the couples are no more a determining factor in the spread of awareness regarding methods of family planning. Comparison of sources of contraception by current users between 1993 and 1999 points towards the growing role of the private sector. In Punjab there are indications of virtual non-existence of social marketing outlets in rural areas for the oral pill and condom. Available outlets have meagre stocks of supplies, depend more on government sources for procurement of supplies, and secure better participation of women than men in the

majority of the villages. The social marketing network is marked by little segmentation of clients, poor need-based vending, limited access, cultural insensibility and lack of motivation. On a better side, Punjab is widely recognized for its good performance in implementing the family planning programme. Since the inception of the programme, as compared to the national average, the contraceptive prevalence rate (CPR) has consistently remained high in Punjab. Apart from awareness, the growth in CPR can be attributed to vigorous programme implementation strategies, mainly tagged to incentives and disincentives to programme-staff and clients.
Attempts at greater economic and social development in Punjab must also include focus on demographic dynamics. The contours of population planning must go beyond the goals set in the National Population Policy and cover grounds that are central to larger issues of human development. Some of the direct and foreseeable demographic challenges that Punjab faces today can be outlined as attainment of replacement level of fertility, elimination of early-age child-bearing, reducing infant and childhood mortality coupled with excess female disadvantage, getting rid of sex-selection during conception and practice of female foeticides, balancing a skewed sex ratio that is highly masculine among children, eliminating extensive son-preference, raising low hospital delivery rates resulting in undesirable maternal deaths, changing the unfavourable demographic regime among socially and economically weaker sections, meeting the unmet need for contraception, promoting men’s participation in family planning, removal of regional demographic disparities, and preparations for dealing with an ageing population. Enunciation and implementation of a State Population Policy can be an effective instrument of desired demographic change in Punjab.
Health
During the formulation of each of the Five Year Plans, the state government has continued to focus largely on strengthening the health infrastructure in the form of buildings, machinery, equipment and manpower for primary health care. It has not realized the importance of having a proper health-management information system, which would have helped in setting need-based priorities. Moreover, the state did not make much effort to establish referral linkages, management of life-style diseases - diabetics, cancer and cardiovascular diseases, regulation of private health care services, and involving the voluntary sector in various health programmes.
Analysis of allocations and expenditures indicate that during all Five Year plans, outlays for MPH have remained between 1.9 per cent and 4.5 per cent of the total outlay, nutrition between 0.04 to 0.5 per cent and other social services between 12.3 to 28.3 per cent. On the other hand, expenditure patterns indicate that in reality the percentage share of MPH had been between 1.5 and 2.5 up to the Eighth Plan, rising to 4.2 per cent during the Ninth Plan. The percentage share of nutrition was insignificantly low at 0.04 to 0.3 of the total expenditure during all the Five Year Plans. However, the share of expenditure on other social services (excluding MPH and nutrition) rose considerably during all the Plans, from 10.8 per cent in the Fourth Plan to 24.0 per cent in the Ninth Plan. This indicates clearly that health and nutrition has been accorded a lower priority among the social services.
Punjab has 2,852 Sub-Centres, 1,465 Subsidiary Health Centre (each having a medical officer and a pharmacist), 484 PHCs, 117 Community Health Centres, three medical and

two dental colleges along with attached hospitals. In addition, 40 mobile dispensaries have been provided for intensive health care to serve the population living within 16 km of the international border. There are 230 Allopathic hospitals in the state. They range from 50-beds hospitals in smaller towns to larger hospitals attached with the five medical colleges, one each at Patiala, Faridkot and Amritsar and two at Ludhiana having facilities for dealing with complicated cases and acting as referral hospitals and teaching colleges. There are 473 Ayurvedic dispensaries, 17 Ayurvedic Swasthya Kendras, five 10-bedded Ayurvedic hospitals (one each at Jalandhar, Bathinda, Ludhiana, Hoshiarpur and Amritsar), and one government Ayurvedic college at Patiala, 105 Homeopathic dispensaries, and 34 Unani (Arab/Persian medical system) dispensaries in the state to promote the Indian system of medicines and Homeopathy (ISM&H). The state has one doctor for every 1,470 of the population, and one hospital bed for every 864 people - ratios that are probably the best in the country. There have been significant improvements in the average radius covered per institution and a consistent increase in the availability of manpower (both medical and para-medical). The provision of health institutions in the state increased 4.5 times (6.4 times in rural areas and two times in urban areas) during 1966-2001. The percentage share of rural health institutions improved from 55.4 in 1966 to 81.6 percent in 1990. The local self-government and the voluntary sector have withdrawn from the health sector. No information is available on the number of private practitioners, number of private clinics and nursing homes.
The incidence and prevalence rates of morbidity patterns in Punjab are higher than the all India average. Morbidity is higher in rural than in urban areas. More people suffer from chronic diseases with increase in age. Education has not had much impact on the morbidity patterns, except that the reporting of illness was less among the illiterates, or not formally educated, in both rural and urban areas of Punjab. There were fewer patients with chronic diseases in rural areas of Punjab compared to all-India and vice versa for urban areas. The number of persons reporting ailments generally increase with increase in age. Chronic illness is generally more prevalent among those who are 40 years, or older. Reporting of ailments is generally higher for general castes than the Scheduled Castes. Examination of the reasons for untreated episodes of sickness reveals that in the majority (83%) of the cases treatment was not taken because the ailment was not considered serious. Financial reasons were cited by very few persons (six percent in rural areas and two percent in urban areas).
Regarding the utilization of health care services, NFHS-2 indicates that the public sector is the major provider of vaccination for children in Punjab. Eighty-eight percent of all the children received vaccination form the public sector, but for curative services, a large majority of households (86%) normally visit the private medical sector. In fact, the use of private sector is much higher in Punjab than at the all India (69%) level. Allopathic treatment is the most preferred form in both the rural and urban areas of the state. The people here believe less in obtaining treatment from a medical shop, or store in the adjoining areas, than in other parts of India. Households in Punjab also do not believe in going to faith healers or religious persons for treatment. The percentage of ailments receiving non-hospitalised treatment from government sources in Punjab declined from 12 per cent to seven per cent in rural areas, and 11 per cent to six per cent in urban areas, during the 42"" and 52'" rounds of NSSO. Though the all-India trend shows a similar picture, the gap is not as steep as in case of Punjab. As for non-hospitalised cases, the cost of treatment is less in the private sector than the public sector, in both the rural and urban areas of Punjab and in the country as a whole. Cheaper outdoor treatment in the private sector indicates that it is striving to provide curative services at

par with the public sector in the state. The cost of treatment is usually higher for males and boys than for females and girls, in Punjab as well as all-India. At least, two-thirds of the cost of medical treatment is towards fees and medicines. The cost for clinical tests in rural areas is higher than in urban areas. These are expensive in both rural and urban areas of Punjab, as compared to all-India.
The health status of women and children in Punjab is reflected in such depressing features as the declining sex ratio (874 per 1000 live births), high proportion of IMR (51 per 1000 live births) and a high prevalence of anemia. Thus, women and children in Punjab are the vulnerable sections and their needs call for precedence. Antenatal care has moved down on the priority list of the para-medical staff. Non-utilization of antenatal care, particularly among women in rural areas, has increased from 13.6 per cent in 1992-93 to 30.8 per cent in 1998-99 (NFHS I & II), causing different kinds of health problems among women and children. Less than two-fifths of the deliveries in Punjab are institutional (37.5%). Privatization of maternity health care services is much evident in Punjab, particularly for conducting deliveries and treating reproductive health problems. This is increasing the number of caesarian section births in Punjab. It has doubled from 4.1 per cent in 1992-93 to 8.2 per cent in 1998-99 (NFHS I & II), and particularly in urban areas (NSS 52"" round), either because of inadequate antenatal care or vested economic interests of the doctors.
Obesity as a problem exists amongst women in Punjab. With 30.2 per cent obese women it ranks second, next to Delhi (34%). Prevalence of anemia amongst women and children exists and has serious implications. In Punjab, 80 per cent of the children (in the age group 6-35 months) and 41.5 per cent women (in the age group 15-49 years) suffer from anemia. The state has 8.9 per cent of its population facing the risk of fluoride deficiency as compared to 6.9 per cent at the national level. The Iodine Deficiency Cell has enforced ban on the sale of non-iodized salt to reduce iron deficiency. It can be further reduced by enforcing food fortification. Considering the level of urbanism and the impact of consumerism in Punjab, fortified food would be a welcome change. Breast feeding practices in Punjab are faulty and can be enhanced significantly by increasing institutional deliveries. Women delivering in public institutions are reported to be following the right kind of breast feeding practices (14.2 % within the first six hours) and not wasting the first milk by squeezing out the precious colostrums, which is vital for child survival. Dietary patterns in Punjab reveal that, the consumption of milk is higher than in the other states in India (875 grams per day). Further, a decline in the intake of calories and proteins is evident, while there is an increase in the intake of fats.
Education
School Education
Punjab ranks le**" in terms of literacy among Indian States and Union Territories. Although the literacy rate has increased from 58.51 per cent in 1991 to 69.95 per cent in 2001, an overall increase of 11.44 per cent, there are still 95 lakh illiterates in the state (2001 Census).
There has been a quantitative expansion of educational institutions. The total number of schools increased from 9,394 in 1970 to 16,038 in 1980 and further to 18,998 in 2000-2001. The most massive expansion has taken place at the primary level. Today, except

for some remote areas, every village has access to primary schools. However, 16 per cent habitations do not have access to an elementary school within the norm of three <ms. Further, the shortages of secondary schools within a distance of five kms, and senior secondary schools within a distance of eight kms are ten per cent and 20 per cent, respectively. Nearly one-fourth of the children is either not enrolled in schools or are in unrecognised schools. There are still about 2.97 lakh children of 6-14 age group who are out of school.
The share of government schools in total enrolment in primary classes is gradually decreasing and has come down from 71.86 per cent (1996) to 66 per cent (2000), but there has been a larger growth in the share of unrecognised private schools from 19 per cent to 25 per cent during the same period. It reflects the disenchantment of the public with government run schools. Punjab has the highest number of students enrolled in private schools after UP.
Although the dropout figures in Punjab have declined to some extent, its rate is still very alarming; 20 per cent of the children drop out at the primary level, 37 per cent at the middle level, 40 per cent at the secondary level and 78 per cent at the 10+2 level. It is shocking that out of 100 children enrolled in class I, only 22 reach senior secondary level.
Infrastructural facilities and civic amenities are lacking in the schools. There are schools without buildings and many of those with building, need urgent repairs. These are in a dilapidated condition and have been declared unsafe for use as classrooms. The majority of the schools are also facing the problem of shortage of toilets, classrooms, playgrounds, boundary walls and verandas.
Apart from physical inputs, the most glaring weaknesses are lack of motivation in teachers, outdated teaching methodology and unskilled teachers. Although Punjab has a respectable pupil-teacher ratio of about 41 at the primary level, a one-way dialogue between teachers and students has remained the norm and learning by rote the only methodology. Further, the education provided is hardly relevant to the day-to-day life of the students. The quality of teaching in schools can be judged by the poor examination results. At present 50 per cent of the students fail at the matriculation level.
The heavy syllabus prescribed and the faulty system of examination for awarding marks in most of the schools, adversely affect the quality of school education and fail to rouse the inherent creativity of the children. Schools without any sanctioned post of a teacher and teacher absenteeism are other causes of poor quality of school teaching.
The allocation of resources in education is only 2.88 per cent as against the target of 6 per cent of the SGDP. Further, 99 per cent of the expenditure on education at the primary level and 90 per cent at the secondary level go to meet salaries, leaving very little for development in other spheres of education.
Higher Education in Punjab
There has been vast progress in higher education since the reorganization of Punjab in 1966. According to the census figures of 1981 and 2001, not only has there been significant expansion, in institution building, but also considerable progress in

enrollment. Figures in the table given below show the comparative expansion between 1980 and 2000.
Significant Expansion in Higher Education__________Sr.No.
I.
i i lM(b)
(ii)M .(b)
II.
(a)
(b)
III.
(i)
M .
ill)M
Institutions
Expans
Year
1980
Year
2000
Increase(Absolut^
on in Educational institutions
UniversitiesGeneral coursesProfessionalcoursesCollegesGeneral coursesProfessionalcourses
18816226
28720483
3 (75%
3 (300%)
99 (52.7%)42 (25.9%)57 (219%)
Expansion in EnrollmentTotal Enrollment
Post-graduatelevelGraduate level
91254
6901
84353
193665
13848
179817
102411(112.2%)
6947 (100.6%)
95464(113.1%)
Enrollment of Women and Scheduled Castes to Total Enrollment
Post-graduatelevelWomenScheduled CastesGraduate levelWomenScheduled Castes
50.5%7.4%
39.9%8.9%
69.6%9.1%
51.0%10.3%
(19.1%)
(11.1%)(1.4%)
Issues and Recommendations• District-wise Imbalances in educational status and development are significant.
All the universities and three/four colleges are located in urban areas. Therefore, educationally backward and under-developed districts and rural areas must be given more attention.
• More educational institutions have to be established in rural areas with more vocational courses, to equalize educational opportunities.
• Existing resources must be optimally utilized for this purpose.• As no autonomous institutions of higher education exist in Punjab, such colleges
should, therefore, be promoted.• There is no universal system of admission policy: even degree programmes are
not organized on the basis of the established manpower needs; therefore, the admission system needs to be restructured.
• There is a wide gap in the enrollment status of students between upper-castes and lower castes. Therefore, education opportunities for the Scheduled Castes should be equalized. Further, distance education must be developed into a viable and effective alternative, to enable education reach most deprived and needy sections of the population.

UGC recommendations of 200 working days in a year, 40 working hours in a week per teaclner, 75 per cent attendance of students in a year, have to be adopted to improve the quality and accountability of higher education. The number of holidays can be reduced by papering date-based information of working norms in each institution.Subsidy to students belonging to better-off families should be removed and privatization of higher education encouraged to achieve better standards and status of higher education.
Labor and Employment
Areas of Concern
Though the rate of unemployment rate in the state is not very high as compared to other states of the country, it has increased from 3.08 per cent during 1993-94 to 4.15 per cent on current daily statuses during 1999-2000. This is a matter of concern. Urban unemployment rates are higher than those of rural rates. Unemployment among the educated youth is much more serious, especially among those with general education in arts, commerce and science.
The existing employment resources in the state are not large enough to provide adequate income and regular employment. Both visible and invisible underemployment is high in the state. It has increased during the period caused by the last quinquennial survey of NSSO. Casual labour, especially of rural males, at 28 per cent during 1999- 2000 is high. There has been a marked increase in the percentage of those available for additional or alternative work, in both rural and urban areas during 1993/94-1999-00.
Female work participation rate has been very low in the state. It reflects the status of women empowerment. Large proportion of women workers in the state engage themselves in a subsidiary capacity in low productivity activities with very low earnings. Female marginal workers have increased over the decadal census period from 1.6 per cent in 1991 to 6.8 per cent in 2001.
The growth of organized sector employment, especially in the public sector has declined. The decline in the public sector is from 1.01 per cent during 1990-95 to 0.19 per cent during 1999-00. The growth rate of employment in the private sector too has also declined during the same period from 2.34 per cent to 0.80 per cent. A large proportion of workers (53%) still depend on the agricultural sector in the state for employment and income, despite disguised unemployment.
Special employment generating schemes for the poor have been playing an important role, by providing employment to them through wage employment and self-employment schemes, especially in the rural areas of the state, and creating economic and social infrastructures. However, the performance of these schemes is severely affected by several lacunae, as revealed by evaluation of the functioning of these schemes from time to time. These have prevented the near optimum utilization of the schemes concerned.
A large section of the labourforce (42%) in the state is illiterate. The proportion of skilled manpower is low. The quality of skills is low. Skill-imparting institutions in the state have

lagged behind in upgrading them. A large number of job seekers, trained through ITls, are unemployed. There is a mismatch between supply of and demand for skill requirements. The present system of vocational training is not adequate.
According to Planning Commission estimates, if during the Tenth Plan period (2002-07) growth of employment continues to be the same as in Ninth Plan (0.73%) and the labourforce grows according to the projected demographic profile, the level of unemployment in the state would be higher than what was expected at the end of the Ninth Plan.
Suggested Steps
Special attention has to be given to generation of appropriate employment opportunities in the rural areas of the state. In fact, the major challenge is the replacement of existing low-level jobs with regular jobs. Efforts to provide decent employment to women should be made in order to properly empower them. There is need to study in detail the different activities in which women are engaged and the potential for their diversification.
It is only through the private sector that regular jobs can be created in the future. Hence, it has to be encouraged to invest in the state for the generation of more employment. Even through this process it might not be possible to generate substantial regular employment in the near future. A large volume of better quality employment has to be generated through self-employment, especially in the unorganized sector. Therefore, adequate policy steps have to be taken to promote self-employment opportunities.
The sectors which have comparative potential of higher employment generation in the future are agro- and food-processing, construction, trade, transport, communication, and other services. Faster development of non-farm activities, especially in the rural areas, will also be helpful in checking excessive rural-to-urban migration, thereby relieving pressure on the urban infrastructure. Special employment programmes for the vulnerable sections need to be effectively implemented after proper restructuring, making them leakage-proof through constant monitoring and fixing of responsibility for any lapses.
The ITls and other technical institutions have to be upgraded and modernized as far infrastructure, staff and courses are concerned. All-out efforts are needed to promote vocational education. Industry should be involved in the management of these institutions. The role of the private sector has to be encouraged in imparting vocational training services. Such institutions as IITs and IIMs, which are known for quality and talent, have to be promoted and expanded. Proper manpower planning and human resource development must be given utmost priority.
However, it will not be possible to achieve significant improvement in the employment situation at the prevailing growth rate. Indeed, a very high investment rate is required if we want to achieve higher rate of growth of the state economy during the Tenth Five- Year Plan, along with an efficient use of scarce resources.
Labour/Industrial Relations in Punjab
Industrial relations constitute one of the most complex and delicate problems of the modern industrial production process. The structure of industrial relations in India draws

its spirit from the concept of a welfare state. Labour policy was directed initially towards maintaining harmony in industrial relations to ensure the realization of the objectives of National Economic Planning. Four types of institutions were created to deal with industrial conflicts: i) interventionist labour laws; (ii) industrial democracy; (iii) code of conduct, moral as well as disciplinary; and (iv) consultation machinery, collective bargaining, both bilateral and trilateral. Among all these, state intervention has played the most dominant and significant role. Wherever conflicts arose between employees and employers, the state came in to sort out problems. In this process the state introduced an array of regulations to maintain harmonious relations between employer and employees. Presently, in the wake of the new economic policy of liberalization, privatization and globalization, the government has started reducing its intervening role.
Industrial relations in Punjab are part and parcel of industrial relations in India. The broad pattern of industrial relations in the state is that the trade union movement, as in the rest of the country, developed along with freedom struggle of India. In Punjab, trade unions are strong in the organized sector and weak in the unorganized sector. The increasing trend in the state is of unions with large membership. Independent and small unions have decreased over the years. The future of trade unions without affiliation to central federations is totally unviable. The pattern of industrial disputes has been declining since 1991. The number of work stoppages has been going down since 1981. There has been a sharp downward trend in the member of workers involved in work stoppage since 1989. The number of man days lost has been fluctuating, especially since 1982. Maximum disputes have been raised by AITUC and CITU, both federations with left leanings. Issues related to wages, allowances, bonus and other matters are the primary causes of work stoppage in Punjab. Adjudication continues to be the most effective method for resolving industrial disputes.
Continuation of harmonious and peaceful labour relations has emerged as a subject for research in the present circumstances. However, emerging realities demand peaceful industrial relations, to attract investments. At the same time there is need for a suitable policy framework for ensuring adequate social security for labour, which is possibly a major condition for harmonious relations between employer and employees.
Information Technology: Growth and Development Strategy
The Indian software and service industry, comprising IT Services, IT Product and Technology Services and IT Enabled Services, has emerged as one of the fastest growing sectors in the Indian economy, with a growth rate exceeding 50 per cent in exports and 40 per cent in the total IT industry over the last five years. However, the share of Punjab in the total turnover and exports from India has been dismal. It was only0.26 per cent of the total exports of India during 2000-2001
Some of the specific constraints for the growth of IT industry in Punjab are non-availability of the required quality of infrastructure and human resource, insufficient funds for the development and promotion of the sector, lack of direction, vision and a non-conducive environment. It is essential for the state to overcome these specific constraints. A target of five per cent share of the total turnover projected for India at US$ 60 billion by 2007, has been suggested for Punjab. Although this is optimistic, it is achievable through a fast track approach. This will help to generate 99,000 jobs by the 2007, 77,000 in IT Enabled Services (ITES) alone.

Special emphasis is recommended to develop IT Enabled Services, as it has a large employment potential and a short gestation period. Its success mainly depends on the availability of trained manpower and quality infrastructure with adequate bandwidth and fault- free and uninterrupted power supply.
The state must formulate policies and provide a conducive environment to attract MNCs, to set up IT industry in Punjab, Special efforts have to made to attract NRIs of Punjab origin actively involved in the IT Industry in USA and other developed countries.
The state needs to train 99,000 high quality manpower with the right mix of technical, business and functional skills, to achieve a five per cent share of the total IT Industry by 2007. (IT Services: 16,000, IT Software Product and Technology Services: 6,000 and IT Enabled Services: 77,000). Upgradation of the infrastructure of engineering colleges, including networking and the training of the faculty, is important to meet the required standards. An Indian Institute of Information Technology of international standard should be set up in Punjab to meet the requirements of quality manpower. It is recommended that a State Council for Computer and IT Education (SCCE), a body of experts responsible for monitoring and fixing minimum standards for quality IT education, both by government and private institutio.ns, should be set up.
Punjab must ensure timely implementation of special norms for bandwidth during the Tenth Plan period, as recommended by the Government of India, to develop quality IT infrastructure. It is recommended that three new IT cities are developed at Patiala, Jalandhar and Ludhiana, besides upgrading the existing infrastructure at Mohali. Each such IT city should have a separate development authority on the pattern of Noida Development Authority and function independently. A fund of Rs. 30 crore may be allocated to create a venture capital fund during 2002-07.
Punjab should strengthen the Department of Information Technology (DolT) in terms of expertise and funds, for promoting and implement e-governance in the state. A monitoring cell, with defined rules and procedures, should be set up for monitoring performances of all the projects and departments against the set targets.
It is recommended that 140 Community Information Dissemination Centres (CIDCs) be set up, one in each block, linking all the villages on a state-wide network, for creating an IT culture and its usage among the masses. This will facilitate effective dissemination of information related to the 29 subjects transferred to panchayats under the 73 ^ Amendment Act. These centres will also function as IT kiosks, providing direct linkages between the masses and the government, and training to the panches, sarpanches and social workers. After initial investment, these centres should be financially self- sustaining.
In the Tenth Plan, Ministry of Information Technology has recommended three to five per cent of the plan outlay for the development of IT. The state has provided Rs. 110 crore,i.e., 0.47 per cent of the total outlay. It should be enhanced to a minimum of two per cent of the state’s total Tenth Plan outlay.

Development Perspective and Strategy
Context
While enunciating a development perspective for Punjab, an essential prerequisite is to spell out the vision of Punjab - the kind of economy, society, polity, ecology and ideology envisaged for it, over a given period of time.
One can envision Punjab eventually as a region, which is sub-urban, displaying a continuum of rural and urban, agricultural and non-agricultural, with a hierarchy of settlements interlinked by a free-flowing transport network.
The popular development perspective seeks transformation of the state in the mould of a western country. An oft repeated self-question is: Why cannot Punjab be like the United States, or the United Kingdom, or like Israel, or Denmark among the smaller countries? However, Punjab has to construct its own model of development, based on the available natural resources, rich cultural heritage, quality of human capital, progressive agriculture, fairly advanced industry, and newly emerged opportunities in the field of information technology. The greatest asset of Punjab is the native genius, skill and work- culture of its people. Once all this is mobilized, the sky is the limit.
Punjab is an extrovert entity, actively interacting with areas all over the world. Its globalised psyche has to be taken care of as a valuable resource in any development perspective. Here poverty is not an issue; achieving a higher level of economic wellbeing is!
One specific feature of the development process in Punjab may be underlined: As soon as a new growth activity is initiated, it picks up momentum, and reaches a plateau rather too soon. The green revolution is one such case. Sustainability of the development process and providing new channels for its flow are now the crux of the matter.
On the whole, Punjab emerges as a grand success story. Evolved in the mode of a ‘culture of competition’, the state is taking time to acquire a ‘culture of co-operation’. Human development is yet to reach the expected level. Succinctly put, Punjab has not been in a position to realize its potential fully.
Time Frame
What should be the time frame for the realization of the development perspective visualized for Punjab? In the medium-term, it could be placed at 1 November 2016, when Punjab would be celebrating the golden anniversary of its formation; in the shortterm, it can be placed at 31 March 2007 when the Tenth Plan gets completed; and as a relatively long-term scenario, it can be dated as 31 December 2020, in the spirit of a new vision. These three datelines can adopt evolving development dimensions as their top priority: financial recovery as the necessary base (2007); human development (education and health) by 2016; and habitat (environment) by 2020.
Tasks
The main strands of any development strategy for Punjab include: rejuvenation of the socio-economic dynamism of the state; improvement in the quality of life as well of
XXIIi

habitat in both rural and urban areas; upgradation of the human resource base by improving the quality of educational and health services; diversification of the economy from agriculture to non-agriculture, of agriculture toward non-farm activities, and of wheat-rice rotation tov\/ards ecologically viable crop-combinations; and effective management of water and soil.
Additional issues pertinent to the development perspective can be listed as: How to make Punjab investment-friendly for industry? How should the state be meeting the challenges posed by the globalisation of the economy, labour-replacing new technologies, and over productive biotechnology? How to promote a culture of taking rational locational decisions, wherein economics leads politics rather than politics leading economics? An item not to be missed on any agenda of a development perspective for Punjab relates to raising the ‘status of women’.
Currently, the state is organized into four divisions, 17 districts, 72 subdivisions, and 140 development blocks. A close scrutiny of the administrative map of Punjab shows some serious distortions in the organization of administrative space. A periodic administrative area reform, not on an ad hoc but a comprehensive basis, emerges as an essential task, for the sake of both administrative efficiency and development administration. In particular, there are some issues to deliberate. Should the state continue with its existing system of divisions, districts, subdivisions, or development blocks, or dispense with divisions and subdivisions and retain only districts and development blocks? What is the relevance of a division in a small state like Punjab? Do we need subdivisions when the average number of development blocks in a district is just eight?
There is still another moot point for deliberation. Should development blocks continue to remain exclusively rural, as they were originally designed, or should any town/s falling within their territorial jurisdiction be also included as a part of the block? The rationale of keeping rural and urban areas as separate in any scheme of things is difficult to justify in the present context.
As a development strategy, there is still another way of reforming the administrative areas. Let the boundaries of the state assembly constituencies and those of blocks correspond with each other, and likewise the boundaries of parliamentary constituencies should conform to those of higher-level administrative units, such as divisions or a group of districts.
In the final analysis, ‘rejuvenation, quality, and management’ emerge as the three key ingredients for reinventing Punjab today.
For years after independence, Punjab effectively demonstrated that it could lead in the mode of a model state in India. Today, it is craving to be led for the full realization of its potential in the making of a prosperous, just and civil society. The tide will turn only when leaders with foresight awaken the state from the slumber of its past glory and create a space for new dreams to manifest.

Chapter 1
PROFILE OF DEVELOPMENT AND CHANGE
Punjab is a classic example of a fast developing economy with agriculture at its foundation. It is credited for ushering in the green revolution in the country. A progressive mix of irrigation, fertilizers and high-yielding variety seeds laid the foundation; a process, which was further strengthened by agricultural credit societies, rural link roads, village electrification, and a variety of extension services. Punjab today contributes nearly 40 per cent of wheat and 60 per cent of rice procured for distribution through the public distribution system. The state also promoted the white revolution, resulting in the highest per capita availability of milk to the people. An agro-based and agro-oriented industrialization is another prominent feature of the state economy. No less commendable are the efforts to strengthen the infrastructure, particularly irrigation and power. The cumulative effect of all this is manifest in the highest per capita income of the state, a position of pride which Punjab has been holding for most of the years since its formation in 1966. A paradox may be stated here and explained: Despite its relatively high income level, the state is noted for considerable outmigration to other parts of India as also emigration to several countries, particularly the United Kingdom, Canada, United States, and Australia. This is attribuiBd not to any distressful situation at home but to the attraction of greater prosperity outside.
Development in a state is the outcome of the interplay of a variety of factors, such as political, economic, demographic and geographic. Being a border state, both external and internal changes have influenced the path of development. In 1947, the state was partitioned. In 1966, it was trifurcated into Punjab, Haryana and Himachal Pradesh. The period of militancy, in the recent past, due to an internal crisis, had its own influence on shaping the development pattern of the state. Despite all this, it was able to achieve remarkable success in accomplishing reasonable conditions for a better standard of life. The present chapter is a profile of development and change in Punjab taking into account, the evolution of the state, its physical setting, infrastructure base, economic development, poverty, agricultural development, industrial development, and human development.
Punjab with an area of 50,362 square kilometres is one of the smaller states of India (Table 1). It accounts for 1.5 per cent of the total area of the country and 2.4 per cent of the total population (2001). It ranks 19‘ among all the states and union territories in terms of area, which is one-seventh of the largest state - Rajasthan. With 2.4 per cent of the country’s total population (2.43 crore) it ranks 15 ’ in the country. Smallness of the state is reflected in the fact that its share in the total population of India is one-severith of the most populous state - Uttar Pradesh. Punjab, with a density of 482 persons per square kilometres is the tenth most densely populated state in the country. (See district level details in Appendix 1).

Table 1Status of Punjab on Selected Parameters in India, 1999*2001
States/Union Territories Area’(in sq. kms.)
Population* Density" (persons per sq. kms.)
Urban Population" (in per cent)
Literate"(in per cent)
Per capita income" (Rupees)
India 32,87,263 102.70,15^47 324 " 27,78 ' ^ ’{165^8 . io :o 6 |
States
Andhra Pradesh 2,75,045 7,57,27,541 275 28.08 61.11 9,318
Arunachal Pradesh 83,743 10,91,117 13 20.41 54.74 9,170
Assam 78,438 2,66,38,407 340 12.72 64.28 5,978
Bihar 94,163 8,28,78,798 880 10.47 47.53 3,768
Chattisgarh 1,35,191 2,07,95,956 154 20.08 65.18 *
Goa 3,702 13,43,998 363 47.77 82.32 *
Gujarat 1,96,024 5,05,96,992 258 37.35 69.97 13,434
Haryana 44,212 2,1,082,989 477 29 68.59 13,709
Himachal Pradesh 55,673 60,77,248 109 9.79 77.13 9,177
Jammu and Kashmir 2,22,236 1,00,69,917 99 24.88 54.46 7,435
Jharkhand 79,714 2,69,09,428 338 22.25 54.13 *
Karnataka 1,91,791 5,27,33,958 275 33.98 67.04 10,928
Kerala 38,863 3,18,38,619 819 25.97 90.92 9,678
Madhya Pradesh 3,08,000 6,03,85,118 196 26.67 64.11 *
Maharashtra 3,07,713 9,67,52,247 314 42.4 77.27 15,410
Manipur 22,327 23,88,634 107 23.88 66.87 7,213
Meghalaya 22,429 23,06,069 103 19.63 63.31 7,826
Mizoram 20,987 8,91,058 42 49.5 88.49 ★
Nagaland 16,579 19,88,636 120 17.74 67.11 *
Orissa 1,55,707 3,67,06,920 236 14.97 63.61 5,411
Punjab . 50162 '2*4*189.296 mz 1 69:9^ ... M mRajasthan 3,42,239 5,64,73,122 165 23.38 61.03 8,272
Sikkim 7,096 5,40,493 76 11.1 69.98 9,816
Tamil Nadu 1,30,058 6,21,10,839 478 43.86 73.47 12,504
Tripura 10,491 31,91,168 304 17.02 73.66 6,604
Uttar Pradesh 53,483 16,60,52,859 689 20.78 57.36 6,373
Uttaranchal 2,38,566 84,79,562 159 25.59 72.28 *
West Bengal 88,752 8,02,21,171 904 28.03 69.22 9,425
Union TerritoriesAndaman and Nicobar Islands 8,249 3,56,265 43 32.67 81.18 ★
Chandigarh 114 9,00,914 7903 89.78 81.76 ★
Dadra and Nagar Haveli 491 2,20,451 449 22.89 60.03 *
Daman and Diu 112 1,58,059 1411 36.26 81.09 *
Delhi 1,483 1,37,82,976 9294 93.01 81.82 *
Lakshadweep 32 60,595 1894 44.47 87.52 *
Pondicherry 480 9,73,829 2029 66.57 81.49 •Source: # - Census of India, 2001, Provisional Population Totals, Paper-1 of 2001, DCO, Punjab
## - Department of Planning, Economic and Statistical Organization, Statistical Abstract of Haryana, 2002, Governmentof Haryana
* - Ministry of Information and Broadcasting (2002); India 2002, A Reference Annual, Publication Division, ,Government of India, New Delhi

The share of urban population to total population in the state is 34 per cent, the 12* highest in India. Seven out of every ten persons in the state are literate, and in terms of literacy it ranks 16* in the country.
EVOLUTION OF THE STATE
Historically, Punjab has experienced many upheavals and turmoils, which, in turn, have influenced its path of development. The administrative map of Punjab has undergone extraordinary changes in the past. The nomenclature 'Punjab’ was widely used during the reign of Akbar (A.D. 1556-1605). It was known as the Kingdom of Lahore during the reign of Ranjit Singh (1799-1839). The British occupied it in 1849 and merged Delhi and the Hisar division of the former fslorthwest Province (now Uttar Pradesh) with Punjab in 1858. In 1901, Punjab’s border districts situated across the Indus were taken away to form the Northwest Frontier Province. In 1912, Delhi territory was separated from Punjab.
At the time of the partition of the Indian sub-continent in 1947, Punjab was bifurcated into two parts: West Punjab (Pakistan) and East Punjab (India). Of its 3,59,179 square kilometres and 29 districts, only 1,52,649 square kilometres and 13 districts were left with Indian Punjab. The two Punjab’s were partitioned on religious grounds. The most prosperous and developed western part went to Pakistan and the relatively backward eastern part remained in India.
In 1956, at the time of the reorganization of states on a linguistic basis, the former PEPSU territory was merged with Punjab. In 1966, the state was further reorganized under the Reorganization Act 1966. There was a strong demand for the reorganization of the state on a linguistic basis so that satisfaction of regional sentiments could be harmonized with the process of development. The Punjabi speaking areas were carved out of the erstwhile Punjab on 1 November 1966. The Hindi speaking areas in the north were merged with Himachal Pradesh. The southern Hindi speaking areas were constituted into a new state of Haryana. After the reorganization, Punjab became linguistically homogeneous and structurally compact. The Punjabi speaking state was created in 1966, with 11 districts, including Rupnagar. The reorganization reduced Punjab to about two-fifths the size attained after the merger of PEPSU in 1956. This was one-seventh the area of Punjab before Independence (Kant, S., 1988).
The state now is a linguistic unit inhabited by Punjabi speaking people. It had a population of 2.43 crore in 2001 distributed among 12,729 villages and 157 towns. Administratively, it is divided into 17 districts, 72 tahsils and 138 blocks. The city of Chandigarh (within the Chandigarh Union Territory) is the joint capital of Punjab and Haryana.
PHYSICAL SETTING
The word 'Punjab’ consists of two Persian words: Panj (five) and ab (waters or rivers) which means the land of five rivers. Before partition, the state had five rivers, namely, the Sutlej, the Beas, the Ravi, the Chenab and the Jhelum. However, as a consequence of partition in 1947, Punjab lost the Chenab and the JheJjjm. Although it no longer constituted the five rivers, the name of the state was not changed in the hope that the spirit, culture and language of the area would continue and flourish. The three rivers - Ravi, Beas and Sutlej - have proved to be useful for generating electricity and irrigation.

Location: Before Independence, Punjab was spread between 27°39' and 34°02' N latitude and 69°23' and 79°52' E longitude. The present Punjab, triangular in shape, extends from 29°30' to 32°32' N latitude and 73°55' to 67°50' E longitude. It covers an area of 19,445 square miles (50,362 square kilometres).
Punjab is located in the northwestern part of the subcontinent. Bordering Pakistan on its west, Punjab occupies a position of great strategic importance. It is bounded on the north by Jammu and Kashmir, Himachal Pradesh on the northeast and east, and Haryana on the southeast and south, and Rajasthan on the southwest.
Physiography: Punjab does not have any large-scale diversity in its physiography. The state has a more or less physical homogeneity with the exception of scattered and low ranges of the Sivaliks in the north and northeast. Physiographically, the state may be divided into three regions:
) Hilly tract I) Foothills, and ii) Flat plains.
The hilly tract, forming part of the Siwalik hills, extends along the north and northeastern border of the state. The foothill plains are located between the hilly tract and the flal plains in the north and northeastern parts of the state. The major part of the state’s physiography is dominated by flat plains. These plains are the result of the alluvium deposits of rivers, and are very fertile. A significant portion of Punjab is the flat plain gently sloping from about 275 metres in the northeast to about 170 metres in the southwest. Punjab surpasses all other states of India in possessing a large level topography. The flat physiography of the state has proved beneficial for laying roads and creating infrastructure at a low cost, which is very difficult in hilly tracts. Higher accessibility to services and the strong linkage between rural and urban areas are partly due to the flat physiography.
Forest: The area under forests is quite insignificant in the state. Accordingly to the National Forest Policy 1982, a minimum 33 per cent of the total geographical area should be under forest. The forest cover in the state is 6.05 per cent of its total area, as against the national average of 19.4 per cent.
Climate: Punjab has an inland subtropical location. Its climate is continental, semi-arid to sub-humid. More than 70 per cent of the annual rainfall is concentrated in the nionsoon months of July to September. Winter rains occur in the December and January. The southwestern part of Punjab receives low annual rainfall. January andJune have the lowest and highest temperatures respectively.
Soil: Soils in the state are generally sandy loam to loam in texture, which are deficient in nitrogen and organic matter and, therefore, need heavy manuring for good yields.

Map1
Source: Census of India (2001), Provisional Population Totals, Paper -2 of 2001,DCO, Punjab

PUNJAB PARTITIONED IN 1947
N o r t h W « i r
^ ® ®'' ■•••RawoU J a m m u & Kashm irr, j jx n d i IP r o v i n c e ^
I ' > '.Chambq"/s lQ U ; U
t !/snaw " <■ . ; / .• '•'> \/ ‘ «u,r,.w,K / s ; r i ; * r , • " ” .--" '■ 'i
•' \ / " ' ' f ^ f ' ’' Vi . . . . ______V * N
‘' — '7> . ■ '" ‘■ ■ \ y ... .L . . . , / ^ '« ‘» ; ' w
, • . •'• ■ \ S io lk C l . ; \ r v ^ t /
Lcl.cr»V K jjurtfVcfla \r' y ■'■■■ *, • r . . s ) o J , e T ^ _ S < ml a T < i n
f j -p-/L/3<‘pw ■ ^ Hun dor ■*...( s l o l e s /
> 1 r . V
k ijorh .' ,‘ / '''o n d othcr^'Ambota'
■■ f - z " ' 2 V U n t f f d
i ' ' i Provincts\ H i | » o r \ f - . . I
/ y .’-RoMoi,'.\ / B a h o w o i p u r ,■'■ R o j p u l o n a
V r » ' « ' • / Pii\ilSrn.»r ,/Y\ V T S l o t P 5 Ou ^c ao n/ i it'dlttfvPuftjalj ^ (
G P«w*ftan Punjib ^ \
f 11 f na 110ti 1 b n ' (1 ♦ riridia Qft(j PoM»*\nn ’ l1— ,—J
Kilometff »
Map 2
Source : Surya Kant (1988), Administrative Geography of India, Rawat Publishers, Jaipur

REORGANfZATION OF PUNJAB IN 1966
J a m m u
^ *v.K a s h m l r t * - ^ \
> ' " 1}
/ y\ H i m a c h a l P r a d e s h ^
\ VP o k ls td n '
V dy \ *7P u n j a b hondigarh
U n i o nT T e r r i t o r y
A ______C ' 'H 'O / U t t a r) V I P r o d e s h
”“ A_ H a r y a n o 1 R o j o s t h a n / 3
/ D e l h i
\
0 130 260JK Mo met res
Source : Same as in Figure 2Map 3

PUNJAB ADMINISTRATIVE DIVISIONS
2001J A .M M U
K H ^ E T E H S10 .10 10 10 JO *)h-4r4.
P A K I S T A Ny
o (■
/
Vj AMRITSAR
>«
f
•N. [ A C H A L
A D E S H
\ o \
f
V-/ / V
/ ^ \ r <r ”)HOSmARPUK
jb^PURTHALA oJAL^'FHpR (, \
X . A \\ n a w a n s h a m r ' I
^ -- ----- '^•S ° r- ^J ( o i ^*^ROPAR V*
r ^ "V. / \ HJOHIANA ,'^V)' ^ Z MOGA
C/-' V
v . / ^ \ .kllR
, - . X V
/s
f.'
s
^ i f ' * ’
? .JvVTHEGARH /SAHIB T ^
) r ^ w/ ^ f/ r ^ .
;7 ^■ v»
/ * (__ _ o tr - S faridko^ ^
► >> S ^ (T-n (•’)<r ® ’ (
^lU KTSAR ’l
\ *rU ^■ / L o \ ^ ^
V / '^ ■ v SANGRUR CJ P '•V BATHINDA ^ 1
■? \ i V. .)*" __ _ 0 / J f
RAJASTH,. , . s (
■ '*\ K-KAPURTHALA^ f ^ — ' ' P - PATIALA
H A R A Y A N A
P A T I A L A . V
Map 4Source; Census of India (2001), Provisional Population loiais, Paper-2 of 2001, OCO, Punjab
However, the weak point of Punjab’s physiography is the deteriorating soil health, change in the water table, and lack of availability of minerals and fossil-fuel resources. Due to the practice of rice-wheat rotation and excessive use of fertilizers over a long period, the soil has lost its character. It requires heavy doses of fertilizers, which

amounts to an additional financial burden on the farming community in terms of the inputs in the agricultural sector in the state.
Water bodies: The rivers -- the Ravi, the Beas and the Sutlej -- are perennial streams. All-time availability of water is the major requirement of the state. To cope with the shortage of water, which fluctuates from one season to another, dams and barrages were constructed for regulating the water supply needed to feed irrigation and powerhouses throughout the year. The state has developed a good network of canals.
Overall, the physical setting of the state makes it conducive for agricultural development. Punjab has a physiography, which has provided an opportunity for the mechanization of agriculture. This has further helped in achieving rapid strides in agricultural production. Its location on a generally hostile international border since partition, has had its own impact on the development process in the state.
INFRASTRUCTURAL BASE
The task, after partition and the reorganization, was to give a direction to the development process of the state, to respond positively to the aspirations and development needs of the people. The vision of the state government, after partition, centred on the initiation of the right kind of priorities. This was in accord with the specific economic infrastructural strength of the state as well as the needs of the overall national economy. The objective was to boost economic development through the rural development. It was to be achieved through agricultural development, rural electrification, and road connectivity. The success in creating this particular infrastructure in the state can be judged from the fact that its rating by the Centre for Monitoring Indian Economy is 191.4 as against the national average of 100.
Rehabilitation; Post-partition Punjab was faced with the lack of the infrastructure necessary to accommodate 40 lakh displaced persons. They were put in refugee camps, institutions and other available structures in insanitary conditions. The immediate task was to create the infrastructure to accommodate the refugee population. New towns were constructed and economic projects initiated for the resettlement of refugees from rural areas. The developmental pattern, established during the period, has continued to guide the path of development in the state till today.
Another major problem after independence was the need for a suitable site for a new capital, since Lahore had been lost to Pakistan. Shimla, the summer capital of British India, was adopted as an interim arrangement. Because of the peripheral location of Shimla, it was decided to build a new capital, to be called Chandigarh, which was centrally located in relation to the territory of Punjab after independence. The capital was shifted from Shimla to Chandigarh in 1953. However, after the reorganization of the state, the capital has again moved towards the periphery. Punjab and Haryana have conflicting claims on Chandigarh. Unable to secure exclusive right to Chandigarh, the two states have established new towns, namely Mohali in Punjab and Panchkula in Haryana, on the periphery of Chandigarh. This has influenced the developmental pattern of the state. Most of the developmental activities are around these towns.
Partition changed not only the overall demography of the area but also the religious composition of the population. Prior to partition, the Hindus, the Muslims and the Sikhs had first, second and third rank in most parts of the state. With the mass exodus of

Muslims to Pakistan on the eve of partition, Punjab became a Hindu majority area, and after reorganization, as constituted now, a Sikh majority area. The three major religious communities possess different skills, which in turn have influenced the subsequent development of the state. The farming community in western Punjab was more skilled than in eastern Punjab. In-migration of these communities to eastern Punjab gave a boost to the agricultural sector.
Before reorganization, the major part of infrastructural development had been allocated to the relatively more populous and developed areas of Punjab (Table 2).
Table 2Comparative Picture of Social Infrastructure and Demographic Attributes in Punjab and
Haryana at the Time of Reorganization and n 2000-01Facility/attribute 1961-1975 2000-2001
Punjab Haryana Punjab HaryanaHigh/Higher secondary schools per 1,000 sq. kms.
19.56(1965-66)
11.22(1965-66)
67.3(2000-2001)
88.6(1999-2000)
Road length (mettalled) per 100 sq. kms.
12.65(1965)
11.95(1965)
91.2(2000-2001)
54.8(1999-2000)
Per cent of electrified villages 29.41(1966)
18.59(1966)
100.0(2000-2001)
100.0(1999-2000)
Birth rate 34(1971-73 y
41(1971-73*)
22.4(1997-99**)
27.6(1997-99**)
Death rate 11.7(1971-73*)
11.3(1971-73*)
7.5(1997-99**)
8.0(1997-99**)
Infant mortality rate 112(1971-73)
90(1971-73*)
52.7(1997-99**)
68.7(1997-99**)
Life expectancy 57.9(1970-75*)
57.5(1970-75J
67.4(1992-96**)
63.8(1992-96**)
Sex ratio" 865(1971)
867(1971)
882(2001)
865(2001)
Per cent literates^ 26.74(1961)
19.90(1961)
69.9(2001)
68.6(2001)
Per cent urban population*^ 23.06(1961)
17.20(1961)
33.9(2001)
29.0(2001)
Source; I) Various issues of Statistical Abstracts of Haryana and Punjabii) * Registrar General (1999): Compendium of India’s Fertility and Mortality
Indicators, 1971-97, Sample Registration System, India, New Delhiiii) ** Registrar General (2001): Sample Registration System Bulletin, Volume
35, No. 2, October 2001, New Delhi.iv) # Census of India, Volumes 1981 and 2001
Irrigation: Efforts were made to bring more area under cultivation. Initially, the completion of the Bhakhra-Nangal project and subsequently sinking of tube wells met the major requirements of water in the^state. In 1970-71, it had 71 per cent of the net irrigated area to net area sown, which increased to 94 per cent in 2000-01.
*Transport and communication: The state has developed a good network of roads. The economy took a new turn with the construction of rural roads in the state. During 1970- 71 to 2000-01, road network increased 3.3 times. Almost all (99.24%) villages are connected by roads. In Kapurthala, Jalandhar, Nawanshaher, Faridkot, Mukatsar, Moga, Mansa and Fatehgarh Sahib districts all villages are connected by roads.

Power: Since its formation, the state has been making every effort to augment its energy resources. By 1975-76, it achieved 100 per cet-fi electrification of all its villages. All the villages are connected to a grid. In 1980-81, 56.33 per cent of the total households were using electricity, which increased to 86.70 per cent in 2000-01. The per capita generation of power (733 kwh) is 2.5 times the national average. Per capita consumption of electricity in the state in 1998-99 was 351.39 khw as against the national average of 90.98 khw, and 232.80 khw in the neighbouring state of Haryana. Approximately two-fifths (39.3%) of the electricity produced in the state in 1999-00 went to the agricultural sector. This share is one of the largest in any state in the country.
Institutional credit: The state has a strong infrastructure for providing credit through a multi-tier and multi-functional system. It has the highest number of banks per capita - 15 banks for every 10,000 population. Institutions providing ready credits in the state increased initially at a faster pace but slowed down gradually. The increase was relatively sharper during 1966 to 1970, when the number of banks per 10,000 rural population increased sharply from 97 to 326. The increasing income of the farmers and the consequent increase in the saving capacity has promoted an improved credit system in rural areas (Singh, H., 2001). In 1990, 55.1 per cent of the banks were located in the smaller areas as against 51.5 per cent in 1980. However, in the post-liberalization period, the situation has changed. Banking facilities are moving towards urban areas. Banks in urban areas increased from 22.6 per cent in 1990 to 30.5 per cent in 2000. On the other hand, banks in smaller areas decreased from 55.5 per cent to 43.2 per cent during the same period.
Besides this, the co-operative societies have made a significant contribution to stimulating the rural economy of the state. Their membership has almost doubled during the 1970-71 to 2000-2001, i.e., from 22 lakh to 44 lakh.
Urban base: One-third of the total population in the state is urban, living in 157 towns. One out of every seven persons in urban areas reside in slums. The existence of urban slums indicates pressure on the urban infrastructure. Urbanization in the state is expected to increase at a rapid pace due to economic reforms and industrial growth. This would put great stress on the urban infrastructure. Despite efforts of the government in containing the number of slum dwellers, the slums are expanding and the situation is worsening with the passage of time.
Education: Infrastructure for social upliftment in the state has increased significantly. The teacher-pupil ratio was 1:42 at the primary level, 1:26 at the middle level and 1:24 at the high/senior stage in 2000 in the state as against 1:42, 1:37 and 1:35 respectively at the national level. However, despite improvements in infrastructural facilities, there has been no change in the teacher-pupil ratio in primary schools during the period 1971 to2000. The teacher-pupil ratio in primary schools in Mukatsar and Mansa districts was 1:55 and 1:60 respectively, indicating a disparity in availability of teachers.
In 1971, only two engineering, technology and architecture colleges were in operation as against 16 in 2000. During the same period, polytechnic institutes have increased from eight to 20 and technical, industrial and craft schools from 27 to 119. This kind of infrastructure has led to a change in the employment scenario of the state. Of the total 5.49 lakh unemployed (September 2001), three-fourths are educated unemployed. Oul of them, unemployed, 77.63 per cent belong to the non-technical category and the
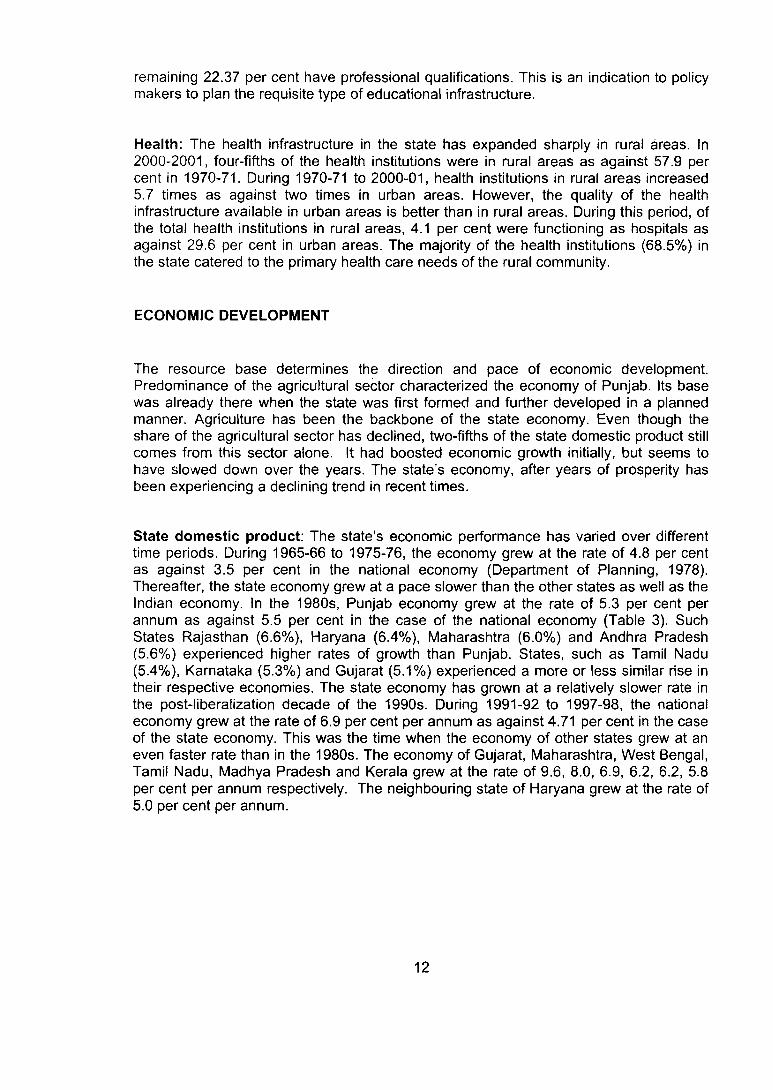
remaining 22.37 per cent have professional qualifications. This is an indication to policy makers to plan the requisite type of educational infrastructure.
Health: The health infrastructure in the state has expanded sharply in rural areas. In 2000-2001, four-fifths of the health institutions were in rural areas as against 57.9 per cent in 1970-71. Dunng 1970-71 to 2000-01, health institutions in rural areas increased5.7 times as against two times in urban areas. However, the quality of the health infrastructure available in urban areas is better than in rural areas. During this period, of the total health institutions in rural areas, 4.1 per cent were functioning as hospitals as against 29.6 per cent in urban areas. The majority of the health institutions (68.5%) in the state catered to the primary health care needs of the rural community.
ECONOMIC DEVELOPMENT
The resource base determines the direction and pace of economic development. Predominance of the agricultural sector characterized the economy of Punjab. Its base was already there when the state was first formed and further developed in a planned manner. Agriculture has been the backbone of the state economy. Even though the share of the agricultural sector has declined, two-fifths of the state domestic product still comes from this sector alone. It had boosted economic growth initially, but seems to have slowed down over the years. The state’s economy, after years of prosperity has been experiencing a declining trend in recent times.
State domestic product; The state’s economic performance has varied over different time periods. During 1965-66 to 1975-76, the economy grew at the rate of 4.8 per cent as against 3.5 per cent in the national economy (Department of Planning, 1978). Thereafter, the state economy grew at a pace slower than the other states as well as the Indian economy. In the 1980s, Punjab economy grew at the rate of 5.3 per cent per annum as against 5.5 per cent in the case of the national economy (Table 3). Such States Rajasthan (6.6%), Haryana (6.4%), Maharashtra (6.0%) and Andhra Pradesh (5.6%) experienced higher rates of growth than Punjab. States, such as Tamil Nadu (5.4%), Karnataka (5.3%) and Gujarat (5.1%) experienced a more or less similar rise in their respective economies. The state economy has grown at a relatively slower rate in the post-liberalization decade of the 1990s. During 1991-92 to 1997-98, the national economy grew at the rate of 6.9 per cent per annum as against 4.71 per cent in the case of the state economy. This was the time when the economy of other states grew at an even faster rate than in the 1980s. The economy of Gujarat, Maharashtra, West Bengal, Tamil Nadu, Madhya Pradesh and Kerala grew at the rate of 9.6, 8.0, 6.9, 6.2, 6.2, 5.8 per cent per annum respectively. The neighbouring state of Haryana grew at the rate of5.0 per cent per annum.

State Annual rate of growth of SDP (per cent)
Annual rate of growth of per capita SDP (per cent)
1980-81 to 1990-91
1991-92 to 1997-98
1980-81 to 1990-91
1991-92 to 1997-98
Bihar 4.66 2.69 2.45 1.12
Rajastlian 6.60 6.54 3.96 3.96
Uttar Pradesh 4.95 3.58 2.6 1.24
Orissa 4.29 3.25 2.38 1.64
Madhya Pradesh 4.56 6.17 2.08 3.87
Andhra Pradesh 5.65 5.03 3.34 3.45
Tamil Nadu 5.38 6.22 3.87 4.95
Kerala 3.57 5.81 2.19 4.52
Karnataka 5.29 5.29 3.28 3.45
West Bengal 4.71 6.91 2.39 5.04
Gujarat 5.08 9.57 3.08 7.57
Haryana 6.43 5.02 3.86 2.66
Maharashtra 6.03 8.01 3.58 6.13
Punjab r : f ....... 4.33
SDP of 14 states 5.24 5.94 3.03 4.02
<3DP ^National acGburitsy'i^
— ■ ■ ■ ■ '" I i
Source: Ahluwalia, M.S. (2000) 'Economic Performance of States in Post-ReformPeriod’ , Economic and Political Weekly, 35(19), 6 May.

Figure 1
Economic Performance of States during tlie 1980s and 1990s
Gujarat
Maharashtra
West Bengal
INDIA
Rajasthan
Tamil Nadu
Madhya Pradesh
Kerala
Karnataka
Andhra Pradesh
Haryana
Punjab
Uttar Pradesh
Orissa
Bihar
2 4 6
Annual rate of growth of SDP (percent)
Source: Same as in Table 3
Per capita income: Since its formation in 1966, the state has been ranked first in terms of per capita income. However, after the introduction of economic reforms in the 1990s, it lost that place. The growth of per capita income in other states was steadier than in Punjab. During the 1980s, the difference in the rate of growth of per capita income between Punjab, Maharashtra and Gujarat was not so wide (3.3, 3.6 and 3.1 % respectively per annum) as compared to the 1990s. During the 1990s, the rate of growth of the per capita income in Gujarat and Maharashtra was 7.6 and 6.1 per cent per annum respectively as against 2.8 per cent in Punjab. This calls for an in-depth analysis.

Per capita income in the state rose continuously during 1966-67 to 2000-01 at current prices. This reflects the rising level of prosperity in the state. Even at constant prices, with the base year 1980-81, the trend reveals that it was only thrice, in the last 32 years, that the per capita income decreased as compared to the preceding year (Table 4). As compared to the per capita income of Rs. 2,094 in 1969-70, in 1970-71 it came down marginally to 2,092, a fall of Rs. 2; from Rs. 2,646 in 1978-79 to Rs. 2,612 in 1979-80 and from Rs. 2,906 in 1982-83 to Rs. 2,904 in 1983-84. However, the per capita income in some years rose at a faster pace than in the preceding year. In 1981-82, 1989-90 and1996-97 the per capita income increased by Rs. 201, 224 and 258 respectively as compared to the preceding year.
Table 4Per Capita Income in Punjab during 19616-67 to 2000-01 at 1980-81 Constant PricesYear Per capita income
(Rupees)Year Per capita income
(Rupees)
1966-67 1,791 1984-85 3,0731967-68 1,957 1985-86 3,2491968-69 2,024 1986-87 3,3021969-70 2,094 1987-88 3,4101970-71 2,092 1988-89 3,5261971-72 2,109 1989-90 3,7501972-73 2,133 1990-91 3,7511973-74 2,142 1991-92 3,8651974-75 2,157 1992-93 3,9311975-76 2,295 1993-94 4,0251976-77 2,388 1994-95 4,1201977-78 2,527 1995-96 4,1721978-79 2,646 1996-97 4,4301979-80 2,612 1997-98 4,4521980-81 2,674 1998-99 4,6271981-82 2,875 1999-00 4,7941982-83 2,906 2000-01 4,9251983-84 2,904Source; Various issues of Statistical Abstracts, Punjab
Even though Punjab’s rank in per capita income has gone down in comparison with other states, it remains one of the highest. Per capita income in the state in 1997-98 was 4.1 times higher than in Bihar, which was 2.9 times higher in 1980-81. In fact, the per capita income of the state was the highest among the major states up to 1993-94, when Maharashtra surpassed Punjab. During this period, the per capita income the state was Rs 4,025 in comparison with Rs. 4,177 in Maharashtra. The gap in the per capita income between these two states has widened ever since. The per capita income of Punjab in1997-98 was Rs. 4,452 as compared to Rs. 4,791 in Maharashtra.

Figure 2
Per Capita Income in Selected States 1980-81 to 1996-97 (at 1980-81 Constant Prices)
5500
500
-----K- I -—-1—
^---- rr—
CNJ CO s lO CD h- 00 O) o CN CO lO CD h-op op CO op 00 00 op 00 05
O) CD CD CD CD 05 CD
O t— 00 lO CD CO CD 1 ■V- CN CO -4 Lf5 CO00 CO 00 00 00 00 00 00 00 00 W
CDCDT—
CD CD 05 CD CD CDO) 05 O) O) O) 05 05 CD (35 CD CD 05 CD CD CD 05
T— T— T— T— T— T— T—
■ ♦ — Punjab Tamil Nadu
H— Bihar
Haryana Maharashtra
•Uttar Pradesh
-A— Himachal Pradesh Gujarat
-----All India
Source: Various issues of Statistical Abstracts, Punjab
Structural transformation of the economy: Despite deceleration of the overall state economy, it has undergone a structural transformation during the last three decades, 1970-71 to 1998-99. The primary sector grew at the rate of 3.9 per cent per annum as against the secondary sector at 6.5 per cent and the tertiary sector at 5.4 per cent (Table 5).
The sectors which have grown at a rate less than the state average are trade, hotel and restaurants (4.9%), agriculture and livestock (3.9%), other services (3.3%), agriculture (3.2%), forestry and logging (2.8%), real estate ownership of dwellings and business

services (2.3%), construction (1.6%), and mining and quarrying (-4.9%). The sectors experiencing a rate of growth higher than the state average were fishing (12.5%), banking and commerce (9.7%), electricity, gas and water supply (9.4%), manufacturing (8.6%), public administration (8.0%), transportation storage and communication (7.6%) and livestock (5.3%).
Table 5Sectoral Rates of Growth in Punjab, 1970-71 to 1998-99 ai 1980-fit1 Constant Prices
Sector1970-74
1974-78
1980-85
1985-90
1992-97
1997-99
1970-71 to 1998-1999
(A) PrimaryAgriculture and livestock 1.42 3.93 4.96 3.96 2.66 1.76 3.92Agriculture 0.56 2.20 5.65 3.58 1.73 2.53 3.19Livestock 1.40 2.30 3.53 4.76 4.27 0.72 5.28Forestry and logging 2.05 8.21 -16.43 -1.09 0.24 0.30 2.83Fishing 0.29 2.57 2.28 16.88 15.15 11.17 12.54Mining and quarrying -19.18 4.20 -3.04 35.79 -36.63 -3.82 -4.90
TotaiiA ) 0.81 2.30 4.66 3.91 2.66 1.80 3.93(B) SecondaryManufacturing 3.48 5.40 8.36 6.66 7.16 3.53 8.62Electricity, gas and water supply 3.88 6.30 5.36 9.99 4.96 3.36 9.41Construction -0.85 5.01 -2.75 0.88 2.29 3.55 1.60
Total (B) 1.44 5.28 4.93 5.75 6.25 3.52 6.52(C) TertiaryTrade, hotels and restaurants 2.77 5.20 2.38 2.75 2.96 2.37 4.89Transport, storage and communication 2.56 2.71 5.28 5.67 9.92 7.92 7.59Banking and Insurance 1.60 5.92 9.12 11.76 8.90 6.94 9.66Real estate, ownership of dwellings and business services 0.47 0.49 1.46 2.65 -0.40 1.11 2.35Public administration 1.34 2.35 2.14 9.14 4.53 5.09 8.01Other services and sanitary services 2.13 2.47 2.00 1.72 1.80 1.40 3.26Total (C) 2.06 3.64 2.97 4.46 4.24 3.97 5.42Total net state domestic product 1.27 3.23 4.18 4.45 3.98 2.92 4.94Per capita Net State product (Per Capita Net Income) Rs. 0.34 2.29 2.40 2.93 2.42 1.95 2.88Source; Various issues of Statistical Abstracts, PunjabNote: The data presented in the table marks the seventies and latest year, and the
last year of the respective plan periods beginning from Fourth Plan

Sectoral Rates of Growth In Punjab 1970-71 to 1998-99 (at 1980-81 constant prices)
Fishing
Bani<ing and Insurance
Electricity, gas and water supply
Manufacturing
Public administration
Transport, storage and communication
Livestock
Total net state domestic product
Trade, hotels and restaurants
Agriculture and livestock
Other services and sanitary services
Agriculture
Forestry and logging
Real estate
Construction
Mining and quarrying
0 2 4 6 8
Annual growth rate (percent)
Source; Various issues of Statistical Abstracts, Punjab
Agriculture is still a major contributor to the state economy, despite its continuously declining share. Its share in SDP declined from 52.85 per cent in 1966-67 to 41.33 per cent (Table 6) in 1998-99 (at 1980-81 base year). The share of the agricultural sector in SDP up to the end of the Seventh Plan (1989-90) decreased by 3.7 per cent points as compared to its contribution up to the end of Fourth Plan period. It decreased at a faster rate during the Eighth Plan than during Seventh Plan. During this period, its share decreased by 4.2 points. The share of agriculture in SDP per se drastically declined from 40.91 per cent to 24.08 per cent during 1966-67 to 1998-99, a fall of 16.83 per cent points. The share of the livestock sector increased by 6.54 per cent points during the same period. Forestry and logging, fishing, and mining and quarrying sectors continue to contribute a negligible share to the state economy. This structural shift in the agricultural sector is a sign of the state’s healthy economy.
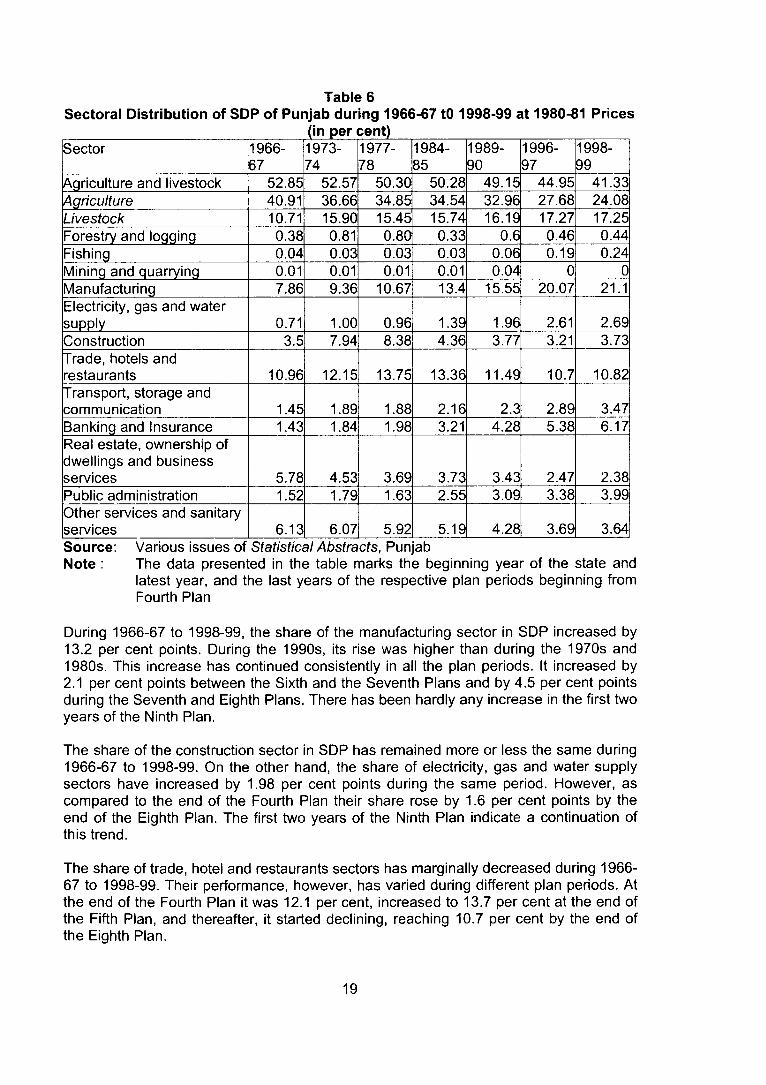
Sectoral Distribution of SDP of Punjab during 1966-67 tO 1998-99 at 1980-81 Prices(in per cent)
Sector 1966-67
1973-74
1977-78
1984-85
1989-go
1996-^7
1998-99
Agriculture and livestock 52.85 52.57 50.30 50.28 49.15 44.95 41.33
Livestock 10.71 15.90 15.45 15.74 16.19 17.27 17.25Forestry and logging 0.38 0.81 0.80 0.33 0.6 0.46 0.44Fishing 0.04 0.03 0.03 0.03 0.06 0.19 0.24Mining and quarrying 0.01 0.01 0.01 0.01 0.04 0Manufacturing 7.86 9.36 10.67 13.4 15.55 20.07 21.1Electricity, gas and water supply________________ 0.71 1.00 0.96 1.39 1.96 2.61 2.69Construction 3.5 7.94 8.38 4.36 3.77 3.21 3.73Trade, hotels and restaurants 10.96 12.15 13.75 13.36 11.49 10.7 10.82Transport, storage and communication 1.45 1.89 1.88 2.16 2.3 2.89 3.47Banking and Insurance 1.43 1.84 1.98 3.21 4.28 5.38 6.17Real estate, ownership of dwellings and business services 5.78 4.53 3.69 3.73 3.43 2.47 2.38Public administration 1.52 1.79 1.63 2.55 3.09 3.38 3.99Other services and sanitary services 6.13 6.07 5.92 5.19 4.28 3.69 3.64Source; Various issues of Statistical Abstracts, PunjabNote : The data presented in the table marks the beginning year of the state and
latest year, and the last years of the respective plan periods beginning from Fourth Plan
During 1966-67 to 1998-99, the share of the manufacturing sector in SDP increased by 13.2 per cent points. During the 1990s, its rise was higher than during the 1970s and 1980s. This increase has continued consistently in all the plan periods. It increased by 2.1 per cent points between the Sixth and the Seventh Plans and by 4.5 per cent points during the Seventh and Eighth Plans. There has been hardly any increase in the first two years of the Ninth Plan.
The share of the construction sector in SDP has remained more or less the same during 1966-67 to 1998-99. On the other hand, the share of electricity, gas and water supply sectors have increased by 1.98 per cent points during the same period. However, as compared to the end of the Fourth Plan their share rose by 1.6 per cent points by the end of the Eighth Plan. The first two years of the Ninth Plan indicate a continuation of this trend.
The share of trade, hotel and restaurants sectors has marginally decreased during 1966- 67 to 1998-99. Their performance, however, has varied during different plan periods. At the end of the Fourth Plan it was 12.1 per cent, increased to 13.7 per cent at the end of the Fifth Plan, and thereafter, it started declining, reaching 10.7 per cent by the end of the Eighth Plan.

The transport, storage and communication sectors consistently increased during every plan period. During 1966-67 to 1998-99, their share increased by 2.0 per cent points, banking and insurance by 4.7 per cent points and public administration by 2.5 per cent points. The sectors experiencing a decline in their share in SDP during the same period were real estate ownership of dwellings and business services (3.4% points) and other services (2.5% points).
Expenditure pattern: Spending on different sectors has had a direct bearing on the growth of the state economy. Budgetary expenditure by the government, during 1967-68 to 2000-01, increased 134 times from Rs. 95.74 crore to Rs. 12,861.74 crore. At the time of the formation of the state, in 1966, the development expenditure was two-thirds of the total budgetary expenditure, which was 5.2 per cent of the NSDP (L. Singh and S. Singh, 2002). It peaked to 72.1 per cent of the total budgetary expenditure in 1975-76, which was 7.7 per cent of the NSDP (Table 7). Thereafter, it started declining. During 1980-81 to 1990-91, it declined by seven per cent points, whereas its share in the NSDP increased by almost one per cent point. The decline in development expenditure was sharper in the 1990s. During 1990-91 to 2000-01, it decreased by 18.1 per cent points.

Different Types o1 Expenditure in Punjab (in Rs crore and per cent s hares)
Years Budgetaryexpenditure
Developmentexpenditure
Nondevelopmentexpenditure
Capitalexpenditureas per cent of NSDP
Budgetaryexpenditureas per cent of NSDP
Development expenditureas per cent of NSDP
1967-68 95.74 60.15 39.84 - 8.6 5.171970-71 136.02 64.99 35.00 4.93 9.47 6.151975-76 278.27 72.14 27.85 - 10.7 7.721980-81 549.53 71.92 28.07 6.01 12.34 8.881985-86 1,162.9 66.48 33.71 6.03 13.98 9.31990-91 2,519.91 64.92 35.07 3.7 15.03 9.761996-97 6,925.67 56.99 42.04 2.34 16.84 9.591997-98 8,195.65 54.46 44.67 1.53 18.05 9.831998-99* 8,384.31 46.74 52.38 5.2 16.91 7.901999-00* 10,195.27 44.75 54.75 3.21 18.38 8.222000-01* 12,861.74 46.77 52.54 4.70 21.12 9.88Source: Singh, L. and S. Singh (2002): Deceleration of Economic Growth in Punjab,
Evidence, Explanation and a Way Out, Economic and Political Weekly, 9 February, 2002*- Reserve Bank of India (various volumes); State finances: A study of
budgetsNote: Figures in parenthesis are percent share.
Figures 5Type of expenditure in Punjab: 1967-68 to 2000-01
52.54' “54.75!
52.77!
S56.99 a i6 4 . 9 3 B iH
I6 6 .4 8 E = 2 ' 1 .
;44.671^2.04!
0% 10% 20% 30% 40% 50% 60% 70% 80% 90% 100%
1 Development E3 Non-development
Source; Same as in Table 7

During 1967-68 to 2000-01, the share of budgetary expenditure to NSDP increased from 8.6 per cent to 21.12 per cent points, an increase of 12.52 per cent points. In comparison, development expenditure increased from 5.2 per cent of NSDP to 9.9 per cent during the same period, an increase of only 4.7 per cent points.
Capital expenditure, which is considered to be the central force for creating capacity in social and economic infrastructural facilities for the use of the productive sectors of the economy, has declined sharply from a high of six per cent in 1985-86 to 4.7 per cent of NSDP in 2000-01. The declining capital expenditure is likely to put a constraint on the expansion of the future rate of economic growth. Decline in investment in both public and private sectors has affected the rate of economic growth of the state in the 1990s (L. Singh and S. Singh, 2002).
Plans-wise expenditure: Plan-wise expenditure on various sectors during the Fourth and the Ninth Plan reveals the predominance of the irrigation and power sectors. In the Fourth Plan, 59.4 per cent of the total expenditure was on these sectors. It rose to 66.1 per cent during the Seventh Plan (Table 8). By the Ninth Plan it came down to 51.1 per cent, but remains the major chunk of the total expenditure. In the social sector, the expenditure on social and community services was 12.2 per cent, which has risen to 28.4 per cent during the Ninth Plan period. At the time of the formation of the state, much emphasis was laid on the development of rural infrastructure through better transport and communication facilities. To reach the desired goals, the expenditure initially was 13.84 per cent of the total. The state attained one of the highest road densities and a well-developed infrastructure. Thereafter, it started declining in each successive plan period. By the Eighth Plan the expenditure on this sector came down to 3.68 per cent. It has slightly increased in the Ninth Plan.
Table 8
Major sectors of development FourthPlan
FifthPlan
SixthPlan
SeventhPlan
EighthPlan
NinthPlan*
Agricultural and allied sectors 10.29 11.73 10.69 7.91 5.4 4.9Co-operation 1.47 1.22 2.09Irrigation and power 59.44 51.73 60.25 66.06 58.81 51.09Industry and mineral 2.64 5.22 3.93 4.2 2.71 1.12Transport and communication 13.84 8.8 6.03 3.98 3.68 4.84Social and community services 12.23 20.38 16.24 13.44 22.83 28.42Economic services 0.09 0.05 0.03 0.71 1.15 1.75General services 0.87 0.74 0.87 1.95 4.00Rural development 2.12 2.66 3.37Special area programme 0.64 0.78 0.89Science, technology and environment 0.07 0.03 0.03Source: Various issues of Statistical Abstracts, PunjabNote: * - Includes actual expenditure during 1997-01 and anticipated expenditure
during 2001-02

The expenditure on agriculture and allied sectors has come down from 10.3 per cent in the Fourth plan to 4.9 per cent during the Ninth Plan. The reduction was more during the Sixth and Seventh Plan during which period it declined by 2.8 per cent points. The expenditure on industry and minerals was more or less the same in the Fourth and Eighth Plan periods. However, its share to total expenditure during the Fifth, Sixth and Seventh Plans rose to 5.2, 3.9 and 4.2 per cent respectively. Expenditure during the successive plan periods reveals an emphasis on irrigation and power, the two factors of development of agriculture and industry, respectively.
POVERTY
Estimates of poverty indicate a declining trend in the country as a whole and in Punjab as well. Comparable estimates based on somewhat consistent methodology and data are available until 1993-94. In the 55‘ Round Survey by NSSO, certain modifications have made the data incomparable with the earlier estimates of poverty. The overall poverty in the country declined from 54.88 per cent to 35.97 per cent during 1973-74 to 1993-94 as against a decline from 28.15 per cent to 11.77 per cent in the state (Table 9). At the national level, the decline in the population below the poverty line was steeper in rural areas than in urban areas during the same period. In Punjab, the trend was different. Here, the decline was more or less similar in both rural and urban areas. It was higher during 1973-74 to 1977-78, when it decreased from 28.15 per cent to 19.27 per cent, a fall of nine per cent. During this period, urban poverty was stagnant, whereas rural poverty declined by 12 per cent. This could have been due to the impact of the green revolution. At present only two states, Goa and Jammu and Kashmir, have a poverty level lower than Punjab. Poverty in Kerala was almost double (12.72%) that in Punjab (5.34%) in 1999-2000.
Table 9
Year Punjab All IndiaTotal Rural Urban Total Rural Urban
1973-74 28.15 28.21 27.96 54.88 56.44 49.011977-78 19.27 16.37 27.32 51.32 53.07 45.241983 16.18 13.2 23.79 44.48 45.65 40.791987-88 13.2 12.6 14.67 38.86 39.09 38.21993-94 11.77 11.95 11.35 35.97 37.27 32.361999-00(7 days recall period) 5.34 5.31 5.4 23.33 24.02 21.59(30 day recall period) 6.16 6.35 5.75 26.10 27.09 23.62Source : Various vo umes of NSSO

Poverty eradication schemes: A number of schemes for eradicating poverty in rural as well as urban areas have been operative in the state. In rural areas, Swaran Jayanti Gram Swan Rozgar Yojna and in urban areas, Swaran Jayanti Shahri Rozgar Yojna, besides other poverty alleviation schemes, are being implemented to provide sustainable income to the targeted groups in the respective areas.

AGRICULTURAL DEVELOPMENT
The state was a deficit area in food production at the time of partition, in 1947. At that time it lost 70 per cent of the income and the same percentage of canal irrigated area in the western part of undivided Punjab. Indian Punjab was left with meagre resources. In the present Punjab area, irrigational facilities were inadequate as per the requirements, livestock were of poor quality, literacy was low and the population lived mostly in rural areas. Not only was there a division of physical resources, but even technical skills were partitioned. Peasants in Indian Punjab had not acquired the same progressive skills in farming as their counterparts in West Pakistan, Soon after Independence, the Government of Punjab passed legislations and formulated schemes aiming at agricultural development.
Deficit to surplus; Over time, the situation has changed. From a food deficit area, the state has become a surplus producer not only in foodgrains like wheat and rice but also in cotton and sugarcane. This remarkable transformation was achieved due to the hard work of the farming community, determined efforts of successive governments, and adequate physical infrastructure in the form of terrain, fertile soils and a well-developed irrigation network.
Agriculture as the lead sector; The programmes and policies initiated for agricultural development in the state were effectively implemented compared to policies in other sectors of development. Respective state governments adopted and followed correct sequencing to achieve the desired goal in the field of agriculture. Policies put into operation began with consolidation of landholdings, followed by extension of cultivated and irrigated lands and still further strengthened by the use of fertilizers and high yielding variety seeds. In addition, problem areas such as the foothill (kandi) zone and the floodplain {bets) zone were identified and given special attention for the development of agriculture. The electrification of villages and their linkage with roads further enhanced and consolidated the gains of agricultural development.
Wheat-rice rotation: Gains of agricultural development, due to the green revolution, were shared mainly by two principal crops - wheat and rice. During 1966-67 to 2000-01, the area under wheat has increased 2.1 times and production 6.3 times (Table 10). The area under rice has increased seven times and yields two times during 1970-71 to 2000- 01. The increasing productivity of these two crops during the last three decades or so has made it profitable to produce these. The steady growth in both the cultivated area and the resultant output was backed by refined agronomic practices, and fairly reasonable support prices.
The increasing profitability of these two crops over time has proved to be a hindrance to the diversification of agricultural production in the state. It has become the usual practice of the farming community to follow the paddy-wheat-paddy cycle. This is leading to serious ecological problems.

Variations in Yield per Hectare of Wheat and Rice 19701-71 to 2000-01
5000
4500
4000
3500TO
3000 -
2500
2000
1500T— CO LO N- 05 T— CO O) T- CO lO N. Oi T-h;- h- h- 00 00 op CO CO CT) 05 CT) o> Oi cp
6 CN ”4 CO CO o CNI CD 00 CD CNJ CO 00 CD1^ h- CO 00 00 00 CO Oi CD CD o> Oi O<J) O) O) o> o i o cn O) CT> Oi Oi Oi O) Oi Oi Or— T— T— T— T— r~ T— CVJ
'Wheat •Rice
Source; Various issues of Statistical Abstracts, Punjab
Green revolution; The cumulative effect of the green revolution, became manifest by the beginning of 1990s. The net sown area of the state increased from 40,53,000 hectares in 1970-71 to 42,18,000 hectares in 1990-91 and 42,64,000 hectares in 2000- 2001.The cropping intensity, which was 133 in 1967, increased to 187 in 1999. This is the highest in the country. In 1970-71, 73 and 36 per cent of the total area were under high yielding varieties (HYVs) of wheat and rice respectively. By 1990-91, these rose to99.7 per cent and 97.5 per cent respectively. On 30 June 1999, 100 per cent of the area under wheat and 97.6 per cent under rice were covered by HYVs.

YearWheat Rice
Area (000 ha)
Production (000 mt)
Yield(kg/ha)
Area (000 ha)
Production (000 mt)
Yield(kg/ha)
1966-67* 1,608 2,449 1,5201967-68’ 1,709 3,335 1,8631968-69 2,063 4,491 2,1771969-70 2,191 4,918 2,2451970-71 2,299 5,145 2,238 390 688 1,7641971-72 2,336 5,618 2,204 450 920 2,0451972-73 2,404 5,368 2,233 476 955 2,0071973-74 2,338 5,181 2,216 499 1,140 2,2871974-75 2,206 5,284 2,995 569 1,179 2,0711975-76 2,449 5,809 2,372 567 1,447 2,5531976-77 2,630 6,292 2,432 680 1,776 2,6111977-78 2,620 6,648 2,537 858 2,497 2,9101978-79 2,734 7,423 2,517 1,052 3,090 2,9371979-80 2,823 7,996 2,797 1,172 3,052 2,6041980-81 2,808 7,669 2,731 1,183 3,233 2,7331981-82 2,917 8,553 2,932 1,269 3,750 2,9551982-83 3,054 9,183 3,007 1,322 4,156 3,1441983-84 3,124 9,419 3,015 1,481 4,536 3,0631984-85 3,096 10,183 3,289 1,644 5,052 3,0731985-86 3,113 10,992 3,531 1,714 5,485 3,2001986-87 3,189 9,458 2,966 1,786 5,949 3,3311987-88 3,139 11,005 3,506 1,720 5,442 3,1641988-89 3,156 11,576 3,668 1,778 4,925 2,7701989-90 3,251 11,681 3,593 1,905 6,680 3,5101990-91 3,273 12,159 3,714 2,016 6,511 3,2291991-92 3,237 12,309 3,802 2,069 6,739 3,2571992-93 3,283 12,399 3,776 2,072 7,026 3,3911993-94 3,335 13,378 4,011 2,179 7,645 3,5071994-95 3,311 13,542 4,090 2,265 7,703 3,3821995-96 3,221 12,510 3,883 2,185 6,843 3,1311996-97 3,232 13,687 4,203 2,159 7,334 3,3961997-98 3,301 12,751 3,853 2,278 7,890 3,4651998-99 3,278 14,192 4,332 2,518 7,993 3,1521999-00 3,388 15,910 4,696 2,604 8,716 3,3472000-01 3,408 15,551 4,563 2,612 9,157 3,506Source; Various issues of Statistical Abstracts, Punjab
Singii, H. (2001): Green Revolution Reconsidered: Contemporary Punjab, Oxford, New Delhi
The Rural World of
Mechanization; The green revolution in the late sixties greatly benefited agricultural development in the state in terms of its mechanization as well. There was a change in the technology of farming, with heavy investment in irrigation, fertilizers, and chemicals

to control pests and weeds. Besides the introduction of high yielding varieties, tractorization greatly boosted agricultural development in the state. The popularity of tractorization can be judged from the fact that, with less than three per cent of the country’s cultivated land, Punjab accounted for about 30 per cent of the total tractors in India in 1972 (Gosal, G.S. and G. Krishan, 1984). Tractors, threshers and crushers hold the most prominent position in the mechanization of agriculture in the state.
Fertilizer use: The consumption of fertilizers in the state has multiplied manifold. It was consuming 51 thousand nutrients tonnes in 1966-67, which increased to 290 thousand in 1970-71, 1,098 thousand in 1985-86 and to 1,314 thousand nutrient tonnes in 2000- 2001. In comparison with the national average of 8.74 kilogram per hectare of gross cropped area in 1971-72, the state was consuming 50.7 kilogram. The difference widened over time. In 1979-80, the state was consuming 104.96 kilogram per hectare of gross cropped area as against 30.4 kilogram at the national level.
Energy input: High consumption of electricity by the farmer is another distinguishing factor responsible for the state’s agricultural development. Consumption of electricity increased from 46.3 crore kwh in 1970-71 to 823.3 crore kwh in 1999-2000, an eighteen- times increase. The number of consumers increased from 91,410 to 794,475, an increase of 8.7 times. Consumption of electricity in 1999-00 was at its peak. During this year, it rose to 823.3 crore kwh, which was 130.2 crore kwh more than in the previous year.
Small size of landholdings: Another typical feature of Punjab’s agriculture is the predominance of small size of landholdings and their further fragmentation. During 1980- 81 to 1990-91, the number of operational landholdings increased from 10,27,000 to 11,11,951. The average size of the landholdings decreased from 3.81 hectares in 1980- 81 to 3.77 hectares in 1985-86 and 3.61 hectares in 1990-91. Seventy per cent of the landholdings are less than four hectares. Landholdings with a size of 10 hectares and above declined from 7.2 per cent to six per cent during 1980-81 to 1990-91. In contrast, landholdings with less than one hectare have increased from 19.2 to 26.5 per cent during the same duration. Fragmentation of landholdings and the resultant reduction in size have posed a serious threat to the farming community who are more or less dependent on agricultural produce. The size of landholdings is one factor hampering the diversification of agricultural production in the state.
Agricultural marketing; The State Agricultural Marketing Board, established in the early sixties, provided space to market arrivals in the state. This has expanded. The number of regulated markets, the average number of villages served per regulated market and the average area served per regulated market have been upgraded. The number of regulated markets increased from 88 in 1966-67 to 144 in 2000-01. The number of markets increased from 109 to 123 during 1979-80 to 1981-82. Consequently, the average number of villages served per regulated market declined from 112 to 99 and the average area served per regulated market from 462 sq. kms. to 409 sq. kms. Since 1992-93, the number of markets has not changed. Besides the State Agricultural Marketing Board other agencies, viz., the Food Corporation of India, Punjab Agro Industnes Corporation, PUNSUP, are also involved in marketing agricultural produce in the state.
Marketing yards have increased in number over time but qualitatively are still not up to the mark. Most of the marketing yards do not have a concrete surface to keep the

arrivals in good condition. The surface is dusty, as wheat and rice are kept in the open and not well protected during the rainy season. Consequently, the quality of stored stocks deteriorates. There are instances in different parts of the state when the stock had to be destroyed.
Declining share of contribution to central pool: Since other states are gradually coming under the green revolution, the share of Punjab’s contribution of wheat and rice to the central pool has declined over time. The decline in the share of wheat is much sharper than of rice. The state was contributing 73 per cent share to the central pool in 1980-81, which has declined to 57.6 per cent in 2000-01, a fall of 15.4 per cent points (Table 11). The share of rice has declined by nine per cent points during the same period.
Table 11
Year Rice WheatContribution to the central pool (lakh tonnes)
Percentage share to contribution
Contribution to the central pool (lakh tonnes)
Percentage share to contribution
1980-81 25.2 45.3 42.8 73.01981-82 30.9 42.5 37.6 57.11982-83 32.3 46.0 48.3 62.51983-84 32.8 41.9 51.7 62.31984-85 42.7 43.6 50.1 53.91985-86 41.8 42.8 61.5 59.41986-87 43.3 47.1 64.8 61.51987-88 33.6 48.8 44.2 56.11988-89 29.6 38.9 47.5 72.71989-90 50.0 46.0 56.0 62.21990-91 48.2 41.0 67.5 61.01991-92 42.5 46.7 55.4 71.51992-93 49.0 42.3 44.9 70.31993-94 54.9 40.2 64.9 50.61994-95 58.3 43.5 72.9 61.41995-96 34.6 34.8 73.0 59.21996-97 42.2 38.4 56.3 68.81997-98 60.4 42.2 59.6 64.31998-99 43.8 37.2 61.5 48.61999-00 67.9 42.1 78.3 55.42000-01 69.4 36.3 94.2 57.6Source: Various issues of Statistical Abstract, Punja b
Distressful loan recovery: The gap in capital inputs and the resultant output has widened over time in the state. The institutional credit system has not been able to effectively involve small farmers. They are borrowing money from local moneylenders (aartias). This has created a peculiar situation in the state. Due to non-payment of credit, farmers are under great stress. The reported suicides by farmers in certain pockets of

the state are an indicator of the stressful agricultural system. In the recent past, farmers have resorted to selling their tractors for clearing their debts to local moneylenders.
Milk production: The emphasis on foodgrains initially was accompanied by diversification in livestock farming. The green revolution in the state was followed by a white revolution. Production of milk multiplied manifold under the well-conceived policy of the state government. It increased from 1,920 thousand tonnes in 1968-69 to 7,774 thousand tonnes in 2000-2001, a four-fold increase (Table 12). In the early 70s, increase in milk production was sharper. In 1971-72, milk production increased by 385 thousand tonnes as compared to the preceding year. The per capita availability of milk per day in the state increased from 375 grams in 1968-69 to 870 grams in 2000-2001.
Dairying in Punjab is not without some problems. The quality of cows and buffaloes is not up to the mark. Per capita production of cows and buffaloes in the state is much lower than in other parts of the world. This sub-sector of agriculture needs serious attention and investment from the policy makers to exploit its potential m improving the rural economy, and the nutrition level of the people.
Table 12Production and Per Capita Availability of Milk in Punjab 1968-69 to 2000-01
YearMilk production (000 tonnes) per annum
Estimatedpopulation( '000)
Per capita availability of milk (kg.) per annum
Per capita availability of milk (grams) per day
1968-69 1,920 14,035 137 3751970-71 1,823 13,441 159 4371975-76 2,400 14,792 162 4441980-81 3,221 16,304 197 5411985-86 4,035 18,521 218 5971990-91 5,142 20,615 249 6821991-92 5,382 21,102 255 6981992-93 5,583 20,789 260 7351993-94 5,970 21,176 292 7701994-95 6,215 21,910 287 7881995-96 6,424 22,328 291 7981996-97 6,755 22,504 301 8251997-98 7,165 23,189 309 8451998-99 7,394 23,700 312 8551999-00 7,706 24,100 320 8752000-01 7,774 24,400 317 870Source; Same as in Table 10
Constraints; On the whole, agriculture in Punjab is in a crisis, which in turn, has influenced the overall economy of the state. The share of agriculture to the state income, which was one-third in 1993-94, has come down to one-fourth in 2000-2001 (at 1993-94 constant prices). Inability to diversify agriculture, market the agricultural produce and static productivity levels in the state are symptoms of a crisis in this sector. The maximum productivity achieved a few years ago has remained more or less the same. Chances of rapid increase in productivity in the near future in the state are also remote.

INDUSTRIAL DEVELOPMENT
The state cannot take equal pride in industrial development as in agriculture. It inherited a weak industrial base at the time of partition in 1947, as the majority of the industrial establishments and the areas supplying raw materials remained in West Punjab (Pakistan). Fear and panic prevented entrepreneurs from investing in industries in a state with a long sensitive international border with a hostile neighbour. The state had to pay for the wars of 1962, 1965 and 1971. These resulted in further flight of capital from Punjab. Moreover, in 1966, with the reorganization of the state, whatever mineral and forest resources it had went to Himachal Pradesh. Industrial complexes, which were around Delhi, went to Haryana.
Predominance of small-scale industries: Small-scale industries dominate the industrial structure in the state. The localization of development in the small-scale sector and its supremacy over the large-scale industries is the outcome of many factors. The state did not have many rich capitalists to invest in large-scale industry and investment by the central government was meagre. Because of the closeness of sensitive international border with Pakistan, capitalists from other parts of India and government agencies were reluctant to invest in big industries. In addition, lack of metallic minerals and fossil fuels required for the establishment of large-scale industries forced industrialists to undertake small-scale industries.
The predominance of small-scale industries in the state can be judged from the fact that during 1973-74 small-scale industries accounted for more than three-fifths of the total industrial production as against two-fifths at the national level. Small-scale industries have grown substantially since 1966. The total number of small-scale industrial units increased from 8,023 in 1966 to 2,00,603 in 2000-01 (Table 13). During the same period, the workforce employed in this sector increased from 56,000 to 8,97,417. Fixed investment increased from Rs. 60 crore to Rs. 4,250 crore and production from Rs. 200 crore to Rs. 19,525 crore during 1966-67 - 2000-01 (P). During the same period, the number of units in the small sector grew at the rate of 9.6 per cent per annum while employment provided by them increased at an annual rate of 8.2 per cent, with the result that the average per unit persons employed declined from seven in 1966-67 to four in 2000-01 (P). Per unit average fixed investment increased from Rs. 0.74 lakh in 1966-67 to Rs. 1.89 lakh in 2000-01 (at current prices). Employment generated per crore rupees invested has dropped from 933 in 1966-67 to 211 in 2000-01 (at current prices). In the eighties, employment generated per crore rupees invested was 614 persons as against 342 in nineties.

Status of Small-scale Industries in Punjab 1966-67 to 20 00-01
Year Number of units
Employment(no.)
Fixedinvestment (Rs. crore)
Production (Rs. crore)
1966-67 8,023 56,000 60.0 200.01974-75 18,114 1,22,162 134.0 484.01975-76 20,271 1,36,334 153.0 568.31976-77 22,298 1,52,638 169.0 633.01977-78 24,231 1,63,1341 195.0 702.01978-79 27,509 1,86,197 225.0 779.01979-80 33,716 2,23,979 273.0 924.01980-81 43,338 2,64,869 332.0 1,118.01981-82 54,021 3,04,155 402.0 1,343.01982-83 64,901 3,39,972 492.0 1,586.01983-84 76,588 3,78,846 572.0 1,786.01984-85 88,271 4,24,478 656.0 1,958.01985-86 97,517 4,64,809 739.0 2,151.01986-87 1,08,913 5,03,397 830.0 2,359.01987-88 1,19,888 5,45,560 943.0 2,682.01988-89 1,32,962 5,94,354 1,064.0 3,109.01989-90 1,46,443 6,33,964 1,218.0 3,504.01990-91 1,60,388 6,68,845 1,349.0 4,050.01991-92 1,76,378 7,11,417 1,499.0 4,437.01992-93 1,81,563 7,32,580 1,621.0 5,345.01993-94 1,84,875 7,55,883 1,764.0 7,075.01994-95 1,88,241 7,76,763 1,973.0 8,737.81995-96 1,91,025 8,02,329 2,216.1 9,713.91996-97 1,93,332 8,21,170 2,491.3 11,106.21997-98 1,95,383 8,40,568 2,859.9 13,057.71998-99 1,97,344 8,64,592 3,360.7 14,444.51999-00 1,99,071 8,83,005 3,793.7 16,610.82000-01 (P) 2,00,603 8,97,417 4,250.0 19,525.0Source; Same as in Table 10
Increasing large/medium units; Large-scale industrial units increased from 122 in t966 to 132 in 1974-75, and from 355 in 1989-90 to 638 in 2000-01 (Table 14). During the same period, the workforce employed in this sector increased from 42,735 to 57,891 to 1,69,801 and 2,51,890 respectively. The fixed investment increased from Rs. 104.0 crore in 1966-67 to Rs. 17,000.0 crore (P) in 2000-01. Production increased from Rs.93.0 crore in 1966-67 to Rs. 35,600.0 crore (P) in 2000-01 (at current prices). Per unit average fixed investment increased from Rs. 85.2 lakh in 1966-67 to Rs. 2,416.7 lakh in 2000-01 (P). Per unit average fixed investment has started increasing sharply since the early nineties. Per unit average fixed investment in 1989-90 was Rs. 868.4 lakh, which increased to Rs. 1,254.6 lakh by 1992-93. Unlike small-scale industries, large/medium industries have become relatively more capital intensive. Employment generated per crore rupees invested has dropped from 411 in 1966-67 to less than 15 in 2000-01 (at

current prices). In the eighties, the employment generated per crore rupees invested in the large/medium industry was 88 persons as against 24 in the nineties.
Table 14
Year Number of Units
Employment(No.)
Fixed investment (Rs. crore)
Production Rs. (crore)
1966-67 122 42,735 104.0 93.01974-75 132 57,891 109.0 308.01975-76 144 63,291 196.0 385.01976-77 160 69,942 257.0 471.01977-78 175 77,971 310.0 607.01978-79 188 91,551 379.0 711.01979-80 203 97,533 629.0 869.01980-81 228 1,07,767 727.0 1,141.01981-82 237 1,09,081 835.0 1,529.01982-83 243 1,20,925 962.0 1,826.01983-84 254 1,24,819 1,099.0 1,993.01984-85 273 1,31,381 1,252.0 2,071.01985-86 292 1,32,174 1,490.0 2,535.01986-87 306 1,42,381 1,401.0 3,185.01987-88 322 1,51,990 2,067.0 3,778.01988-89 335 1,60,609 2,452.0 4,379.01989-90 355 1,69,801 3,083.0 5,458.01990-91 373 1,87,311 4,003.0 7,164.01991-92 395 1,93,789 4,552.0 7,709.01992-93 414 1,88,034 5,194.0 9,335.01993-94 440 2,00,000 5,800.0 11,000.01994-95 475 2,06,722 6,420.0 13,500.01995-96 526 2,10,448 8,744.1 16,656.11996-97 586 2,19,383 9,744.6 21,387.11997-98 620 2,21,154 11,720.1 25,406.01998-99 602 2,27,929 14,038.1 25,376.01999-00 . 611 2,35,993 14,765.8 23,720.12000-01 (P) 638 2,51,890 17,000.0 35,600.0Source; Same as in Table 10
Small-scale industries in the state are getting linked over time to large-scale industries as ancillaries. Consequently, their production process is getting more modernized. However, small-scale units are still backward and usually depend on relatively less skilled labour, willing to accept jobs with poor working conditions and low wages. This makes job opportunities unattractive for the educated youth, as a result of which educated unemployment continues to grow at an alarming rate despite an impressive growth rate of industrial production (Abbi, B. L. and Singh, Kesar, 1997).

industrial dispersal; Another typical feature of the industrial structure in the state is drifting of industries towards rural locations. Both small and large/medium industries have evidently moved towards rural areas. In 1979-80, of the total small-scale industries, 27,428 were in urban areas and 6,288 in rural areas. The situation has changed since. Industries in rural locations have increased at a higher pace than in urban areas. During 1989-90 - 1993-94, industries in rural areas increased 28.5 per cent as against 24.6 per cent in urban areas. There was a similar shift there in large/medium industries. In 1966, of 65 industries classified as large/medium, only 10 were located in rural areas, whereas 55 of them were in urban areas. By 1998 as many as 330 units were in rural areas against 227 in urban areas. Prior to 1966, even though dependent on the rural economy for their raw materials, industrial units could not depend upon the rural environment for the supply of basic infrastructure and skilled personnel and, therefore, were established in urban areas. The situation has changed over time. Proximity to raw materials supported by improved infrastructure, communications, roads and availability of skilled manpower has attracted industries to rural areas. The state government has taken the initiative to move industries towards rural areas by setting up focal points there, but this policy seems to have had little impact on the distributional pattern of industries. The number of these focal points remained static (362) during 1984 to 1997. Apart from this, support in the form of capital subsidies, availability of electric connection and tax incentives have encouraged setting up of industries in rural areas. As a result, they have attracted industrial entrepreneurs from adjacent urban locations. (Singh, H. 2001).
Industry-agriculture linkage: The green revolution in the state gave a big boost to the industrial economy through both forward and backward linkages and continuous transfer of resources from agriculture to Industry (Gill, 1994, pp. 46-57). This is reflected in the relatively higher growth rate of the manufacturing sector than the agricultural sector. The post-liberalization situation has made the state government focus on the development of agro-based industries, to capitalize on Punjab’s competitive advantage in food production.
Constraints: Industries in the state are making headway, despite such constraints as location on a hostile border and near absence of mineral resources. The employment absorption capacity of industries, especially of local labour, has declined.
HUMAN DEVELOPMENT
With a population of 2.43 crore, according to the 2001 Census, Punjab is one of the less populous states in India. As a comparison, Uttar Pradesh recorded a population of no less than 16.61 crore in 2001. This population of Punjab is, however, more than that of Australia at 1.94 crore. The state has experienced an almost two-fold increase in its demographic size since its formation in 1966. The urban population constitutes 34 per cent of the total population with three-fifths concentrated in 14 cities, each with a population of at least one lakh. The average population size of a village, which typically is an agglomerated settlement, is about 1,908 persons.
Man-land ratio: Punjab, with 482 persons per square kilometre is more densely populated than India as a whole, with 324 persons per square kilometre. There are striking variations; Ludhiana (824) is the most crowded while Muktsar (297) is the most thinly populated.

Growth of population; The state recorded an average annual population growth rate of 1.96 per cent during 1971-2001. A slow but steady decline in the population growth rate has been observed: 2.2 per cent during 1971-81, 1.9 per cent during 1981-91 and 1.8 per cent during 1991-2001. By connparison, India’s population has grown at an average annual rate of 2.1 per cent during 1971-2001.
Birth rate: Realizing that rapid population increase would negate the benefits of development, the state government has been trying to control the growth rate of population through its family planning programmes. Achievements in slowing down the growth rate are not that disappointing: the birth rate was 34.1 during 1971-73 and 22.4 during 1997-99. The comparable fall in India’s birth rate was from 36.2 to 26.6 during the same period. Punjab’s performance in fertility decline was superior to the national average, but was found wanting when compared to that of Kerala, where the birth rate came down from 30.5 to 18.
Death rate: Equally noticeable is the decline in Punjab’s death rate from 11.7 in 1971-73 to 7.5 in 1997-99. Comparable figures for India are 15.9 and 8.8 respectively. This signifies that not only the birth rate but the death rate too declined faster in Punjab than in the country as a whole.
Concern for human development: However, the overwhelming attention paid to economic upliftment was not matched by adequate care for some of the critical parameters of human capital, including infant mortality, literacy, sex composition, and reproductive health. Plan documents did voice a concern for human wealth: The primary objective of the First Plan (1951-56) was to raise the standard of living and to expand opportunities for a richer and more varied life and the Ninth Plan (1997-2002) reiterated the importance of focusing on human development. Despite such a strong concern for the development of human capital and a perspective for eliminating the worst forms of human deprivation, the state’s achievements have been mixed.
Indicators of human development: There are various indicators of human development. However, the general consensus is on those in which children survive after birth and live a long and healthy life, people are literate and economically productive and acquire a decent standard of living. Such indicators as infant mortality rate, life expectancy, literacy, gender sensitization (sex ratio), and economic well-being have been used to find out the status of human development in the state. These indicators in Punjab vis-a-vis other states are discussed in detail in the following sections.
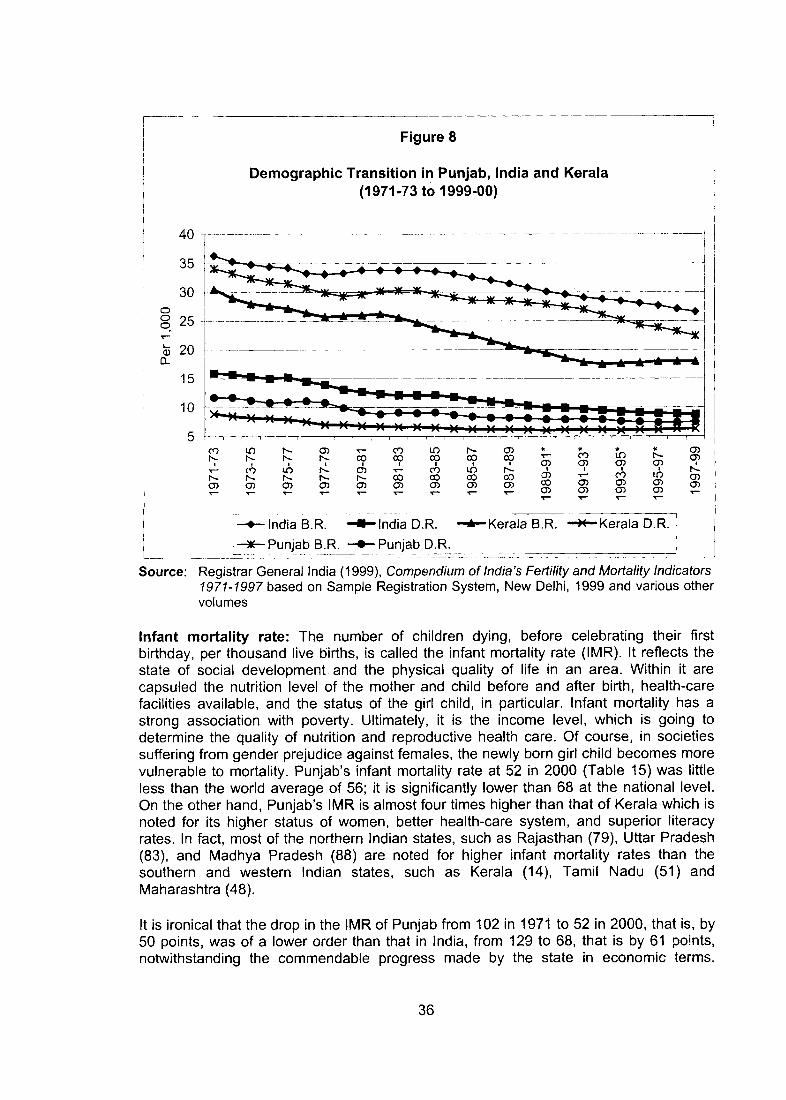
Demographic Transition in Punjab, India and Kerala (1971-73 to 1999-00)
O) <j>
-India B.R. •Kerala B.R. ' " Kerala D.R.
-Punjab B.R. — • — Punjab D.R.
Source; Registrar General India (1999), Compendium of India’s Fertility and Mortality Indicators 1971-1997 based on Sample Registration System, New Delhi, 1999 and various other volumes
Infant mortality rate: The number of children dying, before celebrating their first birthday, per thousand live births, is called the infant mortality rate (IMR). It reflects the state of social development and the physical quality of life in an area. Within it are capsuled the nutrition level of the mother and child before and after birth, health-care facilities available, and the status of the girl child, in particular. Infant mortality has a strong association with poverty. Ultimately, it is the income level, which is going to determine the quality of nutrition and reproductive health care. Of course, in societies suffering from gender prejudice against females, the newly born girl child becomes more vulnerable to mortality. Punjab’s infant mortality rate at 52 in 2000 (Table 15) was little less than the world average of 56; it is significantly lower than 68 at the national level. On the other hand, Punjab’s IMR is almost four times higher than that of Kerala which is noted for its higher status of women, better health-care system, and superior literacy rates. In fact, most of the northern Indian states, such as Rajasthan (79), Uttar Pradesh (83), and Madhya Pradesh (88) are noted for higher infant mortality rates than the southern and western Indian states, such as Kerala (14), Tamil Nadu (51) and Maharashtra (48).
It is ironical that the drop in the IMR of Punjab from 102 in 1971 to 52 in 2000, that is, by 50 points, was of a lower order than that in India, from 129 to 68, that is by 61 points, notwithstanding the commendable progress made by the state in economic terms.

Kerala’s IMR dropped from 58 to 14 during the same period. This signifies that social development is no less critical than economic development in containing IMR.
Table 15
Year Pun. Har. Ker. Kar. T.N. India Mah. Bihar Raj.l U.P. Ori. M.P. A.P. W.B. Guj.1971 102 72 58 95 113 129 105 1 167 127 135 106 1441972 119 94 63 95 121 139 101 123 202 131 156 116 1281973 115 104 54 90 108 134 116 137 176 145 145 105 1611974 97 102 54 86 106 126 89 133 172 150 137 111 1091975 98 114 54 80 112 140 92 155 198 149 151 123 1541976 108 112 56 89 110 129 83 142 178 127 138 122 1461977 105 113 47 83 103 130 • 108 142 168 147 148 125 1381978 117 109 42 82 105 127 81 140 177 133 143 117 1221979 92 100 43 83 100 120 86 109 162 149 143 106 1231980 89 103 40 71 93 114 75 105 159 143 142 92 1131981 81 101 37 69 91 110 79 118 108 150 135 142 86 91 1161982 75 93 30 65 83 105 70 112 97 147 132 134 79 86 1111983 80 91 33 71 87 105 79 99 109 155 126 125 77 84 1061984 66 101 29 74 78 104 76 95 122 155 131 121 78 82 1061985 71 85 31 69 81 97 68 106 108 142 132 122 83 74 981986 68 85 27 73 80 96 63 101 107 132 123 118 82 71 1071987 62 87 28 75 76 95 66 101 102 127 126 120 79 71 971988 62 90 28 74 74 94 68 97 103 124 122 121 83 69 901989 64 82 21 80 68 91 59 91 96 118 121 117 81 77 861990 61 69 17 70 59 80 58 75 84 99 122 111 70 63 721991 53 68 16 77 57 80 60 69 79 97 124 117 73 71 681992 56 75 17 73 58 79 59 73 90 98 115 104 71 65 671993 55 66 13 67 56 74 50 70 82 94 110 106 64 58 581994 53 70 16 67 59 74 55 67 84 88 103 98 65 62 641995 54 69 15 62 54 74 55 73 86 86 103 99 67 58 621996 51 68 14 53 53 72 48 71 85 85 96 97 65 55 611997 51 68 12 53 53 71 47 71 85 85 96 94 63 55 621998 54 69 16 58 53 72 49 67 83 85 98 97 66 53 641999 53 68 14 58 52 70 48 63 81 84 97 90 66 52 632000 52 67 14 57 51 68 48 62 79| 83 96 88 74 51 62Source: Registrar Genera India (1999), Compendium o f India’s Fertility and Mortality
Indicators 1971-1997, based on Sample Registration System, New Delhi, 1999 and various other volumes
Note; Pun.- Punjab Har. - Haryana Ker. - KeralaT.N.- Tamil Nadu Mah.- Maharashtra Raj. - RajasthanU.P - Uttar Pradesh Ori. - Orissa M.P. - Madhya PradeshA.P.- Andhra Pradesh W.B.- West Bengal Guj. - Gujarat
The state did succeed in narrowing down the rural-urban gap in IMR during 1971-2000from 109 to 56 in rural areas and from 76 to 38 in urban areas. But its performance was lower than at the national level. The rural-urban gap narrowed down by 31 points in India
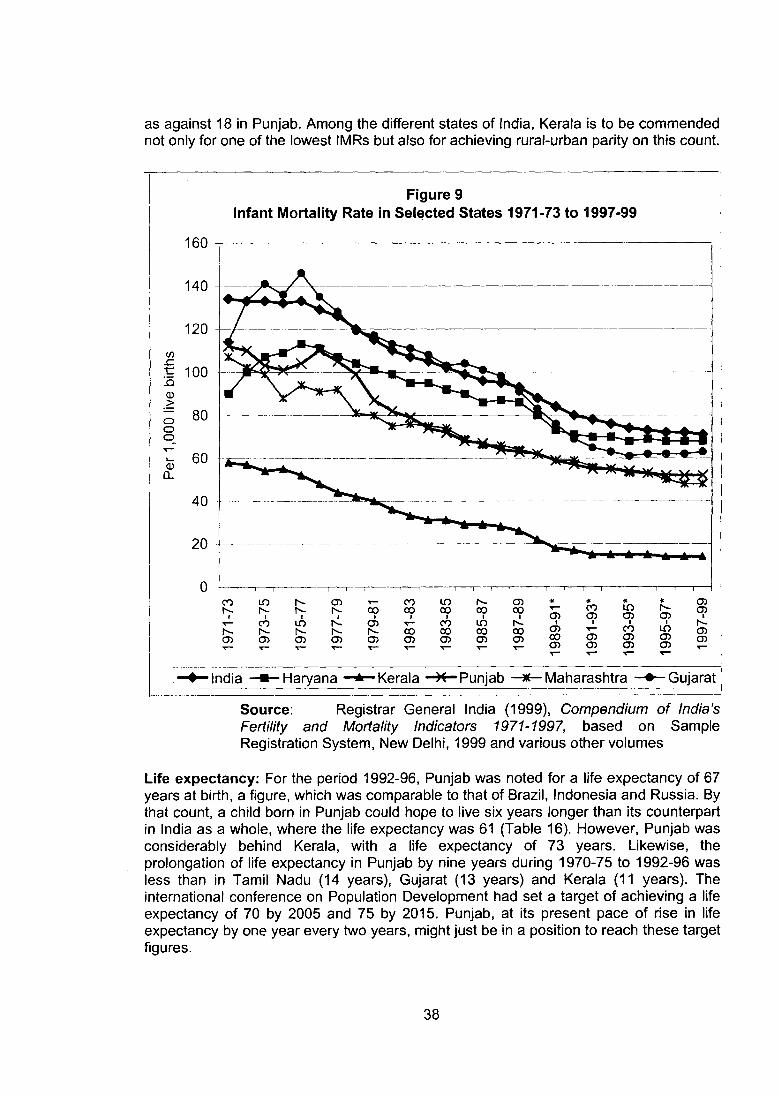
as against 18 in Punjab. Among the different states of India, Kerala is to be commended not only for one of the lowest IMRs but also for achieving rural-urban parity on this count.
Figure 9Infant Mortality Rate in Selected States 1971-73 to 1997-99
160
140
120
wi 100 <D >ooo
0CL
CO LO h - CD X— CO O )r ^ r ^ N - C30 00 00 00 00
CO i n r ^ <J> T— CO i nK - N - 00 00 00 00O ) O ) o > 05 O ) CJ> CT) <y>
'' T—
■KC O L O t^
O ) 0 5 0 5 0 5
d ) ■t— C O L O0 0 0 5 0 5 0 50 5 0 5 0 5 0 5
1O)a>
-India Haryana — ^ K e ra la — ^ P u n ja b Maharashtra — • “ Gujarat
Source; Registrar General India (1999), Compendium o f India’s Fertility and Mortality Indicators 1971-1997, based on Sample Registration System, New Delhi, 1999 and various other volumes
Life expectancy: For the period 1992-96, Punjab was noted for a life expectancy of 67 years at birth, a figure, which was comparable to that of Brazil, Indonesia and Russia. By that count, a child born in Punjab could hope to live six years longer than its counterpart in India as a whole, where the life expectancy was 61 (Table 16). However, Punjab was considerably behind Kerala, with a life expectancy of 73 years. Likewise, the prolongation of life expectancy in Punjab by nine years during 1970-75 to 1992-96 was less than in Tamil Nadu (14 years), Gujarat (13 years) and Kerala (11 years). The international conference on Population Development had set a target of achieving a life expectancy of 70 by 2005 and 75 by 2015. Punjab, at its present pace of rise in life expectancy by one year every two years, might just be in a position to reach these target figures.

States 1970-75 1976-80 1986-90 1991-95 1992-96 Increase in lifeexpectancy in 1992-96 over 1970- 75 period
Madhya Pradesh 47.2 49 53 54.7 55.2 8.0Orissa 45.7 49.4 54.4 56.5 56.9 11.2Uttar Pradesh 43 46.2 53.4 56.8 57.2 14.2Bihar 54.9 59.3 59.4 -
Rajasthan 48.4 51.9 55.2 59.1 59.5 11.1Andhra Pradesh 49.7 52.3 57.7 60.3 60.7 11.0Gujarat 48.8 52.4 57.7 61 61.4 12.6West Bengal 60.8 62.1 62.4 -
Karnataka 55.2 56.3 61.1 62.5 62.9 7.7Tamil Nadu 49.6 53.4 60.5 63.3 63.7 14.1Haryana 57.5 54.8 62.2 63.4 63.8 6.3Maharashtra 53.8 56.3 62.6 64.8 65.2 11.4
Punjab 57.9 60.5 65.2 67.2 67.4 9.5Kerala 62 65.5 69.5 72.9 73.1 11.1INDIA 49.7 52.3 57.7 60.3 60.7 11Source: Registrar General ndia (1999] , Compendium o f India’s Fertility and Mortality
Indicators 1971-1997, based on Sample Registration System, New Delhi, 1999
The current rise in life expectancy is attributed partly to the rise in the nutritional level and partly to the improvement in the health infrastructure in the state. As against four health centres per lakh population in 1966, there were 11 in 2000; as against three doctors per 10,000 population in 1966, there were 10 in 2000; and as against one midwife for 10,000 population in 1966; there were 10 in 2000. The average distance to a health centre was reduced to one-half, from six to three kilometres, during 1966-2000. As such, both availability and access to health services has significantly improved during the period under reference.
011438plann ing COMMISSION LIBRARY
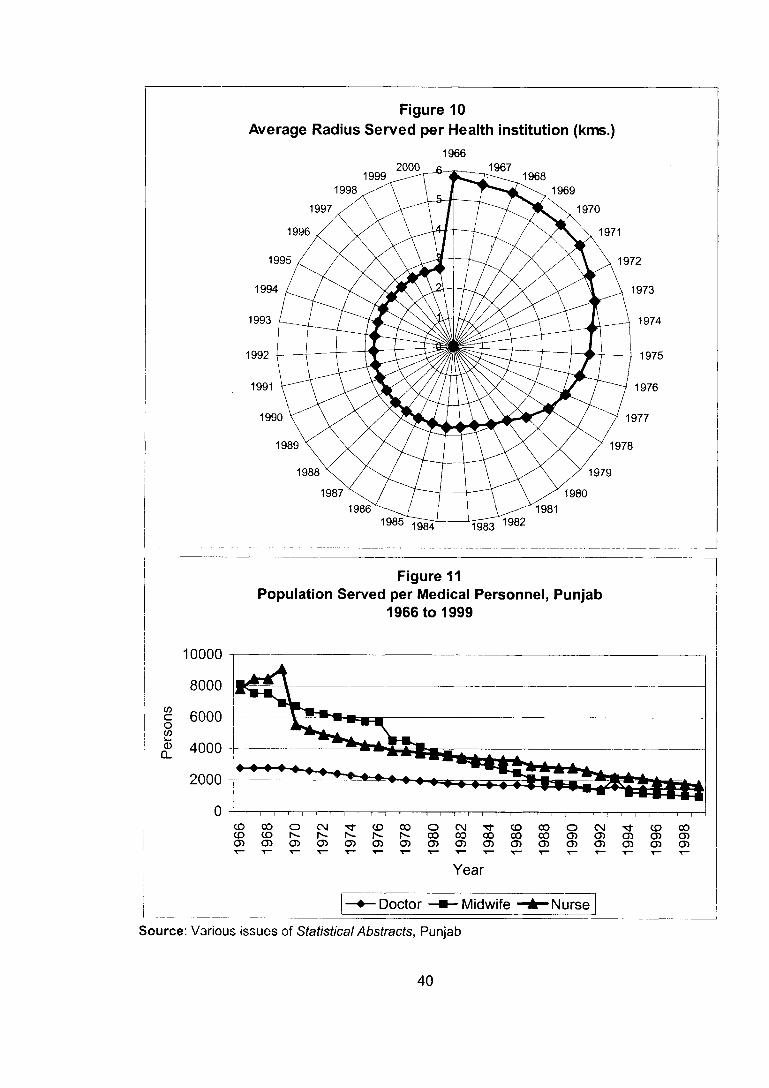
Figure 10Average Radius Served per Health institution {kws.)
19662000fi 1967
1985 1984 1983 1982
Figure 11Population Served per IViedical Personnel, Punjab
1966 to 1999
o ^ o ) C 5 0 5 o ^ o ) o > a ) a ) O J 0 5 a ) 0 ) C 5 0 ^ a > c D
Year
Doctor ■Midwife — Jk— Nurse
Source: Various issues of Statistical Abstracts, Punjab

Literacy: Educational attainments are not commensurate for a state enjoying one of the highest per capita incomes in the country,. Kerala has nine out of every ten persons as literate as compared to seven in Punjab in 2001. Among all the states and Union Territories, Punjab ranks 16'* in literacy rate. Even though the literacy rate of the state improved by 11 per cent points from 59 per cent in 1991 to 70 per cent in 2001, it was of lower than the improvement at the national level from 52 to 65 per cent during 1991-2001.
Four out of every five persons in the urban areas of Punjab are literate and two out of every three in rural areas. Among urban areas, SAS Nagar, (Mohali, Rupnagar district) has the highest literacy rate of 92.5 per cent and Phillaur town (Jalandhar district) the lowest of 31.9 per cent. Hoshiarpur district (81.4%) is at the top in literacy, whereas Mansa district (52.5%) is at the bottom.
One redeeming feature of Punjab, however, is the relatively narrow gap in the literacy rates of males (75.6%) and females (63.5%), and urban (79.1%) and rural areas (65.2%), when compared with the all India picture. This is attributed primarily to a strong urban-rural interaction in the state, which has been promotive of literacy among females, and villages in a more effective manner.
Figure 12Literacy Rates in Selected States 1991-2001
0)CD CD
.CO £5 £DO
13 CD CDO)r-
CD CD < CD x:TJ .CD C W wCD ro sz CD Q </) 0)z roc Q.
CUCO
(/>2 CD Z ■|_
O■O
21 W
QJ
CDs:CDCD
X Q.i-ro52
V)(U"OroQ_2JZ•DC<
w0)■OCD
CD
-C■DCD
WCDCD*cc
•2001 >1991
Source: Census of India (2001): Provisional Population Totals, Paper 1,Directorate of Census Operations, Punjab

Sex ratio: Sex ratio in the Indian context is defined as the number of females per 1,000 males. It is one of the reliable indicators of the status of women in a society. Any prejudice against females may get manifest in their higher mortality rate through neglect, infanticide and even foeticide. The Punjab scene is not glorious in this context. With a sex ratio of only 874 in 2001 (Table 17), the state ranked 27‘ among the 28 states of India. This deficit of 126 females per 1,000 males is far in excess of the national average of 65, India’s sex ratio being 933. In consonance with the relative status of females, the southern Indian states (Kerala 1058, Tamil Nadu 986 and Andhra Pradesh 977) are noted for a higher sex ratio than the northern Indian states (Haryana 861, Uttar Pradesh 898 and Bihar 921).
It is equally notable that while the sex ratio at the national level improved from 927 in 1991 to 933 in 2001, in Punjab it decreased from 882 to 874. More worrisome is the steep fall in the sex ratio in the 0-6 age group, from 873 in 1991 to 793 in 2001. The rising incidence of female foeticide explains this. This tendency is likely to continue and has serious long-term consequences.
Table 17Variation in the Sex Ratio in Selected States during 1971-2001
(Fema es per 1,00C males)1971 1981 1991 2001 Change in sex
ratio during 1971 to 2001
Andhra Pradesh 977 975 972 977 0Bihar 954 946 911 920 -34Gujarat 934 942 934 920 -14Haryana 867 870 865 861 -6Karnataka 957 963 960 963 6Kerala 1016 1032 1036 1058 42Madhya Pradesh 941 941 931 920 -21Maharashtra 930 937 934 922 -8Orissa 988 981 971 972 -16Punjab 865 879 882 874 9Rajasthan 911 919 910 922 11Tamil Nadu 978 977 974 986 8Uttar Pradesh 879 885 879 898 19West Bengal 891 911 917 934 43INDIA 930 934 927 933 3
Source: Various volumes of Census of India
If the sex ratio in the 0-6 age group of all the 593 districts is taken into account, Fatehgarh Sahib district of Punjab has the distinction of having the lowest figure (754). The situation in Patiala (770), Gurdaspur (775), Kapurthala (775), Bathinda and Mansa (779 each) and Amritsar districts (783) is no better. The most telling commentary is that of then ten districts in India, noted for the lowest sex ratio in 0-6 age group, seven are in Punjab. There is something seriously wrong in the social sphere of this economically progressive state.

Kerala
Tamil Nadu
Andhra Pradesh
Orissa
Karnataka
West Bengal
INDIA
Rajasthan
Maharashtra
Madhya Pradesh
Gujarat
Bihar
Uttar Pradesh
Punjab
Haryana
800
Sex Ratio in Selected States 1991-2001
11058
986 1036
974^977
972972
71I963
960934
917
1933 I 927 I
922
910922^9 3 4
S920
|920
.879874'882
^ 9 2 0■ 911
898
850 900 950 1000
Females per thousand males
1050 1100
E11991 H2001
Source: Census of India (2001): Provisional Population Totals, Paper 1, Directorate of Census Operations, Punjab
Economic well-being: In consonance with its higher per capita income of Rs. 14,676 than the national average Rs. 10,067 in 1999-00, Punjab is noted for a significantly higher per capita expenditure too. This is an expression of the higher level of economic well-being. The total consumption expenditure of a resident in Punjab is 1.4 times that of an average Indian, living in a village or town (Table 18). Within the state, the per capita expenditure in urban areas is 1.6 times of that in rural areas.

The consumption basket of an average villager and that of a town dweller displays some notable differences. While food accounts for 64 per cent of the expenditure for a villager, the comparative figure for an urban dweller is 45 per cent. The two are almost at par in terms of the percentage expenditure on fuel/light, and intoxicants. On the other hand, while the per capita expenditure on durable goods, rent and education is higher in urban areas, it tends to be higher in the case of health in rural areas. In addition, the people of Punjab spend significantly more on food, fuel/light, education and intoxicants than an average Indian.
Table 18Average Monthly Expenditure (Rupees) per Person on Selected Group of Items of
Items Punjab Kerala IndiaRuralFood 270.67 266.63 188.89Non-foodFuel and light 36.64 24.70 21.67Health 24.26 19.54 15.43Clothing 14.03 29.83 21.78Education 12.52 9.73 5Intoxicants 6.18 3.82 2.32Footwear 6.09 2.47 3Rent 0.60 0.61 0.74Durable goods 11.58 41.61 16.12Miscellaneous 52.53 56.88 34.48Non-food total 152.85 189.19 120.54Total consumption expenditure 423.52 455.82 309.43UrbanFood 309.95 273.64 271.49Non-foodFuel and Light 56.54 27.60 33.95Health 19.49 20.98 17.56Clothing 51.45 23.17 28.11Education 32.32 12.45 20.54Intoxicants 7.80 3.16 2.89Footwear 14.52 3.55 4.91Rent 33.25 3.48 21.76Durable goods 37.82 9.59 22.89Miscellaneous 117.41 59.3 83.97Non-food total 370.60 163.28 236.58Total consumption expenditure 680.55 436.92 508.07
Source: Sarvekshna, Vol. XXIII, No. 2, 81 Issue October-December, 1999
Despite the high level of economic well - being of the people, lack of adequate attention to parameters of human capital remain a matter of concern for future policy makers.

The state economy, which was growing at a faster pace than the national economy until the late seventies and was moving ahead almost at the same pace during the eighties, received a setback in the nineties. During the last decade, the annual growth rate of the state economy has been slower (4.7%) than that of the national economy (6.9%). In per capita income, Punjab held the top position at the beginning of the nineties among the major states, but came down to the fourth place by the end of the decade.
Taking a longer-term view, the share of the primary sector has decreased considerably, from 55.1 per cent in 1970-71 to 42 per cent during 1998-99; the share of the secondary sector on the other hand has increased from 18.1 per cent to 27.5 per cent, and the tertiary sector has recorded a marginal rise from 27 per cent to 30.5 per cent. As desired, the major share of expenditure during all the plan periods was reserved for irrigation and power, the critical factorstfor the development of agriculture and industry, respectively. The sad part is that the investment on these two has not given matching returns. There is an unbearable amount of subsidy involved in both. Among other factors, such a situation has led to a considerable decline in the share of development expenditure, from 72 per cent in 1980-81 to 46 per cent in 1998-1999. More in-depth analysis of the reasons for the slow growth of the state economy is necessary.
Agriculture in the state found a favourable environment in the extensive level- topography, sub-tropical continental climate, fertile soils, and favorable conditions of water supply through water bodies and irrigation. All this provided a favorable foundation for the green revolution. The state’s remarkable success in agriculture created the base for rapid strides in other sectors of the economy. Today, however, the agricultural sector is passing through a crisis. Constraints in respect of a shift from the wheat-rice rotation to other crops and difficulties involved in the virtually static level of per hectare yield of rice and wheat are expressions of the crisis in this sector.
In this context, it is necessary to accelerate the pace of industrialization. Fortunately for the state, large/medium industries are picking up as also small-scale industry. This is not to say that industry is free from any problem. These are several, especially those relating to technology upgradation, marketing and foreign investment. These call for speedy resolution if particularly the challenge of rising unemployment among educated youth is to be met.
Punjab now needs to prioritize its requirements for making rapid strides. The foremost task ahead is to halt the decelerating rate of its economy. Its acceleration has to be achieved by the end of 10* plan. Agriculture, which is the base of Punjab’s economy, is in a state of crisis. What is required is diversification not only of the cropping pattern but also of the agricultural economy towards non-farm activities. A stronger link between the agricultural and industrial sectors is imperative. This will also help in absorbing the growing size of labour and the unrelenting increase in the number of unemployed.
The new directions of economic development have to be accompanied by adequate attention to hither to neglected areas of some of the critical parameters of human capital, including infant mortality, imbalanced sex ratio and not so standard reproductive health. There seems to be something seriously wrong in the otherwise economically progressive state. An upgradation of human capital is basic for ensuring sustained economic development of the state. Improvement in the quality of infrastructure, transport.

telecommunication, information technology and irngation is a pre-requisite for achieving sustainable development. It follows that the twin challenge before Punjab by 2020 is higher economic growth and upgradation of human capital to ensure sustainable development.
References and Select Bibliography
Abbi, B.L. and Singh, K. (1997): Post Green Revolution Rural Punjab: A Profile pf Economic and Socio-Cultural Change (1965-95), Centre for Research in Rural and Industrial Development, Chandigarh
Ahluwalia, M.S. (200): 'Economic Performance of States in Post-Reform Period’, Economic and Political Weekly, 35(19), May 6
Census of India (2001): Provisional Population Totals, Paper 1, Directorate of Census Operations, Punjab
Census of India (2001): Provisional Population Totals, Paper 2 of 2001, Rural-Urban Distribution of Population, Directorate of Census Operations, Punjab
Chathley, Y.P. (1995): Education Population and Development: A Regional Perspective of Northwest India, Centre for Research in Rural and Industrial Development, Chandigarh
Department of Planning, Government of Punjab: Annual Plans (various issues)
Department of Planning: Economic and Statistical Organization Statistical Abstracts of Punjab (various issues)
Department of Planning: Economic and Statistical Organization, Statistical Abstract of Haryana (various issues)
Department of Planning: Economic Survey of Punjab (various Issues)
Planning Commission: Five-Year Plan Documents, Government of India, (various issues).
Planning Board : Five-Year Plan Documents (various documents). Government of Punjab.
Gill, S.S. (1994): Economic Development and Structural Change in Punjab, Principal Iqbal Singh Memorial Trust, Ludhiana
Gosal, G.S. and Krishan, Gopal (1984): Regional Disparities in Levels of Socio-Economic Development in Punjab, Kurukshetra, Vishal Publishers
Johar, R.S. and Khanna, J.S. (1983): Studies in Punjab Economy, Punjab School of Economics, Guru Nanak Dev University, Amritsar
Johl, S.S. and S.K. Ray (2002): Future of Agriculture in Punjab, Centre for Research in Rural and Industrial Development, Chandigarh
<ant, Surya (1988): Administrative Geography of India, Rawat Publications, Jaipur
<rishan, Gopal (1997): 'Spatial Contrasts in Socio-Demographic Profiles of India’. Population Geography, Volume, 19, No.,1 & 2, June-December 1997.
Ministry of Information and Broadcasting (2002): India 2002: A Reference Annual, Publication Division, Government of India, New Delhi
National Sample Survey Organisation (NSSO): Sarvekshana, Volume XXIII, No. 2, 81^^ issue October-December, 1999
Registrar General of India (1997): Sample Registration System Statistical Report, New Delhi.
Registrar General of India (1997): Sample Registration System Bulletin, various Issues, New Delhi
Registrar General of India (1999): Compendium of India’s Fertility and Mortality Indicators 1971- 1997, based on Sample Registration System, New Delhi, 1999
Registrar General of India (1998): Sample Registration System, Statistical Report.
Reserve Bank of India (various issues): State finances: A study of budget (of various years)
Sarhadi, A.S. (1970): Punjabi Suba: The Story of Struggle, U.C. Kapur and Sons, Delhi
Singh, H. (2001): Green Revolution Reconsidered: The Rural World of Contemporary Punjab, Oxford, New Delhi
Singh, L. and Singh, S. (2002): 'Deceleration of Economic growth in Punjab, Evidence Explanation and A Way Out’, Economic and Political Weekly, 9 February, 2002
Singh, P. (1995): Punjab Economy: The Emerging Pattern, Enkay Publishers, New Delhi

Appendix 1
Table A
District Area(squarekms.)
Totalpopulation
Sex ratio (females perthousandmales)
Density(personspersquarekms.)
Literacy (per cent)
Urban population (per cent)
Gurdaspur 3564 2096889 888 588 74.19 25.46Amritsar 5096 3074207 874 603 67.85 40.00Kapurthala 1632 752287 886 461 73.56 32.59Jalandhar 2632 1953508 882 742 77.91 47.45Hoshiarpur 3365 1478045 935 439 81.40 19.66Nawanshahar 1267 586637 913 463 76.86 13.80Rupnagar 2055 1110000 870 540 78.49 32.46FatehgarhSahib
1180 539751 851 457 74.10 28.08
Ludhiana 3767 3030352 824 804 76.54 55.80Moga 2216 886313 883 400 63.94 20.04Firozpur 5303 1744753 883 329 61.42 25.81Muktsar 2615 776702 886 297 58.67 25.52Faridkot 1469 552466 881 376 63.34 33.89Bathinda 3385 1181236 865 349 61.51 29.78Mansa 2171 688630 875 317 52.50 20.68Sangrur 5020 1998464 868 398 60.04 29.26Patiala 3625 1839056 864 507 69.96 34.98PUNJAB 50,362 24289296 874 482 69.95 33.95
Source Census of India, Provisional Population Totals, Paper-1 and 2 of 2001, DCO, Punjab Department of Planning, Economic and Statistical Organization (2002), Statistical Abstracts of Punjab, Economic Advisor to Government of Punjab, Chandigarh
Table BDistrict-wise Decadal
District Per cent Variation Change in per cent points1981-91 1991-2001
Gurdaspur 16.07 19.33" +3.26Amritsar 14.46 22.72 +8.26Kapurthala 18.60 16.34 -2.26Jalandhar 17.30 18.40 +1.10Hoshiarpur 16.39 13.81 -2.58Nawanshahar 16.39 10.43 -5.96Rupnagar 28.29 23.39 -4.90Fatehgarh Sahib 17.01 18.65 +1.64Ludhiana 36.53 24.79 -11.74Moga 18.61 13.93 -4.68Firozpur 24.00 20.42 -3.58Muktsar 19.55 18.68 -0.87Faridkot 22.79 21.42 -1.37Bathinda 20.49 19.89 -0.60Mansa 18.04 19.83 +1.79Sangrur 21.36 18.57 -2.79Patiala 21.53 20.31 -1.22PUNJAB 20.81 19.76 -1.05
Source; Census of India, Provisional Population Totals, Paper-1 of 2001, DCO, Punjab

Table CDistrict-wise Share of Population to Total Population of the State,
1991 and 2001District Per cent to total population of the state
2001 ! 1991Amritsar 12.66 12.35Ludliiana 12.48 11.97Gurdaspur 8.63 8.66Sangrur 8.23 8.31Jalandhar 8.04 8.14
i Patiala 7.57 7.54Firozpur 7.18 7.14Hoshiarpur 6.09 6.40Bathinda 4.86 4.86Rupnagar 4.57 4.44Moga 3.65 3.84Muktsar 3.20 3.23Kapurthala 3.10 3.19Mansa 2.83 2.83Nawanshahr 2.42 2.62Faridkot 2.27 2.24Fatehgarh Sahib 2.22 2.24
Source; Census of India, Provisional Population Totals, Paper-1 of 2001, DCO, Punjab
Table DDistrict-wise Sex
District Females per thousand males Change in sex ratio1991 2001 during 1991 to 2001
Gurdaspur 878 775 -103Amritsar 861 783 -78Kapurthala 879 775 -104Jalandhar 886 797 -89Hoshiarpur 884 810 -74Nawanshahar 900 810 -90Rupnagar 884 791 -93Fatehgarh Sahib 874 754 -120Ludhiana 877 814 -63Moga 867 819 -48Firozpur 887 819 -68Muktsar 858 807 -51Faridkot 865 805 -60Bathinda 860 779 -81Mansa 873 779 -94Sangrur 873 784 -89Patiala 871 770 -101PUNJAB 875 793 -82
Source: Census of ndia (2001); Provisional Population Totals, Paper 1,Directorate of Census Operations, Punjab

Chapter 2
DEVELO PM ENT AND M ANAGEM ENT OF NATURAL RESO URCES
INTRODUCTION
inter-relationship and inter-dependence among water, land, vegetation and animal resources determine the nature and kind of livelihood support systems particularly in rural areas. Depletion of the natural resource-base and increasing biomass-demand of the expanding human and livestock population are attracting the attention of all concerned. However, the degeneration of natural resources is assuming alarming proportions. It is, therefore, pertinent to evolve strategies for sustainable natural- resource management systems. It is also imperative to observe the changes taking place in the land-use pattern in general and in the agricultural sector in particular, which will have implications for local bio-diversity and the ecosystem, and food and nutritional security of the local people.
Punjab is endowed with some forests, abundant water and fertile land resources, whereas its earth resources (mines, fossil fuel) are negligible. Agriculture is the mainstay of the state, wherein 42,64,000 hectare is the net sown area with a crop intensity of 186 per cent. Irrigation is through surface canal water as well as underground water pumped through tube wells, and over 94 per cent of the cultivated areas is irrigated. The state has an average rainfall of about 382 mm per year, whereas certain areas in the north of the state get over 1000 mm of rain and in the southern side rainfall is low (150-22 mm).
Punjab has a vast expanse of flat alluvial land while the Shivalik hills in the north have fluvial carvings and deposits of the three rivers, namely, the Ravi, Beas and Satluj, which flow through central Punjab, and the sand dunes in the southwest.
However, in recent years, due to the increase in population and other economic activities, scientists, intellectuals and the general public at large have expressed serious concern that both land and water resources have been overexploited, while their conservation has been slow and inadequate, so much so that there is fear that both land and water may become inadequate to support future development activities.
The natural resource of Punjab have been discussed under the following heads:
1. Land2. Water3. Forest4. Wetlands, barren lands5. Bio-diversity6. Energy
LAND
Land is the fundamental base for most human and natural activities and one of the major natural resources on this planet. Production of minerals, as well as agriculture, depends

entirely on the availability and use of suitable land. In Punjab the following activities depend on land.
1. Agriculture2. Water resource3. Forest4. Living species5. Industry and Commerce6. Transport7. Pastures8. Waste Land and uncultivated land9. Miscellaneous
The extent of land utilisation usually depends on the type of soil in an area, e.g.,loamy soils support agriculture, whereas sandy and rocky soils, which are not suitable for agriculture are usually put to some other use.
Table 1Land-use Pa ttern In Punjab (.000 Hect.)
Area 1960-61
1970-71
1980-81
1990-91
1997-98(R)
1998-99(P)
1999-00(P)
2000-01(P)
Geographical area 5036 5036 5036 5036 5036 5036 5036 5036Reported area 5022 5031 5033 5033 5033 5033 5033 5033Forests 35 123 216 222 305 305 281 279Barren and unculturable land
- 208 96 83 57 66 46 49
Land put to non- agricultural use
- 416 436 343 337 394 394 384
Culturable waste - 83 41 35 37 29 20 14Permanent pastures & other grazing land
5 4 10 4 10 6 4
Land under misc. trees, crops & grooves
4 4 12 5 13 5 5
Fallow land 313 139 45 110 49 43 38 34Net area sown 3757 4053 4191 4218 4239 4173 4243 4264Net area as percentage to total area
75 81 83 84 84 83 84 85
Area sown move than once
975 1625 2572 3284 3594 3567 3604 3671
Total cropped area 4732 5678 6763 7502 7833 7740 7847 7935Source: Statistical Abstract of Punjab, Note ; R; Revised, P; Provisional
2001
The land resource of Punjab comprises of plains developed by alluvium - a material laid by the rivers under the influence of the climate and, in the north, the Shivalik hills which have undulating areas with rocky soil with heavy drainage. Punjab has about 4.2 million

hectare of land under agriculture. In addition, 6.0 per cent area is under forests. The remaining area is for human habitation, industry, roads and railways and other unmarked activities. Hence, there is little scope for bringing more area under cultivation. Table 1 shows changes in the land-use pattern in the state over the period 1960-61 to 2000-01.
The share of non-agricultural land is high in the north-eastern hilly parts and areas along various ravine belts. The share of agricultural land is gradually declining because of soil degradation due to intensive cultivation or to changing course of rivers and population pressure. About two million hectare is degraded land (Table 2).
Table 2_____________________ Extent of Degraded Land in Punjab
Waste-land/soil degradation Area (lakh ha)
Water erosion(i) Severe (gullies, ravenous)(ii) Slight & moderate (with/without scrubs)
1.703.40
Water-logged— rising water table 1.22Marshy-submerged 2.28Salt-affected (varying degrees of deteriorationj
(i) Canal command areas(ii) Outside canal command areas________
3.931.27
Degraded forest/pasture lands 2.00Coarse/very light textured (loss of nutrients with deep percolation and leaching, poor in fertility)_______________________________
6.20
Source: Director, Punjab Remote Sensing Centre, Ludhiana
Land Management
The state has been divided into three zones on the basis of soil- and water-management programmes. The northern zone is located in the foothills of the Shivaliks and extends from Derabassi block of Patiala district to Dhar block of Gurdaspur district, covering Ropar, Fatehgarh Sahib, Hoshiarpur and Gurdaspur districts. In these areas, soil erosion due to flash floods is very common. Terracing and leveling of undulating land is necessary to make some headway in developmental activities.
The central zone comprises of the districts of Patiala, Ludhiana, Jalandar, Nawanshahar, Kapurthala and Amritsar. Here, the land is level and there is extensive urbanization, industrialization and agricultural activity. In the agricultural areas, on the one hand alkaline/saline soils are increasing due to water logging and extensive use of underground water, while on the other, soil reclamation work is also going on. More and more land of the ravine beds, covered by the rivers Beas, Ravi and Satluj and their tributaries are being brought under cultivation. Sand scraping is also widespread around the river banks.
The southern zone comprises of the districts of Sangur, Bhatinda, Mansa, Muktsar, Moga, Faridkot and Ferozepur. Sand dunes are common in the southern most area, adjacent to Rajasthan. These are being reclaimed gradually to reach the good soil below for agricultural purposes. Sand scraping is also common. Since the underground water is brackish, the soils are getting sodic relatively fast and such areas are going out of

cultivation. Over 37,000 hectare of land has been reclainried from gullies up to the year 2000. Maximum reclamation has taken place in the districts of Hoshiarpur followed by Ropar and Patiala, where land in each district has been brought under cultivation during the last two years (Table 3). The pace of land reclamation is slow and needs to be speeded up.
Table 3District- wise Progress of Gully Reclamation Work on
Agricultural Land up to 199S1-2000 (Hectare)District Up to
1997-98During1998-99
During1999-2000
Total up to 1999-2000
FatehgarhSahib
- - - -
Hoshiarpur 23711 - - 23711Gurdaspur 2677 - - 2677Jalandhar 97 - - 97Nawanshahar - - - -
Kapurthala 191 - - 191Amritsar 2 - - 2Ludhiana - - - -
Ropar 9290 64 - 9354Patiala 1405 - - 1405Ferozepur - - - -
Sangrur - - - -
Bathinda - - - -
Mukarsar - - - -
Faridkot - - - -
Moga - - - -
Mansa - - - -
Total 37373 64 - 37437Source; Annual Administrative
PunjabReport, Department of Soil & Water Conservation,
Agricultural Land
Cropping intensity has been increasing since the green revolution and now it is 186 per cent. Wheat and paddy are the dominant crops of the Rabi and Kharif seasons respectively, occupying more than 60 per cent of the net cultivated area in each season. Both these crops are water and nutrient guzzlers. For paddy cultivation puddling of the soil is a prerequisite before transplanting. Repeated puddling leads to soil compaction, sub-division of soil particles and makes these soils impervious. Such soils in the long run become biologically inactive due to changes in the physico-chemical characteristics and thus are likely to become un-cultivable. The following important soil related constraints develop due to nutrient exhaustion of soils of macro- and micro-nutrients and intensive cultivation:
• Chemical: Depletion of organic matter; multi-nutrient deficiencies: nutrient imbalance: salinity/sodicity and pollution from agro-chemicals, sewera'ge and industrial affluent.

• Physical: Surface crusts; sub-soil compaction: soil erosion; poor air-waterrelationship; development of hard pan of fine textured sodic soils.
• Biological: Decline in quality and quantity of soil biomass; low biologicaloxidation and slow rate of decomposition of crop residues.
• IHydrological: Shallow water table; negative water balance; water logging;flood hazards; free percolation in coarse soils and poor permeability in fine textured soils.
At present, the organic carbon content has come down to 0.2 per cent from 0.5 per cent since 1960. The macro- and micro-nutrient deficiencies are dominant in 67 per cent of the cultivated area (Table 4). On top of it there are extensive areas where the soils are polluted due to waste-matter dumps containing degradable and non-degradable material, in and around urban areas. Extensive use of agro-chemicals on agricultural land reduce their biological activity, thus affecting the production potential of the soil, besides causing soil and water pollution.
Table 4Percent Distribution of Blocks According to Fertility Status of Soils in Punjab
(on 1the basis of per cent delFicient samples)Fertility 1970-77 1981-90
Status N P K N P KLow 52 16 13 67 44 -
Medium 48 65 58 33 55 43High - 19 29 - 1 57
Source: Brar and Chhibba, 1994, Brar, 1979
Soil Conservation
There is excessive pressure on Punjab’s lands, on the one hand due to intensive cultivation and on the other, due to population pressure, industrialization, water accumulation and other activities. Land resources are limited and very precious and have to be used with a view to its repeated utilization on a sustainable basis. Conservation of land thus assumes great importance. The present activity of the state Department of Soil and Water Management aims at transforming uncultivated land into cultivated land. There is very little scope for further increase in agricultural production by bringing more area under cultivation. Thus, various soil conservation measures, such as land development, water harvesting technology, water management, conservation irrigation, field drainage, improvement of handicapped areas, utilization of sullage water, improvement of sub-soiling, etc., are essential to obtain maximum returns from the limited and highly valuably material resource, i.e, land, for sustaining agi*icultural growth/productivity. During the Eighth Plan, 67,472 hectare has been treated'under different soil and water conservation measures. It was targeted to cover an area of 1,13,700 hectare during the Ninth Plan (Table 5). The soil and water conservation programme was expected to generate 30.60 lakh mandays of employment during the Ninth Plan. However, little attempt has been made to stop or reduce the misuse of soil by making it biologically dead due to accumulation of industrial affluents, dumping of urban waste and natural soil erosion.

Achievements of Soil and Water conservation Works during Plan Periods(Hectare)
8'" Five Year Plan FiveYearPlan(Target)
Item of Work 1992-93 1993-94 1994-95 1995-96 1996-97 1997-02Land development and ravine reclamation
2760 1247 1106 487 405
Rehabilitation of watershed
815 220 373 315
Water harvesting technology_____
330 468 910 1089
Water management 6682 380 850 1526 1504Conservationmeasures
550
Field drainage 90Improvement of subsoiling_____
213 146 65 62
Conservation Irrigation techniques
2886 1133
Improvement of handicapped areas
6071 7438 6858 7000
National watershed development_____
1169 2500 2385 1880
Tapping of sullage water
570 185 256 315
Drip Irrigation 314 325River valley project 396Flood Prone Rivers 1413 1805Total 15975 9362 13056 14756 14323 113700Source: Ninth Five-Year Plan of Punjab (1997-02)
Records do not reveal the amount of land area, which was once productive and has been going out of cultivation gradually. In addition, there may be small land patches distributed here and there owned by the farmers lying unused because these are uncultivable due to alkalinity or salinity. Similarly, in many paddy-growing farms some areas have become water logged where the second crop cannot be grown in the Rabi season. Such fragmented areas, which have become uncultivable have also to be brought under cultivation after proper reclamation through scientific advice to the farmers, who will adopt the reclamation practices faster as the area belongs to them.
In the northern Kandi region, soil erosion is a problem which needs to be tackled in a systematic and scientific manner, by terracing, planning of perennial grasses and trees, bunding, etc., in contiguous areas. The patchy work done here and there leads to more erosion of soils and washes away the terraces and bunds made in a season, which have to be reconstructed reportedly to be redone again. Only when this is done soil erosion can be checked on a sustainable basis in contiguous large area.

Conserving the natural land on a sustainable basis, particularly when it is fertile, is necessary in a situation when agricultural activity has to increase because of increase in population and an increasing demand for agricultural produce. Conservation and sustainability of land should go hand in hand so that these valuable assets remain of value.
In addition, soil salinity is on the increase in the southern region due to the use of brackish water for irrigation and in the central zone due to seepage and overuse of water. Strategies for improving the organic carbon status of the soil are also very important since it plays a multiple role in maintaining soil health.
Intensive research is needed to ameliorate the deteriorating condition of Punjab’s soil and some of the known techniques, such as afforestation, water conservation, etc., should be properly disseminated to the stakeholders. For instance, large quantities of crop residues left in the field by the combined harvester can be recycled for improving the soil structure, decreasing bulk density and increasing porosity and infiltration of these soils in addition to supplementing nutrients. Several agronomic practices, such as raised beds, use of mulches, overhead plastic covers, etc., can greatly reduce environmental stress. Cultivation of crops with minimum tillage or zero tillage is becoming popular in this part of the country, because of the advantage of retaining organic carbon, besides lowering the cost of cultivation. This technique also needs to be continuously refined and evaluated through an inter-disciplinary approach to the cropping system.
In Punjab, an area of 6.98 lakh hectare was affected with alkalinity/salinity of the soil, which included 2.35 lakh hectare severely affected and 4.63 lakh hectare marginally or moderately affected. Out of the total of 6.98 lakh hectare, about 4.90 lakh hectare had been reclaimed up to 1996-97 (Table 6). Subsidized gypsum is supplied to all categories of farmers. Dhancha seeds with a limit of Rs. 300 per hectare are supplied free of cost.
These soils are either alkaline (with high pH), saline (with high salt content) or both alkaline and saline. The reclamation process of saline soils involves removal of excess soluble salts out of the root zone. In irrigated and well drained areas, like most of the central plain zone, soil salts are located and drained to suitable areas. Mulching has been found to increase the efficiency of leaching of salts. Alkali soils with high exchangeable sodium can be reclaimed by applying gypsum, press mud, etc. These scientific methods of soil reclamation, when adopted carefully, can minimize the problem and encourage productivity of several salt tolerant crops. Continuing research inputs are needed to improve technologies to manage such soils on a sustainable basis.
Steps taken by government agencies in vast areas which need reclamation from soil salinity or water logging are a slow process. This activity has to be quickened so tha1 more area is brought under cultivation than that which goes out of cultivation.

Table 6Reclamation of Alkaline/Kallar Land during the Plan Period in Punjab (Hect.)
Total area affected with alkalinity at the beginning of fifth plan 6,98,000Level achieved upto 1979-80 73,547Area reclaimed during sixth plan 1980-85 1,56,197Total area reclaimed upto the end of sixth plan 2,29,744Area reclaimed during seventh plan 1985-90 1,23,475Total area reclaimed upto 1989-90 3,53,219Achievements1990-91 21,323
1991-92 23,4631992-93 18,2101993-94 20,670Eighth plan 1992-97 1,10,0001994-95 19,0001995-96 26,0001996-97 22,4001997-98. (Target) 20,000Ninth Plan (Target) 1,00,000
Source: Ninth Five-Year Plan, Punjab (1997-02)
Outlays of Rs. 1,250.00 lakh and Rs. 250.00 lakh have been made under the 50:50 sharing scheme for 'Reclamation of Alkali Soils’ in the Ninth Plan and the Annual Plan for 1997-98 to reclaim 100,000 hectare and 20,000 hectare respectively. Allocations of Rs. 1,134.12 lakh and Rs.206.22 lakh have been provided in the Tenth Plan and the Annual Plan for 2002-03 respectively for reclaiming saline land.
Table 7Expenditure on Soil Conservation Measures during Plan Period (Rs. in Lakhs)
Plan Period SoilConservation & Engg. Deptt.
Agriculture Department (Land Reclamation)
Total
ExpenditureEighth Plan1992-93 577.99 302.71 880.701993-94 582.36 264.28 846.641994-95 633.80 272.72 906.521995-96 582.36 264.28 846.641996-97 624.35 53.86 678.21OutlayNinth Plan 4175.00 1250.00 5425.001997-98 625.20 250.00 875.20
Source: Ninth Five-Year Plan, Punjab (1997-02)
The state government has been spending money on various soil conservation measures regularly in order to improve degraded land. Expenditure under the sub-head 'Soil Conservation’ during the Eighth Five-Year Plan, i.e., 1992-93, 1993-94, 1994-95, 1995- 96 and 1996-97 and approved outlay for the Ninth Plan and the Annual Plan for 1997-98 is given in Table 7. The total expenditure on soil conservation was Rs. 4,158.71 lakh

during the Eighth Plan. Out of an outlay of Rs 5,425.00 lakh provided in the Ninth Plan, only 35.8 per cent was spent on soil conservation during the plan period.
For water-logged soils, avoidance is the best prescription. Seepage from canal water and overuse of irrigation water for crops have to be checked to avoid water-logging. A proper drainage system has to be developed so that the flow of water is on a gradient to prevent accumulation in the first two to three metre depth of the soil. A project to develop a drainage system in the southern region of the state is under construction. However, a scientific drainage system needs to be refined and reinforced so that the water-logging problem is reduced and eventually eliminated. A mix of scientifically proven methods of minimizing and eliminating water-logging are:
Planting of contour vegetative hedges particularly on higher slope areas. Repair bore-wells with pumping sets for vertical drainage.Shallow bore-well with pumping sets for vertical drainage.Percolation wells with pump sets.Deepening/renovation of village ponds and others.Dissemination of these methods to the farmers concerned can greatly help in checking water-logging.
WATER
Water is considered to be an inexhaustible natural resource in the world, but the quantum varies from place to place. Punjab, as the name suggests, is the land of rivers. It is endowed with a good surface water resource through rivers and streams and also has abundant underground water reservoirs. It is a conservative estimate that nearly 80per cent of the water resources is consumed in the production of food and fibre.Agricultural water-management, therefore, assumes great significance. While surface- water management has been under governmental jurisdiction, underground water is mostly exploited on a private basis.
The use of water has been through an integrated approach on the basis of comprehensive research and investigations. In spite of this, there has been problems of fluctuating sub-soil water level losses and wastage of undeveloped and developed water courses and a general phenomenon of improper drainage. For Punjab, the rivers Sutlej, Ravi and Beas of the Indus basin and the rivers Yamuna and the Ganga basin originating in the Himalayas are the main sources of water for canal irrigation. Storage basins have been constructed over the river Sutlej-Bhakra Dam, on the river Beas-Beas Dam at Pong and on the river Ravi-Thein Dam, whereas for the river Yamuna, the storage dam (Kishau Dam) is yet to be completed. The rivers Sutlej, Beas and Ravi have been interlinked with the transfer of water from the Ravi to the Beas and from the Beas to the Sutlej - the Bhakra canal system and the Yamuna canal system are also interlinked to regulate the water flow. In other words, all the four rivers have been so interlinked that these can operate as a common grid, and this remarkable water management system is greatly responsible for progressive agriculture in the state, as it provides abundant surface water for irrigation.

Surface Water Resources
The three rivers, namely the Sutlej, Beas and Ravi, flowing through the state have a water potential of about 20.06 maf. Although some limitations are imposed by seasonal variations in the flow, large quantities of water are available for irrigation purposes. The river flow is considerably reduced from mid-November to mid-February and the subsequent rise in the level of water is dependent upon the rains. Besides these rivers, there is a network of six major canals, some built during British times and others later on. These are the Upperbari Doab Canal; Bist Doab Canal; Sirhind Canal; Patiala I.B. Circle; Bhakra Main Canal; and Ferozepur Canal Circle. In addition, there are several important water drains and nallahs, as mentioned earlier.
Punjab has a distribution network of 1.45 lakh km of canals including branch canals, and minor distributaries and one lakh km of field canals or water courses. The canal irrigation system irrigated about 1.3 million hectate of land in 1970-71, while only one million hectare was irrigated during 1999-2000 (Table 8). There has been a reduction of over 36 per cent in the canal irrigation area since 1990. This is because only 35-40 per cent of the water entering the canal system reaches the cultivated fields. Normally the optimum efficiency for canal irrigation is 60 per cent. Over the years, maintenance of the canal irrigation system has been neglected and overlooked. Mainly silting of canal beds, unlined channels and distributaries and leakage of bunds due to improper maintenance cause loss of water. Revamping the canal system, particularly by de-silting and lining of channels and distributaries, would generate enough water for the remaining unirrigated land of the state.
Incidentally, the quality of the canal water remains good for most part of the year, except during May and June when the electrical conductivity increases from an average of 400 to 500 moh/cm. The quality of water is also affected by the terrain through which passes it.
The canal irrigation system has also led to much wastage due to seepage. In most of the canals, which are unlined, constant seepage has led to water-logging in most of the command areas and also development of salinity in the soil. Unless the canals are properly cleaned and lined, the problem of water-logging and soil salinity will continue to aggravate and more and more land will become uncultivable. Urgent steps are needed to check the loss of land on account of controllable canal water flow.
Table 8
Source 1970-71 1980-81 1990-91 1999-00* 2000-01*Canals 1292 1430 1669 1051 1002Tube wells 1591 1939 2233 2938 3017Other sources 5 13 7 12 2Total 2888 3382 3909 4001 4021Share of area irrigated to the net area sown (%) 71 81 93 94 94
Source : Statistical Abstract, Punjab 1971, 1981, 1991, 2000 and 2001N o te : * Indicates provisional estimates

Groundwater Resources
Groundwater resources are exploited to supplement surface water resources. In Punjab, underground water resources have been exploited to such a large extent that the crisis of its depletion is becoming a reality. There are 9.35 lakh tube wells in the state to lift underground water for agricultural irrigation and another 1,50,000 in urban and semi urban areas for drinking water, industrial purposes, etc.
During 1970-71, there were only 1.92 lakh tube wells in the state. About 71 per cent crop areas were irrigated by tube wells during 1970-71, increasing to 95 per cent during1999-2000. While canal irrigation has been declining over the years, tube well irrigation, particularly in the central and northern regions of the state, has been on the increase. The state has over 1.7 million hm of available groundwater potential. Due to overexploitation of underground water reserves are getting exhausted, so much so that the water table has gone down by five to ten metres during 1973 to 1996 in the central plain zone. It has been estimated that the average decline of the water level is at the rate of 23 cm per year (Table 9). If this trend continuf G for the next 15 years, more than two lakh submersible pumps would be need :iH td^ replace the present pump sets, at an estimated cost of Rs. 2,000 crore meaning reby an extra expenditure of Rs. 5,000 per hectare of net sown area and in addition a tv.^ fold increase in energy consumption.
Table 9Rise and Fall in Underground Water Table in Different
District Fall in water table (m) Rise in water table (m)Blocks 1973-83 1984-94 Saline/semi
saline blocks1973-83 1984-94
Sub-mountainous ZoneGurdaspur All +0.2-0.6 -0.7-1.2 - - -
Ropar All +0.04 -1.8 - - -
Hoshiarpur All -0.9 -0.9 - - -
Central PlainsAmritsar All -0.9 -2.3 - - -Kapurthala All -0.7 -1.8 - - -Jalandhar All -1.5 -2.5 - - -Ludhiana All -0.9 -1.9 - - -Patiala All -0.9 -1.9 - - -Patiala All -.17 -9.8 - - -FatehgarhSahib
All -1.3 -2.7 - - -
Sanqrur All -5.1 -5.1 - - -
South-west ZoneMansa All -1.6 -1.4 - - -
Bhathinda 0.5 +3.5 -1.9 0.5 7.3 4.2Faridlot 0.5 -1.15 -4.5 0.33 9.0 5.0Ferozepur 0.75 +0.1 4.5 0.25 7.7 3.0
Source: Directorate of Water Resources, Punjab
According to a PAD estimate (1997) in 63 blocks of the state there is over-exploitation of water of more than 100 per cent of the annual net re-charge, whereas in seven blocks

the exploitation is above 85 per cent. This over-exploitation of underground water is due to the constant increase in the number of tube wells because of poor canal water supply, free electricity, cultivation of high water-consuming crops such as paddy, potato, wheat, sugarcane, fodder, etc., and scant attention to water-use efficiency. The phenomenon of over-exploitation of underground water resources is of concern in the other Indian states as well. During 1984-85 to 1998-99, the number of dark blocks has increased from 253 to 422 in the country. In Andhra Pradesh dark blocks have increased from 0 to 30, in Gujarat from 6 to 26, in Haryana from 31 to 51, and in Punjab from 61 to 97 {Report, Planning Commission, 2001). This calls for effective groundwater recharging measures and also regulation of groundwater resources. Extensive research is needed to work out methods of optimal water-use for different crops for different regions and also to improve the surface-water irrigation system.
In the southern region the groundwater is brackish, with high conductivity. Sweet water is found only in deep layers beyond 15 to 20 metres where submersible pumps have to be used. Being the southern and tail-end region of the canal system, both surface and underground water are scarce and hence this area has remained agriculturally less developed. Conjunctive use of sweet water, especially from canals with underground brackish water, has been in the practice for growing various crops in this region. But increase in soil salinity is a constant threat in these areas. Strong research input is needed to develop crop varieties for this area and to maximize the use of available water.
Watershed Management
In the sub-mountain Kandi region of the Shivalik range, soil erosion is rampant due to excessive water-flow during the rainy season and absence of water for drinking and irrigation in the rest of the year. Water conservation has been a need in this area. A watershed development project was initiated in 1990 with the assistance of the World Bank in this region. As a result of developing watersheds, contour vegetative barriers and vegetative reinforcements have been established in 6274 hectare and rain-water conservation has been possible for irrigating over 5000 hectare of land uptil 1995. A total of 2094 villages fall in the Kandi tract, having a population of 14.17 lakh and 30,99,000 hectare of land belonging to the districts of Gurdaspur, Hoshiarpur, Nawanshahar, Ropar and Patiala. As a result of the development of watershed management, the yield of maize crop was 1746 kilogram per hectare, wheat 2098 kilogram per hectare and gram 79.4 kilogram per hectare during 1996-97. The cropping intensity has been 165 per cent. In the project area successful cultivation of crops, forests and grass has been possible, while in non-project areas the conditions are yet to improve. The participation of local people and government agencies have demonstrated that infertile and degraded areas can be conveniently converted into fertile and cultivable areas with their joint efforts and scientific acumen. Continuation of watershed management programmes in the remaining area is necessary for increasing crop productivity. Besides capturing rain, water-sheds can meet the growing demand for irrigation in lean periods. In addition, the basic approach should be to convert the surface flow of water to sub-surface flow for reaching open and groundwater aquifers.
Management of Water-use
Government-managed canal water system, which has a very scientific layout of distribution and delivery mechanism, is now facing criticality in its performance. While

the end user of the canal irrigation system is the biggest sufferer, the influential landlords take advantage of the weakness of the system and usurp the water which otherwise should have reached the tail-enders. By managing the canal system in a scientific manner, the remaining unirrigated area of the state can also receive water for cultivation. Presently more than 50 per cent of the canal water is wasted only because of seepage. This can be easily checked by well-developed scientific procedures.
Water-logging in the canal command areas and areas where the drainage is poor has been a cause of concern, as large areas have gone out of cultivation. Valuable experience has been gained from the management of water-logged areas in the Tikri project (Barabanki district, UP) of National Watershed Development Programmes for Rainfed Agriculture (NWDPRA), where desilting of village ponds and vertical drainage through shallow tube wells have totally eliminated water-logging. In addition, fish culture in desilted ponds and summer cropping of okra, green gram and cucurbits irrigated from shallow tube wells are generating considerable income to the farmers. Such success stories should be emulated for action in the affected areas.
Over-exploitation of underground water needs 'o be checked and regulated so that only the amount of water required is pumped out and there is no wastage. Withdrawal of free electricity or introduction of partial tariff will reduce considerably the continuous running of tube wells and also check wastage of water. The recharge of underground water is an immediate necessity and concerted steps must be initiated now, failing which water scarcity will become a reality by the end of the next decade. In this context, rain-water harvesting, which is relatively an inexpensive technology, should be adopted on a large scale both in urban and rural areas, with a focus on recharging the depleting underground water and also using it for irrigation purposes. Administrative reforms are also required in the distribution of water and a campaign needs to be launched to sensitize people to save water. Panchayati Raj Institutions can greatly facilitate the task of water management at the village level.
Rain-water Harvesting
To recharge the depleting groundwater table, rain-water harvesting is necessary in urban as well as rural areas. The most prominent area where rain-water harvesting can be done is the Kandi area, or the lower Shivaliks where there are a number of choes. The main method recommended for preventing soil erosion is through check dams. Apart from the check dams, sink holes should be made where the soil is impervious. Sink holes have to be located upstream of the check dams where water has been stored. This area serves also as acquifers of the water table of Punjab in general. The design of these sink holes should be such that they can be cleaned annually. Check dams and sink hole combination not only controls soil erosion, but also checks flash floods in these areas.
Rain-water harvesting in inhabited areas: There are many other ways, though at the micro level, to enhance rain-water harvesting. The most prominent and useful method is rooftop rain-water harvesting. Many states, such as Andhra Pradesh and now Haryana have also made it mandatory for every house, of plot-size 250 sq, yards and more, to have its own rain-water harvesting system. In areas having smaller plot size, and even rural settlements, rain-water harvesting pits can be made at the community level.

A typical rooftop rain-water harvesting system comprises of
a) Roof catchmentb) Guttersc) Downpipesd) Rain-water/storm-water drainse) Filter chamberf) Ground water recharge structures, like pit, trench, tube well or a combination of
the above structures.
Storage tanks: For harvesting roof top rain-water, storage tanks may be used. These tanks may be constructed on the surface as well as underground by utilizing local material. The size of the tank depends upon the availability of run-off and water demand. After proper chlorination, the stored water may be used for drinking purposes.
Recharge pits: Recharge pits are constructed for recharging shallow aquifers. These are constructed 1 to 2 m. wide and 2 to 3 m. deep back and filled with boulders, gravels and coarse sand. The size of filter material is generally as below;
Coarse sand ; 1.5 - 2 mm
Gravels : 5 - 1 0 mm
Boulders ; 5 - 20 cm
The filter material should be filled in graded form. Boulders at the bottom, gravels in between and coarse sand at the top so that the silt content that will come with the runoff will be deposited on the top of the coarse sand layer and can easily be removed. If clay layer is encountered at shallow depths, it should be punctured with auger hole and this should be refilled with fine gravel of 3 to 6 mm size.
Trenches: These are constructed when permeable strata are available at shallow depths. The trench may be 0.5 to 1 m. wide, 1 to 1.5 m. deep and 10 to 20 m. long, depending upon the availability of water. These are back-filled with filter materials, in case clay layer is encountered at shallow depth, auger holes may be constructed and back-filled with fine gravel.
Abandoned dug wells: Existing abandoned dug wells may be utilized as recharge structures after cleaning and desilting them. For removing the silt content, the run-off water should pass either through a desilting chamber or a filter chamber.
Abandoned hand pumps; The existing abandoned hand pumps may be used for recharging shallow/deep aquifers, if the availability of water is limited. Water should pass through the filter media before being diverted into hand pumps.
Abandoned tube wells: Abandoned tube wells may be used for recharging shallow/deep aquifers. These tube wells should be redeveloped before use as recharge structures. Water should pass through the filter media before it is diverted into recharge tube wells.

1 S£S iltti tmm S t * fm f
“ ’W j i l l
oxHTt ill. isau —.Sfciifchiartgpi itireMyiitfii h an d pmmi^
Recharge wells: Recharge wells of 100 to 300 mm. diameter are generally constructed for recharging the deeper aquifers and rooftop rain-water is diverted to recharge well for recharge to groundwater. The runoff water may be passed through filter media to avoid choking of recharge wells.
Vertical recharge shafts: For recharging shallow aquifers which are located below clayey surface at a depth of about 10 to 15 m, recharge shafts of 0.5 to 3 m diameter and 10 to 15 m deep are constructed, depending upon the availability of run-off. These are back-filled with boulders, gravels and coarse sand. For lesser diameter shafts, the reverse/direct rotary rigs are used and larger diameter shafts may be dug manually. In the upper portion of 1 or 2 m depth, brick masonry work is carried out for the stability of the structure.
Shaft with recharge well: If the aquifer is available at a greater depth, say 20 or 30 m, a shallow shaft of 2 to 5 m diameter and 5 to 6 m deep may be constructed, depending upon the availability of run-off. Inside the shaft, a recharge well of 100 to 300 mm diameter is constructed for recharging the available water to a deeper aquifer. At the bottom of the shaft filter media are provided to avoid choking of the recharge well.
Lateral trench with bore wells: For recharging the upper as well as deeper aquifers, lateral trench 1.5 to 3 m wide and 10 to 30 m long, depending on the availability of water, with one or more bore wells may be constructed. The lateral trench is back-filled with boulders, gravels and coarse sand.
Agricultural Land
Apart from rooftop rain-harvesting, the agricultural sector should also be encouraged to use different forms of irrigation other than flood irrigation, where much of the water is evaporated. Drip irrigation and sprinkle irrigation should be made compulsory for the^
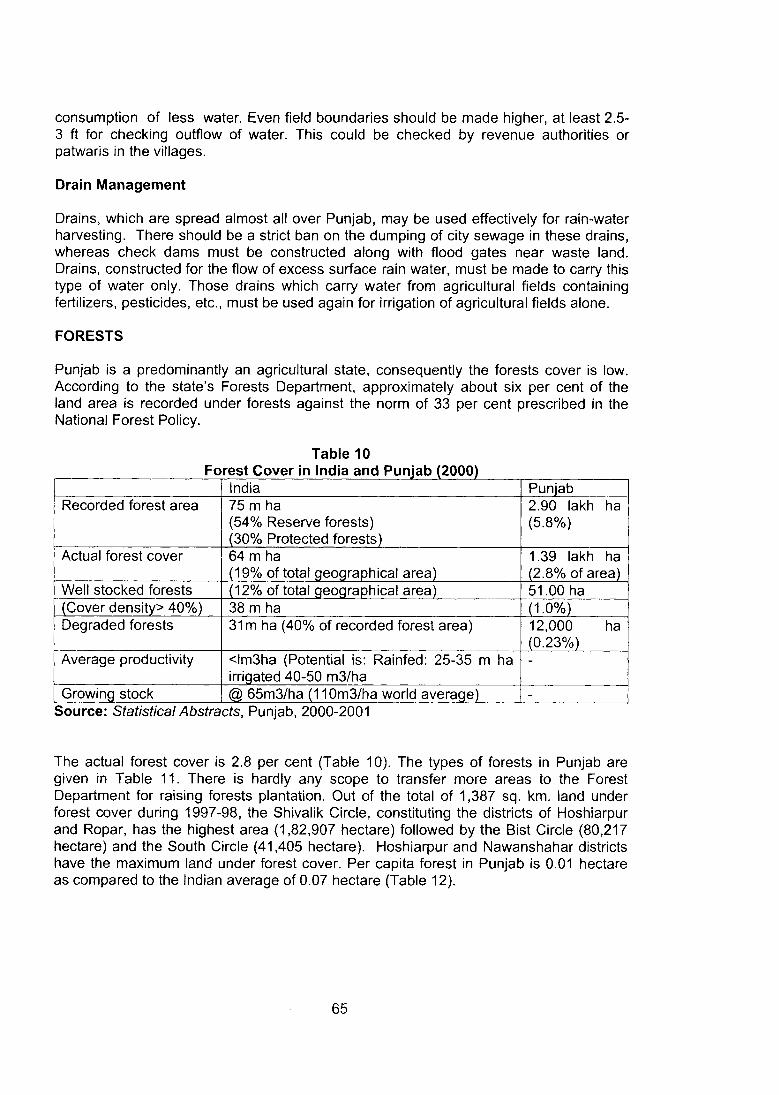
consumption of less water. Even field boundaries should be made higher, at least 2.5-3 ft for checking outflow of water. This could be checked by revenue authorities or patwaris in the villages.
Drain Management
Drains, which are spread almost all over Punjab, may be used effectively for rain-water harvesting. There should be a strict ban on the dumping of city sewage in these drains, whereas check dams must be constructed along with flood gates near waste land. Drains, constructed for the flow of excess surface rain water, must be made to carry this type of water only. Those drains which carry water from agricultural fields containing fertilizers, pesticides, etc., must be used again for irrigation of agricultural fields alone.
FORESTS
Punjab is a predominantly an agricultural state, consequently the forests cover is low. According to the state’s Forests Department, approximately about six per cent of the land area is recorded under forests against the norm of 33 per cent prescribed in the National Forest Policy.
Table 10Forest Cover in India and Punjab (2000)
India PunjabRecorded forest area 75 m ha
(54% Reserve forests) (30% Protected forests)
2.90 lakh ha (5.8%)
Actual forest cover 64 m ha(19% of total geographical area)
1.39 lakh ha (2.8% of area)
Well stocked forests (12% of total geographical area) 51.00 ha(Cover density> 40%) 38 m ha (1.0%)Degraded forests 31m ha (40% of recorded forest area) 12,000 ha
(0.23%)Average productivity <lm3ha (Potential is; Rainfed; 25-35 m ha
irrigated 40-50 m3/ha-
Growing stock @ 65m3/ha (110m3/ha world average) -
Source: Statistical Abstracts, Punjab, 2000-2001
The actual forest cover is 2.8 per cent (Table 10). The types of forests in Punjab are given in Table 11. There is hardly any scope to transfer more areas to the Forest Department for raising forests plantation. Out of the total of 1,387 sq. km. land under forest cover during 1997-98, the Shivalik Circle, constituting the districts of Hoshiarpur and Ropar, has the highest area (1,82,907 hectare) followed by the Bist Circle (80,217 hectare) and the South Circle (41,405 hectare). Hoshiarpur and Nawanshahar districts have the maximum land under forest cover. Per capita forest in Punjab is 0.01 hectare as compared to the Indian average of 0.07 hectare (Table 12).

Table 11 Forests of Punjab
Types of Forests 1997-98 (ha) 1998-99____(hal
A) GOVERNMENT FORESTS1. Reserve forests 4336.36 4336.392. Protected forestsi) Demarcated forests 29842.36 29988.38ii) Un-demarcated forests 7970.05 7970.05iii) Road strips 16511.17 16524.17iv) Rail strips 8723.19 8723.19v) Canal/Drain strips 45024.74 45034.24Total Protected forests 108071.53 108240.033. Unclassed forests 21522.54 21377.34Total Govt, forests 133930.46 133953.75B)PRIVATE FORESTS4.Under sec. 4 & 5 of Punjab Land Preservation Act,
1900169899.60 169899.60
5.Under Sec. 38 of Indian Forest Act. 1927 675.33 675.33Total Private Forest 170574.93 170574.93Grand Total 304505.39 304528.69
Source: Annual Administrative Report, 1998-99,Punjab
Forest & Wildlife Preservation,
The function of forests is merely to provide timber, food, fibre and fuel wood. These have a great influence on the environment, the soil, water and, above all, these are the custodians of bio-diversity and wildlife. The survival of all these elements on a sustainable basis is necessary, but the current situation is such that the conservation of existing forests is so urgent that expansion is a far cry. In contrast, however, degradation of forests for economic reasons and extensive poaching of wildlife has been going on unabated, despite the fact that several forests areas have been declared as reserves for wildlife and felling trees is banned. In Punjab, 8,064 cases of illegal felling of trees and poaching of animals were registered during 1997-98, in addition to several hundreds of unreported cases. Management of forests, therefore, assumes great significance.
Table 12Forest Cover in Punjab and Other States (1997-98)
State Geographic area (sq km)
Forest area (sq km)
Forest as % to total area
Per capita (ha)
Punjab 50362 1387 2.8 0.01Haryana 44212 604 1.4 -
Rajasthan 342239 13353 4.0 0.03Gujarat 196024 12578 6.4 0.03Arunachal Pradesh 83743 68602 82.0 7.93India 3287263 633397 19.3 0.07Source: Statistical Outline of India, 2000-01

Forests of Punjab have been classified as under;
a) Coniferous (Lower Shivalik Chir Pine) forestsb) Bamboo forestsc) Scrub forestsd) Broad leaf forests
Coniferous forests: These forests are found in the Shivalik hills of the state where Chir is the main species, along with Amla, Khair, Sunan and some scattered trees of Terminalias. Chir wood is of poor quality and its felling in the area is completely banned. These areas are being managed according to the tree section of the working plan, i.e., by a selection-cum-improvement felling system.
Bamboo forests: These forests are also found in the Shivalik hills, mainly in the Dasuya Forest Division and in certain pockets of Hoshiarpur and Gurdaspur Forest Divisions in Dholbaha and Salidhar forests respectively. In the Dasuya Forest Division, Bindravan, Karanpur and Nanad Bir areas are almost pure bamboo forests. The main species is Dendrocalamus strictus associated with Rajain, Khair, etc. These forests are being managed under selection-cum-improvement felling system.
Scrub forests: Scrub forests are found in the Shivalik hills and in various Birs of Punjab. Acacia catechu is the main species found here. Acacia nilotica and Delbergia sissoo are found along riverine areas and in the plains. In the Shivaliks, management of these forests is under the Land. Preservation Act of 1900 and under the Indian Forest Act of 1927, whose main objective is to stop and reverse the process of soil erosion and improve the moisture regime and groundwater recharging. In the past few years, economically more important tree species have been introduced in these scrub forests, both in the hills and in the plains. These include Eucalyptus, Neem, Siris, Toot, Drek, Ailanthus, Tun, Amla, Poplar, etc. In the plains, the Eucalyptus areas are under clear felling with regeneration. Improvement in felling, thinning and other silvicutural operations are also conducted as and when required. The techniques of management have great scope for improvement.
Broad leaf forests: Eucalyptus, Shisham, Poplar, Mango, Neem, Toot, Teak, Ailanthus and Tun are some of the important species of the broad leaf forests. These types of forests are mainly found in the plains and are being managed under the prescriptions given in the working plans. Generally, the silvicultural system adopted is clear felling with artificial regeneration. The Eucalyptus forests are under the clear felling system with natural regeneration (coppice), supplemented by artificial regeneration. Improvements in felling, thinning and other silvicultural operations are also carried out as and when required.
Regeneration and Afforestation
Regeneration becomes essential as more and more forests get destroyed due to economic reasons, negligence, fires and other known and unknown causes. It has to be conducted at a faster pace than that of degradation, which now appears to be faster. Punjab has much less area under forests than prescribed, hence forest regeneration assumes great significance, for which concerted practical and scientific approaches have to be adopted. The current methods of forest regeneration are:

Mainly natural: Locational factors are very important in the natural regeneration of any forest species. Natural regeneration of Khair, Chil, Shisham, Eucalyptus and Bamboos has been going on in the forests of the state. Natural regeneration of Shisham is being encouraged in the Shivalik hills, as it helps soil conservation. At some places in the plains of Punjab good natural regeneration of Shisham has been noticed. Eucalyptus regenerates naturally through coppice. Natural regeneration is not the only way of afforestation but has also to be supplemented with artificial regeneration.
Mainly artificial: Afforestation with artificial regeneration is the main method adopted to increase the forest cover of the state. Plants of economically important species, viz.. Eucalyptus, Khair, Bamboo, Teak and Shisham are raised in polythene bags in different nurseries of the state. At present there are 273 forest nurseries, covering an area of 263.49 hectare, which raise the seedlings of those tree species, which are planted when required for the artificial regeneration of the forests. The number of nurseries and seedlings need to be increased two-to three-folds to augment the forest cover in the state.
Afforestation: During 1998-99, afforestation/treatment was carried out over an area of 10,439 ha by the department under different schemes in operation. Apart from this, individuals and various organizations also carried out afforestation/treatment after purchasing the plants from forest nurseries and other private nurseries of the state. Voluntary bodies and village panchayats should be involved in this work.
Forest Produce and Requirement
Forests are also a natural source for wood, wood products, fruits, biodiversity and provide pasture land for grazing animals. Many communities thrive on forest produce, as this is their only means of livelihood and sustenance. In the process, damage to the forests and pasture lands takes place. However, some of the communities using forest produce are equally responsible for the maintenance of these forests, as they also ensure proper protection and regular regeneration exercises.
Overexploitation of forests for their produce for economic gains has endangered them and is the main cause of their degradation. The forest department is charged with the responsibility of preservation, management and regeneration of forests as well as wild life, but degradation of forests and poaching of wild animals go on unabated. Scientific methods need to be adopted for the sustainability of forests and wild life, and peoples’ participation in this task should be ensured for better results.
Table 13
Particulars Unit 1997-98 1998-99Timber Cu.M 73182 67760Firewood -do- 2070 2187Bhabbar grass Tonne 493 494Fodder/grazing Sarkanda Lakh Rs. 24.72 21.98Plants Lakh Rs. 50.31 40.93
Source: Annual Administration Report, 1998-99, Forest & Wildlife Preservation,Punjab

During 1998-99, 67,700 cubic metre of timber was legally produced by the forest department and 2,187 cu.m was meant for fuelwood. Non-wood forest produce, such as babbar grass, bamboo, sarkanda, fodder and fruits, valued at over Rs. 100 lakh, was also produced and sold (Table 13). This production is variable depending on weather conditions, market demand and the availability of forest produce. The projected annual total demand for wood in the state by the year 2005 is approximately 7.24 million cum. There are 88 plyboard manufacturing units in Punjab whose annual demand is met by trees harvested from 6,000 to 8,000 hectare of land annually. These units are working at 50 per cent capacity. On a six to seven year rotation the area under poplar tree cultivation can be easily increased by about one lakh hectare. Installation of pulp units for paper/rayon in public or private sectors is necessary, and this activity itself will encourage afforestation.
Agro-forestry and Social Forestry
Agro-forestry involves growing trees and crops in combination, while social forestry deals with growing trees in the socially inhabited areas, such as towns, villages, roads, parks, railway tracks etc. Punjab Agriculture University (PAU), after years of research, has identified tree species of Poplar, Eucalyptus, Leucaena\ Acacia, Melia, etc., for agroforestry and developed matching technology for their block and boundary plantation. For boundary plantation, planting of Eucalyptus in the north-south direction and its specific management of crop nutrients and water management have been standardized. Guniea grass, oats and sorghum have been identified as suitable crops for block plantation. Keeping in view the demand for several plywood units in the state, considerable emphasis has been laid on Poplar plantation. Cultivation of fodder crops, as inter-crop in the early stages at Poplar plantation has been found to be profitable and better than wheat-paddy rotation (Table 14).
Table 14Economics of Poplar with Inter-cropping
(Annual value Rs./ha)Year Poplar+Wheat
-Kh. FodderPoplar+Sugarcane for three years Wheat-Kh fodder for three years
Poplar+Potato+ fodder for three years Wheat-kh. fodder for three years
Paddy-Wheat
1 16778 27385 36498 33023II 12095 30190 12098 33023111 5925 16228 11143 33023IV 43293 45450 45685 33023V 44580 52658 53683 33023VI 60435 67603 67813 33023
Overall 183106 239514 226118 198138Annual 30518 39919 37686 33023
Source: Singh, Sukhjinder (2000) M.Sc. Thesis, Department of Economics & Sociology.Punjab Agricultural University, Ludhiana (Unpublished).
Usually farmers cannot spare or tie up the land for longer periods under block forests- tree plantation. Boundary plantation of Poplar, Eucalyptus, Drake, etc., planted in the north-south direction has given better results than when planted in the east-west direction. Marshy and marginal land are more suitable for Eucalyptus cultivation. Trees

planted around farm tube wells alongside farm paths and permanent water channels also add to agro-forestry and do not affect agricultural crops.
Cultivation of Eucalyptus was popular in the state during the eighties. Its cultivation declined due to lack of proper marketing and the agro-forestry movement suffered a setback. A second push for encouraging agro-forestry and social forestry is called for with adequate research backing.
Forest Management
Forest management is the crucial input for saving the forests, their bio-diversity and wildlife, from losses due to illegal felling of trees and poaching of wildlife. Besides, vigil has to be kept to detect forest fires. There are roads and paths passing through the forests and some rest houses have also been constructed. These have to be properly maintained. Protection from cattle on open grazing has to be ensured so that the rejuvenation of trees’ undercover is not damaged beyond repair. Several trading operations, such as improvement in felling, Kana/gram stubbing, weeding, debudding, have to be carried out frequently to maintain the health of forest cover. While the wood of Poplar is in great demand there is also need for diversification to grow Teak, Simbal, Bamboo, Shisham, etc., for greater economic returns. Though adequate manpower has been assigned to the forest department, leakages are frequent and sometimes overburdening.
Afforestation is a process of planting trees and other plant species on a regular basis to maintain appropriate forest cover and increase the forest area. In special area programmes, such as the sub-mountainous zone of Kandi area in the districts of Hoshiarpur, Ropar and Gurdaspur, afforestation is aimed at checking soil erosion and conserving water. An integrated afforestation programme with suitable tree species, grasses and other plants, to rejuvenate and add to the forest area and also to avoid the loss of bio-diversity, for ecological restoration and environmental conservation is on. Since 1997, this programme has covered over 1000 hectares in the Kandi area. The speed with which this work is being done is rather slow because degradation of forests is taking place faster than afforestation. In this context, participation of local stakeholders would be meaningful in not only saving the forests from degradation but also in looking after the planted trees. Involvement of Panchayati Raj Institutions would be meaningful.
Bio-diversity and its Conservation
In India about 45,000 plant species have been recorded, which constitute nearly 12 per cent of the world’s total plant species. Out of these 3,000 species are of non-economic value. Many plant species found in the Himalayas and Shivalik ranges are locally used for various medicinal, food and ibre purposes. The medicinal value of some plant species is yet to be determined.
Bio-diversity: Punjab is almost entirely cultivated. The Shivalik in the north and northeast has undulating green forest cover where the maximum wild stock of the state exists. Along with the Shivaliks the wet-lands or patches along rivers are places where wild stock is available. The state can be divided into four main zones as follows;
1. Shivaliks2. Grassy plains3. Semi-arid region4. Wet-lands

Shivaiiks; The Shivalik forests are dominated by deciduous and broad-ieaves bushes and trees. Quite a number of herbs and shrubs are also found in this region, especially during the rainy season. The lower hills have Shisham and Khair trees. The broad- ieaves bushes and trees include Aohatoda, Azadirachta, Bombax, Butea, Albergia, Albizzia, Ficus, etc.. A large number of herbs form part of the ground flora. Thorny bushes and trees include Capparis, Ziziphus, Acacia, Mimosa, Lantana, etc.
The area also provide shelter to a large number of animals, birds, reptiles and insects. The ecosystem is of the climax type. The area has a large number of birds, especially sparrows, finches, weavers, woodpeckers, doves, pigeons, quails, cuckoos, magpie, parakeets, mynahs, etc. Such animals as deer, bluebull, sambhar, hogdeer, chital, etc., are found here, though in very small numbers.
Grassy plains; The grassy plains exist between the Shivaiiks and the sandy southern fringes of Punjab. Most of the area is cultivated, dotted by numerous trees and shrubs. Grasses are the dominant natural vegetation. The fauna include several herbivores, such as hares, squirrels, etc., and carnivores, such as cats, foxes, mangoose, snakes, etc. Birds, which mainly feed on insects and grains are to be found in this area.
Semi-arid region; The southern areas of Punjab were characterized by shifting sand dunes, about half a century ago. However, with increasing cultivation and availability of irrigation facilities, the sandy regions have shrunk considerably. Since humidity is very low, thorny bushes are the main flora. Reptiles, such as lizards and snakes comprise the main fauna of the area. Other animals include hares, jackals, squirrels, etc. Black buck and blue bull are found in Abohar sanctuary, protected by local inhabitants.
Wet-lands; Punjab has several inland fresh water reservoirs, such as ponds, lakes and rivers, which provide habitat to a variety of flora and fauna. Aquatic vegetation, such a? water hycanith, nelumbium, trapa, hydrilla, etc., exixts in abundance in water bodies) along with varieties of algae and petridophytes, which feed large numbers of amphibians and reptiles, such as snakes, turtles, etc., and 116 species of fish have also been recorded in the water bodies of Punjab. They also attract a large number of migratory birds.
The state of bio-diversity in Punjab is not ecologically sound because of many reasons, such as;
1. The green revolution, which has resulted in food stability, is also responsible for changes in the ecosystem and loss of bio-diversity.
2. The narrow spectrum of traded products from agriculture, forestry and fisheries has resulted in the promotion of a few species only to the neglect of all other varieties.
3. Habitat loss has taken place due to micro-climatic change resulting from extensive land-use changes.
4. There is further loss of bio-diversity, as it has not been evaluated properly and integrated into the management of the resources.
5. Legal provisions are there to check poaching, extensive fishing, deforestation, but implementation is lacking, as well as awareness among the people residing in the neighbourhood.

The Punjab foothills of the Shivaliks, which once supported dense vegetation of diverse plant species, now present a highly degraded look. Perhaps many plant species have become extinct in this area. With the passage of time, depletion of agro-bio-diversity has also been taking place because of changes in the system of agriculture and in traditional crops and varieties in favour of new ones, over-grazing and deforestation. Encroachment for urban habitation, industries and other developmental activities have also caused considerable damage to plant species. Effects of such erosion of biophysical and ecological systems are now being felt and will be felt more in the future. As there are no bylaws for adequate control, or powers to check unrestricted destruction of plant species and bio-resources, there is a need for legislative measure against indiscriminate removal of plants from non-agricultural land. A bio-informatics cell needs to be set up to record the existing plant wealth and ensure its conservation.
ENERGY
Energy is among the basic requirements of man, besides food, shelter and clothing. Human beings consume almost every form of energy, such as fossilized fuel, sun, wind, water, thermal or biological energy. Punjab mainly consumes fossil fuel as energy, besides hydro power.
Conventional Energy Sources
Natural non-renewable resources; Coa! and petroleum are the natural non-renewable fuels used in the state. Punjab has none of these resources and is totally dependent on import from other states of the country, though there are two coal-based thermal power plants at Bhatinda and Ropar. Other sources of energy, such as petrol, diesel, furnace oil, kerosene and LPG are used in the state for transportation, industry, domestic purposes and in agriculture.
Natural renewable resources; Hydro-energy is the most important source of renewable energy in the*state. Both large-scale and micro hydro electricity projects have been set up, out of which ten are state owned and three are shared with other states.
Another form of conventional renewable energy used in the state is bio-mass in the form of fuel wood, agro-waste and cattle-dung cakes. According to a report dung-cake consumption during 1978-79 was about three million tonnes in Punjab, it is estimated that by the year 2004-05 it will be about 10 million tonnes.
Non-conventional Energy Sources
In view of the ever increasing demand for energy and depletion of the world’s conventional fuel resources, and their impact on the environment, non-conventional sources of energy need to be tapped.
Solar energy; Punjab has approximately 293 days/year of bright sunshine. This provides a large base for tapping natural energy resources. Solar energy can be utilized for the following five purposes;
i) Low-temperature collection system for domestic heatingii) Concentrating collection systemiii) Photo-electric systemiv) Photo-synthetic system

Wind energy: Wind is also another important source of non-conventionai energy. It involves the use of air masses of different densities and temperatures. Utilization of wind energy had been in practice in rural areas of the state before the seventies for winnowing threshed crops. It has now been substituted by machinces. The potential of wind energy utilization is under study for more effective use.
Cogeneration: Production of energy from steams in boilers is also being tried out in some industries of the state. This could be further enhanced by using various weeds as fuel for these boilers. Such weeds as water hyacinth, congress grass and lantana, which otherwise create enormous environmental problems in the state, could be used as fuel.
IMPROVING EFFICIENCY IN NATURAL RESOURCES USE
Land
Land is a valuable asset particularly when it is agricultural land. In Punjab, with 186 per cent cropping intensity, agricultural land is fully exploited and has started showing signs of fatigue in certain areas. Since agricultural soils in Punjab are alluvial deep, varying from sand to silty clay, it has taken centuries to form the fertile surface layer (5 to 10 cm) of the soil. The fertile layer is often washed away by floods and also erocted by wind and water (Table 15). Preservation of the surface layer, with its accompanying nutritional and biological support system, assumes significance as its loss would lead to loss in agricultural productivity.
Table 15Runoff and Soil loss from Non-arable and Arable Land of Varying Sizes in the
Shivalik Footh lls of PunjabArea (ha) Run (%) Soil loss
(t/ha/yr)(A) Non-arable lands(i) Large
catchments1630-5610
26-42 38-225
(ii) Smallcatchments
3 to 80 21-45 11-189
(B) Arable lands 0.25 to 3 20.35 10.62Source: Sur H.S. (2000) Director, Zonal Research Station,
Bullowal, Saunkhri
Preservation and conservation of agricultural land is the responsibility of the cultivator, who looks after it so that it remains productive. He has to put in an appropriate quantity of nutrients and other ingredients, in place of those taken out in the process agricultural production, to maintain the land’s fertility level. Unfortunately, this has not been happening and as a result our soils are becoming less productive because of loss of macro- and micro-nutrients in several areas. Establishment of a network of soil-testing laboratories as a facility to the farmer will go a long way in advising the cultivators about the hunger of the soil and its productivity potential.

Wastelands, another area of concern, are gradually increasing. Adjoining areas of urban habitation are becoming reservoirs of non-biodegradable wastes. The Government of India started an integrated wasteland development project in 1988-89 to develop wastelands based on village/micro watershed areas. However, dumping grounds around urban and factory areas, where affluents are deposited, and those of leftover brick kilns, quarries and old residential sites constitute a large mass of wasteland which is increasing day by day, but their reclamation and re-use has received little attention. Such areas are not only rendered permanently unusable but are also a source of pollution of air, land and groundwater. Attention needs to be paid to such areas too. Saline soils and water-logged soils are usually man made. Reversing the process of water-logging and soil salinity is a long drawn exercise and has to be done on a community basis. On the other hand, prevention of the development of salinity and water-logging is easily possible through proper extension of knowledge to the farmers. Sustainable agriculture, as a means to ecological conservation, calls for special attention to the management of land, which is our natural resource and should be well maintained.
Water
Water being a critical component of the life-support system, the national emphasis is on drinking water, followed by agriculture, industry and power. The basic needs for human beings, bovines and small remnants are 40, 30 and 1.5 litres per capita per day respectively. This does not include the requirements of wildlife. Scarcity of water can cause great hardship, while its abundance, particularly due to rains or floods, can cause havoc. As the underground water in the state is getting depleted, special attention has to be paid to water management and for this rain-water conservation is an important component. Most of the rain-water normally flows away. If, out of this, adequate precipitation is stored in the soil-profile itself as sub-surface water, and wells as groundwater, it will save the soil from erosion and mitigate the impact of droughts and floods. Siltation of reservoirs and canals will also be reduced. Conservation of rain-water is the requirement of the day, so that the depleting underground water is recharged and pressure on withdrawal for irrigation is reduced. Technology to conserve rain-water from rooftops of urban houses and runoff water of open spaces is available and is being used with success in Andhra Pradesh and other places. Water so collected is used for recharging the underground water basin and also for irrigation and other purposes. In Kandi area where there is high runoff of rain-water, there is also an acute shortage of drinking water. Efforts have to be made to devise means to relocate rain-water of the monsoon season in a manner that it could be used for the sustainability of agriculture, human and plant resources.
Forests
Forests are the lifeline of ail development activities and sustenance of human life. Increasing forest cover through proper management, protection and regeneration are essential components of conservation of soil and water resources and above all for regulating climatic aberrations. In Punjab, forests are important for continuing its agricultural activities. In addition, forests of neighbouring states, especially Himachal Pradesh and Jammu and Kashmir, are more important, as the entire water resources and climatic variables are totally dependent on the forest cover of these states. Degeneration of forests in these states has a direct bearing on Punjab’s agricultural development programmes. Joint efforts by the three states to preserve and enlarge their

forest cover, through a consortium action-programme, will be of mutual benefit and steps should be initiated in this direction urgently.
COMMUNITY PARTICIPATION IN NATURAL RESOURCES MANAGEMENT
The report of the working group on watershed development, rainfed farming and natural resource management for the Tenth Five Year Plan (2002-2007), that the Planning Commission of the Government of India submitted in September 2001, has emphatically pointed out that many government schemes concerning land, water and watershed development programmes started well but could not be operated on a sustainable basis due to lack of community and stakeholders’ participation. Wherever success has been achieved in the conservation of natural resources on a sustainable basis, it has been on account of local participatory activity. Plans and projects of the government, which have secured active participation of the communities, have achieved notable success. The watershed development project in Sukhomanjri (Shivalik hills) has succeeded and attracted attention because of community participation, which created necessary conditions for the development of a sustainable crop-production system, as a result of water- and land-conservation and scientific management.
Active participation of the people and the community in the conservation of natural resources is very important in executing the relevant programmes. It has to be a people’s programme to conserve nature through developing micro-planning for execution with the support of the government. People would participate meaningfully when production increased or stabilized and they got their share of the benefits therefrom. Without direct and tangible benefits, participation of the stakeholders would remain passive and just a few big influential farmers would corner a large proportion of the assistance. The role of Panchayati Raj Institutions assumes importance in this context. Programmes of natural conservation need to be re-oriented in favour of the Gram Sabha members, that is, the villagers. Conditions must be created for them to feel that the cattle resources, the forests, the common land, water and waste-land, etc., belong to them and their conservation would mean improved productivity. The participation of women and the landless in the process of decision-making is also equally important to ensure their active co-operation. Conservation of natural resources needs to be conceived as a means and the production system as an end.
References
Alexandrates, N., World Agriculture: Towards 2010, An FAO Study, FAO and John Eiloy & Sons, N. York. 1995.
Annual Administrative Report, Department of Soil and Water Conservation, Punjab. Various issues.
Annual Administrative Report, Department of Forests and Wild Life, Punjab. Various issues.
Brar, J.S. and Chibbar I.M., ‘N.P. and K. Status of Punjab Soils’, Indian Journal of Ecology, 21(1): 34-38, 1994.
Dhillon, P. Singh, Water Resources Development and Management in North West India, Centre for Research in Rural and Industrial Development, Chandigarh, 1988.
Government of India - Plan Documents. Various issues.

Government of India, Planning Commission, Report of the Working Group on Watershed Development, Rainfed Farming and Natural Resource Management for the Tenth Five Year Plan (2002-2007), Sept. 2001.
Government of Punjab - Plan Documents. Various issues.
Government of Punjab, Statistical Abstracts of Punjab, Economic and Statistical Organisation, Punjab. Various issues.
Johi, S.S. and Ray S.K., Future of Agriculture in Punjab, Centre for Research in Rural and Industrial Development, Chandigarh, 2002.
Kansal, B.D., Dhaliwal G.S. and Bajwa M.S., Agriculture and Environment, National Agricultural Technology Information Centre, Ludhiana, 1996.
Kohli, R.K., Aryaand AtuI K.S., Agroforestry and Environment, lUFRO and DNAES International Meet, Dayanand National Academy of Environmental Sciences, Chandigarh, 1996.
Land and Water Management in India Basin (India). Vol. 1. Land and Water Resources, Indian Ecological Society. PAU, Ludhiana, 1975.
Punjab Agricultural University, Vision 2020, Punjab Agricultural University Perspective Plan, 1998.
Punjab Environment, Status Report, 1995, Punjab State Council for Science & Technology, Chandigarh
Singla, G.B., Agricultural Planning Atlas, Punjabi University, Patiala, 1996.
Statistical Outline of India, 2001-2002, Tata Services Ltd., Mumbai.

FISCAL AND FINANCIAL MANAGEMENT
A GLIMPSE OF THE ECONOMY OF PUNJAB
Punjab is the most advanced state in the country, with a high per capita GSDP, highly productive agriculture a well-developed physical infrastructure and a high human development index. However, the fiscal balances of the state government worsened in the early nineties and has continued to deteriorate by accumulating debt faster than the growth of the economy. This is due to indiscreet high revenue expenditure by the state government and its agencies.
Given the well-developed infrastructure and a high level of income, the state is an important market for consumables. Normally, it should have the advantage of making a quick transition into industry and the service sector with linkages with its own resources and those of the neighboring states.
At Rs. 18,762 per capita Net Domestic Product (1997-98) its per capita output is 50 per cent higher than the all India average. Its position is second only to Goa, but Maharashtra is fast closing the gap from below. Punjab accounts for almost 1.6 per cent of India’s geographical area and 2.36 per cent of its population. More than 33.95 per cent of the states’ population is urban, which is higher than the all-India average of 27.78 per cent.
• Incidence of poverty is about six per cent (2000-01), the lowest among all the major states.
• Life expectancy is the second highest among all the states in the country, after Kerala, for both males and females.
• In literacy, however, it has lagged behind Kerala, Maharashtra and West Bengal, both for males and females.
• There is a distinct improvement in the provision of health facilities in Punjab. At present, there is one doctor for 1,485 persons. The infant mortality rate is 51 per 1000 as compared to the all India figure of 71 per 1000.
• The state’s economy is mainly agricultural, as about 38.66 per cent (Q) of the GDP is from agriculture and allied activities. Industry accounts for 24.90 per cent (Q) and the services industry for the remaining 36.44 per cent (Q) for the year2000- 2001 .
• Over 95 per cent of the state’s gross crop area is irrigated. The cropping intensity is 187 per cent as compared to 131 per cent at the all-India level. Yield of foodgrains per hectare is almost 5,000 kg, the highest in the country.
• Consumption of electricity by agriculturists is on the rise. In 1999-2000, 39.33 per cent of power was consumed by 7,71,132 tube wells for pumping water for irrigation.
The state o f foodgrain production is relevant for the present economy of Punjab.After near stagnation in 1999-2000 and a negative growth of two per cent in 2000-01, the agricultural sector in India attained a growth rate of nearly six per cent in 2001-02. One of the reasons for this is that the distribution of the monsoon rainfall in 2001 has been one of the best in recent years. The production of foodgrains in 2001-02 touched

209 million tons, an increase of 13 million tons over the previous year. Late winter rains in the northwest of India in February 2002 helped to raise foodgrains production to 212 million tons.
In 2001-02, the Food Corporation of India (FCI) procured 20.63 million tons of wheat a record level. Rice procurement also reached a record high in 2001-02. The unusually high procurement of wheat and rice in the last two years has led to accumulation of huge surplus stocks much above the minimum buffer stock norms. The FCI held in stock 58 million tons of wheat and rice n February 2002 against 16 million tons of buffer stock.
The primary reason for excessive procurement is the high Minimum Support Price (MSP). Offtake of foodgrains under the Public Distribution System has been low. Purchases by private traders have gone down considerably.
The food subsidy bill increased from Rs.2,850 crore in 1991-92 to Rs. 12,010 crore in2000-01. For 2001-02, the food subsidy is estimated at Rs.14,000 crore, out of which almost half is accounted for by buffer-stock subsidy or carrying cost of public stocks of foodgrains.
Measures have been taken to liquidate excess stocks: open market sale and export of foodgrains at prices much below the economic cost and increased below poverty-line allocations under the targeted Public Distribution System (PDS). These measures are attempts to reduce the carrying cost of surplus foodgrains.
One of the long-term measures for reducing the foodgrain subsidy and the carrying cost include decentralized procurement of foodgrains and encouraging greater role of the private traders.
The wheat-and-rice rotation dominating Punjab agriculture is a cause of concern because of ballooning stocks of these commodities with the FCI and its inability to find buyers in domestic or. foreign markets. This is likely to affect future minimum support prices for these commodities.
A system of contract farming through private sector companies, agricultural marketing and foodgrain processing, together constitute an alternative to near total purchase of wheat and rice crop by the FCI. This will necessitate elimination of such intermediaries as brokers, doing away with tax collection by the State Marketing Board, the Rural Development Board and purchase-tax on foodgrains, which works out to about 10 to 11 per cent of the price. This will encourage private sector players and multinational foodgrains giants to lift farm produce directly from the fields at pre-negotiated prices, avoiding brokers and intermediaries.
Presently, private players, including such multinationals as CARGIL, are allowed to procure foodgrains through market intermediaries at the minimum support price, after paying the brokerage, market expenses and taxes. These buyers pay escalated costs which make direct purchase from farmers less attractive.
In contract farming, revenue sharing with the farmers is based on a cost-plus return basis. The number of private operators for direct purchase of foodgrains from the farmers will increase in due course and make the concept operational. However, workable tripartite agreements between farmers, the private sector and government will

have to be finalized to ensure that where there is a breach of contract, a proper system to redress the grievances is available. This is within the present legal competence of the state. This contract farming system by private operators, including multinationals, is a good alternative for assured return to the farmers and also for achieving the ultimate goal of value-added processing of the agricultural produce of the state.
Since the excess production on account of the persistence of wheat-and-rice rotation in Punjab is defying all solutions, the state is also considering a proposal to compensate the farmers at the rate of Rs.5,000 per acre for diverting land to other commercial/noncommercial crops. This is an operationally suitable proposal, provided the central government supports it, as Punjab, with its very large production of wheat and rice and almost empty coffers, cannot bear the additional financial burden. The Planning Commission, it is understood, is not likely to support the proposal. Land-use should better be determined by the market/price mechanism and not decided by subsidies. The proposed compensation will be a burden if it is in addition to the Minimum Support Price (MSP) policy of the Government of India. A convincing proposal to compensate farmers for diverting a part of their land from wheat/rice rotation has to be formulated for central support.
There was a significant slowdown of industrial growth in 2000-01 and it continued with greater intensity in 2001-02. Overall growth during April-December 2000-01 was 2.6 per cent, compared to 5.8 per cent during the corresponding period of the previous year. High interest rate, infrastructure constraints and lower domestic and internal and external demand are the factors responsible for the slowdown. Unsatisfactory performance of infrastructure development during 2001-02 is reflective of the overall slowdown in the economy.
The growth of large, medium and small industries in Punjab is given in Table below.
Table 1
Year Growth of Large/Medium Industries in Punjab 1980-81 to 99-2000
Growtlh of Small-s Punj
980-81 to 1
;cale Industry in ab999-2000
No.ofunits
Employment(no.)
FixedinvestmentRs.(Million)
Production Rs. (Million)
No. of units
Employment(no.)
Fixed investment (Rs. in million)
ProductionRs.(Million)
1980-81 228 107767 7270 1,1410 4,3338 264869 3320 111801985-86 292 132174 14900 2,5350 9,7517 464809 7390 215101990-91 373 187311 40030 7,1640 16,0388 668845 13490 405001995-96 526 210448 87441 16,6561 19,1025 802329 22161 971391998-99 602 227929 140381 25,3760 19,7344 864592 33607 1444451999-2K 611 236000 147660 23,7200 19,9000 883000 37940 1661002000-01 638 252000 170000 35,6000 20,1000 897000 42500 195250
Source: Economic Surveys of Punjab.
Industry in Punjab largely provides a low level of employment and most of the low-paid jobs, comprising unskilled labour, have been taken by migrants from other states. The educated or technically qualified youth of Punjab are facing prolonged unemployment due to underdevelopment of the industrial and commercial sectors.

At present there is a lull in industrial activity in Punjab. The steel-melting industry has suffered the most in the recent slowdown. A power load of about 300 MW has been surrendered by industry because of its poor state of health. The textile industry, particularly yarn producing units, are getting progressively sick.
According to the preliminary report of the Industrial Revival Advisory Committee set up by the government, as many as 16,000 small and medium units are sick or likely to become sick. In addition, some of the cycle and cycle-parts units are also progressively getting into distress. The Advisory Committee has recommended that the state government must fulfill the promise of releasing incentives, and cash disbursement should be made to the units, wherever due, as promised, to help the industry face this critical situation. This may help their revival.
With comparatively satisfactory economic fundamentals, Punjab should be able to achieve a growth rate of eight to ten per cent in the short run. For this purpose it is necessary to plan and develop new industrial areas to meet the aspirations of the new generation of entrepreneurs. In addition, the technical education system should be revamped and reoriented so that the educated and trained youth become employable particularly in industry. Agro-processing, light engineering and textile industries have a potential for growth and development in Punjab. After information technology, it is biotechnology which has unlimited scope in sectors such as agriculture, animal husbandry, human health and environment.
According to the Advisory Committee, Punjab State Industrial Development Corporation (PSIDC) and Punjab Financial Corporation (PFC) have made significant contributions to the growth and development of small and medium industries. It has suggested the setting up of a Special Purpose Vehicle (SPV) for taking over assets at retrievable market prices. All powers of recovery under Section 29 of the State Financial Corporation Act, the Land Revenue Recovery Act and the sale of mortgaged assets with the help of the Debt Recovery Tribunal should be given to the Special Purpose Vehicle (SPV). This is at variance, to some extent, with the recommendations of the Punjab Disinvestment Commission, which has suggested the setting up of an Assets Management Authority for taking care of non-performing assets and other similar investments.
The Centre for Monitoring Indian Economy (CMIE), in its forecast for the period ending 31 July 2002, has reduced India’s industrial growth in the current financial year to three per cent from the earlier estimated growth of 3.5 per cent, because of the failure of rains in the first two months of the monsoon season. The monsoon is vital to India’s economic health, as agriculture constitutes 25 per cent of the country’s GDP and employs 70 per cent of the population. The CMIE estimates that such sectors as food products, consumer goods, textiles, garments and two-wheelers would be adversely hit. It expects the manufacturing sector to grow at a moderate pace of three per cent in the current year compared to 2.8 per cent in 2001-02.
CURRENT FINANCIAL POSITION OF PUNJAB
A look at the fiscal deficit and revenue deficit (Table 2) reveals the deteriorating financial situation of Punjab. The revenue balance of the state has been consistently in deficit.

Years Revenue Surplus/
Deficit (+/-)
Fiscal Deficit (-)
Revenue Surplus/
Deficit (+/-)
Fiscal Deficit (-)
(In Rupees Crore) (As a percent of GSDP)1991-92 (480.87) (1150.50) -2.11 -5.201992-93 (635.59) (1251.95) -2.42 -4.921993-94 (766.93) (1493.41) -2.54 -4.941994-95 (741.84) (1785.24) -2.18 -5.251995-96 (450.24) (1364.64) -1.17 -3.561996-97 (1357.06) (1464.68) -3.07 -3.301997-98 (1483.90) (2477.58) -3.07 -5.071998-99 (2628.67) (3779.32) -4.83 -6.881999-00 (2727.11) (3172.21) -4.38 -5.122000-01 (2335.97) (3903.75) -3.41 -5.702001-02 (RE) (3842.00) (5211.00) -5.48 -6.92
Source: White Paper on the State Finance, March 2002The revenue deficit reached its peak of 4.83 per cent in 1998-99. This is stated to be due to the implementation of the Punjab Pay Commission.
Fiscal deficit on the average has been over 5.25 per cent of GSDP during 1991-92 to 2001-02. it reached a high of 6.88 per cent of GSDP in 1998-99. The revenue deficit and gross fiscal deficit will touch 5.48 per cent and 6.92 per cent by the end of fiscal 2001-02, as estimated by the State Finance Department.
Finances of the other states of India too deteriorated over the years, particularly after the implementation of the Fifth Pay Commission Report in 1997, but the gross fiscal deficit in Punjab has remained persistently high even by all-India standards (Table 3)
Table 3Gross Fiscal Deficit as a Ratio o NSDP in Fifteen Major States (in percent)
States 1990-91 1995-96 1997-98 1998-99Orissa 6.4 5.8 6.3 9.4Rajasthan 3.0 6.3 4.9 8.6Uttar Prudish 6.2 4.3 5.7 7.6Punjab 7.4 4.0 5.6 7.4West Bengal 5.2 4.1 4.6 7.1Goa 9.4 3.5 3.5 6.6Gujarat 7.4 2.7 4.0 6.3Haryana 3.2 3.8 3.4 5.8Andhra Prudish 3.1 3.4 2.8 5.5Kerala 6.6 3.7 5.0 5.3Madhya Prudish 3.8 2.8 2.6 5.2Tamil Nadu 4.1 1.8 2.3 3.8Bihar 7.0 3.9 1.9 4.1Karnataka 2.7 2.8 2.3 3.8Maharashtra 2.8 2.8 3.5 3.5
Source: Planning Department, Punjab

The ratio of debt to GSDP touched a high of 40.66 per cent in 2001 and is expected to go up to 47.16 per cent in 2002 BE (Table 4). The guarantees too have been on the rise and, as reported in the White Paper on Punjab Finances, touched Rs.50,000 crore in 2002. The guarantees were also given to Public Sector Undertakings (PSUs), cooperative institutions and for cash credit limit for food procurement.
Table 4Debt o1 the State Government (Rs. In crore
Atend-March
Internal Debt of the State Govt.
Loans and Advances from the Central Govt.
StateProvidentFunds
InsuranceandPensionFunds
TotalDebtStock
TotalBorrowings during the Year
TotalStock as aProportion of GSDP (Inpercent)
1991 421.88 5731.78 694.16 22.16 6869.98 1212.27 36.381992 459.99 6607.22 809.31 28.32 7904.84 1034.86 34.611993 498.62 7734.35 976.26 35.60 9244.83 1339.99 35.191994 534.46 8721.73 1199.61 43.89 10499.69 1254.86 34.711995 1110.46 9543.92 1441.78 53.25 12149.41 1649.72 35.631996 1863.80 9952.73 1749.54 63.93 13630.00 1480.59 35.361997 1913.70 11049.10 2211.34 75.41 15249.55 1619.55 34.531998 2391.70 11979.22 2756.20 88.42 17215.54 1965.99 35.581999 4150.32 13056.97 3566.17 103.31 20876.77 3661.23 38.372000^ 4365.73 14727.39 4449.23 118.87 23661.22 2784.45 37.982001 9612.41* 13008.28 5073.48 136.16 27830.33 4169.11 40.66
Source: White Paper on the State Finances, Punjab: March 2002Note *; Includes Rs.4042.03 crore loans against small savings which were earlier shown under
loans and advances from Central Government.
Revenue receipts as a percentage of GSDP have been erratic. Revenue receipts from tax revenue and non-tax revenue from 1985-86 to 2001-02 is shown in Table 5.
Table 5 Punjab - Erratic Revenues
(As a proportion of GSDP)Years Tax Revenues Total Non-Tax Revenue Total Revenue1985-86 8.52 4.19 12.711986-87 9.41 3.39 12.791987-88 9.03 2.81 11.831988-89 8.88 3.02 11.901989-90 8.73 2.22 10.941990-91 8.42 2.38 10.801991-92 8.30 8.50 16.791992-93 8.28 2.67 10.951993-94 8.36 2.47 10.841994-95 8.89 6.70 15.591995-96 8.08 5.46 13.541996-97 7.34 5.19 12.531997-98 7.58 5.42 13.001998-99 7.00 3.47 10.471999-00 7.40 5.29 12.052000-01 (RE) 8.44 7.22 14.742000-02 (BE) 8.38 6.89 14.36
Source; Punjab Government Budget Documents

The growth of revenue income has shown a substantial increase in the years 1999-2000 and 2000-01. This is largely due to a progressively higher yield from sales tax, which almost doubled during 1997-98 to 2001-02. The growth of receipts from all sources is shown in Table 6.
Table 6Revenue Performance 1997-98 to 2001-02 Rs. in crore)
Items 1997-98 1998-99 1999-00. 2000-01 2001-02(Revised
Estimates)A. Revenue ReceiptsL Tax Revenue1. Sai'-s tax 1401.14 1489.66 1977.28 2644.41 2690.002. S\3t3 excise 1143.70 1204.27 1231.57 1324.67 1350.003. Tax on vehicles 215.68 266.72 321.37 338.32 320.004. Electricity duty 37.79 31.90 76.47 145.06 134.005. Entertainment tax 8.96 8.90 10.29 14.22 19.266. Stamps & registration 233.64 258.12 325.65 424.06 445.007. Land revenue, etc. 3.57 2.90 4.84 7.17 8.30
Total 3044.68 3262.47 3947.47 4897.93 4966.56Non Tax Revenue 2356.53 1507.35 2361.46 2935.24 3132.53
State’s Own Revenues 5401.21 4769.82 6308.93 7833.17 8099.09
Transfers from Govt, of India1. Plan & Non-Plan Grants 293.11 398.98 520.34 827.07 917.342. Share of Central Taxes 656.98 587.16 638.59 716.62 608.18
Total-1 950.09 986.14 1158.93 1543.69 1525.52Total Recelpts-A (l+ll+lll) 6351.30 5755.96 7467.86 9376.86 9624.61
Source.- Punjab Government Budget Documents
The figures in Table 7 indicate that the GSDP ratio of total revenue receipts in 1999- 2000 has shown a downward trend from 13.46 per cent in 1995-96 to 11.91 per cent in 1999-2000.
The GSDP ratio of tax revenue and non-tax revenue has gone down from 8.03 per cent and 5.43 per cent in 1995-96 to 7.31 per cent and 4.60 per cent respectively in the years 1999-2000, whereas capital receipts have substantially increased to 8.2 per cent because of larger borrowings. Borrowings, it is noticed, have not been invested for development purposes but utilised for defraying revenue expenditure.

per cent)Head of Account/Year 1990-
911994-95
1995-96
1999-00
Aggregate receipts (A+B) 15.24 21.59 18.18 20.11A. Total revenue receipts (l+ll) 7.47 15.55 13.46 11.91Own source receipts (1 (a) + 11(c)) 5.13 13.50 11.50 10.06Receipts from Centre (1 (b) +11 (d)) 2.33 2.05 1.96 1.851. Tax revenue (^+b) 5.27 8.87 8.03 7.31a. State own tax1%venue 3.92 7.62 6.88 6.30b. Share in Central taxes 1.'35 1.24 1.15 1.02II. Non-tax revenue (c+d) 2.19 6.68 5.43 4.60c. State own Non-tax revenue 1.21 5.88 4.61 3.77d. Grants from the Centre 0.98 0.80 0.82 0.83B. Total capital receipts (1 to X) 7.78 6.04 4.72 8.201. Internal debt 0.24 1.51 1.30 1.62II. Loans and advancestrom Centre 6.47 3.48 2.08 1.74III. Special securities issued to NSSF 0.00 0.00 0.00 2.73IV. Recovery of loans 0.23 0.14 0.14 0.17V. Contingency fund (net) 0.00 0.00 0.00 0.01VI. Small savings and provident fund etc., (net)
0.64 0.74 0.83 1.43
VII. Reserve fund (net) -0.01 0.01 0.01 0.05VIII. Deposits and advances (net) 0.25 0.13 0.18 0.45IX. Suspense and miscellaneous fund (net) -0.04 -0.01 0.08 -0.04X. Remittances (net) 0.00 0.04 0.09 0.04
Source: State Finances, Reserve Bank of India, January 2002.
The Punjab has a high per capita income but the own tax ratio to GSDP is consistently lower than other major states as evident from Table 8. This trend suggests a distinct possibility of enhancing the tax ratio to GSDP. On the expenditure side, Gujarat and Maharashtra have a lower ratio of revenue expenditure compared to Punjab. Relatively higher revenue expenditure with lower resource mobilization indicates scope for reducing in the revenue deficit by improving the tax ratio to GSDP.
Table 8
Year , Gujarat Karnataka Kerala Maharashtra Punjab Tamil Nadu1980-81 7.2 7.7 7.0 6.8 6.9 8.11985-86 7.7 9.3 8.4 8.0 7.1 10.11990-91 8.6 10.1 8.7 7.9 6.8 10.21991-92 9.4 9.7 7.6 8.1 6.8 10.41992-93 8.6 9.5 8.4 7.2 6.7 10.01993-94 8.7 10.0 8.4 7.0 6.9 9.51994-95 8.0 9.5 8.7 7.6 7.3 9.91995-96 8.0 10.4 8.7 7.3 6.6 10.91996-97 7.9 10.0 9.1 6.8 6.0 10.51997-98 7.6 9.9 9.0 7.5 6.0 9.9
Source: P anning Department, Punjab

Deficits are largely the result of government’s overspending and to a lesser extent due to meagre tax receipts. Budget deficits in Punjab have been growing over the past decade in particular. Deficits have sharply increased the public debt (the accumulated burden of yearly budget deficits), which in Punjab jumped to an alarming figure of 47 per cent of GDP of the state in 2001-2002, weakening government finances and draining resources from the economy.
The abrupt increase in revenue deficit in 1998-99 was on account of the implementation of the Pay Commission Report. The deficit for the year 2001-2002, according to the revised budget estimates, is Rs. 3,842.00 crore.
inflows of income from its own revenues and transfers from the Government of India have been inadequate to meet the mounting pressure of revenue expenditure. Public debt has been a convenient tool for raising resources and the state continues to rely on borrowings to finance its deficits. The revenue deficit (RE) for the year 2001-02 is Rs. 3,842.00 crore which is 5.48 per cent of GDP. Interest payment liability, for the year2001-2002 (RE) is Rs. 2,812.19 crore, which is about one-third of the revenue receipts. The revenue deficit from 1991-92 onwards is shown in Table 9.
Ta|)le 9
Year Revenuereceipts
Revenueexpenditure
Revenue deficit (2-3)
Percentage of revenue deficit of GSDP
1991-92 3715.84 4196.71 (-) 480.87 2.111992-93 2786.93 3422.52 (-) 635.59 2.421993-94 3276.63 4043.56 (-) 766.93 2.541994-95 5300.92 6042.76 (-) 741.84 2.181995-96 5184.75 5635.00 (-) 450.25 1.171996-97 5568.61 6925.67 (-) 1357.06 3.071997-98 6351.30 7835.20 (-) 1483.90 3.071998-99 5755.96 8384.29 (-) 2628.33 4.831999-00 7467.87 10195.28 (-) 2727.41 4.382000-01 9376.86 11712.83 (-) 2335.97 3.41
2001-02(RE)
9624.61 13466.61 (-) 3842.00 5.48
Source: Punja b Government Budget Documents.
Resource conservation is as important as resource mobilization. Unfortunately, no effort has been made to conserve resources and to stop or reduce the outflow of funds for unproductive purposes. Despite an unsatisfactory financial position, the state continues to forego and dissipate scarce resources by giving concessions and freebies. The state is indulging in the luxury of granting exemptions from payment of house tax on selfoccupied properties, exemption of sales tax amounting to Rs.900 crore per year, exemption from payment of water rates by farmers, giving free electricity to farmers and to the Scheduled Castes for household use non-revision of user charges on water supply in urban areas, liberal free travel in government buses to students of primary and high schools/colleges/polytechnics, women over the age of 60 years and concessional

travel to personnel of police and jails departments. This is causing loss to the state transport department running transport services on a commercial basis and also to Punjab Road Transport Corporation.
I he government has been giving free canal water for irrigation to farmers since 1997 and thus losing a revenue of about Rs. 20 crore per year. Land revenue was yielding Rs. 3.45 crore per annum before it was abolished.
The state government is taking on itself additional liabilities, such as pension benefits to the staff of the government-aided private schools and for employees of government- aided colleges. Employers and employees, according to the new policy concept, are to contribute to a privately managed pension fund so that there is no burden on the consolidated fund of the state. This is a contradiction in the liberalized era of reforms.
Ultimately, the taxes needed to support current government commitments fall as a burden on the tax payers. There is a consensus among the states on the need to reduce deficits, but as yet very few have addressed the problem comprehensively. Most of them are engaged in piece-meal measures to reduce the pressure of deficits. The electorate usually finds reduced spending more tolerable than increasing taxes. Cuts in expenditure are painful, but can be strategically aimed at unpopular programmes. Cutting expenditure has also its limits; therefore, increasing the tax base is the option. Although tax increases are politically risky in the present context, the state government will need to raise tax rates to cover costs of social security, education and health-care and also as a measure to transfer wealth from the rich to the poor.
REVENUE EXPENDITURE
The share of committed expenditure of the Punjab Government, consisting of wages and salaries, pensions and interest payments, has registered a rapid rise. Since 1996-97, this committed expenditure has exceeded revenue receipts of the government, as shown in Table 10.
The rate of growth of pensions has been the highest, followed by wages and salaries. In the last 10 years, pensions have grown nine times and wages and salaries four times. The present pension scheme for government employees puts an open-ended financial burden on the government. An expert group set up by the Government of India has submitted its report. It has proposed a hybrid scheme for which it combines contributions from employees and the state government on a matching basis, assuring the employees a defined benefit as pension. A pension scheme based on these parameters will reduce the mounting burden on the Consolidated Fund of the state and release funds for development.

Items 1991-92
1996-97
1997-98
1998-99
1999-00
2000-01 2001-02(BE)
Salaries & wages
1182.75 2333.43 2867.54 3680.70 3820.60 4309.94 4906.19
Pensions &retirementbenefits
142.88 348.45 434.25 719.25 1139.88 1116.00 1150.00
Interestpayments
360.59 1634.44 1848.76 2316.80 2636.67 2733.04** 2812.19
Grants-in- aid touniversities and other aided institutions
108.16 141.28 165.32 196.34 243.79 240.74 240.68
Total 1 to 4 1794.38 4457.60 5315.87 6913.09 7840.94 8399.72 9109.06Revenue receipts *
2323.67 4136.77 4576.40 4863.87 5695.68 7136.43 8806.17
%age of committed exp. to revenue receipts
76.99 107.76 116.16 142.13 137.66 117.70 103.44
Source: Punjab Government Budget Documents.Note: * Excludes interest receipts from PSEB
notional grant under waiver of Special receipts under Lotteries.
** Includes moratorium on interest granted by the EFC (Rs. 390.00 crore).
adjusted against RE subsidy, Term Loans and includes net
Punjab Government employees have been consistently enjoying pay scales higher than even those announced by the Central Pay Commission. Table 11 gives comparative information in selected categories for Punjab, Haryana and the Government of India.
Table 11Selected Comparative Pay Scales: Government of India, Government of Punjab
Post/Category Haryana Centre PunjabPeon 2550-3200 2550-3200 2620-4140Clerk 3050-4590 3050-4590 3120-5160Assistant 5000-7850 5000-8000 5800-9200Sr. scale steno 4450-8000 5000-8000 5800-9200Executive engineers 10000-3900 1000-15200 12000-15500Source: Finance Department, Punjab.
There are several categories of employees in the state, who get time-bound increases in scale, even though such a facility does not exist for Government of India employees. The state government allows payment of Central Dearness Allowance instalments. Public sector undertakings too follow these high pay scales. The consequent ballooning

debt has resulted in a high interest burden, and the excess committed expenditure has been supported by borrowings.
Capital expenditure has consistently remained below two per cent due to high expenditure on wages, pensions, interest payments and non-plan revenue expenditure. Expenditure on police has increased four times during 1990-91 to 2000-2001. Punjab Government implemented the revision of salaries with effect from January 1996. This aggravated the precarious financial position of the state. Salaries, wages and pension bills jumped from Rs. 2,180 crore in 1995-96 to Rs.2, 682 crore in 1996-97 and then to Rs.4, 400 crore in 1998-99 and Rs.5, 426 crore in 2000-2001, by which time the arrears were cleared.
The composition of developmental and non-developmental expenditure as percentage of GSDP of Punjab is given in Table 12.
Table 12(in per cent)
Budgetary Head/Years 1990-91 1994-95 1995-96 1999-2000Aggregate expenditure (1 to III) 15.15 16.11 16.57 19.211. Development expenditure (a+b) 3.54 5.51 4.24 7.96a. Social services 0.55 0.47 0.50 4.42b. Economic services 2.99^ 5.03 3.73 3.54II. Non-development (General services) 1.20 2.71 2.01 9.01III. Miscellaneous 10.41 7.89 10.32 2.24Total revenue expenditure (I to III) 11.76 10.69 12.66 16.341. Developmental expenditure (A+B) 1.40 0.99 0.99 7.31A. Social services 0.48 0.36 0.41 4.35B. Economic services 0.91 0.62 0.58 2.96II. Non-developmental (General services)
1.06 2.49 1.83 8.95
III. Compensation of local bodies 9.30 7.21 9.84 0.08Total capital disbursement (1 + II) 3.39 5.43 3.90 2.861. Total capital outlay (1+2) 2.28 4.74 3.43 0.701. Development (a+b) 2.14 4.52 3.24 0.64a) Social services 0.07 0.11 0.09 0.06b) Economic services 2.08 4.41 3.15 0.572. Non-developmental (General services)
0.14 0.22 0.18 0.06
II. Miscellaneous 1.11 0.68 0.48 2.16Source: State Finances, Reserve Bank of India, January 2002.
From the figures given in Table 12 it is obvious that in 1999-2000 and over a decade the GSDP ratio of non-development expenditure has been rising. This inescapable conclusion is that it is not a healthy sign of the state economy.
The unusually high committed expenditure on wages, salaries, pensions and interest payments and grants in-aid to institutions, as reported in the Wtiite Paper on Punjab Finance (March 2002), is 112 per cent (RE) of the total revenue receipts.

Increase in the toial debt stock and higher trend of interest rates have resulted in doubling interest outgo as a committed liability, between 1987-88 and 1990-91. Interest payment between 1990-91 and 2001-2002 increased almost nine times to Rs. 3,149.00 crore, which accounts for more than 30 per cent of revenue receipts (Table 13).
Table 13 Mounting Interest Expenditure
Year Interest Payments (Rs in crore
Revenue Receipts * (Rs in crore)
Proportion of Revenue Receipts Spent on Interest Payments
1991-92 360.59 2330.67 15.471992-93 410.61 2782.80 14.751993-94 1042.17 3268.37 31.891994-95 1243.69 3751.67 33.151995-96 1489.59 3845.46 38.741996-97 1634.44 4136.77 39.511997-98 1848.76 4576.40 40.40
• 1998-99 2316.80 4863.87 47.631999-00 2636.67 5695.68 46.292000-01 ^2733.04 7136.43 38.302001-02 RE 3149.00 9624.16 32.71Source: Punjab Government Budget Documents.Note: * Excludes interest receipts from PSEB adjusted against RE subsidy,
notional grant under waiver of special Term loans and includes net receipts under lotteries.
** Includes Moratorium on interest granted by the EFC (Rs. 390.00 crore)
There has been a decline in expenditure on social services from 1988-89 onwards. General services on the other hand has registered an increasing share of expenditure from 1991 onwards.
Given the predominant share of wages and salaries in total expenditure, it will be prudent to freeze future recruitment for all categories of employees includingconsultants. The compression of non-wage and non-interest expenditure is equally important. Rationalization or increase in user charges will provide much needed budgetary support. Private partnership for delivery of services by off-loading and transferring non-essential functions to the private sector is a pressing budgetary reform.
Recommendations of the Expenditure Reforms Commission (ERC), when received by the government, should provide a useful framework for immediate moderation in expenditure growth. The recommendations have been delayed inordinately and quick action on these will enable the state government to implement reforms from the first year of the Tenth Five Year Plan.
PLAN AND PLAN EXPENDITURE
The persisting deficit adversely affected the plan programme of the Ninth Five Year Plan. No contribution out of revenue resources was possible for the annual plans, which were implemented with borrowings. In the last year of the plan, i.e., 2001-02. The performance was only 58 per cent of the revised outlay. The state was not able to fully

avail of the central assistance for plan programmes and centrally sponsored schemes, because it could not provide the state’s share for such schemes.
Performance in Ninth Five Year Plan
The likely financial performance is expected to be 77.46 per cent of the revised outlay of Rs. 12,624.14 crore of the Ninth Five Year Plan. The shortfall in expenditure is due to resources constraints, implementation of the Fifth Pay Commission Report and a substantial increase in non-plan expenditure.
Table 14Year-wise Financial Performance o1 the Ninth Five Year Plan (Rs. in crore)
Year Approved outlay Revisedoutlay
Actualexpenditure
Performance to approved outlay (In per cent)
Performance to revised outlay (In per cent)
1997-98 2100.00 1940.00 2021.23 96.25 104.191998-99 2500.00 2500.00 2007.04 80.28 80.281999-00 2680.00 2680.00 1748.85 65.26 65.262000-01 2700.00
(2420.00 Core Plan)
2147.14 2045.25 75.75 95.25
2001-02 3357.00 (3025.00 Core
Plan)
3357.00 1956.18 58.30 58.30
TOTAL 13337.00 12624.14 9778.55 73.32 77.46Source: Planning Department Documents.
According to the guidelines of the Planning Commission, Government of India, the size of the Tenth Five Year Plan is fixed at five and half times the budgeted outlay of the Annual Plan 2001-02, and the size of the Annual Plan 2002-03 is to be fixed at ten per cent above the Plan size of the pervious year. In accordance with these guidelines the size of the Tenth Five Year Plan and the Annual Plan 2002-03 work out as under;
Table 15Outlays for Tenth Five Year Plan (2002-07) and the Annual Plan (2002-03)
(Rs. in croreParticulars Annual Plan 10* Plan (5.1/2 times Annual Plan 2002-03
2001-02 the size of 2001-02 (10% of Annual PlanAnnual Plan 2001-02)
Approved outlay 3357.00 18464.00 3693.00Sources: Punjab Budgetary Documents.
A total Plan outlay of Rs.2, 750 crore only, as against an allocation of Rs.3, 693 crore according to the guidelines for 2002-03, amounts to virtually a ‘plan holiday’, as the proposed outlay comprises resources from Government of India for Centrally Sponsored Plan, Additional Central Assistance, Eleventh Finance Commission Grants or from institutional sources. Even this minimal plan is not backed by adequate resources.
Available resources for the annual plan for the year 2002-03, as worked out by the State Finance Department, are Rs. 1,907 crore. This will not suffice even to meet the salary

component of the Plan, the state’s share in the Centrally Sponsored Schemes and schemes funded by institutions. To avail of the full assistance from the institutions and the Central Government, a minimum plan size of Rs. 2,750.00 crore was recommended by the Punjab Government. The Planning Commission has now increased the plan size to Rs. 2,793 crore.
The Annual Plans in the last five years have remained substantially under-achieved. Therefore, the Plan for the year 2002-2003 reflects a major increase when compared with the actual achievements of the earlier plans.
Table 16__________ Plan Expenditure in the Ninth Five Year Plan (Rs. in crore)__________
Year Total expendBudgeted
tureActual
1996-97 1850.00 1794.391997-98 2100.00 2008.211998-99 2500.00 2007.041999-00 2680.00 1748.862000-01 2700.00 2045.252001-02 3357.00 1956.18
Source: Planning Department Documents.
To meet the minimum requirements of plan expenditure, the state will have to go in for additional resource mobilization to the extent of Rs. 823 crore in 2002-03. The state has agreed to do so.
Additional Resource Mobilization in 2002-03
Disinvestment of State Holdings
The proposed fast-track disinvestment in Punjab Communication Limited, Punjab Alkalis and Chemicals Limited, Punjab Tourism Development Corporation Limited, CONWARE and Punjab State Industrial Development Corporation’s (PSIDC) holdings in Punjab Tractor Ltd. (PTL) will bring in additional funds in the kitty of the government. According to estimates of the Industry, PTL alone is likely to net about Rs.250 to Rs.300 crore on the disinvestment of 23.5 per cent shareholdings with the PSIDC. On the disinvestment of holdings in all the companies concerned, the likely inflow of funds, according to the estimates of industry, is expected to be about Rs. 500 crore.
Higher Yield from Sales Tax
The yields from sales tax as projected in the budget of 2002-03 will grow to Rs. 3,250 crore during the current year and is targeted to increase to Rs. 5,000 crore per annum in four to five years. When the existing exemptions of sales tax are withdrawn, the revenue from it is expected to increase still further. The adoption of VAT in place of sales tax with effect from 1 April 2003, consequent upon the ‘national consensus for floor rates of sales tax’, will result in higher income from this source and it is expected to exceed Rs. 6,000 per year in the last year of the Plan, 2006-07.

Revenue from Stamp Duty and Registration
There is scope for increase in revenue from Stamps and Registration through proper valuation of documents and strict enforcement of the levy of stamp duty. It will require revision of the floor value of properties by the district authorities for the levy of stamp duty, plugging leakages of stamp duty by transfers through general power of attorney and withdrawal of non-merit exemptions from payment of stamp duty. With these measures, revenue from this source will increase to Rs.525 crore for the year 2002-03 and it has the potential to grow to Rs.1,000 crore in four to five years. This projection in the budget is reasonable and achievable.
Plugging of Loopholes in Motor Vehicle Tax
It is admitted that there is large-scale evasion of the Motor Vehicle Tax. This can be eliminated or reduced through strict enforcement measures and liberal issue of route permits. The current year’s income at Rs. 350 crore is expected to grow by 10 per cent to 15 per cent. According to estimates in the budget, it is expected to double in the next four to five years, i.e., to at least Rs.700 crore per year in 2006-07.
Rationalization of Electricity Tariffs
Rationalization of electricity tariffs on the recommendations of the State Electricity Regulatory Body is expected to yield Rs. 930 crore. This is the additional income projected in the budget estimates of 2002-03.
Swapping of High Cost Borrowings
According to a scheme formulated by the Government of India enabling the states to repay high-cost loans over the next three years, all loans that carry interest rates higher than 13 per cent will be retired out of growth in collection of ‘small savings’ on 100 per cent retention by the state and additional market borrowings ear-marked for retiring high- cost debt. It is expected that the weighted cost of borrowing for retiring the high-cost debt, as calculated by the Government of India, is around 9.7 per cent. Through the proposed debt swap, the state will save 3.3 per cent on past borrowings*and this will reduce the annual interest payment liability of the state on public debt. However, care needs to be taken so that the additional loan permitted to be raised by thie Government of India for retiring high-cost old borrowings are not utilized for current consumption. Reform of the small saving scheme, together with reduction of interest rates and swapping of debt, will go a long way to improve the fiscal situation, by reducing the annual payment on public debt. This measure entitles the state government to assistance from the Incentive Fund created by the Government of India.
Revision of User Charges
Due to non-revision of user-charges for services, such as transport, drinking water, sewerage, technical education, medical education, higher education, secondary and tertiary health care, the quality of these services has deteriorated. Government should suitably revise user-charges to recover the direct operational and maintenance cost of these services in a phased manner. There is a significant departure and commitment by the government, in the budget, to improve the quality of services and by making the users to pay for them.

With additional resource mobilization, economy measures and compression in noninterest and non-plan expenditure, adequate funds will be available, enabling the government to achieve projected financial targets in each of the five years of the Tenth Plan which has, at present a financial target of Rs. 18,464 crore as against the actual expenditure of Rs. 9,778.55 crore during the Ninth Plan period. The government can implement a bigger plan even for 2002-03 and provide larger funds for plans from 2003-04 to 2006-07, as the state’s contribution for the implementation of the Tenth Plan is in sight.
ACCESSING CAPITAL MARKET FOR INFRASTRUCTURE DEVELOPMENT: PUNJAB INFRASTRUCTURE DEVELOPMENT BOARD
The Punjab Government has set up a Punjab Infrastructure Development Board (PIDB) under the Punjab Infrastructure Development Act 1998. The government now levies a cess on an advalorem basis on the sale of all agricultural produce, except fruits, vegetables and pulses. It is also levied on petrol. The cess is credited to the Punjab Infrastructure Development Fund (PIDF) and this fund is generally utilized for the development of infrastructure.
The PIDB has prepared a development plan comprising 12 projects at a total cost of Rs.2,214 crore as given below:
1) Chandigarh-Ludhiana highway2) Zirakpur-Patiala highway3) Ludhiana-Moga highway4) Khanna-Nawanshahr road + HLB over river Sutlej5) Ropar-Nawanshahr-Phagwara highway6) Chandigarh-Ambala highway7) Jagraon-Nakodar road + HLB over river Sutlej8) Gurdaspur-Mukerian road + HLB over river Beas9) Bridge over river Suan10) Construction of ROB11) Repair of badly damaged sections and widening of high traffic corridors
to 33 ft.12) Upper Bari Doab Canal Project - Remodeling
The Infrastructure Development Plan is to be implemented by convergence of funds from below and the given sources:
1) Loans from NABARD2) Transfer from Central Road Fund3) Budgetary support from the state4) Contribution by Railways5) GOI-AIBP6) Market loans through redeemable bonds
The PIDB has raised a sum of Rs.309.22 crore through bonds against an unconditional and irrevocable state government guarantee, with a maturity period ending seven years from the deemed date of allotment, which is 1 March 2001. The PIDB has implemented the road sector projects using a multi-pronged funding approach. Private sector

participation is sought both at the construction phase and during the operation phase. It proposes to levy a toll tax on users of the facilities wherever possible.
The income from infrastructure cess, funds raised through bonds and anticipated transfers from partners has enabled the PIDB to commence construction work on roads, bridges and flyovers through well documented and legally sound contracts. The value of such contracts is around Rs.520 crore. Timely repayment of principal and interest is assured by transferring 62 per cent of the income from PIDF and accruals from toll tax to an escrow account. A sum of Rs.150 crore has been transferred to the PWD (B&R) for upgrading and strengthening the road system and another Rs.50 crore has been given for irrigation development for remodeling the canal system.
This route of raising funds from the market through bonds, supported by special cess and transfers from partners, is a laudable initiative towards the creation of much needed infrastructure for the speedy economic development of the state. This concept of tapping market funds through bonds and repayment through accruals from cess and tolls should be extended to other areas of urban development, such as augmenting water supply, setting up treatment plants, disposal of solid and liquid wastes, urban roads, bridges, flyovers to help the growth of the economy in urban areas in particular.
The Public Disinvestment Commission (Commission) has looked into the working of the Punjab Infrastructure Development Board (PIDB), even though its examination was not in its brief. The Commission has raised a point relating to levy of ‘cess’ on the purchase of foodgrains by the state government. According to it, there is strong opposition to the levy of cess from the Ministry of Food & Supplies, Government of India. Also private dealers have challenged the levy of this infrastructural cess in the High Court of Punjab and Haryana. The Commission has pointed out that the PIDB is focusing mainly on roads and bridges with its own funds. It maintains that there is little justification for taking over the routine work of the PWD.
The charter of PIDB provides for private capital participation in infrastructural development through BOT (Build, Own and Transfer), BOO (Build, Own, and Operate) and BOOT (Build, Own, Operate and Transfer) basis. According to the Disinvestment Commission, the PIDB has not adhered to the original objective of public-private participation to leverage its funds through bankable projects. It suggested conversion of the Punjab Infrastructure Development Board into a Trust, whose the management could be the responsibility of Punjab State Industries and Infrastructure Development Corporation Limited (PSllDC).
The track record of PSIDC, particularly its financial prudence, according to the findings of the Commission itself, has been found wanting. It raised loans from the capital market against Government Guarantees for lending to industry by deviating from its entrepreneurial activities. As an institution it has a poor image because of its lending spree over the years and of its present baggage, comprising Rs. 1,700 crore as unrecovered loans and its equity in scores of closed and loss-making units. It will not be at all prudent to club PIDB, a growing institution, with a dead or dying institution like PSIDC. The assets and liabilities of PSIDC should be transferred to the Asset Management Company proposed to be floated for recovering loans and salvaging investments by sale of equity in joint and assisted sector companies of PSIDC.

For the first time in tiie history of Punjab, PWD (B&R) has prepared a bankable Project Report for following projects which will add substantially to the infrastructure of the state. The projects are:
(i) 66 Rail Overbridges Rs.585 crore(ii) Road upgradation in the state Rs.425 crore(iii) Link road widening in the state Rs.300 crore(iv) Border district link roads Rs.411 crore
The target for completion of these projects varies from two to five years.
The department proposes to evolve an integrated state-wise Toll Policy’. It is expected that collection of such tolls will contribute about Rs.50 crore annually with progressive increase in the subsequent year. On completion of these projects there will be smooth flow of traffic, lesser accidents, and a better connectivity. The Buildings and Roads Department will get projects executed by qualified A-Class contractors who have necessary road and bridge construction equipment.
Normally such ambitious programmes cannot be implemented through annual budgetary support. This innovative approach is intended to be financed with the assistance of national and international financial institutions and executed by experienced private agencies. The concept of ‘users pay’ is the cornerstone and this is a thoughtful approach for promoting ‘public and private partnership’ for speedy execution of state-level projects.
FINANCES OF PUNJAB STATE ELECTRICITY BOARD (PSEB)
The present financial position of Punjab State Electricity Board is a matter of concern. The current revenue of the Board is Rs.4,936 crore against its expendfture of Rs.6,814 crore. It has a current deficit of Rs. 1,878 crore. This figure will increase to Rs.2,103 crore after payment of three per cent return on its paid up capital as ordered by the Hon’ble High Court of Punjab and Haryana. The cash deficit for the year 2001-2002 is likely to be Rs.738 crore, to be met through borrowings.
The decision of the government to allow 100 units of free power to the Scheduled Castes has resulted in an annual revenue loss of Rs.lOO crore. The supply of free power to farmers of Punjab for agriculture is costing about Rs.1,200 crore to Rs.1,300 crore per year. The commitment of the state government in principle to partly subsidize power supply to the poorer sections and the farmers through budgetary support is a breakthrough for the State Electricity Board, even though compensation to it will be minimal. This, however, devolves a responsibility on the Board ultimately to make its working commercially viable, by eliminating or reducing inefficiencies and high losses in transmission and distribution. The per unit loss to the Board is given in Table 17.

The Per L nit Loss of Punjab State Electricity BoardYears Average Revenue
Per Unit (Rs.)Average Cost Per Unit (Rs.)
Per Unit Losses (Rs.)
1994-95 1.08 1.48 0.401995-96 1.25 1.60 0.351996-97 1.36 1.70 0.341997-98 1.48 1.97 0.491998-99 1.57 2.13 0.561999-2000 1.62 2.37 0.752000-2001 2.07 2.93 0.86
Source; Economic Survey of Punjab, 1999-2000.
The average power tariff covers only two-thirds of the unit cost. Despite the big shortfall in revenue and mounting losses, the Board has not taken measures to implement the Memorandum of Understanding (MoU) with the Central Government on metering 100 per cent of energy, its auditing and setting up profit centres.
With the continuing deterioration in the financial position of the Board it has not been possible for it to mobilize funds for its developmental schemes. The loans taken from financial institutions to the tune of Rs.1,216 crore in March 1997 have risen to Rs.4,450 crore in 2001-02. Further, default in servicing the loans from financial institutions, has barred the Board from future loans. On the other hand, the coal companies as well as the railways could reduce supply and handling of coal which could result in reduction in thermal generation. The non-payment of power purchased from the National Thermal Power Corporation (NTPC) and other undertakings could lead to the reduction of supply of power to the state.
Re-imposition of tariff on power for agriculture can ward off the present financial crisis of the Board. Free power supply for agriculture has been in operation since 13 February 1997 without compensation by the government except for a sum of Rs.250 crore in2001-02. Cost of power being presently supplied at an average delivered rate of Rs.3.37 per unit is said to work out to around Rs.2,000 crore in 2001-02.
The Central Government is funding the Accelerated Power Development Programme (APDP) but the full benefit of the reforms is not being taken by the Board. The fate of ongoing schemes, particularly the 24 hours power supply scheme, hangs in balance for want of funds. About 85 per cent of the expenditure incurred by the Board on the scheme is yet to be reimbursed.
The state government entered into an agreement with the Ministry of Finance, Government of India, on 9 April 1999 agreeing to implement measures to improve the power sector by augmenting resources to meet its much needed investment requirements. Due to skewed power tariff and low returns, the national and multilateral financing agencies have shown reluctance to invest in the state power sector, thus putting the state at a critical disadvantage. It needs to implement the measures incorporated in the Common Minimum National Action Plan for power.
The thrust of the power programme should be to ensure adequacy of power supply as well as quality and reliability. At present Punjab is facing a shortage of 950 Megawatts in

terms of peaking demand and 4,800 million units on energy basis. The following projects are to be taken up during the Tenth Five Year Plan (Table 18), to meet this power shortage.
Table 18Additional Power Generation in Tenth Five Year Plan
Name of Project CapacityGHTP Stage-ll Lehra Mohabbat 2x 250 MWShahpurkandi (HEP) (Pb. Share 134.4 MW) 168 MWMHP Stage-II(HEP) 16.5 MWUBDC Stage-III(HEP) 30 MWMicro Power House at GGSSTP Ropar 2 MWGoindwal Sahib Thermal Power Station 2x250 MW
Source: Budget Document of Punjab 2002-2003
The institutional funds for these projects will be forthcoming only if the following steps are taken;
a) Levy and recovery of energy charges on a cost plus basis.b) Reduction in transmission losses and avoidance of theft of electricity.c) Improving billing, etc., are the other components of reforms in the power
sector to fully recover the cost of power. This will enable the PSEB to attract private investment in transmission and distribution to supply quality power at affordable prices.
There is need for immediate revision of tariffs for consumers -domestic and industrial, -- re-imposition of agricultural tariff, release of subsidies to the Board and implementation of policy guidelines suggested by the Ministry of Power, Government of India. The Electricity Regulatory Authority should re-fix the tariffs as a major step to implement the reforms. If, due to political compulsions, economic tariff on power supply to agriculture could not be charged for the time being, a notional tariff of Rs.0.50 ps. per unit, as agreed in the conference of chief ministers, should have been charged until the recommendations of the State Electricity Regulatory Authority were available.
The present financial health of Punjab State Electricity Board calls for immediate revision of tariffs to save it from collapse. It proposes to engage a consultant to present its case for upward revision of tariff before the Punjab State Electricity Regulatory Commission, highlighting reasons which have caused the present precarious financial situation, which include inter alia, free power supply to the agricultural sector, Scheduled Castes and subsidized electricity supply to certain consumers. The Board will have to convince the Regulatory Authority about the genuineness of its intensions to implement measures to reduce manpower cost, theft of energy and improve the internal efficiency of the Board.
Punjab State Electricity Board (PSEB) has filed a petition before the Punjab State Electricity Regulatory Commission seeking tariff revision to offset the cash loss projected at Rs.950 crore and to ensure a three per cent rate of return (ROR) on the net value of the assets, as per the provision of the Indian Electricity Act. The proposal includes an increase of 25 per cent tariff for industries, 42 per cent for the domestic sector, two rupees per unit for tube wells having metered supply and Rs.240 per BHP for unmetered tube wells. The Electricity Board has worked out the per unit power generation cost at

Rs.3.50 for the year 2002, which has been contested by the industry in particular. The proposals of the PSEB are not supported by the state government, which has argued that the tariff revision sought by the PSEB was far in excess and not justified. The government has pleaded to the Commission that the cost of the inefficiency of the Board’s management ‘should not be passed on to the consumers’. The government is not prepared to provide help in the form of subsidy to the Board. It has promised to give budgetary support of only Rs.250 crore per year to subsidize power supply in part to the poorer sections of the society and fully to the small farmers. These issues have serious ramifications, including the responsibility of the Board to set its house in order by running it on professional and commercial lines. The commitment of the government to play its role and partly subsidize power supply to the poorer sections and small farmers, through budgetary support which is likely to be quantified by the State Electricity Regulatory Commission as the financial obligation of the state, will ensure compensation to the Board, even though in part, for subsidized power supply. This is indeed a step which might help ultimately to make the working of the PSEB commercially viable.
Just before the finalization, of this chapter the recommendations of the Punjab State Regulatory Commission were made public. The Commission has suggested a total subsidy of Rs.900 crore from Punjab Government to PSEB, leaving no uncovered revenue gap. The power tariff has been increased by 8 to 11 per cent for all categories of consumers and free-electricity to Schedule Castes has been reduced to 50 units per month. The farmer will pay 57 paise per unit for metered and Rs.60 per BHP for unmetered supply. The revenue from the farm sector as a result of this re-imposed tariff, is only Rs.297 crore.
DRAFT REPORT OF PUNJAB DISINVESTMENT COMMISSION
The Punjab Disinvestment Commission (Commission), set up by the state government has completed its draft report incorporating findings, conclusions and recommendations for inviting objections of the employees and public. The recommendations of the Commission are now on the website.
To expedite disinvestment and ensure transparency, fairness and equity, the government has decided to set up a Directorate of Disinvestment for processing the recommendations of the Commission. The final decision on disinvestment will be taken by the Cabinet Committee on Disinvestment under the chairmanship of the Chief Minister.
The state has provided Rs. 8,430 crore (Rs. 3,396 crore as share capital and Rs. 5,033 crore as loans) to 29 public sector undertakings (PSUs) and nine apex co-operative institutions (ACls). In addition, a sum of Rs. 28,990.86 crore has been taken by these undertakings as loans against government guarantees. Direct involvenient of the government is around Rs. 8,430 crore and liability for loans Rs. 28,990.86 crore. The number employed in PSUs is 1,18,624 persons, out of which 93,138 are employees of the Punjab State Electricity Board. Evidently, the problems of state undertakings are gigantic in terms of funds and job security of their employees.
In the era of liberalization, according to the Commission, the role of the government has considerably changed to that of a ‘facilitator’ for the creation of infrastructure for economic growth. It should, therefore, withdraw from its role as a ‘participant’.

The Commission has recommended the setting up of Punjab State Asset Management Authority for implementing the decisions of the government, based on its recommendations. A draft legislation for setting up this Authority has been prepared with the help of professional consultants for the consideration of the Legislative Assembly. Taking into account the poor financial position of the state, disinvestments, or closing down of loss making PSUs, will help to reduce fiscal deficit and raise resources for investment, or to pay off the mounting debts of the state. It is proposed to effect fast- track disinvestment in Punjab Communications Limited, Punjab Alkalis and Chemicals Limited, Punjab Tourism Corporation Limited and PSIDC’s holdings in Punjab Tractors Limited.
The Commission has recommend a ‘One Time Settlement’ (OTS) to take care of Nonperforming Assets (NPAs) and other similar investments and for rescheduling term loans. The proceeds from disinvestment are to be placed in the ‘Disinvestments Fund’ managed by the Asset Management Authority. It will be utilized for financing restructuring, retrenchment, implementing the Voluntary Retirement Scheme (VRS) and for retraining and redeployment of employees of the PSUs. VRS disbursement or retrenchment compensation will be the first charge on the ‘Disinvestment Fund’. Additional resources, if required, can be raised from financial institutions against the assets of PSUs transferred to the Asset Management Authority and through structural assistance from national and international institutions to provide a safety net to the employees. The report of the Disinvestment Commission has dealt with the winding up o f companies, mergers or disinvestment of PSUs, administrative, financial and legal matters for the disposal of loss-making PSUs and ensuring a fair and equitable safety net for the employees who become surplus. The Commission has specifically suggested restructuring of PSEB, by right sizing the staff by offering VRS to, or retrenchment of surplus staff estimated at one-third of the present strength. It has suggested the corporatization of distribution of energy and then its privatization in small blocks.
There is no doubt that the implementation of the recommendations of the Commission, though well thought-out, will hit certain sections of industry and a large number of employees, but this is the only option before the state. Its current level of income generation and resources cannot provide sustenance to the employees, even if it is considered expedient to do so, because of the negative or inadequate output of the PSUs listed for disinvestment. However, the implementation of the recommendations will depend on a political consensus among the ruling and opposition parties. The suggestions invited by the Commission for its consideration should be sympathetically considered, to provide, as far as possible, alternative avenues of employment to the surplus or retrenched employees, so as to cause the minimal hardship to the community.
RECOMMENDATIONS ON WHITE PAPER ON STATE’S FINANCES
The White Paper on Finances of Punjab, a well documented and assiduously prepared paper issued by the Punjab Government, was discussed at a two day meet of eminent economists, financial experts, senior administrators of the state and professionals. The Chief Minister, Chief Secretary and Principal Secretary, Finance, Punjab, addressed the gathering.
It was pointed out that the fiscal stress, which affected the financial position of Punjab, began in 1984-85, when terrorism raised its ugly head. Since then, a downward slide in fiscal balances has continued and became significant and a matter of concern in the

years 1997 to 2002. Public debt rose to 47 per cent of GSDP (2001-2002), gross fiscal deficit to 6.92 per cent and revenue deficit to 5.48 per cent by the end of 2001-02 (RE). Revenue expenditure has been galloping and borrowed funds have been diverted to meet it instead of being invested in productive channels.
The tax base in Punjab continues to be narrow. The major sources of taxation are with the Central Government. At the same time, tax compliance in the state has been poor. It is on record that evasion of sales tax is high, estimated at over Rs. 2,000 crore per year, as against the actual assessment of about Rs. 3,000 crore per year.
Avenues of fresh taxation have not been identified, despite the fact that the consumption expenditure of the people of Punjab has shown an upward trend in the matter of purchase of luxury and white goods. A large number of eating houses and restaurants are doing good business but they are not in the tax net.
The ratio of tax percentage to GDP is lower than in the six fast growing states. This indicates that the state government has not taken steps to raise resources through strict enforcement of taxation measures.
Punjab still relies heavily on raising funds through the expensive route of small savings. With the reduction of interest rates, the state should swap expensive loans with cheaper funds now available due to reduction in interest rates.
Completion of the Thein Dam has been delayed resulting in a huge escalation in the cost of the project. Even now a very large number of its employees are receiving pay and allowances without doing any work. No decision has yet been taken either to absorb, retire or part company with them with a golden handshake.
The government has failed to ensure a minimum return of three per cent on the capital invested in the State Electricity Board. The Hon’ble High Court of Punjab and Haryana intervened and directed the state government to implement the law by ensuring payment of minimum return by the State Electricity Board. If it had to implement populistic measures, like free electricity to the agricultural sector, proper accounting in the form of grants should have been adopted.
Panchayati Raj Institutions and urban local bodies are languishing and transfer of functions, powers and finances, despite concrete recommendations of the First and Second State Finance Commissions, have not fructified because of the reluctance of the political and government functionaries.
The state government, it was observed, has set up a Disinvestment Commission to suggest measures to recover locked funds to the tune of Rs.8,500 crore from the sick units, or make these commercially viable through mergers. This is one of the important measures to achieve reform. The funds so realized should, however, not be used to meet revenue expenditure but to pay off the ballooning public debt, or for reinvestment in regenerative schemes. There is a consensus that government should not be in business and this message guided the Disinvestment Commission while making its recommendations.
Local taxes levied by Municipal Councils are adequate to manage municipal affairs elsewhere in the world. However, municipalities in Punjab are shying away from levying

taxes and recovering user charges on a cost basis. It is time to learn from what is happening elsewhere. Municipalities should become vibrant and viable units of the third- tier government, marginally supported by transfers recommended by the State Finance Commissions or the Central Finance Commissions. The shortfalls if any should be met through public borrowings supported by bankable loan schemes.
Punjab has a distinct role in the field of agriculture. Therefore, it continues to be an agrarian economy with potential for export of its produce to other states. Punjab has a high per capita income growth due to its highest agricultural production in the country. This has led to a high consumption level with a multiplier effect on the growth of the local economy. There is no doubt that it is time that industrial production also grows appropriately, despite the logistic problem of a land-locked state.
The best option for Punjab is to implement its plan to double agricultural production through an extensive research and developmental programme. Commercialization of agriculture with the assistance of corporates is also workable. This Can help consolidation of fragmented holdings.
Agriculture should, in due course, become self-sustaining without subsidies on fertilizers, water and electricity for running tube wells for irrigation. However, agricultural production should be made competitive in the coming years by withdrawing taxes on exports of foodgrains to other states. These include market fee, rural development fund fee and purchase tax. In a free market economy, the present burden of state taxes will make the agricultural produce of Punjab expensive in the very near future, considering the cost of transportation to the centres of consumption.
The government must take hard decisions. It is not necessarily higher taxation, but compression of expenditure, ensuring compliance of tax laws and plugging leakages through enforcement measures. Some steps in this direction have been taken by the state government recently. Downsizing of government has been in the air for some time. This laudable objective can only be achieved through political will and not through platitudes. For this purpose it will be desirable to arrive at a political consensus.
The urban poor continue to be a neglected lot and bear the brunt of total indifference. No policy has been formulated at the state level to take care of the urban poor, who constitute casual labourers, unskilled labourers, skilled workers, drivers, street-sweepers and domestic help. A large number of slum dwellers in the urban areas are engaged in such low-status and low-income jobs as rag pickers, self-employed vendors, hawkers, etc. Thousands of clusters have emerged in the urban areas of Punjab on encroached vacant lands, which are generally not authorized. Civic bodies, therefore, do not provide them with drinking water or drainage and health facilities. Low-lying areas with constant fear of floods, blocked drains, open defecation and littered garbage make the slum dwellers vulnerable to disease. The migrant population residing in slums are breeding places of crime. The silver lining for the slum dwellers is that they constitute the vote bank for the politicians on the eve of elections, in spite of which they continue to live in perpetual misery. Of late, special schemes have been formulated to provide such minimal civic services as water supply, community toilets, community centres and also vocational training programmes for upgrading skills of the youths and women of the slums. After training they are eligible for micro-loans to set up their own small business

enterprises, such as tea stalls, hawkers. Registered societies can be formed by women for taking loans and setting up tailoring, embroidery and other micro-level enterprises. The local municipality in each town has access to funds for such schemes and should arrange for training to upgrade skills of slum dwellers, so that, with the passage of time, they can join the mainstream of society in the urban areas as useful citizens.
The economy of Punjab cannot improve in isolation. It should be the outcome of political consensus. The growth of the economy has to depend on a long-term programme to be continued with the same tempo, zeal and favour, irrespective of the type or shade of the political party in power.
These observations in the foregoing paragraphs, made by experts invited by the Centre for Research in Rural and Industrial Development (CRRID), for a discussion on the comprehensive data given by the Finance Department in the White Paper to improve the financial health of the state, deserve serious consideration.
MEASURES FOR STABILIZING THE FINANCIAL POSITION OF PUNJAB
Punjab’s economy decelerated during the 1990s after recording the fastest growth in the 70s and mid-80s. Factors which seem to have adversely affected the state’s fiscal situation over the past 15 years are high salaries and wage bill, mounting debt burden, heavily subsidized social and economic services, slow growth of revenue and loss- making PSUs. The quality of governance suffered and so did the quality of expenditure over these years. Large-scale persistent absenteeism among teachers of government schools, particularly primary schools in rural areas, and doctors of primary health centers, has considerably affected the delivery of two vital social services.
There is need to restructure the tax collection mechanism and plug leakages in revenue collection from sales tax, stamp duty and motor vehicle tax. Revenue from sales tax can grow to Rs.6,000 crore, stamps duty to Rs. 1,000 crore and motor vehicle tax income to Rs.700 crore per year over the next four to five years. The Finance Minister has partly mentioned this in his budget speech.
As stated earlier the state is relying on raising funds through the expensive route of small savings. The swapping of costly debt including small savings with cheaper debt, a reduction in the current expenditure level and minimum reliance on borrowings, are the other measures for reducing the fiscal stress of the state. At present, almost one-third of the state’s own revenue takes care of yearly payments of interest on borrowings.
There are social and service organizations specializing in the promotion of education and providing health care to the poor and needy. They should be welcomed to deliver such high-cost social services as education and health. Delhi State has under consideration a scheme to transfer infrastructural facilities of schools, which have consistently shown poor results, to private organizations. The Madhya Pradesh Government has initiated a scheme to involve non-governmental organizations to run government hospitals/clinics in districts, through ‘Rogi Kalyan Samitis’. They are authorized to levy and collect a service charge from patients and use it for buying medicines, etc. The poor and deprived sections of the society are assured a minimum level of service. The government is responsible for payment of salaries to teachers/doctors, but the revenue expenditure is taken care of by the private organizations. A government-nominated regulatory authority should ensure quality of

service and exercise control by obtaining audited balance sheets and reports of income and expenditure. Capital grants to schools and hospitals for adding equipment continue to be borne by government.
The achievement of sustainable development, combining economic development, social development and environment protection is the key challenge before government. It entails balancing economic, social and environmental objectives of the society and integrating them as far as possible. Allocating a higher share of public spending to physical- and human-capital formation would help promote growth. Roads and similar infrastructure increase the productive capacity of the state. A better-educated and healthy population contributes to growth as it boosts work and productivity. The fiscal policy of government, ranging from taxing and spending decisions, has an important effect on sustainable development. A prudent, sustainable fiscal policy promotes economic growth. In the long run a low and stable level of government deficit and debt are typically associated with economic growth. Over the long run fiscal policy should keep fiscal deficit and debt at a sustainable level.
Punjab is faced with a dismal and unsustainable fiscal situation (March 2002) as summarized below;
• Revenue deficit is Rs.3,842.00 crore. It is 5.48 per cent of GDP• Gross fiscal deficit is Rs.5,211.00 crore. It is 6.92 per cent of GDP• Public Debt at Rs.3,3037.46 crore is 47.16 per cent of GDP• Annual interest liability at Rs.3,149.00 crore accounts for 32.71 per cent of the
state’s revenue• Salanes and pensions at Rs.5,890 crore per annum account for 74.30 per cent of
the state’s revenue• Budgetary provisions for education and health are largely consumed by salaries
and establishment expenditure• This situation can result in default in payment of salaries and pensions to the
employees and debt servicing, and in further deterioration in the quality of socioeconomic services
• With this background it is not possible to approach multilateral funding agencies, financial institutions and capital markets for funding development programmes
• The government will not be able to access funding under the Centrally Sponsored Schemes in the absence of desired sectoral reforms and its inability not only to contribute its own share but to even release funds received from the Central Government
• Funds received from financial institutions, Government of India and even a partof the Cash Credit Limit for procurement of foodgrains have been diverted to defray revenue expenditure
Therefore, corrective measures should be taken to maintain the essential services, including power, water supply, health, primary education, scavenging and sanitation. Immediate attention should be paid to correcting the revenue/fiscal deficit and substantially reducing public debt. The measures required are:
i) Fiscal deficit, which at present is around seven per cent of GDP be reduced to 3.5 per cent by the end of 2007

ii) Revenue deficit be reduced by 0.5 per cent per annum with 1999-2000 asthe base year and reduced to zero by 2007
iii) Public debt as a percentage of GDP be reduced from 47.16 per centcurrently to 25 per cent by 2007
iv) Committed expenditure, which is 112 per cent of the revenue, should be reduced to 60 per cent by 2007
v) Self-imposed discipline to stop issuing future government guarantees and creation of a Sinking Fund for guarantees
vi) These fiscal targets should be broken up into annual targets andimplemented, beginning with the budgetary proposals for the year 2002- 03. In addition, action has to be taken for;
a) Restructuring major departments for identifying redundant functions and functionaries.
b) Employees so identified, or who become surplus after completion of projects, should be transferred to a common surplus pool, to meet future manpower requirements. This may require re-training of the surplus employees.
c) A blanket ban on the creation of new posts and on recruitment be imposed. In addition, all posts lying vacant or falling vacant may be abolished.
d) A voluntary retirement scheme (VRS) on the pattern of that of the Government of India should be framed and notified. The scheme should be applicable to employees declared surplus.
e) The Finance Department of the state at one time held that financial institutions could fund this one time cash outflow. The Planning Commission holds that funding by banks/financial institutions may not be possible as such outgo essentially relates to revenue expenditure. It has suggested the establishment of a State Renewal Fund on the pattern of the National Renewal Fund to finance this type of cash outgo. The World Bank and international institutions have provided assistance to several countries for structural reforms for downsizing the bureaucracy. These institutions insist on quick disbursal of assistance, no rehiring of retrenched staff and sticking to the reduced level of bureaucracy.
f) The benefit of automatic promotion after four, nine, 14 years ofservice, enjoyed by nine categories of employees, should be withdrawn and every employee should be covered under eight, 16, 24, 32 years scheme.
g) Employees appointed in government service, beginning 1 July2002 should be entitled to contributory pension.
h) Grant-in-aid to educational institutions above school level should be phased out in a period of five years. However, capital grants in place of deficit grant should be substituted so that the quality of service does not suffer.
i) All fresh recruitment, including for projects, should be on acontract basis. This restriction should be initially for a period of five years.

The route of raising funds from the capital market through bonds, adopted by the Punjab Infrastructure Development Board, should be extended to other areas. A bankable project report for implementing construction of railway overbridges, road upgradation, widening of link roads in border districts by Public Works Department, is a step in this direction. It is proposed to formulate an integrated state-wide toll policy to defray repayment of the loans in part or full. Normally such ambitious programmes cannot be implemented through annual budgetary support. The new approach is intended to be financed by national and international financial institutions and executed by private agencies. The concept of ‘user pays’ is a thoughtful approach for promoting public- private partnership in such big projects.
There is now a provision in the Central budget offering reform-linked assistance to states, amounting to a total of Rs. 12,300 crore in such areas as Accelerated Power Development Reform Programme, Accelerated Irrigation Benefit Programme, Urban Reform Incentive Fund and Rural Infrastructural Development Fund. In addition, a lumpsum amount of Rs.2,500 crore has been provided for reforms of policies constraining growth and development. The state has the opportunity to avail of assistance by resorting to developmental measures in specified areas of chronic deficiencies.
According to a recent report (31 July 2002), the Meteorological Department has categorized the ongoing drought as ‘severe’, with monsoons 30 per cent below normal. Failure of the monsoons to this extent occurred thrice in the last century, i.e., in 1917, 1972 and 1987. Rainfall deficiency was 26 per cent in 1987. The monsoon situation has worsened this year with an average deficiency of 30 per cent upto 31 July 2002. The failure and uneven distnbution of the monsoon in Punjab has resulted in the loss of the kharif crop, particularly paddy. The state government has the responsibility of undertaking relief and rehabilitation measures. The Eleventh Finance Commission has laid down that the Calamity Relief Fund should be used for meeting expenditure for providing immediate relief to the victims of drought. The drought situation in a few other states, particularly in North India, is equally grave. If there is further loss of the kharif crop, funds required for relief and rehabilitation will mount and the Central Government may levy a ‘special surcharge’ on 'central taxes’ in consonance with the recommendations of the Eleventh Finance Commission. This should enable the state government to draw on this fund in addition to the calamity fund provided in its budget for 2002-03.
The budget for the year 2002-03 has a number of positive policy statements to improve the financial health of the state and additionally to ensure accountability and transparency. These are;
Fiscal responsibility and better budget management Corrective measures for restoration of the financial health of the state Improving quality of public expenditure Development of infrastructure Diversification of agriculturePower sector reforms and improving the finances of the PSEB Industrial revivalUrban and rural renewal through devolution of funds and functions to the urban local bodies and the Panchayati Raj Institutions

• Improvement in the quality and delivery of education and health services• Welfare of Scheduled Castes, Backward Classes and other weaker sections of
the society• Aggressive disinvestment in public sector undertakings
Another feature of the budget for 2002-03 is that it is a three-year rolling budget to ensure consistency and continuity. This concept of a three-year rolling budget is a medium-term fiscal reform programme prepared by the government. In addition, the state government will prepare an ‘Action Taken Report’ (ATR) on the announcements made in the budget and place it on the table of the House each subsequent year, so that the sincerity and performance of the government can be assessed by the legislature.
MEDIUM TERM FISCAL PROGRAMME
The state has to play an exclusive role in strengthening the physical infrastructure and human developnnent in order to be a favoured destination for private investment. The challenge of fiscal management in Punjab is rather acute and serious. Some measures have been taken to bring down non-productive expenditure to improve the fiscal situation. The declining share in central taxes and duties, as a percentage of GDP and the comparatively low growth in the state’s own tax revenues, mounting public debt, guarantees for loans raised by the public sector undertakings and high committed-expenditure of government suggest the development of a medium-term framework to control the inflow and outflow of the state’s expenditure. The Medium Term Fiscal Reform Programme drawn up by the state government, by resorting to a ‘rolling budget’, is a step in the right direction.
A medium-term fiscal policy statement of Punjab should provide an institutional framework focused on the need to bring down the fiscal deficit, control the growth of public debt and improve the effectiveness of the government in the delivery of goods and services. In such a situation, the government should adopt a fiscal iSolicy in the annual budget showing how the current policies are in conformity with the objectives of the medium-term fiscal plan as defined in the current budget. This includes reduction in revenue deficit as a percentage of total revenue receipt, reduction in fiscal deficit as a percentage of GDP and growth in yield from major taxes such as sales tax, stamp and registration, motor vehicle tax and non-tax revenues and savings from compression of expenditure. The medium-term fiscal plan, approved by the state legislature in the budget session, is a document which provides for surpassing the performance of previous years and monitoring the progress of reforms. The medium term fiscal plan will adhere to the norms laid down in the Draft Fiscal Responsibility Act to ensure control of deficit/borrowings. The Medium Term Fiscal Plan financial terms of this plan for 2002-03 to 2004-05, as prepared by the state government is shown in Table 19.
These reforms, namely, Medium Term Fiscal Plan and the Fiscal Responsibility Legislation introduced in the budget session of 2002-03, should lead the state to a path of high growth.

Item1!
200-01Accuts.
2001-02RE
2002-03BE
2003-04Proj.
2004-05 1 Proj.
1Tax Revenue 5614 5575 6423 7148 79551) Own tax revenue 4896 4967 5719 6348 70462) Shared taxes 717 608 704 800 908Non-tax revenue 3762 4050 6047 6181 70051) Own non-tax revenue 2935 3133 4424 5065 5789
L a) PSEB interest receipts 605 448 603 680 767b) Lottery 1671 2091 3066 3458 3901
! C) Others 659 594 755 927 11201 2) Grants 827 917 1623 1116 1217 11 Total Revenue Receipts 9376 9625 12470 13329 14960
Revenue Expenditure 11713 13467 15964 16261 173541 a) Interest payment 2343 3149 3211 3769 4234
b) Salaries and wages 4287 4888 5054 5155 5355i c) Grants in aid to 1 universities
241 256 265 265 265
d) Pension and retirement ! benefits
1116 1010 1027 1232 1479j
e) Other expenditure 3726 4164 6407 5840 60201)PSEB 605 448 603 680 7672) Lottery 1636 2021 2956 3334 37613) Others 1485 1695 2848 1825 1492
1 Revenue surplus/deficit(+/-) -2337 -3842 -3495 -2932 -2394Capital expenditure (incl.Net Loans & advance)
1567 1415 1952 1300 1600 I
Fiscal Deficit -3904 -5257 -5447 -4232 -3994 1Revenue deficit/revenue Receipts (%)
-24.9 -39.92 -30.00 -22.00 -16.00
Revenue deficit/GSDP(%) -3.41 -5.06 -4.15 -3.13 -2.30Fiscal deficit(%) -5.70 -6.92 -6.46 -4.52 -3.84GSDP 68448 75977 84335 93612 103909
Source: Punjab Budget Document: Medium Term Fiscal Programme, June 2002
The Punjab Fiscal Responsibility and Budget Management Bill, 2002 is proposed t( ensure intergenerational equity in fiscal management and long-term financial stability o the state, by eliminating fiscal deficit. Debt management of the state will be optimally maintained to achieve fiscal sustainability, by putting caps on state governmem borrowings, debt and deficits. The fiscal policy in a medium-term framework will be ir tune with the long-term interests of the state to achieve a revenue surplus for investment purposes.

Quarterly Statement of Income-expenditure
For the sake of transparency and accountability the state Finance Department should compile a quarterly statement of its income-expenditure for wide circulation. The reasons for excess or shortfall in income and expenditure should be recorded in the statement for circulation to the legislature, public and academics for information and feedback. These reform measures hold a promise to improve the financial position of the state in the coming years.
Accessing Foreign Assistance
The newly ushered-in government has initiated a laudable effort to compress expenditure substantially. It has made known its intention to reduce the revenue deficit, the fiscal deficit and the burden of borrowings.
The level of deficit and market borrowing is so high as defy government efforts to achieve their targets, unless easy external funds for budgetary support are identified and procured. In the state budget for the year 2001-02 emphasis is on fiscal reforms and the consolidation process. The focus is on augmenting tax and non-tax revenue receipts and containing expenditure to reduce revenue expenditure as shown in Table 20.
Table 20Growth Rate of Revenue and Expenditure Receipts for the Year 2001-02 & 2002-03
Items Years
2000-01(Accts)
2001-02 (R.E) 2002-03 (B.E)
Amount Amount Growth Rate in (%)
Amount Growth Rate in (%)
1. Tax revenue 5614 5574 -0.71 6423 15.222. Non-tax
revenue3762 4050 7.65 6047 49.30
3. Total revenue receipts
9376 9625 2.65 12470 29.55
4. Revenue expenditure
11,713 13467 14.97 15964 18.54
The government has embarked on a number of corrective measures to restore fiscal stability, which is an important indicator of fiscal prudence in the medium term. Fiscal measures incorporated in the budget include right-sizing the government, compression of non-productive expenditure, revision of user-charges and higher yield from traditional sources, such as sales tax, registration and stamp duty and motor vehicles tax through strict enforcement measures.
Institutional measures to improve the fiscal health include setting up a Public Expenditure Reforms Commission and a Public Sector Disinvestment Commission. Important sectoral measures include emphasis on research and development in the agricultural sector to achieve substantially higher agricultural production, strengthening small and medium enterprises, focus on information technology and bio-technology and

diversification of the cropping pattern, particularly the persisting wheat-rice rotation, through incentives and technological support. Other measures include operationalization of the State Electricity Regulatory Commission to determine electricity tariffs in a rational manner, and the Infrastructure Development Board to access market funds through ‘bonds’ for fast-track infrastructure development.
With these extensive reform measures, it should be possible to access budgetary support from the World Bank (WB), provided the approach to it is supported by a ‘Project Report’ highlighting the state’s development and poverty alleviation programmes. The WB prepares a Project Report at its own cost. Ordinarily the World Bank and other international institutions look forward to support development plans, which are growth- oriented and self-sustaining in the long run. The other states facing similar fiscal problems have actually approached the WB for long-term financial assistance from it and such requests are under consideration.
The WB, it is understood, is sending a team to Punjab for appraisal and assessment of the financial requirements of the state for supporting water supply, sewerage and sanitation programmes in urban areas, water supply in rural areas and road network upgradation programme, in the light of the fiscal reforms initiated and incorporated in its budgetary proposals. Financial support should be forthcoming, if fiscal reform measures announced in the budget are implemented by developing a transparent policy for levying and collection of user-charges for the commercial services provided by the state.
Several multilateral development banks, including the World Bank and the Asian Development Bank, have developed guarantee schemes. The WB facilitates access by developing countries by lengthening the maturity of related borrowings. This provides ample opportunity to approach international funding agencies, seeking funds for infrastructure-related projects based on a cash flow statement, without the direct backing of the state government. The World Bank also issues guarantees for project financing, under the Extended Co-financing Facility, to cover sovereign risks associated with infrastructure projects. This facility is designed to improve access of the developing countries to international capital markets.
The reforms undertaken by the state government in all areas of fiscal management, in line with the national policy, should restore the fiscal health of Punjab. This includes, user-charges on commercial services, to access institutional funds for fast-track infrastructure development.
References
State Finances; A Study of Budgets; 2000-01 and 2001-02, Reserve Bank of India
Statistical Abstract of Punjab, 1995-96,1996-97,1997-98,1998-99,1999-2000,2000-01 and 2001- 02, Government of Punjab
Economic Survey of Punjab, 1981-82,1986-87,1995-96, 1996-97,1997-98,1998-99,1999-2000,2000-2001 and 2001-02
Eleventh Finance Commission Report, 2001, Department of Economic Affairs, Government of India
Punjab State Electricity Regulatory Authority Act, June 2002

Punjab Human Development Report, November 2001, Government of Punjab
Union Budget 2002-03, Ministry of Finance, Government of India
Forecast of Receipt and Disbursement for Annual Plan 2002-07 and Tenth Five year Plan 2002-07
The Punjab Infrastructure Development Act 1998
Punjab Infrastructure (Development and Regulation) Act 2002
Recommendations of Industrial Revival Advisory Committee set by Punjab Government, June 2002
Interim Report Punjab Disinvestment Commission, June 2002
White Paper on the State’s Finances, March 2002
Fiscal Responsibility Bill, June 2002, Government of Punjab
Budget Documents of Punjab State, June 2002-03

DEVELOPMENT OF AGRICULTURE AND ALLIED SECTORS
INTRODUCTION
Punjab has entered the new millennium with problems in the agriculture sector. During the mid-nineteen-sixties, the green revolution transformed the states agriculture and contributed significantly in making the country self-reliant in food. The increase in production and productivity of wheat and rice in the state is legendary in the history of agriculture in India. These achievements presented a rosy picture of agriculture in Punjab until recently, as the achievements of the state in agriculture have run out of steam. Growth rates in agricultural production and productivity are stagnating and profitability in farming progressively getting reduced. Sustainability in agricultural production and the natural resource base are under threat, as warnings have been sounded on over-exploitation of land and water resources, and degradation of the environment and ecology. The technology base, which led to the green revolution, is not expanding any more. Alternative growth paths need to be explored to expand the growth potential of the state.
Punjab is endowed with abundant resources and an enthusiastic farming community, which has resulted in increase in grain-production from 73 lakh tonne in 1970-71 to 253 lakh tonne in 1999-2000. The state contributed in 1999-2000, around 50 per cent to the Central Pool Stock of wheat and rice. Cropping intensity in Punjab is currently more than 185 as against 133 in the country as a whole, and consumption of fertilizer (NPK) is 184 kilogramme per hectare as compared to the Indian average of 70 kilogramme per hectare. About 18 per cent of the total tractors in India are in Punjab. Production is supported by about 94 per cent irrigation coverage with 9,35,000 tube wells. Some of the selected indicators of development in agriculture are given in Table 1.
The fast-track adoption of production-augmenting technologies has led to several growth-related problems on the economic, social and environmental fronts in Punjab agriculture, so much so that the sustainability of wheat-paddy rotation is being doubted and debated.
Today, Punjab is at the crossroads, as the existing production pattern and marketing systems are out of tune with the immediate and long-term supply and demand situation in both national and international markets. A package of dynamic, pro-active and responsive policies and action programmes are required to revive Punjab agriculture, so as to meet the oncoming pressures of free trade, liberalization and globalization.
IMPLICATION OF CHANGES IN AGRARIAN STRUCTURE
Since the introduction of the green revolution technology, the agrarian structure of Punjab has witnessed interesting changes. In the first phase covering upto 1980-81, the number of marginal and small holdings declined sharply, while those in the higher-size categories showed a modest increase. These changes occurred primarily due to three reasons. First, with the onset of the green revolution technology, crop production activities became economically attractive, which created an active land-market for

leasing and selling land. Secondly, progress of agriculture under the green revolution technology created additional employment opportunities in the non-farm sector. These encouraged many marginal farmers either to sell their land or lease it, to earn higher incomes from non-farming jobs. Finally, the new technology turned out to be more attractive to the large farmers, mainly because the mechanical inputs associated with it were indivisible, and thus uneconomic for use in smaller-size farms.
Table 1_______ Some Selected Indicators cf Growth of Punjab Agriculture
Indicator 1970-71
1980-81
1990-91
1999-2000'P>
2000-
01 (p)
Wheat production (MT) 5.1 7.7 11.7 15.9 15.5Wheat yield (kg./ha.) 2238 2730 3715 4696 4563Rice production (MT) 0.7 3.2 6.7 8.7 9.2Rice yield (kg./ha.) 1765 2733 3229 3347 3506Total foodgrains (MT) 7.3 11.9 20.0 25.2 25.3Total foodgrains yield (kg./ha.) 1860 2456 3391 4032 4033All commodities production index (triennium ended 1969-70=100)
109.76 170.23 269.55 321.72 332.59
Cropped area irrigated (%) 71 81 94 94 94Nutrient (NPK) use (kg./ha.) 38 113 163 184 179Total tube wells (^000) 192 600 800 925 935Total tractors ('000) 30 119 265 365Gross cropped area (m./ha) 5.7 6.8 7.5 7.8 7.9Net cropped area sown (m./ha) 4.0 4.2 4.2 4.2 4.3Cropping intensity (%) 140 161 178 185 186Total cultivators (’000) 1665 1767 1917Total agricultural labourers (^000) 787 1105 1452Share in total main workers {%] 20.11 22.83 23.82
Source: Statistical Abstracts, Punjab, various issues.Note : (P) - Indicates provisional estimates
In the second phase beginning from 1980-81, when profitability in farming started falling and growth of employment opportunities in the non-farm sector became limited, the absolute number of holdings in the state increased, even with a significant decline in the total operated area. Consequently, the average holding size in the state fell sharply from 4.07 hectare in 1980-81 to 3.61 hectare in 1990-91 (Table2). All except the small farmers registered a decline in average land-holding size. The number of marginal farmers increased steeply from 1,97,000 in 1980-81 to 2,96,000 in 1990-91 (an increase of more than 50%), while their operating land base, during the same period, increased from a total of 1,26,000 hectare to around 1,64,000 hectare (i.e., an increase of about 30%). Small farms too increased but marginally, with more than a proportionate increase in their total operated area, primarily due to progressive subdivision of medium and large farms under the law of inheritance.

Table 2Comparative Statement of Operational Holdings in Punjab
1980-81 1990-91 1995-96Sizeclass
No. of holdings
(OOP)
Areaoperated
(OOP)
Area size of
holding
No. of holdings
(PPP)
Areaoperational
(PPP)
Area size of
holding
Sizeclass
No. of holdings
(PPP)
Areaoperated
(PPP)Marginal (< 1ra)
197(19.22)
126(3.P2)
P.64 296(26.5P)
164(4.P7)
P.55 2P4(18.66)
122■..(2.941
P.6P
Small (1-2 ra)
199(19.41)
291(6.98)
1.46 2P4(18.26)
328 1.61 183(16.74)
24P15:7
1.31
Medium (2-4 ra)
287(28.PP)
841(2P.16)
2.93 289(25.87)
841(2P.86)
2.91 32P(29.28)
833(2P.P8)
2.6P
Large (4-1P ra)
269(26.25)
1672(4P.P9)
6.22 261 (23.37)
1622(4P.23)
6.21 306(28.P0)
1754(42.3P)
5.73
Extra Large (> 1Pra)
73(712)
1241(29.75)
17.PP 67(6.PP)
1P77(26.71)
16.07 8P(7.32)
1198(28.89)
14.98
Total 1P25(1PP.PP)
4171 (1PP.PP)
4.07 1117 (10P.PP)
4032 (1PP.0P)
3.61 1P93(1PP.PP)
4147(1PP.PP)
3.79
Source;
Note:
Statistical Abstracts, Punjab, various issues.1995-96 data are obtained from Department of Agriculture, Punjab Government Number in parenthesis is percentage to the total
These negative developments in Punjab agriculture appear to have been slightly arrested now. Data from the 1995-96-agriculture census indicated that the average holding size in the state had improved to nearly 3.80 hectare, though it still remained considerably below the level attained in 1980-81. However, except marginal and small farms, all other categories of farms have considerably increased. As a result, the average operating land base for all categories of farms has declined, except for the marginal ones. Apparently, the serious unemployment situation in the state has had a telling effect on its agrarian structure.
More recent changes in the structure of ownership and operational distribution of landholdings, apart from the land-lease market, etc., has been reported in a PALI study published in 2001*. It reveals:
• Farmers with small and medium-size holdings leased in more area to make gainful use of their farm resources.
• The employment of adult male members of farming families in off-farm jobs were on the increase, with 1.37 per cent supplementing their income through off-farm labour, 3.98 per cent in other business, 13 per cent by service in public and private enterprises and 20 per cent in other occupations.
• The modal land rent worked out to Rs. 17,500 per hectare. The lease contracts were mainly verbal, in cash and for one year. The land-lease market did not conform to the provisions of existing legislation, but it was observed to be working more or less to the satisfaction of both leasers and leasees.
• Land sale was more by the small and marginal farmers, mostly because of distress due to their inability to support their farms.
• The average price of land increased from Rs. 41,675 per hectare in 1985 to Rs. 3,04,775 per hectare in 1999. When deflated with the price index, the price of land was still increasing, showing thereby that the land market has been inflationary.
• The practice of mortgaging land among farmers is on the decline. Only about one per cent of the total operational area was under mortgage.
Joginder Singh, “Changing Structure of Land Market in Agrarian State of Indian Punjab”, Productivity, 2001, National Productivity Council, New Delhi.

The distribution of land in three sub-regions of the state revealed that during 1991, the average size of holdings in the sub-mountain region was 2.53 hectare, 3.70 hectare in the central region and 3.79 hectare in the southwest region (Table 3). The size-class distribution of holdings in various districts revealed that concentration of small and marginal farmers was the highest in the sub-mountain region, while concentration of large and medium farmers was the highest in the southwest region. Central districts were at the top in concentration of semi-medium holdings.
Table 3District-wise Trends in Number and Size of Operational Holdings in Punjab,
1971-1991Region/District Total holdings (’000) Average size (Ha)
1971 1981 1991 1971 1981 1991Sub-Mountain RegionRupnagar 65 49 54 1.84 2.61 2.09Hoshiarpur 148 94 98 1.65 2.69 2.64Gurdaspur 123 100 113 2.11 2.60 2.64Sub-total 336 243 265 1.85 2.63 2.53Central regionPatiala 84 79 96 4.63 4.95 4.05Ludhiana 91 74 83 3.46 4.44 3.91Jalandhar 116 75 86 2.44 3.99 3.41Kapurthala 53 35 39 2.49 4.19 3.63Amritsar 187 115 124 2.08 3.64 3.52Sub-total 531 378 428 2.84 4.19 3.70South West region
1 Sangrur 108 90 102 4.16^ 5.13 4.49Bhatinda 107 91 102 4.79 5.53 4.80Faridkot 136 114 107 3.67 4.60 4.83Ferozepur 158 111 112 2.94 4.46 4.51Subtotal 508 406 424 3.78 4.89 4.66
1 Punjab 1375 1027 1117 2.95 4.10 3.79Source: Statistica Abstract of Punjab, various Issues
The present state of agrarian structure points to the fact that marginal and small-size farming, though the largest in numbers, are fast becoming unviable. With increasing pressure on land for more production per-unit area through adoption of modern technologies and use of capital inputs, marginal and small farmers are unable to keep pace with the rapid technological advances in crop production. The scarcity of employment opportunities in the non-farm sector and increasing indebtedness due to increase in cost of inputs, have made the survival of small and marginal farmers difficult. With growing market demand for quality produce, suitable technical and credit support needs to be given to marginal and small farmers, to upgrade their skills for the production of quality goods. Given the preponderance of a large number of marginal and small farms in the state, the strategy for agricultural production should give more attention to meet their specific requirements. Extension services should re-orient the target approach so as to cater to the ever increasing numbers of marginal and small farmers. Besides, appropriate policies have to be designed to generate more off-farm employment opportunities.

PROBLEMS OF CONCENTRATION IN CROP PRODUCTION PATTERN
Wheat-rice rotation implications: The strategy for increasing agricultural production followed in Punjab was based on putting large cultivated areas under wheat and rice; use of high yielding seeds, water and fertilizers: and efforts to improve input-use efficiency for reducing the cost of production. The centre encouraged to pursue this strategy, to enhance foodgrains production, particularly wheat and rice, for meeting the emergent food situation in the country, especially during the seventies and eighties. Consequently, the production of foodgrains in Punjab rose more than seven times, from 3.16 million tonne in 1964-65 to 25.30 million tonne in 2000-01. Besides, high yielding seed varieties, consolidation of land-holdings, expansion of irrigation facilities especially lifting the ground water through tube wells and pump sets, higher use of chemical fertilizers, farm mechanization, development of produce markets, power and road infrastructure, easy availability of credit, strong research and extension support, favourable inputs and output prices - all contributed to raising agriculture production significantly. However, over time, the wheat-rice rotation, now covering over 60 per cent gross of sown area, has created problems of serious consequences, some of which are;
• Both the crops are water-intensive, thus leading to large-scale depletion of groundwater in many areas.
• Both crops are heavy consumers of macro- and micro-nutrients, thus degrading the soil.
• The wheat-rice rotation adversely affects physical characteristics of the soil as, due to puddling for paddy, an impervious layer is formed in the soil, which does not allow root-penetration to deeper layers, thus restricting nutrient use.
• The wheat-rice rotation consumes heavy doses of fertilizers, pesticides and weedicides, which create ecological problems of environmental pollution, fauna and flora imbalances, and builds up residual toxicity in soil, water and air.
• The spread of monoculture of wheat and paddy has rendered these crops vulnerable to pest and weed attacks, thus making them more susceptible to pests and diseases.
The widespread practices of wheat and paddy crop rotation has caused considerable harm to the natural reserves and need to be altered quickly, lest the damages become irreversible.
Changes in cropping pattern: The green revolution brought significant changes in the cropping pattern of Punjab. In 1970-71, about 41 per cent of the gross cropped area was under wheat, which increased to nearly 44 per cent in 1990-91, and hovered around 42- 43 per cent thereafter. Similarly rice, which occupied around 6.8 per cent of the gross cropped area in 1970-71, increased to over 25 percent in 1990-91, and then rose further to around 33 per cent in 2000-01. The increase in wheat cultivation has been at the cost of gram, rapeseed and mustard, while that of rice has been obtained by shifting the area from maize, groundnut and millets. Areas under legumes and forage crops too have declined considerably. Areas under such crops as sugarcane, sunflower, potato, etc., have not remained stable (Table 4). Area under cotton has been adversely affected due to inclement weather and pest attack. It is, however, encouraging to note that productivity of most crops have been increasing over the years except for bajra (Table 5).

Shift in Cropping Pat tern in Punjab (Area in’ 000 ha.)Crop 1970-71 1980-81 1990-91 ^ 1999-2000 2000-01Rice 390
(6.87)1183
(17.49)2015
(26.86)2604
(33.18)2612
(32.92)Maize 555
(9.77)304
(4.50)183
(2.44)163
(2.08)164
(2.07)Bajra & Jowar 212
(3.73)70
(1.03)12
(0.16)5
(0.06)6
(0.08)Groundnut 174
(3.06)83
(7.23)11
(0.15)5
(0.06)4
(0.05)Cotton (American) 212
(3.73)502
(7.42)637
(8.49)381
(4.86)358
(4.51)Sesamum 15
(0.26)17
(0.25)18
(0.24)145
(1.85)19
(0.24)Sugarcane 128
(2.25)71
(1.05)101
(1.35)108
(1.38)121
L (1-52J_Kharif pulses 33
(0.58)58
(0.86)73
(0.97)51
(0.65)42
(0.53)Wheat 2299
(40.49)2812
(41.58)3273
(43.63)3388
(43.18)3408
(42.95)Barley 57
(1.00)65
(0.96)37
(0.49)51
(0.65)32
(0.40)Gram 358
(6.30)258
(3.81)60
(0.80)6
(0.08)8
(0.10)Rapeseed & Mustard 103
(1.81)136
(2.01)69
_ i0 .9 ^56
(0.71)55
(0.69)Potato 17
(0.30)40
(0.59)23
(0.31)76.0
(1.00)64
(0.81)Other vegetable 23
(0.41)24
(0.36)31
(0.41)47
(0.60)46
(0.58)Fruits 50
(0.88)29
(0.43)69
(0.92)30
(0.38)34
(0.43)Net Sown Area 4053 4191 4218 4243 4264Total Cropped Area 5678 6763 7502 7847 7935Cropping Intensity 140 161 178 185 186
Source: Statistical Abstract, Punjal3, 1971, 198^ , 1991,2000 and 2001Note; Figures in parentheses indicate area under crops as percentage share to
total cropped area
Area under pulses has recorded a sharp decline. Gram, which used to be the most important pulse crop in the state during the sixties, declined from a level of nearly3,60,000 hectare in 1970-71 to less than 10,000 hectare in 2001. Yield of gram, which stagnated till 1990-91, has started improving, though it has not yet become attractive enough to arrest the decline in its area and production.

Table 5Yield (kg./ha.) o f Principa Crops In Punjab
Crop 1970-71 1980-81 1990-91 1999-2000Wheat 2238 2730 3715 4696Rice 1765 2733 3229 3347Maize 1555 1602 1786 2577Barley 1022 1640 2754 3521Gram 797 582 744 974Bajra 1176 1244 1107 703Sugarcane (Gur) 4117 5526 5941 6265Cotton (American) 399 329 481 337Cotton (Desi)* 338 241 285 352Rapeseed & Mustard 553 567 1003 1117Groundnut 970 1249 816 969
Source: Statistical Abstract, Punjab, 1971,1981,1991 and 2001.Note: * In term of lint
An examination of district-wise data reveals an interesting pattern in the variabilities in crop yield levels (Table 6). Crops, which have now become important in the state, such as wheat, rice, cotton and sugarcane, have generally lower inter-district variability in their respective crop yields than those, which have been marginalized, such as oilseeds, pulses, bajra and maize. For instance, wheat yield ranges from a low of 3,500 kg per hectare in Hoshiarpur district to a high of nearly 5,150 kg per hectare in Fatehgarh Sahib district. Similarly, rice yield varies from around 2,800 kg per hectare in Gurdaspur district to a high of nearly 3,700 kg per hectare in Fatehgarh Sahib district. In the cotton-growing districts, yield has been fluctuating in a narrow range around an average of 340 kg per hectare. However, the yield of oilseeds, cultivation of which has been marginalized in the state, has recorded wide variations, from as low as 738 kg per hectare in Gurdaspur district to as high as 1,388 kg per hectare in Fatehgarh Sahib. Yield level of pulses, bajra and maize crops, which have too been marginalized in the state, has recorded wide inter-district variations.
Table 6District-wise Productivity of Crops (1999-2000) (Kg per hectare)
Region/District Wheat Rice Cotton OilSeeds
SugarCane
Pulses Bajra Maize
iVlajhaGurdaspur 4362 2831 - 738 68450 560 - 2042Amritsar 4885 3108 274 932 65870 3 3 8 i 703J 2407DoabaKapurthala 4710 3489 - 1190 55040 500 - 3357Jalandhar 4925 3487 - 1326 58720 625 - 2949Nawanshar 4597 3481 - 1216 58060 667 703 2550Hoshiarpur 3591 2920 - 1030 62010 600 - 2680MalwaRopar 4022 3112 - 909 54540 592 - 2426Ludhiana 5064 3611 - 1250 70510 716 - 3122Firozepur 4648 3509 335 1103 70630 649 703 -
Faridkot 4662 3388 353 1090 60740 425 - -
Muktsar 4725 3208 344 898 66360 658 703 2577Moga 4928 3355 280 1187 - 655 703 -
Bathinda 4614 3453 302 1051 - 617 572 -
Mansa 4582 3202 374 1000 66560 765 719 -
Sangrur 4828 3562 346 1050 69720 695 753 2577Patiala 4800 3248 - 1120 59840 706 - 3050Fatehgarh Sahib 5148 3679 - 1388 62380 1060 - 2759Punjab 4696 3347 337 1065 62650 665 703 2577
Source: Statistical Abstract. Punjab. 2001

While the state has attained high yields in some important crops, considerable scope exists for improving crop yields by furthering full use of technology available, within and outside the country. For instance, wheat yield in Punjab is 4,332 kg per hectare whereas it is 8,031 kg per hectare in Ireland (Table 7). Similarly, Punjab produces rice with the yield level at 3,152 kg per hectare whereas Australia has an yield of 10,269 kg per hectare. Sugarcane yield in Punjab is 59.5 tonne per hectare while in Switzerland it is 136.5 tonne per hectare. Again among fruits, for example, while the yield of citrus in Israel is now over 5,407 kg per hectare, it is only around 180 in Punjab. Efforts should be made to improve the yield per unit-area through exploitation of genetic potential via biotechnological tools and intensive research and development. For accelerating the productivity of different crops, advances made by different countries should be utilized to obtain scientific and technological knowhow for adaptation to suit our conditions.
Table 7
Crop Yield in Punjab
Yield in India Highest Yield in India
Highest Yield in World
Wheat 4332 2583 — 8767 IrelandRice 3152 1928 2443 (Tamil 7539 Ukaraine
Nadu)Maize 2286 1755 3328 (A.P) 9401 Chile
I Pulses 788 620 830 (U.P) 5368 FranceOilseeds - 774 1210 1630 (Tamil 6302 IsraelGroundnut Nadu)Sun flower 1718 602 — 2794 SwitzerlandSugarcane 59520 72560 110156 (Tamil 118706 Peru
Nadu)Citrus 180 N.A ~ 5407 IsraelFruitsa) Kinnow 10000 N.A N.A 65000 Israelb) Orange 15000 N.A N.A 43000 Israelc) Mango 7000 N.A N.A 17000 Israel*d) Lemon 5000 N.A N.A 50000 Israel*e) Plum 4000^ N.A N.A 10000 Israel*Vegetablesa) Potato 17000 17886 22629 (U.P) 49000 Belgiumb) Tomato 24000 15068 N.A 466667 Netherlandsc) Cauliflower 24000 15000 N.A 50000 Armeniad) Onion 19330 10106 N.A 81504 Korea
Source:
Note:
Directorate of Horticulture, Government of Punjab Directorate of Agriculture, Government of Punjab FAO Bulletin of Statistics, 2002 (Vol.2^Israel Agriculture, Govt, of Israel, 1986 These figures pertain to 1996
Monoculture: The wheat crop has, from the very beginning, dominated the cropping pattern of the state and its importance has steadily increased. The area and productivity of wheat made a substantial jump during the mid-sixties when new dwarf varieties were introduced. In 1960-61, 29 per cent of the gross sown area of the state was under wheat, which increased to 40.5 per cent in 1970-71 and then to 43 per cent in around 2000 - 01 .
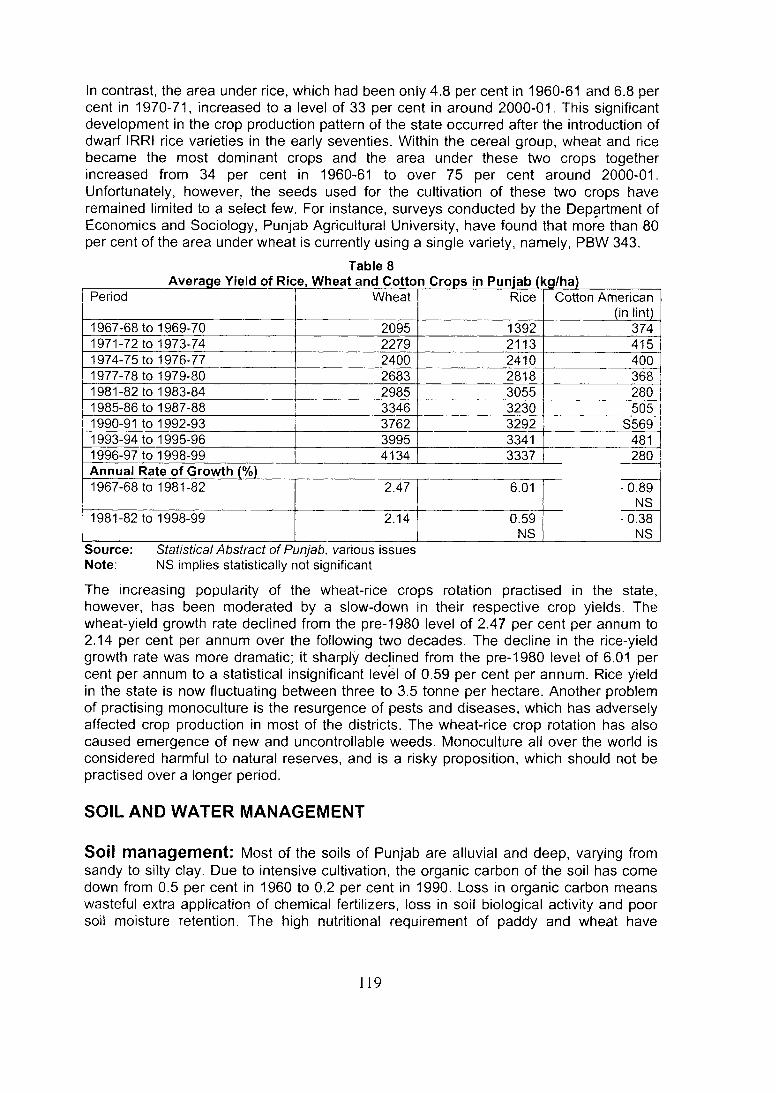
In contrast, the area under rice, which had been only 4.8 per cent in 1960-61 and 6.8 per cent in 1970-71, increased to a level of 33 per cent in around 2000-01. This significant development in the crop production pattern of the state occurred after the introduction of dwarf IRRI rice varieties in the early seventies. Within the cereal group, wheat and rice became the most dominant crops and the area under these two crops together increased from 34 per cent in 1960-61 to over 75 per cent around 2000-01. Unfortunately, however, the seeds used for the cultivation of these two crops have remained limited to a select few. For instance, surveys conducted by the Department of Economics and Sociology, Punjab Agricultural University, have found that more than 80 per cent of the area under wneat is currently using a single variety, namely, PBW 343.
Table 8____________ Average Yield of Rice, Wheat and Cotton Crops in Punjab (kg/ha)__________
Period Wheat Rice Cotton American ________ (in lint)
1967-68 to 1969-70 2095 1392 3741971-72 to 1973-74 2279 2113 4151974-75 to 1976-77 2400 2410 4001977-78 to 1979-80 2683 2818 3681981-82 to 1983-84 2985 3055 2801985-86 to 1987-88 3346 3230 505
! 1990-91 to 1992-93 3762 3292 S5691993-94 to 1995-96 3995 3341 4811996-97 to 1998-99 4134 3337 280Annual Rate of Growth (%)1967-68 to 1981-82
1981-82 to 1998-99
2.47
2.14
6.01
0.59NS
-0.89NS
-0.38NS
Source; Statistical Abstract of Punjab, various issuesNote; NS implies statistically not significant
The increasing popularity of the wheat-rice crops rotation practised in the state, however, has been moderated by a slow-down in their respective crop yields. The wheat-yield growth rate declined from the pre-1980 level of 2.47 per cent per annum to 2.14 per cent per annum over the following two decades. The decline in the rice-yield growth rate was more dramatic; it sharply declined from the pre-1980 level of 6.01 per cent per annum to a statistical insignificant level of 0.59 per cent per annum. Rice yield in the state is now fluctuating between three to 3.5 tonne per hectare. Another problem of practising monoculture is the resurgence of pests and diseases, which has adversely affected crop production in most of the districts. The wheat-rice crop rotation has also caused emergence of new and uncontrollable weeds. Monoculture all over the world is considered harmful to natural reserves, and is a risky proposition, which should not be practised over a longer period.
SOIL AND WATER MANAGEMENT
Soil management: Most of the soils of Punjab are alluvial and deep, varying from sandy to silty clay. Due to intensive cultivation, the organic carbon of the soil has come down from 0.5 per cent in 1960 to 0.2 per cent in 1990. Loss in organic carbon means wasteful extra application of chemical fertilizers, loss in soil biological activity and poor soil moisture retention. The high nutritional requirement of paddy and wheat have

exhausted the soils of vital nutrients. Thus, higher and higher doses of major nutrients, especially nitrogen, has to be applied for sustaining adequate production levels. Micronutrient deficiencies in large areas have also been noticed adversely affecting crop yield. The following are some of the important soil related problems that are adversely affecting agricultural production in Punjab:
• Physical: Surface crusts; sub-soil compaction; soil erosion; poor air-water relationship; development of hard pan; development of fine textured sodic soils.
• Hydrologic: Shallow water table; negative water balance; water logging; flood hazards; free percolation in coarse soils and poor permeability in fine textured soils.
• Chemical: Depletion of organic matter; multi-nutrient deficiencies; nutrient imbalance; salinity/sodicity and pollution from agro-chemicals, sewerage and industrial effluent.
• Biological: Decline in quality and quantity of soil biomass; low-biological oxidation and slow rate of decomposition of crop residues.
Punjab has about 4.2 million hectare of land area under cultivation. In addition, another two million hectare of degraded land is available (Table 9). Part of this degraded land can be recovered for cultivation provided adequate research is undertaken for its reclamation. On the other hand, it is more important to preserve existing cultivated areas from degradation due to water logging, soil salinity and sodicity, besides soil erosion due to intensive cropping and its attended manifestations. Repeated paddy cultivation in the long run will make the soils fine textured, impervious and unfit for cultivation. Corrective measures through intensive R & D have to be undertaken to conserve soil resources. Speedy soil-testing facilities, followed by appropriate advice about fertilizers use, can effectively help save the soils from exhaustion.
Table 9
Waste-land/soil degradation Area (lakh ha)
Water erosion(i) Severe (gullies, ravenous)(ii) Slight & moderate (with/without scrubs)
1.703.40
Water-logged— rising water table 1.22Marshy-submerged 2.28Salt-affected (varying degrees of deterioration)(i) Canal command areas(ii) Outside canal command areas
3.931.27
Degraded forest/pasture lands 2.00Coarse/very light textured (loss of nutrients with deep percolation and leaching, poor in fertility)
6.20
Source: Director, Punjab Remote Sensing Centre, Ludhiana
W ater m anagem ent; Punjab has an irrigation distribution network of 1,45,000 kilometres of canals including branch canals and minor distributaries, and one lakh kilometres of field channels or water courses. The canal irrigation system irrigated12,92,000 hectare land in 1970-71 while only 10,02,000 hectare was irrigated in 2000-01 (Table 10). There has been a significant reduction in canal irrigated area since 1990-91. At present only around 40 per cent of the water that enters the canal system irrigates the crops, whereas the optimum efficiency should be above 60 per cent. Management of the canal irrigation system needs revamping, so that the water thus saved can be used for the remaining unirrigated areas of the state.

Table 10Net Irrigated Area ( 000 ha.) by Different Sources in Punjab
Source 1970-71 1980-81 1990-91 1999-2000 2000-2001Canals 1292 1430 1669 1051 1002Tube wells 1591 1939 2233 2938 3017Other sources 13 12Total 2888 3382 3909 4001 4021Share of area irrigated to the gross area sown (%) 71 81 93 94 94
Source: Statistical Abstract, Punjab 1971, 1981, 1991, 2000 and 2001Note: * - Indicates provisional estimates
There are 9,35,000 tube wells to lift underground water for irrigation. The total demand for irrigation water in the state is estimated at 4.381 million hectare metres (mhm) against a total supply of 3.130 mhm from both canal and ground-water resources,leaving a net deficit of 1.251 mhm (Sondhi and Khepar, 1995). The deficit is met fromover-exploitation of groundwater reserves through tube wells. In many areas, excessive exploitation has pushed the groundwater table below the critical depth of 10 metres.
Irrigation coverage, which was around 71 per cent of the total cropped area in 1970-71, increased to 94 per cent in 2000-01. While canal irrigation has been declining over the years, tube well irrigation, particularly in the central and northern region of Punjab has been on the increase. Over six per cent of the total tube wells in India are in Punjab. Deep tube wells are being used even in the southern region, where the underground water is brackish.
Due to cheap credit and free supply of electricity, the use of tube wells for irrigation has increased steeply in the state. The number of electrically operated tube wells has increased from 6.0 lakh in 1990-91 to 7.7 lakh in 1999-2000. Extensive use of canal irngation and reckless use of groundwater through tube wells have caused water logging problems in some areas and lowering of the ground-water table in other areas. The water table in the central districts of Punjab has been going down at an average rate of0.23 metres per year (Table 11). It is estimated that in the next 15 years about two lakh submersible pumps would be needed to replace the present pump sets, at an estimated cost of Rs. 2,000 crore, or an additional expenditure of Rs. 5,000 per hectare, in addition to a two-fold increase in energy consumption.
Table 11
District Fall in water table (m) Rise in water table (m)Blocks 1973-83 1984-94 Saline/ semi-saline
blocks1973-83 1984-94
Sub-mountainous ZoneGurdaspur Ail +0.2-0.6 -0.7-1.2 - - -
Ropar All +0.04 -1.8 - - -
Hoshiarpur All -0.9 -0.9 - - -
Central PlainsAmritsar All -0.9 -2.3 - - -
Kapurthala All -0.7 -1.8 - - -
Jalandhar All -1.5 -2.5 - - -
Ludhiana Ail -0.9 -1.9 - - -
Patiala Ail -1.7 -9.8 - -
Fatehgarh Sahib All -1.3 -2.7 - - -
Sangrur All -5.1 -5.1 - —
Southwest ZoneMansa AIM -1.6 -1.4 ~ - -
Bathinda 0.5 +3.5 -1.9 0,5 7.3 4.2Faridkot 0.5 -1.15 -4.5 0.33 9.0 5.0Ferozepur 0.75 +0.1 -4.5 0.25 7.7 3.0
Source: Directorate of Water Resources, Punjab.

Currently, 90 blocks out of a total of 118 show a decline in water-table depth ranging from zero to three metres (24% area), three to five metres (23% area) and above five metres (29% area). According to a PAU estimate, there is over-exploitation of more than 100 per cent of annual net recharge of water in 63 blocks, whereas in seven blocks it is above 85 per cent. Out of the remaining 38 blocks, 15 fall in the grey category with 65- 85 per cent of net annual recharge to groundwater, thus leaving only 23 blocks in the white category (Table 12). This over-exploitation of underground water is due to increase in the number of tube wells, free supply of electricity, cultivation of such high waterconsuming crops paddy, potato, wheat, sugarcane, etc., and scant attention to efficiency in water use. Extensive research is needed to work out methods for optimum water-use efficiency for different crops in different regions. Time has come to use increasingly rainwater harvesting technologies for conserving water and for recharging the underground water, both in rural and urban areas.
Table 12Distribution of Blocks into Dark, Grey and White on Basis of Underground Water
___________________________ Resources in Punjab, 1994___________________________District Dark Grey White
Total Technicallyexploitable
Gurdaspur 1HoshiarpurRoparSub-mountainous Zone 15Amritsar 12KapurthalaJalandhar 12LudhianaPatialaSangrur 10Central Plains 55MansaBathindaFaridkotFerozepurSouthwest Zone 8 18
Source: Directorate of Water Resources, Punjab, Chandigarh.
Watershed management: Soil erosion is rampant in the sub-mountain kandi region of the Shivalik range, due to excessive water-flow during the rainy season and absence of water for irrigation in the rest of the year. Water management is necessary in this area. A watershed development project was initiated in 1990 with the assistance of the World Bank in this region. Vegetative barriers and vegetative reinforcements have been established in 6,274 hectares, as a result of the development of watershed contours and rain-water conservation has been made possible for irrigating over 5,000 hectare of land. Watershed management has helped improve crop yield. Cropping intensity too has increased to 165. In the project area successful cultivation of crops, forests and grasses has become possible, while in non-project areas conditions continue to be favourable for growing crops. Participation of the local people and government agencies have demonstrated that infertile and degraded areas can be conveniently converted into fertile and cultivable areas with collective effort and effective use of technology. Extension of watershed management programmes in the remaining areas is necessary for increasing crop productivity. Besides, watersheds can meet the growing demand for irrigation in lean periods.
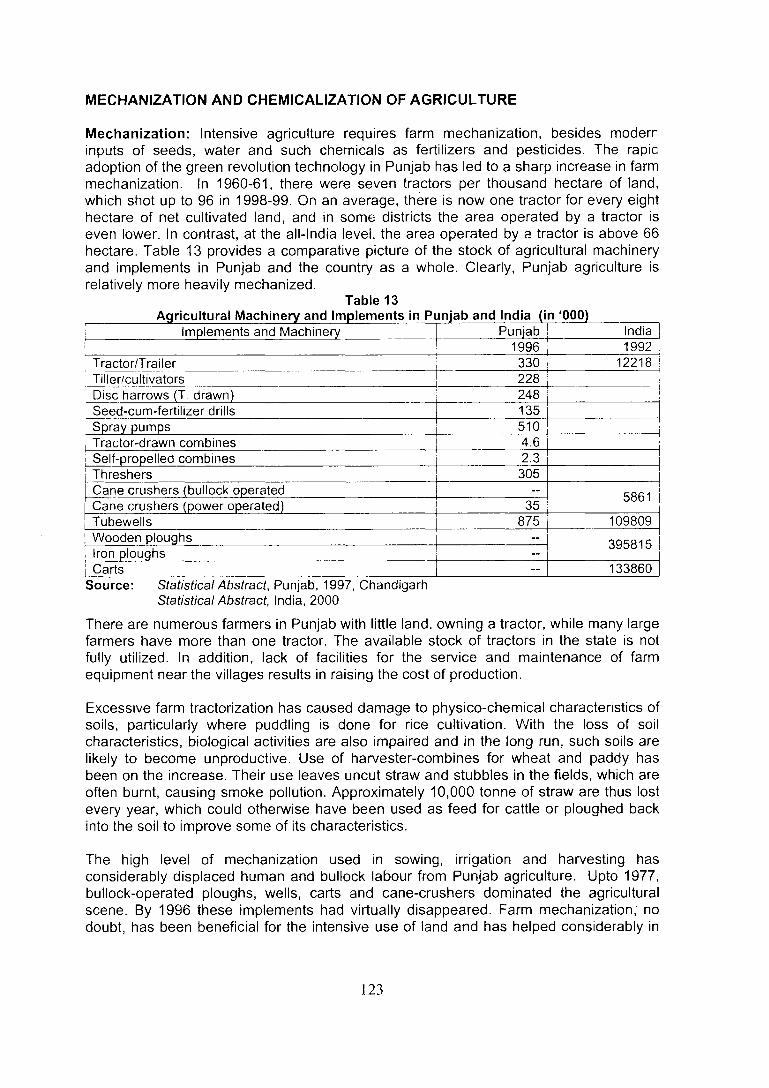
MECHANIZATION AND CHEMICALIZATION OF AGRICULTURE
Mechanization; Intensive agriculture requires farm mechanization, besides moderr inputs of seeds, water and such chemicals as fertilizers and pesticides. The rapid adoption of the green revolution technology in Punjab has led to a sharp increase in farm mechanization. In 1960-61, there were seven tractors per thousand hectare of land, which shot up to 96 in 1998-99. On an average, there is now one tractor for every eight hectare of net cultivated land, and in some districts the area operated by a tractor is even lower. In contrast, at the all-India level, the area operated by a tractor is above 66 hectare. Table 13 provides a comparative picture of the stock of agricultural machinery and implements in Punjab and the country as a whole. Clearly, Punjab agriculture is relatively more heavily mechanized.
Table 13
i Implements and Machinery Punjab India 11 ! 1996 1992
Tractor/Trailer 330 12218 !T iller/cultivators 228 1Disc harrows (T. drawn) 248Seed-cum -fertilizer dhlls 135Spray pumps 510 1Tractor-drawn combines 4.6Self-propelled combines 2.3Threshers 305Cane crushers (bullock operated -
5861Cane crushers (power operated) 1 35Tubewells 1 875 109809W ooden ploughs ~
395815Iron ploughs —
Carts - 133860Source; Statistical Abstract, Punjab, 1997, Chandigarh
Statistical Abstract, India, 2000
There are numerous farmers in Punjab with little land, owning a tractor, while many large farmers have more than one tractor. The available stock of tractors in the state is not fully utilized. In addition, lack of facilities for the service and maintenance of farm equipment near the villages results in raising the cost of production.
Excessive farm tractorization has caused damage to physico-chemical characteristics of soils, particularly where puddling is done for rice cultivation. With the loss of soil characteristics, biological activities are also impaired and in the long run, such soils are likely to become unproductive. Use of harvester-combines for wheat and paddy has been on the increase. Their use leaves uncut straw and stubbles in the fields, which are often burnt, causing smoke pollution. Approximately 10,000 tonne of straw are thus lost every year, which could otherwise have been used as feed for cattle or ploughed back into the soil to improve some of its characteristics.
The high level of mechanization used in sowing, irrigation and harvesting has considerably displaced human and bullock labour from Punjab agriculture. Upto 1977, bullock-operated ploughs, wells, carts and cane-crushers dominated the agricultural scene. By 1996 these implements had virtually disappeared. Farm mechanization, no doubt, has been beneficial for the intensive use of land and has helped considerably in

overcoming the risk of unfavourable effects of weather on maturing crops. In turn, there has been a decline in the use of agricultural labour, which has created serious social and economic problems, as alternative avenues for employment of displaced labour are few. The level of efficiency of farm implements, in terms of time and energy-consumption, needs to be improved through extensive research. Besides, there is also need to develop more innovative and inexpensive instruments, which could be used as time- saving devices and also for additional operations of cleaning, grading, packing, etc.
Chemicalization: Extensive use of agro-chemicals became an important component for increase in crop production during the initial years of the green revolution, and their use has since continued to increase. Among the agro-chemicals, chemical fertilizers dominate the scene, followed by pesticides including weedicides. Punjab has the highest consumption of chemical fertilizer per hectare in the country. It consumed 167 kg of chemical fertilizers per hectare during 1997-98 as compared to the all-India average of 74 kg. Growth of chemical fertilizers consumption was the highest during 1970-71 to 1980-81, with the consumption of all types of chemical fertilizers (NPK) increasing by 250 per cent. By 1998-99 it declined to 80 per cent (Table 14). While productivity of crops increased during the first two decades, on account of increasing nutrient-use efficiency, it began to decline thereafter on account of imbalances in the use of N, P and K, along with the deficiencies of micro-nutrients. The fertility level of 67 per cent blocks in the state was reported to be low in N, while in the remaining 33 percent, it was medium {Table 15). Further, micro-nutrient deficiency of zinc, iron and magnesium has become pronounced in several areas of the state. Deficiency of sulphur and copper too has been reported from several areas. To enhance fertilizer-use efficiency under different cropping systems, continuous technological inputs are needed to make them cost-effective. Integrated use of balanced chemical fertilizers in conjunction with organic manures (compost and green manure), rotation of cereals with legumes and use of bio-fertilizers and vermiculture have to be undertaken to maintain the health of the soil.
Table 14
Year Nitrogenous(N)
Phosphates(P20s^
Potassic(K2O)
Total NPK
1970-71 175 31 7 2131980-81 526 207 29 7621990-91 877 328 15 12201998-99 1081 275 19 1375
Source: Statistical Abstract of Punjab, 1999
Table 15Per cent Distribution of Blocks According to Fertility Status
Fertility Status 1970-77 981-90N P K N P K
Low 52 16 13 67 44 —
Medium 48 65 58 33 55 43High - 19 29 - 1 1 57Source: Brar and Chhi bba, 1994, Brar, 1979
Use of pesticides including weedicides has also contributed to increasing crop production. Currently, about one kg technical grade pesticides per hectare is being used in wheat, paddy, cotton, sugarcane, fruits and vegetables cultivation in Punjab against the all-India average of 350 gm per hectare. The spectrum of use of pesticides has been

changing over the years in response to emerging pests- and weed-problems due to intensive cultivation.
Excessive and indiscriminate use of pesticides and weedicides has led to several new problems, such as development of pest resistance, pest resurgence and outbreaks, and adverse effects on such non-target organisms as predators, pollinators and honey bees. Development of resistance in the American boll worm, because of abuse and misuse of pesticides, accounts for the inability to control cotton pests in Bathinda district. (See the CRRID report on Problems of Cotton Growers in Punjab). Even contingency strategies have failed to cope with the situation causing enormous losses to cotton growers during the last five years. Similarly, abuse and misuse of pesticides is rampant on fruit and vegetable crops, which pose great health hazards to consumers.
The strategy for effective management of pests- and weed-problem lies in the use of integrated pest management technology (IPM), wherein agronomic practices, intercropping and forecasting of pests and diseases are essential components, besides use of pesticides. Unfortunately, IPM technology for important crops has not reached the farmers, due to lack of effective extension efforts. On the other hand, the pesticides available in the market, particularly at the village level, are usually unbranded, often adulterated or date-expired, and the advice on how to use pesticides is given by relatively ignorant pesticide sellers or commission agents. This inadequacy in the use of pesticides is not only wasteful but also dangerous, as it contributes heavily to the pollution of air, water and soil, in addition to health hazards. Appropriate information has to be made available to the stakeholders so that the ill effects of agro-chemicals are reduced. Suitable technologies should be developed to promote safe and efficient use of pesticides. Use of bio-pesticides should be encouraged so that health hazards are minimized.
The disquieting aspect of the excessive use of chemical fertilizers and pesticides is their adverse affects on the eco-system, as it causes soil pollution as well as undergroundwater pollution, plus changes in ecology of weed and soil organisms. Overuse of pesticides is becoming a threat to both human and cattle populations, besides disturbing the flora and fauna of the state. It is on account of these ill effects of agro-chemicals that the green lobby for growing and using organic foods is picking up in the West. Punjab, being agro-technically progressive, should venture into developing technologies for growing organic crops for domestic and international markets.
AGRICULTURAL CREDIT
Sources of institutional and non>institutional credit: Credit is an important enabling input, which has significantly contributed to the success of the green revolution in Punjab. The credit delivery mechanism, cost of credit, etc., are intimately linked with the sources of supply of credit to agriculturists. Formal credit institutions, such as cooperative societies, co-operative banks, land mortgage banks, regional rural banks and commercial banks are supposed to meet the credit requirements of most agriculturists in Punjab. The extent and spread of formal credit institutions in Punjab is given in Table16. Compared to other states, the spread of the co-operative credit network, as also of commercial and regional rural banks, is fairly well developed in Punjab. There are 50 bank branches per thousand square km in Punjab as compared to 20 for the whole country, 21 for Maharashtra, 18 for Andhra Pradesh and 19 for Gujarat.
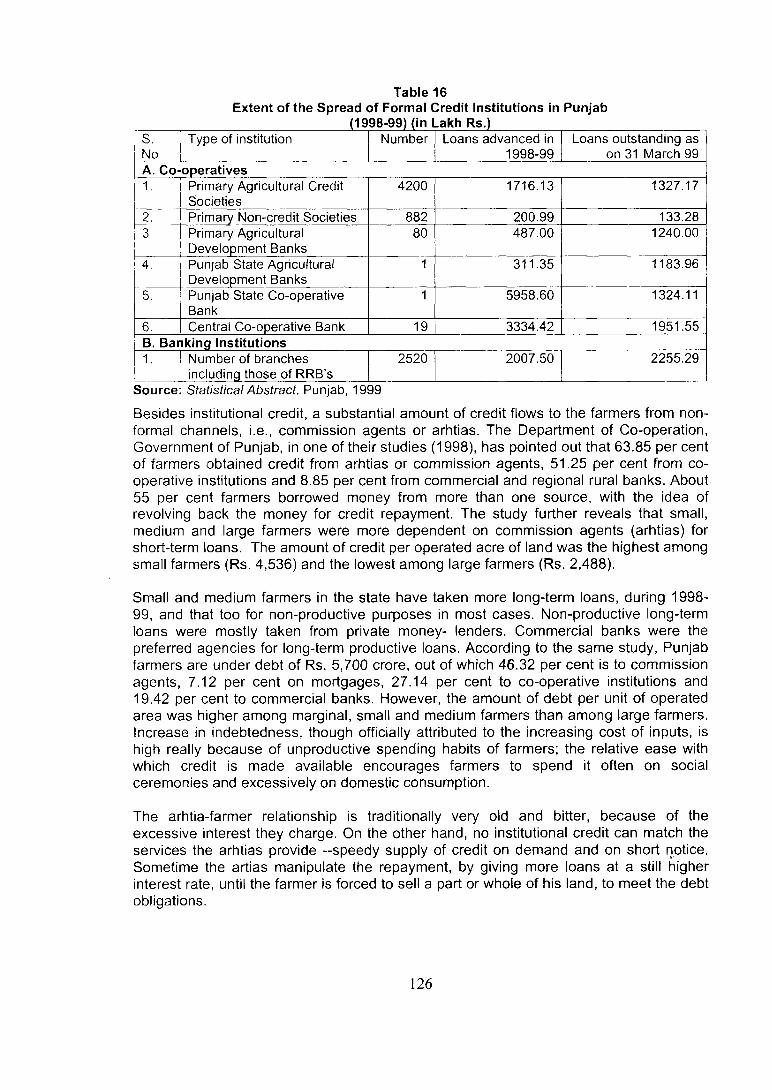
Table 16Extent o f the Spread of Formal Credit Institutions in Punjab
_________________ (1998-99) (in Lakh Rs.)________S.No
Type of institution Number Loans advanced in 1998-99
Loans outstanding as on 31 March 99
A. Co-operatives1. Primary Agricultural Credit
Societies4200 1716.13 1327.17
2 . Primary Non-credit Societies 882 200.99 133.283. Primary Agricultural
Development Banks80 487.00 1240.00
4. Punjab State Agricultural Development Banks
311.35 1183.96
5. Punjab State Co-operative Bank
5958.60 1324.11
6. Central Co-operative Bank 19 3334.42 1951.55B. Banking Institutions1. Number of branches
including those of RRB’s2520 2007.50 2255.29
Source: Statistical Abstract, Punjab, 1999
Besides institutional credit, a substantial annount of credit flows to the farmers fronn non- formal channels, i.e., commission agents or arhtias. The Department of Co-operation, Government of Punjab, in one of their studies (1998), has pointed out that 63.85 per cent of farmers obtained credit from arhtias or commission agents, 51.25 per cent from cooperative institutions and 8.85 per cent from commercial and regional rural banks. About 55 per cent farmers borrowed money from more than one source, with the idea of revolving back the money for credit repayment. The study further reveals that small, medium and large farmers were more dependent on commission agents (arhtias) for short-term loans. The amount of credit per operated acre of land was the highest among small farmers (Rs. 4,536) and the lowest among large farmers (Rs. 2,488).
Small and medium farmers in the state have taken more long-term loans, during 1998- 99, and that too for non-productive purposes in most cases. Non-productive long-term loans were mostly taken from private money- lenders. Commercial banks were the preferred agencies for long-term productive loans. According to the same study, Punjab farmers are under debt of Rs. 5,700 crore, out of which 46.32 per cent is to commission agents, 7.12 per cent on mortgages, 27.14 per cent to co-operative institutions and 19.42 per cent to commercial banks. However, the amount of debt per unit of operated area was higher among marginal, small and medium farmers than among large farmers. Increase in indebtedness, though officially attributed to the increasing cost of inputs, is high really because of unproductive spending habits of farmers; the relative ease with which credit is made available encourages farmers to spend it often on social ceremonies and excessively on domestic consumption.
The arhtia-farmer relationship is traditionally very old and bitter, because of the excessive interest they charge. On the other hand, no institutional credit can match the services the arhtias provide -speedy supply of credit on demand and on short riotice. Sometime the artias manipulate the repayment, by giving more loans at a still higher interest rate, until the farmer is forced to sell a part or whole of his land, to meet the debt obligations.

Incidentally, formal credit, though most welcome for increasing agricultural production, has some inbuilt shortcomings. Hassles in obtaining credit from formal institutions is consumer unfriendly as it is time consuming: demands documentation based on land records, which does not include leased or mortgaged lands; and there are credit limits for specific operations and crops. Inefficiencies of the credit institutions, delays and uncertainties due to lack of manpower, unco-operative attitude of the officials, commission for processing loan applications through agents, and political and administrative interference are the reasons for the arhtias being more popular with the farmers. The flourishing business of the arhtias often depends on the credit they themselves obtain from the banks against land for advancing the money to the bank shy farmers. (Those who do not want to disclose their identity). All efforts in the past to overcome the shortcomings of the credit institutions and reduce the influence of arhtias and commission agents have failed to yield the desired results. Nevertheless, with the increasing opening up of the rural economy, a system of direct linkages should be encouraged through face to face contact of the producers with the investors or marketing and processing agencies. The role of the corporate sector in such a venture needs full policy and governmental support in order to minimize the role of commission agents and arhtias.
Kisan credit cards: Keeping in view the limitations and inefficiencies of the formal credit system, and heavy dependence of farmers on arthias, the Central Government introduced a scheme of Kisan Credit Cards (KCC) in 1998-99. It aims at adequate and timely support from the banking system to farmers for their agricultural needs, particularly for crop production and short-term loans. The KCC has a provision of flexibility in withdrawing money at any time according to the farmer’s requirements, while the borrowing limit is fixed according to the net worth of the farmer, which is determined by district-level technical committees. The KCC scheme is like revolving cash credit and provides for any number of withdrawals and repayments within the limit. The number of KCCs in Punjab stood at 62,624 as in September 2000, with a sanctioned amount of Rs. 317.15 crore.
There was initial enthusiasm for over a year in obtaining the Kisan Credit Cards, but this has slowed down for various reasons. A farmer has to be literate and has to declare the total value of his assets before getting a credit card. He has several inhibitions about such disclosures. Only large farmers are taking advantage of KCC. The success of KCC would depend upon its wide acceptability and use by the small and medium farmers. This might be possible if the credit limit is linked only with the farmers’ property value and repayment is made easier and at a lower interest rate.
AGRICULTURAL RESEARCH AND EXTENSION
Punjab Agricultural University (PAU), Ludhiana, was established in 1962 on the pattern of Land Grant Institutions of the USA. The university did a commendable job in adapting Mexican wheat varieties suitable to North Indian conditions and subsequently improving their quality. Similarly, rice varieties developed by the International Rice Research Institute (IRRI), the Philippines, were quickly modified to suit Indian conditions, thereby getting a quantum jump in yield over the previous existing varieties. Along with this, research in other areas, such as plant protection, agronomy, soil sciences, agricultural economics, etc., helped develop a full package practices. All combined to usher in the green revolution during the late 1960s, which became a role model for the entire country.

The State Department of Agriculture also contributed its mite by disseminating the. findings of the university and arranging to produce the required seeds of high yielding varieties. Extension agencies of both the Agricultural University and the State Department of Agriculture reached the farming community with their packages, who, in turn quickly responded by adopting these for the production of wheat and paddy, which gave them good returns. Since then, PALI has been actively engaged in extending its teaching, research and extension activities, and bagged the award of the best Agricultural Research Institute from the Indian Council of Agricultural Research (ICAR) in 1995. The research activities of the State Department of Agriculture were transferred to PALI in 1962, while the extension work continued to remain with it*.
PAU has developed an excellent infrastructure for agricultural research in its five Acuities; Agriculture, Agriculture Engineering, Basic Sciences and Humanities, Home Sciences and Veterinary Sciences. The ICAR has established five Centres of Advanced Studies and Training in the PALI, namely, Farm Power and Machinery: Genetics and Plant Breeding: Soil Sciences: Veterinary Gynaecology and Reproduction: and Veterinary Surgery and Radiology. More than 5,000 committed research workers, academics and field extension workers are on the rolls of the university.
Despite all attributes, which make PALI a great Institution, its present activities are not very promising. The biggest problem is of inbreeding, with more than 85 per cent of the staff stagnating in their knowledge and its dissemination. More than 75 per cent of the faculty received their Ph.D. degrees from PAU and this proportion will reach 90 per cent by the end of 2006. Nearly 34 per cent of the present faculty will retire by 2006, whereas the number of direct recruits with degrees from other universities is relatively very small. There is very little participation of the faculty in international exchange programmes.
The State Department of Agriculture has 12 district-level farmers’ training centres (STCs) to impart training to the farmers and farm-women. These training centres were established in the early sixties. The existing 12 STCs also cater to the training needs of the newly carved five districts of the state. These are also instrumental in imparting training to the farmers and farm- women in day-to-day agricultural technological developments with regard to crop production and other allied occupations. For this purpose training camps of farmers at the district level were organized, where scientists of PAU educated on the progressive farmers and field staff of the department of agriculture about the latest scientific techniques for crop production and marketing. These were organized both in Kharif and Rabi seasons at all the district headquarters. Later, the staff of the department of agriculture have been organizing farmers' training camps at block and village levels. Every year about three lakhs farmers are trained on scientific crop production.
The details of the training programmes undertaken both during Kharif and Rabi every year by these training centres are given below:-
Sr. No. Name of Training Camp/Institutional No. of Camps/Courses
1. District level training camp 342. Block level training camps 2723. Specialized institutional courses for farmers and farm-women 3404. Institutional courses for conveners 2555. Production-cum-demonstration camps 17006. Demotisttation camps for farm-women 170

training programmes or even international conferences and symposia. Lack of funds is said to be the reason for the neglect of this important training and skill upgradation activity. PAL) is also saddled with problems of imbalance in staffing and declining quality of education. Staff deployment is unrelated to the importance and prioritization of programmes. PAD is ridden with inadequacies not only of research strategy and extension but also of basic maintenance, because of an unhealthy fiscal situation. Around 85 to 90 per cent of the total budget of PAD is spent on salaries alone.
Research and information hold the key to bringing about major breakthroughs in agricultural and livestock production. At present PAU’s means of assessing, storing and retrieving information are very primitive. While Punjab agriculture needs a turn-around in its effort to meet global challenges, PAD is lagging behind and is unable to provide any leadership, for which it was once known as the premier institution at the time of the green revolution.
Extension activity, involving transfer of technology, had once been the most important work of the university. It used to provide a live and intimate link between scientists on the one hand and the field- level functionaries of different state departments, other development agencies and farmers on the other. The three services provided by the extension directorate have been: farm advisory service; farm communication service; and farm training programmes. Besides T & V programmes, these have been very successful and have attracted large numbers of farmers to the Campus Kisan Melas, held at the university and at district headquarters and Regional Research Stations. Currently, the extension activities of the university have considerably slackened and farmers are losing faith in these, as answers to their problems are not forthcoming.
PALI is equipped to meet effectively the challenges of agricultural research posed today by liberalization, privatization and globalization trends, as it has the necessary infrastructure and skills. However, there is need for focused prioritization in research and development strategies, as was the case at the time of the green revolution. Emerging challenges demand that the university should take a fresh look at all its resources, policies and programmes, in order to make a shift to a progressive, sustainable and long-lasting framework of activities. This requires not only adequate funding but also basic improvement in the quality of manpower. It will be necessary to develop a strategic partnership with the corporate sector and with other research institutions both in India and abroad, so as to make a shift from adaptive to original research. For this, excellence in teaching programmes through modern courses and well-equipped laboratories are a must. The disjointed projects for research have to make way for a systems approach to agricultural research. The green revolution made a quantum jump in the yield of wheat and paddy, but such increases in the yield of other crops were neither aimed at nor any breakthrough achieved. A complete range of packages, including technologies for efficient land- and water-management, agronomic practices like 1PM, INMS, development of bio-fertilizers and bio-pesticides, etc., and post-harvest storage and marketing techniques and systems have to be developed. Such research, which cuts across different disciplines, requires a significant shift from the existing commodity- approach to an integrated and precision-programme mode, which may entail a matrix management system.
A sustainable demand-driven and cost-effective production system with integrated natural resources management has to be introduced keeping particularly in view the marginal and small farming system, which has become dominant in the state. Such an

approach should aim to increase productivity, decrease cost of inputs, increase efficiency or management systems, leading thereby to increase in profits from agriculture. The future of agriculture lies in a commercial approach based on the theory of inputs and outputs, demand and supply, and marketing and storage.
During this process of change, such environmental manifestations as health of soil, water, air, forests and agricultural labourers, have to be kept in view. Introduction of transgenic crops, either developed indigenously or brought from abroad, have to be introduced in the local environment, keeping in view the ethics, future requirements and developments, and probable effects on the biosphere. Biotechnology is an expensive and useful tool, which can be used profitably by agricultural and veterinary scientists, provided proper expertise, instrumentation and experimentation are at hand for its exploitation. We have to go a long way to achieve the high productivity levels in different crops attained by many countries (See Table 7). Keeping this in focus, PALI should gear its research programmes in a manner that agricultural production is revolutionized in Punjab as earlier, at the time of the green revolution. The state government has already provided the seed money of Rs. 100 crore to the university for improving its research and other facilities. It remains to be seen whether PAU can rise to the occasion to lead the agriculture of the state to unprecedented levels of success once again.
THRUST FOR NEW DEVELOPMENT INITIATIVES
Public and private investment: Public sector investment in Punjab is around 10 per cent of the Net State Domestic Product (NSDP) in agriculture. Gross capital formation in agriculture in 1998-99 was Rs. 2,157 crore at current prices, while at constant prices it was Rs. 1,633 crore (Table 17). Plan outlays for infrastructure and agriculture and rural development in Punjab have always been the highest among all the major states in all the plans. In the Eighth Plan, Punjab had invested a total of Rs. 618 crore for infrastructure development in agriculture at 1980-81 prices (Table 18). Unfortunately, the state has not been able to attract foreign direct investment in agriculture, or for other ventures, and ranks 14 *" among the states of India.
Table 17frend in Public Sector Investments in Punjab Agriculture Rs. crore)
Year
!
Public sector investment NSDP Agriculture at current prices
Public sector investment as %
NSDP agricultureAt current prices At 1993-94
prices1993-94 1166.02 1166.02 12978 8.981994-95 1476.82 1354.17 14264 10.351995-96 1446.45 1227.56 15369 9.411996-97 1520.04 1215.45 18C13 8.441997-98 1902.63 1453.85 18900 10.071998-99 2156.99 1633.14 20559 10.49
Source: Ramesh Chand 2000, Policy Paper 11, NCAP, New Delhi
According to the Reserve Bank of India (RBI) and the National Sample Survey Organization (NSSO) surveys, per hectare provisions of fixed capital formation were the highest in Punjab during 1980-81, but fell to the fourth position in 1991-92. Most of the private investment has gone into farm machinery and irrigation structures. As a result, the state has a high degree of mechanization of farm operations. Since capital intensity is increasing among all categories of farmers, particularly large farmers, it is making agriculture less profitable, as net returns are getting reduced due to the higher cost of cultivation.

Public and Private Investments in Agriculture during different Plans (Unit Rs/ha at 1980-81prices)________
Plan Public InvestmentPunjab India
Private InvestmentPunjab India
Fifth Plan (1974-75 to 1978-79) 853 311Sixth Plan (1980-81 to 1984-85) 713 258 262
(1981-82)80
(1981-82)Seventh Plan (1985-86 to 1989-90) 355 197Annual Plan (1990-91 to 1991-92) 128 187 173
(1991-92)126
(1991-92)Eighth Plan (1992-93 to 1997-98) 618 188
Source: Ramesh Chand 2000, Policy Paper 11, NCAP, New Delhi.
The decline in public investn^ient is mainly due to diversion of resources to subsidies for fertilizers, rural electricity, irrigation, credit and other agricultural inputs, rather than for creation of assets. The declining trend in public sector agricultural investments has to be reversed by increasing allocation of public funds for agriculture. As the state is facing a severe resource crunch, public investment can be increased only if the present flow of subsidies on such inputs as power, water and fertilizer are reduced.
Employment generation: In the post-green revolution situation in Punjab agriculture, farm mechanization and paddy-wheat crop rotation has greatly influenced the labour employment pattern. Abundant labour are employed during the sowing and harvesting seasons. They are relieved after the operations are over. This has reduced the duration of employment of casual labour and peasants on the farms. The capitalist pattern of agricultural development has not only increased casualization of the workforce but also the share of hired labour, which is mostly migrant and comes during the season from Uttar Pradesh, Bihar, Rajasthan and other states. The affluence of farmers, achieved during the green revolution, has also affected their life-style and mindset. They now spend more on consumable items, social functions and, aspire to own scooters and cars. The youth from the farming community at best drives a tractor but shuns hard work on the farm, which is normally passed on to the hired labourer. This pattern has created a paradox of scarcity and surplus of the labourforce in the state.
Trends of employment*: The Planning Commission has estimated that Punjab will have a very low growth rate of employment, that is, 0.73 per cent per annum during the Ninth Plan period. The labourforce is projected to grow at the rate of 2.27 per cent per annum. Consequently, 10,65,000 persons will be unemployed during the Ninth Plan. The data collected by the Economic and Statistical Organization of Punjab indicate that the unemployment situation in the state is more serious than projected by the Planning Commission. Labour absorption capacity of agriculture is on the decline in Punjab. The annual rate of decline is the highest for paddy (2.36%) followed by wheat (2.22%), maize (1.61%) and sugarcane (0.98%). Only in the case of cotton has there been an increase of 0.19 per cent per annum, but the overall requirement of labour has increased at the rate of over one per cent per annum. The trend of overall increase in labour absorption in the seventies was reversed in the eighties and nineties. Total labour absorption in
‘This and the next sub-section are drawn heavily from S.S. Gill, 'Agriculture, Crop Technology and Employment Generation in Punjab’, published in Future of Agriculture in Punjab, edited by S.S. Johl and S.K. Ray, published by the Centre for Research in Rural and Industrial Development, January 2002.

agriculture stood at 480 million man-days during the triennium ending 1983-84. It declined to about 432 million man-days during the triennium ending 1996-97 (Table 19).
Table 19_____ Estimated Total Employment in Principal Crops (‘OOP Man-Days) in Punjab
Year(Trienniumending)
Paddy Wheat Cotton Rapeseed & Mustard
Others All Crops
1992-93 144871.20 143271.44 69735.66 3527.01 84152.21 445557.521996-97 139836.04 139281.45 65351.34 3557.21 83644.51 431670.55
Source; S.S. Gill, 'Agriculture, Crop Technology and Employment Generation in Punjab’, published in Future of Agriculture in Punjab, edited by S.S. Johl and S.K. Ray, published by the Centre for Research in Rural and Industrial Development, January 2002 .
Note : 1. Employment is calculated by multiplying, area under different crops by per hectare employment in respective crops (i.e., paddy, wheat, cotton, rapeseed and mustard). In the case of other crops the weighted average (of four crops) per hectare employment is multiplied by the total area under other crops.
2. Total employment In 1992-93 over 1983-84 declined by 7.25 per cent and in 1996-97 by 10.14 per cent over 1983-84.
The major cause of this decline is the sharp decrease in man-days required per hectare in crop cultivation. The high level of mechanization in sowing, irrigation and harvesting of paddy and wheat has progressively replaced human labour by machine labour. Draught power has virtually disappeared from the agricultural scene in Punjab.
Employment pattern: The problem of under-employment is quite serious for domestic labourers, as half the time there is usually no work available for them. At the same time, unemployment is on the rise, both among educated and uneducated youth in rural areas, mostly in the age-group between 15-20 years. The employment-generation strategy and policy has to be multi-pronged, bearing in mind the capabilities and aspirations of the unemployed youth and the availability of resources in the state. The long-term strategy demands that in the next 10-15 years, nearly half the cultivators and about 20 per cent of the agricultural labourers have to be shifted outside agriculture both within and outside rural areas. Non-farm employment has to be expanded in major areas, so that the potential workforce presently engaged in agriculture and allied activities are shifted to these sectors. Decentralized development, or block planning, has to be accompanied by major investments by the public or private sector for marketing, storage, processing and transportation. This can also take care of the uneducated and unemployed youth.
There is generally a mismatch between the aspirations of the unemployed and the policies pursued for creating employment opportunities. Rural educated job-seekers aspire to secure white-collar government or semi-government jobs. On the other hand, the government is not willing to act as a major employer of such youth. Alternative opportunities for skill-development through vocational training has to be popularized at the village level. Simultaneously, the corporate sector has to be encouraged to enter the rural areas with their programmes, so that employment generation activities are created. Self-employment skills have to be imparted and credit facilities made available for translating their aspirations into reality in rural areas. The machinery of the Planning Commission needs to be activated with well thought-out policies and action programme, as the task is colossal and calls for multi-directional co-operative efforts.

Contract/commercial/organic farming: In order to give a boost to the supply of commodities for the processing industry there is a need for their production in contiguous areas around processing units. For this, usually commercial or contract farming is undertaken. In the case of sugar production, commercial farming is already in vogue as many farmers produce sugarcane in defined command areas of the factory and supply the cane to it. However, in a situation where the factory operates below its capacity, commercial cane growers suffer loss due to non-utilization of their produce. Farmers suffered similar losses when Pepsi Corporation switched over from contract farming to commercial farming in the case of tomato.
Contract farming has the advantage of the buyer entering into a contract with the required number of farmers and taking their entire produce at a previously fixed price, irrespective of the market fluctuations at the time of the harvest. Contract and commercial farming are being practised in Punjab on a limited scale, as the corporate sector with processing units have not entered the scene in any significant manner. Both the systems of farming are of advantage to growers.
The biggest impediment to the expansion of contract/commercial farming is the small land-holdings of the majority of the farmers. In either case a large number of farmers have to be inducted into the system in a contiguous manner. The reluctance of a few farmers in between, jeopardizes the efforts of contract or commercial farming. The land- lease and tenancy system have to be re-oriented and modified to help farmers to extend ready support to contract/commercial farming.
Organic farming, particularly in the case of fruits, vegetables, cotton and sugarcane, is the buzz word in the West, where the green movement is transforming food habits of people. Organic farming helps in the improvement of the physical health of the soil by increasing moisture-holding capacity, regulating soil temperature and by improving the texture and structure of the soil. Organically grown commodities fetch a two to four times higher price. For growing organic foods, the certifying agencies have to be in place to monitor the authenticity of organic cultivation. Proper monitoring during cultivation is an important integral component of organic farming. Farmers with small holdings, who cannot afford to use such capital inputs as fertilizers and pesticides, if imparted proper skills and advice to grow organic foods without any chemical input, would be happy to grow such crops, provided marketing costs and pricing are remunerative. Organic farming can succeed in a big way with proper research and extension inputs, coupled with incentives for marketing.
The government of India has sanctioned Rs. 75 lakh for improvements of soil health in 2002-03, to popularize the centrally sponsored organize forming scheme. The following components are being covered under this scheme:
1. Green manuring2. Verming composting3. F.Y.M.
Information boost: Information technology is yet to make inroads in the development of agriculture in India. In advanced countries, every village is interconnected with the county office and the state headquarters, for a free flow of information about agricultural operations, weather, marketing structure and crop intelligence, and price trends, besides many other issues concerning crops and allied activities. Computers have become common household items with the farmers, because the information available is so huge that the farmers sieves through it carefully to extract what is of use for them in the context of their problems. The farmer can get in touch with experts to seek their advice

in no time, on day-to-day problems of crop growth animal health etc. Informatics-led agricultural development is a step towards precision agriculture and enhances the quality of life of the farming community. There is need for a sophisticated information and communication technology (ICT) network with farm and non-farm linkages for the sustainable development of agriculture in Punjab.
Punjab is a progressive agricultural state and the agricultural university is the brain behind the supply of information. When inter-connectivity and the information base are strengthened, at least up to district headquarters at the beginning, and subsequently to each Panchayat, access to information will increase many times and so will productivity. The time has come for the networking system to be put in place to give another boost to sagging agriculture in the state.
Export production: With the introduction of WTO the expectation was that states with surplus agricultural produce would be able to export their material and earn profits. But these expectations have been belied, because of inability to access the world market on account of competitiveness and quality requirements. In 1998, the share of agricultural and allied products in the total export of Punjab was about 54 per cent, according to Punjab Small Industries and Export Corporation. This includes cotton textiles, yarn, readymade garments and hosiery.
Punjab produces eight million tonne of surplus wheat, which is available for export, but most of it cannot be exported because of inability to reach quality requirements. Only durum wheat, which is good for pasta and pizza, is being exported. Similarly, Basmati rice produced in Punjab is quite competitive and so is cotton. Scope for exporting fruits and vegetables to neighbouring countries of the Middle East and Southeast Asia is high. But uncertainties in deliveries of required quality and quantities often make exports unpredictable. Technological breakthroughs in biotechnology, tissue culture, greenhouse technology, etc., have to be achieved, to acquire an edge over other countries. Exports can be further boosted when fruits and vegetables are processed and packed according to international specifications. Punjab has had some success in the export of such processed vegetables, as sarson ka saag, tomato ketchup, mixed pickles, squash, fruit jam, honey and spices marketed by MARKFED. Dehydrated peas are also exported. However, while a great potential exists for export, the quantum of fruits and vegetables processed for the purpose is very small.
Exports of dairy products in the form of ghee is limited to the Middle East and the Gulf countries. Other dairy products have a potential, which is still to be exploited. Similariy, there is a market for meat and meat products abroad, but the potential has not been realised because of competition from European countries.
Floriculture, however, is a preferred item for export because of the climatic advantage. The benefit of climate allows certain flowers to be grown at a time when these are not available in the western countries. Punjab, being land-locked, export of perishable material such as flowers, fruits and vegetables are at disadvantage, which can be removed by opening up the northern trade route for export to Afghanistan, the Central Asian Republics and the East European countries.
Problems that the exporters of Punjab face are no different from those of other states. Both pre-shipment and post-shipment problems exist, besides transportation and infrastructural difficulties. Absence of market intelligence is hampering export promotion, as international requirements of quantity and quality inputs and pricing are not instantly available. A networking system is needed to overcome this problem. Punjab has set up a new company called Punjab Agro Export Corporation Limited (PAGREXO) on the

pattern of AGREXO of Israel. All agricultural items exported by Israel to different countries are branded under the name of AGREXO. Similar is the objective of PAGREXO. PAGREXO has been successful in exporting kinnows, grapes and a few selected vegetables, such as okra, bittergourd, melons and tinda. This corporation is a boon to exporters, as it tackles most of the pre-shipment problems and also carries out some post-shipment measures. Such a corporation should be managed well to boost exports.
DIVERSIFICATION OF FARMING SYSTEMIt was the compulsion of the acute food shortage in the country in the sixties that made the Central Government give a fillip to the production of foodgrains. Several policies were framed at the Central and State levels to give a boost to foodgrains production. Punjab contributed significantly to these efforts and played a leading role in ushering in the green revolution in India. Now a situation has come when the granaries of Punjab, as well as of the Centre, are overflowing with foodgrains. Even then, the emphasis on foodgrains production in Punjab is continuing, primarily because of guaranted purchase by government at administratively fixed prices. As a consequence, crop production in Punjab has progressively become less diversified. Problems arising from the limited diversification of cropping activities prompted the state government, as early as 1985, to appoint a committee for suggesting remedial measures. Popularly known as the Johl Committee, it recommended shifting 20 per cent of the area under the wheat-paddy system to such crops as maize, oilseeds, sugarcane, fruits, vegetables and forests (Table 20). It also suggested introduction of dairy enterprises on a large scale, for which the area under fodder crops had to be doubled, from 0.7 million to 1.4 million hectares by the year 2000. Despite these recommendations, the area under rice and wheat increased steadily, mainly due to assured remunerative prices offered for these crops. Clearly, the committee’s recommendations received scant consideration from government as well as from the farming community.
Table 20Area of Different Crops Based on Recommendations Made by Johl Committee (1986) and Actual Observed Area
(Million Ha)in 1999-2000Crops Actual area Proposed area Area present
(1999-2000)The trend
1985-86
1990-91
2000-01
Suggested Actual
Wheat 3.15 2.90 2.40 3.39 - +Paddy 1.70 1.52 1.25 2.60 - +Maize 0.26 0.30 0.40 0.16 + -
Pulses 0.20 0.29 0.38 0.11 + -
Other foodgrains 0.16 0.19 0.20 0.04 + -
Total foodgrains 5.47 5.20 4.63 6.30 - +Rapeseed & Mustard 0.15 0.23 0.30 0.06 + -
Other Oilseeds 0.06 0.09 0,18 0.10 + +Total Oilseeds 0.21 0.32 0.48 0.16 + -
Sugarcane 0.10 0.13 0.20 0.11 +Cotton (American) 0.47 0.55 0.68 0.48 +Cotton (Desi) 0.09 0.10 0.12 0.09 +Vegetables including Onions
0.04 0.05 0.20 0.14 + +
Fruits 0.04 0.08 0.13 0.07 ++ +Fodders 0.72 0.90 1.41 0.61 ++ -
Forests 0.28 0.40 0.56 0.28 +Total Cropped area 7.17 7.40 8.20 + +
Note: + Increase - Decrease .. Stagnant (no trend) ++ Increase to double or even moreSource: M S Bajwa, 'Strategies for Agricultural Research and Development’ quoted in Future of Agriculture in Punjab,
Published by CRRID, 2002

The farmers have found the paddy-wheat combination relatively more remunerative and less risky due to assured pricing and guaranteed purchases. Options for growing other crops, suggested from time to time, have failed due to a relatively higher order of instability in their crop yield, low return and poor marketing facilities. The study by Ramesh Chand (March 1999) has proposed three types of diversification options for Punjab; i) items of mass production and consumption - small-scale enterprises, such as dairying, growing of pulses and oil-seeds; ii) concentration on area-specific enterprises of moderately high-value commodities in different agro-climatic zones and sub-zones, such as cotton, vegetables, potatoes, sugarcane, basmati rice, etc., to enhance the income of farmers; and iii) limited zone/site-specific diversification through non- conventional high-value crops for elite consumption, such as floriculture, exotic vegetables, mushrooms, etc., which are perishable and require specialized marketing. Medicinal, aromatic and spice crops are also a site-specific alternative for bringing about diversification in small areas in Punjab.
Several other options for diversification have been suggested from time to time and some of these have also been experimented with in Punjab. Sunflower and soyabean were introduced as alternate crops and their cultivation was extensive in the state. However, after a few years, farmers began to abandon these crops, because prices fluctuated year to year and marketing became a problem. The failure of this experiment has made Punjab farmers cautious about undertaking any further experimentation on diversification. Returns from the options suggested by expert scientists are generally lower than the existing wheat-rice cropping pattern practised by the farmers.
Constraints to diversification from wheat and paddy crops can be removed when the suggested alternative crops become remunerative, have ready accessibility to markets and are free from risks of attack by pests and diseases. The need and urgency to grow legume, pulses and oilseeds is high, because the country imports these products every year. The problem these crops face is that although a support price is announced for them, procurement through the regulated market is not in place. Even the returns from these crops do not favourably match those of wheat or paddy. In order to encourage the cultivation of pulses and oilseed crops in particular, some incentives are needed to compensate the farmers for the shift from wheat/paddy in an appropriate manner.
Shifting to cultivation of fruits and vegetables, including off-season and exotic vegetables, flowers, medicinal plants, etc., are other alternatives which experts have suggested by experts from time to time. Diversification into other allied sectors of dairy farming, fisheries, mushroom growing, etc., have also been mentioned. These suggestions, though seemingly attractive, are capital-intensive and full of several risk factors including demand, marketing, processing and consumption.
Factors that have encouraged the Punjab farmer to grow more and more wheat and paddy over the years, namely minimum support price and assured procurement, cannot and should not be allowed to remain operative in the present situation. A gradual withdrawal, reduction or modification in these support measures is needed, which in turn will prompt the farmers to diversify from these crops. At the same time, an alternative package of options should be made available to the cultivators, so that the adjustment to new crops takes place smoothly.
Institutional agencies have to come fonA/ard to provide suitable credit for the production of crops involving high capital. For other groups of crops, pricing, marketing and risk factors have to be thoroughly worked out. The Punjab farmer has become very commercialized and venturing to cultivate any new crop is viewed from different angles
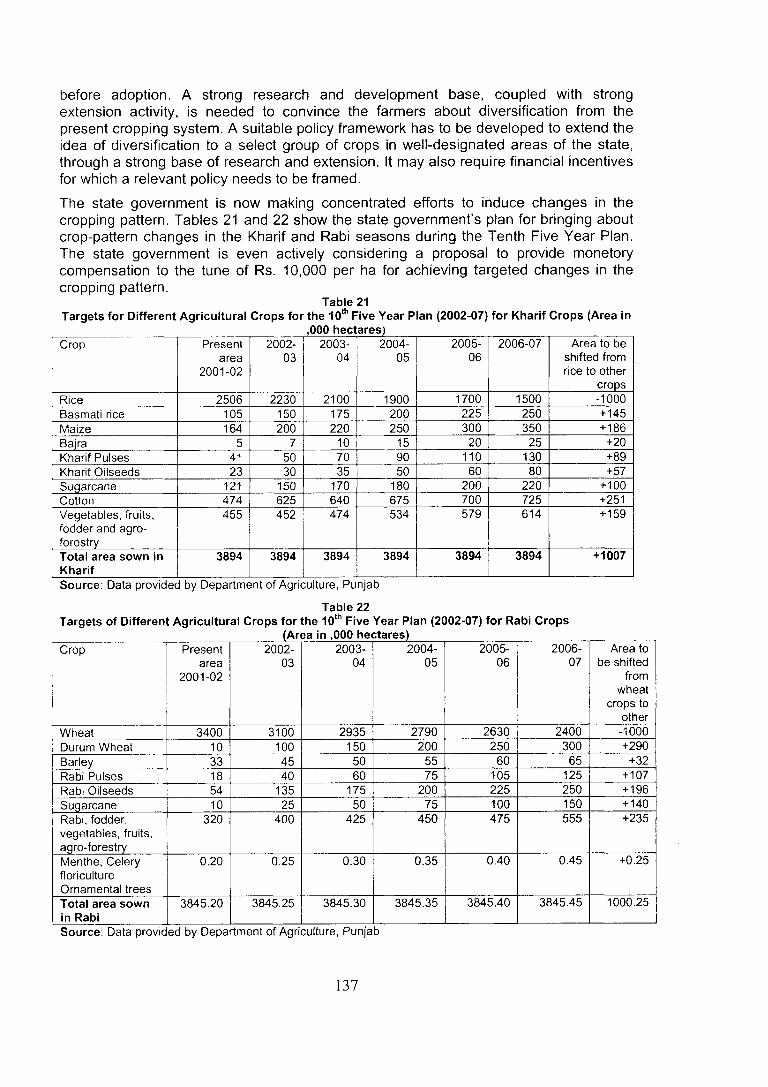
before adoption. A strong research and development base, coupled with strong extension activity, is needed to convince the farmers about diversification from the present cropping system. A suitable policy framework has to be developed to extend the idea of diversification to a select group of crops in well-designated areas of the state, through a strong base of research and extension. It may also require financial incentives for which a relevant policy needs to be framed.
The state government is now making concentrated efforts to induce changes in the cropping pattern. Tables 21 and 22 show the state government’s plan for bringing about crop-pattern changes in the Kharif and Rabi seasons during the Tenth Five Year Plan. The state government is even actively considering a proposal to provide monetory compensation to the tune of Rs. 10,000 per ha for achieving targeted changes in the cropping pattern.
Table 21Targets fo r Different Agricultural Crops fo r the 10“’ Five Year Plan (2002-07) fo r Kharif Crops (Area in
1 Cropi
Presentarea
2001-02
2002-03
2003-04
2004-05
2005-06
2006-07 Area to be shifted from rice to other
cropsRice 2506 2230 2100 1900 1700 1500 -1000Basmati rice 105 150 175 200 225 250 + 145IVlaize 164 200 220 250 300 350 + 186Bajra 5 7 10 15 20 25 +20Kharif Pulses 41 50 70 90 110 130 +89Kharif Oilseeds 23 30 35 50 60 80 +57
j Sugarcane 121 150 170 180 200 220 +100i Cotton 474 625 640 675 700 725 +251
Vegetables, fruits, i fodder and agro
forestry
455 452 474 534 579 614 +159
Total area sown in Kharif
3894 3894 3894 3894 3894 3894 +1007
Source: Data provided by Department of Agriculture, Punjab
Table 22Targets of Different Agricultural Crops fo r the 10* Five Year Plan (2002-07) fo r Rabi Crops
Crop Presentarea
2001-02
2002-03
2003-04
2004-05
2005-06
2006-07
Area to be shifted
from wheat
crops to other
Wheat 3400 3100 2935 2790 2630 2400 -1000Durum Wheat 10 100 150 200 250 300 +290Barley 33 45 50 55 60 65 +32Rabi Pulses 18 40 60 75 105 125 +107Rabi Oilseeds 54 135 175 200 225 250 + 196Sugarcane 10 25 50 75 100 150 + 140
i Rabi, fodder, vegetables, fruits, agro-forestry
320 400 425 450 475 555 +235
Menthe, Celery floriculture Ornamental trees
0.20 0.25 0.30 0.35 0.40 0.45 +0.25
Total area sown in Rabi
3845.20 3845.25 3845.30 3845.35 3845.40 3845.45 1000.25
Source; Data provided by Department of Agriculture, Punjab

ANIMAL HUSBANDRY AND DAIRY FARMING
Dairy
Punjab is also important for its dairy products. Unfortunately, however, the yield of milch animals and their total production in the state is not in consonance with the levels attained in developed countries. In 1966, Punjab had 15 lakh buffaloes and 10 lakh cows. There numbers have now increased to 37 lakh buffaloes and 12.5 lakh cows. During the last two decades, the area under fodder crops has remained around seven lakh hectares, constituting less than 10 per cent of the total cropped area. The per day availability of fodder in the state works out to about 10-12 kg per animal against the national average of five kg per animal. The optimum requirement is 40 to 50 kg per animal. Obviously, the milch animals are under-nourished and hence produce less milk.
On an average, a buffalo in Punjab yields about 1,300 litres of milk in its lactation period of about 210 days. The inter-calving period is 15 to 18 months. In the case of crossbred cows, the average lactation yield is over 3,500 litres of milk with a calving interval of 12 to 14 months. Unfortunately, consumers in Punjab do not like cow’s milk, because of its low fat content and yellowish colour, whereas all over the world cow’s milk is in demand. The per capita availability of milk is about 870 gm in Punjab against 204 gm for India, 592 gm for Haryana and 330 gm for Himachal Pradesh (1998).
Livestock enterprises account for about 14 per cent of the state domestic product of Punjab, which is one-third the share of agriculture. For a herd of 10 animals, the cost has been worked out to be Rs. 2,64,000 for a buffalo-herd unit and for a crossbred cows-herd unit it is Rs. 2,98,000 per lactation period. However, the net income is estimated, at Rs. 31,803 for crossbred cow as against Rs. 20,672 for buffalo-herd units (Joginder Singh and Dhaliwal, 2002). The higher profitability of a crossbred cow-herd unit is because of a higher milk yield.
Due to heavy pressure of growing wheat and paddy, the area under fodder has been decreasing, and so has the composition of the live-stock population. During 1977-1997, the total bovine population increased by nearly 19 per cent, but, while the population of cattle as a whole decreased by 20 per cent, the stock of buffaloes increased by more than 50 per cent (Table 23). As a viable means of diversification, cultivation of fodder has to increase along with increase in livestock population, in order to make it more productive, in such countries as USA, Canada, Israel, Denmark, New Zealand and others, dairy farming as an enterprise is very successful and crossbred cows have an average lactation milk production of 10,000 litres per cow. This suggests that there is a tremendous possibility for increasing cow’s milk production if scientific methods are used. Such an increase in buffalo’s milk production is difficult, as high milk-yielding genetic stock is not available.
Table 23
Year Cattle Buffaloes Horses&
Ponies
Donkeys Sheep Goat Camel Totallivestock
Poultry
1972 3390 3796 50 65 388 537 102 8646 30171977 3312 4110 76 61 498 722 74 8996 55391990 2832 5578 33 36 508 537 43 9678 152761997 2639 6171 34 23 436 414 30 9857 11457
Source: Statistical Abstract, Punjab, various issues

There is also considerable scope for reducing the cost of milk production by: a) improving the animals through crossbreeding and introduction of a exotic breeds; b) improving the feed and making it more balanced and nutritious; and c) proper management under hygienic conditions.
In order to make dairy enterprises economically attractive the aim should be:
Developing herds of crossbred cows with lactation yield of not less than 5,000 litres.Calving at two and half years of age and with a calving interval of 12 to 14 months.Import of a substantial number of pure breed exotic cows with lactation yield of not less than 5,000 litres and calving at two years of age with a calving interval of 12 months.Drastic reduction in dependence on buffaloes.Retaining and developing only a limited number of buffalo herds, yielding a minimum of 2,500 litres of milk per lactation.
• Scientific herd management system and livestock breeding policy.
The PAU has recommended cross-breeding of cows with the use of Jersey cows in the sub-mountain rain-fed areas and Holstein Friesians in the plains region of Punjab. The nutrient component of milch animal deserves special attention, as most of the present herd are under-nourished.
The state has abundant roughage (wheat and rice crop), which can be used in making silage through processes developed by PAU. Additional nutrients can also be added to this silage. Authentic frozen semen from pedigree bulls is necessary for cattle breeding, need which, if necessary, may be imported from designated countries. Animal health is another component, which has to be put on a strong footing, so that the optimal use of potentials of animals is maintained.
Milk production
Punjab has 49 milk plants in the co-operative and private sectors with a handling capacity of 50 lakhs litres of milk per day. Of these, 11 milk plants belong to Milkfed Punjab, which handles over 15 lakh litres milk per day. Nine of these plants manufacture milk powder, ghee and pasteurized milk in pouches. The 28 milk plants in the private sector, with a capacity of 35 lakhs litres per day, manufacture milk powder and ghee. Some multinational companies, such as Smith Kline & Beecham, Wockhardt Limited, etc., do not make pasteurized milk but manufacture special value-added milk products for sale in India and abroad. Several of these milk plants are unable to procure enough milk due to competition with each other and, as a result, 35 to 45 per cent of their installed capacity remain idle. Some of the milk plants in the private sector have already closed down and some are on their way out. The situation demands urgent steps to revive the dairy industry by supplementing milk for the use of milk plants.
Although the Prevention of Food Adulteration Act is applicable to milk and milk products, in practice it is seldom applied to retail vendors. However, it is ngorously applied in organized dairies. The unhygienic conditions prevailing in small dairies and city-based
‘dudhias’ is not only dangerous to milch animals from the health point of view, but even consumption of such milk, which is obtained unhygienically, is harmful to consumers. Unfortunately, little is being done about the hygiene of milch cattle and of the process of milking the cattle and storage and distribution. Introduction of high technology for producing hygienic milk for consumption and maintaining proper health of the milch cattle, have assumed extreme urgency.
OTHER ANIMALS AND THEIR PRODUCTS
Piggery: Rearing pigs as a commercial venture is still to be established on a sound footing in the state. Economically, it is a very active biological feed converter with a ratio of 1:4. Its meat is highly rich in fats, and bacon and other meat products made out of it are of great commercial value both in India and abroad. However, scientific methods of pig rearing are not readily available to pig keepers; hence, most of the animals remain scavengers and as such their meat can be harmful for human consumption. On the other hand, a well organized pig rearing stall can be of great economic value, where pure exotic breeds are maintained in hygienic conditions and fed with balanced diet. Consumption of its meat can increase and its byproducts could be exported.
Poultry: In Punjab, poultry grew phenomenally during 1977 to 1990, when the number jumped from 30 lakh to 152 lakh, but declined to 115 lakh in 1997 (Table 21). This decline is attributed to reduced profitability and increased competition from the poultry industry of South India. Besides meat, 2,630 million eggs are also produced by the chickens. On an average 240 eggs per layer per annum are produced, whereas well- bred chickens of Denmark, Australia and the Netherlands produce anywhere between 300 to 350 eggs per layer per annum. Chicken breeding needs improvement both for meat and egg production. Even proper feeding and healthcare can improve meat and egg production from the existing stocks considerably.
Rabbits: Rabbits are prolific layers, herbivores and can efficiently convert fodder to food. They can convert plant protein of little value into 20 per cent of high value edible meat. Comparable figures for other species are 20 to 23 per cent for broiler chicken, 16 to 18 per cent for pigs and eight to 13 per cent for beef. Rabbit meat production is economically cheap and is an attractive proposition, especially when the aim is to produce quality animal protein. Russian Chinchilla and New Zealand whitebreed rabbits have given very encouraging results in meat production, i.e., about 1.6 to 2 kg meat in 84 days. Over 2,000 of these can be raised on one acre of land producing berseem and lucerne. Rabbit’s skin is also a saleable product, which can fetch much money depending upon the breed. Angora-wool rabbits provide an additional source of income as the wool, used for woollen garments for infants, is quite expensive and much in demand. Development of rabbitories, if properly encouraged is economical and remunerative for small-scale ventures.
Sheep and goat: Sheep and goat reanng has a stigma attached to it among Punjab farmers as it is considered to be an enterprise meant for Scheduled Castes and marginal and small farmers. The population of goats and sheep in 1997 was 12,20,000 and over a period of 20 years it has come down to 8,50,000, a decline of more than 30 per cent (Table 21). Milk, meat and wool are the main products of goat and sheep. Little has been done by way of research for the improvement of their stock. Wool production has been picking up for sometime in the past, but meat production is still in the unorganized sector. There is urgent need for improving breeds of goats and sheep for quality wool.

increased meat and milk production, and for scientifically organized abatoires for hygienic processing of meat and its products.
Byproducts of animal wastes are very useful, as hides, skins, horns, bones, animal fat, bristles, blood, hooves and hair can be profitably exploited for diverse purposes. Many medicines are derived from various organs and excretions of these animals, which have great value in the pharmaceutical industry. At present, byproducts, except skins and hides, are of little value. Considerable scope exists in the scientific utilization of the byproducts of these animals with economic benefits.
Fisheries; After the green and white revolutions, Punjab is now on the threshhold of a ‘Blue Revolution’. A trend has already been set in favour of diversification to fish farming. Farmers are engaged in intensive fish culture in ponds and tanks on modern scientific lines through composite fish culture of fast growing species. There is great potential for pisciculture in the state. Fisheries’ resources of Punjab comprise 868 km of river, 11,200 km of canal, 5,804 hectare of small water reservoirs and lakes. In addition, there are 7,185 village ponds covering an area of 4,730 hectare, which are suitable, or can be made suitable, for fish culture after some renovation and water-supply arrangements. Besides, there are 5,228 village ponds covering an area of 2,664 hectare, which require major renovation to make these fit for fish culture. Some farmers have also started fish tanks on their farm-land as a measure of diversification because of its lucrativeness {State Industrial Profile o f Punjab, Ludhiana, 2001).
The economics of fish farming is quite attractive, as returns over variable cost under proper management practices are nearly one and half times those of paddy-wheat rotation. The only capital expenditure involved is deep excavation of land for fish ponds. Fish culture is a highly specialized occupation and requires technical skill in production and marketing. The state government has arranged to provide fish fingerlings for fish cultivators, but has not taken care of skill upgradation, pricing and marketing. If these are provided, inland fish farming can be a very profitable enterprise for medium and large farmers.
Apiculture: Punjab Agriculture University (PALI) has been encouraging bee farming and a large number of farmers have taken up this enterprise successfully. Since 1978, the number of bee keepers has increased from 34 to 1,25,000, beehives from 165 to1,25,000 and honey production from seven to 2,200 tonne per annum. Dabur India Limited has given further boost to honey production in the state by entering the market for the purchase of crude honey. With more corporate sector firms entering this arena, and inputs of improved technology, honey production can further improve, particularly by involving small and marginal farmers.Sericulture: Since 1994, sericulture has come under the jurisdiction of horticulture. There are 16 government sericulture farms. Over two lakh mulberry plants have been planted and distributed in the kandi areas. This activity is confined mostly to the kandi areas and the sub-mountain regions, where plantations of mulberry are available and a government agency undertakes to collect the cocoons. Absence of silk-weaving factories and collection centres are limiting the progress of this enterprise. Though it is a cottage industry which can give employment to women and small farmers in particular, it is not yet receiving due attention.

Horticulture: Fruits; The diversity of physiograhic, climatic and soil characteristics of Punjab allows successful cultivation of a variety of fruits, vegetables and flowers. There was a three-fold increase in the area under fruit production during 1981-82 to 1995-96, but in 1999-2000 there has been a considerable decline in the area under fruits. A total of 4,18,639 tonne of fruits were produced in the state during 1999-2000. However, there has been a decrease in production of 47 per cent in citrus, 16 per cent in mango, 11 per cent in guava and seven per cent in pears (Table 24). The per capita availability of fruits is 56 gm against the minimum recommended requirement of 85 gm. It is, therefore, essential that fruit cultivation in Punjab is taken up on a large scale, as a means of diversification, and to fulfill fruit requirements for table consumption, besides the processing industry.
Table 24___________Area (Hectare) under Different Fruits and Vegetables in Punjab__________
Commodity 1981-82 1991-92 1995-96 1999-2000 (p)FruitsKinnow 3883 11807 26645 1434Orange & Malta 5853 10987 13170 3317Lemon 509 1096 1258 668Mango 6817 11581 15211 5608Litchi 336 1386 1990 1146Guava 2853 4015 5833 4357Pear 3616 7427 8226 2147Peach 1038 3137 4237 1101Plum 233 372 336 120Grapes 308 2187 2336 1378Ber 698 1671 2523 1735Miscellaneous 2703 3258 3657 1198Total fru its 28847 68835 84422 34209VegetablesPotato 32715 30919 39095 63993Topica 369 68 21Sweet potato 432 55 30Onion 1267 950 1615 2032Other winter vegetables
12882 16246 14816 23864
Other summer vegetables
16160 12647 11812 20573
Total vegetables 63825 60848 77309 110266Source : Statistical Abstract of Punjab, 1982,Note : P = Indicates Provisional Estimate
R = Indicate Revised Estimates
1992, 1996 and 2000
Among citrus fruits, kinnow, lemon, oranges and malta are dominant. Productivity of these fruits in Punjab is around eight tonne per hectare, while in Andhra Pradesh it is 15, Karnataka 11 and Bihar 10 tonne per hectare. In Israel the productivity of kinnow is 65 tonne and orange 43 tonne per ha. The low productivity in Punjab can be ascribed not only to poor management and biotic stresses, but also to the use of imperfect technologies and poor quality plant material, which can be easily improved through scientific methods.

Grape cuitivatidn also picked up in the state during 1991-92 to 1995-96, but has gone down considerably in recent years. The State Department of Horticulture entered into an agreement with the Israel Government for improving the quality of Perlette grapes in the state. During 1998-99, 205 h{;ctares were covered for improvement. Grape productivity has improved, but remains far behind the international level. The situation with regard to other fruits is also similar.
The reasons for poor performance in fruit tree cultivation appear to be:
• Trees have become old and have been cut down without replacement.• High yielding, certified and quick maturing plant materials are scarce.• Diseases and pests are taking a heavy toll.• The marketability of fruits is complex and uncertain• Price structure fluctuates every season and is not remunerative.• Lack of value addition, processing, storage and transportation facilities.• Support to research and development is inadequate.
Efforts have to be made to overcome these impediments before fruit cultivation becomes attractive and remunerative.
Vegetabiss: Vegetable cultivation in the state has been on the increase since the last decade and the area under vegetables is more than one lakh hectare, out of which three-fourths of the land is under potato. PAD is a forerunner in generating hybrid seeds of certain vegetables including muskmelon, cucumber, egg plant, okra, chillies and tomatoes. Hybrid crops have given higher yields and higher returns to the farmers particularly when marketed in the cities. The state government has set up vegetable- seed farms at different places, which also serve as demonstration centres. Seedlings produced in these centres are supplied to farmers for cultivation. The popularity of the cultivation of red chillies has increased in recent years as dry chillies give good returns. The production of some of the vegetables is so high that often the market crashes and the cultivators suffer heavy losses because of the glut. Such crops as tomato, potato, onion and cauliflower are subject to gluts in different areas and as a result the farmers even do not harvest the crops. This clearly demonstrates that the potential of vegetable cultivation is high in the state but, due to lack of proper marketing and a processing industry, their off-take will depend a great deal on market forces.
Cultivation of off-season vegetables is yet to take off in the state. The technology is available and can be profitably employed by progressive vegetables growers of the state, with the financial backing of the state government. Such exotic vegetables as celery, broccoli, asparagus and leafy vegetables, such as basil, etc., are valuable crops preferred by foreign tourists. Their cultivation can fetch remunerative returns.
Cultivation of vegetables is capital- and labour-intensive, besides being risky. Most of the vegetables are grown for table purposes, while some are exported to the neighbouring states of Haryana, Himachal Pradesh, Jammu & Kashmir and Delhi. One of the options of diversification from wheat and paddy is vegetable cultivation. This can only succeed if the area under vegetables is increased and processing units, cold storages and dry freezing plants are established in areas where vegetables are grown. Suitable policy directions are needed so that vegetable-growing areas are delimited and get increasing support from industry. The corporate sector can play a pivotal role in establishing the required processing units, for which encouragement should come from the state

government and financial institutions. Above all, research input is a vital ingredient in increasing the quality and quantity of vegetables.
Flowers: Cultivation of flowers has attracted the attention of farmers and it is gradually increasing because of high demand in domestic and international markets. Production technologies have been perfected for gladiate, chrysanthenmum, carnation, marigold and rose. Marketing avenues, pricing, cold-storage facilities and transportation are some of the bottlenecks in extending their cultivation.
Other agricultural activities
Mushroom cultivation: There are three button mushroom spawn producing laboratories functioning at Patiala, Jalandhar and Hoshiarpur. These centres besides supplying the spawn also train the farmers for growing mushroom and provide suitable readymade compost at subsidized rates. During 1998-99, about 1000 tonne of button mushrooms were produced in the state.
During 1980-81 to 1990-91, mushroom cultivation had become popular in the state and a maximum of 35,000 tonne of mushroom per year were being produced. Subsequently the production declined because of lack of market and processing facilities for making soups and other value added products. Oyster mushroom and paddy straw mushroom cultivation can make this enterprise a round the year activity. This venture, given marketing, processing and pricing support can flourish to the advantage of small farr.iers
Aromatic plants: The cultivation of aromatic plants, such as mentha, lemon grass and others, has been taken up by some farmers on an experimental basis. Some subsidy is also being given for mentha cultivation and about 40,500 hectare area was under mentha during 1998-99. Oil-extraction plants have been set up where the harvested mentha is consumed. Growers get adequate return from this crop. Similar arrangements can be made for other aromatic crops in the state, which could encourage diversification.
Development Strategies in the Context of Liberalization and Globalization of Agriculture (WTO)
Agreement on Agriculture (AOA) came into force with the establishment of the World Trade Organization (WTO) on 1 January 1995, to establish 'a fair and market-oriented agricultural trading system’. The likely impact of this agreement has been greatly contested in India in general and Punjab in particular. Now that India is a signatory to WTO, many challenges have come up before the country (Ghuman, 2002). It aims at eliminating distortions in global trade of agricultural produce by:
• Lowering of domestic support to agriculture.• Replacing all non-tariff barriers and eventually slashing down even tariff barriers.• Providing access to the market of each member country.• Lowering export subsidies in agricultural trade.
Unlike developed countries where agriculture is a business, in India agriculture is to a large extent a means of livelihood. Under the agreement, the member countries are obliged to gradually open up the agricultural sector to world trade. In this context, Trade Related Intellectual Property Rights (TRIP), social clauses and labour issues have a

special impact on Indian and Punjab agriculture in particular. Once export restrictions are removed it will be possible to export agricultural produce to international markets. However, volatility of world prices will definitely have an impact on domestic prices. It is expected that agriculturally developed regions like Punjab will gain in the long run from trade, because of opportunities for tapping export markets. But much will depend on the supply-side constraints that bedevil the agricultural market. Improvement in product quality has to be brought to international standards. It was with this concern that the Punjab Government appointed a committee under the chairmanship of Professor Y K Alagh to look into various aspects of WTO affecting Punjab. Some of its preliminary findings and recommendations are given below:
• Punjab’s agriculture has been structured to produce foodgrains in response tothe national mandate. To meet the emerging challenges, a concrete programme of diversification and raising value addition in each agro-climatic region of Punjabdepending upon its soil and water reserves has to be developed.
• The new programmes must be provided financial and organizational support. It is estimated that an agricultural adjustment fund of Rs. 550 crore for three years would be required for the programme for quality upgradation, trading arrangements for foodgrains and diversification to high level sectors.
• At the Centre agricultural trade must be taken more seriously so as to provide an institutional system, including commodity board and insurance, etc., so as to be able to survive fluctuations that occur in world trade.
• Trade-efficiency would depend upon the level of production, marketing,processing, transport, etc. In general, Punjab farmers are at a considerable disadvantage compared to developed countries. Because of high transportation costs, wheat from Punjab will cost more at Mumbai than that coming from Australia.
• Recognized and strong farmer agencies need to be created who touldcollectively represent the farmers in the market to look after their skill and information-needs, market facilities and intelligence and credit-needs. Such an agency can provide export subsidies to farmers with small quantity of export surpluses under ‘Green Box’ measures.
• Punjab could also take advantage of backward area development exemption (Resource Poor Zones) for border areas, Kandi belt, etc., by providing infrastructure under ‘Green Box’ measures.
As such, the export competitiveness of Punjab agriculture is quite limited, as its main agro-products are wheat, rice and sugar, but it is competitive internationally only in cotton. Another crucial factor affecting competitiveness is cost of cultivation and yields of different crops. For this the Agricultural University has to play a lead role in devising ways and means for cost effectiveness in crop production.
Johl (2001) has argued that a farmer in a structurally distorted domestic market cannot be expected to compete cost effectively in a competitive globalized market. It has been suggested that answers to the emerging problems are to create a conducive environment in the agricultural sector to promote commercial farming and minimizes recourse to subsistence farming. Johl has made the following suggestions in this regard:
• An effective land market must be developed, which allows viable farm units to grow. The land-lease market must be streamlined so that larger farm units are created, which become commercially viable, start producing more and generate

employment. For creating effective land markets some of the agrarian laws wlii have to be amended.
• The administered pricing policy and procurement system must play a pro-active and complementary role to encourage production, keeping in view market demands. A shift from wheat and rice cultivation is urgently needed in favour of oilseeds and pulses.
• The variety of subsidies, provided directly or indirectly to farmers to facilitate crop production, needs a critical review and re-orientation so that these could be transferred to ‘Green’ or ‘Blue Box’ subsidy. This adjustment will be highly complementary and effective in rationalizing pricing and procurement policies and in meeting requirements of WTO regimes as well.
• Besides producing more per unit area, value addition and quality improvement of farm produce is the need of the day.
The western countries have commercialized the business of agricultural commodities by mere grading and packing the produce as it generates better demand and better prices. In Punjab, the concept of ‘food parks’ has been envisaged to process and market the produce as the advanced countries do, so that value addition increases sale and profitability.
Research and extension programmes are basic ingredients for the success of crop production activities. These have to operate as a link between the producer and the market, so that the producer’s interests are kept above board and he is allowed to adjust his production programmes in accordance with market requirements of kind, quality and quantity. Under the WTO framework, Punjab agriculture should undergo a paradigm shift in strategy. From a 'production-driven’ agriculture, we have to move to a 'demand- driven’ one. For this, government needs to spend liberal amounts on R & D, infrastructure for the agro-processing industry, seed, biotechnology and product-quality development. This assumes more importance in view of the declining trend in public investment in agriculture. The challenges are enormous and must be met, if Punjab is to remain a leader in agriculture.
References
Annual Administrative Report, Department of Horticulture, Punjab Government. Various Issues.
Brar, J.S. and Chhibbar l.M. ‘N, P and K Status of Punjab Soils’, Indian Journal of Economics, 21(1): 34-38, 1994.
Brar, S.P.S. ‘Fertility Status of Punjab Soils’, Journal of Research, PAU, 16(3): 272-281, 1979.
Chand, Ramesh. ‘Emerging Issues in Punjab Agriculture-Variety and Options for Future’, Economic and Political Weekly, 7 March 1999.
FAO Production Yearbook, Vol. 52, 1998.
Govemment of India, Plan Documents.
Government of Israel, Israel Agriculture, Department of Agriculture - Report, 1996.
Government of Punjab, Statistical Abstract of Punjab, Economic and Statistical Organization, Punjab. Various Issues.

Government of Punjab. Plan Documents.
Johl, S.S. et.al., Report of ttie Expert Committee on Diversification of Agriculture in Punjab, Government of Punjab, 1986.
Johl, S.S. and Ray, S.K, Future of Agriculture in Punjab, Centre for Research in Rural and Industrial Development, Chandigarh, 2002.
NABARD, Annual Report, 2000-2001.
Punjab Agricultural University, Vision 2020. Punjab Agricultural University Perspective Plan, 1998.
Raul, Chhabilendra, Bitter to Better Harvest: Post Green Revolution, Northern Book Centre, New Delhi, 2001.
Singh, Joginder, Changing Structure of Land Market in Agrarian State of Indian Punjab, Punjab Agricultural University, Ludhiana, 2001.
Sondhi, S.K. and Khaper, S.D, ‘Water Resources Development and Management for Sustainable Agricultural Production’, Proceedings of Water Management Symposium, PAU Ludhiana, 4-17 April, 1995.
State Industrial Profile of Punjab, Small Industnes Service Institute, Ludhiana, Ministry of SSI and ARS, Government of India, 2000-2001.

Chapter 5
RURAL DEVELO PM ENT
INTRODUCTION
There are no universally accepted approaches to rural development. It is a choice influenced by time, space and culture. The term rural development connotes overall development of rural areas to improve the quality of life of rural people. In this sense, it is a comprehensive and multidimensional concept, and encompasses the development of agriculture and allied activities, village and cottage industries and crafts, socio-economic infrastructure, community services and facilities and, above all, human resources in rural areas. As a phenomenon, rural development is the end-result of interactions between various physical, technological, economic, social, cultural and institutional factors. As a strategy, it is designed to improve the economic and social well-being of a specific group of people - the rural poor. As a discipline, it is multi-disciplinary in nature, representing an intersection of agriculture, social, behavioural, engineering and management sciences. (Katar Singh 1999).
In the Indian context rural development assumes greater significance as 72.22 per cent (according to the 2001 census) of Its population still live in rural areas. Most of the people living in rural areas draw their livelihood from agriculture and allied sectors (60.41 % of total work force), and poverty mostly persists here (27.1 % in 1999-2000). At the time of independence around 83 per cent of the Indian population were living in rural areas. Accordingly, from the very beginning, our planned strategy emphasized rural development and will continue to do so in future. Strategically, the focus of our planning was to improve the economic and social conditions of the underprivileged sections of rural society. Thus, economic growth with social justice became the proclaimed objective of the planning process under rural development. It began with an emphasis on agricultural production and consequently expanded to promote productive employment opportunities for rural masses, especially the poor, by integrating production, infrastructure, human resource and institutional development measures.
During the plan periods, there have been shifting strategies for rural development. The First Plan (1951-56) was a period when community development was taken as a method and national extension services as the agency for rural development. Co-operative farming with local participation was the focus of the Second Plan (1956-61) strategy. The Third Plan (1961-66) was the period of re-strengthening the Panchayati Raj System through a democratic decentralized mechanism. Special Area Programmes were started for the development of backward areas in the Fourth Plan (1969-74). In the Fifth Plan (1974-79), the concept of minimum needs programme was introduced to eradicate poverty in rural areas. There was a paradigm shift in the strategy for rural development in the Sixth Plan (1980-85). The emphasis was on strengthening the socio-economic infrastructure in rural areas, and initiatives were taken to alleviate disparities through the Integrated Rural Development Programme (IRDP). During the Seventh Plan (1985-90), a new strategy was chalked out to create skill-based employment opportunities under different schemes. Special programmes for income generation through creation of assets, endowments and land reforms were formulated for participation by the people at the grassroots level.

The focus of the Eighth Plan (1992-97) was to build up rural infrastructure through participation of the people. Priorities were given to rural roads, minor irrigation, soil conservation and social forestry. Strategic changes were made in the Ninth Plan (1997- 2002) to promote the process of nation-building through decentralized planning. Greater role of private sector was also ensured in the development process.
The Ninth Plan laid stress on a genuine thrust towards decentralization and people’s participation in the planning process through institutional reforms. It emphasized strengthening of the panchayati raj and civil society groups for promoting transparency, accountability and responsibility in the development process. The role of the government, in general, had to shift, from being the provider, to the facilitator of development processes by creating right types of institutional infrastructure and an environment conducive to broad-based economic development.
The focus of rural development in Punjab has mostly been along the same lines as followed by the Central Government. The state government in its document on the Tenth Five Year Plan (2002-07) and the Annual Plan (2002-03) has strategically re-stressed the following thrust areas:
(i) Uninterrupted availability of power to agriculture and revitalization of the irrigation network.
(ii) Greater access to potable drinking water, better roads, better educational infrastructure particularly primary education, and extension of quality health services.
(iii) Generation of additional employment opportunities in the private sector by promoting investment, improving marketable vocational skills with widespread use of information technology.
(iv) Upliftment of underprivileged sections by enhancing beneficiary-oriented social security programmes, as well as specific employment generating programmes to increase their income and improve the quality of life.
(v) Strengthening the process of rural renewal by greater thrust to schemes for reaching out quality facilities to the rural population.
(vi) Restructuring agriculture to meet the challenges posed by WTO, through the introduction of a programme for 'second push to agriculture and allied sectors’ with emphasis on agricultural research, promotion of food processing for value addition, providing marketing infrastructure and support for agriculture including agri-export.
The strategy for rural development in the state can be seen in the expenditure pattern for various development schemes from 1965-66 till date. Table 1 shows the pattern of government expenditure on rural development programmes in Punjab. It shows that high priority was given to setting up local-level administrative infrastructure at the block level.

to promote agriculture and allied activities to meet the foodgrains requirements of the nation during 1965-66 to 1980-81. Simultaneously, as production increased, expenditure on infrastructure development, such as irrigation, communication, pavement of streets and construction of drainage and village betterment also increased. Better infrastructure further helped in increasing production. Subsequently, expenditure on institution building was initiated from 1980-81. Simultaneously, the expenditure pattern on human resource development and empowerment of underprivileged sections of the society were made progressively more favourable for upgrading skills through training for gainful employment and a better quality of life. It may be seen from the Table that significant qualitative and quantitative variations have occurred in the developmental plan strategies in the past.

s. No. Major Heads 1965-66 1970-71 1975-76 1980-81 1985-86 1990-91 1995-96 1999-2000 2000-01 ‘
1 Local Level Adm inistra tion 63.94
(50.74)99.77
(71.82)167.43(52.17)
251.89(16.70)
381.55(12.58)
759.92(16.65)
6759.87(30.53)
1839.54(25.00)
2157.79(75.58)
Block headquarters 63.94 99.77 167.43 251.89 381.55 759.92 6759.87 1839.54 2157.792 Production 34.60
(27.46)16.10
(11.59)11.29(3.52)
Animal Husbandry and Agricultural Extension 25.62 6.64 - - - - - -Rural Arts and Crafts 8.98 9.46 11.29 - - - - - -
3 Infrastructure Development 8.66(6.83)
5.96(4.29)
59.86(18.65)
591.70(39.76)
1044.26(34.43)
1394.04(30.54)
7748.20(33.36)
1315.43(17.88)
679.94(23.80)
Irrigation 3.09 _j 0.34 1.74 - - - - — —Communication 5.57 5.62 10.97 11.70 19.62 18.76 115.23 151.38 —Pavement of streets and construction of drains - - 47.15 450.00 846.47 1325.70 7532.05 * -Village betterment - - - - 125.17 - - - —Assistance to Panchayats for Panachayat Ghars - - - 70.00 20.00 18.58 38.36 7.79 2.57Matching grants to Panchayats and social bodies for development workers
- " - 50.00 33.00 31.00 62.56 35.02 10.08
Development of model villages - - - 10.00 - - - — —Disposal of sullage water - - - - - - - 14.85 62.69Community service works through NRIs participation - - - - - - - 8.00 32.13Primary School Buildings (New Construction) - - - - - - - 416.57 320.97Financial Assistance to Panchayats, Samitis & Zila Parishads - - - - - - - 903.57 251.50
4 Human Resource Development 18.14(14.42)
17.08(12.29)
81.44(25.38)
53.91(3.62)
65.87(2.17)
69.82(1.53)
6515.94(28.05)
3187.18(43.32)
5.89(0.21)
Health and rural sanitation 6.86 5.62 45.74 11.70 - 6114.70 2213.53Education 5.20 5.80 9.15 11.73 21.32 13.33 350.91 923.18 —Social education 6.08 5.66 17.53 24.98 27.07 19.76 49.65 36.78 -Composite programme for women and Pre-school children - - 9.02 5.50 11.20 9.62 0.68 # ~Assistance for integrated development of villages of historical/religious importance
- -- - - 6.28 27.11 -- - --
Purchase of Punjabi books - - - - - - - 13.69 5.895. Institu tional Development 50.80
(3.41)49.12
(1.62)
68.20
(1.49)18.61(0.08)
27.56
(0.37)11.36(0.40)
Financial assistance to Panchayats, Samitis and Zila Parishads for revenue earning schemes.
- - -- 42.80 40.00 52.64 0.91 27.56 11.36
Promoting and strengthening of Mahiia Mandals - - - 8.00 9.12 15.56 17.70 - —6 Employm ent Generation 540.00
(35.80)1491.93(49.19)
2272.02(49.77)
2224.11(10.04)
987.57(13.42)
Integrated Rural Development Programme - - - 540.00 872.18 1050.47 1125.75 — -
Rural Landless Employment Guarantee Programme - - - - 619.75 1221.55 1098.36 ** —
S.G.S.Yojana - - - - - - - 987.57 —
Grand Total 125.35(100)
138.91
(100)320.02
(100)1488.30 3032.73
_ a ? .o ).4564.00 . (100)
23226.73
(100)7357.28
. .(100)2854.98
(100)Source: Statistical Abstracts of Punjab, various issue Note : * indicates scheme head changed # Indicates scheme transferred to concerned departments Indicates scheme has ceased off. Figures in brackets are in percentage
Figures taken from Sluiislical Absnvct. Piiiijah 200J. 151

The spread of the green revolution has considerably changed the profile of the Punjab farmer from the old traditional farming to an aggressive and commercialized modern farming system. The green revolution not only brought prosperity to the Punjab farmers, but also changed their psyche, mindset and pattern of living. Structural changes started taking place in the villages. Katcha houses were progressively converted into pucca houses; the proportion of katcha houses which was 33.28 per cent in 1981, sharply declined to 12.40 per cent in 1993-94. All the villages were electrified and road links were developed in almost all the villages. The government hastened to provide irrigation facilities (by providing subsidy for tube wells and free electricity since 1997). Irrigation covers 94 per cent of the total cropped area. Simultaneously, credit facilities for farm mechanization and other inputs were extended. The majority of Punjab farmers now view agriculture as a commercial enterprise and seek more and more facilities and infrastructure support from the government for improving living conditions in the villages.
Considering the overall development that has taken place so far, much more remains to be done for improving the quality of life of rural Punjab, which has a large deprived population, consisting of marginal farmers, landless labourers, besides Scheduled Castes and Backward Classes (Table 2). This component of the population has to be brought into focus for their upliftment, with special emphasis on their skill upgradation, removal of unemployment and poverty and vertical growth to acquire productive assets for better living on a sustainable basis.
Level of infrastructure development: Development of physical as well as social infrastructure plays an important in the overall advance of the rural economy, role by directly contributing to employment generation and asset creation. Improved network of physical infrastructure facilities such as well-built roads, irrigation, rail links, power and telecommunications, information technology, food storage, cold chains, market-growth centres, processing of produce and social infrastructure support, viz., health and education, water and sanitation, and veterinary services and co-operatives are essential for the development of the rural economy, especially in the era of liberalization, privatization and globalization (LPG).
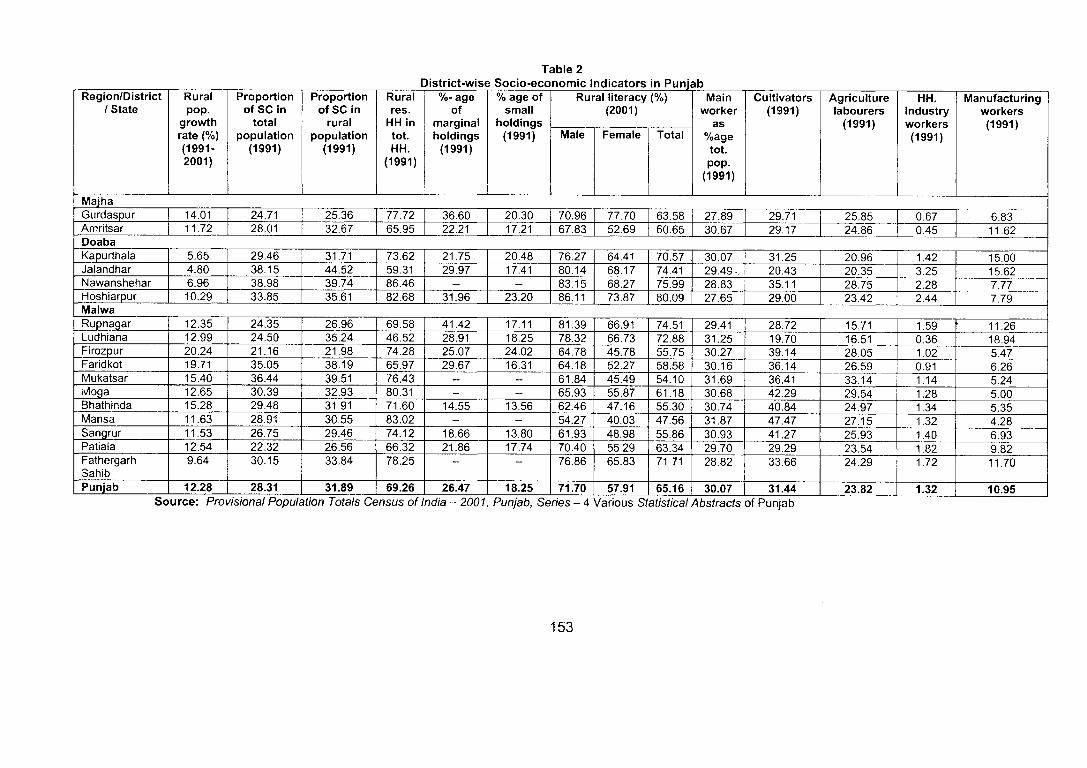
Region/District / State
Rural pop.
growth rate (%) (1991- 2001)
Proportion of SC In
total population
(1991)
Proportion of SC in
rural population
(1991)
Rural res.
HH in tot. HH.
(1991)
%- age of
marginalholdings
(1991)
% age of small
holdings (1991)
Rural literacy (%) (2001)
Mainworker
as%agetot.pop.
(1991)
Cultivators(1991)
Agriculturelabourers
(1991)
HH.Industryworkers(1991)
Manufacturingworkers(1991)
Male Female Total
MajhaGurdaspur 14.01 24.71 25.36 77.72 36.60 20.30 70.96 77.70 63.58 27.89 29.71 25.85 0.67 6.83Amritsar 11.72 28.01 32.67 65.95 22.21 17.21 67.83 52.69 60.65 30.67 29.17 24.86 0.45 11.62DoabaKapurthala 5.65 29.46 31.71 73.62 21.75 20.48 76.27 64.41 70.57 30.07 31.25 20.96 1.42 15.00Jalandhar 4.80 38.15 44.52 59.31 29.97 17.41 80.14 68.17 74.41 29.49-, 20.43 20.35 3.25 15.62Nawanshehar 6.96 38.98 39.74 86.46 - - 83.15 68.27 75.99 28.83 35.11 28.75 2.28 7.77Hoshiarpur 10.29 33.85 35.61 82.68 31.96 23.20 86.11 73.87 80.09 27.65 29.00 23.42 2.44 7.79MalwaRupnagar 12.35 24.35 26.96 69.58 41.42 17.11 81.39 66.91 74.51 29.41 28.72 15.71 1.59 ' 11.26Ludhiana 12.99 24.50 35.24 46.52 28.91 18.25 78.32 66.73 72.88 31.25 19.70 16.51 0.36 18.94Firozpur 20.24 21.16 21.98 74.28 25.07 24.02 64.78 45.78 55.75 30.27 39.14 28.05 1.02 5.47Faridkot 19.71 35.05 38.19 65.97 29.67 16.31 64.18 52.27 58.58 30.16 36.14 26.59 0.91 6.26Mukatsar 15.40 36.44 39.51 76.43 ~ - 61.84 45.49 54.10 31.69 36.41 33.14 1.14 5.24Moga 12.65 30.39 32.93 80.31 - - 65.93 55.87 61.18 30.68 42.29 29.54 1.28 5.00Bhathinda 15.28 29.48 31.91 71.60 14.55 13.56 62.46 47.16 55.30 30.74 40.84 24.97 1.34 5.35Mansa 11.63 28.91 30.55 83.02 — — 54.27 40.03 47.56 31.87 47.47 27.15 1.32 4.28Sangrur 11.53 26.75 29.46 74.12 18.66 13.80 61.93 48.98 55.86 30.93 41.27 25.93 1.40 6.93Patiala 12.54 22.32 26.56 66.32 21.86 17.74 70.40 55.29 63.34 29.70 29.29 23.54 1.82 9.82FathergarhSahib
9.64 30.15 33.84 78.25 “ — 76.86 65.83 71.71 28.82 33.66 24.29 1.72 11.70
Punjab 12.28 28.31 31.89 69.26 26.47 18.25 71.70 57.91 65.16 30.07 31.44 23.82 1.32 10.95Source: Provisional Population Totals Census of India - 2001, Punjab, Series - 4 Various Statistical Abstracts of Punjab

Punjab is relatively better placed than other states in rural infrastructure facilities, such as connectivity with pucca roads, telephone within two kilometres, percentage of cropped area irrigated, safe drinking water, primary and middle schools within the village, cent per cent rural electrification and households using electricity (Table 3).
Table 3Rural Infrastructure In Punjab
Indicators Rank of Punjab
State/s having better rank
Connected with pucca road 2 Kerala (1)Bus-stop within 2 km. 7 Kerala (1), TamilNadu (2), Andhra
Prudish (3), Karnataka (4), Gujarat (5) and Maharastra (6)
Primary school within village 4 West Bengal (1), Haryana (2) and Maharashtra (3)
Middle school within village 2 Karnataka (1)Middle school within 5 km. Range 7 Kerala (1), WestBengal (2),
Himachal Prudish (3), Bihar (4), NorthEast (5) and Rajasthan (6)
Railway station within 5 km. 9 Orissa (1), WestBengal (2), Bihar (3), TamilNadu (4), Gujarat (5), Kerala (6), Haryana (7) and Uttar Prudish (8)
Post office within 2 km. 6 Kerala (1), Andhra Prudish (1), TamilNadu (3), Gujarat (4) and WestBengal (5)
Telephone within 2 km. 4 Tamil Nadu (1), Kerala(2) and Gujarat (3)
Safe drinking water 3 Kerala (1) and Gujarat (2)% cropped irrigated area 1Source: NCAER, India Human Development Report, 1999.
However, within Punjab there are disparities between rural and urban areas (1991 Census) in accessibility of basic facilities in respect of households having pucca houses (71 % for rural and 88 % for urban), toilet facilities (16 % for rural and 73 % for urban), electricity connections (77 % for rural and 99 % for urban), safe drinking water (92 % for rural and 94 % for urban) and households having access to all the three facilities taken together (13 % for rural and 68 % for urban).
Status of human development: According to the National Human Development Report 2001, Planning Commission, Government of India, There is today, a broad based consensus to view human development in terms of, at least, three critical dimensions of well-being. These are related to longevity - the ability to live a long and healthy life; education - the ability to read, write and acquire knowledge; and command over resources - the ability to enjoy a decent standard of living and have a socially meaningful life’. Similarly, poverty is viewed not only in terms of lack of adequate income, but as a state of deprivation spanning the social, economic and needs context of the people that prevents their effective participation as equals in the development

process. In a nutshell, human development can be gauged from indicators such as level of literacy, enrollment in schools, health facilities, poverty ratios and per capita income levels.
Despite being an economically well-off state (ranked second among Indian states for per capita net state domestic product, at 1993-94 constant prices, during 1998-99), it has lagged behind in effective human resource development, especially in rural areas. The value of the human development index (HDI) for Punjab in 1991 was 0.475 (ranked 12* among Indian states and Union Territories) - 0.447 for rural Punjab (rank 1V^) and 0.566 for urban Punjab (rank 16‘ ). Gender Equality Index (GEl), estimated to reflect the relative attainments of women as against men, was 0.710 in value and Punjab ranked 19 among the Indian states and UTs, - a matter o f concern. However, in the context of HPl the state ranked seventh among the Indian states and UTs in 1991, and sixth in the case of rural Punjab.
There exist wide ranges of disparities in the attainment of education, reach of health facilities and level of poverty across rural and urban areas of the state. The literacy rate was 65.16 per cent for rural Punjab during 2001 and 79.13 per cent for urban areas (a difference of 14 per cent). This situation is even worse for females, where the margin of rural-urban divide was 17 per cent. Similar was the case with the enrollment ratios within the age group 6 to 11 years, which was 63.7 per cent for rural areas as against 71.2 per cent for urban areas in 1991. In the case of upper primary school the difference between urban and rural enrollment ratios was as high as 12 per cent. The situation for girls was even worse as the difference in the enrollment ratios was 18 per cent (11 to 14 years age group). This shows the pathetic state of basic education in rural Punjab and the differentials in the attainment levels of education across boys and girls.
The situation regarding health indicators too was no different. According to the Indian Human Development Report 1999, rural Punjab was ranked 16‘ (last) among the Indian states regarding access to health sub-centres. Data obtained from the Sample Registration System (SRS) 1998 indicate that although the crude death rate (CDR) for the state had declined from 10.4 per 1,000 population in 1971 to 7.7 in 1998, the CDR in urban areas (6.3) was significantly lower than in rural areas (8.2). The infant mortality rate (IMR) in Punjab in 1998 was estimated at 54 per 1,000 live births, which was much lower than the rate of 72 for India as a whole. However, the rural IMR (58) was at a significantly higher level than the urban IMR (40). The crude birth rate for the state in 1998 was estimated at 22.4 but, while it was 18.5 for the urban areas the corresponding estimate for the rural areas turned out to be at a much higher level at 23.7. Rural women in Punjab, on an average, give birth to about 0.7 more children than urban women; the Total Fertility Rate (TFR) for rural women was estimated at 3.0 and that for urban women 2.3.
The sex ratio in Punjab, according to the Census of 2001, was one of the lowest in the country. It declined to 874 females per 1,000 males, from 882 in 1991. In rural areas too, the sex ratio was on a lower side at 887. Within rural Punjab, the district of Fatehgarh Sahib had the lowest sex ratio (859). Further, within the age group of 0-6, Punjab had seven out of ten bottom districts with the lowest sex ratio in the country. Fatehgarh Sahib district has the lowest sex ratio for this age-group (754) in the country. Within rural areas too, is district was at the lowest level. It had 747 female children against 1,000 male

children. This reflects the low status accorded to women, especially the girl child in Punjab. The widespread practice of female foeticide has further aggravated the situation. If the trend in declining sex ratio is not checked urgently, it will have long-term irreversible implications for the society as a whole.
Table 4 highlights the sub-regional disparities with respect to accessibility of some of the basic facilities in rural areas of the state.

Region/Districts
Density of population (per sq. km.)
Croppingintensity
% of cropped area irrigated
%Villageswithwaterscarcity
Popn.servedpermedicalInst.
Popn.servedperprimaryschool
Popn.servedpermiddleschool
Popn.servedperHigh/S.SSchool
% of Inhabited villages linked with pucca road
Popn.servedpercommercialBank
Popn.servedpermarketcommittee(Squs.Kms)
Popn.servedperPostOffice
RuralFocalPoints
Sex ratio (Rural)
TotalRural
0-6agegroup
MajhaGurdaspur 438 186 99.9 30.0 4591 1031 3186 8059 100.0 16468 53.3 5549 62 895 789Amritsar 286 191 99.4 68.5 3169 1488 4242 7830 97.7 11672 32.4 4112 70 885 789DoabaKapurthala 328 195 100.0 24.5 3041 1030 2768 6682 94.1 11888 45.5 4933 22 907 773Jalandhar 427 174 99.8 37.2 3067 1259 3265 5816 100.0 11959 39.5 3433 38 904 806Nawan Sehar 417 187 88.6 58.0 2663 1221 2935 5937 99.8 13594 47.6 3354 21 914 a i lHoshiarpur 361 162 67.2 66.1 6112 969 3301 6019 99.0 15479 76.7 3221 44 947 813MalwaRupnagar 380 177 76.7 82.2 3120 933 3324 6215 97.2 12956 100.7 4223 28 869 787Ludhiana 377 195 100.0 69.3 5231 1513 3076 5317 99.4 13319 48.3 4025 38 877 812Ferozepur 249 194 99.0 74.0 3360 1254 4328 9649 89.3 18547 44.0 4907 53 893 874Faridkot 239 192 98.3 100.0 3327 1712 2844 6783 100.0 16796 38.8 5878 10 876 805Mukatsar 215 179 96.0 98.7 2437 2000 3170 5753 100.0 14684 86.4 4694 27 880 810Moga 324 197 99.9 100.0 3223 2760 3322 5787 100.0 9442 30.2 3429 20 885 820Bhatinda 259 180 95.0 100.0 3135 2580 3994 6700 100.0 15106 40.6 6247 33 868 789Mansa 254 176 88.0 100.0 3253 2091 3819 9759 100.0 20268 43.3 5791 19 875 780Sangrur 267 193 99.2 85.0 3529 1916 7927 6901 84.1 16514 20.9 6005 60 869 779Patiala 338 196 98.9 78.9 4562 1146 4098 8760 99.4 16337 37.2 6792 39 862 764FatehgarhSahib
341 189 100.0 35.8 3202 902 3203 6870 100.0 18895 48.1 4723 19 859 747
Punjab 330 187 94.5 58.5 3620 1331 3738 6970 97.3 14387 40.6 4524 597 887 795Source; Statistical Abstract, Punjab-2001

Another important indicator of the status of economic as well as human development is the incidence of poverty. Table 5 gives the percentage of population below poverty line for Punjab and India, by rural and urban residence respectively, according to the various rounds of NSS. Punjab is one of the states where the poverty ratio was less than ten per cent in 1999-2000. Estimated at 6.16 per cent in 1999-2000, it was the lowest among the Indian states. However, here too the ratio was less favourable in rural than in urban areas. (See Table 5)
Table 5____________________ Poverty Ratios n Punjab and India____________________
Year/State Area Punjab India1999-2000 Rural
UrbanTotal
6.355.756.16
27.09 23.6226.10
1993-94 RuralUrbanTotal
11.9511.3311.77
37.2732.3635.97
1987-88 RuralUrbanTotal
12.6012.9112.70
39.0640.1239.34
1983 RuralUrbanTotal
13.2023.8616.29
45.6142.1544.76
1977-78 RuralUrbanTotal
16.3727.6419.36
53.0747.4051.81
Source; 1 Report of the Expert Group on Estimation of Proportion and Number of Poor, Perspective Planning Division, Planning Commission, Government of India, New Delhi, July 1993
2 Planning Commission, Government of India.
In the present policy environment of LPG, agriculture and rural development are now poised for a paradigm shift. The core factors that can bring forth a tangible transformation are the following:
a) Reduction of rural-urban disparities in terms of economic development, employment and infrastructure.
b) Development of industry in rural areas related to agriculturaldevelopMTient, cottage industry and allied sectors.
c) All-round skill upgradation through research and extension andinformation technology, so that rural people can design means for the improvement of their own links own betterment.
d) Minimizing social differences through collective participation in ruraldevelopmental activities; developing common programmes for village improvement and to make combined efforts for eliminating or minimizing gender disparities and social evils within rural society, through the decentralized Panchayati Raj System.

To meet the incoming challenges, the above-mentioned points assume greater significance today. It is now expected that the transformation can be hastened through the effective implementation of the Panchayati Raj System, which has the constitutional authority to plan and implement programmes for rural development.
RURAL DEVELOPMENT AND PANCHAYATI RAJ INSTITUTIONS
Panchayats have been in existence since time immemorial. In the ancient period, They generally functioned as informal institutions to solve intra-village and sometimes intervillage feuds, and as organized for a for village-level social developmental and cultural activities. In the medieval period casteism and the feudal system of governance slowly eroded self-governance in the village. During the British regime ‘... the autonomy of Panchayats gradually disappeared with the establishment of local civil and criminal courts, revenue and police organizations, the increase in communications, the growth of individualism and the operation of the individual’s Ryotwari System’ {Royal Commission Report on Decentralization 1907).
In the case of Punjab, village panchayats were first set up formally after the passage of the Punjab Village Panchayat Act in 1912 under the Mantagu-Chelmsford Scheme. The Punjab Village Panchayat Act, 1921 replaced the earlier legislation. It was further followed by the Village Panchayats Act, 1939, on the initiative of the then Development Minister, Chaudhary Chottu Ram of the Unionist Party Government. At the same time, the other rural-level institution operating was the district board. There were functional links between the Panchayats and the district boards limited mostly to the improvement and expansion of rural works and some civic works.
After independence, the Indian Constitution placed the Panchayati Raj System under the Directive Principles of State Policy. In Punjab, both the institutions, namely Village Panchayats and District Board, were sought to be democratized and re-empowered through a new Act The Punjab Gram Panchayat Act, 1952. It provided for the constitution of village panchayats on a mandatory basis through universal adult franchise. The Punjab government decided to reorganize its Panchayati Raj System in 1961 on the basis of the Balwantray Mehta Committee recommendations. New additions were made for the adoption of the three-tier pattern in the Punjab Panchayat Act, with the introduction of the Panchayat Samitis and Zila Parishads Act, 1961. The new three- tier system, comprising Gram Panchayat at the village level, Panchayat Samiti at the block and Zila Parishad at the district level, became operative from 1962-63. The existing district boards were abolished. The Panchayat Samitis and Zila Parishads functioned as representative bodies upto 1970 and again from 1975 to 1978. (In the intervening period from 1970-1975, these had been dissolved). Thereafter, these two tiers remained with government officials till 1994. Elections to the Gram Panchayats (first tier) were held regularly (1952,1957, 1962,1968,1973,1978,1983,1992 and 1998) since independence, with the exception of 1988 due to the turbulent situation in the state. With the passing of the 73' Constitutional Amendment Act, 1992, the state government enacted a new panchayat Act, The Punjab Panchayati Raj Act, 1994, which came into force in place of the Gram Panchayat Act, 1952, on 21 April 1994. New rules were framed under the provisions of this new Act and the first elections to 138 Panchayat Samitis and 14 Zila Parishads were held in 1994, and 2,441 Samiti members and 274 Zila Parishad members were elected. The village Panchayat elections were held in June

1998. Recently, elections to Panchayat Samitis and Zila Parishads (which were due in 1999) were held in June 2002, for which 2,485 members of Samitis and 281 members of Zila Parishads were elected by the members of the Gram Sabhas for 140 Samitis and 17 Zila Parishads respectively (Tables 6, 7 and 8).
Table 6
Region/District 1968 1973 1 1978 1 1983 1 1992 1 1998MajhaGurdaspur 870 1056 1246 1335 1451 1589Amritsar 1009 1045 1080 1088 1164 1268DoabaKapurthala 236 340 427 449 490 533Jalandhar 833 878 1055 1084 1113 886Hoshiarpur 835 1035 1294 1350 1432 1314Nawan Shahr - - - - - 440MalwaRupnagar 611 629 716 757 805 856Ludhiana 805 824 877 884 840 871Firozepur 658 756 907 931 1036 1202Farldkot 536 542 552 552 581 180Bhatinda 481 510 516 516 278 303Sangrur 574 657 683 685 703 727Patiala 970 1059 1258 1318 1035 1063Mansa - — - - 241 243Fatehgarh Sahib - - - - 428 438Moga — — - — - 191Muktsar — — — — - 265Total 8418 9331 10611 10949 11597 12369
Source: Department of Panchayats and Rural Development, Punjab
Table 7Total Members of Elected Representatives (Ranches and Sarpanches) of Gram Panchayats during
1968-1998Region/District 1 1968 11 1973 11 1978 11 1983 1 1992 1 1998
MajhaGurdaspur 4942 5963 7746 7683 10748 10677Amhtsar 6638 6985 8234 7176 8951 9328DoabaKapurthala 1431 2092 2918 3440 3032 3554Jalandhar 5159 5988 7602 7049 8211 6229Hoshiarpur 5106 5576 7191 7224 10696 8705Nawan Shahr - ~ - - 3103MalwaRupnagar 3195 3415 4948 5978 6380 5676Ludhiana 4676 4780 6327 5167 6428 6540Firozepur 4371 5082 5848 6250 6342 8341Fridkot 3581 3748 4417 4339 4806 1418Bhatinda 3055 3380 3893 4392 2407 2589Sangrur 3807 3833 5226 5239 4932 6067Patiala 5728 6424 9060 9078 7366 7001Mansa - - - - 2005 2013Fatehgarh Sahib - - - - 2807 2754Moga - - - - — 1690Muktsar - - - - - 2157Total 51689 57266 73410 73015 85111 87842Source: Department of Panchayats and Rural Development, Punjab

The 73' Constitutional Amendment Act, 1992 has given the mandate to establish a three-tier structure (Gram Panchayat, Panchayat Samiti and Zila Parishad) of the Panchayati Raj Institutions, enabling them to assume the role of self-governing institutions at micro-levels of administration for decentralized planning and management. The emphasis was on constituting a Gram Sabha for each village for exercising powers and performing the functions provided in the 11* Schedule under Section 243G. It provided an institution for the association of lakhs and lakhs of rural voters, both men and women, in the governance by managing local affairs in a more meaningful and appropriate manner conforming to local wishes and aspirations. This constitutional status of the PRIs has also empowered women and Scheduled Castes in the capacity of chairpersons by providing reservation for participating in the decision making process. Further 29 subjects have been exclusively transferred to the PRIs for micro-planning and implementation, for economic development with social justice.
Table 8______ Total Number of Scheduled Caste and Women Sarpanches during 1978-1998______
Region/District
Scheduled Castes
1978 1983 1992
Women
1998 1978 1983 1992 1998GEN SC Total
MajhaGurdaspur 124 100 92 266 27 19 30 396 130 526Amritsar 44 32 32 278 26 278 139 417DoabaKapurthala 59 49 67 111 11 122 61 183Jalandhar 257 217 45 252 25 163 136 299Hoshiarpur 186 202 201 313 17 13 21 286 151 437Nawan Shahr 112 92 55 147MaiwaRupnagar 65 51 20 143 18 206 68 274Ludhiana 46 41 49 206 12 186 103 289Firozepur 21 16 25 166 12 11 320 86 406Fridkot 14 45 13 12 36 23 59Bhatinda 16 62 67 36 103SangCur 31 13 29 140 170 72 242Patiala 104 37 58 153 16 11 281 76 357Mansa 51 25 79FatehgarhSahib
24 90 103 42 145
Moga 42 41 22 63Muktsar 69 53 35 88
Total 961 774 671 2499 197 79 121 2854 1260 4114Source: Department of Rural Development and Panchayat, Punjab
It is imperative to increase and upgrade their knowledge, administrative and technical skills, leadership qualities and governance capabilities, through massive education, research and training for planning and implementation of the 29 subjects mentioned in the Eleventh Schedule, to ensure the effective performance of functions and powers by the representatives of PRIs,. These subjects could further be clubbed into five clusters, viz., agriculture and allied activities, rural industrialization, infrastructure development, human development and social welfare and gender development (Annexure I). Once these elected representatives are converted into more effective human resources, they

will automatically become trainers for the members of the Gram Sabha (co-rulers in rural governance). This will enable every rural adult to be converted into a valuable human resource, capable of contributing to rural development and its sustenance. A well designed training programme has the capacity to reinforce the concept of integrated development, by giving the right direction to the otherwise disjointed development approaches, through inbuilt co-ordination between the state, PRIs and all stakeholders. It can also secure the horizontal as well as vertical co-ordination among a large number of local bodies functioning side by side.
Adequate research has not been conducted to develop an alternative model for sustainable development of rural Punjab. Though Punjab Agricultural University has succeeded in developing the agriculture and allied sectors, it has not yet evolved an integrated/holistic model for rural development. For this, there is need to set up a minimum of four zonal centres (one each in Majha and Doaba cultural zones and two in Malwa Zone) for conducting research on issues and problems of rural society and suggest viable solutions for policy planning. These centres should impart training and education to the representatives of local governance (PRIs), co-operatives, mahila mandals, youth clubs and other stakeholders, if any, about their roles and responsibilities, and also promote appropriate rural technologies and skills for human development. So far, Punjab has lagged behind in skill upgradation of its human resources. What is needed now Is a long-term policy for development of human resources, through education, training, empowerment of PRIs and the creation of a congenial socio-economic, institutional and political environment. Human resources are inexhaustible and renewable, and these are the only resources which can sustain development for a longer period. Human beings are both the end and the means of development. The proposed centers, as suggested above would help to fulfill the aforesaid objectives*.
The experience of CRRID in conducting the training and education programme for the representatives of PRIs has reinforced its importance, especially in areas which affect the pace of rural development. So far, CRRID has successfully conducted four state- level conferences, four district-level conferences and 126 block-level workshops in 11 districts of the state, at which 11,493 representatives of PRIs (Table 9) were educated about their roles and responsibilities provided in the Punjab Panchayati Raj Act, 1994, encompassing broad aspects of rural development (listed in the 11* Schedule). The consequent assessment and evaluation of the training and education programme indicated the need for continuation of training to facilitate sustainable rural development.
*' It may be mentioned here that Punjab has a State Institute of Rural Development (SIRD) at Nabha and a Community Development Centre at Batala, which cater mainly to the training needs of government functionanes. These are grossly inadequate to meet the requirements of training of elected
representatives of PRIs. q 2

Number of Training Workshops for the Representatives of Panchayatl Raj Institutions_____ Conducted by CRRID_____
Sr.No.
Year Number of workshops/ conference
Level Number of participants’'
1998 Block 1051999 @ Block 3152000 State 652000 Block 1112001 State 436
10 2001 District 49611 2001 48 Block 179512 2002 (upto14‘
August)21 Block 875
Total 134 All 11493Note: * Participants comprised of representatives of Panchayati Raj Institutions including
members of all the three tiers. Due representation was given to women and SC members in the workshops/conferences.
@ From 1999 to 2001, the participants were mainly from the Gram Panchayats, as elections to the other two Panchayat bodies were held in 2002.
At present there are 87,842 nnembers of Gram Panchayats, 2,485 nnennbers of Panchayat Samitis and 281 members of Ziia Parishads. It is estimated that a sum of Rs. 11 crores would be needed for carrying out a one-time training programme to enhance their capacity-building through their training and education, (TablelO). It is also necessary to build-in a reorientation-training programme, for which a separate budget should be worked out every year.
Table 10Action Plan for Education, Training and Empowerment of the Elected Representatives of
PRIsParticulars Number
of PRIsTotal No. of electedrepresentatives
Proposed No. of training workshops
Expenditureperparticipant* (In Rs.)
Total Expenditurerequired(in Rs.)
GramPanchayats
12369 87842 1757 1200 10,54,10,400.00
PanchayatSamitis
140 2485 140 1500 37,27,500.00
ZilaParishads
17 281 17 2000 5,62,00.00
Total 12526 90568 1914 10,97,00,300.00Note: *Based on CRRID’S Two Day B
PRIsock Level Training Programmes for representative of
The new orientation requires attitudinal change to develop a vast base of human resource. At the present stage, when PRIs have yet to take firm root, it is important that they win the acceptability and confidence of the people through efficient implementation of development programmes, rather than be perceived as organs of state power Furthermore, the Eleventh Schedule covers all the three levels of Panchayats and there

is an apparent overlap of functions. Therefore, demarcation of operational responsibility between one level of Panchayats and another has to be made specifically v\/ith reference to each programme or activity. The number of plan schemes, as mentioned in the said document, literally runs into hundreds. Each of them has to be examined to see what the state government should retain and what should be entrusted to the district/intermediate/Gram Panchayats. Such demarcation cannot first be a one-time exercise, and will require periodical dissemination of information, education and training.
Preparation of multilevel integrated village plans, together with budget estimates, is another essential prerequisite for Panchayati Raj Institutions. Article 243 G has made it clear that the primary role of the Panchayats will be in the area of development, planning and implementation of programmes of economic development with social justice.
There is immediate need to study the potential of rural industrialization for creation of employment opportunities in rural areas, in the context of the 73 Amendment Act, 1992. The demand for encouraging the setting up of rural industrial enterprises is^going to be generated with the mandate to plan as well as implement the work-plan on the subjects transferred to the PRIs. A close look at the 29 subjects provides a clear picture of the potentials of setting up all types of industries in rural areas. This is high time that the state government should consider it seriously.
The time is also ripe for the state government to have a dialogue with such international organizations as the (nternatlonaf Labour Organisation (ILO) and the corporate sector/industrial houses to work out operational plans for capacity building on the one hand, and evolve clearly-designed operational strategies for promoting enterprises for the manufacture of products, demands for which are going to be generated by the decentralized activities in the context of the 73'^ Amendment on the other. The operational strategy is sure to get the support of the Government of India in view of its pronouncement to have a National Programme for Rural Industrialization (NPRI), proposing to set up 100 rural clusters every year to give a boost to rural industrialization. It is being done for the benefit of artisans and unemployed youth. It is perceived to reduce rural-urban disparities. It will also go a long way in the marketing of rural industrial products.
Moreover, the objectives of the Panchayati Raj system could be revitalized by transferring funds, functions and functionaries, as provided in the 73 Constitutional Amendment Act, 1992 and Punjab Panchayati Raj Act, 1994. In the changed situation, PRIs will have to be viewed as institutions of local self-government, not as implementing agencies for Centre and State Government Programmes, but as institutions to prepare micro-plans and also to implement them. Active participation of women and Scheduled Caste representatives has to be ensured in decision making for building, promoting and empowering the new leadership of women and Scheduled Castes. For this, Panchayati Raj Institutions will have to be strengthened. Strengthened PRIs will demand a understanding of their role, systems of governance, accountability, transparency and interlinkages. Comparative state-wise studies of PRIs, carried out by the National Institute of Rural Development, Hyderabad, have clearly brought out the differences in governance of PRIs where powers and responsibilities have been transferred and where these have not been transferred.
The First Punjab Finance Commission, in its recommendations, stressed the devolution of funds from the state government to PRIs for improving their financial position. The

state government had accepted for implementation, witii effect from 1 January 1997, the recommendation for transferring 20 per cent of the net proceeds of five taxes: stamp duty, Punjab motor vehicles tax, electricity duty, entertainment tax and entertainment cinematograph shows tax. Other recommendations of the Finance Commission have been sent to the departments concerned for comments. According to the recommendation of the First Finance Commission, the 20 per cent share of the receipts of these five taxes, amounting to Rs. 607.29 crore over the five years 1996-97 to 2000- 01, was to be transferred to PRIs and ULBs (Table 11).
Table 11Amount to be Transferred to PRIs/ULBs from Five Divisible State Taxes and Amount Actually Given
_____ (in Rs. crore)______Year Receipt
fromdivisible
taxes
Costof
collection
Netreceipt
20%share
net
Original budget outlay
for PRIs
Amount Transfe
rred to PRIs
Short fall of PRIs
Original budget
outlay for ULBs
Amount Transfer
red to ULBs
Shortfall of ULBs
1 3(1-2)
10i8z9)_
1996-97 450.54 5.15 445.39 89.07 11.89 11.891997-98 476.59 6.03 470.56 94.11 55.77 26.92 28.85 50.97 36.26 14.711998-99 542.21 12.81 529.40 105.88 59.47 8.53 50.94 45.57 10.82 34.751999-00 701.26 11.36 689.90 137.98 63.37 31.48 31.89 40.00 13.18 26.822000-01 912.63 11.42 901.20 180.24 54.00 14.70 39.30 32.22 17.78 14.44Total 3083.23 46.77 3036.45 607.29 232.61 81,63 150.98 180.65 78.04 102.61
Source: (i) Department of Finance, Punjab(ii) Annual Plan Documents 1997-98 to 2001-2002(iii) Department of Local Government Punjab
‘The funds, which were due to PRIs as their share of divisible taxes but have not been transferred to them, would have made considerable difference to their financial position’ (Second Punjab Financial Commission Report). Even the provision for the transfer of share of the divisible tax as budgeted has not been in accordance with the recommendations of First Finance Commission. The share of PRIs becomes Rs.607.29 crore x 232.61/413.26 = Rs. 341.55 crore, but the original budget outlay was Rs. 232.61 crore resulting in an amount of Rs. 150.98 crore from the budget outlay (actual Rs. 259.92 crore) not being given to PRIs.
For strengthening the Panchayati Raj System and its institutions the state must take initiatives on: transfer of functions, finances and functionaries to the Panchayati Raj Institutions; empowerment of the Gram Sabha; replacement of the District Development Planning Boards by District Planning Committees: integration of development funds allotted to MPs with the funds of Zila Parishads; decision of the state government on the recommendations of the State Finance Commissions within a specified period; ensuring training of all newly elected representatives within a year of their election and organizing refresher courses periodically.
The ongoing programme of training and empowerment of representatives of PRIs being organized by CRRID in Punjab, and sponsored by UNICEF, has brought out clearly the significance of such training programmes. Participants have been unanimous that these should be at the local level and within a year immediately after the elections. Women and Scheduled Castes representatives, in particular, stressed the need for these training programmes. In general, the participants opined that such training programmes, as conducted by CRRID, would considerably help elected representatives to understand the process of decentralized planning and devolution of powers to PRIs through transfer of funds, functions and functionaries. It is apparent from the above observations that

unless these powers are fully devolved, the PRIs will not be able to perform their duties, especially in village planning.
Skill upgradation-an Indigenous approach: Mahatma Gandhi had been a champion of rural self-sufficiency in resource utilization, governance and other aspects for the welfare of the rural community. He also emphasized the concept of Nai Talim (basic education), aimed at educating the rural youth for solving rural problems. The idea of rural institutes has been finding place in the recommendations of various education commissions starting from Dr. Radhakrishnan Commission of 1949. Subsequent to this a rural-based agricultural university was set up at Pant Nagar in Uttar Pradesh in 1960 and the second university in 1962 at Ludhiana. When India was passing through a phase of grain shortage, the entire attention of the agricultural universities was on research, development and extension of agriculture. In the process, rural development programmes, a task originally meant for State Agriculture Universities (SAUs) were lost sight of.
In view of the Constitutional Amendment Act, 1992, the time has come when rural development programmes and activities must take a front seat. It is in this context that the National Council of Rural Institutes (NCRI) has started considering introduction of rural higher education programmes, primarily based on the Nai Talim concept, in accordance with local needs and requirements of the people who have not so far been incorporated in mainstream higher education, covering directly dimensions of research, teaching, extension and networking. It is with the introduction of this type of a rural education programme that the Panchayati Raj System will get the needed strength for understanding and resolving local rural problems. The ultimate goal is the development of able and responsible human beings, fully competent to organize and eventually lead a profession to new heights of accomplishment in the service of the society.
Most of our learning in the higher institutes is_ based upon hypotheses, concepts and theories evolved by western scholars including rural sociologists, which has limited application to our rural development. Rural problems of Punjab, as for that matter every state of the Indian Union, are different and unlike the West whose concepts and theories have been applied in the past for the developmental processes. In the context of rural development, indigenization of concepts and theories are essential for understanding and resolving the issues that confront state governments, Panchayati Raj Institutions and stakeholders. This calls for Indianization of social science research, particularly relating to rural areas. Such an approach, if adopted in social science research, is likely to provide solutions to problems of bringing about rural transformation at a faster pace.
Punjab’s rural society has its own identity and psyche, traditions, culture and heritage. Therefore, these must be considered a part of overall rural developmental strategies, with emphasis on the explicit recognition of Punjabi identity. The social factors dominant in the Punjabi style of living and working, when compared with Indian standards, are qualitatively better in some respects (Table 3). While much reform is needed to speed up rural transformation in Punjab, some of the areas that need immediate attention are given below.
RURAL NON-FARM SECTOR
The contribution of Punjab to India’s net domestic product (NDP) in 1999-2000(at current prices) was estimated at 3.45 per cent. According to the 2001 Census, while nearly three-fourths of India’s population lived in rural areas, in Punjab this was around two-

thirds. Further while two-fifths of the state’s NDP came from its agriculture and allied sector, for the rest of the country it was less than one-third. The rural-urban divide in income distribution in Punjab was not as pronounced as at the all-India level. The Census also highlights the dominant role that agriculture continues to play in Punjab in shaping the level of living of its people (Table 12).
Table 12Sector-wise Share of Punjab in Net Domestic Product of India by Economic Activity (1999-
Economic Activity India Punjab Share of PunjabPrimary 489019 23352.05 4.78Secondary 343467 12411.70 3.58Tertiary 770246 19706.37 2.56Total 1605732 55470.12 3.45Sourc^: Statistical Abstract of India-2000
Statistical Abstract of Punjab-2001
In Punjab, while the share of the primary sector in the net state domestic product has come down from 49.13 per cent in 1980-81 to 38.66 per cent in 2000-01 (at 1993-94 constant prices), for the secondary sector it has increased from 20.01 per cent to 24.9 per cent and that of the tertiary sector from 30.86 per cent to 36.44 per cent, (for details see Table 13)
The rural non-farm sector, with its forward and backward linkages, is an integral part of overall rural development, which has not yet received due attention in Punjab. Table 14 gives the percentage shift of rural non-farm employment and shares of the secondary and tertiary sectors in Punjab. It is evident that there has been a sharp decline in the share of employment under household industry from 9.96 per cent of the total workforce in 1981 to 4.53 per cent in 1991. Similarly, under the non-household industry group it has marginally declined to 21.25 per cent in 1991 from 22.29 per cent in 1981. On the other hand, the share of employment in construction has increased from 6.80 per cent in 1981 to 7.25 per cent in 1991. A significant increase was also found in the category 'other services’, from 33.33 per cent to 41.11 per cent during this period. For district- wise details see Annex II.
Table 13
Sectors 1980-81* 1990-91* 2000-01 **(Q)Agriculture 33.76 31.25 25.90Livestock 14.44 15.23 12.26Sub-total Primary 49.13 47.13 38.66Registered manufacturing 6.70 10,13 10.78Unregistered manufacturing 4.96 6.70 5.21Construction 5.71 3.25 6.25Electricity & v\/ater supply 2.64 3.80 2.66Sub-total Secondary 20.01 24.38 24.90Transport, communication and storage 2.61 3.12 5.15Trade, hotel and restaurants 13.10 10.39 12.59Banking and insurance 2.30 4.07 5.44Real estate and ownership of dwelling 4.77 3.50 4.15Public administration 2.85 3.35 5.05Other services 5.30 4.06 4.06Sub-total Tertiary 30.86 28.49 36.44Grand Total 100 100 100
Source: Statistical Abstract of Punjab various issues Note : Quick estimates
at 1980-81 constant prices ** - at 1993-94 constant prices

Percentage Shift of Rural Non-farm Employment and Shares of Secondary and Tertiary Sectors inPunjab during 1981 and 1991
1981 1991Household industry 9.96 4.53Non-household industry 22.29 21.25Construction 6.80 7.25Trade & commerce 17.41 16.79Transport, storage & communications 10.16 9.97Other services 33.33 41.11
Source; Director of Census Operation Punjab, Census o f India 1981, 1991.
Table 15_______Percentage Distribution of Workers by Category-Punjab 1981-2001
Total/rural
urban
Person/male
femalesCultivators
Percentage Distribution of Total WorkersAgriculturelabourers
Workers in household industry
Other workers
1981 1991 2001 1981 1991 2001 1981 1991 2001 1981 1991 2001Total Persons 35.9 31.4 23.0 22.2 23.8 16.4 2.6 1.3 3.4 39.4 43.4 57.3
Mates 37.0 32.5 26.0 22.1 23.8 15.9 2.5 1.3 2.3 38.5 42.5 35.8Females 5.9 8.7 13.0 25.3 24.4 17.9 4.9 3.2 7.0 64.0 63.8 62.0
Rural Persons 47.7 42.8 31.5 28.5 30.8 22.0 2.3 1.2 3.1 21.5 25.3 43.4Males 48.8 43.8 37.6 28.1 30.4 22.5 2.2 1.1 1.8 20.9 24.8 38.2Females 9.7 15.0 15.4 42.6 41.5 20.8 5.7 3.4 6.7 42.0 40.1 57.1
Urban Persons 5.1 4.2 3.2 5.7 7.2 3.4 3.4 1.7 3.9 85.5 86.5 89.5Males 5.3 4.4 3.4 5.8 7.5 3.3 3.4 1.6 3.2 85.5 86.5 90.1Females 1.2 1.1 1.8 4.1 3.6 4.3 3.8 2.9 8.5 90.9 92.5 85.4
Source; Census o f India-2001
The data in Table 14 throw light on the state of the ongoing non-farm activities in Punjab. The share of employment in the manufacturing sector (household and non-household industry) is declining and increasing in the services sector. Within the service sector, however, trade and commerce and transport, storage and communication, which should have been growing and employing more persons, have been showing a downward trend in the share of total employment. Adequate provision of these services would have given fillip to the manufacturing sector as well.
Table 15 gives the percentage distribution of workers by categories for rural and urban Punjab from 1981 to 2001. Only 3.1 per cent of the rural workforce has been engaged in the household industry. The percentage share of 'other workers’ in rural areas has increased from 21.5 per cent in 1981 to 43.4 per cent in 2001, whereas that of other workers in urban areas has increased marginally from 85.8 per cent to 89.5 per cent during the corresponding period. 'Other workers’ mainly include government servants, teachers, plantation workers, those engaged in trade, commerce, business, transport, storage, banking, construction, political or social work, priests, entertainment, artists, etc.
Out-migration of the rural population in search of jobs has not only resulted in overburdening urban resources but has also forced the labourforce (displaced from the rural economy) to live in slum-like situations in urban centres. It is necessary to create better socially acceptable employment opportunities by developing the non-farm sector in rural areas, to stop the migration of the rural unemployed to urban areas. For this, minimum basic facilities, such as availability of safe drinking water, proper sanitation and sewerage, better rural health and education and community social assets, wherever existing, have to be utilized effectively and developed where non-existent. The need is to mobilize and involve the community for the proper maintenance of the facilities available at the local level, preferably under Panchayati Raj Institutions.

The corporate sector can play a major role by bringing resources, new technology, modern management and extension services to the local people, which can facilitate provision of employment opportunities for the rural unemployed in secondary and tertiary sectors, by training them for the required jobs. For example, agriculture in Punjab is already over-capitalized in the case of farm machinery, usages of fertilizers and pesticides. Local people could be trained for maintenance and repair services, input delivery services by acting as servicing agents, as Mahindra Shubh Labh Services Limited have done in Tamil Nadu and Rajasthan, which has helped both agriculturists (by increasing farm production) and non-agriculturists (by providing employment in nonagriculture sectors). In short, the service sector for agriculture can be developed profitably by the corporate sector.
RURAL INFRASTRUCTURE DEVELOPMENT
Punjab has set up the Punjab Infrastructure Development Board (PIDB), Punjab State Agriculture Marketing Board (PSAMB) and Punjab Agro-Industry Corporation (PAIC) for the development of infrastructure in the state, for the construction and repair of roads, bridges and national highways including village and town roads, regulated markets, sub- market yards, purchase centres, development of food parks having the facilities of research and development centres, procurement centres, cold-storage space, transportation hub, facilities for sorting, grading and quality assurance, food processing centres and other facilities.
Punjab contributes 45 per cent of rice and 65 per cent of wheat to the central pool. Punjab State Agricultural Marketing Board operates through its 144 market committees for procurement of foodgrains. In addition, 207 sub-market yards and 1,191 purchase centres are opened during the wheat and paddy seasons. Market committees are service-rendering agencies and their main source of income is the market fee. The existing rate of market fee has been fixed at two per cent on an advalorem basis for all purchase /sale transactions of agricultural produce. In addition, the Rural Development Board also levies two per cent Rural Development Fund (RDF) on the purchase/sale of agricultural produce under the Rural Development Fund Act. The market committees have been made the collecting agencies for both the market fee and RDF. RDF is to be used for the construction/repair of village link roads and the development of villages.
TalArrivals of Wheat and
}le 16Paddy (in lak li tonnes)
Crop/ Year 1997-98 1998-99 1999-2000 2000-2001 2001-2002 (upto Feb.
2002)Paddy 98.54 96.19 111.33 119.55 119.55Wheat 65.07 79.56 79.56 97.23 105.91
Source: Punjab State /
Collect
Agricultural Marketing Board, Chandigarh
Table 17ion of Market Fee during Last Five Years (Rs. in Crore)
S. No. Year Total market fee1 1997-98 174.602 1998-99 175.743 1999-00 231.424 2000-01 270.205 1.4.2001— 28.2.2002 293.02
Source; Punjab State Agricultural Marketing Board, Chandigarh

Despite these Boards and Corporations and an agriculturally developed economy, the state has lagged behind in building up required infrastructure facilities, such as storages, cold chains, food parks, agro-based industries, grading and quality assurance, marketing intelligence network and dissemination of information in rural areas.
As agriculture is the mainstay of the rural economy of Punjab, there is urgent need to set up infrastructure suitable for facilitating the backward and forward linkages to agriculture. Chinese experiences show that ‘Communes’ have played very important role in rural social transformation through the social process of rural institutional change, accompanied by technical changes as well. Not only did they help in agricultural development but also dramatically reduced rural poverty from about one-third of the rural population in 1978 to about eight per cent in 1996. This is explained by rapid, broad- based rural development, encompassing farm as well as non-farm sectors (ESCAP, UNITED NATIONS, 1996).
strategically, it is necessary to provide basic civic amenities to the rural population, which has been deficient since long. The state government now intends to adopt an approach of integrated development of rural areas by providing various basic facilities simultaneously, as indicated below:
(a) Integrated water supply and sewerage disposal system.(b) Hundred per cent brick pavement of village streets with mechanized
prefabricated bricks, with due attention to disposal of storm water.(c) Setting up bio-gas plants for disposal of sullage, water/generation of gas
for household consumption and generation of electricity.(d) Provision of electricity through solar photo-voltaic and windmills in an
integrated grid system manner.(e) Provision of street lighting, 24 hours electricity supply.(f) Setting up parks in rural areas with special emphasis on cleaning.(g) Vermiculture composting.
This requires the integration of various schemes under implementation by the Government of India as well as the state government, to ensure funding of development in a consolidated manner. The need is to strengthen decentralized, well-governed local institutions working at the village level, which have the potential for mobilizing and allocating local resources in enterprises for effective rural industrialization.
RURAL GROWTH CENTRES
Strategically, the state has had provision for the Focal Point Scheme since 1978. The objectives of this scheme are to provide full and gainful employment in the rural areas; increase agriculture production and its handling by providing marketing facilities through purchase centres; revive traditional industries to facilitate development of cottage and small-scale agro-based industries; develop and utilize local resources and ensure participation of weaker sections in the development process. There is provision for hospital, bank branch, post office branch, telephone exchange, agro-service centre, marketing yard, repair workshops, extension services of various departments, supply of petrol, diesel and cooking gas and village industries in each of the focal points. Although there are 597 rural focal points in Punjab, the desired results of providing full employment, reviving village industries, utilizing local resources and ensuring participation of weaker sections in the development process have not been very much

rewarding. This is mostly attributed to wrong selection of sites of many focal points, as these are away from natural growth centres and in some focal points, only partial services have been provided, in many focal points constructed buildings remain unutilized and under-utilized. Proper maintenance of these public utility buildings is lacking. Before starting any such big project, the government should carry out feasibility studies by conducting surveys and holding discussions with the stakeholders.
FOOD AND AGRO-INDUSTRY LINKED MARKETING SERVICES
Development of agro-based industries has a significant role in rural development, especially in an agrarian economy such as Punjab’s. These industries not only provide input services but also gainful employment opportunities to rural people. Agroprocessing basically involves value addition to farm produce. Presently Punjab is mainly involved in primary processing activities, such as rice milling, flour milling, sugar milling, cotton ginning, milk processing and cattle-feed making. Current agro-processing activities are based on the crops produced in the state, which have very limited scope for secondary processing. However, there are some secondary processing units engaged in the production of bread and biscuits, juice and jam, wood and paper in the private sector. There are 22 sugar mills, 2,042 rice shellers, 60 spinning mills and 46 milk plants in Punjab. Processing of fruits and vegetables is extremely low, despite the availability of a large quantity of raw materials.
In the past, almost one-fourth of the horticulture and vegetables were lost through wastage and spoilage, because of inadequate arrangements for cold storage transport and dehydration. Efforts of some private units to establish fruit- and vegetable- processing units could not succeed because of lack of facilities such as good roads, regular power supply, and the license-quota system, poor information networking, shortage of technical labour and supply of quality raw material.
Given the present structure of crop production, some important technologies for small and cottage processing units are: mini rice mills, mini grain mills, mini dal mills, mini wheat mills. It provides atta, suji, maida and grain, which can further be used for value addition in bigger units.
According to basic Animal Husbandry Statistics, 1999, Government of India, AHS series- 7, Punjab produces 77.74 lakh tonnes of milk, which is 11 per cent of the total milk production of the country (712.71 lakh tonnes). In this era of global trade as Punjab is number one in India in per capita availability and productivity of milk, second in milk production and 13 * in milch animal population, the state has the potential to enter global trade by promoting its dairy sector. Unfortunately, the performance of our dairy sector is poor as compared to developed countries in terms of productivity, cost effectiveness and milk quality. We could go up to 1,800 litres per lactation of buffaloes and 3,000 litres per lactation of cross-breed cows. In the case of cows, Punjab has the potential to increase the average lactation milk production to 10,000 litre per cow, which is the level prevailing in such countries as USA, Canada and Israel. The need is to improve these factors with a well-planned programme involving government, private industry and farmers, to enter the world market. Existing milk plants can play a big role in developing the milk industry. They can contribute through a better milk procurement system, quality improvements, provision of technical inputs to farmers and new product development.
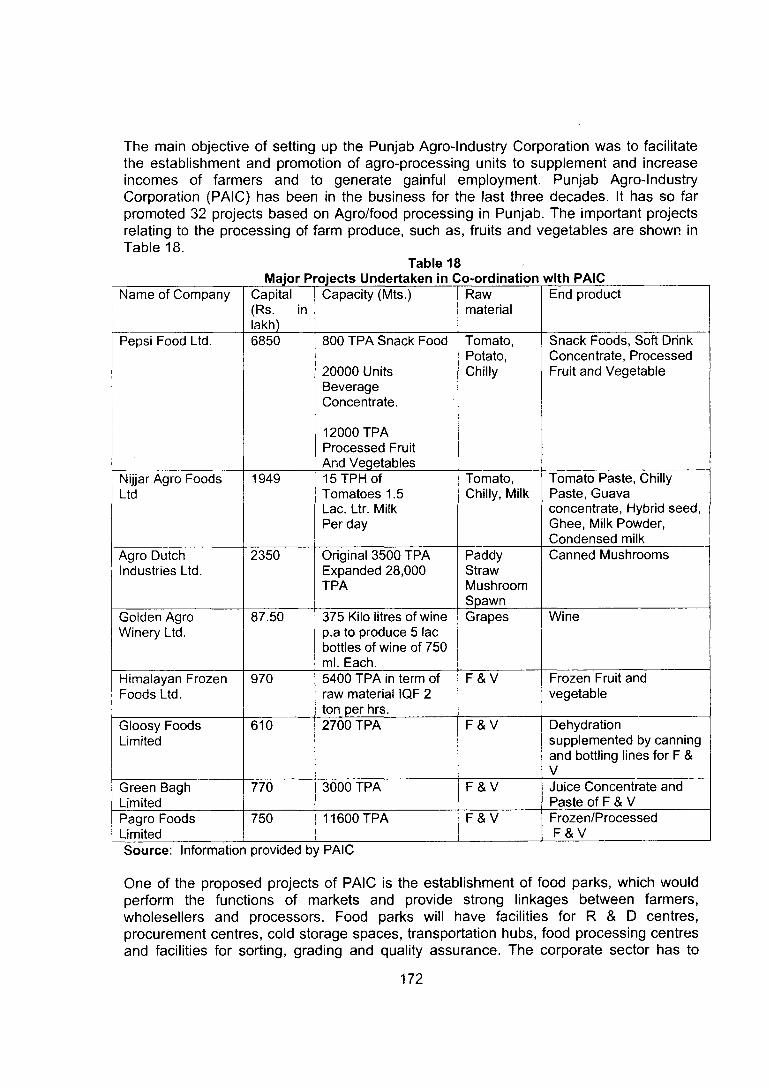
The main objective of setting up the Punjab Agro-Industry Corporation was to facilitate the establishment and promotion of agro-processing units to supplement and increase incomes of farmers and to generate gainful employment. Punjab Agro-Industry Corporation (PAIC) has been in the business for the last three decades. It has so far promoted 32 projects based on Agro/food processing in Punjab. The important projects relating to the processing of farm produce, such as, fruits and vegetables are shown in Table 18.
Table 18
Name of Company Capital (Rs. in lakh)
Capacity (Mts.) Rawmaterial
End product
Pepsi Food Ltd. 6850 800 TPA Snack Food
20000 UnitsBeverageConcentrate.
12000 TPA Processed Fruit And Vegetables
Tomato,Potato,Chilly
Snack Foods, Soft Dnnk Concentrate, Processed Fruit and Vegetable
Nijjar Agro Foods Ltd
1949 15TPH of Tomatoes 1.5 Lac. Ltr. Milk Per day
Tomato, Chilly, Milk
Tomato Paste, Chilly Paste, Guava concentrate. Hybrid seed, Ghee, Milk Powder, Condensed milk
Agro Dutch Industries Ltd.
2350 Original 3500 TPA Expanded 28,000 TPA
PaddyStrawMushroomSpawn
Canned Mushrooms
Golden Agro Winery Ltd.
87.50 375 Kilo litres of wine p.a to produce 5 lac bottles of wine of 750 ml. Each.
Grapes Wine
Himalayan Frozen Foods Ltd.
970 5400 TPA in term of raw material IQF 2 ton per hrs.
F&V Frozen Fruit and vegetable
Gloosy Foods Limited
610 2700 TPA F&V Dehydrationsupplemented by canning and bottling lines for F & V
Green Bagh Limited
770 3000 TPA F&V Juice Concentrate and Paste of F & V
Pagro Foods Limited
750 11600 TPA F&V Frozen/ProcessedF&V
Source; Information provided by PAIC
One of the proposed projects of PAIC is the establishment of food parks, which would perform the functions of markets and provide strong linkages between farmers, wholesellers and processors. Food parks will have facilities for R & D centres, procurement centres, cold storage spaces, transportation hubs, food processing centres and facilities for sorting, grading and quality assurance. The corporate sector has to

come in on a large scale to promote better backward and forward linkages with farm producers, to make the PAIC dream of food park a success. Moreover, with the WTO agreement in force, the future of agriculture in Punjab lies in the efficient use of resources, quality produce, value addition and agro-processing. Diversification of Punjab’s economy is further limited by its resource endowments. The limited resources, which are available within the state, are not being used judiciously and are creating environmental degradation, pollution, contamination and depletion of water, deforestation and soil degradation. Planners must take into account these bottlenecks while formulating the new strategic policy for agricultural development, through backward and fonA/ard linkages ideal for the international market.
Corporatization of the rural economy becomes more relevant in the changed globalized system, where market requirements of quality produce have to be met. The entry of the corporate sector will also help the farmers of Punjab diversify crops from wheat and rice to other crops. This can be done by providing awareness about quality inputs and their judicious use, ensuring their crop procurement, refrigeration, carrier, grading, cleaning, packing, branding and also helping in research and extension. Some of the well-known corporate sector units are experimenting with contracting the farmers of Punjab for growing potato, tomato and chillies in the districts of Sangrur, Bhatinda, Mansa, Moga, Ludhiana, Kapurthala, Hoshiarpur and Amritsar. The recent field experience of CRRID with Mahindra Subh Labh Services Limited (MSSL), Mumbai, shows that the farmers of the state are showing a keen interest to grow crops according to the requirements of the corporate sector, provided it protects the existing minimum returns and assures marketing of the produce.
RURAL POVERTY ALLEVIATION PROGRAMME
India has a long history of government intervention in the rural sector of its economy. India’s development strategies have accorded high priority to agriculture and rural development. The Community Development Programme (CDP) reflected India’s concern for nation-building and equity. The Intensive Agriculture Development Programme (lADP) employed the selective principle in deploying resources for achieving rapid production gains, ensuring thereby the equity concern of the CDP. Its main objective was to achieve rapid increase in agricultural production through the use of complementary inputs and services at the farm level. A number of programmes, such as the Intensive Agricultural Area Programme (lAAP), the High Yielding Varieties Programme (HYVP) and the Intensive Cattle Development Programme (ICPD) had been patterned like the lADP. The lesson learnt from these programmes was that a rising economic growth rate was no guarantee against poverty and unemployment. The growing inter-regional and inter-personal disparities that surfaced from these selective growth-oriented programmes led to a re-examination of the development strategies. As a consequence, special programmes, such as Small Farmer Development Agency (SFDA), Marginal Farmers and Agricultural Labourers Schemes (MFALS), Drought Prone Area Programme (DPAP) and Tribal Area Development Programme (TADP) were introduced for the weaker sections and the economically depressed areas in the seventies. These programmes were aimed at tackling the problems of poverty and backwardness by helping the weaker sections to increase their incomes through seif- employment and wage-paid employment. A Minimum Needs Programme (MNP) was also launched, to supplement the income-increasing effect of these programmes in order

to provide civic amenities and community facilities in rural areas. In 1978-79, the principal contents of Community Area Development (CAD), DPAD, MFAL, SFDA were all integrated into a new programme. Integrated Rural Development Programme (IRDP) for providing income generating assets and self-employment opportunities to the rural poor.
A series of special employment programmes were also initiated in the seventies, namely. Rural Works Programme (RWP), Crash Scheme of Rural Employment (CSRE), Pilot Intensive Rural Employment Projects (PIREP), Employment Guarantee Schemes (EGS), Food for Work Progarmmes (FFWP), National Rural Employment Progarmme (NREP) and Rural Landless Employment Guarantee Programme (RLEGP), to address the acute unemployment situation in rural areas. The experiences of these progarmmes indicated the need for more concentrated efforts to tackle the problems of rural unemployment and construction of public works under the schemes. Keeping this in view, the Jawahar Rojgar Yojana (JRY) was launched in April 1989 by merging the two ongoing NREP and RLEGP into a single rural employment programme. Consequently, on 1 April 1999 the Jawahar Gram Samridhi Yojana (JGSY) was started to ensure development of rural infrastructure at the village level by restructuring the erstwhile JRY.
The Employment Assurance Scheme (EAS) was launched on 2 October 1993 to make larger and efficient use of available human resources for alleviation of poverty, reduction in inequalities and sustenance of a reasonable high pace of economic growth. Subsequently, the Jawahar Rozgar Yojana (JRY) has been merged with the EAS since 1 January 1996. It now covers all the rural blocks of the country. The scheme aims at providing assured employment of 100 days of unskilled manual work in a year to the rural poor, who are in need of employment and seek it. The second objective is the creation of economic infrastructure and community assets for sustained production and employment generation. The programme is restricted to males and females above 18 years and below 60 years of age. A maximum of two adults per family are to be provided assured employment for 100 days under the scheme.
The newly launched centrally sponsored Swarn Jayanti Gram Swayrozgar Yojana (SGSY) has been revised keeping in view experiences of the strength and weaknesses of earlier self-employment programmes, viz., IRDP, Training of Rural Youth for Self- Employment (TRYSEM), Development of Women and Children in Rural Areas (DWCRA), Supply of Improved Toolkits to Rural Artisans (SITRA), Ganga Kalyan Yojana (GKY) and Million Wells Schemes (MWS), which are no longer in operation. SSGY has been started from 1 April 1999. It is a comprehensive self-employment, programme for the rural poor and is conceived as a holistic scheme of micro-enterprises covering various aspects of self-employment, viz., organization of the rural poor in Self Help Groups (SHG), capacity building, training, planning of activities clusters, infrastructure buildup, technology, credit and marketing. Thus emphasis in rural development has progressively shifted from growth to welfare and then from a responsive to an integrated approach.
Punjab had been implementing these centrally sponsored programmes since the Sixth Five Year Plan. The plan-wise actual expenditure for different five vear plans is shown in Table 19.

Table 19Rural Deve opment under Five-Year Plans (Actual Expenditure) (Rs. in lakh)
T^Plan (1985-90)
Sub-head of development
^P la n (1992-97)
9^Plan (1997-2001
Actual Exp. % age to total Exp. on Rural
Dev.
ActualExp.
% age to total Exp. on Rural
Dev.
Actual Exp. % age to total Exp. on Rural
Dev.Community Development and Panchayats
2803.72 28.41
IRDP 3043.45 30.84 2977.24 16.43 1572.42 6.27National RuralEmploymentProgramme
1667.35 16.89
Jawahar Rojgar Yojna________
1705.34 9.41 3831.01 15.28
OtherProgrammme like employment guarantee programme, land reforms
9.30 0.09 13436.46 74.16 19664.44 78.44
Kandi watershed and area development programme
2247.00 22.77
Integrated RuralEnergyProgramme
97.00 0.98
Total RuralDevelopmentExpenditure
9867.82 100.00 18119.04 25067.87 100.00
Total Plan Expenditure
354716.55 681933.76
7812618.18
Percentage of RuralExpenditure to Total Plan Expenditure
2.78 2.65 3.21
Source: Various Statistical Abstracts of Punjab, Government of Punjab
The poverty ratio of Punjab has always been on the lower side throughout the plan periods. Currently, it is 6.16 per cent as compared to 26.1 per cent for India. The green revolution of the mid-sixties and early seventies has helped the rural poor of Punjab as the benefits from increased agricultural production have ‘trickled down’ to the poor, to some extent.
The target group of these centrally sponsored schemes consists of small and marginal farmers, agricultural labourers and rural artisans, including the disadvantaged sections of the society, such as the Scheduled Castes, physically handicapped and women. The financial and physical achievements of various centrally sponsored schemes during the Ninth Five Year Plan are as follows:

Swaranjayanti Gram Swarozgar Yojana (SGSY): SGSY was started on 1 April 1999. During 2001-2002 the Government of India allocated funds amounting to Rs. 440.29 lakh to Punjab on a 75:25 sharing basis. During 2001-02 (upto January, 2002), out of the total available funds of Rs. 544.43 lakh, Rs. 435.84 lakh, that is 80 per cent, has been utilized. During the same year, 169 Self Help Groups were formed. Of these 59 SHGs (including those formed in the previous year), covering 632 members, started economic activities. The total assistance, amounting to Rs. 159.49 lakh, has been provided to these groups. In addition to this, 3,019 individual swarozgaris have also been assisted and, assistance amounting to Rs. 1,143.62 lakh provided. Out of the total assisted swarozgaries, 57 per cent were SCs, 24 per cent women and one per cent disabled. For 2002-2003 the state has proposed Rs. 1,050.00 lakh for SGSY to benefit 6,500 swarozgaries. Table 20 gives details of financial and physical achievements under SGSY during the Ninth Five Year Plan (up to February 2002).
Table 20Financial and Physical Achievement under SGSY Scheme during
Item 1997-98 to 2001-02 Percent to totalTotal funds available 4396.87 -
Total expenditure 4003.64 91.0Total beneficiaries/ swarozgaries assisted (No.) .........................
35167 -
SC 19580 55.7Women 13599 38.7Handicapped 436 1.2
Source; Data provided by the office of JDC (RD), Government of Punjab, Chandigarh.
Sampoorna Grameen Rozgar Yojana (SGRY): The government of India launched a new centrally sponsored scheme, Sampoorna Grameen Rozgar Yojana (SGRY), involving an annual expenditure of Rs. 10,000 crore on 25 September 2001. Under the Scheme, 50 lakh tonnes of foodgrains (worth Rs. 5,000 crore, calculated at Rs. 10 kg) are to be provided every year to all the States and UTs free of cost and the remaining amount of Rs. 5,000 crore is to be utilized to meet the cash component for wages and material costs.
The objectives of the SGRY are to provide additional wage employment in rural areas and also food security, alongside the creation of durable community, social and economic assets and infrastructure development in these areas. The programme is selftargeting in nature and would be available for all the rural poor (BPL/APL) who are in need of wage employment and are willing to engage in it. Preference will be given to the poorest among the poor, women, SC/ST and parents of child-labour withdrawn from hazardous occupations. Under the Scheme, 5 kg of foodgrains (in kind) is to be distributed as part of wages per man-day. The remaining part of the wages is to be paid in cash to ensure the notified minimum wage. Punjab has fixed Rs. 5 per kg. as price of wheat.
During the financial year 2001-2002 the EAS and JGSY were continued as part of SGRY Scheme. From the financial year 2002-2003 onward, the allocation of funds would be made in a manner that each Panchayat receives a minimum of Rs. 50,000. The physical performance of JGSY (SGRY) for 2001-2002 is given in Table 21.

Table 21Physical Performance of JGSY under SGRY- 2001-2002
Employment generated category- wise
(Lakh man-days) employment generated
During the month of March 2002
Cumulative including March 2002
SC 1.934 6.376Others 0.611 2.378Total 2.545 8.754WomenLandlesc 0.130Others 2.545 8.585Disabled 0.169
0.010Source: Data provided by the office o JDC (RD), Government of Punjab, Chandigarh.
SGRY Is executed in two streams:
First Stream; The first stream is being implemented at the district and intermediate Panchayat level; 50 per cent of the funds are to be earmarked (from out of the total funds available under the SGSY) for distribution between the Zila Parishads and intermediate level Panchayats (Panchayat Samitis) In the ratio of 40:60. (Of the 50 per cent funds under the first stream, 20 per cent are to be utilized by the Zila Parishads and 30 per cent by the intermediary level Panchayats)
Second Stream: The second stream is being implemented at the village Panchayat level; 50 per cent of the funds available under the SGSY are earmarked for the Village Panchayats and for distribution among the Gram Panchayats through Zila Parishads/ DRDAs. The allocation of funds is being made in a manner that each Panchayat receives a minimum of Rs. 50,000.
Works to be taken up: The works to be taken up will be labour-intensive, leading to the creation of additional wage-employment, durable assets and infrastructure, particularly those which would assist in drought-proofing, such as soil and moisture conservation works, watershed development, promotion of traditional water resources, aforestation and construction of village infrastructure and link roads, primary school buildings, dispensaries, veterinary hospitals, marketing infrastructure and Panchayat Ghars.
Employment Assurance Scheme (EAS): The primary objective of the EAS scheme, which has now been merged in SGRY, was to provide gainful employment, during the lean agricultural season, in manual works to all able bodied adults in rural areas who were in need and desirous of work, but could not find it. The work could be either on farm or in other allied operation or on the normal plan/ non-plan works during such a period. The secondary objective was the creation of community, social and economic assets for sustained employment and development.
During 2001-2002, against the total available funds of Rs. 10,15.83 lakh, Rs. 680.60 lakh, that is 67 per cent, was utilized. This helped jn generating 5.11 lakh man-days. Out of the total man-days of employment generated 74 per cent were for SCs and two per cent for women. Table 22 gives the details of financial and physical achievements under EAS during the Ninth Five Year Plan (up to February 2002).

Financial and Physical Achievement under EAS Scheme during Ninth Five Year Plan (upto
Item 1997-98 to 2001-02 Percent to totalTotal funds available 15818.26 -
Total expenditure 9246.45 58.5%Total employment generated (Lakh man days)
62.38 -
SC 45.19 72.4%Women 2.79 4.5%Landless 39.58 63.4%
Source; Data provided by the office of JDC (RD) , Government of Punjab, Chandigarh.
Jawahar Gram Samridhi Yojana (JGSY): JGSY is the restructured, streamlined and comprehensive version of the erstwhile Jawahar Rozgar Yojana (JRY). Designed to improve the quality of life of the poor, it was launched on I April 1999. The primary objective of JGSY was to create a demand-driven community village infrastructure, including durable assets at the village level and, to enable the rural poor to increase opportunities for sustained employment The secondary objective was the generation of supplementary employment for the unemployed poor in rural areas. During 2001-2002 (upto January, 2002), against the total available funds of Rs. 1,101.82 lakh, Rs. 802.86 lakh, that is 73 per cent, was utilized. This helped in generating 5.56 lakh mandays, of which 3.96 lakh mandays were generated for SCs and 0.21 lakh for women. Table 23 gives the details of financial and physical achievements under JGSY during the Ninth Five Year Plan (up to February 2002).
Table 23Financial and Physical Achievement under JGSY Scheme during Ninth Five Year Plan
Item 1997-98 to 2001-02 Percent to totalTotal funds available 7413.36 -
Total expenditure 6605.89 89.1Total man days generated (in lakhs) 51.86 74.7SC 38.76 -
Women 0.73 1.4Handicapped 0.014 0.03
Source; Data provided by the office of'JDC (RD), Government of Punjab, Chandigarh.
Indira Awaas Yojana (lAY): The Government of India has been implementing lAY since 1985-86, with the objective of providing dwelling units free of cost to members of Scheduled Castes, Scheduled Tribes, and freed bonded labourers living below the poverty line in rural areas. From 1993-94, its scope has been extended to cover non- Scheduled Caste/ Scheduled Tribe rural poor. Benefits of the scheme have also been extended to families of ex-servicemen of the armed and paramilitary forces killed in action. Three per cent of the houses are reserved for the below-poverty-line disabled persons living in rural areas. During 2001-2002, against the total available funds of Rs. 894.29 lakh, Rs. 542.86 lakh, that is 61 per cent, has been utilized. This has resulted in the construction of 1,896 houses, 47 per cent of the target. Of the constructed houses, 91 per cent were constructed for Scheduled Castes. In addition, 976 houses were upgraded, 48 per cent of the target fixed. Out of the upgraded houses, 90 per cent were for the Scheduled Castes. For the year 2002-2003 the state has planned to spend Rs.350.00 lakh as its share on this programme to construct 5,600 new houses and upgrade
178

2,800 houses. Table 24 gives details of the financial and physical achievements under lAY during the Ninth Five Year Plan (up to February 2002).
Table-24Financial and Physical Achievements under lAY Scheme during Ninth Five Year Plan (upto
Item 1997-98 to 2001-02 Percent to totalTotal funds available 5435.15 -
Total expenditure 4550.8 83.7%Total number of houses constructed 21100 -
SC 19543 92.6%Women 6820 32.3%Handicapped 83 0.39%Source: Data provided by the office of JDC (RD), government of Punjab, Chandigarh.
Pradhan Mantri Gramoday Yojana (Gramin Awaas) (PMGY): The Pradhan Mantri Gramodaya Yojana (Gramin Awaas) is generally, based on the pattern of the Indira Awaas Yojana and will be implemented in rural areas throughout the country. During 2001-2002 (upto January, 2002), against the total available funds of Rs. 307.64 lakh, Rs. 83.48 lakh, only 27 per cent, was utilized. This resulted in the construction of 507 new houses and upgradation of 97 houses. For the year 2002-03 funds amounting to Rs. 500.00 lakh have been proposed to construct 2,000 houses and upgrade 1,000 houses. Table 25 gives details of financial and physical achievements under PMGY during the Ninth Five Year Plan (up to February 2002).
Table 25Financial and Physical Achievements under PMGY Scheme during Ninth Five Year Plan
Item 1997-98 to 2001-02 Percent to totalTotal funds available 610.64 -
Total Expenditure 445.66 73%Total number of houses constructed 1531 -
SC 1441 94.1%Women 886 57.9%Handicapped - -
Source; Data provided by the office of JDC (RD), Government of Punjab, Chandigarh.
Special Project under SGSY: Under the SGSY scheme (for the year 2001-2002)the Government of India sanctioned Rs. 21.11 crore for five districts -- Amritsar, Gurdaspur, Ferozepur, Bathinda and Muktsar. However only Rs. 7.87 crore were released. The main achievements are given in Table 26 and 27.
Table 26Financial Achievements of Special Project under SGSY
Name of district
Name of project Total cost of the project
Funds released
GOI State receipt
Totalfunds
available
Exp.
Amritsar Carpet weaving 309.00 115.88 38.63 — 154.51 34.10Bhatinda Handloom 495.00 181.50 60.50 2.29 244.29 125.76Ferozepur Handloom 441.80 165.68 — — 165.68 2.46Gurdaspur Dairy 495.00 185.63 59.64 — 245.27 44.27Muktsar Dairy 370.00 138.75 46.25 — 185.00 —
Total 2110.80 787.44 205.02 2.29 994.75 206.57Source: Data provided by the office of JDC ( ^D), Government of Punjab, Chandigarh.
179

Name of district Credit mobilized (Rs. in lakh)
Swarozgaries assisted (No.)
Amritsar — —
Bhatinda 90.00 373Ferozepur — —
Gurdaspur 251.84 515Muktsar — -
Total 341.84 888Source: Data provided by the office of JDC (RD), Government of Punjab, Chandigarh.
Integrated Waste Land Development Project; Under this centrally sponsored scheme (IWDP), the Government of India sanctioned the projects to DRDAs of Bathinda and Sangrur for the year 1994-95 amounting to Rs. 409.13 lakh and Rs. 287.78 lakh respectively. Upto December 2001 the Government of India released funds amounting to Rs. 337.40 lakh to DRDA Bathinda and Rs. 41.81 lakh to DRDA Sangrur. In Bathinda District out of the total available funds of Rs. 347.49 lakh (including interest), Rs. 345.91 lakh was utilized. The Government of India has discontinued the project of Sangrur district, as its implementation has been show. Table 28 provides the financial and physical targets of various centrally sponsored schemes for 2002-03.
Table 28
Name of Scheme Proposed allocation for 2002-03
Center State Total
Physical targets
SGSY 3150.00 1050.00 4200.00 6500 swarozgariesSGRY 9375.00 3125.00 12500.00 60 lakh man-dayslAY 1050.00 350.00 1400.00 5600 houses to be constructed
2800 houses to be upgradedPMGY 500.00 " 500.00 2000 houses to be constructed
1000 houses to be upgradedTotal rural sanitation
250.00 75.00 325.00
Source; Data provided by the office of JDC (RD), Government of Punjab, Chandigarh.
The important point to be noted in the case of Punjab for all the centrally sponsored schemes is the utilization of the funds. These have never been fully utilized, mostly due to lack of matching funds from the state government. For example, in the case of the lAY scheme, the financial performance (achievement) during the Ninth Five Year Plan (upto February 2002) has been 83.7 per cent of the target. This ratio is 91 per cent for SGSY and 58 per cent for the EAS scheme.
Besides centrally sponsored schemes, the Government of Punjab has been implementing many welfare schemes for poor families from socially disadvantaged sections of the society, namely, stipend to SC girls studying in primary schools, housing for SC families, SCs Dharmsala, incentives for removal of untouchability, shagan scheme for SC girls at the time of their marriage, manure pits for SCs’ families, kanya jagriti joyti scheme, financial help for handicapped, orphans, widows and old people and other nutritional schemes for pregnant women and under-weight children.

The main reasons for the failure of the earlier poverty alleviation programmes to eradicate poverty completely has been identified as: failure to reach the right beneficiaries, pilferages and leakages, procedural difficulties, inadequate assistance in some cases, beneficiaries using the money for other unproductive purposes, repayment of bank loans, lack of marketing of products, training, human resource development, and proper information about the schemes and centralized administrative processes. Some schemes, which are being implemented by the state, are duplicate in nature, for example, the housing scheme. These shortcomings have also been reflected in the evaluative studies by CRRID of IRDP (July 1995 to June 1996-- fifth round) and lAY (1998-99) in Punjab.
The implementation of these programmes could be made more effective by strengthening the inbuilt monitoring system by involving the community in their implementation through Panchayats. The poor are to be identified by the Gram Panchayats in the Gram Sabha meetings, and the list forwarded to the Panchayat Samitis (PSs), whose representatives should be made responsible for examining the list for its genuineness. Then the PSs should forward this list to Zila Parishads, which could play the role of a bridge between the state government and the grassroots level of governance. The need is to strengthen the district planning committees for better results.
Although, constitutionally local self-governance has been transferred to local bodies, the Panchayats have not been given the authority and responsibility to implement and prepare plans for economic development and social justice. The state government has not been paying attention to the recommendations made by its First and Second Finance Commissions, which have suggested measures for raising funds for the Panchayats, to make them self-sustainable. The need is to encourage the mass media to help increase awareness among the rural masses, especially the rural poor. The thrust of the plan strategy should also take into account the emerging social, political and cultural inequalities, besides economic upliftment.
MICRO-FINANCE AND RURAL BANKING
The availability of bank credit facilities can help to bring prosperity to rural people. There are 1,120 branches of scheduled commercial banks in the rural areas of Punjab. These constitute 44.7 per cent of the total number of branches functioning in the state in the year 2000. The share of rural branches has decreased from 54.4 per cent in 1990 to 44.7 per cent in 2000. The credit-deposit ratio for rural Punjab was 43.36 per cent, whereas for rural Maharashtra, it was 58.90 per cent in 2000 (Table 29).

Number of Branches, Deposit & Credit and Credit-Deposit Ratio in All Commercial Banks _____________ for 1990 and 2000 (Rs. in lakh)____________
Name of the State/
India
No. of branches Deposits Credits Credit- deposit ratio (%)
1990 2000 1990 2000 1990 2000 1990 2000Punjab 1180
(54.4)2170*
1120(44.7)2504*
250708(28.9)
866824*
915018(23.7)
3857206*
84737(22 .2)
382340*
396750(26.3)
1506296*
33.80 43.36
Haryana 736(57.8)1273*
697(46.7)1491*
85505(24.9)
343324*
344318(20.2)
1705250*
58109(28.0)
207801*
143535(20.3)
706137*
67.95 41.68
Maharastra
2491(43.7)5689*
2309(37.1)6216
148237(4.5)
3281284
602134(3.9)
15299611
111083(4.9)
2276369*
351640(2.7)
12820100
74.93 58.40
All India 34184(56.50)60515*
32719(50.00)65521*
2623364(15.3)
1719439
12044675(14.6)
82213276
1606785(15.4)
10431193
4739602(10.1)
46903171
61.25 39.35
Source (i)
(ii)Note: (i)
(ii)
Banking Statistics, Basic Statistical Returns Volume 19, March 1990.Banking Statistics, Quarterly Handout, March, 2000 Figures in parentheses represents the share in rural region to the total of all the regions.*denote the total in all the regions (rural, semi-urban, urban & metropolitan).
The slow growth of the rural non-farm sector could be attributed to the lower CD ratio (33.80% in 1990) for rural Punjab. Further, the share of credit to the rural non-farm sector was only 12.9 per cent of the total rural credit in 2000-01. The share of rural credit is more for agriculture machinery (34.4%) and dairy development (37.7%). {Annual Report, Punjab, 2000-01, NABARD). This reflects the priorities in our development strategy. These have been the development of agriculture and allied sectors (limited to dairy) and not the development of the rural non-farm sector. This sector has the potential of generating more employment, which has not been fully exploited so far. As agriculture is already over-capitalized in case of farm implements there is a need to shift credit towards agro-processing industries, storage, cold chains, market yards, transport, village and cottage industries and other services.
Traditionally, in the absence of an institutionalized banking system, rural people, especially farmers, approach moneylenders for their credit needs. The CRRID study on problems of credit for the cotton growers of Punjab shows that the need for their credit is still met by the commission agents (75.9%). It has been noticed that such type of credit did not help in capital formation but was used for consumption purposes and day to day needs of the rural people, which has not helped the growth of the non-farm sector.
The experiences of the Gramin Banks role of Bangladesh and Indonesia in the development of rural areas reveal how the formation of small homogenous groups (5-10 members) across religion, gender, caste, cluster and location played an important role in rural development, especially in the non-farm sector. The concept of Self Help Groups (SHGs) in India has been adopted in view of their successful with rural masses, who first

engage in small savings on their own for a specified period for use in case of an emergency that a group member might face. Once the bank is convinced that respective groups have budding ideas of starting micro-enterprise, they provide them the required financial support. The need is to adopt an approach where micro-finance could be made available to ru'-al people, especially the poor, through improvement in the rural credit- delivery system.
MODEL VILLAGE PLAN
A model village will facilitate human resource development through better education, health and training and generate employment avenues both in secondary and tertiary sectors. Initially funds for infrastructure building, will have to be mobilized from government as well as non-government sources, such as non-government organizations, international funding agencies, non-resident Indians (NRIs), religious Institutions and other sources besides the village’s income from its own sources. Consequently, for the maintenance and sustainability of public services, user’s charges could be levied according to the social and economic position of the households. According to the concept of a globalized village, each village will be connected with modern information technology for better dissemination of information. This type of a village will have the potential of producing human resources catering to national as well as international requirements.
A model village is perceived as a village having all modern physical and social infrastructure facilities. According to HUDCO, the village to be developed as a model village has to adopt a convergence approach with integrated development, equipped with good housing, appropriate sustainable technology, site-specific functional planning, user-friendly and innovating designing, along with the integration of many other supportive inputs. The preparation of a model village plan has been perceived as a part of the community development programme of the Government of India since the very First Five-Year Plan. Although the green revolution in Punjab has helped in improving economic conditions of the people living in rural areas, our planning could help improve their quality of life only to a limited extent. Development of a model village, as perceived in our planning, has not been widely applied in its true sense.
An Action Plan, designed by CRRID in consultation with the representatives of Gram Panchayat/Gram Sabha for building a model village is given below;
(i) Meeting of Gram Sabha(ii) Identification of village problems(iii) Prioritization of needs at village level(iv) Preparation and approval of plan(v) Technical consultation with the department of rural development for resource
mapping(vi) Operational plan preparation by Gram Panchayat(vii) Identification and mobilization of resources
Begowal (Ludhiana) and Palahi (Kapurthala) villages of Punjab are appropriate examples of model villages, with a holistic development approach promoting social harmony and quality of life. CRRID has also developed a model village plan for village Khera Dona in Kapurthala district. It might be of interest to note here that a non-resident Indian of the same village sponsored this study of CRRID.

It is hoped that the character of a model village will shift from the present rural character, dominated by agriculture, to semi-urban, with a larger share of the income from secondary and services sectors than the primary sector. Within the primary sector the share of allied agricultural activities would increase, which would help in providing employment opportunities for people involved in agriculture as casual workers. Non-farm activities would also encourage contract arrangements in employment and not the casual one. It would further increase women’s participation in work and slow down the out-migration process from villages to urban centres.
Palahi: An Integrated Village Development Model
Village Palahi is situated on a link road, which is three kilometres from Phagwara (district Kapurthala) on the northwestern side. The village has 548 hectares of cultivable land with 100 per cent irrigation facilities. The total population of the village is 3,800.
The National Rural Development Society (Regd) Palahi established in 1983 under the chairmanship of the village Sarpanch, is engaged in the overall development of Palahi in collaboration with the Panchayat. It is because of these collaborative efforts that today the village has all such as facilities like solar street lights, solar pumps, solar water heating systems, solar cookers, post office, commercial bank, co-operative society, sewing centre, sports stadium, library, health care hospital, government primary and high schools, community hall, Ambedkar Bhawan, water supply, ayurvedic dispensary, common tractor-run water tanker, public school, veterinary hospital, gobar gas plant, Gurudwara and Masjid. The National institute for Integrated Rural Development and Transfer of Technology (Palahi Community Polytechnic) is another big achievement of this village. This institution was started in 1984-85 with the aim and objective of imparting training in various technical and educational trades to educated, semi-educated and unemployed youths in the age group 18-35, in order to make them youth capable securing gainful employment or start their own ventures to cater for demands from local areas. The major activities of this institution are: manpower development and training, transfer of technology, setting up technical working units. The Polytechnic imparts vocational training in such courses as refrigeration, motor winding, welding, electrician’s jobs, garment designing, commercial secretarial practices and software programming.
Palahi was once a typical archetypal Punjab village, but today, it not only boasts of a free Internet service, but also has a community hall, solar lighting, brick laned streets and biogas plants to convert manure into power. Palahi is the only village in the state where solar lighting and indoor toilets are common. The key to Palahi’s success is its residents, who contributed in cash and kind for village development and its immigrant sons. Almost every household has one or more members settled in western countries, mainly, Britain, Canada and USA. This section of the nonresident population has made the village proud through their contributions in cash. Palahi’s NRI sons provided Rs. 32 lakh of the Rs. 35 lakh spent for the community hall, which can seat 1,100 people. With a Community Centre Hall, a village Panchayat Complex, a Ferro-cement unit, a biogas plant, a library stocked with 12,000 books, football ground, badminton courts and a stadium, well-maintained schools, polytechnic centre, impressive clock tower and bhck-lined streets, Palahi is a unique model for integrated development of a village.For more details; E-mail; [email protected] _____________
ROLE OF NGOs, SHGs AND CORPORATE SECTOR
Voluntary social services have been an integral part of the socio-cultural and religious ethos of our society from ancient times. The objective has been to increase human capacities by promoting non-economic factors such as education, health and nutrition, which in turn would speed up the process of economic development. The role of NGOs

is both co-operative and complementary to the state. The existence of NGOs assumes importance in the context of rural settings, as living conditions have deteriorated. State- NGO partnership alone cannot resolve all the socio-economic problems, hence it has to be in co-ordination with all agents of social change, i.e., the state, local self- governments, the corporate sector, academics and civil society groups.
The role of voluntary agencies in the development of rural areas can be to supplement efforts of government for the upliftment of the poor and needy disseminate information about development schemes and programmes of the government to rural people; make people aware of the consequences of female foeticides and imbalance in sex ratio; mobilize financial resources from the community; help in upgradation of skills of rural youths for self-employment opportunities; facilitate the formation of self-help groups and micro-finance; ensure protection of women and children’s rights and abolish ills of child labour; and, make available technologies in a simpler form to the rural poor.
The work of voluntary agencies has been considered complementary to that of government in offering the rural poor a range of choices and alternatives, at low cost and with greater participation. Indian planning strategy has provided scope for the active involvement of NGOs in the planning process, and sufficient funds have been allotted for a wide range of anti-poverty and minimum needs programmes. A semi-autonomous body. The Council for the Advancement of People’s Action and Rural Technology (CAPART), has already been functioning to administer these funds. The government has frequently sought to replicate voluntary initiatives on a large scale, especially in technological innovation, health care and education.
When individuals, on their own initiative, act in a conglomeration to meet their individual and common needs with the primary focus on self-reliance, it can be called a Self Help Group (SHG). Self-help implies a step beyond the stage of passivity to activity and of making a creative contribution. The benefits of self-help groups are based on cooperation rather than competition. They provide benefits of economies of scale, cost- effective alternatives for different financial services, collective learning, democratic and participatory culture and a firm base and platform for dialogue and co-operation. SHGs develop from a common binding force, common need, interest and concern, especially for the rural poor. It is this common binding force, which makes SHGs function more efficiently. The effectiveness of SHGs would be considerably enhanced if a symbiosis could be worked out between them and Panchayati Raj Institutions (PRIs). The key to this is the integration of SHGs with the democratically elected and empowered panchayats when the requisite devolution of power, functions and authority to the latter takes place. There is urgent need to work out a mechanism that will allow the SHGs and the PRIs to work in tandem and establish a system of reinforcing each other’s work.
NABARD has been promoting the role of NGOs in the formation of SHGs, which could be made functional with their help. NGOs can also work with the formal as well as informal financial institutions and help in micro-financing the SHGs. In Punjab, there are only 541 SHGs who have taken credit from NABARD upto 2001. Such low numbers of SHGs are due to the fact that voluntary agencies, especially NGOs, are not very active in the state. A list of important NGOs and their respective areas of operation is given in Table 30. The existing SHGs have been mostly formed with the efforts of bank officials in co-operation with Panchayats.

Table 30 List of important NGOs in Punjab
Name ActivitiesAdarsh Seva Samiti, Anandpur Sahib Women’s developmentAll India Jeev Raksha Bishnoi Sabha Abohar, (Ferozepur)
To protect animals and encourage a forestation
All India Pingalwara Society Amritsar and Jullandhar
a) To provide shelter and food to the destitutes, disabled orphans and mentally handicapped people
b) Environmental literacyc) Forestationd) Rehabilation of destitutes through vocational
trainingAll India Women’s Conference, Amritsar Social justice and human rightsBhartia Grameen Mahila Sangh, Chandigarh
(a) Welfare of women and children of rural areas(b) Social education to children(c) Community development
Doaba Shri Guru Singh Sabha, Jullandhar
To motivate people for reformative education. To run charitable hospital
Environment and Life Scientist Association, Ludhiana
To create awareness among the people in general and students in particular regarding environmental hazards, pollution and its effects and remedies, Educating masses regarding eco-friendly products
Family Planning Association of India, Mohali (Ropar)
Community participation for family planning through developmental activities, promotion of family life education
Indian Council of Sociaf Welfare, Chandigarh
a) Upliftment of womenb) Awareness programme on health issuesc) AIDS controld) Anti-dowry campaigne) Self-employment schemes
Kharar Welfare Society, Kharar (Ropar) To promote social work in Kharar TehsilManav Kalyan Shiksha Kender, Mohali (Ropar) a) Social welfare
b) Welfare of physically and socially, handicapped sections of the society
Manav Sudhar Sabha, Sialba Majri (Ropar)
1jI
I
(a) To work for village slum areas(b) Promotion of socio-economic programme for
helping the needy(c) Relief and assistance to people stricken by
natural calamities like floods, earthquake, storms and rains.
1 National Institute for IRD and Transfer of Technology, 1 Palahi (Kapurthala)
a) Manpower development and trainingb) Transfer of technology to the villagersc) Total village development
Nishkam Seva Ashram Village Daad (Ludhiana)
a) To fight against poverty, hunger, unemployment and diseases
b) Schools in slum areasc) Home for the agedd) Income generation for women and physically
handicappede) Hospital, medical facilities and dispensariesf) Community services
Phagwara Environmental Association, Phagwara 1 (Kapurthala)
a) Environment awarenessb) Plantation

Pargati, Hoshiarpur (a) Women’s development and literacy(b) Environment protection(c) Promotion of local artisans and handicrafts
Punjab Action Group for Rural Development, Phagwara (Kapurthala)
Rural development
Punjab Women Welfare, College Road, Hoshiarpur (a) To impart training to women in different technical trades under Nehru Rozgar Yojana
(b) Free training to poor and handicapped(c) Financial help to under-privileged peoples
who are victims of riots or natural calamitiesRural Development and Social Welfare Society - Patiala (a) To provide vocational training to the
rural/urban unemployed youth(b) Transfer of low cost technology for rural
needs(c) Environmental sanitation and non-
conventional energy resources.(d) To raise living standards of rural people
through use of modern technologyRural Human Development Centre, Nurpur Bedi (Ropar) (a) Rural development with special emphasis on
women development(b) Rural technology(c) Conduct workshops for Mahila Mandals and
train them about livestock rearingSDKS Shri Dasondhi Ram Birji Foundation, Patiala (a) Social work
(b) Upliftment of downtrodden(c) Relief work for poor, needy students and
victims(d) Awareness for health education and peace
Sewa Bharti, Chandigarh (a) Sewa, Service and Sanskar Samratha in labour colonies
(b) Working for the development of weaker sections of the society.
Shanti Swaroop Memorial Education Society, Roopnagar (a) Promotion of education in remote areas with special emphasis on women’s education.
(b) Economic development of women through vocational training by imparting traditional and non-traditional skills
(c) Health(d) Environmental awareness
Society for Education, Environment and Protection of Animals, Amritsar
(a) Green India and clean India(b) Anti-pollution and pro-conservation(c) Environment awareness(d) Plantation
The Centre for Development Action, Patiala Involvement in development projects with focus on growth and under-privileged people.
The Nagar and Gram Sudhar Mahila Society, Rajpura (Patiala) (a) Awareness on health education(b) Social work(c) Vocational training for women(d) Children’s library(e) Legal aid for women
The Punjab Rural Education Promotion Council, Ludhiana (a) To promote rural education, especially in rural schools
The Rationalist Society Punjab, Barnala (Sangrur) (a) To annihilate superstitions(b) To inculcate scientific temperament(c) General awareness about environment and
pollutionVolunteers for Social Justice, Phillaur (Jalandhar) (d) Upliftment of under-privileged sections,
especially Scheduled Castes, Schedule Tribes and landless workers.
(e) Creating legal awareness among underprivileged sections for freedom of life.
(f) Elimination of child and bonded labour.Source: DAINET, NGO Directory (a directory of Non-governmental Organizations in India), Volume-ll - Chandigarh,
Haryana, Himachal Pradesh and Punjab, Development Alternatives Information Network, New Delhi, 1998.
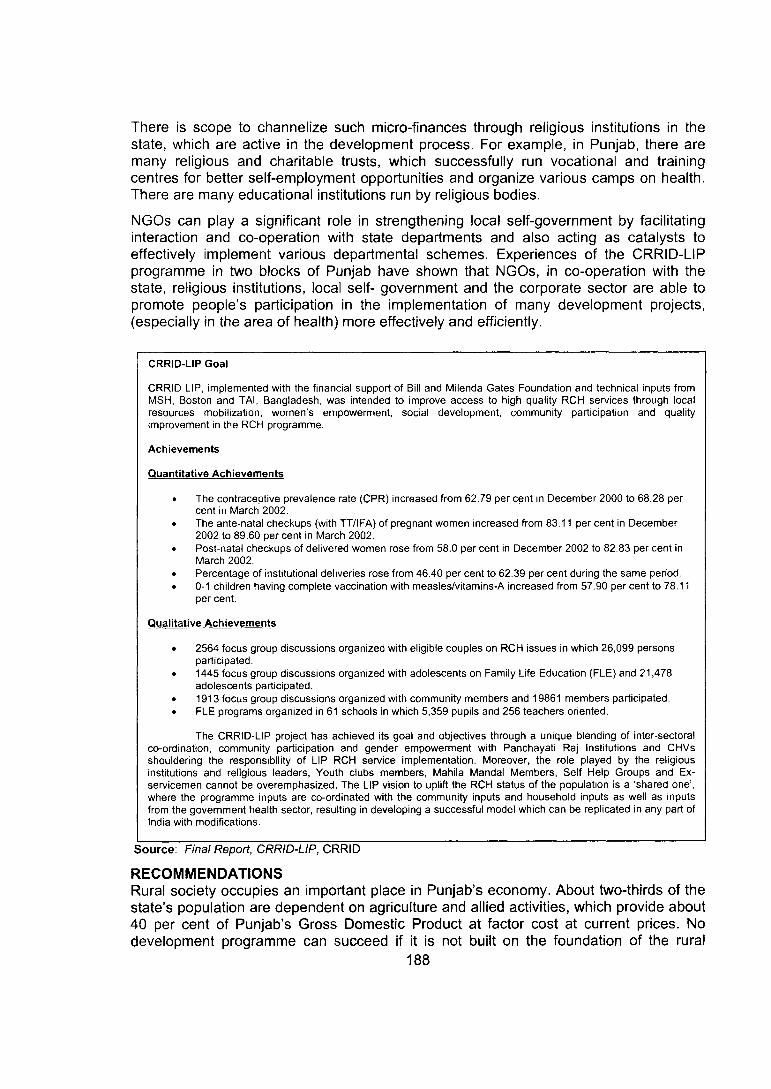
There is scope to channelize such micro-finances through religious institutions in the state, which are active in the development process. For example, in Punjab, there are many religious and charitable trusts, which successfully run vocational and training centres for better self-employment opportunities and organize various camps on health. There are many educational institutions run by religious bodies.
NGOs can play a significant role in strengthening local self-government by facilitating interaction and co-operation with state departments and also acting as catalysts to effectively implement various departmental schemes. Experiences of the CRRID-LIP programme in two blocks of Punjab have shown that NGOs, in co-operation with the state, religious institutions, local self- government and the corporate sector are able to promote people’s participation in the implementation of many development projects, (especially in the area of health) more effectively and efficiently.
CRRID-LIP Goal
CRRID-LIP, implemented with the financial support of Bill and Milenda Gates Foundation and technical inputs from MSH, Boston and TAI, Bangladesh, was intended to improve access to high quality RCH services through local resources mobilization, women's empowerment, social development, community participation and quality improvement in the RCH programme.
Achievements
Quantitative Achievements
• The contraceptive prevalence rate (CPR) increased from 62.79 per cent in December 2000 to 68.28 per cent in March 2002.
• The ante-natal checkups (with TT/IFA) of pregnant women increased from 83.11 per cent in December 2002 to 89.60 per cent in March 2002.
• Post-natal checkups of delivered women rose from 58.0 per cent in December 2002 to 82.83 per cent in March 2002.
• Percentage of institutional deliveries rose from 46.40 per cent to 62.39 per cent during the same period.• 0-1 children having complete vaccination with measles/vitamins-A increased from 57.90 per cent to 78.11
per cent.
Qualitative Achievements
• 2564 focus group discussions organized with eligible couples on RCH issues in which 26,099 persons participated.
• 1445 focus group discussions organized with adolescents on Family Life Education (FLE) and 21,478 adolescents participated.
• 1913 focus group discussions organized with community members and 19861 members participated.• FLE programs organized in 61 schools in which 5,359 pupils and 256 teachers oriented.
The CRRID-LIP project has achieved its goal and objectives through a unique blending of inter-sectoral co-ordination, community participation and gender empowerment with Panchayati Raj Institutions and CHVs shouldering the responsibility of LIP RCH service implementation. Moreover, the role played by the religious institutions and religious leaders, Youth clubs members, Mahila Mandal Members, Self Help Groups and Ex- servicemen cannot be overemphasized. The LIP vision to uplift the RCH status of the population is a 'shared one’, where the programme inputs are co-ordinated with the community inputs and household inputs as well as inputs from the government health sector, resulting in developing a successful model which can be replicated in any part of India with modifications.
Source: Final Report, CRRID-LIP, CRRID
RECOMMENDATIONSRural society occupies an important place in Punjab’s economy. About two-thirds of the state’s population are dependent on agriculture and allied activities, which provide about 40 per cent of Punjab’s Gross Domestic Product at factor cost at current prices. No development programme can succeed if it is not built on the foundation of the rural
188
sector. There is dire need to give high priority to rural development and to formulate an integrated rural development policy, taking into account the following recommendations:
• Ensure effective dissemination of information, education and impart training to the elected representatives of PRIs for overall rural development.
• Introduce rural higher education, based on the concept of Nai Talim as envisaged by Mahatma Gandhi for human resource development, keeping in view local requirements of rural management, engineering, science and technology and research, training, networking and extension.
• Need to develop rural agro-based industries, which have the potential of absorbing the surplus agricultural labourforce and checking migration to urban areas.
• Co-ordinate between Panchayats, government, NGOs and the corporate sector to upgrade skills of rural people and improve their quality of life, by establishing rural enterprises catering to their skills and needs.
• Maintain and upgrade existing rural infrastructure and promote such facilities as storage, cold chain, food parks, marketing intelligence network to facilitate agroprocessing industries.
• Prepare and implement plan for ‘Model Village’, involving Gram Sabha/Gram Panchayats for decentralized micro-planning, to avail of modern physical and social infrastructure facilities required for a better quality of life.
• Upgrade rural market growth centres for agricultural produce, according to international requirements, in view of WTO.
• State should raise matching funds required for full utilization of central funds under centrally sponsored poverty alleviation schemes.
• Ensure required credit facilities by rural banks to non-farm activities (manufacturing and tertiary sectors).
• Evolve and adopt indigenous concepts and theories of development, to resolve the problems confronting the state government, PRIs and stakeholders during the process of rural development.
• The Government of India in certain cases provides funds for development of rural areas through the agency of NGOs, whereas PRIs, being the real representative bodies of the people, are not treated as NGOs. The Government of India should abandon this approach and provide funds from all agencies, including International funding, to PRIs.
• The pace of rural development could be accelerated by transferring the 29 subjects mentioned in the ZS^d Constitutional Amendment Act, 1992 and devolving funds and functionaries to the Panchayati Raj Institutions.The state government is in the process of adopting the central pattern of devolution of functions, functionaries and funds in respect to these 29 items. The Government of India is also required to devolve to the PRIs similar functions in respect of schemes implemented by its various ministries in rural areas.
• Most of the rural poor belong to Scheduled Caste families, which have been discriminated against for long. The concept of poverty has to be understood from a different angle in Punjab, as the proportion of Scheduled Caste population is very high in rural areas (32 %) as compared to other states, and the rural society of Punjab is of a heterogeneous character. In addition, the status of women in Punjab could not be improved as desired, which is reflected in the low sex ratio of the state (874 per 1,000 males) and their low participation in economic
189

activities. This situation is further aggravated by the prevalence of female foeticide in the state. Besides the plight of SCs and women, Punjab is facing a peculiar situation emerging out of the marginalization of the peasantry, which is rendering marginal and small farmers landless. Strategically, Punjab should take into account these factors while designing policy programmes to uplift the poor.
ReferencesJohl, S.S. and Ray, S.K. 2002, Future of Agriculture in Punjab, Centre for Research in Rural and Industrial Development, Chandigarh
“Manpower Profile”, India Year Book 2001, Institute of Applied Manpower Research, New Delhi
National Family Health Survey, India 1998-99, Punjab Series, International Institute for Population Sciences, Mumbai, India
National Human Development Report, 2001, Planning Commission, Government of India, March 2002
Provisional Population Tables - Paper 3 of 2001, distribution of workers and non-workers, Series- 4, Punjab, Census of India, 2001
Riddell, Rogar and Mark, C and Robinson, 1995, “Non Government Organizations and Rural Poverty Alleviation, Clarendon Press, Oxford
Roul Chhabilendra 2001, 'Bitter to Better Harvest,, Northern Book Centre, New Delhi
Sarkar, K. Gautam 1995, Agriculture and Rural Transformation in India, Oxford University Press, Delhi
Singh Katar 1999, Rural Development: Principles Policies and Management, Sage Publications, New Delhi
Statistical Abstract India, 2000, CSO, Ministry of statistics and program implementation, Government of India
Statistical Abstracts of Punjab - various issues. Government of Punjab
Malhotra Rashpal: Impact of 73'" Constitutional Amendment on Rural Industrialisation in India: Issues and Policies, paper presented at expert group seminar on Rural industrialization - Issues and Policies, organized by South Asia Multi Disciplinary Advisory Team (SAAT) ILO at Gurgaon (25-26 August 2000)
Atal Yogesh 1981, 'The Call for Indigenization, International Social Science Journal Vol. XXXIII, No. 1, pp 189-197
India Panchayati Raj Report-2001 Volume I & II, National Institute of Rural Development, Hyderabad, January 2002
Local Initiative Program in RCH (Final Report), Centre for Research in Rural and Industrial Development, Chandigarh- July 2002
The State of Panchayat: Participatory Perspective (edited by Manoj Rai et all) SAMSKRITI, New Delhi, 2001
Reports on Training and Education of Representatives of PRIs in the State of Punjab (1996,1997 and 2001), Centre for Research in Rural and Industrial Development, Chandigarh
India: Human Development Report, National Council for Applied Economic Research, Oxford University Press, New Delhi, 1999

29 items mentioned In the 73"' Constitutional Amendment Act, clubbed Into five broad categories(I) Agriculture and Allied Activities ‘
Agriculture, including agriculture extension- Land improvement, implementation of land reforms, land consolidation and
soil conservationMinor irrigation, water management and watershed development
- Animal husbandry, dairying and poultry FisheriesSocial forestry and farm forestry Minor forest produce Fuel and fodder
(II) Rural industrializationSmall-scale industries, including food- processing industries Khadi, village and cottage industries
(III) Infrastructure DevelopmentRural Housing Drinking waterRoads, culverts, bridges, ferries, waterways and other means of communicationRural electrification, including distribution of electricity Markets and fairs Non-conventional energy sources Maintenance of community assets
(IV) Human DevelopmentTechnical training and vocational education Adult and non-farm education Cultural activitiesHealth and sanitation, including hospitals, primary health centres anddispensariesFamily welfarePoverty alleviation programmeEducation, including primary and secondary schoolsLibraries
(V) Social Welfare and Gender DevelopmentWomen and child development
- Social welfare including welfare of the handicapped and mentally retarded- Welfare of weaker sections and in particular of Scheduled Castes and
Scheduled TribesPublic distribution system.

Table ADistrict-wise Percentage Shift of Rural Non-farm Employment and Shares of Secondary and Tertiary Sectors in
Region/District/State
Householdindustry
Non-householdindustry
Construction Trade & commerce
Transport storage &
communication
Other services
1981 1 1991 1981 1 1991 1981 1 1991 1981 1 1991 1981 1 1991 1981 i 1991MajhaGurdaspur 7.51 2.11 21,85 15.43 6.70 11.64 18.66 14.86 10.29 8.57 35.35 47.37Amritsar 8.62 1.56 19.03 19.20 5.93 5.41 20.59 17.00 14.03 13.02 32.51 43.84OoabaJalandhar 11.55 6.15 30.97 27.33 7.41 8.16 14.24 16.69 9.27 10.30 26.56 31.37Kapurthaia • 6.97 4.07 29.00 31.00 7.35 7.87 15.60 15.94 8.24 7.83 32.84 33.31Hoshiarpur 11.61 6.53 16.52 17.83 7.94 7.81 16.65 13.93 9.68 7.95 37.60 45.95MalwaRupnagar 9.73 3.98 22.41 17.35 7.08 5.52 11.74 11.45 9.47 10,94 39.57 50.76Patiala 5.25 5.49 27.76 24.86 6.82 7.14 17.34 15.44 10.93 10.25 31.90 36.82Sangrur 15,07 6.31 16.78 21.28 6.58 6.62 20.56 18.73 7.25 9.77 33.79 37.29Bathinda 14.04 7.63 18.74 ' 14.89 9.46 9.60 18.73 19.22 7.25 7.11 31.78 41.55Faridkot 11.60 5.92 21.58 18.26 6.92 5.08 16.73 16.11 8.85 8.17 34.31 46.46Ferozepur 9.18 4.89 17.13 18.82, 6.42 6.76 24.55 19.88 9.67 9.12 32.81 40.53Ludhiana 10.34 2.10 25.11 28.04 4.51 4.74 14.85 15,03 11.62 12.95 33.59 37.14Punjab 9.96 4.53 22.29 21.25 6.80 7.25 17.41 16.79 10.16 9.97 33.33 41.11
Source: Directorate of Census Operations, Punjab.

THE INDUSTRIAL SECTOR OVER THE YEARS
At the time of independence, Punjab had only a few hundred industrial units mainly processing foodgrains, cotton ginning and brick kilns. Most of the manufactured items of even common use came from outside. During the post-independence period, industrial development in Punjab took place in phases. Thus, in the fifties the cycle-parts and hosiery industries took their roots, while in the sixties, with the advent of the green revolution, agriculture-related industries like farm machinery manufacturing came up. The main focus in the seventies was on such industries as auto-parts and electronic items and during the eighties on such resource-based industries as food processing, vanspati, edible and non-edible oils and sugar in a big way. Diversification of industry started, with the process of liberalization and economic reforms, while many of the established processing units, both in the small and medium and large sectors, came under pressure. The industrial sector in the state is in the throes of a very significant phase of transition with severe challenges and many new opportunities.
Share of manufacturing sector in SGDP
Table 1
Year At Current Prices At Constant PricesPunjab India Punjab India
1980-1981 11.61 17.70 11.61# 17.70#1985-1986 13.51 17.90 14.40# 19.40#1990-1991 15.05 18.60 16.58# 21.10#1995-1996 15.76 18.10 15.80* 17.90*1996-1997 15.23 17.70 15.58* 18.20*1997-1998 15.04 16.70 15.88* 17.70*1998-1999 14.04 15.60 15.99* 17.00*1999-2000 14.44 15.40 15.84* 17.10*
Source:
Note:
National Accounts Statistics, 080, Government of India Statistical Abstract of Punjab ESO, Government of Punjab (#) At 1980-81 (Constant) Prices, (*) At 1993-94 (Constant) Prices
The share of the manufacturing sector in the State Gross Domestic Product which was (at current prices) 11.61 per cent during 1980-81 gradually increased to 15.76 per cent in 1995-96, but showed a declining trend later and, during 1998-99, it came down to 14.04 per cent. Subsequently, during 1999-2000 it went up slightly to 14.44 per cent as shown in Table 1. At constant prices the share of the manufacturing sector has shown a similar trend and it has been almost at the same level since 1995-96. The share of the manufacturing sector at constant prices has always been higher than at current prices, indicating that prices of manufactured goods are not rising at par with the prices of other goods. The share of the manufacturing sector in the Gross National Domestic Product at current as well as constant prices has always been higher than in the State Gross

Domestic Product, which indicates that Punjab is still comparatively less industrialized. For obvious reasons, for transforming a traditional economy into a modern, dynamic economy, the share of the secondary sector, including manufacturing, as well as the tertiary sector in the State Gross Domestic Product should steadily increase over time, while the share of the primary sector should decline.
Growth of industrial sector
Tables 2 and 3 clearly show that the industrial sector has grown at an impressive rate during the Sixth FYP (1980-85) in terms of number of units, employment, investment and production. During the Seventh FYP (1985-90) the large and medium sector has shown better growth both in terms of investment and production, but the overall growth rate of the SSI sector has declined. Production showed an impressive growth during the Eighth Plan. This high rate of growth in production may be attributed to the investment made during the Seventh and Eighth FYPs. Many new large and medium units came into operation during this period. However, the growth rate of employment has been continuously declining during the Seventh, Eighth and Ninth Plan periods. The implications of this trend and its impact on the economy deserve to be critically examined in depth. During the first three years of the Ninth FYP there has been an all round decline in the growth rate of the industrial sector in terms of the number of units, employment, investment and production.
Table 2
YearUnits (No.) Employment (No.)
Investment (lakh) current prices
Production (lakh) current prices
ssi L&M Total ssi L&M Total ssi L&M Total ssi L&M Total
1980-81 43338 228 43566 264869 109767 374636 33202 72742 105944 111844 • 114107 225951
1985-86 97517 292 97809 464809 132174 596983 73894 148972 222866 215100 253453 468553
1992-93 181563 414 181977 728580 188034 916614 162097 519461 681558 535515 933525 1469040
1996-97 193332 586 193918 821170 219383 1040553 249133 984465 1233598 1109622 2138765 3248387
1997-98 195383 620 196003 840568 221154 1061722 285999 1172084 1458083 1305774 2540577 3846351
1S98-99 197344 602 197946 864592 227929 1092521 336067 1403854 1739921 1444447 2537561 39820081999-2000 199071 611 199682 883005 235993 1118998 379368 1476581 1855949 1661085 2372014 4033099
Source: Director of Industries, PunjabNote ; (SSI) Small Scale Industry, (L&M) Large & Medium Scale Industry
Table 3
PlanYears
Units Employment Investment Production
SSI L&M Total SSI L&M Total SSI L&M Total SSI L&M Total
6'" Plan 1980-85 21.32 6.16 21.25 13.67 6.19 11.60 19.24 14.75 16.18 16.30 19.57 17.87
7''’ Plan 1985-90 10.77 5.40 10.75 8.36 5.31 7.66 13.16 19.80 17.67 12.37 20.18 16.61
8' Plan 1992-97 1.85 8.24 1.87 2.91 2,56 2.83 10.71 16.84 15.42 20.40 22.82 21.81
9'" Plan 1997-00 0.98 1.46 0.98 2.45 2.47 2.45 15.06 14.67 14.73 14.43 4.05 7.74
Source: Based on data from Director of Industries, Punjab
Table 4 shows major industrial sector-wise break up of industry in Punjab as on 31 March 2000. The important sectors in terms of production, investment, employment and export potential are bicycle and bicycle parts and automobile and components (transport

equipment and parts), agro/food processing (food products and beverages), textiles and hosiery, basic metal, metal products, machinery other than electrical and electronics industry. These sectors have contributed about 70 per cent of the total industrial output. Bearing in mind their significance for the economy of the state in general and industry in particular, they will be discussed in the following sections with a view to highlighting their technological status, human resource development, and other factors that impinge on their potential for growth.
Table 4
NICCode Name of the industry
Units Employment Fixed Investment Production
(No.) %* (No.) %* Rs. lakh %* Rs. Iaj<h %*
20-22 Food Products & Beverages
9765 4.89 97704 8.73 273139 14.72 752769 18.66
23-26 Textiles, Hosiery & Garments etc.
14556 7.29 190337 17.01 528706 28.49 668973 16.59
27 Wood products 11623 5.82 39472 3.53 11509 0.62 30353 0.75
28 Paper products 3527 1.77 23055 2.06 70258 3.79 87758 2.18
29 Leather & Leather products 14488 7.26 38242 3.42 10241 0.55 33356 0.83
30 Rubber & Plastic products 4567 2.29 43537 3.89 53317 2.87 183483 4,55
31 Chemical and products 4022 2.01 36792 3.29 252516 13.61 444896 11.03
32 Non-metallic mineral products
2556 1.28 31684 2.83 24387 1.31 52243 1,30
33 Basic metal products (Forging, Re-Rolling & Casting)
5645 2.83 69837 6.24 119858 6.46 477530 11.84
34 Metal products (Hand tools)
20579 10.31 103505 9,25 39465 2.13 150958 3.74
35 Machinery & parts except electrical (Machine Tools)
10644 5.33 67691 6.05 53143 2.86 226415 5.61
36 Electrical machinery & parts(Incl. Electronics)
4438 2.22 32657 2.92 123238 6.64 147942 3.67
37 Transport equipment and parts (Automobiles & Parts, Bicycle & Parts)
6955 3.48 105574 9.43 167151 9.01 506915 12.57
38 Miscellaneous Industry (Sports Goods)
3030 1.52 16615 1.48 51958 2.80 51965 1,29
74-99 Repairing and servicing 36984 18.52 82996 7.42 26883 1.45 41358 1.03
Non-SIDO Industries 46303 23.19 139300 12.45 50179 2.70 176185 4.37
199682 100 1118998 100 1855948 100 4033099 100
Source: Director of Industries, PunjabNote; (*) % Indicates the share of the sector to total Industry.
Concentration of industry
Tables 5 and 6 on distribution of industry indicate that the main industrial centres in Punjab are Ludhiana, Jalandhar, Amritsar, Mandi Gobindgarh, Batala and Mohali. Ludhiana is known for the production of hosiery and readymade garments, bicycles and components, sewing machines and parts, machine tools, auto-parts, industrial fasteners,

electrical and electronic goods. About 21 per cent of the total industrial units in Punjab are located in Ludhiana district. Famous for hand tools, pipe fittings, valves and leather products, Jalandhar is well-known for its sports-goods too. Mandi Gobindgarh, popularly known as the ‘Steel-Town’ of Punjab, hosts more than 300 steel re-rolling mills despite being situated far from the sources of raw materials. Batala is famous in the country for its castings and machine tools, while Amritsar is known for food products, paper machinery and textiles. Mohali near Chandigarh, which attracted a number of ‘sunrise industries’, thanks to its locational advantages and infrastructure, seems to have lost its momentum for growth in recent years.
District Ludhiana jpads Punjab in industrialization. More than 28 per cent of the industrial output of Punjab comes from Ludhiana, which has the highest number (166) of large and medium units. While Amritsar and Jalandhar were traditionally more advanced, Sangrur, which was one of the centrally declared Backward Districts and Patiala, have become fast growth areas.
Districts Bathinda, Ferozpur, Gurdaspur, Hoshiarpur, Kapurthala and Moga, each contributes two to five per cent share to the state’s industrial production; while Faridkot, Mansa and Muktsar each contributes less then one per cent share. These districts are industrially backward and ‘A’ category incentives are provided to industry coming up in them under the Industrial Policy, 1996.
Table 5
DistrictUnits (No.) Employment (No.) Investment (lakh) Production (lakh)
SSI L&M Total SSI L&M Total ssi L&M Total SSI L&M Total
Amritsar 27221 58 27279 113748 19007 132755 49999 84631 134630 208335 95865 304200
Bathinda 6318 17 6335 19327 4601 23928 12716 61877 74593 59098 86787 145885
Faridkot 2528 5 2533 11721 804 12525 6482 5487 11969 19254 5603 24857
FatehgarhSahib 3866 17 3883 19215 3015 22230 16095 18811 34906 125948 61596 187544
Ferozepur 6391 20 6411 25635 6996 32631 20796 15702 36498 47216 47329 94545
Gurdaspur 11543 19 11562 54029 4768 58797 14540 15563 30103 65822 33494 99316
Hoshiarpur 9109 33 9142 29085 14912 43997 10045 106903 116948 18901 137164 156065
Jalandhar 27790 26 27816 143549 9696 153245 40077 27122 67199 190406 47760 238166
Kapurthala 7792 7 7799 25119 17603 42722 8237 91349 99586 31865 126181 158046
Ludhiana 42232 166 42398 265871 72252 338123 95664 302577 398241 556094 597737 1153831
Mansa 2753 2753 8781 8781 4074 4074 29533 29533
Moga 5245 5 5250 19285 1701 20986 8698 22316 31014 28044 82907 110951
Mukatsar 4061 7 4068 17182 2095 19277 7728 10892 18620 18796 18821 37617
NawanShehar 3934 14 3948 10360 6771 17131 2757 53703 56460 5900 101866 107766
Patiala 12579 109 12688 45041 32272 77313 39300 266377 305677 126840 363461 490301
Ropar 8754 59 8813 28967 20398 49365 18389 245173 263562 41489 407266 448755
Sangrur 16955 49 17004 46090 19102 65192 23770 148098 171868 87543 158177 245720
TOTAL 199071 611 199682 883005 235993 1118998 379367 1476581 1855948 1661085 2372014 4033099
Source; Director of Industries, Punjab

District Concentration of types of industries
Amritsar Power Loom Weaving, Wood & Machine Screws, Radio & Transistors, Agricultural implements. Paints & Varnishes and Dyes, Electric fans. Pharmaceuticals, Printing machinery. Textiles, Chemicals, Soap, Acids.
Bathinda Cotton ginning and processing. Pharmaceutical, Flour mills
Faridkot Agricultural implements. Cottonseed oil, Rice bran oil
FatehgarhSahib
Steel re-rolling, Pump parts, Sewing machine parts. Truck body building
Ferozepur Cotton ginning & processing, Grey board. Flour mills. Agricultural implements. Millboard
Gurdaspur Agricultural implements. Conduit pipes. Machine tools, Soap & chemical products, C.l. castings, Brassware
Hoshiarpur Rosin & Turpentine oil. Paints & Varnish, Sugar, Agricultural implements, Pressure cookers. Paper and Paper board
Jalandhar Surgical instruments, sports goods. Hand tools, Automobile parts, Cocks & valves. Pipe fittings, Bus body building. Leather tanneries, Ball bearings. Publication, Switch & switch-gears and Rubber goods
Kapurthala Agricultural implements, Pressure cookers. Fans, Wood & Machine screws, Electrical goods. Rice Mills, Rubber goods, Bolts & Nuts and Diesel engines.
Ludhiana Bicycles & bicycle parts, Automobile parts, Hosiery goods, Sewing machine & parts. Home appliances. Machine tools, Readymade garments, Hosiery needles. Rubber goods, Label s (Metal & Cotton), Chemical goods. Oil engines. Agricultural implements. Electronic goods, Tractor parts. Cycle tyres/tubes. Plastic goods
Mansa Agricultural implements. Cotton spinning
Moga Agricultural implements. Milk products.
Muktsar Cotton yarn. Rice Bran O il, Paper
Nawanshahar Light Commercial Vehicles, Pharmaceutical, Yarn, and Sugar
Patiala Automobile parts. Sewing machine parts, Enamelled copper wire. Electrical goods, Bakery machinery. Cutting tools. Biscuits, shoes
Rup Nagar Agricultural implements, Pharmaceuticals, Tractors & Parts, Electronic components, Electrical components
Sangrur Agricultural implements, Tractor parts. Cycle parts, Sewing machine parts. Milk products, Chilled Rolls
Source; Director of Industries, Punjab
Exports
During 1999-2000 the total value of exports from Punjab was Rs. 4,062 crores. The major sectors which have made significant contribution towards exports from the state are woollen textiles, bicycles and parts, hosiery goods, hand tools, leather products, and

sports goods. Export of principal items during 1997-98 to 2000-01 is shown in Table 7. The trend of exports has not been uniform and has been nearly stagnant of late.
Table 7
Pnncipal items 1997-98 1998-99 1999-2000 2000-01
Woolen Textile 84623 86236 91838 93424
Carpets 6139 9082 13131 7224
Hosiery/Readymade garments 50757 44502 51816 52472
Tanned/chrome leather products
10366 8259 11375 11814
Sewing machine & Parts 4360 7556 6539 5215
Electric switch gears/Electronic goods
6240 2362 7218 1415
Engg. Goods 12585 14946 14274 15228
Auto parts 8434 13862 14282 14415
Bicycle parts/Moped 88956 46243 51620 52016
Sports goods 24644 16144 19318 20416
Machine tools 6779 7123 8131 8029
Hand tools 28417 22917 26872 24059
Rice 48554 49886 52872 49916
Food products 6698 4914 8014 6415
Diesel engines 3844 3126 4475 @
Drugs & Pharmaceuticals 2316 1409 3431 @
Handicrafts @ @ @ 742
Other items 26766 24346 21056 38696
Total 420478 362913 406262 401496Source: Director of Industries PunjabNote: (@) Included in other items
BICYCLE AND BICYCLE PARTS INDUSTRY
The second largest manufacturer of bicycles and bicycle parts in the world, India produced 13.1 million bicycles in 2000, while China produced 52.2 million. The Ludhiana cluster produces about 60 per cent of the total bicycles manufactured in the country in the large and small-scale sector and more than 80 per cent of the parts and components in the small and tiny sector. The first indigenously owned bicycle-
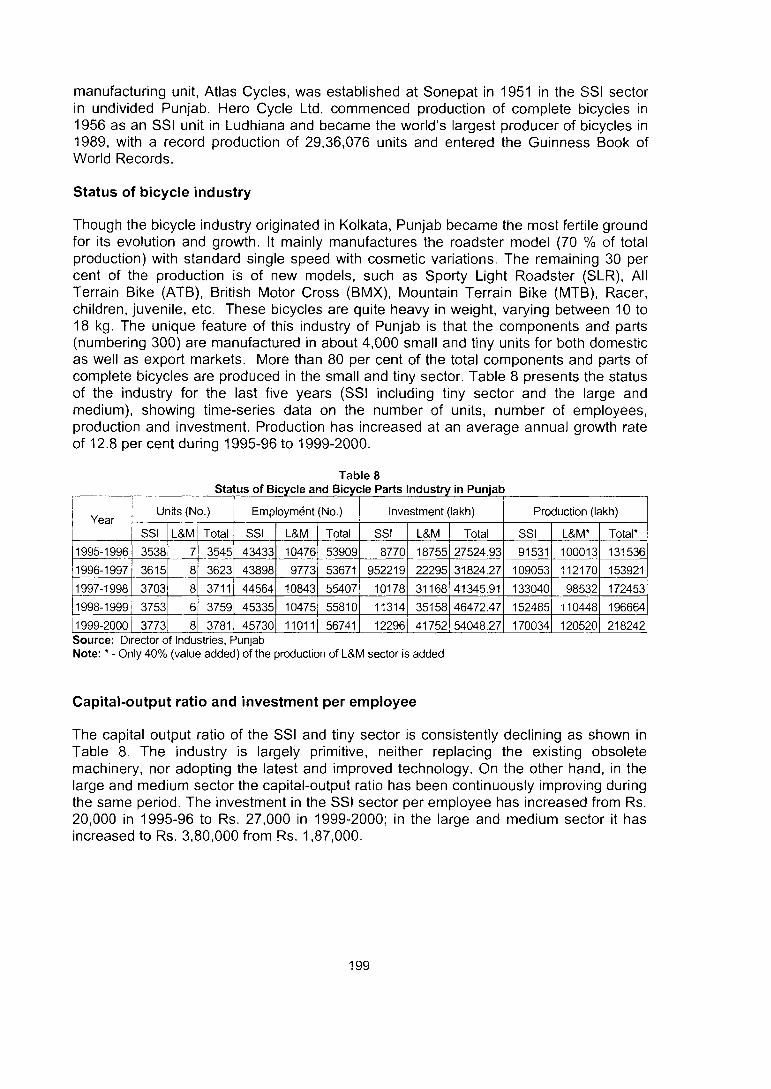
manufacturing unit, Atlas Cycles, was established at Sonepat in 1951 in the SSI sector in undivided Punjab. Hero Cycle Ltd. commenced production of complete bicycles in 1956 as an SSI unit in Ludhiana and became the world’s largest producer of bicycles in 1989, with a record production of 29,36,076 units and entered the Guinness Book of World Records.
Status of bicycle industry
Though the bicycle industry originated in Kolkata, Punjab became the most fertile ground for its evolution and growth. It mainly manufactures the roadster model (70 % of total production) with standard single speed with cosmetic variations. The remaining 30 per cent of the production is of new models, such as Sporty Light Roadster (SLR), All Terrain Bike (ATB), British Motor Cross (BMX), Mountain Terrain Bike (MTB), Racer, children, juvenile, etc. These bicycles are quite heavy in weight, varying between 10 to 18 kg. The unique feature of this industry of Punjab is that the components and parts (numbering 300) are manufactured in about 4,000 small and tiny units for both domestic as well as export markets. More than 80 per cent of the total components and parts of complete bicycles are produced in the small and tiny sector. Table 8 presents the status of the industry for the last five years (SSI including tiny sector and the large and medium), showing time-series data on the number of units, number of employees, production and investment. Production has increased at an average annual growth rate of 12.8 per cent during 1995-96 to 1999-2000.
Table 8
YearUnits (No.)
I” ■ Employment (No.) Investment (lakh) Production (lakh)
SSI L&M Total SSI L&M Total SSI L&M Total SSI L&M* Total*
1995-1996 3538 7 3545 43433 10476 53909 8770 18755 27524,93 91531 100013 131536
1996-1997 3615 8 3623 43898 9773 53671 952219 22295 31824.27 109053 112170 153921
1997-1998 3703 8 3711 44564 10843 55407 10178 31168 41345.91 133040 98532 172453
1998-1999 3753 6 3759 45335 10475 55810 11314 35158 46472.47 152485 110448 196664
1999-2000 3773 8 3781 45730 11011 56741 12296 41752 54048.27 170034 120520 218242Source: Director of Industries, PunjabNote: * - Only 40% (value added) of the production of L&M sector is added
Capital-output ratio and investment per employee
The capital output ratio of the SSI and tiny sector is consistently declining as shown in Table 8. The industry is largely primitive, neither replacing the existing obsolete machinery, nor adopting the latest and improved technology. On the other hand, in the large and medium sector the capital-output ratio has been continuously improving during the same period. The investment in the SSI sector per employee has increased from Rs.20,000 in 1995-96 to Rs. 27,000 in 1999-2000; in the large and medium sector it has increased to Rs. 3,80,000 from Rs. 1,87,000.

As shown in Table 9 the export value of bicycles and parts in Punjab in 1995-96 was Rs. 43,611 lakh, which increased to Rs. 70,643 lakh in 1996-97 and to Rs. 88,956 lakh in 1997-98. Exports declined sharply during 1998-99 to Rs. 46,243 lakh. During 1999-2000 it increased to Rs. 51,620 lakh and remained at the same level in 2000-01.
Table 9 Exports of Bicycle Industry
Year Exports (Rs. lakh) Change (%)
1995-1996 43611
1996-1997 70643 62
1997-1998 88956 25
1998-1999 46243 48
1999-2000 51620 12
2000-2001 52016Source: Director of Industries, Punjab
Technological status; some observations
• Most of the components of our cycles are made from mild steel, with the latest introduction of plastics and aluminum for the export market only. Even the steel of desired specifications and quality is not available at reasonable rates.
• Quality control system is generally poor. The component manufacturers, being mostly in the tiny sector, have very inadequate quality control systems. Even at the assembly stage and in retailers and shops, the mechanics are not adequately trained and aware of the importance of various alignments, etc.
• The ordinary bicycle comprises of as many as 300 individual components and over 1,500 operations are performed to manufacture it. Various manufacturing techniques prevalent in our country are not only time consuming, but also causing extensive raw matenal wastage.
Strategy for future development
A well-defined strategy has to be formulated to sustain and accelerate the present growth rate and increase the market size, both domestic and export, against the backdrop of stiff competition from China. The industry has to produce quality products and introduce new designs in the market for survival. Technological upgradation through innovative R&D, human resource development through skills-upgradation and training, adoption of the cluster approach for systematic infrastructure development and market oriented policy and institutional framework are absolutely essential for growth.

Based on a wide-ranging interaction with various segments of the industry, which sometimes have divergent points of view, it is suggested that a single federation of bicycle and bicycle parts industries with different association as its constituents should be formed to promote overall growth. The federation should evolve appropriate mechanisms for providing R&D, marketing, policy and infrastructural support to facilitate growth. The proposed federation could have the following structure:
Technology upgradation
Wide technology gaps have been observed between the technologies in use in the developed countries and in India and it is necessary to bridge them by new developments in the designs of bicycles, parts and components. As it is beyond the capabilities of the existing small-scale sector it is absolutely necessary to suitably restructure and strengthen the Research & Development Centre for Bicycles & Sewing Machines at Ludhiana.
Research & Development Centre for bicycles and sewing machines
The centre was set up in 1981 with the assistance of UNDP/UNIDO with the following main objectives;
• Design and develop new models of bicycles and pass on the know-how to the industry for commercial exploitation.
• Evolve testing and quality control procedures, which could be adopted by the industry and, thus enable it to produce contemporary and high quality models for domestic and export markets.
With UNDP assistance the centre was equipped well, but it has not been able to contribute much to technology upgradation of the industry and development of new models of cycles and parts. Whatever little R&D work was going on in the centre came to a standstill with the discontinuation of financial assistance from the Punjab Government. At present, the centre is only working as a production and testing unit and earning just enough to pay wages and salaries and other establishment expenses.
The quality of bicycles has to be improved and new models, comparable to international designs, introduced, to sustain the growth and further development of the bicycle

industry in the state and to increase its siiare of export. To achieve this objective the R&D centre should be restructured and strengthened possibly on the following lines:
• The bicycle industry should form a Federation of Bicycle Industry with the active participation of industry associations representing different segnrients.
• The state government should transfer the management, control, and assets of the R&D Centre to the Federation on the basis of a binding protocol.
• Future expenditure, recurring/non-recurring, to run the centre should be borne by the Federation. For this purpose a Bicycle Development fund may be created by levying a Development Cess of say two rupees per bicycle. Appropriate mechanism for collecting the cess may be evolved by the Central/State Government in consultation with the proposed Federation.
• A one-time grant may be provided by the Central/State Government or obtained from some international agency like UNDP through the good offices of the Government of India, to meet the financial requirements for upgradation of the R&D Centre.
The R&D Centre should work with the objectives of:
• Designing and developing new models comparable with the latest available in the international market and pass on the knowhow to the industry for commercial exploitation.
• Strengthening the testing and quality control labs to make available testing facilities for all types of bicycles and components.
• Upgrading of standardization and calibration facilities.• Reinforcing the Documentation centre by making available latest literature
and periodicals on domestic and international marketing information, new designs, manufacturing techniques and testing methods and international standards and specifications.
Human resource development and training
Training the workforce of the industry is necessary for upgrading their skills to adopt the latest manufacturing technologies, management techniques and quality management systems enabling them to compete in the international markets. Study visits to the developed countries should be conducted to give exposure to new developments taking place in the global arena.
Consortium/nodal agency
The trade associations related to bicycle and component industry should join hands and form a consortium/nodal agency to obtain the maximum advantage of partnership. This agency should Work to for safeguard and promote the interests of the industry in domestic and international markets, for procuring raw materials at reasonable prices, dissemination of trade information and liaison with government, financial, and other developmental institutions.
A consortium approach may be adopted to reap the following benefits:• Improve the bargaining strength in price negotiation, thus avoiding price
cutting and undercutting by individual exporting units.

• Secure favourable terms of trade with regard to price, payment terms, etc.• Popularize the common brand through effective marketing in the export
market.• Build strategic tie-ups, including joint ventures, with well-known international
companies in the industry to tap growing and vibrant segments of markets in USA, Europe and other developed countries.
• Avail the advantage of marketing development assistance and other promotional policy measures of the government.
The mindset of the consumer has to undergo a sea change. Bicycle is considered a poor man’s transport. Populations with higher income avoid riding a bicycle because it is a typical roadster model and does not suit their tastes and status. Under these conditions, there is not much demand from the higher income strata. The bicycle is made keeping in view the lower income group of the population that cannot afford higher prices. In trying to keep the price low, not much headway has been made in the design and look of the bicycle. The following steps could be taken to break the vicious circle:
• New fancy models should be developed and offered to the public for free test ride.
• Trade fairs and bicycle racing should be popularized.• Enable the industry to have access to raw materials from international as well
as domestic sources.• Possibilities of providing locally produced raw materials at international prices
can be pursued.• Imports of raw materials can be made in economically viable bulk quantities.
Policy and institutional support
• More specialized SSI bank branches may be opened to provide financial assistance to the SSI sector.
• Finance should be made available at a reasonable cost, e.g., at a interest below or equal to prime lending rate (PLR).
• Financial evaluation procedures for lending should be made more objective and transparent and made public.
Reservation policy
The reservation policy for bicycle components and parts has played a major role in fostering the small and tiny sectors. Though serious doubts about its relevance have been raised, in the context of current national and international trends, after a series of meetings with industry associations and representatives, it is felt that the present policy of reservation should be continued for the time being. However, the investment limit of Rs. 1 crore could be to enhanced to Rs. 5 crore in some selected and identified components to begin with, in order to:
• achieve higher quality standards;• introduce new models in domestic and export markets;• avail of economies of scale to face the new challenges under the emerging
WTO regime; and• introduce state of art technologies to attain higher levels of productivity and
share of export market.

After independence, Ludhiana and areas around it have emerged as a natural cluster for the bicycle industry, with medium, small and tiny industrial units, using traditional and modern techniques of production, but not well organized and systematic. These units are located in a haphazard manner causing considerable environmental degradation and other problems. Unless a systematic and planned cluster approach is followed, further development of the industry and even the present trend of growth will not be sustainable. Based on detailed discussions with government officials and industry associations concerned, it is suggested that the exiting cluster should be strengthened with modifications. A common effluent treatment plant is absolutely necessary in the existing cluster, to provide a pollution-free environment. Better infrastructure facilities are essential for efficient material movement. The concept of ‘flatted factory system’ should be to introduced in selected, planned areas, provide more industrial accommodation and factory space. For facilitating future growth the following specific suggestions deserve urgent follow-up:
• There should be an area exclusively allocated for the bicycle industry; to begin with 100 acres with provision for further extension.
• The units in residential areas should be relocated within this new cluster to check pollution in these areas and facilitate future growth.
• Concerted efforts one necessary by both Central and State Governments, industry associations and other agencies involved, with industry taking the lead, for developing the cluster.
• Central/State Governments may give one time grant for the development of the cluster.
The planned cluster will not only help remove the existing bottlenecks but also facilitate availing of the full benefits of government policy and available resources and facilities. The major benefits of the cluster could be:
• Taxes can be levied only at entry and exit points, thus enabling the free movement of goods within the cluster.
• Units located within the cluster can be linked through a computer network for better sharing and dissemination of information.
• Labour laws can be liberalized within the cluster.• Time-and-work study can be conducted within the cluster for achieving higher
levels of productivity and efficiency.• The single-window clearance scheme can be better implemented.• Access to finance to industry through banks and other financial institutions
can be improved• Promote partnership for HRD, technology upgradation, procurement of raw
materials, common facility services in production and testing, and marketing of products in domestic and international markets.

With the increase in the motor vehicle population in the country during the 1980s, a large number of SSI units were established in Punjab to produce automobile components. These units have been catering to the needs of original equipment manufacturers (OEMs) and replacement markets. Of late, some units have also come up to serve the export market with improved technology and product quality and they have been able to export even to developed countries. The industry, which started as motor vehicle repair workshops, has come of age and is now a major foreign exchange earner.
The automobile industry in Punjab is mainly an auto-component industry. The total number of units has grown to 2,598 (with 2,569 in SSI and 29 in L&M) employing about 45,745 persons in 1999-2000. The total production in this sector has been valued at Rs.2,154.90 crore with an investment of Rs. 1,128.03 crore growing at an annual average rate of 14.7 per cent and 8.4 per cent for production and investment respectively, during 1995-96 to 1999-00. Thus, the performance of this sector has been quite good. The status of the automobile and components industry is shown in Table 10.
Table 10
YearUnits (No.) Employment (No.) Investment (Rs. lakh) Production (Rs. lakh)
SSI L&M Total SSI L&M Total SSI L&M Total SSI L&M Total1995-1996 2269 27 2296 15432 25105 40537 5044 82359 87403 19569 108647 1282161996-1997 2334 29 2363 15492 25929 41421 5764 89347 95111 22189 139802 1619911997-1998 2451 31 2482 16727 25570 42297 6815 126957 133772 28064 122685 1507491998-1999 2505 29 2534 17658 27285 44943 8310 115767 124077 29824 141565 1713891999-2000 2569 29 2598 18281 27464 45745 9844 102959 112803 32647 182843 215490Source: Director of Industries, Punjab
The capital-output ratio in the SSI sector has marginally increased from 0.26 in 1995-96 to 0.30 in 1999-2000, while in the L&M sector it has declined from 0.76 to 0.56.
Investment and production in the SSI sector per employee during 1995-96 to 1999-2000 increased from Rs. 0.33 lakh to 0.54 lakh and from Rs. 1.27 lakh to Rs. 1.79 lakh respectively. During the same period, investment and production per employee in the L&M sector increased from Rs. 3.28 lakh to Rs. 3.75 lakh and from Rs. 4.33 lakh to 6.66 lakh respectively.
Major destinations of auto components exports are Europe (36%), America (27%), Asia (16%), Africa (13%) and others (8%). The auto components industry has contributed significantly to exports as shown in Table 11.

ExportTable 11
of Auto Components (Rs. in lakh)Year Value (FOB) Change (%)
1994-1995 4419
1996-1997 5436 23.01
1997-1998 8434 55.15
1998-1999 13862 64.36
1999-2000 14282 3.03
2000-2001 14415 0.93Source: Director of Industries, Punjab
Auto-parts manufacturing units are spread over the whole state and most of them manufacture components required in the replacement market. The products presently manufactured in the industrial belts of Ludhiana, Jalandhar, Kapurthala and Ropar are metal-based. They range from such simple items as nuts and bolts to such complex items as axle, shafts and radiators. Managerial standards, engineering capability, machinery and quality control vary from poor to excellent, with most of the small-scale units showing engineering ingenuity and getting the best out of what they have and what they know.
Present technological status and observations
Among the auto-component manufacturers, there exists a three-tier structure. At tier-1 are the original equipment manufacturers (OEM) and components manufactured by them go either directly into assembly lines or are exported. There are a few units in tier-1 category and they are in the large and medium sector. Tier-ll manufacturers supply subcomponents to tier-1 manufacturers as well as to the export market. Tier-Ill manufacturers produce low-cost, low value-added, low quality auto-component and mainly cater to the needs of the replacement market. Most of the component manufacturers in the large and medium sector and in the SSI sector fall in the tier-11 category and tier-111 category respectively.
Auto-components manufacturers in the SSI sector use conventional techniques of production and machinery, such as open die, old types of power presses, inefficient furnaces, old generation welding equipment, and locally made special purpose machines called ‘Addas’, etc. The processes are not carried out in sequence and based on scientific lines. Dies and other press tools are generally got manufactured from die makers lacking knowledge of designing and development techniques. Consumables, such as lubricants, welding electrodes and tools, etc., are selected on a random basis and no proper attention is given to the required grade. Without the latest designing facility, like CAD or OEM drawings of the components, most of the small- scale units merely produce components by copying samples. Small-scale units cannot achieve interchangeability as well as the required tolerances required by the replacement market. The majority of the units do not follow documented procedures of quality control. Components are not inspected at various stages of processing. Locally made inspection gauges are used, and there is no provision to calibrate them periodically. Small-scale entrepreneurs are not aware of various new methods and techniques, to either combat pollution or adopt alternative pollution-free processes. The low level of technologies in

use results in high cost, poor quality and low productivity and consequent competitive disadvantages.
Strategy for Development of Auto-component Industry
There is no doubt that the auto-component industry needs quality improvement and more market exposure. To achieve these objectives, technology upgradation, human resource development and training, effective innovative management techniques for producing zero-defect products, quality control and adopting the cluster approach for systematic and planned infrastructure development are necessary.
Technology upgradation
Wide gaps exist between technologies used by auto-component manufacturers in India and abroad. With MNCs setting up their shops in India, auto-component manufacturers should give serious thought to technology upgradation and quality control. It is well nigh impossible for SSI in Punjab to bridge this technological gap on their own, because they neither have the resources nor the capabilities. The Automobile R&D Centre at Ludhiana needs to be strengthened and its technological capabilities upgraded to provide guidance and support to the industry.
Suggestions to bridge the identified gaps
Product development: Hot forging requires to be replaced by cold forging techniques wherever possible and economical. An intermediate technology in the form of warm forging could also be introduced. The OEM drawings of components should be made available to small-scale units so that quality components within required tolerances and interchangeability are ensured.
Quality control: Units should adopt documented procedures for quality control, and inspection of components at various stages of processing should be introduced. Separate inspection cells/sections should be established in the units and their working should be made effective. The ultimate aim of Total Quality should be achieved through various quality control measures. The units should go for ISO-14000 Certification.
Pollution control: Entrepreneurs should be provided with information on various new techniques and technologies, which are eco-friendly and can combat pollution hazards. Small versions of economical and efficient systems of pollution-control devices and equipment should be made readily available in the market. The State Pollution Control Board should not only act as a regulatory body but also assist small-scale entrepreneurs to overcome problems faced by them in trying to control pollution.
Energy conservation: Economical versions of fuel-efficient designs of furnaces and other heating equipment could be made available to the entrepreneurs at reasonable prices, to achieve energy conservation. Power-efficient electric motors, lighting system, welding equipment, etc., should be introduced to small- scale industrialists.
Human resource development: Various institutions engaged in imparting training to industrial workers and supervisors and other managerial staff should be equipped on modern lines to cater to the special needs of the industry.

Punjab is endowed with fertile land and a favourable climate to grow a large number of cereals, fruits and vegetables, oilseeds, pulses and maize and provides about 25 per cent of India’s wheat production and approximately 10 per cent of rice production. The state has basic raw materials, manpower and a vast consumer market, which are the necessary prerequisites for industrial production. Value addition in agriculture is the answer to the wheat-paddy rotation, which has become one of the weak spots in the state’s economy.
There is a huge domestic and export market for food products, but the consumer demands high quality food, both raw and processed, at affordable prices. Development of the agro/food processing sector can bring more employment opportunities, especially in the small towns and rural areas, and cheaper and better products to the consumers. Therefore, Punjab will have to look for alternative crops, which can increase revenues/returns to the farmers and have better scope for marketing/processing. This would be possible with research and development in specific crops to achieve desired quality/yield and supporting infrastructure.
Status and potential
The food-processing sector covers a wide spectrum of products and is one of the largest in terms of production, consumption, export and growth prospects. The vast potential of agricultural resources available in Punjab can be better exploited and utilized by preserving and processing, using available technologies. Though the Government of India has sanctioned a number of schemes, so far not much progress has been made towards setting up agro-based food processing industries, proportionate to the agriculture potentials and commodities available in the state. At present, the agroprocessing industry is mainly limited to traditional processing of agricultural raw materials, such as atta chakkies, oil mills, cotton ginning and rice shelling, etc., using a basic, low-grade technology. There is little high-tech agro/food industry adding value to primary products. Only less than two per cent of the fruits and vegetables produced is processed, compared with 80 per cent in Malaysia. Therefore, there is scope for setting up a processing industry in the state, on a priority basis, using indigenous technologies as well as the latest technologies from abroad. The present status of the food and beverages industry in Punjab is shown in Table 12. Production has grown at an average rate of 15 per cent during 1995-96 to 1999-2000. The share of the food and beverages Industry on 31 March 2000 was 18.66 per cent, the highest of the total production of the industrial sector in Punjab.
The capital-output ratio of the SSI sector has slightly improved from 0.22 in 1995-96 to 0.24 in 1999-2000; in the large and medium sector it initially improved from 0.46 to 0.51, but later declined in 1998-99 and, 1999-2000 to 0.41. The investment in the SSI sector per employee has increased from Rs. 0.58 lakh in 1995-96 to Rs. 0.9 lakh in 1999-2000, and production per increased from Rs. 2.61 lakh in 1995-96 to Rs. 3.67 lakh in 1999- 2000. On the other hand, in the large and medium sector the investment per employee increased from Rs. 4.18 lakh in 1995-96 to Rs. 5.81 lakh in 1999-2000 and the production per employee from Rs. 9.01 lakh in 1995-96 to Rs. 14.12 lakh in 1999-2000.

Table 12Status of Food & Beverages Industry in Punjab
YearUnits (No.)
SSI L&M Total
Employment (No.)
SSI L&M Total
Investment (Rs. lakh)
SSI L&M Total
Production (Rs. lakh).
SSI L&M Total
1995-1996 8972 103 9075 50872 33952 84824 29260 141899 171159 132527 305835 438362
1996-1997 9159 108 9267 52825 34855 87680 32829 164714 197543 154515 320804 475319
1997-1998 9301 114 9415 54318 35482 89800 37260 195533 232793 173856 405214 579070
1998-1999 9443 123 9566 56952 38165 95117 43941 220707 264648 192145 543721 735866
1999-2000 9644 121 9765 59950 37754 97704 53694 219445 273139 219750 533019 752769
Source: Director of Industries, Punjab
By using better techniques of farming, high yielding and hybrid seeds, agro-processing units could enhance farm income very substantially. Reports indicate that in the case of Pepsi Foods Limited, Hoshiarpur, the tomato yield increased by 200-266 per cent and income of farming increased by 230 per cent.
According to the assessment of Mckinsey (1997), packaged atta, packaged milk, fresh poultry, bakery, Indian dairy products and confectionery will grow faster with high volumes as these are mass-consumption items. The projected volume of business turnover in different categories of food processing industries, according to this study is given in Table 13.
Table 13Projected Volume of Business Turnover of Agro-processing Industry in India (200^
Sr. No. Food category and sub category Likely volume of business in 2005 (Rs. in crore)
1. High volume & growth
(') Packaged atta 15000
(") Packaged milk 36000
(iii) Fresh poultry 27000
(iv) Bakery 10000
( W Tea & Coffee 7400
( V i) Confectionery 6500
(vii) Soft drinks 10500
(viii) Processing meat & poultry 9000
(ix) Indian dairy products 7300
2. High growth & low volume
( i ) Frozen vegetables 350
(ii) Puree, jam, sauces 1000
(iii) Fnjit drinks 2000
(iv) Fresh vegetables 1200
(V) Value-added dairy products 47003. Low growth & high volume
( i ) Sugar 24000
Oil 50000Total 211950
Source: Mckinsey and Company (1997)

Large gaps exist in the industry at different stages of operation, such as raw materials, technology and machinery, processing techniques, quality control and packaging. As already stated, most of the food processing units are in the small and tiny sector, using old inefficient, uneconomical machinery and technology and lacking infrastructure, because of financial and other constraints. At present, workers do not have basic ideas of food processing, and unskilled workers and supervisors work in the industry. Personal hygiene is also very poor in most cases. Training of floor level workers and their personal hygiene are essential to produce quality finished products. Quality control of raw materials and finished products is as important as processing. To compete in national and international markets, strict quality control of finished products is a must. Packaging is also one of the important aspects of the development of the food processing industry. The agro/food processing industry can be considered a sunrise industry and it has the potential of attracting local and foreign investments in Punjab.
To emerge as a leader in the agro-processing industry, a well thought-out, co-ordinated, growth-oriented, multipronged, strategy covering the following aspects could be considered:
• The role and responsibility of public sector undertakings in the agricultural sector should be thoroughly reviewed and appropriate structural changes made to render them effective instruments for promoting the agro/food- processing industry in the present situation.
• Agri-Export Zones (AEZs) and Parks should be set up product-wise, after examining their viability. This will facilitate building centralized, modern infrastructure. These facilities should be available to medium SSI/Tiny industries and farmers on a shared basis against reasonable cost. The private sector should be motivated to participate effectively in setting up the AEZs, with initial financial assistance from the Government of India and promotional support from the Punjab Government.
• Multinational companies (MNCs), should be attracted to invest in agro/ food processing industry in Punjab. This will facilitate upgradation of the entire infrastructure for achieving the benefits of large-scale vertical integration of different activities across the agro-business chain. This step is very vital for the growth of the agro/food processing industry in Punjab, in the emerging competitive markets for agro/food products.
• The state government should carefully examine the schemes of the Government of India for the promotion of agro/food processing and adopt and implement expeditiously only those which further and facilitate the achievements of its objectives.
• Keeping in view the growth potential of the agro/food processing industry, an Apex Review Committee, presided over by the chief minister, should review and monitor periodically the strategies and plans and projects in this sector.

Ludhiana is famous worldwide for its hosiery and knitting industry. The history of hosiery in Ludhiana can be traced back to 1902-1903, when the first unit manufacturing woollen socks was set up. During the years that followed this industry in Ludhiana progressed steadily. Till recent years our main trading partner for the export of hosiery knitwear, was the erstwhile USSR. However, after its disintegration, exports have diversified to other markets, viz., Europe, USA and other advanced countries. Production in the textile and hosiery industry in the Eighth FYP achieved an impressive average annual growth rate of 26 per cent. It, however, declined sharply during 1995-96 to 1999-2000 to 14 per cent in textile and 11.22 per cent in hosiery, as shown in Table 14;
Table 14Status of Textile and Hosiery Industry In Punjab______
Year Textile/ Dying/ WeavingSSI L&M
Hosiery & GarmentsTotal L&M SSI Total Grand
TotalUnits
1995-1996 635 56 691 54 12760 12814 135051996-1997 653 69 722 73 13068 13141 138631997-1998 673 79 752 79 13311 13390 141421998-1999 696 87 783 67 13486 13553 143361999-2000 715 108 823 68 13665 13733 14556
Employment1995-1996 4119 48455 52574 24744 89884 114628 1672021996-1997 4397 55347 59744 23652 91945 115597 1753411997-1998 4909 55761 60670 21679 93600 115279 1759491998-1999 5327 57180 62507 18684 96537 115221 1777281999-2000 5719 67535 73254 18618 98465 117083 190337
Investment (Rs. lakh)1995-1996 2194 182524 184718 74565 15970 90535 2752531996-1997 2620 237904 240524 79029 17678 96707 3372311997-1998 3827 266879 270706 95923 19657 115580 3862861998-1999 6089 319088 325177 151957 26157 178114 5032911999-2000 7578 328617 336195 162272 30239 192511 528706
Production (Rs. lakh)1995-1996 11234 212495 223729 103264 96758 200022 4237511996-1997 12953 298970 311923 125861 107401 233262 5451851997-1998 19846 322782 342628 152897 121243 274140 6167681998-1999 21927 355536 377463 145299 135818 281117 6585801999-2000 24840 340008 364848 148063 156062 304125 668973
Source: Director of Industries Punjab.
During 1995-96 to 1999-2000 the capital-output ratio of the SSI and the L&M sectors in the textile industry increased form 0.20 to 0.31 and from 0.86 to 0.97 respectively. In the hosiery industry during the same period it increased from 0.17 to 0.19 and from 0.72 to 1.10 respectively, as shown in Table 14. Investment per employee in the SSI and the L&M sectors in the textile industry increased from Rs. 0.53 lakh to Rs. 1.33 lakh and

from Rs. 3.77 lakh to Rs. 4.87 lakh respectively and in the hosiery industry from 0.18 lakh to 0.31 lakh and from Rs. 3.01 lakh to Rs. 8.72 lakh respectively.
Table 15______________ Consolidated Data for the Textile and Hosiery Industry
Year Units (No.SSI L&M Total
Employment (NoSSI L&M Total
Investment (lakh)SSI L&M Total
Production (lakh)SSI L&M Total
1995-1996 13395 110 13505 94003 73199 167202 18164 257089 275253 107992 315759 423751
1996-1997 13721 142 13863 96342 78999 175341 20298 316933 337231 120354 424831 545185
1997-1998 13984 158 14142 98509 77440 175949 23484 362802 386286 141089 475679 616768
1998-1999 14182 154 14336 101864 75864 177728 32246 471045 503291 157745 500835 658580
1999-2000 14380 176 14556 104184 86153 190337 37817 490889 528706 180902 488071 668973
Source: Director of Industries Punjab.
The capital output ratio of the SSI and the L&M sectors increased from 0.17 to 0.21 and from 0.81 to 1.01 respectively as shown in Table 15 during 1995-96 to 1999-2000. Investment per employee in the SSI sector nearly doubled form Rs. 0.19 lakh to Rs. 0.36 lakh while in the L&M sector it increased from Rs. 3.51 lakh to Rs. 5.70 lakh during 1995-96 to 1999-2000. Production per employee in the SSI sector increased from Rs.1.15 lakh to Rs.1.74 lakh and in the L&M sector from Rs.4.31 lakh to Rs.5.67 lakh.
Table 16
YearUnits Employment Investment Production
ssi L&M SSI L&M SSI L&M SSI L&MEighthPlan 4.41 17.96 3.08 5.34 12.00 26.48 28.84 26.04
1996-2000 1.79 13.03 2.61 4.37 17.95 20,51 13.79 12.31Source: Based on data from Director of Industries Punjab.
As shown in Table 16, there has been a decline in the number of industrial units, employment and production in 1995-96 to 1999-2000 compared with the Eighth FYP.
Exports
Table 17
Year Exports (Rs. lakh) Change (%)
1997-1998 141519
1998-1999 139820 -1.20
1999-2000 156785 12.13
2000-2001 153120 -2.34Source: Director of Industries, Punjab
Status of the industry; some observations
The textile and hosiery Industry in Punjab can be classified into two groups, viz., hosiery & readymade garments and textiles. The hosiery and readymade garments industry is highly labour- intensive There exists a ‘technological dualism’ in this industry as, on the one hand, it uses state-of-the-art technology, manufacturing high value-added fashion

garments and on the other, it relies on conventional, locally manufactured and fabricated machinery and equipment, well suited to the capabilities of the untrained and illiterate labour force. Yarn is the basic raw material for textile, hosiery and readymade garments. Proper blended yarn of requisite quality is not available at a reasonable price. The dyeing processes at present are highly energy consuming, inefficient and polluting and in-house testing facilities for colour-matching and colour-fastness are not available in most of the units. Designs normally are copies from magazines, journals, or samples provided by the buyers. The majority of the units have not adopted Computer Aided Designing/ Manufacturing.
Machinery being used in the industry are flat-bed machines, circular knitting machines and imported reconditioned knitting machines. To cater to the requirements of western countries, it is essential to improve the technology not only to manufacture hosiery products, but also the basic machinery. Emphasis should be more and more on the use of computerized machinery and equipment. The industry is still not using laser and other modern techniques for cutting the fabric. Knitwear is stitched on multi-thread lock-stitch, chain-lock, flat-lock and over-lock machines, either manufactured indigenously or imported. Embroidery, patchwork, printing and beadwork are done with indigenous machinery and the quality of embroidery is not acceptable in the international market. However, some of the progressive units have imported computerized multi-head embroidery machines, which can create intricate logos on T-Shirts and other garments. Latest models of modern machinery and equipment in use in developed and other developing countries for producing yarns of new blends, ready to use yarn, knitting fabric, cutting and stitching knitwear, dyeing and finishing the and products, and CAD/CAM facilities must be introduced in our country.
As the Hosiery and Knitwear Facility has closed down there is no institute or agency, which is involved in research and development in hosiery and knitwear in the state, to develop low-cost hybrid technologies. The industry is in need of such a facility, which would develop and transfer technologies to the units.
Strategy for the development of hosiery and textile industry
Human resource development: With the addition of the latest models of machinery and equipment, the industry needs a trained workforce to handle these efficiently and effectively. There is no training centre to impart training on electronic gadgets and systems, computer-aided designing and manufacturing, handling of testing equipments, etc. Apart from these technical training facilities, the industry also needs specialized trained professionals in different managerial, marketing, and financial areas, to make the units sustainable and internationally competitive.
Textile park: Textile parks with ultra-modern facilities are required to be developed near Ludhiana for hosiery and knitted garment units. The layout of the complex should be such that dyeing and processing units are clubbed together, so that a Common Effluent Treatment Plant is feasible. Provisions should also be made for setting up on R & D Centre, Testing and Training Centres, Exhibition hall. Auditorium, Telecommunication, etc.
Air cargo facilities at Ludhiana: Facilities for Air Cargo Services in or around Ludhiana would facilitate exports.

Research and development centre: An exclusive Centre for Research & Development for hosiery and knitted garments, to develop appropriate modern technologies and processes is required at Ludhiana. It should have modern facilities backed by well- known specialists and experts in the field, with a separate wing for imparting training to workers and intermediate-level management personnel. Regular courses at the degree and post-graduate level should also be undertaken. The Centre should act as a show- window of modern technology, by installing various machinery and equipment. The land, building and equipment of the defunct common facility set up by the state government could be transferred to the Association of Hosiery and Knitwear Industry, which should take on the responsibility of establishing and running the new facility. An appropriate institutional mechanism should be evolved for this purpose through consultation between the Central and State Governments and the Associations concerned.
National institute for fashion technology: A full fledged Institute of Fashion Technology, on the pattern of such Institutes at New Delhi, Hyderabad, Tirupur, Kolkata and Mumbai, should be established at Ludhiana to train professionals in designing, marketing, quality control and manufacturing of knitwear. The institute could help in creating awareness among the local entrepreneurs by organizing exhibitions, fashion shows, seminars, etc. The management of this institute too should be with the Association of Industry defined by a protocol with the State/Central Governments.
Visits of foreign experts: The Government of India should invite experts on spinning, dyeing, processing, knitting, finishing and manufacturing of garments from developed and other developing countries, to enlighten small-scale entrepreneurs about appropriate technologies and processes, on the basis of study of the existing set-up of the units during their stay. This will help in creating confidence among the entrepreneurs in making their units sustainable and competitive in the international market. The proposed Institute could co-ordinate this activity.
Development of economical models of modern machines: Machine building facilities and capabilities within the country should be upgraded and updated, either through foreign collaborations or by assigning special projects to various institutes engaged in R & D, such as MERADO, (Ludhiana) and CMTl (Bangalore). Creation of such facilities would not only help in developing the hosiery and readymade garments manufacturing units, but would also save foreign exchange, as well as earn it through export.
Financial assistance: For modernization and technology upgradation of the cluster, it is essential in this era of stiff competition to provide finance at rates of interest comparable with internationally prevailing interest rates. This will help the small-scale units to purchase modern machinery and components required to produce products of acceptable quality. This will encourage more and more small-scale units to enter the international market, thus boosting India's share in world trade. The state government should take up the matter with the Central Government and the Reserve Bank of India.
Development and transfer of dyeing and processing technology: ThellTs/universities in the country, having textile technology as a branch of study, should be entrusted with special projects for developing and transferring eco-friendly, lesser energy- and water-consuming technology for wet dyeing of yarn/fabric.
Common brand: The hosiery and knitwear manufacturing industry at Ludhiana can not compete with the multinational companies in the quantum of production, types, styles,

designs and quality of products. Some tie-ups with some of the larger established brands for manufacturing as well as marketing in the international market are essential for increasing India’s of share of foreign trade in this area.
BASIC METAL INDUSTRY
The basic metal industry is acclaimed as the mother of all industries. Before independence there were some restrictions on setting up the iron and steel industry and, therefore, very few units were engaged in the manufacture of basic metals. These units were mainly concentrated in the erstwhile princely states of Nabha, Patiala, and Faridkot. These states offered many incentives, such as tax holiday and free land, to promote industry within their respective territories. After independence, overall industrial growth in Punjab to the development of the steel industry as backward-linkage efforts. The industry, which started with the manufacture of bars and rods and small smith shops, graduated to the manufacture of forging items, castings for machine tools, girders, heavy channels and joints of different compositions. This impressive growth despite Punjab’s distance from coal mines, steel producing areas and ports was due to such factors as availability of cheap and good quality power, entrepreneurship and incentives given by government such as freight equalization.
Major constituents of the basic metal industry are casting, forging, melting and re-rolling. The present status of the industry is shown in Table 18.
Table 18
Year Units (No.) Ennployment (No.) Investment (lakh) Production (lakh)
SSI L&M Total SSI L&M Total SSI L&M Total SSI L&M Total
1980-1981 2232 26 2258 19588 8837 28425 4452 4886 9338 12887 11692 24579
1985-1986 3101 33 3134 25902 10131 36033 8247 11881 20128 21832 30574 52406
1990-1991 4086 51 4137 33442 14729 48171 12603 22457 35060 48904 91874 140778
1995-1996 5093 95 5188 45093 18387 63480 217.64 675.33 892.97 1373.09 2718.07 4091.16
1996-1997 5227 105 5332 47280 18683 65963 2507Q 76974 102044 163353 281346 444699
1997-1998 5349 105 5454 49410 18207 67617 29964 70837 100801 197929 442597 640526
1998-1999 5462 93 5555 51902 16942 68844 35723 78205 113928 213184 228951 442135
1999-2000 5568 77 5645 54468 15369 69837 41262 78596 119858 270937 206593 477530
Source: Directorate of Industry Punjab
The capital-output ratio in the basic metal industry is 0.25 with 0.15 in the SSI sector and 0.38 in the L&M sector. The investment required to generate one unit of employment is Rs. 75,000 and rupees five lakh in the SSI and L&M sectors respectively. The L&M sector, with an average share of 70 per cent and 58 per cent in investment and production, has been leading over the SSI sector in the basic metal industry in Punjab, for the last four years (1996-97 to 1999-2000). However the SSI units employ 75 per cent of total workforce in the basic metal industry.
Melting and re-rolling industry
Re-rolling is one of the most important segments of the iron and steel industry, constituting an essential link in its supply chain. The rolling and re-rolling mills cluster in Punjab is located at Mandi Gobindgarh and adjoining areas. Mandi Gobindgarh is rightly called the Steel Town of Punjab. About 275 rolling and re-rolling mills, five arc furnaces and 100 induction furnaces are in operation in Punjab. The steel melting and re-rolling sector consists of small and medium scale units producing several thousand tonnes annually of different types of structurals, rods, plates, flats, etc.
Technological status and gaps
Various sizes and types of re-rolling mills and induction furnaces are in operation. Machines and furnaces are indigenously designed and manufactured. Sizes of induction furnaces vary from two tonnes to 12 tonnes per charge. These furnaces produce mild steel of structural quality at a competitive cost and as per BIS standards. Generally, rolling mills operate at slow speeds, though a few units have established medium-speed rolling mills. Some units have adopted automation to perform certain difficult and hazardous operations and these semi-automatic rolling mills are more efficient and produce better quality products. Almost all types of sections of various sizes in different compositions are being manufactured in Punjab, contributing about 25 per cent of the total production of rolled steel products in India.
Consumption of oil and coal per metric tonne of steel is much higher than international standard, as the industry uses 45-60 litres of oil compared to 25-30 litres internationally. Cost of fuel alone accounts for about 30 per cent of the total cost of production. Therefore, the main emphasis should be on energy conservation as a cost saving measure. Scrap is the basic raw material for the melting and re-rolling industry. It comes from different sources, such as ship-breaking, steel plants, imports and local scrap dealers. Scrap coming from steel plants and ship-breaking is of good quality. Local as well as imported scrap are not so. Though induction furnaces undertake limited refining, the end products are not of good quality.
The roll passes are designed purely on the basis of the practical experience of the foreman of the mill, who is generally not well qualified and well conversant with requirements of grades of rolling materials, pressures, speeds and reductions, etc. Faulty roll-pass design results in frequent breakdown of machinery, poor quality of finished goods and wastage of energy. Average capacity utilization of Punjab’s re-rolling industry is about 37 per cent of the total installed capacity, with many mills not even breaking even. This is mainly due to the obsolete technology and consumption of expensive energy.
The major problems of the industry are lack of technical knowledge and awareness of energy-efficient and environmentally sound technologies, as well as practices that have been introduced successfully across the globe. The means of transforming this knowledge and awareness into an operational framework is also lacking because of:
• Low and asymmetric information base which has limited the size of thetechnology market.
• Low engineering, technology, innovation and R&D base.• Low level of human resources development.• Dominance of technical and financial risks in the minds of decision makers.

Re-rolling mills do not often adopt quality control measures and normally they keep control only over dimensional accuracy. Very few re-rolling mills have BIS certification. Units of induction furnaces possess good laboratories and some of them even have the latest instruments like spectrometers.
Apart from general trade practices and finance schemes of banks, the industry has evolved a unique finance system of its own to meet its working capital needs. A third party finances the deal between the induction furnace owner and the re-roller. He pays instantly to the furnace owners and charges a premium of a certain fixed amount per tonne for a specified period from the re-roller. The re-roller repays the amount to the third party on a specified date. If he is unable to pay back the financier within the stipulated period, the financier charges higher premium for subsequent next period. This system is reportedly working well as, the seller receives the payments immediately and the re-roller is able to procure raw materials to run his industry.
Suggestions for technological upgradation
• The industry should use liquefied natural gas as fuel, as it has many advantages over coal and oil, which are now in use. LNG is environment friendly, has more calorific value and is cheaper than oil.
• Pilot projects, using continuous processes, having both induction furnace and re-rolling mill should be set up, where preheated scrap could be charged to induction furnace. The plant will not only conserve energy, but also help in providing better quality products.
• Regular workshops/seminars, with the participation of technology suppliers, equipment manufacturers and consultants, will help the industry by providing exposure to new technologies.
• Training operators in operation and maintenance of new systems should be organized.
• Support to provide back-up services and update the technology from time-to- time with R&D inputs, should be ensured.
• Adoption of new technology by a large number of units/markets will depend on information-base and technology dissemination.
• Technical and financial risks involved in the introduction of new technologies have to be assessed by the industry in consultation with experts.
• Software to be developed for roll-pass design and computerized fluid dynamics (CFD) for each unit with institutional back-up for development, installation, training, etc., at the shop floor.
• Market has to be provided intelligence on input material and finished products to help the units to plan their inventory and improve the flow of material.
Status of forging industry
Expansion of road transport, the green revolution and the development of steel making and light engineering industry in the state gave a boost to the forging industry. More than 90 per cent of the forging units are located in Ludhiana and Jalandhar and the remaining in Mandi Gobindgarh, Phagwara, Mohali, Amritsar, etc. The forging industry in the state may be categorised in order of merit into various segments and dispersal thereof at different locations, as indicated below:

Segments__________Nuts, Bolts and Screw
Location________________________Ludhiana, Jalandhar, Mohali, Amritsar
Hand tools and garden tools Jalandhar, Ludhiana
Bicycle & sewing machine parts Ludhiana
Auto-parts Ludhiana, Jalandhar, Phagwara
Tractor parts, Diesel engine parts Ludhiana, Phagwara
General forgings Ludhiana, Mandi Gobindgarh.
Status of technology and upgradation
The forging industry mainly employs hot-forging techniques. Nuts, bolts, screws and similar items upto certain specified sizes are manufactured by the cold-forging process. Some of the progressive units employ warm-forging technology for producing B.B. Axles and allied cycle products.
Hot-forging techniques in general are of a primitive nature, where machinery and equipment in use date back to the fifties or sixties. The technology in practice is both labour- as well as energy- intensive and is dependent on the skill of the persons involved. However, a trend has emerged during the past couple of years to import and install second-hand multi-station horizontal forging machines.
Oil-fired furnaces used for heating and heat treatment are of non-standard specifications and design and are not fuel-efficient. The tools and die-making facilities in the units are very poor. Products forged through poorly designed and manufactured dies are of substandard quality.
More than 90 per cent of the units do not have adequate in-house material-testing facilities. The majority of the machinery and equipment in use in the forging industry are manufactured by the small-scale machinery manufacturers located at Ludhiana and other places in the state. Modern accessories and gadgets are nor available for these machines. Recent additions of imported Knuckle-joint type power presses. Multi-station Horizontal Forging Machines, etc., though second-hand, have brought in new vistas of awareness in the industry.
Provisions for designing of press tools and forging dyes are totally missing. These are traditionally developed under the guidance of foremen by the tool-room people without precision measuring instruments. Recently, some progressive manufacturers have started applying CAD/CAM to forging. The conventional process of designing the formed products by the ‘build-and-test’ method is no longer cost-effective in today’s global competitive market. The only way to reduce the ‘design-to-build’ time and optimize the process is to resort to computer-based product and process design.
Human resource development
The basic metal industry is critically dependent on a skilled work-force, but there is a dearth of technically trained manpower. Though some of the units have engaged better qualified personnel, trained from various institutes, the majority of the labourforce on the shop floor is employed on a contract basis. They are often not concerned about wastage

and quality of products and conserving various inputs. There are many institutions imparting technical training at various levels in the state. However, these training courses need to be revised and upgraded according to latest developments in the industry.
METAL PRODUCTS INDUSTRY
The metal products industry transforms basic metals into more useful products, such as conversion of metal sheets into trunks and almirahs, and pipes into steel furniture. Similarly, it also produces such industrial products as nuts and bolts and hand tools, etc. The metal products industry is concentrated in Amritsar, Jalandhar, Ludhiana and Kapurthala, though fabrication units are spread all over the state. Tables 19 and 20 depict the status and growth of the industry in Punjab. Production in the Eighth FYP achieved quite a good annual average growth rate of 21.27 per cent, but declined in the first three years of the Ninth FYP to 12.21 per cent. The employment growth rate also declined from 2.43 per cent to 1.79 per cent during the same period as shown in Tables 19 and 20.
Table 19
YearUnits (No.) Employment (No.) Investment (Rs. lakh) Production (Rs. lakh)
SSI L&M Total SSI L&M Total SSI L&M Total SSI L&M Total
1980-1981 7854 14 7868 43917 3574 47491 4168 827 4995 10505 1577 12082
1985-1986 12656 14 12670 66081 3119 69200 9035 816 9851 18292 2454 20746
1992-1993 18165 15 18180 85859 3335 89194 17276 1700 18976 45014 5293 50307
1995-1996 19651 12 19663 93077 3180 96257 22248 1869 24117 86396 8518 94914
1996-1997 19870 15 19885 95194 2938 98132 24736 3261 27997 97244 9954 107198
1997-1998 20094 16 20110 96789 2981 99770 27118 4544 31662 116727 11080 127807
1998-1999 20339 12 20351 98825 2945 101770 29462 6169 35631 125292 11252 136544
1999-2000 20569 10 20579 100973 2532 103505 33434 6031 39465 139985 10973 150958
Source: Director of Industries Punjab.
Table 20
Units (No.) Employment (No.)Investment
(Rs. lakh)
Production
(Rs. lakh)
SSI L&M Total SSI L&M Total SSI L&M Total SSI L&M Total
1.16 -11.67 1.15 1.98 -4.59 1.79 10.59 24.29 12.13 13.03 3.46 12.21
Source: Based on data, Director of Industries Punjab.
The capital-output ratio in the SSI sector declined marginally during 1996-97 to 1999-2000, while in the large and medium sector it increased form 0.33 to 0.55 as shown in Table 19. Investment per employee in SSI and the large and medium sectors increased from Rs. 0.26 lakh to Rs. 0.33 lakh and from Rs. 1.11 lakh to Rs. 2.38 lakh respectively

during 1996-97 to 1999-00. During the same period production per employee in SSI and large and medium sectors increased from Rs. 1.02 lakh to Rs. 1.39 lakh and from Rs. 3.39 lakh to Rs. 4.33 lakh respectively.
Hand tools
The term ‘hand tool’ is generally applied to tools used by hand. These are quite smallsized tools, but are essential for erection and maintenance of plants, machinery and equipment. The use of hand tools covers almost all types of industries, viz., engineering, electrical and electronics, construction, plumbing, etc.; different types of servicing industries; and also certain types of production processes irrespective of their sizes and scales of operations (i.e., small, medium or large). Absence of these tools would in fact paralyse every type of industrial activity. Hand tools most commonly used in industries are wrenches, hand drills, pullers, vices, hammers, screwdrivers, pliers, spanners, clamps, cramps, etc. Such hand tools, as flaring tools, pullers, ring expanders and compressors, screw and stud extractors, tyre valve pull-out tools, flanging tools, valve lifters and reseating tools, etc., are extensively used in automobile repair workshops and garages. They also have important applications in the household sector in day to day life.
Growth and present status
The hand tools industry is concentrated in Jalandhar and Ludhiana. With the partition of the country in 1947, there was a large-scale influx of people, including industrialists and artisans, from West Pakistan. Some of them started small manufacturing units for their survival. Certain incentives given by government helped these people to rehabilitate themselves and set up their industries. Owing to acute shortage of foreign exchange and consequent restrictions on the import of various items, including hand tools, the domestic hand tools industry got a comparative advantage in the home market. This, together with increased effective demand in this sector, led to induced investment. In such conducive economic conditions, the hand tools industry of Punjab grew rapidly. The freight equalization scheme of the Central Government, took care of the locational disadvantage of the state of being far away from sources of raw materials, such as iron, steel and coal, and gave a big push to the hand tools industry. The natural dynamism of Punjabi entrepreneurs helped it capture markets not only in the county but also abroad. The product mix and product range availability in Jalandhar is quite extensive and exhaustive compared to other areas of concentration. The industry in the small-scale sector, by adopting a lower-level and labour-intensive technology provides employment to thousands of people in the state. Details of industrial growth, employment, production and investment from the year 1980-81 onwards are given in Table 21.
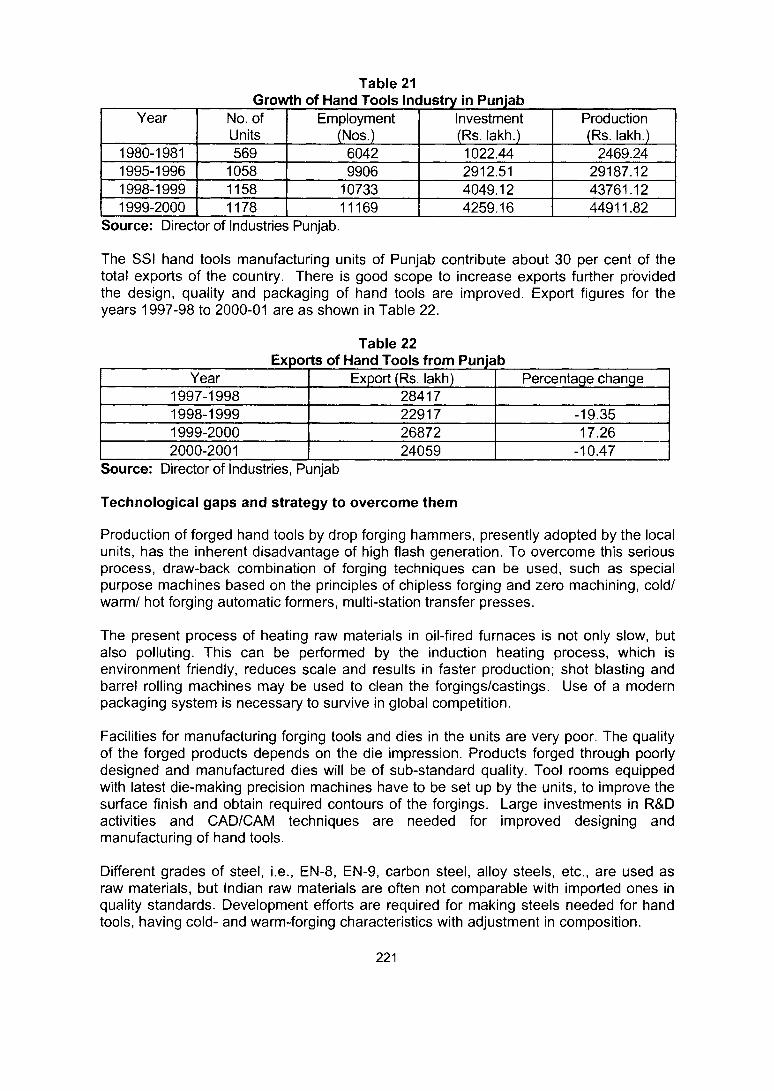
Year No. of Units
Employment(Nos.)
Investment (Rs. lakh.)
Production (Rs. lakh.)
1980-1981 569 6042 1022.44 2469.241995-1996 1058 9906 2912.51 29187.121998-1999 1158 10733 4049.12 43761.121999-2000 1178 11169 4259.16 44911.82
Source: Director of Industries Punjab.
The SSI hand tools manufacturing units of Punjab contribute about 30 per cent of the total exports of the country. There is good scope to increase exports further provided the design, quality and packaging of hand tools are improved. Export figures for the years 1997-98 to 2000-01 are as shown in Table 22.
Table 22_____________________ Exports of Hand Tools from Punjab____________________
Year Export (Rs. lakh) Percentage change1997-1998 284171998-1999 22917 -19.351999-2000 26872 17.262000-2001 24059 -10.47
Source: Director of Industries, Punjab
Technological gaps and strategy to overcome them
Production of forged hand tools by drop forging hammers, presently adopted by the local units, has the inherent disadvantage of high flash generation. To overcome this serious process, draw-back combination of forging techniques can be used, such as special purpose machines based on the principles of chipless forging and zero machining, cold/ warm/ hot forging automatic formers, multi-station transfer presses.
The present process of heating raw materials in oil-fired furnaces is not only slow, but also polluting. This can be performed by the induction heating process, which is environment friendly, reduces scale and results in faster production; shot blasting and barrel rolling machines may be used to clean the forgings/castings. Use of a modern packaging system is necessary to survive in global competition.
Facilities for manufacturing forging tools and dies in the units are very poor. The quality of the forged products depends on the die impression. Products forged through poorly designed and manufactured dies will be of sub-standard quality. Tool rooms equipped with latest die-making precision machines have to be set up by the units, to improve the surface finish and obtain required contours of the forgings. Large investments in R&D activities and CAD/CAM techniques are needed for improved designing and manufacturing of hand tools.
Different grades of steel, i.e., EN-8, EN-9, carbon steel, alloy steels, etc., are used as raw materials, but Indian raw materials are often not comparable with imported ones in quality standards. Development efforts are required for making steels needed for hand tools, having cold- and warm-forging characteristics with adjustment in composition.

The hand tools industry in Punjab is skill-intensive and facing scarcity of technically qualified and trained manpower. The root cause of this sad state of affairs lies in the system of the contractual labour-management relationship. The labour and the majority of the supervisory staff are employed on a contract basis making weaning away of labour easier by offering small increments in wages by unscrupulous competitors. This perpetuates a high labour turnover and makes labour unconcerned about wastage of materials, product quality deterioration and conserving various other inputs. Contractual labour is more concerned about high tonnage of production. The high labour turnover discourages individual initiatives to impart skill-development training to hand tools workers.
During the recent past, some units have employed trained persons from the Central Tool Room (CTR), Ludhiana, and the Central Institute of Hand Tools (CIHT), Jalandhar. There is still a supply-iag of technically qualified and trained manpower. Specialized and need-based short-term courses for training of the workforce at different levels are required to bridge the gap. The CTR, Ludhiana and CIHT, Jalandhar could play a major role in this area. The industry also needs qualified professionals in designing, overseas marketing and financial management to make the units competitive in national/international markets.
Labour laws
The labour laws are generally in favour of labour and cause many practical problems for the employers. They need to be reviewed and amended in the interests of both labour and management. This is urgently necessary to gear up the industry for global competition, and government has to take the initiative.
Research and Development Centre
The Ministry of Industry under UNDP set up the Central Institute of Hand Tools in the early eighties at Jalandhar. During the last one and half decade, this institute has been working for the development of the hand tools industry in Punjab by developing new designs for hand tools as well as modern manufacturing processes. Now the industry badly needs technology upgradation to work manufacture modern hand tools to enable it compete in the global market. Therefore, this centre has to be adequately equipped and its facilities upgraded to provide specialized training for designing, quality control and manufacturing.
Cost of bank finance is a significant factor in export pricing. This becomes more crucial for such highly competitive products as hand tools. Since we have to integrate with the global market in the WTO regime, rates of interest, particularly for export, should be brought in line with international rates, which are reported to be five to six per cent. Timely and adequate availability of finance, particularly to the small-scale sector, is a must for growth. Study visits of entrepreneurs in the SSI sector to various technically advanced units both in India and developed countries, along with technical experts in the trade, to make them aware of prevailing technologies and manufacturing techniques, will be very productive.

The machinery manufacturing industry plays a significant role in the industrial development of every country, since the quality, accuracy and durability of components, parts and industrial and consumer products, depend to a large extent on the quality of the machinery used for their production.
The machinery making industry of Punjab has played a very significant role in the industrial development of the country. This is particularly true of the small-scale sector of the state engaged in the production of machines for the manufacture of a variety of industrial products. This industry includes diesel engines, tractors, oil expellers, textile machinery, centrifugal pumps, machine tools, sewing machines and their parts. As shown in Tables 23 and 24, production in the Eighth FYP achieved an impressive annual average growth rate of 28.27 per cent, while it declined in the first three years of the Ninth FYP to 17.35 per cent. During the same period the employment growth rate slightly declined from 2.32 per cent to 2.29 per cent. However, the employment growth rate was quite high in the Sixth and Seventh FYPs.
Table 23
YearUnits (No.) Employment (No.) Investment (Rs. lakh) Production (Rs. lakh)
SSI L&M Total SS! L&M Total SSI L&M Total SSI L&M Total
1980-1981 4336 11 4347 25286 4421 29707 4520 3097 7617 10587 6164 16751
1985-1986 6874 11 6885 37248 3587 40835 7558 1730 9288 15721 8774 24495
1992-1993 9379 7 9386 54111 3675 57786 12468 8135 20603 30016 28761 58777
1996-1997 10084 12 10096 58334 4972 63306 16889 20005 36894 59127 91069 150196
1997-1998 10263 9 10272 59851 5620 65471 18983 44698 63681 68451 137065 205516
1998-1999 10490 10 10500 62024 6495 68519 22951 60066 83017 77784 192133 269917
1999-2000 10636 8 10644 62937 4754 67691 24500 28643 53143 84424 141991 226415
Source: Director of Industries Punjab.
The capital-output ratio of the SSI sector has remained the same during the 1996-97 to 1999-2000 as shown in Table 23, while in the large and medium sector it initially increased from 0.22 to 0.3, but came to the same level in 1999-2000 as in 1996-97. Investment per employee in SSI and large and medium sectors increased from Rs. 0.29 lakh to 0.39 lakh and from Rs. 4.02 lakh to 6.03 lakh respectively during 1996-97 to 1999-2000, while production per employee in SSI and large and medium sectors increased from Rs. 1.01 lakh to 1.34 lakh and Rs. 18.32 lakh to Rs. 29.87 lakh respectively.
Table 24
Units (No.) Employment (No.) Investment Production
SSI L&M Total SSI L&M Total SSI L&M Total SSI L&M Total
179 -11.30 1.78 2.57 0.60 2.29 13.35 35.17 22.33 12.65 21.53 17.35
Source: Director of Industries Punjab.

The machine tools industry in Punjab, with an annual output of more than Rs. 250 crore is mainly concentrated in Batala and Ludhiana, and produces a variety of machine tools of different sizes and types, such as lathes, shapers, milling machines and drilling machines, special purpose machines for different industries. Machine tools worth Rs. 80 crore are being exported annually from Punjab.
Technological gaps and suggestions for upgradation
Technology gaps exist in the following areas:• Conventional general-purpose flat-bed lathe machines being manufactured
are like thou manufactured by developed countries 50 years ago. There has not been much progress in improving the designs of the machines. On the other hand, machine tool designs are continuously updated with the use of Computer Aided Design and Finite Element Analysis in developed nations.
• Spindle speeds are in the range of 5,000 rpm and not much automation has been adopted.
• Whereas in modern machines, spindle speeds up to 30,000 rpm and in some cases upto 1,60,000 RPM have been achieved, use of automatic tool changers and pallet changers, make the machines more productive. Feed rate of 0-5,000 mm/minutes and rapid traverse rates can be 9,000 to 12,000 mm/minute achieved. Accuracy is seldom claimed by manufacturers or demanded by customers locally. Accuracy is very high in developed nations and will have to be achieved in the coming WTO regime.
• The machine operator makes himself and the work-place dirty. Clip conveyor systems are not used to clean the machines. Leakage from the hydraulic system and absence of dust extraction systems in wood-working machines lead to more noise and dust. At the same time safety features are mostly absent or crude. Safety is not built into designs. Much needed electronic safety guards are not used in mechanical presses/metal forming machines.
• Conventional material, such as graded C.I., are mostly without any quality control. Advanced materials, such as C.l. by potential mehanite process and polymer concrete, granite and other patented materials to make them thermally stable, vibration free, more accurate and ensure longer tool life, are not in use.
• Conventional measuring instruments, such as vernier calipers, micrometers, dial indicators, etc., are used. The laser calibration system for inspection of machine tools, roundness checking, and surface roughness checking machines to evaluate accuracy of machine tools parts, are not used.
• Flame hardening of guide-ways, grinding of slide-ways of lathe, use of patented turret material to reduce friction in slide-ways and AC servo motor, CNC control, are not used by our machine tools industry. Advanced designs, such as machine vision system of work-holding to ensure accuracy and reliability, have yet to be developed.
• Conventional machining, such as drilling, turning, grinding, polishing and pressing is in use. Modern machining methods, such as laser machining, aqua jet machining, plasma cutting, etc., developed for greater accuracy and productivity are not available.
• Much time is wasted in setting up and operating machines, as most of the operations are manual. Set-up time can be reduced by putting up operation

panels within easy reach of the operator, by clearly designating interference- free work area, and by direct mounting of tools into the turret face.Modern machine tools with specialized attachments, such as automatic tool changer, automatic pallet changer, pneumatic feeders, electronic safety guards to improve speed and productivity of machines tools, are not manufactured.Advanced design concepts, such as moving column design, moving head stock swing beam principle, hydraulic tool damping, hydraulic hold down system in shears, flying optics principle in laser cutting machines, etc., to improve accuracy, safety and speed of the machine tools, are not employed in our machine tools industry.Upgradation of technologies in use and human resource development and training on a continuing basis are essential for the growth of this segment of industry.
ELECTRONICS INDUSTRY
The evolution of technology has lid to increasing use of electronics in a variety of applications. Today, the electronics hardware industry spans a whole gamut of products and the entire spectrum of the value chain. Newer applications and better ways of doing things are fuelling growth. Electronics gadgets and tools are being used in India too in a large range of applications and fast catching up with the world in terms of penetration. This can lead to an enormous domestic demand for these products, giving the necessary critical mass for global competitiveness. Such a base will also be a stabilizing factor for manufacturers to target the international market.
The major segments of the electronics hardware industry are information technology (comprising computers and computer peripherals), telecommunications (comprising switching equipment, transmission equipment and customer premises equipment) and consumer electronics (the major products being television, audio/video equipment, clocks and watches), control instrumentation, industrial electronics, strategic electronics and the electronic components industry which supplies components to these segments. They have similar basic building blocks, value chain and issues. Convergence is increasingly blurring distinctions between these segments. Technology evolution is resulting in increasing convergence. Hence, in view of future trends, it will be appropriate to integrate these segments into one industry - Electronics Hardware Industry (EHI).
The growth rate of the electronics hardware industry has been slower than that of the software and service industry during the Ninth FYP. This trend needs to be reversed into a growth, path by introducing a set of policies conducive to the growth of the electronics hardware industry. An investment climate comparable to Taiwan, the Philippines, Singapore, Korea and Malaysia has to be created, to derive the maximum competitive advantage from the twin factors of low-cost high-quality knowledge-workforce and a fast growing domestic market. The electronics hardware industry is characterized by growing competition and shrinking margins and has to bear high risk arising out of technological

obsolescence. Hence, strong policy support from the government, coupled with fierce entrepreneurial spirit, is required. The sector-wise production of the electronics hardware industry during the Ninth Plan in India is given in Table 25:
Table 25
Sector 1997-98 1998-99 1999-2000 2000-01 2001-02 (E)
Consumer 7600 9200 11200 11550 13000
Industrial 3150 3300 3750 4000 4500
Computers 2800 2300 2500 3400 4000
Comm. & Broad Eqpt. 3250 4400 4000 4500 5000
Strategic 900 1300 1450 1750 1900
Components 4400 4750 5200 5500 6000
Total 22100 25250 28100 30700 34400Source; Ministry of Information Technology (MIT) Report, Tenth Five Year Plan
On the assumption that an electronic hardware growth-oriented policy, similar to the software policy, would be introduced, the Ministry of Information Technology, Government of India, has projected the production of the electronics hardware industry sector-wise, as shown in Table 26.
Table 26
Sector Production by 2006-07 (Rs. in crore) Compound annual growth rate
Consumer electronics 38100 24
Industrial dlectronics 6600 8
Computers H/W 14900 30
Communication & Broadcasting
12500 20
Strategic electronics 3800 15
Components 15000 20
Total 90900 22
Source: MIT Report, Tenth Five Year Plan
Status and potential of electronics hardware industry in Punjab
During 1985-90, SAS Nagar, (Mohali), Punjab, was the hub of electronics hardware industry and the second largest centre after Bangalore with top-grade units in communications, computers and peripherals, electronic components including picture tubes, semi-conductor devices, active components, etc. However, during recent years there has been an overall decline of the electronics hardware industry and it seems to have lost its momentum. Table 27 shows the growth rate of the electrical and electronics industry in the state.

Table 27Status of Electrical and Electronics industry in Punjab
YearUnits (No.)
SSI L&M Total
Employment (No.)
SSI L&M Total
Investment (Rs. lakh)
SSI L&M Total
Production (Rs. lakh)
SSI L&M Total
1980-1981 977 10 987 5437 4495 9932 655 1635 2290 2073 5804 7877
1985-1986 2167 23 2190 10841 5742 16583 1827 11446 13273 4510 6694 11204
1992-1993 3633 27 3660 17495 8852 26347 4521 35522 40043 12809 53859 66668
1996-1997 4113 28 4141 20696 9448 30144 6609 65453 72062 26427 187719 214146
1997-1998 4223 33 4256 21947 10221 32168 8322 83765 92087 31388 252362 283750
1998-1999 4301 34 4335 22436 10487 32923 8731 92193 100924 33056 170823 203879
1999-2000 4403 35 4438 23203 9454 32657 9379 113859 123238 36193 111749 147942
Source: Director of Industries, Punjab
During 1999-2000, however, the total output of the electronics hardware industry has been Rs. 679.83 crore according to the Statistical Abstract, Punjab 2001. The major units are M/S Punjab Communication Ltd., Mohali (PCL); M/S Semiconductor Complex Ltd., Mohali; M/S Bharat Telecommunication Ltd. Ludhiana (Beetel), and M/S Telephone Cables Ltd. There are a large number of industries in the SSI sector, manufacturing PCs, power supplies, industrial electronic equipment, TVs, Radios, UPS, electronic instruments, electronic test zigs, tools and components, etc. Penetration of telephones, computers and colour TVs is quite high in Punjab. This, coupled with increased use of IT in the rural sector. E-governance, Internet, and software industry, the domestic market is expected to expand. The electronics hardware industry has a very good employment potential, as mostly ancillary units, particularly in the SSI sector, are run by self- employed graduate engineers, diploma holders, ITI’s in engineering and graduates/postgraduates from the science stream. To achieve accelerated growth of the electronics hardware industry in the state the following measures are suggested:
• State government to give priority-sector status to the electronics hardware industry on par with software and service industries.
• An Electronic Hardware Technology Park (EHTP) in Mohali with world-class infrastructure will greatly boost the small-scale sector and attract new entrepreneurs and foreign investors. More Electronic Hardware Parks in the state on private initiative and with government support are necessary.
• Provide appropriate facilities and incentives to MNCs, to set up manufacturing plants in each sector of the electronics hardware industry in the state.
• Train and develop quality manpower suitable for evolving innovative designs and the development of manufacturing, assembly and quality control techniques.
• Set up Research and Development, Designs and Quality Control Centres in participation with industry, with financial and technical assistance from international agencies.

The Punjab Government has been making special efforts to promote small-scale/tiny and cottage industrial, services and business units at the Rural Focal Points, to create employment opportunities in rural area. So far 594 Rural Focal Points have been identified, of which land has been made available for 263. These Focal Points are under the control of the Department of Rural Development and Panchayats. The status and growth of rural industries is given in Table 28.
Table 28 Growth of Industries in Rural Areas
1980-81
Percentage
1990-91
Percentage
Percentincrease(comparewith1980-81)
2000-01
Percen-tage
Percentincrease(comparewith1980-ai)
Units(in nos.)
Urban 32884 75.88 93267 58.16 183.62 117866 58.76 258.43
Rural 10454 24.12 67101 41.84 541.87 82737 41.24 691.44
Employment(in nos.)
Urban 223018 84.20 482454 72.13 116.33 624806 69.61 180.16
Rural 41851 15.80 186391 27.87 345.37 272836 30.39 551.92
Investment(in Rs. crores)
Urban 288.73 86.93 1000.91 74.21 246.66 2448.00 59.57 747.85
Rural 43.4 13.07 347.87 25.79 701.54 1661.14 40.43 3727.51
Source; Director of Industries, Punjab
Table 28 indicates that there has been impressive growth in the last 20 years from 1980- 81 to 2000-01 in the number of industrial units, employment and investment in the SSI/Tiny Sector. During 1980-81 to 2000-01 the number of industrial units in SSI/Tiny sector in rural areas increased eight times, employment 6.5 times and investment 38 times. Investment per employee in SSI/Tiny sector in rural areas increased during 1980- 81 to 2000-01 from Rs. 10,400 to Rs. 60,000, compared to the increase of total SSI/Tiny sector per employee from Rs. 12,500 to Rs. 46,000 during the same period.
Traditional Rural and Tiny units in Khadi and Village Industries
Since its inception in 1956, the Punjab Khadi and Village Industry Board (KVIC) has been implementing various schemes for generating sustainable employment for the traditional rural artisans and entrepreneurs, by providing financial assistance and technical help for setting up village and tiny industries. The KVIC has been promoting very small and tiny industries by traditional artisans, such as weavers, spinners, cobblers, blacksmiths, carpenters, potters, etc. With the advance of technology, entrepreneurs have started making use of modern machinery and equipment and are manufacturing quality products. By 1999-2000 the number of units established under the schemes of the KVIC went up to 34,678, with production valued at Rs. 220.46 crore and employment of about 45,100 persons.
Improved infrastructure, upgradation of technologies and skills, easy credit, and better marketing are essential to improve productivity in the rural sector. Training on non-farm

income-generating activities is one of the necessary prerequisites for the creation of productive employment opportunities in rural areas.
THE INDUSTRIAL SUPPORT SYSTEM
Over the years several specialized institutions, some directly under government departments and others under corporate structure, have been set up in the state to provide financial, technological and other promotional support to industry. A brief overview of this industrial support system follows.
Small Industries Service Institute, Ludhiana
The Small Industries Service Institute of the Government of India was set up at Ludhiana in 1956 to serve small industries in Punjab. The main services provided by this institute are:
Technical counselling Managerial counselling Economic counselling Management development trainingProduct/Process oriented entrepreneurship development training Skill development training Modernization Ancillary development Export marketingMarketing assistance including sub-contract exchange Technology upgradation Energy conservation Pollution control Quality management Testing facilities by chemical laboratory Vendor development Workshop facilities (engineering)
Common facility workshops have been upgraded with the installation of CNC Horizontal and Vertical machines and CNC lathes in the Hi-Tech cell
Central Tool Room, Ludhiana
The Government of India established the Central Tool Room at Ludhiana in 1980-81 with financial and technical collaboration from the Federal Republic of Germany and the active support of the Government of Punjab. The Centre has been providing services to industry in general and small-scale units in particular, in such areas as technical consultancy, designing and manufacturing of tooling, heat treatment and training.

Central Institute of Hand Tools, Jalandhar
The Government of India set up the Central Institute of Hand Tools, Jalandhar, with UNDP assistance and the active participation of Punjab Government. Registered as a Society in 1983, it provides comprehensive support in the field of design and development of the latest hand tools, and consultancy and common facility services to small-scale entrepreneurs.
Mechanical Engineering Research and Development Organisation
The Central Mechanical Engineering Research Institute (CMERI), Durgapur, under the aegis of the Council of Scientific & Industrial Research (CSIR), established a centre in Ludhiana in 1965, known as MERADO, to boost mechanical engineering research and development in Punjab. The centre helps the industry in the following fields;
Design, development and standardization of industrial machinery and equipment, farm machinery and equipment and jigs, fixtures, tools and gauges. Testing of materials, components and products for hardness, tensile, compression, bending and impact strength, internal flaws by ultra sonic, radiographic, magnetic and penetrate methods, measurement of coat thickness and crack depth, precision measurements of linear and angular dimensions, profiles and surface finish, calibration of instruments and gauges, performance testing of I.C. engines, pumps, sprayers, etc., chemical analysis of materials, microstructure analysis and foundry sand testing. Preparation of feasibility reports for light and medium industries, industrial consultancy, expert guidance to the foundry industry and precision jig boring, etc.
Bureau of Indian Standards (BIS)
The Bureau of Indian Standards has an office at Chandigarh to provide quality testing of industrial products of the state.
Electronic Test & Development Centre, Mohali
This centre has been set up to provide testing facilities to electronic industries, besides developing new techniques for the growth of electronics industries in the state.
National Institute of Secondary Steel Technology, Mandi Gobindgarh
This institute provides technical services to the secondary steel sector by arranging seminars and workshops in the state and undertaking consultative projects and pollution studies relevant to the industry.
National Metallurgical Laboratory, CSIR, Batala
This laboratory provides facilities for research and development work, besides chemical, mechanical and metallurgical tests for ferrous and non-ferrous metals.
Central Food Technology Research Institute, Ludhiana
The CFTRI Mysore has set up an Extension Centre at Ludhiana for the development of the food processing industry in the state.

National Productivity Council, Chandigarh
The Council is engaged in the improvement of productivity of SSI units in Punjab.
Central Scientific Instruments Organisation, Chandigarh
This organization is equipped to carry out research, design and development in electrical, electronic, electro-mechanical, optical and medical instruments of different natures and specifications.
Central Leather Research Institute, Jalandhar
This organisation provides testing facilities, training in leather manufacturing and leather garments, research and development and extension services including common facilities.
Wood Grading & Marketing Centre, Ludhiana
This centre, set up in 1968 with the assistance of UNDP, mainly purchases quality wood to save producers and consumers from exploitation by middlemen.
Institute for Auto Parts Technology, A-9, Phase-V, Focal Point, Ludhiana
Institute for Machine Tools Technology, Batala
The Punjab Government with the assistance of UNDP/UNIDO has established these institutes, to cater to the overall development and growth of the auto-parts and machine tools industries. These institutes provide the following facilities:
• Design development• Testing and job work• Specialized short-term training• Consultation
Bicycle & Sewing Machine Research & Development Centre
This centre was set up with UNDP assistance for carrying out research, design and development work on bicycles and components and sewing machines and components. It provides metrology, chemical testing and tool room facilities to the industry.
Northern India Technical Consultancy Organisation, Chandigarh
This organization provides a package of total consultancy services to the industry, covering all stages of project implementation. Besides, it also provides consultancy services to departments of the state government and financial institutions.
Punjab State Electronic Development Corporation
This corporation is engaged in the promotion of the electronics industry in the public, joint and private sectors. Besides, its also creates infrastructure facilities necessary for the growth of electronics industries.

Science & Technology Entrepreneurs Park (STEP)
Science & Technology Entrepreneurs Park provides space and environment for creative thinking/innovation, self-development, product development and venture development for science and technology entrepreneurs.
Punjab Energy Development Agency, Chandigarh
This agency assists in the installation of wind/water pumps and small aero-generators for battery charging and stand-alone power generator, on subsidy.
Punjab Pollution Control Board, Patiala
This institution has been entrusted with the task of implementation of the Pollution Control Act in the state. Some of the obligations of industrial entrepreneurs for control of pollution are clearance of site from the environmental angle and consent to establish an industry (N.O.C).
Industrial Development-cum-Quality Marking Centres
The Punjab Government has set up the following 10 Industrial Development-cum-Quality Marking Centres, which provide such services as quality marking, testing, research, design and development and common workshop services:
Government Industrial Development-cum-Quality Marking Centre, (Engg), Amritsar.Government Industrial Development-cum-Quality Marking Centre, (PaintsA/arnishes), Amritsar.Government Quality Marking Centre (Textiles), P.O. Rayon & Silk Mills, Amritsar.Government Industrial Development-cum-Quality Marking Centre (Engg.), Batala.Government Industrial Development-cum-Quality Marking Centre, Bathinda. Government Quality Marking Centre (Sports & Leather Goods), Industrial Area, Jalandhar.Government Industrial Development-cum-Service Centre (Engg. Goods), Ludhiana.Government Industrial Development-cum-Quality Marking Centre for Plastic Moulds, Ludhiana.Government Industrial Development Centre (Engg), Mandi Gobindgarh. Government Industrial Development-cum-Quality Marking Centre (Engg), Patiala.
Government Tanning Institute, Jalandhar
This institute provides diploma in tanning and footwear technology and training for artisans.

Banks
Punjab is well served by banks with 51 branches per 000’ sq. km against the national average of 21 bank branches per 000’ sq. km. By the end of December 2000, the following banking facilities were available in the state:
Indian commercial banks 2574Co-operative banks 829Post-office saving banks 3931Foreign banks 1
7335
Small Industries Development Bank of Inrdia
The SIDBI is an apex financial institution, established for the promotion, financing and development of small-scale industries. Through its branch office in Chandigarh, SIDBI administers the following schemes for the promotion of small-scale industry:
• Scheme for direct assistance to specialized marketing agencies.• Scheme for assistance to marketing organizations.• Scheme for purchase of mobile sales vans.• Scheme for direct discounting of bills.• Bill re-discounting schemes.• Short-term bills re-discounting schemes.
National Small Industries Corporation (NSIC)
The NSIC supplies machinery and equipment on hire-purchase and lease-basis to small entrepreneurs, besides providing finance for purchase of raw materials under the Government Purchase Programme. The Single Point Registration Sclieme of NSIC provides such marketing assistance, as supply of tenders free of cost; exemption from payment of earnest money; waiver of security deposit and issue of competency certificate. The corporation has opened a Prototype Development and Training Centre at Rajpura. Besides development of prototypes it also provides training facilities in the trade of electronics, plastics and computers.
Punjab Financial Corporation
Punjab Financial Corporation, set up in the year 1953 under the State Financial Corporation’s Act 1951 to boost industrial growth in the state, provides medium and long-term loans to entrepreneurs for setting up new industrial units under various schemes and for expansion/diversification, renovation, modernization and rehabilitation of existing units. Assistance provided by Punjab Financial Corporation includes the following:
• Special scheme for unemployed persons.• Composite Loan Scheme (AVIC).• Single Window Scheme.• Scheme for Scheduled Castes/Scheduled Tribes.• Scheme for physically handicapped entrepreneurs.• Scheme for ex-servicemen (Semfex).• Scheme for women entrepreneurs (Mahila Udhyam Nidhi Scheme).

Scheme for quality control facilities. Equipment Finance Scheme.Special Capital Scheme.Modernization Scheme.Scheme for purchase of generating sets. Scheme for hotel industry.Scheme for rehabilitation of sick units. General Scheme.Scheme for transport industry.
Punjab State Industrial Development Corporation, Chandigarh
Set up in 1966, the PSIDC promotes and develops medium and large-scale industries in the state and acts as an institutional entrepreneur. It provides financial assistance to projects promoted by private entrepreneurs in the state through term loans and direct participation in and underwriting of equity and preference share capital.
Technical education in Punjab
Punjab has a large network of institutions for imparting technical education. Such technical disciplines as computer engineering, electronics, architecture, irrigation, environmental engineering, agriculture structural engineering, textiles, chemical, mechanical, civil electrical, instrumentation and control, etc., are taught in these institutions. There are 19 institutions offering degree level engineering courses and 41 others providing diploma level technical courses. Besides these institutions, 130 Industrial Training Institutes and one Advanced Training Institute are also functioning in the state to impart technical training in different trades.
Institutional support to exporting units
The following institutions are connected with the promotion and development of exports from state;
Export Marketing Wing, Directorate of Industries, Chandigarh.Joint Director-General of Foreign Trade, Ludhiana.Assistant Director-General of Foreign Trade, Amritsar.Export Credit & Guarantee Corporation, (ECGC), Ludhiana.Export Inspection Agency, Ludhiana.Export Inspection Agency, Jalandhar.Wool & Woollen Export Promotion Council, Ludhiana.Sports Goods Export Promotion Council, Jalandhar.Engineering Export Promotion Council, Jalandhar.Textile Committee, Amritsar.Textile Committee, Ludhiana.Punjab Small Industries & Export Corporation, Chandigarh.Apparel Export Promotion Council, Ludhiana.Regional Committee for Core Group on Exports in SSI Sector under the chairmanship of the Joint Director-General of Foreign Trade.Small Industries Service Institute, Ludhiana.
No consolidated report is available reviewing the functioning of the promotional and supportive institutions, set up at different points of time in response to the demands and felt needs of industry in specific situations. But, many of them have become largely inadequate a.nd nearly irrelevant in the current globalized context in which the industry finds itself. Some of them are avoidable burdens on the state exchequer as their days are over!
OVERVIEW OF INDUSTRIAL POLICIES AND STRATEGIES FOR STRUCTURAL CHANGES IN THE EMERGING SITUATION
Like most other States, Punjab too has been making efforts to promote the development of industry, as evident from the successive Five Year Plans (FYPs), statements of industrial policy and growth strategies evolved and implemented by the government from time to time. As these policy pronouncements, coupled with the package of incentives and other promotional schemes, reflecting the priorities of the state, were expected to accelerate the growth of different sectors of industry, an overview of them is given in the following paragraphs.
Realizing that the small and tiny industry, which has been the backbone of industry in the state, flourishes best when there is commensurate development of modern large- scale industry, from the Sixth Five Year Plan (1980-85) onwards emphasis was laid on the co-ordinated development of large and medium and small and tiny industries. Accordingly, the Sixth Five Year Plan visualized the attainment of the following objectives:
• Accelerated growth and realization of economic benefits of the already created infrastructure of industries.
• Diversified rapid industrialization of the state.• Promotion of rural industries for which separate incentives are envisaged, to
ameliorate the economic condition of the weaker section of the society.• Special emphasis on small-scale industrial units, to create maximum
employment.• Special incentives for setting up industries.• Export of the state’s industrial products and exploring new markets for
exports.
The Sixth Plan provided an outlay of Rs. 81 crore for various promotional schemes and incentives for achieving these objectives, and actually utilized Rs. 74 crore. During this period industry grew at an annual rate of 5.41 per cent against 10.02 per cent in the Fifth FYP. Despite the progressive industrialization policy there was a slow-down in growth. The Seventh Plan (1985-90) continued the policy thrust of the Sixth plan with greater vigour. Actual expenditure under plan schemes went up to Rs. 149 crore against theapproved outlay of Rs.124 crore and industry grew at an annual rate 10.05 per cent.During this period public sector undertakings and other industrial promotional institutions were strengthened, and the policy of providing incentives in the form of various subsidies was also continued.

The Industrial Policies of 1987 and 1989, which were introduced during this period, offered a package of graded incentives favouring ‘no-industry districts’ and ‘backward areas’, on the lines of the policy of the Government of India. The Industrial Policy of 1987 divided the state into four clearly identifiable categories of ‘A’, ‘B’, ‘C’ grade growth- areas and ‘no-incentive areas’, to bring about balanced industrial development. Capital subsidy, priority for power connection, sales tax incentives, land subsidy, exemption from electricity duty, special incentives to export-oriented units and entrepreneurs belonging to the SC community and generating-set subsidy were given under this policy. The Industrial Policy of 1989 continued to provide the package of incentives which included;
(1) Capital subsidy(2) Sales tax incentives(3) Purchase tax(4) Sales tax exemption/deferment for expansion/ modernization/diversification(5) Special incentives for pioneer units(6) Land subsidy(7) Priority for power connection(8) Exemption of electricity from electricity duty(9) Special incentives for specific categones of industries/entrepreneurs(10) Generating-set subsidy
At the same time certain types or industry were categorized as ‘no-incentive industry’.
There was a gap of two years between the terminal year of the Seventh Plan and the beginning of the Eighth Plan. During this period (1992-97) the emphasis in the strategy of industrial policy and planning was shifted from accelerated growth to generation of gainful employment and balanced regional growth, as would be evident from the following policy objectives:
• Generation of gainful employment, particularly in rural areas, for optimum utilization of skilled/unskilled manpower and fuller utilization of raw materials, particularly agro-products available in rural areas.
• Balanced regional growth for removal of rural-urban disparity.• Technological upgradation and modernization to achieve higher productivity
and improve quality standards and designs to increase exports.• Development of rural/cottage industries to exploit local resources.• Provision of counselling services for better and scientific marketing and
management techniques.• Emphasis on upgradation of rural industry through improved technological
inputs.
At about the same time was announced the Industrial Policy of 1992 with the following special features:
• Multiplicity of incentives avoided and only two incentives, viz.. Investment Incentive and Sales Tax Concessions continued.
• Stress on investment in border districts for creating employment for youth in the area.
• Special incentives for electronic units.
The draft of the Eighth FYP proposed on outlay of Rs. 576 crore, out of which the lion’s share of Rs. 317 crore was for state-level promotional institutions, such as the PSIDC,

the PFC and the PSIEC, while a sum of Rs. 26.5 crore was set apart for R&D Centres, including the new Machine Tool Centre at Batala and the Automotive Centre, Ludhiana, and technology upgradation. However, the Plan that was approved reduced the total outlay to Rs. 162.9 crore, but the actual expenditure was, Rs. 195.88 crore. Out of the total expenditure, approximately 60 per cent (Rs. 117.5 crore) was on account of payment of incentives to industry.
The Ninth FYP (1997-2002) gave high priority to infrastructure and technology upgradation and the thrust areas were;
• Proper infrastructure facilities.• Upgradation of technology and modernization of industry.• Reducing direct investment of government in production activities.• Provision of adequate facilities/concessions to attract new entrepreneurs.
Though the outlay of the Ninth FYP was Rs.349.79 crore (out of which interest subsidy alone accounted for Rs. 301 crore), actual utilization during the first four years was Rs. 71.67 crore, about 20 per cent. The outlay of Rs. 288.9 crore for the Tenth Plan is less then the provision of Rs. 349.79 crore for the Ninth Plan (as shown in Table 29) and the major part of it (Rs. 250 crores) is again for grant of incentives, which have already accrued. The Plan lays stress on modernization and technological upgradation and provides approximately Rs. 30 crore, mainly for setting up the UNIDO-assisted R&D projects for Machine Tools, Batala; Automotive Centre, Ludhiana: Central Institute of Hand Tools, Jalandhar; and the North India Institute of Fashion Technology. However, the actual budgetary provision for industry for the first year of the Plan, i.e., 2002-03, is just Rs. 25 lakh for the North India Institute of Fashion Technology!
Quite interestingly, the Industrial Policy and package of incentives announced by the state government in 1996, which are still in vogue, sought to achieve the following targets:
• Increase the annual industrial growth rate from the present eight per cent to 12 per cent in the next two years.
• Increase the present share of industry in Gross Domestic Product (GDP) from 17 per cent to 25 per cent in the next five years.
• Divert 15 per cent of the present rural population to manufacturing and related occupations, through rapid industrialization, and thereby reduce dependence on agriculture and allied activities in the next fifteen years
Table 29
Approved Outlay
(in Rs. lakh)
Actual Expenditure
(in Rs. lakh)
Average annual growth rate of industry
6*^PIan(1980-1985) 8183.00 7417.00 17.87
7"^PIan(1985-1990) 12331.00 14900.00 16.61
8‘ Plan(1992-1997) 162.92 19588.00 21.81
9‘ Plan(1997-2002) 34979 7167.00
(first 4 years)
13.39
10*" Plan(2002-2007) 28893.00
For 2002-2003 100.12*Note: * Actual budgetary provision for the year of 2002-03 is just of Rs. 25 lakh.

it is evident from the Industrial Policy Statement, that the packages of incentives and the allocation and actual utilization of funds during successive FYPs do not form part of an integrated, long-term strategy for planned development. The Ninth Plan presents a very dismal picture of the industrial sector and indeed, of the whole process of planning and implementation of plan schemes.
Trends in employment generation
As evident from Table 30 employment per unit has declined from six in 1980-81 to four in 1999-2000 in the SSI sector and from 481 to 386 in the large and medium sector during the same period. Investment per employee and production per employee have shown an increasing trend during the same period for both the SSI and the large and medium sectors. This trend, perhaps inevitable in the current competitive context, has a serious impact on employment generation and related socio-economic aspects of development, which deserves attention at policy-making levels.
Table 30Average Employment per Unit, Investment and Production per Employee (Rs.)
Year Employment Per Unit Investment Per Employee (Rs.) Production Per Employee (Rs.)
SSI L&M SSI L&M SSI L&M
1980-1981 6 481 12535 66269 42226 103954
1985-1986 5 453 15898 112709 46277 191757
1990-1991 4 504 20166 213121 60549 376593
1995-1996 4 400 27622 415501 116063 791462
1999-2000 4 386 42963 625688 188117 1005121
Source: Based on data from Director of Industries, Punjab
The average investment in plant and machinery per small-scale unit in Punjab was only Rs. 1.46 lakh in 1997-98, which was much lower than Rs. 5 lakh in Maharashtra. During the same period the average employment per unit in Punjab was significantly low at 4.3 compared to eight in Maharashtra. During the first three years of the Ninth FYP the average production per small-scale unit in Punjab has been only Rs. 7.45 lakh, which is less than half the all India'average of Rs. 16.82 lakh. These and other indicators show that though there has been progress in the industrial sector, Punjab is still lagging behind other states like Maharashtra.
Table 31
Year Unskilled Skilled Total
1980 NA NA 452596
1985 NA NA 636408
1990 101811 557439 659250
1992 239612 508174 747786
1995 138760 367476 506236
1997 138683 442335 581018
1998 118294 449918 568212
1999 123456 421561 545017
2000 110294 425865 536159
Source; Statistical Abstracts of Punjab

Table 31 reveals certain other aspects of the employment situation. From the live registers of employment exchanges it is observed that during the Sixth FYP (1980-85) the number of job seekers increased by 40 per cent, whereas during the Seventh FYP it remained static. During 1992 it peaked at 7,47,786, apparently due to a sudden increase in the registration of unskilled workers. By 1995 the situation improved and the number of job seekers decreased to five lakh. By the end of the Eighth FYP skilled workers swelled the number of job seekers to 5,81,018. During the first three years of the Ninth FYP this number has decreased slowly.
General observations and some suggestions for structural changes
Small scale industries in the state, the backbone of its industrial economy, are currently producing by and large low-value items, including sports and leather goods, hosiery and woollen textiles, hand tools, machine tools, bicycles and parts and sewing machines and parts. The level of technology in use in these industries is quite low, which results in low industrial productivity and quality of products, leading to a competitive disadvantage both in domestic and global markets. Upgradation of technology is the crying need of the hour for the very survival of most of the SSI units in the state. The Research and development facilities available are on the one hand woefully inadequate and out-dated and on the other seldom put to optimum use.
With the process of the integration of the Indian economy with the global economy and the consequent far-reaching structural changes taking place, small-scale industries have to adapt and adjust themselves to the demands of the time, requiring them to become internationally competitive. They have to transit from a protected to a competitive environment. At the same time the WTO regime opens up a window of opportunities for small-scale industries to grow and flourish with access to wider global markets. Upgradation of manufacturing processes and management practices, through the induction of technology, modern machines and adoption of international quality standards, are essential prerequisites for taking advantage of the emerging opportunities. This transformation has many implications, both in terms of governmental policies to promote small-scale and village industries and of providing a new focus and orientation to the institutions that have been set up in different contexts for this purpose. The thrust of government policies and programmes in the near future has to be specially geared primarily to bring about this transformation at the least cost to the economy. This is all the more important in the context of the existing weaknesses in the small-scale sector. According to estimates of the RBI, about 30 per cent SSI units were sick as at the end of March 1999 and if incipient sickness was also included, the number of sick units and closed units taken together would account for about 40 per cent of the total number of small-scale units.
Against this background, comprehensive reforms and structural changes are required to create WTO-compliant delivery mechanisms of developmental initiatives with the direct participation of industry.
• In the special context of the current financial crisis facing the state government, its role in the emerging industrial scene, will necessarily have to be limited to that of an active facilitator and co-ordinator of the processes of growth, providing a transparent conducive policy frame-work and efficient delivery mechanisms through good governance. Viewed in this light the following recommendations/observations of a systematic nature suggest
themselves for consideration over and above those made recently by the Chief Minister’s Advisory Committee on Industrial Growth;Keeping in view the experience gathered over the years in setting up and managing research and development centres, including the Departmental Industrial Development-cum-Quality Marketing Centres, the emerging requirements of industry and the severe constraints on the Central and State Governments, the management of these institutions should be entrusted to relevant Associations of Industry, on the basis of binding partnership protocols evolved through a consultative process. The Department of Industries of the state government could take urgent initiative in this regard, so that arrangements for providing one of the most vital inputs required for the survival and growth of industry, especially in the SSI sector, are not delayed. Needless to stress, considerable idle infrastructure and large human resources available with government could be put to optimum use through this process. This could start with the Bicycle and Sewing Machine Research and Development Centre on the lines discussed earlier.The functioning of the Directorate of Industries should be reviewed and reoriented in order to make it more relevant to meet the requirements of industry in the emerging scene. Some of its officers, who are professionally qualified and competent, could be seconded to Associations of Industry where they could make better contribution by involving themselves actively in the developmental processes of various segments of industry. The Department of Industries could take necessary initiatives in this regard, as several issues of policy, including deployment of government officers outside departments and agencies of government and their service conditions are involved.The role of Udyog Sahayak should be redefined and strengthened and put on a statutory basis in order to facilitate effective operation of the ‘One Window’ concept for industrial promotion. The Kerala legislation, with appropriate modifications to suit state-specific requirements, could be the model for this purpose.Taking into account the sweeping changes taking place in the economy and their immediate as well as long term impact on industry, especially the SSI sector, an appropriate institutional mechanism, such as a state Industrial Promotion Board with wide statuary powers and functions should be put in place after due consultations with the relevant stake-holders to deal with sickness and symptoms of sickness in segments of industry/industrial enterprises.The proposed industry-driven State Industrial Promotion Board could be statutorily empowered to constitute an Industry Development Fund, with the levy of a development cess of say one per cent on the annual turnover of industrial enterprises with a turnover of over rupees one crore a year. The State Industrial Promotion Board could be statutorily obliged to utilize the Fund for the promotion of industry in accordance with the priorities it lays down form time to time.

References
Chhabilendra Roul, Bitter to Better Harvest Post-Green Revolution: Agricultural and Marketing Strategy for India.
National Accounts Statistics 1985, Central Statistical Organisation, Government of India.
National Accounts Statistics 2001, Central Statistical Organisation, Government of India.
Statistical Abstract of Punjab 1985-86, 1990-91, 1995-96, 2000-01; Economic and Statistical Organizations, Government of Punjab.
Statistical Abstract India 2000, Central Statistical Organisation, Government of India.
Industrial Policies of 1987,1989,1992 and 1996 of Government of Punjab.
Sixth, Seventh, Eighth, Ninth and Tenth Five Year Plans, Government of Punjab.
State Development Reports on Industrial Development, Small Industries Service Institute (SISI), Ludhiana, Government of India.
Data on Employment, No. of Units, Investment and Production of Industrial Sector, Director of Industries, Punjab.
Report on Traditional Rural and Tiny Industry, Director of Industries, Punjab.
Ministry of Information Technology (MIT), Government of India, Tenth Five Year Plan Report.
Note on Agro Processing Industry, Punjab Agro Industry Corporation (PAIC).
Economic Survey of Punjab, 2000-01, 2001-02.
Ernest & Young, India; The Hardware Opportunity.

Chapter 7
INFRASTRUCTURE DEVELOPMENT
Infrastructure is the mother base for all activities. It is from the band of services within this domain that all other developmental activities draw their sustenance. Inadequately envisioned, or poorly delivered, it can stunt growth for decades.
As the world over this sector has been traditionally managed by the government, there is a presumption nowadays that the reason for this is to be found in its ownership per se. A number of studies the world over have found that the ownership pattern, whether public or private, is not conclusively linked to the actual performance of an enterprise. Examples of success and failure are equally distributed, irrespective of public or private ownership.
It is also not correct to be taken over by a ‘the state has no funds’ mentality. The reason for the unsatisfactory delivery of the infrastructure sector is also not within the ‘resource crunch’ hypothesis, but embedded in the inefficient working of the sector. This suboptimality flows from an inherent presumption that the services within the sector can be run non-commercially, and/or can only survive based upon inputs of subsidies from other sectors.
Irrespective of ownership, the government would do well to device sustainable long-term financial and business models, which are in a position to deliver infrastructure services, in line with the overall developmental vision of the state. From envisioning to implementation, the process should be communicative, and have peoples’ participation all through. It remains clear that people do not expect services for free. While they may expect these freebies in the short run, they remain aware that this free service model will ultimately lead to the collapse of the service itself. People want working and guaranteed services, and they are willing to pay a reasonable price.
AGENDA FOR INFRASTRUCTURE
There cannot be any planning for infrastructure without a developmental vision. Infrastructure is the ultimate supplier, and everybody is its customer. Being the supplier of last resort, it must, therefore, subordinate itself to requirements of all other sectors.
Based on a blueprint of Punjab for 2020, the infrastructure sector can set itself an agenda in line with what is outlined in the following section.
Primary Sector
Dependence on bulk foodgrains is starting to taper off. The farm sector will switch over progressively to commercial cropping. The area under oilseeds, sugarcane, fruits and vegetables will gradually increase. While there will still be a demand for transport of bulk foodgrains, we will witness increased activity in the processing of agro-products, bringing

in the demand for speedy transport. There will be need for refrigerated movement to Indian and foreign destinations. The farmer will need support from information technology by setting up ‘virtual mandis’ for regional, national, and international trading. For this, the telecom and IT backbone will have to be strengthened and taken to the villages.
The farm and rural sector will require assured supply of good quality electricity for production of cash crops, agro-processing, storage, and to ensure the working of computers and telecom devices. The farm sector will need assured supply of fertilizers. As evident from current trends, consumption of urea will go down, and phosphatic fertilizer will increase.
Secondary Sector
Other than farming, Punjab has little primary resources. There are no coal, mineral or fossil fuel deposits that can be tapped. At present we are seeing a declining trend in the overall daily number of workers employed in the registered factories in the state.
There is no large industry in Punjab at the moment, which employs more than 5,000 people. All future hopes appear to be based on setting up an oil refinery by Hindustan Petroleum Corporation Ltd. near Bathinda. The reasons for these expectations are not very clear. Refinery building being a very specialized job, machinery, plant equipment, and other requirements are not likely to be sourced from within Punjab. The setting up of the refinery is not going to cause any significant changes in the sale and distribution patterns of petroleum products. At best, there would be some potential in transport, and direct employment for about 500 persons.
The major industries are textiles and readymade garments, motor parts, cycle and cycle parts and manufacturing of various food products. Their growth rates are not very encouraging.
Considering the more than five lakh youth borne on the live register of Employment Exchanges in Punjab, and the hidden unemployment in the farm sector, the industry sector in the state does not offer significant hope. With the most optimistic scenario, and in keeping with trends data of the Economic Survey of Punjab, industry may generate10,000 fresh jobs per year, which is too little.
As is clear from the Economic Survey of Punjab 2001-2002, the real growth potential in future is anticipated to be in agro-processing. Considering that the strength of the state is in the primary sector, this appears to be reasonable, and the government is likely to put in place a strategy for this. Therefore, the infrastructure sector should also target this, and remain available to answer challenges. These are in the provision of speedy transport, assured power, broad-band telecom connectivity, and in the availability of latest farm and food-processing technologies.
Tertiary Sector
The tertiary sector provides trade, transport, banking, insurance, IT services, etc., and has grown at a rate of over seven per cent per annum. Considering the potential of growth in this area, infrastructure should also concentrate on it for speeding up the development of Punjab. This will need laying down broad-band telecom networks.

assured power supply, reliable transport infrastructure, including a well managed international airport.
The tertiary sector depends upon knowledge enhancement. The state has medical, engineering, and architecture colleges, along with management institutions. Punjab Technical University is also going ahead with its programme of taking technical education to the people, including IT skills. It may be noted that the tertiary sector is most dependent on good infrastructure support. Unlike the primary and secondary sectors, it is knowledge-person-oriented, and can be re-situated quickly. It is amenable to IT, and if the persons involved in it find any infrastructural lacunae, they take flight quickly. Thus, with the right infrastructure and policy to match, tertiary sector development can achieve a much steeper growth curve.
Health services are one of the most important tertiary sector activities. Trends are showing an increase in respiratory and circulatory system diseases. Including cardiac ailments. Another area responsible for large casualties is accidents, especially road accidents. Heart, lung, and trauma management are areas, which need quick movement to the health centres. Therefore, infrastructure will have to factor in these important issues. It should assist in the prevention, diagnosis, and emergency management of these health issues all over the state.
With this vision, and a resultant agenda for infrastructure, the state can proceed to put in place the various sectors involved.
In this chapter, we comment on the following infrastructure sectors:
• Energy• IT and Telecom• Transport
ENERGY
Resources and Current Availability
One of the most vital inputs, it literally fuels the engine of progress and development. It can be tapped from both renewable and non-renewable resources. Let us examine the availability of the primary sources of energy (Table 1).
Table 1
RenewableHydro-power YesBiogas Yes, limitedSolar YesWind Negligible potentialGeo-thermal NoTidal NoNon-renewableCoal NoOil NoGas No

Nuclear energy as an energy source is not considered on account of it being ruled out for strategic reasons, as Punjab is a border state. Considering the resource base, Punjab should concentrate on mini-and micro-hydel schemes, solar and biogas areas in renewable energy.
In the case of non-renewable sources, coal is already a major source of energy. Punjab is heavily dependent upon Guru Gobind Singh TPP at Ropar and Guru Nanak Dev TPP at Bathinda, and is also in an expansion mode for further units at Guru Har Gobind Singh TPP at Lehra Mohabbat. Thermal power continues to be the major supplier of energy in the state. Since 1997, thermal power has become the mainstay of electrical energy availability in the state (Table 2).
Table 2
Year ThermalGeneration
HydroGeneration
Purchased Total
1991 5426 7540 2515 154811996 7534 7557 4972 200631997 8978 7616 5084 216781998 9424 6806 6647 228771999 9989 8808 6296 250932000 12641 7739 6008 263882001 13217 7063 6892 271722002 13198 6967 6830 26995
Source: Punjab State Electricity Board
Punjab also purchases power from outside, notably from Baira Siul, Singrauli thermal, Salal hydel and others. In 2001-2002, such purchases are likely to be about 6,830 million kwh. Thus, the state’s self-generated thermal power accounts for 50 per cent of total power availability, 25 per cent coming in from self-generated hydel sources, and the remaining 25 per cent being purchased from outside. The complete picture of electrical power availability in India is clear from the following Table 3;
Table 3Electrical Power Avallabilil y in India
1997-98 (billion kwh)
1998-99 (billion kwh)
1997-98 (Annual growth in per cent)
1998-99 (Annual growth in per cent)
Power generation 420.6 448.4 6.5 7.5Hydro-electric 74.5 82.7 8.8 1.9Thermal 336.1 353.7 4.6 9.9Nuclear 10.0 12.0 14.1 12.8Plant load factor of thermal plants (Percent)
64.7 64.6
Source: www.ficci.com/fjcci/econo-upda/power.htm
While electrical generation is growing at an overall rate of 7.5 per cent, the major growth is in the thermal and nuclear sectors. With nuclear power ruled out, and mega hydro

project power availability in the near future uncertain, Punjab has moved on the right track of building up a thermal generation capacity.
GVK Goindwai Sahib Power Project (500 MW)
This 500 MW coal-fired power plant is coming up in the Amritsar district of Punjab, with a 2X250 MW configuration. Coal for the project has been linked and the EPC contractor has been selected. The project also envisages using imported coal. The first unit will be commissioned in 34 months from the date of financial closure and the second unit in four months from then. This will be the state’s first independent power project. It is likely to pump in 2,715 million kwh per year at 68.5 per cent plant load factor. The fuel supply agreement has been negotiated with Eastern Coalfields Ltd., and the fuel transport agreement with Northern Railways is under negotiations. For the escrow account agreement with PSEB, the matter is under consideration by the Board. On acpount of financial difficulties and slow progress of reform, PSEB is not able to go ahead with the escrow account, and the project is stagnating.
Transmission and Distribution LossesExamining the facet of transmission losses, we find that Punjab is in an almost enviable position. In 1980-81, it was 19.6 per cent, and peaked to 21.5 percent in 1991-92. It has been shown in 1999-2000, as 15.07 per cent, as against Maharashtra 32.17 per cent, Karnataka 38 per cent, and even next door Haryana and Delhi at 37.29 per cent and 47.52 per cent respectively. The state’s achievement in T&D losses minimization is laudable, but it is worthwhile to mention that with one-third of the power being distributed free, where is the need for theft? It is thus possible that real T&D loss may be higher than reported, with a part of it shown in the agriculture area. By factoring in experience of Punjab’s pre-free electricity days, it is safe to consider the real T&D loss at about 20 per cent. Considering the domain of possibility, there is potential to bring this down to about 10 per cent, and this can add about 1,500 million kwh per year.
Generating EfficiencyThe average plant load factor (PLF) for Punjab’s thermal units is about 69% (Table 4). A comparison with the other states is as under:
Table 4Plant Load Factor of Thermal Plants
State 1994-95 1995-96 1996-97 1997-98 1998-99SEBs 55 58 60.3 60.9 60.1AndhraPradesh 70.2 77.4 81.4 85.0 80.7Gujarat 60.5 65.3 65.4 66.1 64.6Karnataka 64.9 67.7 70.2 75.2 81.6MadhyaPradesh 58.2 58.7 74.4 74.9 77.7Rajasthan 75.6 73.7 75.6 82.1 78.1Central Sector 69.2 71.0 71.1 70.4 71.1Private Sector 65.8 72.3 71.2 71.2 68.3Punjab 56.7 55.0 65.7 69.0 69.4
Source: Annual Report, Ministry of Power 1999-2000
Punjab may seek comfort in the fact that the national average load factor for thermal units is 65 per cent, but that can provide little solace, weighed down as it is by Bihar’s

35.8 per cent, and Assam’s 18 per cent. The fact is that a number of states are doing very well, and Punjab should attempt an 80 per cent plant load factor. Such technical arguments as old machinery, etc, are given, but available examples in industry speak for themselves. Pre-NTPC, the Badarpur plant in Delhi was declared unmanageable, and was running at about 31.4 per cent PLF. Post-NTPC, the plant continues to be important for Delhi, and is running at 80 per cent PLF. There exists a possibility of adding about1,500 million kwh by enhancement of PLF to 80 per cent plus.
Total Expected Availability
Even if we factor in another 1,000 million units as being made available/saved through micro-hydel and renewable energy sources such as solar power and biogas, it becomes clear that self-sufficiency in energy cannot be achieved. Even today, Punjab is buying about 7,000 million kwh from the grid, and it shall continue to do so. In fact, this will increase, anticipating further growth in demand for power, as realized from an analysis of consumption trends. The total likely availability of power from the state’s own resources by about 2010 is shown in (Table 5).
Table 5Conceptual Framework of Availability of Power from the
Generation UnitsThermal at 68% PLF 16000Hydel 7000Non-conventional resources, micro-hydel 1000Enhancement of PLF to 80% plus 1500Minus T&D losses @ 10% 2550Total 23000
Consumption
Punjab has the highest per capita consumption of electricity among all states in India, at 904.58 kwh per year (Table 6). It achieved 100% electrification in 1980.
Table 6Annual per Capita Consumption of Electricity by Sitates 1999-2000 (million kwh)
State Domestic light and small power
Commercial light and small power
Industrial Publiclighting
Agricultural Total
AndhraPradesh
63.57 12.77 114.05 3.97 133.4 327.80
Bihar 10.52 4.19 85.04 0.45 15.39 115.59Gujarat 83.83 29.11 261.46 3.29 311.40 689.09Haryana 105.93 19.74 126.66 1.57 232.80 486.70Karnataka 63.04 10.14 90.83 3.18 181.72 348.91TamilNadu 70.96 40.90 217.75 4.07 120.46 291.72Maharashtra 102.81 27.68 251.02 5.59 116.24 503.34Punjab 161.31 34.11 355.19 2.58 351.39 904.58Source; Central Electricity Authority

A sample of the states has been taken, and Punjab is the highest in per capita consumption in domestic, industrial, and agncultural use. There are only three Union Territories of Daman & Diu, Pondicherry, and Dadra & Nagar Haveli, with a higher industrial consumption, on account of large projects. Chandigarh and Delhi have higher domestic consumption. On the overall, the per capita consumption in Punjab would definitely place it as one of the high energy-consuming societies. The sub-sectoral break-up of power consumption in Punjab is shown in (Table 7).
Table 7Sub-sectoral Break-up of Power Consumption in Punjab,
1970-71 to 2000-01 (Percentage)1970-71 1980-81 1990-91 1998-99 1999-00 2000-01
Domestic 9.77 11.74 13.60 18.43 18.06 22.02Commercial 5.22 3.29 2.74 3.85 3.82 4.74Industrial 35.96 38.09 36.26 36.58 36.78 41.95Public lighting and bulk
11.05 3.27 4.53 2.04 2.01 2.44
Agriculture 38.00 43.66 42.87 39.10 39.33 28.85Source: Economic and Statistical Organisation
Domestic supply: The share of domestic consumption has more than doubled since the seventies, and is likely to rise further (Table 8). While being the highest per capita consumer, it is necessary to take note of the households with electricity (Table 8).
Table 8
Year Total Households Households using Electricity
Percentage
1980-81 2748453 1553629 56.531990-91 3365132 2754312 81.851999-00 4174410 3565857 85.422000-01 4267250 3699739 86.70
Source: Punjab State Electricity BoardEconomic and Statistical Organisation
Thus, growth of demand from domestic households can be anticipated as we move towards real 100 per cent use of electrification. This trend will be more pronounced because Punjab is quickly moving to being one of the most urbanized states in the country. In 1951, there was 22 per cent urbanization; this had jumped to 34 per cent in2001, and is further expected to touch 45 per cent by 2020. This implies that out of the current population of 2.25 crore, 0.77 crore are urbanized. This figure will move to 1.92 crore with the expected population of 4.26 crore in 2020, as against 2.34 crore in rural areas. Thus, while net addition to rural population will be 0.87 crore, urban figures will go up by 1.15 crore. The clear ramifications of this are:
• Domestic sector will need and demand 100 per cent electrical supply.
• Since urban consumptions are higher than rural, we can expect an increase in per capita power consumption.

The domestic sector uses 4,400 million kwh of power, and we can expect an additional annual demand of about 400 million kwh every year, doubling the total requirement to about 8,500 million kwh by 2010, while the population will double after 2020.
Commercial supply: The commercial sector consumes about 1,000 million units. With increased urbanization, such commercial activities as trading, health services, retail outlets, etc., will increase at a fast pace. Until now, this sector has remained largely stable in its power consumption, even going down at certain times. It will now add to its consumption as an important growth area in the tertiary sector. There is also a trend towards energy-consuming displays, and an affinity for air-conditioning the commercial setup to attract customers. It is anticipated that in keeping with global trends, the commercial sector will demand extra energy. Since Punjab anticipates growth in the tertiary sector services market, it would be necessary to plan for an additional requirement of 250 million kwh per year till 2010. The commercial sector will thus need3,500 million kwh per year.
industrial supply: No major industry, other than the Hindustan Petroleum refinery, is slated for Punjab. At present, it is planned with a captive power plant to trap released gases and byproducts and become a power-surplus unit. For the last decade, the industrial sector has been demanding extra energy at the rate of about 400 million kwh additional units every year. The consumption in 2000-01 was 8,000 million kwh, and plans should be made keeping the same in mind. Thus, the industrial sector will need12,000 million kwh per year in 2010.
Public lighting and bulk: Public lighting and bulk-sector demand remains at 500 million kwh. The major addition to this is the bulk demand from the Northern Railway, with electrification sanctioned upto Amritsar. It is anticipated that further electrification projects will be taken up to handle the suburban and inter-city passengers of Punjab’s metropolitan and other large towns. After discussions on this with the Railways, it would be wise to add 1,000 million kwh in this segment by 2010.
Supply to agriculture: The agricultural sector today needs about 5,500 million kwh. This demand has been going down in recent years, with the peak at 8,200 million kwh. Undoubtedly, it is linked to the demand for water, and thus is a correlate of rainfall and availability of assured irrigation. Its decreasing demand is on account of a succession of good monsoons, and the area under irrigation increasing from 57,81,000 hectares in 1980 to 75,44,000 hectares in 2000. However, the rains can always fail, and though the demand in this sector is not likely to increase from its peak of 8,200 million units, at least this much should be planned for as being available for this sector. At present too, with the failure of the monsoon, a large demand has been generated in the agricultural sector, and urban domestic and industrial supplies have been badly disrupted.
Total Demand: In keeping with international demand trends, over the decade from 2010 to 2020, the overall demand is likely to double, and stand at 68,000 million kwh.

Table 9Anticipated Demand for Energy (in million kwh)
Sector Demand in 2010Domestic 8500Commercial 3500Industrial 12000Public lighting and bulk 1500Agriculture 8500Total 34000
Source; Economic Survey of Punjab Punjab State Electricity Board
Even for a time horizon of 2010, the anticipated demand for electrical energy is anticipated at 34,000 million units against a likely self-generation of about 23,000 million units (Table 9). To cover this shortfall, Punjab will need to put in place an additional3,000 MW of generating potential at PLF of about 80 per cent. This large chunk is nowhere in sight, and there is no possibility of generating the anticipated 68,000 million kwh by 2020. Environmental concerns also dictate that Punjab should seriously evaluate the effects of setting up more thermal-based generation capacity.
Punjab must accept the fact that in the conceivable future, it will always be shopping for power on the national grid. This would appear to be in the interest of both the state and the nation, with a number of power surplus states, central sector generating units in a position to sell, IPPs, and the emerging road map in the power reforms sector
Shift To Commercial Basis Through Basic Reform
It is in the interest of the state to shift to a commercial basis for generation, transmission, and distribution of electricity. An examination of costs and revenues will apprise of the implicit subsidies in PSEB operations. Earlier, it was largely supplying power, by purchasing it from outside. From 1975-76, it entered the self-generation phase, and from then on, the cycle of subsidy really started. In the first phase, PSEB was a supplier, and in the second phase it became a generator (Table 10). ‘In the first phase, the cost wasdecreasing, but in the second phase, it showed an increase.....insistence on greaterpower generation was confined to the second phase...... proved a costly affair. Risingcoal prices and haulage costs, T&D losses, lower PLF....contributing to these cost escalations’ {Scope for Raising Agricultural Power Tariff in Punjab, Abnash C Julka, CRRID).
The mainstay of PSEB generation is thermal power stations. The cost of coal received is lower than the transport and handling charges! The coal supplied was of such a low grade that the ash content was in the range of 40 per cent. It means that PSEB effectively paid for coal, but got 40 per cent less, and bought and transported ash at the cost of coal! In addition, lower grade coal results in excess handling, higher pollution levels, undue wear and tear of various equipment resulting in shorter life-spans and earlier replacements. The auxiliary consumption of total fuel is increased. Above aJI, the disposal of ash is another major problem, and constitute almost an environmental disaster. In future, power utilities may even have to pay to transport the ash back, for being disposed in redundant coal mine shafts, to prevent large scale air and ground pollution.

Table 10Cost and Revenue per Unit of Electricity (in F
Year Cost per unit Revenue per unit Subsidy per unit
Source: Rangnekar1990
According to the Economic Survey of Punjab 2001-2002, the current average cost per unit of electricity is Rs 2.93, and average revenue per unit Rs 2.07, implying a present level of subsidy at 0.86 paise per unit. While the PESB supplied power free to farmers, it supplied it to the commercial sector at Rs 3.99 per unit, and to industry at Rs 4.13 per unit. This runs counter to the policy of attracting growth in secondary and tertiary sectors.
In such a situation, there is always the possibility of wrong diagnosis. The ‘resource crunch’ theory is all pervasive, and somehow it appears that the only issue is that the government does not have funds to set up additional capacity. The result of this is the disastrous Independent Power Producers (IPP) programme. While these fast track IPP projects were brought on, the basic reforms in the power sector were placed on the back burner. Private power generators realized this, and forced the government into Power Purchase Agreements (PPAs), shifting the entire risk onto the SEBs. As a result, we find many of these projects in doldrums, starting with the (in)famous case of Dabhol Power Corporation, and Punjab’s own Goindwal project. If basic reforms are not brought about, and if there is only an attempt to shift risk rather than decrease it, there may be a situation when the IPPs may even work to oppose power sector reform, armed as they are with guarantees, and counter-guarantees (‘Power Sector Reform and Regulation; The Road Ahead,’ Sebastian Morris, India Infrastructure Report 2001).Thus:
• It is in the overall economic and environmental interest of Punjab not to conceive of fresh generation capacity, other than micro-hydel, and initiatives in solar and bio-gas energy areas.
• Punjab should shift to a commercial basis of electrical energy generation, transmission and distribution.
• This will mean increased PLF at the generating end, with a target of 80 per cent.• On the transmission side, the losses will have to be limited to 10 per cent.• At the distribution end, power must be metered and charges recovered in
accordance with a tariff policy.
It is worthwhile to remember that some government-controlled PSUs have a better PLF than private operators. This only highlights the fact that mere privatization is not the solution, but increase in efficiency is the answer. Cases of power sector reform are now noticeable in India. UP has divided its SEB into generation, distribution and transmission companies, with privatization of power distribution in Kanpur under way. Delhi has recently brought in Tatas’ BSES to take over distribution in the national capital.

PSEB - Reform Status
According to the Ministry of Power, the status is as under:
Unbundling/corporatization: PFC and ADB are providing technical and financial assistance for power sector reforms in the state. Reform-related studies, namely, tariff rationalization, demand-side management, and profit-centre approach to PSEB operations have been initiated.
Privatization of generation/distribution; No significant progress.
Formation of SERC: The government of Punjab notified the constitution of its SERC on 31 March 1999. The Planning Commission has noted that the Punjab Government has expressed commitment to power reforms, and proceeded with a tarriff rationalization study. The status of power sector reform in some other states has proceeded much beyond, and Punjab lags behind (Table 11).
It is time that Punjab went ahead and demonstrated its resolve to reforms in the power sector. For a state with the highest per capita power consumption, and also one with its GNTP at Bathinda continuing to win awards for highest PLF (in 1980s), this could be one of the defining differences between the achievement of a flourishing Punjab in 2020, or a ‘has been’ status.
Table 11Status of Power Sector Reform In Some Other States
State StatusOrissa - Reforms Act, passed and OERC set up in 1996.
- SEB unbundled Into OPGC, OHPC and GRIDCO with four subsidiary distribution companies, OPGC, disinvested.- Distribution companies privatized— 51 per cent share of three companies WESCO, NESCO, SOUTHCO given to BSES and of the fourth (CESCO) to AES Corpn. of USA.- World Bank loan - US $ 350 million, DFID assistance, 64.5 million Pounds
Haryana - Reforms Act notified in March,98 and HERC set up on 17 August 98.- HSEB unbundled in August 98 into HVPN (Haryana Vidyut Prasaran Nigam Ltd), a power transmission company and HPGC (Haryana Power Generation Corpn. Ltd) a generation company.- Two distribution companies, Viz.; UHBVNL (Uttar Haryana Bijli Vitran Nigam Ltd and DHBVNL (Dakshin Haryana Bijli Vitran Nigam Ltd) established.- Loan assitance of US $ 600 million for power sector reforms programme committed by World Bank for 10 years.- Financial Restructuring Study and Asset Evaluation Study by M/s Price Waterhouse Coopers. M/s Arthur Andersen engaged as Reforms Consultants for Corporatization, commercialization and privatization of distribution.
AndhraPradesh
- APERC Act 1998 enacted and SERC set up.- APSEB unbundled into Transmission Corporation of Andhra Pradesh Ltd. (APTRANSCO) and Andhra Pradesh Power Generation Ltd. (APGENCO).- Loan of US $ 790 million committed by World Bank. US $ 210 million released. Supplementary technical co-operation Grant of UK Pound 28 million approved by DFID
Source: www.planningcommission.nic.in/sebch5.htm

After the recent amendments in Electricity Laws, transmission activity has been given an independent status and the concept of Central and State transmission utilities has been introduced. While POWERGRID has been notified as the Central Transmission Utility (CTU), the State Electricity Boards, or their successor state transmission companies, would be the state transmission utilities. It is mandated in the Act that CTU and STU would be government companies. The participation by the private sector in the area of transmission is proposed to be limited to construction and maintenance of transmission lines, for operation under the supervision and control of CTU/STU.
A Power Trading Corporation (PTC) has been incorporated as a Limited Company as per Company's Act 1956 on 16 April 1999, for the purpose of buying power from mega power projects under long-term PPAs and selling it to the beneficiary states also under long-term PPAs. Security to the PTC would be provided by means of a Letter of Credit and recourse to the state's share of central plan allocations and other devolutions. A precondition for purchase of power from mega power projects would be constitution by the beneficiary states of their Regulatory Commissions with full powers to fix tariffs as envisaged in the Central Act. They would also have to privatize distribution in the cities with a population of more than ten lakh.
Draft Electricity Bill
The draft Electricity Bill prepared by the Government of India seeks to provide a legal framework to the reform process and restructure the power sector to being about transparency, accountability and efficiency in the system. The Bill has suggested the unbundling of the SEBs into independent managed corporations for generation, transmission and distribution, to make them commercially viable. According to the new Bill, SERCs will have to be established within three months of the Act coming into force. It will certainly push the reform programme all over the country and show the direction in which the power sector should move in future. It will also infuse confidence in foreign investors and help bring in more investments in the power sector. The Bill suggests breaking up the existing monopolist structure in the transmission sector and recognizes the need to create a power-pool and allow trading of power like any other commodity. For transmission, the Bill envisages changing the system from that of a monopolistic provider supplying electricity at regulated rates to that of a system where different companies will compete to provide electricity at competitive rates.
Key Points• SERCs to be set up within three months of the new Act coming into force.• Corporatized state transmission utility to be established within 120 days.• Power pooling to facilitate establishment of a spot market for electricity to come
into force from the first anniversary of the new Act.• Generation and transmission projects not to require techno-economic clearance
from the CEA.• Applications for new projects to be processed by the regulatory commission
within 120 days.• CEA's role limited to national planning and technical development.• All supply to be compulsorily metered within one year of the Act coming into
force.

• Central commission to fix generation and transmission tariff; distribution tariff to be fixed by the SERCs. Tariff could be left to market forces to be determined at an appropriate time in future through government direction.
• REBs to be dissolved and replaced with regional transmission centre.
Punjab to be Ready
The Electricity Bill is a clear pointer of things to come, and the Punjab Government should be ready, by taking the envisaged steps right now. These steps include unbundling of generation, transmission and distribution activities. Groundwork needed to take all the stakeholders into confidence must be finalized and completed. Since in the conceivable future, Punjab will always need to purchase power from external sources, it will have to go to the Central Transmission Utility, and buy power through the Power Trading Corporation. Two preconditions are legally mandatory for trading on the GRID:
• Set up SERC, with full power to fix tariffs, and it is obvious that the Central Government will look for demonstrated action in this area; and
• privatize distribution in cities with populations in excess of ten lakh.
The Move Forward - with People Sector Participation
In the 'privatization-is-a-cure-for-all-ills’ mind-set, PSP has come to mean Private Sector Participation. Let Punjab give it a new meaning and bring in People Sector Participation in the power reforms arena. We have said that mere privatization is no panacea, but the endeavour should be to pursue efficiency. With this, we also factor in the recent experiences of many states in power reforms. Of note is also the recent agitation in Haryana’s Jind district, where government functionaries were held captive by farmers, in response to certain power sector reform issues. It is essential that the power sector reform be made a people’s issue, to be achieved through people’s participation, and not be seen as a legal / bureaucratic diktat. At present, the reform process is only causing alienation, and becoming one more sore point in government-people relationship. While ultimately the patient of power sector may be cured through reform, why make the medicine bitter, and have a confrontation with the people?
There is also another important issue to be considered. Punjab’s current T&D losses are believed to be low, and point to the fact that power theft is not rampant, unlike in Delhi at 47 per cent. That may be so, but where is the need to steal with free power being given to half the citizens comprising the agriculture sector, accounting for nearly one-third of total consumption? It is felt that when SERC finally announces the revised tariffs on the agriculture sector, not only will it raise a resistance to pay, but will also raise the level of theft. In this situation T&D losses will also start mounting. Today, the agricultural sector only enjoys free power, but without theft, but if the reforms are not implemented through the people, they will also become party to theft. This will take the problem of vigilance for the power industry in Punjab to a new level.
Involve Local Bodies
In 2001, a series of workshops on Involvement of Consumers in Power Sector Reforms in Rajasthan, were held by the Centre for Consumer Action Research & Training (CART) at Chittorgarh, Abu Road and Alwar. They involved farmers, rural domestic consumers, members of the Panchayati Raj Institutions, engineers and linesmen from

the local power distribution company, namely, Ajmer Electricity Distribution Company Limited, and from the local district administration. The salient points that emerged were:
• Consumers expressed their willingness to pay if they were given assured quality and quantity of power.
• This was proved by the fact that many of the farmers today have generators and they had estimated that the generating one unit of power through generators cost them as much as Rs. 10 per unit.
• Willing to take collective responsibility - formation of committees to monitor and help in reducing thefts, to monitor the activities of linesmen and bring to the notice of appropriate authorities in case a linesman or engineer/s was found to be corrupt, monitor and ensure bill collections and timely payments, etc.
• People were in favour of installing a community meter outside the village so that theft of power, if any, can be identified and measured. The village-level committee can be formed to take care of that, and some incentives can be given for good results.
The panchayats, zilla parishads, and urban local bodies can become the drivers of power sector reform in Punjab.
Proposed Model
A working model can be set in place as under:
• Retain self-generation at present levels, keeping in mind high costs of generation, and the rising environmental costs.
• Initiate steps to fall in line with the Electricity Bill, and take advantages of the proposed system of trading power on the grid.
• Start an initiative to begin people’s participation in the reform process. Engage GOs and NGOs in an exercise of dialogue with the people; SERC can coordinate such an exercise. The exercise must be precisely planned, and executed with clear blessings from the highest level. The aim is to build up a consensus for the reforms process by ensuring good quality and assured supply of power at reasonable prices.
• Involve PSEB employees in the reform-related decision-making process. Employees must be told that they will not be forced to quit their jobs.
• Incorporate a power generation utility consisting of PSEB’s generation wing. Evolve procedures to decentralize decision-making to this generator, while retaining general policy initiative through the Board level, by retaining majority equity capital share. If possible, disinvest through employee stock option plans, further broad-basing the success factor. Build in procedures to ensure efficiency, with minimum PLF achievement at 80 per cent. Do not offer employee-incentives for generation, othen/vise plants may refuse to back off, when asked, raising grid frequency to dangerous levels. Rather, build in disincentive for not producing as per target. The disincentive will not apply when the generator is asked to back off by the Regional Transmission Centre.
• Incorporate a power transmission utility, as envisaged under the Electricity Bill. Begin talks with CEA, PowerGrid, and neighbouring states for establishing and participating in the Regional Transmission Centre/s. Evaluate possibility of multilateral assistance from national and international bodies for strengthening the

state’s transmission backbone. The plan should envisage setting up a transmission backbone for handling the anticipated 68,000 million kwh demand for the year 2020. While Punjab can trade in power from the Power Trading Corporation, it is the state’s responsibility to have a transmission tier in place. Hand over local distribution to panchayats, zilla parishads, and urban local bodies. The transmission company will hand over power at the local sub-stations, in a metered quantity. The following methodology can be considered:
Power is metered in to the local sub-station, and effectively handed over to the local body. The locally available distribution infrastructure is brought on to the books of the local body. The local body becomes a franchisee for distribution, and is paid a fixed ad valorem charge for maintenance of its distribution infrastructure, and a percentage commission for collection of user charges. The number of linesmen and other staff required to be stationed should be worked out in advance, along with the fixed contractual remuneration that will be paid. The local body will have to be assured that technical hand-holding will be done when needed.Employees of PSEB can be offered a VRS proposal, linked with a choice of a village / town in which they would like to be associated with the local body in maintenance of distribution infrastructure, distribution of electricity, and collection of user charges. After VRS, they will be working with the local body for a fixed lump-sum on a contractual basis. Considering the bi-annual ‘harvesting’ absenteeism in linesmen and other staff, if the scheme Is worked out thoughtfully, it is likely to succeed. Implement rigorous training to local bodies, and the PSEB staff involved, to take on the new role.Involve the private sector in upgrading of distribution systems wherever necessary. Funds for this will come from the user charges for higher loads, etc., and can be collated at a level sufficiently large enough to offer economies of scale.The entire package of ad valorem maintenance charge, fixed contractual moneys, etc., will be worked out in a financially secure manner, with no input from the government.
• Place a cap on any new recruitment in PSEB, and strictly implement the same. Special VRS offers should be linked to the distribution scheme as mentioned earlier. Re-deployment of staff will be required in accordance with the new corporatized structure.
• Move for long-term PPAs from the Grid, based upon initial experiences.
By exposing the public to the advantages of clean, reliable power supply at reasonablerates (no stabilizers, no inverters, a better quality of life), and with people’s involvement at the grassroots through local bodies, Punjab can pioneer the process of reforms in the power sector.
Other Initiatives
Fluorescent lighting; In the domestic lighting sector, people still use incandescent lighting. It would be desirable to impose a higher slab of local tax so that the incandescent bulb becomes an expensive proposition. At the same time, taxes on fluorescent lighting should be brought down to encourage its use, and it should also be

mandated that only electronic ballasts (chokes) are used. This should be coupled with a public awareness programme, and a targeted drive to wipe out incandescent bulbs within a two year period. This step will reduce the total lighting load by a margin of 50 per cent.
Energy saving equipment: It should be mandated by law that for day to dayappliances, such as fans, cooler fans / pumps, food processors (‘mixies’), agricultural motors, etc., BIS certification is a must. The market is full of cheap, but power-guzzling appliances. They actually cost the buyer much more total life-cycle cost, in a heavy running charges, and place a great strain on the power system of the state. An awareness campaign should be run for this, and manufacturers asked to seek BIS certification for their products. The energy consumption of the product should be compulsorily mentioned prominently for consumer guidance, and surprise checks of products in the shops conducted to ensure that they adhere to the specifications laid down. This should be achieved in a total target time of two years.
The effect of this will be two-fold;
• It will reduce the load on the power system• It will raise the level of technical competence in the small industry manufacturing
sector (fans, pumps, ‘mixies’, etc.,), making Punjab’s products better placed to compete in the market.
IT & TELECOM
Considering the very nature of these sectors, they are heading towards convergence, and policy initiatives must address them together, at the same time. Telecom is infrastructure-oriented, and IT represents a value-added service. The networked world has now made it mandatory for IT services to be based on telecom connectivity, since stand-alone IT applications will dwindle in the future. Thus, telecom is largely viewed as providing support for information interchange, and IT represents the basic operating systems, along with the higher level user-interfaces required.
Telecom India
India's 2.16 crore-line telephone network is one of the largest in the world and the third largest among emerging economies (after China and the Republic of Korea). Given the low telephone penetration rate - 2.2 per 100 people of the population, which is much below the global average, India offers a vast scope for growth. It is, therefore, not surprising that it has one of the fastest growing telecommunication systems in the world, with the system size (total connections) growing at an average of more than 20 per cent over the last four years.
The industry is considered as having the highest potential for investment in India. The growth in demand for telecom services in the country is not limited to basic telephone services. India has witnessed rapid growth in cellular, radio-paging, value-added services, internet and global mobile communication by satellite services. This is expected to soar in the next few years. Recognizing that the telecom sector is one of the prime movers of the economy, the government's regulatory and policy initiatives have also been directed towards establishing a world-class telecommunications infrastructure

in India. The telecom sector in the country, therefore, offers an ideal environment for investment.
The Ministry of Communications, through the Department .of Telecommunication & Department of Telecom Services and its undertakings, leads the telecommunication initiative in the country for provision of basic telephone services, national and international long-distance communications, manufacture of complete range of telecom equipment, research and development, and consultancy services. The sector has been progressively opened for private sector participation not only in value-added areas, but even in basic services, National Long Distance/ International Long Distance, and internet telephony. The Telecom Commission performs the executive and policy making functions and the Telecom Regulatory Authority of India those of a n , independent regulatory body.
A Convergence Bill is anticipated, ‘to promote, facilitate and develop, in an orderly manner, the carriage and content of communications (including broadcasting, telecommutonication, and multimedia), for the establishment of an autonomous Commission to regulate all forms of communications, and for establishment of an Appellate Tribunal and to provide for matters connected therewith or incidental thereto.’
The Bill proposes to repeal the following legislations.
• The Indian Telegraph Act, 1885.• The Indian Wireless Telegraphy Act, 1933.• The Telegraph Wires (Unlawful Possession) Act, 1950.• The Telecom Regulatory Authority of India Act, 1997.• The Cable Television Networks (Regulation) Act, 1995.
The telecom sector is thus poised for a major paradigm change, and Punjab should launch itself into a preparatory mode to take care of the advantages likely to accrue from this co-ordinated approach.
The telecom infrastructure in Punjab is as follows;
• Total equipped capacity of 10,52,065 lines.• Total number of telephone lines working in Punjab Teiecom-8,90,495.• Number of telephone^exchanges— 1,004.• Trunk Automatic Exchange (TAX)-56Klines.• Subscriber Trunk Dialing facility available from 794 exchanges.
Value-added services available;
I netInternet ISDN Paging Cellular
Punjab has formulated and announced an IT policy. A reading and analysis of the policy shows that the role of the government in this area is highly over-emphasized, and this anomaly will have to addressed head on:

Vision statement of IT Policy
To use Information technology towards accelerated overall development of a knowledge-rich society’.
Information Technology is being viewed as of vital importance by the state because of two main reasons.
• First, IT will be used to enhance quality, reduce costs and improve overall efficiency and effectiveness of the government machinery. IT can enable the government to dramatically re-engineer and improve its processes and services delivery systems for the benefit of the common people. Effective use of IT would bring about much needed radical changes in the functioning of the government, leading to better efficiency, transparency, accountability, and objectivity and ensure ‘A better government which is cost-effective and capable of serving the needs of the citizens better.’
• The second reason is economic. IT can dramatically help improve the economy of Punjab, generating more jobs and export revenues. In short IT is an effective tool for catalyzing accelerated economic growth, effective governance and human resource development.
The thrust of the government is towards provision of IT services, and it does not embrace hardware. In this regard, the statement must be complimented on being realistic, by not intending to waste any time and money on trying to establish any hardware initiatives. This clarity is unfortunately lost when laying down detailed objectives for the IT policy. Indeed, India is basically an assembler base, and the funds required for R&D, manufacturing, and marketing of hardware, are not in sight. Globally, the IT network has established itself around R&D in US and Japan, basic mother board level assembly in China / Taiwan, etc., higher level system assemblies in consumer countries like India, and software porting from select source countries. India scores high as a preferred source of software, and Punjab is right in concentrating on and defining HRD as a premier issue involved.
IT is thus to be furthered by:
• Increased organizational efficiency of the government.• Building a successful domestic IT and knowledge-based Industry and business.• Producing globally competitive IT-enabled human resources for jobs within and
outside India/ Punjab.
The following objectives are laid down by the IT policy:
• Improve the overall economy of Punjab by generating more jobs, as well as domestic and export revenues and ensure, even spread, such benefits to one and all in the state, including the poor and the rural population.
• Create employment potential through human resource development through IT literacy, education and training for creation of high-value employment.
• Empower citizens through deployment of IT, e-governance and freedom of information, particularly in social and public service sectors.

• Provide public-centred governance, which is efficient, cost-effective, transparent, friendly, affordable, convenient, effective and accountable.
• Encourage private-sector participation in IT-related infrastructure and public services on a self-sustaining revenue model basis.
• Make Punjab globally competitive in the globalized, privatized and liberalized economy and the changing business environment of the new millennium.
• Make Punjab a favoured industry-destination for attracting investment from outside the state by creating world-class infrastructure, institutional framework and an enabling environment for the clusterization of high-tech industry in general and IT Industry in particular.
• Turn Punjab into a smart and intelligent state and a knowledge-society through IT-education and e-governance, by promoting knowledge as the key resource for economic progress of individuals and institutions.
The Punjab Government will bring into existence the following frameworks for implementing its IT vision:
e-lnstitutional Framework
To create the required institutional framework, like the Department of Information Systems and Administrative Reforms, IT-related corporations, joint ventures, agreements, strategic partnerships, etc., for framing the IT strategy, enabling policies, action plans, standards, methodologies, and to facilitate the effective implementation of this IT Policy.
e-lnfrastructure
Basic infrastructure: Create world class IT Infrastructure to make Punjab a favoured IT- and knowledge-lndustry destination.
e-Governance
To deploy IT for providing an efficient and cost effective government and improve its processes through administrative re-engineering, modernization through IT. This will ultimately lead to the creation of an 'Intelligent’ state.
e-public interface: Citizen-IT Interface: Provide a public-service oriented government and improve the public-service delivery. Make information more accessible through an affordable, friendly, shared and widely used IT infrastructure at the front end. Encourage private sector participation in providing IT-based public services. To provide a productive government-citizenry interface.
e-Employment
Employment generation: Generate more jobs in the area of IT and other sectors through rapid development of IT Industry, business and economy.

Human resources development In IT: Invest in people, tools, methods and partnerships necessary to improve the knowledge and skills of human resources. Produce a high quality and competitive IT-enabled workforce of world-class capability at all levels, who are welcomed as an asset by the IT industry within and outside the country.
e-Education
IT and IT based education; Improve the quality, reach and effectiveness of delivery systems of education through the use of IT. Enhance the value and employability of the youth of the state by equipping them with the knowledge of IT both at school and college levels. Create an IT-friendly culture, enabling a knowledge-based society.
e-lndustry
Knowledge industry; Encourage and promote the IT industry by providing an institutional framework and an enabling environment for the clusterization of high-tech industry in general, and IT industry in particular, to strengthen the economy of Punjab. $tress should be on creativity, innovation, entrepreneurship and creation of R&D clusters.
e-Business
Generate more domestic and export revenues through development of e-business for improving the overall economy and thus the quality of life of the citizens of Punjab. Make the state globally competitive through the use of IT to respond quickly to the changing business requirements and border-less marketing.
Paradigm Problems
An examination of these framework statements points to a lack of clear direction to the IT policy, which appears to a attempt to achieve everything.
• It is alarming to note that the government intends to create a bureaucratic structure of ‘Department of Information Systems and Administrative Reforms, IT- related corporations, joint ventures, agreements, strategic partnerships, etc.’ This is ostensibly for ‘for making the IT strategy, enabling policies, action plans, standards, methodologies and to facilitate the effective implementation of this IT Policy’. Punjab would do well to keep in mind that this kind of bureacratization is exactly what is to be avoided, and worldwide experience clearly demonstrates that IT producers and consumers remain equipped and capable of providing direction to each other. It is a fact that IT is one industry that grew the maximum, without any such ‘framework’-based support from the government.
• The new IT bureaucracy envisages the following:
■ IT Vision Group - The Apex Envisioning Body.■ Cabinet Sub-Committee on Information Technology.■ Department of Information Systems and Administrative Reforms (DISAR)
IT Resource Acquisition and Disposal Policy.

Procedure and responsibility for implementation of IT projects.IT initiative fund for e-governance.Empowered Committee on Computerization (ECC).Departmental Committee on IT/ Computerization (DC-IT).Punjab IT Corporation.
This level of governmental intrusion into the sector is unwarranted, and is not borne out by the history of the development of this sector worldwide.
• It should also be kept in mind that the Convergence Bill and the Communications Commission of India will provide the necessary regulatory control at the national level, and Punjab would do well to avoid setting up any parallel organizational structure in this regard.
• There is talk of ‘clusterization’ of high-tech industry. The world over it is clearly proven that it is better to provide a communications network that allows ‘declusterization’ of knowledge workers. It should be possible for a future IT person in a Punjab village to tele-commute to his principal’s office in Los Angeles or Tokyo, and conduct business and service transactions.
• There appears to be an idea that we should provide infrastructure in a specific area, get some ‘industries’ in place within those confines, and climb aboard the IT band-wagon. This is not going to happen, as has been proved in various such ‘clusters’ developed earlier. In Mohali, a number of corporations have shut shop and given a drastic blow to this whole idea.
• There still appears to be hope of attracting the hardware industry. This should be given up. From computers to televisions, factories have shut shop in Punjab. It should be realized that this is not the most ideal place to invest in hardware. The state will welcome any initiative, but its policy should not be based on this expectation.
Punjab should immediately give up these hackneyed concepts and re-examine its position, factoring in the latest IT industry scenarios.
Give IT a direction
The need for IT in Punjab arises from its near total absence in its most important activities - agriculture and agro-processing. The success of IT is almost assured if it can address the issues in these areas, and this will provide employment to people becoming surplus from these mother areas.
The Punjab Government should concentrate on the following:
• e-Infrastructure■ Ensure that from every village upwards, there is reliable broadband
connectivity, backed with reliable electricity to keep the telecom infrastructure up and running.
■ Take cognisance of the issues in the Convergence Bill while designing the network
■ Involve the private sector and step in only when unavoidable. And even for these areas, evaluate and execute BOO (Build-Own-Operate) projects.
■ Involve the Panchayats and other local bodies in the management of services for their communities.

• e-HRD
■ Proliferate IT knowledge■ Introduce computers and IT as a way of life from school onwards, so that
the future population is IT-savvy. This will wipe out the digital divide in thestate, and build an excellent foundation for advanced IT training.
■ Assist Punjab Technical University, and other training initiatives to impart the latest education, since the obsolescence factor in this area is very high.
• e-Governance
■ Re-engineering of government processes by effective deployment of IT.■ Any-where, any-time services to citizens.■ Better accountability, responsiveness and transparency of all systems.
Set an example
In this regard, Punjab should commence upon a targeted and time-bound initiative, bringing e-governance to the citizens’ doorstep.
A broad framework that can be adopted is listed below.
Need for IT in social sector
For government; As the corporates are under intense competition, governments around the world are also under tremendous popular pressure to perform better, and in a more professional manner. This necessitates; faster processing, decision-making and communication. The systems for delivery of services and grievance-redressal in the social sector have to be efficient and responsive. It is imperative to put in place an IT regime, which is as real-time and on-line as local conditions permit. A simple interface should capture raw data, and a user-transparent processing mechanism should deliver decision-making information to administration. It is often seen that field officers at the district level are forced to spend an inordinate proportion of their time in information collection and transmission. While IT implementation will empower them with quick and reliable monitoring tools on local social-delivery systems, they will also be freed from the usual drudgery of information collection and transmission. The administration will have increased time for positive action, and be able to provide a prompt and positive public interface for grievance-redressal and free and easy access to services and information, while bringing about transparency in the system. Information technology can enhance the capability of the local, regional and top-level governmental machinery and local bodies to make use of relevant information, take informed decisions and plan, execute and monitor in a better and productive manner.
It also needs to be clearly understood that since financing the social sector through government revenues depends upon regulatory issues of excise, taxation, etc., it is necessary to implement effective IT interventions in these latter areas too. While the social sector expenditure and actual results will be analysed in relation to targets, the availability of revenues according to plan to ensure continued support to the social schemes can also be monitored.
For people; The social sector is beset with inadequacies and inequalities. These features are present in many forms, such as inequality of infrastructure, resources, education, employment, development opportunities, etc. This is manifested among the people, societies as well as regions. At the root of these inequalities, more often than not, is the lack of education and accessibility to information. Information technology has the potential of providing prompt and easy access to relevant and quality information and opportunities and occasions to the common man at affordable costs. This is a great tool to bridge the gap and instantly reduce the divide between those who have access to facilities and services and those who do not. This technology has got the potential of proliferating the high-quality services and advanced knowledge for value addition in important matters in the field of education, health, markets, technology, agriculture and a host of other issues. The hitherto restricted treasure of knowledge gets opened up to one and all at the same time, at an equal footing, at a very reasonable cost and with manageable effort. In the present context, there is urgent need to empower the common man with IT in the social sector, and to prevent the syndrome of ‘digital have-nots’.
Existing IT intervention
The present IT intervention in the social sector revolves largely around the NIC’s NICNET connecting the districts. The exercise is well known, and the relevant data can be taken from NIC. However, being designed essentially as an in-house database, the system has not proliferated to the smaller constituent units, and does not interact with the people. For a meaningful and futuristic implementation, we should now look to the village level, and also keep public-system interface as a priority area.
Measures for Strengthening Existing Practices
Since IT grows in clear jumps, the concept of ‘strengthening’ cannot be used in the conventional sense. Such strengthening of existing systems is time-consuming, costly, and can never entirely do away with prevalent handicaps. Considering the overall lifecycles of specific information technologies, in both hardware and software, it is prudent to design new systems. These can be extremely cost-effective, and also raise the level of corporate and societal knowledge to current standards. The new system should be proliferated to the village level (in phases), be as real-time and on-line as possible, with ease of use and maintenance. It should stress on transparency, and save the environment by being largely paperless. When implemented well, it can easily pay for itself by cutting administrative costs, while lowering the overall cost of service delivery.
While generic database engines available in the market can be used in the back-office setup, the front end for the user will be application driven. This will cut down training costs, and also reduce time required for actual implementation. The field data on ambient conditions, non-availability or non-reliabiiity of electric supply / transmission media will be studied, and area-specific designs perfected. In the pilot phases, villages with varying degrees of system-hostility - equipment- and attitude-based will be taken up to gain experience for final implementation. It is desirable to build the system at the village level around the existing school, which already has teachers available. The teacher’s skill-level will be upgraded for IT basics, and application usage. Since the services and the railways have already implemented IT in a big way, resource persons in the village can be ex-servicemen or ex-railwaymen with IT-exposure. In the event of there being no school, the Panchayat house will be used, with the above-mentioned
resource persons. In case resource persons are not available, necessary training can be imparted to suitable person/s recommended by the panchayat.
It is necessary that IT should not create new costs by employing fresh people, and it must be structured as part and parcel of the job. The requirement is to draw a suitable person from the existing setup, and train him for the job. The jobs that IT will create will be in the IT services sector - software, hardware sales and maintenance, and upgradation. Keeping the above in view, the following improvements over the existing system can be achieved after detailed study:
System requirements.Clients: external and internal.System design, networks.Processes, inputs, outputs, replies.System management, maintenance.Feedback.The public interface, its user friendliness.Generation, sharing and using a information.Impact on public and officials, corrections and updation.Innovation, improvement for better results.Making it a way of life for staff, public
Area of Use - Monitoring and Evaluation System
IT can be used for a complete monitoring and evaluation of social sector schemes. Detailed possibilities in each area are listed below, including for regulatory bodies, in order to monitor both the schemes and the revenue needed for their financing.
Regulatory Bodies (e.g., Taxation, revenue collection, transport licensing, etc.):
Providing interface with the people.Information and feedback centres.Registry, receipt and despatch.Feeding the system, the inputs.Processing, delivery and follow-up.Inputs, outputs and reports.Levels of decision-making.Status of disposal and pendency.Monitoring disposals, time limits.Linkage with key functionaries.Decisions and replies; putting online.Representation, queries and appeals.Feedback, impact and corrections.
Development Organizations (e.g., Education, Employment Programmes, etc.)
• Study of a developmental goals.
• Organizational setup to realize it.• Digitization of the setup, linkages.• Interface with the beneficiaries.

• Interface with the people’s bodies.• Flow of information, inputs-outputs.• Analysis, updation, feedback.• Corrections and modification.
Public Utilities (e.g., Health, Electricity, Water, Sanitation, etc)
• Agenda of the utility.• People’s expectations.• Resources, infrastructure.• User charges: rates and recovery.• Providing the services, monitoring.• Redressing grievances, replies.• Quality and competitiveness.• Response, reporting and feedback.
Monopoly services (e.g. Mandi Boards, etc)• Agenda, services systems.• Expectation of clients, users.• Efficacy in services, bottlenecks.• Improvements through digitization.• Inputs, processing and reporting.• Grievance-redressal systems.
• Reply and responses, feedback.• Corrections and updation.• Setting up virtual mandis and commodity exchanges.
Welfare Organizations (e.g., Sainik Boards, Animal Welfare groups, etc)
Interface with target groups, goals.Interface with other organizations.Policies, their implementation, monitoring.Processing and reporting, feedback system.Corrective measures, modification.
Role of NGOs and IT industry
It is important to realize that pure IT organizations cannot conduct effective implementation in the social sector. Non-governmental organizations have the benefit of being close to the people, sharing their experiences and having a feel of the pulse of their perceived needs. At the same time they have the capacity to organize people and also muster assistance from government in their initiatives. NGOs help by working on core issues in the social sector, and focusing to both the government and the people on the pitfalls and the possibilities. There can be partnership between NGOs and IT companies in taking IT to the grassroots.
Focusing Government Initiative
The biggest limitation of a government set-up working in social sectors is the lack of constant presence of its organs at the places where they are supposed to deliver results.

There are issues of staff motivation, skills and information. Consequently, the operation, monitoring and supervision of the activities at the grassroots level needs improvement. Ambitious policies and plans are devised but results do not match targets on account of delayed monitoring, or improper implementation by lower-level functionaries. Leakage of required inputs to non-target groups is another important variable. There are always the plaguing questions of missing links, i.e., low inputs, ill-equipped personnel, poor infrastructure, outdated technologies and inadequate information. Correct and timely feedback thus does not reach the planners and implementers through normal channels, and NGOs fill this vital gap for the government.
Focusing Peoples’ Initiative
Individually and collectively, people have the best historical experience and wisdom to identify about the best options for their development and betterment of the services. What they lack is the timely support from the system, better forward and backward linkages and knowledge about the latest methods of value addition. Those who are able to cope with such issues, have taken initiatives for their welfare and have surprised all others concerned. However, a large section is still struggling with the issues which can easily be solved with the induction and adoption of the tools provided by information technology. People's bodies, such as municipalities, panchayats, town areas, cooperatives, marketing and banking institutions, societies, unions and organizations are to benefit immensely if they go this way. In a way, this is becoming essential because they have to deal with large numbers of clients and with multiplicity of information and data.
Possible Intervention of NGOs
Government organizations are busy with issues of governance. Their main concern is to satisfy the public and have a positive impact on their lives. An objective approach and expert input is required to study the real requirements and to suggest solutions. An outside body will view the entire process objectively, rather than looking at it defensively. While the basic requirement of systems largely remains the same for all kinds of public organizations, the finer differences in their objectives and functions require specific solutions. Keeping this in view, strategies may have to be separately evolved for various kinds of public organizations. While the activities may seem to be similar and overlapping, their nature differs when they are implemented in a particular type of organization.
NGOs can also partner an IT organization in inducting IT in social-sector development schemes, and undertake activities of counselling, enabling and supporting public organizations to go digital.
Suitably equipped NGOs can provide the following services;
• Study of key Issues.• Study of functions and obligations.• Expectations of the public, clients.• Processing, delivery and reporting.• Requirements of policy/statute.• Requirements of public good.• Requirements of transparency.
Systemic strengths and weaknesses.Scope of improvement through digitization.The actual digital system details, including hardware, software, network. The public interface.Psychological factors, management of change.
The clear recommendation for the IT sector is to provide the backbone broadband connectivity to village levels, preferably through private initiatives, or through BOO schemes, and other such vehicles, and create a climate of convenience for wooing service providers. This should be built upon by focusing on strength in HRD aimed at this sector. IT should be used to bring about a quantum improvement in the quality of life of citizens, through committed implementation of e-governance programmes, based not merely on automation, but a re-engineering of the government-citizen contact apparatus. Great potential exists in inducting IT into the agricultural and agro-processing sector, and in implementing genuine e-governance.
Note on Commodity Exchange and Virtual Mandis
In this mode of trading a commodity may be 'bought' but delivered at a future date. For instance, if a trader/farmer quotes Rs 7,000 for a tonne of wheat in December 2002 for a delivery to be made in February 2003, the buyer stands to gain if the price of wheat goes up by February. In case prices fall, the trader/farmer harvests the profit. This leaves no scope for big manipulations. The seller is bound to keep his commitment and release the item at the pre-fixed rate. Forward trading bridges the gap between what the farmers get and what is charged from the consumers. So futures trading helps in stabilizing prices in times of shortage, assuring sales at a steady price, and it ensures a continuous supply of commodities.
The Forward Contracts (Regulation) Act, 1952, governs futures trading in commodities in India. According to its provisions, futures trading in commodities can be conducted only by such Commodity Exchanges, which are recognized by the Forward Markets Commission (FMC) under Section 6 of the Forward Contracts (Regulation) Act and have got specific permission from FMC to launch futures trading in specified commodities.
A list of some functioning commodity exchanges in India is given in Table 12.

EXCHANGE PRODUCTS
India Pepper and Spice Trade Association, Pepper-DomesticPepper-International
KeralaEmail; ipsta(a)vsnl.com
The Bombav Oil Seeds and Oils Exchanqe Ltd..Mumbai. MaharashtraWeb site: http://www.booe.ora. Email: booeind(5)bom3.vsnl.net.in
Castor oil- international, Rapeseed/Musta rd Oil, Sunflower Oil
Castorseed, Refined Sunflower Oil
Groundnut Oil, RBD Palmolein
The East India Jute & Hessian Exchange Ltd. Hessian Jute Goods Jute-NTSDWest Bengal-700001 Raw Jute-TSD SackingVijay Beopar Chamber Ltd., Muzaffarnagar, GurUttar PrudishEmail: vbc(5)nde.vsnl.net.inThe Chamber of Commerce Hapur Gur PotatoesUttar PrudishEmail: coc.haour^oDtonetwork.comBathinda Om and Oil Exchange Ltd. GurPunjabEmail: omexbathinda(a)hotmail.comThe Meerut Agro Commodities Exchange Company (P) Ltd. GurUttar PrudishSOPA Board of Trade Ltd. Madhya Pradesh Email: sbot(a)satvam.net.in/sbot(®mantrafreenet.com
Rapeseed/Musta rd Oil
Rapeseed/Mus tard OilCake
Rapeseed/Mustardseed
Soya Cake Meal Soya Oil Soyabean
The Spices & Oil seeds Exchange Ltd. TurmericMaharashtraThe East India Cotton Association Ltd. CottonMaharashtraEmail: eica(5)bom8.vsnl.net.inThe South India Cotton Association CottonTamil NaduEmail: sicacoimbatore(5)vsnl.comThe Ahmedabad Cotton Merchants Association CottonGujaratThe Central Gujarat Cotton Dealers Association CottonGujaratThe Southern Gujarat Cotton Dealers Association CottonGujaratCoffee Futures Exchange India Ltd. Bangalore Karnataka Web site: htto://64.176.70.72/cofei.htm Email: [email protected]
Coffee-PlantationA
Coffee- Robusta Cherry AB
Raw CoffeeArabicaParchment
Ahmedabad Commodity Exchange Ltd. CastorseedGujaratEmail: info(a)acecastorfuture.com
Kanpur Commodity Exchange Uttar Pradesh Rapeseed/Musta rd Oil
Rapeseed/Mus tard OilCake
Rapeseed/Mustardseed
The Rajkot Seeds Oil and Bullion Merchant Association CastorseedGujaratThe Rajdhani Oils & Oilseeds Exchange Ltd. GurDelhiEmail: raidhanioiKaisatvam.net.in
Source: UNDP Report on Commodity Exchange, 2000

It was surprising to note that Bathinda Om and Oil Exchange Ltd. in Punjab, were willing to exchange e-mails and transact on the Internet.
Punjab should immediately proceed with a commodity exchange framework, with Punjab Agricultural Marketing Board and Markfed, identified as lead agencies, to start the programme. There should be a gradual phasing out of physical mandis as they exist, and replaced by an emphasis on a warehousing system, piloted by the Punjab Warehousing Corporation. Punjab can make tremendous gains with this initiative, cutting out wastage and market congestions, and lowering overall costs.
TRANSPORT
The data on transport statistics are not easily available, and even at the national level, remain a matter of dispute. In fact, it was surprising to note that Economic Surveys of Punjab do not include transport as a sub-head in the sectoral analysis. Estimates for transport output in the country are produced by separate ministries. The data for road transport are released by the Ministry of Surface Transport and for railway traffic by the Ministry of Railways. Both these Ministries question the data for their sectors, released by Planning Commission and the World Bank differs with all of them in this regard. The Transport Sector’, G Raghuram, India Infrastructure Report 2001). We will examine the existing transport infrastructure, the agenda before it and arrive at a blue print for the future.
The average annual compounded growth rate of Gross Domestic Product in Punjab is shown in Table 13.
Table 13Sectoral Annual Compound Growlth Rate of Gross DomesItic Product in PunjabSector Sixth Plan
80-81 84-85Seventh
Plan85-86 89-90
EighthPlan
92-93 96-97
1998-99 1999-2000 2000-01
Primary 5.37 5.24 3.10 3.06 7.02 2.07Agriculture 5.44 5.29 3.07 2.92 7.00 1.97Secondary 5.04 8.65 7.12 11.78 5.90 5.73Tertiary 5.14 5.22 5.79 4.94 7.74 7.14Overall 5.23 5.98 4.83 5.79 6.99 4.78
Source: Economic & Statistical Organisation, PunjabNote: Sixth & Seventh Plans at 1980-81 prices, other at 1993-94 prices
It can be seen, therefore, that the major growth component is in the secondary and tertiary industry sectors at about six per cent and seven per cent respectively. The AACGR of Gross State Domestic Product in Punjab is around five per cent. It can thus be presumed that the transport capacity, both passenger and freight, will have to be doubled over the next decade to accommodate this growth rate.
It is significant that Punjab has one of the highest vehicle density per 100 km of road at 3,102.7; only Delhi, Haryana and Gujarat are higher. Punjab’s capital Chandigarh has the distinction of the national highest in this regard at 2,1587 {Motor Transport Statistics in India, Ministry of Surface Transport, 2000).
The existing transport infrastructure in Punjab is as follows:

The following National Highways serve Punjab (Table 14):
Table 14
NH No. From To Length (kms.)1 Shambu (Haryana
Boundary)Ludhiana - Jalandhar - Amritsar - Pakistan Border
279.42
1-A Jalandhar Tanda - Mukerian - Pathankot Samba(excluding Himachal Pradesh Portion)
104.734
10 Dabwali (Haryana Boundary)
Malout -Abohar - Fazilka (Pakistan Border)
109.06
15 Pathankot Gurdaspur-Amritsar-Zira-Faridkot-Bajakhana-Bathinda-Malout-Abohar-Usmankhera (Rajasthan Boundary)
363.67
20 Pathankot Chakki (Himachal Boundary) 11.975
21 Zirakpur (Excluding U.T. Area)
Mohali-Kharar-Ropar-Kiratpur- GarhaMora (HP Boundary)
76.88
22 Ambala Barrier (Haryana Boundary)
Zirakpur-Kalka (Haryana Boundary) 30.99
Total = 977 kms.
Source: www.Puniabqovt.nic.in. (PWD Department, B.R.)
The major artery is national highway No. 1, also known as the Grand Trunk Road or Sher Shah Suri Marg. Entenng at Shambu, it runs through Punjab, and right accross to the Wagha Border with Pakistan. This connects the major towns of Ludhiana, Jalandhar and Amritsar along with the industrial townships of Sirhind and Govindgarh. A number of state highways also branch of to other major towns, such as Ferozpur, Patiala, Bhatinda, Hoshiarpur, etc.

ROAD NETWORK OF PUNJAB
„ Jammu & Kashmir
PAKISTAN
N
i
CHANDIGARH
M a^n^te Scalc
Rajasthgn
(S) Slate CapiUI
• District HeadquarterDislfict Bcuindary
— Irk f nationalBoundary
»|~|» Malional Hiflhway
Olher Roads
1/Haryana
o p y rig ii (c) Compare Infcbasc Pvl Lie 2D01-D2
Map 1
The total length of these national highways in Punjab is 977 kms. These highways are also of a strategic nature, considering the status of Punjab as a border district, important
*for the defence of the nation. National Highway No. 1 also connects Jammu & Kashmir, approached via Jalandhar and Amritsar. National Highways are maintained by the government of India and serve Punjab well.
State Highways and Major District Roads
These arterial roads, referred to as plan roads, are maintained by the PWD Department of the Punjab Government and are spread over the total length of 7,305 kms. Of these, 2,166 kms are state highways, 1,799 kms are district roads, and 3,340 kms are other district roads. As can be seen from the map, the state highways network is fairly extensive. Some of these roads, owing to their importance, are being elevated to the status of national highways. The important plan roads under this account are likely to be:
• Kiratpur Sahib-Anandpur Sahib-Nangal Road.• Chandigarh-Patiala-Sangrur-Barnala-Bhatinda Road.• Kharar-Ludhiana-Moga-Ferozepur Road.• Ropar-Hoshiarpur-Dasuya-Mukerian-Gurdaspur-Kathua Road.• Jalandhar-Nakodar-Moga-Sangrur-Patran-Narwana-Rohtak-Delhi Road.• Bathinda-Fatehabad Road.

All villages of Punjab are connected by link roads, running for 31,657 km. The standard design is that the link road touches the village, goes around it and leaves to connect the next village. The part of the road going around the village is called ‘Phirni’, with usuallly two or three bus stoppages located at convenient points. Rarely do these link roads enter the village. The village is served by brick-laid lanes that connect to the Phirni.
Railways
There are 3,664 track km. of railway track in Punjab. As can be seen from the railway system map of Punjab, the major double line railway artery runs parallel to National Highway No. 1, all the way from Shambhu to Amritsar. From here there are two main branches, one going towards Patiala, Bhatinda, Abhohar and the other moving towards Moga and Ferozpur. The third branch takes off from Jullundhar and moves towards Jammu. There are many other small branch lines connecting the foodgrain-producing mandis of Punjab, primarily to assist in loading and movement of wheat and rice to other parts of India. The capital city of Chandigarh is connected by a line branching off from Ambala and moving towards Chandigarh via Lalru. One of the major sanctioned projects for new railway works under execution by Northern Railway is the Chandigarh-Ludhiana rail link, scheduled for completion upto Morinda junction by 2003.

There is no planned movement of passenger or freight by using inland waterways. The major river systems of Sutlej and Beas are not found suitable for transportation, the water being effectively used for power generation and irrigation purposes. The well- developed canal irrigation system could have offered some opportunity, but none of the bridges, etc., were designed for permitting any water vessels to move under them. As such transportation by inland watenA/ays in Punjab is negligible, and future growth possibilities uncertain.
Air Transport
Punjab is served by Raja Sansi International Airport at Amritsar and the domestic airport at Chandigarh. There are smaller airstrips at Patiala, Ludhiana, etc., but only Amritsar and Chandigarh are capable of handling large commercial aircraft, with others only capable of small aircraft and helicopters. There are no mass-based air taxi services available in the state. Considering the overall socio-economic scenario and the defence requirements of air space in the border state of Punjab, this sector cannot be banked upon for any mass movement in the near future.
Importance of Road and Rail: An Agenda
Punjab is, therefore, wholly dependent on roads and railways for its transport requirements. It is these two sectors that must provide the necessary transport infrastructure to look after the needs of the state. An agenda for the transport sector in Punjab could be set as follows;
• Considering its length and breadth, it should be possible to move across the state between major towns in three to four hours.
• The state capital houses the legislature, the judiciary and the administrative government centres. In addition, it houses Punjab University, and the Post Graduate Institute of Medical Education and Research. It also has engineering, architecture, medical and management institutes which attract students and professionals.
Thus movements to and from the state capital to other parts of the state will continue to remain important. However, Chandigarh is situated at the edge of the state and, therefore, transport infrastructure must provide a quick and reliable mode, that ensures that people can go back after business in the state capital in the same day.
• One of the largest causes of unnatural deaths in Punjab is road accidents. Transport infrastructure of the future must ensure quick, safe and reliable movement, while enhancing overall speed.
• Punjab will continue to need a large amount of coal for feeding its thermal power plants. Other bulk requirements would remain in the areas of cement, steel and fertilizer. The transport sector should be capable of moving these large quantities towards the consumption centres.
• Considering the strength of Punjab in agriculture, and the push towards agroprocessing, the transport sector must facilitate the movement of processed food out of the rural areas to near urban areas for final processing and/or consumption

food. There will also be need to move these quickly out of Punjab towards consumption areas in other parts of India. There would call for the availability of refrigerated containers, called ‘reefers’.
• With the advent of virtual mandis, foodgrains and other agricultural products will need to be moved from villages towards aggregation centres, for movement in bulk. The roads must be capable of handling container trucks to facilitate the same.
• With the rapid urbanization of Punjab, expected to touch 43 per cent by 2020, it would be desirable to put in place frequent services between major towns, and suburban transportation systems in the bigger towns of Amritsar, Jullundhar, Ludhiana and Patiala.
• Cycling remains an important mode of transport for distances upto five to six kms. While being good for the health, it also helps protect the environment. On pre-identified routes, leading from surrounding villages of the major towns, dedicated cycling tracks must be put in place to facilitate commuting by cycle. This will also provide market-demand for the well-developed cycle industry of Ludhiana.
• Considering the large number of accidents on the road and related deaths and increasing instances of cardiac diseases, trauma-management will become important in the future. Patients will need quick attention, and transport services should be in place to respond to these health emergencies in the future.
With this agenda for the transport sector, a blueprint for future development can be laid down.
Road Sector
The plan and link-road network is serving Punjab well. However, the design of these roads and technical specifications do not permit regular movement of heavy vehicles. As a result these roads usually become unserviceable during the monsoons, and consume large amounts of money in their maintenance. It is desirable that the concept of life-cycle costing instead of immediate cost should be applied, which will show that the long-term cost of building a more expensive road may be lower than a cheap road with high maintenance cost.
It should also be appreciated, that as in the telecom sector, in the_road sector too, the last mile is as important as the major back-bone. It is found that while much attention is being paid to national highways and state highways, the links of these roads to the rural areas leave much to be desired. In a future scenario, where the Punjab Government is targeting growth in agro-processing industries, the village has to be well linked and integrated into the road transport infrastructure, through wider roads that are capable of taking heavier axle loads than at present. The link road also witnesses a large movement of tractors. The tyres of these vehicles are intended for off-road use and, therefore, exert greater wear and tear on metal roads than other vehicles. Therefore, it is all the more important that the village roads are designed well and built to iast for taking these demanding loads. A number of road improvement projects are in hand, with commissioning promised shortly (Table 15).

Major Road Construction Projects near Completion Cost Rs. in lakhBridge over Choe on Badowan Sardulpur Sakrulli Paldi link road
118.97
Bridge over Langerpur choe on Dasuya Rampur road 115.00Replacement of old submersible bridge on Patran-Moonak Tohana Road
130.00
H.L. Bridge over Sutlej river creak crossing Pala Megha Pir Berian Road
97.64
H.L. Bridge over river Ghaggar near Makraur Sahib 147.05Bridge over Sirhind Canal x-ing Ludhiana Chandigarh road near Neelon
233.44
H.L. Bridge over river Ghaggar on Annadana to Nawangaon link road
196.96
Southern Byepass at Ludhiana. 850.00Ring Road around Hoshiarpur Phase II 250.72Ring Road around Hoshiarpur Phase II 356.11Raising/widening Hussainpur Saidpur Mangupur Road Km 0.01 to 13.72
228.02
Improvement of Dasuya Hoshiarpur Road 113.62Raising Gurdaspur Dera Baba Nanak Road 93.20Raising Jalandhar Hoshiarpur Road 68.88Raising Hoshiarpur Phagwara Road (Km 19.20 to 21.00)
80.00
Raising/strengthening Ropar Bela Road (4.00 Kms) 75.00Raising/Strengthening Dehlon Raipur Gujjar Pakhowal Road 108.00
Source: WWW.Puniabaovt.nic.in. (PWD Department, B.R.)
Private Participation in Roads
Punjab has invited private parties to participate in the road sector, and has defined a policy with the following salient features;
• The highway sector has been declared as an industry to enable easy borrowing terms and floating of bonds.
• The provisions of MRTP Act have been relaxed to enable large firms to enter the highway sector.
• Customs duty on import of construction equipment has been reduced and procedures streamlined.
• For projects taken up on BOT basis, the state government will permit entrepreneurs to charge toll that market forces will bear.
• The land will be made available at a nominal lease to the entrepreneur taking up the projects.
• The entrepreneur will be permitted to exploit commercial potential of the sites under rail overbridges for a period of 30 years.
• Any other compensation package can also be considered to make the projects viable.

other features are:
• Invitation of ‘Licence Period’ competitive bids• Government will bear the cost of pre-feasibility studies, and acquisition of land for
the project will be time-bound. The government may acquire the land through negotiations with the land-owner
• Suitable provision for adjustment of the toll-fee structure for inflation/exchange rate variations.
• Permitting development of highway facilities alongside, to provide predetermined revenue sources for the entrepreneurs within the framework of Rules/Acts.
• Dispute resolution under the Indian Arbitration Act, 1996, in the event of losses arising out of exceptional circumstances or force majeure, the government may suitably compensate the entrepreneur on the basis of fair and balanced allocation to risks.
It must be pointed out that there is the usual misconception at work about the role of the private sector in this area. The Government of Punjab says that ‘due to resource crunch, it has not been possible to upgrade road infrastructure in the state commensurate with the ever increasing traffic volume’. The issue is not resource crunch, but the absence of a sound technical and economic basis to road sector policy. Under such conditions, the private sector will conduct ‘cherry picking’, and leave the unprofitable roads in the government sector. The clause of compensating the entrepreneur on the basis of risk is particularly dangerous and amenable to misuse. If the risks are to be borne by the government, then what is the role of private business? A number of projects have already been proposed on the Build-Own-Transfer Model (Table 16).
Table 16
Name of Bridge Estimated cost (Rs. in lakh)
District RoparBridge over Kishanpur choe in Km 19 on Ropar Balachaur road 127.00Rail overbridge at level crossing No. 24-B at Morinda on Sirhind-Nangal Dam Rail Line(Section crossing Ludhiana-Chandigarh road(SH-18) in km 65.100
1756.72
H.L. Bridge over river Sutlei at Kiratpur Sahib 3500.00District LudhianaRail overbridge Ludhiana-Dhuri rail line in replacement of level crossing No. 2A/2 near Preet Palace at Ludhiana
2204.00
District MansaRail overbridge at Mansa on Mansa Sardulgarh Sirasa Road 1000.00District BathindaRail overbridge at Bathinda on Bathinda Sirsa Road 1000.00District Fatehgarh SahibRail overbridge on Sirhind Chuni Road 335.00District SangrurJandali Bridge near Ahmedgarh over Bathinda Branch 70.00Rail overbridge on Dhuri Byepassa) Over Dhuri Ludhiana road 500.00b) Over Dhuri Barnala Road 500.00District GurdaspurRail overbridge on Amritsar Pathankot Road in Gurdaspur town 1000.00H.L.Bridge over River Beas on Gurdaspur Kathua Road, 4575.00H.L.Bridge over River Beas on Gurdaspur Mukerian Road, 3550.00

District JalandharH.L.Bridge over River Sutlej 24 span 25 mtr. each on Mehatpur Sidhwan Jagraon Road
4000.00
H.L.Bridge over Sutlej parallel to Rail-Road bridge 24 span 25 mtr. each near Gidderpindi on Jalandhar Makhu Road
4000.00
District NawanshahrH.L.Bridge 24 span 25 mtr. each including guide bund, etc., on Rahon Mattewara Ludhiana road over River Sutlej
4000.00
H.L.Bridge 24 span 25 mtr. each including guide bund etc. on Rahon Machiwara road over river Sutlei
4000.00
District PatialaRail overbridge 22 No.Phatak Patiala 1500.00Rail overbridge in Rajpura Town 1500.00District AmritsarRail overbridge on Amritsar Batala Road near Verka 1200.00District FaridkotBridge near Abohar Branch on Mukatsar Malout road 60.00District KapurthalaRail overbridge at Phagwara on Phagwara Nakodar Road. 1000.00Total 41699.34
Source: ivivw.Puniabgovtnic.in, (PWD Department, B.R.)
Punjab should propose maximum rail-bridge projects, since, according to a recent policy directive of the Ministry of Railways, they will provide the required 50 per cent of the project cost for all such proposals (Table 17).
Table 17
Name of Road Estimated Cost (Rs. in lakh)
District LudhianaNorthern Bypass coonnecting Ludhiana-Ferozepur road to Ludhiana- Jalandhar Road
1000.00
Widening/Strengthening of Ludhiana-FerozepurRoada) Four laning Ludhiana Mullanpur Section 2000.00b) Widening/Strengthening of Mullanpur Jagraon section 1000.00Four laning of Ludhiana-Chandigarh road 40000.00District HoshiarpurWidening/Raising of Hoshiarpur-Dasuya Road with H.L. Bridges on choes 2000.00District FaridkotLudhiana Moga road Section Ajitwal to Moga 1000.00Four-laning Moga bypass including railway overbridge on ludhiana- ferozepur railway line
1400.00
Four-laning bypass at Mukatsar 200.00District SangrurAmargarh bypass (23 wide) including cost of land 100.00District GurdaspurImprovement of Batala-Beas road (Laying B.M. and P.C.) 200.00District JalandharFour-Laning Jalandhar Kalassanghian Tashpur road Km 0 to 32.10 3200.00Four-Laning Phagwara Nawanshahar Balachaur road Km 0 to 48.73 4880.004-Laning of Jalandhar Kapurthala Makhu Road 4720.00

District NawanshahrNawanshahar bypass 1500.00District PatialaFour-laning Bahadurgarh-Rajpura road 1500.00Raising BanurTepla road 700.00Stg. Patiala-Khanauri Road 60.00District AmritsarFour-Laning of Amritsar to Rajasanasi road(Airport) 700.00Additional bypassesBypass at Banga 1000.00Bypass at Phagwara 1000.00Bypass at Balachaur 1000.00Inter District RoadsFour-laning of Zirakpur Patiala Sangrur road 3440.00Ropar Nawanshahar Phagwara Road 3173.00Kharar Morinda Ludhiana Jagroan Moga road 3744.00Total 79517.00
Source: www.Puniabaovt.nic.in, (PWD Department. B.R.)
Efforts are also under way to obtain assistance from multi-lateral agencies for four-laning projects, valued at Rs 1,600 crore. These include Zirakpur-Patiala-Sangrur, Rupnagar- Nawanshahr-Phagwara, and Kharar-Morinda-Ludhiana-Jagroan-Moga corridors.
Cycle Tracks
Punjab uses the cycle, and this healthy habit should be encouraged. From about 10 km from major towns, dedicated cycle tracks should lead in, from multiple radials selected on the basis of settlements nearby. At present, the cyclist shares the national highway or district road with heavy and medium vehicles. He risks fatality, and is forced off the road quite often by motorized vehicles. Cycle tracks will relieve road congestion, reduce pollution, and keep up a healthy practice at a negligible cost to government. With the provision of these tracks, demand for Punjab’s indigenous cycle industry will also increase.
Fund Generation
Collating funds requirements, it is seen that about Rs. 2,800 crore are needed to upgrade the road infrastructure to desirable standards. The toll-road model is a bag of mixed success, and the initial euphoria over the scheme has been much tempered. While efforts to attract private investment should continue, for Punjab, it is suggested that local taxation on petroleum products should be considered as a route for capital building. The consumption of motor spirit (petrol) and high speed diesel was 5,97,130 and 25,08,438 kilolitres respectively in 2000-2001. {Economic Survey o f Punjab). There is thus a possibility of raising Rs 300 crore per year by imposing a special cess of just one rupee per litre. The cess should be deposited in a non-lapsable Road Development Fund, which would provide the required capital inflow over the next ten years.
Railway Sector
The railway system should open up three main arteries connecting the rest of the state with Chandigarh:

• Chandigarh-Lalru-Rajpur-Patiala-Sangrur-Bathinda-Malout-Abohar.• Chandigarh-Morinda-Samrala-Ludhiana-Jagraon-Moga-Talwandi-Ferozepur.• Chandigarh-Ludhiana-Phillaur-Phagwara-Jalandar-Amritsar.
For this, two projects have to be considered;
• Completion of the sanctioned work of Chandigarh-Ludhiana corridor.• Fresh sanction and completion o f Lalru-Rajpura link.
Punjab should immediately lobby with the Ministry of Railways in this regard. While the target for connecting Chandigarh to Morinda has been laid down as 2003, the final leg to Ludhiana should be commissioned by 2005. For this, land acquisition and other assistance from Punjab should be provided expeditiously.
The railways should also sanction afresh and commission by 2005 the Lalru-Rajpura link, techno-economic surveys for which have already been done.
Table 18 lists proposals for railway development along these corridors.
Table 18Conceptual Framework for Railway Development along Different Corridors
(With diese traction), (at current prices)Corridor Phase 1 (2005) Funds needed
(in Rs.)Phase II (2010) Funds needed
(in Rs.)Chandigarh-Abohar
CompleteLalru-RajpuralinkUpgrade Rajpura-Abohar to 110 kmph
100 crore
100 crore
Doubling ofChandigarh-Bathinda
400 crore
Chandigarh-Ferozepur
CompleteChandigarh-Ludhiana
Upgrade Ludhiana- Firozepur to 110 kmph
250 crore (already sanctioned by Railways)
100 crore
Doubling ofChandigarh-Ludhiana
Doubling ofLudhiana-Firozepur
200 crore
200 crore
Chandigarh-Amritsar
CompleteChandigarh-Ludhiana
Alreadyaccountedabove
Line capacity enhancement works on Ludhiana- Amritsar
100 crore
Considering the power-deficit situation in Punjab, it may be desirable to plan for diesel traction mode for train operation on these corridors. The popular perception that electric traction is superior to diesel is not correct. The whole of US and Canadian system is still based on diesel traction. The choice of traction is a techno-economic variable, and should be based on a rational analysis. Considering the overall energy situation, and the

type of requirements in Punjab, it may be desirable to move with the diesel mode for the present on these alignments. This will also lower the cost by upto one crore rupees per km of track.
In Phase I, the funds requirement is Rs 550 crore, out of which Rs 250 crore is already committed by the Railways. In Phase II, the need is for Rs 900 crore. Over the next eight years, fresh funds needed are thus about Rs 1,200 crore.
According to the Railways Act, no local taxation can be applied upon railway services, unless notified by the Central Government, but the possibility of this nevertheless exists. Punjab should propose raising half this sum through a local service tax to be recovered from passengers, originating journeys from within Punjab. The potential to raise fares exists in Punjab, where ticketless travel is a rare phenomenon. A comparison of current road / rail fares is quite revealing (Table 19).
Table 19__________________ Comparison of Current Road/Rail Fares__________________
Corridor IVIail Rail Fare (in Rs.) Ordinary Bus Fare _____ (in Rs.)_____
Chandigarh-Bathinda 58.00 99.00Chandigarh-Ferozepur 64.00 101.00Chandigarh-Amritsar 62.00 102.00
Thus, bus fares are about 75 per cent higher than rail, and there exists a possibility of increasing rail fares in Punjab through special purpose taxation, without substantially affecting the travel mode.
The Ministry of Railways should be negotiated with to collect the tax and credit it to a Punjab Rail Development Fund to be maintained by them and used for the development of the railway infrastructure in Punjab. It can be so negotiated that the Ministry of Railways would give a matching grant every year, to develop rail corridors as outlined above. Since nowadays Railways ticketing is networked, and a ticket can be purchased from any station, and even on the Internet, special procedures will need to be evolved for crediting the money to the fund. However, since it is already computerized, it should not be difficult to implement it on the reserved segment. Unreserved sales will take place from stations within Punjab, and this can be accounted at these very stations.
At current traffic levels, a 10 per cent surcharge would raise about Rs 60 crore every year, and with a matching support from the Indian Railways, rail development in Punjab can proceed on schedule. It may also be mentioned that the infusion of this investment in the transport sector will lead to large-scale multiplier effect on the overall growth of Punjab’s economy.
Multi-modal Approach
There is a prevalence of transport myopia in our planning paradigm and this flows from a compartmentalized and sectoral approach to transport infrastructure. Various modes plan future projects in isolation, and fail to achieve a synergy that would have come out of a multi-modal approach. When a passenger steps out of his home, he uses a pavement to walk on, takes a bus to the railway station, covers part of his journey by
trains and may use a taxi to reach his final destination. It is evident that to the passenger, all are modes of transport and he uses them one after another in the same journey. Problems arise when the planning process fails to see this inter-connection of various legs of a journey, and thus cannot provide a well co-ordinated answer to the passengers’ itinerary. This myopic view also causes an adverse effect on the safety aspect. It is of no comfort to the user that an accident is more or less likely to happen in this or that mode of transport. The user would like to be uniformally safe over the various modes that he uses.
Having said that, however, analysis reveals that the roads remain the most unsafe mode of transport. Despite having 1/7' the vehicles per km, road deaths per 10,000 vehicles each year are more than 14 times in India, as compared to United Kingdom. (Ministry of Surface Transport 1998). Poorly maintained roads, in addition to causing accidents, also cause heavy wear and tear on vehicles, and the goods in transit. It has been estimated in various reports that the loss being incurred in such wear and tear is nearly two per cent of Gross Domestic Product. The impact on pollution is also high in such cases. Bad roads and the wear and tear on vehicles lead to low average speeds, subsequently reducing the productivity of vehicles. Users and planners alike in Punjab are aware of these problems. It is essential that we perceive the concept of users, requirements and plan for servicing these in a holistic and multi-modal manner.
Passenger Transport Plan
There are six important movement arteries for passengers in Punjab.
1. Chandigarh-Rajpura-Patiala-Bathinda-Malot-Abohar.2. Chandigarh-Morinda-Samrala-Ludhiana-Jagram-Moga-Firozpur.3. Chandigarh-Ludhiana-Phagwara-Jalandhar-Amritsar.4. Rajpura-Sirhind-Govindgarh-Ludhiana-Jalandhar-Amntsar.5. Amritsar-Tarantaran-Patti-Jeera-Firozpur-Fazilka.6. Chandigarh-Rupnagar-Nawanshahr-Hoshiarpur-Pathankot.
Each of these corridors represents distances more than 200 km, with an average of 130 km. The movement represents cross-state moves and is presently largely road based, except on the Rajpura-Ludhiana-Jullundhar-Amritsar corridor, where competing rail services are well patronized. The last corridor is not amenable to rail service, since it is a hilly terrain and would require large infusion of capital for starting fast rail services.
The smaller segments of passenger moves are less than 200 km, and essentially move as a bridge between these major corridors. It is, therefore, suggested that the major corridors should provide reliable and fast rail-based service for moving across the state and between towns on these corridors. The cross-state services should move in the morning towards Chandigarh from Abohar/Firozpur/Amritsar, and return in the evening. Maximum travel time should not exceed about three hours or so. The stoppages on these fast cross-state services will be at the major towns. Suburban services on thesecorridors, stopping at every station, will provide connection to these services. Thefrequency of the suburban services can be planned to run at about an hourly interval in the morning and evening and a few services in the intervening hours. Services on less than 100 km segments between major corridors will be looked after by the road sector.

The following essentials should be provided for:
• Common ticketing■ A ticket purchased for a journey which entails travel on both road and rail
modes will be issued as a single ticket providing access to both.■ An authority to look after road fares, and the issue of joint ticketing, will be
formed. A framework to share revenues for railway journeys will need to be decided.
• Multi -modal terminals■ Road and rail terminals at major towns to be co-located in a manner
facilitating easy transhipment. Such services as rest rooms, parking, refreshment areas, etc., can be planned jointly for both modes.
• Use of information technology■ System information, tracking of road transport moves through GPS,
issuing of smart cards, acceptance of credit cards, etc., to be implemented on the network to help customers.
Freight Sector
On date, multiple handling of commodities, rising wastages, and transport cost characterize the freight sector. For example, harvested wheat is stocked in the farmer’s house, then brought to the mandi and dumped, then bagged, then transported to a godown, then taken to the railway station and dumped, and then loaded into railway wagons. The reverse is also true for inward commodities for consumption in Punjab. The same multiple handling is true of cement, steel, fertilizers, coal for public use, etc.
In keeping with the thrust sector of the Government of Punjab, a transport system will have to meet the requirements of agro-processing industries too. This will demand assured transit for rural and semi-urban areas to the consumption centres in Punjab and outside, and may also need refrigerated wagons.
Need For Warehousing
In keeping with the need to minimize handling, correctly-sized warehouses will have to be established at the consumption/production centres, and at major railheads in Punjab.
The farmers can be encouraged to bag the wheat at source in their farms, and stock them at the local warehouses. These local warehouses can be reasonably priced and scientifically designed to ensure the stocking of foodgrains, and assist in subsequent movement directly to consumption centres/railheads. At the railheads, commodities moving in for consumption in Punjab can be stocked in the warehouses linked to the rail terminals. Commodities can move directly from these warehouses to the consumption points. The Railways, being the custodians of bulk transport and also having land at most places, should invite the private sector to participate in the management of such warehouses, attached to railheads. It is learnt that schemes are already being readied in the Ministry for such an endeavour.

To implement this paradigm of decreased handling, lower wastage and lower overall cost, the freight transport and distribution sector will have to be backed by a reliable IT and Telecom setup. It has earlier been mentioned that the physical market or mandi, should be replaced by a virtual market, where commodity exchanges permit trading on line. The farmer in the village, or a co-operative setup will trade directly with the buyers. At the same time, the village co-operatives and other local bodies and individuals will also be in a position to source their requirements of other commodities, which may be stocked at the railheads, etc.
These schemes can be implemented as pilot projects in one district in the first phase and then proliferated quickly over the whole state. The advantages that will accrue in terms of stemming wastages and lowering costs will bring about a monumental change in the method of movement of distribution of commodities. Additionally, it will open up the entire world to Punjab villages to trade with and become an engine for development.
The implementation of this system will also reduce the overall transport cost by cutting down superfluous moves. For example, when commodities move from the village, during the multiple-handing cycle, they may be travelling repeatedly over the same stretch. In the proposed commodity-exchange, in a virtual mandi situation, there will only be precise movements from one point to another without any repetitive or unnecessary movement. While lowering the cost of transport, this will also reduce the congestion on the road network.
It is also seen that tractors, which are essentially designed for off- road application, move on the roads and provide, initial 15 km. approximately of transport, when moving to the mandi. The design of their tyres places heavy stress on the road surface leading to damage both to the tyre and the road. In the proposed setup, freight movement will be through vehicles designed for this purpose, which will ensure that roads last longer.
Move Towards Containerization
Movement by containers will be the standard scheme in the future. The proposed setup will start facilitating the induction of this modern system in commodity-transport in Punjab. Refrigerated containers, called ‘reefers’, are now commonly available and can become helpful too in the development of the agro-processing industry in Punjab. Containers will also ensure a seamless movement from production to consumption centres, whether intra-state, inter-state or international.
CONCLUSION
Punjab has pride of place among the states of India and its economic success story has stood out as an example to others. In recent times, the going has not been good, and it is high time that the state moves once again towards a cycle of sustainable growth.
It is anticipated that Punjab will move towards more economic cropping patterns, and into the area of agro-processing. This will be coupled with a conscious effort to develop the knowledge-base in information technology, and other segments of the tertiary sector.

Punjab should announce putting in place an infrastructure base that will help to meet these ambitious requirements. It is recommended that:
1. The state should give up a subsidy-based approach and move towards a technocommercial basis for infrastructure projects.
2. Realize that users are willing to pay for services, provided the overall quality of services meets their requirements. People would rather pay for good services, than suffer a defective free service.
3. Major reforms should be brought through people’s participation, not governmental diktat.
4. Induction of new technologies should not give rise to new bureaucracies, but should result in enhanced service-deliveries through process-re-engineering.
5. While the rural sector will remain important, a policy shift emphasizing the increasingly urban character of Punjab should be built into the decision- making processes.
While specific recommendations with regard to Energy, IT and Telecom and Transport have been detailed, it is strongly recommended that the above-mentioned paradigms should be embedded in the infrastructure-planning process. This will ensure the resurgence of Punjab’s infrastructure, propelling it onto a sustainable growth curve.
References
Annual Report: Ministry of Power 1999-2000
Economic and Statistical Organisation, Punjab
Julka, A.C.: 'Privatization of Passenger Road Transport in Punjab: Scope and Modalities’, unpublished report submitted to Punjab State Electricity Board by the Centre for Research In Rural and Industrial Development (CRRID), Chandigarh
Rangenkar, S.B. (1990): 'Power Economy of Punjab and its Border Areas: A Study Based on Social Priority’, unpublished report submitted to the Planning Board, Government of Punjab by the Centre for Research In Rural and Industrial Development (CRRID), Chandigarh
UNDP Report on Commodity Exchange, 2000
WWW. ficci. com/ficci/econo-upda/power. htm
WWW. planningcommission. nic. in/sebch5. htm
www.Punjabgovt.nic.in, (PWD Department, B.R.)

Chapter 8 URBAN DEVELOPMENT
TRENDS IN URBANIZATION
Punjab is in the midst of urban transition. At the dawn of the twentieth century, only 12.46 per cent of the total population of the then pre-partition united Punjab was urban. At the beginning of the twenty-first century, the urban population of Punjab has increased to 33.95 per cent, against 27.78 per cent for the country as a whole. Punjab is now the fifth major urbanized state of India after Tamil Nadu (43.86%), Maharashtra (42.40%), Gujarat (37.35%) and Karnataka (33.98%). Table 1 and Figure 1 present the trends in urbanization in Punjab.
Table 1
Year Totalpopulation
Urbanpopulation
Percentage of urban population
Decadal growth of urban population (%) / absolute
Total number of UAs/ towns
Annualcompoigrowth(ACGR
indrate
(%)Total Urban
1951 9,160,500 1,989,267 21.72 20.02/331,853 110 - -
1961 11,135,069 2,567,306 23.06 29.06/578,039 106 1.96 2.781971 13,551,060 3,216,179 23.73 25.27/648,873 106 1.98 2.271981 16,788,915 4,647,757 27.68 44.51/1,431,578 134 2.16 3.751991 20,281,969 5,993,225 29.55 28.95/1,345,468 120 1.90 2.572001 24,289,296 8,245,566 33.95 37.58/2,252,341 157 1.82 3.242011* 29,088,860 11,344,249 39.00 39.00/3,098,683 - 1.82 3.242021* 34,836,818 15,607,417 44.80 44.80/4,263,168 - 1.82 3.24
Source: Census of India 1951,1961,1971,1981, 1991 and 2001 Note: ‘ Projections; Based on ACGR of 1991-2001 decade
Today, one out of every three persons in Punjab Is urban by residence. It is the most urbanized sate of the region and is ahead of Haryana, Jammu & Kashmir and Himachal Pradesh. The ACGR of the urban population is higher than that of the total jDopulation.
This has resulted in high population density in urban areas. A number of towns/urban agglomerations have come up during 1991-2001 and distance between towns has decreased due to growth of new towns and expansion of urban area limits. The state has thus witnessed a rapid growth in urban population due to migration from rural to urban areas in search of employment opportunities, health and educational facilities. There was an addition of 22.5 lakh people in urban areas in the decade of 1991-2001, against 13.4 lakh in 1981-91.
The growth of urban population in the various size-categories of towns shows an interesting trend. Large cities and towns (class I and II) have been increasing at a faster pace with a larger population base. Table 2 and Figure 2 depict the growth of urban population in different size-categories of cities and towns in Punjab from 1951 to 2001.

Figure 1Decennial Variation of Population in Punjab
400
350
CLoQ.
348.37
290.89
COO) o>0 5
OOCM
Years
• o
o<BQ.
S Total Population I Urban Population I Rural Population
Source; Same as in Table 1
The class I and II towns are likely to grow faster and become over-crowded with higher population densities. Since 1951, Ludhiana city has witnessed a virtual explosion in population growth. During 1981-91, it recorded a growth rate of 71.77 per cent, the third highest among metropolitan towns in India. In 1991, Ludhiana became the first million- plus metropolitan city of Punjab. Amritsar too has acquired metropolitan status and has become the second metropolitan city of the state. One, out of every six urban dwellers (16.92%) in the state, resides in Ludhiana city and one out of every nine urban dwellers (11.83%) in Amritsar city. It is significant that three out of every ten urban dwellers (29.23%) in the state reside in these two metropolitan cities. Ludhiana city has a disproportionately high density of 8,755 persons per sq km, only slightly lower than Delhi.
Table 2
Years Class 1 Class II Class III Class IV Class V Class VI All Classes1951 3
[33.11](658,725)
2[7.73]
(153,719)
17[26,17]
(520,558)
20[14.44]
(287,223)
36[13.18]
(262,197)
2[5.37]
(106,845)
110[100.00]
(1,989,267)1961 4
[38.25](981,890)
5[10.15]
(260,707)
23[28,11]
(721,684)
20[10,44]
(267,913)
35[10.38]
(266,439)
19[2.67]
(68,673)
106[100.00]
(2,567,3061971 4
[40.52](1,303,128)
8[15.84]
(509,389)
2[22.20]
(714,176)
31[13,32]
(428,413)
29[6.84]
(219,911)
12[1.28]
(41,162)
106[100.00]
(32,161,791981 7
[46.38](2,155,714)
10[14.39]
(668,780)
27[20.24]
(940,482)
36[11,28]
(524,505)
40[6.50]
(301,905)
14[1.21]
(56,371
134[100.00]
(4,647,757)1991 10
[54,16](3,246,224)
18[19.91]
(1,193,171)
25[12.92]
(774,453)
46[10.82]
(648,230)
14[1.72]
(102,945)
7[0.47]
(28,202)
120[100.00]
(5,993,225)-2001 14
[58.38](4,814,405)
19[16.45]
(1,356,386)
35[12.50]
(1,030,623)
54[9.82]
(809,366)
28[2.52]
(207,891)
7[0.33]
(26,895)
157[100.00]
(8,245,566)Source: Census of India, 1951,1961,1971,1981, 1991, 2001Note:- 1) Number of towns in each category (without bracket),
3) Total population in each class ( )4) Size of population:Class 1 = 100,000 and above Class 11 =Class III = 20,000 - 49,999 Class IV =Class V = 5 ,0 00-9 ,99 9 Cass VI =
2) Percentage population in each class [ ]
50,000 - 99,999 10 ,000- 19,999 Below 5,000

Increasing urbanization and the consequent concentration of urban population in class I and class II cities needs to be viewed with concern by urban policy makers. The disproportionate increase in population in these towns in particular and in the other size- categories in general has created huge deficiencies in such civic services, as water supply, sewerage, solid waste management and urban infrastructure, such as housing, transport and roads. Land is becoming scarce in towns and consequently the problem of housing is acquiring serious proportions. Provision of urban basic amenities and upgradation of existing infrastructure for additional urban population has become a challenging task.
Figure 2Decennial Variation of Class-wise Urban Population in Punjab (%)
1951 1961 1971Years
1981 1991 2001
•Class •Class II Class III Class IV Class V' •Class Vi' •Urban Population
Source; Same as in Table 2
Analysis of urbanization in various districts does not present a uniform pattern. Table 3 depicts the district-wise trend of urban population in Punjab. It is evident that Ludhiana, Jalandhar and Amritsar are the top three urbanized districts and Nawashahar the least urbanized district of the state with only 13.80 per cent of population being urban. It must be noted that the districts with a low level of urbanization have started experiencing a decennial rate of growth in population that is as high as in the highest urbanized districts and even higher (Mansa and Fatehgarh Sahib).

Table 3Percentage of Urban Population to Total Population in Districts
Districts Percentage of urban population to total population in district
Decadal growth of urban population (%)
Faridkot 32.95 (2.50) 33.89 (2.27) 24.91Kapurthala 25.76 (2.78) 32.59 (2.97) 47.14Rup Nagar 25.82 (3.88) 32.46 (4.37) 55.11Bathinda 26.98 (4.43) 29.78 (4.27) 32.36Sangrur 24.80 (6.97) 29.26 (7.09) 39.91Fatehgarh Sahib 22.17(1.68) 28.08(1.84) 50.26Firozepur 25.70 (6.21) 25.81 (5.46) 20.94Muktsar 23.40 (2.55) 25.81 (2.40) 29.44Gurdaspur 21.99 (6.45) 25.46 (6.48) 38.15Mansa 14.85(1.42) 20.68(1.73) 66.84Moga 19.13(2.48) 20.04 (2.16) 19.38Hoshiarpur 17.10(3.71) 19.66 (3.52) 30.84Nawashahar 11.00 (0.98) 13.80 (0.98) 38.49Punjab (Total Urban) 37.58Source: - Census of India 1991 and 2001Note: - Figures in parenthesis indicate percentage of urban
total urban population of the statepopulation of the district to
Analysis of the spatial pattern of urbanization reveals a trend towards ribbon- deveiopment along the nnajor transport corridor such as the Grand Trunk Road (GTR) that acts as the economic spine of the state. Three corporation towns of Punjab are situated on GTR. Urbanization in the state is developing as a corridor, creating a linear pattern running from southeast to northwest with large concentrations of population in class I and class II towns. There is a haphazard growth of slums and large-scale migration is unabated. It is creating physical, demographic and environmental imbalances in the state and generating demand for upgradation of the urban infrastructure and civic services. Presently, the urban infrastructure is in bad shape. It is the worst in small and medium towns. City governments are financially weak because of a host of reasons and are unable to provide adequate services for the growing needs of the citizens. The cities in Punjab, with poor infrastructure, may become unlivable and unproductive. Prioritization of development of small and medium towns/ viable regional growth centres, convergence of programmes to improve physical, social and economic infrastructure are essential, keeping the future scenerio of urbanization in view.
The major concern at present is the critical gap in demand and supply of basic civic services in growing urban areas. Despite augmentation of basic services, housing and urban infrastructure, deficiencies in quantity and quality persist. A higher growth of the state economy will require strong urban-infrastructure support and quality services. The strategies for urban development need to target 100 per cent coverage of urban population with supply of safe drinking water, upgraded sewerage facility, 100 per cent lifting, disposal and treatment of garbage and better housing facilities by the end of the Tenth Five Year Plan. The existing concentrated urban growth would need to be deflected through the development of smaller urban areas that will minimize the flow of

migrants to larger cities. The construction of roads connecting large and small towns and even villages with an adequate and efficient transport system will help to decongest larger urban areas. People will find affordable housing in peripheral towns. This is possible if satisfactory infrastructure with efficient surface transport for commuting is available.
The productivity of cities also depends upon the workforce. Migrants constitute the major workforce. Their contribution to urban productivity is significant, but unable to find a proper living space, they become a burden on the urban infrastructure, as they put up temporary and illegal structures on private and public lands commonly known as slums. The slum and shanty settlements in and on the periphery of towns become a major burden for the urban local bodies (ULBs), as such services as drinking water supply, sewerage and sanitation are provided to them with no or little cost-recovery. The migrant workforce should be provided proper living space and environment for a harmonious growth of population, settlements and resources in urban areas.
Cities are engines of economic growth as they contribute more than 60 per cent of the state domestic product (SDP) in Punjab. With the advent of economic reforms, liberalization and globalization, cities are emerging as important reservoirs of employment and providers of health services, higher education and centres of art and culture. But this positive role of urbanization is overshadowed by the deteriorating urban infrastructure and civic services, and substandard housing. The situation calls for innovative measures for urban development, housing, efficient delivery of services and bridging gaps between demand and supply, starting from small and medium towns to class I and class II towns.
The negative impact of urbanization needs to be mitigated by strategies addressing the major constraints in the provision of urban basic civic services, housing, slum development and poverty alleviation. The state government should prepare an urbanization strategy encompassing an area-specific economic framework, rural-urban linkages, and intersectoral as well as spatial and environmental dimensions of urban development. To counter the severity of urban problems, the modes of solution have to be coherent and comprehensive to address local problems, and cities should be able to meet the needs of the present urban population in such a fashion that it does not affect its future needs.
The goals of urbanization strategy involve strengthening of urban local bodies by transferring funds and functions, adequate/sustainable provision of urban infrastructure/basic civic services, such as water supply, sewerage, solid-waste management, roads, street lights, drainage, environment conservation, housing, land development and transport infrastructure. Capacity building of elected and appointed representatives of local self-government and other urban managers is one of the major constituents of the urbanization strategy and a prerequisite for institutional development and functional strengthening of ULBs. The urban strategy must emphasize creation of an enabling legal, financial and regulatory framework for urban development, housing and poverty alleviation. Since state budgetary support, central government transfers and tax base of ULBs are inadequate, the urban strategy should suggest ways and means of mobilizing resources from non-budgetary sources, i.e., funds from the capital market through bonds and other alternative sources of financing.

URBAN GOVERNANCE, DEMOCRATIC DECENTRALIZATION AND INSTITUTIONAL SET-UP FOR URBAN DEVELOPMENT
Local governments under the Constitution of India, belong to the donnain of the state governments, as they are listed in List II in the Seventh Schedule. Hence, they have historically been operating within the control system of the state governments and have very little financial and functional autonomy.
The ULBs in Punjab, numbering 134, are governed by the Punjab Municipal Act (PMA), 1911 and the Punjab Municipal Corporation Act (PMCA), 1976, as amended in 1994, to bring the two Acts in conformity with the Constitution (74* Amendment) Act, 1992 (CAA). The Punjab State Assembly has passed the Punjab Municipal Bill, 1999, which has, to some extent, broad based the functional scope of the ULBs. It is awaiting assent of the President of India.
CAA is a milestone in the history of urban governance. It provides and stipulates that:
• Municipalities are to function as 'institutions of self-government’, prepare 'plans for economic development and social justice’, perform functions and implement schemes as entrusted to them by the state governments including functions listed in the Twelfth Schedule [Article 243W (a)].
• With a view to reducing the distance between the local communities and the local government, CAA provides for the constitution of Wards Committees (WCs) in the cities with a population of three lakh or more [Article 243S(1)].
• The State Election Commission is to superintend, direct and control the preparation of electoral rolls, and conduct elections to the urban local bodies [Article 243K(1)].
• The State Finance Commission is to review the financial position of urban local bodies and make recommendations to the state government regarding (i) the ‘principles’ which should govern the distribution of resources between the state and the local bodies, the determination of the revenue sources to be assigned and appropriated by the local bodies, and the grants-in-aid from the State Consolidated Fund; (ii) the ‘measures’ needed to improve the financial position of ULBs; and (iii) any other matter as the Governor may refer to it in the interest of sound finances of the local bodies [Article 243Y (1)].
• The District Planning Committees (DPCs) are required to be constituted to 'consolidate’ the plans prepared by the Panchayats and the municipalities of the district and to prepare a draft development plan for the district as a whole [Article 243ZD(1)].
• The Metropolitan Planning Committees (MPCs) to prepare draft development plans for the metropolitan areas concerned as a whole [Article 243ZE (1)].
The scheme of the CAA provides for regular and fair conduct of elections. If an ULB is superceded before the expiry of its term, elections shall be held within a period of six months. The Election Commission was constituted in compliance with the provision of the CAA, and two elections to local bodies have been held in Punjab. The First State Finance Commission (FSFC) was set up in 1994 and the Second State Finance Commission (SSFC) in 1999. The recommendations of the FSFC have been accepted by the state government for fiscal transfers and the recommendations of the SSFC are presently under consideration. Though reforms towards democratization of ULBs have been set in motion, the devolution of functions to be performed by ULBs of different sizes, transfer of funds to match these functions, and the system of accountability, is left to the wisdom of the state government.

Recognizing the neglect of integrated urban development planning by the local authorities, the CAA incorporated, inter-alia, functional decentralization to enable the ULBs to discharge effectively their responsibilities, suitable to contemporary urbanization and a participatory planning process to promote convergence of resources. The state government needs to introduce improvements to overcome structural deficiencies in the generation of revenue from such conventional sources, as property tax, octroi, user charges, license fees and from profession tax, land-based taxes and funds through municipal bonds etc.. Also, the financial base of ULBs could be augmented through better tax administration and adoption of an appropriate mechanism for rationalizing the pricing of basic civic services. Since provision of municipal services rests with the ULBs, there is need to seriously implement the reforms as envisaged in the CAA. The suggested ways and means as discussed in subsequent sections need to be executed and monitored regularly.
Functional Domain of Urban Local Bodies
The functional domain of municipalities in Punjab suffers from lack of clarity. It lacks stability, as, over time, the functional responsibilities of the municipalities have either been modified, deleted or taken over by the state agencies and fragmented amongst several agencies.
The Twelfth Schedule of the Constitution contains an illustrative list of municipal functions for transfer to ULBs. In Punjab there has been no change in the functional domain of ULBs in the post-CAA regime. No doubt, the transfer of functions listed in the Twelfth Schedule is not mandatory, but the intention to transfer these is clear. For enabling the performance of the functions listed in the Twelfth Schedule, the Constitution provides for supplementing local revenues through transfer of funds from the state government, sharing of state taxes and assignment of taxes and grants-in-aid, specific or general. The CAA thus envisages transfer of functions and finances to the municipal bodies to enable them to act as city-level governments for discharging mandatory, core and other civic functions delegated to them.
Presently, the State Municipal Acts make the bureaucracy the supervisory and controlling authority of the municipal bodies. Though the Constitution envisages empowered units of self-government, the executive powers vest with the appointed bureaucrats. This is against the ethos of self-government. Elected members of the municipal bodies feel that the executive wing (appointed representatives) of the state government is influenced by the Members of the Legislative Assembly (MLAs) and Members of Parliament (MPs) who look upon elected members of the local municipal bodies as trespassers in the game of power sharing. Vesting of executive powers with appointed functionaries come handy in such a system of control and authority. Devolution of functions and tax authority and fiscal autonomy to ULBs, therefore, demand a fresh look at the existing laws and, above all, a strong political will to translate the spirit of CAA.
Fragmented functioning is illustrated by the performance of such parastatal agencies as Punjab Water Supply and Sewerage Board (PWSSB), State Urban Development Agency (SUDA) and Improvement Trusts. These organizations have encroached upon the local functional domain of ULBs. It is time that the functions of parastatals are transferred to the elected municipal bodies who, after two elections since 1994, have attained enough maturity to perform these functions. Parastatal institutions should be subordinate to ULBs and at best act as consultants to them till abolished.

The recommendations of the FSFC pertaining to revenue assignment, sharing of taxes and grants should be implemented in full, to enable the ULBs perform their functions efficiently in general and in the delivery of municipal services in particular. There should be no interference by the State Government in such municipal affairs as fixing of rates, rents and user charges and granting exemptions to pay taxes. This will make local governments strong and close to the people, and the local polity vibrant and alive.
Th^ Wards Committees, District Planning Committees and Metropolitan Planning Committees, mandated by the CAA, should be constituted. It is time to introduce the Mayor-in-Council system (or President-in-Council) in ULBs, to strengthen functioning of local democracy through elected representatives.
Functional and institutional Development of Local Self-government through Education, Research and Training
Training and human resource development, backed by research, have a key role in strengthening the ULBs to cope with the challenges in the context of the CAA. Capacity-building of elected representatives of ULBs will help in institutional development and functional strengthening of local self-government. The strategy for capacity-building of urban administrators/managers includes realistic assessment of human, financial and technical resources required by ULBs. The elected and appointed officials of ULBs should be aware of the salient features of the 74'^ CAA, the institutional/organizational set-up, preparation and implementation of development plans, innovative municipal management through people’s and private sector participation and regulation of the private sector in the delivery of municipal services. An orientation for raising funds through internal resources, borrowings from institutions and the debt market are the other essential features of the training of functionaries of ULBs. Managerial skills of about 5,000 senior, middle and junior level elected and appointed representatives need to be upgraded, for maintaining the tempo of growth and good governance in 134 local bodies, including four municipal corporations.
Fiscal Domain of Urban Local Bodies
The resources of ULBs comprise internal sources (tax and non-tax revenues) and external sources (borrowings and grants-in-aid/share in state taxes and transfers from the Central Government). Articles 243X, 243Y and 280(3) (c) of the Constitution of India are relevant for strengthening the fiscal domain of ULBs. Progressive devolution of fiscal authority will address the existing mismatch between functions and resources.
Sections 61 of PMA, 1911, and Section 90 of PMCA, 1976, deal with taxation powers of ULBs in terms of taxes and fees. Though a number of tax and non-tax sources have been mentioned in these Acts, octroi, property tax and water supply and sewerage charges are the major sources of income of ULBs. Octroi, a buoyant source of income, was abolished from 1 December 2001, except on electricity. The exclusion of octroi had a significant negative effect on the revenue base of ULBs. However, the Hon’ble High Court of Punjab and Haryana has provided a fiscal reprieve by reinstating the levy of octroi and it is being collected by ULBs since 29 April 2002.
Property tax is the next major source of income of ULBs, but its-contribution continues to be meagre, due to a variety of reasons, including exemptions on self-occupied residential properties (from 1 April 1997 onwards), poor and discretionary valuation, deficiencies in assessment and collection procedures and a faulty rate structure.

The next important contributor to municipal income is water supply and sewerage charges. ‘User charges’ from water supply and sewerage have a small share in the tota income. This is due to a host of reasons, such as faulty pricing and poor cost recovery, system losses, theft, excessive energy consumption, poor billing and collection, high capital cost and non-volumetric supply of water. Other sources of revenue are not consistent and adequate to meet the growing demands of ULBs for infrastructure development and rising wages and salaries.
Profession tax provided for in the PMCA, 1976, and PMA, 1911, development tax in the PMCA, 1976, and scavenging tax and tax on menial domestic servants in the PMA, 1911, are not yet levied by ULBs. Income from entertainment tax (show tax), levied by ULBs in addition to the entertainment tax charged by the state government, is negligible. Other sources of non-tax revenue, comprising license fees for various trades, licenses, slaughter house fee, building application fee, tehbazari (rent for temporary occupation of vacant municipal land on road-side), sale proceeds and rents of municipal properties, interest on investments, fees, fines and charges for performance of statutory and regulatory functions, are nominal and do not have much impact on strengthening the finances of ULBs. Borrowings, with the approval of the state government, have been mainly confined to loans from the Housing and Urban Development Corporation (HUDCO) and the Life Insurance Corporation (LIC) for water supply and sewerage projects through PWSSB. Except Ludhiana Municipal Corporation (LMC), which issued bonds for rupees (Rs.) 17.84 crore in 1999 through private placement, no ULB in Punjab has raised any loan from the capital market.
ULBs receive 'transfers’ and ‘grants’ from the State and the Central Governments, which are highly erratic and unpredictable, depending upon the exigencies of the state’s own financial resources. Own revenues of ULBs are not sufficient to meet the growing demand of basic civic services and the urban infrastructure. The fiscal domain of ULBs continues to remain weak and deplorable. Article 243X of CAA provides that the state government may, by law, authorise a municipality to levy, collect and appropriate such taxes, duties, tolls and fees and assign them such taxes, duties, tolls and fees as levied and collected by the state government. It also provides for making grants-in-aid to the municipalities from the Consolidated Fund of the state.
Income and expenditure of municipalities -- The income and expenditure of urban local bodies is dependent on:
• Adequacy of tax base and its effective exploitation by ULBs.• Effective use of non-tax sources, such as user charges and land-based non
property taxes.• Transfers from higher levels of government.
Income of municipalities: Income of municipalities from tax and non-tax revenue sources, capital receipts and transfers from the State and Central Governments from 1996-97 to 2001-02 is given in Table 4. It shows remarkable financial self-sufficiency of ULBs from their own sources. Their dependence on fiscal transfers is negligible. It is worth noting that the generation of revenue from own sources has been increasing in subsequent years despite several populist measures of the state government to abolish local taxes. This suggests that if tax authority is devolved to ULBs and they are given fiscal autonomy, the fiscal constraints presently being experienced by them will ease substantially. Table 4 also reveals distress signals. Revenue from property tax and user charges has been depleting over the years as a proportion of total local revenue. It also indicates a very subdued role of fiscal transfers. This is largely because the income of

urban local bodies in the form of share in taxes is not in accordance with its recommendations of the FSFC and so is the case of transfer of grants to ULBs as recommended by the Tenth Finance Commission (TFC). It is not regular and predictable. Urban development projects of local bodies are affected because of absence of assured quantum of grants and share of taxes according to the recommendations of the State and the Central Finance Commissions. Powers of municipalities, as stated by the FSFC, are severely inhibited by state control. A municipal council cannot raise loans without the sanction of the state government, if the amount exceeds rupees five lakh under the Local Authorities Loan Act, 1914, which is a central legislation. The PMCA, 1976, also provides for borrowing by the municipal corporation for specified purposes within the ambit of the Local Authorities Loan Act. This adversely affects the fiscal autonomy of ULBs.
Table 4Total Revenue Income of Urban Local Bodies from 1996-97 to 2001-02
(Rs. in crore)Items 1996-97 1997-98 1998-99 1999-00 2000-01 2001-021. Tax Revenues Estimatesa) Octroi 217.63
(55.83)226.45(52.82)
271.65(54.27)
406.69(59.57)
456.82(55.53)
531.72*(61.03)
b) Property tax 34.7
(8.90)
34.92
(8.15)
42.42
(8.47)
54.31
(7.95)
66.73
(8.12)
66.64
(7.65)c) Share from auction money and excise duty on liquor
41.34(10.61)
43.71(10.20)
45.04(9.00)
38.34(5.62)
63.44(7.71)
60.99(7.00)
d) Others 2.75
(0.70)
4.26
(0.99)
4.31
(0.86)
3.51
(0.51)
3.07
(0.37)
3.50
(0.40)e) Total (a+b+c+d) 296.42
(76.04)309.34(72.16)
363.42(72.60)
502.85(73.65)
590.06
(71.73)662.85(76.08)
2. Non-Tax Revenuesa) Water supply & sewerage charges 30.05
(7.71)
31.18
(7.27)
38,04
(7.60)
43.68
(6.40)
57.73
(7.02)
59.62
(6.84)b) Others including capital receipts 43.31
(11.11)44.29
(10.33)56.92
(11.37)87.63
(12.83)101.52(12.34)
112.12(12.87)
c) Total (a+b) 73.36(18.82)
75.47(17.60)
94.96(18.97)
131.31(19.23)
159.25(19.36)
171.74(19.71)
3. Revenues fronn Own SourcesTotal (1e+2c) 369.78
(94.86)384.81(89.76)
458.38(91.57)
634.16(92.88)
749.31(91.09)
834.59(95.79)
4. Share from taxes as per recommendations of the FSFC
-- 36.26(8.46)
10.82(2.17)
13.18(1.93)
17.78(2.16)
5. Grants:a) As per recommendations of 10th & 11th Finance Commissions
- “ 7.65(1.53)
9.56(1.40)
5.74(0.70)
10.95(1.26)
b) For Centrally Sponsored and State Plan schemes
18.89(4.85)
5.4(1.26)
22.42(4.48)
23.75(3.48)
45.77(5.56)
23.25(2.67)
c) Others 1.14
(0.29)
2.24
(0.52)
1.3
(0.25)
2.1
(0.31)
4.01
(0.49)
2.4
(0.28)d) Total (a+b+c) 20.03
(5.14)7.64
(1.78)
31.37(6.26)
35.41(5.19)
55.52(6.75)
36.6
(4.21)6. Total Revenue (3+4+5d) 389.81
(100.00)428.71
(100.00)500.57
(100.00)682.75
(100.00)822.61
(100.00)871.19
(100.00)Source: Report of the Second Punjab Finance Commission (2002) and Local Government Department,
PunjabNote: 1) Figures in parentheses indicate % age to total revenue income in respective years.
2) ‘ Revenue from octroi for the year 2001-02, includes grants of Rs. 140.51 crore against losses, onaccount of abolition of octroi (1 December 2001 to 31 March 2002)

An item-wise analysis of various sources of income in the context of the recommendations of the FSFC, the TFC and the Eleventh Finance Commission (EFC) is presented below. An effort has been made to give suggestions for enhancing income from these sources.
Octroi: In view of a very high estimate of financial resources required for augmentation of basic urban infrastructure and services, abolition of octroi is not advisable. It is the only local tax with buoyancy and elasticity. Nevertheless, the existing drawbacks in its administration need to be addressed. An array of concessions and exemptions given to several goods and commodities needs review. The measures mentioned below could, therefore, be considered:
• Switching over progressively from the age-old practice of assessment of octroi on ‘weight basis’ to ‘ad valorem basis’. This is equitable.
• Computerization of major check-posts, with connectivity with a central point, to reduce malpractices and improve octroi collections through quick monitoring.
• Effective transit pass system, by feeding into the computers the description ofgoods and vehicles entering the towns and its transmission to the octroi posts atthe exit point to
• check misuse of transit passes.
• A bench-mark for octroi staff and its monitoring to improve their efficiency andintroduction of incentives for employees and informers are other measures forimproving octroi collection.
• Leakage of revenue on account of under-invoicing in bills can be plugged by random checking of vehicles and co-ordination with the sales tax department.
• Private sector participation in octroi collection can enhance income from octroi through the implementation of an efficient and leak-proof system, better tax administration and application of low-cost modern techniques.
A recent study of Ludhiana Municipal Corporation by the Centre for Research in Rural and Industrial Development (CRRID), conducted by Gupta and Teotia (2001), indicates that LMC has achieved significant growth in income from octroi by implementing these measures and through effective tax administration. Table 5 shows the comparative picture of revenue from octroi in municipal corporations and municipal councils/nagar panchayats (MCs/NPs).

Year MCs/NPs(A)
Municipal Corporations_____ (B)
Ludhiana Amritsar Jalandhar Patiala
Total(B)
Grand Total(A+B)
9.56j [ 4 ^
116.48(53.52)
217.63(1 0 0 .00)
1997-98 101.73(44.92)
58.68(25.91
29.86(13.19)
28.1_(1 4_1]
8.08 124.72(55.08)
226.45(1 0 0 .00)
1998-99 123.09(45.31
73.49(27.05)
34.77(12.80)
31.26(11.51
9.04(3.33)
148.56(54.69)
271.65(100.00)
1990-00 182.84(44.96)
114.18(28.08)
46.97(11.55)
50.28(12.36)
12.42(3.05)
223.85(55.04)
406.69(100.00)
2000-01 226.64(49.61)
117.26(25.67)
50.11(10.97)
50.78H i m
12.03(2.63)
230.18(50.39)
456.82(100.00)
2001-02 264.17(49.68)
145.5(27.36)
44.95 63.24(11.89)
13.86(2.62)
267.55(50.32)
531.72(100.00)
Source: Local Government Department, Note: Figures in parentheses indicate
particular year
Punjabpercentage share in the total income from octroi in a
Income fronn octroi in Amritsar, Jalandhar and Patiala Municipal Corporations and other MCs/NPs has not shown adequate growth. The income of LMC has increased substantially and it is more than the total income of Amritsar, Jalandhar and Patiala Municipal Corporations put together. The measures adopted by LMC to enhance its income can be adopted by other corporations and municipal councils.
Property tax: Besides octroi, property tax (PT) constitutes the most important municipal tax in Punjab. Entry 49, read with Entry 5 of the State List in the Seventh Schedule of the Constitution of India, enables the ULBs to levy tax on land and buildings. ULBs in Punjab do not charge PT on all types of properties, and a large proportion of these are exempted. These include self-occupied properties, schools (even those receiving 95% grants from the state), many charitable and religious institutions and central government organizations and institutions. According to the FSFC, growth of income from PT is constrained by existing rent control laws. The Commission noticed several deficiencies in fixation of tax base, tax rate, tax assessment, tax collection, tax exemptions/concessions and lack of uniformity in the laws for municipal corporations and municipal councils. Though Punjab has liberalized its Rent Control Legislation to make it fall in line with the Model Rent Control Law, 1992, of the central government, the desired result of boosting tax revenue, as a result of changes in the formula for determining the standard rent, have been limited, as most of the old high-priced inner city properties have continued to be assessed at a very low rateable value. As a part of strategy to reform PT, the FSFC gave certain recommendations to strengthen the fiscal domain of ULBs, which have not been implemented so far. Eyen for exemptions declared by the state government in 1994, no compensation has been given to ULBs.
Property tax reforms: Income from PT has potential and its administration should be streamlined for a higher yield. The tax base, tax rate, tax assessment, tax collection, tax exemptions and resolution of disputes are important aspects of property tax

administration. According to the guidelines for PT reforms prepared by the Ministry of Urban Development (MOUD), Government of India (GOI), a good PT structure should have the following characteristics;
• A low rate of tax to make it acceptable.• Assessment and collection should be simple and transparent.• Equity between different classes of tax payers.• Minimum discretion of assessors.• Facilitating self-assessment by owners/occupiers.
Taking into consideration the host of administrative and legal reasons behind a subdued revenue productivity of the existing annual rental value system, a consensus on 'area based’ property tax, which has stood the scrutiny of the courts, has now generally evolved. The Hon’ble Supreme Court of India has held, in CWP No. 888 of 1996, that the 'property tax is the principal source of income of the urban local bodies. It is unfortunate that the property taxes are levied at very low rates, which have been generally rent based and not revised for five years. Regrettably, large-scale exemptions and concessions are given to property holders. A lot of disparity is also seen in the manner of assessment of property tax. There is a need to have area based property tax reforms to make the system of assessment rational, transparent, simple and fair with minimum exemptions’. The EFC too has expressed similar views and highlighted, in particular, the need to improve revenue mobilization by ULBs through reforms in this local tax.
Property tax models operating in Patna, Ahemedabad, Tamil Nadu and Andhra Pradesh are worth looking at for reforming this tax in Punjab. The Hon’ble Supreme Court of India, in a recent judgment on the Andhra Pradesh PT system, has upheld the area detail system of property tax, provided the methodology and the procedure of valuation and assessment of rental value are stipulated in the municipal laws. Property tax in Punjab, therefore, needs to be refurbished by providing for determination of annual rental value on the basis of location, quality of construction, age and use of land and buildings, by stipulating the methodology and procedures to be followed, as in Andhra Pradesh. The depressing effect of rent control laws on property valuation could thus be eliminated and PT could be made a buoyant and elastic source of revenue.
Innovative practices in valuation and assessment and also in tax administration as well, would need to be adopted. These include the use of Geographical information System (GIS) for tax mapping, valuation and tax collection, computerization of PT records for effective billing and collection, delivery of PT bills through courier, a scheme of incentives and penalties for tax payers to enhance collection ratio, and strict monitoring of tax collection through ABC Analysis. Increasing demand for augmentation of basic urban services in the wake of rising urbanization is too serious a phenomenon to allow populist measures of large scale tax exemptions, deficient tax system, defective system of valuation and poor collection.
In Punjab, according to a CRRID study (Gupta and Teotia 2001), LMC has gone in for several innovations as discussed above. It has enhanced its income from PT from Rs. 14.06 crore in 1997-98 to Rs. 32.41 crore in 2001-02. The comparative growth of PT in Ludhiana, Amritsar, Jalandhar and Patiala Municipal Corporations and MCs/NPs is shown in Table 6.

Year MCs/NPs(A)
Municipal Corporations_______m _______
Ludhiana Amritsar Jalandhar Patiala
Total(B)
Grand Total (A+B)
14.06(40.26)
2.8(8.03)
3.2(9.16)
2.51(7.18)
22.57(64.63)
34.92(100.00)
1998-99 14.81(34.91)
16.94(39.93)
3.41(8.04)
4.12(9.72)
3.14(7-40)
27.61(65.09)
42.42(100.00)
1990-2000 19.61(36.10)
22.13(40.75)
3.99jL m
5.04(9.28)
3.54(6.52)
34.7(63.90)
54.31(100.00)
2000-01 24.04(36.02)
27.19(40.75)
4.58(6 .86)
6.77(10.15)
4.15(6 .22)
42.69(63.98)
66.73(100.00)
2001-02 18.83(28.26)
32.41(48.63)
4.51 7.01(10.53)
3.88 47.81■(71:74)
66.64(100.00)
Source; Local Government Department, PunjabNote: Figures in parenthesis indicate percentage share in the total income from
property tax in a particular year
The contribution of LMC to total FT collection is almost 49 per cent of the total PT income of the state. It is more than double that of three municipal corporations taken together and almost twice all other MCs/NPs. The innovative practices adopted by LMC are growth oriented and sustainable and can be replicated in other municipalities of Punjab to mobilize income from PT (Gupta and Teotia 2001).
PT in Punjab has the potential to generate additional revenue for the ULBs of more than 25 per cent per year in the next five years.
User charges for civic services: The FSFC noticed that the principle of ‘user charges’ is not being properly enforced by ULBs for providing civic services. As a result, most of these, which could be financed through ‘user charges’, are heavily subsidized or given free. In Punjab, municipalities do not recover even one-third of the cost of maintenance of water supply and sewerage. The FSFC noticed several deficiencies in the management of the water supply and sewerage system. They are:
• Large-scale evasion due to unsatisfactory billing and collection of water charges.• Expenditure on maintenance is out of proportion and far in excess of the
recovery by way of user charges from the consumers.• There is no system of revision of rates for water supply and sewerage to provide
for cost escalation including labour cost, wages, spare parts and hike in power tariffs.
• Too much wastage of water by public and street taps, theft through illegal connections and supply to unauthorized settlements are the other shortcomings.
The FSFC recommended that user charges should be extended to all municipal services, such as water supply, sewerage and parking lots and later to solid-waste management. The principle of full cost including operation and maintenance (O&M) costs, billing and collection costs and capital costs should be incorporated in user charges. Periodic revision of user charges, at least every three years, and a system of

charges based on the level of consumption and cross-subsidies to weaker sections should be introduced. The municipalities must ensure an efficient and desirable level of services to justify recovery of user charges. Instead of initiating reforms to recover full cost of water supply and sewerage, Amritsar Municipal Corporation passed a resolution to give free water and sewerage facilities. This is an example of fiscal adventurism that will destroy every rudiment of efficiency.
At present recovery of O&M charges of water supply and sewerage is poor in most of the municipalities. A report on the status of water and sanitation in Ludhiana city by the Financial Institutions Reforms and Expansion Project of United States Agency for International Development (USAID FIRE-D Project 2000) indicates that the average O&M recovery in LMC was only 17 per cent in 1999-2000. Though LMC has improved by adopting a number of innovative measures, there is still scope to improve recovery of O&M cost of water supply and sewerage.
Pricing and cost recovery through rationalization of user charges: Cost recovery for providing urban civic services in Punjab has been low and the provision of services is totally unrelated to its cost. Municipal services are considered ‘social goods’ and the concept of cost recovery has not been considered seriously. Presently the rich and the poor are charged the same rate for the services, which continues to be highly subsidized. On the basis of recommendations of the FSFC and major findings of a CRRID study of LMC by Gupta and Teotia (2001), the following measures can be adopted by ULBs for recovery of user charges of municipal services, especially water supply, sewerage and solid-waste management:
• Pricing for water needs to be rationalized on the basis of the unit-cost of production. There should be periodic revision of charges after every three years. Water rates should be linked to cost of production in general and with the revision of power tariff in particular, with an annual hike of ten per cent to offset the escalation in the cost of maintenance of staff and materials.
• Metering of water supply should be progressively introduced as the present system encourages wastage.
• There should be no free supply of water and the system of public stand-posts should be abolished. Beneficiaries should pay collectively for water supplied through stand-posts, even though the rate can be low or nominal. An innovative system of cross-subsidy from one income group to another needs to be worked out in the interest of equity.
• Sewerage charges need to be based on water consumed and should be equal to water tariffs.
• Commercial and industrial connections should be charged higher rates than residential connections and higher rates should be charged for higher consumption.
• Progressive management contracts of O&M of water supply and sewerage system, delivery of bills and running of tube wells will enhance efficiency.
• Cost-recovery for capital investment could be effected, at least in part, by charging upfront for new water and sewerage connections from users.
• Involvement of the local community in running tube wells, sanitation and park maintenance through Neighbourhood Tube-well Operators, Mohalla Sanitation Committees and Park Management Committees respectively, should be encouraged to ensure people’s participation in municipal affairs and effect economy in expenditure on these services.

The CRRID study (Gupta and Teotia 2001) shows that some of these innovative urban management practices have been implemented by LMC, resulting in increase in revenue from water supply and sewerage and economy in expenditure on solid-waste management. Table 7 shows comparative growth of income of municipal corporations and MCs/NPs from water supply and sewerage charges.
Table 7Income of Urban Local Bodies from Water Supply and Sewerage Charges from 1996-97 to
2001-02
YearMCs/NPs
(A)Municipal Corporations
(B)Total(B)
GrandTotal(A+B)
Ludhiana Amritsar Jalandhar Patiala1996-97 11.13 5.4 7.33 4.04 2.15 18.92 30.05
(37.04) (17.97) (24.39) (13.45) (7.15) (62.96) (100)1997-98 10.19 6.69 7.52 4.38 2.4 20.99 31.18
(32.68) (21.45) (24.12) (14.05) (7.70) (67.32) (100)1998-99 13.54 8.87 7.7 5.06 2.87 24.5 38.04
(35.59) (23.32) (20.24) (13.31) (7.54) (64.41) (100)1990-2000 19.93 7.02 8.17 5.46 3.1 23.75 43.68
(45.63) (16.07) (18.70) (12.50) (7.10) (54.37) (100)2000-01 21.38 17.4 8.31 6.18 4.46 36.35 57.73
(37.03) (30.14) (14.39) (10.71) (7.73) (62.97) (100)2001-02 22.56 17.56 8.03 6.57 4.90 37.06 59.62
(37.84) (29.45) (13.47) (11.02) (8.22) (62.16) (100)Source; Local Government Department, PunjabNote: Figures in parenthesis indicate percentage share in the total income from water
supply and sewerage charges in a particular year
The increase in the percentage share of income of LMC is encouraging, as its income from water supply and sewerage charges increased from Rs. 5.4 crore (17.97%) in 1996-97 to Rs. 17.56 crore (29.45%) in 2001-2002. According to Gupta and Teotia (2001), the water supply and sewerage reforms initiated by LMC are growth oriented and sustainable and can be replicated in other municipal corporations/councils.
Additional excise duty and share of auction money and excise duty: Therecommendation of the FSFC to enhance additional excise duty (AED) payable to ULBs from seven per cent to ten per cent on country liquor has not been implemented. Recommendations to enhance the AED payable to ULBs on Indian Made Foreign Liquor (IMFL) from 16 per cent to 20 per cent has been considered by the government from time to time, when time of considering the annual excise policy, but no permanent decision has been taken so far. Table 8 shows amounts due and transferred to ULBs as share of auction money and excise duty.

Year
I
Share of auction money & excise duty
Provision in the state budget
Amount released to ULBs
Difference between Cols. 2 & 4
(1) (2) (3) (4) (5)1996-97 39.3 41.34 41.34 + 1.981997-98 58.33 43.71 43.71 -14.621998-99 59.98 71.97 45.04 -14.941999-2000 63.44 57.52 38.34 -25.102000-01 61.96 * 63.44 + 1.48
Total 283.07 214.54 231.87 -51.20Source: Report o f the Second Punjab Finance Commission (2002)Note: *A token provision of Rs. 1000/- was made in the budget of 2000-01.
There is thus a shortfall of Rs. 51.20 crore. Transfer of the share of ULBs should be predictable, stable and transparent. The full share of ULBs in auction money and excise duty, as recommended by the FSFC, should be transferred to enable municipalities to prioritize future developmental activities.
Share of urban local bodies in state taxes: The FSFC recommended that 20 per cent of the net proceeds of the following five taxes and duties should be transferred to ULBs and PRIs, with defined principles of sharing inter se among them;
• Stamp Duty• Electricity Duty• Punjab Motor Vehicle Tax• Entertainment Tax• Entertainment (Cinematograph Shows) Tax.
The State Government decided to implement these recommendations with effect from the fourth quarter of 1996-97. The devolution of 20 per cent share of five state taxes to ULBs is shown in Table 9. it is evident that the transfers have been rather poor and continue to be partial without any justification. Recommendations of the Central Finance Commission are usually accepted in full and annual transfers from the Centre to the State are the same as recommended by the Commission. This is, however, not so in the case of recommendations of the State Finance Commission.
Table 9
Year Receipts from 5 divisible state taxes #
Cost of collection
Net tax receipts (Col 2-Col 3)
20% share of net tax receipts (PRIs + ULBs)
Budget provision for ULBs
Amounttransferred to ULBs
Shortfall (Col.6- Co.7) for ULBs
(1) (2) (3) (4) (5) (6) (7) (8)1996-97 450.54 5.15 445.39 22.27* 11.89** - 11.891997-98 476.59 6.03 470.56 94.11 50.97 36.26 14.711998-99 542.21 12.81 529.40 105.88 45.57 10.82 34.751999-2000 701.26 11.36 689.90 137.98 40.00 13.18 26.822000-01 912.63 11.42 901.21 180.24 32.22 17.78 14.44Total 3083.23 46.77 3036.46 540.48 180.65 78.04 102.61
Source: Report of the Second Punjab Finance Commission (2002)Note: # 1. Stamp Duty, 2. Electricity Duty, 3. Motor Vehicle Tax, 4. Entertainment Tax, 5. Entertainment
(Cinematograph Shows) Tax.* 20 per cent share for fourth quarter of 1996-97 calculated by taking one-fourth of total net receipts for 1996-
97.** Revised budget outlay.
Transfers of shared revenue to municipalities are ad hoc, unpredictable, unstable and discretionary. Non-transfer of the full share to ULBs affects their fiscal domain and makes them even more dependent on the state government. Revenue sharing should be predictable and, in principle, the full amount should be transferred to ULBs to strengthen their fiscal base.
Taxation of central government properties: Taxation of Central Government properties is subject to the provisions in the Constitution. The Central Government has now settled the issue by allowing ULBs to charge only for the services provided by them. The EFC, after considering all aspects, has recommended that ‘all government properties whether they belong to the Central or the State Governments, should be subject to the levy of user charges and should be regulated by a suitable legislation’.
In Punjab, only Amritsar and Ludhiana Municipal Corporations levy nominal service charges on Central Government properties. Recommendations of FSFC that steps to tap this source of revenue should be taken have not been considered seriously by the State Government as well as local bodies. Recommendations of the FSFC and the EFC should be taken seriously and ULBs should recover service charges on Central Government properties.
Enhancing local tax authority and internal revenue efforts: Devolution of buoyant fiscal tools to ULBs is necessary to enable them properly address the existing mismatch between functions and tax and non-tax sources. The FSFC suggested devolution of i) profession tax, ii) license fee on privately-bored tube wells, iii) surcharge on water pumped into the sewerage system, iv) full potential of the tax on advertisements and hoardings, along with periodical revision of non tax rates, and v) reduction of state control on fixing rates of local taxes. The state government has been indifferent to these valuable suggestions. It has not granted fiscal autonomy to ULBs to decide their own taxation rates.
The existing position of local tax authority and internal revenue efforts indicate a status quo situation, as nothing has been done to enhance local fiscal authority and internal resource mobilization. All powers remain vested in the state government and devolution of fiscal autonomy to ULBs remains unimplemented. The levy of local taxes, as recommended by the FSFC, will help to bring stability and strength to fiscal resources and help to build a strong and viable tax base.
Devolutions recommended by the Tenth Finance Commission and the Eleventh Finance Commission: Article 283 (3)(c) of CAA empowers the central finance commission to make recommendations regarding measures needed to augment the Consolidated Fund of a state, to supplement the resources of its municipalities on the basis of the recommendations of the state finance commission. The TFC for the first time made a provision of Rs. 30.60 crore to be given to ULBs of Punjab, on the basis of a ratio of the slum population derived from the urban population figures of the 1971 Census. The ULBs were required to prepare suitable schemes and provide matching contributions. It also mandated that no amount be used on salaries and wages. Table 10 contains grants recommended by the TFC, amounts received by ULBs and the shortfall.

Table 10Grants Recommended by the Tenth Finance Commission
(Rs. n crore)Year Grants recommended by the Received by the ULBs Shortfall
TFC (2-3)(1) (2) (3) (4)
1996-97 7.65 - 7.651997-98 7.65 - 7.651998-99 7.65 7.65 -
1999-00 7.65 9.56 -1.91Total 30.60 17.21 13.39
Source: Report of the Second Punjab Finance Commission (2002)
The EFC has recommended a grant of Rs. 54.70 crore, i.e., Rs. 10.94 crore per annum to be given to ULBs for the period 2000-2005. Table 11 shows grants recommended by the EFC, amounts received by ULBs and the shortfall in 2000-01 and 2001-02.
Table 11Grants Recommended by the E eventh Finance Commission (Rs In crore)
Year Grants recommended by Received by the Shortfallthe EFC ULBs
-j 2 3 4 (2-3)2000-01 10.94 5.74 5.202001-02 10.94 - 10.94
Total 21.88 5.74 16.16Source: Report of the Second Punjab Finance Commission (2002)
Tables 10 and 11 indicate that ULBs have not received the full amount as recommended by the Tenth and Eleventh Finance Commissions of India. The shortfall in grants is detrimental to the fiscal health of ULBs. Inadequate receipt of grants may result in slow progress of developmental activities and poverty alleviation programmes. The grants, as recommended by the TFC and the EFC, should be transferred to ULBs for successful implementation of urban development and poverty alleviation programmes.
Municipal expenditure: Municipal expenditure, comprising expenditure on general administration, tax collection, provision of services and debt servicing is shown in Table 12.
Table 12
Total Expenditure of Urban Local Bodies from 1996-97 to 2001-2002 ( Rs. in crore)Components of Expenditure 1996-97 1997-98 1998-99 1999-
20002000-01 Estimates
2001-021. General Administration 15.42 17.86 26.09 28.97 37.37 39.98
2. Tax Collection 35.9 39.14 50.85 59.54 49.75 52.243. Provision of Services 261.64 244.45 256.93 424.63 457.16 530.31
4. Debt Servicinga) Interest 2.78 2.8 1.55 1.58 1.67 2.70b) Repayment of Principal 6.86 7.2 8.07 6.84 6.87 7.17
c) Total (a+b) 9.64 10.00 9.62 8.42 8.54 9.875. Miscellaneous 46.17 49.19 61.72 70.59 175.74 150.1
Total Expenditure (1+2+3+4C+5)
368.77 360.64 405.21 592.15 728.54 782.5
Source: 1) Report of the Second Punjab Finance Commission 2002)2) Local Government Department, Punjab

Expenditure on establishment: According to the FSFC all municipalities incur unduly large expenditure on staff. Excessive cadreization with fixed strength, as determined by the government, does not leave any initiative for municipalities to reduce their expenditure on establishment. The excessive expenditure on staff is also due to unplanned expenditure on ad hoc and temporary workforce for sanitation, roads, water supply, etc. The FSFC considered this matter and recommended that measures should be taken to reduce excessive expenditure on the establishment and the limits on it upto a permissible percentage of the income must be adhered to. The State Government should exercise its authority to ensure that the cadre strength of various services is not inflated.
According to the SSFC, the cost of establishment was 42.03 per cent of the total own revenue and 39.57 per cent of the total expenditure of ULBs in 2000-01. It was higher than the limits fixed by Local Government Department, that not more than 35 per cent of the total expenditure should be spent on salaries. Privatization/contracting-out is being introduced in municipal functions, such as sanitation, streetlights, park maintenance, delivery of bills (through courier) and O&M of tube wells in a few municipalities. There is scope for privatization/contracting-out of municipal services in ULBs to reduce expenditure on establishment bringing it upto 35 per cent or even less.
The Local Government Department generally insists on the ULBs to present a balanced budget. Balancing of the budget, however, should not be at the cost of deficient municipal services. Table 13 shows the impressive budgetary surplus that has been increasing over the years.
Table 13Budgetary Surplus In Urban Local Bodies from 1996-97 to 20()1-02 (Rs. in crore)
Particulars 1996-97 1997-98 1998-99 1999-2000
2000-01 2001-02 Total
Income 389.81 428.71 500.57 682.75 822.61 871.19 3695.64
Expenditure 368.77 360.64 405.21 592.15 728.54 782.50 3237.81Revenue Surplus {+)/ Deficit (-)
(+)21.04
(+)68.07
(+)95.36
(+)90.60
(+)94.07
(+)88.69
(+)457.83
Source: 1) Report of the Second Punjab Finance Commission (2002)2) Local Government Department, Punjab
ULBS should not be forced to present balanced budgets. The revenue surplus would need to be leveraged for borrowings for much needed urban infrastructure and augmenting the existing civic services.
Data-base on Finances of Urban Local Bodies and Management Information System (MIS)
The FSFC and SSFC of Punjab, TFC and EFC have expressed serious concerns about the non-availability of data on the finances of local bodies. According to the EFC 'in the absence of any reliable financial/ budgetary data, no realistic assessment of the needs of the municipalities for basic civic and developmental functions can be made nor can any information be generated on the flow of funds to the local bodies for the implementation of various schemes for economic development and social justice’. The

SSFC has mentioned that a dependable and comprehensive database on the finances of local bodies is necessary but the position in this regard is not satisfactory. The FSFC and SSFC obtained the requisite data of income and expenditure of local bodies from them ab initio, and scrutinized and rectified the deficiencies.
The process of data collection, analysis, interpretation and updating should be expedited to strengthen policy planning for effective local self-government in Punjab. With the increased use of computerization, ULBs should be able to create a strong database on major aspects of municipal finances. The data will be useful for policy makers for predicting and managing the present and future development of growing cities. The recommendations of FSFC and SSFC regarding creation of a database should be implemented immediately. As recommended by the SSFC, the responsibility for the purpose may preferably be entrusted to the Director, Local Government and not to the Examiner Local Fund Accounts, as recommended by the EFC. A regulatory mechanism can help in continuous monitoring of data collection, evaluation and development of a management information system and its dissemination to various stake holders, like State and Central Governments for the finance commissions, planners, academics, research institutions/universities and consumers. An allocation of Rs. 10.93 lakh recommended by EFC for all ULBs of Punjab is not adequate and a specified percentage of budgets of ULBs should be earmarked for creation of database and MIS.
Property and Asset Management
The importance of property/ asset management in ULBs can hardly be overemphasized. This is essential to improve the fiscal base and quantify the capital supporting the assets. ULBs should put together all scattered assets of land and buildings, which are possibly being eroded through encroachments or unauthorized takeovers. With computerization and a management information system in place, this technique will help to preserve, maintain and compute the orderly growth of assets, comprising lands, buildings and other municipal properties, which must be inventorized for recovery of rents and rates and the most economic use of assets. The LMC adopted this technique, with technical support from Infrastructure Professionals Enterprise (P) Ltd. It did a comprehensive land-inventory exercise and identified 865 additional properties including large tracts of land. The total monetary value of these assets is reported to be Rs. 350 crore. The potential revenue generation from these properties/assets of LMC is over a crore of rupees per annum. According to the CRRID study (Gupta and Teotia 2001), ‘the mapping, survey of properties and inventory of old and newly identified assets, is a distinctive achievement of LMC towards tightening control on taxable properties and its own assets’. This can be replicated by other municipalities for strengthening their fiscal domain.
URBAN BASIC CIVIC SERVICES AND FINANCING URBAN INFRASTRUCTURE: A PLAN FOR URBAN DEVELOPMENT
Water supply, sewerage, surface drainage, solid-waste management, roads and street lighting are important urban basic civic services and core constituents of urban infrastructure. There is an acute pressure on these services in the wake of growing urbanization in Punjab. Most of the towns and cities of Punjab have serious deficiencies of civic services with regard to the coverage of population and level and quality of services. According to the FSFC of Punjab, water supply is a big casualty. Sewerage is inadequate, and even where sewerage exists, there is no proper arrangement for sewage disposal and its treatment. There are many pockets where even rudimentary
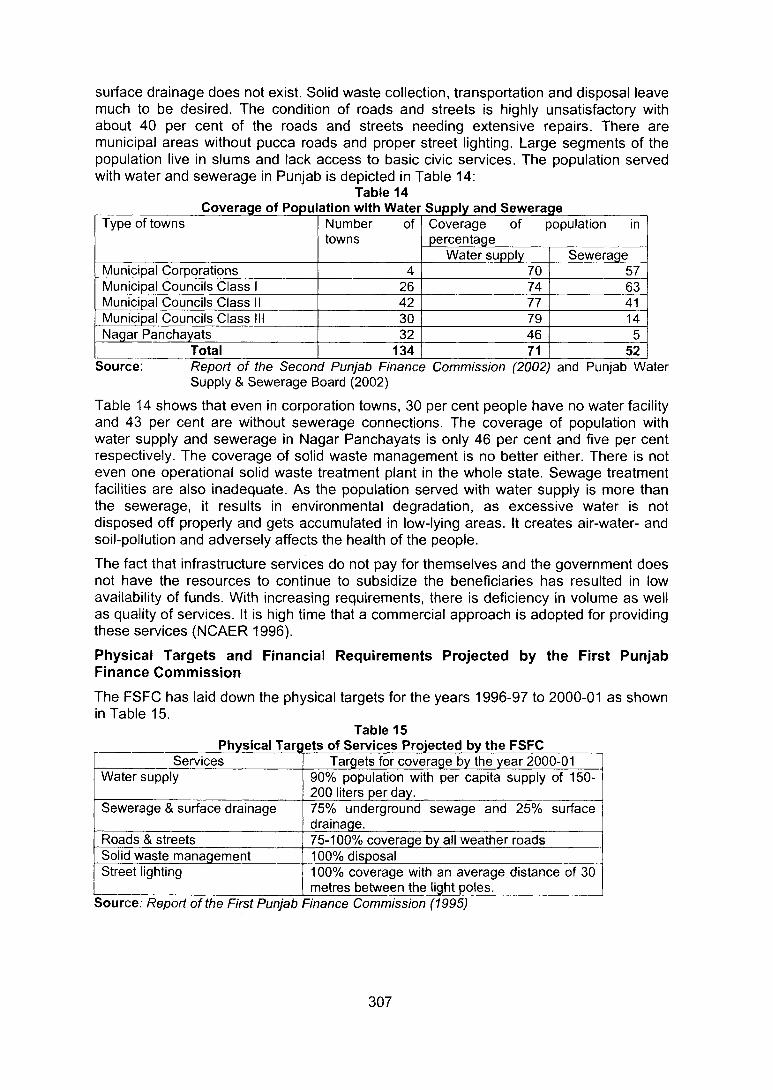
surface drainage does not exist. Solid waste collection, transportation and disposal leave much to be desired. The condition of roads and streets is highly unsatisfactory with about 40 per cent of the roads and streets needing extensive repairs. There are municipal areas without pucca roads and proper street lighting. Large segments of the population live in slums and lack access to basic civic services. The population served with water and sewerage in Punjab is depicted in Table 14:
Table 14Coverage of Population with Water Supply and Sewerage_________
Type of towns Numbertowns
of Coverage of population in percentage_____
Water supply SewerageMunicipal Corporations 70 57Municipal Councils Class I 26 74 63Municipal Councils Class II 42 77 41Municipal Councils Class 30 79 14Nagar Panchayats 32 46
Total 134 71 52Source: Report of the Second Punjab Finance Commission (2002) and Punjab Water
Supply & Sewerage Board (2002)
Table 14 shows that even in corporation towns, 30 per cent people have no water facility and 43 per cent are without sewerage connections. The coverage of population with water supply and sewerage in Nagar Panchayats is only 46 per cent and five per cent respectively. The coverage of solid waste management is no better either. There is not even one operational solid waste treatment plant in the whole state. Sewage treatment facilities are also inadequate. As the population served with water supply is more than the sewerage, it results in environmental degradation, as excessive water is not disposed off properly and gets accumulated in low-lying areas. It creates air-water- and soil-pollution and adversely affects the health of the people.
The fact that infrastructure services do not pay for themselves and the government does not have the resources to continue to subsidize the beneficiaries has resulted in low availability of funds. With increasing requirements, there is deficiency in volume as well as quality of services. It is high time that a commercial approach is adopted for providing these services (NCAER 1996).
Physical Targets and Financial Requirements Projected by the First Punjab Finance Commission
The FSFC has laid down the physical targets for the years 1996-97 to 2000-01 as shown in Table 15.
Table 15Physical Targ ets of Services Projected by the FSFC
Services Targets for coverage by the year 2000-01Water supply 90% population with per capita supply of 150-
200 liters per day.Sewerage & surface drainage 75% underground sewage and 25% surface
drainage.Roads & streets 75-100% coverage by all weather roadsSolid waste management 100% disposalStreet lighting 100% coverage with an average distance of 30
metres between the light poles.Source.- Report of the First Punjab Finance Commission (1995)
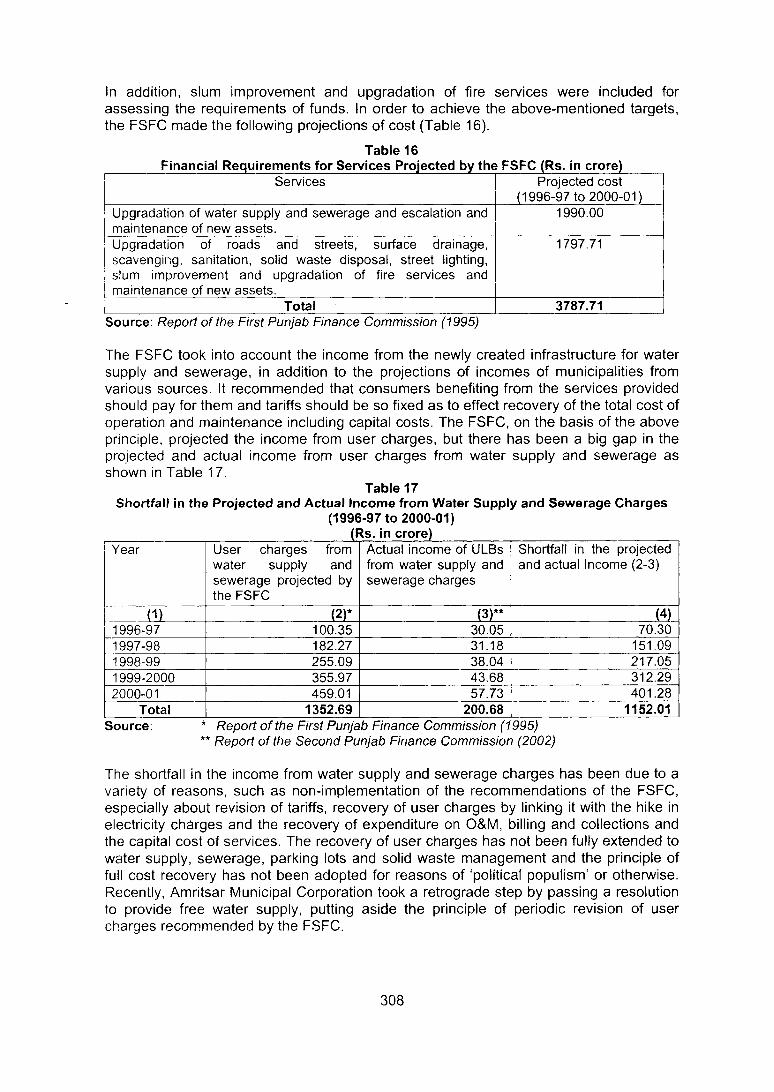
In addition, slum improvement and upgradation of fire services were included for assessing the requirements of funds. In order to achieve the above-mentioned targets, the FSFC made the following projections of cost (Table 16).
Table 16______ Financial Requirements for Services Projected by the FSFC (Rs. in crore)
Services Projected cost (1996-97 to 2000-01)
Upgradation of water supply and sewerage and escalation and maintenance of new assets.Upgradation of roads and streets, surface drainage, scavenging, sanitation, solid waste disposal, street lighting, slum improvement and upgradation of fire services and maintenance of new assets.
1797.71
Total 3787.71Source: Report of the First Punjab Finance Commission (1995)
The FSFC took into account the income from the newly created infrastructure for water supply and sewerage, in addition to the projections of incomes of municipalities from various sources. It recommended that consumers benefiting from the services provided should pay for them and tariffs should be so fixed as to effect recovery of the total cost of operation and maintenance including capital costs. The FSFC, on the basis of the above principle, projected the income from user charges, but there has been a big gap in the projected and actual income from user charges from water supply and sewerage as shown in Table 17.
Table 17Shortfall in the Projected and Actual Income from Water Supply and Sewerage Charges
(1996-97 to 2000-01)
Year User charges from water supply and sewerage projected by the FSFC
Actual income of ULBs from water supply and sewerage charges
Shortfall in the projected and actual Income (2-3)
(1) (2)* (3)** (4)1996-97 100.35 30.05 70.301997-98 182.27 31.18 151.091998-99 255.09 38.04 217.051999-2000 355.97 43.68 312.292000-01 459.01 57.73 401.28
Total 1352.69 200.68 1152.01Source: Report of the First Punjab Finance Commission (1995)
Report of the Second Punjab Finance Commission (2002)
The shortfall in the income from water supply and sewerage charges has been due to a vahety of reasons, such as non-implementation of the recommendations of the FSFC, especially about revision of tariffs, recovery of user charges by linking it with the hike in electricity charges and the recovery of expenditure on O&M, billing and collections and the capital cost of services. The recovery of user charges has not been fully extended to water supply, sewerage, parking lots and solid waste management and the principle of full cost recovery has not been adopted for reasons of ‘political populism’ or otherwise. Recently, Amritsar Municipal Corporation took a retrograde step by passing a resolution to provide free water supply, putting aside the principle of periodic revision of user charges recommended by the FSFC.

There has been a big gap in the expenditure projected by the FSFC and the actual expenditure on the provision of services as shown in Table 18. Projected expenditure on upgradation and maintenance of existing and new assets includes water supply, sewerage, storm water drainage, sanitation, roads, scavenging, streetlights, slum improvement, fire services including repayment of loans and existing expenditure of municipalities.
Table 18Projected and Actual Expenditure on Provision of Services (1996-97 to 2000-01) (Rs. in
Year Expenditure on provision of sen/ices projected by the FSFC
Actual expenditure on provision of services
Shortfalls(2-3)
(1) (2)* (3)** (4)1996-97 419.99 261.64 158.351997-98 590.15 244.45 345.701998-99 736.72 256.93 479.791999-2000 926.64 424.63 502.012000-01 1114.21 457.16 657.05
Total 3787.71 1644.81 2142.90Source: Report of the First Punjab Finance Commission (1995)
Report of the Second Punjab Finance Commission (2002)
The actual expenditure on provision of services has been much lower than projected by the FSFC. The Ninth Five Year Plan has ended with a massive backlog of funds needed for providing urban basic services in Punjab.
Physical Targets and Financial Requirements for Financing Urban Infrastructure Projected by the Second Punjab Finance Comnnission
According to the Report of the SSFC (2002) only '47 per cent of expenditure on operation and maintenance of water supply and sewerage schemes is being recovered by ULBs. In some ULBs the recovery is even less than 25 per cent of O&M expenditure’. This is so largely because rates of water supply and sewerage charges have not been revised by most ULBs since March 1993, except in Ludhiana (with effect from 5 April 1999), Jalandhar (with effect from 10 December 1999) and Patiala (with effect from 28 February 2000) Municipal Corporations. The rates continue to be highly subsidized and vary from municipality to municipality. The rates for yellow cardholders have not been revised for more than a decade.
The SSFC has worked out the present O&M cost for water supply at Rs. 2.73/- per KL, though the cost including depreciation and interest is rupees six per KL. The SSFC has recommended the following targets to recover 100 per cent O&M cost of water supply and sewerage (Table 19).
Table 19Targets for Recovery of O&M Costs Pro ected by the SSFC (2002-03 to 2005-06)
Year 2002-03 2003-04 2004-05 2005-06Targets for Recovery of O&M Costs (%)
60 80 90 100
Source; Report of the Second Punjab Finance Commission (2002)

The SSFC has recommended that efforts should be made to reduce O&M expenditure to the extent possible, through economy in energy consumption, proper maintenance of distribution pipes, privatization of preparation and distribution of bills, and to increase revenues by checking unauthorized connections. Much of the advantages of tariff reforms to cover O&M expenses in terms of saving water and preventing wastage will be lost unless water supply to the consumers is metered.
Table 20 shows estimated the targets for coverage of services and financial requirements as recommended by the SSFC for the years 2002-03 to 2005-06.
Table 20Physical Targets and Financial Requirements for O&M and
Creation of New Assets Projected by SSFC (2002-03 to 2005-06) (Rs. in crore)Particulars Targets for coverage by
the year 2005-06Financial requirements for O&M and creation
of new assets from 2002-03 to 2005-06Without escalation With escalation
(@7 % per annum)Water Supply 85%Sewerage 70% 642.00 728.29Sewage Treatment Plants
Amritsar, Patiala, Gobindgarh, Rajpura, Batala, Bathinda and Malerkotia
166.61 189.62
Solid waste management
100% 138.08 162.25
Solid waste treatment plants
Four corporation towns and a few class I & II Towns
87.85 103.25
Storm water drainage
For corporation towns _______only_______
291.50 342.20
Roads & Streets 100% 586.44 689.04Street lights 100% 270.76 318.16Surface drainage 100% 187.81 220.71Sanitation 100% 655.56 770.56Other services 117.84 138.44
Grand Total 3144.45 3662.52Source: Compiled from the Report of the Second Punjab Finance Commission (2002)
The suggested targets for provision of services seem to be on the lower side. The task is challenging, as the accumulated backlog of developmental works, especially water supply, sewerage and solid-waste management (including treatment) need massive investments. Management and handling of municipal solid waste to comply with Municipal Solid Wastes (Management and Handling) Rules, 2000, also require huge investments.
The success of the New Economic Policy and the objectives of the state government to increase economic growth and quality of life in urban areas, is critically contingent on a strong urban infrastructure and service support. Adequate provision for these services is essential to ensure creation of an environment-friendly, sustainable urban infrastructure for the citizens. In this perspective, the objectives should be to achieve the targets in the next five years in respect of core services in urban areas of Punjab as shown in Table 21. The estimates of likely expenditure on these services for the period 2002-03 to 2006- 07, taking into account the escalation in cost, have been prepared in consultation with the Local Government Department and the Punjab Water Supply & Sewerage Board.

Physical Targets and Financial Requirements for Water Supply, Sewerage, Solid Waste Management and other Infrastructure Services from 2002-03 to
Particulars Target of coverage (%) by the year 2006- 07
Financial requirements2002-
032003-
042004-
052005-
062006-
07Total
(2002-03 to 2006-
07)Water supply 100 106.0 111.0 121.0 122.0 122.0 582.0Sev^erage 100 210.0 270.0 310.0 380.0 440.0 1610.0Drainage 25 63.0 81.0 93.0 114.0 132.0 483.0Sewage treatment Plants
100 168.0 168.0 168.0 168.0 171.0 843.0
Solid waste Management(a) Extension and augmentation of collection and transportation(b) Treatment and disposal
100
100
20.0
25.0
20.0
25.0
20.0
25.0
20.0
25.0
25.0
25.0
105.0
125.0O&M of water supply &sewerage system
167.5 171.0 174.0 177.5 187.0 877.0
Roads & Streets 100 140.0 140.0 140.0 140.0 140.0 700.0Street lights 100 60.0 60.0 60.0 60.0 60.0 300.0Fire services 100 35.0 35.0 35.0 35.0 35.0 175.0Parks, gardens, urban forestry, parking and bus stands etc.
40.0 40.0 40.0 40.0 40.0 200 0
Grand Total - 1034.5 1121.0 1186.0 1281.5 1377.0 6000.0
Source: 1) Punjab Water Supply and Sewerage Board (2002)2) Local Government Department, Punjab3) CRRID Projections
The estimated investment to cover the total population with water supply, sewerage, solid waste management, roads, street lights is Rs. 1,034.5 crore in the first year, i.e., 2002-03. The total funds needed for investment from 2002-03 to 2006-07 have been estimated at Rs. 6,000.0 crore.
Projection of Income and Expenditure of Urban Local BodiesThe projected income, expenditure and resource gap of ULBs for the next five years, i.e., 2002-03 to 2006-07, is presented in Tables 22, 23 and 24 respectively.
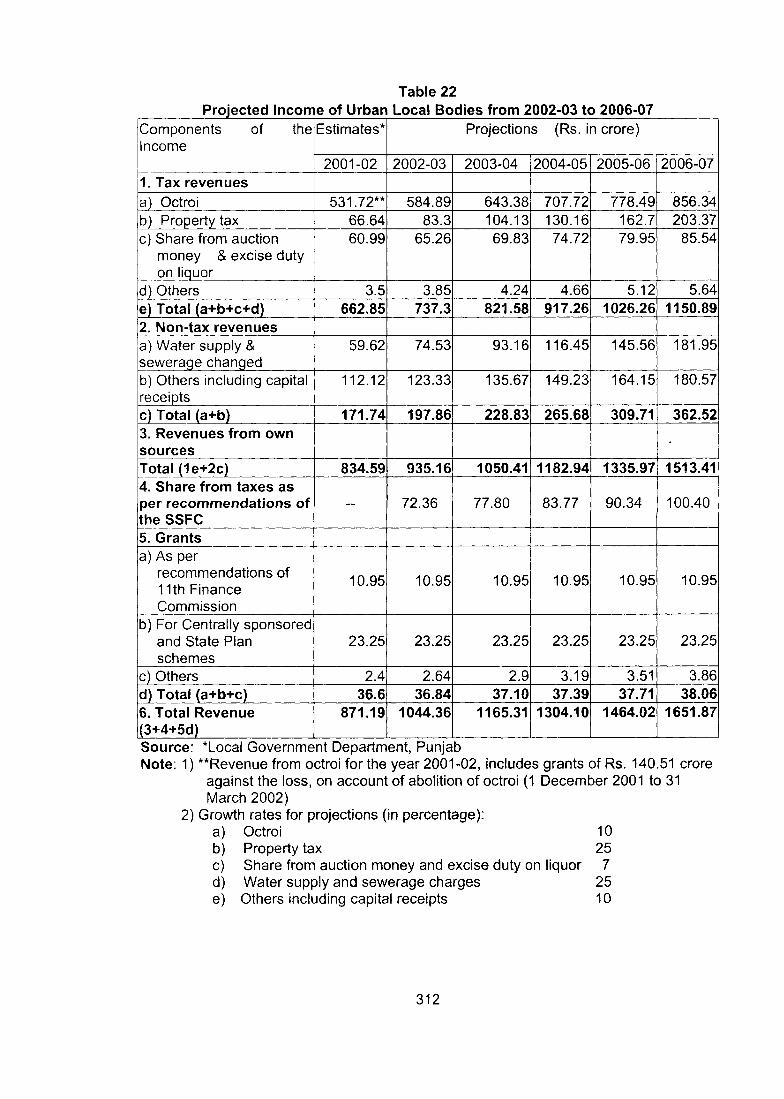
Components of the Income
Estimates* Projections (Rs. in crore)
2001-02 2002-03 2003-04 2004-05 2005-06 2006-071. Tax revenuesa) Octroi 531.72** 584.89 643.38 707.72 778.49 856.34b) Property tax 66.64 83.3 104.13 130.16 162.7 203.37c) Share from auction
money & excise duty on liquor
60.99 65.26 69.83 74.72 79.95 85.54
d) Others 3.5 3.85 4.24 4.66 5.12 5.64e) Total (a+b+c+d) 662.85 737.3 821.58 917.26 1026.26 1150.892. Non-tax revenuesa) Water supply & sewerage changed
59.62 74.53 93.16 116.45 145.56 181.95
b) Others including capital receipts
112.12 123.33 135.67 149.23 164.15 180.57
c) Total (a+b) 171.74 197.86j 228.83 265.68 309.71 362.523. Revenues from own sourcesTotal (1e+2c) 834.59 935.16 1050.41 1182.94 1335.97 1513.414. Share from taxes as per recommendations of the SSFC
- 72.36 77.80 83.77 90.34 100.40
5. Grantsa) As per
recommendations of 11th Finance Commission
10.95 10.95 10.95 10.95 10.95 10.95
b) For Centrally sponsored and State Plan schemes
23.25 23.25 23.25 23.25 23.25 23.25
c) Others 2.4 2.64 2.9 3.19 3.51 3.86d) Total (a+b+c) 36.6 36.84 37.10 37.39 37.71 38.066. Total Revenue (3+4+5d)
871.19 1044.36 1165.31 1304.10 1464.02 1651.87
Source: *Local Government Department, PunjabNote; 1) **Revenue from octroi for the year 2001-02, includes grants of Rs. 140.51 crore
against the loss, on account of abolition of octroi (1 December 2001 to 31 March 2002)
2) Growth rates for projections (in percentage);a) Octroi 10b) Property tax 25c) Share from auction money and excise duty on liquor 7d) Water supply and sewerage charges 25e) Others including capital receipts 10

Table 23Projected Expenditure of Urban Local Bodies from 2002-03 to 2006-07
Components of expenditure Estimates* Projections2001-02 2002-03 2003-04 2004-05 2005-06 2006-07
1. General administration 39.98 40.64 43.48 46.53 49.78 53.272. Tax collection 52.24 55.00 55.00 55.00 55.00 55.003. Provision of services 530.31 609.86 701.33 806.54 927.52 1066.644. Debt servicing a) Interest 2.70 4.70 4.70 4.70 4.70 4.70b) Repayment of principal 7.17 8.50 8.50 8.50 8.50 8.50c) Liabilities of old loan - - - 7.00 17.50 31.50d) Total (a+b+c) 9.87 13.20 13.20 20.20 30.70 44.705. Miscellaneous 150.10 165.11 181.62 199.78 219.76 241.74Total Expenditure (1+2+3+4d+5) 782.50 883.81 994.63 1128.05 1282.76 1461.35Source: *Local Government Department, Punjab.
Table 24_________Projection of Resource Gap from 2002-03 to 2006-07 (Rs. in crore)
Particular Years2002-03 2003-04 2004-05 2005-06 2006-07
Total
Total income of ULBs 1044.36 1165.31 1304.10 1464.02 1651.87 6629.66Total exp. of ULBs 883.81 994.63 1128.05 1282.76 1461.35 5750.60Surplus 160.55 170.68 176.05 181.26 190.52 879.06
Table 24 projects a surplus for the next five years, but this alone cannot meet the requirement of funds by ULBs for financing urban infrastructure. Therefore', gigantic efforts are needed to raise funds to finance basic urban infrastructure for the entire urban population to make cities livable.
Strategic Planning for Financing Basic Civic Services and Urban infrastructure
Broad contours of reforms in non-tax sources, as discussed below, will enable additional generation of resources as also direct and indirect cost recovery. The Local Government Department should improve buoyancy of existing taxes and use tools of resource mobilization to finance urban infrastructure. The following steps can improve pricing and cost-recovery of water supply and sewerage and improve fiscal health of ULBs:
• Metering of water supply, as it will be fair and equitable to both providers and consumers.
• Rationalization/revision of water supply and sewerage charges linked with electricity tariff.
• Detection of arrears and charging interest on delayed payments.• User charges should cover all civic services that qualify for levy of user charges.• Involvement of citizens in fixation of tariffs, checking misuse of services including
detection of thefts.

These objectives can best be achieved through strong political will, peoples’ participation and better use of information technology, i.e., computerization of billing and collection, creation of database and display of all important information/events on websites. According to the India Infrastructure Report (NCAER 1996) ‘cost minimization needs appropriate technology, proper attention on maintenance, curbing misuse of services and efficient service provisions’. Technological innovations in water supply, sewerage and solid waste management can promote low cost options and commercial viability of the projects. Recycling of water and re-charging/conservation of rainwater should be promoted.
There is tremendous scope for private sector participation (PSP) in infrastructure development and delivery of services. PSP can help in developing commercially viable projects and ensure efficient provision/delivery of services, customer satisfaction, pricing and cost recovery. LMC has succeeded successful in mobilizing resources and upgrading the level and quality of environmental infrastructure through public-private partnership. The practices adopted by LMC need to be implemented by other municipalities as well.
Additional Resource Mobilization for Financing Urban Infrastructure
The financial targets for providing the projected basic civic services could be achieved by revising the existing tariffs and recovery of 100 per cent cost of O&M of water supply and sewerage in the next five years. This will create confidence among national and international investors. Revision of water supply and sewerage tariff will generate additional revenue of Rs. 20 crore per annum. Punjab could take the clue from ULBs of other states with higher rates of water supply and adjust its own rate structure on the pattern of such cities as Jaipur, Chandigarh, Bangalore and Chennai, etc., as shown in the Table 25.

Cities Metered rates (Non-slab) (In Rs/KL/Month)
Unmetered flat rates (In Rs.A'ear)
Metered slab rates (In Rs./KL/ Month)
Domestic Non - domestic
Industrial Domestic Non - domestic
Industrial Domestic Non-domestic Industrial
Vishakhapatnam 5.00 - 12.00 480.00 - - - - -
Madurai 5.00 - 20.00 240.00 - 3360.00 - - -
Hyderabad 3.50 15.80
'
480.00
■
** 55.00-up to15KL 3.75-15-25 KL6.00-25-50 OKL
- -
Ahemedabad 3.00 - - - - 25-30% of ARV
- - -
Pune 2.50 12.00 - - - - - - -
Bangalore 60.00 65.00 (minimum) 3.50 upto 25 KL7.00-25-50 KL19.00-50-75 KL26.00-75-100 KL
33.00 upto 10 KL39.00-10-20 KL44.00-20-40 KL51.00-40-60 KL57.00-60-100 KL60.00 above 100 KL
Chennai 600.00 4800.00 2.50 upto 10KL10.00-10-15 KL15.00-15-25 KL25.00-above 25 KL
25.00 upto 500 KL 40.00- above 500 KL
Bhopal - - 8.00 720.00 - - - - -
Jaipur
■ ■ ■ ■ ■ '
1.56 upto 15 KL 3.00-15-40 KL 4.00 above 40 KL
4.68- upto 15 KL 8.25-15-40 KL 11.00- above 40 KL
11.00- upto 15KL 13.75-15-40 KL 16.50 above 40 KL
Chandigarh** 9.00 11.00 — 1.75 upto 15 KL 3.50- 15-30 KL 5.00-30-60 KL 6.00 above 60 KL
— —
Source: 1) * National Institute of Urban Affairs (2001), Urban Water Supply and Sanitation: Status and Investment Implications, NiUA, New Delhi 2) ‘ ‘ Municipal Corporation of Chandigarh (August 2002)

The slab system is equitable as it takes care of the poorer sections of the society who consume lesser quantities of water. Property tax reforms suggested in the previous section will yield an additional income of Rs. 30 crore per annum. Fees and rents constituting non-tax revenue are low and even the nominal cost of rendering these services are not recovered. Rationalization of fees and rents is estimated to yield anadditional income of Rs. 10 crore per annum. The breakup of additional resource mobilization is given in Table 26.
Table 26Additional Resource Mobilization by Urban Local Bodies
Revision of tariff on user charges Rs. 20 crore per annumIncreased income from property tax Rs. 30 crore per annumEnhanced recovery from fees and rents Rs. 10 crore per annumTotal additional income Rs. 60 crore per annum
This will strengthen the fiscal capability of ULBs and will help to raise finances form the capital market. The proposed financing of implementing projected urban infrastructure and services is given in Table 27.
Table 27
Contribution by urban local bodies Rs.150 crore per annumTransfer from the Punjab Infrastructure Development Board (On the pattern of transfer to Public Works Department (PWD)/Bridges and Roads (B&R) and Irrigation Department)
Rs.75 crore per annum
Earmarked contribution by the State Government out of devolution of funds
Rs.75 crore per annum
Total Rs.300 crore per annum
Financing urban infrastructure and basic services requires Rs. 6,000 crore, i.e., an average investment of Rs. 1,200 crore per annum. With an additional resources of Rs 300 crore on account of improved fiscal performance by the municipalities, consequent upon reimposition of octroi, upward revision of tariffs and user charges, PT reforms, better tax administration and economy in expenditure supported by political will, it is possible to raise Rs. 900 crore per annum from national and international capital markets. Rating agencies will give a good rating to raise tax-free municipal bonds. Institutions such as LIC, General Insurance Corporation (GIC), HUDCO, Industrial Credit and Investment Corporation of India (ICICI) and Infrastructure Leasing and Financial Services (IL&FS) too will support commercially viable projects. A part of the assured income of ULBs could be dedicated to the escrow account to assure timely payment of principal and interest, to enhance the confidence of the investors in municipal debt instruments.
A project report based on the above parameters, including cash flow statements, to meet the requirements of rating agencies and lenders should be prepared by a group of professionals. The project report should be acceptable to lenders for subscribing to the tax-free bonds/loans in suitable tranches, for raising funds through private placement from the capital market. The ‘aims and objects’ of raising the funds would be attractive, being developmental, covering the entire community including the poor and the deprived.

Municipal Bonds for Financing Urban infrastructure
‘Municipal Bonds’, as an instrument to finance urban infrastructure, is relatively a new concept in India. This mode of accessing the capital market on the strength of commercially viable projects took its birth in the mid-nineties. The New Economic Policy (NEP) along with liberalization and structural adjustments has led to search for an alternative system of financing infrastructure development.
There is concern today for promoting efficient use of resources, which traditionally comprised subsidies, grants and loans. This system of financing could not make the municipal administrators proactive in rationalizing tariffs for ‘user charges’, to put in place an effective system of cost recovery. Availability of funds for the development of urban
^infrastructure and services from traditional sources is presently unthinkable. All this has culminated in a change of mindset for accessing the capital market by issuing municipal bonds. Till date, the cities of Ahemedabad (twice), Nagpur, Nasik, Indore, Ludhiana, Bangalore, Madurai and Hyderabad have accessed the capital market for raising funds through municipal bonds as shown in Table 28.
Table 28Access of Municipal
Name of municipalities Year of issue
Size of issue (Rs in crore)
Governmentguarantee
Creditrating
Ahemedabad Municipal Corporation
1998 100.0 NO AA(SO)
Bangalore Mahapalika 1997 100.0 NO A (SO)Ludhiana Municipal Corporation
1999 17.8 NO AA(SO)
Nasik Municipal Corporation 1999 100.0 NO AA(SO)Nagpur Municipal Corporation 2000 50.0 NO AA- (SO)Madurai Municipal Corporation 2001 30.0 NO A +(S0)Indore Municipal Corporation 2001 10.0 Yes N.AAhmedabad Municipal Corporation
2002 100.0 NO AA(SO)
Hyderabad Municipal Corporation
2002 82.5 NO AA+(SO)and
LAA+(SO)Source; Gangadhar Jha, (2002):
DelhiDevelopment of Municipal Bond Market in India, NlUA, New
Jhe Government of India has permitted raising of tax free bonds by city governments, for structuring commercially viable/bankable projects and for developing a long-term debt market. The Union Finance Ministry permitted raising tax-free municipal bonds upto Rs. 200»crore in 2001-02. This amount has been increased to Rs. 500 crore in 2002-03. HUDCO has created a fund for project development and restructuring, for participation in the emerging bond market. The success of raising funds from the capital market is contingent on the internal financial strength, which will enable city governments to obtain investment-grade credit rating, for accessing the capital market and service the debts thus raised.
Financing of urban infrastructure through credit rating calls for certain reforms. The accounting system has to be such that it throws light on the basic parameters of financial strength and performance of city governments. Some states, notably Tamil Nadu, have

switched over to a new accrual-based double-entry accounting system for municipal governments. Other measures include tax reforms, effective tax administration, rationalization of user charges, effective billing and collection, asset management and upgrading professional skills of municipal staff through extensive training.
There is need to raise low cost resources to bridge the backlog of infrastructure services. To achieve it Tamil Nadu Urban Development Fund (TNUDF) raised Rs. 110.05 crore from the capital market on the basis of LLA + (SO) rating. TNUDF has so far approved a number of projects costing Rs. 669.60 crore, comprising such core amenities as improvement of sewerage, storm-water drainage, sanitation, solid waste management services and augmentation of water supply. Financial institutions at the national level, such as ICICI, IDFC, IL&FS and HUDCO are important partners of the Fund. TNUDF was able to obtain a loan also from the International Bank for Reconstruction and Development (IBRD), linked to performance criteria. Based on this support, the it floated the first non-guarantee unsecured bonds in the capital market, issued by a financial intermediary with urban municipal cash flow as its base. Financial institutions, commercial banks and insurance companies are the major subscribers to the bond issue. This was part of TNUDF’s efforts to position itself as a pooled financial agency for the smaller ULBs for providing funds for urban infrastructure on a long-term basis. Lenders to the municipalities are provided escrow cover to ensure repayments (TNUDF 2001).
Punjab Infrastructure Development Board (PIDB), responsible for overall development planning, policy formulation, regulation and single window approvals for infrastructure development in the state, was established under the Punjab Infrastructure Development Act, 1998. It provides for the establishment of Punjab Infrastructure Initiative Fund to accelerate the development of infrastructure in Punjab. A cess of one per cent on the sale of petrol/diesel and agricultural produce, except fruits, vegetables and pulses, is credited to Punjab Urban Development Fund (PUDF). In 2000-01, PIDB raised Rs. 300 crore through private placement of bonds rated by Investment Information and Credit Rating Agency (ICRA) as ‘LA (SO)’, indicating adequate safety and timely payment of interest and principal. For this, the Punjab Government gave an irrevocable guarantee for repayment of principal and interest thereon till maturity. The repayment has been ensured through escrow mechanism. The existing financing pattern of PIDB indicates that funds raised by it through infrastructure-cess and bonds have not been used for urban infrastructure, which comprise water supply, sewerage disposal and treatment, municipal roads, street lighting, solid waste management, parks and urban mass transit system. This requires immediate intervention.
The other innovative entities are West Bengal Municipal Development Project, Karnataka Municipal Development and Urban Infrastructure Projects, Mumbai Urban Infrastructure Development Project, Rajasthan Urban Infrastructure Development Project, Preparatory Technical Assistance for Calcutta Municipal Environmental Improvement Programme and National Urban Environmental Infrastructure Fund. All these projects/ funds have essentially a common denominator, such as assistance from the World Bank, Asian Development Bank (ADB) or other international funding agencies and the local capital market, for raising funds for the improvement of the quality of urban life including the poor.
The Finance Minister, Government of India, in his budget speech (2002-03) observed, ‘we are aware of the sad plight of most of our towns and cities. This needs to be

changed if they have to act as engines of growth, and if they are to provide a healthy environment for our citizens. Hence, we can no longer afford to delay reforms in this sector.’
The Local Government Department should look for assistance from the World Bank, ADB and other international agencies, by structuring viable and bankable projects through escrowing a portion of the income of ULBs for credit enhancement and giving confidence to investors. There is need to create a pooled financing mechanism in Punjab to enable ULBs, especially in the small and medium towns, as in Tamil Nadu, to raise funds for financing urban infrastructure.
The India Infrastructure Report (NCAER 1996), in its chapter on Urban Infrastructure, has recommended that ‘a state level Regulatory Body be set up to monitor quality of services provided and price charged’. It is incumbent on the state to create a strong regulatory mechanism, to promote PSP in project development, its financing, pricing and cost recovery (user charges) and quality control. Regulatory measures are also important for long-term contracts, leases and concessions. The regulatory mechanism should be independent, so that it is not influenced by short-term populist measures of political parties for electoral interests.
The regulatory mechanism has assured significance with the implementation of the New Economic Policy, characterized by liberalization and privatization. The Local Self Government Department should draw up a legislative proposal, so that the proposed regulatory body can determine and suggest suitable/viable options of public-private sector participation in infrastructure financing, delivery of services and pricing and cost recovery. Regulated PSP promotes competitiveness and improves quality of services. The charges and rates of services fixed by the regulatory mechanism, after hearing the consumers and other stakeholders, will create confidence in their authenticity and the utilization of the revenue earmarked for development projects for the benefit of the persons paying these charges. The regulatory mechanism will be able to identify various types of risks in PSP projects and the inefficiencies of the organization providing and delivering the services. The result of such an exercise would be that the consumers would not have to pay for inefficiencies at different levels.
PRIVATE SECTOR PARTICIPATION AND PEOPLE’S INVOLVEMENT IN MUNICIPAL AFFAIRS AND URBAN DEVELOPMENT
Urbanization in Punjab is expected to accelerate in the current decade on account of economic reforms, industrialization, commercial growth and consequent migration to cities for employment. It will create a demand for efficient urban infrastructure. ULBs and other public agencies are unable to provide an adequate level of infrastructure conforming to established standards and norms, due to lack of financial resources, poor tax base and age-old technologies. There is pressure on city governments for augmentation of infrastructure services.
The fiscal stress and inability to recover the full cost of services by city governments do not permit them to even maintain the existing level of services, let alone augment them. Therefore, PSP and peoples’ involvement in municipal affairs acquire importance for enhancing the fiscal capacity of ULBs to provide adequate infrastructure services and ■educe expenditure on service delivery.
PSP is a potential option to cope with the challenges of growing needs of financing urban infrastructure. The volume of investment required for removing the backlog and also for augmentation of services is massive. This gap can be met through PSP, which may take the form of total privatization, or contracting-out, or public-private partnership. PSP will bring much needed resources, new technology, enhance efficiency and ease budgetary constraints. The private sector frequently acts as a contractor to build infrastructure facilities and sometimes operates and manages them. Now, a growing pool of domestic and international private finance is available for investing in commercially viable urban infrastructure projects, lack of which has been a serious constraint for accessing the capital market, it is expected that PSP can establish sustainable partnership between the public and private sectors. The community will benefit through PSP, as it brings in management efficiency, quick and effective decisionmaking and capacity-building for more efficient delivery of services leading to greater consumer satisfaction.
PSP can help in off-loading the financial, functional, administrative and managerial burdens of ULBs. It can also help in augmenting and maintaining rapidly expanding urban infrastructure services. A study of LMC by Gupta and Teotia (2001) shows that the involvement of PSP in municipal affairs, especially in the collection, preparation and distribution of bills, and operation and maintenance • of tube wells, has improved efficiency, along with reduction of administrative and overhead expenses and improved delivery of services.
Hyderabad Municipal Corporation has gone for PSP for its solid waste management services. About 60 per cent of the total work has been contracted out and work has been divided into ‘day units’ and ‘night units’. This has improved sanitation, resulted in an enhanced role of the community and increased participation of citizens (IHS-lndia 2002).
Two promising PSP projects in water supply and sanitation are the Tirupur Water Supply and Sewerage Project and a recent initiative to provide water supply to three mediumsized towns in Karnataka by a joint venture company. The Tirupur Project is the first water supply and sewerage project to be structured in a commercial format. It is also the first to use ‘index-based user charges’ and direct cost recovery for urban environmental services. The ‘water purchase-guarantee’ provided by the beneficiary group and equity participation by the Build-Operate-Transfer (BOT) operator are some of the good aspects of this partnership model (Mathur 2001).
Alandur Municipality has contracted out a sewerage project to a private sector operator, to augment its network, construct pumping houses and sewage treatment plants. Out of the investment of Rs. 45 crore, Rs. 13.2 crore will be provided by TNUDF as a loan. Loans from other financial institutions and internal sources of Alandur Municipality from connection charges and sewerage charges are financing the project. Alandur Project is unique in the sense that it is the first attempt to involve the community. The progress of the project is reviewed on a monthly basis through public meetings. Its success is assured as the community is responsive and the Government of Tamil Nadu is supportive of Alandur Municipality.
Rajkot Municipal Corporation has contracted out maintenance of streetlights, solid waste removal and transportation, cleaning of public toilets, maintenance of gardens and fire

stations. Pali (Rajsthan) Municipal Council has entrusted the maintenance of streetlights to the private sector. The City and Industrial Development Corporation (CIDCO), a public sector institution in New Mumbai, has had a successful experience with privatization, which included maintenance of sewerage pumps and water pumps, meter reading and billing, maintenance of parks and gardens and collection of service charges. The Karnataka Water Supply and Sewerage Board (KWSSB) has handed over O&M and augmentation of water supply and sewerage system of four cities, namely, Belgam, Hubli, Dharwad and Mysore to a UK-based private company. It will first reduce unaccounted water-use and improve operational efficiency and then arrange finance for new investments. The KWSSB has introduced an innovative pricing structure in which water charges are linked with O&M expenditure and debt servicing (IHS-lndia 2002).
Private companies have assured the Municipal Corporation of Delhi (MCD) a minimum toll tax collection of Rs. 1 billion per annum as compared to Rs. 0.57 billion collected by MCD, out of which about 30-40 per cent is establishment cost, resulting in a net income of less than Rs. 0.4 billion. A South African company has been entrusted the task of toll tax collection for NOIDA Toll Bridge, which is an exemplary infrastructure project completed with the help of PSP {Urban Finance 2002). Surat Municipal Corporation (SMC) has introduced PSP in delivery of municipal services especially solid waste collection, maintenance of street-lights, construction of roads, tree planting and operation of water treatment plants. This, along with other innovative urban management practices, has considerably improved the environmental conditions of Surat. Several states, such as West Bengal, Maharashtra, Rajasthan, Andhra Pradesh, Haryana and Madhya Pradesh too have introduced privatization in the delivery and expansion of municipal services and infrastructure development.
There is need to expand the scope of PSP to attract investment in large- and medium- size infrastructure projects. Municipalities in small and medium towns can raise loans/debt from private sector financial institutions, through the ‘pooled financing mechanism’, for financing their urban infrastructure projects.
The Government of India in its Budget 2002-03, has initiated the following reforms and sources of funds to promote PSP/ Public-Private Partnership (PPP) in urban/municipal infrastructure development:
• The Urban Reform Incentive Fund (URIF), with an allocation of Rs. 500 crore to provide reform-linked assistance to states. Apart from assisting other areas it seeks to provide incentives to reforms through initiation of PPP in the provision of civic services.
• A City Challenge Fund (CCF) has been established to support cities by funding transitional costs of moving towards sustainable and credit-worthy institutional systems of municipal management and service delivery. It will assist in partial financing of the cost of developing an economic reform programme and financially viable projects, to be undertaken by ULBs with the help of the private sector.
• The Pooled Finance Development Scheme will help credit- augmentation to assist small ULBs to access market borrowing on a credit-worthy basis.
• The Union Finance Minister has announced that 'Public-Private Partnerships will be encouraged for the provision of infrastructure facilities, the modalities for which are being worked out by a Task Force’.

Such multilateral development banks as the World Bank, (WB) and the ADB have developed guarantee schemes, to attract international private capital for financing urban infrastructure projects in developing countries. The WB facilitates access by lengthening the maturity of related borrowing. This provides ample opportunity for ULBs to go for infrastructure-related projects with the help of international funding agencies, without the direct backing of the state government. The WB also issues guarantees for project financing, under the Extended Co-Financing Facility, to cover sovereign risks associated with infrastructure projects (IHS-lndia 2002). This will improve access to international capital markets and the role of PSP in financing urban infrastructure projects in Punjab.
Punjab can benefit from these reform-linked assistance initiatives by encouraging PSP/PPP in infrastructure development and financing basic civic services. The FSFC and the SSFC of Punjab have emphasized privatization of municipal services, tax collection and infrastructure development activities. The recommendations of the First and Second State Finance Commissions should be considered seriously and implemented to pave the way for the involvement of the private sector.
People’s Participation
At present there is no involvement of people, citizen’s organizations and nongovernmental organizations (NGOs) in management of municipal affairs. Active peoples’ participation in infrastructure management, urban development and service delivery can help ULBs enhance coverage and convergence of services. Evaluation of urban poverty alleviation programmes in Punjab indicates that their poor implementation is due to lack of peoples’ participation and of neighborhood groups.
Involvement of local communities has become imperative for the success of urban development and poverty alleviation programmes, management of municipal affairs and sustainability of cities. Innovative and best practices in urban development and poverty alleviation schemes are unlikely to succeed without making the beneficiaries themselves partners in the implementation. The following area-wise issues for promoting peoples’ participation in providing some of the services and implementing different programmes need to be addressed seriously.
Water supply: There is little or no partnership of local people in the delivery of urban water service. Consumers can be actively involved at various levels of the water supply system. For instance, LMC involved local people in running tube wells through Neighborhood Tube Well Operators, resulting in economy in municipal expenditure. This practice can be replicated by other ULBs (Gupta and Teotia 2001). The other areas of peoples’ participation can be detection of leakages, thefts, water conservation and quality monitoring. Citizens can be involved in promoting the concept of ‘pricing and cost recovery’ and principles of ‘user pays’ and ‘polluter pays’. People should be mobilized to recycle waste water and use harvested rain water for lawn irrigation and other domestic purposes. According to the Ninth Five Year Plan, financing of drinking water supply programmes is a crucial issue in urban areas because of the massive investment required. In this context peoples’ involvement can help to reduce ‘wasteful use’ of water in day to day domestic activities and expenditure in service delivery, and sensitize consumers to pay the full cost of v/ater.

Sewerage: This is one of the least discussed but one of the most important and expensive services, it needs active participation of users. Inadequate coverage and poor maintenance of sewerage systems affect urban environment and health of the local population. The burden on the sewerage system is increasing due to growth in urban population and misuse of water facility. Damage of sewerage pipes, throwing of kitchen garbage and other waste material in sewers is are common phenomena, which needs to be tackled at the source. People are not aware of the ill impact of an overflowing sewerage system. They should be involved in ensuring the smooth flow of sewage. This is possible only if people do not throw non-degradable waste material in sewers and do not damage sewer lines. The principle of ‘polluter pays’ should be applied and violators should be brought to book. Dissemination of information to and education of sewer users can help ULBs to maintain the system efficiently. This will result in economy in expenditure on O&M of the sewerage system.
Baroda Citizens Council (BCC), a non-governmental organization, works intensively in 30 communities reaching 12,000 families to provide sanitation, shelter improvement, vocational training, health and education services. BCC became a partner in a slum networking project for environmental sanitation in Ramdev Nagar in 1994. People contributed 50 per cent of the cost of construction of community-level infrastructures, such as shallow-bore sewer, water line and house connections, streetlighting, roads, community garbage collection and landscaping, and the entire cost of constructing household toilets and facilities, such as bathing places (NlUA 2001). This shows that the community, if made a partner in development, can contribute in many ways.
Solid waste management: Peoples’ participation in solid waste management (SWM) in urban areas is almost non-existent. It is considered the sole responsibility of ULBs and peoples’ attitude towards it is negative. At present they are not aware about environmental, social, economic and health implications of poor waste management. ULBs suffer from financial, technical and human resource constraints in efficiently managing solid waste. Inadequate waste management in urban areas is due to lack of peoples’ involvement in solid waste management. The CRRID study (Gupta and Teotia 2001) indicates that LMC involved people in upgrading sanitation services and successfully implemented the ‘Mohalla Sanitation Scheme’ for efficient management of waste. The scheme has effected economy in municipal expenditure on sanitation and improved environmental conditions in the city. This practice should be replicated in other cities to ensure peoples’ participation in SWM and environmental improvement of neighbourhoods in urban areas.
NGOs like EXNORA in Chennai, Sristhi in Delhi, Muskan Jyoti Samiti (MJS) in Lucknow, Urban Community Development (UCD) project in Pune, Surat Citizens Council (SCC) in Surat and Baroda Citizens Council (BCC) in Baroda have demonstrated that peoples’ participation can dramatically improve sanitation in the neighbourhoods and promote compliance to user charges. The dramatic transformation of Surat into a clean and green city has been possible due to the combined efforts of the Surat Municipal Corporation and the local people, whose aspirations for a clean city have been a compelling factor in this change. The SCC, a citizen’s forum, is reported to be working on a scheme to recruit responsible citizens to function as watchdogs to ensure that the reforms continue (N!UA 2001). This has reduced expenditure of ULBs on SWM. Involvement of citizens has to be ensured in segregation of waste at source, its collection and transportation, creating awareness about the impact of littering, pricing and cost recovery, better handling of waste at home and outside. City governments need
to evolve a comprehensive plan to involve local people in sanitation and other urban environmental infrastructure schemes.
Urban poverty alleviation: The major cause of the slow progress of urban poverty alleviation schemes has been lack of involvement of local people and absence of convergence of different support systems. The Swarna Jayanti Shahiri Rozgar Yojana (SJSRY), a modified scheme after the amalgamation of Urban Basic Services for the Poor (UBSP), Nehru Rozgar Yojana (NRY) and Prime Minister’s Integrated Urban Poverty Eradication Programme (PMIUPEP), is based on development of community- based organizations aimed at improving the quality of life of the urban poor, by not only providing them with the opportunity of self-employment through subsidized loans, but also by improving prospects of wage employment. But the urban poverty alleviation programmes have been slow in taking off due to non-involvement of the urban poor in the formation of Community Based Organizations (CBOs) like Community Development Societies (CDSs), Neighbourhood Committees (NHCs) and Neighbourhood Groups (NHGs) as observed in the study conducted by the Institute for Development and Communication (IDC) on urban poverty alleviation in Punjab. Local citizens, CBOs, NGOs and other Self Help Groups (SHGs) are important stakeholders and ULBs should evolve partnership relations with them to make poverty alleviation programmes successful.
Slum improvement: Slum improvement programmes, such as the National Slum Development Programme (NSDP), being implemented at the grassroot level by NHCs and CDSs, have failed to provide physical and social amenities, community centres and housing facilities. It is largely due to the lack of participation of slum dwellers, poor convergence of sectoral and departmental programmes and non-formation of CBOs. Active participation of local slum communities through Slum/Neighbourhood Sanitation Committees, Thrift and Credit Societies and CDSs for the upgradation of physical and social infrastructure has become necessary for city-friendly development of slums. ULBs should ensure participation of slum dwellers in slum development activities and poverty alleviation programmes.
HOUSING
Housing and basic services were generally substandard in pre-partition Punjab. The problem multiplied after independence, with increased intensity of population in urban areas. Slum population over the-years has grown at a fast pace. This has resulted in substandard housing and houselessness and lack of minimal basic amenities. Land has been becoming scarce in cities and its price sky rocketing. This has constrained the growth of private sector housing. The gap in demand and supply of housing stock has increased, causing over-crowding in existing housing colonies and formation of new slums. Growth of public sector housing is not keeping pace with the demand. The situation is the worst for low-income groups, weaker sections and the Scheduled Caste population. Since housing is beyond the affordability of the poor illegal encroachment of government land is common, and there is mushroom growth of unauthorized slum colonies.
Housing is a state subject, though the central government, through its different institutions, such as HUDCO, National Housing Bank (NHB), Building Material and Technology Promotion Council (BMTPC) and National Urban Infrastructure Development Finance Corporation (NUIDFC) has been making efforts at different levels

Currently, these organizations are striving to improve housing stock and upgrade urban infrastructure. The state Government earlier through the Housing Board and now from 1995 onwards through Punjab Urban Development Authority (PUDA), is involved in land development and construction of houses, commercial complexes and shops in cities and towns of Punjab.
Despite a quantitative increase in the housing stock over successive decades, the housing situation in Punjab continues to be unsatisfactory. A study conducted by the Socio- Economic Research Foundation (SERF), New Delhi, for the Ministry of Urban Affairs and Employment, Government of India, and the Department of Housing and Urban Development, Government of Punjab, has estimated the shortage of housing in Punjab. This is shown in Table 29.
Table 29Estimated Housing Shortage in Urban Areas of
_________________ Punjab in 1995, 1997 and 2002________________________SNo. Particulars Shortage in urban areas
1995 1997 2002Projected urban population 66,47,080
(68,08,518)69,88,366
(72,56,857)78,93,802
(85,11,156)Size of household 5.62 5.62 5.60Number of households 11,82,754 12,43,481 14,09,607Total housing stock 12,16,360 12,72,445 14,28,454Number of vacant houses 1,01,201 1,04,086 1,12,562Available housing stock 11,15,159 11,68,359 13,15,892Houses needed for decongestion 93,438 98,235 1,11,359Replacement of unserviceable kutcha houses
3,134 3,295 3,740
Replacement of other houses in bad condition
29,983 31,522 35,729
10 Allowance for vacancy for covering Shortages____________________
8,017
11 Housing shortages (3-6) +7+8+9+10
1,94,150 2,08,174 2,52,560
Source; Studv on Preparation of Sectoral Housing Action Plan: Punjab State, SERF,1996, New Delhi.
Note: Population figures in parenthesis (s. no.1) have been calculated on the basis ofACGR of urban pODulation of Punjab recorded by the Census of India during 1991 & 2001.
Requirement of funds and land for housing in urban areas during 1995 to 2002, estimated by SERF, is as below:
FundsLand
Rs. 11,304.18 crore 5,012.76 hectares
Out of Rs. 11,304.18 crore, required for financing urban housing (1995-2002), Rs. 11,087.74 crore was for construction of new houses, Rs. 80.89 crore for structural upgradation of houses and Rs. 136.55 crore for additions to existing houses. Out of 5,012.76 hectares of urban land required for housing during 1995-2002, 1,065.97 hectares were needed during 1995-97 and 3,946.79 hectares during 1997 to 2002.
Requirements of funds and land, based on the projection of population growth, is on the lower side. If the actual population growth is considered (as shown in parenthesis in

Table 29), which is considerably higher than the projected population, the housing shortage will go up and so will the requirement for funds and land for housing. Housing, being a self-help activity, has not received much attention from the public sector. The state has been engaged in the construction of houses for its employees. Moreover, plan outlays for housing have not been adequate. Table 30 shows approved plan outlays and expenditure on housing in Punjab for the Eighth, Ninth and Tenth Five Year Plans.
Table 30Approved Plan Outiay and Expenditure on Housing Including Police Housing (Rs. in crore)
Plans Approvedoutlay
Percentage of total outlay
ExpenditureActual
expenditurePercentage of
total expenditureEighth Five Year Plan 229.74 3.50 266.01 4.21
Ninth Five Year Plan 252.85 1.77 148.64 1.34
Tenth Five Year Plan 165.67 0.71
Source: Ninth and Tenth Five-Year Plans of Punjab, Department of Planning.Government of Punjab
Table 30 shows that the approved outlay, percentage of total outiay, actual expenditure and percentage share of housing in total expenditure have declined sharply. It is worth mentioning that housing has been allocated a negligible amount in the Tenth Five Year Plan, despite huge requirement of funds and land. The criticality of the situation is that EWS housing for vulnerable sections is not receiving any attention, as the stategovernment is involved in construction and maintenance of houses for senior officers,legislators and guest houses at Chandigarh, New Delhi and district headquarters in Punjab. Housing for the police force is another priority area, which is siphoning off a considerable portion of the plan outlay.
The current phase of economic development under the liberalization regime has opened up new options for financing housing. Such specific instruments as ‘bonds’ can finance housing and infrastructure services. Institutional finance from HUDCO, NHB, NUIDFC, Lie and commercial banks is now available without much difficulty, if land is earmarked and made available by ULBs or PUDA. Disbursements by housing finance institutions have shown impressive growth.
The following steps have been taken by the Government of India to strengthen the housing finance mechanism and promote public-private partnership to accelerate the pace of housing construction, especially for economically weaker sections;
• Hundred per cent foreign direct investment is permitted in urban infrastructureprojects under the Foreign Investment Policy in all major areas of urban development, such as housing, commercial premises, hotels and resorts.
• Private initiative is welcome in such sectors as water supply, sanitation, publictransport, housing and urban development. Non-Resident Indians (NRIs)/Person of Indian Origin (PIO)/Overseas Corporate Bodies (OCBs) are permitted to invest in housing and real estate development upto 100 per cent on a repatriable basis.

• The Government of India is committed to provide investment incentives in the form of:
■ A ten-year, 100 per cent tax holiday to enterprises responsible for developing, maintaining or operating water supply, sanitation and sewerage projects.
■ Interest-income and long-term gains of an approved infrastructure capital fund or an infrastructure capital company, from investments made in shares or long-term finance in any enterprise engaged in any area of infrastructure development, are exempted from tax, subject to fulfillment of prescribed conditions.
■ The Union Government has set up the URIF with an initial allocation of Rs. 500 crore, to provide reform-linked assistance to states, incentivise reforms in rent control laws, simplify the legal and procedural framework for conversion of agricultural land for non-agricultural purposes and to revise of bylaws to streamline the process of construction of buildings and development of sites.
■ Housing has been declared a priority area and government has repealed the Urban Land (Ceiling and Regulation) Act, 1976. It has already come into force in Punjab and will release urban land for housing and infrastructure development.
• The NHB has commenced securitization of housing loans and is operationalizingforeclosure of mortgages, to strengthen housing finance. It has also decided tolaunch a ‘Mortgage Credit Guarantee Scheme’, which would be provided to all housing loans, thereby fully protecting lenders against default. This will make housing credit more affordable, thereby increasing access to housing credit to low income groups.
• As a follow-up of the National Agenda on ‘Housing for AH’, the Government ofIndia formulated the National Housing and Habitat Policy in 1998. It aims at:
■ Creation of surplus in housing stocks either on rental or ownership basis.■ Providing quality and cost-effective shelter options, especially to the
vulnerable groups and the poor.■ Removing legal, financial and administrative barriers to facilitate access
to land, finance and technology.■ Forging strong partnerships between private, public and co-operative
sectors to enhance the capacity of the construction industry to participate in every sphere of housing and habitat.
■ Using technology for modernizing the housing sector, to increase efficiency, productivity, energy-efficiency and quality.
The National Housing and Habitat Policy (NHHP) has laid down the role of all stakeholders, i.e., the Central Government, State Government, public/private housing finance companies, development authorities, corporate-private-co-operative sectors and research and technology transfer organizations, to achieve the goal of ‘shelter for all’.
It is in the context of the above reforms, supporting housing projects, that the Punjab Government should benefit from reform-linked assistance from the Union Government. Efforts should be made to conform to the objectives set by NHHP. Since the Union Government is committed to provide support in the form of equity contribution, concession/incentives and a transparent regulatory mechanism, the State Government should remove all legal, administrative and regulatory barriers to access to housing

finance, construction and land development. It should declare housing a priority area in the annual plans.
The present situation indicates that HUDCO, Housing Development and Financial Corporation (HDFC) and the nationalized banks are not helping vulnerable groups adequately for housing activities and the housing backlog is increasing every year. Urban infrastructural requirements, particularly land assemblage, development of land, trunk and peripheral services, power, water and sewerage, and agencies and sources of financing for the next five years, need to be identified and a linkage established with the institutions concerned to ensure success of the programmes. The private sector has plenty of money and the state government should tap this buoyant source for financing housing and urban infrastructure activities.
The state government has constituted PIDB, to act as a nodal agency for implementing infrastructure and urban development programmes. A PUDF has been created to meet the needs of finances for urban infrastructure. Punjab Infrastructure Fund Rules, 2001, and Punjab Infrastructure (Development and Regulation) Act, 2002 are landmark measures designed to boost infrastructure development activities in the state. The Act should promote public-private partnership and private-sector participation in development and operation and maintenance of urban infrastructure, including housing.
The existing institutional set-up does not meet the needs of the houseless population. Housing is a complex problem and has several dimensions. A good housing project should have adequate basic services, such as water supply, sewerage, drainage, solid waste management, electricity and streetlights, etc., and a good location. This requires co-ordination with several departments and agencies. Therefore, an institutional set-up should be identified for converging essential activities for supporting and implementing housing projects. At the district level, ‘Housing Action Plans’ should be prepared with special focus on houseless urban population and economically weaker sections.
As a follow-up to NHHP, the state government needs to liberalize the legal and regulatory regime, promote participation of the private sector and co-operatives in housing, undertake appropriate reforms for easy access to land and empower ULBs to discharge their responsibilities in regulatory and developmental functions. The role of the state must be changed from that of a builder to an enabler, or facilitator. Punjab Urban Development Authority (PUDA) also needs to revamp and redefine its role for facilitating land-assembly and development of infrastructure. It should move away from direct construction activity and forge partnerships with the private sector and co-operatives for housing construction in an efficient manner, by devising flexible schemes to meet the users’ requirements. The corporates, State and Central Governments, private sector and co-operatives should work together for land assemblage, construction of housing and development of amenities. The private sector, co-operatives and NGOs should collaborate with the state government/PUDA for construction of houses and work out schemes for slum rehabilitation/reconstruction/development on a cross-subsidization basis. Finance companies should redefine their role and devise schemes to lend at affordable rates to those who are in dire need of housing-finance support. Funds could be mobilized from provident funds, insurance funds and mutual funds to finance housing activities. Low-cost and locally available material and user-friendly technologies should be adopted to promote city-friendly and eco-friendly housing construction.

Social housing schemes for EWSs and LIGs, under implementation in Punjab with state plan provision and loan assistance from HUDCO and other financial institutions, should make housing more affordable for vulnerable groups. The rate of interest should be brought down to promote housing for the urban poor, including pavement dwellers living below poverty line (BPL). The Night Shelter Scheme for pavement dwellers, initiated during the Eighth Plan and modified in 1992, should be revitalized to construct community night shelters with basic civic amenities. Efforts should also be made to make the Night Shelter Scheme self-supporting in maintenance.
There is a need to explore the possibility of external assistance for housing projects. Such organizations as Kreditanstalt fur Wiederaufbau (KfW), IBRD and ADB have provided loan assistance/grants to HUDCO for construction of houses for economically weaker sections. Housing, being a capital-intensive activity, needs huge funds. Efforts should be made by Central as well as State Governments to attract external assistance from international agencies, as soft loans and grants for housing for underprivileged sections.
The housing agenda must promote accessibility of the urban poor to housing and basic amenities. Central and State housing agencies should concentrate on low-cost, affordable housing for the poor, integration of income generation programmes with housing activities, easier availability of loans and grants to purchase land and material, assistance for construction of individual houses, and simplification of legal and documentation procedures involved in the above activities. Such cities as Ludhiana, Amritsar, Jalandhar, Patiala, Ferozpur and some other class I and class II towns have a higher concentration of houseless population, as well as people below poverty line. These cities and towns need special attention. Slums and squatter settlements should be given preference and separate housing schemes introduced for people living below poverty line. A viable credit system should be developed to provide services to informal- sector housing.
SLUM DEVELOPMENT
There is lack of consensus on a uniform definition of slums. Section 3 of the Slum Areas (Improvement and Clearance) Act of 1956 has defined slums but the definition is not comprehensive. The Census of India, 2001, has defined slums as ‘all areas notified as slums by the state/local government under any Act’, and ‘all areas recognized as slum by state/local government, which have not been formally notified as slum under any Act’ and ‘a compact area of about 300 population or about 60-70 households or poorly-built congested tenements, in unhygienic environment, usually with inadequate and lack of any proper sanitary and drinking water facilities’.
There is mushrooming growth of urban slums in Punjab. This is largely due to shortage of low-cost housing, high price of land and unabated migration of workforce from rural to urban areas. Slums present a very dismal picture of an habitat unfit for human habitation, with or without minimal basic amenities and civic services. They have serious deficiencies of water supply, sewerage and solid waste management. Physical, environmental and socio-economic decline is visible in every area of life in the slums. High levels of air, water and soil pollution affect the health of the slum dwellers as well as other urban people.

The Census of India, 2001, after forming ‘enumeration blocks’ for slums, collected data from 28 towns (10 class I and 18 class II towns as per 1991 Census), except Mohali, where no slum pocket was identified. Table 31 shows slum population in Punjab in 2001.
Table 31__________________ Slum Population in Punjab, 2001______
Population living in slum pocket/areas in the state (in lakh)Total population of the 28 towns in which slums have been identified (in lakh)__________________________ ________________
58.88
Percentage of slum population of 28 towns to the total population of these towns
19.56
Percentage of slum population to total urban population of the state 13.97Percentage of slum population to total population of the state 4.74
Source: Census of India, 2001
Table 31 shows that Punjab has 11.52 lakh slum dwellers. A considerable percentage of urban people live in slum-like conditions, but have not been included in the overall total of slum dwellers, as the Census has not considered slums of all the towns. If slums of all towns were included, the slum population would go up. A Compendium on Indian Slums, prepared by the Town and Country Planning Organization of the Ministry of Urban Development, Government of India, has shown higher slum population in Punjab, i.e., 14.10 lakh (23.60% of the urban population) in 1996.
The National Report on Environment and Development, submitted by the Government of India to the United Nations Conference on Environment and Development (Rio Conference), held in 1992, shows that ‘the growth rate of slum population in Indian cities, largely through continuing migration is significantly faster than that of other segments of urban population. Indian cities also have very high levels of air and water pollution’. Poor people settle in slums because of availatDility of low-cost housing and transportation close to workplaces. The National Commission on Urbanization (1988) too states that ‘urban centres have generated the most brutal and inhuman living conditions, with large sections of the citizens living in squatter settlements. The overcrowding in the slums and the desperate lack of water and sanitation leads not only to severe health problems but to abject degradation of human life’ (cited in CMAG Newsletter 2002). Punjab is no exception to this, in this context, the pace of slums formation and the enormous numbers involved, make it one of the major challenges for urban policy makers.
The Central Government, through different legislations, such as Slum Areas (Improvement and Clearance) Act, 1956, and Urban Land (Ceiling and Regulation) Act of 1976; schemes/ programmes, such as Environmental Improvement of Urban Slums (ElUS) of 1992; Integrated Child Development Services (ICDS), 1975; Urban Community Development Programme, 1979; UBSP, 1990; NRY, 1989; PMIUPEP, 1995; NSDP, 1996; and SJSRY, 1997 are all aimed at eradicating poverty, improving housing and environmental conditions and upgrading the level of basic amenities and civic services. The ElUS has not been implemented seriously by the Government of Punjab. This is reflected in the non-utilization of funds. Out of an approved outlay for ElUS in the Ninth Plan, as much as Rs. five crore could not be used at all. Only Rs. 1.5 crore could be

actually spent on slum improvement projects. The progress of other centrally/state- funded schemes is equally poor and the slum problem continues to loom large.
Such schemes as NSDP, which is fully funded by the Government of India, have not been implemented effectively. The NSDP, launched in 1996-97, aims at providing basic amenities and infrastructure in slum areas of ULBs. Though the Government of India has so far released Rs. 34.79 crore, only Rs.14.14 crore have been released to SUDA by the Finance Department of Punjab. The State Government must utilize the full amount released for NSDP.
The state government, through slum rehabilitation/clearance and resettlement programmes, has been trying to improve slums. Studies indicate that rehabilitation schemes have not concentrated on the genuine needs of the slum dwellers. They are provided plots/houses far from their workplaces and that too without adequate basic amenities, civic services and transportation facilities. The corporate sector has not provided adequate housing facilities for their employees and hence poor wages force them to live in slums. Slum dwellers also have a tendency to sell plots/houses allotted to them and again come back to the same location or establish new slums at some other place. There is need to make strict rules to prevent this.
The state government must work to achieve the objectives of Draft National Slum Policy (NSP). It needs to formulate a well thought-out state slum policy, which could be the basis for the development of a strategy for slum improvement on a sustainable basis. The goal of a slum development strategy should be to provide physical and social amenities, ensure urban poverty alleviation and protection of urban environment. It should concentrate on the establishment of community-based organizations and strengthening the municipal support system. ULBs have to play a pivotal role in slum development and poverty alleviation. Efforts need to be made to promote poor-friendly urban governance through legislations, regulatory mechanisms, monitoring and transparency, with the active participation of the slum dwellers and other stakeholders. The convergence of sectoral and departmental schemes on housing, urban development, poverty alleviation, education, health, self-employment and wage- employment is important to achieve the objectives of the Draft National Slum Policy and the proposed state slum policy.
The state government should make efforts to attract financial assistance/grants from such international agencies as the United Nations Centre for Human Settlements (UNCHS), which focuses on upgradation of habitat, housing and environment in urban areas; IHS (Netherlands): United Nations Children Education Fund (UNICEF), working for the welfare of women and children in urban areas; USAID; Ford Foundation: City Alliance; World Bank; Department for International Development (DFID, UK) focusing on capacity-building of city managers, reform of financial institutions and expansion and upgradation of urban environmental infrastructure; and such research networks as the International Group on Law and Urban Space (IRGLUS), working for tenure-security and related issues in urban areas.
URBAN POVERTY ALLEVIATION
Poverty is a multidimensional and multifaceted problem that represents deprivation in its starkest form. James D. Wolfenshon, President of'the World Bank, has rightly pointed out that, ‘Poverty amid plenty is the world’s greatest challenge’ {World Development Report 2000-01: Attacking Poverty). The Working Group on Urban Ppverty, appointed by

the National Commission on Urbanization (1988), observed that, ‘the most demanding of urban challenges, unquestionably, is the challenge posed by urban poverty: the challenge of reducing exploitation, relieving misery and creating more humane conditions for working, living and growth for those disadvantaged people who have made the city their home already or are in the process of doing so. The task of adequately feeding, educating, housing and employing a large and rapidly growing number of under-nourished, semi-literate, semi-skilled, underemployed and impoverished city dwellers who are living on pavements, in poorly serviced chawls, in unhygienic slums, in illegal squatters and other forms of degraded and inadequate settlements and who are struggling to make a living from low paying and unstable occupations, in a reasonable time span is the essence of development challenge facing the Indian planners today'. (Cited in Sabir Ali, 2000). '
According to the Economic Survey o f Punjab (2000-01), ‘poverty, in a broad sense does not refer to deprivation with reference to a minimum basket of goods and services that are essential for existence, it also includes socially perceived deprivation with respect to individual basic needs like shortfalls in health and education, inadequacy of shelter and deprivation associated with rigidities in social stratification’.
Measurement of Absolute Poverty in Punjab
The poverty line is a measure of absolute poverty and the Planning Commission of India (PCI) estimated state-specific poverty lines using their original identification by the Lakdawaia Committee and updating them to 1999-2000 prices using the Consumer Price Index of Industrial Workers (CPIIW) for urban households and Consumer Price Index for Agricultural Labourers (CPIAL) for rural households. The poverty line of Punjab and some selected states is given in Table 32.
Table 32State-specific Poverty Line In 1999-2000 (Rs. per capita per month)
State Rural UrbanAndhra Pradesh 262.94 457.40Assam 365.43 343.99Bihar 333.07 379.78Gujarat 318.94 474.41Haryana 362.81 420.20Himachal Pradesh 367.45 420.20Karnataka 309.59 511.44Kerala 374.79 477.06Madhya Pradesh 311.34 481.65Maharashtra 318.63 539.71Onssa 323.92 473.12Punjab 362.68 388.15Rajasthan 344.03 465.92Tamil Nadu 307.64 475.60Uttar Pradesh 336.88 416.29West Bengal 350.17 409.22Delhi 362.68 505.45All India # 327.56 454.11
Source; Planning Commission of India, New DelhiNote; # The poverty line (implicit) at all-India level is worked out
class-wise distribution of persons and the poverty ratio poverty ratio at all-India level is obtained as the weighted wise poverty ratio.
from the expenditure at all-India level. The average of the state-

The urban poverty line of Punjab is only slightly higher than in Bihar, and considerably lower than in Uttar Pradesh, Orissa, Rajasthan and the all-India average. The data on urban poverty estimates, based on these poverty lines, do not seem to convey the real picture and raise a number of methodological issues. The poverty line of Punjab, with second highest per capita income, has been fixed at the bottom along with Bihar. The measurement of the poverty line has not captured all vulnerable sections, that do not have access to housing, wage employment, basic amenities and civic services. There is a high concentration of population below poverty line and a slight upward revision of the urban poverty line could increase the number of poor considerably.
Changing Poverty Scene; Trend of Urban Poverty from 1973-74 to 1999-2000
The Planning Commission has estimated the incidence of poverty at national and state levels, using the methodology formulated in the Report of the Expert Group on Estimation of Proportion and Number of Poor (Lakdawala Committee) and applying it to consumption expenditure data from the large sample surveys on consumer expenditure, conducted periodically by the National Sample Survey Organization (NSSO). Poverty estimates for the years 1973-74 to 1999-2000 are given in Table 33.
Table 33
NSS Rounds Year People below poverty lineRural Urban Total
28 1973-74 30.47 10.02 40.49(28.21) (27.96) (28.15)
32 1977-78 18.87 11.36 30.23(16.37) (27.36) (19.27)
38 1983 16.79 11.85 28.64(13.20) (23.79) (16.18)
43 1987-88 17.09 8.08 25.17(12.60) (14.67) (13.20)
50 1993-94 17.76 7.35 25.11(11.95) (11.35) (11.77)
55 1999-2000 10.20 4.29 14.49(30 day recall basis) (6.35)
1(5.75) (6.16)
Source; Planning Commission of India, New Delhi.Note: Figures in parenthesis are percentage of people below poverty line
Table 33 shows that the proportion of urban poor in Punjab has declined from 27.96 per cent in 1973-74 to 5.75 per cent in 1999-2000, a decline of 22.21 percentage points over a period of 26 years. The absolute number of urban poor has also declined by 5.73 lakh during the same period. This decrease in absolute terms was impressive during the period 1993-94 to 1999-2000. It decreased by 3.06 lakh in six years against 3.79 lakh during the 12 years from 1987-88 to 1999-2000.
No doubt the urban poverty in Punjab has declined considerably in the last 30 years. The contribution of the cities to the SDP has also increased over the last three decades. It indicates that the increase in the pace of economic growth and a decrease in urban poverty are inversely related. But what could be termed the paradox of poverty reduction in the state is that despite growing contribution of cities to the state and national income, poverty exists in towns and cities, not in terms of the minimum per capita income to consume the required calories for biological existence, but in terms of such deprivations as miserable living conditions due to poor housing, inaccessibility to basic amenities and

civic services, illiteracy and poor health. Decrease in the ratio of urban poor not withstanding, their absolute number is still substantial. If one adds to this the nunnber of those who are deprived of shelter, basic urban services, education and health, the number of the poor would be much larger.
The incidence of urban poverty is alarming in some of the populous districts of the state. A survey of below poverty-line (BPL) families conducted by the SUDA, Punjab, is indicative of the concentration of BPL families in a few districts (Table 34).
Table 34Distribution of Urban Poor in Different Districts in Punjab, 2002__________
Districts Number of families below ______poverty line______
Percentage
Ludhiana 62431 28.27Jalandhar 50039 22.66Patiala 22684 10.27Amritsar 20292 9.19Firozepur 10854 4.92Sangrur 9365 4.25Gurdaspur 7467 3.38Bathinda 6411 2.90Mansa 5702 2.59Kapurthala 4537 2.05Faridkot 4224 1.91NawanshahrRoopnagar
3802 1.723732 1.69
Muktsar 3251 1.47Hoshiarpur 2499 1.13Moga 1794 0.81Fatehgarh Sahib 1753 0.79
Total 220837 100Source: Tenth Five-Year Special Component Plan 2002-2007 and Annual Special Component
Plan 2002-03 for Scheduled Caste, Government of Punjab (June, 2002).
Table 34 shows that Ludhiana district has the largest number of families living below the poverty line, i.e., 28.27 per cent, and more than 50 per cent of the total BPL families in the state live in only two districts, i.e., Ludhiana and Jalandhar. Ludhiana, Jalandhar, Patiala, Amritsar, Ferozepur and Sangrur together have about 80 per cent of the total BPL families.
Though decrease in urban poverty in Punjab has been much faster than in several other states, including the national average, this trend may not continue in future with the fast growth of urban population due to migration of rural poor to urban centres and of poor from such neighbouring states as, such Uttar Pradesh, Himachal Pradesh, Jammu and Kashmir, Bihar and Rajasthan with high incidence of poverty. In this context, urban poverty alleviation should be central to the urban development strategy.
The Union and State Governments have been trying to cope with this multi-dimensional problem through various poverty alleviation and infrastructure development programmes, such as ElUS, UBSP, NRY, PMIUPEP, Low Cost Sanitation (LCS), Integrated Development of Small and Medium Towns (IDSMT), NSDP, and recently, SJSRY. The strategy for poverty alleviation has focused on the development of environmental infrastructure, generation of employment and economic growth of cities. Most of the programmes have been directly targeted for poverty alleviation, but have failed to make much impact on the problem, due to a variety of reasons.

An evaluative study of UBSP in Ludhiana and Amritsar, conducted by the IDC (1998) for SUDA, Punjab, indicates several deficiencies in the implementation of poverty alleviation schemes. A few of the shortcomings are mentioned below:
• Slum identification was not done according to well accepted criteria and similarly identification of beneficiaries was not according to the norms of the UBSP.
• Inadequate support structure due to non-representation of beneficiaries, lack of intersectoral representation and co-ordination with line departments, untrained and non-responsive resident community volunteers (RCVs), lack of networking within community organizations and poor community mobilization/participation.
• The quality of training was poor and training provided for skill-upgradation was a mere formality. Such services as drainage and sanitation were poor in slums.
• Sanctioning of loans was arbitrary and beneficiaries were not identified according to the criteria of the scheme. Judged by established norms, the majority of beneficiaries of loans, training and other facilities under UBSP were found ineligible.
• Leakages of loan money were as high as 12 per cent. Delay in processing of loan applications, inadequate raw material inputs and poor marketing of products, were the other shortcomings.
• Skill-upgradation was poor as training of women beneficiaries was limited only to stitching and sewing. Once trained, they were unable to utilize their skills, since there was no linkage between skill-upgradation and setting up of micro enterprises.
It is in the context of the above factors that a plan, based on community participation, particularly of the urban poor, should be prepared to focus on human, social and infrastructure development in clusters occupied by the urban poor. There is need to build partnerships with poor communities for empowering vulnerable groups, especially women and children. Capacity-building of urban poor through Participatory Learning and Action (PLA) techniques will help them to be aware of the range of options available, learn to deal with their own problems and pool resources to become self-reliant. The experience of implementation of programmes successfully in mobilizing women and poverty-reduction in other states can be drawn upon to improve the effectiveness of urban poverty alleviation programmes in Punjab. Special action plans should be prepared for six districts with large numbers of BPL families and efforts made to converge all sectoral and line-departmental schemes targeting urban poverty.
Poverty alleviation (Seventh Schedule of the Constitution) is the joint responsibility of the Union of India and the State Government and one of the core constituents of the Directive Principles of the Constitution of India. Urban poverty alleviation is one of the 18 functions listed in the Twelfth Schedule of the 74 Constitution Amendment Act, 1992. It is in this context that the Union of India, the Government of Punjab and the ULBs of the state should make joint efforts to design policy interventions and implement pro-poor city-friendly programmes for sustainable development of urban areas. Efforts should also be made to pool resources from international financial institutions.
An effective poverty alleviation programme would need to create a proper structure consisting of RCVs and CDSs. They would have to be linked with urban local self- government, as crucial stakeholders in urban governance, for ensuring accountability and transparency. One such model is operating in Kerala, which has one of the most effective systems of poverty alleviation. The Ward Committee, constituted in each ward, has on it representation of the President of the Area Development Society (ADS),

formed by the urban poor in the ward and registered with the municipal government. The Ward Committee’s functions include giving assistance for the preparation and encouragement of development schemes within the ward and their implementation, and identification of beneficiaries of welfare schemes. The UBSP strategy in Kerala has led to a movement of urban poor women. Their organizational strength has made them respectable, responsible and equal partners in the development process within and outside their community. Self-Employed Women’s Association (SEWA), Ahemedabad, is a movement that has attempted to redress the gender equation at home, the work-place and the community. vSEWA members have improved their economic conditions by adding to their assets and work-tools, finding adequate work-space, expanding markets, diversifying into other work activities, stabilizing incomes, gaining access to raw materials and so on (NlUA 2001).
The Kerala Municipality Act, 1994, provides for the constitution of a Poverty Alleviation Fund by the municipal governments. The ULBs are mandated by the Act to contribute two per cent of their revenues to this fund every year for alleviation of poverty. This needs to be replicated in Punjab by amending the municipal legislation. This will integrate the urban poor with the formal system of governance and the implementation of urban poverty alleviation programmes will be effective and sustainable.
The World Development Report 2000-01 has emphasized ‘attacking poverty’ through ‘empowerment’, by strengthening the ability of the poor people to take and shape decisions, to ensure ‘security’ through protection of the poor from illiteracy, diseases, shocks, disasters and violence, and to provide ‘opportunity’ by stimulation of economic growth on the basis of ‘voices of the poor’, of more than 60, 000 people living below the poverty line in more than 60 countries. It is in this context and also in the light of the objectives of the national poverty alleviation programmes, that a state-level ‘urban poverty alleviation policy’ should be formulated in Punjab. It should emphasize grassroot-level political empowerment of urban poor through the CAA, social development/security and creation of adequate opportunities, with special attention to convergence/integration of various activities related to urban poverty alleviation.
References
The Punjab Municipal Act, 1911.
The Punjab Municipal Corporation Act, 1976.
Report of the First Punjab Finance Commission (1995), Department of Finance, Government of Punjab.Report of the Second Punjab Finance Commission (2002), Department of Finance, Government of Punjab.
Report of the Eleventh Finance Commission (2000), Department of Economic Affairs, Ministry of Finance, Government of India, New Delhi.
The Constitution (Seventy Fourth Amendment) Act, 1992, Ministry of Urban Development, Government of India, New Delhi.
Gupta, J. P. and Teotia, Manoj Kumar (2001), Innovative Urban Management: Resource Mobilization and Privatization in Ludhiana Municipal Corporation, GRRID, Chandigarh (unpublished Report, Submitted to NlUA New Delhi under FIRE (D) programme of USAID).

NIUA(2001),L//'jban Water Supply and Sanitation; Status and Investment Implications, National Institute Urban Affairs, New Delhi
Guidelines for Property Tax Reforms (2002), Ministry of Urban Development, Government of India, New Delhi.
NCAER (1996), The India Infrastructure Report (known as Rakesh Mohan Committee Report), National Council of Applied Economic Research, New Delhi.
USAID FIRE (D) Project (2000), Report on the Status of Water and Sanitation in Ludhiana City, United States Agency for International Development, New Delhi (unpublished).
Jha, Gangadhar (2002), Development of Municipal Bond Market in India, paper presented at the Workshop on Development of Municipal Bond Market in India, organized by NlUA, New Delhi, 31 May 2002.
The Punjab Infrastructure Development Act, 1998.
The Punjab Infrastructure (Development and Regulation) Act, 2002.
TNUDF (2001), Report on the Activities and Annual Accounts of Tamil Nadu Urban Development Fund for the Financial Year 2000-01, Department of Housing and Urban Development, Government of Tamil Nadu, Madras.
Descriptions of West Bengal, Karnataka, Mumbai, Rajasthan Urban Infrastructure/ Municipal Development/Environmental Improvement Programmes, Technical Assistance for Calcutta Municipal Environmental Improvement Programme, National Housing and Habitat Policy (1998) and programmes/reform initiatives relating to housing, urban development and poverty alleviation, etc., were obtained from the Ministry of Urban Affairs and Employment, Government of India’s Website http:urbanindia.nic.in/prg.htn
Union Budget 2002-03, Ministry of Finance, Government of India, New Delhi.
Mathur, Mukesh P. (2001), Alandur Sewerage Project: A Success Story of Public-Private Partnership Arrangements, paper prepared for the India Infrastructure Report, 2002.
Urban Finance (2001), 'Bond Special’, Volume 4, Number 1 (March 2001), Quarterly Newsletter of the NlUA, New Delhi.
Jha, Gangadhar (2002), Case Laws on Property Tax and Implications for Reforming the Tax Base, paper presented at the National Seminar on Reforming the Property Tax System in India, organized by NlUA at Bangalore (14-15 February 2002).
IHS-lndia (2002), Financing Urban Infrastructure, Training Manual, prepared by Institute of Housing and Urban Development Studies; India for FIRE (D) Project of USAID and NlUA, New Delhi.
IHS-lndia (2002), Project Development for Urban Local Bodies, Training Manual, prepared by Institute of Housing and Urban Development Studies; India for FIRE (D) Project of USAID and NlUA, New Delhi.
Urban Finance (2002), MCD Decides to Privatize Toll Tax Collection’, Volume 5 Number 1, Quarterly Journal of NlUA. New Delhi.
Municipal Solid Wastes (Management and Handling) Rules, 2000,’ Ministry of Environment and Forests, Notification, 25 September 2000.

SERF (1996), Study on Preparation of Sectoral Housing Action Plan: Punjab State, Socio- Economic Research Foundation, New Delhi.
A Compendium on Indian Slums (1996)’, Town and Country Planning Organization, Ministry of Urban Development, Government of India, New Delhi.
I DC (1998), evaluation of different poverty alleviation programmes, prepared by Institute for Development and Communication, Chandigarh for State Urban Development Agency, Punjab.
Tenth Five Year Special Component Plan, 2002-07 and Annual Special Component Plan 2002-03 for Scheduled Castes, Department of Welfare, Government of Punjab, Chandigarh.Ali, Sabir (2000), ‘Urban Poverty in India; An Introduction,’ in Social Change, Volume 30 Numbers 1 and 2 (March-June 2000)
Economic Survey (2000-01), Poverty Alleviation, Government of Punjab, Chandigarh.
Planning Commission (1997), Estimate of Poverty, Press Information Bureau, Government of India, 11 March 1997.
Planning Commission (2001), Estimate of Poverty, Press Information Bureau, Government of India, 22 February 2001.
Ninth Five-Year Plan 1997-2002, Department of Planning, Government of Punjab, Chandigarh.
Tenth Five-Year Plan 2002-2007, Department of Planning, Government of Punjab, Chandigarh.
CMAG Newsletter, Slum Policy Special, a quarterly Journal of City Managers Association, Gujarat (CMAG), Volume Numbers 10 and 11; December 2001 and March 2002, Ahemedabad.
NlUA (2001), ‘Kerala--A National Strategy Translates into a State Level System for Interaction with Local Women’s Groups’, in Mobilizing Communities, Communities in Action Series 2, National Institute of Urban Affairs, New Delhi.
World Bank (2001), World Development Report 2000/2001: Attacking Poverty, New York: Oxford University Press. ^
NlUA (2001), ‘Surat--Civic Response to a City’s Crisis’, in Mobilizing Communities, Communities in Action Series 2, National Institute of Urban Affairs, New Delhi.
NlUA (2001), ‘Baroda-Community Participation for Transformation of a Slum’ in Mobilizing Communities, Communities in Action Series 2, National Institute of Urban Affairs, New Delhi.
NlUA (2001), ‘Ahemedabad--SEWA: A Women’s Self Help Organization for Poverty Alleviation’ in Mobilizing Communities, Communities in Action Series 2, National Institute of Urban Affairs, New Delhi.

Chapter 9
DEMOGRAPHIC DEVELOPMENT
INTRODUCTION
This chapter deals with the overall demographic situation in Punjab. The scope is rather mixed consisting of demographic history since the state became a separate entity, comparison with other states, coverage of the elements of population change and their determinants, with a focus on the future population perspectives. An overview of demographic issues is absolutely critical for Punjab because development cannot be assessed in terms of generation of economic growth alone. In order to be more meaningful, it has to address the key objective of reduced population growth for human development, social integration, removal of disparities, economic empowerment and also protection of environment. Profiling of population in the state helps to identify areas that need policy and programme interventions, to set near- and far-term goals, and to decide priorities, besides understanding them in an integrated structure. This chapter contains information from several sources for discussing the recent demographic progress in the state and covers a whole range of issues, such as fertility, nuptiality, mortality, family planning, ageing, sex preference, sex-ratio imbalances and others. It summarizes the demographic dynamics in the state at the beginning of the twenty-first century and highlights the demographic dimensions of development, through an independent assessment.
FERTILITY TRANSITION
Limiting population growth in India is at the top of the national agenda. The First Five Year Plan recognized the ‘rapid increase in the growth of population’, emphasized the need to reduce the birth rate to stabilize the population, and suggested some measures to be taken (Planning Commission 1952). As a result of socio-economic development and family planning intervention, India recorded significant fall in fertility in the postindependence period, fairly widespread across the states. Yet, regional variations have continued in the onset and speed of fertility transition in the country. Initial achievements of Kerala, in leading the fertility decline in India, is being widely replicated elsewhere. In the north, Punjab has undergone substantial transformations in its fertility profile during the last three decades of the twentieth century. Data from well-known sources, notwithstanding the differences they have among themselves about the pace as well as magnitude of the decline, confirm a sustained decline in fertility in the state.
Levels and Trends
Fertility has been falling consistently in Punjab, as indicated by trends in total fertility rates since the beginning of the 1970s for major Indian States (Table 1). Though the southern states are ahead in fertility transition and have total fertility rates lower than Punjab, the fall has been substantial in the state. After Kerala, Punjab is the second state in the country to have reduced the total fertility rate approximately by half, from the early seventies to the late nineties in a totally different socio-cultural environment (Table 1). In fact, there has been a suggestion that Kerala in southern India and parts of erstwhile Punjab, currently in India, experienced simultaneous onset of fertility decline in

the 1940s, though the environment that triggered tapering off of fertility varied considerably from the setting of human development in Kerala to economic development in Punjab (Das Gupta 1997). However, the early declines in fertility in Indian Punjab were not sustained, fluctuating more rapidly in response to immediate conditions of war, health, and famine in the vicinity and in some districts, and recovering thereafter. The origin of the current trends of fertility fall in Indian Punjab can be traced back to the mid- 1950s in the post-partition situation (Dyson 2001), though the 1970s signal a secular fall in birth rates according to the sample registration system (SRS).
Table 1Fertility Decline in Major Indian States (1970-72 to 1996-1998)
State Total fertility rate (TFR)1970-72
1980-82
1990-92
1996-98
Percent decline in TFR1971-81
1981-91
1971-91
1991-97
1971-97
A. P. 4.7 3.9 3.0 2.5 17.0 23.1 36.2 20.0 48.9Assam 5.5 4.1 3.4 3.2 25.5 17.1 38.2 5.9 41.8Bihar 5.7 4.6 4.4 19.3 6.5Gujarat 5.7 4.4 3.2 3.0 22.8 27.3 43.9 6.3 47.4Haryana 6.4 5.0 3.9 3.4 21.9 22.0 39.1 12.8 46.9H. P. 4.7 4.0 3.1 2.4 14.9 22.5 34.0 22.6 48.9J, & K. 4.8 4.4 3.3 8.3 25.0 31.3Kamataka 4.4 3.6 3.1 2.5 18.2 13.9 29.5 19.4 43.2Kerala 4.1 2.9 1.8 1.8 29.3 37.9 56.1 0.0 56.1M. P. 5.7 5.2 4.6 4.0 8.8 11.5 19.3 13.0 29.8Maharashtra 4.5 3.7 3.0 2.7 17.8 18.9 33.3 10.0 40.0Orissa 4.8 4.2 3.3 3.0 12.5 21.4 31.2 9.1 37.5Punjab 5.3 4.0 3.1 2.7 24.5 22.5 41.5 12.9 49.1Rajasthan 6.3 5.4 4.5 4.2 14.3 16.7 28.6 6.7 33.3Tamil Nadu 3.9 3.4 2.2 2.0 12.8 35.3 41.0 9.1 48.7Uttar Pradesh 6.7 5.8 5.2 4.8 13.4 10.3 22.4 7.7 28.4West Bengal 4.2 3.2 2.6 23.8 18.8INDIA 5.2 4.5 3.7 3.3 13.5 17.8 28.8 10.8 36.5Source; Sample Registration System (SRS), Registrar General,Note: Indicates data not available.
ndia. Various volumes.
The three-years’ moving averages of the SRS are stable enough to describe effectively the shifting pattern of fertility in the state. Except for 1977-79 to 1982-84, during which the decline stalled, the process of fertility transition was reasonably consistent in Punjab (Table 2, Figure 1). Diminishing crude birth rate (CBR) and total fertility rate (TFR) point towards a new environment of reproduction where modifications in the reproductive strategy of couples reflect preference for progressively smaller families. The decline in fertility is extensive in the state, and is not confined to any specific region or community. Rural and urban areas in each district are experiencing transition in fertility in different ways, depending on changes in local conditions, which often act as important inducements for the determination of family size. The substantial decrease in fertility in Punjab, despite some of the key social indicators, such as strong son preference, sizeable presence of a socially backward population and relatively higher infant mortality, being against the decline, is a manifestation of the primacy of intervention by selected development factors, namely, the family planning programme, female literacy and prosperity at the household level. Studies are virtually non-existent to assess the role of economic aspirations, family systems and vsocial status indicators in the fertility transformations in Punjab.

and
Table 2Levels and Trends in Crude Birth Rate (CBR)
Period India PunjabCBR TFR CBR TFRTotal Total Total Rural Urban Total Rural Urban
1971-73 36.3 5.1 34.1 35.1 30.4 5.2 5.5 4.21972-74 35.3 5.0 33.3 34.4 29.3 5.1 5.4 4.01973-75 34.8 4.9 32.4 33.3 29.0 4.9 5.2 3.91974-76 34.4 4.8 31.8 32.7 28.6 4.8 5.1 3.91975-77 34.2 4.7 31.5 32.2 28.6 4.6 4.9 3.81976-78 33.3 4.6 30.7 31.5 27.7 4.4 4.6 3.61977-79 33.1 4.5 29.9 30.5 27.6 4.0 4.2 3.41978-80 33.3 4.4 29.3 29.8 27.7 3.9 4.1 3.41979-81 33.8 4.4 29.6 30.0 28.3 3.9 4.0 3.41980-82 33.8 4.5 30.2 30.7 28.5 4.0 4.1 3.41981-83 33.8 4.5 30.3 30.8 28.7 4.0 4.2 3.41982-84 33.8 4.5 30.3 30.9 28.7 3.9 4.1 3.41983-85 33.6 4.4 29.7 30.1 28.3 3.8 3.9 3.31984-86 33.2 4.3 29.1 29.6 27.9 3.6 3.7 3.21985-87 32.6 4.2 28.6 28.9 27.7 3.4 3.6 3.11986-88 32.1 4.1 28.6 29.0 27.7 3.4 3.5 3.11987-89 31.5 4.0 28.5 28.8 27.6 3.4 3.5 3.11988-90 30.8 3.9 28.1 28.6 26.8 3.3 3.5 3.01989-91 30.1 3.8 27.9 28.4 26.2 3.2 3.4 2.91990-92 29.6 3.7 27.5 28.2 25.1 3.1 3.3 2.81991-93 29.1 3.6 27.0 27.4 24.1 3.1 3.2 2.71992-94 30.4 3.5 26.1 27.4 22.9 3.0 3.2 2.61993-95 29.9 3.5 25.3 26.6 21.8 2.9 3.1 2.51994-96 27.4 3.5 24.3 25.8 20.6 2.9 3.0 2.41995-97 27.7 3.4 23.9 25.4 19.6 2.8 3.0 2.31996-98 27.1 3.3 23.2 24.6 18.9 2.7 2.9 2.21997-99 26.6 — 22.4 23.7 18.7 ~ — ~
1998-2000 26.1 ~ 21.8 22.9 18.5 ~ ~ ~
Source;Note;
- ® i TO 5 H ^ 4 J
I ' :ro o 1
0 ^
Sample Registration System (SRS), Registrar Rates for India exclude Mizoram till 1995, and onwards'— ‘ Indicates data not available.
General, India. Various volumes. Jammu and Kashmir from 1991
Figure 1Trends in Total Fertility Rate in India and Punjab (1971-73 to 1997-98)
00O)in00 00o> O)
■ India (total) -it— Punjab (urban) •Punjab (total) •Punab (rural)
Source; Sample Registration System (SRS), Registrar General, India. Various volumes.

With fertility falling significantly in Punjab during the past three decades, it is appropriate to look at the long-term prospects of reaching the replacement level. Since achievement of replacement-level fertility is crucial for the long-term objective of a 'Stable Population’ by 2045 in India, and the medium-term objective of reducing the total fertility rate (TFR) to replacement level by 2010, as laid down in the National Population Policy 2000 (NPP 2000), it is pertinent to examine the position of Punjab in relation to the national target. Recent indications do not signal the possibility of reaching the replacement level in the state by 2010. While according to SRS estimates, Kerala and Tamil Nadu reached the replacement level by 1998, the recent National Family Heath Survey (NFHS) indicates that only Kerala has reached this level by 1998-99. Punjab, according to both, is yet to attain the replacement level of fertility. NFHS estimates the state’s fertility to be five per cent above the replacement level as against the SRS estimate of 24 per cent. According to recent NFHS, urban areas have already reached the replacement level of fertility (TFR being 1.79), whereas in the rural areas the fertility (TFR being 2.42) remains 15 per cent higher than the replacement level. With nearly two-thirds of the population still living in villages, the prospects of stabilizing the population in the near future in Punjab depends on the success of the effort in rural areas. This is a task worth considering.
Age Pattern of Fertility
The age pattern of child-bearing in Punjab has undergone a change during the last three decades with fertility limitation being increasingly common at relatively old ages. Though fall in fertility has been observed among women of all ages, the contribution to the fertility decline has been mostly from women in the age 35 years and above, according to the SRS. Two successive rounds of NFHS, recording a rapid fall in fertility, higher than the national standard, in Punjab during the 1990s, also document lesser contribution by younger women (age 15-29) than by older women (age 30-49). Relatively less enthusiasm among younger women in limiting fertility can be attributed to social and cultural reasons that stress the need for child-bearing immediately after marriage. Childbearing, coming shortly after marriage, is mainly concentrated in 20-24 and 25-29 age groups, which account for 40 and 36 per cent respectively, of the births in the entire reproductive period of women (NFHS 2, 2001). Such concentration of births is more severe among urban than rural women. Between 1991-93 and 1996-98 (the two rounds of NFHS), the contribution of women aged 20-29 years to overall fertility declined from 76 to 72 per cent. Fall of fertility, by this magnitude, may also be regarded as substantial as it is at young age that the pressure to bear children is immense in Punjabi society.
Table 3
Age group (incompletedyears)
1971 1976 1981 1986 1991 1996 1997 1998 Percent decline in
ASFR (1971-98)
15-19 29.9 25.2 18.9 23.2 23.3 14.9 16.4 20.9 30.120-24 231.0 244.6 216.7 236.5 244.2 213.8 199.6 205.5 11.025-29 306.5 299.6 258.0 234.8 210.8 197.2 204.3 184.2 39.930-34 214.3 184.6 166.9 118.2 101.1 86.8 82.5 68.6 68.035-39 173.9 134.4 85.5 51.5 34.9 27.3 31.0 24.3 86.040-44 68.4 55.3 34.6 16.1 7.5 8.9 9.5 6.9 89.945-49 24.7 13.7 12.3 3.9 2.2 4.0 0.5 1.1 95.5
Source: Sample Registration System (SRS), Registrar General, India, New Delhi. Various volumes.

Age group (in years)_________________________________I ^ -* -1 9 7 1 — K -1981 ■ '* '1991 - ♦ - * 1 9 9 8
Source; Sample Registration System (SRS), Registrar General, India. Various volumes.
Socio-Economic Differentials
Social and economic conditions considerably determine the course of fertility transition, as fertility varies most according to economic and social backgrounds. In Punjab, fertility differentials are sharp across selected economic and social indicators. As seen from the recent round of NFHS, variations in fertility (measured in terms of differences in total fertility rates, current pregnancy rates, and mean number of children ever born to women in 40-49 age group) by the standard of living, educational attainment, place of residence, religion and caste are striking. For instance, the TFR, of women in households with a low standard of living (3.77) is nearly 2.1 times higher than their counterparts with a high standard of living (1.74), and of illiterate women is 1.8 times higher than that of women with education high school and above (1.71). Women in cities and towns also report lower TFR (1.79) than women in villages (2.42). Since there exists a great degree of concurrence between caste affiliation and economic well-being, inequality in the economic sphere often gets reflected in demographic indicators. In Punjab, Scheduled Caste women and other Backward Caste women record higher levels of TFR (2.93 and 2.55) and percentage of pregnancy rates (6.1 and 5.4) as against women from other castes (1.79 and 3.5). Interestingly, for the two major religious groups that accounted for a little more than 97 per cent of the population in 1991 in the state, differences by religion are narrow. Demographic reflections of social inequalities are clear and still persist, according to the NFHS. Over time, there has been little change in relative positions by social or economic class, in terms of the respective contribution to overall fertility, though the major social and economic groups have shown a decline in current pregnancy rates and fertility.
Age at Marriage, Birth Intervals, Age at First and Last Birth
Marriage patterns are important determinants of fertility and family planning regimes. Traditionally the female age at marriage has been relatively higher in Punjab than the national average (Goyal 1988). The NFHS indicates that in 1998-99, for women aged 25-29, the median age at first marriage was 3.6 years higher in Punjab (20.0 years) than in the nation as a whole (16.4 years). Among the major states, only Kerala had a slightly higher median age at marriage (20.2 years) than Punjab, according to this source. As data from the 1991 Census indicate between 1981-86 and 1986-91, the female mean age at marriage increased by 0.4 years in Punjab as against 0.3 years in the entire

country, excluding Jammu and Kashmir. During 1981-1991, as against 53.3 per cent of currently married women who married before they reached 18 in India, 24.7 married earlier than the legal minimum age in Punjab. Even if the share of such women fell in the state from 21.0 per cent in 1981-86 to 15.7 per cent in 1986-91, there is still need to identify these weaker sections in terms of socio-economic characteristics, and to concentrate on them in order to eliminate the practice of early marriage.
One significant aspect of fertility trends and levels is the frequency of child-bearing, as indicated by the length of birth-intervals. While quick successive pregnancies cause extensive health risks to the mother and the child, those with longer gaps promote child- survival and help in reduction of fertility. Among major states of India, the median interval between two most recent births, according to recent NFHS statistics, is the longest in Kerala (38.1 months) and the shortest in Punjab (28.0 months). In the latter, in nearly six years time, the median birth interval decreased by 1.3 months and the percentage of births occurring within 24 months of previous birth dropped from 35.7 to 33.2, indicating compression of intervals and a move towards bunching of births among the communities. The median birth interval varies substantially by background characteristics and reveals comparatively frequent child-bearing among socially and economically disadvantaged women in Punjab. Rural women, less educated women, women from Scheduled Castes and from households with low standards of living, tend to reproduce faster than others, according to the NFHS. For example, women in low- standard of living households (26.5 months), women with less education (illiterate 27.3 months) and Scheduled Caste women (25.6 months) have shorter birth intervals than women in households with a high standard of living (31.1 months), women having greater education (31.7 months for high school completed and above), and women with non-Scheduled Caste status (30.6 months). Spacing of births is determined by such intervening factors as the practice of contraception, duration of breast-feeding, order as well as sex of the previous birth, in addition to its survival status. The NFHS-2 also reveals that high parity mothers space their last interval longer than the low parity mothers. Similarly, death of the child causes the median birth interval to shrink considerably (from 28.5 months in the case of a surviving child to 24.4 in case of a dead child). The sex of the previous child also affects the frequency of child-bearing through reduction in the median birth interval (by 1.2 months in the case of a daughter). The fact that these birth-interval differentials have persisted for a long time among the ever- married women, as existing studies report (NFHS 1995, 2001 and Abb! et al. 2000), is an indicator of differential approaches to family formation among communities in Punjab.
The age at first birth and the age at last birth are two important indicators that highlight the length of the reproductive period in terms of initiation and cessation of child-bearing. A trend towards shortening of reproductive life in Punjab, in recent times, from 9.0 to 7.4 years has been documented by the NFHS. Between 1992-93 and 1998-99, little change has been observed among women in the state in the onset of fertility, even if the age at which child-bearing is terminated is on the decline. For instance, in both rounds of NFHS, the age at first birth among women aged 25-29, 30-34, 35-39, 40-44, and 45-49 differed little with the median age of first birth, around 21.0-21.5 years. On the contrary, termination of child-bearing earlier is reported in the second survey, with the median age at last birth declining from a little over 30.0 to 28.6 years, for women aged 40-44 years. The data on age at first birth also establish early child-bearing among economically and socially deprived women.

Data on birth-interval, on a long-term perspective, support the idea that strategies of reproduction are changing in Punjab. Couples from diverse backgrounds are giving up the old practice of relatively longer gaps between two successive births or between marriage and the first birth in favour of shorter birth-intervals. Such gradual shortening of birth-intervals, alongside the fertility decline, is in response to a variety of social, economic and other demands, that the society is imposing on the couples for conforming to newer reproductive goals of having fewer children. These aspects are to be factored into population programmes in the state aimed at keeping the birth-intervals longer, more so among weaker sections, so as to delay the first and subsequent births. In other words, further lengthening of intervals is difficult unless female education is increased beyond a threshold level, campaigns are set in motion to increase breast-feeding and programmes are put in the place to reduce infant mortality and substantially eradicate son preference. These are required in addition to addressing economic concerns about raising living standards of households.
Prospects for Further Decline
Pathways to fertility decline are complex, changing and non-universal. As fertility declines in a variety of situations, generalizations about social, cultural and economic causes of fertility decline are not easy and seldom necessary. However, routes to lower fertility in different settings have been historically documented and have extensively improved the understanding of reproduction patterns. In the absence of systematic explorations of receding fertility in Punjab, with a focus on dimensions of development and mechanism of influence, existing evidence point to overall effects of sustained economic prosperity flowing from the green revolution, a well-off rural sector, impact of a strong family planning programme, greater access to health care services, superior infrastructure in terms of housing, roads, transport and basic amenities, improved exposure to education and communication, high female age at marriage, better female literacy as against males, and more recently, induced abortion, etc.
While it is important to acknowledge the fact that fertility has fallen considerably in the state, since the early seventies, despite constraints, it is more useful to explore the prospects of further decline in the near future. The key to this lies in eradicating the existing strong son preference, reduction in the level of infant mortality, augmenting contribution by socially and economically poor sections to lowering of fertility, progress in eliminating the unmet need for contraception, change in reproductive strategies among younger couples and overall advance in living conditions.
MORTALITY CHANGE
Reduction in mortality has been an important goal of planning since the First Five Year Plan. Programmes have been initiated at the national as well as the state level to improve overall survival conditions, as a result of which mortality decline is visible among segments of population in most of India. A dramatic fall in mortality has been also observed in Punjab for last three decades of the twentieth century.
Levels, Trends and Differentials
In Punjab, as the time series data based on three-yearly moving average, show, the overall crude death rate (CDR) declined from around 12 per 1,000 in the early seventies.

to around nine per 1,000 in tine early eighties, and to eight per 1,000 in the early nineties (Table 4). Reduced mortality has been an integral part of the demographic transition in the state, and has extensively contributed to increased life expectancy at birth and at other ages. Though overall mortality in Punjab has been consistently iower than the national average, yet, over time, the advantage that Punjab initially had, in terms of lower probability of death, has diminished systematically after the mid-eighties. For example, in little less than three decades, the advantage of Punjab over the national mortality situation declined by 12 percentage points, from 26 per cent in 1971-73 to 14 per cent in 1998-2000. This was because the other states had made comparatively faster progress in curbing their respective death rates. Both rural and urban areas have gained consistently from the onset of mortality decline, even if rural death rates continue to exceed urban death rates for a variety of reasons in Punjab, as elsewhere in India. Notwithstanding a marginal rise in the crude death rate in the nineties, as reported by the NFHS, overwhelming evidence shows that overall death rates have decisively fallen in Punjab.
Table 4
Period India Punjab Comparative advantage of
Punjab (in percent)Total Total Rural Urban Total
1 1971-73 15.9 11.7 12.4 9.1 26.41972-74 15.7 11.7 12.5 8.9 25 51973-75 15.3 11.2 11.8 8.8 26.81974-76 15.0 10.8 11.3 8.9 28.01975-77 15.2 10.9 11.4 9.0 28.31976-78 14.5 11.1 11.7 9.0 23.41977-79 13.9 10.8 11.3 8.6 22.31978-80 13.1 9.9 10.5 8.0 24.41979-81 12.7 9.2 9.7 7.3 27.61980-82 12.3 8.8 9.5 6.7 28.5
1 1981-83 12.1 9.1 9.8 6.9 24.8r 1982-84 12.1 9.0 9.8 6.5 25.6
1983-85 12.1 9.1 10.0 6.6 24.81984-86 11.8 8.7 9.5 6.4 26.31985-87 11.3 8.4 9.0 6.8 25.71986-88 11.0 8.2 8.7 6.9 25.51987-89 10.7 8.2 8.7 7.0 23.41988-90 10.3 8.1 8.6 6.6 21.41989-91 9.9 7.9 8.6 6.1 20.21990-92 9.9 7.9 8.7 6.0 20.21991-93 9.7 8.0 8.6 5.9 17.51992-94 9.5 7.9 8.2 6.1 16.8
! 1993-95 9.2 7.6 7.9 6.0 17.41994-96 9.1 7.5 7.9 6.2 17.61995-97 9.0 7.4 7.8 6.1 17.81996-98 9.0 7.5 7.9 6.2 16.71997-99 8.9 7.5 8.0 6.2 15.71998-2000 8.7 7.5 8.0 6.1 13.8
Source: Sample Registration System (SRS), Registrar General, India. Various volumes.

d:QoCDo
CON-
1O)
IDI00rO)
s-LOO)
CDh-I10 5
COd)N-O)
0000
00O)
m00000002
r00lOooO)
0500N-000 5
0 50 5000 5
000 5
0 50 5
IT50 5 0 5
uS0 50 5
0 50 5Ih-0 50 5
•Death rate (CDR)_ -Vciar_ -
■ Birth rate (CBR) ‘Rate of natural increase (RNI)
Source: Sample Registration System (SRS), Registrar General, India. Various volumes.
Age- and Sex-specific Death Rate
In addition to rural and urban variations, mortality situation is also better understood through its sex composition and age pattern. Gains to males as well as females from mortality decline are distinct over the years in Punjab (Table 5), with net gain to females, notwithstanding early-age vulnerability surpassing the net gain to males in the process of mortality transition. In fact, a notable feature of mortality transition in Punjab, between 1971 and 1998, has been larger gains for females than for males in general. The narrowing down of sex differential in mortality, characterized by comparatively higher female mortality, as observed in 1971, has yielded to a reverse, yet, more common pattern, as in 1998, where male crude death rate outstripped female crude death rate.
The age-specific mortality curve for Punjab in 1971, as well as 1998, was the usual 'U ’- shape, due to relatively higher mortality at young and old ages. Though, for nearly three decades, the mortality pattern by age has remained broadly the same, significant changes seem to have taken place in different segments of the population. Mortality rate at the early age of life (0-4 years) has strikingly plummeted down for males as well females in urban and rural areas. In the five-to-nine year age group, mortality decline appears to have been confined to males and females only in urban areas, leaving rural female children untouched. Dynamics of mortality change also suggest a trade-off in the mortality of the young and old, between the early seventies and late nineties. For males below 20 years of age, mortality dropped sharply in contrast to a moderate rise for those 20-54 years old, and a substantial rise for those 55 years and above. Similarly, for females, dunng the same period, the mortality rate fell for those below 45 years and increased for those aged 45 and above. Punjab has recorded gains in the reproductive

age group (15-44 years) too, where the risks of child-b'^aring decisively enhances female exposure to death through maternal mortality.
Table 5
Age (incompletedyears)
1971 1998Male Female Male Female
Rural Urban Total Rural Urban Total Rural Urban Total Rural Urban Total0-4 32.0 28.4 31.3 52.0 30.8 47.6 16.2 15.0 15.9 20.8 8.6 17.95-9 1.6 1.9 1.7 1.0 3.0 1.4 0.8 0.4 0.7 2.2 1.3 2.010-14 0.9 — 0.7 2.3 1.2 2.1 0.6 0.7 0.6 0.8 1.6 1.015-19 0.8 1.0 0.9 1.2 1.1 1.2 1.5 1.9 1.6 1.4 0.5 1.220-24 3.6 0.3 2.8 2.3 1.1 2.0 3.7 1.2 3.1 1.8 0.9 1.625-29 2.9 1.2 2.5 4.1 3.5 4.0 4.3 0.4 3.3 2.1 1.9 2.030-34 3.8 1.3 3.2 3.7 - 2.9 4.4 2.0 3.7 1.6 2.0 1.735-39 3.4 1.4 2.9 4.7 4.7 4.7 3.4 2.8 3.2 1.6 4.2 2.340-44 4.4 10.2 5.7 4.8 3.6 4.5 7.7 6.1 7.2 2.3 0.6 1.845-49 8.0 3.2 6.9 1.6 5.1 2.7 6.2 3.9 5.5 4.7 8.4 5.750-54 8.6 14.9 9.9 3.6 14.8 5.8 10.5 9.2 10.2 6.8 10.6 7.855-59 8.5 36.6 13.8 5.9 21.2 7.5 15.5 26.0 18.2 11.3 22.8 14.360-64 27.3 24.5 26.7 19.2 14.9 18.2 25.9 20.8 24.8 20.8 5.5 17.565-69 24.4 28.6 25.2 17.1 28.8 19.6 35.1 40.7 36.4 25.3 34.4 27.370+ 80.7 74.7 79.6 95.0 80.5 92.2 89.0 70.6 86.0 74.7 70.8 91.4All 10.0 8.9 9.8 11.7 8.7 11.1 8.8 6.6 8.2 7.5 6.1 7.1Source; Sample Registration System (SRS), Note; Indicates data not available.
Registrar General, India.
Figure 4Age and Sex-specific Death Rates in Punjab (1971)
(/i(D■*->2jC -t—>
CD 0 Q
120
80
40
O ) O ) O ) O ) O )•t— C N C N C O C O up L O C D C D
O uS O L O O O L O O L O o L OT— < N C s l C O C O in L O C O C D
+o1
Age (in completed years)
■Male ’Female
Source; Sample Registration System (SRS), Registrar General, India.

03CDQ
Age (in completed years)
‘Male Female
Source: Sample Registration System (SRS), Registrar General, India.
The improvement in mortality has also brought to the fore some sharp differences in the sex composition of death in Punjab. It is apparent from Table 5 that at some specified ages the sex of the individual is one of the important indicators of exposure to death. While female mortality-disadvantage is greatly pronounced during childhood and adolescence (0-14 years), male vulnerability begins to be high from the age of 20 and onwards.
Infant, Child and Under-five Mortality
Infant and childhood mortality-reduction goals have continued to be national priority since the First Five Year Plan (Planning Commission 1952), as mortality varies with age and children below five years typically have a relatively higher probability of death in Indian circumstance. The situation in Punjab might compare favourably with the national scene, but the overall economic prosperity of the state is not reflected in trends of infant and child survival (Table 6). In spite of lower incidence of poverty, greater agricultural prosperity, attainment of better living standards and access to basic amenities, elevated urbanization, higher female literacy, greater network of transport, increasing private participation in health care services, and less rural and urban gap in provision of health infrastructure, mortality has continued to be high for infants and children. If development means elimination of preventable deaths for human welfare, then higher mortality trends for the children below five years of age should be a major cause for serious concern in Punjab.

Infant Mortality Rate (IMR) by Selected Background Characteristics in Major Indian StatesState IMR'
(2000)Percentage of births in
medical institutions
(1998-99)
Percent-age of population
poor^ (2000)
Percentage of
females literate
(2001)
Percentage of
population living in
urban areas (2001)
Percent-age of females
participating in workforce
(2001)
Annual rate of
growth of SDP in
per cent (1991-92 to 1997-
98)A. P. 65 49.8 15.8 51.2 27.1 34.9 5.0Assam 75 17.6 36.1 56.0 12.7 20.8Bihar 62 14.6 42.6 33.6 10.5 18.8 2.7Gujarat 62 46.3 14.1 58.6 37.4 28.0 9.6Haryana 67 22.4 8.7 56.3 29.0 27.3 5.0H. P. 60 28.9 7.6 68.1 9.8 43.7J & K NA 35.6 3.5 41.8 24.9 22.0Karnataka 57 51.1 20.0 57.5 34.0 31.9 5.3Kerala 14 93.0 12.7 87.9 26.0 15.3 5.8M. P. 87 20.1 37.4 50.3 26.7 33.1 6.2Maharashtra 48 52.6 25.0 67.5 42.4 32.6 8.0Orissa 95 22.6 47.2 51.0 15.0 24.6 3.3Punjab 52 37.5 6.2 63.6 34.0 18.7 4.7Rajasthan 79 21.5 15.3 44.3 23.4 33.5 6.5Tamil Nadu 51 79.3 21.1 64.6 43.9 31.3 6.2Uttar Pradesh 83 15.5 31.2 43.0 20.8 16.3 3.6West Bengal 51 40.1 27.0 60.2 28.0 18.1 6.9INDIA 68 33.6 26.1 54.2 27.8 25.7 6.9
Source; 1. Sample Registration System (SRS), Registrar General, India.2. National Family Heath Survey 2 (1998-99), India3. Poverty Estimates for 1999-2000, Planning Commission, India.4. 5. and 6. Provisional Population Totals, Punjab, Papers 1, 2 and 3, Census o f India 2001.7. Ahluwalia (2000)
Note; 1. The estimates of poverty (percentage of population below poverty line) are basedon a 30-day recall period and the state specific poverty lines of 1999-2000.
2. Indicates data not available.
In spite of a seemingly lower infant mortality rate (IMR) in Punjab than in most of the major states of India, the number of deaths before the first birthday is very high (Table 6). The fact that recent estimates of infant mortality vary somewhat between 52-57 per 1,000 live births, depending on the source (SRS or NFHS), cannot hide the reality that out of total deaths in 1998, the share of infant deaths was 16 per cent in Punjab as against four percent in Kerala (SRS). Barring Punjab, all the developed states in the Union were able to reduce their infant mortality level substantially between 1981 and 2000. During this period, for instance, the IMR fell by 62 per cent in Kerala, by 47 per cent in Gujarat, by 45 per cent in Tamil Nadu, by 39 per cent in Maharashtra as against only 36 per cent in Punjab (Table 8). Mortality among infants has not been showing signs of real decline since the early nineties, as indicated by the time-trend (Table 7). Reasons for this merit some investigation, in the context of the link between overall economic deceleration in Punjab as reported recently and living standards of households, particularly in the rural sector (Table 6).
For greater success in infant mortality reduction in Punjab, there is need to concentrate on rural areas, where two-thirds of the total population reside. The major States (Kerala, Maharashtra, Tamil Nadu and West Bengal), with mortality among infants before first birthday lower than in Punjab, are those, whi< h were able to reduce infant mortality

progressively by focusing consistently on rural areas. For instance, decline in rural infant mortality in Kerala (51%), Maharashtra (24%), Tamil Nadu (35%) and West Bengal (30%), during 1986-88 and 2000, far exceeded the decline in Punjab (15%). The fact that rural areas in Punjab require urgent attention in this regard is clear from the latest early-life NFHS mortality statistics. Neo-natal, post-neonatal infant, child and under-five mortality rates are shown as, 69 per cent, 42 per cent, 58 per cent, 96 per cent, and 64 per cent higher respectively in villages than in cities and towns. Lack of rural bias is perhaps one of the reasons why Punjab has had a much slower decline in mortality during one and half decades of the last century, as indicated by the percentage change in the IMR. Any innovative programme-formulation and management must recognize this rural-urban dichotomy.
Table 7Levels, Trends and Sex Composition
Year Levels and trends in infant mortality Gender disparity (f/m) in infant mortality®
India Punjab India PunjabTotal Total Rural Urban
1971-73 134 112 120 79 1.05 1.161972-74 133 110 118 77 — —
1973-75 133 103 111 71 — —
1974-76 132 101 108 69 — —
1975-77 133 104 111 71 — —
1976-78 129 110 117 76 1.07 1.101977-79 126 105 110 79 1.05 —
1978-80 120 99 105 73 1.03 —
1979-81 115 87 92 64 1.01 —
1980-82 110 82 89 54 1.00 —
1981-83 107 79 85 58 0.99 —
1982-84 105 74 81 53 0.99 0.981983-85 102 73 80 52 1.01 1.051984-86 99 68 75 47 1.01 1.121985-87 96 67 71 57 1.01 1.151986-88 94 64 66 59 1.00 1.151987-89 93 63 67 55 0.99 0.991988-90 88 62 65 49 1.00 1.061989-91 84 59 62 43 1.00 0.991990-92 80 57 60 42 1.01 1.131991-93 78 55 60 40 1.01 1.091992-94 76 55 59 38 1.00 1.211993-95 74 54 57 38 1.01 1.271994-96 72 53 57 38 1.01 1.251995-97 72 52 56 39 1.03 1.201996-98 72 52 56 39 1.03 1.131997-99 71 53 56 39 1.03 1.091998-2000 70 53 57 39 — ~
Source; Sample Registration System (SRS), Note; Indicates data not available and
Registrar General, India. Various volumes. ' based on sex specific moving averages.

Source: Sample Registration System (SRS), Registrar General, India. Various volumes.
The timing of infant death has also far-reaching importance for framing measures that enhance the survival chances of the newborns. Since biological factors are largely decisive in determining chances of survival in the neo-natal period, and environmental and behavioral factors in the post neo-natal period, classification of deaths into such categories also help in understanding their pattern during infancy.
Mortality, at all stages, has declined considerably in Punjab since the early eighties, as in other major states (Table 8). In spite of social, economic and cultural constraints, many states have performed better than Punjab in reducing childhood mortality. For instance, Tamil Nadu and Kerala have been able to reduce mortality among children below five years of age by nearly three-fifths and West Bengal by two-fifths, as against only 23 per cent in Punjab. Such states like Kerala, Tamil Nadu, West Bengal and Maharashtra were also able to lessen substantially the neo-natal, post neo-natal, infant and child deaths. This needs to be emulated in Punjab, which has substantial loss of lives during childhood (0-4 years); 20 per cent of total deaths occur in childhood in Punjab as against five per cent in Kerala, 14 per cent in Tamil Nadu and 18 per cent in Maharashtra. This indicates that with the right kind of intervention, the scope to reduce childhood mortality is immense in Punjab.
Gender Bias in Infant and Child Mortality
Sharp sex-differentials characterize infant and childhood mortality in Punjab. Data from both the SRS and NFHS show comparatively high female mortality in Punjab than in other states of India. In view of considerable gains to both sexes from the onset of mortality decline during Iasi three decades, such male-female divergence is possible, in theory, when female children benefit either equally or less in relation to male children. In

spite of improvements in literacy, expansions in outreach of health-care services and rise in overall living standards in recent times, the sex composition of infant mortality trends in Punjab indicate that greater vulnerability of the girl child has remained virtually unchanged in the long run (Table 9 and Figure 7). On the contrary, more recent data reveal intensification of gender disparity in mortality in Punjab at every stage of childhood, particularly before the fifth birthday (Table 9). Rise in female disadvantage in mortality between 1992-93 and 1998-99 is a worrisome sign, implies preponderance of social, cultural and economic rather than health and medical factors, and reinforces the need for corrective measures.
Table 8
state
1
Neo-natal mortality rate
Post neo-natal mortality rate
Infant mortality rate Child mortality
1981 1998 Percentdeclineduring1981-
98
1981 1998 Percentdeclineduring
1981-98
1981 2000 Percentdeclineduring1981-2000
1981 1998 Percentdeclineduring
1981-91
A P. 60 46 23.3 26 21 19.2 86 65 24.4 30 20 33.3Assam 67 51 23.9 39 25 35.9 106 75 29.2 40 32 20.0Bihar 74 44 40.5 44 37 15.9 118 62 47.5 43 33 23.3Gujarat 75 44 41.3 41 21 48.8 116 62 46.6 41 27 34.1Haryana 58 41 29.3 44 29 34.1 101 67 33.7 37 33 10.8H. P. 15 50 -233.3 57 18 68.4 71 60 15.5 19 22 -15.8J& K 44 - 28 - - 72 50 30.6 26 - -
Karnataka 49 42 14.3 21 17 19.0 69 57 17.4 24 21 12.5Kerala 26 11 57.7 12 5 58.3 37 14 62.2 12 5 58.3M. P. 81 61 24.7 62 37 40.3 142 88 38.0 61 37 39.3Maharashtra 54 29 46.3 r 25 19 24.0 79 48 39.2 26 18 30,8Orissa 80 60 25.0 55 37 32.7 135 96 28.9 42 29 31.0Punjab 49 33 32.7 32 22 31.3 81 52 35.8 26 20 23.1Rajasthan 60 50 16.7 49 33 32.7 108 79 26.9 50 40 20.0Tamil Nadu 63 35 44.4 29 18 37,9 91 51 44.0 35 14 60.0U. P. 96 52 45.8 54 33 38.9 150 83 44.7 60 38 36.7West Bengal 64 30 53.1 27 23 14.8 91 51 44.0 34 20 41.2INDIA 70 45 35.7 41 27 34.1 110 68 38.2 41 29 29.3
Source; Sample Registration System (SRS), Note: Indicates data not available.
Registrar General, India.
Table 9Levels and Trends in Neo-natal, Post neo-natal, Infant, Child and Under-five Mortality by Sex
State Type of mortalityNeo-natalmortality
Post neo-natal mortality
Infant mortality Childmortality
Under-fivemortality
1992-93
1998-99
1992-93
1998-99
1992-93
1998-99
1992-93
1998-99
1992-93
1998-99
PunjabMale 32.9 34.4 22.8 15.3 55.6 49.7 12.7 5.9 67.6 55.4Female 27.0 37.9 22.1 27.3 49.1 65.2 23.0 23.8 71.0 87.4Femaledisadvantage(f/m)
0.8 1.1 1.0 1.8 0.9 1.3 1.8 4.0 1.1 1.6
INDIAMale 57.0 50.7 31.7 24.2 88.6 74.8 29.4 24.9 115.4 97.9Female 48.1 44.6 35.8 26.6 83.9 71.1 42.0 36.7 122.4 105.2Femaledisadvantage(f/m)
0.8 0.9 1.1 1.1 0.9 1.0 1.4 1.5 1.1 1.1
Source: National Family Health Suivey (1992-93 and 1998-99), India.

c<D ^ro 15
■S E03EQ)
U_
Figure 7Female Disadvantage in infant Mortality in India and Punjab
(1971-99)
0.6T - c M c o N - c N c o T j - i o c o h ' - o o a J O ' t - C N c o ' ^ m c D r ^ c o o )h>~h~h~h~OOOOCX3QOOOOOOOC300503050) 05050>0>0>0>0 5 0 ) 0 5 C3 5 C J > 0 5 0 5 0 ) C 3 5 0 > 0 5 0 ^ 0 > C J ) 0 5 0 > C 3> 0 ) 0 > 0 5 0 5 0 )
Year
•India — ♦ — Punjab
Source; Sample Registration System (SRS), Registrar General, India. Various Volumes.
Causes of Death in Infancy and Childhood
Though reliable data on direct causes of death are vital for its assessment in early childhood, such information is rarely available in a format that can be useful for initiating health-assessment and intervention programmes. However, data from Survey o f Causes of Death in Rural Areas (Registrar General, India) fill the gaps in mortality statistics to some extent and identify the top killer diseases during infancy and childhood. For example, for infants dying before first birthday in rural Punjab in 1998, the causes were premature birth (25%), pneumonia (25%), anaemia (10%), respiratory infections (6%), diarrhoea (6%), congenital malformations (4%) and birth injury (1%). Similarly, major causes of rural-child deaths in Punjab in 1998 were pneumonia, diarrhoea and gastroenteritis, and malaria, which together accounted for 60 per cent of deaths in the 1- 4 years age group (Registrar General, India).
Investigation of circumstances that create an environment for higher levels of infant and child mortality in general, and excess female mortality in particular, leads one to a set of factors that are deeply embedded in the socio-economic position of the households. For instance, studies on Punjab have indicated that place of residence, education and work- status of mother, caste affiliation, standard of living and pattern of differential care based on the sex of the child in households, extensively affect the chances of survival of children below five years of age at various stages (Das Gupta 1987, Krishnaji 2002). Demographic determinants, such as order of birth, sex of the child, mother’s age at birth, length of the previous birth interval, etc., are also found to be crucial in the levels of neonatal, post neo-natal, infant, child and under-five mortality (NFHS 1995 and 2001). Studies are required to ascertain the role of a dominant backward population, gender preference, access to and utilization of health-care services particularly during pre-natal, natal and post-natal periods slowing dov'n of economic growth and impact of the current structural adjustment programme on recent trends in infant and childhood mortality in the state.

Further reduction in mortality, due to the above causes, will certainly depend not only on the state of public health programmes in Punjab, but also on overall levels of economic and social development in terms of health, hygiene, environmental sanitation, levels of living, financial capacity to pay for health care and socio-cultural barriers in accessing it. The enormity of the tasks ahead, in relation to infant mortality, can well be visualized from the fact that Punjab has to go a long way, in order to conform to the national goal of bringing down the IMR to 45 by 2007, 30 by 2010, and 28 by 2012, as laid down in the National Population Policy (2000). and the Tenth Five Year Plan (2002-2007). This appears difficult to achieve, as for some time in the recent past, the infant mortality level has been stagnating in the state, with the rates hovering around 53 per 1,000, and not falling as normally expected.
Ways to fight infant mortality would include removal of gender bias, strengthening of the Child Survival and Safe Motherhood (CSSM) Programmes under the RCH umbrella, screening mothers-to-be for ante-natal check-up and nutritional intake, reduction in the share of non-institutional births, adequate provision for emergency obstetrics services, introduction of nutritional programmes especially for anaemic mothers, proper immunization, baby-friendly infant-feeding practices and nourishment for the newborn, strengthening the sub-centres, subsidiary health centres and primary health centres, and making women doctors available for female clients, particularly at selected centres in remote rural areas, and wider community involvement.
Maternal Mortality
Maternal mortality ratio (MMR), as an important indicator of socio-economic development, women’s empowerment and access to basic health care, has been recognized by the planning process from the First Five Year Plan (1951-56) onwards (Planning Commission 1952). Yet, in India, more than 1,00,000 women die every year from causes connected with pregnancy, childbirth and related complications (NFHS 2000). This has strong implications for infant survival, family ties and generational wellbeing, as these deaths not only devastate the families concerned but also lead to unfavourable social and economic relations between generations. Even if, in India, maternal deaths are substantial, precise data on these are rare at the state level. One of the different ways of improving assessment of maternal mortality is to upgrade the data on such deaths through advances in the vital registration system, reporting the exact cause of death, and inclusion of some basic background characteristics of the deceased.
Lack of studies on maternal mortality, particularly in Punjab, hamper efforts to address the problem. Though the SRS provided the MMR for Punjab for the first time in 1998, the rate is far from the reality, as it is based on information collected through the post-death verbal-autopsy method for a small sample of deaths (eight). An MMR of 199 for Punjab as against the national average of 407 seems to be a gross underestimate. Even if the SRS-based MMR is considered correct, it is still far from the National Socio- Demographic Goal for 2010, which aims to bring the MMR below 100 per 1,00,000 live births, as enunciated in the National Population Policy 2000 (NPP 2000). Maternal deaths according to the SRS are due to direct causes, consisting of haemorrhage (88%) and complications predominantly related to puerperium (12%).
According to some hospital- and community-based studies, variations in maternal mortality can be directly related to rural and urban residence, availability and use of health infrastructure for ante-natal, natal and post-natal requirements, conditions of


The use of contraceptives among Indian couples shot up to a reasonable level in a brief period from virtually no practice at the time of independence. Notwithstanding policy rigidities, socio-cultural barriers, programme deficiencies, etc., contraception today is at the core of the demographic changes that are widely sought, both officially and privately. Discounting the riddles that official service statistics present, some states have done less better than others in programme performance, and hence have contributed to regional disparity in the use of family planning methods.
In the north, apart from Himachal Pradesh (61%), Punjab is widely recognized for its good performance in implementing the family planning programme, like Maharashtra (60%) and Gujarat (53%) in the west and Andhra Pradesh (59%), Karnataka (57%), Kerala (56%), and Tamil Nadu (50%) in the south, according to the recent NFHS. Since the inception of the programme, the contraceptive prevalence rate (CPR) has consistently remained higher in Punjab than the national average, notwithstanding the controversies that had dogged the programme, till recently. Apart from awareness, the growth in CPR in the state can be attributed to vigorous programme implementation strategies, mainly tagged to incentives and disincentives to programme-staff and clients. Both official service statistics and independent contraceptive prevalence surveys have consistently established the edge of Punjab over others in making contraception reach the population widely (Table 10, Figure 8). In addition to a real difference in use of methods, the differences between official and non-official figures can also be attributed to methodological differences in the estimation.
Table 10Levels
Year MOHFW NSS/NFHS/ORG
Levels and trends In method composition
Sterilization lUD Condom Oral pill
India Punjab India Punjab India Punjab India Punjab India Punjab India Punjab1973 15.0 24.8 12.2 21.8® 11.3 11.5 1.4 6.0 2.3* 7.3* - -1975 16.3 24.6 - - 12.4 12.8 1.4 5.1 2.5* 6.8* - -1976 18.9 29.1 - - 14.1 14.2 1.5 5.2 3.4* 9.7* - -1977 26.1 36.0 - - 21.1 20.5 1.6 5.6 3.5* 9.8* - -1978 24.4 33.1 - - 20.4 20,3 0.9 3.5 3.0* 9.3* - -1979 24.4 28.9 - - 20.2 19.8 1.0 3.3 3.3* 5.9* - ~1980 23.9 27.6 - - 20.2 19.4 1.1 3.3 2.7* 4.9* - -1981 24.3 27.4 - - 20.0 19.2 1.1 3.6 3.2* 4.6* - -1982 25.6 30.2 - - 20.7 20.6 1.2 4.4 3.8* 5.1* ~ -1983 28.4 37.7 - - 22.0 24.0 1.4 7.9 4.9* 5.8* - -1984 32.4 48.0 - - 23.7 27.5 2.3 11.1 6,2* 9.4* - -1985 35.8 57.4 - - 25.0 29.9 3.0 14.3 7.8* 13.1* - -1986 38.7 60.6 - - 26.5 31.2 3.9 15,8 8.3* 13.6* - -1987 46.7 72.0 - - 27.9 33.9 4.8 18.9 7.4 17.2 1.3 1.91988 44.2 78.3 39.9 65.9* 28.9 36.6 5.5 21.8 8.3 18.0 1.5 1.91989 46.7 79.9 - - 29.8 37.2 6.2 22.4 8.9 18.4 1.7 1.91990 48.6 85.5 - - 30.1 39.3 6.6 23.9 10.0 20.2 1.9 2,11991 49.6 85.4 - - 30.3 41.1 7.0 25.5 10.1 16.6 2.1 2.11992 48.6 83.8 - - 30.3 38.3 6.6 25.3 9.4 17.8 2.2 2.41993 48.7 80.2 36.3 51.3* 30.3 37.9 1 6.6 24.3 9.9 16.1 2.0 1.91994 51.3 89.8 - - 30.3 38.5 7.2 26,3 11.2 22.1 2.7 2.91995 51.6 90.8 - - 30.2 38.9 7.6 28.1 10.8 20.6 3.0 3.31996 52.2 91.9 - - 30.2 38.8 8.2 31,4 10.7 18.3 3.2 3.41997 51.0 86.6 - - 29.6 38.5 7.8 28.8 10.4 16.5 3.1 2.91998 50.8 77.5 - - 29.3 35.5 7.6 24,7 10.1 14.7 3.8 2.71999 - - 42.8 53.8* - - - - - - - -
Source: 1. Ministry of Health and Family Welfare, Government of India, Year Books. Various volumes.2. @: National Sample Survey (NSS), 28* Round, 1978.3. #: Operations Research Survey III (1988-89), Operations Research Group (ORG), Baroda.4. $; National Family Health Survey (NFHS), India, 1992-93 and 1998-99.
Note: 1. Includes use of oral pills also.2. Indicates data not available.3. Figures are in percentages.

Figure 8
O) 0 5 Gi O) O)Year
CD CD O) 0 5 0 5 0 5
"Punjab" ' )< "India"
Source; Ministry of Health and Family Welfare, Government of India, Year Books. Various volumes.
Method Mix
The three decades of the seventies, eighties and nineties, while recording an impressive rise in contraception prevalence, also witnessed significant changes in nnethod- preference of the couples in Punjab (Figures 9 and 10). Among modern methods, the terminal ones, such as sterilization and spacing methods like the lUD continued to dominate the range of contraceptives offered by the state and registered remarkable growth in acceptance among the couples (Table 10). Comparison of results from two successive rounds of NFHS also point towards a transition in contraception-prevalence in the state in terms of method-mix and preferences, with direct implications for policy planning besides programme implementation. Rapid rise in the share of traditional methods, growth in the popularity of condoms, stagnation in the acceptance of lUD, and reduction in the traditional dominance of sterilization are some of the salient features of this transition. Already, low share of male sterilization in total sterilization has further declined from eight per cent in 1992-93 to five per cent in 1998-99, indicating continuity in male lack of enthusiasm for adoption of terminal methods. Traditional methods are more popular among older than younger women.


state can currently focus more on women in rural areas, Muslims women, women in the age group 20-29 and those with one child, in order to enhance couple-protection rates. While such target groups express the desire to delay child-bearing through family planning methods, older women, higher parity women, Hindu women and Sikh women are more for termination of child-bearing through contraception. If the family planning programme in the state is to be more result-oriented, then innovative strategies must be put in place to bring in these interested sections of the community. Existence of unmet need also reinforces the argument that fertility in Punjab can be lowered further without any coercive measures to limit the family size.
While a lower volume of unmet need for contraception reflects the potential for family planning programme in the state, both by the government and the non-government sector, very high met need for contraception in Punjab, even higher than in Kerala, may not entirely reveal the real scope for intervention. This is so because the definition of unmet need is subjective, grounded on the perception of the individual woman, which could underestimate the actual need for family limitation in dynamic and macro perspectives.
Non-use and Discontinuation
Unmet need for contraception can be better understood, if the reasons for non-use as well as discontinuation of contraception are investigated. The main reasons why couples refrain from currently using contraception in Punjab are the desire for additional children (42%), postpartum amenorrhoea and breast-feeding (32%), menopause and hysterectomy (12%) and health concerns (5%), as suggested by NFHS. Hence, increasing contraception-prevalence rate substantially in Punjab in the near future does not seem easy, without confronting pro-natal norms, particularly son preference, and addressing health concerns including possible side effects. Towns and cities in the state are virtually free from any opposition to family planning methods, reluctance to use them because of side effects and method inconvenience when compared to villages. Avenues for direct action by the state for removing bottlenecks is limited, as, over time, opposition to contraception (by religion, family and husband) and method-inconvenience are on the decline in recent times, as indicated by NFHS. Discontinuation of the used method also throws insight into programme dynamics, and rural as well as urban areas record similar patterns of discontinuation in Punjab. Couples mostly discontinue family planning when they want to have a child (19%) or when the husband is away (16%), though side effect is also a significant fc.ctor.
Social, Economic and Demographic Differentials
Socio-economic differentials in family planning practice are distinct in Punjab, as evident from NFHS. Acceptance of traditional methods of family planning, surprisingly, is much higher in urban than in rural areas, whereas in modern methods there is little gap in rural and urban use. While female sterilization is the most popular modern method in rural areas (with 64% of couples using them), in urban areas the condom is used extensively (by 33% of couples). Couple-protection rate through use of modern methods is lowest among Muslim women (32%) and women with middle school education (48%). Women from Scheduled Castes, Other Backward Castes, and households with low standard of living have also been observed to use contraception to a lesser degree than other women in the state.

Figure 12Socio-economic Differentials in Contraception in Punjab , 1998-99
Background socio-eoonomic characteristic
□ Rural HHigh Sch. BSCSHigh SDL
E3 Urban
aOBCE3 Hindu n others □ No child
I Illiterate I Muslim
□ lson
■ Literate BSikh□ Low SDL■ 1 daughter
□ Mid. Sch.
OMed. SDL
Source: National Family Health Survey 2.
The family planning programme in Punjab is also influenced by son-preference, as opting for contraception or not by couples depends to a large extent not only on the total number of living children but also on the number of living son(s). As NFHS indicates, a strong correlation also exists between the sex composition of surviving children and methods adopted for family planning (Table 11). Comparison between spacing and terminal methods shows that the acceptance of terminal methods by couples are largely dependent on the needed number of male children in the family. Even such methods as condom and lUD, which often do not finally terminate child-bearing, are used by couples after meeting the targets of family“Size in terms of the required number of sons. If the family planning programme in the state has to make further inroads and be sustainable, it must address and confront the gender dimensions.
Both the panels in Table 11 suggest that the 'Two Child Norm’ is strongly rooted in the fertility planning of the couples and determines the choice method in Punjab. The idea, highly ingrained in the minds of couples that contraceptives are only meant for use after the birth of at least one child, needs to be changed. It also confirms that there exists vast scope in the state for increased family planning practices among couples. At least, spacing methods, such as the lUD and condom, can be more vigorously promoted in the state, particularly among women with no child, one child and two children. If method- specific concerns are dealt with properly, the pill could also be reasonably promoted among women. This perhaps will have a direct impact on the level of unmet need that has been earlier recorded in the state.


being increasingly so in the recent past? There is little evidence, till now, in contemporary demographic literature that suggests a strong deviation in the sex composition of births from the biologically established ‘norm’ of 105-106 males per 100 females in Punjab. Analysis of historical sex ratios at birth for Punjab, though not conclusive, implies no reason why a surplus of male births was prevalent in colonial Punjab, as some would suggest. Annual fluctuations, coverage-error, recall lapse and classification of births either into live or still, etc., cannot justify the rise of the magnitude of sex ratio at birth (SRB) that is being witnessed since the early 1980s. The cause of this unusual increase in the surplus of male babies at the time of birth can less likely be described in terms of any biological or medical perspective, that would answer why women in Punjab have the higher probability of giving birth to male offspring(s) than their counterparts elsewhere in India.
Table 13Levels and Trends in Sex Ratio at Birth (SRB) in India and Punjab (1972-81 to 1999)
State Sample Registration System (SRS)1981 1996
90 98
National Family Health Survey (NFHS)
1972 1982 1993-97
81 91
Civil Registration System (CRS)
1995 1996 1997 1998 1999
Punjab 113 123 106 118 114 129 132 133 126 128India 110 111 107 106 107
Source; 1. Sample Registration System (SRS), Registrar General, India.2. National Family Health Survey (NFHS) 1992-93: India and different states.3. National Family Heath Survey (NFHS 2) 1998-99: India and different states.
Note: 1. Sex ratio at birth (SRB) is defined as number of males per 100 females.2 . indicates data not available.
The SRB is a direct manifestation of sex ratio at the time of conception. If social, cultural, environmental and biological factors that selectively affect the conception and carriage of female foetus to full term are absent, then higher than a ‘normal’ SRB is less probable. Being ‘secondary’ in nature, SRB is greatly affected by what happens to the ‘primary’ sex ratio (the ratio of conception) and to pregnancies. With medical evidence that endogenous factors are more hostile to the survival of male babies, not only in pregnancy but also during fours weeks after birth, one expects the male (numerical) advantage at the time of conception to prevail, but at a lesser level, conforming to the ‘normal’ SRB. But the fact that in Punjab the male advantage is more than 'normal’ at the time of birth, gives currency to the argument that a significant share of females are lost either at the time of conception or during pregnancy. Widely available sex-selection technologies, at affordable prices, till recently with little social or legal hurdles, seem to have made intervention possible for couples, either at conception or during early pregnancy.
Another route by which SRB affects child sex ratio is through its extended impact on the order of birth. In the absence of any intervention, biological or behavioural, in the process of conception and pregnancy, the sex ratio at the time of birth tends to be less masculine, or at least remains constant with the rise in the order of birth, as the later- borns are more likely to be girls than boys (Klassen 1994). Hence, it may be assumed that in high-fertility populations, more births per woman means a natural cushion against masculinity. With fertility transition under way, higher order births are being stopped

faster in Punjab than in India as a whole, leading to the preponderance of the first- and second-order births, as seen in NFHS. So, on the basis of this biological lead, one would have expected that the fertility decline in these two populations might have had a natural and independent diminution effect on the femininity of the child population, depending on its frequency. It is necessary to verify this possible effect.
Higher Female Childhood Mortality
In addition to the sex ratio at birth, the other distortion in child sex ratio comes from excess female child mortality (discussed earlier in detail). Though young-age children from both the sexes have gained in chances of survival, especially during the past two decades, improvements in mortality conditions have not been able to wipe out the excess female disadvantage that has long characterized mortality in Punjab. The persistent higher death rate for the girl child, relative to the opposite sex, highlights the setback that young female members of households have to face. Shortages of females, at birth and at early age, create numerical disparity in the childhood for each cohort, difficult to alter subsequently.
Sex Preference
Changes in sex ratio are linked to the overall preference for the male child in Punjab. Strong male dominance in mediaeval history, extending up to the modern period, has characterized the state. Regular invasions from across the border, male-oriented agricultural system, presence of sizeable sections of lower-caste population, focus on male-centric rituals and kinship systems, absence of strong social reform movements, etc., have contributed to higher value of the male child in traditional Punjabi society. In modern Punjab, in spite of the rise in female education and legal support, there are many reasons, in popular perception, for not having a female child. Here, the position of the daughter-in-law in the family is defined, on her arrival, to the culturally-sanctioned urgency of producing a child, preferably a son.
In spite of economic progress, institutional arrangements, constitutional support and educational campaigns, preference for a male child among the couples still persists extensively in Punjab. As indicated by two sets of NFHS, for couples in the state, in 1999, the mean ideal number of children, on an average, was 2.3, which consisted of 1.2 sons, 0.8 daughters and 0.3 children of either sex. In 1993, the mean ideal number was 2.6 with 1.5 sons, 0.9 daughters and 0.2 children of either sex. The fact that among ever-married women in 1999, 86.2 per cent of the couples wanted at least a son and 78.0 per cent at least a daughter, 29.1 per cent wanted more sons than daughters and 0.4 per cent more daughters than the sons, highlights how the desire for a male child is endemic in Punjab.
Sex-Selective Abortions
Desire for a male child being strong and the sex ratio at birth increasingly turning masculine in Punjab, it is likely that a sizeable share of female foetuses are terminated during pregnancy. Data on the nature and scale of abortions in Punjab, as revealed by recent surveys, do not indicate such a scale of pregnancy terminations as to result in a highly masculine sex ratio at birth. Recent large-scale surveys data are silent on the sex composition of induced abortions, though they establish a somewhat higher incidence of such abortions in Punjab than the national average. Direct data too suggest acceleration


With gains in average life expectancy being substantial in the state as observed, survival to a higher age is increasing and causing a continuous rise in numbers and percentages of persons aged 60 and above in both rural and urban areas (Table 16, Figures 5 and 6). Rise in the share of male and female elderly in Punjab, when considered in the national context, is on the higher side. In 20 years, the old age population has increased by 57 per cent in the state from 1.01 million in 1971 to 1.59 million in 1991.
Table 16Trends in the Percent Share of Persons 60 and
above in Rural and Urban Areas in India and Punjab (1971 to 1998-99)Year Punjab India
Rural Urban Total Rural Urban Total1971 8.03 5.72 7.48 6.21 4.98 5.971981 8.44 6.12 7.80 6.84 5.36 6.491991 8.51 6.25 7.84 7.11 5.75 6.701998-99 11.90 9.90 11.20 8.10 7.30 7.90*
Source: 1.
2 .
Ageing Population o f India: An Analysis o f 1991 Census Data, Registrar General, India.National Family Health Survey 2: India and Punjab.
Figure 13Share of the Aged in Total Population in Punjab (1971-99*)
12i
2(CszCO
c<D0
Q.
1971 1981 Year 1991 1998-99
Rural H Urban D Total
Source: 1. Ageing Population of India: An Analysis o f 1991 Census Data,Registrar General, India.
2. National Family Health Survey 2: India and Punjab.

Figure 14Share of the Aged in Total Population in India (1971-99)
1971 1981 Year 1991 1998-99
I Rural E3 Urban H Total
Source; 1. Ageing Population o f India: An Analysis o f 1991 Census Data, Registrar General, India.National Family Health Survey 2: India and Punjab.
In 20 years since 1971, the average annual growth rate, among the elderly in Punjab, has changed considerably in terms of both sex and age. Growth in the population of elderly women not only surpassed that of the elderly male but also of the female population of all ages (Table 17). Among both male and female elderly population, growth rates of the 'young-old’ population (aged 60-79) exceeded those of the 'old-old’ (aged 80 and above).
Table 17
Age(in completed years)
Punjab IndiaMale Female Male Female
60+ 2.28 3.65 3.70 3.63All ages 2.42 2.56 2.73 2.70
60-69 2.23 3.75 3.27 3.4070-79 2.57 3.97 4.12 3.9780-89 2.04 3.03 5.93 4.5490-99 1.89 3.07 5.39 4.16100+ 0.12 -1.09 1.25 0.47
Source; Ageing Population o f India: An Analysis o f 1991 Census Data, RegistrarGeneral, India.
Note; Figures are in per cent.

Rise in the proportion of the elderly in the scale observed and expected in Punjab, has multifaceted consequences that need to be addressed seriously. These broadly relate to continuous social, economic, cultural, technological, and health transformations in the society. Specifically, these implications can be elaborated as changes in marital status, newer living arrangements, widespread age and gender discrimination, ongoing epidemiological transition, frequent loneliness and depression, impairment of functional status leading to disability, lowering of socio-economic status, decline in family support, non-availability of social security, lack of care-giving, vulnerability to natural disasters, etc. Unfortunately, for the population in Punjab, not much is known of these aspects and there is need for more research and documentation in these areas for effective intervention.
While dealing with ageing in Punjab, lessons have to be drawn from other ageing societies, so that the mistakes of treating the problem primarily as an issue of health care and economic empowerment, must not be repeated in policy planning for the elderly. In addition to these two aspects, the social and emotional dimension of ageing must be addressed, if its onslaught is to be effectively dealt with. Foundations for a new philosophy of ageing are essential for a regime of 'productive ageing’ where older persons are active contributors rather than mere consumers.
At the national level, the National Policy on Older Persons (NPOP), announced in 1999, recommends a series of steps that help to deal with issues related to ageing. In Punjab, there is need to assess the progress that has been made till date, under NPOP, to encourage individuals to make provision for their own as well as their spouse’s old age, and other old family members; ensure primacy of non-institutional care, added protection for vulnerable elderly such as widows, frail, handicapped, abused and destitute, promotion of geriatric health care and services, monitoring, evaluation and up-gradation of services for the elderly, fostering of inter-sectoral partnership and spread of awareness for the elderly. Involvement of the district administration, local self- government, NGOs and Panchayati Ra\ institutions and self-help groups in devising integrated programmes, also need to be examined along with progress in the establishment of old age homes. Such an evaluation will make the initiatives and measures more meaningful and relevant to the needs and welfare of the aged.
REGIONAL DEMOGRAPHIC DISPARITY
Like every major state in India, the demographic situation in Punjab is very different across communities, rural and urban areas and administrative units. Serious difficulties are encountered while capturing these variations meaningfully, even if they are useful for policy planning and programme implementation. One such constraint is lack of appropriate data for smaller units, particularly for districts that are at the hub of decentralized planning. Selected information from some recent surveys and estimations are by and large meaningful overview the demographic disparity in Punjab, which are manifestations of social, economic, cultural and other diversities.
Data on selected indicators reflect the demographic heterogeneity in Punjab. Lower rates of growth in Nawasahar (1.04%), Hoshiarpur (1.38%) and Moga (1.39%), and
higher rates in Ludhiana (2.45%), Rupnagar (2.34%) and Amritsar (2.27%), as against the state average (1.98%) for the total population during 1991-2001 indicate the varied demographic situation. Even if fertility is declining in Punjab, variations in the fertility are still considerable. Recent indirect estimates (Guilmoto et al. 2002) indicate total fertility to range from as low as 2.1 in Jalandhar to as high as 2.8 in Firozpur in 2001; with districts in central Punjab recording lower TFRs (2.2 in Kapurthala and Nawasahar, and 2.3 in Hoshiarpur, Ludhiana) than their counterparts elsewhere. Data on birth-order indicate that in the high fertility districts a substantial share of women depart from the two-child norm and have more of higher-order births. For example, 45 per cent of births are third and higher order in Amritsar as opposed to 30 per cent in Jalandhar. Other districts where third and higher order births are sizeable in the state (36.0%) are Firozpur (43%), Moga (41%), Gurdaspur (4^%), Mansa (37%) and Muktsar (38%), according to data from the 1998 Rapid Household Survey (RHS). District-level regression of fertility , on some selected socio-economic variables for 1991 indicate that fertility is significantly correlated with female literacy rate, female mean age at marriage, percentage of married females in the age group 15-19, percentage of households with electricity connections, percentage of households living in pucca households (Registrar General, India 1997).
Variations in family planning practice, as a proximate determinant of fertility, can directly account for some inter-district differences. While on the whole Punjab has a higher level of contraception, couples in Rupnagar (71%) and Bhatinda (69%) were greater users of family planning methods than the couples in Mansa (64%), Moga (64%) and Firozpur (62%) in 1998. It is interesting to note that some low-fertility districts, namely, Jalandhar (65.0%), Hoshiarpur (64%), Kapurthala (63%) and Nawansahar (65%) are not at the top of family planning use. Age at marriage, a direct element in demographic change, varies considerably in Punjab. Districts where females marry earlier, before the legal minimum age 18, are mostly confined to the southwest (Firozpur, Mansa, Moga, Bhatinda and Faridkot). District level changes in the child sex ratio in Punjab can be viewed through the sex ratio at birth available from the Civil Registration System (CRS 1999), in spite of its inadequacies. Bhatinda (135), Mansa (135), Sangrur (137) and Patiala (136), all in the west, have very high masculine sex ratio (males per 100 females) at birth. Interestingly, in none of these districts reporting masculine sex ratio at birth, induced abortion is higher than the state average, except for Patiala, according to the 1998 RHS. On the contrary, the percentage of pregnancies deliberately aborted is reported to be high in Kapurthala (5.8), Jalandhar (5.1), Fatehgarh Sahib (5.0), and Amritsar (4.9).
Correlation of some demographic variables with others at the district level reveals deficiencies of the quality of data and establishes the complexity of relationships in Punjab. In some cases the relationship is clear (Figures 15, 16, 17, 18 and 19), whereas in others (between sex ratio at birth and child sex ratio) it is intricate. Such patterns among demographic and socio-economic variables need elaboration and reinforce the need for policy interventions to be specific rather than grossly uniform across the state.

O)03(D
0)cnc■>>u .03
E0mE0)
= 0.5864
15 17 19 21Crude birth rate
23 25
Source; Rapid Household Survey (RHS), 1998.
Figure 16Relationship between Female Literacy and Share of Higher
Order of Birth
B 80CD
85
80 '
75 i V** R-" = 0.2079
65
600u- 55
0TOE
5025 30 35 40
Birth order (3 and above)
45 50
Source; Rapid Household Survey (RHS), 1998.
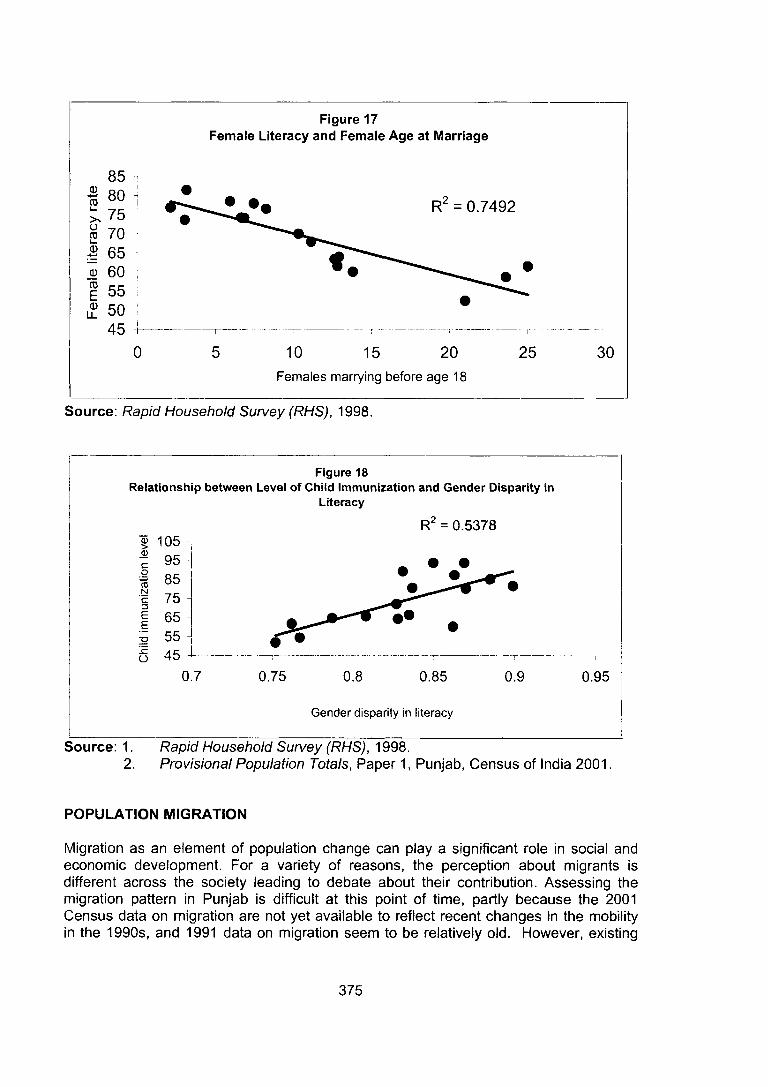
850(0 80L_> . 75o2 700 65Q) 60CD
E 550
U _ 5045
= 0.7492
0 10 15 20Females marrying before age 18
25 30
Source; Rapid Household Survey (RHS), 1998.
Figure 18Relationship between Level of Child Immunization and Gender Disparity in
Literacy
= 0.53780)> 105 i
c 95oro 85N'c 75 -EE 65 -1o 55 -£O 45 -L
0.7 0.95
Gender disparity in literacy
Source: 1. Rapid Household Survey (RHS), 1998.2. Provisional Population Totals, Paper 1, Punjab, Census of India 2001
POPULATION MIGRATION
Migration as an element of population change can play a significant role in social and economic development. For a variety of reasons, the perception about migrants is different across the society leading to debate about their contribution. Assessing the migration pattern in Punjab is difficult at this point of tinie, partly because the 2001 Census data on migration are not yet available to reflect recent changes in the mobility in the 1990s, and 1991 data on migration seem to be relatively old. However, existing

migration statistics may describe some of the patterns that have confronted Punjab till recently.
Migration into Punjab needs to be examined in terms of domestic and international sources. Depending on the definition, based either on place of birth or on place of last residence, used to measure migration in India, the 1991 Census enumerated 1.12-1.13 million interstate migrants into Punjab, who came from other states and Union Territories in India as compared to 0.87-0.89 million in 1981 and 0.58-0.64 million in 1971. Such migrants constituted 5.5 per cent of the total population in the state in 1991, 5.3 per cent in 1981 and 4.3 per cent in 1971. Sources of inflow indicate that the majority of domestic migrants into Punjab are from the adjoining and neighbouring states and Union Territories (Table 18). The only far-away locations from where people move in large numbers into Punjab are either in Bihar and Uttar Pradesh, which, together with the adjoining states and Union Territories, account for a little less than 90 per cent of interstate migrants into Punjab (Figure 19).
Table 18
Origin of migration
1971 1981 1991Place of
birthPlace of
last residence
Place of birth
Place of last residence
Place of birth Place of last residence
Bihar 1.3 1.3 5.8 5.4 8.1 7.9Haryana 31.0 32.5 28.4 29.4 26.5 26.6H. P. 15.4 13.7 12.9 12.1 12.1 11.7J .& K . 4.5 4.1 3.5 3.4 3.2 3.2Rajasthan 10.0 11.7 10.5 10.3 9.8 9.7U. P. 24.0 22.4 25.2 24.0 24.9 24.4Delhi 4.2 5.7 4.2 4.7 4.1 4.4Others States and UTs in India
9.6 8.6 9.5 10.7 11.3 12.1
Allinterstatemigrants
100.0(584853)
100.0(636230)
100.0(872377)
100.0(887492)
100.0(1126149)
100.0(1120282)
Source; Census of India 1971, 1981, 1991: Punjab.
Figure 19Interstate Migration into Punjab (1991)
IBihar HHaryana □ H P . 0 J and K ORajasthan BU.P. DDelhi 0Others
Source; Census of India.

Figure 20interstate Out-migration from Punjab (1991)
EHaryana HDelhi lElRajasthan DU.P. BH.P. 0Maharashtra QChandigarh HM.P. QOthers
Source: Census o f India.
Migration from across the border is negligible in Punjab. For 1971, 1981 and 1991, the total immigration (from the countries of Asia, Africa, Americas, Europe and Oceania) into Punjab has been estimated as 1.1 million, 0.87 million and 0.55 million respectively, according to the place-of-birth definition, and 0.81 million, 0.68 million and 0.47 million respectively, according to the place-of-last residence definition. Inflow of such magnitude may appear sizeable in absolute terms, but the reality is that a bulk of such migration is from a single origin and was a one-time affair as part of a tumultuous event in the history of lndia--partition and creation of the present day Pakistan--in 1947. The share of the movement from Pakistan in the total international immigration into Punjab remained incredibly high in the post-independence period, declining marginally from 98.5-97.9 per cent in 1971, to 98.3-97.9 per cent in 1981, and to 96.8-96.5 per cent in 1991, depending on the method of measurement. Next to Pakistan, the other source from where more than 10,000 international migrants have come to Punjab is Nepal. It is extremely difficult to record out-migration from Punjab to destinations outside the country accurately. Data on international out-migration from Punjab is extremely difficult to compile, making the available estimates inadequate and unreliable. Indirect evidence and periodic reports, other than migration statistics, tend to imply a regular and substantial emigration from Punjab, particularly the Doaba region.
Economic and social factors motivate people to leave their homes for new destinations, and this is true for migrants heading towards Punjab. Besides being part of the family movement, search for employment and matrimonial alliance are two major reasons why men and women migrate into Punjab. While male migration is mainly employment- related, female migration is predominantly due to marriage. During 1987-88, according to the National Sample Survey (NSS), nearly two-thirds of the male in-migrants explained their movement as primarily employment- and business-related, and 28 per cent associated the moves with family movement. Among female in-migrants, 76 per cent attributed their movement to marriage, and 16 per cent to migration of the family to which they belonged, in the rural areas of Punjab. Similarly, among all urban male inmigrants, 50 per cent cited (better) job prospects as the main reason for relocation, and 30 per cent said that they accompanied their families, as against 43 per cent and 46 per cent of females who gave the main reason as marriage and accompanying their families into towns and cities. ’

Even if out-migration is considered to be significant in Punjab, reliable data is available only for those going to other place in the country. According to 1991 migration statistics, based on the place-of-birth definition, 1.38 million interstate migrants from Punjab were found in other States and Union Territories. Within India, outward migration from Punjab is mainly directed towards the neighbouring States and Union Territories, which receive a little more than three-fourths of the interstate outflow from Punjab. For example, the most popular destinations outside the state, for those leaving Punjab, are places in Haryana, Delhi, Rajasthan, Uttar Pradesh, Himachal Pradesh, Maharashtra, and Madhya Pradesh. Out of 100 persons migrating from Punjab to different places in India, 26 go to Haryana, 17 to Delhi, 13 to Rajasthan, 12 to Uttar Pradesh, seven to Himachal Pradesh, and four each to Madhya Paradesh and Maharsahtra. In the absence of the 1991 data on population movements towards Jammu and Kashmir, if Chandigarh is added to the list of destinations, the above States and Union Territories together are home to 92 per cent of interstate migrants from Punjab. This indicates that as in other states, domestic migration from Punjab is primarily middle- and short-distanced. Since 1971 there has not been any significant change in the inland destinations of migrants from Punjab. They constitute a sizeable proportion in Himachal Pradesh (43%), Haryana (23%), Rajasthan (14%), Uttar Pradesh (9%) and Delhi (7%), and are significant from the point of view of these States and Union Territory, according to the place-of-birth statistics of 1991.
POPULATION POLICIES AND PROGRAMMES: NEED FOR STATE POPULATION POLICY
In the Indian context, the population policy is basically meant to lower fertility through greater family planning efforts. It covers other areas such as marriage, mortality, migration, reproductive and child health, other health care delivery, gender relations, nutrition, community participation and communication that aid reduction in fertility levels. Institutionalization of demographic and related concerns through setting up long-term and short-term goals, organizational arrangements, outlining frameworks for interventions, specification of operational strategies, provision of monitoring and evaluation, and mechanisms of impact-assessments may also be some other elements of such a policy. Programmes are designed and put into practice, by (with support from) the government, to influence demographic structures and trends with or without explicit policy statements to cover relevant tasks.
Scores of programmes, mostly sponsored by the Union Government, address the demographic and related issues of Punjab; some more directly than others. Infrastructure, transport, community participation, women’s involvement, health guides, reproductive and child health, school health check-up, training of health workers, postpartum services, contraception, sterilization beds, social marketing, information, education and communication, etc., are some of the critical areas covered in the state by the department of family welfare under a host of schemes. While some of these schemes are evaluated and feedback made available, others need to be examined for making them more effective for promoting health and population outcomes, with or without a population policy for Punjab.
The National Population Policy 2000 (NPP 2000) is a milestone in dealing with issues related to health and family welfare, and reflects the national demographic concerns of

the country. While the NPP 2000 addresses diverse national issues, there is need to prioritize the concerns and focus on the policy options at the state level, for which the state population policy is an excellent instrument. Moreover, as a step towards grassroots planning, it has the advantage of accon^imodating the district and community level interests singularly. Perhaps this is the reason why state level population policies are being increasingly formulated in India to focus on specific problems in greater detail. Since health is a state subject, such documents are increasingly seen as documents of decentralization, regional planning, integration with the national scene, local commitment, and desire to deal with the problem differently. Formulated in this background, there is neither disagreement nor duplication between the NPP and the state population policies. In fact, the NPP can provide an important framework for the advocacy and operationalization of state population policies, which can supplement the goals of NPP. This synergy between the two is particularly useful when the states are guided and funded by the Union Ministry of Health and Family Welfare in the matters of its concerns.
The states are realising progressively the role of the state population policy in charting out the course of population growth in the context of the commitment to time-bound benchmarks, decentralized planning and socio-economic development. Hence, such states as Gujarat, Karnataka, Madhya Pradesh, Maharashtra, and Rajasthan have already announced their respective state population policies, whereas Haryana, Kerala, Orissa, and Tamil Nadu, Uttar Pradesh are in the process of drafting them. In the long term, health and demographic programmes, tailored to the goals enunciated in the state population policy, are to provide continuity to population stabilization efforts. Realization of the spirit of the SPP is a step forward in shaping the demographic dimensions in tune with welfare, as well as sustainable development objectives. However, in spite of the centrality of demographic issues in public policy measures, Punjab has not yet come out with a population policy. While initiatives have reportedly been taken in this regard in drafting the policy, the government is yet to adopt it, and the details have not been made public for initiating debates and discussions in relevant circles. Some recent developments, particularly in the field of data availability from the Census of India 2001, National Family Health Survey (NFHS), Rapid Household Survey (RHS) and completion of a set of thematic in-depth studies at the micro-level, perhaps fulfill the primary information needs for such a policy at the state level.
Creation of institutions, such as State Population Commission, not necessarily in the pattern of the National Population Commission, can also help in need-assessment and envisaging near- and far-term objectives for the state. With adequate provision of intersectoral co-operation beyond official organs, such a commission can foster and mobilize the desired impact. If needed, a special piece of legislation on the subject can also motivate the government. These steps would presuppose not only a non-traditional approach and strong political commitment, but also critical evaluation of the efforts undertaken till date.

DEMOGRAPHIC CHALLENGES AND OPPORTUNITIES: PERSPECTIVES FOR FUTURE
Attempts at greater economic and social development in Punjab must also include focus on demographic dynamics. The demographic challenges the state faces today are manifold and steps are needed to address these concerns. Demographic goals may be easily articulated, quantified and enunciated in policy documents, but translating them into reality is difficult. Bringing about desired behaviourial changes in the target population is complex and time-intensive. This is why demographic programmes have long gestation periods for yielding results. Moreover, unlike other areas, the spillovers are crucial to demographic attainments and there is a great deal of interdependence between population dynamics in the state and events outside. As elsewhere, anchored c uongly in the economic and social conditions of the people, the fate of demographic development in the state is going to be profoundly influenced by the strategies of economic development and overall improvement in living standards.
The contours of population planning must go beyond the goals set in the National Population Policy and cover grounds that are central to larger issues of human development. Some of the direct and foreseeable demographic challenges that Punjab faces today can be outlined as attainment of replacement level of fertility, elimination of early-age child-bearing, reducing infant and childhood mortality coupled with excess female disadvantage, getting rid of sex-selection during conception and practice of female foeticides, balancing a skewed sex ratio that is highly masculine among children, eliminating extensive son-preference, raising low hospital delivery rates resulting in undesirable maternal deaths, changing the unfavourable demographic regime among socially and economically weaker sections, meeting the unmet need for contraception, promoting men’s participation in family planning, removal of regional demographic disparities, and preparations for dealing with an ageing population. At one level, these thematic areas must be at the core of a series of actions by the state, whereas at the other, some critical areas should be simultaneously considered to make the thematic outcomes successful. There are listed below.
Restoration of public confidence in government’s health sector is a daunting task and has implications for achievement of demographic goals in the state. In rural areas. Community Health Centres, Primary Health Centres, Subsidiary Health Centres, and Sub-centres are not fully equipped to respond to people’s needs and are known to have constraints that prevent optimum utilization of their services. Since family planning is largely seen as the government’s initiative and is implemented through the health department, health sector performance is critical to the success of the family planning programme.
Another area, which merits serious attention, is the need for greater public participation. Broad-basing community participation implies not only greater involvement in programme-implementation but in policy formulation as well. Schemes do not succeed because they do not reflect the needs and concerns of the people with changing times. Programmes are not altered in tune with the changing reality in rural or in urban areas. With the and Constitutional Amendments providing a framework for grassroots devolution and local participation, efforts to stabilize population can only succeed if the functions, functionaries and funds are used in keeping with expectations of the public at all levels. Related with this is the identification of fringe and vulnerable groups and

ensuring that their legitimate interests are well represented in programme formulation and implementation. Scheduled Caste population, migrant groups, landless households, slum dwellers, etc., constitute such marginalized sections whose demographic profiles might need more attention. Creating adequate opportunities for these groups and safeguarding their interests are also major tasks of the future for achieving demographic goals. The current programme interventions do not address gender disparities adequately. Much of the success in population and related programmes depends on how the issues that confront women and children are reflected in the policy and programme priorities. Since women are at the centre of demographic change, creating a mechanism that is sensitized towards their position in society, will also determine the success of initiatives by the government.
Reliable, long-term and cross-sectional data aid demographic assessments, make policy formulations and programme interventions accurate as well as focused. In Punjab, there is need to encourage indigenous data generation, particularly in the course of programme intervention. Overhauling present data collection, compilation, management and use-systems, is long overdue, as the current management information system does not keep pace with the rapid and ongoing changes in the society. Useful data have to be regularly collected, rigorously tested, systematically compiled, and made accessible to the public. Demographic publications are not many, not updated regularly, and are not widely available, leading to poor public perception of the issues involved. The focus on segmentation at various levels is lacking, with maintenance of records in most of the health institutions deficient and unreliable. Utility of data management is yet to be fully understood and the meagre networking with nodal centres yields fewer inputs to field staff. There is need to examine the constraints and provide strong support to such endeavors, in terms of allocation of funds, qualified personnel and infrastructure. Efforts of Punjab Health Systems Corporation (PHSC) in compiling and analysing data from 154 hospitals and community health centers (CHCs), to identify areas of intervention and bring about improvements, are a step forward.
Turning the demographic tide is not difficult in Punjab, with higher ranking in human development being its great asset. The state has some inherent healthy features that are the source of enormous advantage in population planning and weigh heavily in favour of attempts to define and shape demographic attributes. Provision of a wide rural infrastructure, wider access to basic amenities, high and balanced urbanization pattern, low incidence of poverty, less rural-urban gap in the provision of health services, an innovative and spread-out private sector, household prosperity, regular media exposure, greater female literacy, traditions of religious philanthropy, etc., act as force-multipliers in intervention activities and hold out great promise for efforts to change the population profile.
References
Abbi, B.L., Nanda, A.K., Malhi, Prahbhjot, Aggarwal R.K., Sing, Sukhvinder, Khurana, Samidha (2000), Operations Research on Spacing Methods: A Study of Operational Efficiency of Family Planning Programme in Rupnagar District, Punjab. Centre for Research In Rural and Industrial Development (CRRID), Chandigarh.
Ahluwalia, M.S. (2000), 'Economic Performance of States in Post Reform Period’, Economic and Political Weekly, XXXV(19), pp. 1637-1648.

Das Gupta (1987), 'Selective Discrimination against Females in Rural Punjab, Population and Develoment Review, 13(1), pp. 77-100.
_____________ (1997), 'Liberty, Equality and Fraternity: Exploring the Role of Governance inFertility Decline’, Working Paper Series, Number 97.06, December, Harvard Centre for Population and Development Studies, Harvard School of Public Health.
Dyson, Tim (2001), 'Birth Rate Trends in India, Sri Lanka, Bangladesh, and Pakistan: A Long Comparative View’, in Fertility Transition in South Asia (Ed.) Sathar, Ayesha Zeba and Philips James F., International Studies in Demography, Oxford University Press, Oxford, pp. 51-77.
Goyal, R.P. (1988), Marriage Age in India, B.R. Publishing Corporation, Delhi.
Guilmoto, Christopher Z. and Rajan S. Irudaya (2002), 'District Level Estimates of Fertility from India’s 2001 Census’, Economic and Political Weekly, XXXVII(7), pp. 665-672.
Klassen, Stephan (1994), 'Missing Women Reconsidered’, World Development, 22(7), pp. 1061- 1071.
Krishnaji, N. (2001), India’s Sex Ratio Conundrum (Ed.), Rainbow Publishers, New Delhi.
_____________ (2002), 'Working Mothers, Poverty and Child Loss’ in Thinking Social Sciencein India: Essays in Honour of Alice Thorner (Ed.), Patel Sujata, Bagchi Jasodhara, Krishna Raj, Sage Publications, New Delhi, pp. 187-191.
International Institute of Population Sciences, and Measure DHS+, ORC Macro (2000), National Family Health Survey 2, India 1998-99: India, Mumbai.
_____________ (2001), National Family Health Survey 2, India 1998-99: Punjab, Mumbai.
International Institute for Population Sciences (1995), National Family Health Survey 1992-93, India, Bombay.
Miller, B.D. (1981), The Endangered Sex: Neglect of Female Children in Rural North India, Ithaca, New York.
Natarajan, D. (1972), 'The Change in Sex Ratio’, A Census Centenary Monograph, Number 6, Office of the Registrar General, India, New Delhi.
Population Research Centre (PRC) (1998), Family Welfare Services in Punjab: Coverage and Client Satisfaction - A Rapid Assessment Survey in Rupnagar District, Punjab, July, Centre for Research in Rural and Industrial Development (CRRID), Chandigarh.
_____________ (1999), Target-free Approach in Family Welfare Programme: ConcurrentEvaluation of Fatehgarh Sahib District in Punjab, November, Centre for Research in Rural and Industrial Development (CRRID), Chandigarh.
(PRC) (2000), Availability of Condoms and Oral Pills in Punjab: A Village LevelAssessment Survey in Selected Districts, August, Centre for Research in Rural and Industrial Development (CRRID), Chandigarh.
Population Research Center, Centre for Research in Rural and Industrial Development, and International Institute of Population Sciences (1995) National Family Health Survey: MCH and Family Planning, Punjab 1993, Bombay.
Planning Commission (1952), Government of India: The First Five Year Plan, pp. 489-524.

Premi, M.K. (1991), India’s Population: Heading Towards A Billion-An Analysis of 1991 Provisional Results, B.R. Publishing Corporation, New Delhi.
Registrar General, India (1997), District Level Estimates of Fertility and Child Mortality and their Interrelations with Other Variable’s, Occasional Paper No. 1 of 1997, New Delhi.
(2002), Survey of Causes of Death (Rural), India, Annual Report (1998),Series-3, New Delhi.
_____________ (nd), Sample Registration System: Statistical Report, Various volumes, NewDelhi.
_____________ (nd). Birth Interval Differentials in India 1984, Vital Statistics Division, NewDelhi.
UNFPA, India (2001), POP Times, The Population and Development Newsletter, Volume 3 (3), August, New Delhi.
Visaria, P. (1971), The Sex Ratio of the Population of India’, Monograph No 10, Census of India 1961, Office of Registrar General, India, New Delhi.

Chapter 10
HEALTH
INTRODUCTION
Health is clearly stated as a priority, in the First Five Year Plan: ‘nothing can be considered of higher importance than the health of the people which is a measure of their energy and capacity as well as of the potential of man-hour for productive work in relation to the total number of persons maintained by the nation. For the efficiency of industry and of agriculture, the health of the worker is an essential consideration’. To define health is a complicated task. Medical professionals look at health as the absence of disease. The World Health Organization (WHO) defines health as a state of complete physical, mental and social well-being and not merely an absence of infirmity and disease. As reflected in many studies, the health of an individual does have a direct relationship with human resource development and economic development.
Ttiis chapter attempts to describe the development of health services, particularly after 1966. Starting from a historical perspective of health-planning in India and Punjab, it analyses various issues, mainly related to trends in outlays and expenditure during the different Five Year plans and the annual plans; availability of infrastructure facilities and other health services in Punjab during 1966-2001; morbidity and treatment pattern; health-seeking behaviour and utilization patterns of available health care facilities and services; health of the vulnerable population with special reference to maternal and child health services; status of nutrition; and the disabled population. An attempt has also been made to incorporate the health provider’s perspective as to what needs to be done further for developing the health sector and services in Punjab. The last section describes the vision and works out some operational strategies to achieve the same.
A HISTORICAL PERSPECTIVE
Health Planning in India
Health Planning in India started, as early as in 1943, when the Bhore Committee was appointed to go into health and medical needs of India. The committee recommended the control of major communicable diseases, and development of health organizations for providing health services to the people. Its recommendations were given due importance during the subsequent five year plans. At the time of independence in 1947, the health infrastructure was mainly urban and clinic-based, providing only curative services. On 2 October 1952, rural health services were launched through a Primary Health Centre (PHC) in each block, covering a population of 66,000. Along with the establishment of health-centre complexes, a number of disease control programmes were taken up (vertical programmes), to be integrated with rural health services. They were malaria, filaria and goitre in the 1950s: leprosy, tuberculosis and small pox in the 1960s; and the expanded immunization programme (EPI) and National Programme for Control of Blindness in the 1970s. Thus, by the end of the Third Five Year Plan, India
The First Five Year Plan, Planning Commission, Government of India, p. 488.
384

laid the foundation of basic health services, originally defined by the WHO as ‘a network of coordinated, peripheral and intermediate health units with a central administration, capable of performing effectively a selected group of functions essential for the health of a nation, and assuring the availability of competent professional and auxiliary personnel to perform these functions’. Subsequent five year plans focused on the need to integrate family planning with maternal and child health (MCH) and nutrition services, and to intensify control of communicable diseases, particularly malaria and small pox, and also the training programmes. The Sixth Five Year Plan (1980-85) adopted the goal of Health for All (HFA 2000 AD) and the net reproduction rate (NRR) of Unity by 2000 A.D. The plan provided for restructuring norms for rural health infrastructure and its vast expansion and development of promotive and preventive services along with curative facilities. In 1983, for the first time, a National Health Policy was formulated. It laid stress on preventive, promotive, public health and rehabilitative aspects of health , care and pointed to the need for establishing comprehensive primary health care services to reach the population in the remotest areas of the country.
In the Seventh Five Year Plan (1985-90), the major thrust was laid on the consolidation of the health infrastructure already developed. The objectives of the Eighth Five Year Plan (1992-97) realized that the health facilities must reach the entire population by the end of the plan period. The HFA paradigm must take into account not only high-risk vulnerable groups, i.e., mothers and children, but also focus sharply on the underprivileged segments, and, therefore, within this strategy, ‘Health for Underprivileged’ would be promoted consciously and consistently. The Ninth Five Year Plan (1997-2002)^ observed that inappropriate location, poor access, poor maintenance, gaps in critical manpower, mismatch between personnel and equipment, lack of essential drugs/diagnostics, poor referral linkages, are some of the factors responsible for sub-optimal functioning of primary health care institutions. The plan in general aims to improve the health-status of the population by optimizing coverage and quality of care by identifying and rectifying the critical gaps in infrastructure, manpower, equipment, essential diagnostic reagents and drugs.
Most recently, the Ministry of Health, Government of India has prepared the National Health Policy (NHP) 2002. The main objective of NHP-2002 is to achieve an acceptable standard of good health among the general population of the country.
Health Planning in Punjab
Punjab, as such, does not have any specific health policy of its own. Health programmes in the state, as in most of the other Indian States, have continued to pursue, the policies of the Union Government. Even though health is a state subject, the policies and programmes framed by the Central Government are top priorities, as they are usually accompanied by a grant component, sometimes up to 1 0 0 per cent.
Prior to the beginning of the Fourth Five Year Plan, efforts had already been made to expand the health services to meet the requirements of the people of the state,
Dutt, P.R., Primary Health Care Rural Communities, Vol. 1 (1993), Gandhigram Institute of Rural Health and Family Welfare Trust, Tamilnadu, India, p.4
Ninth Five Year Plan (1997-2002), Thematic Issues and Sectoral Programmes, Government of India, Planning Commission, New Delhi, p. 142.

according to the guidelines laid down by the Central Government. However, the problem of making these services adequate for the community was yet to be solved? The population served in 1966 was 2,758 per doctor, 8,119 per midwife, 7,797 per nurse and 1,384 per dai, which were grossly inadequate. The total numbers of beds available (8,737) in 1966 were much less, and on an average 72 beds were available per lakh of population. Moreover, there were large-scale disparities in the availability of beds. For example, three districts, namely, Amritsar, Ludhiana and Patiala had 57 per cent of the total beds available in the state. It was stated in the Draft Outline of Fourth Plan that ‘there has been a steady increase in the health facilities available in the Punjab State but, unfortunately, the gains made had been absorbed by the growing population"^. It was further felt that ‘there should also be qualitative improvements in the service rendered to the community. Whatever the deficiency in the registration of “vital statistics”, the high death rate as well as high infant mortality rate are indicative as much of the inadequacy and the low quality of health services available to the population in general’ . It was felt that there is an urgent need to expand the health facilities at a faster rate than the rate of growth of population particularly in Sangrur, Bhatinda, Ferozepur, Rupnagar, Hoshiarpur and Gurdaspur districts.
Based on the above few priorities listed in the Fourth Plan, allocations were made to improve the quality of service, particularly in rural areas, and meet the need for special inducement and facilities provided to the medical and paramedical personnel. ‘Thus, during the Fourth Five Year Plan, efforts were made to provide medical and health facilities to the people, both in urban as well as in rural areas of the State. Efforts were made to improve the hospitals in the matter of staff, equipment and physical facilities and the highest pnority was assigned to the family planning programme to check the growth of population in the State For the first time. Rupees 25 lakh were earmarked for ‘Child Health Care Campaign’ in the last year of the Fourth Plan (1973-74), out of which only Rupees 16.63 lakh were utilized.
The Fifth Five Year Plan laid emphasis on building the health infrastructure. It was proposed to establish health Sub-centres at the rate of one each for a population of 10,000. Provisions were incorporated for upgradation of 29 PHCs to 30-bedded rural hospitals. Proposals were made for opening 150 new dispensaries in rural areas and to establish dental clinics in each block. There were proposals to open new Ayurvedic/Unani dispensaries, and to establish common medical facilities in rural areas, including diagnostic facilities such as X-Ray, laboratory, operation theatre and library for doctors serving in these areas, and completion and improvement of existing district hospitals.
In the Sixth Five Year Plan, it was strongly felt that the existing number of medical institutions in the state was sufficient to meet the needs of the people. Simultaneously, it was also felt that the expansion of these institutions had not been brought to a reasonable norm of efficient functioning. A number of shortcomings, such as shortages of para-medical staff, buildings, modern machinery and equipment in the working of public health system were noticed. As a result, it was considered appropriate to go slow
Draft Outline Fourth Five Year Plan Punjab State, Planning Department, Government of Punjab, p. 75
Ibid, p. 75
Draft Fifth Five Year Plan (1974-79), Planning Department, Government of Punjab, Chandigarh, p. 171.

with further expansion and concentrate on meeting existing deficiencies and improving operational efficiencies of medical institutions in the state. Thus, the Sixth Plan focused on improvement of infrastructure and provision of quality health services. Under public health, the Seventh Plan provided adequate outlays for purchasing essential machinery and equipment, replacement of obsolete equipment and for the completion of spill-over work, so as to optimally utilize the investment already made. During this plan, 330 Subsidiary Health Centres (SHCs), more commonly known as rural dispensaries, were upgraded to the level of Primary Health Centres (PHCs), raising the total to 460, i.e., one each for approximately 30,000 rural population. An additional community health officer, staff nurse, laboratory technician and two class IV employees were provided to PHCs. In tune with the earlier FYPs the Eighth Five Year Plan aimed at strengthening the infrastructure, provision of equipments and manpower development. A section on state- specific strategies laid down that for ‘States like Punjab and Haryana with above average level of infrastructure and below average performance in some health indices, specific efforts need be made to identify the factors responsible for the relatively poor performance and correct them’. Punjab’s, Ninth Plan highlighted the need to strengthen the existing health infrastructure. It was felt that despite rapid expansion, the majority of the institutions were without proper buildings. The main role of the Ninth Plan envisaged consolidation and strengthening of existing medical institutions (Allopathic, Ayurvedic and Homeopathic) in the state, by meeting the existing deficiencies in building, machinery and equipment, and provision of basic minimum services in the health sector. A proposal was also made to establish a four-bedded hospital each at 277 focal points in the state.
A Punjab Health System Corporation (PHSC) was set up in 1996-97 covering 150 hospitals at the level of Community Health Centres, sub-divisional hospitals and district hospitals. Among these, 8 6 medical institutions are situated in rural and 64 in urban areas. The corporation upgraded the facilities with the aid of a soft World Bank loan (70%), state government (20%) and other loans (10%). User charges in the 150 hospitals are levied at the same rate as in other hospitals in the state. Collections through user charges are retained entirely by the hospitals concerned, unlike the collections from hospitals not covered by the Corporation, which accrues to the state exchequer. Thus, the burden of servicing the World Bank loan (after a five year loan moratorium) will be borne by the state government, to which the charges levied on beneficiaries of the loan at present do not accrue. It is thought that five years hence, user charges on all improved facilities could be enhanced. At that stage, there could perhaps be an earmarking of a portion of the enhanced charge for servicing the loan.®
Most recently, the Tenth Five Year Plan of the Government of Punjab indicates that 70 per cent sub-centres, 67 per cent Subsidiary Health Centres (dispensaries), 62 per cent Primary Health Centres and 51 per cent Community Health Centres are without proper buildings. A total sum of Rupees 32,840 lakh would be needed to provide proper buildings for these institutions. Like the earlier plans, the major thrust of the Tenth Five Year Plan would be to consolidate and strengthen the existing medical institutions in the state in Allopathic, Ayurvedic and Homeopathic medicines, by removing the existing deficiencies in buildings, medicines, machinery and equipment and providing basic
Ninth Five Year Plan (1997-2002), Volume II, Thematic Issues and Sectoral Programmes, Government of India, Planning Commission, New Delhi, p. 148.
Indira Rajaraman, Hiranya Mukhopadhyay, H.K. Amar Nath State Fiscal Studies: Punjab, National Institute of Public Finance and Policy, New Delhi, 1999. p.26.

minimum services in the health sector. Besides extending the targets covered in the Ninth Plan, the Tenth Plan has emphasized mental health care, biomedical waste and diagnostic services in the state, setting up an institute of para-medical services, opening new dispensaries in urban slum areas, provision of toilets and attendants, accommodation in medical institutions, establishment of new PHCs/upgradation of existing SHCs to PHCs and completion of the provision for four-bedded hospitals at the remaining 197 focal points out of the 277 selected.®
From the above, it should be evident that during the formulation of all the Five Year Plans, the focus of the state government has largely remained on strengthening the health infrastructure in the form of buildings, machinery, equipment and manpower for primary health care. It did not realize the importance of having a proper health management information system, which would have helped in setting need-based priorities. Moreover, the state has not made many efforts to establish referral linkages, management of life-style diseases - diabetes, cancer and cardiovascular diseases, regulation of private health care services, and involving the voluntary sector in different health programmes.
RESOURCE ALLOCATION AND EXPENDITURE
The major industrial countries of the world spend a substantial portion of government expenditure on health. For example, United States, Australia, Switzerland and United Kingdom spend between 14 to 20 per cent of their total expenditure on health. The Asian countries, such as Bhutan, Maldives, Thailand, Sri Lanka and Malaysia, spend six to ten per cent, while India spends a considerably low amount, at around 1.5 per cent of its total expenditure on health.
Outlays and Expenditure during the Five-Year Plans
In Punjab, the percentage share of medical and public health sector in the total budget outlay has been fluctuating between 1.8 per cent and 4.5 per cent during the different Five Year Plans. Table 1 gives percentage shares in total outlay and total expenditure and proportion of total expenditure to total outlay for medical and public health (MPH), nutrition and social services^^ other than MPH and nutrition.
Table 1 indicates that during all these Five Year Plans, outlays on MPH have remained between 1.9 per cent and 4.5 per cent of the total outlay, nutrition between 0.04 to 0.5 per cent and other social services between 12.3 to 28.3 per cent. On the other hand, expenditure patterns indicate that in reality the percentage share of MPH had been between 1.5 and 2.5 up to the Eighth Plan and rose to 4.2 per cent during the Ninth
Tenth Five Year Plan and Annual Plan, Government of Punjab (2002-2003)
Health Information of India, 1997-98, Central Bureau of Health Intelligence, Directorate General of Health Services, Ministry of Health and Family Welfare, Government of India, New Delhi
Most recently these include general education, technical education, sports and youth services, art and culture, medical and public health, water supply and sanitation, housing (including police housing), urban development (including state capital project), information and publicity, welfare of SCs, STs and other BCs, labour and labour welfare, social security and welfare, other social services, and defence services welfare.

Plan; for nutrition it was insignificantly low between 0.04 to 0.3 of the total expenditure during all the Five Year Plans. However, the share of expenditure on other social services (excluding MPH and nutrition) rose considerably during all the Plans from 10.8 per cent in the Fourth Plan to 24.0 per cent in the Ninth Plan, which indicate clearly that health and nutrition has been accorded a lower priority among the social services.
Table 1Proportion‘d of Outlays and Expenditure on Medical and Public Health, Nutrition,
Social Services in Punjab (as percentage of total), 1969-2007______________________Five Year Plan (FYP)/ period
Percent share in total outlay
MPH Nutrition Social services (excluding MPH and nutrition)
Percent share in total Expenditure
MPH Nutrition Social services (excluding MPH and nutrition
Proportion of total expenditure to total outlayMPH Nutrition Social
services excluding MPH and nutrition
4'" FYP (1969-74)
2.55 0.09 13.14 1.47 0.04 10.76 0.83 0.66 1.19
5'" FYP (1974-78)
0.06 20.17 1.57 0.04 18.77 0.58 0.50 0.65
6<n pYp
(1980-85)2.50 0.04 16.31 2.75 0.08 13.42 1.06 1.81 0.79
7'" FYP (1985-90)
3.15 0.50 12.35 1.64 0.35 11.45 0.56 0.75 1.00
8‘" FYP (1992-97)
0.30 24.55 2.49 0.15 20.20 0.66 0.50 0.85
9<n PYP(1997-02)
4.45 0.30 28.26 4.24* 0.31* 24.o r 0.74* 0.79* 0.66*
10'" FYP (2002-07)
2.28 0.22 20.81 NA NA NA NA NA NA
Source:
Note:
Calculated on the basis of information provided in different issues of Statistical Abstracts of Punjab/Annual Plans, Five Year Plan and Annual Plan Documents Includes anticipated expenditure for the annual year 2001-2002.
Figure 1 indicates the percentage of total outlays and expenditure on MPH and nutrition. It is evident that the total expenditure was minimum during the Fourth Plan and the maximum during the Ninth Plan. Except for the Sixth Plan, the expenditure has always been less than the total outlay, indicating a poor performance of the plan. The outlays for nutrition during the different five-year plans indicate that it has always had a very small share of the total budget (0 .1 -0 .5%), and even that money was not spent fully.
Figure 1Percentage of Total Outlays and Total Expenditure on Medical and Public
Health, and Nutrition
4th FYP 5th FYP 6th FYP 7th FYP 8th FYP
Five Year Plans
9th FYP 10th FYP
- • — Percentage of MPH to total outlay
-•►— Nutrition as percentage of total outlay
-A— MPH as percentage of total expenditure
Nutrition as percentage of total expenditure

The proportions of total expenditure to total outlays indicate that MPH and nutrition were accorded less priority among the social services (Table 1 and Figure 2). If we examine the proportionate figures for total outlays and total expenditure, we find that except during for Sixth Plan and marginally during the Ninth Plan, when the proportion of actual expenditure to total outlay was more for MPH and nutrition, the expenditure on other social services has always been higher.
Figure 2Proportion of Total Expenditure to Total Outlay
Five Year Plans
*MPH ' Nutrition “ Sodal sen/ices excluding MPH and nutrition j
Source: Various volumes of Statistical Abstract, Punjab
Outlays and Expenditure during the Annual Plans (1980-2002)
Table 2 gives the percentage of annual share in total outlay and total expenditure on medical and public health and social services excluding MPH. These have increased over time for both the categories, i.e., MPH and social services excluding MPH. However, the increase in other social services expenditure is higher than that of MPH.

Proportions of Outlays and Expenditure on Medical and Public Health, Social Services ______ Excluding MPH in Punjab (as percentage of total), 1980-81 to 2001-2002______
AnnualPlan
Percent share in total outlay
MPH Socialservices(excludingMPH)
Percent share in total Expenditure
MPH Social services (excluding MPH and nutrition
Proportion of total expenditure to total outlayMPH Social
services excluding MPH and Nutrition
1980-81 2.80 16.62 2.73 16.84 0.97 1.011981-82 2.64 16.29 2.51 14.25 0.95 0 .8 81982-83 2.34 12.21 2.57 11.85 1 . 1 0 0.971983-84 3.07 12.04 2.63 11.39 0.83 0.921984-85 3.07 11.81 3.28 13.44 1.04 1 .1 11985-86 3.11 12.25 1.49 9.94 0.47 0.801986-87 2.58 12.72 1.61 9.66 0.73 0.891987-88 2.04 10.52 1.43 8.81 0.74 0 . 8 81988-89 2.95 11.50 1.76 11.55 0.61 1 . 0 21989-90 2 . 6 6 22.83 1.85 17.09 0.76 0.821990-91 2.19 19.02 2.52 13.23 1.26 0.761991-92 4.40 21.81 2.85 19.05 0 . 6 8 0.921992-93 4.00 25.30 3.07 20.54 0.59 0.631993-94 3.40 22.64 2 .2 1 24.54 0.59 0.991994-95 3.13 26.94 2.32 22.78 0.85 0.971995-96 2.65 21.19 2.09 18.30 0 . 8 6 0.941996-97 2.85 23.68 2.84 17.78 0.97 0.731997-98 4.73 25.69 1.58 19.00 0.32 0.711998-99 6.64 25.27 4.18 18.46 0.50 0.591999-2000 6.46 31.68 5.07 30.87 0.51 0.642000-01 7.93 27.22 5.40 22.31 0.56 0.672001-02 5.54 23.59 4.74^ 28.73^ 0 .8 6 ^ 1 .2 2 '*2002-03 3.33 20.41 NA NA NA NA
Source: Calculated from the information provided in various issues of Statistical Abstractsof Punjab/Annual Plans
Note: * - Includes anticipated expenditure for the annual year 2001-2002.
Figure 3 shows that the share of the nnedical and public health sector in the total outlay during the annual plans has increased over a period of time. For example, it was 2.8 per cent in 1980-81, and increased to 7.9 per cent during 2000-2001 and 5.5 per cent during 2001-2002. Even though the share of medical and public health increased in the total outlay, in the total expenditure it remained static between 1.5 per cent and 3 per cent during 1980-81 to 1997-98. The recent period, particularly after 1998-99, has witnessed a slight increase in the percentage of spending on medical and public health, ranging between four to five per cent of the total expenditure.

Figure 3Percentage of Total Outlays and Total Expenditure on
Medical and Public Health (1980-2001)
c0e<DCL
CO LO 05 X— CO CJ5 T—00 00 00 00 00 05 05 05 05 C35 oo (N •4- CO 00 o CVJ CO CO o
CNJ100 00 00 00 00 05 05 05 CT) 05a> 05 05 O i 05 05 05 O ) 05 o
T— ooCVJ
Reference year
•Outlay on MPH as percentage of total > ■ Expenditure on MPH as percentage of total
Source; Various volumes of Statistical Abstract, Punjab
Figure 4 shows the proportions of total expenditure to total outlay during the different annual plans on MPH and Social Services other than MPH. Except during the three annual plans, i.e. 1982-83, 1990-91 and 1996-97, the proportion of expenditure to total outlay on MPH has always been less than that on social services other than MPH. This clearly shows that MPH was given a lesser priority than other social services.
Figure 4Proportion of Total Expenditure to Total Outlay (MPH, Social Services excluding
Medical and Public Health)
■r— CM CO lO CD 00 C35 o T— eg 00 m CD N - 00 C3) O T— egoo CO 00 CO 00 00 op op op 05 ay cp o> C35 05 CJ) O ) CJ) C3) cp cp cpO CVJ CO i to CD N- CO CJ5 6 eg CO ■4- uS CO N- 00 cj) CD r—00 00 CO CO 00 00 00 00 CO 05 05 C35 05 C35 C35 05 O) C35 C35 O o05 <35 CJ) 05 05 CJ) c:) 05 C35 <y> C35 C35 05 05 CJ5 CD 05 C35 CJ) O oT— T— T— T— x— T— T— T— T— T— T— r— T— 1— T— T— T— T— ■»— T— CM OJ
Reference Year
•MPH •Social services excludina MPH

It is now well known that Punjab, like all other states, has made significant improvements in bringing down the crude death rate (CDR), infant mortality rate (IMR), and in bringing up the standard of living and expectancy of life at birth. Moreover, significant improvements in the control of various communicable and non-communicable diseases, such as diphtheria, poliomyelitis, tetanus (both neonatal and others), whooping cough, measles, leprosy, malaria, tuberculosis, goitre, blindness, etc., are well known.
In Punjab, health services (comprising of preventive, promotive and curative) are provided through the Department of Health and Family Welfare. Since primary health care is the first and the nearest contact between the individual and health care services, Punjab, like many other states of India, has made intensive provisions for primary health care services through a network of Sub-Centres (SC), Subsidiary Health Centres (SHCs), Primary Health Centres (PHCs) and Community Health Centres (CHCs). To support these primary health care services, provisions have been made for secondary- level health care facilities through sub-divisional and district hospitals. Further, tertiary- level health care facilities in the form of specialized hospitals and hospitals attached to the state medical colleges, have been provided for to support the secondary-level health care services. These institutions, besides extending support to secondary-level health care systems, are expected to carry out research and manpower development for the health services of the state.
Availability of Health Institutions
At the time of independence, there was only one medical college at Amritsar. A medical college was established during the First Plan at Patiala. In 1966, there were only 496 medical institutions and the average population served per institution improved only marginally from 24,729 in 1962 to 24,538 in 1966^^. In 1966, Amritsar, Kapurthala, Ludhiana and Patiala districts were in the lead in the availability of medical facilities, whereas Gurdaspur, Ferozepur, Hoshiarpur, Bhatinda and Sangrur districts were backward. The average radius served per institution showed that the medical facilities were comparatively inadequate in Ferozepur, Bhatinda and Sangrur districts.
Punjab has taken rapid strides in the promotion of health infrastructure services. Today, it has 2,852 Sub-Centres, 1,465 Subsidiary Health Centre (each having a medical officer and a pharmacist), 484 PHCs, 117 Community Health Centres, three medical and two dental colleges along with attached hospitals. In addition, 40 mobile dispensaries have been provided for intensive health care to serve the population living within 16 km of the international border. There are 230 Allopathic hospitals in the state. They range from 50-beds hospitals in smaller towns to larger hospitals attached to the five medical colleges, one each at Patiala, Faridkot and Amritsar and two at Ludhiana with facilities for dealing with complicated cases and acting as referral hospitals and teaching colleges. To promote the Indian system of medicines and homeopathy (ISM&H), there are 473 Ayurvedic dispensaries, 17 Ayurvedic Swasthya Kendras, five 10-bedded Ayurvedic hospitals (one each at Jalandhar, Bathinda, Ludhiana, Hoshiarpur and Amritsar), one government Ayurvedic college at Patiala, 105 Homeopathic dispensaries.
12 Draft Outline Fourth Five Year Plan Punjab State, Planning Department, Government of Punjab, p. 73

and 34 Unani (Arab/Persian medical system) dispensaries in tiie state. The state has one doctor for every 1,470 of the population, and one hospital bed for every 864 people -- ratios that are probably the best in the country.
Development of Health Infrastructure (1966-2001)
The following figures highlight some of the significant changes that have occurred in the development of the health infrastructure in the state since 1966.
Radius covered per Institution/Beds Available per 1000 Population
There has been remarkable improvement in the availability of health institutions, number of beds, doctors, midwives and nurses during 1966 to 2000. As revealed in Figure 5, the average radius covered was 5.8 km per health institutions in 1966, which has been reduced to 2.7 km in 2001. Similarly, in 1966, beds available per 1,000 of population were 0.7, which increased to 1.1 during the year 2001. The numbers of additional beds provided in hospitals, however, were compensated by the increase in population during these years.
Figure 5: Average Radius per institution and Beds Available per 1,000 Population (1966-2001)
CD05
COO) CJ3 O) N-Oi 00O) 0005 0005
0505
O)05
0505
05C35
Reference year
'Average radius per institution •Beds/ 1 0 0 0 population
Source: Various volumes of Statistical Abstract, Punjab
Manpower Availability
Figure 6 shows that there has been a tremendous increase in the availability of medical and para-medical manpower during 1966-2001. For instance, in 1966, the population covered per doctor was 2,758, per midwife 8,119 and per nurse 7,797, which declined to 1,470, 982 and 1,636 respectively during 2001. In fact, there has been a consistent increase in the availability of manpower (both medical and para-medical) in the state.

Reference Year
Population covered per doctor
-X— Population covered per nurse
• Population covered per midwife
Source: Various volumes of Statistical Abstract, Punjab
Growth of Health Institutions
The availability of health institutions in the state increased 4.5 times (6.5 times in rural areas and two times in urban areas) between 1966 and 2001 (Figure 7). In absolute terms, the total number of institutions rose from 496 in 1966 to 2,229 in 2001, the rural health institutions in the state rose from 275 to 1,777 during the same period, and the urban health institutions from 221 to 452 during 1966-2001. There was considerable increase in the number of rural health institutions during 1973-83, the period during which Sub-Centres and SHCs were set-up by the Government of Punjab on the recommended of the Government of India. There has hardly been any increase in the number of health institutions since 1985.
Figure 7Number of Health Institutions in Punjab (1966-2001)
Reference Year
■Total institutions Rural institutions Urban Institutions

As revealed by Figure 8 , the percentage share of rural health institutions was 55.4 per cent among total health institutions in 1966, increased to 64.9 per cent in 1973, 79.1 per cent in 1980, and 81.6 per cent by the year 1990. During the 1990s, there was some additional emphasis on urban infrastructure. As a result, the share of urban health institutions increased slightly from 18.4 per cent to 20.3 per cent.
Figure 8Percentage Share of Rural and Urban Health Institutions in
Punjab (1966-2001)1 0 0 %
75%
50%
25%
0 %CDCDCD
CJ)CD
CMh-(J)lON-(J)
00a> CO
CD0005
h-00
oa>CJ)
0005OiCDc:)CD
CDCDCD
Reference Year
B Rural
Source; Various volumes of Statistical Abstract, Punjab
Health Institutions by Ownership
The percentage share in the number of health institutions by ownership among the state government, local self-governments and voluntary organizations (Figure 9), decreased sharply for the last two categories. In fact, the local self-government has completely withdrawn from the health sector. For example, the respective shares of the three sectors were 71.6 per cent, 13.3 per cent and 15.1 per cent in 1966, which changed to 96.6 per cent, 1.1 per cent, and 2.3 per cent respectively in 2001. Thus, during the last37 years, local self-government and voluntary organizations have withdrawn from the health sector.

Percentage SFigure 9
1966 1970 1974 1978 1982 1986 1990 1994 1998
Reference Year
State government □ Local self Government ^V o lun tary Organisations
Source; Various issues of Statistical Abstract, Punjab
Growth of Rural Health Institutions
If we look at the growth of rural health institutions, it is clear that during all these years, there has been an emphasis on the opening up of newer dispensaries in the state (Figure 10). The growth of rural hospitals took place during 1978-80. Their number increased form 23 in 1978 to 79 in 1979 and to 111 in 1980. Their number remained more or less stagnant up to 1989, and then started decreasing, as many of them were accorded the status of Community Health Centres (CHCs), according to the revised guidelines of the Government of India. Likewise, earlier there was one PHC per block in Punjab, but in response to the revised criterion of one PHC per 30,000 population, many rural dispensaries have been given the status of PHCs since 1987. As a result, while the number of PHCs has increased, that of SHCs has decreased. Most of these PHCs continue to be known as Mini PHCs in Punjab, with inadequate infrastructure facilities and without drawing and disbursing powers (DDO) powers and operated by a single medical officer.
Figure 10Rural Health institutions in Punjab (1966-2001)
1800 c 1600 J § 1400 - 1 1200I 1 0 0 0 4z 800
600400
CD
^ 2 0 00
- 2 0 0 Jg-05
-s>-CD05-tf3-h-05
-G O -r>-05
CO05
0005
0505
0505
0505
0505
Reference Year
-K— Rural hospitals PHCs •SHCs CHCs, CHCs/PHCs

Growth of Urban Health Institutions
Urban health institutions have not kept pace with the rising urbanization in the state. As regards the growth of urban health institutions, the number of urban hospitals has increased only slightly from 106 in 1970 to 134 in 2001. Urban PHCs too have remained more or less static during the recent years. The only significant increase has been in the number of urban dispensaries, which increased form 98 in 1966 to 248 in 2001, an increase of 2.5 times (Figure 11).
Figure 11Urban Health Institutions in Punjab (1966-2001)
300
X i X i X tX i X 'S if t^ iSiSiSiS i i r t r ^ ix-ixix iXTXTXix i^CD 00 CD CD o> o>
Oo>
eg1a> h«-
05
CDh-O)00r»-05
o00O)
CVJ0005
00CJ5
CD0005
0000Oi
o0505
CNJ0505
0505
CD0505
000505
OOOCNJReference Year
-Urban hospitals PHCs — ♦ — Urban dispensaries —>^CHCs, CHCs/PHCs
Source: Various volumes of Statistical Abstract, Punjab
Growth of Health Institutions under Indian System of Medicines and Homeopathy (ISM&H)
During 1966-2001, minor importance has been given to the development of health institutions under the alternative system of medicines, popularly known as Indian System of Medicines and Homeopathy (ISM&H). Figure 12 shows that the number of ayurvedic institutions increased from 157 in 1966 to 495 in 2001. The major growth of ayurvedic health institutions took place during 1970-1984. There has been no emphasis on the Unani system of medicines. Slightly more emphasis was given to homeopathy during 1986-1992. The data clearly reflect that the efforts to develop ISM&H have not been as focused as it should have been.

Figure 12Number of Institutions under Indian System of Medicines and Homeopathy (iSIVI&H) (1966-
2001)
1 1 I t 1 1 1C D O O O C N ' ^ C D C 3 0 0 C \ I M - C O C X 5 0 C M T t C O O OC D C O t ^ r ^ t ^ r ^ t ^ O O O O O O O O C 0 0 5 C T > 0 5 0 > 0 )0 > 0 ) a 5 0 5 0 ) 0 ) 0 ) O ^ C J ) a ^ 0 5 C 7 ) Q ) 0 ) 0 5 0 > 0 )
ooocsf
-X— Ayurvedic InstitutionsReference Year
Unani Institutions “♦ — Homeopathic institutions
Source: Various volumes of Statistical Abstract, Punjab
Private Health Institutions in the State
The private health sector plays a crucial role in the health delivery system. With a wide network of services, it caters to the needs of both rural and urban populations and has expanded considerably to nrieet increasing demands. The total health expenditure in India is estimated to be about six per cent of GDP, of which private health care expenditure is 75 per cent. About, one-third of this expenditure is on secondary and tertiary in-patient care, the rest meet the curative needs at the primary level. Insurance coverage mechanisms are negligible and most of this expenditure is out of pocket. For each one per cent increase in per capita income, private health care expenditure has increased by 1.47 per cent. About 57 per cent of hospitals and 32 per cent of hospital beds are in the private sector. At present, about 80 per cent of 3,90,000 allopathic doctors registered with medical councils in India are working in the private sector. Moreover, there are over 6,50,000 providers of other systems of medicines practicing in India and most of them come under the private sector. Utilization studies show that one third of the in-patients and three-quarters of out-patients utilize private health care f a c i l i t i e s . P u n j a b has an abundance of private health care institutions and practitioners, but despite playing such an important role, no information as to the actual number of private hospitals and clinics is available with the Government of Punjab, as there is no provision for it. Registration is not required for starting a hospital, a nursing home, or private practice.
Ramesh Bhat, ‘Characteristics of Private Medical Practice in India: A Provider Perspective’, Health Policy and Planning, Volume 14 (1), Oxford University Press, 1999, p. 26-37.

Maternal and Child Health Referral Services
Efficient maternal and childcare services include immediate referral services to the firs+ referral units, which can reduce infant mortality rate and maternal mortality rats considerably. The mid-term appraisal of the Ninth Five Year Plan (1997-2002) also iterates the need to obtain and analyze information on health care infrastructure and manpower. 15
A perusal of Table 3 reveals that there is need for more specialized childcare hospitals in Punjab. The Ninth Plan suggested that in all government hospitals in urban areas inpatient facility for maternal care services should constitute four out of ten beds for maternity care.
Table 3Institutions Provid ng Specialized Medical Services
Specialized services/Type of management
Total number of institutions
Number of beds
Hospital Ward Hospital WardPediatrics 1 115 1 0 0 1047State public 0 108 1 0 0 817Voluntary organizations 0 6 0 170State special 0 1 0 6
Services available for deliveries, complications of pregnancy, child birth and puereperium
14 6 8 742 2063
State public 5 57 72 1632Voluntary organizations 6 5 250 345State special 0 6 0 8 6
Municipal 3 0 420 0
Source; Directory o f Medical Institutions in Punjab State as on 1-4-1995, Series No. 8 , Publication No. 26, Directorate of Health and Family Welfare, Punjab, Chandigarh.
MORBIDITY PATTERNS IN PUNJAB
Health experts find serious errors in the data recording information related to morbidity. Despite this limitation, this section attempts to highlight some of the morbidity patterns in Punjab as revealed by surveys undertaken during different rounds of the National Sample Survey Organization (NSSO), and the Health Care surveys undertaken by the National Council of Applied Economic Research (NCAER).
Mid-Term Appraisal of Ninth Five Year Plan (1997-2002), Planning Commission, Government of India, New Delhi, October 2000, p.247
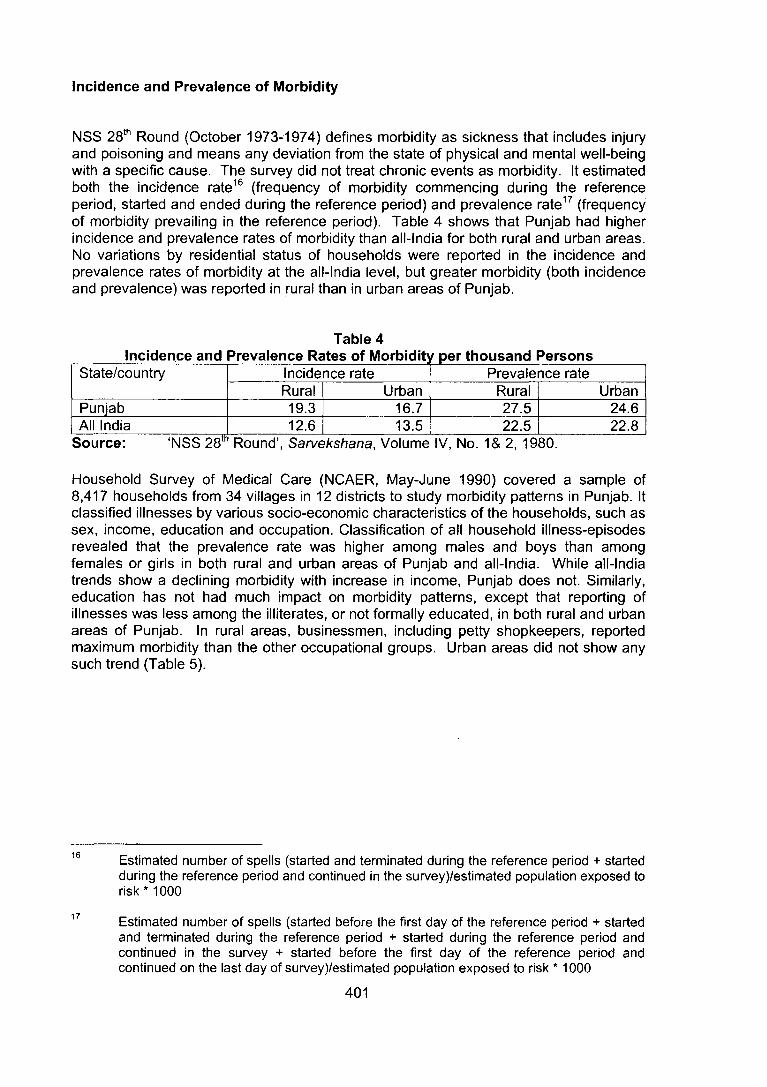
NSS 28* Round (October 1973-1974) defines morbidity as sickness that includes injury and poisoning and means any deviation from the state of physical and mental well-being with a specific cause. The survey did not treat chronic events as morbidity. It estimated both the incidence rate ® (frequency of morbidity commencing during the reference period, started and ended during the reference period) and prevalence rate^^ (frequency of morbidity prevailing in the reference period). Table 4 shows that Punjab had higher incidence and prevalence rates of morbidity than all-India for both rural and urban areas. No variations by residential status of households were reported in the incidence and prevalence rates of morbidity at the all-India level, but greater morbidity (both incidence and prevalence) was reported in rural than in urban areas of Punjab.
Table 4Incidence and Prevalence Rates of Morbidity/ per thousand Persons
State/country Incidence rate Prevalence rateRural Urban Rural Urban
Punjab 19.3 16.7 27.5 24.6All India 1 2 . 6 13.5 22.5 2 2 . 8
Source: ‘NSS Round’, Sarvekshana, Volume IV, No. 1& 2, 1980
Household Survey of Medical Care (NCAER, May-June 1990) covered a sample of 8,417 households from 34 villages in 12 districts to study morbidity patterns in Punjab. It classified illnesses by various socio-economic characteristics of the households, such as sex, income, education and occupation. Classification of all household illness-episodes revealed that the prevalence rate was higher among males and boys than among females or girls in both rural and urban areas of Punjab and all-India. While all-India trends show a declining morbidity with increase in income, Punjab does not. Similarly, education has not had much impact on morbidity patterns, except that reporting of illnesses was less among the illiterates, or not formally educated, in both rural and urban areas of Punjab. In rural areas, businessmen, including petty shopkeepers, reported maximum morbidity than the other occupational groups. Urban areas did not show any such trend (Table 5).
16 Estimated number of spells (started and terminated during the reference period + started during the reference period and continued in the survey)/estimated population exposed to risk* 1 0 0 0
Estimated number of spells (started before the first day of the reference period + started and terminated during the reference period + started during the reference period and continued in the survey + started before the first day of the reference period and continued on the last day of survey)/estimated population exposed to risk * 1 0 0 0

Prevalence Rate of Illnesses by Socio-economic Characteristics (per 1000 Persons)Socio-economic characteristics Rural areas
Punjab IndiaUrban areas
Punjab IndiaSex
Annual income•Low income (< 12,000) 25.0 87.4 67.1 77.2Middle income (12,500-56,000) 48.8 65.7 43.4 63.1High income (> 56,000) 18.0 47.2 45.7 57.6EducationNo formal education 27.8 74.9 25.9 69.7Primary 25.2 84.8 50.1 65.4Secondary 56.3 79.1 60.5 70.0Graduate and others 52.3 78.6 53.2 6 6 . 6Occupation of the head of householcCultivators 41.6 71.2 32.4 67.2Wage earners 28.0 94.0 79.9 66.3Salary earners 50.8 79.0 51.3 6 8 . 2Professionals 40.3 73.7 55.5 69.3Artisans 0 .0 84.3 45.2Petty shopkeepers 79.4 91.0 47.3 67.9Businessmen 139.3 97.4 18.2 60.1Others 0 .0 73.1 6.3 78.0Total 37.7 79.1 49.7 67.7
Source: NCAER, Household Survey of Medical Care, May-June 1990
NCAER (1993) survey of health care utilization and expenditure also measured the prevalence rate of illnesses. It pointed out that the prevalence rate of illnesses per 1,000 persons was much higher in Punjab than the national average (132.0 in rural areas in Punjab as compared to 106.7 in India, and 175.4 in urban areas of Punjab as compared to 103 in India). The survey also indicated some sex-wise rural-urban differentials. For instance, the prevalence rate of illnesses was much higher among rural males in Punjab than in India (155.8 per 1,000 as against 105.5 per 1,000). It was also much higher for both males and females in urban areas of Punjab than the national average. The percentage of illness episodes treated was also much higher in Punjab than in India (Table 6 ).
Table 6
Sex Rural areas Urban areasPun ab India Puniab India
Prevalence of illness
Percenttreated
Prevalence of illness
Percenttreated
Prevalence of illness
Percenttreated
Prevalence of illness
Percenttreated
Males 155.8 1 0 0 . 0 105.5 8 8 .1 1 2 0 . 6 95.0 98.2 92.4Females 106.4 98.2 108.1 88.4 175.4 94.2 108.4 90.9Total 132.0 99.3 106.7 8 8 .2 175.4 92.3 103.0 91.7
Source: NCAER, Household Survey of Health Care Utilization and Expenditure, March1995.

NSS 28‘ round survey revealed that more people suffered from chronic diseases with increase in age in both the rural and urban areas of Punjab. Such chronic morbidity was more prevalent among males in rural areas and among females in urban areas. Asthma, piles, rheumatism, bronchitis, tuberculosis, epilepsy, kidney stone or kidney trouble and high blood pressure were the common chronic diseases suffered by the people of Punjab in both rural and urban areas (Table 7).
Table 7Number of Persons Suffering from Chronic Diseases in Punjab by Age, Sex and
Characteristics Punjab (Rural) Punjab (Urban)M F P M F P
Age-group0-14 247 269 257 473 334 40515-24 759 900 827 416 607 50225-44 2459 3503 2970 1724 2342 199845-59 6689 5772 6238 4097 7042 551360+ above 9717 6708 8458 8036 7326 7718Not recorded - - - - - -
All ages 2348 2197 2277 1621 1993 1794By type of chronic diseaseTuberculosis 1 0 2 130 115 75 107 90Leprosy - - - 56 65 60Syphilis 45 2 2 34 19 2 1 2 0
Cancer 13 - 7 - 43 2 0
Thyroid trouble or Goiter
13 7 1 0 19 62 40
Diabetes 13 50 30 37 2 2 30Mental illness 51 50 51 19 43 30Epilepsy 70 58 65 37 2 1 30Rheumatic fever 26 65 44 - - -
High blood pressure 45 123 81 130 215 169Bronchitis 1 0 2 8 6 95 130 8 6 1 1 0
Asthma 774 468 630 391 407 398Peptic ulcer 26 72 48 19 43 30Kidney stone or Kidney trouble
96 72 85 56 - 30
Arthritis 6 14 1 0 - 2 2 1 0
Rheumatism 154 195 173 56 257 149Stroke 26 14 2 0 - - -
Piles 204 8 6 149 37 107 70Others 582 685 630 540 472 508Not recorded - - - - - -
All types of ailments 2348 2197 2277 1621 1993 1794No. of sample ailments 367 305 672 87 93 180
Source: ‘NSS 28* Round Sarvekshana, Volume IV, N0 . 1 & 2 , 1 980.

Table 8 shows the prevalence rates of illnesses classified under serious communicable diseases^®, acute illness^® and chronic diseases^® in rural and urban areas in Punjab and India. The prevalence rate of communicable diseases was lower in rural areas and higher in urban areas of Punjab as compared to India. (Influx of migrants from backward states may be one possible explanation for higher prevalence of communicable diseases in urban areas). The prevalence rate of acute illness was higher in both the rural and urban areas of Punjab than in India. (Greater awareness and prompt reporting may be one explanation for this). There were fewer patients with chronic diseases in rural areas and additional patients with chronic diseases in urban areas of Punjab than in India. (Life-style and dietary patterns in urban areas might have contributed to this). The average di/ration of illness for communicable and acute illnesses in rural Punjab for both males and females was higher than in rural India. The duration in urban areas was somewhat same for Punjab and India. This seems to indicate that the rural people of Punjab are not getting proper treatment for their illnesses as compared to their counterparts in other rural areas of the country and the urban areas of the state.
Table 8
Type and duration of illness Rural 1 UrbanPunjab I India 1 Punjab 1 India
Type of illnessSerious communicable diseases 12.9 15.6 18.1 14.0Acute illnesses 111.1 77.9 105.6 70.6Chronic diseases 7.9 13.2 22.2 18.4Total 132.0 106.7 145.8 103.0Average duration o f illness (in days) (for communicable and acute illness only)Male 14.0 11.4 9.2 10.4Female 12.2 10.1 9.5 9.8Total 13.2 10.8 9.3 10.1
Source: NCAER, Household Sun/ey o f Health Care Utilization and Expenditure, March 1995.
The 52"' round of NSS on morbidity and treatment of ailments also showed that the prevalence of morbidity was higher in Punjab than in India. For instance, prevalence of acute illness was 56 per 1,000 in rural areas of Punjab against 42 per 1,000 in rural areas of India; figures for chronic illness were 20 per 1,000 as against 13 per 1,000 respectively. Similarly, prevalence of acute and chronic illnesses was higher in urban areas of Punjab than in India. The number of persons reporting ailments (acute or chronic) usually increases with the increase in age in Punjab as well as in India. Chronic illnesses are generally prevalent among persons who are 40 years or older. Classification of data by sex and residential status did not show much difference in the prevalence rate of acute or chronic diseases (Table 9).
18
19
Communicable diseases include typhoid, malaria, cholera/acute gastro-enteritis, jaundice, chicken pox, measles, mumps and tuberculosis.
Acute illnesses include diarrhoreal diseases, respiratory infections, non-specific fever, skin-diseases, eye/ear problem, headaches/bodyaches/backaches, stomach problems- indigestion, gas acidity and constipation.
Chronic diseases include aches and pains (arthritis and reumatism), cardio-vascular diseases (heart-ailments/hypertension), diabetes, kidney problems, breathing problems, asthma, cancer, weakness/dizziness, anaemia, mental and psychological disorders, and others.

Acute and Chronic Ailments Classified by Age and Sex (per 1000 Persons)Age-Group Punjab All-India Punjab All-India
Acute Chronic Any Acute Chronic Any Acute Chronic Any Acute Chronic AnyMale
Female0-14 46 50 43 45 57 64 47 4915-39 55 16 69 36 45 47 25 72 37 4540-59 73 53 126 48 27 75 46 75 120 42 31 7360&above
74 107 181 90 73 161 96 153 242 73 94 166
All 57 25 81 44 14 57 52 34 86 43 15 58All0-14 59 64 45 48 71 76 49 5215-39 51 11 61 32 40 57 17 73 32 4040-59 56 39 95 45 24 69 45 52 96 39 27 6660+ 73 102 176 93 80 170 83 137 217 69 89 157All 56 20 76 42 13 55 60 25 85 41 14 54No. of ailing personsEstimated(00)
7716 2755 10406
269773
84301 352625
3778 1572 5331 82712 28141 110527
Sample 748 294 103 16511 5321 21732 494 270 763 9855 3862 13675
Source: ‘NSS, 52 Round (July 1995-June 1996)” , Morbidity and Treatment of Ailments, NSSO, Department of Statistics, Government of India, November 1998.
Morbidity, Level of Living and Social Groups
Table 10 shows the relationship between reporting of morbidity and level of living as measured by monthly per capita consumption expenditure (MPCE). A positive association between MPCE and PAP (proportion of ailing persons) is observed in both rural and urban areas of India, PAP being higher in rural than in urban areas. In Punjab, no such relationship was observed. Reporting of ailments was generally higher for general castes than Scheduled Castes.
Table 10Number of Persons Reporting Ailments During a Period of 15 Days per 1,000 Persons by Fractile Groups of
Mpceandsocialgroups
Rural areas Urban areasPunjab All-India Punjab All-India
Male Female
Persons
Male Female
Persons
Male Female
Persons
Male Female
Persons
Mpce fractile groups0-10 87 58 73 44 40 42 26 33 29 42 40 4110-20 93 45 62 40 39 40 44 41 42 42 47 4520-40 83 53 68 45 49 47 82 85 84 47 55 5140-60 58 48 54 50 55 52 55 58 56 50 55 5260-80 67 80 73 56 62 59 82 92 87 51 65 5780-90 65 78 71 66 72 69 70 100 83 58 76 6690-100 76 93 84 83 91 86 158 136 149 71 71 71All 71 81 76 54 57 55 84 86 85 51 58 54Social groupsST - 129 72 42 43 42 266 146 227 42 47 45sc 71 71 71 52 55 54 81 51 67 49 57 53Others 71 88 79 56 60 58 81 98 89 52 59 55No. of ailing personsEstima- Ted (00)
5139 5267 10406 175224 177401
352625
2858 2473 5331 54264 56263 110527
Sample 515 523 1038 10832 10900 21732 383 380 763 6767 6908 13675
of Statistics, Government of India, November 1998,

Table 11 shows the number of persons who reportedly received medical treatment for ailments. It is evident that medical treatment of ailments was much higher in Punjab in both rural and urban areas than in India among all the age groups. While figures for treated episodes was higher for males, the picture in Punjab was much better than in India in terms of different age groups and sex. In most of the categories, a direct relationship exists between the MPCE and number of episodes receiving treatment. No such trend is noticeable in Punjab. Among the social groups, the Scheduled Caste population was slightly less active in availing treatment for ailments in rural areas, and vice versa for general population in urban areas.
Table 11Number o f Persons Classified by Age, Sex, MPCE and Social Groups Reportedly Receiving Some Medical Treatment fo r A ilm ents
_______________________ (Per 1000 A iling Persons) (type o f ailment: any)Socioeconomiccharacteristies
Rural areasPunjab All-India
Urban areasPunjab All-India
Age-groups0-14 996 980 990 850 832 842 942 938 940 934 910 90315-39 998 995 996 861 839 849 964 977 970 903 919 92740-59 999 999 999 831 813 822 1000 975 986 897 905 90460+ 976 943 959 788 748 769 990 964 976 891 915 872All 994 986 990 838 816 827 965 965 965 910 855 907Mpce fractile group0-10 1000 1000 1000 724 759 741 1000 1000 1000 820 807 81310-20 1000 1000 1000 790 755 773 1000 634 820 878 863 87020-40 916 1000 949 825 783 803 993 934 964 909 895 90240-60 1000 931 972 830 794 812 959 982 970 920 905 91260-80 998 993 995 838 823 830 944 978 960 928 918 92380-90 997 989 993 868 852 860 994 1000 997 962 946 95490-100 997 986 992 915 894 905 963 956 961 898 933 914All 994 986 990 838 816 827 965 965 965 910 903 907Social groupsST 1000 1000 801 766 784 1000 940 988 878 925 902SC 988 985 987 837 827 832 978 954 969 939 895 916Others 998 987 992 842 818 830 958 968 963 907 904 905No. o f ailinc personsEstimated( 00)
5109 5194 10303 146793 144753 291546
2759 2387 5147 49405 50820
100525
Sample 506 510 1016 8960 8807 17767 371 371 743 6138 6211 12349Source: NSS, 52 Round (July 1995-June 1996)’, Morbidity and treatment of ailments, NSSO, Department of Statistics, Government of
India, November 1998.Note: M- Males, F-Females, P-Persons
Reasons for Untreated Episodes of Illness
Table 12 shows the percentage distribution of untreated episodes of sickness classified by reasons for non-treatment. A large majority of households (83% in rural areas and 93% in urban areas) reported that treatment was not sought since the ailments were not considered serious. Financial reasons were cited by very few (6 % in rural areas and 2% in urban areas in Punjab as compared to 15% and 10% respectively at the all-India level).
Table 12
Reasons for no treatment Rurai UrbanPunjab India Punjab India
No medical facility 1.29 2.86 - 0.13Lack of faith in system of medicines 3.09 1.93 1.96 1.81Long waiting - 0.33 - 1.05Financial reasons 6.24 15.27 2.09 9.57Ailments not considered serious 82.66 74.61 93.18 81.13Other reasons 6.72 5.00 2.77 6.31Ail 100.0 100.0 100.0 100.0

Health-seeking behaviour or utilization of health care services is influenced largely by the access to health facilities, individual and family beliefs and attitudes related to illness and the system of medicines, cost of treatment and individual capacity to pay. The following section is an attempt to analyze the health-seeking behaviour in the context of preventive and curative health care services for non-hospitalized (outdoor) and hospitalized (indoor) episodes of illnesses and the related behavioral aspects grouped by socio-economic factors, type of treatment preferred, choice of public/private or voluntary sector, and the cost of treatment.
Preventive and Curative Services by Source of Treatment
Table 13 sums up the role of public and private sector for the provision of contraceptive, preventive and curative services. It clearly shows that public sector essentially plays a crucial role in providing preventive services for contraception and immunization, but the private sector.dominates in provision of curative services or institutional deliveries. The table clearly shows that the private sector caters more to the urban population than to the rural population. It shows that 8 8 per cent of all children (93% in rural areas) received vaccinations from the public sector. The survey revealed that the share of the private health sector in immunization has a direct relationship with urbanization, mother’s education (at least high school), caste (higher share in general caste), and households with a high standard of living. As for curative services, the table shows that a large majority of households (8 6 %) in Punjab normally visits the private medical sector. Its use is much higher in Punjab (8 6 %) than in the country as a whole (69%). Overall, three types of health providers are generally used as a source of treatment by almost all the households. Forty-seven per cent households preferred treatment from private doctors,38 per cent from private hospitals and clinics, and nine per cent from government/municipality hospitals. Moreover, the pattern of service utilization is similar for both rural and urban areas. The type of health care services used is influenced only slightly by the standard of living of the households concerned. The private sector is the dominant health care service provider for households of all standards of living, with 81 per cent of even households with a low standard of living usually relying on this sector for health care when a household member falls ill. Use of government dispensaries as a source of care declines sharply form nine per cent among households with a low standard of living to only two per cent among households with a high standard of living. Likewise, more people visit private nursing homes than government hospitals for institutional deliveries (29.6% as against 7.6% of the total deliveries).
Table 13Share of Public and Private Sector in Contraceptive, Preventive, and Curative Services
Type of service Share of public sector Share of private sectorRural Urban Total Rural Urban Total
All contraception 75.2 40.3 64.3 18.5 45.4 26.9Male sterilization 100.0 100.0 100.0 0.0 0.0 0.0Female sterilization 98.0 88.2 96.1 1.8 11.2 3.6lUD 53.0 35.5 45.3 47.0 64.5 54.7Oral Pills 28.1 16.7 24.5 62.6 69.8 64.9Condoms 14.6 5.9 10.0 53.4 63.0 58.5Childhood vaccination 92.7 72.3 87.5 6.7 27.7 12.0Percent share in institutional delivery 7.1 9.3 7.6 24.5 46.8 29.6Usual source of Health care 14.2 13.0 13.8 85.5 86.6 85.9
Source: National Family Health Survey-2, Punjab, India 1998-99Note; The totals will not add up to 100 due to the presence of other categories

Type of Treatment Preferred for Hon-Hospitalized illnesses
The household survey of health care utilization and expenditure (NCAER, 1993) points out that for non-hospitalized illness episodes, Allopathic treatment is the most preferred form of treatment in both rural and urban areas of Punjab. Table 14 highlights the fact that the allopathic system of medicine is preferred more in Punjab than in the country as a whole. For instance, Ayurvedic/Siddha, Unani methods are preferred by none in rural Punjab, but at the all-India level nearly four per cent households prefer such methods. The reason for not preferring the Indian system of medicine and Homeopathy (ISM&H) is probably the lack of importance attributed to it or its inadequate health infrastructure.
Table 14________ Non-hospitalized Illness Episodes by Type of Treatment (In per cent)__________
System of medicines Rural areasPunjab India
Urban areasPunjab India
Allopathic 97.3 90.9 94.9 93.2Homeopathic 1.4 2.0 0.7 2.9Ayurveda/Siddha 0.0 3.8 2.3 2.2Unani 0.0 0.2 0.0 0.1
Any combination 1.4 2 .0 2 . 1.2Rituals 0 .0 0 .6 0 .0 0.3Others 0 .0 0.5 0 .0 0 .2
Total 100.0 100.0 100.0 100.0Source; NCAER, Household Sun/ey of Health Care Utilization and Expenditure, March
1995Non-hospitalized Illnesses, Source of Treatment and Payment Mechanism
Table 15 shows the distribution of non-hospitalized illness episodes by type of treatment. This is slightly more favourable to the private sector in rural areas both in Punjab and at the all-India level. However, if we look at the health-seeking behaviour of the urban population, the share of public sector in Punjab is much less (18.2% males and 28.8% females) than in India (34.7% males and 33.2% females). People in Punjab believe less in obtaining treatment from a medical shop or store in the adjoining area, which is the usual practice in other parts of India. Moreover, households in Punjab do not believe in going to faith healers or religious persons for treatment.
Table 15Non-hospita Ized Illness Episodes Classified by 1Fype of Treatment (in Percent)
Type of facility Rural areas Urban areasPunjab India Punjab India
Male Female Male Female Male Female Male FemalePublic facility 42.2 42.6 40.2 43.3 18.2 28.8 34.7 33.2Private facility 57.8 57.4 54.5 5C.8 78.5 69.8 58.9 60.9Medical shop 0 .0 0 .0 2 .6 3.7 1.5 1.4 5.5 5.0Faith/healer/ religious person
0 .0 0 .0 0.7 0.3 0 .0 0 .0 0.3 0 .2
Home remedies 0 .0 0 .0 2 .0 2 .0 1.7 0 .0 0.7 0 .8
Total 1 0 0 . 0 1 0 0 . 0 1 0 0 . 0 1 0 0 . 0 1 0 0 . 0 1 0 0 . 0 1 0 0 . 0 1 0 0 . 0
Source: NCAER, Household Survey of Health Care Utilization and Expenditure, March1995.
The 52" round (1995-96) of NSSO collected data on the curative aspects of health care system in India and the MCH programme. For Punjab, these are based on a sample survey of 4,216 (2,227 rural and 1,989 urban) households. When compared to the 42"^ round data (1986-87), the share of the government sector has fallen drastically during

the two rounds from 12% to 7% and 11% to 6 % in rural and urban areas respectively. Though trends at the all-India level too indicate a fall in the share of the government sector, the gap is not as wide as in Punjab (Table 16). The trend is similar at the all- India level, with the exception of rural and urban areas of Andhra Pradesh, urban Bihar and urban Maharashtra. The share of the government sector for management of nonhospitalized illness episodes at all-India level was 2.7 times higher in rural areas and 3.3 times higher in urban areas compared to Punjab according to the recent round. These findings are comparable to NFHS data.
Table 16
State/Country Rural Urban52"" Round 42"" Round 52"" Round 42"" Round
Punjab 7 1 2 6 11
India 19 21 2 0 24Source; ‘NSS, 52 Round (July 1995-June 1996)’, Morbidity and Treatment of Ailments,
NSSO, Department of Statistics, Government of India, November 1998.
NSS 42" round data also collected information on the payment mechanism. Table 17 shows that less people obtained no-payment treatment or free treatment in both the rural and urban areas of Punjab than in India. Payment was made to government or private institutions by 6 6 per cent of the households in rural areas in Punjab compared to 46 per cent in India, and by 65 per cent of the households in urban Punjab as compared to 44 per cent in India. From the above data, it can be easily inferred that in Punjab people are willing to pay for the treatment received. The average duration of treatment per episode by source of treatment indicates that the treatment span was a little longer in the rest of India than in Punjab and slightly less in urban areas and in the private sector than in the government sector. (Table 20)
Table 17Distribution of Treatments (not as an in-patient) Classified by Type of Institution and
Payment category/institution Rural UrbanPunjab 1 All-India Punjab 1 All-India
Payment categoryNo payment 29.19 49.14 20.79 42.26Under employer’s medical welfare scheme
4.47 5.21 13.99 13.74
Percent reportedly made payment to institutionsGovemment institutions 24.94 12.42 24.66 12.65Private institutions 41.40 33.23 40.56 31.35All (Government and Private) 66.34 45.65 65.22 44.00Total 100.0 100.0 100.0 100.0
Source: ‘NSS, 42 Round’, f^orbidity and Utilization o f Medical Services, July 1986-June 1987
Table 18 illustrates the distribution of non-hospitalized cases by the type of treatment and type of medical services (medicines, X-ray, ECG, other diagnostic test, surgery and other treatment). It clearly shows that the distribution was more in favour of the private than the public sector. Less people availed free services from government or other sources in Punjab than in India in ail the categories stated above.
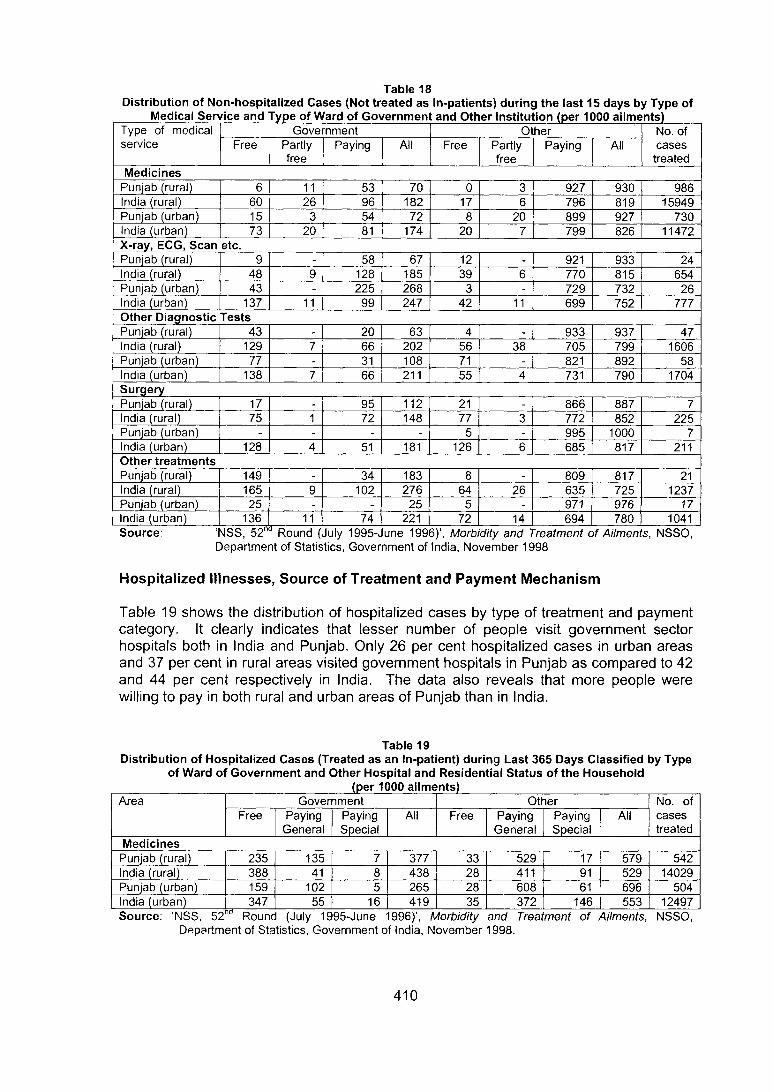
Distribution of Non-hospitallzed Cases (Not treated as In-patients) during the last 15 days by Type of Medical Service and Type of Ward of Government and Other Institution (per 1000 ailments)____
Type of medical service Free Partly
freePaying All Free Partly
freePaying All
No. of cases
treatedMedicines
India (urban) 73 20 81 174 20 799 826 11472X-ray, ECG, Scan etc.Punjab (rural) 58 67 12 921 933 24India (rural) 48 128 185 39 770 815 654Punjab (urban) 43 225 268 729 732 26India (urban) 137 11 99 247 42 11 699 752 777Other Diagnostic TestsPunjab (rural) 43 20 63 933 937 47India (rural) 129 66 202 56 38 705 799 1606Punjab (urban) 77 31 108 71 821 892 58India (urban) 138 66 211 55 731 790 1704SurgeryPunjab (rural) 17 95 112 21 866 887India (rural) 75 72 148 77 772 852 225Punjab (urban) 995 1000India (urban) 128 51 181 126 685 817 211Other treatmentsPunjab (rural) 149 34 183 809 817 21India (rural) 165 102 276 64 26 635 725 1237Punjab (urban) 25 25 971 976 17India (urban) 136 11 74 221 72 14 694 780 1041Source: ‘NSS, 52 Round (July
Department of Statistics,1995-June 1996)’, Morbidity and Treatment o f Ailments, NSSO, Government of India, November 1998
Hospitalized Illnesses, Source of Treatment and Payment Mechanism
Table 19 shows the distribution of hospitalized cases by type of treatment and payment category. It clearly indicates that lesser number of people visit government sector hospitals both in India and Punjab. Only 26 per cent hospitalized cases in urban areas and 37 per cent in rural areas visited government hospitals in Punjab as compared to 42 and 44 per cent respectively in India. The data also reveals that more people were willing to pay in both rural and urban areas of Punjab than in India.
Table 19Distribution of Hospitalized Cases (Treated as an In-patient) during Last 365 Days Classified by Type
of Ward of Government and Other Hospital and Residential Status of the Household
Area Government Other No. ofcasestreated
Free PayingGeneral
PayingSpecial
All Free PayingGeneral
Paying I All Special ,
MedicinesPunjab (rural) 235 135 7 377 33 529 17 579 542India (rural) 388 41 8 438 28 411 91 529 14029Punjab (urban) 159 102 5 265 28 608 61 696 504India (urban) 347 55 16 419 35 372 146 553 12497
Department of Statistics, Government of India, November 1998.

It is well established that cost of treatment is an important determinant for the choice of health care. The following section attempts to show the differences in cost of treatment by type of illness (non-hospitalized or hospitalized), system of treatment (allopathic or other) and the socio-economic characteristics of the households.
For Non-hospitalized Illness Episodes
The NSS 42" round (1986-87) suggests that for non-hospitalized illnesses, the cost of treatment was much less in the private sector than the public sector in both rural and urban areas of Punjab and all-India (Table 20). Outdoor treatment being cheaper in the private sector than in the public sector clearly implies that private sector as such is striving to provide curative services at lesser cost -than the public sector. Another possible reason for lesser cost per episode in private sector may be the lesser treatment span in private sector as revealed in the table.
Table 20
Expenditure/duration Rural areas Urban areasPunjab India Punjab India
Average total expenditure (in rupees)Government 99.09 114.75 92.90 103.39Private 83.05 84.93 76.61 91.30Average total duration of illness (in days)Government 11.9 13.2 1 1 . 8 13.3Private 1 0 . 1 1 2 . 2 9.3 11.5
Source:1986-June 1987
NCAER (1990) indicates that the cost of medical treatment was the highest for the Allopathic system of medicines in both India and Punjab (Table 21). However, it was less for Punjab than for India. One surprising factor emerging from this table is that the private sector provides services at a competitive price compared to the public sector. The cost of treatment in the private sector is, however, much higher in both rural and urban areas of India than in Punjab. The table also indicates that the cost of medical treatment increases with the distance covered by the patient. It is usually higher for males and boys than for females and girls in Punjab as well as in India. At least two- thirds of the cost of medical treatment is towards fees and medicines. The costs of clinical tests in rural areas are higher than in urban areas.

Average Cost of Treatment per Illness Episode Classified by System of Medical Treatment, Type of Treatment, Distance, Sex (in Rupees), and Break-up of the Medical Expenses (in Percent)
Characteristics Rural areas Urban areasPunjab 1 India Punjab India
System of medical treatmentAllopathic 133.27 167.04 142.53 150.87Homeopathic 75.41 125.03 108.40 136.26Ayurvedic 30.69 91.10 74.19 104.16Rituals 0.00 165.94 0.00 118.09Self-medication 0,00 18.98 46.99 48.22Source of medical careGovernment hospitals 119,12 187.32 124.45 123.79ESI hospitals - 161.11 140.00 94.88Private hospitals and clinics 142,28 154,31 131.23 175.21PHC 37.69 119.38 80.48 120.82Charitable dispensaries - 81.82 - 204.99Medical stores 50.69 130.43 168,73 97.99Others 6.80 71.13 87.32 115.17Distance (in Kilometres)< 1 77.57 87.05 93.27 111.751-2 132.33 98.81 103.57 131.783-5 81.83 130.96 236.89 172.476-10 78.39 171.71 145.59 288.4610+ - 274.70 1017.12 421.02SexMales 114.43 151,79 161.67 1.59.02Females 77.27 212.26 121.13 161.00Boys 78.64 96.59 74.15 99.02Girls 33.19 87.23 64.43 82.56Total 98.44 151.81 128.72 142.60Percent break-up of medical expensesFees and medicines 65.29 65.74 71.02 64.75Clinical tests 13.14 4.28 3.92 5.79Surgery 0.00 2.79 0.00 3.01Hospitalization 5.12 4.45 5.11 4.64Special diet 9.04 6.42 11.05 7.40Rituals 0.25 2.27 1.46 1.47Transport 3.61 6.76 5.36 4.98Bribes and tips 0.55 1.47 2.19 1.86Others 3.00 5.82 11.10 6.10Total 100.00 100.00 100.00 100.00
Source: NCAER, Household Survey o f Medical Care, May-June 1990.
The NCAER data (Table 22) show the average cost of treatment for non-hospitalized illnesses by systems of and type of medical treatment, distance, sex and per cent breakup of medical expenses. It is evident that the treatment cost for non-hospitalized illness- episodes was slightly higher in a private medical facility than in a public facility. One surprising factor that emerges is that the cost of treatment through a public facility is much higher in Punjab than in India, but through a private facility, it is the other way round. The cost of treatment increases with the increase in distance from the place of treatment in India but it is not so in the rural areas of Punjab. It is higher for males and boys than females and girls in Punjab as well as in India. The table also indicates that fees and medicines alone account for at least two-thirds of the total cost of treatment. Clinical tests are more expensive in both rural and urban areas of Punjab than in India.

Average Cost of Treatment per Illness Episode for Non-hospitallzed Illnesses Classified by System of Medical Treatment, Type of Treatment, Distance, Sex (in Rupees),
Characteristics Rural areas Urban areasPunjab 1 India Punjab 1 India
Average expenditure per illness episode for non-hospitalized illnessesMales adult 79.75 113.65 91.11 134.08Females adult 46.91 101.43 143.34 126.40Male children 85.51 60.06 116.95 77.18Female children 76.36 44.79 19.74 60.71Total 70.46 90.48 116.84 113.93Source of medical carePublic facility 62.42 49.08 92.23 62.90Private facility 76.37 130.06 125.27 152.19Medical shop - 21.24 89.91 23.02Faith/healer/religious person - 65.82 - 77.21Home remedy - 8.00 - 14.95Duration of illness (in days)<5 40.01 32.71 43.21 45.276-10 44.57 56.59 49.98 81.6211-20 86.96 109.95 138.66 163.1821-30 233.59 176.02 416.46 217.34>30 125.54 346.93 632.96 385.45Total 64.58 79.32 110.58 102.51Distance (in Kilometres)< 1 77.57 87.05 93.27 111.751-2 132.33 98.81 103.57 131.783-5 81.83 130.96 236.89 172.476-10 78.39 171.71 145.59 288.4610+ - 274.70 1017.12 421.02Percent break-up of medical expensesFees and medicines 66.1 71.3 69.3 77.6Clinical tests 13.7 4.4 14.0 6.9Special diet 3.2 8.1 5.7 8.2Rituals 2.8 0.9 2.2 0.5Transport 10.4 14.5 6.8 6.5Bribes, tips and miscellaneous 3.8 0.8 1.0 0.3Total 100.00 100.00 100.00 100.00
Source: NCAER, Household Survey o f Health Care Utilization and Expenditure, March 1995.
The survey conducted during the 52"^ Round of NSS reveals that the cost of treatment has gone up in the private sector in Punjab as compared to the government sector for non-hospitallzed illness-episodes in rural areas, but is still lower than in India. In urban areas of Punjab, the cost of treatment in the government sector is much higher than in India. Some sort of malpractices cannot be ruled out in this regard (Table 23).
Table 23Average Medical and Other Related Expenditure (for Non-hospitaiized illness Episodes)
per Treated Illness during the Last 15 Days Classified by Source of Treatment (in Rupees)
Source of treatment Rural areas Urban areasPunjab India Punjab India
Government 153 129 205 166Other 179 186 160 2 0 0All 175 176 162 194
NSSO, Department of Statistics, Government of India, November 1998
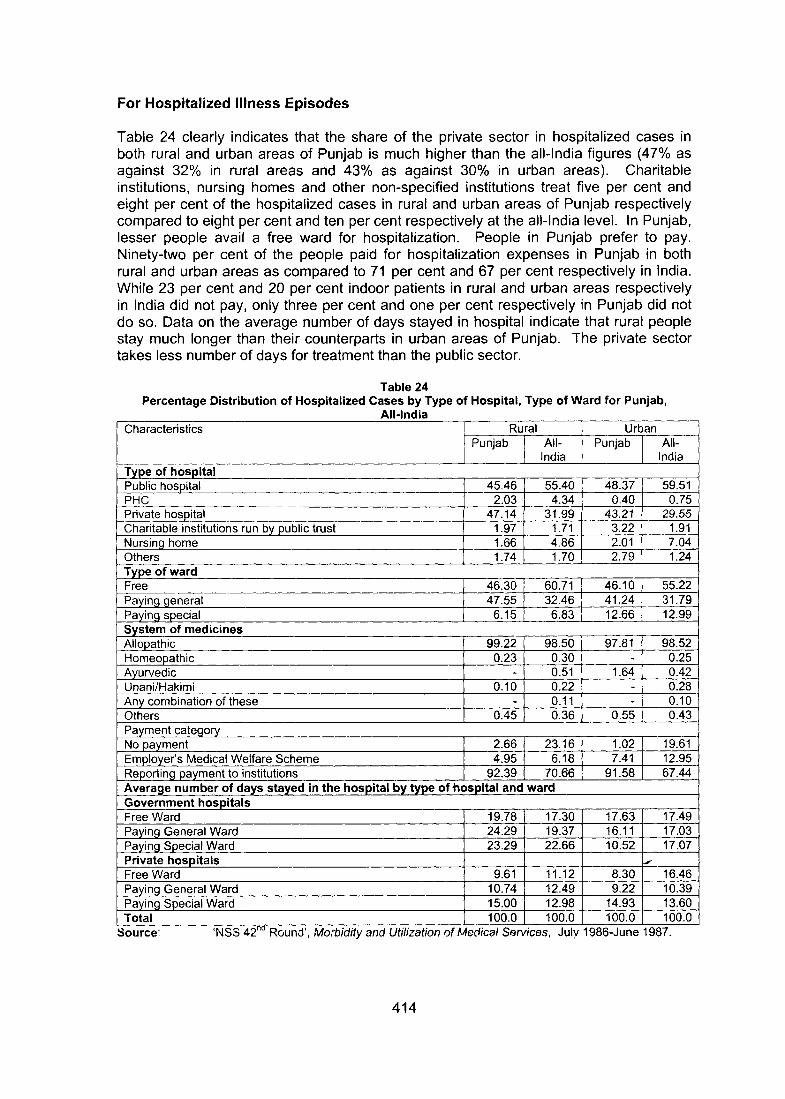
For Hospitalized Illness Episodes
Table 24 clearly indicates that the share of the private sector in hospitalized cases in both rural and urban areas of Punjab is much higher than the all-India figures (47% as against 32% in rural areas and 43% as against 30% in urban areas). Charitable institutions, nursing homes and other non-specified institutions treat five per cent and eight per cent of the hospitalized cases in rural and urban areas of Punjab respectively compared to eight per cent and ten per cent respectively at the all-India level. In Punjab, lesser people avail a free ward for hospitalization. People in Punjab prefer to pay. Ninety-two per cent of the people paid for hospitalization expenses in Punjab in both rural and urban areas as compared to 71 per cent and 67 per cent respectively in India. While 23 per cent and 20 per cent indoor patients in rural and urban areas respectively in India did not pay, only three per cent and one per cent respectively in Punjab did not do so. Data on the average number of days stayed in hospital indicate that rural people stay much longer than their counterparts in urban areas of Punjab. The private sector takes less number of days for treatment than the public sector.
Table 24Percentage Distribution of Hospitalized Cases by Type of Hospital, Type of Ward for Punjab,
All-IndiaCharacteristics Rural Urban
Punjab All-India
Punjab All-India
Type of hospitalPublic hospital 45.46 55.40 48.37 59.51PHC 2.03 4.34 0.40 0.75Private hospital 47.14 31.99 43.21 29.55Charitable institutions run by public trust 1.97 1.71 3.22 1.91Nursing home 1.66 4.86 2.01 7.04Others 1.74 1.70 2.79 1.24Type of wardFree 46.30 60.71 46.10 55.22Paying general 47.55 32.46 41.24 31.79Paying special 6.15 6.83 12.66 12.99System of medicinesAllopathic 99.22 98.50 97.81 98.52Homeopathic 0.23 0.30 - 0.25Ayurvedic - 0.51 1.64 0.42Unani/Hakimi 0.10 0.22 - 0.28Any combination of these - 0.11 - 0.10Others 0.45 0.36 0.55 0.43Payment categoryNo payment 2.66 23.16 1.02 19.61Employer’s Medical Welfare Scheme 4.95 6.18 7.41 12.95Reporting payment to institutions 92.39 70.66 91.58 67.44Average number of days stayed in the hospital by type of liospital and wardGovernment hospitalsFree Ward 19.78 17.30 17.63 17.49Paying General Ward 24.29 19.37 16.11 17.03Paying Special Ward 23.29 22.66 10.52 17.07Private hospitalsFree Ward 9.61 11.12 8.30 16.46Paying General Ward 10.74 12.49 9.22 10.39Paying Special Ward 15.00 12.98 14.93 13.60Total 100.0 100.0 100.0 100.0

As against the NSS 42"" round, NCEAR indicates that the distribution of hospitalized cases is more in public facility than in private in both the rural and urban areas of Punjab and India (Table 25). The survey points out that almost the entire rural population (95%) of Punjab is dependent on public facilities for treatment of hospitalized illness-episodes.
Table 25Percent Distribution of Hospitalized Illness Episodes by Type of Treatment______________
Type of facility,treatment anddistance
Rural areasPunjab India
Urban areasPunjab India
Reported nunnber of hospitalized cases by sex (per ‘OOP persons)Male 22.2 8.4 12.4 10.9Female 5.7 5.5 16.6 8.4Total 14.2 7.1 14.3 9.7Distribution of hospitalized cases by type of treatmentPublic facility 95.3 62.0 67.2 60.1Private facility 4.7 38.0 32.8 39.9Total 100.0 100.0 100.0 100.0Average distance traveled for seeking in-patients (in kilometers)Public sector facility 9.0 18.6 3.5 5.7Private sector facility 15.0 18.7 5.4 6.2All 9.3 18.7 4.1 5.9Source: NCAER, Household Survey of Health Care Utilization and Expenditure, March 1995
NSS 52"^ round data (Table 26) indicate that the percentage of beds available in government hospitals is higher than the number of patients treated.
Table 26Number of Hospitalized Treatment Received from Public Providers
State/Country Rural Urban Percentage of beds in government hospitals
Punjab 394 276 74India 453 431 65
Department of Statistics, Government of India, November 1998.
The cost of treatment for hospitalized or indoor patients in the private sector is nearly three times higher in rural Punjab and 5.4 times in urban Punjab as against 2.3 times and 3.1 times in rural and urban areas respectively in India (Table 27). The data further reveal that the General Ward in a private hospital would cost slightly higher than in a government hospital.
Table 27
Type of hospital/ward/duration/expenditure Rural areas Urban areasPunjab 1 India Punjab 1 India
Type of treatmentGovernment 409.75 320.34 277.86 385.02Private 1212.17 733.38 1497.34 1206.01All 896.80 597.06 977.79 933.33Average total expenditure (in rupees) per hospitalized case by type of hospitalGovernment hospitalsFree Ward 1088.76 630.40 880.38 582.12Paying General Ward 1303.19 1040.21 1682.51 1412.11Paying Special Ward 2471.15 1482.62 1326.64 1268.08Private HospitalsFree Ward 1750.16 665.65 1058.46 975.21Paying General Ward 1407.42 1031.15 1948.85 1393.26Paying Special Ward 3575.16 1637.85 3001.23 2862.86Average no. of days in the hospital 15.4 15.5 13.7 15.2Average total expenditure 1402.01 853.23 1599.84 1182.95
Source; NSS, 42 Round’, Morbidity and Utilization of Medical Services, July 1986-June 1987.

Household survey of health care utilization and expenditure (1995) also collected information on the breakdown of expenditure. If we look at the average cost of treatnnent per illness-episode for hospitalized illness by type of treatment (Table 28), we find that it is generally lower in Punjab than in India in both rural and urban areas. The difference is lower, when one compares the average cost of treatment in the private sector in Punjab with that of India. For example, the difference in cost of treatment between public and private sector is 1.8 times and 3.6 times in rural and urban areas of Punjab respectively against 3.5 times and 5.1 times in rural and urban areas at the all-India level.
Table 28Average Cost of Treatment Per Illness Episode for Hospitalized Illness
Type of treatment Rural areas Urban areasPunjab India Punjab India
Public 434.21 535.20 372.81 452.55Private 762.50 1877.21 1357.31 2318.84Total 449.62 1044.49 696.03 1196.87Source: NCAER, Household Survey o f Health care Utilization and Expenditure,
March 1995.
Table 29 describes the health-seeking behaviour across different social groups. It classifies the type of services, viz., free, paying general and paying special, by social groups and adult education. The share of the three services (free, paying general and paying special) start decreasing in urban and rural areas of Punjab, but the share of general cases keeps on rising with higher paying capacity.
Table 29Percentage Distribution of Hospitalized Cases Defined by Social Groups and Adult
Education Classes by Type of Hospital and Type of Ward for Rural and Urban
Socialgroup/education
Rural UrbanType of ward Type o1 ward
Free Payinggeneral
Payingspecial
All Free Payinggeneral
Payingspecial
All
Social GroupST - - - - - 11.65 - 2.15SC 37.53 30.63 3.45 35.42 32.51 24.58 3.98 30.37Neo-Buddhist
1.03 - - 0 . 8 6 - - - -
Others 61.44 65.05 96.55 63.14 67.49 63.77 96.02 67.48Adult EducationIlliterate 24.15 29.43 7.29 24.27 14.28 16.74 - 14.39>1<5 3.99 2 . 6 8 34.54 33.85 16.74 9.11 12.59 61.565<10 36.67 34.54 14.90 35.63 38.70 12.59 9.03 33.171 0 + 35.19 33.85 77.81 36.43 37.81 61.56 90.97 43.47All 1 0 0 . 0 1 0 0 . 0 1 0 0 . 0 1 0 0 . 0 1 0 0 . 0 1 0 0 . 0 1 0 0 . 0 1 0 0 . 0
1986-June 1987.
The sun/ey conducted during the 52"^ Round of NSS reveals that the cost of treatment in government hospitals is much higher in Punjab than in the rest of India and vice versa for hospitals other than government. In absolute terms, the cost of hospitalized
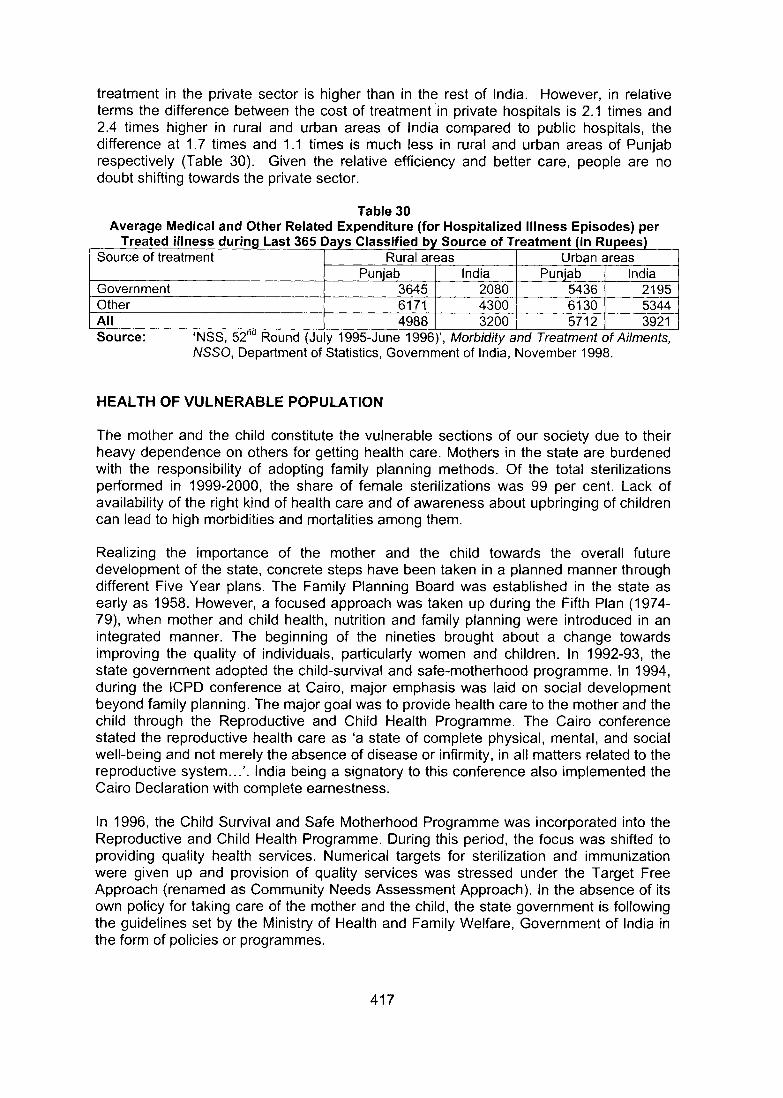
treatment in the private sector is higher than in the rest of India. However, in relative terms the difference between the cost of treatment in private hospitals is 2 . 1 times and 2.4 times higher in rural and urban areas of India compared to public hospitals, the difference at 1.7 times and 1.1 times is much less in rural and urban areas of Punjab respectively (Table 30). Given the relative efficiency and better care, people are no doubt shifting towards the private sector.
Table 30Average Medical and Other Related Expenditure (for Hospitalized Illness Episodes) per
Treated illness during Last 365 Pays Classified by Source of Treatment (in Rupees)Source of treatment Rural areas
Punjab IndiaUrban areas
Punjab IndiaGovernment 3645 2080 5436 2195Other 6171 4300 6130 5344All 4988 3200 5712 3921Source: ‘NSS, 52" Round (Juy 1995-June 1996)’, Morbidity and Treatment of Ailments,
NSSO, Department of Statistics, Government of India, November 1998.
HEALTH OF VULNERABLE POPULATION
The mother and the child constitute the vulnerable sections of our society due to their heavy dependence on others for getting health care. Mothers in the state are burdened with the responsibility of adopting family planning methods. Of the total sterilizations performed in 1999-2000, the share of female sterilizations was 99 per cent. Lack of availability of the right kind of health care and of awareness about upbringing of children can lead to high morbidities and mortalities among them.
Realizing the importance of the mother and the child towards the overall future development of the state, concrete steps have been taken in a planned manner through different Five Year plans. The Family Planning Board was established in the state as early as 1958. However, a focused approach was taken up during the Fifth Plan (1974- 79), when mother and child health, nutrition and family planning were introduced in an integrated manner. The beginning of the nineties brought about a change towards improving the quality of individuals, particularly women and children. In 1992-93, the state government adopted the child-survival and safe-motherhood programme. In 1994, during the ICPD conference at Cairo, major emphasis was laid on social development beyond family planning. The major goal was to provide health care to the mother and the child through the Reproductive and Child Health Programme. The Cairo conference stated the reproductive health care as ‘a state of complete physical, mental, and social well-being and not merely the absence of disease or infirmity, in all matters related to the reproductive system...’. India being a signatory to this conference also implemented the Cairo Declaration with complete earnestness.
In 1996, the Child Survival and Safe Motherhood Programme was incorporated into the Reproductive and Child Health Programme. During this period, the focus was shifted to providing quality health services. Numerical targets for sterilization and immunization were given up and provision of quality services was stressed under the Target Free Approach (renamed as Community Needs Assessment Approach). In the absence of its own policy for taking care of the mother and the child, the state government is following the guidelines set by the Ministry of Health and Family Welfare, Government of India in the form of policies or programmes.

The declining sex ratio, especially in the 0-6 years age group (793 per 1000 live births), high maternal mortality rate jand a large section of anaemic women (41%) indicate the poor condition of women in the state. Sex-selective abortions in the state, which have picked up during the last decade, will further deteriorate the health of women. Even though estimates of the repeated abortions that a woman undergoes are not available, its high prevalence in the state cannot be denied. Besides the psychological trauma the woman undergoes, her physical health also deteriorates. This could result in higher maternal mortality rates. The National Population Policy 2000 has set a target of reducing the MMR to below 100 by the year 2010, which the state aspires to achieve. This reinforces the urgency of ensuring that all pregnant women receive adequate antenatal care and delivehes take place under hygienic conditions with the assistance of trained medical practitioners. Further, meticulous post-partum care needs to be imparted to the mother and the child to help them to recoup and adjust to the new environment.
Antenatal Care
Antenatal care monitors the progress of pregnancy, identifies, and treats maternal complications. It also helps in identifying high-risk pregnancies reflected in imbalances in height, weight, immunization patterns, anaemia levels and age at the time of giving birth. In Punjab, 2.5 per cent females are susceptible to high-risk pregnancies as they get married before the age of 18 years. One out of every four women in Firozpur and Muktsar districts marries before 18 years of age.^^ Among other high risk factors such diseases as tuberculosis, measles, and hypertension at the time of pregnancy, can result in various deformities, premature births and stiil-births.
Figure 13Still-birth Rate in Punjab and India 1971-1999
a> o) o> 0 5 0 5 d ) O ) 05 05 0 5 0 5 05 05 05
-♦— Punjab India
Source; Registrar General, India, Compendium of India’s Fertility and Mortality Indicators (1971-1997) based on Sample Registration System (SRS), 1999.
Sample Registration System Statistical Report, 1998. Registrar General, India, New Delhi, 1998 and District Wise Social Economic Demographic Indicators, National Commission on Population, New Delhi, 11 July 2001, p. 26.

The inadequacy of antenatal care services provided to women, besides other factors, is reflected in the generally higher still-birth rate in Punjab, than the national average. During 1986-1991, the still-birth rate almost doubled, from 12.9 to 24.7 per 1,000. Inadequate antenatal care is evident also from the NSS 42"^ round, wherein just one- fourth of the women in rural and urban Punjab were receiving antenatal care.^^ Antenatal care also plays a significant role in reducing premature births. Three per cent of the women in the state with no antenatal care reported premature births as against 2.7 per cent with antenatal care of one to three visits (NFHS, 1998-99). In South Indian states antenatal care is higher than in the North Indian states.
Utilization of antenatal care services in Punjab has declined from 8 8 per cent to 74 per cent during 1992-93 and 1998-99 (Table 31). The decline in the number of women receiving at least one antenatal check-up needs immediate intervention, to reduce stillbirths, undenA/eight births and other complications leading to increased maternal mortality rates. The use of tetanus toxoid increased from 83 per cent to 90 per cent and of iron and folic acid tablets from 74 per cent to 80 per cent during 1992-93 to 1998-99.
Table 31Antenatal Care Indicators, Punjab and India (per cent )
Antenatal care indicators 1992-93 1998-99Punjab India Punjab India
Percentage of women receiving ANC 87.9 62.3 74.0 65.4Percentage receiving two doses of tetanus toxoid vaccine
82.71 53.8 89.9 6 6 . 8
Percentage receiving iron/folic tablets 73.6 50.5 79.6 57.6Source: anc
1998-99
One out of every four women did not avail antenatal care services in Punjab as against one out of three at the national level in 1998-99 (Table 32). Differences in rural-urban bias in the utilization of antenatal care services are evident at both state and national levels. Non-utilization of antenatal care services in rural areas is three times higher than in urban areas at the state level as well as at the national level. Absenteeism of medical/paramedical staff from duty at the primary health centre and below is a matter of concern and a major cause for lack of adequate antenatal care services being provided to pregnant women, as observed during field studies carried out by the Population Research Centre, CRRID, in different districts of Punjab. Further, with the ANM’s manifold duty chart, with particular emphasis on promoting family planning acceptance to bring down the birth rate, antenatal care services have become secondary. There is need to redefine her job responsibilities and to increase the involvement of the multipurpose health worker (male) in the sub-centre’s duties.
NSS, 42"' Round (1986-87), Sarvekshana, issue No. 432, Volume Xlil, NO. 4, April-June 1990, p. S-99.

Table 32Antenatal Care Check-ups and Stage of Pregnancy, Punjab and India (per cent)
Number and timing of checkups
Punjab India
Not know/missing 0.7 0.8 0.7Total 100.0 100.0 100.0 100.0 100.0 100.0Median number of check-ups (for those who received at least one antenatal check-up
4.8 2.9 3.5 4.2 2.5 2.8
Stage of pregnancy at the time of the first antenatal c leck-upNo antenatal check-up 9.7 30.8 26.0 13.6 39.8 34.0First trimester 67.7 35.1 42.6 55.1 26.6 33.0Second trimester 20.1 31.4 28.8 24.2 25.5 25.2Third trimester 2.5 2.6 2.6 6.9 7.6 7.4Not know/missing 0.2 0.4 0.4Total 100.0 100.0 100.0 100.0 100.0 100.0Median months pregnant at first antenatal check-up (for those who received at leastone antenatal check-up)____Number of births
2.7 3.5 3.2 3.0 3.9 3.5
207 693 900 7191 25202 32393Source: National Family Health Survey-2, Punjab, IndiaNote: Table includes only the two most recent births
the survey
1998-99during the three years preceding
The preferred place for availing antenatal care services in the state is a doctor or other professional outside the home. At the national level, 15.4 per cent of rural women availed antenatal care services at home as against 1.9 per cent in the state, in 1992-93 (Table 33). However, by 1998-99 the percentage of women availing antenatal services at home, both in rural and urban areas, had drastically declined. Outside home, a higher proportion of Scheduled Caste women avail services of other health professionals, while other caste women avail those of a doctor. Among women in rural Punjab, a trend of not availing antenatal care is emerging, besides a decline in the share of women seeking care from trained personnel. This is an area of concern for the improvement of the health status of females.
Table 33
Sources Punjab India1992-93 1998-99 1992-93 1998-99
Rural Urban Rural Urban Rural Urban Rural UrbanAntenatal check-up only at home from health
worker
1.9 1.5 0.8 0.0 15.4 3.9 6.6 2.0
Antenatal check-up outside home fromDoctor 29.4 50.3 34.8 63.1 31.1 69.6 41.2 74.8Other health professionals
55.0 40.4 33.6 27.2 10.0 7.2 11.5 8.8
Trained birth attendant 0.2 0.6 - - 0.3 0.4 0.3 0.2No antenatal care Checkup
13.6 7.2 30.8 9.7 42.4 17.8 39.8 13.6
Source: National Family Health Survey-^ and 2, Punjab, India 1992-93 and 1998-99

Availability of the various testing instruments, such as weight, height, blood pressure and urine at the rural health centres can further promote utilization of antenatal services in the state. It is imperative to upgrade the skill of the para-medical staff through training programmes, during which specific counselling techniques can be discussed for further dissemination among the community.
Natal Care
Natal care determines the quality of care in providing women a safe, clean, hygienic environment and services of trained personnel who can efficiently cut the umbilical cord, for the safe delivery of the child. This period is extremely vital and protection against sepsis in the mother and neonatal tetanus in the infant is crucial and needs to be taken care of, as it has a direct bearing on maternal and infant health. In the state, 46.7 per cent infant deaths are due to birth injury.^^ This reinforces the view that it is important to have skilled attendance and preferably institutional deliveries, which reduce many risks associated with the process of delivery and thereafter.
Three out of every five women in the state give birth to a child at home. Traditionally, the first delivery of the woman is conducted at her parent’s house. This seems to be followed more strictly in rural than in urban areas. The share of home deliveries in rural and urban areas of the state have declined by 1 0 and 19 per cent respectively, during 1992-93 to 1998-99. The shift towards delivery in medical institutions is a healthy trend (Table 34), but there is a long way to go to get the desired results. Besides rural-urban differentials in deliveries, caste-wise differences are also evident. A higher proportion of Scheduled Caste women deliver their babies at home (78%) followed by Other Backward Class women (67.2%) and other caste women (47.5%) (NFHS, 1998-99).
Table 34
Place of delivery
Rural UrbanPunjab Punjab India India Punjab Punjab India IndiaNFHS-1 NFHS-2 NFHS-1 NFHS-2 NFHS-1 NFHS-2 NFHS-1 NFHS-2
Publicinstitution
10.2 7.1 10.0 12.5 8.1 9.3 30.2 29.1
NGO/Trust - 0.3 - 0.5 - 0.0 - 1,5Privateinstitution
11.1 24.5 6.0 11.6 28.1 46.8 27.4 34.5
Own home 64.2 59.4 69.5 60.5 56.0 42.3 34.6 27.6Parents’ home 14.0 8.7 13.4 13.8 7.2 1.7 6.9 6.3Other 0.4 - 0.5 1.0 0.6 - 0.5 1.0Do not know - - 0.5 - - - 0.4 -
Total 100.0 100.0 100.0 100.0 100.0 100.0 100.0 100.0Source: National Family Health Survey-'[ and 2, Punjab, India 1992-93 and 1998-99
Traditionally, childbirth has been viewed as a regular physiological process not requiring any medical intervention. Thus, the dais or traditional birth attendants were not expected to have any training besides experience. Though they have never been a formal part of the public health delivery system, they have now been trained to perform deliveries under hygienic conditions. To ensure hygiene and avoid any complications of infections, the health department in the state has equipped dais with disposable delivery kits. The proportion of institutional deliveries is still very low and faith in dais is still very strong in rural areas (42%). In contrast, doctors are preferred in urban areas (48.4%); ANM/LHV is the next preferred attendant assisting during delivery in urban and rural areas (NFHS 1998-99).
Registrar General, India, 1995, Family Welfare Programme in India, Year Book, 1997-98, Department of Health and Family Welfare, Government of India, New Delhi

The SRS 1995 figures show a low proportion of institutional births and a high proportion of births being attended by trained personnel. The recent NFHS surveys revealed that one-fourth of the total deliveries (25.0%) were conducted in medical institutions in 1992- 93, which by 1998-99 had increased to a little less than two-fifths (37.5 %) (Table 35). Similar results were reported by the National Sample Survey’s 42"" round. According to it, four-fifths of the deliveries were being conducted at home in both rural and urban Punjab. The proportion of home deliveries declined to 77.5 per cent in rural and to 60.6 per cent in urban areas as reported by the NSS 52* round.
Table 35
Natal care indicators 1992-93 1998-99Punjab India Punjab India
Percentage of births delivered in medical institutions
24.8 25.5 37.5 33.6•
Percentage of deliveries assisted by health 1 professionals
48.3 34.2 62.6 42.3
Source: National Family Health Survey-1 and 2, Punjab, India 1992-93 and 1998-99
District-level variations in the type of assistance at the time of delivery are evident; Kapurthala, Ludhiana and Jalandhar districts had a higher proportion of women receiving skilled attention (Table 36) at the time of delivery (87.6%, 85.9% and 84.4% respectively) as compared to Nawanshahar, Muktsar and Mansa districts (68.5%, 57.7% and 57.7% respectively). This can be attributed to differences in the availability of improved health facilities and the paying capacity of the population in these districts.
Table 36
Name of the district Per cent safe Delivery
Name o f the district Percent safe delivery
Kapurthala 87.60 Sangrur 72.3Ludhiana 85.90 Firozpur 72.0
1 Jalandhar 84.40 Moga 70.01 Rupnagar 83.8 G urdaspur 69.50! Patiala 83.60 Hoshiarpur 69.5! Faridkot 83.30 Nawanshahr 68.5
Fatehgarh 78.7 Muktsar 67.7Bathinda 74.40 Mansa 57.6
1 Am ritsar 73.10Source; District Household Survey; Reproductive and Child Health Survey, 1998-99, UPS,
Mumbai.National Commission on Population, District Wise Data, Government of India, 2001
The target of achieving 80 per cent institutional deliveries and 100 per cent deliveries by trained personnel set by the NPP-2000 is still a distant dream for Punjab.
With the increasing impact of urbanization and the level of standard of living, privatization of maternity care, both in rural and urban areas, is evident in the state. A narrowing of the public sector and widening of the private sector for deliveries is emerging even among Scheduled Caste women. In 1992-93, one out of every ten Scheduled Caste women gave birth in a private institution as against one in every six in 1998-99.

During 1992-93 to 1998-99, the number of caesarian section deliveries doubled from 4.1 per cent to 8.2 per cent (NFHS I and II). According to the NSS 52" round, deliveries through operations were more in urban (8.3 per cent) than in rural (5.7 per cent) areas of the state. Inadequate antenatal care and non-identification of high-risk pregnancies, coupled with vested economic interests of private practitioners, are some of the reasons for the promotion of caesarian section births in the state.
The Ninth Plan was particularly committed towards providing essential primary health care and emergency life-saving services. The ‘maternity benefit scheme for women below poverty line up to two child norm’, under the National Social Assistance Programme, was also initiated during this period in an attempt to take care of pregnant women. Thus, care during domiciliary delivery can be further enhanced to achieve our goal of reducing MMR to 20 per 1,000 live births by the year 2007. Considering the target of the Tenth Five Year Plan (2002-2007) to reduce the MMR to 20 per 1,000 by 2007 and to 10 per 1,000 by 2012, it is important to prioritize medical attention at birth, inadequacy of which contributes to high MMR.
Post-natal Care
Post-natal care for the mother and the child has far-reaching consequences on the former’s health. Post-natal care must ensure a total state of physiological and psychological well-being of the mother. This is the period when she is recouping her health, while the child is adjusting from a protected to an exposed environment and hence, chances of occurrence of reproductive health problems among women are high.
NSSO 42"* round reveals that of the one-fourth women registering for prenatal check-up, both in rural and urban Punjab, less than one-fifth registered for post-natal care, while NSS 52" round reported that there were 24.3 per cent women in rural and 33.5 per cent in urban Punjab registering for post-natal care (Table 37), with the public dispensary as the preferred place for rural mothers and public hospital for urban mothers. This clearly reveals that if the facilities are further improved and provided round the clock, attendance to these institutions will increase and in turn improve ma-ernal and child health.
Table 37
Percentage ofmothers registered/typeofinstitutions
Punjab (42""' round)
Punjab (52"‘‘ round)
India(42"'^ round)
India(52"'^round)
Rural Urban Rural Urban Rural Urban Rural Urban
Percentage of mothers registered
11.58 13.11 24.3 33.5 12.60 23.76 24.2 39.9
Public hospital 29.84 25.13 17.6 44.5 20.51 39.37 32.5 42.1Primary health Center
- 1.98 18.8 2.5 10.44 3.30 33.5 6.5
Public dispensary - - 41.2 17.5 1.16 0.53 4.5 2.1Primary/private hospital 8.32 18.92 10.6 23.5 16.44 22.95 12.5 22.9Nursing home - 9.87 6.2 5.8 0.92 7.68 4.5 14.6Charitable institution - - - 2.7 0.34 0.73 0.5 1.4ESI doctor/AMA - - - - - - 0.8 0.5Private doctor 5.05 4.19 4.3 2.8 9.97 9.88 8.6 7.8Lady Health Visitor 38.70 20.26 - 21.85 4.40 - -
Others 12.58 12.80 0.61
1.71 1.92 0.7 0.9
Total 100 100 100 100 100 100 100 100Sources.
Sarvekshana, Issue no. 47, Vol. XIV (April-June, 1991)NSS 52"'* round, July 1995-June 1996, Maternal and Child Health Care in India, NSSO, Department of Statistics, Government of India, December 1998.

Literacy level of women plays a vital role in their availing and comprehending the value of post-partum services. Women belonging to other castes have availed such services more often (24.3%) than Scheduled Caste women (17.3%)
Coordinated efforts by health providers and policy-makers are essential to provide maximum medical and paramedical staff to ensure antenatal, natal and post-natal care to the community at large, to improve the health status of the mother and the child.
Underweight Children: The impact of lower antenatal care in the state is reflected in the number of underweight children. Punjab ranks 14‘ and Bihar 1®* with 62.2 per cent underweight chi ldren.This reflects on the nature of health and nutritional care being provided to the mother during pregnancy. In 1992-93, little less than one-third of the children, who were weighed, were born underweight. By 1998-99, this figure came down to little less than one-fourth (Table 38). In both rounds of NFHS surveys, children in rural areas were more prone to be born underweight than their counterparts in urban areas. The all-India pattern was more or less the same as in Punjab. This can be attributed to the availability of weighing machines at the time of birth. This can be further achieved by promoting institutional deliveries, in which newborn babies would be weighed, besides creating awareness of getting the children weighed at the time of birth.
Table 38
State Less than 2.5 kg. 2.5 Kg. Or more1992-93Punjab 28.6 71.4Rural 31.0 69.0Urban 25.4 74.61998-99Punjab 23.8 76.2Rural 25.3 74.7Urban 2 1 . 6 78.41992-93India 26.0 74.0Rural 24.7 75.3Urban 26.3 73.71998-99India 22.7 77.3Rural 23.9 76.1Urban 2 1 . 1 78.9
Source. Calculated from NFHS 1 and 2
Reproductive Health Problems: Reproductive health problems are those inhibiting the ability of men and women to achieve their reproductive goals. Among all the states of India, in Punjab, 28.3 per cent of women have reproductive health problems as against 19 per cent in Karnataka and 28 per cent in Tamil Nadu. Women rely more on private health care services (46.5%) than the public health sector (17.6%) (NFHS 1998-99) for the treatment of such problems. Considering the confidential nature of the problem,
24 National Family Health Suryey-2, Punjab, India 1998-99
Gopal, Krishan, (1997) 'Spatial Contrasts in Socio-demographic Profiles of India’ Population Geography, Volume, 19, No.,1 & 2, June-December 1997.

possibilities of under-reporting seem to exist. Levels of literacy and awareness and nonavailability of medical and para-medical staff according to women’s convenience could be attributing factors to under- or non-reporting of such problems. Punjab has an existing staff of 105 gynecologists in rural areas, but their availability seems to be sparse, hence, the need to reshuffle them, keeping the real needs of the people in mind. This will prove beneficial not only to the women but also for the achievement of the health goals of the state.
Infertility: Infertility among women is another vital problem, which has a very profound social and psychological impact on the psyche of the women in particular. Treatment facilities for infertility are available only at tertiary-care public units, though the private sector in Punjab is playing a very strategic role in providing treatment for this problem. A need to undertake systematic studies and research on infertility is imperative.
Child Health Status
A child is not just a component of a large population, rather it is a component of development. Investments in the improvement of the health status of children would determine the future workforce and quality of life of Punjab. Child health and survival are the most important aspects of the Family Welfare Programme in the state. Every effort is being made to prevent childhood morbidity and mortality by providing different kinds of immunization.
The Infant Mortality Rate (IMR) is an indicator of the status of infant-health and the quality of care being provided in the state. The IMR shows the level of social development and the state of physical quality of life in a particular area. It is also a reflection of the nutrition level of the mother and the child, health-care facilities available in the area, and the level of economic development. Besides other factors, advancement in health services, comprising of preventive care - immunization services -- and promotive care, in terms of distribution of iron and folic acid tablets aiid cotrimoxazole, have also played an important role in bringing down the IMR in the state. A constant decline from 1971 to 2000 is evident in Punjab and at the national level, though the decline in the state is slower than the national average. The state’s IMR at 52 in 2000 is significantly lower than 6 8 at the national level. Economic prosperity of the state is not reflected in its IMR level. In comparison with Kerala, the IMR in Punjab is four times higher. This is an expression of the better-health care system in Kerala, besides the high status allocated to women and a higher literacy rate.
Mortality among infants and children, classified as infant mortality, neonatal, post-natal and peri-natal mortality levels have also declined during 1971-1997. This is an indicator of increased child survival rates (Figure 14 ®). Further, according to the National Population Policy 2000, neonatal care has been identified as a priority area and its implementation should be intensified with the help of pediatricians, gynecologists, anesthetists and other public health specialists.
Prevention of childhood mortality was one aim of starting a Universal Immunization Programme in 1985-86 in the state. Immunization trends in Punjab are encouraging. Pulse Polio was given the shape of a drive in 1995 with the ‘Pulse Polio Campaign’ all over India. Trends, subsequent to that, in Punjab have been continuously upward. In the
Registrar General, India, Compendium of India’s Fetiility and Mortality Indicators (1971- 1997) based on Sample Registration System (SRS), 1999.

Eighth Plan, the Government of India had provided cold-chain equipment and the state government was made responsible for maintaining its requisite temperature, so that the vaccines did not lose their potency. Special grants were allocated subsequently for provision of independent feeder/generator for uninterrupted power supply/solar water heating panels in the hospitals. Subsequent assistance has been sought from the World Bank to further strengthen the immunization project.
Improvement in the vaccination coverage has been confirmed by two National Family Health surveys conducted in Punjab. More than four-fifths of the children have been vaccinated against tuberculosis, diphtheria, pertussis, tetanus and polio by 1 2 months of age. A higher proportion of urban than rural children have been vaccinated before one year of age. However, a stringent drive against measles is required both in urban and rural health centres to achieve an upward trend. A clear-cut gender bias towards the male child has emerged in the immunization trends in Punjab. Elamon^® (1998) worked out the gender differentials in child immunization on the data of NFHS (1992-93) and confirmed these results. Gender bias towards the male child is evident from the possession and presentation of immunization cards (NFHS I & II) (Table 39). At the district level, Hoshiarpur and Rupnagar have achieved 90 per cent immunization of children, while Firozpur and Moga districts are lagging far behind.^®
Caste-wise differential in the immunization services are evident. Four out of every five children belonging to the other category were immunized as against little more than one out of two among Scheduled Castes. A smaller proportion of Scheduled Caste children were immunized against measles (61.1%) and BCG (77.1%) than those belonging to the other category (NFHS, 1998-99).
Figure 14Infant Mortality Indicators in Punjab, 1971-97
1997
1991
1981
1971
80 100 120
HNeo Natal Mortality Rate ^Post Natal Mortality Rate ^ Peri Natal Mortality Rate D Infant Mortality Rate
Source: Source: Registrar General, India, Compendium o f India’s Fertility and Mortality Indicators (1971-1997) based on Sample Registration System (SRS), 1999.
27 Annual Plan, 2001-02, Ministry of Health and Family Welfare, Governnnent of India, New Delhi
28 Joy, Elamon, (1998), ‘Gender Differentials in Child Immunization: A Study Based on NFHS Data’, Journal of Family Welfare, Voi. 44, No. 3, September 1998)
District Wise Social Economic Demographic Indicators, National Commission on Population, New Delhi, 1 July 2001, p. 50

Table 39Vaccination Coverage in Punjab and India (per cent)
Vaccines Coverage in Punjab Coverage in India
DPT 3 73.6 82.0 51.7 55.1Polio 1 82.2 90.5 67.0 83.6Polio 2 78.2 88.5 61.2 78.2Polio 3 73.4 83.6 53.4 62.8Measles 64.8 76.5 42.2 50.7All 61.9 72.1 35.4 42.0None 17.5 8.7 30.0 14.4Percentage showing vaccination card
37.8 43.0 30.6 33.7
Source; National1998-99
Family Health Survey-1 and 2, Punjab, India, 1992-93 and
Though immunization trends of most of the vaccine-preventable diseases seem optimistic, concerted efforts are necessary to maintain the existing trends, improve on gray areas and aim to achieve 1 0 0 per cent immunization for all the vaccines as is the state target.
Acute respiratory infection and diarrhoea: To combat such fatal diseases as Acute Respiratory Infection and diarrhoea among children, the Government of India has initiated such intervention strategies as the ARI to combat pneumonia and Oral Rehydration Therapy to combat diarrhoea. The state government has followed, too. The Oral Rehydration Therapy Programme was started in 1986-87 and is continuing at present Strategies for ARI were developed during 1989, under which health workers were trained in ARI management and cotrimoxazole is being supplied to health worker through the CSSM drug kit.
NFHS II reports that the incidence of ARI and diarrhoea was more in the urban areas of Punjab, while fever and diarrhoea with blood was more in the rural areas. Nine out of every ten children in rural areas and all in urban areas sought treatment for ARI as against three out of every five in rural areas and three out of four in urban areas at the national level (Table 40).
Table 40Prevalence of Acute Respiratory Infection (ARI), Fever and Diarrhoea among
Percentage of children suffering in the past two weeks from:
Punjab IndiaRural Urban Rural Urban
Cough accompanied by fast breathing (ARI) 14.0 15.9 20.3 16.2Fever 25.8 2 1 . 6 29.7 28.8Any diarrhoea 9.4 1 1 . 0 19.0 19.6Diarrhoea with blood 0.7 0.4 2.9 1 . 6
Percentage with ARI taken to a health facility or provider
91.6 1 0 0 . 0 61.4 75.1

Children from families with a low standard of living suffer more from diarrhoea and those with a medium standard of living from fever. As far as the knowledge of Oral Rehydration Therapy is concerned 78.1 per cent mothers in rural and 93.3 per cent in urban areas are aware of it. The private medical sector (60.1%) is preferred rather than the public medical sector (36.9%) for procurement of ORS.
Child and adolescent health are areas of vital concern, and has very far-reaching repercussions. The School Health Check-up Programme, as a national programme, can prove to be a major success if its implementation and evaluation is a regular feature at the state level. The School Health Check-up Programme (1996) evaluation conducted in Patiala and Rupnagar districts by the Population Research Centre, CRRID, reveals differential morbidity patterns among rural and urban areas. Children in rural areas suffer from worm-infestation and pyoderma, while in the urban areas anaemia and teeth cavities are more prevalent. To provide comprehensive oral health care, the Intensive Dental Health Programme for school children, teachers and the public was launched in the state in 1989-90. Inter-linkages, developed between the health and education departments, can strengthen the programme and our concern for future development.
Adolescent health care: Adolescence is a period of turmoil and thus requires much more care. The National Population Policy 2000 has highlighted the significance of this age group and their priorities. The NFHS- 1998-99 reveals that adolescent girls (15-19 years) are most anaemic. They are likely to carry this problem into their reproductive age as well. As a result of which they could give birth to anaemic and underweight children. In fact, this becomes a life-cycle disease. Further, very positive figures of reaching targets of immunization against tetanus toxoid of children at 16 years are not available. This indicates lack of initiative among medical staff as well as the community in this area, with respect to this vulnerable section of society, particularly girls who are getting ready for motherhood. A specific programme for provision of access to information and counselling services, pertaining to their health, nutritional and reproductive needs and problems, is an urgent need for adolescents in Punjab. Age at menarche’ is a less researched area and a major determinant of the nutritional status of adolescents which calls for indepth research. Adolescent services cells could be made accessible at the primary health centres, to ensure adequate dissemination of information, optimal utilization of services available and guidance.
In all there has been considerable progress in the status of health of children in Punjab, even though scope for further improvements exist. Gender biases are evident in the kind of treatment being provided to the female child. This is an urgent area of intervention. A healthy child is the end-goal of development and thus medical and social programmes need to be considered together.
Role of medical/paramedical staff for MCH services
Centrally sponsored schemes, such as Village Health Guides, are being implemented in the state. The Ministry of Health and Family Welfare, Government of India, has discarded the sponsorship of the VHG scheme, it has been left to the state government to carry it forward if such a need is felt. The Mahila Swasthya Sangha Scheme, with women and childcare as one of its objectives, is currently being implemented in the state.
In Punjab, there are eleven multipurpose health worker (male and female) training schools, but their syllabus and education need immediate and closer attention. There is an imbalance between their education and the real need of the community. Further,

trained manpower is being underutilized by not being absorbed in the government/private medical mainstream.
A wide network of multipurpose health workers is in position in the state, but what is lacking is their qualitative utilization through enforcement, inspection and mobilization. Even though there has been progress in many economic and social spheres, basic services, such as sanitation, cleanliness, adequate water supply and hygiene- are inadequate in Punjab and these are basic requirements for keeping good health. There has been progress on many fronts; nevertheless, the profound changes called for will take some time to accomplish. Along the bumpy road of implementation, doubts about the appropriateness of some of the proposed actions are likely to surface. Yet, political will, dedication and accountability of medical and paramedical staff and the community at large can lead Punjab to success.
NUTRITION AND RELATED ISSUES
Nutrition affects development as much as development affects nutrition {National Nutrition Policy 1993). The Constitution of India, Article 47, states that the 'State shall regard the raising of the level of the nutrition and the standard of living of its people and the improvement of public health among its primary duties...’ The NNP 1993, further advocates a comprehensive, integrated and inter-sectoral strategy for alleviating the multi-faceted problem of malnutrition and achieving the optimal state of nutrition for the people. The policy includes short-term as well as long-term interventions. The direct short-term interventions include:
• Expanding the nutrition intervention net (ICDS,ORT,UIP).• Empowering mothers with nutrition and health education.• Reaching adolescent girls.• Ensuring better coverage of expectant women.• Controlling micronutrient deficiencies.• Fortifying essential foods with nutrition.• Universal coverage of iron and folic acid tablets, vitamin A and iodine deficiency
control programme.
From a food-deficit state Punjab has become a food-surplus state, thanks to the green revolution. However, the Nutrition Policy 1993 maintains that increased food production does not necessarily ensure nutrition for all. It is awareness about the 'right’ kind and 'amount’ of food intake, which determines the nutritional status of an individual. The major issues of concern about the nutritional status of the people of a state are chronic energy-deficiency and under-nutrition, chronic energy-excess and obesity, micronutrient deficiencies (anaemia, vitamin-A,, iodine and fluoride).
Nutritional Status of AdultsChronic energy-deficiency (CED) grades in adults reflect their nutritional status, and is determined by Body Mass Index (BMI), based on height and body-weight - wt (kg)/ht (mt) 2. Chronic Energy Deficiency is classified as CED-I (BMI range of 17.0 -18.5), CED-II (BMI 16-17) and CED-III (BMI <16). Low normal-status adults (BMI 18.5 -20), normal- status adults have (BMI 20-25), Obese-I (BMI 25-30) and Obese-ll (BMI>30). Little less than one-fourth of the adult population in Punjab suffer from chronic energy-deficiency, of whom a large proportion suffer from mild forms of CED. Obesity is emerging as a

major problem in Punjab, with nearly 15 per cent adults suffering from obesity, which leads to such 'major killers’ as non-insulin dependent diabetes, coronary artery diseases, cardiovascular diseases and malignancy (Table 41). The National Family Health Survey (1998-99) reported that Punjab has the highest proportion of obese women in India.
Table 41
state Area CEDIII
CEDII
CED1
CEDTotal
LowNormal
Normal NormalTotal
Obese1
ObeseII
ObeseTotal
Punjab Rural 4.1 5.2 13.7 23.0 19.0 43.2 62.2 12.2 2.6 14.8India Rural 8.6 7.8 18.2 34.6 20.9 40.5 61.4 4.1 0.7 4.1
Urban 6.8 6,1 14.7 27.7 18.4 47.9 66.3 5.4 0.6 6.0i Total 8.2 7,4 17.3 32.9 20.4 42.1 62.5 3.8 0.7 4.5
Source: India Nutrition Profile, Department of Women and Child Development, Ministry of Human Resource Development, Government of India. (1998)
One-third of the adults in Bathinda suffer from CED as against 28 per cent in Sangrur. Adults in Kapurthala, Jalandhar, Faridkot and Amritsar are reported to be relatively more obese than in the other districts (Table 42). Factors responsible are low awareness about the kind of food to consume and faulty eating habits. Thus, improvement in the situation is possible by checking food consumption patterns of the people of Punjab.
Table 42
District CEDIII
CEDII
CED1
CED(T)
Lownormal
Normal Normal(T)
OBESE1
OBESE11
OBESE(T)
Amritsar 3.1 4.3 11.9 19.3 20.4 42 62.4 14.3 4 18.3Bhatinda 6.9 6 .6 18.8 32.3 18.4 34.4 52.8 1 1 . 8 3.1 14.9Faridkot 5.2 6.4 14 25.6 15 37.9 52.9 16.9 4.6 21.5Ferozpur 5 6 14.3 25.3 20.3 40.4 60.7 11.7 2.3 14Gurdaspur 6 .6 6 16.1 28.7 2 1 . 2 38.5 59.7 1 0 .1 1.5 1 1 . 6
Hoshlarpur 0 .8 3.2 8 1 2 15.5 61.3 76.8 1 0 . 8 0.4 1 1 . 2
Jalandhar 2 .6 5.1 13.4 2 1 . 1 16.5 40.8 57.3 18.2 3.4 2 1 . 6
Kapurthala 2 .2 2 .6 10.7 15.5 15.4 45 60.4 2 0 .1 4 24.1Ludhiana 2 5.5 11.7 19.2 24.6 53.7 78.3 2.4 0.1 2.5Patiala 5.8 6.1 14.9 26.8 17 41.1 58.1 11.5 3.6 15.1Rupnagar 4.2 4.7 15.3 24.2 25.9 47.6 73.5 1.9 0.4 2.3Sangrur 6.1 6.1 16 28.2 18 35.7 53.7 14.8 3.3 18.1Punjab 4.1 5.2 13.7 23 19 43.2 62.2 1 2 . 2 2 .6 14.8Source: India Nutrition Profile, 1998, Ministry of Human Resource Development,
Department of Women and Child development, Government of India, New Delhi
Nutritional Status of Women
Maternal nutrition lays the foundation of future child-health. In Punjab, the mean height of women (154.5 cm) is the tallest among all the states in India. As compared to the other states of India the lowest number of women in Punjab (16.9%) suffer from Chronic Energy Deficiency, just after Delhi (12.0%). However, the worrisome factor is that women, susceptible to chronic energy deficiency, fall in the 15-19 age group and they are illiterate and live in rural areas. Scheduled Caste women, with a low standard of living, are more prone to such deficiencies. Among all the states in India, Punjab has the highest proportion of obese women (30.2%) just after Delhi (33.8%) (NFHS, 1998-99). This makes them prone to high-risk pregnancies.

Anthropometric data (weight and height) for children under four years are used to classify them as under-nourished. The indices used are weight for age, height for age and weight for height. The current nutritional status of children under four years in the state indicates that less than one-third (28.7%) are underweight, nearly two-fifths (39.2%) stunted in height and less than one-tenth (7.1%) are too thin or wasted (Table 43). Percentage of severe forms of underweight are 8 .8 , stunted 17.2 and too thin or wasted 0 .8 .
Table 43 Nutritional Status o f Children
state Weight for age Height for age Weight for height% below -3SD % below -
2SD^% below -3SD % below -2SD' % below -3SD % below -
2SD^
1992-93
1998-99
1992-93
1998-99
1992-93
1998-99
1992-93
1998-99
1992-93
1998-99
1992-93
1998-99
India 20.6 18 53.4 47 28.9 23 52 45.5 3.2 2.8 17.5 15.5Punjab 14.2 8.8 45.9 28.7 15.7 17.2 40 39.2 2.8 0.8 19.9 7.1Source: National Family Health Survey-1 and 2.Note : 1 Also includes the children who are below -3 Standard deviations from the International reference
population median
Though the nutritional status of children has improved since the last NFHS, conducted in1992-93, except for the height for age wherein children are more stunted than in 1992- 93. Female children were found to be more under weight, stunted and thin than male children. At the national level, more females were underweight and stunted and male children too thin or wasted. The problem was more profound in rural than in urban areas in the state as well as at the national level.
Table 44District Level Prevalence of Underweight, Stunting and Wasting among Children
District Underweig ht Stunting WastingMale Female Total Male Female Total Male Female Total
Amritsar 46.7 47.5 47.1 61.5 60.8 61.2 5.1 5 5.1Bhatinda 52.9 60.3 56.1 57.9 63 60 6.9 12.3 9.1Faridkot 49.2 46.3 47.9 63.9 53.8 59.5 1 . 6 6.5 3.8Ferozpur 52 58.5 54.8 65.6 78.2 71.3 10.7 3.8 7.6Gurdaspur 51.9 6 8 . 6 59.5 61.8 65.1 63.3 1 2 . 8 16.3 14.1Hoshiarpur 18.6 18.9 18.7 48.5 41.5 45.5 4.3 5.7 4.9Jalandhar 39.3 36.3 37.9 66.4 66.7 66.5 2.4 2.9 2 . 6
Kapurthala 38.5 35.3 37.1 58.1 59 58.5 6 7.9 6.9Ludhiana 62.9 62.7 62.8 33.4 48.1 40.9 49.4 38.5 43.9Patiala 54.9 52.2 54 60.4 41.3 54 17.6 17.4 17.5Rupnagar 87.1 78.9 83.2 74.4 50.7 63.1 32 40.8 36.3Sangrur 46.7 43.3 45.1 58.6 59.7 59.1 2.7 13.4 7.7Punjab 49.6 51 50.3 60 59.2 59.7 11.4 13.1 1 2 . 1
Source; India Nutrition Department of New Delhi
Profile, 1998, Ministry of Human Resource Development, Women and Child Development, Government of India,

Among the districts of Punjab, rural Rupnagar reported the highest percentage of undenA/eight children, while Firozpur the highest percentage of stunted (short for their ages) children and Ludhiana the maximum percentage of wasted children (Table 44).
Micronutrient Deficiencies
Anaemia: Anaemia or iron and folic acid deficiency is one of the micronutrient deficiencies, which needs constant vigil and special mention. Its consequences are very far-reaching, particularly among children. Anaemia in a child leads to impaired cognitive performance and behavioural and motor development and ultimately affects his academic performance. Anaemia also leads to reduced immunity and increased morbidity of chi ldren.NFHS-II reported that in Punjab 80.0 per cent of the children in the age group 6-35 months were anaemic of which 5.9 per cent were severely anaemic, while the corresponding percentages at the all-India level were 74.3 and 5.4 respectively. Children in the age group 24-35 months reported the highest level of anaemia (79.3%) in the state. Anaemia levels were also higher among the rural (80.9 %) and Scheduled Caste (86.1%) children in Punjab.
Anaemia among pregnant women leads to maternal mortality, risk of premature delivery and low birth-weight. In Punjab 41.4 per cent women suffer from anaemia, of whom 0.7 per cent are severely anaemic. At the national level the corresponding percentages are 52 and 1.9. A high percentage of women in the 15-19 age group are anaemic (56.0%). A higher percentage of anaemic women are illiterate (55.8%) and live in rural areas (53.9%).^^ To combat nutritional anaemia, prophylaxis distributed among pregnant women has surpassed the set target since 1980-81. However, the provision of prophylaxis against nutritional anaemia for children of 1-3 years has reached 62.3 per cent of the target set by the Directorate of Health, Government of Punjab (2000-01). There has been a continuous decline in the provision of prophylaxis against anaemia for children since 1980-81.
Subadra Seshadri (1997) 'Nutritional Anaemia in South Asia’, In Stuart Gillespie (ed.), Malnutrition in South Asia: A Regional Profile. Kathmandu: Regional Office for South Asia, UNICEF.
National Family Health Survey-2, Punjab, India 1998-9931

Maharashtra 1
Rgure 15Anaemia among Women and Children
■children t3v\^Dmen
Source; National Family Health Survey-2, Punjab, India, 1998-99
Fluoride deficiency: Prolonged intake of water containing excess fluoride causes the crippling disease called fluorosis. Prolonged ingestion manifests itself as dental, skeletal and non-skeletal fluorosis. Malnourished children, pregnant women and lactating mothers are especially vulnerable to fluorosis. In Punjab 8.9 per cent of the population are at risk (21 lakh) as against 6.9 per cent population (6 . 6 6 crore) at the national level. The INP^^ revealed that in rural Punjab there were 2.8 per cent persons suffering from
32 Mitigating Fluorosis Through Safe Drinking Water, Data sheets, UNICEF
India Nutrition Profile, Ministry of Human Resource Development, Department of Women and Child Development, Government of India, New Delhi, 1998.

dental fluorosis. Interventions include a diet rich in calcium, Vitamins C, E antioxidants.
and
Iodine deficiency: Iodine is a vital micronutrient, lodine-deficiency disorders have been identified as a public health issue and accorded importance since the mid-twenties. The National Iodine Deficiency Disorders Control Programme has concentrated on ensuring the consumption of iodized salt. NFHS-II (1998-99) reports that in Punjab three-fifths of the households use iodized salt. Scheduled Castes and persons living in rural areas with a low standard of living do not use iodized salt.
Vitamin-A deficiency: Vitamin-A deficiency can lead to blindness. Hence, its prevention and control is being carried out by administering doses of the vitamin-A to children under three years of age. Provision of Vitamin-A solution to children is a shared responsibility of the health department of the state and the ICDS staff. The achievement of Punjab’s health department on administering Vitamin-A drops to children in 1998-99 was 96.97 per cent.
Food Consumption Patterns
A study of the food consumption patterns of a community is imperative to ascertain its nutritional status. The NSSO carried out sample surveys in 1971-73 (2 /^ round), 1981 (38 round) and 1991-94 (50 '" round) to assess the consumption of calories, proteins and fats. According to these surveys, consumption of calories and proteins declined in both rural and urban areas of Punjab during 1971-1994 (Table 45). But the consumption of fats in rural Punjab increased from 50 kcal in 1971-73 to 52 kcal in 1981 and then to 59.8 kcal in 1993-94.
Table 45Per Capita Intake of Calorie, Protein and Fat per Diem in Punjab and India
Area Calorie according to Protein according to Fat according to
27thround
38thround
50thround
2 7 th
round38"'round
50thround
27thround
38‘^round
50‘ round
1972-73 1983 1993-94 1972-73 1983 1993-94
1972-73 1983 1993-94
(Kcal) (Kcal) (Kcal) (O.OGm) (O.OGmj
(O.OGm)
(O.OGm) (O.OGm)
(O.OGm)
PunjabRural 3493 2677 2418 85 79 74.7 50 52 59.8Urban 2783 2 1 0 0 2089 70 63 61.8 52 49 53.7IndiaRural 2266 2 2 2 1 2153 62 62 60.2 24 27 31.4Urban 2107 2089 2071 56 57 57.2 36 37 42Source; Sarvekshana, Volume 21, No. 2 , 7 3 ^ Issue, October-December 1997,
NSSO, Department of Statistics, Government of India, p.45
In a urban areas of Punjab, the fat intake was more or less the same during the 1972-94. A positive correlation between per capita expenditure and per capita per diem intake of calorie, protein and fats was seen in both rural and urban Punjab (NSSO 50 round,1993-94). The per capita consumption of milk is 875 grams per day in Punjab.^ In rural
Statistical Abstract of Punjab, Government of Punjab, 2000
434

Punjab the consumption of milk and its products is much higher than at the national level. Consumption of roots and tubers is higher than that of other vegetables and cereals in rural Punjab, according to the RDA.^^ Thus, the food consumption pattern has very strong social, cultural and economic dimensions.
In spite of the rich dietary pattern and availability of iron and folic acid tablets at the grassroots level, a large proportion of women and children in Punjab suffer from anaemia. Intervention exists today only for pregnant women and children up to six years of age. Inadequate institutional deliveries result in low awareness-levels among women, which indirectly affects infant-feeding practices. Faulty eating habits, type of food consumed (usually fat-rich and high-caloric), overeating and urbanism (the diet remaining unchanged despite work-culture having undergone drastic changes), can result in obesity, which, in turn, leads to various health problems. Obesity may not be perceived as a disease but it lead to hypertension, heart disease, diabetes and cancer and other chronic diseases in women. Hence it needs intervention.^®
Food consumption pattern among women: As far as the food consumption pattern of women in Punjab is concerned nearly all consume pulses or beans, green leafy vegetables and other vegetables. More than 90 per cent of them consume milk or curd,, though the consumption of fruits, eggs and chicken, meat or fish is a little low. More than two-fifths of the women (41.4%) of Punjab suffer from anaemia. Caste does not seen to determine the pattern of consumption of food. The high standard of living is reflected in increased consumption of pulses, leafy vegetables and other vegetables, roots and tubers, fruits, milk and its products and sugar.^^
Infant feeding practices: The right kind of infant feeding practices are essential for child health. To monitor nutritional deficiencies in children and to improve their nutritional status, it is necessary to explain the importance of breast-feeding to mothers. The UNICEF recommends breast-feeding immediately after birth. In Punjab six out of hundred mothers breast-feed their child within one hour of birth, while at the national level 15.8 per cent do so. Lack of awareness about the right kind of practices are evident: 87.3 per cent of the mothers in Punjab squeeze out the first milk from their breast, without any knowledge of the value of colustrum in the first milk. Less than two- fifths of the children (36.3%) in the 0-3 months are exclusively breast-fed. In Punjab, 14.2 per cent women, who had their delivery in public hospitals, started breast-feeding within six hours. Breast-feeding within six hours is prevalent among v^omen in urban areas and those belonging to middle and high standards of living.^® This again reinforces the issue of the advantages of institutional deliveries. This is one area where interventions need to be made in Punjab.
35
36
37
India Nutrition Profile, Department of Women and Child Development, MOHRD, GOI, 1998
Meena Kaila (1999) 'Health and Lifestyle- The Veritable Linkage' Health for the Millions, Vol., 25, no. 3, May-June 1999.
National Family Health Survey-2, Punjab, India 1998-99

The government has initiated the ICDS to combat malnutrition and other health problems. This scheme provides supplementary nutrition to children below six years of age and to nursing and expectant mothers. Kishori Shakti Yojana for adolescent girls was initiated in three blocks of Punjab in 1999-2000 to help adolescent girls understand and learn the significance of personal hygiene, sanitation, nutrition, first aid, health and nutrition education, family life, child care and development, etc., and to prepare for future healthy motherhood (Tenth Five Year Plan, 2002-07 and Annual Plan 2002-03, Government of PunjatD, Department of Planning). The Food and Nutrition Board has been assigned the task of formulating cost-effective recipes that could be sent to all the Anganwadi workers, who could disseminate these in the community at large.
The Public Distribution System (PDS) was initiated during the Seventh Plan to ensure food security and equitable distribution of essential goods at subsidized rates. Wheat and rice are being distributed to families below poverty level since 1998-99. The distribution of such essential commodities as wheat flour, rice, levy sugar through fair price shops decreased in 1999-2000 as compared to 1998-99, due to the narrowing of the price-difference gap between the PDS and the market.^® The state has a network of 14,787 fair price shops as in March 2001.'*°
Prophylaxis against nutritional deficiencies of iron and vitamin-A is provided through the Directorate of Health and Family Welfare and the partly through the ICDS. Iodine deficiency is being monitored by the iodine deficiency cell and by marketing iodized salt.
DISABLED POPULATION
Disability is an impairment, which makes an individual incapable of performing an activity as per the desired norms of normal individuals. Disabled persons are also termed as handicapped, challenged, invalid or sick. Disability not only leaves a deep impact on the psychological state of an individual- but also has very intense social and economic implications associated with it. The disabled have to be given equal rights with the rest of the people. Schemes for them should be such as to enable them play a productive role in the development of the state.
This empathetic view has been evident among the planners right from the Second Five Year Plan onwards. Special allocations have been made for the disabled population in the Five Year Plans for the country as well as for the state. The Sixth Five Year Plan (1980-85) allocated special scholarships ranging from Rs 15 to Rs. 100 per month for persons in the 6-30 years age group who were orthopaedically handicapped, or were deaf and dumb, or blind, and whose parents’ or guardians’ income was less than Rs 500 per month. A new scheme, Assistance to Disabled Persons- was introduced in the Seventh Plan (1985-90), which further strengthened the existing scheme by providing Rs. 50 per month per beneficiary. Subsequently it was during the Ninth Plan (1997-02) that disabled persons in the age group 16-55 years, who had no means of sustaining themselves, were given an amount of Rs 200 per month each.
39 Economic Survey of Punjab, 2000-2001.
Economic Survey of Punjab, 2001-2002.
436

The 1981 Census had collected information on the disabled population of India, which revealed that 1.2 persons per 1,000 population were disabled in Punjab as against 1.7 at the national level (Table 46). The 1991 Census did not collect any information on the disabled. The 2001 Census has made an endeavour once again to collect such information but the data are still awaited. The Persons With Disability Act 1995 has been introduced since 1 February 1996 to provide social security to the disabled persons. The Act envisages all-round welfare of disabled persons by providing them jobs, right to better living, rehabilitation services and also ensure that they have full protection of their rights and representation at all levels.
Prevalence of disability in Punjab; Figures reveal that Punjab with 1.2 persons per 1,000 population disabled was ranked 28 *", while the neighboring state of Himachal Pradesh with a figure of 2.6 was ranked sixth as against the national figure of 1.7 according to the 1981 Census.
Table 46______________ _____________ Disability In Punjab and India__________1 State/Country Num ber o f disabled
per 1000 populationTotally blind j Totally crippled
1I
Totally dumb |j
i Punjab 1.176 46.81 33.05 20.14i Rural 1.376 47.77 32.29 19.94 1I Urban 0.644 41.32 37.40 21.28 1
India 1.709 42.78 32.49 24,73 i1 Rural 1.933 1 43.77 31.43 1 24.80! Urban 0.977 i! 36.34 39.43 1I 24.23 1
Source; Census of India. 1981, The Physically Handicapped, Report & Tables.India, Part Vll-B.
Senes-1,
The proportion of totally blind among the disabled was higher (48%) than the totally crippled (32%) and totally dumb (19.9%) in the rural areas of Punjab. This was true for urban areas as well. At the district level, in Patiala and Rupnagar, two out of every five disabled were blind as against three out of every five in Kapurthala (Table 47),
Table 47
i District PercentBlind
PercentCnppled
Percent i ! Dumb i
1 G urdaspur 42.33 32.76 ! 24.911 Am ritsar 46.86 33.89 19.24 Ij Firozpur 44.21 34.39 21.40 ;
Ludhiana 44.39 34.25 21.36Jalandhar 52.41 27.18 20.41Kapurthala 59.68 25.77 14.55Hoshiarpur 45.32 28.20 25.26 1Rupnagar 41.33 31.34 27.32Patiala 41.29 34.48 24.23Sangrur 50.26 34.57 15.17Bhatinda 49.80 33.02 17.18Fandkot 46.29 40.18 13.53
! Punjab 46.80 33.05 20.13 iSource: The Physically Handicapped, Report & Tables. Census of India. 1981, Series-1,
India, Part Vll-B.
Measures to control trachoma began from the Fourth Five Year Plan (1969-74) onwards, when it was proposed that the Trachoma Control Programme would be started in Punjab on the recommendation of an ICMR study which had reported that 80 per cent of the

disabled suffered from trachoma in the state. Measures at the state level achieved 90.1 per cent of the target for administering prophylaxis against blindness due to Vitamin-A deficiency in 1982-83 {Year Book, 1983-84). This went up to 97 per cent in 1998-99 (Department of Health, Government of Punjab). Cataract surgery to combat blindness had been consistently exceeding the target between 1984 and 1997. An inter-state comparison shows that Punjab tops the list in the percentage of cataract operations conducted. Likewise, cataract surgery rate per lakh population has also been the highest in Punjab {Health Information: Punjab (1991) and India (1997 and 1998).
The proportion of disabled population in rural Punjab was the highest among all the states of India as reported by the 36‘ and 47th rounds of National Sample Survey. It was among the top five states in the number of disabled in urban areas. The NSSO 1991 data reveal that hearing, speech and locomotor disabilities were prevalent more among males in both rural and urban areas of the state, while the proportion of blind females was more in urban Punjab.
During 1999-2000, the Department of Health and Family Welfare, Punjab Government, carried out a door-to-door survey to ascertain the exact number of disabled persons in all the districts of Punjab, it was found that of the total population of the state 1.1 per cent were disabled, 0.1 per cent mentally handicapped, 0.23 per cent visually handicapped (low and blind), 0.10 per cent hearing and speech handicapped and 0.61 per cent suffered from locomotor disability (Table 48). The National Sample Survey (1983 & 1994) has confirmed these findings on locomotor disability, particularly among males and in rural Punjab. The National Family Health Survey (1992-93) too has confirmed the findings that locomotor disability was the highest among males in rural Punjab. Thus, a need to formulate more effective strategies to cope with locomotor disability is imperative.
Table 48
District MentallyHandicapped
Blindness Hearing & Speech
Locom otor Total
Am ritsar 0.30 0.56 0.18 0.42 1.48Bathinda 0.18 0.39 0.08 0.48 1.15Fatehgarh Sahib 0.07 0.14 0.17 0.79 1.19Faridkot 0.02 0.03 0.02 0.56 0.64Ferozpur 0.00 0.00 0.00 0.36 0.36G urdaspur 0.01 0.00 0.01 0.34 0.37Hoshiarpur 0.01 0.10 0.00 0.02 0.15Jalandhar 0.03 0.05 0.03 0.32 0.44Kapurthala 0.07 0.35 0.11 3.29 3.82Ludhiana 0.10 0.20 0.21 0.77 1.30Mansa 0.24 0.95 0.50 1.21 2.92Moga 0.06 0.14 0.08 1.06 1.36M uktsar 0.11 0.74 0.20 0.66 1.72N awanshahr 0.03 0.05 0.02 0.45 0.57Patiala 0.09 0.10 0.07 0.80 1.03Rupnagar 0.05 0.03 0.05 0.32 0.47Sangrur 0.09 0.33 0.08 0.51 1.02Punjab 0.09 0.23 0.10 0.61 1.05
Source: Departm ent o f Social Security and W omen and Children W elfare, G overnm ent ofPunjab (1999-2000)
District-wise state of disability reveals that Amritsar has the highest percentage of persons suffering from mental disability. It has the only mental hospital in Punjab, opened in 1947. Mansa district reported the highest number of visually and hearing/speech disabled persons (Table 48). Kapurthala district reported the highest percentage of locomotor disability. There are a number of voluntary organizations and NGOs working for the welfare of the disabled in different districts of Punjab, but none of them is listed from Mansa with the Department of Social Welfare, Punjab.
Government Initiatives
Schemes being implemented in Punjab for the disabled include assistance for educational support materials, disability pensions, grant to government institutions, transport subsidies and miscellaneous expenses. According to the guidelines of the Government of India, the Red Cross Society, Rupnagar, has been declared as the state resource centre (SRC) for the purpose of implementation of the National Programme for Rehabilitation of Persons with Disabilities Scheme. Aid and distribution of appliances to patients suffering from different type of disabilities is being undertaken through the District Disability Rehabilitation Centres at Patiala, Ferozpur and Sangrur districts of Punjab
In addition, the Ministry of Social Justice & Empowerment, Government of India, has sanctioned the National Programme for Rehabilitation of Persons with Disabilities in districts Rupnagar and Sangrur. It aims to provide comprehensive services, which include prevention and early intervention by providing medical care, aids and appliances, education, non-vocational and vocational training, economic rehabilitation and integration of persons with disabilities in rural areas in the society. The Ministry of Social Justice & Empowerment, Government of India, has sanctioned a Regional Spinal Injuries Centre in Punjab.
The National Mental Health Programme was initiated in 1982 in an effort to help the mentally challenged population in the state. There have been continuing efforts through the Five Year Plans to upgrade the Mental Hospital at Amritsar. Efforts to take care of the mentally disabled, according to the Mental Health Act, 1987, are the thrust areas of the Tenth Five Year Plan in Punjab too.
The National Programme for the control of blindness was launched as a 100 per cent centrally sponsored programme in 1976, addressed to nutritional blindness due to vitamin-A deficiency and cataract-related blindness. This programme has been carried forward in the same spirit by the Health Department and with due support from private, voluntary and NGO sectors. The Government, Lions and Rotary Clubs and Medical Colleges, such as CMC, Ludhiana, organize free eye camps to conduct eye check-ups and perform cataract operations.
There are 30 homes/schools for blind, deaf and dumb and mentally retarded persons in Punjab run by the state government and NGOs. In all, 33 voluntary organizations are working for the welfare of the handicapped under the PWD Act 1995 (Department of Social Welfare, Government of Punjab). The role of NGOs, especially in performing cataract operations in the state is an encouraging sign.

To understand the specific healtin needs of Punjab, and to improve its health status, in- depth interviews were conducted with some of the Civil Surgeons, District Immunization Officers, District Family Welfare Officers and District Health Officers. A few suggestions that emerged from the discussion are as follows:
• Most of the health care providers feel that the existing infrastructure is sufficient to provide the best of MCH and EPI services. What is lacking is the work culture. Often there is no accountability for failures. The reason for non-performance is lack of political and administrative will. Strict action should e taken against the defaulters to curb such practices as absenteeism. Usually, if a case is reported, politicians hush it up.
• Political interference in postings, internal adjustments and deputations should be eliminated, so that every medical person is put to maximum use. Mismatching of posts should be ended and persons placed in their proper field, e.g., posting a pharmacist in place of a staff nurse leads to bad precedence and inefficiency.
• In many instances, sophisticated equipment and machinery are not put to proper use and at times not even installed. Rationalizing postings of specialist doctors would help in proper utilization of sophisticated equipment and provide job satisfaction.
• In order to reduce the financial burden of the state government, it has been suggested that all diagnostic facilities, such as laboratory tests, X-rays, MRI, EGG, should be handled by the private sector at government-approved rates. This will also result in the co-ordination of the two sectors. Recently, Punjab
^ Health Systems Corporation has opened its doors to the private sector and has come out with a novel experiment to engage medical officers, anesthetist, gynecologists, radiologist, staff nurses and Auxiliary Nurse Midwifes (ANMs) on a contract basis to handle emergencies. The success of this model is yet to be assured.
• With the mushroom growth of small nursing homes, often with a husband wife team, malpractices such as referrals, unnecessary diagnosis, fee-splitting, have started in most of the districts in Punjab. It is overwhelmingly believed that most of these nursing homes are fleecing the poor patients, in this regard, it is strongly felt that the Nursing Home Registration Act should come into force with immediate effect. Government should also be empowered to monitor the functioning of all these institutions.
• In order to improve institutional deliveries in the state, it is emphasized that all the staff nurses, lady health visitors, and multipurpose health workers must stay at places of their postings and be available for deliveries. There is need to provide 24 hours specialists, services at the first referral units (FRU), to enhance institutional deliveries, emergencies, obstetric services, and emergency neonatal services. Availability of comfortable residential premises to the medical/paramedical staff would enhance the delivery of quality health services to the community at large.
• Often lack of medicine supply is attributed to insufficient clinical services. Such medicines should be provided in plenty to strengthen the curative services. Supervision in the field should be strengthened. For this purpose, additional drivers, vehicles and provisions for additional expenses on POL should be permitted.

Optimizing the existing rural health infrastructure in the state is a major challenge. Current vertical intervention programmes like TB, Malaria, or special programmes for STD and AIDs management should be brought under primary health care, in order to stop the lopsided management of health problems.Since different districts have different problems, district health plans would be useful for decentralized planning.
CONCLUSIONS
Development of the health sector in India during the last 50 years has been ‘through planning special programmes for discreet interventions and then “integrating” them into packages...Practice of the concept of integration of preventive, promotive and curative services in this manner has been one of the major causes for the failure of the health care s y s t e m . S u c h attempts at integration have resulted in widening disparities between the demand and supply of health services. Primary health care, particularly in rural areas, has been focusing largely on preventive aspects of health care, such as family planning, immunization, and malaria surveillance work and ignoring the curative aspects.
During the different five-year plans and annual plans, the focus of Punjab Government has largely remained on strengthening the health infrastructure in the form of buildings, machinery, equipment and manpower for primary health care. The state has not made efforts to establish a strong health-management information system, which is extremely important for setting need-based priorities. Moreover, the state has not made enough efforts to establish referral linkages, management of life-style diseases, such as diabetes, cancer and cardiovascular diseases, regulate private health care services, and to involve the voluntary sector in different health programmes.
There seems to be a strong preference in the state for availing treatment from the private sector, in both rural and urban areas. The main factors helping the growth of the private sector are availability of medical facilities at all hours, specialized skills and technology, experience and promotional efforts. Despite the higher cost of establishment, the private sector in Punjab is posing a challenge to the public sector by providing services at par with it for non-hospitalized illness episodes and at a slightly higher cost for hospitalized illness episodes. The cost of treatment in the private sector is much cheaper in Punjab than in India. Less people in Punjab prefer to obtain free treatment in government or private/voluntary hospitals than in the rest of India. It is felt that the unregulated growth of the private sector has resulted in widening disparities in affordability, and such malpractices as mushrooming growth of diagnostic facilities, fee- splitting practices, etc.
Despite the quantitative increase in health institutions in Punjab, the status of antenatal, natal and post-natal cares remains inadequate. The state has a small number of institutional deliveries, resulting in higher still-births and infant mortality and low breastfeeding practices. There is a rise in the number of caesarian section deliveries, particularly in urban areas of the state. Problems related to menarche, menopause and infertility are neglected areas. The nutritional status of women and children in Punjab reveals high anaemia and obesity levels. As far as the disability patterns are concerned,
Ritu Priya, ‘Dubious Package Deal; Health Care in Eighth Plan’, Economic and Political Weekly, August 18, 1990, p. 1820

locomotor disability among males in Punjab is a matter of concern. Despite the fact that women-centered health programmes in the state have been able to provide health services, their dependence on others for seeking secondary health services is a matter of concern for the future.
VISION AND STRATEGIES FOR FUTURE
Morbidity is inevitable and health-care facilities are its natural concomitant. When a person visits a health care facility, he is already in distress. He looks forward to a system of health care that responds quickly to his needs and reduces his physical, financial and mental pressure. The vision of Punjab, as we foresee, goes a step further than the Government of India’s goal of ‘Health for AH’. A distinct vision of health aspires for a generally healthy population, free from the Impact of communicable and non- communicable diseases, with client friendly manpower in health and family welfare centres. Besides the continuation of the usual preventive health care measures, the state must ensure provisions for the availability of quality health care services (including secondary and tertiary health care services) to everyone, including the underprivileged. The health care system of the future should be more scientific and technologically advanced. Better health care services in future are envisaged, with the introduction of selected health sector reforms, such as integration of public and private sectors, formulation of rules for regulating the private sector, introduction of sustainable approaches towards treatment and cure for communicable diseases, particularly HIV/AIDS, and a viable health insurance policy. We also look forward to immediate state interventions in the form of setting up special clinics for the welfare of the vulnerable sections (children, adolescents, women, and the elderly), and bringing about an attitudinal and behavioural change in the removal of existing socio-cultural practices, particularly attached to the reproductive health of women. Revitalizing the existing health care institutions through reforms in governance (with greater involvement of Panchayati Raj Institutions and urban local bodies), and provision of additional funding on a self-sustainable basis (levying of user charges in consultation with the representatives of PRIs and ULBs) would help us come out of administrative problems and resource crunch. We also foresee a greater inter-sectoral and inter-departmental coordination, which would not only ensure effective and optimal utilization of existing and future health care programmes, but also result in an increased public awareness towards healthy practices. Periodic assessment of health problems and needs of the state is expected as an essential prerequisite for assessing future requirements. To achieve the above, the following policy interventions are suggested:
1. The first priority for Punjab is to have a State Health Policy, clearly listing out future health care requirements. The state is likely to face newer morbidity patterns emerging, because of rising population, in-migration, urbanization and industrialization.
2. The existing number of medical institutions in the state is sufficient to meet the needs of the people, but they have to be brought to a reasonable norm of efficient functioning. Such shortcomings as inadequate para-medical staff, buildings and equipments must be overcome. It is oven/vhelmingly felt that with rising urbanization, impetus needs to be given to secondary and tertiary care hospitals, growth of which has not kept pace with the changing times and changing disease patterns.
3. Focused attention needs to be given to curative aspects of health care, particularly in a state like Punjab where the share of the number of cases treated in the public sector has gone down considerably. Strengthening the existing

public health services and widening their network through the involvement of private practitioners, voluntary non-governmental organizations and research institutions would improve the health care services in the state. Trained manpower from different multipurpose health worker’s schools (on a contractual or voluntary basis) in the state could be utilized to promote health care at the grassroots.
4. In tune with the objectives of NHP-2002, convergence of all national programmes on health, such as malaria, tuberculosis, HIV/AIDS, RCH and universal immunization programme, under the management of autonomous bodies for overall implementation, is desirable in the state. Effective implementation by such bodies would not only reduce the proportion of communicable and non- communicable diseases in the state but also reduce the burden of the state government to enable it to plan alternative strategies.
5. Special strategies need to be planned for such districts as Amritsar, Ludhiana, Patiala, Jalandhar and Nawanshahar, which have reported a higher number of HIV positive cases in the state. The present Voluntary Counselling and Testing Centres (VCTC) for HIV/AIDS testing in three medical colleges/hospitals, i.e., Faridkot, Patiala and Amritsar, are grossly inadequate. Such testing facilities should be made available at all Civil Hospitals.
6. It is very important that professional medical bodies and the Government of Punjab evolve some rules and regulations and develop appropriate strategies to regulate the private sector. It is important to have directives on the manufactuhng, sale, quality and prescription of pharmaceutical drugs on the one hand, and medical and clinical practices, including license to practice, basic code of conduct, negligence and consumer complaint on the other. The rating of private clinics, nursing homes and hospitals based on physical facilities, manpower, equipment and technology would be useful.
7. With the rising medical bosts, there arises the question of the available financing options. Hospitalized treatment in both the public and private sectors is very expensive and leads to loss of life-long savings, leaving no money for future social security. It is suggested that the Punjab Government should work out modalities for a viable health insurance policy to meet rising health costs in public and private sectors.
8. Decentralization of powers to Panchayati Raj Institutions (PRIs) in Punjab, according to the 73'" Amendment of the Constitution, to identify their area- specific priorities, develop programmes and mobilize resources, is an obvious measure. This would not only revitalize the faith of the community in their chosen leaders, but also ensure effective administration (accountability, transparency and efficiency) of health services. Imparting training and sensitization of elected PRI representatives on women’s and children’s issues is important.
9. Special clinics should be established in each district to deal with problems related to menarche, menopause, reproductive health and infertility in the state.
10. A nutritional awareness programme is suggested, on the pattern of the school health check-up programme. Agro-processing industrial units in the state should be encouraged to produce micronutrient-fortified food items.
11. Special emphasis needs to be given to preventive measures, such as vaccination against communicable diseases and identification of high-risk pregnancies to detect deformities and disabilities. Impact of urbanization brings along with it mental stresses and strains. Efficient strategies need to be evolved to combat life-stresses, which lead to accidents, burns and suicides. More trauma wards need to be established in Punjab to meet such eventualities. Mental health specialists at each hospital can play a vital role in maintaining and upgrading the state of mental health of the people of Punjab. Guidance on nuthtional Jntake of

food to prevent delciency-induced disabilities needs to be spread. Government should make infastructural changes to make the life of the disabled convenient. Work places transportation, traffic signals and roads have to be made more handicapped-friencly.
12. A number of prmary studies should also be undertaken, through autonomous research insttutons, to assess the health needs of the state.
13. Last but not the least, a proper computerized health-management information system shoud be developed for immediate access to information on health and other such irdicators as nutrition and disability at the grassroots level. This will largely hep h planning area-specific and need-based policies and programmes in future.
A few concerns, whchare outside the domain of this chapter, but constitute an integral part of the health/ gro/vth of the human mind and body are environment and occupational health adequate availability of drinking water, hygienic living conditions, nutritious food, remDval cf drug addiction and other health hazards. Excessive use of alcohol is a deterrent to gowth, particularly in an agrarian society like Punjab. The state has to design the future of next generation by ensuring minimization of alcoholism and drug addiction. We visualize the need of extending the scope of interconnectivity and interdependence o the state within the region to ensure a disease free, and an environmentally clean society.
References
Bhat, Ramesh ('9S9), ‘Characteristics of Private Medical Practice in India: A Provider Perspective’, Hsat.h Polny and Planning, Volume 14 (1), Oxford University Press, p. 26-37.
Bir, T. (2000), ‘User Charts: A Policy Option for Health Service Development in Developing Countries like hdia’. Health and Population: Perspectives and Issues, 23(2): 71-84, 2000.
Brugha, Ruairi ard Zwi Anthony (1998), ‘Improving the Quality of Private Sector Delivery of Public Health Senices: Challenges and Strategies’, Health Policy and Planning, 13 (2), 107-120.
Caldwell, et al , ‘What vveKnow about Health Transition, the Cultural, Social and Behavioural Determinants of Heath’ Health Transition Series, Vol 1 and 2, The Australian National University Printing Service for the Health Transition Centre, National Centre for Epidemiology and Population Health, The Australian National University, Canberra, Australia.
Census of India The Ph/sically Handicapped, Report & Tables, 1981. Series-1, India, Part Vll-B.
Central Bureau o' Healh htelligence. Directorate General of Health Services, Ministry of Health and Family Welfa'e, Go/enment of India, New Delhi, Health Infornriation of India (various issues),
Central Bureau o' Healti Intelligence (CBHI), Ministry of Health and Family Welfare, Government of India (1998', Heath Map of India.
Chatterjee, Meera (1985), mplementing Health Policy, Manohar Publication, New Delhi.
Department cf Woner aid Child Development, Ministry of Human Resource Development, Government cf Irdie, Irdia Nutrition Profile, 1998
Department o Planninc, Government of Punjab Annual Plan (various issues), Chandigarh.

Directorate General of Health Services, Ministry of Health and Ftmiy Welare, Government of India, Bulletin on Rural Health Statistics in India, June 2000.
Duggal, Ravi (2000), The Private Health Sector in India: Nature, Tnncs and a Critique, Voluntary Health Association of India, New Delhi.
Dutt, P.R., Primary Health Care, Rural Communities, Vol. 1 (1993),Gaidhigram Institute of Rural Health and Family Welfare Trust, Tamilnadu, India.
Economic and Statistical Organization, Government of Punjat, tatstical Abstracts of Punjab (various issues)
Economic and Statistical Organisation, Government of Punjcb, Ecmcmic Survey of Punjab (various Issues)
Elamon, Joy (1998), ‘Gender Differentials in Child Immunization: AStidyB^ed on NFHS Data’, Journal of Family Welfare, Vol. 44, No. 3, September 1998.
Gerard, Russo (1994), The Role of the Private Sector in Health eA/ces.‘ Lessons for ASEAN, reprinted report No. 308, East West Centre, Honolulu, Hawaii, USA
Indian Institute of Education, ‘Health for All: An Alternative Strategy, f^pcrt of a Study Group set up jointly by the Indian Council of Social Science Research and he Inciar Council of Medical Research.
International Institute for Population Sciences and Macro ORC, Naional Fan ily Health Survey-2, India 1998-99.International Institute for Population Sciences, Mumbai (1998-9^ Listiict Household Survey: Reproductive and Child Health Survey.
Janovsky, Katja (1995), Health Policy and Systems Developnett, Xn Agsnda for Research, World Health Organisation, Geneva.
Kaila, Meena (1999) ‘Health and lifestyle -- The Veritable Linkage l-balh hr the Millions, Vol., 25, no. 3, May-June 1999.
Krishan, Gopal (1997), ‘Spatial Contrasts in Socio-Demographic Profiles of India’, Population Geography, Volume, 19, No.,1 & 2, June-December 1997.
Ministry of Health and Family Welfare, Government of incia. New Delhi Family Welfare Programme in India, Year Book (various issues).
Ministry of Health and Family Welfare, Government of India, New Delhi 'Annual Reports' (various issues)
Ministry of Health and Family Welfare, Government of India, NewDehi (20)2), National Health Policy 2002.
Murali Indira, Bir T. and Kumar Rajesh, Training Course on Healtl Policy (^search (December 20-24, 1999), National Institute of Health and Family Welfare, New Delhi.
Nanda, A.K., Aggarwal, R.K., Sharma, P.K., Parthi, K., Sharma S and Wunjial, M. ‘Special School Health Check-up Scheme for Primary Schools in Punjab: InpaDt Evaluation in Rupnagar and Patiala District’ Population Research Centre (PRC), Centre fo' Fesearch in Rural and Industrial Development, Chandigarh (October 1998), 53 p.
National Commission on Population, District-wise Social Economic Demographic Indicators, New Delhi, 11 July 2001.

National Council of Applied Econonnic Research (NCAER), New Delhi, Household Survey of Medical Care (May-June 1990), June 1992, 52 p.
National Council of Applied Economic Research (NCAER), New Delhi, (March 1995), Household Survey of Health Care Utilization and Expenditure, 95 p.
National Institute of Health and Family Welfare, New Delhi (December 2000), Development of Health Insurance in India: Current Status and Future Directions, Report of Seminar held on 29-30 December 2000, 46 p.
National Sample Survey Organisation (NSSO), Department of Statistics, Government of India, San/ekshana, Volume IV, No. 1& 2, 1980.
National Sample Survey Organisation (NSSO), Morbidity and Utilization of Medical Sen/ices (42" Round), July 1986-June 1987.
National Sample Survey Organisation (NSSO), (50'* round), Department of Statistics, Government of India, San/ekshana, October-December, 1997.
National Sample Survey Organisation, Department of Statistics, Government of India, Maternity and Child Health Care, NSS 42" round (July 1986-June 1987) in Sarvekshana, issue no. 47, Vol. XIV (April-June, 1991)
National Sample Survey Organisation (NSSO), Department of Statistics, Government of India, Morbidity and Treatment of Ailments (52"^ round), July 1995-June 1996, Department of Statistics, Government of India, Sarvekshana, November 1998.
National Sample Survey Organisation, Department of Statistics, Government of India, Maternal and Child Health Care in India, National Sample Survey, 52" round, July 1995-June 1996, December 1998.
Peabody, John W. et. al : ‘Policy and Health: Implications for Development in Asia’, Cambridge University Press.
Pedagaonkar, S.L., ‘Health Services in Maharashtra; A study of growth and inequality’. Margin (special issue), January-March 1993, Part II.
Peter, Pritchand (1981), ‘Manual of Primary Health Care: Its Nature and Organization’, Second Edition, Oxford University in Press.
Planning Board, Government of Punjab, Five Year Plan Documents’ (various documents).
Planning Commission, Government of India, Five Year Plan Documents’ (various documents).
Population Reference Bureau (PRB) ‘World Population Future’, Population Bulletins (various issues).
Priya, Ritu, ‘Dubious Package Deal: Health Care in Eighth Plan’, Economic and Political Weekly, 18 August, 1990, p. 1820.
Raina B L (1988) ‘Population Policy’, B.R. Publishing Corporation, Delhi.
Rajaraman, Indira, Mukhopadhyay, Hiranya and Amarnath, HK (1999), State Fiscal Studies: Punjab, National Institute of Public Finance and Policy, New Delhi. (1999)
Registrar General of India, Population Projections for India and States 1996-2016, New Delhi.

Registrar General of India (1997), Sample Registration System Statistical Report, New Delhi.
Registrar General of India (1998), Sample Registration System Statistical Report, New Delhi.
Registrar General of India, Sun/ey of Causes of Death (Rural), (various issues).
Seshadri.Subadr.'a (1997) ‘Nutritional Anaemia in South Asia’, in Stuart Gillespie (ed.)’. Malnutrition in South Asia: A Regional Profile, Khatmandu, Regional Office for South Asia, UNICEF
Shariff, Abusaleh (October 1995), Health Transition in India, Working Paper No. 57, National Council of Applied Economic Research, New Delhi.
UNICEF Data Sheets on mitigating fluorosis through safe drinking water
World Bank, A Vlision for India’s Health System, Report of Conference held on 15-16 November 2001, New Delhi,, downloaded from internet.
World Health Organisation (1977), Health Needs of Society: A Challenge for Medical Education, edited by Gellhoirn, A., Fulop, T. and Bankowski, Z., Council for International Organizations of Medical Sciences (C.1.0.M.S.), Geneva.
World Health Organisation (1978), Primary Health Care:, Report of the international Conference on Primary Health Care, Alma Ata, USSR, 6-12 September 1978.
World Health Orgianisation, The World Health Reports (various issues).

EDUCATION
Education is a core sector for achieving the objective of employment, human resource development and bringing about much needed change in social environment, leading to overall progress through efficient use of resources. An appropriate education system cultivates knowledge, skill, positive attitude, awareness and sense of responsibility towards rights and duties and imparts inner strength to face oppression, humiliation and inequality. {Ninth Five Year Plan, 1997-2002)
Education, being a vast subject, the present chapter has been divided into different parts. There is a section on literacy followed by an overview of a school education and higher education in Punjab. Effort has, however, been made to retain the linkages between the different sections wherever possible.
LITERACYA person who is able to read and write with understanding in any language is recorded as literate. Literacy is the best possible barometer to judge the level of educational awakening in a state, leading to a minimum capacity for self-learning. In Punjab, the literacy rate has been rising. It was 58.51 per cent in 1991 and increased to 69.95 per cent in 2001, an increase of 11.44 per cent points during the fast 10 years.
Table 1Literacy Rate, Punjab (1991-2001)
Years Rural Urban Total Male Female1991 52.77 72.08 58.51 65.66 50.412001 65.16 79.13 69.95 75.63 63.55
Source: Census of India (Punjab), 1991-2001Note: Literacy rate have been worked out by excluding 0- 6 age-group
Punjab has fared well in reducing the gap between male and female literacy, which decreased from 15.25 per cent in 1991 to 12.08 per cent in 2001. Male literacy rate increased from 65.66 per cent in 1991 to 75.63 per cent in 2001 and female literacy rate from 50.4 per cent to 63.55 per cent. Female literacy rate has increased by 13.14 per cent points and male literacy by only 9.97 per cent points during the last decade. Female literacy rate in Punjab is also considerably higher than that of India where 54.16 per cent of the females are literate.
According to the 2001 Census, rural literacy rate is 65.16 per cent and urban 79.13 per cent signifying that the gap is not very wide. There has tieen a reduction in the rural- urban literacy gap, from 19.31 per cent points in 1991 to 13.97 per cent points in 2001. In spite of these positive trends, there are still 94.35 lakh (including 0-6 population) illiterate in the state {Census o f India, 2001). It is also a matter of great concern that in spite of having improved its literacy rate figure, the rank of Punjab went down from the 12'^ position in 1971 to the 16 in 2001, when compared to other states and UTs in India. At present, Kerala has the highest literacy rate of 90.92 per cent while Bihar has the lowest of 47.53 per cent.

States/UTs Literacy Rate Rank by Literacy RateIndia 65.38Kerala 90.92 1Mizoram 88.49 2Lakshadweep 87.52 3Goa 82.32 4Delhi 81.82 5Chandigarh 81.76 6Pondicherry 81.49 7Andaman & Nicobar island 81.18 8Daman & Diu 81.09 9Maharashtra 77.27 10Himachal Prudish 77.13 11Tripura 73.66 12Tamil Nadu 73.47 13Uttaranchal 72.28 14Gujarat 69.97 15Punjab 69.95 16Sikkim 69.68 17West Bengal 69.22 18Manipur 68.87 19Haryana 68.59 20Nagaland 67.11 21Karnataka 67.04 22Chhatisgarh 65.18 23Assam 64.28 24Madhya Prudish 64.11 25Orissa 63.61 26Meghalaya 63.31 27Andhra Prudish 61.11 28Rajasthan 61.03 29Dadra & Nagar Haveli 60.03 30Uttar Prudish 57.36 31Aruncahal Prudish 54.74 32Jammu & Kashmir 54.46 33Jharkhand 54.13 34Bihar 47.53 35
Source: Census of India, 2001Note: The literacy rate pertains to percentage of total literates to total population
excluding 0-6 population
Further, within Punjab, district-wise data reveal wide disparity in literacy rates.
AAQ

Table 3Total Literacy and Female Literacy by Districts of Punjab, 2001
District Literacy Rate Female LiteracyPunjab 69.95 63.55Hoshiarpur 81.40 75.56Rupnagar 78.49 71.74Jalandhar 77.91 72.93Nawanshahr 76.86 69.52Ludhiana 76.54 72.11Gurdaspur 74.19 67.31Fatehgarh Sahib 74.10 68.60Kapurthala 73.56 67.90Patiala 69.96 62.94Amritsar 67.85 61.41Moga 63.94 58.96Faridkot 63.34 57.09Bathinda 61.51 53.76Firozepur 61.42 52.33Sangrur 60.04 53.29Muktsar 58.67 50.59Mansa 52.50 45.07
Source: Census of India (Punjab), 2001
Table 3 shows that Hoshiarpur district is the most literate in the state, with a literacy rate of 81.40 per cent, followed by Rupnagar (78.49%), Jalandhar (77.91%), Nawanshahr (76.86%) and Ludhiana (76.54%). All these districts have atleast three-fourths of their population literate. On the other hand, Muktsar has a literate population of only 58.67 per cent and Mansa at the bottom only a little over one-half (52.50%). The major reason for high literacy in the Doaba region is that educational facilities started early in this area. The per square availability of primary schools is the highest in Hoshiarpur district. The high literacy rate is also the outcome of the culture and nature of work of the people in the Doaba region. The economy in this area is largely dependent on the service sector rather than primary sector.
Female literacy rate in Punjab is 63.5 per cent. It is the highest in Hoshiarpur (75.56%), the lowest in Mansa (45.07%) and just above the midway mark in Muktsar (50.5%) and Ferozepur (52.33%). Further, there are nine districts in Punjab with a lower female literacy rate than the state average. The literacy rate of the Scheduled Castes is even more dismal.
Table 4
Population No. of Literates Literacy % ageTotal (SC + Non SC) 16975724 9932116 58.51Male 9014582 5919225 65.66Female 7961142 4012891 50.41SC PopulationTotal 4661746 1915554 41.09Male 2495749 1243394 49.8Female 2165997 672160 31.03Non-SC PopulationTotal 12313978 8016562 65.10Male 6518833 4675831 71.7Female 5795145 3340731 57.6
Source: Census of India (Punjab), 1991Note: Literates have been worked out from total population, excluding 0-6 age-group

The literacy rate of the non-Scheduled Castes is quite high (65.10%) as compared to the Scheduled Castes (41.09%). The female literacy rate of the non-Scheduled Castes (57.6%) is almost double than that of the Scheduled Caste women (31.03%). Hence, it is obvious that the total literacy percentage of the state has been adversely affected by the Scheduled Caste population. The literacy rate of Scheduled Caste women is really pathetic in the pockets of Bathinda (12.84%), Faridkot (15.78%), Ferozepur (15.09%) and Sangrur (17.02%).
Government should, therefore, give priority consideration to improve the literacy rate of the Scheduled Castes and especially females in the identified pockets.
Adult Literacy
The adult education programme was being run under 100 per cent Centrally sponsored Rural Functional Literacy Programme and Social Education Scheme until the beginning of the nineties. After the abolition of these schemes in June 1991, the adult education programme remained neglected in the state for two to three years. It was again revived by NLMA and given a new name, Total Literacy/Post Literacy Programme.
Table 5
1971 1981 1991 1998Male 44.64 51.08 61.29 70.0Female 24.19 32.81 43.39 55.0Total 35.22 42.57 52.90 63.0
Source: NSSO, 1998 and Census of India (Punjab), 1971-1991
The data reveal that there are 37 per cent illiterates in the 15+age group. But in Punjab, state government programmes cater only to the 15-35 age group and not to the total illiterate adult population.
Table 6 gives the proportion of illiteracy in the 15-35 age group.Table 6
Year No. of Illiterates Total Population Percentage of IlliteratesMale Female Total Male Female Total Male Female Total
1971 962946 1263325 2226271 2260295 1998096 4258391 42.60 63.23 52.281981 1141858 1421027 2562885 3108584 2754113 5862697 36.73 51.0 43.721991 1060874 1375295 2436169 3747468 3370848 7118316 28.31 40.90 34.22
Source: Socio-cultural Tables, Census of India, (Punjab), 1971-91
It may be noted that the absolute number of illiterates in the age group 15-35 increased during 1971-81 but came down during 1981-91. The percentage of illiteracy has been declining consistently both for males and females. However, it is a matter of concern that there are still 24,36,169 illiterates in this age group.
The scheme of Total Literacy was started in Punjab during 1994-95 to impart functional literacy to illiterates of the age group 15-35. This was to be implemented by the Deputy Commissioner of each district through the Zila Sakhrata Samiti.
The scheme has three phases;
1) Total Literacy Campaign 2) Post Literacy Campaign 3) Continuing Education

Total Literacy Campaign (TLC)
The objective of this campaign is to provide basic l^nowledge of reading, writing and numerics. All 17 districts have already been covered under TLC in Punjab. Hoshiarpur, Faridkot (including Moga and Muktsar) districts have completed this campaign.
Of the total illiterates in the 15-35 age group in 1991, during enlistment under TLC, only 20,74,679 person were identified between 1994-98 and only 55.24 per cent enrolled.
Post Literacy Campaign (PLC)
The objective of this phase is to develop basic skills amongst neoliterates. There is a book called Post Literacy Primer (PL-I) which is taught during this programme. Six districts, namely, Hoshiarpur, Faridkot (including Moga and Muktsar), Ropar and Nawanshehar have been covered under PLC. Hoshiarpur and Faridkot (including Moga and Muktsar) districts have already completed this programme, but it is continuing in Ropar and Nawanshehar.
Continuing Education (CE)
During the Tenth Five Year Plan, it is proposed to introduce Continuing Education (CE) to impart functional literacy to all illiterates in the age group 15-35 years. For adult learners, only Hoshiarpur district has qualified for the CE programme. However, except for some districts, the TLC programme has not functioned well. It is going on at a very very slow pace. There has been no progress for the past 2-3 years in the Patiala, Fatehgarh Sahib and Gurdaspur districts. Post-literacy campaigns need greater emphasis to ensure the realisation of the gains of TLC. Withdrawal of school teachers, lack of funds and enthusiasm at all levels of society have been reported by most of the districts as the cause of the very slow pace or failure of the programme.
It is strongly recommended that there should be regular monitoring at the state and district levels. The adult literacy programme can now be merged with SSA for effective functioning and optimal utilization of resources, as there is a very easy convergence of adult literacy programmes with EGS (Education Guarantee Scheme), AIE (Alternative Innovative Education) under SSA.
SCHOOL EDUCATION: PRIMARY, ELEMENTARY, SECONDARY AND SENIOR SECONDARY
Relevance of Schooling
‘Elementary education is the most crucial stage of education spanning the first eight years of schooling and laying the foundation for the personality, attitudes, social confidence, habits, learning skills and communicating capabilities of pupils. The basic skills of reading, writing and arithmetic are acquired at this stage. Values are internalized and environmental consciousness sharpened. The crucial role of universal elementary education for strengthening the fabric of democracy, through provision of equal opportunities to all for the development of their inherent individual potential, was accepted from the very inception of our Republic in Article 45 under the Directive Principles of Slate Policy in the Constitution, which provides for free and compulsory education to all children until they complete the age of 14 years. This was iterated in

1968, by the Resolution on the National Policy on Education’. {Challenge of Education, a policy perspective, 1985)
The famous Unnikrishnan Case declared primary education a fundamental right. The 93^ Amendment added a new clause to make elementary education a fundamental right. A state subject so far, education was brought on the Concurrent List.
Secondary and Senior Secondary levels of education are also considered very essential in a child’s life. Classes XI and XII give the children the choice of joining different courses, including science, commerce and mathematics to facilitate their entry into the world of work, as this stage is terminal in nature and has been considered a turning point for the child to move towards a place of work.
The present section provides an overview of the current quantitative and qualitative status of school education in Punjab, in the light of the major goals of education identified by the national policy, along with some interventions/recommendations for policy alternatives in education. The major variables, which have been described here, are: growth of institutions by levels, enrollment, retention and dropout rate, quality of school education, non-formal education and infrastructure. This section also discusses educational policy/plans and expenditure.
Problems of School Education in Punjab
Punjab is in the most unenviable position with respect to literacy and education. There has been an increase in total literacy rate by 11.4 per cent points between 1991-2001. Male literacy has improved by 9.97 per cent points, female literacy by 13.1 per cent points and rural literacy by 12 per cent points during this period. Although the absolute number of illiterates has decreased from 70.43 lakh in 1991 to 63.80 lakh in 2001 (excluding the 0-6 age-group), the number continues to be alarmingly high.
The state has universal access at the primary level. It has a significantly high ratio of primary sections. Except some remote areas/new habitations with small populations, there is a government primary school in almost every village. However, there are 61 per cent villages without a middle section. In fact, 16 per cent habitations do not have an elementary school even within the norm of 3 km. Nearly one-fourth of the children are either not enrolled in schools or are in unrecognized schools. Further, there are still about 2.97 lakh children of 6-14 age group who are out of school. Among those enrolled in schools, the dropout rate is very high. Out of 100 children enrolled in class 1, only 22 reach senior secondary level. The condition of facilities and infrastructure available in the primary schools is pitiable. More than 1,000 schools do not have buildings of their own. Even such basic necessities as drinking water and toilets are conspicuous by their absence in a large number of schools. Students do not have proper sitting arrangements and teachers do not have sufficient numbers of black-boards to teach and chairs to sit on.
Apart from physical inputs, the most glaring weaknesses are lack of motivation, outdated teaching methodology and unskilled teachers. Although Punjab has a respectable teacher-pupil ratio of about 1:42 at primary level, a one-way dialogue between teachers and students has remained the norm and learning by rote the only methodology. The prevalent teaching-learning process is inadequate for the first generation students, who are not supported by the home environment. Further, there is lack of relevance of

education to day to day life. A commitment to create specific and stated levels of learning and competence at different stages of education, is absent. At present, there is no reliable system of concurrent monitoring or evaluation at the state level. Planning is vague and indicative, with no commitment to fulfillment of stated specific targets. The main stress has only been on formulation of schemes and almost no action-research to discover what will work. Total lack of accountability towards pupils and their performance is further hindering educational development. The time has indeeed come for introspection and diagnosis, consolidation of existing resources and planning for bridging tiie gaps.
Education Policy and Plans
The Government of India’s National Policy on Education, 1986 (modified in the year 1992) is a forthright statement on education as an empowering agent.
While making certain modifications in NPE (1986) in 1992, the Central Government took a significant decision to direct the State Governments to have their own state programmes of action for implementing the thrust areas of the policy, keeping in view local conditions as also the spirit of NPE.
NPE gives priority to universalization of elementary education (UEE) and identifies it as the major goal. It, inter alia, lays emphasis on the following aspects of education:
(i) universal access;(ii) universal enrollment and universal retention of children upto 14 years of age;(iii) a substantial improvement in the quality of education.
The policy relating to secondary education Implies;
(i) Providing access to secondary schools in the unserved areas.(ii) Establishing open schools for children who cannot attend full-time schools.(iii) Enhancing the options by ensuring a vocational stream along with the three
streams of humanity, science, commerce in higher secondary schools.(iv) Consolidating the facilities:
a) Improvement in curriculum and evaluation methods.b) Improvement in infrastructural facilities, such as building, classrooms
and playgrounds, etc.
Adhering to the national policy, Punjab aims to achieve the goal of universalization of elementary education. For this, separate Directorates of Primary Education and Secondary Education have been set up.
Till now, we had been adhering to the national policy. This is, however, for the first time that Punjab has initiated its own policy wherein the major objective is to universalize implementation of the national policy. A perusal of the Five Year Plans of Punjab reveal that although the First Five Years Plan did recognize quality as the key area of concern for educational reforms, the pressures for expansion were such that most of the development expenditure was consumed for opening new schools and appointment of additional teachers, rather than in making concentrated efforts to improve the quality of education. Moreover, opening of new schools and appointment of additional teachers were more attractive as a populist measure. Statistically too, the data on the number of schools reveal that the maximum increase was during 1970-80.

It was only during the Seventh Plan (1985-90) that the focus shifted from expansion and upgradation of education to consolidation of qualitative improvement. However, during the Ninth Plan (Punjab), the main focus was on both qualitative improvement and expansion and upgradation of schools, to meet the target of universalization. During the Tenth Plan, it is envisaged that the main stress will be laid on providing/upgrading infrastructural facilities in the existing schools by providing buildings/furniture. It will also cater to decentralization to the village level, training of manpower, which includes teaching personnel and leadership. The focus of the state administration in the Tenth Plan is mainly on improving the quality of education.
A study of the outlay and expenditure in different five-year plans on general education (all stages) reveals picture shown in Table 7.
Table 7Punjab: Outlay and Expenditure in Different Five Year Plans on General Education
Plans Approved outlay on education
Percentage of total outlay
ExpenditureonEducation
Fourth Five Year Plan (1969-74) 2100.00 7.16 2307.69Fifth Five Year Plan (1974-78) 4327.00 4.21 3056.43Sixth Five Year Plan (1980-85) 5300.00 2.71 5470.58Seventh Five Year Plan (1985-90) 7637.00 2.32 6371.27Eighth Five Year Plan (1992-97) 21683.00 2.62 23714.82Ninth Five Year Plan (1997-2002) 41310.49 2.89 60947.61
(1997-2001)Tenth Five Year Plan (2002-2007) 141089.77 6.07 -
Source; Statistical Abstract of Punjab (1970-2002)
The data reveal that the present outlay has come down to 2.89 per cent in the Ninth Plan from 7.16 per cent in the Fourth and 4.21 per cent in Fifth Plan. The percentage of the total outlay to the education sector had been consistently decreasing until the Seventh Plan. In the Eighth and the Ninth Five Year Plans, although there has been a marginal increase in the outlay i.e. it increased to 2.62 per cent in the Eighth Plan and 2.89 per cent in the Ninth Plan, but the percentage is still very low as compared to the Fourth Plan and even the Fifth Plan. Hence, it is obvious that the education sector is not being given as much priority as it was given earlier. However, the expenditure during the Ninth Plan, i.e., from 1997 to 2000 has really exceeded the given outlay. Rs.60,947.61 lakh has been spent on education in 1997-2001 as against the allotted amount of Rs. 41,310.49 lakh. The main reason was the implementation of the recommendations of the Fifth Pay Commission, wherein again the major amount was spent on salaries/state liabilities rather than educational development. In the Tenth Plan a major jump to Rs. 1,41,089.77 lakh is envisaged for the education sector and the state government claims that besides meeting the state liabilities, during this plan period, care is being taken to ensure that the money released is utilized to meet the objectives of development.

Primary Education(Rs. In Lakh)
Year Plan Non Plan TotalBudgetAllocation
TotalExpenditure
Expenditure on Salaries
% Expd. onSalaries
BudgetAllocation
Expenditure
BudgetAllocation
Expendi-Ture
1992-93 562.00 486.00 19598 19429 20160.00 19915.00 19509.25 97.971993-94 288.75 157.91 20186 20072 20474.75 20229.91 20129.91 99.511994-95 319.00 293.65 23999 22389 24318.00 22682.65 22437.65 98.921995-96 120.92 59.06 26265 26089 26385.92 26148.06 26148.06 100.001996-97 1176.75 1026.11 30378 30376 31554.75 31402.11 30452.11 97.001997-98 1278.14 1053.77 38264 38262 39542.14 39315.77 38351.55 97.551998-99 611.61 607.61 45830 45822 46441.61 46429.61 45912.44 98.891999-2000 1106.28 794.21 56066 55925 57172.28 56719.21 56054.71 98.832000-2001 1574.52 1092.10 62552 59661 64126.52 j 60753.10 60067.26 98.87
Secondary EducationYear Plan Non-Plan Total Total Expendi % Expd.
Budget Expendi Budget Expendi Budget Expendi ture on onAllocation ture Allocation ture Allocation ture Salaries Salaries
1992-93 3301.02 2017.36 29499.35 27796.28 32800.37 29813.64 24682.86 82.791993-94 6099.28 4048.99 29253.09 29956.48 35352.37 34005.47 28861.02 84.871994-95 6746.5 5237.00 30411.32 32700.33 37157.82 37937.33 32455.53 85.551995-96 9058.5 5449.66 37462.26 38479.90 46520.76 43929.56 38366.71 87.341996-97 10691.5 6718.24 45019.03 47133.64 '55710.53 53851.88 47301.86 87.841997-98 12391.38 1070561.61 51772.32 62042.91 64163.70 72748.52 65294.53 89.571998-99 18270.7 16806.02 70762.12 74286.95 89032.82 91092.97 81822.14 89.821999-2000 22620.56 19809.27 86215.21 74514.70 108835.77 94323.97 85166.89 90.292000-2001 27916.35 19322.05 95265.98 88930.90 123182.33 108252.95 97993.58 90.522001-2002 32897.58 22106.9 100299.70 96301.07 133197.28 118407.93 106663.86 90.08Source: Directorate of Education, Punjab
In spite of the fact that educational expenditure continues to be the highest item next only to defence, the resource gap for educational needs is still one of the major problems. Punjab is spending 2.88 per cent of the SGDP on education in comparison to 3.62 per cent at the national level. However, this percentage is really less, as there was a clear indication in the NPE 1986 that the investment on education should reach six per cent of the national income.
Not only is the allocation for education very low, but, according to present data, 99 per cent of the expenditure at the primary level and 90 per cent at the secondary level are spent on salaries. The expenditure on salaries at the primary level has increased from97.8 per cent in 1992-93 to 100 per cent in 1995-96. It dropped to 97 per cent in 1996 but has again increased and reached 99 per cent in 2000-01. At the secondary level, the expenditure on salaries has been consistently rising from 83 per cent in 1992-93 to 87 per cent in 1995, 89 per cent in 1998 and has finally reached 90 per cent in 2000-01. Such a high percentage of expenditure on salaries clearly reveals that very little is left for development of education itself.
Progress of Education at Different Levels
The overall educational profile of the population in Punjab is really disappointing, as reflected in Table 9.
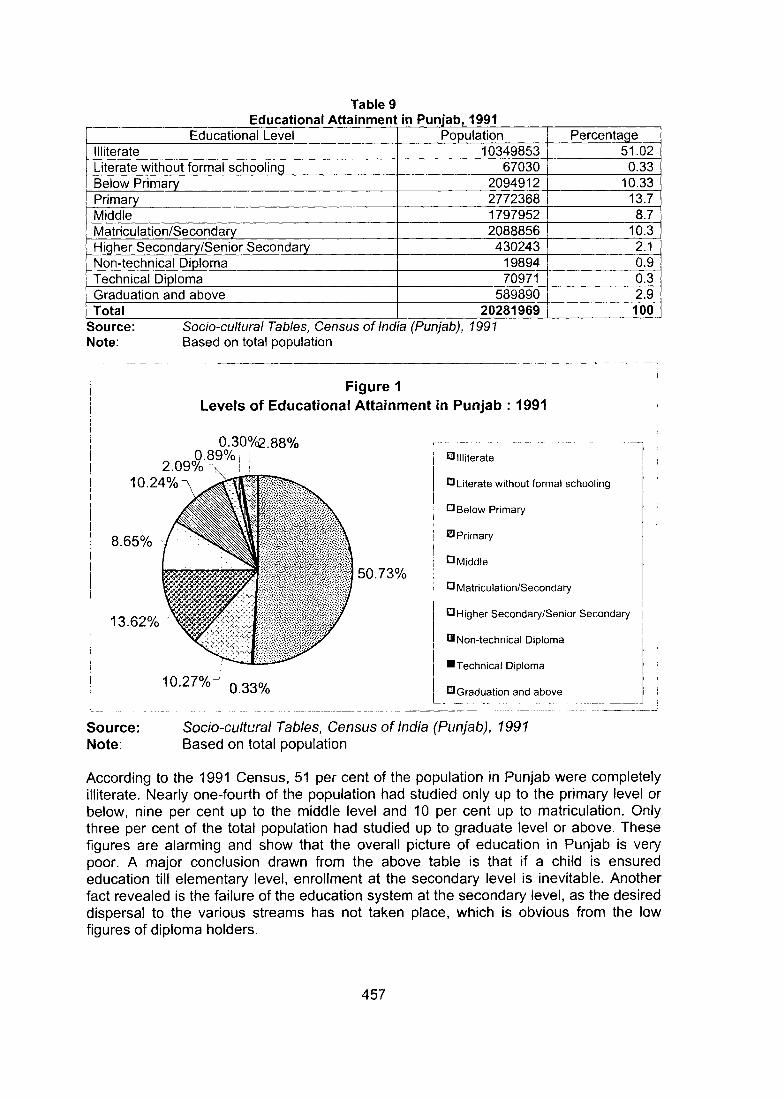
Educational Level Population PercentageIlliterate 10349853 51.02Literate without formal schooling 67030 0.33Below Primary 2094912 10.33Primary 2772368 13.7Middle 1797952 8.7Matriculation/Secondary 2088856 10.3Higher Secondary/Senior Secondary 430243 2.1Non-technical Diploma 19894 0.9Technical Diploma 70971 0.3Graduation and above 589890 2.9Total 20281969 100
Source:Note;
Socio-cultural Tables, Census of India (Punjab), Based on total population
1991
Figure 1Levels of Educational Attainment in Punjab : 1991
0.30?/c2.88%
10.24%
8.65%
13.62%
50.73%
10.27% 0.33%
E3 Illiterate
Cl Literate without formal schooling
Q Below Primary
B Primary
□ Middle
□ Matriculation/Secondary
□ Higher Secondary/Senior Secondary
C®Non-technical Diploma
■ Technical Diploma
□ Graduation and above
Source:Note:
Socio-cultural Tables, Census of India (Punjab), 1991 Based on total population
According to the 1991 Census, 51 per cent of the population in Punjab were connpietely illiterate. Nearly one-fourth of the population had studied only up to the primary level or below, nine per cent up to the middle level and 10 per cent up to matriculation. Only three per cent of the total population had studied up to graduate level or above. These figures are alarming and show that the overall picture of education in Punjab is very poor. A major conclusion drawn from the above table is that if a child is ensured education till elementary level, enrollment at the secondary level is inevitable. Another fact revealed is the failure of the education system at the secondary level, as the desired dispersal to the various streams has not taken place, which is obvious from the low figures of diploma holders.

The status of education at different levels, i.e., primary, middle, secondary and senior secondary, has been discussed under the umbrella of the major goals identified by the National Policy of Education, i.e., to ensure access to school, universal enrollment and retention of children up to the age of 14 years and improving quality of school education.
MAJOR GOALS AND ACHIEVEMENTS
Goal I: Ensure Access to Schools
Current Status
In Punjab, the state government manages 90.8 per cent of the recognized educational institutions: nine per cent are non-government, aided and/or recognized institutions and only a negligible number comes under the control of the Centre. The number of nongovernmental but recognized institutions is however higher in the case of high schools and senior secondary schools than primary and middle schools, i.e., one-fifth of the high schools and one-fourth of the senior secondary schools are non-governmental institutions. Punjab Government has made great strides in expanding access to education by opening new schools at all levels. The total number of schools increased from 8,891 in 1966-67 to 18,998 in 2001. The data reveal that the most massive expansion of schooling facilities took place during the 1970s-80s in Punjab, when the number of schools jumped from 9,394 to 16,050.
Although there has been a gradual increase in the number of institutions from the 1980s to 2000, the expansion has not been that significant as in the period 1970-80.
Table 10
Type of School Central Govt. State Govt. Non-Govt.(Recognized)
GrandTotal
Primary 8 (0.06) 12175 (93.7) 813(6.3) 12996Middle 1 (0.03) 2390 (94.^ 143 (5.6) 2534High 9 (0.4) 1746 (79.5) 441 (20.0) 2196Sr. secondary (10+2)
46 (4.0) 831 (71.6) 284 (24.46) 1161
Total 64 (0.3) 17144 (90.76) 1681 (8.89) 18887Source: Educational Statistics at a Glance of Punjab (1999)Note: Figures in parentheses are percentages
Table 11
Type of School
1966-67
1969-70
1974-75
1980-SI
1990-91
1992-93
1996-97
1999-00
2000-01
Primary 7002 7256 9335 12383 12379 12462 12613 12996 13076Middle 866 959 1397 1498 1430 1429 2545 2534 2534High 730 919 1275 1912 2249 2104 2159 2196 2199Higher Sec/ Sr. Sec.
293 260 245 257 520 673 1134 1161 1189
Total 8891 9394 12252 16050 16578 16668 18451 18887 18998
966-2001
Source: Economic Survey of Punjab, 2001-02

District No. ofvillagessurveyed
No. of villages having Totalupperprimarysections
Totalsecondarysections(4+5)
GPS GMS GHS GSSS (3+4+5)
2 3 4 5Amritsar 1249 1216 217 165 64 446 229Bathinda 302 294 73 83 61 217 144Faridkot 198 195 77 41 18 136 59Fatehgarh Sahib 437 416 65 40 24 129 64Ferozepur 1079 1030 180 95 65 340 160Gurdaspur 1555 1459 241 137 104 482 241Hoshiarpur 1410 1202 172 141 92 405 233Jalandhar 886 830 151 117 76 344 193Kapurthala 588 518 108 66 45 219 111Ludhiana 935 854 181 165 79 425 244Mansa 242 238 95 47 20 162 67Moga 313 307 69 83 57 209 140Muktsar 251 248 75 69 38 182 107Nav\/an Shehar 433 409 88 57 32 177 89Patiala 1094 1042 167 110 73 350 183Ropar 903 812 119 76 52 247 128Sangrur 750 727 206 156 61 423 217Total 12625 11797
(93.44)2284
(18.09)1648
(13.05)961
.J7.61).4893
(38.76)2609
(20.67)Source; Tentative Data, Department of Education, 2002Note: - Numbers represent villages having the respective education facility so do not correspond
with number of schools.Upper Primary (classes 6-8) are run in GMS, GHS and GSSS so for the purposes of upper primary total of (3+4+5) represent upper primary section.Secondary classes, i.e., (classes IX-X) are run in both GHS and GSSS. So the total of (4+5) represent number of secondary section.
The number of primary schools increased tremendously in the past. It rose to 7,256 in 1970 and reached 12,383 in 1980. At present it has already reached 13,076 (2000- 01).The number of middle schools was 1,498 in 1980-81, increased to 2,545 in 1996-97, and is at present 2,534. High schools numbered 919 in 1969-70, 1,275 in 1974-75,1,912 in i980-81, 2,249 in 1990-91 and 2,199 in 2000-01. It is evident that the number of schools really increased only during 1970-80. Senior secondary schools too increased to 1,189 in 2000-01 from 520 in 1990.
The data of the survey conducted in 12,625 villages by the Education Department reveal that except for some remote/unserved areas, there is a primary school in almost every village. There is likelihood of shortage of primary schools in Mand/Kandi/Border and Bet areas of Punjab, because of their difficult terrain. However, at the other end, the data also show that there are only 39 per cent of villages, having elementary sections and only 21 per cent which have secondary sections.
Even if we consider the distance norm as laid down by government, there are only 84 per cent habitations which have a middle school within three kms. which means shortage of elementary sections in 16 per cent habitations. Similarly, there is also a shortage of secondary and senior secondary schools in 10 per cent and 20 per cent

habitations, according the distance norm of five kms. and eight kms. respectively (Sixth All India Educational Survey, 1993-94).
The assessment of the number of schools reveals that though the state is progressing well and there has been a quantitative expansion of educational institutions in Punjab, the real increase in the number of schools has been just at the primary level. However, according to the present data, following the norm that there should be one secondary section for every 1.8 elementary section, the shortage comes to nearly 6,000 secondary schools. This indicates that even if ail the secondary schools are upgraded upto the senior secondary level, there will still be a shortage of nearly 3,000 schools.
Alternate Schooling
Non-formal education for children in the 6-14 age-group: In pursuance of the National Policy on Education, 1986, the Central Government provides help for the establishment of non-formal education centres. But in Punjab, neither the government, nor NGOs, nor voluntary agencies run any such centres. Non-formal education was carried on until 1991, but there are no data available. However, since 1991, Punjab has no facility for non-formal education at the primary or upper primary level for children in the age group 6-14. In only one district of Amritsar, a Chandigarh- based NGO applied to the Centre for starting NFE centres in 90 slums of the district. This project has been approved. But at present, no non-formal educational centre is operational. It is, however, proposed that under the Sarv Shiksha Abhiyan, in the Tenth Plan, the Education Guarantee Scheme and alternative innovative education will be initiated.
Open school programme for children in the 14-18 age-group: The National Policy 1986, had proposed alternative education/open schools at the secondary level to provide access to dropouts, working children and girls. However, the state’s effort so far has been to bring the children to mainstream/ formal schooling, and hence not much work has been done on open schools, though the large number of school dropouts warrant such an initiative.
Punjab started the open school programme in 1992, as an integral part of Punjab School Education Board as a centre of open learning to cover the gap at the secondary level. PSEB is operating the programme with 175 centres and 16,000 students. It has not developed any separate set of operational procedures except providing flexibility in the number of chances for passing examinations. In 1994-95 the open school was converted into a correspondence course, as a distance education programme. It has the same curriculum, examination and certification process as in formal schools. Except for this programme at the matriculation level, there is no alternative schooling in the state at present for the out-of-school children in the 14-8 age group. The open school in Punjab is dependent only on student fees. In the absence of any financial support and requisite publicity, it has not realized its full potential. Recently, the state government claims to have formed VEDCs in the villages to check drop-out rates under SSA. However till date, Punjab Open School has hardly been able to cover even one per cent of the out- of-school children at the matriculation level. The open schools in fact have lost their orientation and become a haven for unrecognized schools which wish to expand up to the secondary level of education and get their pupils certified through these open schools. To restore the essential character of the open schools, steps have to be taken urgently to rescue these from the stranglehold of commercially-run private schools. Further, Central funding is required to subsidize the study material and offset publicity

costs. At present, the number of study centres is far short of the requirement. Central assistance is essential for the extension and upgradation of the study centre network. But the best way will be to utilize the existing school infrastructure (buildings and teachers) innovatively for such non-formal education.
Goal II: Universal Enrollment and Retention of Children up to the Age of 14 Years
Current StatusTable 13
Admission in Schools, 1984-1998 (in akh)_______Year Class Class VI Class IX Class XI1984 4.49 2.72 1.70 0.331998 4.80 3.64 2.78 1.08Source: Directorate of Education, Punjab
Enrollment in primary classes in government and recognized schools has remained almost static for 15 years, i.e., the number of admissions has increased from 4.49 lakh to only 4.80 lakh during 1984 to 1998. The growth at upper primary, high and senior secondary levels seems to be quite healthy, but in reality the picture is not that rosy, as it is based on a smaller base.
Total enrollment of students in recognized institutions increased from 30.6 lakh in 1980- 81 to 36.61 lakh in 1991. However, the increase in the next nine years was not that significant. It touched only 39.48 lakh in 2000. These figures reveal that massive expansion in enrollment took place in 1980-90. Enrollment among girls increased from 13.1 lakh in 1980 to 15.9 lakh in 1991 and reached 18.55 lakh in 1999-2000. Presently, it has marginally decreased to 18.47 lakh in 2000-2001, whereas the enrollment of boys increased from 17.4 lakh (1980) to 20.0 lakh (1990) and only to 21.01 lakh (2001). The increase in enrollment has been more in the case of girls (5.37 lakh) than boys (3.61 lakh) during 1980-2001 (Table 14).
Further, enrollment of Scheduled Caste students too has been rising in the age groups 6-11, 11-14 and 14-18. The increase was from 7.9 lakh in 1980 to 10.2 lakh in 1991 and has touched 14.31 lakh in 2000-01. The real expansion in enrollment of SCs is, however, a recent phenomenon. Their numbers grew the maximum in 1990-2000. However, the share of SCs at the primary level was 43.84 per cent of the total students in 2000-01, which came down to 32.89 per cent at the middle level and to 21.18 per cent at the secondary level. This has emerged as a very important intervention area for the government, as the data reveal a high dropout rate among Scheduled Castes as they move to higher levels of education.
Table 14Enrollment of Scheduled Caste, Non-Scheduled Caste and Total Students in Recognized
Age-group
Total Students Non-Scheduled Castes Scheduled CastesBoys Girls Total Boys Girls Total Boys Girls Total
1 2 3 4 5 6 7 8 96-111980-81 11.4 9.3 20.7 7.9 6.7 14.6 3.5 2.6 6.11990-91 11.1 9.5 20.7 7.1 6.3 13.5 4.0 3.2 7.21999-2000
11.25 10.12 21.37 6.38 5.67 12.05 4.87 4.45 9.32
2000-01 11.20 9.92 21.12 6.32 5.54 11.86 4.88 4.38 9.26

11-141980-811990-911999- 20002000-01 14-18 1980-81 1990-911999- 20002000-01 Total 1980-81 1990-911999- 20002000-01
4.35.3
5.27
5.22
1.83.6
4.54
4.59
17.420.0
21.06
2.73.9
4.69
4.69
1.12.5
3.74
3.86
13.115.9
18.55
21.01 18.47
7.09.3
9.96
9.91
2.96.1
8.28
8.45
30.636.1
39.61
39.48
3.44.1
3.57
3.49
1.52.9
3.56
3.60
12.713.3
13.51
2.33.2
3.21
3.16
1.02.1
2.99
3.06
10.011.6
11.87
13.41 11.76 25.17
5.67.3
6.78
6.65
2.55.1
6.55
6.66
22.725.9
25.38
0.91.2
1.70
1.73
0.30.7
0.98
0.99
4.76.7
7.55
7.60
0.40.7
1.48
1.53
0.10.4
0.75
0.80
3.14.3
6.68
6.71
3.26
0.41.0
1.73
1.79
7.910.2
14.23
14.31Source: Director Public Instruction, Sc hools, Punjab; cf Economic Survey of Punjab, 2001
It was also felt pertinent to study the age-specific enrollment ratios in the age group 6-14.
Table 15
6 to Below 11 11 to 14 6 to 14Boys Girls Total Boys Girls Total Boys Girls Total
Punjab 74.99 72.91 74.01 72.18 65.82 69.19 73.96 70.31 72.24Haryana 71.07 67.24 69.27 63.56 52.82 58.65 68.33 62.13 65.45HimachalPradesh
86.96 82.87 84.95 87.10 76.74 82.05 81.02 80.52 83.84
Kerala 84.74 82.12 83.44 94.98 93.67 94.33 88.75 86.63 87.70Gujarat 81.39 70.56 76.14 90.63 72.92 82.23 84.75 71.40 78.33TamilNadu
79.58 76.49 78.06 90.99 82.63 86.92 83.83 78.75 81.34
India 73.20 59.13 66.40 65.02 48.20 57.06 70.33 55.40 63.17Source: Sixth All India Education Survey, 1999, Data pertains to 1993-94
The age-specific enrollment ratio is only 74.01 for children in the age group six to below 11 and 69.19 for the 11 to 14 age group. Further, only 55 per cent of the children in the 14-7 age group are enrolled in schools. The enrollment ratio is 74.99 for boys and 72.9 for girls in the six to 11 age group and 72.18 for boys and 65.82 for girls in the 11 to 14 age group. Although Punjab’s figures are higher than the national enrollment figures (63.17), it is still behind many other states such as Kerala, Himachal Pradesh, Gujarat, Tamil Nadu, etc. In spite of the tall claims of the Punjab Government of achieving a state of high excellence in education, it is a matter of concern that 28 per cent of our children in the 6-14 age group are as yet either not enrolled or are in unrecognized schools.
From independence till the sixties, most children attended schools run by different state governments and the number of private schools was rather small. Recently there has been an expansion in the number of private schools.

Percentage Distribution of Students (6-14 Age Group) in Government/ Government-aided ___________ and Private Schools in Select States, 1994
Government aided Schools
U.P. 73.8 27.2M.P 96.1 3.8Orrisa 95.7 4.1Rajasthan 96.5 3.4West Bengal 99.0 1.0Gujrat 98.2 2.0Maharashtra 98.3 1.5Andhra Pradesh 89.7 10.2Karnataka 90.2 9.6Kerala 88.0 12.0Tamil Nadu 93.0 7.0All India 90.0 9.8
Source: India Human Development Report, 1999
On the whole, in rural India, about 90 per cent of all school-going children in 1994 attended government/government-aided schools. Other states, such as HP, Bihar, MP, Orissa, Rajasthan, Maharashtra, Karnataka and Tamil Nadu too had a very high percentage of children going to government/ government-aided schools. Even Kerala had 88 per cent of children in government/government-aided schools. However, Punjab is the topmost state after UP, with a relatively high proportion of students attending private schools.
In the last decade or so, there has also been a rapid increase in the number of unrecognized private schools in Punjab at the primary level (figures under documentation). The enrollment of children in these unrecognized schools in Punjab has reached 25 per cent of total enrollment at the primary level, although the number of such unrecognized schools is negligible at the middle and high level. Taking into account the unrecognized schools, total enrollment in primary schools, increased 5.20 per cent during 1996-2000 which is obvious from the data in Table 17.
Table 17
Year Govt. Schools Recognised Schools Un-recognisedSchools
1996 71.86 8.89 19.241997 70.67 9.03 20.291998 70.90 8.87 20.221999 69.48 8.40 22.112000 66.27 9.21 24.50Source: Directorate of Education, Punjab (1996-2000)

Figure 2Management-wise Trends in Enrollment at Primary Schools Level:
Punjab
0)O)Sc<uoI—(UCL
80
70
60
50
40
30
20
10
0
70.67
/
IQ 9^ 90 20.22 22.11 24.5
8^89 a87 84 ^
1996 1997 1998 1999 2000
Years
□ Govt. Schools {2 Recognised Schools OUnrecognised Schools
Source; Directorate of Education, Punjab (1996-2000)
The share of government schools in total enrollment in primary classes is gradually decreasing and has come down from 71.86 per cent in 1996 to 66.27 per cent in 2000. The share of recognized schools in total enrollment is marginally increasing and has gone up to 9.21 per cent from 8.89 per cent in 1996-2000. Larger growth is in the unrecognized schools, which has gained 24.50 per cent points (2000) from 19.24 per cent points (1996). It reflects the diminishing confidence of the public in government-run schools, which not only lack such basic infrastructure as buildings and furniture, but also motivation and commitment of the teachers. Hence households with comparatively higher income prefer to send their children to private schools, which they perceive as imparting qualitatively better education. However, without undermining their role in enrolling children in small mohallas, who might otherwise have been out of school, the government has recently started the policy of enlisting the unrecognized schools so that these are also brought under some kind of check and control, and also to enable the educational data of these schools to be included in the education statistics of the state.
Household expenditure: According to the Constitution of India, primary and elementary schooling have to be provided free of cost to all citizens. However, except for tuition fees, parents continue to bear the expenditure on other kinds of fees, books, stationery, uniforms, etc.

Per Student Annual Household Expenditure on Elementary Education by Select States,1992 and 1994
Harayana 801 696HP. 842
Bihar 246 375U.P. 351M.P 281 258Orisa 309 253Rajasthan 364 428West Bengal 504 316Gujrat 342 278Maharashtra 329 302Andra pradesh 378 295Karnataka 448 383Kerala 754 586Tamil Nadu 349 379All India 4640 378
Source: India Human Development Report, NCAER, 1999
On an average, at the elenrientary level (including private schools), the household expenditure per child is annually Rs. 670 (1994) in Punjab. It has increased from Rs.612 in 1992. This is despite the fact that free elementary education has been declared as a fundamental right. Household expenditure is quite high when compared to the national level, where the per pupil expenditure is Rs.378. Household expenditure per child is Rs. 479 in government schools and Rs. 1,398 in private schools in Punjab, as compared to Rs. 317 in government schools and Rs.742 per annum in private schools at the national level. Punjab ranks third (only after Haryana and Himachal Pradesh) so far as household expenditure on elementary education is concerned. It was reported that a major chunk of the household expenditure on education was also spent on private coaching/tuitions, apart from transport, uniform and books.
The state government also spends quite a large budget on school education. About 1,15,855 teachers and 19,554 support persons work in the department. There are three Directorates functioning under the aegis of education. There are four accepted levels of education - Primary, Middle, Secondary and Senior Secondary. Figures from NSSO 52"" round (1995-96) show that Punjab spends more than double the national average on school education. The average expenditure per child in general education by Punjab is Rs. 1,394 in rural areas as compared to only Rs. 570 in India. Again, in urban areas, Punjab spends Rs. 2,786 per child as compared to Rs. 1,686 at the all-India level. It is, therefore, high time that the state rationalizes its per student expenditure.
Retention in Schools
Household and state expenditure per child show that huge amounts are spent in educating every single child. Therefore, enrollment by itself is no panacea if children do not continue education beyond a few years. Dropout is in fact an indicator of wastage in education.

1988-2000Year Primary (l-V) Elementary (l-VII!) Secondary (1-X ) Senior Secondary
(l-X II)1— ■ — \Male Fe- i
maleTotal Male Fe
maleTotal Male Fe
malei Total Male Fe
maleTotal
1988-89 29.20 29.62 29.39 - - - - - -1991-92 29.83 30.25 30.02 33.12 41.29 36.90 - - - - - -1992-93 31.05 31.85 31.42 42.77 48.40 45.38 - - - - - -1993-94 20.69 22.94 21.74 36.15 72.78 39.23 44.88 52.81 48.54 - - -1994-95 22.63 22.94 22.74 37.68 43.01 40.15 51,54 56.88 54.01 - - -1995-96 22.83 22.61 22.73 38.16 43.58 40.66 51.03 54.29 52.54 79.58 83.27 81.281996-97 24.03 21.76 22.97 31.29 35.82 33,41 51.39 54.71 52.93 80.00 82.93 81.401997-98 25.21 22.28 23.84 26.56 30.50 28.40 46.89 50.10 48.37 76.28 79.28 77.601998-99 22.86 20.62 21.79 26.75 29.28 27.92 39.99 44.35 42.03 76.43 79.47 77.841999-00 24.83 20.15 22.49 29.82 29.90 29.86 35.37 35.73 35.54 - - -2000-01 21.96 18.53 20.36 36.86 37.42 37.13 40.39 38.84 39.67 - -Source: Directorate of Secondary Education, Punjab
3OQ.2DOJ0 53c0)OOa.
100
Figure 3Dropout Rates at Different Levels of Education
1997-98 1998-99 1999-00 2000-01
SSenior Secondary (I - XII) Total
nD Elementary (l-VIII) Total
□ Secondary (I - X) Total
0 Primary (1-V) Total
Source: Directorate of Secondary Education, Punjab
The dropout rate at the primary level of education in Punjab declined from 31.42 per cent in 1992-93 to 21.74 per cent in 1993-94 but thereafter it increased marginally and has again declined to 20.36 per cent at present, which is less than the dropout at the National level (42.39%, 1998-99). Surprisingly, the dropout rate for boys (21.96%) is more than that of girls (18.53%) at the primary level. Although at the elementary level

the drop-out is less in Punjab than at the all India level (56.82% in 1998), it continues to be at 37 per cent, as it was in 1991-92. The male and the female dropout rates are almost similar at the elementary level. At the secondary level, the dropout rate increased from 48.54 per cent in 1993-94 to 54.01 per cent in 1994-95, but thereafter it consistently declined till 1999 and reached 35.54%, but recently it has again risen to 40 per cent (2000-01).
In spite of the government’s initiative to reduce the dropout rate, the figures continue to be very alarming. It is a matter of great concern that 20 per cent of the children drop out of schools at the primary level, 37 per cent by the time they reach the middle level, 40 per cent at the secondary and 78 per cent at the 10+2 level, i.e., 78 per cent of the children in class I dropout by the time they reach senior secondary classes. It is a matter of serious concern that out of the total students enrolled in class I only 22 per cent reach class XII.
Out-of-school children: According to the survey conducted by the Directorate of Education, there are 1.69 lakh children in the 6-11 age group and 1.28 lakh children in the 11-14 age group in the state, who do not attend school. According to the data available, 2.97 lakh children in the 6-14 age group and 10.52 lakh children in the 14-8 age group are out of the school network.
Table 20Out-of-school Chllt ren, 2001
Age-group Male Female Total6-11 89276 79701 16897711-14 67072 61400 1284726-14* 156348 141101 29744914-17** 540126 512504 1052630
Source:Note;
Directorate of Education, PunjabBased on village surveyBased on projected population and enrollment
It may be observed that 76.91 per cent of the out-of-school children belong to the SC or OBC population. Even the remaining 23.09 per cent, though may be coming from upper social classes but belong to the economically weaker sections.
Further, the Directorate of Education also confirms that out of the 2.97 lakh children not going to schools, 1.13 lakh (37.91%) are engaged in one or other kind of labour activity and the majority of them are in the age group 11-14 years.
Besides working as labourers or assisting their parents in work, the other reasons for children remaining out of school/or dropping out of school, identified by the Directorate of Education are; 1) poverty, 2) large family, 3) lack of inspiration/ interest/awareness or disinterest among parents and children, 4) illness/death/desertion/ emigration of either of parents, 5) lack of teachers/ infrastructure in schools, 6) study curriculum uninspiring/ dull/difficult, 7) teachers uninterested/uninspiring/dull/rude, 8) timing not convenient and 9) access to school/difficult/far away, etc. In addition to the reasons mentioned above, field studies also suggest that many parents still hesitate to send girls to co-educational institutions and are particularly averse to those in which there are no women teachers. In Punjab there are 48 per cent such schools. Thus, state intervention becomes important in not just providing sound education, economic incentives and committed teachers, but also in tackling the socio-cultural impediments.

Further, it is not only important to initiate schemes but also to ensure its regular monitoring, e.g., the scheme for providing scholarships for attendance to the SC girls is being promoted as an economic incentive, but field visits to different schools in various districts in Punjab revealed that money for disbursement under this scheme is not remitted regularly. Scholarships are not paid in time, if paid at all, was the common complaint of the school authorities. Many a time, the scholarships were received after the students had passed out of the Institution.
Goal III: Improving Quality of School Education(In terms of strengthening curriculum, teaching practices, evaluation methods, teacher-pupil ratio, options and infrastructural facilities)
Current Status
Heavy obsolete syllabus, outmoded teaching methods and inappropriate examination system: Overall improvement in ‘curriculum, teaching practices and examination methods were the core targets for secondary education, envisaged even in the year 1986 as mentioned in the National Policy of Education. However, at present, the quality of school education and the creativity of students are being adversely affected by the heavy syllabus prescribed and the system of examination and awarding marks in the schools. Although, Punjab Government claims that it is striving to make the curriculum more relevant to local specificities, many studies, including the oneconducted by CRRID in Faridkot and Lambi Blocks in Punjab, reveal that the parents are not satisfied with the syllabus taught, as they feel that it does not give their children access to skills that are related to the employment available outside. Empirical studies reveal that people felt that what their children learnt in schools were not relevant foreveryday life. It was also suggested by the teachers of different schools that thecurriculum framework should be based on both compulsory and flexible subjects. Except languages, arithmetic and general science, all other subjects, such as algebra,geometry, geography and even history were not of practical value in day to day life and hence could be listed as optional subjects. It is important to make the curriculum more relevant and flexible.
It is also strongly felt that present methods of teaching are quite outmoded especially in the rural areas. The percentage of rural enrollment to total enrollment is as high as 75 per cent at the primary level and 70 per cent at the middle level. Quite often, the teachers encourage memorizing the contents of books and rote learning. There is also very little stress on value-education in the curriculum. Teachers and curriculum have been reported as uninspiring. This has been a major reason for school dropouts. The level of satisfaction of children/parents can be imagined from the fact that out of 100 students enrolled in class 1 in Punjab, only 60 per cent reached class 10 and 22 per cent reached class 12.
Further, urban-rural disparities emerge because of the privately managed English- medium institutions, generally located in urban areas. Although Punjab Government has decided to introduce English language in all government schools in the class 3 itself (according to the latest Education Policy, 2002), it, however, seems that this will create more problems than solve them.

One notices that nearly 98 per cent expenditure at the primary level and 90 per cent at the secondary level are incurred on salaries of teachers and administration, leaving very little for socially useful work programmes, excursions, games and hobbies, science equipment and kits or even simple blackboards, chalks, posters and charts. In these circumstances, even an inspired teacher, with the best of training would have no choice but to encourage rote-learning of texts.
The present mode of teaching/learning is a matter of concern when one considers that in Punjab only 75 per cent of the school-age children ever go to recognized primary schools and only 58 per cent appear for the 10* standard public examination. The pass percentage in the matriculation examination is only 49 per cent for regular students and 33 per cent for those appearing privately. Pass percentages have deteriorated over the years both among regular as well as private students.
Table 21Pass Percentage in Matriculation Examination, 1998-2001
Year Regular Passed %age Private Passed %age1998 284456 187613 65.95 58545 24430 41.721999 274275 134858 49.16 76665 31828 41.512000 307949 161824 52.54 84999 33972 39.962001 272465 133996 49.17 100968 33854 33.52
Source:Note.
Punjab State Education Board, MohaliData pertains fo Punjab School Education Boards only
Low examination results at grade 10 clearly indicate the weakness in the knowledge and understanding of the subjects among the students. It is a direct indicator of the low quality of teaching in schools. Otherwise how could one explain nearly 50 per cent failure rate in Board Examinations at the matriculation level?. Since the parents and the state have invested such huge amounts for a period of 10 to 12 years in the education of children, is not this an expression of the failure of the entire education system?
It is, therefore, suggested that while classroom learning is important, what the child learns by self-observation outside the classroom is equally important. The child must become an active participant in the process of learning through observation, field studies, experiments and discussions. The child’s individuality and creativity needs to be given due importance. Innovations in curriculum, which should be based on the needs of the learners and related to the local environment, are required. It has been strongly recommended by educationists that there should be no textbooks upto the fifth class and the curriculum should be totally activity-based. Priority also needs to be given to reorientation in the outlook of the teachers, which at present is getting highly commercialized, as reflected in the number of tuitions being encouraged by them. There is also need for overhauling the examination system, so that it recognizes and evaluates creativity and new thinking rather than mere memorization. Schools must change from mere education shops to centres for imparting knowledge and building skill levels.
JTeachers will perhaps have to play the most important role to enable the coming generations to develop capabilities to cope with a profoundly change-oriented world. But for this, teachers, education/training will have to be adopted as the first area of intervention.

Teacher-pupil ratio: The teacher-pupil ratio is also an important indicator of the quality of school education.
Table 22District-wise
Year/District ClassI t o V VI to VIII IX and X XI to XII
1971 42 30 18 -
1980 41 25 17 -
1990 38 20 29 -
1997 40 29 22 241998 42 28 22 211999 41 26 23 262000 42 26 23 28District, 2000Gurdaspur 32 27 21 26Amritsar 40 24 32 24Kapurthala 36 23 20 30Jalandhar 45 28 28 24Nawanshehar 47 31 22 19Hoshiarpur 35 28 25 29Rupnagar 36 23 21 14Ludhiana 40 25 21 26Ferozepur 49 27 22 28Faridkot 47 23 13 20Muktsar 55 24 22 28Moga 54 32 23 17Bathinda 51 28 19 15Mansa 60 31 22 43Sangrur 50 28 20 20Patiala 41 26 21 23Fatehgarh Sahib 45 , 29 22 13
Source: DPI, Punjab; cf Statis tical Abstract o f Punjab, 2001
In Punjab, the teacher- pupil ratio is 1:42 at the primary level, 1:26 at the middle level, 1:23 at the secondary and 1:28 at the higher secondary level (2000). However, notwithstanding this overall satisfactory position, there are significant inter-district disparities, especially in primary schools. In some districts, such as Muktsar, Mansa, Moga and Sangrur, the teacher-pupil ratio is more than 1:50 at the primary level.
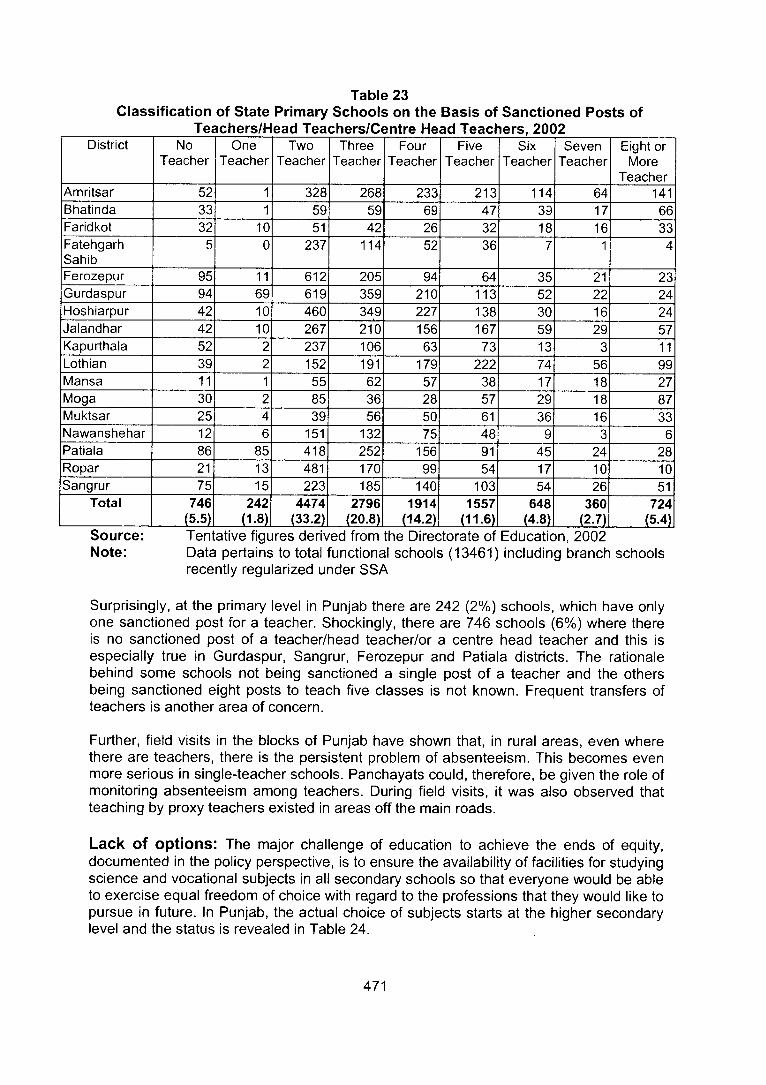
Table 23Classification of State Primary Schools on the Basis of Sanctioned Posts of
Teachers/Head Teachers/Centre Head Teachers, 2002District No
TeacherOne
TeacherTwo
TeacherThree
TeacherFour
TeacherFive
TeacherSix
TeacherSeven
TeacherEight or
More Teacher
Amritsar 52 328 268 233 213 114 64 141
FatehgarhSahib
237 114 52 36
Ferozepur 95 11 612 205 94 64 35 21 23Gurdaspur 94 69 619 359 210 113 52 22 24Hoshiarpur 42 10 460 349 227 138 30 16 24Jalandhar 42 10 267 210 156 167 59 29 57Kapurthala 52 237 106 63 73 13 11Lothian 39 152 191 179 222 74 56 99Mansa 11 55 62 57 38 17 18 27Moga 30 85 36 28 57 29 18 87Muktsar 25 39 56 50 61 36 16 33Nawanshehar 12 151 132 75 48Patiala 86 85 418 252 156 91 45 24 28Ropar 21 13 481 170 99 54 17 10 10Sangrur 75 15 223 185 140 103 54 26 51
Total 746(5.5)
242(1-8)
4474(33.2)
2796(20.8)
1914(14.2)
1557 648 360 724i M i
Source: Tentative figures derived from the Directorate of Education, 2002Note: Data pertains to total functional schools (13461) including branch schools
recently regularized under SSA
Surprisingly, at the primary level in Punjab there are 242 (2%) schools, which have only one sanctioned post for a teacher. Shockingly, there are 746 schools (6%) where there is no sanctioned post of a teacher/head teacher/or a centre head teacher and this is especially true in Gurdaspur, Sangrur, Ferozepur and Patiala districts. The rationale behind some schools not being sanctioned a single post of a teacher and the others being sanctioned eight posts to teach five classes is not known. Frequent transfers of teachers is another area of concern.
Further, field visits in the blocks of Punjab have shown that, in rural areas, even where there are teachers, there is the persistent problem of absenteeism. This becomes even more serious in single-teacher schools. Panchayats could, therefore, be given the role of monitoring absenteeism among teachers. During field visits, it was also observed that teaching by proxy teachers existed in areas off the main roads.
Lack o f options: The major challenge of education to achieve the ends of equity, documented in the policy perspective, is to ensure the availability of facilities for studying science and vocational subjects in all secondary schools so that everyone would be able to exercise equal freedom of choice with regard to the professions that they would like to pursue in future. In Punjab, the actual choice of subjects starts at the higher secondary level and the status is revealed in Table 24.

Year Arts Science Commerce Vocational1999 847 (100) 408 (47.1) 311 (36.7) 262 (30.9)
Source: Education Department, Punjab
The data reveal that Arts courses are available in all senior secondary schools. However, the option of choosing other courses as science, commerce, vocational, etc., is available only in a limited number of schools. In fact only 47 per cent of the schools have the option of science, 37 per cent commerce and 31 per cent vocational education.
Table 25
Arts Science Commerce Agriculture Vocational/Technical
others Total
Rural T G T G T G T G T G T G T GXI &XII
32862(79.8)
10975(81.9)
2527(6.1)
942(7.0)
1212(2.9)
337(2.5)
246(0.6)
73(0.5)
2852(6.9)
705(5.3)
1465(3.6)
359(2.6)
41164 13391
UrbanXI &XII
59524(66.0)
28723(70.4)
13692(15.2)
6068(14.9)
7435(8.3)
2704(6.6)
127(0.1)
54(0.1)
5583(6.2)
2093(5.1)
3747(4.2)
1180(2.9)
90108 40822
TotalXI &XII
92386(70.4)
39698(73.20
16219(12.4)
7010(12.9)
8647(6.6)
3041(5.6)
373(0.3)
127(0.2)
8435(6.4)
2798(5.2)
5212(3.9)
1539(2.8)
131272 54213
Source: Sixth All India Education Survey, 1999, Data pertains to 1993-94
At the 10+2 level, a large majority of the students (70%) opt for Arts and only a very small proportion (12%) opt for science, seven per cent for commerce and six per cent for vocational courses. There are significant urban-rural differences emerging in the choice of subjects; 80 per cent of students in rural areas opt for arts subjects as compared to 66 per cent in urban areas. The percentage of children opting for science and commerce is comparatively more in urban than in rural areas. Vocationalization of higher secondary education was the major objective of the reforms envisaged in the Education Policy. It however seems that attempts made so far have not borne fruit and enrollment in the vocational stream, which was expected to reach 50 per cent at the 10+2 level, has remained rather marginal as only six per cent have opted for it in both rural and urban areas.
Table 26Distribution of Enrollment at Senior Secondary Stage in Select States
State Arts Science Commerce Agriculture Vocational Others TotalKamataka 64.80 16.50 14.80 0.30 2.50 1.00 100Kerala 13.40 31.80 5.50 5.80 41.50 2.00 100Madhya Pradesh 31.8C 46.70 12.30 4.60 2.60 2.10 100Maharashtra 52.80 19.00 23.30 0.20 4.10 0.60 100Manipur 46.40 36.70 5.70 0.00 1.60 9.60 100Meghalaya 38.00 56.20 3.50 0.00 2.30 0.00 100Andhra Pradesh 28.40 44.00 24.10 0.20 2.80 0.40 100Punjab 70.40 12.40 6.60 0.30 6.40 4.00 100Source: Sixth All India Educational Survey, 1999, Data pertains to 1993-94
Further, in Punjab only 12 per cent of the students opt for science as compared to 32 per cent in Kerala, 47 per cent in Madhya Pradesh, 56 per cent in Meghalaya and 44 per cent in Andhra Pradesh. Similarly, children opting for commerce are less in Punjab than in other states. The state is also far behind Kerala in vocational education. The main reason for it is the outdated syllabus, with no relevance to the technical requirements in the employment market. Hence this stream is less popular as it fails to prepare the child for work and for upward mobility. The committed expenditure on teachers with knowledge limited only to a particular outdated field, already in employment with no

students opting for it is a burden on the state. As pointed out by the government itself ‘many experienced teachers have stated that vocationalization within the secondary school system has been a casualty at the hands of educational planners who have no insight into the opportunities of employment, or the type of expertise required, for vocational employment. Consequently, lack of professionalism characterizes every initiative in the planning of training of teachers, preparation of curricula, selection of courses, infrastructure and other prerequisites. For future planning, therefore, while laying stress on vocationalization of education, adequate financial resources have to be allocated for starting viable activities in this field. Adequate infrastructure and manpower prerequisites have also to be sorted out.
The total non-enrollment of the children at the secondary level (45%), their dropout rate (48% at the secondary and 78% at the higher secondary level), their results (50% failure at the matriculation level), all show that the secondary and senior secondary levels have remained a terminal stage for the child to stop education. Perhaps this is considered as the time for the child to start working. Actually, secondary education was never considered a goal and this was perhaps the major drawback of education planners. It is only now that the state is moving towards secondary education and is preparing itself for universal secondary and senior secondary education by the year 2015 {World Bank Report prepared by Department o f Education, 2002).
Lack of infrastructural facilities in schools: For the child, the school is one of themain agencies of socialization, and the first prerequisite of schooling is availability of good quality infrastructure for imparting education. Hence a school must be attractive in terms of its environment. However, the data in the tables that follow do not give a very positive picture of the infrastructure facilities available in the schools of Punjab.
Table 27Count of Facilities Required in Primary/Middle/Secondary/
Senior Secondary Schools. 1999Level of School
Buildings Toilets BoundaryWalls
Verandas Playgrounds TotalSchools
(Number)Primary 676 10770 4995 3780 6147 13769
(4.9) (78.2) (36.3) (27.5) (44.6)
Middle 303 1552 1120 1107 1140 2336(13.0) (66.4) (47.9) (47.4) (48.8)
High 138 640 480 545 508 1728(8.0) (37.0) (27.8) (31.5) (29.4)
Senior 36 217 166 186 181 829Secondary (4.3) (26.2) (20.0) (22.4) (21.8)
Source: Education Department, 1999Note: Total schools also include the functional schools based on school level survey
The data in Tables 27 and 28 reveal that there are 676 schools (5%), at the primary level without their own buildings; 78 per cent require more toilets, 36 per cent boundary walls, 28 per cent verandas and 45 per cent require usable playgrounds. Further, there are only 76 per cent school buildings in good condition.
The remaining one-fourth of the buildings require urgent repair. Drinking water, which is a basic necessity, is also not available in 20 per cent of the schools. Further, only 31 per cent of the Government Primary Schools have the facility of toilets for girls and boys. At

the middle level, 13 per cent of the schools require buildings, 48 per cent boundary walls, 47 per cent verandas, 49 per cent playgrounds and 66 per cent require toilet facilities.
Although provision of such infrastructural facilities, as buildings, playgrounds, etc., at the secondary level were the priority areas to be met during the Seventh Plan itself, there are still eight per cent of secondary schools which require buildings of their own, 37 per cent require toilets, 32 per cent verandas and 29 per cent playgrounds. Similarly, at the senior secondary level, five per cent of the schools are without buildings and 26 per cent require toilets. Even at the 10+2 level where the children are grown-up and need to have privacy, there are no separate toilets for girls in a number of schools.
Table 28Infrastructure Status Report of Government Primary School Including Branch Schools, 1998
District School buildings in good condition
Schoolbuildingsneedingrepair
Drinkingwater
Toilets for boys/girls available
Toilets for girlsavailable
Total number of schools
Amritsar 834 565 1060 270 70 1399(59.6) (40.4) (75.8) (9.3) (5.0)
Bathinda 373 10 320 187 37 383(97.4) (2.6) (83.6) (48.8) (9.7)
Faridkot 195 57 197 111 41 252(77.4) (22.6) (78.2) (44.0) (16.3)
Fatehgarh 349 100 377 118 49 450Sahib (77.6) (22.2) (83.8) (26.2) (10.9)Firozepur 1061 189 1015 395 166 1250
(84.8) (15.1) (81.2) (31.6) (13.3)•Gurdaspur 853 702 1001 262 138 1548
(55.1) (45.3) (64.7) (16.9) (8.9)Hoshiarpur 1066 209 1090 266 93 1283
(83.0) (16.3) (84.9) (20.7) (7.2)Jalandhar 774 195 883 371 167 963
(80.4) (20.2) (91.7) (38.5) (17.3)Kapurthala 410 128 460 162 53 536
(76.5) (23.9) (85.8) (30.2) (6.5)Ludhiana 871 126 917 528 273 965
(90.1) (13.1) (95.0) (54.7) (28.3)Mansa 197 82 203 80 53 279
(70.6) (29.4) (72.8) (28.7) (18.9)Moga 426 29 218 210 221 455
(6.4) (47.9) (46.2) (48.6)Muktsar 235 78 227 115 71 313
(75.1) (24.9) (72.5) (36.7) (22.6)Nawan 332 108 384 130 38 441Shehar (75.2) (24.5) (87.1) (29.5) (8.6)Patiala 929 222 892 381 146 1151
(80.7) (19.3) (77.5) (33.1) (12.7)Rupnagar 730 136 760 250 117 904
(80.8) (15.0) (84.1) (27.6) (12.9)Sangrur 598 250 689 295 123 848
(70.5) (29.5) (81.3) (34.8) (14.5)Total 10233 3186 10693 4131 1886 13420
(76.3) ........ (23.7) (79.7) (30.8) (14.1)Source: Education Department, 1998
Further information and data collected from the Directorate of Education too indicate that many of these buildings are in depilated conditions and have been declared unsafe for use as classrooms. The majority of the schools also face problems of shortage of

classrooms. The data reveal that 60 per cent of the primary schools and 58 per cent of the upper primary schools require additional classrooms. Further, 69 per cent of the secondary and 73 per cent of the higher secondary schools too are short of classrooms, although a programme for the construction of additional classrooms, to the extent they were deficient, was declared a major target in the National Policy 1986. The total number of additional classrooms required is 18,002 at the primary level, 4,150 at the upper primary, 4,091 at the secondary and 3,239 at the higher secondary level. There is also shortage of such b,asic necessities in the schools as blackboards, chalks and dusters. Nearly one-fourth of the sections do not have furniture even for the teachers. In 14 per cent of sections in the schools, the furniture/mats supplied for students are inadequate and in one-fourth there is absolutely no furniture, i.e., desk, bench, patre or even a mat for students. The data speak volumes about the state of infrastructure available in the schools.
In a nutshell, the condition of school buildings, basic amenities, availability of blackboard, furniture and playgrounds reveal that infrastructural facilities available at present in the schools of Punjab are poor. It is high time that our focus shifts to providing/upgrading/ optimally utilizing the existing infrasructural facilities in the schools.
A look at the current status of education in Punjab in terms of the national goals reveals that, in spite of a specific provision in the Constitution to endeavour to provide free and compulsory education up to the age of 14 and several explicit commitments with regard to the achievement of universal elementary education and improving secondary education, the progress so far has been way behind the target. In spite of the Policies on Education at the National Level and Programme of Action, the status of education in Punjab is not very impressive. In many cases, measures of reform could not be initiated because of lack of commitment, a positive attitude, planning and implementation.
Further there were faults at the stage of policy planning itself. The policy framework lacked the specificity required for evolving implementation strategies for a vast variety of situations existing on the ground. Hence, the commitment, which was to be fulfilled by the seventies/eighties, is still to be realized. There has been an uneven development of education not only between states but also between different castes and gender. Present schemes have not yielded significant results. A great many people, particularly educationists, feel that a large majority of the goals of the 1968 National Policy on Education still remain merely goals, even after the formulation of the 1986 and 1992 National Policy on Education.
Future Scenario
There are serious difficulties in presenting a comprehensive projection of the future because of inadequacy of data and lack of clarity about the overall future scenario. However, it would be adequate to present a broad picture, which might yield some insights into policy planning. Although it was projected that enrollment would slightly decline in the initial years, i.e., till the year 2001, but if the governments started to take action and seriously implemented their plans and policies, ‘there will be acceleration of the programmes for the universalization of elementary education, which will increase the enrollment rate by 2006-07’. The likely scenario of the enrollment as projected by the Directorate of Education is given in Table 29.

Table 29Projected Population and Accelerated Enrollment of 6-17 Age-group in ___________ Government Schools, 1991-2011 (in thousand)___________
Year Projected population 6-17 age
Projected accelerated enrollment 6-17 age
2006 60.63 35.272011 56.94 34.36
Source: Project submitted by the Education Department to the World Bank, 2002
‘With increase in access to upper primary and secondary schools, improvement of facilities at the school level, trained teachers, community participation and the achievement of the other objectives of the SSA, there will be an increase in the enrollment and retention rates. Increase at the primary level will be only just more than marginal, but at the upper primary and secondary levels, it will be substantial. Increased incentives will further attract the children to government schools’ (Proposal submitted to the World Bank by the Department of Education, 2002). In spite of the increasing craze for private schools in Punjab, if the government improves the quality of school education according to the recommendations made in the pages that follow, i.e., making education useful and relevant for children through curriculum revision, child-centred teaching- learning methods, improvements in educational provisions, value-education, teachers’ training, teacher empowerment, change in the examination system and improving the infrastructural facilities, enrollment in government schools will be at least 70 per cent of school-age going children by the year 2007. The enrollment in only government schools is likely to increase from the present 30.19 lakh (2001) to 35 lakh in 2006 or 2007. The increased enrollment and retention at all levels will also increase the output of more secondary graduates. The share of private schools in total enrollment is not likely to reach more than 30 per cent from the present 25 per cent’ (Proposal submitted to the World Bank by the Department of Education, 2002). However, the government has to depart from ‘tokenistic’ planning on models provided by the national planners and others and take initiatives involving experimentation with specific objectives at the grassroot, institutional and district levels. It is also necessary to develop an authentic system of monitoring, appraisal and evaluation to achieve our present targets and also to cater to the projected education scenario of the future.

On-going Education Programmes/Schemes
Opening and upgradation of schools ; Government has made efforts during the session 2001-02, and 1,404 schools have been upgraded, i.e., 468 from primary to middle level, 468 from middle to high and 468 from high to 10+2 level. The state government also plans to upgrade 200 more schools to middle, high and 10+2 level and open 50 new primary schools. Thus opening of new schools and upgradation of existing schools is being encouraged to achieve the goal of universal access to education.
Total literacy campaigns and post literacy campaigns are in operation.
A new Centrally sponsored scheme in the ratio 75:25 between the Government of India and the state has been introduced in 2001-02. Under this scheme. Alternative schooling is proposed to be provided for children in the 6- 14 years age-group who were out of school. For this, 10,000 EGS centres are proposed to be set up.
Free and compulsory primary education.
Attendance scholarship to SC girls.
Mid-day Meal Scheme has been continuing in all districts since 1995. Three kg. wheat or two kg. rice is given for a period of 10 months per child.
Free text-books to all the SC student and also to all girl children upto elementary level have been provided under SSA.
Introduction of English from class-ill.
Appointment of para-teachers/siksha karmi.
At present the state is hopeful of achieving universalization of elementary education within a decade through the Sarv Shiksha Abhiyan (SSA). SSA is a Centrally-sponsored scheme on a sharing basis between the GOI and the state government, with an objective to provide quality elementary education to all children and achieve Universalization of Elementary Education (UEE). The annual work plan for 2001-02 has been sanctioned Rs. 130 crores. The allocation on schemes is likely to increase in the coming years. The major thrusts in SSA are as follows:
All 6-14 age group children in school by 2003.
All 6-14 age group children complete five years of primary schooling by 2007.
All 6-14 age group children complete eight years of schooling by 2010.
Focus on elementary education of satisfactory quality with emphasis on education for life.
Bridge all gender and social category gaps at primary stage by 2007 and at elementary education level by 2010.Universal retention by 2010.
It has a holistic and convergent cafeteria approach, i.e., all the existing Centrally sponsored programmes of EE like Operation Black Board, Teacher Education, Non-formal education, Programme for Nutritional Support, Integrated Education for disabled children, Shiksha Karmi scheme and free education for girls, etc., have to be incorporated under this new framework of SSA. In addition to this, efforts and programmes of all the related departments have also to be dovetailed.
The scheme of Operation Black Board to improve school facilities by providing for more teachers, rooms and teaching/learning equipment. (Presently being clubbed with SSA)
In-service training to JBT Teachers in DIETS: The scheme of strengthening teacher’s education by establishing quality teacher training institutions, like DistrictInstitution ofEducation and Training (DIETS). 17 DIETS arefunctional.
Strengthening and Improving Science Education inSchools :Pre-service and in- service training of teachers by SCERT (State Council of Education, Research and Training)
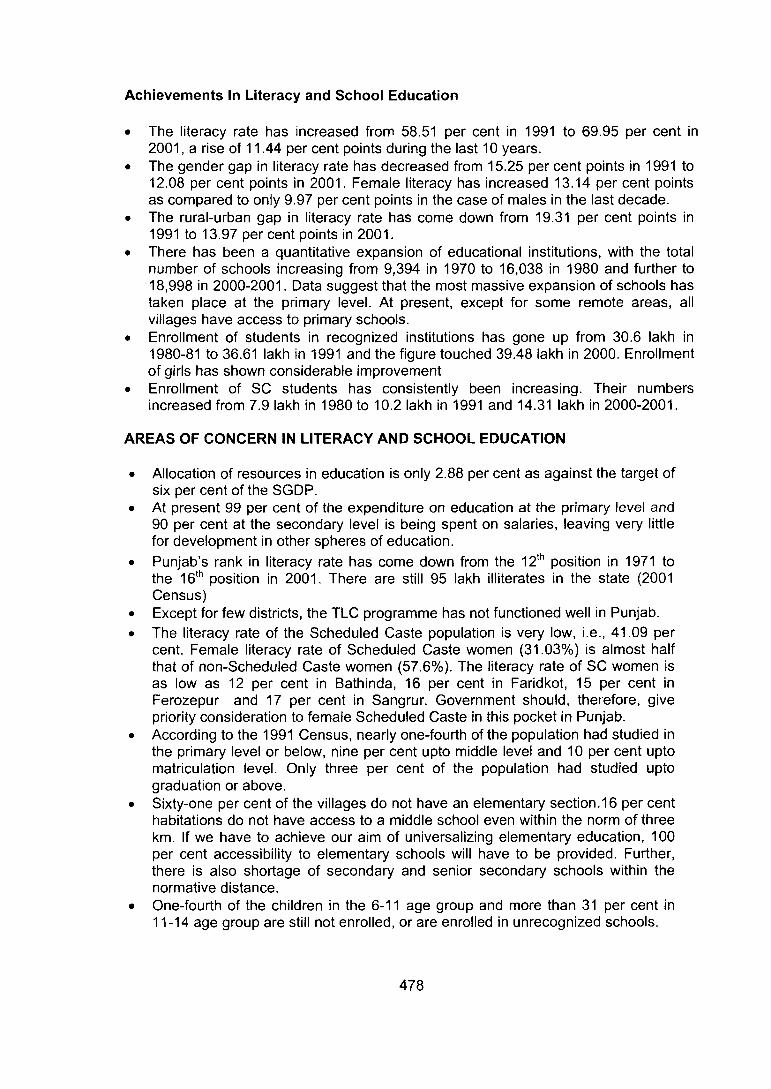
Achievements In Literacy and School Education
• The literacy rate has increased from 58.51 per cent in 1991 to 69.95 per cent in 2001, a rise of 11.44 per cent points during the last 10 years.
• The gender gap in literacy rate has decreased from 15.25 per cent points in 1991 to12.08 per cent points in 2001. Female literacy has increased 13.14 per cent points as compared to only 9.97 per cent points in the case of males in the last decade.
• The rural-urban gap in literacy rate has come down from 19.31 per cent points in 1991 to 13.97 per cent points in 2001.
• There has been a quantitative expansion of educational institutions, with the total number of schools increasing from 9,394 in 1970 to 16,038 in 1980 and further to 18,998 in 2000-2001. Data suggest that the most massive expansion of schools has taken place at the primary level. At present, except for some remote areas, all villages have access to primary schools.
• Enrollment of students in recognized institutions has gone up from 30.6 lakh in 1980-81 to 36.61 lakh in 1991 and the figure touched 39.48 lakh in 2000. Enrollment of girls has shown considerable improvement
• Enrollment of SC students has consistently been increasing. Their numbers increased from 7.9 lakh in 1980 to 10.2 lakh in 1991 and 14.31 lakh in 2000-2001.
AREAS OF CONCERN IN LITERACY AND SCHOOL EDUCATION
• Allocation of resources in education is only 2.88 per cent as against the target of six per cent of the SGDP.
• At present 99 per cent of the expenditure on education at the primary level and 90 per cent at the secondary level is being spent on salaries, leaving very little for development in other spheres of education.
• Punjab’s rank in literacy rate has come down from the 12* position in 1971 to the 16‘ position in 2001. There are still 95 lakh illiterates in the state (2001 Census)
• Except for few districts, the TLC programme has not functioned well in Punjab.• The literacy rate of the Scheduled Caste population is very low, i.e., 41.09 per
cent. Female literacy rate of Scheduled Caste women (31.03%) is almost half that of non-Scheduled Caste women (57.6%). The literacy rate of SC women is as low as 12 per cent in Bathinda, 16 per cent in Faridkot, 15 per cent in Ferozepur and 17 per cent in Sangrur. Government should, therefore, give priority consideration to female Scheduled Caste in this pocket in Punjab.
• According to the 1991 Census, nearly one-fourth of the population had studied in the primary level or below, nine per cent upto middle level and 10 per cent upto matriculation level. Only three per cent of the population had studied upto graduation or above.
• Sixty-one per cent of the villages do not have an elementary section. 16 per cent habitations do not have access to a middle school even within the norm of three km. If we have to achieve our aim of universalizing elementary education, 100 per cent accessibility to elementary schools will have to be provided. Further, there is also shortage of secondary and senior secondary schools within the normative distance.
• One-fourth of the children in the 6-11 age group and more than 31 per cent in 11-14 age group are still not enrolled, or are enrolled in unrecognized schools.

Share of government schools in total enrollment in primary classes in gradually decreasing and has come down from 71.86 per cent (1996) to 66 per cent (2000), whereas there has been a larger growth in the share of unrecognized private schools, which has now increased from 19 per cent to 25 per cent in the last four years. It reflects the discontent of the public with government run schools.
Although Punjab has reduced the dropout figures to some extent, this rate is still very alarming, as 20 per cent of the children dropout at the primary level, 37 per cent at the middle level, 40 per cent at the secondary level and 78 per cent at the 10+2 level. It is a shocking fact that out of 100 children enrolled in class I, only 22 reach senior secondary level.The percentage of Scheduled Caste enrollment at the primary level is 43.84 per cent of the total students. It has come down to 32.89 per cent at the middle level and to 21.18 per cent at the secondary level. This reflects a very high dropout rate among Scheduled Castes, as they move to higher levels of education.The number of out-of-school children is also quite high. At present 2.97 lakh children in 6-14 age group and 10.52 lakh children in 14-18 age group are out of school.There is no non-formal education centre at present for children in the age group 6-14 and no alternative schooling in the state for out-of-school children in the age group 14-18 years, except for one at the matric level. That is why in Punjab open school has hardly been able to cover one per cent of the out-of-school children.There are significant inter-district disparities in teacher- pupil ratio. In some districts, such as Muktsar, Mansa and Moga, the teacher-pupil ratio at the primary level is more than 50 students per teacher as compared to other districts where the ratio varies between 31 to 40. Further there are many schools in Punjab where there is no, or only one sanctioned post of a teacher, head teacher or centre head teacher.The quality of teaching in schools can be judged by the poor results of the students. At present there is 50 per cent failure of students at the matriculation level.There are lack of infrastructural facilities and civic amenities in the schools.
The heavy syllabus prescribed and the system and examination of awarding marks in most of the school are adversely affecting the quality of school education and the creativity of students. Schools with no, or a single post sanctioned for a teacher and problem of teachers’ absenteeism are other threats to quality of school teaching.Five per cent buildings are required at the primary level, 13 per cent at the middle, eight per cent at the high and five per cent at the senior secondary level. Besides the building-less schools, there are many other schools where buildings, need urgent repair. Many of these buildings are in dilapidated conditions and have been declared unsafe for use as classrooms. The majority of the schools are also facing the problem of shortage of classrooms, toilets, playgrounds, boundary walls, verandas etc.

To achieve the targets of elementary and secondary education, we need to take the following steps;
1. Optimal upgradation of primary schools to elementary level and secondary schools to senior secondary level: The state has nearly achieved universal access to primary schools, except in certain Mand/Border/Kandi and Bet areas. Special strategies like the Education Guarantee Scheme (EGS) should be envisaged for these remote areas without accessibility to basic primary education. The focus should be now on achieving universalized accessibility at the elementary level and easy accessibility at the secondary level, by optimally merging the number of schools under two categories instead of four, i.e., one at the elementary level and the other at the secondary level. The government should make efforts to upgrade the maximum number of primary school to the elementary level and the secondary schools to senior secondary level, rather than creating totally new infrastructure. The expansion in the number of schools should be middle upwards. This has also been recently accepted as a major target by the state government (Punjab Education Policy, 2002). But how far it is implemented, is the real issue.
2. Rationalization and redistribution of staff: At present, a major chunk of the expenditure on education is on salaries/state liabilities, leaving very little for actual development in education. The state government should try to utilize optimally the expenditure. Staffing in Punjab needs to be redistributed, restructured and rationalized. It is very important to upgrade the primary schools to middle level, so that the shortage of teachers at the former is compensated by the excess at the latter, the teacher-pupil ratio being lower at the middle level than at the primary level. The merging of the two levels will help in rationalizing the manpower required upto the elementary level. The secondary level should also be optimally upgraded to the senior secondary level. It seems that the total number of teachers recruited is not so much of a problem, the need is to ensure their proper and rationalized deployment. The convergence and merger of the four branches of education into two will reduce the workload of the education department and help in redistributing the number of teachers required at different levels.
3. Focus on pre-service/in-service teachers’ training; The government should enhance the competency and skills of the teachers by promoting pre-service and in-service training for them. DIETS ( District Institution of Education and Training at elementary level)/GISTC’s (Government In-service and Training Centres at secondary level) and other training institutions must be optimally utilized for this purpose. Such pre-service and in-service training programmes should be constantly reviewed and strengthened, as its quality has a direct bearing on the quality of education in the state.
4. Rationalizing teacher transfers; Transfer of teachers in Punjab is not merely an administrative problem but also hits at the very core of the quality of education. One of the reasons for non-enrollment/dropouts is the single-teachers and teacher-less schools and persisting absenteeism. Influential teachers get themselves transferred to convenient locations, leaving behind a bunch of

schools which do not see the face of a teacher for months/years. So the need of a rational and transparent transfer policy cannot be over emphasized. The new education policy released by the state sets guidelines for teachers’ transfers for the first time. These guidelines, which are pragmatic and practical, must be adhered to and implemented by the state.
5. Focus on teacher empowerment: The critical role of teachers in the entire education set-up must be realized. Emphasis should be made to address their professional development needs. Processes should be set up to initiate a participative mode for the teachers in the development of curriculum, text-book, teaching-learning material and methodologies. However, simultaneously the teachers have to be made more responsible and performance-oriented.
6. Setting up an academic council: There is need for an autonomous multimember academic authority to undertake sample studies to collect data about the functioning of institutions and learning capabilities of students. It is necessary to make the education system more transparent. Action-research and policy development should be other concerns of this council. Members should include educationists, PRIs and school representatives, preferably teachers.
7. School heads: It is strange to note that there is no post of a headmaster in a middle school and some of the primary schools also function without any head. Apart from the non-availability of the post of a head, it is also the aptitude/attitude and vision of the school head which has a direct bearing on the quality of education. The present system of promotion for school headship is outdated. Teachers at the fag end of their service, when they prepare themselves for the bliss of retirement, get promoted to school headship. By that time they neither have the zeal nor the stamina to make any impact on the school under their charge. Moreover from teaching they are just thrown into an entirely new field of work which requires altogether new skills. So, not only must every school, have its head, but they must be sufficiently young, with enough years of service ahead in which they may translate their vision of the school into reality. The new education policy of the state has come out with such a programme, which must be implemented without delay.
8. Revamping the curriculum: There should be a special thrust to make education at elementary level useful and relevant for children. At present, it is highly regimented with uniform courses. The state has been blindly following the national curriculum without considering the special conditions at the grassroot level of Punjab. Hence modernization of the syllabus with more flexibility in the choice of subjects is recommended. Curriculum framework should be based on compulsory and flexible subjects, wherein the children have the choice to opt for the subject of their interest. It will help in reducing the weight of the school bag. It is recommended that the subjects, which do not have practical value in day to day life could be listed as optional. In fact there should be a continuous review of the utility of the curriculum from time to time. Further, there is need to emphasize on moral values and iterate their importance in everyday life.
9. Need for reforms in examination/evaluation system: It is important to review the current examination system and consider possible alternatives of bringing reforms in it. At present, the emphasis in education is on theory which is

encouraging rote-learning without basic understanding. More practical work and activities should be encouraged, which would also discourage mass copying and rote-learning. It will be appropriate to adopt a regular grading system and emphasize on the year-long classroom work, instead of evaluating only on the basis of annual examinations. This will increase the attendance rate and the knowledge of the students.
10. Provision of infrastructure/optimum utilization of the existing infrastructure: Efforts should be made to bridge the infrastructural gaps. Schools should raise resources through voluntary organizations and panchayats, with the state government providing matching grants. The state should also endeavour to optimize utilization of existing infrastructure in schools, by merging the school education at two levels--elementary and secondary- which would help in maximizing the utilization of the existing infrastructure. Introducing a shift system and using the existing buildings and teachers for open learning/non- formal education in the evening are the other methods of utilizing the existing infrastructure.
11. Changing the mindset of parents; As far as the social and cultural handicaps of enrollment and retention of girls in schools is concerned, the NGOs and PRIs need to be associated effectively to initiate an attitudinal change in the parents of the girl child.
12. Enhance incentives to ail children in government schools; The various Incentives being provided by the government should be for all children, irrespective of caste criteria (as being adopted today) to achieve the goal of universalization of education.
13. Promoting free lunch; Interaction with the parents in the various districts of Punjab and the government machinery of the departments concerned have led to the recommendation that, although the mid-day meal scheme is not achieving the desired results and encourages the children to sell off wheat on the way from the school to their homes, it is felt that some sort of packed, cooked and nutritious food should be supplied to children to attract them and retain them in the schools.
14. Adult literacy programmes should be merged with SSA: This will help in effective functioning and optimum utilization of resources. There should be timely release of the Centre’s and the State’s share of funds and regular monitoring of these programmes at the state as well as district level.
15. English should be started in class 6: According to the new Education Policy of the state, the English language has to be started in class 3 in government schools. But it is strongly felt that it is difficult for the child to bear the burden of an additional language at such a tender age. His understanding capacity is limited in the formative years and, therefore, it is strongly recommended that English should be started in class 6 and not in class 3. The English language cannot be avoided, but emphasizes needs to be given to the mother tongue, especially in the formative years.

16. Village as unit of planning: To initiate a community-based approach, village should be the lowest unit for planning education. Village plans should converge to form the District Educational Plans.
17. Decentralization and community participation: The state government should take effective steps to encourage transfer of elementary educational institutions to the PRIs and urban local bodies, in a bid to empower the community and other stakeholders. It is essential that control of schools and teachers should be transferred to local bodies, which have a direct interest in teachers’ performance. Efforts should be made to involve the community in education development through VEDCs. The state’s efforts at decentralizing powers to VEDCs for running the SSA programmes in villages should be replicated in other educational programmes too. Decentralization will actually be achieved only when the panchayats, VEDCs and UEDCs become fully autonomous, with full financial powers to plan, manage and control the school affairs. It is also important to enlarge and strengthen the role and participation of PTAs/MTAs in schools.
18. Increased allocation/resource mobilization for education: The state should substantially increase public investment and encourage and private investments in education, so that it rises to six per cent of the national income by the year 2007. It is, however, important that money is spent on increasing access to schools, infrastructure, monitoring, inspection, management and development of education rather than merely on salaries.
19. Private initiatives have to be facilitated: In recent times, a tendency has developed in people to send their children to private schools. There is need to facilitate and encourage private bodies to share the responsibility with government. It is, however, very important to ensure that minimum standards of quality of education are maintained in the private schools.
20. Monitoring and evaluation: An institutionalized mechanism has to be set up for regular inspection, monitoring and follow-up. A school gradation and evaluation system, initiated by the state from this year, is a welcome step, which needs to be institutionalized. A similar system of appraisal of teacher and school heads must also be put in place. One needs a local-level body or institution to monitor the performance of teachers.
21. Participative field studies should be undertaken: At present not much research on education is being undertaken in Punjab, at the grassroots level. So, to identify the requirements of planning, measure the effectiveness of various schemes, evaluate the measures undertaken by the state to improve quality of education and curriculum, it is important to expand research, which will reveal the ground realities. Government should also probe into such areas as relevance of education in daily life and public perception of government schools.

Historical background
Independent India inherited a higher education system with strong colonial legacies. The planners of India were, therefore, faced with the immediate challenge of bringing about a basic transformation in its educational system to fulfill the developmental needs of the country. The educational planners had recognized the bi-directional linkages between education and development. The need for a literate workforce was considered to be as essential in this context as the education and training of an adequate pool of highly skilled manpower. Considerable emphasis was also given to higher education to strengthen the educational system as a whole, and particularly to scientific and technological components therein, so as to meet the requirements of high-level capabilities in the realm of knowledge as well as skills. To achieve these objectives, the University Grants Commission (UGC) was set up as the apex national organization concerned with the establishment and maintenance of standards in higher education. The UGC acts as a vital link between the policy-making bodies of the government and institutions of higher education (Raza, 1991, pp.32-33). Some of the recommendations of different commissions on education (given below) which have influenced policies, planning and development in higher education, are discussed in this section:
• Report of the University Education Commission, 1948-49.• Report of the Education Commission, 1964-66.• National Policy on Education, 1968.• National Policy on Education, 1986.• Education Reforms Commission, Punjab, 1985.
The broad areas and recommendations on higher education and their institutions concerned, covered by these commissions, are; (1) aims and objectives of institutions of higher education; (2) their management and governance: (3) assuring quality and standards in these institutions: (4) achieving equity and access through them; (5) their funding pattern; and (6) reforms in the existing system and distance higher education, etc. National Policy on Education (1968) reinforced the recommendations of the Education Commission (1964-66) on reconstruction of education to relate it more closely to the life of the people, in the context of (a) continuous efforts to expand educational opportunities; (b) a sustained and intensive effort to raise the quality of education; (c) emphasis on development of science and technology; and (d) cultivation of moral and social values. Later, the National Policy on Education (1986) visualized that higher education should become dynamic with the (a) consolidation and expansion of institutions, (b) development of autonomous colleges, (c) re-designing of courses, (d) training of teachers, (e) strengthening research, and (f) improvement in efficiency and management.
Basic Problems of Higher Education
As higher education in the country, as well as in Punjab, grew in size, its problems and prospects too increased both in numbers and size, and its relevance to development and especially to the socio-economic needs of the society increasingly became issues of debate. Comparing the situation of higher education in other states and at the all-India level, its development in Punjab is seen to be relatively superior. But there are problems.

such as imbalanced and unplanned institutional growth, lack of infrastructural facilities, excessive and discriminatory system of admissions, financial constraints, placement of degree holders, irrelevant course content and gap between general and professional courses. Hence, there is need for various changes, modifications, adaptations, orientations and innovations.
Development of Higher Education
Punjab has a long history of higher education -- whether formal or non-formal -- of a traditionally progressive and forward-looking educational system. The reorganized state of Punjab (1966) has experienced a large number of changes in its size, social fabric and economy. These are directly linked with the development of education in the state. The structure and system of higher education in the state has followed the national pattern, such as college and university education in general and professional degrees. The current position of higher education in Punjab, although, considered as the core sector for achieving the objective of employment for an individual, is also oriented towards socio-economic, environmental, and human resources development.
Status of (General and Professional) Higher Education: Trends
Universities: The development of university education has been examined in Table 30.
Table 30 Growth of Universities
Years Universities*General Technical,**
Medical, Veterinary*** and Agriculture
Total
1971-1980 3 1 41981-1990 3 1 41991-2000 3+ 4 7
Source: Statistical Abstract of Punjab 2001-2002, Economic Advisor to Govt, of Puniab,Chandigarh, PP. 510-512, and Department of Higher Education, Punjab, Chandigarh (Unpublished)
Notes: * Amritsar-1, Jalandhar-1, Ludhiana-1, Faridkot-1, Patiala-1, Talwandi Saboo 1,and + Chandigarh-1
** providing degrees — B.E, B.Tech, B.Arch, B.B.A, B.C.A, M.C.A and M.B.A.through professional colleges.
*** providing degrees — M.B.B.S, B.D.S, B.A.M.S, B.Sc (Nursing), B.H.M.Sc,M.Sc/M.S/M.D, etc., and degrees in veterinary sciences through universities departments or professional colleges.
Seven universities serve Punjab. Panjab University, Chandigarh, Punjabi University, Patiala and Guru Nanak Dev University, Amritsar, impart general as well as professional education. The range, diversity and sophistication of subjects offered by these universities are the same as anywhere in the country. Punjab Agriculture University at Ludhiana is well known for its contributions to education, research and extension services in the field of agriculture. Punjab Technical University at Jalandhar, Punjab Medical University at Faridkot, and Punjab Veterinary University at Talwandi Saboo are in the process of being established exclusively for technical education, medical and veterinary sciences. In addition, there exists another institution offering higher learning in medicine, namely, the Postgraduate Institute of Medical Education and Research,

Chandigarh. These universities and institutes are autonomous bodies, created by Acts of State/Central Legislatures. Punjab University and the Postgraduate Institute of Medical Education and Research, Chandigarh, are both in a slightly different position, in respect of their governance and financial aids or grants. Since, they also serve Punjab, as such, it would be legitimate for us to include a reference to these matters in the discussion here.
In quantitative terms, the increase in the number of institutions of higher education in Punjab has been spread equally across universities imparting arts/sciences/commerce, technical and professional education. The facilities they provide, however, appear to be inadequate to meet the present requirement, especially for the population of rural areas, as these are all located in urban areas. In qualitative terms, standards of attainments of most of these universities are comparable with that elsewhere. Nevertheless, there is need and scope for further improvement in respect of their goals and pursuit of excellence. Views of the members of the faculty, administrative staff and students of different universities highlight great scope for introducing changes in higher education, for improving the performance of the system and making it more relevant to the needs of the day. The structure of governance of the universities in Punjab has followed the pattern evolved by other universities in the country, and based on the model developed in Europe. Hence here is no need to suggest any change in the university structure, but it is imperative to follow a pattern, which has international acceptance.
Colleges
There are a sufficient number of colleges in the state and most of them are affiliated to one or the other of the seven universities of Punjab. Table 31 highlights the growth of colleges during the last three decades.
Table 31Distribution of Recognized Colleges according to Courses of Study
Years Arts,ComnHomeCollec
Science, lerce and
scienceles
Engineering, * Technology and Architecture Colleges
Medical (Allopathic only) and Veterinary Colleges
Teachers Training Colleges (B.Ed)
Boys Girls Total Boys Girls Total Boys Girls Total Boys Girls Total1971-80 110 52 162 3 - 3 5 - 5 12 6 181981-90 118 53 171 3 - 3 5 - 5 12 6 181991-00 131 73 204 16 - 16 6 - 6 13 9 22Source: Statistical Abstract of Punjab 2001, Economic Advisor to Government of Punjab, Chandigarh, PP.
510-511Note: * Perspective Plan of Department of Technical Education, on Industrial Training, Punjab-Vision
2020 Report defined 19 Engineering Colleges, 41 Polytechnics/Institutions including Pharmacy Institutes and 129 Industrial Training Institutes in Punjab
Undergraduate teaching is mostly undertaken in the affiliated colleges (whether government, private aided or private unaided). Though these colleges mostly confine themselves to undergraduate teachings, some also offer postgraduate courses. Besides, some universities also provide education facilities at graduate and postgraduate levels, through correspondence courses and evening colleges.
Figures in Table 32 show considerable gap between the existing numbers of rural and urban colleges in Punjab. The ratio between urban and rural colleges is nearly 1:2 as calculated from the given data.
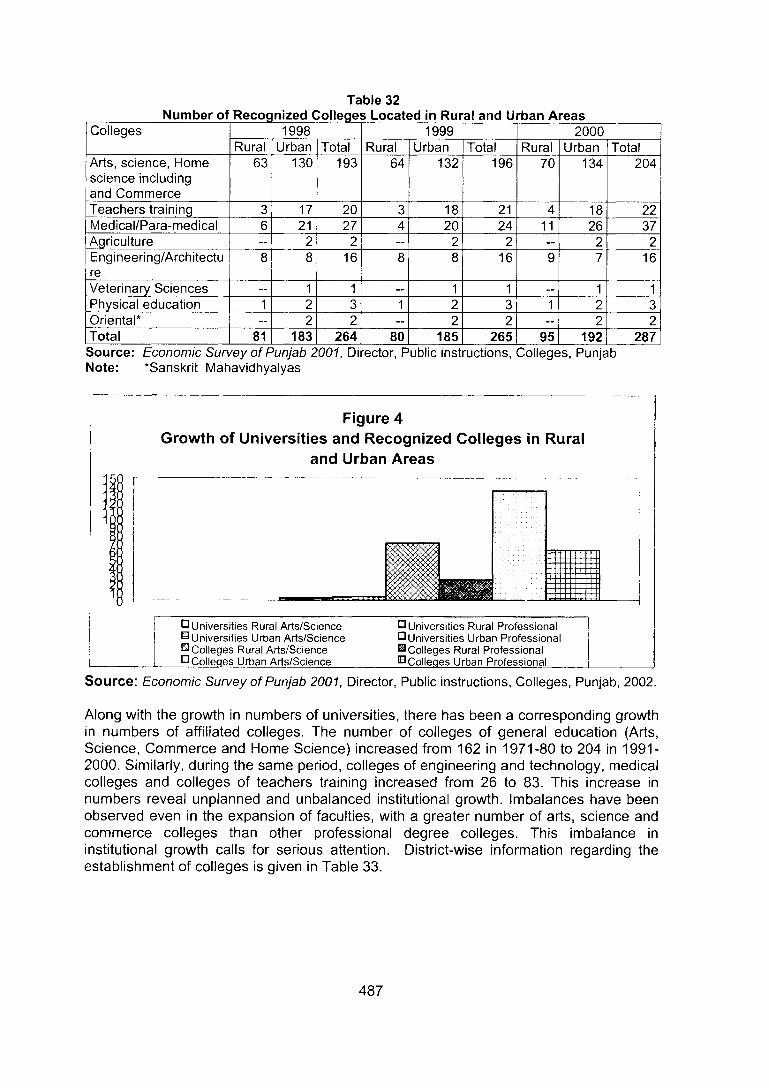
Colleges 1998 1999 2000Rural Urban Total Rural Urban Total Rural Urban Total
Arts, science, Home science including and Commerce
63 130 193 64 132 196 70 134 204
Teachers training 3 17 20 3 18 21 4 18 22Medical/Para-medical 6 21 27 4 20 24 11 26 37Agriculture ~ 2 2 — 2 2 — 2 2Engineering/Architecture
8 8 16 8 8 16 9 7 16
Veterinary Sciences — 1 1 — 1 1 „ 1 1Physical education 1 2 3 1 2 3 1 2 3Oriental* — 2 2 — 2 2 — 2 2Total 81 183 264 80 185 265 95 192 287Source: Economic Survey of Punjab 2001, Director, Public instructions, Colleges, Punjab Note: *Sanskrit Mahavidhyalyas
Figure 4Growth of Universities and Recognized Colleges in Rural
and Urban Areas
Universities Rural Arts/Science S Universities Urban Arts/Science 13 Colleges Rural Arts/Science P Colleges Urban Arts/Science
Cl Universities Rural Professional Cl Universities Urban Professional ^Colleges Rural Professional BColleges Urban Professional
Source: Economic Survey of Punjab 2001, Director, Public instructions. Colleges, Punjab, 2002.
Along with the growth in numbers of universities, there has been a corresponding growth in nunnbers of affiliated colleges. The number of colleges of general education (Arts, Science, Commerce and Home Science) increased from 162 in 1971-80 to 204 in 1991- 2000. Similarly, during the same period, colleges of engineering and technology, medical colleges and colleges of teachers training increased from 26 to 83. This increase in numbers reveal unplanned and unbalanced institutional growth. Imbalances have been observed even in the expansion of faculties, with a greater number of arts, science and commerce colleges than other professional degree colleges. This imbalance in institutional growth calls for serious attention. District-wise information regarding the establishment of colleges is given in Table 33.

District-wise Status of Recognized Colleges according to Courses of Study (2000-2001)Districts Arts, Science,
Commerce and Home science
CollegesBoys Girls Total
Engineering, Technology and
Architecture Colleges
Boys Girls Total
Medical (Allopathic only)
Colleges
Boys Girls Total
Teachers Training Colleges (B.Ed)
Boys Girls TotalGurdaspur 7 16Amritsar 13 20Kapurthala 11 17Jalandhar 12 20Nawan SheharHoshiarpur 12 17RupnagarLudhiana 14 16 30Ferozepur 11FaridkotMukatsarMogaBathindaMansaSangrur 10 13Patiala 10 12Fatehgarh Sahib 1Source: Statistical Abstract of Punjab 2001, Economic Advisor to Government of Punjab, Chandigarh
STATUS OF TECHNICAL AND PROFESSIONAL (VOCATIONAL) EDUCATION
Besides the above professional institutions, it is imperative to discuss briefly the technical institutions, such as polytechnics and Industrial Training Institutes that impart technical and industrial training as well as paramedical and veterinary sciences education. The Department of Technical Education and Industrial Training looks after 16 engineering colleges (13 government and three affiliated private and three private), 41 polytechnics/ institutions including Pharmacy (diploma level institutions), and Hotel Management institution and about 129 industrial and vocational centres at the ITI level. Every year a total of about 2,800 engineers, 5,300 diploma holders and about 16,800 craftsmen at the certificate level are being trained by these technical institutes. Besides, three engineering colleges, seven polytechnics and 33 new industrial training institutes are in the pipeline at various levels of establishment in the state.
The Directorate of Medical Education and Research, Punjab, governs medical education and research in the state. The directorate was set up to develop medical manpower and to ensure that medical education and teaching hospitals received adequate attention and proper facilities for research in various branches of medicine. To develop superspecialists, teachers from the level of senior lectures and above are sponsored to the Post-graduate Institute of Medical Education and Research, Chandigarh and the All India Institute of Medical Sciences, New Delhi, for postgraduate courses {Annual Plan- 2001, Punjab). These developments indicate that the Government of Punjab considers professional education, and especially industrial training, as high priority. In the circumstances, action needs to be initiated on different fronts to make the technical education system responsive to the needs and requirements of industry. Participation of the private sector needs to be encouraged for continuous up-gradation and expansion of HRD facilities. Keeping in view the expansion of technical higher education, besides the

promotional activities of Punjab Technical University in the field of professional education it is necessary to establish a higher-level apex body like I IT as a separate unit.
Status of Students’ Enrollment and Placement
Table 34 shows the fast growth of enrollment of students between 1971 and 2000 and this indicates the high demand for more institutions of higher education.
Table 34 Growth of Students’ Enrollment
Postgraduate Students Graduate StudentsYears Total
enrollment
Increase over the preceding Decades
Decade’s-percentageincreased
TotalenrollmentIncreased
Increaseoverprecedingdecades
Decade’s-percentageincreased
1971-80 6901 - - 84353 - -
1981-90 7313 412 6.0 86501 2148 2.541991-2000
13848 6535 89.3 179817 93316 107.88
Source: Statistical A bstract o f Punjab-2001, Economic and Statistics Organization,Punjab
The data reveal that the number of enrollments at the postgraduate and graduate levels has increased from 6,901 to 13,848 and 84,353 to 1,79,817 within three decades. Further, the decade 1991-2000 shows manifold increase in enrollments. The contradictions of the current position of fast expansion at degree level, especially in arts, science and commerce courses, are shown in Table 35. The high rate of students’ enrollment in various courses also highlights inaccessibility to job opportunities.
Table 35
Years Ph.D M.Phil @ M.A M.ScBoys Girls Total Boys Girls Total Boys Girls Total Boys Girls Total
1971-80 56 46 102 138 140 278 2852 2985 5837 338 319 6571981-90 74 74 148 263 355 618 2176 3115 5291 500 636 11361991-2000 102 170 272 18 51 69 3421 7553 10974 580 1349 1929
Continued...Years M.com B.A/B.A (Hons) B.Sc/B.Sc (Hons.) B.Com/B.Com
(hons)Boys Girls Total Boys Girls Total Boys Girls Total Boys Girls Total
1971-80 22 5 27 33436 27535 61071 7780 3395 11175 5162 324 54861981-90 61 59 120 26590 33867 60457 5175 4457 9632 5955 2714 86691991-2000 153 441 594 56218 67037 123255 7207 8380 15587 11536 10027 2156
Continued...Years B.E/B.Sc (Eng.)
B.Arch./B.TechM.B.B.S B.Ed
Boys Girls Total Boys Girls Total Boys Girls Total1971-80 1676 31 1707 1629 587 2216 1009 1689 26981981-90 1943 168 2111 1312 990 2382 1007 2243 32501991-2000 10787 2444 13231 1327 1186 2513 1079 2589 3668
Source: Statistical Abstract of Punjab 2001; Economic Advisor to Government of Punjab, Chandigarh, pp. 520-524
Note: @ The decrease of enrollment in M.Phil is due to closing of M.Phil classes in PunjabiUniversity, Patiala and GND University, Amritsar

A high percentage of enrollment in arts and science colleges (89.25%) is evident from Table 35-A. It also indicates a high rate of incidence of unemployment among nontechnical graduates and undergraduates.
Table 35 A Course-wise percentage of Enrollment
Courses PercentageArts and science colleges 89.25Teachers training colleges 1.49Medical colleges 2.92Aghculture colleges 0.46Engineering colleges 5.29Veterinary colleges 0.25Physical education colleges 0.27Oriental colleges 0.07
Source: Economic Survey o f Punjab 2001-2002: Economic Adviser Government of Punjab, Chandigarh, P. 36 and P. 153
In practice, near about 80 per cent of the total students are compelled to take admission at degree level in arts, science and commerce subjects. This is because such courses are not organized on the basis of established manpower needs and demands by various developmental sectors. Hence, there is need to restructure the admission system in different courses to improve the status of employability of graduates and postgraduates. Besides, there should be two streams of courses-vocational and general--at the first- degree level, at least for the next two decades or so, as an interim measure. (The Education Commission 1964-66 has already given this suggestion). This endeavor may help in reducing the unwanted rush of students for higher-level arts/sciences courses. Provision for offering courses of functional utility, with a vocational bias, may be helpful to those who wish to end their studies with a pass degree and are not willing to pursue further education. Vocationally motivated students could then find gainful employment or be self-employed in vocations of their own choice after the completion of +2 school stage. If they wish to continue their education, they may go in for general education, or may proceed to polytechnics for diploma or certificate courses in technical, professional or any other skill-formation courses. Therefore, vocational courses at the first-degree level need to be enriched and diversified. By this effort, government or private institutions would definitely reduce the educated unemployment level and equip students for self-employment, while giving the highest priority to vocational sectors.
District-wise enrollment of students in postgraduate and graduate courses as given in Table 36 show the trend and pattern of enrollment in different faculties.
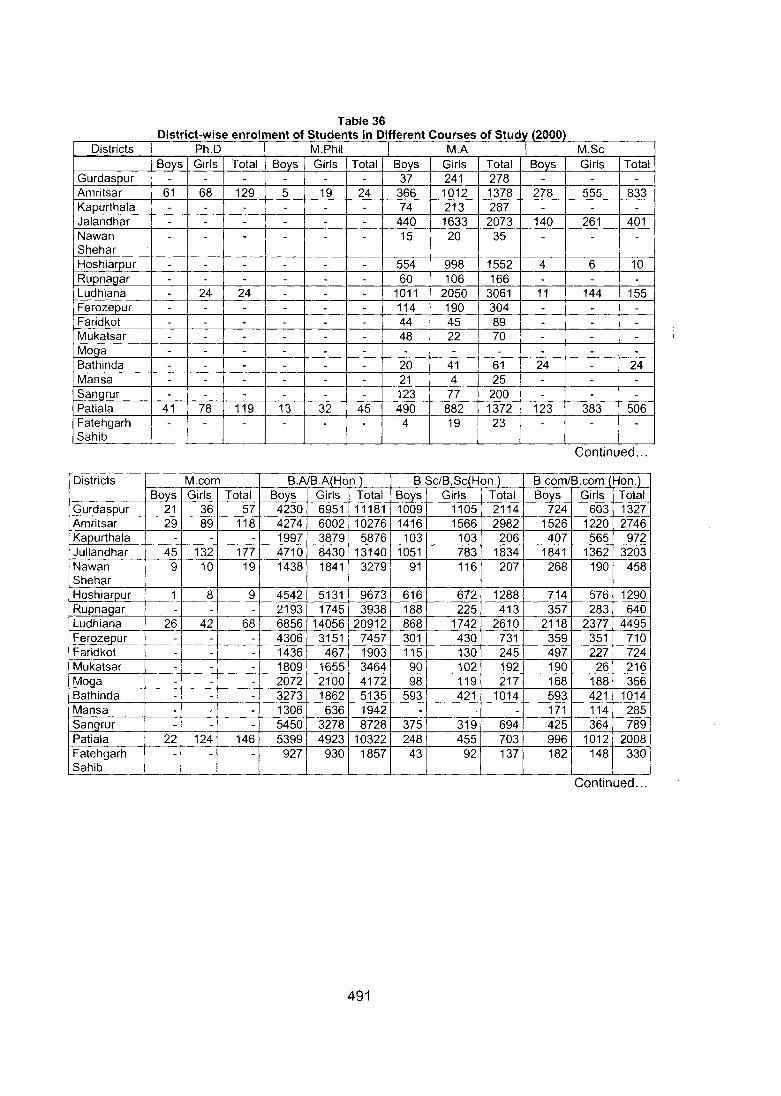
Districts Ph.D M.Phil M.A M.ScBoys Girls Total Boys Girls Total Boys Gids Total Boys Girls Total
Gurdaspur - - - - - - 37 241 278 - - -
Amritsar 61 68 129 5 19 24 366 1012 1378 278 555 833Kapurthala - - - - - - 74 213 287 - - -
Jalandliar - - - - - - 440 1633 2073 140 261 401NawanShehar
- - - - - - 15 20 35 - - -
Hoshiarpur - - - - - 554 998 1552 4 6 10Rupnagar - - - - - - 60 106 166 - - -
Ludhiana - 24 24 - - - 1011 2050 3061 11 144 155Ferozepur - - - - - - 114 190 304 - - -
Faridkot - - - - - - 44 45 89 - - -
IVlukatsar - - - - - - 48 22 70 - - -
Moga - - - - - - - - - - - -
Bathinda - - - - - - 20 41 61 24 - 24Mansa - - - - - - 21 4 25 - - -
Sangrur - - - - - - 123 77 200 - - -
Patiala 41 78 119 13 32 45 490 882 1372 123 383 506FatehgarhSahib
- - - - - - 4 19 23 - - -
Continued.
Districts M.com B.A/B.A(Hon.) B.Sc/B,Sc(Hon.) B.com/B.com fHon.)Boys Girls Total Boys Girls Total Boys Girls Total Boys Girls Total
Gurdaspur 21 36 57 4230 6951 11181 1009 1105 2114 724 603 1327Amritsar 29 89 118 4274 6002 10276 1416 1566 2982 1526 1220 2746Kapurthala - - - 1997 3879 5876 103 103 206 407 565 972Jullandhar 45 132 177 4710 8430 13140 1051 783 1834 1841 1362 3203NawanShehar
9 10 19 1438 1841 3279 91 116 207 268 190 458
Hoshiarpur 1 8 9 4542 5131 9673 616 672 1288 714 576 1290Rupnagar - - - 2193 1745 3938 188 225 413 357 283 640Ludhiana 26 42 68 6856 14056 20912 868 1742 2610 2118 2377 4495Ferozepur - - - 4306 3151 7457 301 430 731 359 351 710Faridkot - - - 1436 467 1903 115 130 245 497 227 724Mukatsar - - - 1809 1655 3464 90 102 192 190 26 216Moga - - - 2072 2100 4172 98 119 217 168 188 356Bathinda - - - 3273 1862 5135 593 421 1014 593 421 1014Mansa - - - 1306 636 1942 - - 171 114 285Sangrur - - - 5450 3278 8728 375 319 694 425 364 789Patiala 22 124 146 5399 4923 10322 248 455 703 996 1012 2008FatehgarhSahib
- - - 927 930 1857 43 92 137 182 148 330
Continued...

Districts B.E/B.Sc (Eng.) B.Arch./B.Tech.
M.B.B.S B.Ed.
Boys Girls Total Boys Girls Total Boys Girls TotalGurdaspur 799 208 1007 27 33 60Amritsar 456 454 910 85 284 369
Jullandhar 896 154 1050 130 200 330
IHoshiarpur 151 149 300Rupnagar 937 321 1258Ludhiana 1015 169 1184 327 284 611 175 825 1000Ferozepur 841 137 978 136 304 440Faridkot 566 194 760 109 97 206 35 45 80Mukatsar 528 130 658 56 44 100Moga 548 124 672 113 286 399Bathinda 830 279 1109MansaSangrur 1876 341 2217Patiala 1272 239 1511 435 351 786 65 115 180Fatehgarh Sahib 560 106 666
Source: Statistical Abstract of Punjab 2001 \ Economic Advisor to Government of Punjab, Chandigarh,
The data show that there is an increasing interest among pupils towards technical and vocational education. The increased number of technical and professional institutions, as shown in previous tables, indicates that the Department of Education and Universities has started different professional courses, which have been gradually on the increase during consecutive decades. The data also reveal that the enrollment in professional streams is gradually increasing, with a corresponding decrease in general education in both rural and urban areas, as well as among male and female students.
Figures on enrollment indicate that the growth of graduates in Commerce has increased faster in the previous decades than that of Arts and Science courses. This shows the students’ interest in professional courses, especially Commerce, which generates better job opportunities for professionals, in both public and private sectors (especially in industrial and banking sectors). Data reveal that higher numbers of students are interested to enter professional courses at the postgraduate level than the graduate level. No comprehensive studies are available about wastage and stagnation at higher levels of education in Punjab. Small sample studies have, however, been conducted by some scholars, who have come to the conclusion that wastage and stagnation are particular characteristics of the modern system of general education. This has generated frustration among students, parents and teachers. The situation worsens further when unsuccessful dropouts are compelled to enter the employment market, which does not have ready jobs even for successful first-graders. So, higher numbers of failures on the one hand and low standard of academic performance on the other have reduced the efficiency of higher education. This situation is also true of Punjab and, therefore, needs serious attention.
Concerned with higher education and placement of students, the Education Commission 1964-66 recommended the need to strengthen linkages between higher education and productivity, which leads to socio-economic development. There is no follow-up record of higher-level degree holders available in published or unpublished form; therefore, it is difficult to assess the social and economic relevance of higher degrees. The existing

educational system has not undergone any change, nor has it any direct linkage with the socio-economic needs of the people. Hence, a tremendous gap has developed between the supply and demand of an educated workforce. In this context, some studies highlight a large surplus of degree holders who could not fined a suitable place in the employment market, since they do not possess the relevant education or skill formation needed on the job market.
RELEVANCE AND ACCESS OF HIGHER EDUCATION TO THE DISADVANTAGED
The Education Commission (1964-66) rightly stated, ‘Indian society is hierarchical, stratified and deficient in vertical mobility. The social distance between the different classes, particularly between rich and poor, the educated and the uneducated, is large and is tending to widen ...’ Similar is the situation in Punjab, and this complex character of the population affects the socio-economic development of the state. People living in rural areas, and especially Scheduled Castes and Backward Castes and other economically weaker sections of society, are exploring the same educational opportunities as the other castes, because of lack of financial support. Although the number of women students in all the subjects at the higher level is increasing relatively in successive decades, the equality of women and men remains an issue of debate in relation to higher education. This demands immediate attention. In this context, the National Policy on Education (1986) has rightly emphasized the need for removal of disparities and equalization educational opportunities for all sections of society. Table 37 shows the gap between total enrollment and that of women and Scheduled Castes. In Punjab, the Scheduled Castes population is more than 33 per cent, but comparatively, their enrollment at postgraduate and graduate levels is significantly low. Their enrollment in different courses of studies is quite uneven, such as 86.27 per cent in arts/sciences/commerce, 2.93 per cent in teachers’ training, 4.30 per cent in medical and paramedical sciences, 0.54 per cent and 5.03 per cent in agriculture and engineering {Economic Survey o f Punjab).
Table 37Women and Scheduled Castes’ Enrollment in Higher Education
Year Postgraduate Students’ EnrollmentTotal
enrollmentWomen
enrollmentScheduled
Castesenrollment
Women as percent of total
Scheduled Castes as
percent of total1971-80 6901 3495 513 50.6 7.4
1981-90 7313 4239 745 57.6 10.1
1991-00 13848 9564 1313 69.6 9.1
Graduate Students’ Enrolment1971-80 84353 33661 7302 39.9 8.9
1981-90 86510 44439 9801 51.4 11.3
1991-00 179817 91663 18555 51.0 10.3
Source: Statistical Abstract of Punjab-2000; Economic and Statistics Organization, Punjab.

It is evident that despite government’s efforts, the enrollment of women and Scheduled Castes students is still far behind that of the general castes. Reasons for the educational backwardness of women and Scheduled Castes are mainly: (i) economic and social status of the families; (ii) lack of interest and inadequate backup by family or society; (iii) medium of instructions imparted in colleges and universities; and (iv) negative attitude of the students. Although the proportion of women and Scheduled Castes availing higher education has increased in relative numbers, there is still need to encourage them to go in for higher education.
REGIONAL (DISTRICT-WISE) IMBALANCES
Besides other educational variables, the dimension of regional disparities in facilities of higher education available is also noteworthy. Table 38 shows that these vary from district to district. There are a few districts, which have far better educational facilities than others, in relation to the actual requirements of the existing population. In Punjab, the 17-23 years age group population constitutes 14 per cent of the total. Table 38 presents figures of district-wise population of the age group 17-23 years, who have availed of higher education.
Table 38
Districts PopulationTotal
Population17-23*
Universities*
Colleges EnrollmentsPostgraduates Graduates
Total Total%
17-23%'
Total Total%
17-23%
Gurdaspur 2096889 293565 - 18 335 0.01 0.11 15689 0.75 5.34Amritsar 3074207 430289 1 28 2482 0.08 0.6 17283 0.51 4.01Kapurthala 752287 105320 - 19 287 0.04 0.3 7364 0.97 7.10Jalandhar 1953508 273491 1 26 2651 0.13 1.00 19557 1.00 7.20NawanShehar
586637 82129 - 11 54 0.009 0.11 4205 0.74 5.21
Hoshiarpur 1478045 206926 - 18 1571 0.10 0.81 12551 0.84 6.15Rupnagar 1110000 155400 - 11 166 0.01 0.11 6249 0.56 4.02Ludhiana 3030352 424249 1 40 3308 0.10 0.87 30812 1.01 7.31Ferozepur 1744753 244265 - 16 304 0.01 0.12 10316 0.60 4.22Faridkot 552466 77345 1 9 89 0.01 0.11 3918 0.70 5.15Mukatsar 776702 108738 - 11 70 0.009 0.64 4630 0.59 4.25Moga 886313 124083 - 16 10 0.002 0.05 5816 0.65 4.68Bathinda 1181236 165373 1 14 85 0.007 0.05 8272 0.70 5.00Mansa 688630 96408 - 7 25 0.003 0.03 2227 0.32 2.30Sangrur 1998464 279785 - 16 200 0.01 0.07 12428 0.62 4.44Patiala 1839056 257468 1 21 2188 0.11 0.84 15510 0.84 6.62FatehgarhSahib
539751 75565 - 6 23 0.004 0.03 2990 0.55 4.00
Punjab 24289296 3400501 6 287 13848 0.05 0.40 179817 0.74 9.28Source: Census Operation 2001; Punjab Series-17 and Statistical Abstracts-2001, Government of Punjab,
PP. 510-524.Note: Punjab University, Chandigarh is not included in the table
Medical colleges: Patiala-1. Amritsar-1, Faridkot-1, Ludhiana -2Engineering colleges: one each at Ludhiana, Patiala, Jalandhar, :Longowal, Gurdaspur, Faridkot, Malout, Mohali, Fatehgarh Sahib and Bathinda. Besides one medical college and one engineering college are also located at Chandigarh* Estimated population calculated from year age group return, (1991 census), indicating 14% of total population - 2001 Census

The data in Table 38 show that out of the six universities located in Punjab, three are in the adjoining districts of Ludhiana, Jalandhar and Amritsar. These districts are far better-off in their socio-economic and educational conditions and are considered to be developed districts of the state. Punjabi University, located at Patiala, is the only university, which provides educational facilities to some underdeveloped districts of Punjab. Punjab Medical University and Punjab Veterinary Sciences University, located at Faridkot and Talwandi Saboo respectively, are basically meant for human health and veterinary sciences. These two universities cater to a very small area of Punjab. Mansa, Sangrur, Gurdaspur, Mukatsar and Ferozepur are classified as backward districts and have very limited facilities of higher education. This shows that the universities located in Punjab basically promote higher education in developed and particularly in urban areas. This perpetuates regional (district-wise) disparities in higher education in the state. Besides, it is also notable that most of the engineering and medical colleges in the state are situated in urban areas of developed districts. This means that the backward districts need to be considered for thoughtful planning by the state government for the development of higher education. The quantitative information supplied by the Education Department gives the impression that there is need to establish more colleges and universities for bringing about a balance betw'een developed and underdeveloped, and urban and rural populations. Since Punjab is passing through a financial crisis, it is suggested that the state should not establish new higher educational institutions, but should use existing infrastructure for opening new sections for higher students’ enrollment in a shift system.
GROWTH OF TEACHING STAFF
Along with the expansion of institutions and students, there has been a corresponding growth in the number of teachers in the universities and colleges, from 483 and 6,052 (1971-1980) to 839 and 10,057 (1991-2000) respectively as Table 39 highlights.
Table 39Number of Teachers in Universities and Colleges, 1971-2000
Decades Universities Arts, Science, Commerce and Home science colleges
Engineering, Technology and Architecture colleges
Medical colleges (Allopathic only)
Teachers’ Training colleges (B.ed)
Men Women
Total Men Women
Total Men Wo-Men
Total Men Wo-Men
Total Men Women
Total
1971-80 398 85 483 3105 1604 4709 241 4 245 598 228 826 154 118 2721981-90 504 115 622 3401 2653 6052 252 16 268 849 257 1106 125 130 2551991-00 613 226 839 3421 3804 7225 866 208 1074 872 492 1364 108 286 394
Source: Statistical Abstract of Punjab 2001] Economic Advisor to Government of Punjab, Chandigarh.
Table 40 shows the district-wise number of teachers in recognized colleges according to courses of study.

District-wise Number of Teachers in Recognized Colleges according to Courses of Study (2000)Districts Arts, Science, Commerce and
Home science CollegesEngineering,
Technology and Architecture Colleges
Medical Colleges (Allopathic only)
Teachers Training Colleges (B.Ed)
Men Women Total Men Women
Total Men Women
Total Men Women
Total
Gurdaspur 273 258 531 48 55Amritsar 388 413 801 196 114 310 11 39 50
Nawan Shehar 107 89 196 13 17 11Hoshiarpur 325 249 574 14 20Rupnagar 1C9 171 280 60 39 99Ludhiana 473 778 1251 204 17 221 396 280 676 17 105Ferozepur 189 165 354 48 14 62 15 38 53Faridkot 58 34 92 28 37 109 33 142 11Mukatsar 71 75 146 35 10 45 12Moga 47 101 148 27 15 42 30 37Bathinda 132 120 252 63 14 77Mansa 51 30 81Sangrur 240 147 387 133 20 153Patiala 250 301 551 103 32 135 171 65 236 14 19Fatehgarh Sahib 48 36 84 26 10 36Source: Statistical Abstract of Punjab-2001 \ Government of Punjab.
The trend in recruitment of teachers reveals that the number of teachers in the universities and colleges has increased three-fold within the last three decades. Information available from the Higher Education Department, Government of Punjab, explains that the current situation has become variable (decrease or stagnation), because of limited funds and non-availability of grants on time. The number of students per teacher (teacher-pupil ratio) appears acceptable on the aggregate as Table 41 highlights:
Table 41 Student-teacher Ratio
University Teachers College TeachersDecades Students Teachers Ratio Students Teachers Ratio
1971-80 6901 483 14:3 84353 6052 13:91981-90 7313 622 11:8 86501 9239 9:41991-00 13848 839 16:9 179817 10057 17:9
Source: Statistical Abstract o f Punjab-2001; Economic and Statistics Organization, Punjab.
At most levels, the existing pupils-teacher ratio in the state conforms to the norms laid down by the Education Commission (1964-66). The existing number of teachers at university and college levels appears to be sufficient, with a reasonable a good ratio of 17 and 18 students per teacher. This suggests that, for the next two decades, no new appointment of teachers may take place at university and college levels, except for replacement of retirement, or any other unforeseen happenings, even though the number of students will keep on rising, both as a result of the natural growth in students and a decline in the dropout rate.

Higher education contributes to the development of every area by providing educated and trained manpower for its economic and industrial set-up. Thus, higher education and economy are closely related and have a direct impact on each other. The efficiency of the system is, therefore, judged by the quantity and quality of the product at the given cost. Efficiency can be considered, as to (1) whether the out-turn of graduates and postgraduates of university education is upto the mark both in terms of quantity (number passed) and quality (level of academic achievement), or (2) whether the graduates and postgraduates are equipped with skills and capabilities required by the existing economy, or whether there is a mismatch between the training imparted and the skills needed. This can be assessed by examining extent to which graduates and postgraduates are absorbed in the job market {Higher Education in India, pp.89-90). The present position of higher education in regard to efficiency and quality reveal the level of wastage and the number of failures at the first-degree stage or passes in third division. This adds to the number of educated unemployed. This is a major issue, which must be tackled. The quantitative expansion of higher education in the state has been unplanned and unbalanced. The expansion has taken place not by choice but by compulsion. Some times it has been in order to satisfy social and political demands. While the system has expanded in terms of institutions and enrollments, there has been no change in the basic infrastructure facilities for meeting the educational needs of the growing number of students. One of the obvious implications of this numerical growth, without qualitative improvement, is that students do not get the education desirable, related to the demand. The colleges do not have adequate space, classrooms, and playgrounds, libraries and laboratories. Inadequate infrastructure facilities contribute to low academic standards in the affiliated colleges, where more than 80 per cent of the enrollment is concentrated. The problem is particularly acute in urban areas where, due to political and social pressures, colleges have to enroll students beyond the allotted number of seats, strength, or unqualified or, below average students. Overcrowding in the affiliated colleges has almost made it impossible to produce quality pass-outs or to introduce any change or innovation. Even the condition of the professional colleges is not very healthy, where admissions are also made after charging heavy fees in the form of endowment funds. In these cases the merit and capabilities of the candidates are generally ignored. In such circumstances, retention of the quality and standards of education is impossible. This state of affairs demands serious attention.
Support for Research
Research, the highest academic endeavor, is either compulsory, or an optional subject, directed by different departments of different universities, especially in post-graduate courses. Obviously, research at this level cannot be expected to have a high standard of quality and the findings might not be accepted as valid to be considered for any policy or plan. M.Phil research is in partial fulfillment of degree requirements and in many cases, it can be extended to Ph.D Most research work at a higher educational level does not seem to be thematic; it is fragmentary and lacks precision of thought and technique, as reported by the Education Reforms Commission Punjab, 1985. The report did not underestimate the scope of fundamental research in education, but suggested that, to solve current educational problems, applied research, including action research, is equally important. Research must not be restricted merely to universities departments, but has to flow to other institutions too, and should be linked with the policy and planning strategies of the state.

The State Council of Education Research and Training, Punjab, has laid the main stress on pre-service and in-service teachers’ training. For giving in-service training to the already working secondary teachers, 12 in-service Training Centres have been functioning at District headquarters in the state. In addition, the State Institute of Science Education imparts in-service training to science and mathematics teachers. To impart training in the latest advances in educational technology, SCERT organizes seminars for teachers through the educational technology cell. The main objectives of these institutions are to; (1 ) bring about qualitative improvement in the existing educational system of the state; (2) provide pre- and In-service education for teachers and educational supervisors; (3) monitor and develop educational programmes; (4) introduce and implement new education policies of the Central and State Governments. Education Reforms Commission, Punjab, 1985, had also given importance to preservice or entering-service training programmes. It maintains that existing training programmes have no relevance to the present-day teaching and learning situation. A sense of professionalism is often lacking among teachers and no attempts are being made to arouse it. Institutions imparting teacher-education have superficial links with the existing system of education, whether in schools or in universities, therefore, the dominant thrust areas of teacher-education should be value-oriented education to strike a balance between the concomitants of advances in science and technology and humanistic values. As for vocationalization of education, teachers should be sensitized to acquire skills to link educational activity with work and employment, so as to create an urge for continuing professional education. In the current technological environment, there should be a special training programme package in the pre- and in-service training programmes. Teachers’ training institutes should have their own practicising schools. Information technology needs to be introduced in the course of the training programmes. To raise the quality and standards of education among pupils, it is absolutely essential to produce better-quality teachers and this can be done by providing better quality of training programmes. The state has no training programmes for teachers. It is necessary to initiate pre-service and in-service (condensed courses) training programmes for teachers, teaching in colleges and universities. The quality of teachers needs to be evaluated in terms of academic achievement, professional training, and the desirable attitude towards teaching as a profession. The present observations on Punjab’s teachers highlight the lack of a system of ensuring accountability of the teachers in terms of the quality of their teaching work. There is no system of evaluation of the teacher’s output with regard to teaching, research, innovation, and regularity at higher levels; hence, there is urgent need for the department of education to consider these issues seriously.
COURSES AND EXAMINATIONS
Examination is an integral part of the total educational process, as it has linkages both with teaching and learning. The examination component of the educational system has two broad objectives, namely, (a) to serve as a feed-back mechanism with regard to the effectiveness of the teaching-learning process, and (b) to classify the students at the end of a pre-determined period for purposes of class-promotion. In the present circumstances, examinations are being held mostly for the classification or promotion of students. The assessment is the basis of evaluating the performance of the students in a public examination, generally held annually. This system of examinations is almost identical in Punjab. The annual examination is the base for promoting students from one

class to another. In 1981, the UGC brought out a monograph on education reforms, which iterated the deficiencies, as a number of committees and commissions had earlier pointed out. On the basis of the recommendations of the committees and commissions, efforts have been made to remove the glaring shortcomings of the examination system. Basically, the whole system in the state has become examination-ridden. Mass copying (somewhere and sometime) is also prevalent at graduate and post-graduate levels. Some universities have introduced a semester system to reduce the burden of examinations on the students, but this effort has not produced significant results. Internal assessment, introduced in order to make evaluation of education an integral part of the teaching-learning process, has not produced much positive result. There is very low correlation between marks obtained by students in internal assessment and in external examination. Even the report of the Education Reforms Commission, Punjab, 1985, has maintained that the existing method of holding examinations in the state is not satisfactory. The use of unfair practices is on the rise. Teachers are not voluntarily coming forward to share responsibility because of various reasons. Hence the credibility of the existing examination system is fast disappearing. The report has suggested measures and approaches for overcoming the shortcomings of the examination system. Some of them are as under:
• The examination work should be made a part of the total responsibility of teacher.
• The heads of institutions should provide a list of teachers for performing these duties and each and every teacher should get his/her turn by rotation.
• A mechanism to co-ordinate and supervise the work of evaluation must be developed. To make the examination system clean, a code of ethics for the evaluation of the pupils must be evolved by the teachers themselves.
In the context of the situation in Punjab, there is no need for internal assessment; hence annual and terminal examinations alone (semester system) need to be conducted for students’ evaluation. As annual examination promotes the students to the next class and terminal examinations evaluate the memory, time sense, and reproducing ability of the students, these systems might remove anxiety, nervousness and fear of examinations among students.
INSTITUTIONAL AND DISTANCE EDUCATION (OPEN LEARNING SYSTEM)
With the advancement of science and technology, the concept of imparting higher education has undergone a tremendous change. The conventional concept has given way to that of distance education. The new approaches to teaching and learning combine together correspondence with different communication media, such as television, audio-video recorder, computer and even satellite, etc. The system aims at extending facilities of education to all individuals regardless of ‘who and where’. During the last decade, distance education has spread (correspondence courses and Indira Gandhi Open University system) throughout Punjab. The Open University system is an outgrowth of the development and wider acceptance of the concept of distance education. This includes use of non-print media as supplementary material, such as television, computer and satellite. Although Punjab has no open university, the Indira Gandhi Open University provides opportunities for higher education even here. Moreover, Punjab Technical University, Jalandhar, provides a franchise system of education for those, who are not enrolled in conventional institutions. The other universities, such as Punjabi University, Patiala, Guru Nanak Dev University, Amritsar,

and also Punjab University, Chandigarh, provide facilities through correspondence courses with print material and contact courses, mainly in Arts and literature subjects. In fact, the Directorate of Correspondence Courses and the Open University system have made significant progress in imparting higher education. Despite all efforts, this system of education mostly reaches the economically well-off upper class families, because of high fees. If the system of distance education has to develop into a viable and effective alternative to make education reach the most deprived and most needy population, then it has to provide education at nominal charges and introduce such subjects as are available in the conventional system of education.
FINANCIAL INPUTS, MONITORING AND CO-ORDINATION
In regard to the financial position, there is some difference in allocation of funds to government and non-government colleges. Statistics in previous tables revealed that the quantitative growth in higher education is noteworthy, but the flow of financial resources into the system of education is slow, insufficient and unevenly distributed. Financial resources are divided into two parts: (i) General Education and (ii) Technical and Professional Education.
Table 42
Plan Periods Plans after reorganized Punjab
GeneralEducation
Technical Education
1969-74 4* Plan 2 1 0 0 - 0 0 85-001975-79 5'" Plan 4237-00 125-251980-85 6 ‘ Plan 5300-00 300-001985-90 7' Plan 7637-00 2504-001992-97 8 '" Plan 21678-00 19600-001998-2003 9‘ Plan 41310-49 26202-50
Source: Prepared from different Plans and a so recorded from department of higher andtechnical education.
Figures in Table 42 indicate a regular increase in the allocation of funds from the Fourth Plan to the Ninth Plan. The successive five-year plans indicate that the allocation of funds has increased in technical and professional education but general education has relatively suffered. The financial resources, though considerably increased in absolute terms, have been found grossly inadequate for imparting higher education to the major portion of the population. Inadequacy of funds has also affected adversely the qualitative development of education. As the number of institutions of higher education in the state has increased considerably and enrollment of students too, expenditure on higher education needs to be increased accordingly, as Table 43 shows.
Table 43
Year Plan Non-Plan TotalA.E. R.E. Exp. A.E. R.E. Exp. A.E. R.E. Exp.
1997-98 371.7 162.24 115.91 13128.7 15055.5 13684.75 13500 4 15217.7 13800.661998-99 428.7 333.51 205.49 15664.32 17751.84 16533.07 16093.02 18085.4 16738.56
1999-2000 473.2 393.7 59.2 14932.98 21866.08 21396.5 15406.18 22259.8 21455.72000-01 490.7 251 117.46 19516.72 21323.62 21851.24 20007.42 21574.6 21968.72001-02 246.2 237.51 67.17 19934.91 22392.54 - 20181.11 22630.1 -2002-03 535.2 - - 19872.77 - - 20407.97 - -
Source: Department of Higher Education Punjab, Chandigarh, April, 2002 (Unpublished)Note: A.E; Approved Estimates, RE: Revised Estimates, Exp.: Expenditure

The general trend of resource allocation shows that a major part of the expenditure is on salaries of teachers. The proportion of expenditure on staff salaries has been continuously rising over successive decades in Punjab. This leaves little for expenditure on enhancing the quality of education. This has an adverse effect on developmental objectives.
Besides funds allocated by the state government, there are several other bodies, apart from individuals and business undertakings, which contribute directly or indirectly to the expenditure incurred by educational institutions. These include the Central Government, University Grants Commission, universities, etc. The trend of expenditure by such institutions, however, cannot be projected for future years. The proportionate distribution of expenditure on teachers and other staff salaries, recurring and non-recurring expenses is shown in Table 44.
Table 44Distribution of Expenditure on Salaries and other Management (Percent)
Years College/UniversityRecurringSalaries
Non-Recurring
Teachin Non-Teaching
TotalSalanes
Other Total Nonrecurring
GrandTotal
1980-81 60.62 13.99 74.61991-92 57.3 15.1 72.4 22.6 95.0 5.0 100.002001-02 55.0 16.0 71.0 23.0 94.0 6.0 100.00
Professional Insti utions1980-81 44.70 20.73 65.43 100.001991-92 42.0 24.0 66.0 26.0 92.0 8.0 100.002001-02 40.0 26.0 66.0 26.0 92.0 8.0 100.00
Source: Ec ucation Reforms Commission Punjab, 1985, section II, P. 148.
The report of the Education Reforms Commission, Punjab, 1985, clarified that in absolute terms both teachers’ salaries and total per student expenditure would rise steadily over the years. However, no separate estimates have been made for college and university education, even though the cost of education is known to be markedly different for arts and science students and those undergoing professional courses, such as medicine, engineering, business administration, agriculture and computer science. The report pointed out that the proportion of students going in for advanced courses have risen from 5.3 per cent of the population in the 18-23 years age group in 1981-82, to 6.7 per cent in 1991-92, and 8.2 per cent by 2001-02. In the absence of per-student cost data for all these disciplines, averages were arrived at to represent the cost for students above the plus 2 level, in two categories; those studying general courses in colleges and universities and those in professional institutions studying medicine, engineering and the like. This exercise, broadly indicates the large amount of money that would be required to impart education to students at higher levels in the next two decade, without specifying the breakup of students under various disciplines.
Besides the above, expenditure per pupil at the higher level of education has apparently increased. Although per-student cost is not available, there are estimates that indicate that expenditure per pupil at higher professional levels is two to three times higher than at higher general-education level. A good explanation for such a difference in favour of

professional education as against general education in allocation of funds has been given by Varghese {Resources for Higher Education in India,1987). There is a positive correlation between the socio-economic background of the students and the level of educational achievement. Professional and technical courses normally attract students from urban affluent families. This is perhaps true not only for Punjab, but for other states also. Dhar {Education and Employment in India,1976) pointed out that sons and daughters of well-off parents study in such fields as medicine and engineering, which command higher salaries, and are characterized by very low unemployment rates. Youths from lower social economic groups attend arts, science and commerce colleges. The policy of admissions also tends to help in maintaining such a discriminatory system. Generally, admissions to professional courses are made on the basis of competitive tests, which tend to help students from well-to-do families, mostly from urban areas. Sharma {Professionals in the Making; Their Social Origins, 1976) reached the conclusion that the urban background and public school education with high proficiency in English, rather than proficiency in the subject, help in securing good marks in competitive tests. This means obviously that competitive examinations are in favour of a few rich families, ignoring the interests of the poor masses. This relates to the cost of education, which has increased significantly in terms of current prices. This situation also exists in Punjab, relatively, and needs to be given serious consideration.
ISSUES FOR FUTURE CONSIDERATIONS (HIGHER EDUCATION)
Besides the above discussion, it is imperative to discuss issues, which too need serious attention.
1. It is evident that the higher education system in Punjab has expanded significantly since the reorganization of the state. The number of universities has increased from three to seven in the last three decades (1971-2000), a more than 100 per cent rise. Colleges (general and professional), which were 188 in 1971-80 increased to 287 in 2000 and are located in both rural and urban areas. The system has enrolled nearly two lakh students in various undergraduate and post-graduate courses. Women and Scheduled Castes students constitute about60.3 per cent and 9.7 per cent of the total enrollment in institutions of higher education. Nevertheless higher education still demands specialized human resource development with improved infrastructural facilities.
2. Despite the extremely high growth rate of higher education, Punjab still lags behind, in terms of International standards’ in providing opportunities of higher education to the relevant age group (17-23). The UNESCO Statistical Yearbook 1995 indicated that a very small portion (6 %) of the relevant age group of population of India was enrolled in institutions of higher education. However, Punjab has a slightly better record in this regard. A large number of students do not go beyond graduation. About 90 per cent of the total enrollment into higher education is for undergraduate courses. About nine per cent of the students are enrolled for postgraduate courses and less than one percent (0.2%) for Ph.D and M.Phil research work. The maximum numbers are in liberal arts/science courses (89.25%). Engineering and technical and professional courses attract a very small percentage (10.75%) of students. In the circumstances, there is urgent need to encourage students to shift from liberal arts/sciences to paramedical and applied sciences. This will bridge the gap between technical and professional and arts/sciences courses.

3. Autonomy and accountability are considered to be important aspects of qualitative management. Almost all the commissions on education have recommended (a) delegation of powers and duties’: (b) autonomy to departments and colleges, and (c) accountability of different participants of the system. The report, Alternative Models of Management, by Gnanam, recommended (a) decentralization of responsibilities and authority: (b) participatory management: (c) accountability of all participants: and (d) assessment of performance. Current evidence continues to support the observations of the Govariker Committee Report (1988), on the management of universities in India. As it pointed out, the management of universities in India is of a rigid and controlling nature, leaving no scope for any invention/innovation in the teaching- learning process. The entire university system has been reduced to conduct of examinations, declaration of results and planning for new admissions. Recommendations on delegation of power, autonomy, and accountability are yet to be implemented at the university as well as college levels. The existing system of higher education in Punjab demands that autonomy must be given to universities and to certain colleges in respect to teaching methodology, curriculum development and examination improvement, under a system of monitoring and evaluation. The accountability of the institutions is essential as it checks fall in standards and malpractices.
4. Despite all encouragement from the University Grants Commission and the StateEducation Department, no autonomous college exists in Punjab. The scheme of autonomous colleges, suggested by the Commission and the National Policy on Education (1986) and Programme of Action of (1986), needs to be activated.
5. Maintenance of quality and standards in the institutions of higher education is theresponsibiHty of the University Grants Commission and the State Education Departments. The University Grants Commission has suggested some norms for maintenance of minimum standards of the teaching- learning process in universities and colleges. These are: there should be 200 working days, 40 working/teaching hours per week by per teacher, and 75 per cent minimum attendance of students at tutorials along with lectures. But, in practice, universities and colleges work for not more than 100 days in a year. If an institution of higher education works for only 1 0 0 days, instead of 2 0 0 days, then the quality of the teaching-learning process is bound to suffer. Keeping this in view, it is suggested that there is need to revamp the whole system of examinations, vacations and admission pattern. Motivation will be needed for the involvement and dedication of teachers.
6 . The quality of output is usually assessed in terms of (a) performance inexamination and (b) placement level. This assessment might be valid, but it has no relevance to the demands of the employment market. For this, job-oriented courses might help ensure better placements. There is also need to prepare database by each institute of higher education in the state, and also in the country.
7. As far as the performance of students is concerned the rate of wastage at theundergraduate level is almost 40 per cent to 50 per cent (AlU, 1985) and 40 per cent to 60 per cent (AlU, 1996) at the post-graduate level. These percentages have been obtained from specific case studies. The performance of college and university students in Punjab is also more or less the same. This wastage could possibly be reduced by providing new opportunities for a career in research and management with better incentives.

8 . The University Grants Commission has initiated various schemes for curriculum development and restructuring courses, to reorient these to the needs of the society. A study by AID (1985) indicated that the system of higher education had become obsolete. It neither helped those who wanted to go for self-employment nor those who wanted to go for jobs of any kind. The present system in Punjab apparently is in a similar position and has not undergone any sigrrificant change. Although, one or two universities and some colleges have gone for restructuring of courses and adopting an interdisciplinary approach in the teaching-learning process, this is not sufficient, hence a fundamentally fresh approach is needed.
9. Although the participation of women in higher education has increased in relative numbers, they continue to participate only in such traditional courses as arts, humanities and education. Maximum participation of women candidates (45.6% to 60.3%) in total enrollment has been seen during the last three decades, but their participation in technical and professional courses is comparatively extremely low. The participation of SC candidates in institutions of higher education has increased relatively. They constituted 9.7 per cent of the total enrollment in higher education, which has increased marginally (8.1% to 9.7%), within the last three decades. For greater participation of women and Schedule Castes students in job-oriented science subjects, there is need to change the attitude of families concerned and society, as a whole.
10. Distance (open university) education is imparted through correspondence courses with the following objectives; (a) providing efficient qualitative education through less expensive methods, (b) meeting the increasing demand for higher education, and (c) providing education to all those who cannot reach the conventional university teaching for various reasons. This method of teaching/learning is quite acceptable but, In practice, it only reaches economically well-off families. The University Grants Commission too encourages correspondence courses and open university system in the states. Presently, the system suffers from some deficiencies: (a) low quality of education; (b) covering only arts and social sciences in higher education; (c) repetition of courses already available in the conventional universities, and (d) lack of use of new technologies of education, etc. These universities should take serious steps to remove these deficiencies. Revamping the curriculum is necessary to make it more practical and job-oriented and better facilities are required for the contact programme and libraries. There is scope of opening up access to new disciplines of practical need of the students.
11. The share of higher education in the public current expenditure in India is 14.7 per cent, which is much lower than that of some of the developed countries {UNESO Statistical Year Book, 1995). Hardly one per cent of the GNP is spent on research and development in science and technology. Expenditure on research and development and higher education ultimately determines the level of future development of the country. Punjab, being a developed state, financing higher education is an important issue and the question is who should be responsible -- the State, or the Centre, or the beneficiaries, or everyone? The World Bank’s view is that higher education in India is subsidized for children of well-to-do families. A similar situation exists in Punjab. The beneficiaries have the capacity to pay, therefore, they should pay. A similar view has been taken in a White Paper prepared by the Ministry of Finance, Government of India. It treats higher education as a non-merit good and maintains that as the substantial benefit of education goes to individuals, it should be treated as private good, for which students should pay. Financial assistance is essential for research-

oriented courses. Earn while learn schemes may help generate more participation in the existing system of education.
12. The methods of teaching are weighted in the direction of memorizing of texts for merely getting degrees, which are meant for getting employment or better marriage prospects. Now the time has come, when degrees awarded should be linked with employment, or self-employment opportunities. The system needs revamping, hence a broad-based overall approach is needed for the evaluation of students.
13. Planning for general and professional education (especially technical education) should be aimed at achieving self-reliant growth and upgradation of domestic technological capabilities. To strengthen Punjab’s scientific and technological capabilities, it is necessary to initiate research and development in different related areas. Although technical and vopational Institutions from ITIs and polytechnics to post-graduate level courses cover science and technology disciplines, there is need for an NT as an apex body in Punjab, which should have linkages with technical courses in different higher education institutions located in the state.
14. There is serious unemployment among engineers and technicians in the state, because of mismatch between qualifications of students coming out of these institutions and the demand of the industry. There is also the factor of sick units, or the failure of the industrial units at various focal points in the state. Hence there is urgent need to establish and develop industrial units in the state. With the anticipated industrial growth and economic development in the next two decades, there will be scope for the absorption of many qualified engineers and technicians. At present, many highly qualified engineers and technologists migrate abroad or to metropolitan cities in search of better employment opportunities. Establishment and development of industrial units in the state might check out-migration of qualified and skilled manpower, and also in- migration of unskilled, unqualified people. Modification in industrial policy is needed to check brain drain.
15. Technical education institutions by and large function independently. Linkagesbetween technical institutions and users’ agencies are not sufficiently strong. Taking into account the current situation and the likely needs of successive years, more concerted efforts need to be made to enable technical education play its desired role in meeting the needs of industry. Taking into account the state’s development and socio-economic perspectives, there is need to reorganize the technical education system, through induction of improved technologies’ aimed at providing adequate technical and managerial manpowerto the service sector as well as the unorganized sector.
16. There is need for development in other areas, such as micro-electronics,informatics, telemetric, bio-technologies, engineering design, material sciences, instrumentation and space technology. A well concerted and co-ordinated approach to the introduction of’ emerging technologies in innovative industries might further accelerate the development and socio-economic growth of the state.
17. Political will is needed if technical education is to address itself to these multipleand challenging tasks. As scientific and technological advances are very rapid and unpredictable, a viable approach to technical education must encourage development of motivation and skills for continuing and independent learning. Hence, there is need to reshape, restructure and reorganize the technical education system for producing high quality engineers and technologists, so that

they may contribute to the development of the state and meet the challenges of the future.
18. Due to social and political pressures, the higher education system in Punjab has expended faster in the last two decades in terms of institutions, enrollment and manpower. Higher education is today apparently open to all, irrespective of merit or capabilities. Its rapid expansion is due to a higher pressure on enrollment in colleges and universities without proportionate expansion of essential infrastructure facilities. This has adversely affected quality and standards. A large majority of such colleges are located in urban areas, providing educational facilities to urban students; therefore, the rural pupils have limited scope for higher education. This deprives them of opportunities to compete with urban pupils, both in further educational avenues and in the job market. A rational approach is needed for opening new colleges and also attention to proper infrastructure, numbers of candidates and the viability of the courses.
19. Private affiliated colleges receive government aid to the extent of 95 per cent of their recurring expenditure based on their staff strength (according to the Directorate of Education). This aid has now become inadequate in view of the increase in the administrative and teaching staff of these colleges. The grants, more often than otherwise, are not available in time, which cause considerable hardship to the institutions and their staff. This system needs to be reviewed. The Education Reforms Commission, Punjab, 1985, pointed out that the state has a well-founded system of university education. The prime objective of the university is to engage itself in the pursuit of creating new knowledge. The need of the economy and all development processes is for persons skilled in the art of utilizing the already discovered knowledge for the benefit of society. An analysis of the manpower needs of any organized socio-economic system would reveal that, for its successful functioning, it requires 80 per cent of its personnel trained in skills for utilizing the existing knowledge and only 2 0 per cent of those for generating new knowledge. While our universities are geared to train only the latter category, our tertiary system has no provision for training the former, which constitutes the bulk of the manpower needs of the economy. Until the gap is filled, or facilities for doing so are fully developed, education at this level will remain unbalanced. This mismatch between needs of, and achievements in manpower development is responsible for educated unemployment and pressure on universities, leading to a fall in standards of education.
20. Government should encourage private enterprises and avoid creating a system based on affiliation of institutions with central agencies. It is also suggested that the government may follow the Bits-Pilani pattern (practical school, where practical training has been given more importance) for technical education in Punjab.
SUMMING UP (HIGHER EDUCATION)
Most of the relevant issues concerning higher education were first discussed by the Universities Education Commission (1948-49) and then by the Education Commission (1964-66). Both expressed grave concern about the deteriorating quality of higher education. The National Policy on Education (1968) too proposed various measures for the improvement of higher education. It has suggested the need for effective measures for all-round improvement and emphasized consolidation and expansion of facilities in existing institutions. It has also expressed concern about deteriorating academic

standards in affiliated colleges. This system does not provide autonomy to deserving colleges to frame curricula, courses of studies, or develop their own system of evaluation. It has clearly stated that courses and programmes should be redesigned to meet the demands of specialization. The scheme of re-designing courses has been introduced by UGC to re-model the conventional three subjects’ course of the first- degree level. The National Policy (1986) suggested that teachers’ performance should be systematically assessed and also proposed provision of enhanced support to research and steps to ensure its high quality. It also envisaged the establishment of a National Apex Body covering general and professional education for greater coordination and consistency of policy, sharing facilities and developing inter-disciplinary research. The UGC has given high priority to the implementation of NPE (1986). Presently, in Punjab, the responsibility for the development of professional and technical higher education is shared by the Department of Education and a number of other agencies. There are separate structures for higher education in engineering, medicine and agriculture. Separation of decision making and funding mechanism has become more of a problem, because various disciplines are emerging, and courses of study have to be developed, keeping in view the need for developing compatible inter-faces with other related disciplines. In order to remedy this problem, there is need to establish a state apex body for higher education, undertake integrated planning and reinforce programmes of post-graduate education and interdisciplinary research. NPE (1986) also has specific proposals for improving overall improvement of the efficiency of the universities. Effective measures will have to be taken for improving the working conditions of teachers and the quality of teaching. A comprehensive, open, participatory and data-based system of teacher-evaluation needs to be established. It should take into account the work of teachers in research and innovation, regularity and attention to teaching and extension, and social service activities.
Many good schemes suggested by the different Commissions (1948-49 and 1964-66), and Policies (1968 and 1986) have not provided expected results because of inadequate strategies for implementation, lack of financial resources, or lack of political will. Some of the programmes were not implemented and some failed because of scarcity of funds. A firm determination and a strong political will are the essential instruments, which can pave the path to success. If the Government of Punjab has desirable intentions and is willing to bring about qualitative improvement in higher education, then the suggested measures might be helpful in shaping and reshaping the existing educational system of higher education.
References
Balachander K.K., Higher Education in India: the shifting perspective, University News, A.I.U, No. 12,1988
Census of India (2001), Provisional Population Totals, Paper 1, Series 4, Punjab.
Centre for Research in Rural and Industrial Development, Block Level Plans of Faridkot and Lambi, (Unpublished Report), 1998
Centre for Research in Rural and Industrial Development, Impact of Women Specific and Women Related Schemes in the State of Punjab, (Unpublished Report), 2000

Centre for Research in Rural and Industrial Development, Social Protection Programme for the Children in Sports Goods Especially Football Stitching in Jalandhar, (Unpublished Report), 2001.
Chauhan, C.P.S Higher Education in India; Ashish Publishing House, New Delhi, 1990.
Department of Education: information collected from the office; Department of Higher Education, Punjab, Chandigarh, April 2002.
Department of Planning, Five Year Plans, Government of Punjab, Punjab
Dhar, et al. Education and Employment in India; the policy nexus, Minerva Publications, Calcutta, 1976.
Directorate of Education, Educational Statistics at a Glance of Punjab, 1999, Punjab
Economic Advisor to Government of Punjab, Statistical Abstract of Punjab (1970-2002), Punjab
Economic Advisor to Government, Economic Survey of Punjab (2000-2001), Punjab
Education Department, Punjab Education Policy (2002), Plan of Action, Punjab
Government of Punjab: Annual Plan— Department of Higher and Technical Education; http://punjabgovt.nic.in/ Education/ edu851.htm and http:// Punjabgovt. nic.in/ Education/ edu89.htm.
Government of Punjab: Economic Survey of Punjab; Advisor to Government of Punjab - 2001- 2002, Chandigarh, 2002.
Government of Punjab: Education Reforms Commission, Punjab, 1985; Section-1, II and III, Chandigarh,1985.
Government of Punjab: Statistical Abstract of Punjab-2001; Economic and Statistical Department, Chandigarh-2001.
Kaur Kuldip, Education in India-1781-1^85: Policies, Planning and Implementation', CRRID, Chandigarh, 1985.
Ministry of Education, Challenge of Education 1985), A Policy Perspective, Government of India, New Delhi
Ministry of Human Resource Development, Analysis of Budgeted Expenditure on Education (1995-96 to 1997-98), New Delhi.
Ministry of Human Resource Development, Government of India, National Policy on Education, (1986), Programme of Action, New Delhi
Ministry of Human Resource Development, ‘Manpower Profile (2001)’, India Year Book.
Ministry of Human Resource Development, Selected Educational Statistics, 1998, Government of India, New Delhi.
Raza Moonis (Ed.), 'Higher Education in India’ (Retrospect and Prospect), Association of Indian Universities, New Delhi, 1991.
National Council of Applied Economic Research (NCAER), India Human Development Report, (1998), New Delhi

National Council of Educational Research and Training (NCERT), Sixth All India Education Survey, Main Report, (1999).
Raza M. and Premi, ‘Indicators of Equity Education’, Journal of Education Planning and Administration, NIEPA, New Delhi, 1987.
Sharma B.R., 'Professionals in the Making - their social origin’; Economic and Political weekly, February 1976.
Varghese, N.V, ‘Resources for Higher Education in India - An Explanation’, Journal of Education Planning and Administration, Vol. 1, Nos. 3 and 4, NIEPA, New Delhi 1987.

Chapter 12 LABOUR AND EMPLOYMENT
INTRODUCTION
No doubt Punjab has made tremendous progress since independence and has been a leading state in per capita income and food production in the country. However, of late, the state has witnessed a low rate of growth as compared to some major states and the country as a whole, which has serious implications, especially for the expansion of higher employment opportunities. One of the serious problems Punjab is confronted with at present is the high level of unemployment. Disguised unemployment in the agricultural sector and the large volume of low-quality, existing employment, are causes of concern. Particularly, unemployment among the educated youth is serious in the state. The growth of employment has not been commensurate with that of the state domestic product, resulting in underutilization of the labourforce. An important objective of development planning has been to provide for increasing employment opportunities not only to meet the backlog of the unemployed but also the new entrants to the labourforce. One of the important monitorable targets for the Tenth Five Year Plan at the national level, that has rightly been given prominence, is providing gainful high-quality employment to the labourforce (Ministry of Finance 2001). Similarly, the major thrust area, as a strategy in the Tenth Five Year plan of Punjab, is the generation of additional employment opportunities in the private sector by promoting investment and improving marketable vocational skills with widespread use of information technology. However, the process of globalization and privatization has serious implications for further generation of employment opportunities in the organized sector, especially the public sector, where the disinvestment process is on and the emphasis is on resource efficiency. The higher use of capital-intensive technology in the wake of the new economic order has serious implications for generating employment opportunities. This points to further deterioration of the employment situation in the short run, if not in the long run and hence, appropriate policy interventions are required at various level, in order to improve the employment situation in the state.
This section of the chapter seeks to examine the dimensions of the employment and unemployment situation in the state, status and quality of employment, sector-level changes in employment especially farm and non-farm employment, employment in the organized sector, role of special employment generating schemes/programmes and status of skilled and trained manpower. The trends and structure of employment and unemployment have been analysed at the area, gender, age, and education levels over specific periods, for which relevant information is available. Appropriate policy recommendations have been made, after a detailed study of the vahous aspects of the employment and unemployment situation in the state and related issues.
DIMENSIONS OF EMPLOYMENT AND UNEMPLOYMENT
Measurement Criteria
Analysis of the measurement, trends and structure of employment and unemployment in Punjab is mainly based on quinquennial surveys earned out by the National Sample Survey Organization (NSSO). Different approaches have been used to determine the activity status of persons during specific reference periods, namely one year, one week

and each day of the reference week. Based on these periods, three different nneasures of activity status, such as usual status, weekly status and daily status, have been arrived at as follows.
Usual Status
Usual principal status: A person is considered in the labourforce on Usual Principal Status (UPS) if he/she has spent relatively longer time (i.e., major time criterion) on economic activity during 365 days preceding the date of survey. Persons classified as not belonging to the labourforce are assigned the broad activity status of ‘neither working nor available for work’. The activity status of persons, who belong to the labourforce, of working or not ‘working but seeking and/or available for work’, is ascertained on the basis of major time criterion. UPS unemployment rate is the proportion of those classified as unemployed on this basis expressed as a percentage of those classified as being in the labourforce. On this criterion, a person can be counted as unemployed even though he/she may have been employed for part of the year.
Usual principal and subsidiary status: A person, whose principal usual status has been determined on the basis of major time-criterion, could have pursued some economic activity for a relatively short time during the reference period of 365 days preceding the date of survey. The status in which such economic activity was pursued is termed the subsidiary status of that person. This is a more inclusive measure which covers, in addition, participation in economic activity on a more or less regular basis, of those classified as unemployed on the UPS as well as those as being outside the labourforce on the same criterion. This criterion is termed as Usual Principal and Subsidiary Status (UPSS). This would result in a higher proportion of the population as being in the labourforce with a higher proportion of workers and lower unemployment rates relative to the UPS criterion.
Current Weekly Status
The Current Weekly Status (CWS) of a person is the activity status pursued during a reference period of seven days preceding the date of survey. According to this criterion, a person is counted as employed if he/she was engaged in economic activity for at least one hour on any day during the reference week. A person who is not working even for one hour on any day but found seeking/available for work during the reference week is classified as unemployed. A person who had neither worked nor was available for work anytime during the reference week is considered as engaged in non-economic activity (or not in the labourforce). To the extent that employment varies seasonally over the year, the labourforce participation rates (LFPR) on the current weekly status would tend to be lower. However, CWS unemployment rates would tend to be higher when we consider unemployment during the current week of those classified as being employed in the UPS (or UPSS) criterion. The difference between unemployment rates on current weekly and that on usual status would provide one measure of seasonal unemployment.
Current Daily Status
The activity pattern of population, particularly in the unorganized sector, is such that during a week and sometimes even during a day, a person could pursue more than one activity. Based on the time disposition of a person on each day of the reference week, person-days employment/unemployment are aggregated to generate estimates of

person-days in employment/unemployment. On Current Daily Status (CDS) criterion, a person was considered working for the entire day if he/she had worked for four hours or more during the day. If the person had worked for one hour or more but less than four hours, he/she was considered employed for half-day and seeking or available for work (unemployed), or neither seeking nor available for work (not in the labourforce) for the other half of the day. The person-days unemployment rate is derived as the rate of person-days in unemployment to the person-days in the labourforce. This measure emphasizes the unemployment of those employed on a weekly status. This measure of unemployment fully captures open unemployment. However, the analysis of data has been done by and large on the basis of UPSS approach, supported by other measures wherever necessary.
Labour Force Participation Rates (LFPRs) in Punjab
According to usual status, CWS and CDS criteria, labourforce participation rates for rural as well as urban males has declined by one per cent during the six years from 1993-94 to 1999-2000 (Table 1). On the other hand, LFPR for rural females has remained almost the same over this period according to the UPS criterion, whereas it has increased from about 22 per cent to 28 per cent according to UPSS. This indicates that a higher proportion of females in rural areas are subsidiary workers. LFPRs are higher for urban males than rural males in the state, for whom these show a declining trend since 1987- 8 8 .These rates for urban males show an increase from 1987-88 to 1993-94 and afterwards a decline in 1999-00. This LFPRs suggests that more people are joining school and also that there is a reduction in the growth of population.
Table 1Punjab
Usual Principal Status 1987-88 1993-94 1999-00Rural Male 55.3 55.0 53.9Rural Female 8 . 1 4.0 4.3Urban Male 56.0 57.0 55.9Urban Female 6 . 8 6.3 7.5Usual Principal & Subsidiary StatusRural Male 57.1 55.4 54.3Rural Female 32.1 22.3 28.2Urban Male 56.5 57.1 56.5Urban Female 13.3 9.9 1 2 . 8
Current Weekly StatusRural Male 55.1 55.1 54.0Rural Female 8.3 2 0 . 2 27.4Urban Male 56.1 57.0 55.9Urban Female 7.9 9.7 1 1 . 1
Current Daily StatusRural Male 55.0 54.8 53.2Rural Female 7.6 1 2 . 0 15.8Urban Male 55.8 56.8 55.5Urban Female 7.4 7.9 9.0Source: NSSO 1990, 1997, 2001

Worker-Population Ratios (WPRs) In Punjab
WPR is an important indicator of development showing the proportion of working population in an economy. Table 2 indicates that WPR in Punjab, based on UPS criterion for rural males and urban males, was 52.6 per cent and 54.1 per cent respectively in 1999-2000. On the other hand, WPR based on UPSS was 53 per cent for rural males and 57.7 per cent for urban males over the same period. The female WPR in the state during 1999-2000 was four per cent on UPS and 28 per cent on UPSS criterion in rural areas. This indicates that a large proportion of women work in a subsidiary capacity in rural areas. The female WPRs based on CWS and CDS, which are comparatively higher, support this conclusion.
A glance at Table 2 shows that there has been a declining trend of WPR based on UPSS since 1983 for rural as well as urban males. For instance, WPR for rural males has steadily declined from 67 per cent in 1983 to 53 per cent in 1999-2000 and for urban from 62.4 per cent to 54.9 per cent over the same period. However, WPR for rural females, which declined from 36.5 per cent in 1983 to 22 per cent in 1993-94, has increased to 28 per cent in 1999-2000. A similar trend is witnessed for women workforce in urban areas. WPR in urban areas is comparatively higher than in rural areas by usual status approach.
Table 2
1983 1987-88 1993-94 1999-00Usual Principal StatusRural Male 63.4 53.7 54.2 52.6Rural Female 4.7 7.5 3.7 4.0Urban Male 61.5 53.2 55.1 54.1Urban Female 8.46 5.8 5.8 7.3Usual Principal and Subsidiary StatusRural Male 67.0 56.0 54.6 53.0Rural Female 36.5 31.7 2 2 . 0 28.0Urban Male 62.4 54.0 55.3 54.9Urban Female 14.9 12.3 9.3 12.5Current Weekly StatusRural Male 62.3 53.1 54.1 52.3Rural female 1 0 . 2 7.9 19.9 27.9Urban Male 61.2 53.1 55.0 53.7Urban Female 10.3 7.0 11.7 15.5Current Daily StatusRural Male 59.1 52.9 53.3 51.0Rural Female 7.1 7.1 11.7 15.5Urban Male 59.1 52.0 54.6 52.9Urban Female , 9.5 6.5 7.5 8.5
Source: NSSO 1987, 1990, 1997, 2001.
Age-specific Worker-population Ratio (ASWPR)
The number of persons usually working in a particular age group per 1,000 persons in that age group is defined as the age-specific worker population ratio. Table 3 gives the ASWPR for Punjab for all workers based on UPSS criterion for 1999-2000. Comparable

estimates are given in the second row of each group for 1993-94. It can be observed that ASWPR among rural males declined in the younger age groups as well as in those aged 50 years and above, during 1999-2000 as compared to 1993-94. It has remained almost the same for age groups of 25 to 49 years. However, ASWPR among rural females has increased over this period. This is mainly because of an increase in subsidiary workers. A similar trend is witnessed in younger age groups, both males and females, in the urban areas over this period
Work Participation Rate at the District Level
Table 4 clearly shows that the total work participation rate has increased in all the districts of the state during 1991-2001, the highest WPR being in Nawanshahr district and the lowest in Gurdaspur district. Total WPR for the state as a whole has increased from 30.9 per cent in 1991 to 37.6 per cent in 2001. However, a look at the gender-level WPR indicates that female WPR has substantially increased during this period from 4.4 per cent to 18.7 per cent, whereas the male WPR has remained almost the same at 54 per cent. Table 4 shows that female WPR has increased in all the districts of the state, whereas male'WPR has increased in some districts, decreased in some others and remained the same in the rest. This can partly be attributed to the level of changes in the growth of different sectors in various districts. Increase in female WPR is encouraging. However, there has been a significant increase in the proportion of female marginal workers during the decade. Among Indian States and Union Territories, Punjab ranked 2 4 th i th 2 0 ‘h respectively during 2 0 0 1 in terms of the total, male and female work participation rates. Generally, WPR is higher in those districts, which are agriculturally dominated.
Table 3Age-specific Usual Worker ( JPSS) Population Raitio in Punjab
Age group (in years)
RuralMale
RuralFemale
RuralPersons
UrbanMale
UrbanFemale
UrbanPersons
0-4 - - - - - -i1 — — — ~ — —
5-9 5 3 5 14 2 2 18— — — — — —
10-14 6 8 42 55 45 23 35
75 29 53 55 1 2 3415-19 447 258 359 354 125 245
566 205 405 469 56 29420-24 849 377 605 724 1 2 2 433
913 259 592 802 99 450
25-29 949 421 681 937 154 642970 325 637 977 1 0 1 567
30-34 972 460 711 980 194 575967 376 672 969 189 589
35-39 990 560 771 980 226 611988 482 737 980 185 606
40-44 978 622 809 980 244 649972 531 749 997 263 657
45-49 985 614 819 984 258 642

Age group (in years)
RuralMale
RuralFemale
RuralPersons
UrbanMale
UrbanFemale
UrbanPersons
974 435 724 961 216 635
50-54 919 490 729 923 305 673
958 375 691 928 190 57155-59 877 431 639 862 204 507
940 359 635 896 169 52260 & above* 589 2 1 1 405 466 57 260
792 259 545 659 76 379
All 530 280 410 549 125 353546 2 2 0 392 553 93 336
All India 531 299 — 518 117 —
553 328 - 521 1 2 1 -
Source: NSSO 1997, 2001.Note: Figures in the second row in each age group refer to 1993- 94.
* In the age group 60 and above; the figures for 1993-94 belong to theage group of 60-64 years.
Table 4Work Participation Rate at the District Level in Punjab, 1991 and 2001
State/Districts Work Participation RateTo tal Male Female
2 0 0 1 1991 2 0 0 1 1991 2 0 0 1 1991Nawanshahr 44.9 29.8 55.6 53.0 33.0 4.0Faridkot 42.4 32.8 59.5 55.7 23.0 6 . 8
Bathinda 42.2 32.8 55.4 55.5 27.0 7.1Mansa 40.7 34.3 54.4 57.6 25.1 7.5Sangrur 40.6 32.3 54.9 56.3 24.1 4.7Moga 40.1 31.4 54.3 55.1 24.2 4.5Muktsar 39.7 33.5 55.2 56.8 22.3 7.1Rupnagar 39.3 30.1 52.8 52.2 23.8 4.6Fatehgarh Sahib 38.2 30.2 55.1 54.7 18.3 2 . 1
Ludhiana 37.8 31.3 55.9 55.5 15.7 2 . 6
Patiala 37.2 30.2 54.1 53.2 17.6 4.1Firozepur 37.1 32.3 53.6 54.5 18.5 7.4Amritsar 36.0 30.7 53.2 55.0 16.3 2.7Kapurthala 35.0 31.2 53.4 54.0 14.1 5.8Hoshiarpur 34.7 28.6 51.0 50.6 17.3 4.7Jalandhar 34.5 30.1 54.1 53.0 12.3 4.6Gurdaspur 33.4 28.1 51.9 51.3 12.7 2.4Punjab 37.6 30.9 54.1 54.2 18.7 4.4
Source: Director o Census Operations, Punjab, 2002.

Table 5 shows that the rate of growth of the labourforce has been higher (2.57%) than that of the workforce (2.55%) during 1993-94/1999-2000. The growth of the female workforce has been comparatively higher than that of the labourforce. On the other hand, the growth of the male workforce has been less than that of the male labourforce during this period. When we examine the growth rates at the area level, we find that the growth rate of the labourforce in rural areas has been higher (2.07%) than that of the workforce (1.99%), whereas the growth rate of urban persons has been lower in the labourforce (3.81%) than in the workforce (3.95 per cent).
Table 5Annual Compound Growth Rates of Population, Labourforce and Workforce,
1993-94/1999-00Population_____ Labour Force Work Force
Rural Males 1.17 0.88 0.66Rural Females 1.16 5.20 5.31Rural Persons 1.17 2.07 1.99Urban Males 3.35 3.17 3.23Urban Females 3.11 7.60 8.32Urban Persons 3.24 3.81 3.95Males 1.89 1.60 1.50Females 1.77 5.61 5.81Persons 1.82 2.57 2.55
Source; Director of Census Operations, Punjab, 1991; NSSO 1997, 2001.Note: Estimates of population as on 1 January 94 and 1 January 2000, which are
mid-points of quinquennial surveys 1993-94 and 1999-2000, have been worked out by interpolation from population Census estimates for March 1991.Crude labourforce participation rates and workforce participation rates (on principal and subsidiary status) have been used for rural males, rural females, urban males and urban females from NSS survey reports for 1993-94 and 1999-2000.
Changes in the Status of Employment
Employed persons have been categorized into three broad groups according to their status of employment, (i) self-employed, (ii) regular employees and (iii) casual labour. Table 6 displays per 1,000 usually employed persons by these broad categories for both principal status workers and all workers, i. e., principal and subsidiary status workers. Analysis of the status of employment relates only to all workers. Table 6 reveals that during 1999-2000, 54 per cent males and 89 per cent females in the rural areas of the state were self-employed. The corresponding proportions in urban areas were 47 per cent males and 49 per cent females. The proportion of regular employees among women (3.7%) as compared to men (17.5%) was much lower in rural and higher in urban areas, with 43 per cent women and 40 per cent men being regular employees during this period. The proportion of casual labour was relatively much higher for males than females, both in rural and urban areas of the state. However, male casual labour in rural areas at 28.5 per cent was much higher than in urban areas at 12.2 per cent.

Table 6Per 1000 Distribution of Usually Employed by Status of Employment
1987-88 1993-94 1999-00UsualPrincipalStatus
RuralMale
RuralFemale
UrbanFemale
UrbanFemale
RuralMale
RuralFemale
UrbanMale
UrbanFemale
RuralMale
RuralFemale
UrbanMale
UrbanFemale
Self-employed
593 614 510 246 543 421 485 254 583 476 468 187
Regularemployees
187 133 385 667 133 184 400 644 176 230 409 712
CasualLabour
2 2 0 253 105 57 324 395 115 1 0 2 286 294 123 1 0 1
Principal & Subsidiary StatusSelf-employed
600 852 430 581 547 850 487 500 540 889 474 491
RegularEmployees
180 35 440 315 132 32 398 415 175 37 404 434
CasualLabour
2 2 0 113 130 104 321 118 115 85 285 74 1 2 2 75
Source: NSSO 1990, 1997, 2001.

An examination of changes in the status of employment over the period indicates that the proportion of self-employed rural males has decreased from 54.7 per cent in 1993-94 to 54 per cent in 1999-2000, whereas that of rural females has increased from 85 per cent to 89 per cent. It is interesting to note that regular male employees in rural areas have increased by four per cent during 1993-94 through 1999-2000 and correspondingly casual male labour has declined proportionality over this period. Similarly, whereas self- employment of rural women has increased by four per cent over this period, women casual labour has correspondingly decreased by the same percentage. Changes in the status of urban employment indicates that male self-employment decreased from 48.7 per cent in 1993-94 to 47.4 per cent in 1999-2000, whereas regular employment and casual labour increased by 0.6 and 0.7 percentage points respectively. Over the same period, female self-employment and casual labour in urban areas declined by one per cent each and regular employment increased by two per cent. Recent changes in the status of employment point to the impact of post-liberalization policies.
Changes in Industrial Distribution of Workforce
Table 7 indicates the changing structure of the workforce at the broad industry level in Punjab as compared to the country as a whole. The share of the workforce engaged in agriculture in Punjab has declined from about 6 8 per cent in 1983 to 53 per cent in 1999- 2000 as compared to about 6 8 per cent to 60 per cent in the country as a whole. On the other hand, the share of the secondary sector has increased in Punjab from about 13 per cent in 1983 to 18 per cent in 1999-2000 as compared to 14 to 17 per cent in the country. The workforce engaged in the service sector in the state has increased from 19.26 per cent to 27.62 per cent over the same period as compared to 17.21 per cent to 22.73 per cent in the country. Thus, it is evident that Punjab has experienced a greater shift of labourforce to non-farm sectors than in the country as a whole. This can be attributed partly to the deteriorating conditions in the agricultural sector in the state.
Table 7
Sector Punjab India
1983 1993-94 1999-00 1983 1993-94 1999-00
Agriculture 67.90 56.50 53.23 68.45 64.75 59.84
Mining & Quarrying 0.03 0.24 - 0.58 0.72 0.57
Primary Sector 67.93 56.74 53.23 69.03 65.47 60.41
Manufacturing 9.81 10.28 10.91 11.24 11.35 12.09
Electricity, gas. Water etc. 0,72 1.27 0.93 0.28 0.36 0.32
Construction 2.22 4.08 5,67 2.24 3.12 4.44
Secondary Sector 12.75 15.63 17.51 13.76 14.83 16.85
Trade, Hotel & Restaurants 6.17 10.45 13.54 6.35 7.42 9.40
Transport. Storage communication
etc.
3,41 3.56 5.21 2.44 2.76 3.70
Finance, Insurance Services 0.91 1.07 1.25 0.56 0.94 1.27
Public Administration, Community
Services,
7.88 12.54 9.26 7.86 9.38 8.36
Others 0.95
Tertiary Sector 19.22 27.62 29.26 17.21 20.50 22.73
All (No. In Millions) 7.30 7.98 9.29 302.76 374.45 397.00
Source; N S S O 1987, 1997, 2001; Planning Commission 2001Note; The total workers in each industry for each year have been worked out by applying the percentage distribution given by National Sample Surveys
across industries to absolute numbers of four categories of vi/orkers. These categories of workers in each industry have been added to work out estimates of total workers in each industry.
Table 8 presents the distribution of usually employed workers by industry for principal and subsidiary status workers. During 1999-2000, an.ong all usually employed workers in rural areas of Punjab, about 63 per cent males and 91 per cent females were engaged in agricultural activities. The proportion of males in the agricultural sector gradually declined from 17 per cent in 1983 to 64 per cent in 1999-2000. On the other hand, the females engaged In this sector decreased from 92 per cent in 1983 to 91 per cent in 1999-2000. Over the years, there has been a gradual increase in the proportion of males engaged in construction, trade, hotels and restaurants and transport, storage and communication services in the rural areas of the state.

Percentage of Usually Working Persons in the UPSS by Broad Industry Category
Rural Males Rural Females Urban Males Urban FemalesBroad Industry Category
1983 1987-88 1993-94 1999-00 1983 1987-88 1993-94 1999-00 1983 1987-88 1993-94 1999-00 1983 1987-88 1993-94 1999-00
Agriculture 77.0 68.8 - 68.1 63.7 92.2 91.6 92.7 90.6 10.1 7.3 6.5 6.5 31.2 43.5 27.6 20.1Mining & Quarrying
-- -- - - 0.1 0.1 “ “ - — 1.0 -- “ 0.2 ■
Manufacturing 6.2 9.7 62 7.7 4.2 2.8 1.3 2.3 27.1 29.6 26.4 24.2 22.8 16.6 10.2 13.4
Electricity, gas, Water etc.
0.7 1.1 1.5 . 1.1 “ — 0.2 0.2 ,1.8 1.5 1.7 1.3 1.2 0.7 0.8 0.7
Construction 2.9 4.0 4.7 7.8 0.1 - -- 0.1 3.8 4.5 5.6 7.4 - 0.4 1.0 1.4
Trade, Hotel & Restaurants
4.1 4.5 6.3 8:1 0.6 1.1 1.0 1.1 21.4 24.8 28.2 32.7 5.3 5.1 8.2 25.1
Transport,Storagecommunicationetc.
3.3 3.8 3.6 5.6 0.1 0.1 9.4 8.7 6.7 9.7 0.8 1.2 0.6 2.1
Finance,InsuranceServices
0.3
7.2
0.6 0.5
4.2
3.9
22.9
2.8 3.8 2.5
32.3
2.1 1.3
PublicAdministration, Community Services, etc.
5.1 9.0 554 2.1 4.8 5.7 20.2 21.1 14.5 33.9 49.5 35.9
All 100.00 100.00 100.00 100.00 100.00 100.00 100.00 100.00 100.00 100.00 100.00 100.00 100. 00
Source: NSSO 1987,1990,1997,2001.

In the urban areas of the state, trade, hotels and restaurants engaged about 33 per Cb... of male workers, while the manufacturing and construction sectors accounted for 24 per cent and seven per cent respectively of the usually employed males during 1999-2000. Public administration, community services and transport, storage and communications provided employment to about 15 per cent and 1 0 per cent respectively of urban male workers. On the other hand, services accounted for the highest proportion of urban females, that is, 37 per cent followed by trade, hotels and restaurants (25%), agriculture (20%) and manufacturing (13%). The proportion of urban male workers in manufacturing declined by three per cent and in services by six per cent during 1983 to 1999-2000. Their proportion increased in construction and trade, hotels and restaurants over this period. On the other hand, the proportion of urban female workers substantially increased in trade, hotels and restaurants by 2 0 per cent and decreased in agriculture and manufacturing by 11 and 10 per cent respectively. It may be noted in this context that the share of the rural non-agricultural sector in the state has increased from 23 per cent in 1983 to nearly 26 per cent in 1999-00. However, according to the provisional results of Census 2001, non-agricultural workers in the rural areas of the state have substantially increased at 46.4 per cent and correspondingly, there has been a 20 per cent decrease in agricultural workers during 1991-2001 (Director of Census Operations, Punjab, 2002).
The share of rural female workers has increased from about eight per cent to nine per cent over the same period. Male workers engaged in the secondary and tertiary sectors in urban areas in 1999-2000 were 32.9 per cent and 60.7 per cent respectively. The share of women workers engaged in these are 15.5 per cent and 64.4 per cent respectively in 1999-2000.
It is interesting to note that as compared to Punjab’s share of 27.4 per cent, the proportion of rural workers in the non-farm sector is the highest in Kerala (51.7%), followed by West Bengal (36.4%) Assam (32.3%), Tamil Nadu (32.1%) and Haryana (31.5%), whereas the share for the country as a whole is 23.7 per cent (NSSO 2001). Thus, it may be observed that the share of the non-agricultural sector has increased over the period in the state. However, the pace of shift from agriculture to non- agricultural activities, especially in rural areas, needs to be hastened through diversification of activities and other means necessary. However, the nature and determinants of non-farm employment need to be examined (Chand 2002). it will be interesting to note that in most of the developed countries, only a very small proportion of workers are dependent on the agricultural sector. For instance, in countries such as Canada, Britain, United States, Australia, Italy, Republic of Korea, the workforce engaged in the agricultural sector ranged between one per cent and 5.7 per cent only in 1997 (ILO 1999). Hence, speedier diversification into non-agricultural activities is the immediate requirement to generate higher employment opportunities in the state.
Growth Rates of Employment in Sectors
Table 9 shows that the manufacturing sector has registered a significant growth in employment, especially in the rural areas of the state, in the post-liberalization period. The growth rate of employment in this sector in rural areas has increased from -0.64 per cent during 1983/1993-94 to 6.83 per cent. The household industry in rural areas has registered substantial rise during 1991-2001. The construction sector has recorded a high growth of employment during this period in both rural and urban areas. Transport, storage and communications is another sector, which has witnessed very high growth of
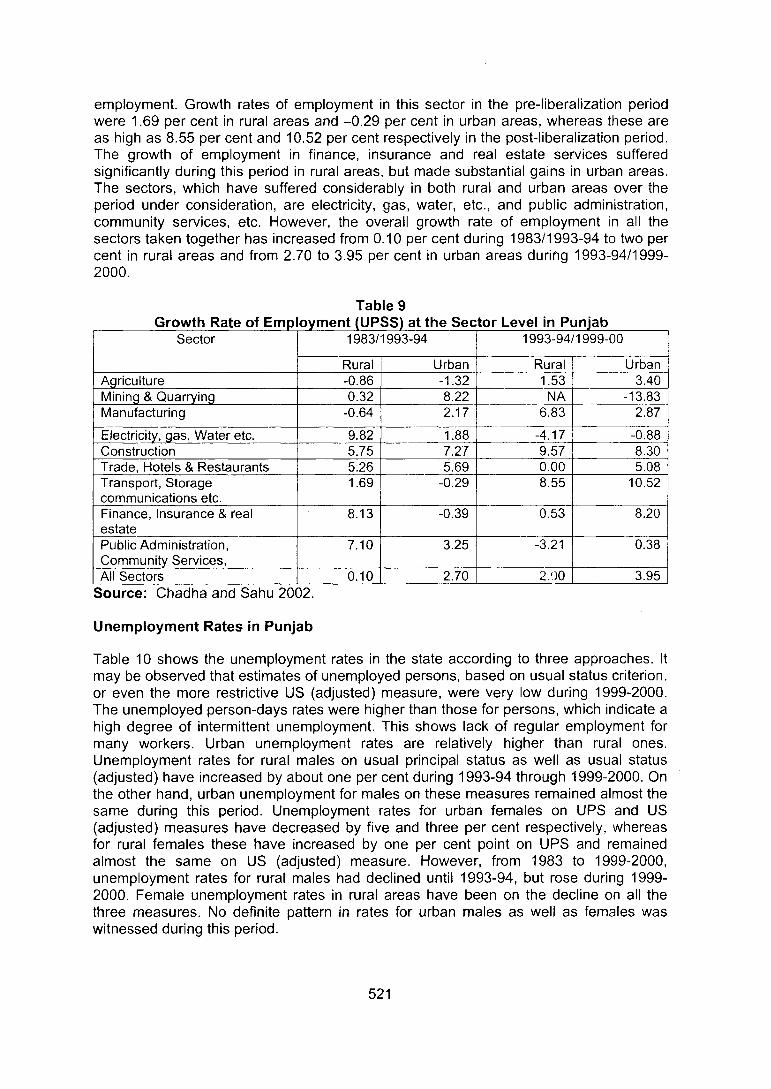
employment. Growth rates of employment in this sector in the pre-liberalization period were 1.69 per cent in rural areas and -0.29 per cent in urban areas, whereas these are as high as 8.55 per cent and 10.52 per cent respectively in the post-liberalization period. The growth of employment in finance, insurance and real estate services suffered significantly during this period in rural areas, but made substantial gains in urban areas. The sectors, which have suffered considerably in both rural and urban areas over the period under consideration, are electricity, gas, water, etc., and public administration, community services, etc. However, the overall growth rate of employment in all the sectors taken together has increased from 0.10 per cent during 1983/1993-94 to two per cent in rural areas and from 2.70 to 3.95 per cent in urban areas during 1993-94/1999- 2000 .
Table 9_____ Growth Rate of Emp oyment (UPSS) at the Sector Level in Punjab_____
Sector 1983/1993-94
Rural Urban
1993-94/1999-00
Rural UrbanAgriculture - 0.86 -1.32 1.53 3.40Mining & Quarrying 0.32 8.22 NA -13.83Manufacturing -0.64 2.17 6.83 2.87
Electricity, gas. Water etc. 9.82 1.88 -4.17 - 0.88Construction 5.75 7.27 9.57 8.30Trade, Hotels & Restaurants 5.26 5.69 0.00 5.08Transport, Storage communications etc.
1.69 -0.29 8.55 10.52
Finance, Insurance & real estate
8.13 -0.39 0.53 8.20
Public Administration, Community Sen/ices,
7.10 3.25 -3.21 0.38
All Sectors 0.10 2.70 2.00 3.95
Source: Chadha and Sahu 2002.
Unemployment Rates In Punjab
Table 10 shows the unemployment rates in the state according to three approaches. It may be observed that estimates of unemployed persons, based on usual status criterion, or even the more restrictive US (adjusted) measure, were very low during 1999-2000. The unemployed person-days rates were higher than those for persons, which indicate a high degree of intermittent unemployment. This shows lack of regular employment for many workers. Urban unemployment rates are relatively higher than rural ones. Unemployment rates for rural males on usual principal status as well as usual status (adjusted) have increased by about one per cent during 1993-94 through 1999-2000. On the other hand, urban unemployment for males on these measures remained almost the same during this period. Unemployment rates for urban females on UPS and US (adjusted) measures have decreased by five and three per cent respectively, whereas for rural females these have increased by one per cent point on UPS and remained almost the same on US (adjusted) measure. However, from 1983 to 1999-2000, unemployment rates for rural males had declined until 1993-94, but rose during 1999- 2000. Female unemployment rates in rural areas have been on the decline on all the three measures. No definite pattern in rates for urban males as well as females was witnessed during this period.

Area- and Sex-wise Unemp oyment Rates in PunjabRural Male us us (adj) cws CDS1983 3.2 - 3.9 6.91987-88 2.9 1.9 3.4 3.81993-94 1.4 1.3 1.9 2.71999-00 2.3 2.3 3.1 4.2Rural Female1983 - 11.7 5.7 9.31987-88 7.4 1.6 4.8 6.61993-94 7.1 1.2 1.5 2.31999-00 6.2 0.9 1.0 1.7Urban Male1983 - 3.9 4.9 7.11987-88 4.8 4.4 5.3 6.81993-94 3.3 3.1 3.4 3.91999-00 3.1 2.8 3.9 4.8Urban Female1983 - 9.5 8.1 9.41987-88 14.7 6.8 11.4 12.21993-94 8.6 5.3 4.8 5.81999-00 3.5 2.1 4.3 5.3
Source: NSSO !987,1990., 1997, 2001.
When we compare the unemployment rate of Punjab with other states of the country, we find that it is one of the lowest on CDS at 4.15 per cent in 1999-2000. Among major states, only Himachal Pradesh and Rajasthan have relatively lower unemployment rates than Punjab, except Rajasthan in 1987-88 (Table 11). Kerala has the highest unemployment rate (20.77%) followed by West Bengal (14.95%) and Tamil Nadu (12.05%). The unemployment rate in India during 1999-2000 was 7.29 per cent, relatively much higher than that of Punjab. A glance at the Table 11 indicates that unemployment rates for most of the states, except Gujarat, Haryana and Karnataka, have increased in the nineties.
Table 11
States/Country Unemployment Rate
1987-88 1993-94 1999-2000Andhra Prudish 7.35 6.67 7.94
Assam 5.09 7.96 8.00
Bihar 4.04 6.25 7.35
Gujarat 5.79 5.73 4.63
Haryana 7.59 6.59 4.67
Himachal Prudish 3.12 1.82 2.93
Karnataka 5.06 4.89 4.61
Kerala 21.19 15.50 20.77
Madhya Prudish 2.86 3.42 4.60
Maharashtra 4.67 4.97 7.09
Orissa 6.44 7.28 7.38
Punjab 5.07 3.08 4.15
Rajasthan 5.74 1.33 3.06
Tamil Nadu 10.36 11.44 12.05
Uttar Prudish 3.44 3.45 4.27
West Bengal 8.13 9.87 14.95
Delhi 4.77 1.91 4.58
India 6.09 6.031 .......................
7.291. .. . . .

NSSO survey defines educated persons as those who have attained an educational level of secondary and above. Table 12 presents unemployment rates, on various approaches, for educated persons for the latest and the last quinquennial survey. During 1999-2000 unemployment rate among the educated in Punjab was much higher for females in both rural and urban areas, despite a substantial decline during 1993-94 to 1999-2000. The unemployment rate for educated rural males has increased by one per cent on different approaches over this period. Among urban males, the unemployment rate has declined by one per cent on different measures. A comparison with total unemployment rates indicates that those for the educated are relatively higher in the state.
Table 12Unemployment Rates of Educated Persons of age 15 years and above
Rural Male US US (adj) CWS1993-94 3.5 3.5 4.11999-00 4.8 4.6 5.3Rural Female1993-94 34.7 11.2 12.41999-00 21.5 6.2 5.5Urban Male1993-94 5.8 5.4 5.81999-00 4.7 4.3 4.9Urban Female1993-94 13.8 11.3 10.61999-00 6.4 5.1 9.4
Source: NSSO 1997, 2001
Unemployment Rates of the Youth
Table 13 indicates that unemployment rates are much higher among the youth than in the total population on different approaches. Urban unemployment rates for the youth are much higher than in the rural areas of Punjab. Youth unemployment rates for rural females are lower than males for all approaches, except the usual principal approach. On the other hand, urban unemployment rates for female youth are higher than males on all measures. Changes over time indicate that unemployment rates on different criteria for male youth in rural areas of the state have substantially increased during 1999-2000 as compared to 1993-94, whereas those for urban male youth have remained almost the same, except one per cent increase in the current daily status. On the other hand, rates for rural as well as urban female youth have significantly declined during the same period.

Table 13Unemployment Rates among the Youth (15-29 years)
Usual Principal Status
Male Female Persons Male Female Persons
Usual Status (ad1993-94 2.9 3.7 3.1 6.8 17.3 7.9
1.3 1.2 1.3 3.1 5.3 3.41999-00 5.4 2.1 4.4 6.1 6.3 6.1
2.3 0.9 1 .8 2 .8 2.1 2.7Current Weekly Status1993-94 3.4 4.1 3.5 7.3 15.6 8.1
1.9 1.5 1 .8 3.4 4.8 3.61999-00 6.7 2 .0 5.3 7.4 11.4 8 . 0
3.1 1 .0 2.4 3.9 4.3 3.9Current Daily Status1993-94 4.3 6 .2 4.7 7.9 18.7 8.9
2.7 2.3 2.7 3.9 5.8 4.11999-00 8 . 0 3.6 7.0 8.9 13.9 9.5
4.2 1.7 3.7 4.7 3.5 4.5Source: NSSO 1997, 2001.Note: Figures in the second row of each column denote
taken together.
Magnitude of Unemployment
unemployment rates for ail ages
In addition to NSS data, estimates of unemployment are available from the State Employment Exchange, Economic and Statistical Organization and the Planning Commission, Government of India. According to the live register of employment exchanges, the total number of registered job seekers, both educated and uneducated, were 5.37 lakh as on September 2000 (Economic Adviser 2001). The problem of educated job seekers (with qualification of matriculation and above) is serious in the state. The total number of educated unemployed persons, which was 3.73 lakh (65.78%) in March 1999, increased to 3.96 lakh (73.61%) in March 2000. However, employment exchange data suffer from a number of constraints (Chand, 1993).
A recent survey by the Economic and Statistical Organization of Punjab of the unemployment situation in the state, conducted as a part of the Fourth Economic Census in 1998, indicates that the situation is the most serious in the age group of 18-35 years. According to this survey, there were 14,71, 527 unemployed persons in the state, of which 10,40,269 (70.69%) belonged to rural areas and 4,31,258 (29.31%) to urban areas. Of the total estimated persons, 8,97,860 (61.62%) were educated and 5,73,667 (38.98%) uneducated, both literate (below matriculation) and illiterate (Economic Adviser, 2000). The shares of educated and uneducated unemployed persons in the rural areas were 56.17 per cent and 43.87 per cent respectively. However, the share of educated unemployed persons was much higher at about 73 per cent in urban areas. This indicates that the educational infrastructure is much better in urban areas, which is not the case in rural areas. Thus, a large rural workforce is deprived of better education

and training opportunities. Due to lack of appropriate training programmes for skill formation, uneducated unemployed persons have to be content in rural areas with disguised employment (Gill, S S 2001).
A district-level analysis of the unemployment situation in the state, based on this survey, indicates that districts with a relatively higher proportion of total unemployed persons in rural areas were Amritsar, Gurdaspur, Firozepur, Sangrur, Ludhiana, Jalandhar and Patiala, with unemployment percentages varying from about seven in Patiala to 13 in Amritsar (Table 14). On the other hand, districts with a relatively higher proportion of work-seekers in urban areas were Amritsar, Jalandhar, Ludhiana and Patiala, with unemployment percentage varying from about eight in Patiala to 19 in Amritsar. The districts in which the proportion of educated job-seekers was very high in both rural and urban areas were Amritsar, Gurdaspur, Ludhiana, and Jalandhar. These districts are industrially important.
Table 14District-wise Percentage of Total and Educated Unenfiployed Persons Desirous of Self-Employment
in Punjab. 1998State/Districts Total unemployed persons
Rural Urban TotalEducated unemployed persons
Rural Urban TotalGurdaspur 11.08 6.54 9.75 12.94 6.76 10.78Amritsar 12.70 19.50 14.69 12-46 20.21 15.17Firozepur 9.73 7.49 9.07 7.19 7.70 7.37Ludhiana 7.95 13.77 9.65 8.81 12.82 10.21Jalandhar 7.37 15.37 9.71 7.96 15.85 10.72Kapurthala 2.02 1.47 1.85 2.23 1.48 1.97Hoshlarpur 6.24 2.46 5.13 7.75 2.90 6.06Rupnagar 3.68 2.97 3.47 4.72 3.60 4.33Patiala 6.90 7.84 7.07 6.04 7.88 6.68Sangrur 8.43 6.76 7.94 7.48 6.03 6.97Bathlnda 4.86 3.88 4.57 3.94 3.50 3.79Faridkot 2.22 2.55 2.32 1.82 2.22 1.96Fatehgarh Sahib 2.98 1.71 2.60 2.97 1.67 2.51Mansa 2.73 1.47 2.36 2.11 1.55 1.91Muktsar 4.43 3.54 4.17 3.69 3.01 3.45Nawanshahr 2.62 0.80 2.09 3.14 0.63 2.67Moga 4.04 2.28 3.52 4.72 2.18 3.82Punjab (No.) 10,40,269 4.31.258 14,71,527 5,83,851 3,14.009 8,97,860
Source: Economic Adviser, Government of Punjab, 2000
Estimates of unemployment in the Ninth Five-Year Plan (Planning Commission, 1999) indicate that the growth of employment has lagged far behind the growth of the labourforce, resulting in a high increase in unemployment in Punjab. It is estimated that the growth of employment during the Ninth Five-Year Plan (1997-2002) will be 0.73 per cent as compared to that of the labourforce, which will be 2.27 per cent during the same period. The projected growth rate of employment in the state is one of the lowest among major states. Hence, it is estimated that unemployment during the Ninth Plan will be 10,65,000 persons. However, it growth of employment the post-Ninth Plan period (2002- 07) continues to be the same as in the Ninth Plan and the labourforce grows according to the projected demographic profile, the level of unemployment in the state will be higher than what is expected at the end of the plan period. In addition to Punjab, the other states which are expected to face prospects of increase in unemployment in the post-Ninth Plan period (2002-07) are Bihar, Rajasthan, Uttar Pradesh and Kerala. These estimates are based on NSS usual principal and subsidiary status concepts of

measurement of unemployment, which is the closest to the concept used in the population census to enumerate workers.
Quality of Employment
Not only is there the problem of open unemployment, the quality of large existing employment is low and deteriorating into an increasing level of underemplyment. Underemployment is defined as underutilization of labour-time of workers. Two types of underemployment can be distinguished. Some of the persons usually employed do not have work throughout the year due to seasonality of work, or othenA/ise, and their labourtime is not fully utilized. The underemployment of this kind is termed as visible underemployment, where a person is available for work for shorter reference period. Visible underemployment is measured by cross classifying persons by their a) usual and current weekly statuses, b) usual and current daily statuses and c) current weekly and daily statuses. A proportion of workers employed, such as self-employed, may appear to work throughout the year but the work pursued by them may not be sufficient in terms of income generation. They would, therefore, want additional and/or alternative work. This type of underemployment is termed invisible underemployment and, therefore, not directly measurable. The proportion of the usually employed who are available for additional /alternative work, provides, by and large, an overall share of the employed who do not have enough work.
Table 15 indicates that the proportion of the usually employed, who were found not to be employed during the week preceding the date of survey, referred to as underemployment rate, declined for both rural and urban males during 1987-88 through 1993-94 and increased during 1993-94 through 1999-2000. A similar pattern is witnessed for urban females. On the other hand, the underemployment rate of rural females has substantially declined all through from 1987-88 to 1999-00. It may be observed that the problem of underemployment is more serious among usually employed females than males. For instance, the underemployment rate for rural females during 1999-00 was six per cent and for urban females, about 18 percent during the same period. The corresponding percentages for usually employed males were only two and three.
The underemployment rate, on the basis of the activity pattern of the usually employed during different days within the reference week, is indicated by the distribution of their days by current daily status as displayed in Table 15. It may be observed that the proportion of underemployed females in both rural and urban areas was very high, as compared to males throughout the period 1987-88 to 1999-2000. For instance, during 1999-2000 the proportion of female underemployment was 47 per cent for rural areas and 33 per cent for urban areas. The corresponding percentages for males were only four each. The pattern of change during 1987-88 through 1999-2000 is similar to that of the usually employed by current weekly status, except that the rate for rural females has remained similar during 1993-94 through 1999-2000.
Some persons, categorized as working during a week, might not have had worked for the entire week. The distribution of persons working according to current weekly status by their current daily status, therefore, would indicate the proportion of person-days on which they have remained without work. Table 15 indicates that the percentage of person-days, on which persons with some work during the reference week were without work during 1999-2000, was about 33 for rural males, 43 for rural females, two for urban

males and 20 for urban females. The proportion of unemployed days showed a rising trend for rural males between 1987-88 and 1999-2000. When there was no work, a very high proportion of females as compared to males withdrew from the labourforce in both rural and urban areas.
Table 16 shows that the proportion of the usually employed, who did not work more or less regularly throughout the year, was higher for rural males and females than urban males and females during 1999-2000. The pattern of change over the period indicates that the percentage of rural and urban males and urban females declined between 1987- 8 8 and 1993-94, but increased thereafter up to 1999-2000. The proportion of rural females who did not work regularly increased considerably from two per cent in 1987-88 to 12 per cent in 1999-2000.
Table 15
Usually employed (UPSS) by their broad CWS
Person-days of usually employed (UPSS) by their broad CDS
Person-days of persons employed according to CWS by their broad CDS
RuralMale
Emp-Loyed
Unemployed
Not In theLabourForce
Employed
Unemployed
Not in theLabourForce
Employed
Unemployed
Not in thelabourforce
1987-88 940 18 42 936 21 43 995 4 11993-94 986 7 7 972 16 13 984 8 61999-00 979 9 13 956 19 25 975 11 14Rural Female1987-88 249 2 749 223 5 772 896 14 901993-94 895 1 104 527 1 473 589 1 4101999-00 937 1 62 536 2 463 572 - 428UrbanMale1987-88 974 14 12 955 280 17 979 16 61993-94 994 2 4 985 7 8 991 4 41999-00 974 11 15 959 20 21 984 10 6Urban Female1987-88 529 15 456 493 17 490 930 9 611993-94 951 - 49 777 - 223 812 1 1871999-00 823 7 170 665 9 326 804 2 194
Source: NSSO 1990, 1997, 2001,
Table 16Number of Workers (UPS) Who Did Not Work More or
1987-88 1993-94 1999-00Rural Male 1 1 0 57 8 6
Rural Female 2 1 75 117Total - 58 8 8
Urban Male 72 37 79Urban Female 84 9 50Total - 35 77
Source: NSSO: 1990, 1997, 2001.
Table 17 shows whether the usually employed were underutilizing their available labourtime due to lack of enough work or persons having enough work but not getting sufficient

return were seeking, or available, for additional work and alternative work. The percentage of usually employed who reported themselves as available for additional work, or alternative work, could serve as two indicators of underemployment. Table 17 presents the number of usually employed persons of age 15 years and above who sought, or were available, for additional work per 1 , 0 0 0 usually employed persons in the age group. About five per cent usually employed rural males and six per cent usually employed urban males had reported seeking or being available for additional work during 1999-2000. The corresponding percentages were three each for rural females as well as urban females. On the other hand, among those who sought alternative work during 1999-2000, 4.6 per cent were rural males, 5.6 per cent urban males, 1.1 per cent rural females and 4.7 per cent urban females. It may be observed that the number of those who sought additional/alternative work had considerably increased during 1999-0 0 , indicating further deteriorating quality of employment.
Table 17Number of Usually Working Persons of Age 15 years and Above per 1000 Usually Employed Persons in the Principal Status (15 years & above) Who Were Available
for Additional/ Alternative WorkAvailab e for additional work Available for alternative Work
1987-88 1993-94 1999-00 1987-88 1993-94 1999-00Rural Male 90 24 54 75 2 1 46Rural Female 16 18 34 3 14 1 1
All - 24 53 - 2 1 44Urban Male 54 15 57 48 18 56Urban Female 95 2 0 33 32 38 47All - 16 55 19 55
Source: NSSO: 1990, 1997, 2001.
Employment in the Organized Sector
It is clearly evident that the state of unemployment and underemployment is serious in Punjab. This is confirmed when we examine employment generation in the organized sector and find that growth of employment in both the public and private sectors has declined. Table 18 indicates that about 70 per cent of the employment in the organized sector was in the public sector and 30 per cent in the private sector during 2000. The share of public sector employment has decelerated since 1985, whereas the share of private sector employment has increased from 26 per cent in 1985 to 28 per cent in1990 and further to 30 per cent in 2000. Female employment in the organized sector in the state was 1.44 lakh (17%) during this period (lAMR 2001). The share of organized sector employment in total employment in the state was about nine per cent only in 2000. Obviously, a very large proportion of the workforce (91%) in the state is engaged in the informal sector. As compared to Punjab, the proportion of workforce engaged in the organized sector in the country is only about seven per cent (Planning Commission 2 0 0 1 a).

Table 18Growth of Employment in the Organized Sector in Punjab (as on 31 March)
6746010.62
680109.65
698198.88
836939.95
793969.39
25550540.23
27614539.19
28978736.85
29647635.23
30419835.97
Quasi Government (Central and State)
11660618.36
14375320.40
17310422.01
18252621.69
17443320.62
Local Government 282444.44
312234.43
334874.26
327643.89
317593.75
Total (1) Public Sector 46779573.65
51913173.67
56619772.00
59545970.77
58978669.73
2. Private Sector 16734026.35
18547826.33
22023728.00
24600029.23
25599630.27
Grand Total 635135100.00
704609100.00
786434100.00
841459100.00
845782100.00
Source: Economic Adviser, 2000Note: Figures in the second row are percentage to the grand total
Table 19 shows that the growth rate of employment in the organized sector has constantly declined from 2.63 per cent in 1981-85 to1.36 per cent in 1995-96 and further to 0.10 per cent in 1999-2000.The decline in the growth rate of employment in the public sector has been much faster than in the private sector. For instance, the growth rate of employment in the public sector declined from 1.75 per cent in 1985-90 to -0.19 per cent during 1999-2000, and in the private sector from 2.22 per cent to 0.80 per cent.
Table 19Annual Compound Growth Rates of Employment
Year Public Sector Private Sector Total1981-85 2.64 2.61 2.631985-90 1.75 3.49 2 . 2 2
1990-95 1 . 0 1 2.34 1.361995-00 -0.19 0.80 0 . 1 0
1981-90 2.14 3.10 2.401990-2000 0.41 1.52 0.73
Source: worked out from Table No. 12.1 7
It should be noted that there is a strong preference for white-collar jobs in the organized sector, especially government jobs, rather than unorganized jobs because of assured regular income and other social security benefits. The economy has to grow at a high rate, if the expectations of the labourforce about the creation of employment in the organized sector has to be met. In the absence of the expansion of government employment in the organized sector, the possibility of creating more jobs in the private organized sector has to be explored.

Wages of casual workers in public works in rural areas in Punjab are lower than in Himachal Pradesh and Jammu & Kashmir. Wages of women in these works in the state are the lowest (Table 20). However, it should be mentioned here that the estimates for Punjab are based on a very small sample. Wages in other than public works in the state are higher in urban areas than in rural areas. Wages of women in these works are substantially lower than those of men in the state and of women in other states. Wages paid to agricultural labour in the state during 2 0 0 0 for various agricultural operations, such as ploughing, sowing, weeding, harvesting, ranged from Rs. 78 per day for weeding to Rs. 99 for harvesting (Economic Adviser 2001). The increase in the share of casual labour is considered an indication of deteriorating employment quality, where job- security and other benefits are not ensured. Increase in casual labour should be accompanied by growth of productivity and real wages.
Table 20Average Daily Wage (Rs.0.00) for Casual Workers of Age Five Years and above
Rural Public Works Other than Public WorksRural Urban
State/Country Male Female Male Female Male Female
Punjab 57.14 18.71 65.86 49.48 82.40 53.09Haryana 43.30 28.57 62.65 51.01 68.47 47.74HimachalPrudish
75.70 51.00 67.06 50.36 70.99 50.30
Jammu & Kashmir
83.79 23.75 77.04 66.07 97.65 71.48
Rajasthan 36.22 50.28 55.19 37.02 67.07 45.35
India 48.14 38.06 44.84 29.01 62.26 37.71
Source: NSSO:2001.
Strategy for Employment Generation
The Task Force on Employment Opportunities, set up by the Planning Commission, has very appropriately identified the following five broad areas, which together would constitute an appropriate strategy for employment generation (Planning Commission 2 0 0 1 b):
■ Accelerating the rate of growth of the economy, especially in sectors, which would ensure the spread of income to the low-income segment of the labourforce.
■ Pursuing appropriate policies in individual sectors, which are important for employment generation. These sector-level policies must be consistent with the overall objective of accelerating the growth of the state domestic product.
■ Implementing focused special employment programmes for creating additional employment and enhancing income generation for existing activity, aimed at helping weaker sections of the society that might not be sufficiently benefited by the more general growth promoting policies.

■ Pursuing suitable policies for education and skill development, which would upgrade the quality of the labourforce and make it capable of supporting a growth which generates high quality jobs.
■ Ensuring that the policy and legal environment governing the labour market encourages labour absorption in the organized sector.
The following sections discuss broadly aspects of employment generation and related issues in Punjab.
EMPLOYMENT GENERATION: POTENTIAL SECTORS
The agricultural sector in Punjab is very important in terms of its contribution to employment and income generation and hence cannot be ignored at the policy level, despite its declining share. However, it should be kept in mind that this sector has a limited capacity to engage a larger workforce, as it suffers from disguised unemployment. From the long-term point of view, expansion of employment opportunities has to be explored in the non-farm sector. A significant shift in the labourforce must take place from agriculture to non-agricultural activities. In addition to speeding up reforms in the agricultural sector, such as liberalizing leasing of land, diversification to non-cereal crops, improvement of quality of agricultural produce, promotion of agricultural exports, it is necessary to encourage allied activities which are more labour-intensive and provide greater attention to agricultural and rural infrastructure development. Since long there has been much talk on diversification and value addition through agro-processing for a long-time, but not much progress has been made in this direction.
Agro- and Food- processing
India is the largest producer of fruits and vegetables in the world, but only less than two per cent of the production is processed, as compared with 80 per cent in Malaysia, 78 percent in the Philippines, 70 per cent in Brazil and 30 per cent in Thailand. In Punjab, a major producer of fruits and vegetables and with a large livestock population, the food processing industry is a potential area where there is large scope for expansion. Horticulture and vegetables are labour-intensive activities and hence, higher employment opportunities can be generated in this sector. Serious attention has to be paid to quality and marketing infrastructure and other necessary conditions have to be created for large-scale promotion of these activities through emphasis on R & D, extension and training, development of food parks, strict quality control and testing labs, cold storage, warehouses, air conditioned transport, and removal of various constraints. Animal husbandry and dairying contribute significantly to employment and income generation and have potential for further development, if steps are taken for disease control, improvement in genetics, extension services, strengthening of marketing and credit infrastructure and provision for adequate quality of fodder and feed. Value addition to abundant unprocessed agricultural production will promote forward and backward linkages resulting in higher income and employment opportunities in the state.
Manufacturing Industries
Small-scale industries (SSIs) dominate the industrial scene in Punjab in terms of their contribution to employment, income generation and exports of industrial products. Only a few large and medium industries exist in the state. The State Industrial Policy of 1996

has attempted to create an investment-friendly environment in Punjab. However, in the process of liberalizing the economy, there is need to increase competitiveness, efficiency and quality of manufactured products. There is need to dereserve items manufactured by SSIs in a phased manner to allow competition and growth, as suggested by the Expert Committee on Small Enterprises, 1997, headed by Abid Hussain. Reservations for small-scale industry have prevented India from becoming a global power in labour-intensive mass manufacturing, that would, in turn, create very large factory jobs at home, as it has happened in China.
It is argued that the impact of WTO will affect certain industries, which are unable to compete in the short run. But in the long run, it will have a favourable impact on output and employment. The Study Group on Small Enterprises, set up by the Planning Commission, which submitted its final report in May 2001, has made a number of useful recommendations to promote SSIs, such as redefining SSIs, improving fiscal incentives, providing easy access to credit, capital subsidy for technology upgradation and improvement of infrastructure, so that new challenges can be faced in the changing economic environment. It is recognized that as restructuring takes place, the number of SSIs may indeed be reduced and some of the weaker units displaced by others, which will expand as a result of enhanced competitiveness. This is a normal process of structural evolution and is consistent with strengthening the sector as a whole. The fear that it will lead to a reduction in output or employment may not be valid, since restructuring might permit deeper penetration of world markets, which would generate a larger volume and higher quality of employment than is the case at present (Planning Commission 2001a). The decline in weaker enterprises in the wake of restructuring the economy can be offset by the expansion of employment in stronger enterprises. It is argued that the total employment generated by the restructured industry is likely to be more sustainable and growth-oriented in the long run. This requires a radical shift in policy from protection to promotion. The relationship between SSIs and large industries must also be seen as mutually supportive and not against each other.
Construction
Construction has recorded a higher growth of employment in the recent period. With appropriate policy measures, this sector can play an important role in generating higher employment in infrastructure building. The growth of this sector has a positive impact on the growth of related sectors of the economy. The employment effect of construction growth is very high, not only because of its high employment elasticity but also because of the high employment multiplier effect it has among major sectors of the economy.
Service Sector
The service sector is very important for the future growth of employment. Most of the developed nations are dominated by service activities in terms of their contribution to income and employment generation. In Punjab, service activities have grown faster in the 1990s and have scope for further expansion, if necessary policy interventions are made. The potential areas in this sector are tourism, information technology, housing and real estate, road transport, trade, education and health. A sizeable growth of employment opportunities is expected to take place in the service sector in future. Banks have so for been concentrating on priority sectors for credit. Keeping in view the future prospects of the service sector in generating substantial employment, credit needs of this sector should not be ignored.

Employment in the Unorganized Sector
The contribution of the unorganized/informal sector in the state is significant in terms of employment and income generation. iVlore than 90 per cent of the workforce is engaged in activities in the informal sector. Similarly, about 93 per cent of the workforce earns its livelihood in the unorganized sector in the country and its contribution to the net domestic product has been 60.5 per cent of the total national net domestic product (CSO 2001). Though this sector provides employment to the largest workforce, it has to function under severe constraints and the quality of most of the employment generated is low. The constraints faced by this sector limits its capacity to absorb a longer labourforce. Especially the general lack of credit availability through formal financial institutions inhibits the expansion of informal sector activities and hence, the growth of employment (Chand 1993a, 1997). It has been observed that under the present economic order, the growth of employment in the organized sector has considerably declined in recent times and there is not much scope of employment expansion especially in the public sector. It is essential, in the circumstances, that special efforts should be made to fulfil the financial requirements of the economically viable enterprises in the unorganized sector, so that the projected growth rate can be achieved.
SPECIAL EMPLOYMENT PROGRAMMES
Programmes for Rural Areas
Several State and Centrally sponsored programmes are in operation for self- employment and wage-employment generation (Chand 1996) for vulnerable sections of the society, who are below poverty line in the state. Programmes with state share are especially designed for poverty alleviation in the rural and urban areas. The major Centrally sponsored scheme in the rural areas are Integrated Rural Development Programme (IRDP) with sub-schemes, Training of Rural Youth for Self-Employment (TRYSEM), Million Wells Scheme (MWS), Supply of Improved Toolkits to Rural Artisans (SITRA) and Development of Women and Children in Rural Areas (DWCRA). These schemes have been brought under Swaran Jayanti Gram Swarozgar Yojana (SGSY) launched in April 1991999-2000. The restructuring of IRDP is considered a step in the right direction for improvement in the programmes. The objective of SGSY is to provide sustainable income to the rural poor. The programme aims at establishing a large number of micro-enterprises in rural areas. It is envisaged that every family assisted under the SGSY will be brought above poverty line in three years. During the year 1999-00, assistance amounting to Rs. 327.72 lakh (subsidy+loan) was provided to 1,694 beneficiaries. In the current year, an assistance of Rs. 900.82 lakh (subsidy+loan) has been provided to 3,273 beneficiaries up to September 2000. During the year 1999-2000, 1,046 Scheduled Castes (SC) beneficiaries were provided loans amounting to Rs.181.88 lakh and up to September 2000, an amount of Rs. 497.48 lakh was given to1,958 SC beneficiaries (Economic Adviser 2001)
Low productivity and unemployment are the factors responsible for rural poverty, it, therefore, becomes imperative to increase productivity and enhance employment in rural areas. An employment-oriented growth strategy can achieve this goal in the medium and long run. In the short run, supplementary employment has to be provided to the needy, especially in agriculturally lean seasons. To meet this specific requirement, two wage- employment programmes were put into operation- the National Rural Employment Programme (NREP) and the Rural Landless Employment Guarantee Programme

(RLEGP). From 1, April 1989, NREP and RLEGP merged into Jawahar Rozgar Yojana (JRY). The main objective of JRY is generation of additional gainful employment through creation of rural infrastructure and community and social assets. Another wage- employment scheme for rural areas is the Employment Assurance Scheme (EAS), which provides employment in the agricultural lean season and thus generates supplementary wage-incomes through public works programmes. JRY has been replaced by Jawahar Gram Samridhi Yojana (JGSY), which is now conceived as a rural infrastructure development scheme which also provides employment to the rural poor.
Table 21Financial and Physical Progress of Centrally Sponsored Employment Generating ____________________ Schemes in Punjab during 2001-02
JGSY EAS SGSYFinancial Progress (as on 25.5.2002)Total funds available (Rs. in lakh)_______ ____________
1375.92 1020.75 380.75
Percentage of expenditure 54.28 47.62 103.38Physical Progress (as on 18.5.2002)Unit Lakh mandays Lakh mandays Total Swarozgaris
assisted (No.)Total target 0 0 14.04 0 0
Total achievement 5,38 3.75 4251Percentage of achievement 0 0 26.7 0 0
Source: Internet; Ministry of Rural Development Website.
Table 21 shows that out of the total funds available for JGSY and EAS during 2001-02, only 54.28 per cent and 47.62 per cent respectively were utilized. Against the target mandays of 14.04 lakh to be generated through EAS, the achievement has been only 26.7 per cent. This may be partly responsible for the under-performance of these schemes in the state.
Programmes for Urban Areas
Migration from rural areas is seen as the main cause for urban growth as well as urban poverty, making urban poverty alleviation an important issue. The Nehru Rozgar Yojana (NRY) and the Prime Minister’s Integrated Urban poverty Eradication (PMIUPEP) have been two urban poverty alleviation programmes. NRY had consisted of three schemes: (i) Scheme for Development of Urt^an Micro Enterprises, (ii) Scheme for Urban Wage Employment and (iii) Scheme for Housing and Shelter Upgradation. NRY has now been replaced by a new scheme, Swaran Jayanti Shahari Rozgar Yojana (SJSRY), which has three components namely (i) Urban Self-employment Programme, (ii) Urban Wage Employment Programme and (iii) Development of Women and Children in Urban Areas. Under the Urban Self-employment Programme, loans and subsidy amounting to Rs. 904.30 lakh were given to 3,120 beneficiaries during 1999-2000. In the current year up to September 2000, an amount of Rs. 589.78 lakh has been provided to 841 beneficiaries. During 1999-2000, 987 SC beneficiaries were given Rs. 315.80 lakh and in the current year up to September 2000, 288 SC beneficiaries have been provided an amount of Rs. 226.37 lakh. Under the Urban Wage Employment Programme (UWEP), which seeks to provide wage employment to persons below poverty line, living within the jurisdiction of urban local bodies with a population of less than five lakh, 1.62 lakh

mandays were generated with an expenditure of Rs. 482.00 lakh during 1999-00 and another 0.66 lakh mandays on an expenditure of Rs. 211.00 lakh upto September 2000. Under the Development of Women and Children Scheme, Rs. 30.81 lakh were distributed to 90 beneficiaries as loan and subsidy up to September 2000. Out of 90 beneficiaries, 45 SC beneficiaries were given assistance of Rs. 16.34 lakh (Economic Adviser 2001).
In addition, schemes for the economic upliftment of Scheduled Castes and Backward Castes, through setting up economic ventures, are being implemented at the state level. For example, the Punjab Backward Classes Land Development and Finance Corporation (BACKFINO) and Punjab Scheduled Castes Land Development and Finance Corporation provide loan and subsidy under different schemes.. Besides, under bank tie-up, loans for families living below poverty line, in both rural and urban areas, are also arranged by both Corporations. BACKFINO provided loans to the tune of Rs.462.89 lakh to 793 beneficiaries during 1999-2000. In the current financial year up to September 2000, an amount of Rs. 314.29 lakh has been paid to 611 beneficiaries. The Punjab Scheduled Castes Land Development and Finance Corporation provided loans amounting to Rs. 1587.47 lakh to 7,706 beneficiaries during 1999-00. In the current year, upto September 2000, an amount of Rs 532.48 lakh has been given to 2,328 beneficiaries.
Under the Prime Minister’s Rozgar Yojana (PMRY), a 100 per cent Centrally sponsored scheme, which provides self-employment opportunities to educated youth, 1,4253 cases have been sponsored to the banks against the target of 9,000, out of which 5,984 cases have been sanctioned loans up to November 2000. Besides, agriculture finance for self- employment through Punjab State Co-operative Agricultural Development Bank is provided for allied agricultural activities. Punjab Khadi and Village Industries (KVIs) provide financial assistance for self-employment in different industries/schemes. Punjab Agro-Industries Corporation provides self-employment opportunities to unemployed youth. The Punjab State Cooperative Supply and Marketing Federation (MARKFED) also encourages self-employment, through a scheme of allotment of dealership of its products to unemployed graduates in the state. C-Pyte (Centre for Training & Employment of Punjab Youth) provides employment-oriented training and upgrades the skills of educated youth of the state to make them employable. Under this scheme 48,367 youth have been absorbed till date in various public and private organizations. Financial assistance through banks for dairy development is also provided for self- employment, of the candidates from rural areas, after adequate training.
The Khadi and Village Industries (KVI) sector has potential for creating new jobs at low cost. This sector not only provides employment in rural areas at low investment per job, but also utilizes local skills and resources and provides part-time and full-time work to rural artisans, women and weaker sections of the society. Financial assistance is provided at the prevailing bank rate, with 25 per cent margin money subsidy upto loans of Rs 10 lakh. Expansion of village industries will ensure an increase in income levels and quality of life of rural workers and craftsmen. Important KVIs contributing to production and employment in the state are processing of cereals and pulses, ghani-oil industry, gur and khandsari industry, carpentry and blacksmithy. These industries have provided full-time and part-time employment to 83,661 persons in the state.
Government provides funds under various plan schemes every year to deal with the unemployment situation in the state. The approved outlay for different employment

generation schemes in the Ninth Five Year Plan (1997-02) is Rs 3,531.53 crore. It is expected to generate direct and indirect employment of 17.55 lakhs persons during the plan period. An outlay of Rs 586.82 crore has been made to implement employment- generating schemes for providing employment to 1.81 lakh persons during 2002-03 (Department of Planning, N/nth Five Year Plan 1997-2002 and Tenth Five-Year Plan 2002-07 and Annual Plan 2002-03). Thus, a substantial amount of resources is being spent on employment generating schemes in the state.
However, a number of evaluative studies on various employment-generating schemes, especially Centrally sponsored schemes, have identified gross mismanagement responsible for the underperformance of these schemes. The Planning Commission’s account of various poverty alleviation schemes often reads like a criminal charge sheet. Writing about one rural programme, the report cites ‘leakages, misappropriation of funds, violation of programme guidelines, selection of the non-poor as target group, absence of proper maintenance of accounts and poor quality of assets’. It has been calculated that last year Rs 46,000 crore in subsidies had been budgeted for largely ineffective schemes in the country to help the poor. Hence, it is suggested they should be cut in half and the money spent on infrastructure instead (Unger 2001). Similar views have been expressed about these schemes in the Draft Approach Paper to the Tenth Five-Year Plan (2002-07) (Planning Commission 2001a).
An evaluation study of all rural development programmes in the Jalandhar district of Punjab revealed, that though these programmes have contributed to the upliftment of the rural poor over a period of time and created durable assets, the suffer from a number of serious maladies at the implementation level, which considerably reduce their efficacy and effectiveness (Chand 1999). There has been lack of concern in responding to real market demand for self-employment schemes and very little interaction with the beneficiaries at the grassroots. Official apathy, lack of monitoring, non-adherence to guidelines, casual approach of various functionaries at various levels are responsible for the poor performance of these schemes. Most of the elected heads of Panchayat did not have any training for the implementation of JRY works. Muster rolls were not maintained properly in the majority of cases. Contractors executed and supervised the JRY works. Workers from outside the village were brought in by the contractor. The share of women in employment generation was insignificant. Annual plans were not discussed at the Gram Sabha meeting.
Reorientation of the employment and anti-poverty schemes has to be undertaken to improve the situation during the Tenth Plan. The problem of disguised unemployment and underemployment is serious in the state and the growth process may not be fully during the plan period. The appropriate instrument for addressing this specific problem is the Employment Assurance Scheme (EAS), which has been designed specially for this purpose and should be implemented on the pattern of the Maharashtra Employment Guarantee Scheme, which has been a success (ILO 2000).
Poverty and Unemployment
Despite the low ratio of employment to growth, Punjab has been able to reduce the incidence of poverty because of the high level of agricultural productivity per worker. Employment elasticity to SDP in the state was one of the lowest, 0.30, followed by Tamil Nadu and Haryana during 1983-94. Male agricultural productivity during 1992-95 at 3.01 was the highest in the country. This helped reduce poverty by 4.4 per cent during 1983-

94 (Planning Commission 1999). Further, the proportion of persons below the poverty line in the state has come down from 11.5 per cent in 1993-94 to 6.36 per cent in rural areas and 11.35 per cent to 5.75 per cent in a urban areas during 1999-00. For the state as a whole, it has declined from 11.77 per cent in 1993-94 to 6.16 per cent in 1999- 2000.
SKILLS, TRAINING AND EMPLOYMENT
Mismatch between Supply of and Demand for Skills
Mismatch between skill requirements of employment and the skill base of the unemployed is one reason for unemployment. This is likely to become more acute in the process of rapid structural changes in the economy. Skills and training in the state are acquired through various training systems, such as hereditary skills acquired in the family, on the job training, education related to work through educational institutions, vocational training through specialized institutions such as it is, and formal apprenticeship.
It is widely recognized that the rapid expansion, particularly of higher education, has also contributed to the mismatch in the labour market. It is felt that while shortages are often experienced, of middle-level technical and supervisory skills, graduates and postgraduates in arts, commerce and science constitute a large proportion of the educated unemployed. High private rates of return on higher education, resulting to a large extent from low private cost, is an important reason for the rush for higher education despite high incidence of educated unemployment. At the same time, after completion of schooling, very few join vocational courses. Efforts to strengthen vocational education are needed. We have to learn from the experiences of those economies which have made tremendous progress through vocational education. Table 22 indicates that of the total job seekers in Punjab during 2000, 73 per cent were educated and 27 per cent uneducated, and of the total educated 24 per cent were technically qualified and 76 per cent non-technically trained. Further, out of the total technically unemployed about 37 per cent were ITI trained craftsmen, eight per cent diploma engineers, six per cent paramedical personnel, 36 per cent B. Ed and M. Ed teachers and nine per cent other teachers.
It is, therefore, necessary to orient the educational and training system towards improving its capability to supply the requisite skills in the medium and long run, so as to enable it to respond quickly to the needs of the labour market in the short run. Besides, the system should also be in a position to impart suitable training to the large proportion of workers engaged as self-employed and wage earners in the informal sector, for upgradation of their skills so as to raise their productivity and incomes levels.
Low Level of Skilled Manpower
Skill-levels and training have a decisive impact on the growth of income and employment. However, quantification of skill-levels is not easy due to data constraints. Information is available only on educational attainments of workers is available. Table 23 indicates that education levels of workers in Punjab, as well as in the country as a whole, are quite low. According to the 1991 Census, about 42 per cent of the main workers were illiterate, another 18 per cent below middle-level class and only 40 per cent of the workers of the state, as compared to 51 per cent in the country as a whole, were middle

school and above. However, this information pertains to general education and not skilled manpower, for which information is not easily available. We have some information for the country as a^whole on 30 specific marketable skills possessed by persons in the labourforce. In rural areas, only 10.1 per cent of male workers and 6.3 per cent of female workers were equipped with specific marketable skills.
Percentages of skilled manpower were higher in urban areas with 19.6 for males and11.2 for female workers (NSSO 1997). The level of vocational skills, in the labourforce in India is very low as compared to other countries. For instance, in the age group of 20-24, only five per cent of the labourforce in India has vocational skills whereas in developed countries the percentage varies between 60 and 80, which is much higher. The percentage for Korea at 96 is very high. Many developing countries too have a much higher percentage of skilled manpower than India, for example, in Mexico, it is 28 per cent, Mauritius, 36 per cent and Botswana 22 per cent (Planning Commission, 2001a).
Table 22
Category As on 31 March1990 1996 1997 1998 1999 2000 Up to
30.9.2000Educated 335456 325879 365483 373094 372970 396414 393768Technical
Graduate 437 1052 1000 931 966 1020 736Engineers 0.50 1.22 1.00 0.95 1.01 1.08 0.79Diploma 5189 7213 7124 7205 6623 6532 7057Engineers 5.97 8.35 7.14 7.37 6.93 6.94 7.59I.T.I. Trained 28147 33516 35006 35665 35575 34936 34515Craftsmen 32.37 38.79 35,08 36.50 37.24 37.12 37.11Other Craftsmen 5957 1873 1980 3332 2872 2734 2774
6.85 ' 2.17 1.98 3.41 3.01 2.90 2.98Allopathic 27 60 75 106 134 126 72Doctors 0.03 0.07 0.07 0.11 0.14 0.13 0.8Other Doctors 275 481 409 394 380 387 249
0.32 0.56 0.41 0.40 0.40 0.41 0.27Para-medical 3887 4452 5159 5291 5114 5413 5451Personnel 4.47 5.15 5.17 5.41 5.35 5.75 5.86Agricultural 643 640 604 653 546 460 214Specialists 0.74 0.74 0.61 0.67 0.57 0.49 0.23Veterinary 4 10 23 31 27 18 19Graduates - 0.01 0.02 0,03 0.03 0.02 0.02Dairy Graduates - 3 5 1 6 5 2
Teachers 23425 27173 37038 3472 36655 34459 33817(B.Ed. & M.Ed.) 26.94 31.45 37.11 35.54 38.38 36.61 36.37Teachers 3083 878 1339 1072 1480 1550 1697(J.B.T.) 3.54 1.02 1.34 1.10 1.55 1.65 1.82Teachers 15885 9059 10135 8310 5163 6479 6368(others) 18.27 10.48 10.16 8.50 5.40 6.88 6.85Technical (Total) 86959 86410 99797 97717 95541 94119 92971
100.00 100.00 100.00 100.00 100.00 100.00 100.00Non-Technical 248497 239469 265686 275377 277429 302295 300797(Freshers)Graduates 35934 29984 31285 30239 28600 27021 27957Post-Graduates 10581 8305 7882 7832 6910 6990 6004Matriculates and 201982 201180 226519 237306 241919 268284 266836under-GraduatesAll others 286806 222048 187486 203563 193939 141977 1427SeTotal (l+ll) 622262 547927 552969 576657 566909 538391 536524Source: Economic Adviser 2001.

Such existing training institutions, as Industrial Training Institutes, have undoubtedly been meeting a significant part of the requirements of skilled manpower for organized industry. The need, however, seems to exist for expeditious restructuring and reorientation of their courses are quickly to respond the labour market. Greater involvement of industry in planning and running the training system would also be necessary for this purpose.
Table 23Percentage Distribution of Main Workers According To Education Level, 1991
Education Level Punjab IndiaIlliterate 41.5(36.75) 51.0(19.56)Below primary 3.9 7.8Primary but below middle 14.2 13.9Middle but below matric 12.3 10.9Matric but below graduate 22.4 11.9Graduate and above 5.7 4.4Total main workers (in lakh) 60.98 2859.32
Source: Director of Census Punjab 1991; Planning Commission, 1999.Note: Figures in brackets refer to percentage of workers who are unemployed.
Quality of Skills and Training
The quality of training imparted by some of the institutions is not up to the mark. For instance, much of the training provided by ITIs is for skills for which there is little current demand. The curriculum has not been revised for a long time and is not attuned to current market requirements. Skills acquired by the students are poor and not required by the employers. The facilities and infrastructure in most ITIs are inadequate and the equipment obsolete. There is a shortage of trained faculty in these institutes. According to employment exchange data, a large proportion of the technically trained manpower from ITIs and other institutions has remained unemployed. Evaluation of special training programmes indicates that the number of those who had been trained were either unemployed, or not employed in the trade in which they had received training. Thus, there is immediate need for expansion of specialized training through IITs. The role of the private sector in higher general education and technical education must be expanded. The existing ITIs must be strengthened and modernized. The industrial sector should be more involved in the management of ITIs at various levels. Improvement of vocational education at the school-level has to be emphasized. The apprenticeship system has to be strengthened. There is dire need for greater involvement of the private sector in the entire process, with the support of public sector as facilitator, to achieve the vast improvements required in the quality of training and skills.
No training facilities oriented towards the needs of the informal sector exist, which is otherwise expected to provide for a large part of the expansion in employment. With regular wage-employment shrinking, the educated unemployed have to find job- opportunities as self-employed, which are mostly in the informal sector or outside the organized sector. This suggests the need to pursue strategies that help the informal sector to expand, particularly in high-growth areas, where the income levels in the unorganized sector can be expected to be fairly reasonable. It should be noted that various aspects of employment, unemployment and related issues have been comprehensively dealt with in the Reports prepared by the Government of India (Planning Commission 2001 b, 2001 c, 2002; Ministry of Labour 2002).

The slow growth of employment may be primarily due to the fact that the SDP growth rate actually achieved has fallen short of what was expected during the plan periods and growth of employment has not taken place according to the elasticities of employment projected during the plans. Thus, in order to generate additional productive employment opportunities and improve the quality of existing employment during the Tenth Five-Year Plan and beyond, the growth of the economy has to be accelerated to higher levels. Hence, the emphasis is on growth-led employment generation. The investment level has to be raised substantially to attain higher growth rate of the economy in future and its efficient use has to be ensured to the extent possible. That would result in higher employment elasticity. The rate of investment (gross state capital formation) as a percentage of GSDP, and the efficiency of investment measured by the incremental capital-output ratio (ICOR), are two critical determinants of growth, which are important from a policy point of view for accelerating growth in the future.
The rate of investment in Punjab has varied between 1993-94 and 1999-2000, averaging22.4 per cent, whereas the average grbwth rate during this period was about 4.2 per cent (Table 24). This gives an ICOR of 5.3 per cent. By applying this ICOR, an acceleration from 4.2 per cent growth to five per cent would need an investment rate of 26.7 per cent. Similarly, acceleration to six per cent, seven per cent and eight per cent would require investment rates of 32.0 per cent, 37 per cent and 42.6 per cent respectively. In this respect, the performance of the country as a whole has been far better, as it has achieved a growth rate of 6.5 per cent with an average rate of investment of 24.4 per cent giving an ICOR, of 3.7 per cent during 1992-93 to 1999- 2000. Acceleration of growth from 6.5 per cent to eight per cent and nine per cent would require an increase in investment rate of 30 per cent and 34 per cent at the national level. To achieve a very high rate of investment is not an easy task. However, policies to reduce ICOR resulting in efficient use of capital, can also help attain a higher growth with a relatively lower investment level. Domestic savings, have to be maintained at an adequate level as these constitute the major source for financing investment in addition to raising foreign direct investment (FDI) to meet any shortfall. Improvement in efficiency in every sector is imperative if the targeted rate of growth has to be achieved. To attain efficiency, domestic and international competition is very essential, though it could have some adverse effect on employment, initially. China could achieve a higher growth rate of the economy because of a very high rate of domestic investment and FDI.
Table 24
Rate of investment 22.4 (24.4%)Growth rate 4.2 (6.5%)Incremental capital-output ratio 5.3 (3.7%)To achieve growth rate of: Estimated investment required:5 per cent 26.7 per cent6 per cent 32.0 per cent7 per cent 37.3 per cent8 per cent 42.6 per cent
Source: Economic Adviser, Statistical Abstracts of Punjab Note: Figures in parentheses are for the country as a whole

Thus, if accelerated growth of gross state domestic product (GSDP) has to be the coreof a viable strategy for employment generation, a policy framework for action for its rapidgrowth of GSDP must be regarded as the essential precondition. Following areas canbe regarded critical at the level of macro-economic policy (Planning Commission 2001b).i) Achieving high rate of investment.ii) Improvement in efficiency.iii) Improvement in infrastructure.iv) Improvement in financial system.v) Credit availability for informal sector
IMPLICATIONS FOR EMPLOYMENT POLICY
1. The districts, which are industrially important, such as Amritsar, Ludhiana andJalandhar, have a very high proportion of those seeking employment. There isimmediate need for appropriate intervention in these areas for enhancingemployment opportunities.
2. Underemployment in the state has increased in recent times. This indicates the deteriorating quality of employment. In fact, the major challenge is the replacement of existing low-quality jobs with high-quality jobs.
3. Appropriate employment opportunities have to be created for the better educated, which could ensure a higher income level.
4. Unemployment among youth in the state is comparatively higher than among allages. If the energy of the youth is not channelled properly by providing adequatework opportunities, they might indulge in acts, which would be detrimental to the society.
5. Female woke-participation rate has been very low in the state reflecting on thestatus of women’s empowerment. A large proportion of women workers in the state are engaged in a subsidiary capacity in low productivity activities with very low earnings. A large number of them have to work under highly exploitative and discriminatory conditions. Efforts to provide decent employment to women should also include legal protection against women-specific exploitation. There is need to study in detail various aspects of, and activities in which women are engaged.
6 . The private sector has to be encouraged for generation of higher employment in the state. Regular jobs in the organized sector can be increased if serious and sincere efforts are made to remove the bottlenecks, which discourage rapid expansion of regular employment in the private sector. One of the major constraints is inflexible labour laws. Changes in the labour laws, the process for which has already begun, can provide greater flexibility for the expansion of employment.
7. Creation of regular employment in the near future will not be substantial. A large volume of better quality employment has to be generated through self- employment. Therefore, adequate policy steps have to be taken to promote self- employment opportunities.
8 . Despite increase in self-employment opportunities in the state, a large work force will continue to work as casual labour, thereby keeping a large number of households poor. There is need to improve the quality of such employment in terms of higher working days and better real wages, which can be ensured through faster growth of the economy.
9. Activities in the non-agricultural sector have to be promoted and excessive dependence on the agricultural sector has to be reduced for better quality of employment and incomes and hence, to achieve a higher rate of growth of the

economy. Sectors, which have comparative potential of higher employment generation in the future are, apart from agro- and food-processing, small-scale industries, construction, trade, tourism, transport, communication, information technology and other services. These sectors have achieved significant growth during the post-liberalization period. It is expected that the most of the employment to be generated in the next few years will be in the services sector. Thus, vast improvements in this sector can create large quality employment. Extensive economic and social infrastructure development is the need of the time to promote overall growth of the economy. Private investment needs to be encouraged in this sector for speedier results. Faster development of non-farm activities, especially in rural areas, will be helpful in checking rural-to-urban migration.
10. The unorganized sector assumes greater significance for future expansion of employment, as the growth of employment in the organized sector has substantially declined. However, to promote wage and self-employment in this sector, its various needs especially for those viable from a long-term point of view have to be met.
11. Various employment generating programmes for the vulnerable sections of society need to be effectively implemented after proper restructuring, making them leakage proof through constant monitoring and fixing of responsibility for any lapses. A casual approach to the handling of these schemes has to be shed and their smooth functioning ensured. There is also need to restructure the KVIC programme to enhance its product quality and competitive ability.
12. The ITIs and other technical institutions are in need of upgradation and modernization in terms of infrastructure, staff and courses. The system of specilized higher technical education needs to be strengthened, if our technical manpower is to avail of the opportunities in the international labour market. Industry should be involved in the management of these institutions. The private sector has to be encouraged to play an important role in imparting vocational training. Such institutions as IITs and IIMs, which are known for their quality of talent, have to be promoted. Several developed countries could achieve higher levels of growth because of a very high level of vocational and technical education. Training systems of these countries need to be studied.
13. At the prevailing growth rate, it will not be possible to achieve significant improvement in the employment situation. Indeed, a very high investment rate is required if we want to achieve a higher rate of growth of the state economy during the Tenth Five-Year Plan, along with an increase in efficiency of capital use, i. e., reduction in ICOR. Hence, there is a need to achieve higher investment rate to ensure growth-led employment generation in the economy.
Keeping in view the seriousness of the unemployment problem, the authorities concerned in the state have intensified efforts to make available higher employment opportunities, especially for educated persons, through several ways, such as identifying workers in short supply and high demand in the private sector, identifying skill gaps through surveys, improving the quality of training to narrow down the mismatch of demand and supply, promoting on-the-job training by involving employers in the private sector, strengthening the Overseas Employment Cell for those desirous of working abroad, setting up the Youth Employment Board with the collaboration of ILO, providing training by starting coaching centres at the employment exchange level and making online services available for better information.

INTRODUCTION
‘Labour is the source of all wealth and all life-sustaining activity on earth. If we just cast a glance around us, we find any thing that is not a work of Mother Nature, is the work of human labour. Indeed, to work itself is the essential attribute of human nature’ {Journal of Workers Education, June 2000).
Industrial relations constitute one of the most complex and delicate problems of the modern capitalist industrial production process, which is characterized by rapid change and conflicting ideologies on national and international fora. The ideas, institutions and patterns of collective bargaining, which had shaped the philosophy of industrial relations in the past, are being felt as comparatively irrelevant in the context of new developments, new technology, and the changing socio-political and economic order emerging throughout the world in general and in the developing countries in particular (Indian Labour Year Book, 1999).
The present structure of Indian industrial relations draws its spirit from the concept of a welfare state. At the time of independence several labour laws were enacted to protect the workers from exploitation. Labour policy was directed initially towards maintaining harmony for ensuring the realization of the objectives of economic planning. To deal with industrial conflicts four types of institutions were created: (i) Interventionist labour laws;(ii) industrial democracy; (iii) code of conduct, moral as well as disciplinary; and (iv) consultation machinery. (Collective bargaining through bipartism and tripartism). Among all these, state intervention has played the dominant and significant role. Wherever conflicts arose between employees and employers, state came in to sort out problems. In this process the state introduced an array of regulations to protect the interests of industry as well as of workers (Ratnam, 1996).
In the wake of the New Economic Policy (NEP), the state is now trying to deregulate Indian industries in order to compete with multinationals. New technologies and structural and other adjustments seem to have made position of trade union much more vulnerable than any time in the past.
The growing flexibility of Indian industries has left unions with little membership and very little to do. This has weakened their power a In many sick public sector units, unable to compete in an open market system, trade unions have been compelled to adopt ‘concession bargaining’ for their many existence and survival. This is what is happening all over India and in Punjab too.
In this background an attempt has been made to understand the status and situation of labour and labour/industrial relations in Punjab. In the following pages some important aspects of labour and industrial relations, such as trade unionism and related aspects, industrial disputes and their causation and settlement machinery, composition of the labourforce, social security system and welfare schemes, problems and prospects of trade unionism, and the role of government, employers and trade unions and political leadership, will be discussed. In addition, efforts will also be made to look at the future of labour and industrial relations in Punjab.

i) Data related to small industrial units and industrial disputes, involving less than ten workers resulting in work stoppage and lockouts, are not collected. In order to have a complete picture of the industrial relations scene at the state, as well as at the national level, it would be necessary to ensure collection and dissemination of requisite data on all the industrial disputes resulting in work- stoppages or lockouts.
ii) The whole set of data disseminated by the State Labour Department and the National Labour Bureau largely relate to the organized sector. Industrial disputes resulting in work stoppages in the unorganized sector, therefore, mostly go unrepresented in the industrial relations picture.
iii) Since the data are collected on a voluntary basis, some degree of non-response cannot be ruled out. The solution, however, does not lie in statutory submission of the requisite, but inadequate, statistics, but in strengthening the data collection machinery of the states, and also training those involved in the job of collection of labour-related information.
COMPOSITION OF THE LABOURFORCE IN PUNJAB
Punjab’s economy is predominantly agricultural. However, over a period, its overall economy has undergone a structural transformation. The sectoral distribution of the workforce shows that in 1981, 58.02 per cent of the workforce of Punjab was engaged in agriculture. In 1991 (cultivators and agricultural labour), the percentage was 55.26 per cent and in 2001 it has declined to 39.4, which constitutes a marked shift in the workforce from the agricultural to the non-agricultural sector during this decade. One can call it a qualitative shift in the economy. This loss in the share of employment in the primary sector is due to the shift of the workforce to the secondary and tertiary sectors. The recent Census on Punjab (2001) reveals that the share of workers in the household industry has increased from 1.33 per cent in 1991 to 3.4 per cent in 2001. Clubbed data of manufacturing and others show that the in share in engaging workforce was 45.74 per cent in 1991 and 60.6 per cent in 2001. The shift from primary to the secondary and tertiary sectors is 14.86 per cent. This is a very significant change in the share of the workforce in different sectors. The domination of small-scale and unregistered tiny units in the industrial structure in Punjab is another significant feature of the economy.
According to the 1991 Census, only 12.98 per cent of the workers are employed in the organized sector of Punjab and the rest 87.02 per cent are in the unorganized sector, where labour laws are applied negligibly. In the light of this it is imperative to see how the life and livelihoods of those engaged in this unorganized sector can be made more secure against deprivation. The pattern of employment is also of low quality, as the majority of the workforce is employed as farm and construction workers and unskilled labourers in factories and elsewhere. {White Paper on the State Finances, Government of Punjab, March, 2002)
Migrant Labour
Migrant labour is another important component of the labourforce of Punjab, apart from local labour. However, according to the census reports of 1971,1981,1991, Punjab still is an out-migrating state. A major proportion of the migrant labourforce working in the industrial and agriculture sectors of Punjab hail from Uttar Pradesh, Bihar, Rajasthan

and Orissa. They are attracted to Punjab because of better employment opportunities and higher wages than in the states of their origin. IViigrants are not only employed in agriculture and the industrial sector, but in other occupations too, such as building and road construction, brick making and rickshaw pulling, etc. Most of these migrants are males. It needs special mention that a large number of these migrants are permanent settlers in Punjab as a part of urban and rural settlements. Those who migrate seasonally and continue to shift their residence and remain in circulation are not recorded in the census data. Therefore, a large number of migrants remain unrecorded {Draft Human Development Report, Punjab, 2001).
Various persons, scholars, academics have made estimates of unrecorded migrants. For instance Avasthi (1997,1-2) estimates that out of the 14.33 lakh agricultural labourforce about 2.5 lakh are migrant workers; 84,000 out of one lakh workers engaged in brickkilns are migrant workmen; and in the construction sector out of 1,56 lakh workers nearly 1.10 lakh are migrants. Employment of inter-state migrants in the industrial sector too is substantial. Such migrants are estimated to number about six to seven lakh. This immigration has posed important issues not only, for the socio-economic and political environment of the state, but also for settlement patterns, wage rates, single unit migration and above all the newly evolved forms of exploitation of in-migrants to Punjab from other backward states (Chand, 1998: 3). Thus, migrant labour plays a major role in the economic development of the state.
It has been perceived that migrant labour is placed lower than the local labour in terms of economic status and is also exploited. They meet with discrimination in terms of wage payment, hours of work, social behaviour and social security covers and social and basic amenities. It is also not true that the provisions of Inter-State Migrant Workmen’s Act are being followed in Punjab and of Minimum Wage Act are being implemented, especially in the unorganized sector. As this situation has very serious implications for harmonious industrial relations in Punjab, it needs the immediate attention of the state government.
Child Labour
According to the census figures, there were 2,32,774 working children in Punjab in 1971, 2,16,939 in 1981 and 1,42,830 in 1991. Evidently there has been a tremendous decrease/decline in the number of working children in Punjab over the decade 1981-91. The decline is 34.16 per cent, which amounts to 3.42 per cent per annum. In Punjab, the proportion of working children to total children in the age group of 5-14 years, was 5.16 per cent during 1981 and 3.03 per cent during 1991 (Sharma, 2001:68-69).
Sex-wise distribution of child workers shows the predominance of males (86.70%). Data further reveal that the majority of main workers are male and females are marginal workers. According to the 1991 census, there were 1,20,520 children in rural areas and 22,310 in urban areas of Punjab, which shows that child labour is mainly prevalent in rural areas (85.62%). In rural areas child workers are engaged in the agricultural sector and allied activities (Sharma, 2001: 70-74). One can conclude that in Punjab child labour is predominantly confined to the agricultural sector followed by services and small-scale cottage industry.
In 1981, main child workers were 82.70 per cent of the total child workers and this proportion further rose to 93.96 per cent during 1991. This clearly shows that the percentage of marginal workers is very small and child labour in Punjab mainly comprise

of those children who work for the major part of the year and their main activity is confined to either cultivation as agricultural labourers, or in the household industry, or in some other jobs in the informal sector. If we compare this figure with the all-India figure it seems negligible, but as Punjab is a very prosperous state, it is a matter of great concern to the state. The labour department of Punjab Government in 1997 carried out a survey of 28,644 factories/shops and commercial establishments to find out cases of child labourers. A total number of 3,614 children were detected working in 1,681 establishments (Child Labour Survey Report, Department of Labour, Punjab, 1997).
The survey found a large number of children, i.e., 1,906, working in brick kilns, followed by 936 in hotels, restaurants, dhabas and tea stalls, 91 children were working in hazardous processes, defined by schedule ‘A’ or ‘B’ of Child Labour (Prohibition and Regulation) Act, 1986. The survey data further show that out of 3,614 children detected 2,802 were males and 812 female and 2,952 (81.68%) illiterate. Further information shows that 2,474 (68.45%) children detected were found to be working for a period ranging from 0 to 6 months. The majority of them 2,761 (75%) were working for more than six hours a day. Of the children detected 428 were getting up to Rs 200 per month, 1,334 from Rs. 200 to Rs. 500 and only 1,852 (48.75%) getting wages about Rs. 500 per month. The survey also much that most of the children found working were wards of migrant labourers. Locals were very few. Data, also show district-wise concentration of child labour. Out of 3,614 child labourers detected by the survey, the maximum number (932) in Amritsar, followed by Kapurthala (769), Jalandhar (384), Hoshiarpur (347), Patiala (211) and Ludhiana (144), [Child Labour Survey Report, Department of Labour, Punjab, 1997).
Poverty, till date, has been identified as the single largest reason for child labour. Although the magnitude of absolute poverty is relatively less than in many other states, relative poverty exists in Punjab. This has contributed to the existence of a sizable child labourforce. In most of the cases children contribute to augmenting the family income. Besides the Scheduled Castes and Backward Castes of the state, migrant labour from Bihar, Uttar Pradesh, Orissa and other states have also contributed in aggravating the problem of child labourers in Punjab as the all send their children to work as child labourer to enhance their income.
Employers not only take advantage of their vulnerable position by paying less wages. They have also pushed them to hazardous work. Employers find that the advantage of employing children is that they do not go on strike and disrupt production. They are also the easiest to dislodge at times of economic difficulties. Children are the cheapest to hire and easiest to fire as they do not resist. They can be made to work in poor working conditions on a very low wage rate. Since it affects industrial relations, they should intervene urgently to insure that the children of disadvantaged sections and properly looked after to become a high quality human resource for the development of the society.
TRADE UNIONISM IN PUNJAB
The growth of trade unionism in Punjab is part of the history of Indian trade union movement. Before 1947, there was not much trade union activity in Punjab. There were only four trade unions, up to 1919-20. These were affiliated to the AITUC, as mentioned by Mathur and Mathur (1957.17-18). There also existed another five unions sympathetic to the AITUC, which had a very brief existence. It was only during 1930-40 that the

number of trade unions in Punjab rose to 65, with a membership of 11,051, which however, declined to 22 in 1944-45,
After independence, the trade union movement in Punjab got an impetus from different political parties. The green revolution triggered a great deal of agricultural and industrial development in the state. Consequently, there was an increase in employment in the industrial sector. This gave new life to the trade union movement in Punjab. Many factors common to Indian trade unionism have influenced and facilitated its growth in the state. An attempt has been made here to understand the status of trade unionism in reorganized Punjab since 1966. Various indicators which have affected the growth of trade unionism have been analysed and discussed with the help of available statistics.
Growth of Trade Unions in Punjab
Punjab, unlike other states, shows a declining trend in the density of unionization as, measured by the ratio of membership per union. This is understandable, because industrialization of Punjab is still based largely on small firms. The number of registered trade unions in the state increased more than four-fold from 536 in 1968 to 2,297 in 1999 (Table 25). The number of unions submitting returns is very low. A similar tendency has been observed at the national level too (Ratnam, 1996: 3). There are only 523 unions (22.77%) submitting returns as against 2,297 registered unions registered in 1999. According to available data, there has been a 52 per cent increase in the index number of unions submitting returns between 1968 and 1999, but the response rate has sharply declined from 64 per cent to 23 per cent. This is indicative of the failure of the government to make the unions file their returns regularly, although it is a statutory obligation. It also reflects the irresponsible and casual approach of the management of the trade unions. In view of only a 23 per cent (in 1999) response rate it would not be safe to conclude that the average membership per union has increased from 257 to 1,035, as revealed in Table 25.

Year Total No. of registered
unions
Index of registered unions
(1968 = 100)
No. of unions submitting
returns
Index of unions submitting returns
(1968 = 100)
Membership of unions submitting
returns
Index of membership (1968 = 100)
Responserate
Average membership of unions submitting
returns1968 536 100.00 344 100 88413 100.00 64.18 2571969 592 110.45 323 93.89 89681 101.43 54.56 2781970 624 116.42 379 110.17 119200 134.82 60.74 3151971 476 88.81 365 106.10 125187 141.59 76.68 3431972 543 101.30 389 113.08 r 157691 178.35 71.64 4051973 624 116.42 412 119.76 203686 230.38 66.03 4941974 678 126.49 433 245.63 212259 240.07 63.86 4901975 731 136.38 464 134.88 205877 232.85 73.53 4441976 751 140.41 410 119.18 223865 253.20 54.59 5461977 815 152.05 399 115.98 206736 233.82 48.96 5181978 887 165.48 409 118.89 232732 263.23 46.11 5691979 986 183.95 470 136.62 279300 315.90 47.67 5941980 1070 199.62 409 118.89 225592 255.15 38.22 5521981 1169 218.09 462 134.30 310189 350.84 39.52 6711982 1173 218.84 473 137.50 346049 391.40 40.32 7321983 1218 227.24 469 136.33 333628 377.35 38.51 7111984 1292 241.04 416 120.93 275037 311.08 32.20 6611985 1376 256.72 457 132.84 316888 358.41 33.21 6931986 1429 266.60 491 142.73 341766 386.55 34.36 6961987 1512 282.09 484 140.69 316297 357.74 32.01 6541988 1635 305.04 456 132.55 393863 445.48 27.89 8641989 1745 325.56 507 147.38 446040 504.49 29.05 8801990 1851 345.33 467 135.75 385761 436.31 25.23 8261991 1806 336,94 477 136.68 397984 450.14 26.41 8341992 1876 350.00 415 120.63 347729 393.30 22.12 8381993 1927 359.51 407 118.31 393970 445.60 21.12 9681994 2004 373.88 467 135.26 494596 559.38 23.30 10591995 2075 387.13 417 121.22 431629 488.20 20.10 10351996 2097 391.23 446 129.65 445399 503.77 21.27 9981997 2158 402.61 426 123.84 443487 501.61 19.74 10411998 2226 415.30 499 145.06 459503 519.72 22.42 9211999 2297 428.54 523 152.03 660226 746.75 22.77 1262Sources: 1. Office of the Labour Commissioner, Punjab, Chandigarh.
2. E.S.O., Various issues of Statistical Abstract, Punjab, Chandigarh. Note: 1. Response rate = No. of union submitting returns
----------------------------------------------------------------- X 1 0 0Total No. o f registered unions
The data only of unions submitting returns reveal a declining trend with small membership. Clubbing the data into three categories, according to membership size,i.e., 0-499, 500 to 1,999 and 2,000 and above, at four points of time, i.e., 1968, 1981,1991 and 1999, shows that the percentage of small and medium size unions has decreased and those with a large membership has increased over 1968 to 1999 (Table 26). It has been observed that the share of unions with less than 500 members has continuously declined from 45.42 per cent in 1968 to 15.64 per cent in 1981 to 13.70 per cent in 1991 and to 9.18 per cent in 1999. This is also true of unions with a membership of less than 2,000, whose share has fallen substantially from 38.50 per cent in 1968 to 30.13 per cent in 1981 to 20.24 per cent in 1991 and to 13.14 per cent in 1999. Unions with a membership of more than 2 ,0 0 0 , have increased their share from 16 per cent in 1968 to 54.24 per cent in 1981 to 66.07 per cent in 1991 and to 77.68 per cent in 1999. It can possibly be concluded that workers must have realized that their strength lies only in their numbers. At the national level too, the degree of unionization is very high in the public sector with its large employment, while it is much less in small and medium units, particularly in the private sector (Ratnam, 1996: 4). It can, therefore, be concluded that, since Punjab has a large number of small-scale industries, the role of trade unions as such has not been as much in evidence as it might have been with large industries.
Income and Expenditure of Trade Unions
Adequate financial resources are a necessary condition for a union to be effective and independent. Table 27 shows that the financial status of unions in Punjab is comfortable. The average income has increased 17 times during 1968 and 1999, and the average expenditure 16 times. Another indication of the sound financial condition of the unions is the substantial closing balance in their accounts. This means that they are not short of funds for undertaking trade union activities. But unions in small units always face a financial crunch.
Trade Unions’ Affiliation with Central Federations
Indian unions are fragmented on the basis of ideological and other factional considerations and of caste and regional differences and also centred on personalities. (ILO, 1992). According to several studies, apart from low membership coverage and fragmentation, there has been a decline in membership and growing alienation between trade unions and members (Ramaswamy, 1998). In Punjab, mainly five central federations of trade unions, namely, the INTUC, AITUC, Bhartiya Mazdoor Sangh (BMS), Centre of Indian Trade Unions (CITU) and the Hind Mazdoor Sabha (HMS) are active among industrial workers, as evident from Table 28. However, a substantial number of unions in Punjab are not affiliated to any of these federations and operate independently. The table shows a growing tendency to seek affiliation with federations. This is also indicative of increase in politicization of trade unions. In 1968, 42.44 per cent of the trade unions, with 30.33 per cent of the total membership of unions, fell into the category of non-affiliated or independent unions. The percentage of unions in this category has declined continuously from 43.01 in 1970 to 29.87 in 1981 to 23.69 in 1991 and to 16.82 in 1999. Their membership too has decreased, though to a relatively lesser degree.

Year Less than 50 50-99 100-299 300-499 500-999 1000-1999 2000-4999 5000-9999 10000 & above TotalNo. Mem. % No. Mem. % No. Mem. % No Mem. % No. Mem. % No. Mem. % No. Mem. % No. Mem. % No. Mem. % No. Mem.
1968 91 2312 2.62 71 4439 5.02 103 19843 22,44 36 13561 15.34 26 17716 20.04 13 16319 18.46 3 7944 8.98 1 6279 7.10 0 0 0 344 884131969 78 2228) 2.48 69 4797 5.35 88 15559 17,35 43 15128 16.87 26 18534 20.67 16 21685 24.18 2 4930 5.50 1 6820 7.60 0 0 0 323 89681
1970 102 2832 2.38 68 468^ 3.93 11^ 19954 16,74 39 14709 12.34 27 18305 15.36 18 25052 21.02 5 19933 16.72 2 13734 11.52 0 0 0 379 1192001971 87 2338 1.87 72 5208 4.16 114 18153 14,50 39 15080 12.09 24 14690 11.73 21 28796 23.00 5 17522 14.00 3 23400 18.69 0 0 0 365 1251871972 95 2827) 1.79 6d 4886 3.10 12d 20695 13,12 40 1542^ 9.78 35 22675 14.38 19 27249 17.28 7 24256 15.38 5 39718 25.18 0 0 0 389 1577311973 84 2554 1.26 77 5032 2.47 128 21785 10.71 38 14690 7.22 46 29332 14.42 23 31903 15.69 ■ 7 20362 10.01 9 77726 38,22 0 0 0 412 2033841974 76 2150 1,07 88 6264 3.11 141 24126 11.96 38 14670 7.2d 47 29770 14.76 24 35496 17.6d 6 19546 9.69 9 69620 34.53 0 0 0 429 2016421975 82 2450) 1.19 94 6640 3.22 155 27047 13.14 37 14077 6.84 59 3374d 16.39 23 33045 16,0^ 11 30387 14.76 7 58483 28.41 0 0 0 464 2058771976 74 2167 0,97 88 6232 2.78 121 20901 9 .34! 38 14412 6 .44I 4d 30081 13.44 24 35371 15,80 7 22324 9.97 10 92377 41.26 0 0 0 410 2238651977 71 2071 1.00 8: 5823 2.82 116 20441 9.89 39 14693 7.11 44 28382 13.73 28 38343 18,55 9 24599 11.90 9 72384 35.01 0 0 0 399 2067361978 7- 2131 0.92 72 4911 2.11 115 20418 8.77 43 15728 6,70 5^ 36761 15.80 25 35937 15,44 13 33476 14.38 10 83370 35.82 0 0 0 409 2327321979 77 2234 0.80 82 5851 2.09 14^ 24762 8,87 47 17126 6.li^ 66 44939 16.09 24 33625 12,04 18 48764 17.46 11 101967 36.51 0 0 0 470 2792641980 70 2256 1.00 63 4629 2.05 117 23725 10.52 49 18929 8.39 65 46816 20,75 22 31579 14,00 17 46228 20.49 0 51430 22.80 0 0 0 409 2255921981 71 2176 0.70 7^ 5394 1.74 133 24029 7.75 46 16896 5.45 72 49648 16.01 31 43806 14.12 25 75865 24.46 d 20191 6.51 5 72180 23.27 462 3101851982 73 2230 0.64 71 4972 1.44 78 10534 3.04 108 32311 9.34 72 48873 14.12 32 45316 13.09 27 78293 22.62 4862d 14.0d 5 74894 21.64 473 3460491983 77 2430 0.73 76 5039 1.51 75 1056© 3.17 110 31678 9.5Q 57 33222 9,96 33 43762 13.12 27 73906 22.15 7 55574 i6.ed 7 77451 23.21 469 3336281984 77\ 248S 0.90 5S 3937 1.43 141 24650 8.96 36 13356 4.80 4^ 30919 11,24 25 32363 11.76 26 72632 26.41 6 36034 13.10 4 58658 21.33 416 2750371985 62 1941 0.61 81 5619 1.77 135 23732 7.4^ 50 17173 5.42 64 43637 13,77 28 38966 12.30 25 72475 22.87 8 57019 17.99 4 56334 17.78 457 3168881986 67 1994i 0.58 88 6780 1.98 153 27542 8.00 49 17534 5.13 67 45649 13.36 24 35431 10.37 27 79847 23.36 12 75299 22.03 4 51690 15.12 491 3417661987 7d 2177 0.69 91 5845 1.85 144 25279 7,99 49 18293 5.78 61 41850 13.23 32 42529 13.45 25 75782 23.96 7 45423 14.36 5 59113 18.69 484 3162971988 60 1685 0.43 74i 4609 1.17 141 21387 5,43 42 13479 3.42 55 31893 8.10 32 34948 8.87 30 105765 26.85 15 96191 24.42 7 83906 21.30 456 3938631989 76 2407 0.54 74 5297 1.1^ 157 28461 6,38 50 18909 4.24 61 3956^ 8.87 40 51713 11.59 30 100997 20.64 13 86935 19.4^ 6 111753 25.05 507 4460401990 58 1945 0.50 66 4592 1.19 145 25430 6,59 58 23189 6,01 71 48372 12.54 25 33540 8.69 29\ 96051 24.90 10 73570 19.07 5 79072 20.50 467 3857611991 53 1677 0.42 77 5292 1.33 147 25176 6.33 59 22360 5.62 73 48113 12.09 24 32421 8.15 28 85775 21.55 10 68688 17.26 0 108482 27.26 477 3979841992 56 1780 0,51 68 4713 1.36 111 19426 5.59 60 22110 6.36 66 45114 12.9^ 18 25272 7.27 27 87168 25.07 4 27382 7.87 5 114734 32.99 415 3477291993 54 1557 0,40 61 4244 1.08 115 20224 5.13 54 19907 5.05 60 40841 10.37 20 29135 7.39 3Q 97997 24.87 8 54482 13.83 125583 31.88 407 3939701994 60 1923 0.39 67 4652 0.94 140 25492 5.15 58 21711 4.39 65 42533 8.60 34 46486 9.40 26 87537 17.70 11 65193 13.18 0 199069 40.25 467 4945961995 59 1805 0.42 70 4915 1.14 120 21455 4.97 54 20362 4.72 49 34535 8.00 24 32299 7.48 25 82426 19.10 10 58093 13.46 0 175739 40.71 417 4316291996 56 1778 0.40 81 5465 1.23 134 24322 5.46 46 18547 4.16 61 43881 9.85 2S 39468 8.86 27 93955 21.09 7 43460 9.76 6 174523 39.18 446 4453991997 57 1818 0.40 70 4957 1,12 125 22690 5,12 53 20855 4.70 48 33942 7.65 28 40120 9.05 31 108759 24.52 7 48428 10.92 7 161918 36.51 426 4434871998 59 1890 0.41 73 5158 1,12 138 24323 5.29 51 19353 4.21 54 36848 8.02 29 40119 8.73 29 99651 21.69 10 59178 12.88 6 172983 37.64 449 4595031999 60 1936 0.29 69 4858 0,74 174 29254 4.43 64 24573 3,72 62 41964 6.36 31 44791 6.78 40 133416 20.21 13 83964 12.72 10 295470 44.79 523 660226
Sources; 1. Office of the Labour Commissioner, Punjab, Chandigarh,2. E.S.O., Various Issues of Statistical Abstract, Punjab, Chandigarh.
Note: 1. The data relate only to trade unions, which submit their returns. 2. No.Percentage of membership in relations to total trade union membership.
= Number of unions; 3. Mem, = Membership of the unions; 4.% =

Year Opening balance (Rs.)
index of opening balance
(1968=100)
Income(Rs.)
Index of income
(1968=100)
Expend.(Rs.)
Index of expend.
(1968=100)
Closingbalance
(Rs.)
Index of closing balance
(1968=100)
Average income per union (Rs.)
Average expend,
per union (Rs.)
1968 268431 100 437314 100 416137 100 289608 100 1271 12101969 252439 94 613927 140 515091 124 351275 121 1901 15951970 233905 87 1281936 293 1127343 271 384494 133 3419 30061971 360338 134 1643624 376 1494741 359 509221 176 4503 40951972 505051 188 1633751 374 1608910 387 529892 321 4200 41361973 653353 243 1334031 305 1117599 269 869785 300 3238 27121974 838607 312 1354367 310 1387924 334 805050 278 3157 32351975 985665 367 1751540 401 1561739 375 1175466 406 3775 33691976 1283544 478 1442728 330 1359108 327 1367164 472 3519 33151977 777037 289 1356362 310 1202051 289 931348 322 3399 30131978 890764 332 1592578 364 1464356 352 1018986 352 3894 35801979 1470743 548 2145087 491 1789026 430 1826804 631 4564 38061980 1081215 403 1873295 428 1620890 390 1333620 460 4580 39631981 1906413 710 2997723 685 2448912 588 2455224 848 6489 53011982 3046297 1135 3766271 861 3406582 819 3405986 1176 7962 72021983 1431781 533 3465839 793 2973966 707 1953654 675 7390 62771984 3073447 1145 2879923 659 2556244 614 3397126 1173 6923 61451985 1374530 512 4531405 1036 4524707 1087 1381228 477 9916 99011986 3026907 1128 5000546 1143 5118882 1230 3208571 1108 10184 104251987 2246462 837 4058919 928 4097068 985 2208313 763 8386 84651988 5776792 2152 5592285 1279 8769187 2107 2599890 898 12264 192311989 1302825 485 5389284 1232 4349256 1045 4342853 1500 10630 85781990 1590213 592 6104149 1396 5992950 1440 1701412 587 13071 128331991 1556497 580 6411371 1466 5960249 1432 2007619 693 13441 124951992 2975062 1108 6868798 1571 6787739 1631 3057021 1056 16551 163561993 3328272 1240 4718853 1079 5134667 1234 2912458 1006 11594 126161994 4130956 1538 7826306 1790 7553413 1815 4403849 1521 16759 161741995 4557039 1693 7790043 1781 6713394 1613 5635688 1946 18681 160991996 4059545 1512 8800552 2014 6603845 1587 6256252 2160 19732 148071997 8190443 3051 16318209 2359 10754801 2584 13753851 4749 38306 252461998 5656146 2107 10263040 2347 7527765 1809 8391421 2897 20567 150861999 4814069 1793 11598305 2652 10349526 2487 6062848 2093 22176 19789
Sources:
Notes;
1. Office of the Labour Commissioner, Punjab, Chandigarh.
2. E.S.O., Various Issues of Statistical Abstract, Punjab, Chandigarh.1 .The information regarding income and expenditure is based on returns received from registered trade unions. 2. Expend. = Expenditure.

A ffilia tio n s <Year INTUC AITUC BMS CITU HMS 1 PMF Others Total
No. % Mem. % No. % Mem. % No, % Mem. % No. % Mem. % No. 1 % Mem. 1 No. % Mem, % No. % Mem. % No. Mem1968 84 24.42 19905 22.5 49 14.24 21151 23,92 62 18.02 19631 22.20 0 0 0 0 3 0,87 914 1.03 146 42.44 26812 30.33 344 884131969 42 13.00 16197 18.06 51 15,79 18223 20.32 87 26.93 31040 34.61 0 0 0 Oj 3| 0.92 1154 1.29 140 43 34 23067 25.72 323 896811970 64 17.20 20593 17.28 40 10,75 2088a 17.53 91 24.46 36675 30.78 12 3.23 5020 4.21| 5| 1.34 1339 1.12 160 43.01 34633 29.07 372 1191481971 57 15.62 29083 23.23 44 12,05 23592 18.85 99 27.12 36514 29.17 10 2,74 3135 2.50j 4 1,10 1040 0.83 - 151 41.37 31823 25.42 365 1251871972 80 20.56 52038 32,99 45 11,57 22192 14.07 110 28.28 45320 28.73 13 3.34 5702 3.611 1 0.26 245 0.16 140 35,99 32234 20.44 389 1577311973 92 22.33 70545 34.63 45 10.92 24270 11.92 126 30.50 63989 31.42 10 2.43] 4200 2.od g 1.21 1706 0.84 - 134 32.52 38976 19.14 412 2036861974 99 21.93 68991 33.61 50 11.55 22443 10.93 124i 28.64 68468 63.36 13 3.00 4713 2.3d 1.62 2529 1.23 144 33.26 38118 18.57 433 2052591975 111 23.92 75310 36.58 51 10.99 25434 12.35 130 28,02 69071 33.55 15 3.23 4836 2.3S d 1.08 1924 0.93 152 32.76 29302 14.23 464 2058771976 89 20.00 88430 39,50 44 10.77 42019 18,77 121 29.4^ 60864 27.191 19 3.65 3990 1.7a 4 0.97 1752 0.78 3 0.73 1343| 0.60 139 33.81 25467 11.38 411 2238651977 61 15.29 59378 28,79 47 11,78 39020 18.92 125 31.33 60161 32.08 id 4.01 8151 3.93 d 1.50 2297^ 1.12 6 1.50 1423 0.68 138 34.59 29806 14.46 399 2062361978 46 11..25 61245 26.31 45 11.00 37405 16.07 137 33.50 78876 33.89 24 5.87 11885 5.1l| 141 3.42 517a 2.22 6 1.47 3798 1.63 13/ 33.50 34345 14.76 409 2327321979 69 14.68 69709 24,96 42 8.94 2481^ 8,89 141 30.00 86752 31.06| 30 6.381 17319 6.201 ia 2.77 4602 1.67 4 0.85 11041 0.40 171 36.38 749637 26.83 470 2793001980 60 . 14.671 49580 21.98 34 8.31 10999 4.87 161 39.36 98.140 43.50 27 6.60 15786 7.od iq 2.44 424d 1.88 1 0.24 750 0.33 110 28.36 46100 20.44 409 2255911981 73 15.80 97919 32.19 41 8,87 30847 10,14 159 34,42 91715 30.15 43 9.31 26854 8.83 1.52 707d 2.33 1 0.22 865 0.28 138 29.87 '48914 16.08 462 3041891982 74 15.64 93524 27,03 64 13.53 46504 13.44 137 28.96 89897 25.98 45 9.51 30324 8.7S a 1.69| 7897^ 2.28 1 0.21 867 0.25 144 30.44 77039 22.26 473 3460521983 83 17.70 77977 23,37 59 12.58 53528 16,04 165 35.18 95890 28.74 47 10.02 30146 9.04 10 2.13 89oa 2.67 1 0.21 750 0.22 104 22.17 66429 19.91 469 3336281984 40 9.62 39177 14,24 61 14.66 36688 13,34 143 34.38 93308 33.93 46 11.06 22022 8.01 12| 2.88 16499 6.00 3 0,72 1353 0.49 111 26.68 65993 23.99 416 2750401985 48 10.50 43975 13,88 76 16.63 45379 14.32 148 32.38 98012 30.93 51 11.16 27883 8.8a 12 2.63 19379 6.11 3 0,66 1390 0.44 11^ 26.04 80878 25.52 457 3168881986 66 13.44 48478 14,18 83 16,90 59237 17.33 172 35.03 123025 36.00 31 6.31 16723 4.89 a 1.83 919a 2.69 4 0.81 2079 0.61 126 25.66 83026 24.29 491 3417661987 44 9.09 26180 8,28 84 17,36 60616 19,16 166 34,30 21755 38.49 55 11.36 31266 9.89 6| 1.24 2889 0.91 4 0.83 2591 0.82 125 25.83 71000 22.45 484 3162971988 44 9.64 27509 6,90 sd 11,62 45179 11,47 167 36,62 136566 34.6^ 65 14.25 55835 14.ia id 2.19 15623 3.97 1 0.22 1094 0.28 lid 25.44 112057 28.45 456 3938631989 72 14.20 62590 14,03 78 15.38 41734 9.30 191 37.67 157381 35.28 54 10.69 54179 12.19 d 1,78 18414 4.13 2 0.39 2641 0.59 101 19,92 109101 24.46 507 4460401990 41 8.78 17127 4.44 74 15.85 52088 13.50 179 38,33 139462 36.15 50 10.75 16784 4.39 11 2.36 1849d 4.79 3 0.64 2292 0.59 109 23.34 139591 36.18 467 3858341991 65 13,63 65963 16,57 79 15,72 62796 15.78 172 36,05 144578 36.33 39 8.18 30992 7.79 id 2,10 9852 2.48 3 0.63 2989 0.75 lid 23.69 80814 20.31 477 3979841992 38 9.16 16943 4,87 5^ 13,49 36250 10.42 164 39,52 118095 33.96 49 11.81 46386 13.34 d 1.45 40329 11.60 5 1.20 1738 0.50 97 23.37 87991 25.30 415 3477291993 42 10„27 24641 6,25 63 15,40 59767 15,17 177 43.28 12489^ 31,70 13 3.18 33654 8.54^ d 1,22 47620 12.09 1.22 1355 0.34 104 25,43 102035 25.90 409 3939701994 66 14,13 80614 16,30 75 16,06 127626 25,80 174 37,26 132824J 26,86 34 7.28 36007 7.2a id 2,14 36657^ 7,41 1 0.21 1421 0.29 107 22,91 79447 16.06 467 4945961995 32 7.67 19992 4,63 76 18,23 131902 30,56 194 46,52 127924 29,64 23 5.52 27759 6 .4a 9j 2.16 34513 8,od 1 0,24 836 0.19 82 19,66 88703 20.55 417 4316291996 29 6.50 1774^ 3,92 74 16,59 137156 30,7^ 199 44,61 123158 27,65 46 10.31 34356 7.71 1,60 32439 7,28 2 0,83 1485 0.33 89 19,56 99059 22.24 446 4453991997 30 7.04 13643 3,08 64 15.02 123967 27.95 196 46.09 148148 33,40 37 8.69 27668 6.24 id 2,34 28479 6,42 2 0,89 1591 0.35 87 20,42 99994 22.54 426 4434871998 29 6.46 8594 1,87 66 14,69 122747 26,71 233 51.89 201349 43,82 33 7.35 37893 8.2s d 1,33 6254 1.36 2 0.45 1491 0.32 80 17,81 81175 17.66 449 4595031999 93 17.78 1397741 21,17 68 13.00 125876 19,06 232 44.36 209838 31,78 27 5.16 39783 6 .O3I 1^ 2.2^ 419151 6,35 0.57 1482 0.24 88 16,83 101557 15.38 523 660226
S o u rce s: 1. Office of the Labour Commissioner, Punjab, Chandigarh. N otes: 1. No. = Number of unions submitting returns
2. E.S.O 2. Mem. =
Various Issues of Statistical Abstract, Punjab, Chandigarh, Membership of unions submitting retums

The position of INTUC was the best among the federations, in 1968. It had the maximum number of affiliated unions (24.42%), followed by BMS (18.02%) and AITUC (14.24%). The position of INTUC has declined sharply to 6.46 per cent in 1998. The position of AITUC too deteriorated after 1970, but since 1984 onwards it has been able to register gradual improvement, reporting affiliation of 18.23 per cent of the total unions, with the highest membership of 30.79 per cent in 1996. BMS overtook INTUC in 1969 and started gaining ground continuously and has established a substantial lead. In 1998, BMS had the affiliation of little more than half (51.89%) of the unions in Punjab.
The membership of INTUC kept rising till 1983, but started declining thereafter and came down to 1.87 per cent in 1998. On the other hand, AITUC, which had been losing membership up to 1993, suddenly improved its position in 1994, 1995 and 1996 and claimed the highest percentage of union membership, i.e., 30.79 per cent, followed by BMS (26.65%), HMS (7.28%) and INTUC (3.92%). CITU, beginning in 1970, had been gaining till 1988 in the share of both affiliated unions and membership, but seems to have lost favour since. In 1988, it had 14.18 per cent of the total membership of the unions filing their returns, which came down to 6.03 per cent in 1999. HMS too has gradually improved its position. The Punjab Mazdoor Dal (PMD) has become almost redundant in the state.
INDUSTRIAL DISPUTES, THEIR CAUSES AND RESOLUTION
A systematic enquir into the trends of industrial unrest, along with causes and consequences, would be immensely useful for framing further strategies, policies and programmes for bringing about harmony in industrial relations in the state.
Industrial Disputes in Punjab
Between 1968 and 1999 the index number of industrial disputes rose from 100 to 441, with the exception of 1990 when it rose to 567. The index number of work stoppages, which had gone up to 393 in 1979 has since declined to 71 in 1999. The index of workers involved in work stoppages has shown an uneven trend. While it came down to 39 in 1974, it rose to 1,037 in 1989 and was down to 98 in 1999 (Table 29). This indicates a declining tendency among workers to participate in work stoppages. The index of mandays lost has far exceeded that of industrial disputes. During 1968 to 1999, the index number of disputes leading to work stoppages declined to only 71 per cent. The index number of mandays lost, however, increased nine-fold. This is because the average number of workers per work stoppages has increased a great deal. This shows a qualitative shift in the nature of industrial disputes. The number of mandays lost per work stoppage has increased substantially, i.e., work stoppages last longer, from several days to even weeks. This is a very disturbing trend, as compared to the period until about the mid-1970s, when work stoppages lasted only a few hours or days. It also means that the production resources and capacities installed in the mills are not being optimally utilized. This should be a matter of concern for those involved in corporate governance and state administration.

Table 29
Industrial Disputes in Punjab (1968 - 99)Year No. of
disputes raised
Index of disputes
raised (1968=100)
No. of worl<
stoppages
Index of worl<
stoppages (1968=100)
No. of workers involved in worl^ stoppages
Index of workers involved
(1968=100)
No. of mandays
lost in work stoppages
Index of mandays
lost (1968=100)
Estimated number of workers employed in
working factories
Index of workers
employed (1968=100)
1968 1981 100 28 100 11579 100 62375 100 104307 1001969 2340 118 23 82 5664 49 100278 161 105924 1021970 3514 177 22 79 38067 329 104161 167 116806 1121971 3094 156 15 54 32602 282 158867 255 118503 1141972 3574 180 30 107 7083 61 107533 172 118657 1141973 4432 224 55 196 6559 57 81837 131 127451 1221974 4254 215 24 86 4513 39 69285 111 131100 1261975 4932 249 21 75 10536 91 90332 145 136325 1311976 6461 324 33 118 7714 67 37961 61 144359 1381977 5430 274 57 204 28867 249 278516 447 156817 1501978 5987 302 94 336 21952 190 211052 338 168072 1611979 6802 343 110 393 20848 180 357690 573 188098 1801980 7830 395 89 318 35499 307 291477 467 201735 1931981 8072 407 89 318 25879 223 244609 392 208732 2001982 7975 404 76 271 34893 301 799293 1281 239198 2291983 8989 454 71 254 13604 117 228447 366 243008 2331984 8217 415 38 136 26530 F 229 177535 285 273932 2631985 8908 450 46 164 28086 243 173018 277 282214 2711986 8686 438 56 200 49109 424 643088 1031 298503 2861987 8895 449 50 179 20764 r 179 295727 474 326722 3131988 9922 501 44 157 21410 185 271100 435 336050 3221989 10091 509 52 186 120049 1037 600784 963 345145 3311990 11237 567 69 246 44038 380 303656 487 367513 3521991 10012 505 45 161 59318 512 294286 472 383798 3681992 7700 389 29 104 32131 277 230177 369 394979 3791993 7618 385 42 150 15673 135 300556 482 405223 3881994 7654 386 28 100 21031 r 182 260555 418 417998 4011995 7404 374 22 79 12610 109 521963 837 431729 4141996 7820 395 23 82 25855 223 364648 584 445004 4271997 8211 414 28 100 6075 r 52 105784 169 441357 4231998 8668 438 23 82 18053 156 784317 1257 449059 4311999 8727 441 20 71 11372 98 559128 896 446953 428
S o u rce s :! Office of the Labour Commissioner, Punjab, Chandigarh. 2. E.S.O., Various Issues of Statistical Abstract, Punjab, Chandigarh

Table 30 reveals that AITUC has sponsored the largest percentage of industrial disputes in Punjab, though other federations, as well as unaffiliated unions, have also become increasingly active in raising disputes. This trend has been evident since 1976. It is clear from Table 30 that as an organization, they raised 45 per cent of the disputes in 1999. Among the federations, AITUC raised the maximum number of disputes, averaging 25 per cent, followed by INTUC, CITU, BMS, HMS and PMD in that order. This shows that unions with a left ideology or those working independently (category of others) are more active in taking up issues of the workers than INTUC, BMS and HMS, etc.
Causes of Worl^ Stoppages
Stoppage means a temporary stoppage of activity in a unit, as a result of which the persons employed in it are forced to remain away from their usual duties. Such a work stoppage may be due to an industrial dispute or for other reasons, viz., financial stringency, strategic considerations, breakdown of machinery, natural calamities, accumulation of stocks, lack of demand, shortage of raw materials or electricity, power and coal, and legal disputes, etc. Work stoppage due to industrial dispute may be the result of a strike or a lockout.
Table 31 shows that causes of work stoppages have undergone change since 1968. Economic causes, viz., wages and allowances and bonus continue to remain the most important issues of industrial disputes in Punjab. These accounted for 75 per cent of the work stoppages in 1968, 62.22 per cent in 1991 and 40 per cent in 1999. The table shows that work stoppages, especially on account of wages and allowances, have sharply declined from 67.68 per cent in 1968 to 44.44 per cent in 1991 to 25 per cent in 1999. Work stoppages for bonus have substantially increased from 7.14 per cent in 1968 to 36.36 per cent in 1995. However, there are not that important now. Individual issues, such as suspension and termination have gained sharply in importance. Their share in work stoppages have increased from 3.57 per cent in 1968 to 20 per cent in 1999. This underlines the increasing concern of the workers and trade uni(^ns for protecting their employment, because of growing unemployment all over the country. Leave and holidays are the least important causes for work stoppages, while retrenchment and indiscipline and violence have led to substantial work stoppages in different years during 1968 to 1999. The total number of work stoppages in Punjab were 28 in 1968, reached a peak of 110 in 1979 and declined thereafter to 20 in 1999.
Dispute Resolution
The existing machinery for the settlement of industrial disputes consists of conciliation, adjudication and arbitration. Faith in the conciliation machinery has been significantly eroded between 1969 and 1999 as shown in Table 32. In 1969, it was used for the settlement of 27.54 per cent of the disputes. In 1999, its use had declined to only 7.87 per cent. During 1969 to 1999, on an average, 25 per cent of the disputes were

<I—o
20)
ooOCl
COCD
ro
Q
Q-
(fl
g lCO
05
CO
c«O
■s(A
■(00£.
Oz
N-CM
05'S t
05
Oz
o= )
- Csi- r-
r
CDLO(N
00oc\i
CDoo(N
00oCJ5
OO
oo
CD
CJ)
CM
CDCJ5
OJ
sCNJ
COCNJlO
CDOCO
CD
05OCN00
lO
IT5
o
00oOO
inCOCT)
0000in
CM
CO
oC35C35
CO
CD1^
00in
CO0
>
00h -00
00o00CO
C3500
CDCOCD
CMo00
00in(6CM
s
00CD05
s
'Oi nin
€ o
g ,sg .2 (rt 45 E ^£ o P w= S I E -■? J3 I 5
8£ w 5O HI 2

Year Wages & allowances Bonus Personal matters Retrenchment Leaves & holidays
Indiscipline & violence
Other causes Total
No. % No. % No. % No. % No. % No. % No. %1968 19 67384 2 7.14 1 3.57 1 3.57 - 5 17.86 281969 5 21.74 1 4.35 - 4 17.39 1 4.35 12 50.17 231970 9 40.40 1 4.55 1 4.55 - - 11 50.00 221971 60.00 1 6.67 - 1 6.67 - 4 26.66 151972 10 33.33 3 10.00 4 13.33 2 6.67 - 11 36.67 301973 12 21.8^ 7 12.73 16 29.09 3 5.45 1 1.82 16 29.99 551974 9 37.50 2 8.33 2 8.33 3 12.50 8 33.33 241975 6 28.57 - 5 23.80 1 4.76 1 4.76 8 38.10 211976 4j 12.12 7 21.21 7 21.21 5 15.15 - 10 30.30 33
"^1977 26 45.61 11 19.30 10 17.54 1 1.75 1 1.75 8 14.04 571978 48 51.06 6 6.38 17 18.09 d 5.32 1 1.06 17 18.09 941979 39 35.46 10 9.09 32 29.09 6 5.45 1 0.91 22 20.00 1101980 3d 42.70 7 7.87 23 25.84 J 5 5.62 16 17.98 891981 28 31.46 11 12.36 20 22.47 3 3.37 1 1.12 26 29.21 891982 28 36.84 3 3.95 23 30.26 1 1.32 1 1.32 20 26.32 761983 22 30.99 4 5.63 24 33.80 5 7.04 1 1.41 15 21.13 711984 13 34.21 3 7.89 14 36.84 8 21.05 381985 11 23.91 1 2.17 15 32.61 - - 2 (4 .35J 17 36.90 461986 16 28.57 3 5.3^ 15 26.79 2 3.57 1 1.78 2 (3.57^ 17 30.36 561987 14 28.0d 5 10.00 11 22.00 1 2.00 3 4.00 7 (14.00) 9 18.00 501988 11 25.00 4 9.09 19 43.18 - - 6 (11.36) 5 11.3^ 441989 21 40.38 3 5.77 16 30.77 3 5.77 1 1.92 5j (5.77) 5 9.62 521990 23 33.33 6 8.70 20 28.98 9 13.04 - 5 (7.753 6 8.6d 691991 20 44.44 8 17.78 8 17.78 - 2 (4.44) 7 15.56 451992 10 34.48 3 10.34 6 20.68 - - 3 (10.34) 7 24.14 291993 10 23.81 3 7.14 9 21.43 3 7.14 1 2.38 5 (11.90^ 11 26.19 421994 5 17.86 1 3.57 5 17.86 4 14.2S 13 46.43 281995 7 31.82 8 36.36 5 22.73 2 9.09 - - 221996 9 39.13 4 17.39 2 8.69 3 13.04 - - - 5 21.74 231997 10 35.71 1 3.57 7 25.00 4 14.29 - n 6 21.43 281998 5 21.73 2 8.70 3 13.04 1 4.35 - - 12 52.17 231999 5 25.00 3 15.00 4 20.00 1 5. 00 - - - 7 35.00 20
Sources: 1. Office2. E.S.O
of the Labour Commissioner, , Various Issues of Statistical
Punjab, Chandigarh.Abstract, Punjab, Chandigarh

Year Disputes pending under
examination at the beginning
of the year
Disputes during
the year
Total disputes
available for disposal
Disputes settled
mutually or in conciliation
Disputes withdrawn by
workers/unionsDisputes
referred for
arbitration
Disputes rejected or filed
Disputes referred for adjudication
Disputes pending for disposal at ttie end of the year
With conciliation officer
With Labour Commissioner or
Government
No. No. No. % No. % No. % No. % No. % No. % No. % No. %
1969 314 2340 2654 100 731 27.54 673 25.35 15 0.57 380 14.32 539 20.31 154 • 5.80 162 6.10
1970 316 3514 3830 100 816 21.31 866 22.61 23 0.60 322 8.41 1146 29.92 225 5.87 432 11.28
1971 657 3094 3751 100 722 27.25 888 23.67 19 0.51 313 8.34 1096 29.22 185 4.93 228 6.08
1972 413 3574 3987 100 885 22.20 1022 25.63 15 0.38 312 7.83 867 21.75 495 2.42 391 9.81
1973 886 4432 5318 100 1284 24.14 1272 23.92 4 0.08 344 6.47 1160 21.81 512 9.63 742 13.95
1974 1254 4254 5508 100 818 14.85 1291 23.44 2 0.04 388 7.04 1382 25.09 742 3.47 885 16.07
1975 1627 4932 6559 100 1039 15.84 1505 22.95 7 0.11 374 5.70 1975 30.11 666 10.15 993 15.14
1976 1659 6411 8070 100 1391 17.24 1712 21.21 10 0.12 53 0.66 3096 38.36 525 6.51 1283 15.90
1977 1808 5430 7238 100 970 13.40 1390 19.20 12 0.17 97 1.34 2803 38.73 584 8.09 1382 19.09
1978 1966 5987 7953 100 934 11,74 1553 19.53 6 0.08 305 3.84 2709 34.06 691 8.69 1755 22.07
1979 2466 6802 9248 100 1233 13.30 1460 15.75 2 0.02 573 6.18 4061 43.82 560 6.06 13.79 14.88
1980 1939 7830 9769 100 1504 15.40 1633 16.72 1093 11.19 4073 41.69 1466 15.66*
1981 1466 8072 9538 100 1770 18.56 2137 22.41 706 7.40 3025 31.72 1196 12.54 704 7.38
1982 1900 7995 9895 100 1570 15.87 2544 25.71 - 580 5.86 3721 37.60 918 9.28 562 5.68
1983 1480 8989 10469 100 1598 15.26 2859 27.31 - 936 8.94 2655 25.36 1303 12.45 1118 10.68
1984 2421 8217 10638 100 1704 16.02 3235 30.41 - 888 8.35 712 6.69 2364 22.22 17.35 16.31
1985 1735 8908 10643 100 1661 15.61 2699 25.36 0.03 683 6.42 3381 31.77 1702 15.99 514 4.83
1986 2216 8686 10902 100 1544 14.16 3405 31.23 - 941 8.63 2169 19.90 1747 16.02 1096 10.05
1987 2843 8895 11738 100 1506 12.83 3540 30.16 - 685 5.84 3003 25.58 2125 18.10 879 7.49
1988 3004 9922 12926 100 1165 9.01 4218 32.63 - 868 6.72 3596 27.82 2018 15,61 1061 8.21
1989 3079 10091 13170 100 1160 8.81 4171 31.67 - 796 6.06 4574 34.73 2029 15.41 440 3.34
1990 2469 11237 13706 100 1125 8.21 4458 32.53 - 1204 8.78 4267 31.13 2331 17,00 321 2.34
1991 2652 10012 12664 100 1470 11.61 3635 28.70 - 790 6.24 4025 31.78 2364 18.67 380 3.00
1992 2744 7700 10444 100 1080 10.34 2678 25.64 - 559 5.35 4017 38.46 1803 17.26 307 2.94
1993 2110 7618 9728 100 983 10.10 3087 31.73 - 914 9.40 2416 24.84 1597 16.42 731 7.51
1994 2328 7654 9982 100 962 9.64 2966 29.71 - 934 9.36 2358 23.62 1587 15.90 1175 11.77
1995 2762 7409 10171 100 1039 10.21 2200 21.63 - 762 7.49 3602 35.41 - - 2668 26.23
1996 2668 7820 10448 100 1439 13.77 2498 23.91 - 716 6.85 2827 27.05 - - 3008 28.79
1997 3008 8211 11219 100 1281 11.41 2750 24.51 ■ - 300 2.67 3578 31.89 - - 3310 29.50
1998 3310 8868 12178 100 1055 8.66 3482 28.59 - 868 7.13 3109 25.53 2387 19.61 1277 10.49
1999 3664 8727 12391 100 975 7.87 3514 28.36 - 387 3.12 4714 38.04 2146 17.32 655 5.29
Sources:
Note:
1. Office of the Labour Commissioner, Punjab, Chandigarh.2. E.S.O., Various Issues of Statistical Abstract, Punjab, Chandigarh1. *: Break-up of disputes pending fo r disposals at the end of the year with conciliation officer or with labour Commissioner/ Government

w ith d ra w n e ith e r b y th e w o rk e rs th e m s e lv e s , o r on th e p e rs u a s io n o f co n c ilia tio n o ffice rs . O n an a v e ra g e , s ix to se ve n p e r c e n t o f th e c a s e s w e re re je c te d , o r file d by th e g o v e rn m e n t, d u rin g th is p e riod . A d ju d ic a tio n c o n tin u e s to be th e m o s t im p o rta n t m ethod . It h as b ee n u sed to re so lve 20 to 4 0 p e r c e n t o f th e d is p u te s on an a v e ra g e . G an i (1990 : 6 0 ) a nd R a tn a m (19 96 : 13) a lso m e n tio n g re a te r d e p e n d e n c e on a d ju d ic a tio n fo r the re s o lu tio n o f d isp u te s . Its use w a s e x c e p tio n a lly h igh in 1979 and 1980. V o lu n ta ry a rb itra tio n has fa lle n in to d isu se o v e r th e p e rio d u n d e rs tu d y . In d u s tria l d is p u te s , p en d ing b e fo re th e c o n c ilia tio n m a ch in e ry , o r u n d e r e x a m in a tio n w ith th e g o v e rn m e n t, have g ro w n to a b o u t 20 p e r ce n t, o r m ore . T h is p o in ts to th e in e ffic ie n c y , o r in a d e q u a c y , o f the m a c h in e ry a v a ila b le to h a n d le in d u s tria l d isp u te s .
R e ce n tly , th e P u n ja b L a b o u r D e p a rtm e n t h as a d o p te d a n e w s tra te g y o f h o ld in g Lok A d a la ts fo r re so lv in g in d u s tria l d is p u te s p e n d in g in la b o u r c o u rts . A c c o rd in g to th e State D eve lopm en t R eport on Labou r o f th e L a b o u r D e p a rtm e n t o f P u n ja b , th e s e L ok A d a la ts w e re s ta rte d w ith th e d ua l a im o f a ) re lie v in g c o u rts o f th e ir h e a v y w o rk lo a d ; and b) d e v e lo p in g an a lte rn a tiv e d isp u te s e ttle m e n t m e ch a n ism . F irs tly , it w a s to red uce d e p e n d e n c y on a d ju d ic a tio n and to g e t th e w o rk e rs and tra d e u n io n s to re p o s e th e ir tru s t in th e c o n c ilia tio n m a c h in e ry o f th e s ta te , and s e c o n d ly to p ro v id e ju s tic e to th e w o rke rs w ith o u t a n y cos t. T h is s y s te m is g a in in g m o m e n tu m a nd o n e h o p e s w o u ld be su cce ss fu l in lo o k in g a fte r th e in te re s ts o f the w o rke rs .
SOCIAL SECURITY AND WELFARE SCHEMES
T h e m o d e rn c o n c e p t o f so c ia l s e c u rity is a p ro d u c t o f th e in d u s tria l re v o lu tio n in the W e s t. E a rlie r, in Ind ia , th e jo in t fa m ily s y s te m w a s a b le to m e e t th e n e e d s o f soc ia l s e c u r ity o f a p e rson . B u t w ith th e b re a k u p o f th e jo in t fa m ily sys te m , d u e to m ig ra tio n o f u n e m p lo y e d m e m b e rs o f th e fa m ily to th e c itie s to w o rk in in d u s trie s , th e n eed fo r soc ia l s e c u r ity w a s fe lt. In Ind ia , th e e vo lu tio n and d e v e lo p m e n t o f so c ia l s e c u rity s c h e m e s is m a in ly a p o s t- in d e p e n d e n c e p h e n o m e n o n . T h o u g h th e r ig h t to so c ia l s e c u rity has n o t b ee n s p e c ific a lly in c lu d e d in th e C o n s titu tio n o f th e co u n try , o n e o f th e D ire c tive P rin c ip le s (A rtic le 4 1 ) o f S ta te P o licy lays d o w n : ‘th e s ta te sh a ll w ith in th e lim its o f its e c o n o m ic c a p a c ity and d e v e lo p m e n t m ake e ffe c tiv e p ro v is io n s fo r s e c u rin g th e rig h t to w o rk , to e d u c a tio n and to p u b lic a s s is ta n c e in ca se o f u n e m p lo y m e n t, o ld age , s ic k n e s s a n d d is a b le m e n t and in o th e r ca se o f u n d e s e rv e d w an t;
A c c o rd in g to th e A nnua l R eport on L abou r (1999-2000) o f th e M in is try o f L ab ou r, G o v e rn m e n t o f Ind ia , so c ia l s e c u rity re fe rs to th e p ro te c tio n , w h ic h s o c ie ty p ro v id e s fo r its m e m b e rs th ro u g h a s e rie s o f p u b lic m e a s u re s a g a in s t e c o n o m ic and so c ia l d is tre ss , c a u s e d b y s to p p a g e o r s u b s ta n tia l re d u c tio n o f e a rn in g s re s u ltin g fro m s ickn e ss , m a te rn ity , e m p lo y m e n t in ju ry , u n e m p lo y m e n t, in va lid ity , o ld a g e a nd d e a th and fo r p ro v id in g fo r m e d ica l ca re , w h ich is s u b s id iz e d in th e ca se o f fa m ilie s w ith ch ild re n . S o c ia l s e c u r ity p ro g ra m m e s a re d e s ig n e d to p ro v id e b e n e fits , in b o th ca sh and kind , on th e o c c u rre n c e o f su ch co n tin g e n c ie s .
U n d e r th e C o n s titu tio n o f Ind ia , so c ia l s e c u rity in its b ro a d s e n s e , a s e n v is a g e d in th e D ire c tiv e P rin c ip le s o f S ta te P o licy , is a m a jo r a s p e c t o f p u b ic p o lic y to d a y and th e e x te n t o f its p re v a le n c e is a m e a s u re o f th e p ro g re s s m ad e b y a c o u n try to w a rd s th e idea l o f a
w e lfa re s ta te .
B a s ic a lly , th e c o n c e p t is base d on id e a ls o f h u m a n d ig n ity a nd so c ia l ju s tic e . T h e In te rn a tio n a l L a b o u r O rg a n iz a tio n (ILO ), in its v a rio u s d e c la ra tio n s , c o n v e n tio n s and

re c o m m e n d a tio n s , o u tlin e th e c o n c e p t o f so c ia l se cu rity , in th e P h ila d e lp h ia D e c la ra tio n o f 1944, th e ILO has e n jo in e d fo r its e lf a so le m n o b lig a tio n to fu rth e r, a m o n g th e n a tio n s o f th e w o rld , p ro g ra m m e s w h ich w ill a ch ie ve th e e x te n s io n o f so c ia l s e c u rity m e a s u re s to p ro v id e a b a s ic in co m e to all in need o f su ch p ro te c tio n and c o m p re h e n s iv e m ed ica l ca re (R a jan , 2 0 0 0 :4 ). T h e ILO c o n v e n tio n No. 102 (27 A p ril 195 5 ) lays d o w n the m in im u m s ta n d a rd s o f/fe oc ia l se cu rity . T h e y co m p rise ; (i) m e d ica l ca re ; (ii) s ic k n e s s bene fit; (iii) u n e m p lo y m e n t b e n e fit; (iv) o ld -a g e bene fit; (v) e m p lo y m e n t in ju ry b e n e fit; (vi) fa m ily b e n e fit (v ii) m a te rn ity b e n e fit (v iii) in va lid ity b e n e fit (ix) s u rv iv o rs ’ b e n e fit
Ind ia has n o t ra tifie d a ll th e ILO c o n v e n tio n s re la tin g to so c ia l s e cu rity . T h e soc ia l se cu rity c o n v e n tio n s o f ILO ra tifie d by Ind ia a re th e fo llo w in g :
C o n ve n tio n N o. 18: W o rk m e n ’s C o m p e n s a tio n (O ccu p a tio n a l D is e a s e s ) 1925.C o n ve n tio n N o. 1 9 :E q u a lity o f T re a tm e n t (A c c id e n t C o m p e n s a tio n ) 1925.C o n ve n tio n N o.42 : W o rk m e n ’s C o m p e n s a tio n (O ccu p a tio n a l D ise a se s ).C o n ve n tio n (R e v is e d ) 1934.C o n ve n tio n No. 118: E q u a lity o f T re a tm e n t (S o c ia l S e cu rity ) 1962.
T h e re a re n a tio n a l law s, w h ic h p ro v id e fo r ce rta in m a n d a to ry b e n e fits in re s p e c t o f ce rta in e m p lo y m e n ts . T h e s e in c lu d e m e d ica l ca re and s ic k n e s s b e n e fits , in v a lid ity and s u rv iv o rs ’ b e n e fits , e m p lo y m e n t- in ju ry b e n e fits and m a te rn ity b e n e fits . T h e re a re law s e n a c te d and s c h e m e s e s ta b lis h e d by th e C e n tra l/S ta te G o v e rn m e n ts p ro v id in g fo r the soc ia l s e c u rity and w e lfa re o f s p e c ific c a te g o rie s o f w o rk in g p eo p le .
T he p rin c ip a l so c ia l s e c u rity law s e n a c te d by the C e n tra l G o v e rn m e n t a re th e fo llo w in g :
(a ) T h e W o rk m e n ’s C o m p e n s a tio n A ct, 1923 (W .C . A ct).(b) T h e E m p lo y e e s ’ S ta te In su ra n ce A ct, 1948 (ES I A c t).(c) T h e E m p lo y e e s ’ P ro v id e n t F u n d s and M is c e lla n e o u s P ro v is io n A c t, 1952
(E P F A ct).(d) T h e M a te rn ity B e n e fit A ct, 1961 (M B A ct).(e) T h e P a y m e n t o f G ra tu ity A ct, 1972 (P G A ct).
T he c o n c e p t a nd a p p ro a c h e v o lv e d b y ILO to w a rd s so c ia l s e c u rity in b e s t s u ite d to th e d e ve lo p e d c o u n trie s , w h e re th e la rge p ro p o rtio n o f w o rk e rs a re in re g u la r sa la rie d e m p lo y m e n t in th e o rg a n iz e d s e c to r w ith a d e q u a te ly h igh le ve ls o f in c o m e and the N a tiona l o r S ta te G o v e rn m e n ts a re a b le to p ro v id e soc ia l s e c u rity th ro u g h m a n d a to ry in su ra n ce w ith c o n tr ib u tio n s fro m a la rge s e g m e n t o f the p op u la tio n .
S e ve ra l e x p e rts on so c ia l s e c u rity d id n o t a d v o c a te th is ILO a p p ro a c h and sa id th a t it
w ou ld n o t be a p p ro p ria te fo r th e d e v e lo p in g co un trie s , in c lu d in g Ind ia , w h e re an o v e rw h e lm in g ly la rg e p ro p o rtio n o f th e w o rk fo rc e d oe s no t e n jo y a re g u la r sa la rie d incom e, as m ore th a n 90 p e r c e n t o f is e n g a g e d in th e u n o rg a n iz e d s e c to r a nd o n ly less than 10 p e r c e n t e n jo y th e b e n e fits o f th e o rg a n ize d se c to r. T h e y fu rth e r m a in ta in e d th a t soc ia l s e c u rity in th e d e v e lo p in g co u n trie s like Ind ia has to be in te g ra te d w ith a n tip o ve rty p o lic ie s , su ch as e m p lo y m e n t g u a ra n te e s and s e c u rity (R a jan , 2 0 0 0 :7 ). Th is, Ind ia has been d o in g s in c e in d e p e n d e n c e , bu t it has so fa r fa ile d to e v o lv e a ny co m p re h e n s iv e so c ia l s e c u rity p ro g ra m m e fo r the d is a d v a n ta g e d s e c tio n s o f th e so c ie ty . B e ca u se o f th is , o n ly th e w o rk fo rc e invo lved in the o rg a n ize d s e c to r can ta k e a d v a n ta g e o f th e s c h e m e s /la w s fo r so c ia l se cu rity .

A s P u n ja b h as n o t y e t e v o lv e d a ny in d e p e n d e n t so c ia l s e c u rity p ro g ra m m e o f its o w n , it fo llo w s th e p o lic ie s , law s, A c ts , p ro g ra m m e s o f th e C e n tra l G o v e rn m e n t. A b o u t 13 per c e n t o f th e w o rk fo rc e e n g a g e d in th e o rg a n iz e d s e c to r in th e s ta te e n jo y th e b e n e fits o f so c ia l s e c u rity sch e m e s , b u t th e m a jo rity e n g a g e d in th e u n o rg a n iz e d s e c to r a re n o t co v e re d by th e se s ch e m e s . T h u s th e p os ition o f P u n ja b is a lso n o t m uch b e tte r than th e re s t o f th e co un try .
A t th e a ll- In d ia leve l, o u t o f an e s tim a te d w o rk fo rc e o f a b o u t 3 9 .7 c ro re , o n ly 2 .8 c ro re e n jo y th e b e n e fit o f fo rm a l so c ia l s e c u rity p ro te c tio n . The Working Group on Social Security for the Tenth Five Year Plan (2002-2007), G o v e rn m e n t o f Ind ia , has p o in ted o u t th a t a s th e im p le m e n ta tio n o f so c ia l s e c u rity law s is th e re s p o n s ib ility o f th e e m p lo ye r, it d e p e n d s m a in ly upon h is g o o d b e h a v io u r, o r s w e e t w ill. W h e re th e e m p lo y e rs a re
e n lig h te n e d , o r th e re a re p o w e rfu l tra d e u n ion s , th e rig h ts o f th e w o rk e rs a re p ro tec ted and th e c o m p e n s a tio n s a re pa id as p e r the A ct. In all o th e r c a s e s th e re is a te n d e n c y to p a y a n o m in a l co m p e n s a tio n o r e ven to d e n y it. In su ch c a s e s th e o n ly re m e d y a va ila b le to th e w o rk e rs o r th e d e p e n d e n ts is to a p p ro a c h th e S ta te L a b o u r D e p a rtm e n t c o n c e rn e d and se e k its in te rve n tio n , w h ich g o e s u p to a rb itra tio n , w h ich is tim e c o n s u m in g . E ven a fte r a rb itra tio n th e re is no w a y in w h ich th e s ta te a u th o ritie s a re in a p o s itio n to e n fo rce th e p a y m e n t o f co m p e n s a tio n .
V e ry o fte n , it is se en th a t sm a ll e m p lo ye rs , e ven w ith v e ry g oo d in te n tio n s , do n o t have a d e q u a te fu n d s to d is c h a rg e th e ir liab ilities . A n o th e r s ig n ific a n t fin d in g o f th e s tu d y g ro up is th a t se ve ra l a tte m p ts h ave been m ad e in th e p a s t to a d d re s s th e m u ltifa rio u s p ro b le m s fa ce d by th e w o rk e rs in th e u n o rg a n iz e d se c to r, th ro u g h le g is la tiv e as w e ll as p ro g ra m m e -o rie n te d m e a s u re s . E ven th ro u g h th e s e m e a s u re s w e h a ve n o t su c c e e d e d in a c h ie v in g th e d e s ire d o b je c tiv e , p a rtly on a c c o u n t o f th e ig n o ra n c e , illite ra c y and lack o f u n io n iz a tio n o f w o rk e rs on th e o ne hand, and th e re s o u rc e c o n s tra in ts o f th e s ta te on th e o th e r. T h e re fo re , th e re is n eed fo r a w e ll-d e s ig n e d so c ia l s e c u rity sy s te m in P un jab , e s p e c ia lly fo r w o rk e rs e n g a g e d in sm a ll-s c a le un its , o r th e u n o rg a n iz e d se c to r. T he s u p p o rt and in v o lv e m e n t o f g o v e rn m e n t is e s s e n tia l in th is reg a rd .
K e e p in g th is s itu a tio n in m in d , th e W o rk in g G ro u p has s tre s s e d th a t a w e ll-d e s ig n e d so c ia l s e c u rity sys te m fo r th e w o rk e rs in th e u n o rg a n iz e d s e c to r w ill h e lp in im p rov ing p ro d u c tiv ity , c o n tr ib u te to h a rm o n io u s la b o u r/in d u s tr ia l re la tio n s and th u s to s o c io e c o n o m ic d e v e lo p m e n t. It w ill e n c o u ra g e and p ro p a g a te so c ia l p e a ce by re d u c in g the fre q u e n c y o f in d u s tria l c o n flic ts , in c re a se w illin g n e s s to w o rk , m a ke it e a s ie r to m e e t im p ro v e d q u a lity p ro d u c ts , e n s u re a b e tte r in v e s tm e n t c lim a te a nd th e re b y e n h a n c e the c o m p e tit iv e n e s s o f th e e co n o m y. It is s u g g e s te d h e re th a t th e P u n ja b G o v e rn m e n t s h o u ld m ake its ow n c o m p re h e n s iv e so c ia l s e c u rity p o licy fo r la b o u r, as it is o ne o f the d e v e lo p e d s ta te s o f Ind ia {Working Group on Social Security for Tenth Plan, 2002-2007).
Welfare Schemes
W ith th e h e lp o f th e C e n tra l G o v e rn m e n t, th e P u n ja b G o v e rn m e n t is ru n n in g a n u m b e r w e lfa re s c h e m e s fo r w o rk e rs , w ith fo c u s on ch ild a nd w o m e n la b o u r, and th e w a rd s o f w o rk e rs .
A c c o rd in g to th e State Development Report (SDR), b ro u g h t o u t by th e D e p a rtm e n t o f L a b o u r and E m p lo y m e n t, G o v e rn m e n t o f P u n ja b , th e L a b o u r D e p a rtm e n t, w ith the a s s is ta n c e o f C e n tra l L a b o u r M in is try , has s ta rte d th e N a tio n a l C h ild L a b o u r P ro je c t (N C L P ) fo r th e e ra d ic a tio n and w e lfa re o f ch ild lab ou r. U n d e r th is p ro g ra m m e , 27

s c h o o ls h ave b een o p e n e d in th e y e a r 2 0 0 0 in J a la n d h a r. In th e s e sch o o ls , ch ild w o rk e rs (m a in a nd m a rg in a l) a nd th o se w h o a re like ly to b e c o m e ch ild la b o u r a re a d m itte d . T he m a n a g e m e n t and th e d a y to d a y ru n n in g o f th e s e s c h o o ls h a ve b een e n tru s te d to N G O s, v o lu n ta ry o rg a n iz a tio n s , tra d e u n io n s and lo c a lly a c tive c lubs.
T h e sch o o l b u ild in g s a re w ith in the w a lk in g d is ta n c e fo r th e ch ild re n . T h e a im s, o b je c tiv e s and w o rk in g s ty le o f th e se sp e c ia l s c h o o ls h ave b ee n e x p la in e d to th e te a c h e rs . T h e cu rr ic u lu m o f th e s e sch o o ls is th e s a m e a s th a t o f th e re g u la r p rim a ry s ch o o ls . E ach ch ild is g ive n a s tip en d o f R s. 100 p e r m on th , and R s. 2 .5 0 p e r ch ild p e r d ay is sp e n t on re fre s h m e n ts fo r n u trition . T h e ch ild re n a re e x p e c te d to reach th e 5*^ s ta n d a rd w ith in th e p ro je c t pe rio d o f th re e ye a rs . A fte r c o m p le tin g th e sp e c ia l sch o o l e d u c a tio n , the ch ild re n a re e x p e c te d to jo in th e fo rm a l s tre a m o f e d u c a tio n in th e s ta n d a rd . T h o s e w h o a re n o t in te re s te d in fu rth e r s tu d ie s can jo in a v o c a tio n o f th e ir c h o ice fo r w h ich th e y w ill g e t tra in in g in th e s e sch o o ls . S o fa r, v o c a tio n a l g u id a n c e is no t be ing p ro v id e d in th e s e s c h o o ls . H ow e ver, th e re q u is ite sk ill w o u ld be p ro v id e d to the ch ild re n a c c o rd in g to th e g u id e lin e s o f th e p ro jec t.
In th e J a la n d h a r p ro je c t, u n d e r th e N C LP , a to ta l o f 1 ,350 c h ild re n w e re a d m itte d w ith th e ra tio o f 50 c h ild re n in e ach sch o o l. T h is p ro je c t has been e x te n d e d to L u d h ia n a and A m rits a r, m a jo r in d u s tria l c ities . A n o th e r w e lfa re sch e m e , o f th e L a b o u r D e p a rtm e n t, G o v e rn m e n t o f P u n ja b , is th e o rg a n iz a tio n o f h e a lth c a m p s w ith th e c o -o p e ra tio n o f e m p lo y e rs , tra d e u n io n s and so c ia l o rg a n iz a tio n s , in w h ich th e w o rk e rs g e t m ed ica l c h e c k u p and m ed ic in e .
T h e L a b o u r W e lfa re B o a rd , las t c o n s titu te d on 22 M arch 2 0 0 0 loo ks a fte r th e o th e r w e lfa re a s p e c ts o f lab ou r. T h e b a s ic fu n c tio n o f th e B o ard is to p ro v id e b e n e fits to in d u s tria l w o rk e rs a nd th e ir fa m ilie s , u n d e r d iffe re n t sc h e m e s . T h e m a in s o u rc e s o f in co m e o f th e B o a rd a re ;
1. G ra n t- in -a id b y th e s ta te g o ve rn m e n t.2. V o lu n ta ry d o n a tio n s .3. U np a id a c c o m m o d a tio n s tra n s fe rre d to W e lfa re Fund.
4 . In te re s t o f F D R s d e p o s ite d w ith banks.
T h e fo llo w in g w e lfa re s c h e m e s a re run by th e B oard :
i) B a lw a rd is fo r th e c h ild re n o f th e in d u s tria l w o rk e rs .ii) In te re s t-fre e loans.iii) G ra n t o f s tip e n d to th e c h ild re n /w a rd s o f in d u s tria l w o rk e rs a n d to in d u s tria l
w o rk e rs , fo r s tu d ie s .iv) S c h e m e s fo r g ra n t o f e x -g ra tia to the w id o w s o f in d u s tria l w o rk e rs .v ) C in e m a s h o w s fo r re c re a tio n o f in d u s tria l w o rk e rs and th e ir fa m ilie s .v i) L a b o u r w e lfa re ce n tre s .
A c c o rd in g to th e A n nua l R eport (2000) o f th e L a b o u r D e p a rtm e n t, 17 L a b o u r W e lfa re C e n tre s have b een se t up fo r th e b e n e fit o f th e w o rk e rs a nd th e ir d e p e n d e n ts , e s p e c ia lly w o m e n , a t im p o rta n t to w n s , nam e ly , A m rits a r, L u d h ia n a , B a th in d a , P h a g w a ra , J a la n d h a r, P a tia la , G o b in d g a rh , R a jp u ra , M oha li, N an ga l, A b o h a r, A n a n d p u r S a h ib and S a n g ru r. T h e s e ce n tre s im p a rt fre e tra in in g in se w in g , k n ittin g and e m b ro id e ry to th e
fe m a le m e m b e rs o f th e w o rk e rs ’ fa m ilie s .

CONCLUSIONS AND SUGGESTIONS
Conclusions
• T ra d e u n io n ism in P u n ja b as w e ll as in Ind ia d e v e lo p e d a lo n g w ith th e c o u n try ’s fre e d o m s trug g le . In P un jab , it g re w and d e v e lo p e d la rg e ly a fte r In d ia ’s in d e p e n d e n c e and p a rtic u la rly a fte r th e re o rg a n iz a tio n o f th e s ta te o f P u n ja b in 1966.
• T ra d e u n io n ism in P u n ja b in th e o rg a n iz e d s e c to r as a w h o le is in a fa ir ly h e a lth y sh a p e , bu t it is ve ry w e a k in th e u n o rg a n ize d se c to r, w h e re a b o u t 87 p e r c e n t o f th e w o rk fo rc e is e n g a g e d . T h e n u m b e r o f re g is te re d tra d e u n io n s , w h ich a re p rim a rily in the o rg a n iz e d se c to r, has in c re a se d fro m 5 36 in 1968 to 2 ,2 9 7 in 1999.
• T he p ro p o rtio n o f la rg e -s ize d u n io n s has been in c re a s in g , a nd th e c h a n g in g m e m b e rs h ip p a tte rn o f th e u n ion s sh o w s th a t w o rk e rs n o w jo in th o s e w ith a la rge m e m b e rs h ip . T h is fu rth e r s h o w s th a t in fu tu re , th e tra d e u n io n s w ill be a b le to b a rg a in fro m a p os ition o f s tre n g th and th e d e c is io n s a rr iv e d a t by su ch la rge u n io n s w ill be a c c e p ta b le to a la rge n u m b e r o f w o rk e rs . T h e p e rc e n ta g e o f in d e p e n d e n t u n ion s has d e c lin e d o v e r th e ye a rs , a s th e y se e no fu tu re w ith o u t a ffilia tio n to one o f th e fe d e ra tio n s .
• In 1999, in P un jab , B M S had th e m a x im u m u n io n s a ffilia te d to it and the m a x im u m p e rce n ta g e o f m e m b e rs h ip in th e sta te . B u t A IT U C has d e c lin e d in re s p e c t o f both . IN T U C has los t g ro u n d o v e r the la s t 25 y e a r in te rm s o f u n ion s a ffilia te d to it as w e ll in m e m b e rsh ip .
• A d e c lin in g trend has been o b s e rv e d in ind us tria l d is p u te s , c o n flic ts , m a n d a ys los t a nd n u m b e r o f w o rk e rs invo lved in th e se . T h e s e a re s ig n ific a n t a s p e c ts o f th e in d u s tria l re la tio n s sc e n e in P u n ja b . O ne m u s t a ls o n o te th e w e a k e n in g p o s itio n o f w o rk e rs ’ o rg a n iz a tio n s , fe a r o f los ing e m p lo y m e n t, w e a k n e s s o f sm a ll- s ize u n io n s and th e u n d e m o c ra tic a ttitu d e o f the m a n a g e m e n t. T h e m a jo rity o f th e in d u s tn a l d is p u te s have been ra ised by A IT U C and C IT U , fe d e ra tio n s w ith le ftis t lea n in gs .
• T h e a n a ly s is o f th e d a ta sh o w s th a t th e p a tte rn o f in d u s tria l d e v e lo p m e n t in P u n ja b w ill be m ore ca p ita l- in te n s iv e , n o t la b o u r-in te n s iv e . T h is w ill b ring a q u a lita tiv e sh ift in th e n a tu re o f in d u s tria l e m p lo y m e n t. M ore o f th e e m p lo y e e s w ill be sk ille d , te ch n ica l and p ro fe ss io n a l. T h is w ill h ave fa r-re a c h in g in flu e n c e s on th e in d u s tria l re la tio n s sys te m in P u n ja b , as the m a jo r ity o f th e s e m i-s k ille d and u n sk ille d la b o u r w ill b e co m e re d u n d a n t.
• A n o th e r s ig n ific a n t c h a ra c te r is t ic o f tra d e u n ion s in P u n ja b and e ls e w h e re is th e ir p o litica l a ffilia tion , w h ich d iv id e s u n io n s a lo ng p o litica l line s to s e rv e th e p o litica l in te re s ts o f re sp e c tive pa rties . T h is has a n e g a tive im p a c t on th e o rg a n iz e d s tre n g th o f th e w o rk in g c la ss and tra d e u n io n s in s e rv in g th e ir o w n in te re s ts .
• P rim a ry ca u se s o f w o rk s to p p a g e s in P u n ja b , as a t th e a ll- In d ia leve l, have been e c o n o m ic , i.e ., issue s re la ted to w a g e s , a llo w a n c e s and b on us .
• T h e d is p u te s s e ttle m e n t m a c h in e ry in P u n ja b has n o t b ee n v e ry e ffe c tive . T he w o rk e rs se em to have d e ve lo p e d an in d iffe re n t a ttitu d e to w a rd s th e g o v e rn m e n t m a c h in e ry o f the L a b o u r D e p a rtm e n t. T h a t is w h y th e y p re fe r s e ttlin g th e ir d is p u te th ro ug h the co urt, and a d ju d ic a tio n co n tin u e s to be th e m o s t e ffe c tive m e th o d fo r reso lv in g in d u s tria l d is p u te s in P un jab .
• T h e g o v e rn m e n t is w ith d ra w in g fro m in te rv e n tio n in in d u s tria l d is p u te s and tr ip a rtite n e g o tia tio n s have been re p la ce d by th e b ip a rtite sy s te m , in w h ich

m a n a g e m e n t and th e w o rk e rs se ttle d is p u te s b e tw e e n th e m s e lv e s . It can be c o n c lu d e d th a t th e p os ition o f th e m a n a g e m e n t has b e c o m e s tro n g e r th a n th a t o f th e w o rk e rs and th e ir un ions.
In o rd e r to m a in ta in th e sp ir it o f th e C o n s titu tio n and to s a fe g u a rd th e in te re s ts o f the d e m o c ra tic w e lfa re s ta te in Ind ia , it is o b lig a to ry fo r th e la w m a k in g m a c h in e ry to ta ke in to co n s id e ra tio n th e b a s ic te n e ts , i.e ., ju s tic e , e q u a lity , fra te rn ity and libe rty e n s h rin e d in o u r C o n s titu tio n . If th is is b o rn e in m ind th e n it w ill be p o s s ib le to m a in ta in and s tre n g th e n th e a im s and o b je c tiv e s o f th e C o n s titu tio n .
A s se en in p ra c tice , th e p re se n t la b o u r law s a re c u m b e rs o m e a nd te d io u s in th e p ro c e s s o f th e ir a p p lica tio n , and a n y b o d y can d ra w a n y m e a n in g fro m th e s e law s a t o n e ’s p le a su re . Law s sh o u ld , th e re fo re , be v e ry s im p le to u n d e rs ta n d and co m p re h e n s iv e in th e ir na tu re .
E rro rs and o m is s io n s , as ide n tifie d , m u s t be re c tifie d s p e e d ily . W h e n e v e r s o m e a m e n d m e n t is n ee de d it m u s t be ca rried o u t q u ick ly . D is p u te s sh o u ld n o t be ke p t p e n d in g b u t be d e c id e d in th e s h o rte s t p o s s ib le tim e .
G o v e rn m e n t m u s t a vo id b e co m in g a m o u th p ie c e o f a n y o n e s e c tio n o f the so c ie ty , as it re p re s e n ts th e e n tire n a tio n . A d e m o c ra tic g o v e rn m e n t is a lso e xp e c te d to loo k a fte r th e in te re s ts o f all se c tio n s o f th e s o c ie ty .
L a b o u r law s m u s t be im p le m e n te d in th e ir tru e s p ir it b y th e L a b o u r D e p a rtm e n t. If it d o e s n o t do so it sh ou ld be he ld re s p o n s ib le fo r th e n o n -im p le m e n ta tio n o f th e s e law s.
Law s sh o u ld be s tr ic tly fo llo w e d by b o th th e p a rtie s , i.e ., e m p lo y e rs and e m p lo y e e s , and if a ny a g re e m e n t is re a ch e d b e tw e e n th e tw o th en it m u s t be a d o p te d and fo llo w e d by both .
R e p o rts a b o u t th e im p le m e n ta tio n o f la b o u r law s, as p re p a re d by in d e p e n d e n t b o d ie s o f in te lle c tu a ls and su b m itte d to g o v e rn m e n t, m u s t be m a d e p ub lic .
T he a lre a d y e x is tin g re g u la to ry c o m m itte e s , tr ip a rtite and b ip a rtite m u s t be m a d e e ffe c tiv e to m ake in d u s tria l re la tio n s sm o o th and p e a c e fu l, by h o ld in g re g u la r m e e tin g s and p u ttin g fo rw a rd th e ir a d v ice and re c o m m e n d a tio n s .
It is n e c e s s a ry to th e s tu d y the la b o u r law s as a p p lie d , m o n ito r a n d e v a lu a te th e m fro m tim e to tim e. It h as a lso to be se en w h e th e r w e a re fo llo w in g th e
d ire c tio n s o f th e ILO .
O n e -e n te rp r is e o n e -u n io n m u s t be m ad e m a n d a to ry and u n ion e le c tio n s sh o u ld be th ro u g h s e c re t ba llo t. A s s ta te d a bo ve , th e s e p ro v is io n s m u s t be in c o rp o ra te d in la b o u r law s and th e ir a p p lica tio n to o m u s t be m ad e m a n d a to ry .
T h e in s titu tio n o f th e w e lfa re o ffic e r m u s t be d e fin e d , to m ake la b o u r la w s m ore e ffe c tiv e and p ra c tica l, and it sh o u ld n o t a p p e a r th a t he is o n ly a re p re s e n ta tiv e o f the m a n a g e m e n t. It has been o b s e rv e d th a t th e la b o u r w e lfa re o ffic e r has b e co m e in e ffe c tiv e and d y s fu n c tio n a l in p ra c tice .
A s w e ll-k n o w n e c o n o m is ts the w orld o ver, h ave p o in te d -o u t, la b o u r is th e b a c k b o n e o f e v e ry e co n o m y, o f e v e ry c o u n try o f th e w o rld . T h e re fo re , th e w e lfa re o f la b o u r m u s t be g ive n firs t p rio rity .
In th e ca se o f a g ro - in d u s tr ie s , a co -o rd in a tio n c o m m itte e o f w o rk e rs , fa rm e rs and m a n a g e m e n ts sh o u ld be c o n s titu te d in e ach in d u s try . T h is w ill n o t o n ly h e lp re s o lv e p ro b le m s o f a ll ih e th re e , b u t a lso p ro m o te s m o o th fu n c tio n in g o f th e s e in d u s tria l un its and h e lp to b ring h a rm o n y in in d u s tria l re la tio n s .

• T ra d e u n io n s sh ou ld a vo id p ro lo n g e d w o rk s to p p a g e s , as th e s e can a g g ra v a te th e co n flic t and h o s tility b e tw e en the so c ia l p a rtn e rs and u ltim a te ly ca u se loss o f p ro d u c tio n .
• T h e re is no need fo r s e p a ra te u n ion s fo r m ig ra n t w o rk e rs , s in c e th e in te re s ts o f both m ig ra n t and loca l w o rk e rs a re th e sa m e . A t th e s a m e tim e , th e un ion le a d e rs h ip and m a n a g e m e n t m u s t a d d re ss th e p ro b le m s o f m ig ra n ts to w in th e ir c o n fid e n c e and e n su re th e ir p a rtic ip a tio n in tra d e u n ion a c tiv it ie s .
• M a n a g e m e n t and g o v e rn m e n t sh ou ld c o n s id e r th e g e n u in e d e m a n d s o f the w o rk e rs s y m p a th e tic a lly , in th e c h a n g in g e n v iro n m e n t.
• P u n ja b G o v e rn m e n t, w ith th e he lp o f th e C e n tra l G o v e rn m e n t, o r on its ow n, sh o u ld s ta rt so m e v o c a tio n a l o r te ch n ica l c o u rs e s to tra in th e loca l w o rk fo rc e to m e e t th e re q u ire m e n ts o f s p e c ific in d u s trie s . T h is w o u ld in c re a s e e m p lo y m e n t o f loca l la b o u r and a lso red uce d e p e n d e n c e on m ig ra n t labou r.
• F o rm u la tio n o f a ra tio na l w a g e p o licy fo r fu tu re w a g e -d is p u te se ttle m e n ts , sh ou ld be fo u n d e d on th e s ta te ’s d e v e lo p m e n t n e e d s and p e r ca p ita in co m e .
• T h e s ta te g o v e rn m e n t sh ou ld e vo lve a c o m p re h e n s iv e so c ia l s e c u rity p ro g ra m m e fo r la b o u r in g e n e ra l and fo r th o se w o rk in g in th e u n o rg a n iz e d s e c to r in p a rticu la r, so th a t th e y can fee l se cu re d u rin g tim e s o f d ifficu lty .
• W h ile fo rm u la tin g s ta n d in g o rd e rs , o p in io n s o f w o rk e rs ’ u n io n s sh o u ld be ta ken in to a cco u n t. W o rk e rs and th e ir u n ion s sh o u ld be in vo lve d in all m a jo r p o licy d e c is io n s a ffe c tin g th e w o rke rs , in the in te re s ts o f b e tte r in d u s tria l re la tio n s . T he w o rk e rs sh o u ld fe e l p a rt o f th e e n te rp r is e s /e s ta b lis h m e n t, ra th e r th a n a m ere a fa c to r o f p ro d u c tio n .
• C o n s e n s u s sh o u ld be e n co u ra g e d and th e co n c ilia tio n o ffic e r sh ou ld be in s tru c te d to ta k e /g iv e o b je c tive d e c is io n s , w h ich a re a g re e a b le to both the p a rtie s -- m a n a g e m e n t and tra d e u n io n s /w o rk e rs . F o r th e e ffe c tiv e n e s s o f th is p ro ce ss , s u ita b le tra in in g sh ou ld be im p arte d to th e c o n c ilia tio n o ffic e r on a c o n tin u in g bas is .
• A re a s o n a b le tim e lim it sh ou ld be fixe d to s e ttle d is p u te s , th ro u g h c o n c ilia tio n o r c o lle c tiv e b a rg a in in g , to a vo id th e ir p ro lo n g a tio n .
• E n c o u ra g e m e n t and s u p p o rt to the p ro ce ss o f c o lle c tiv e b a rg a in in g in th e p riva te as w e ll as p u b lic s e c to r o rg a n iz a tio n s w ill d e fin ite ly h e lp in itia te h a rm o n io u s in d u s tria l re la tio n s .
• A s it is p e rce ive d , so m e o ffic e rs e m p lo y e d in th e L a b o u r D e p a rtm e n t, a fte r s u p e ra n n u a tio n , g e t lu c ra tive jo b s /e m p lo y m e n t in in d u s tria l e s ta b lis h m e n ts . T h is m u s t be b an ne d u n d e r law as it e n c o u ra g e s a n ti- la b o u r a ttitu d e s .
References
Section I
Central Statistical Organisation (2001), National Accounts Statistics 2000, M inistry of Statistics and Program me Implementation, Govt, o f India, New Delhi.
Chadha.G K and Sahu P P (2002), ‘Post-Reform Setbacks in Rural Em ploym ent : Issues That Need Further Scrutiny’, Economic and Political Weekly 37(21) 1998-2026, May 25-31.
(1992), ‘Urban Informal Sector in Punjab: Experience and Issues’, lASSI Quarterly, December.
- (1993), ‘Educated Unemploym ent in Punjab’, Man and Development 15(1) 82-132.

- (1996), ‘Em ploym ent and Unemploym ent in Punjab’, Man and Development, 18(3), September.
- (1997), Urban Informal Manufacturing Sector: A Study o f the Border Districts o f Punjab, Jammu & Kashmir and Rajasthan, CRRID, Chandigarh.
- (1999), Impact Assessment Study on Rural Development Programmes in Jalandhar District (Punjab), Project sponsored by the Ministry of Rural Development, G overnm ent of India, CRRID, Chandigarh.
- (2002), ‘Growth and Determ inants o f Rural Non-farm Em ploym ent in Punjab’, Man and Development, 24(2), June.
Departm ent o f Planning, Ninth Five-Year Plan (1997-02) and Annual Plan 1997-98, Governm ent of Punjab, Chandigarh.
Departm ent of Planning, Annual Plan 2001-2002, Government, o f Punjab, Chandigarh.
Departm ent of Planning, Tenth Five-Year Plan (2002-03) and Annual Plan 2002-03, Governm ent of Punjab, Chandigarh.
Director of Census Operations Punjab, Census o f India 1991, General Population Tables and Primary Census Abstract, Punjab, Part IIA & I IB, Chandigarh.
D irector o f Census Operations Punjab (2002), Census o f India 2001, Provisional Population Totals, Distribution o f Workers and Non-Workers, Paper 3 o f 2001, Chandigarh.
Economic Adviser, Statistical Abstracts of Punjab 2000 and other issues. Government, o f Punjab, Chandigarh.
Economic Adviser (2000), Report on Unemployed Persons (Age Group 18-35 years) Desirous o f Self-employment in Punjab State Economic and Statistics Organization, Governm ent o f Punjab, Chandigarh.
Economic Adviser (2001), Economic Survey o f Punjab 2000-2001, Governm ent, o f Punjab, Chandigarh.
Gill, S S (2001) ‘Agriculture, Crop Technology and Em ployment Generation in Punjab’, paper presented at Seminar-cum-Workshop on Future Problems and Prospects o f Punjab Agriculture, held at CRRID on Jan. 4,5 2001.
Institute of Applied M anpower Research (lAMR), (2001), Manpower Profile, New Delhi.
ILO (2000), World Labour Report, 2000, Income Security and Social Protection in a Changing World. International Labour Office, Geneva.
Ministry of Finance (2001), Economic Survey 2000-2001, G overnm ent o f India, New Delhi.
M inistry of Labour (2002) The Report o f the Second National Com m ission on Labour, G overnm ent o f India, New Delhi.
NSSO (1987), Report on Third Quinquennial Survey on Employment and Unemployment. Survey Results NSS 38 Round 1983, G overnm ent o f India, New Delhi.
NSSO (1990), ‘Results o f the Fourth Quinquennial Survey on Em ploym ent and U nem ploym ent’, NSS 43" Round (July 1987-June 1988), Sarvekshana, Special Number, Governm ent of India, New Delhi.

NSSO (1997), ‘Em ployment and Unemploym ent in India, 1993-94’, Fifth Quinquennial Survey, NSS 50th Round (July 1993-June 1994), Report No.409, Departm ent o f Statistics, G overnm ent of India, New Delhi.
NSSO (2001), ‘Em ployment and Unemploym ent Situation in India 1999-2000 (Part I)’, Sixth Quinquennial Survey, NSS 55 Round (July 1999-June 2000), G overnm ent of India, New Delhi.
Planning Com m ission (1999), Ninth Five-Year Plan 1997-2002, Development Goals, Strategy and Policies, Vol. I, G overnm ent of India, New Delhi.
Planning Com m ission (2001a), Draft Approach Paper to the Tenth Five-Year Plan (2002-07), G overnm ent of India, New Delhi
Planning Com m ission (2001b), Report o f Task Force on Employment Opportunities, Governm ent o f India New Delhi.
Planning Com m ission (2001c), Report o f the Steering Committee on Labour and Employment for the Tenth Five-Year Plan 2002-07, Governm ent of India New Delhi.
Planning Com m ission (2002), Report o f the Special Group on Targeting Ten Million Employment Opportunities per Year over the Tenth Plan Period, Governm ent of India New Delhi.
Unger Brooke (2001), ‘A Survey of Indian Econom y’, The Economist, June 2.
Section II
Avasthi, S.C., Status Paper on Migrant Labour in Punjab, paper presented during the workshop on ‘ Inter-State M igrant ILbour Problems and Issues’ organized by the Departm ent o f Sociology, Punjab University, Chandigarh, 26 to 28 Septem ber 1997.
Chand, Krishan, Migrant Labour and Trade Union Movement in Punjab: A Case o f Sugar Industry, Ph.D thesis. Departm ent of Business Management, Punjab University, Patiala (Pb.)1999.
Channy, S.S. (nd), State Development Report (Labour), Labour Department, G overnm ent of Punjab, Chandigarh.
Departm ent of Finance, White Paper on the State Finances, March 2002; G overnm ent o f Punjab, Chandigarh.
Departm ent of Labour, Various Annual Administrative Reports, G overnm ent of Punjab, Chandigarh.
Departm ent of Labour, Child Labour in Punjab: A Survey Report 1997, G overnm ent o f Punjab, Chandigarh.
D irector Census Operations (Punjab), Reports o f Census o f Punjab (1981,1991, 2001), G overnm ent o f India, Chandigarh.
Econom ic and Statistical Organization, various Issues o f Statistical Abstract of Punjab, G overnm ent o f Punjab, Chandigarh.
Gani, A., ‘Industrial Relations in Jammu & Kashm ir’, Indian Journal o f Industrial Relations, Vol.26, No. 1, July 1990.

International Labour Office, World Labour Repon, Geneva, 1992.
Mathur, A.S., and Mathur, J.S., Trade Union Movement in India, Chaitanya Publishing House, Allahabad, 1957.
Ministry of Labour, Indian Labour Year Book-1999, Labour Bureau, G overnm ent of India, Shimla- Chandigarh, 2001.
Ministry of Labour, Annual Report: 1999-2000, Governm ent of India, New Delhi.
Planning Com m ission of India; Report o f the Working Group on Social Security (For the Tenth Five Year Plan, 2002-2007), Governm ent of India, October, 2001.
Punjab State Planning Board, Draft Hunnan Development Report Punjab-2001, G overnm ent of Punjab, Chandigarh.
Rajan, W. R., Whither Social Security, CITU Publication, Delhi, 2000.
Ramaswamy, E.A., Workers Consciousness and Trade Union Response, Oxford University Press, New Delhi, 1998.
Ratnam, C.S. Venkata (ed.), Industrial Relations in Indian States, Global Business Press in Collaboration with Indian Journal o f Industrial Association and Friedrich Elbert Stiftung, 1996.
Sharma, B.K., Socio-Econom ic Profile of Child Labour in a Developing Economy, Himalaya Publishing House, Delhi, 2001.

INFORMATION TECHNOLOGY: GROWTH AND DEVELOPMENT STRATEGY
IT SOFTWARE AND SERVICE INDUSTRY'In fo rm a tio n T e c h n o lo g y (IT ), a kn o w le d g e -b a s e d in d u s try , h as th e tre m e n d o u s p o te n tia l o f b e c o m in g an e n g in e o f a c c e le ra te d e c o n o m ic g ro w th , p ro d u c tiv ity im p ro v e m e n t fo r all s e c to rs o f th e e c o n o m y and m e a n s o f e ffic ie n t g o v e rn a n c e . It e n h a n c e s a c c e s s to in fo rm a tio n , p ro te c ts c o n s u m e rs , p ro v id e s a c c e s s to g o v e rn m e n t s e rv ic e s , m a ke s skill fo rm a tio n a nd tra in in g m ore e ffe c tive , im p ro v e s d e liv e ry h ea lth s e rv ic e s , and p ro m o te s tra n s p a re n c y . It p ro v id e s tre m e n d o u s e m p lo y m e n t p o te n tia l and lin k a g e s b e tw e en g o v e rn m e n t and th e p eo p le bo th a t the ru ra l a nd u rb a n leve l. In v e s tm e n t in k n o w le d g e - b a se d in d u s trie s w ill d e te rm in e th e leve l o f th e c o u n try ’s d o m in a n t p o s itio n in th e w orld e c o n o m y in th e n e x t tw o d e ca d e s .
Status of IT Software and Service Industry in IndiaT h e In d ia n IT s o ftw a re and se rv ice in d u s try h as e m e rg e d as o n e o f th e fa s te s t g ro w in g s e c to rs in th e Ind ian e co n o m y, w ith a g ro w th ra te e x c e e d in g 50 p e r c e n t in e x p o rts and 40 p e r c e n t in th e to ta l IT in d u s try o v e r th e la s t fiv e ye a rs . T a b le 1 s h o w s th e tu rn o v e r o f th is in d u s try in c lu d in g d o m e s tic and e xp o rts .
Table 1
Year Domestic Exports Total Percentage Growth Rate
(Export)
Percentage Growth Rate
(Dom estic and Export)
1994-95 0.35 0.485 0.835
1995-96 0.49 0.734 1.224 51.34 46.60
1996-97 0.67 1.085 1.755 47.82 43.40
1997-98 0.95 1.750 2.700 61.29 53.80
1998-99 1.25 2.650 3.900 51.43 44.40
1999-2000 1.70 4.000 5.700 50.94 46.10
2000-01 1.96 6.300 8.260 57.50 44.90
Source; Based on Hanna (1994), Heels (1995) and Masco (2001)
E x p o rts d e c lin e d d u rin g 2 0 0 1 -0 2 , p rim a rily d ue to th e s lo w -d o w n in th e U S e c o n o m y a fte r th e 11 S e p te m b e r 2001 te rro ris t a tta ck . H o w e ve r, th e N A S S C O M -M c K in s e y R ep ort 2 0 0 2 h as p ro je c te d th a t the Ind ian IT s o ftw a re a nd s e rv ic e in d u s try w ill s till a ch ie ve a tu rn o v e r o f U S $ SObillion (a p p ro x im a te ly 7 .0 p e r c e n t o f G D P ) by 2 00 8 , b e c a u s e o f the
e x p e c te d in c re a s e in th e IT E n ab led S e rv ic e s (IT E S ) se c to r.
T h e IT s o ftw a re a nd s e rv ic e in d u s try has b een c a te g o riz e d in to th re e b ro ad se c to rs :
• S o ftw a re P ro d u c t and T e c h n o lo g y S e rv ice s ,
The electronics hardware, including com puters and peripherals, have been dealt with separately in Chapter 6, entitled 'Industrial D evelopm ent’.

• IT Services, and• IT Enabled Services.
The projected turnover of industry in India by 2007 and 2008 is given in Table 2Table 2
Category By 2007* (US$ b)
By 2008 {US$ b)
A. ExportsSoftware Product and Technology 8 11Services 22 30IT Services 18 24IT Enabled Services
Total 48 65
B. Domestic 12 15
(A+B) 60 80
Status of IT Software and Service Industry in PunjabDuring the eighth plan period, i.e., 1992-1997, there was hardly any activity in the IT software and service industry in Punjab. It made a beginning only when the Software Technology Park (STPI) of the Government of India came into operation at Mohali in 1998-99. Since the announcement of the policy of tax holiday for STPIs by the Government of India for a period of 10 years, 145 software units have registered with STPI Mohali till 2001-02. However, the number of units in operation is only 65. Table 3 shows the state-wise software exports of India through STPI during 2000-01.
Table 3State-wise Software Exports through STPI* of Ind a during 2000-01
State Exports (in crore) PercentageKarnataka 7475 37.27
Tamil Nadu 2956 14.74
M aharashtra 2570 12.82
Andhra Pradesh 2017 10.06
Uttar Pradesh 1660 8.23
Haryana 1450 7.23
Delhi 1100 5.49
W est Bengal 250 1.25
Orissa 200 1.00
Kerala 141 0.70
Guiarat 102 0.51
Punjab (STPI, Mohali) 52 0.26Madhya Pradesh 50 0.25
Rajasthan 30 0.15
Total 20054 100.00
Source: Software Technology Parks o f India, New Del hiNote: Software Technology Parks o f India
Table 4 shows IT software and service exports through STPI, Mohali (Punjab) from 1998-99 to 2001-02. In 2001-2002, the exports were Rs. 70 crore.

1998-99 1999-00 2000-01 2001-02
IT Enabled Services 4.70 7.01 17.3S 30.00
Software Developm ent 3.07 7.79 34.64 40.00
Total 7.77 14.80 52.00 70.00
S o u rce : Software Technology Parks o f India, Mo hall
During the last two years, the private sector has been In the process of setting up )T infrastructure in Punjab: iVlahindra & Mahindra software technology park In Mohali; Reliance, HFCL and VSNL are setting up telecom infrastructure in Punjab. The progress is rather very slow. The share of Punjab in the Indian IT software and service industry is very meagre, i.e., 0.26 per cent in 200V2002, (See Table 3)
During the Ninth Plan, there has not been any significant progress in the IT industry, in spite of the fact that the policies of the Punjab Government are as attractive as of such other states as Karnataka. Some of the specific constraints for the insignificant grovklh of IT Industry are as follows:
• Quality o f infrastructure required for IT industry was not available.• Quality of human resource was not matching with IT Industry’s requirements.• insufficient funds for IT industry.• Lack of direction and vision.• Non-conducive environment.
The IT industry in other states of India, where high quality infrastructure and trained manpower are available, has achieved accelerated growth and Increased its share from 0.6 per cent to six per cent of the total turnover o f the IT industry in India during the last five years, mainly due to robust growth in the ITES segment. The IT Industry in Haryana has grown from a turnover of Rs. 400 crore in 1999-2000 to Rs. 2,054 crore in 2000-01, an almost five fold increase. Punjab, therefore, can also aim at and achieve five per cent share of the total IT industry in India by the year 2007, with emphasis on ITES. in view of the present status o f the software industry in Punjab, i.e., 0.26 per cent share, the projection of five per cent share by 2007 is very optimistic. To achieve this, a fast track approach will have to be adopted. The suggestions and recommendations made In this report have to be implemented to ensure such rapid growth. A conducive environment must be created to ensure that both national and international MNCs set up IT Industries in Punjab.
For achieving a five per cent share. It Is recommended that targets be fixed for a four per cent share of the national turnover (according to the NASSCOM-McKinney, Report 2002) for software products and technology services and the same for IT services, because each of these involves high technology and longer gestation period, and a seven per cent share for IT Enabled Services, as it has a shorter gestation period and a huge employment potential. Projected category-wise turnover o f IT software and service industry In Punjab by 2007 is shown in Table 5.

*Projected Category-wise Turnover of IT Software and Service Industry in Punjab by 2007
Targeted percentage share for Punjab in term s of projected national turnover
Turnover in 2006- 07 Rs. in Crore (In US$ b)
A. Exports “Category A”Software Product and Technology Services “Category B”IT Services “Category C”IT Enabled Services Total
1600 (0.32)
4400 (0.88)
6300(1 .26) 12300 (2.46)
B. Domestic 3000 (0.60)
15300 (3.06)
Source; P ro je c tio n s b a se d on N a s s c o m -M c d n se y R eport, 2 00 2
Software Product and Technology Services p ro v id e a h igh g ro w th o p p o rtu n ity fo r th e Ind ian s o ftw a re in d u s try . Ind ian co m p a n ie s h ave a m a rk e t p o te n tia l o f s o ftw a re p ro d u c t d e v e lo p m e n t, su ch as e n te rp r is e s o ftw a re (e -b u s in e s s so lu tio n , E R P , e -c o rp o ra te g o v e rn a n c e ), c o n s u m e r s o ftw a re (p e rso n a l p ro d u c tiv ity to o ls ) a nd e m b e d d e d s o ftw a re . Ind ian c o m p a n ie s h ave d e v e lo p e d a n u m b e r o f h ig h ly a cc la im e d a nd p o p u la r p a cka g e s , such as H R m a n a g e m e n t and b u s in e ss a cc o u n tin g b y T C S , b a n k in g a u to m a tio n p a c k a g e s by In fo sys , E R P to o ls b y R A N C O , e tc.
T h is s e g m e n t is h ig h -te c h n o lo g y o rie n te d and re q u ire s h ig h ly sk ille d p ro fe s s io n a ls . In th e s h o rte r te rm , th e re w ill be lim ite d d e v e lo p m e n t in th e a re a , a s R & D b u d g e ts o f th e co m p a n ie s a re lim ite d . T a k in g th e s e fa c to rs in to a cco u n t, P u n ja b h as to a im to a c h ie v e a t le a s t fo u r p e r c e n t o f U S $ Sb illion, i.e ., U S $ 0 .3 2 b illio n (R s. 1 ,600 c ro re ) by 2 0 0 7 (T a b le 5).
IT Services a re u n d e rg o in g a s tru c tu ra l ch a n g e from c lie n t/s e rv e r to w e b /p a c k a g e - base d se rv ice s . T h is w ill fo rm th e m a jo r c h u n k o f IT se rv ice s . G ro w th in IT s e rv ic e s w ill co n tin u e to p ro v id e th e b ig g e s t o p p o rtu n ity , w h ile o th e r s e c to rs o f IT s o ftw a re in d u s try w ill a ls o m a ke a s ig n ific a n t c o n tr ib u tio n . IT se rv ic e s , both e x p o rt a nd d o m e s tic , w ill g ro w ra p id ly a s n e w o p p o rtu n itie s a re e m e rg in g in m a n a g e m e n t/c o n s u ltin g se rv ic e s , a p p lic a tio n m a in te n a n c e and In te rn e t se rv ic e s . T h e m a jo r u se rs o f IT s e rv ic e s a re th e g o v e rn m e n t, f in a n c ia l s e rv ic e s a nd b a n k in g , m a n u fa c tu rin g and re ta il and d is trib u tio n . N ew a re a s like ly to e m e rg e a re c o m m u n ic a tio n , h e a lth c a re a nd u tilitie s , as th e s e w ill in c re a s in g ly be d e re g u la te d . H ow e ver, IT s e rv ic e s e s s e n tia lly re q u ire h ig h -q u a lity m a n p o w e r, s ta te o f th e a rt sk ills , w o rld -c la s s te le c o m a nd IT -k n o w le d g e b ase d e n v iro n m e n t.
A detailed report has to be prepared for all major activities/segm ents on the pattern o f Andhra Pradesh. To project year-w ise targets and for their monitoring, a detailed survey has to be carried out to prepare the report.
T h e im p o rta n c e o f IT s e rv ic e s can be ju d g e d fro m th e fa c t th a t th e y w ill a c c o u n t fo r 4 5 .8 p e r c e n t o f th e to ta l tu rn o v e r o f the s o ftw a re ind us try , i.e ., U S $ 2 2 b illio n o u t o f U S $ 4 8 b illio n p ro je c te d e x p o rt by 2 00 7 . P u n ja b sh o u ld a im a t a c h ie v in g a t le a s t fo u r p e r c e n t o f U S $ 2 2 b illio n , i.e., U S $ 0 .8 8 b illion (R s. 4 ,4 0 0 c ro re ) by 2 0 0 7 (T a b le 5)
The ITES s e c to r in Ind ia has e m e rg e d as a key e n g in e o f g ro w th fo r th e Ind ian IT in d u s try and th e te c h n o lo g y -le d s e rv ic e s ind us try . T h is s e c to r has g ro w n fro m Rs. 2 ,40 0 c ro re in 1 9 9 9 -2 0 0 0 to Rs. 4 ,1 0 0 c ro re in 2 0 0 0 -2 0 0 1 , p ro v id in g e m p lo y m e n t to 7 0 ,0 00 peo p le .
It c o v e rs a w id e ra n g e o f se rv ice s , so m e o f w h ich a re :
• C u s to m e r-in te ra c tio n s e rv ic e s in c lu d in g ca ll ce n tres .
• B a ck o ffice s , re v e n u e a c c o u n tin g , da ta e n try , da ta c o n v e rs io n a nd H R se rv ice s .
• T ra n s c rip tio n and tra n s la tio n se rv ice s .
• C o n te n t d e v e lo p m e n t and a n im a tio n .
• O th e r s e rv ic e s , in c lu d in g re m o te e d u c a tio n , d a ta s e a rc h , G IS , m a rk e t re se a rch and n e tw o rk co n s u lta n c y .
T h e e m p lo y m e n t p o te n tia l in IT E S is s u b s ta n tia l and the g e s ta tio n p e rio d is le s s e r than in o th e r s e c to rs o f th e IT ind us try . It is h ig h ly q u a lity -o rie n te d , h u m a n - re s o u rc e in te n s ive a nd re q u ire s c o n s is te n t p e rfo rm a n c e w ith h igh s ta n d a rd s . T h e re fo re , th e su c c e s s o f IT E S w ill m a in ly d e p e n d on th e q u a lity o f m a n p o w e r and in fra s tru c tu re . K n o w le d g e - b a se d s k ill-o r ie n te d tra in in g is th e ke y to q u a lity o f m a n p o w e r. IT E S to s u c c e e d re q u ire s to p -c la s s in fra s tru c tu re w ith a d e q u a te b a n d w id th , fa u lt- fre e and c o n tin u o u s p o w e r w ith tw o la ye rs o f re d u n d a n c y to a vo id a ny b re a kd o w n .
U S te c h n o lo g y firm s a re ra p id ly s h iftin g b a ck -o ffice fu n c tio n s to Ind ia . F o re ig n firm s a re e a g e rly w a itin g to se t up c e n tre s to p ro ce ss fin a n c ia l c la im s , p a y ro ll-d a ta , b u ild ing c u s to m e r-s u p p o rt d e sk , e tc. A c c o rd in g to a N A S S C O M s tu d y , G E C a p ita l has saved U S $ 2 7 0 m illio n , C IT I B a n k U S $ 7 0 m illio n and B ritish A irw a y s (B A ) U S $ 4 2 m illio n , a to ta l o f U S $ 3 8 5 m illio n sa ve d p e r ye ar, as a re su lt o f th e ir sh iftin g b a c k -o ff ic e o p e ra tio n s from U S to Ind ia . M o s t o f th e firm s a lre a d y in Ind ia a re in the p ro c e s s o f e x p a n d in g and e a g e r to se t up o p e ra tio n s in o th e r a re a s o f th e co u n try .
IT E S , o r re m o te p ro c e s s in g , p re se n ts a g o ld e n o p p o rtu n ity fo r P u n ja b . F o r th is , th e s ta te h as to e m p h a s iz e on sk ill- fo rm a tio n th ro u g h w o rld -c la s s tra in in g and in fra s tru c tu re b u ild in g . P u n ja b n e e d s to g a rn e r a t le a s t se ve n p e r c e n t s h a re o f th e to ta l re ve n u e o f Ind ia in IT E S . T h is can p ro v id e e m p lo y m e n t to 7 7 ,0 00 e d u c a te d yo u th and g e n e ra te a tu rn o v e r o f U S $ 1 .2 6b illion (R s. 6 ,30 0 c ro re ) b y 2 007 (T a b le 5).
A h ig h -le v e l c o m m itte e o f e x p e rts sh o u ld be c o n s titu te d fo r th e p ro m o tio n o f the IT in d u s try in th e s ta te to fo rm u la te a p o licy fo r e n su rin g a h a s s le -fre e and c o n d u c iv e e n v iro n m e n t to a ttra c t M N C s and N R Is to se t up IT in d u s tr ie s in P u n ja b . S p ec ia l e m p h a s is h as to be p la ce d on N R Is, ke e p in g in v ie w th a t a la rg e n u m b e r o f th e m from P u n ja b a re a c tiv e ly in vo lve d in th e IT in d u s try in U S A and o th e r d e v e lo p e d co u n trie s . T h e p ro p o se d c o m m itte e o f e x p e rts sh o u ld a lso m o n ito r th e g ro w th o f th e IT in d u s try in th e sta te .

In d ia ’s m a in c o m p e titiv e a d v a n ta g e in th e s o ftw a re a nd s e rv ic e s in d u s try is its a b u n d a n t E n g lis h -s p e a k in g and c o s t-e ffe c tiv e h um an re so u rce . A s on 31 M arch 2 0 0 1 , it has3 .4 0 .0 0 0 p e o p le w o rk in g in the s o ftw a re and s e rv ic e s e c to r in Ind ia , th e se c o n d la rg e s t IT w o rk fo rc e a fte r th e US. A c c o rd in g to th e p ro je c tio n s o f th e M in is try o f In form ation Technology (M IT) Report, Ind ia n e e d s to d e v e lo p m ore th a n 22 lakh h igh q u a lity k n o w le d g e w o rk e rs in s o ftw a re and re la ted a re a s by 2 008 .
T o a c h ie v e an o ve ra ll ta rg e t o f fiv e p e r c e n t o f th e n a tio n a l tu rn o v e r, i.e ., U S $ 3 .0 6 b illio n by 2 0 0 7 (T a b le 5 ), P u n ja b w o u ld need 9 9 ,0 0 0 IT -tra in e d m a n p o w e r w h ic h has to be h igh q u a lity and o f th e r ig h t m ix o f te c h n ic a l, b u s in e s s and fu n c tio n a l s k ills to m e e t th e n e e d s o f all b u s in e s s s e g m e n ts .
A c c o rd in g to th e M IT Report, h u m a n re s o u rc e in IT h as b een c a te g o riz e d in to th re e c a te g o rie s : C a te g o ry ‘A in c lu d e s h ig h e r-e n d p ro fe s s io n a ls , c a te g o ry 'B ’ c o m p ris e s p ro fe s s io n a ls m a in ly fo r IT se rv ic e s and c a te g o ry ‘C ’ fo r IT E S . T o a c h ie v e th e p ro je c te d tu rn o v e r, P u n ja b n e e d s 6 ,0 0 0 p ro fe s s io n a ls fo r c a te g o ry ‘A ’ . 1 6 ,0 00 fo r c a te g o ry ‘B ’ and7 7 .0 0 0 fo r c a te g o ry ‘C ’. T a b le 6 s h o w s th e p ro je c te d c a te g o ry -w is e IT m a n p o w e r re q u ire m e n ts by 2 0 0 7 in P u n ja b (T a b le 6).
It is n e c e s s a ry to fo rm u la te a p p ro p ria te s tra te g y a nd m e a s u re s in re s p e c t o f re q u is ite in fra s tru c tu re w ith sp e c ia l fo c u s on h u m a n re so u rce , ta k in g in to a c c o u n t e m e rg in g e d u c a tio n a l te c h n o lo g ie s , to a c h ie v e th e p ro je c te d tu rn o v e r o f th e P u n ja b IT ind us try . T he to ta l e s tim a te d c o s t o f m a n p o w e r-q u a lity im p ro v e m e n t is R s. 60 c ro re d u rin g 2 0 0 2 - 07. (R s. 30 c ro re fo r C a te g o ry ‘C ’ a nd Rs. 15 c ro re e ach fo r C a te g o ry ‘A ’ a nd C a te g o ry ‘B ’)
Table 6Projected IT Manpower Requirements during and by 2007 in Punjab
Qualification Estimated IT M anpower
Requirem ents (India)
Projected IT M anpower
R equirem ents as percentage o f the
National Requirem ent
Category ‘A’Software Product and Technology Services
M S/M .Tech/B.Tech in Com puter Science
1,50,000 6,000 (4%)
Category ‘B’
IT Services
B.Tech in Non-Computer Science, MCA
4,00,000 16000 (4%)
Category ‘C’
IT Enabled Services
BA/B.Sc/B.Com & Diploma and it is
11,00,000 77,000 (7%)
All 16,50,000 99,000 (6%)Source: Projections based on M inistry of Information Technology, Report for Tenth Plan
(2002-2007), G overnm ent o f India. Figures have been proportionately adjusted as per the revised projections by NASSCOM -M ckinsey Report, 2002, from the earlier NASSCO M -M ckinsey Report, 1999.

• F o r q u a lity im p ro v e m e n t, P u n ja b h as to tra in 9 9 ,0 0 0 h ig h -q u a lity m a n p o w e r d u rin g 2 0 0 2 -2 0 0 7 . IT se rv ic e s (1 6 ,0 0 0 ), IT s o ftw a re p ro d u c t and te c h n o lo g y se rv ic e s (6 ,0 0 0 ) and IT E S (77 ,00 0 ).
• U p g ra d a tio n , in c lu d in g n e tw o rk in g , o f in fra s tru c tu re o f th e e n g in e e rin g co lle g e s .
• T ra in in g o f fa c u lty to m e e t th e req u ired s ta n d a rd s . In te ra c tio n and e x c h a n g e o f fa c u lty m e m b e rs w ith in s titu te s o f h ig h e r le a rn in g in In d ia a n d a b ro a d .
• A n I IT o f an in te rn a tio n a l s ta n d a rd sh o u ld be s e t up to m o ve up th e v a lu e ch a ifi in IT in d u s try . It w ill h e lp th e s ta te ca tch up w ith o th e r IT -d e v e lo p e d s ta te s in India . It w ill a lso h e lp to fill th e m u c h -n e e d e d g a p in th e a v a ila b ility o f q u a lity h um an re so u rce .
• T o e n s u re th a t h ig h -q u a lity IT m a n p o w e r is b e ing p ro d u c e d b y bo th g o v e rn m e n t and p riva te in s titu tio n s , it is re c o m m e n d e d th a t P u n ja b G o v e rn m e n t sh o u ld se t up a S ta te C o u n c il fo r C o m p u te r and IT E d u ca tio n (S C C E ), a b o d y o f e xp e rts re s p o n s ib le fo r m o n ito rin g and fix in g m in im u m s ta n d a rd s fo r th e q u a lity o f IT e d u c a tio n in th e s ta te .
IT INFRASTRUCTURE
In to d a y ’s IT -s a v v y w o rld , th e g ro w th o f e v e ry e c o n o m y is linke d w ith th e g ro w th o f In fo rm a tio n T e c h n o lo g y and , in tu rn , s o u n d a nd q u a lity in fra s tru c tu re is a b s o lu te ly e s s e n tia l fo r th is .
D u ring la s t d e c a d e , th e m ain c o n tr ib u tio n to w a rd s b u ild in g IT in fra s tru c tu re h a s been the S o ftw a re T e c h n o lo g y P a rk a t M oha li, w h e re p riv a te s e c to r c o m p a n ie s a re in th e p ro ce ss o f se ttin g up te le c o m m u n ic a tio n in fra s tru c tu re . S o fa r th e p e rfo rm a n c e o f P u n ja b has b een d ism a l a s c o m p a re d to o th e r IT -d e ve lo p e d re g io n s in Ind ia . D u rin g 2 0 0 0 -2 0 0 1 , o u t o f th e to ta l e x p o rt o f Rs. 2 0 ,0 5 2 c ro re fro m S T P Is a c ro s s th e c o u n try , P u n ja b had a to ta l e x p o rt o f R s. 52 c ro re , w h ile B a n g a lo re S o ftw a re T e c h n o lo g y P a rk had an e x p o rt o f Rs. 7 ,4 7 5 c ro re , N o id a Rs. 4 ,3 5 0 c ro re , C h e n n a i Rs. 2 ,9 5 6 c ro re , M u m b a i Rs. 1 ,610 c ro re and P u n e Rs. 9 60 c ro re .
It is v ita l to d e v e lo p th e q u a lity IT in fra s tru c tu re re q u ire d to a c h ie v e th e p ro je c te d tu rn o v e r o f U S $ 3 .0 6 b illio n by 2 00 7 (T a b le 4 ) and to m e e t th e o th e r in fra s tru c tu re re q u ire m e n ts fo r IT -u s a g e in v a rio u s a p p lic a tio n s , in c lu d in g e -g o v e rn a n c e .
T h e m a in c o n s titu e n ts o f IT in fra s tru c tu re a re te le c o m m u n ic a tio n -b a c k b o n e b o th n a tio na l and in te rn a tio n a l, V -S A T in fra s tru c tu re and In te rn e t S e rv ic e P ro v id e rs (IS P s). IT s o ftw a re and s e rv ic e s in c lu d in g IT E S and In te rn e t a re a m o n g th e m a jo r u s e rs o f th e IT in fra s tru c tu re w ith a d e q u a te co m m u n ic a tio n b a n d w id th . T h is s e c to r is v e ry se n s itiv e to th e q u a lity as w e ll a s th e s ize o f th e in fra s tru c tu re . P re s e n tly , th e in fra s tru c tu re th a t e x is ts in* th e te le c o m m u n ic a tio n s e c to r in P u n ja b a lo n g w ith th e im p le m e n ta tio n s o f th e fu tu re p la n s o f th e V S N L and o th e r p riva te o p e ra to rs su ch a s H F C L and R e lia n ce , is lik e ly to m e e t th e b a s ic re q u ire m e n t o f IT in fra s tru c tu re in te rm s o f g o o d -q u a lity c o n n e c tiv ity by 2 0 0 7 . IT in fra s tru c tu re b e ing v ita l fo r th e d e v e lo p m e n t o f th e IT Industry , th e M in is try o f In fo rm a tio n T e c h n o lo g y (M IT ), G o v e rn m e n t o f Ind ia in th e ir T e n th P lan has re c o m m e n d e d s p e c ia l n o rm s fo r b a n d w id th . T h e P u n ja b G o v e rn m e n t h a s to e n su re its t im e ly and s p e e d y im p le m e n ta tio n .

A c c o rd in g to th e s tu d y by N A S S C O M , by 2 00 2 , th e re q u ire m e n t o f in te rn a tio n a l b a n d w id th fo r c o n n e c tiv ity to In te rn e t w a s p ro je c te d to be 100 G b P s. H ow e ver, th e se p ro je c tio n s co u ld n o t be a ch ie ve d as th e e x p e c te d g ro w th o f In te rn e t cou ld no t ta ke p la ce , due to v e ry h igh te le p h o n e ta riff a lo ng w ith e q u a lly h igh c o s t o f In te rn e t b ackb on e . T h is has re su lte d in in a d e q u a te d e m a n d . T h e n u m b e r o f In te rn e t u sers and the a v a ila b ility o f b a n d w id th a re linke d w ith e ach o the r; as su ch th e b a n d w id th re q u ire m e n t is m a rk e t d e p e n d e n t.
H o w e ve r, re c e n tly th e b a s ic se rv ice p ro v id e rs h ave re d u ce d te le p h o n e c h a rg e s , b u t the n u m b e rs o f in te rn e t u s e rs /In te rn e t s u b s c rib e rs a re no t in c re a s in g a t th e e x p e c te d rate . T h e P u n ja b G o v e rn m e n t has to fo rm u la te a p o licy to e n s u re u s a g e o f In te rn e t in all its d e p a rtm e n ts , p u b lic p la ces , d ow n to b lo ck and v illa g e leve l. It h as to e n s u re a d e q u a te d e m a n d by w a y o f c re a tin g a su ita b le IT c u ltu re and su ita b le in fra s tru c tu re , so as to im p ro ve th e v ia b ility o f th e IS Ps.
It is p ro p o se d to d e v e lo p th re e new IT c itie s and u p g ra d e th e e x is tin g in fra s tru c tu re at M oh a li, to a c h ie v e th e p ro je c te d tu rn o v e r o f th e IT so ftw a re in d u s try . T h e in fra s tru c tu re and q u a lity sh o u ld be su ch th a t each IT c ity sh o u ld be a b le to g e n e ra te , on an a ve rag e , a tu rn o v e r o f b e tw e e n R s. 3 ,0 0 0 -5 ,0 0 0 c ro re y e a rly by 2 0 0 7 . T h e p ro p o se d IT c ities sh o u ld have , b e s id e s g o o d q u a lity te le c o m in fra s tru c tu re , a d e q u a te b a s ic in fra s tru c tu re in te rm s o f c o n tin u o u s u n in te rru p te d p o w e r su p p ly , g o o d q u a lity roa ds , e ffic ie n t tra n s p o rt, p ro x im ity to a irp o rt, a good e d u ca tio n and an R & D ce n tre . T h e s e le c tio n o f th e s e IT c itie s h as to be base d on th e a c a d e m ic e n v iro n m e n t. K e e p in g th is in v iew , the p ro p o s e d n ew c itie s a re P a tia la , J a la n d h a r and L u d h ia n a . T h e y h ave th e a c a d e m ic e n v iro n m e n t s u ita b le fo r th e g ro w th o f th e IT in d u s try as a lre a d y in p lace . H ow ever, th e s e can be e a s ily u p g ra d e d fu rth e r so as to b e co m e 'C e n tre s o f A ttra c tio n ’ fo r in v e s to rs to se t up th e ir p ro d u c tio n /re s e a rc h and d e v e lo p m e n t fa c ilit ie s in th e fie ld o f in fo rm a tio n te c h n o lo g y . T h e e s tim a te d co s t o f e ach IT c ity m a y be o f th e o rd e r o f Rs. 15 0 -2 0 0 c ro re and th e c o s t o f u p g ra d a tio n o f th e in fra s tru c tu re a t M oh a li w ill be a n o th e r Rs. 50 c ro re . D e ta ile d p ro p o s a ls fo r e ach IT c ity h ave to be d ra w n up s e p a ra te ly . E ach c ity w ill h ave an S T P as a p rim e m over. It is p ro p o se d th a t e ach IT c ity sh ou ld have a s e p a ra te d e v e lo p m e n t a u th o rity on th e p a tte rn o f th e N o ida D e v e lo p m e n t A u th o rity , and fu n c tio n in d e p e n d e n tly , to e n su re its p ro p e r g ro w th and d e v e lo p m e n t.
Venture Capital (VC) has p layed a v ita l ro le in th e m a te ria liz a tio n and c o m m e rc ia liz a tio n o f in n o v a tiv e and c re a tiv e ideas. T h e In d ia n s o ftw a re and se rv ice in d u s try has e m e rg e d as o n e o f th e fa s te s t g ro w in g se c to rs in th e co u n try . A la rge n u m b e r o f s o ftw a re c o m p a n ie s , s ta rte d by re s e a rc h -m in d e d p ro fe s s io n a ls w ith in n o v a tiv e ide as , h a ve b e n e fite d and h ave su c c e e d e d in th e ir v e n tu re s , w ith th e h e lp o f th e in itia l fu n d in g th ro u g h se ed m o n e y a nd v e n tu re ca p ita l. U S A is a p rim e so u rce o f v e n tu re ca p ita l. A c c o rd in g to th e Ind ian V e n tu re C ap ita l A s s o c ia tio n (IV C A ), ve n tu re ca p ita l fu n d in g in Ind ia w a s U S $ o ne b illion in th e y e a r e n d in g M arch 2 00 2 and is like ly to go up by 50 p e r c e n t to U S $ 1 .5b illion in th e c u rre n t f in a n c ia l ye a r.
T h e s ta te g o v e rn m e n t has a lre a d y ta ke n th e in itia tive in th is re g a rd by se ttin g up a Rs. 20 c ro re v e n tu re fu n d fo r th e g ro w th o f th e s o ftw a re in d u s try in th e s ta te . It is su g g e s te d th a t fu n d be in c re a se d to Rs. 50 c ro re and a sp e c ia l a llo c a tio n o f R s. 30 c ro re be m ade fo r th e IT in d u s try in th e s ta te . H ow e ve r, th e s ta te has to p la y a m ore p ro a c tiv e and p ra g m a tic ro le by p ro v id in g fu n d s to b rig h t yo u n g ta le n te d e n tre p re n e u rs , so th a t s ta rtups and v e n tu re s by q u a lifie d p ro fe ss io n a ls a re n o t u n s u c c e s s fu l fo r w a n t o f in itia l f in a n c ia l a s s is ta n c e . T h is w ill go a long w a y in b u ild in g c o n fid e n c e a m o n g the
p ro s p e c tiv e y o u n g e n tre p re n e u rs a nd w ill c re a te a m uch n e e d e d c o n d u c iv e and e n a b lin g c u ltu re , im p o rta n t fo r th e g ro w th o f th e IT s o ftw a re a n d s e rv ic e in d u s try in th e s ta te .
E-GOVERNANCE
T he o b je c tiv e s o f e -g o v e rn a n c e a re in fo rm a tio n d is s e m in a tio n to th e p u b lic w ith a ny w h e re o r a n y tim e s e rv ic e s to c itize n s , m ak ing th e g o v e rn m e n t m a c h in e ry m ore e a s ily a c c e s s ib le , tra n s p a re n t, e ffe c tive , e ffic ien t, and a c c o u n ta b le . A c o m p re h e n s iv e c itize n - s e rv ic e p o rta l sh o u ld be se t up fo r th is p u rp o se , w ith su ch s e rv ic e s as is s u a n c e o f g e n e ra l c e rtific a te s ; s e rv ic e s re la ted to ta xes , re v e n u e , tra n s p o rt, p e rm its and licen ses , re g is tra tio n o f a ll typ e s ; p en s io n s ch e m e s , so c ia l s e c u rity a nd w e lfa re sch e m e s ; e d u c a tio n tra in in g ; e m p lo y m e n t; h o u s in g ; in fra s tru c tu re ; fin a n c ia l a s s is ta n c e s ch e m e s ; in d u s trie s ; a g ric u ltu re ; and o th e r m is c e lla n e o u s se rv ic e s . T h is w ill n o t o n ly help im p le m e n t e -g o v e rn a n c e b u t w ill a lso in cu lca te and c re a te an IT c u ltu re in th e s ta te .
Im p le m e n ta tio n o f e -g o v e rn a n c e n e c e s s ita te s to p p rio rity to c o m p u te riz a tio n and n e tw o rk in g o f d iffe re n t d e p a rtm e n ts a t th e h e a d q u a rte r, d is tr ic t and b lo c k leve l; id e n tif ic a tio n o f ke y d e p a rtm e n ta l a p p lic a tio n s ; c re a tio n o f d a ta -b a s e s , d ig itiz a tio n o f p u b lic d o m a in in fo rm a tio n ; and a v a ila b ility o f d e p a rtm e n ta l d a ta on a d a y -to -d a y basis.
T he s ta te g o v e rn m e n t has a lre a d y ta ke n up an a m b itio u s e -g o v e rn a n c e p ro je c t, ca lle d e- G o v e rn a n c e -C itiz e n In te rfa ce , to im p le m e n t e -g o v e rn a n c e . It h as c h o se n F a te h g a rh S a h ib as a p ilo t d is tr ic t fo r the im p le m e n ta tio n o f th is p ro je c t, it e n v is a g e s e x te n s io n o f th e c o m m u n ic a tio n n e tw o rk , in c lu d in g h a rd w a re a nd s o ftw a re , w ith in th e d is tr ic t to c o n n e c t th e d iffe re n t o ffic e s linked w ith th e D C o ffice , w h ic h fu rth e r w ill be c o n n e c te d to d is tr ic t c e n tre s and s ta te h e a d q u a rte rs . T h e s ta te sh o u ld e n s u re th e co m p le tio n o f the p ro je c t in F a te h g a rh S a h ib and se t up s im ila r p ro je c ts in o th e r d is tric ts so th a t g o v e rn m e n t a nd th e p e o p le d ra w m a x im u m b e n e fit fro m IT and e -g o v e rn a n c e .
To fa c ilita te and im p le m e n t e -g o v e rn a n c e in th e s ta te , th e fo llo w in g m e a s u re s are re c o m m e n d e d ;
• L a u n ch a m a s s iv e p ro g ra m m e fo r ru ra l and u rb a n c o n n e c tiv ity . E s ta b lish P u n ja b -w id e A re a N e tw o rk (P U N W A N ) to p ro v id e c o n n e c tiv ity b e tw e e n s ta te h e a d q u a rte rs . S e c re ta ria l A re a N e tw o rk , D e p a rtm e n t L oca l A re a N e tw o rk , d is tric ts , s u b -d iv is io n s , b lo cks and v illa g e s
• F a c ilita te e s tim a te d 2 .5 m illion In te rn e t c o n n e c tio n s by 2 0 0 7 , in line w ith thep o lic y o f th e G o v e rn m e n t o f Ind ia
• F a c ilita te IT k io sks w ith in th e cyc lin g d is ta n c e o f fo u r to fiv e km s, in c lu d in g rurala re a s , by 2 00 5 , th ro u g h p riva te s e c to r p a rtic ip a tio n . G o v e rn m e n t o f P u n ja b sh o u ld p ro g re s s iv e ly m ake a v a ila b le a c c e s s to In te rn e t c o n n e c tiv ity and e -m a il fa c ility in a ll g o v e rn m e n t o ffices .
• L a u n c h a p ro g ra m m e fo r tra in in g p a n c h e s and s a rp a n c h e s a t th e v illa g e leve la nd m a y o rs and d e p u ty m a yo rs a t th e m u n ic ip a l c o rp o ra tio n leve l.
A c c o rd in g to th e re c o m m e n d a tio n s o f th e W o rk in g G ro u p on IT fo r M a sse s , se t up by the G o v e rn m e n t o f Ind ia , fiv e p e r c e n t o f th e s ta te ’s to ta l b u d g e t s h o u ld be a llo c a te d fo r IT in d u c tio n . P u n ja b has a lre a d y se t up D e p a rtm e n t o f In fo rm a tio n T e c h n o lo g y (D o lT ). It is p ro p o s e d th a t it sh o u ld be fu rth e r s tre n g th e n e d in te rm s o f e x p e rtis e a nd fu n d s . It is re c o m m e n d e d th a t a t le a s t 0 .5 p e r c e n t o f th e b u d g e t in th e firs t ye a r, p ro g re s s iv e ly

in c re a s in g it to tw o p e r c e n t in th e te rm in a l y e a r o f th e p lan p e rio d , sh o u ld be u tilized fo r p ro m o tin g a nd im p le m e n tin g e -g o v e rn a n c e .
It is s tro n g ly re c o m m e n d e d th a t e -g o v e rn a n c e o f th e s ta te sh o u ld be im p le m e n te d in a h o lis tic a nd in te g ra te d m a n n e r th ro u g h a m o n ito rin g ce ll, w ith d e fin e d ru les and p ro c e d u re s b a se d on p rin c ip le s o f e qu ity , re s p o n s ib ility , tra n s p a re n c y a n d a cc o u n ta b ility . It sh o u ld be a b le to m o n ito r th e p e rfo rm a n c e and th e s ta tu s o f a il th e p ro je c ts , d e p a rtm e n ts and m in is tr ie s a g a in s t th e se t ta rg e ts . In ca se o f n o n -p e rfo rm a n c e , the m o n ito rin g ce ll w ill re ce ive an a le rt s ign a l and th e ca use .
IT FOR MASSES
T h e ru ra l p o p u la tio n in P u n ja b c o n s titu te s 6 5 p e r c e n t o f the S ta te ’s p o p u la tio n . B e ing p re d o m in a n tly an a g ric u ltu ra l s ta te , th e q u a lity o f life and th e h ea lth o f th e its e c o n o m y is la rg e ly d riv e n by th e p e rfo rm a n c e o f th e ru ra l s e c to r. In fo rm a tio n te c h n o lo g y p ro v id e s n e w o p p o rtu n itie s to ta c k le p ro b le m s re la ted to ru ra l p o ve rty , h e a lth , illite racy , u n e m p lo y m e n t and e n v iro n m e n ta l d e g ra d a tio n . T he sp e c ia l IT T a s k F o rce , c o n s titu te d by th e G o v e rn m e n t o f Ind ia , has re c o m m e n d e d th e use o f s ta te -o f- th e -a rt in fo rm a tio n te c h n o lo g y fo r th e d e v e lo p m e n t o f a g ric u ltu re a nd ru ra l d e v e lo p m e n t, on th e line s o f the s u c c e s s fu l W a ra n a p ro je c t in th e K o lh a p u r a nd S a ng li d is tric ts o f M a h a ra s h tra .
T h is p ro je c t e ffe c tiv e ly d e m o n s tra te s th e co n tr ib u tio n o f an IT in fra s tru c tu re to th e a cc e le ra te d s o c io -e c o n o m ic d e v e lo p m e n t o f a c lu s te r o f 70 c o n tig u o u s 'W ire d V illa g e s ’. T h e p ro je c t a im s to u tilize IT to in c re a se th e e ffic ie n c y /p ro d u c tiv ity o f th e e x is tin g c o o p e ra tiv e e n te rp r is e , b y se ttin g up a s ta te -o f- th e -a rt c o m p u te r c o m m u n ic a tio n n e tw o rk a nd c re a te a d a ta -b a s e o f v illa g e s on d iffe re n t s o c io -e c o n o m ic a s p e c ts su ch a s hea lth , e d u c a tio n , w a te r su p p ly , s a n ita tio n and p o p u la tio n . It a lso p ro v id e s in fo rm a tio n on a g ric u ltu ra l-re la te d s c h e m e s , e m p lo y m e n t g e n e ra tio n s c h e m e s , a nd g o v e rn m e n t p ro c e d u re s fo r g e ttin g ra tio n ca rd s , b irth a nd d e a th ce rtific a te s , e tc ., to th e v illa g e rs .
It is p ro p o s e d th a t P u n ja b sh o u ld a d o p t th e 'W ire d V illa g e ’” c o n c e p t to n e tw o rk its 1 2 ,4 00 v illa g e s w ith a ll in fo rm a tio n and c o m m u n ic a tio n fa c ilit ie s , in c lu d in g In te rn e t. To c o v e r th e e n tire s ta te , a to ta l o f 138 'C o m m u n ity In fo rm a tio n D is s e m in a tio n C e n tre s ’ (C ID C s), o n e e ach a t th e b lo ck leve l, sh o u ld be s e t up, w h ic h w ill be linke d to e ve ry v illa g e . T h e s e c e n tre s w ill a lso e ffe c tiv e ly d is s e m in a te in fo rm a tio n re la te d to th e 29 s u b je c ts tra n s fe rre d to the P a n c h a y a ts u n d e r th e 73'^ A m e n d m e n t to th e C o n s titu tio n . C ID C s a lso fu n c tio n a s IT k io sks and w ill p ro v id e d ire c t lin k a g e s b e tw e e n th e m asse s and th e g o v e rn m e n t. C ID C s w ill fu rth e r o rg a n iz e tra in in g o f p a n c h e s a nd s a rp a n c h e s in th e use o f IT a nd its b e n e fits fo r th e ir d a y -to -d a y re q u ire m e n ts .
T h e to ta l in v e s tm e n t fo r se ttin g up su ch 138 C e n tre s has b een w o rk e d o u t to be Rs. 372 c ro re , a t th e ra te o f Rs. 2 .7 c ro re p e r C ID C . (O n an a v e ra g e ru p e e s th re e lakh p e r v illa g e and o n e C ID C w ill c o v e r 90 v illa g e s ). It is re c o m m e n d e d th a t th e P u n ja b m a k e s e ffo rts to g e t th e p ro je c t fu n d e d b y th e G o v e rn m e n t o f Ind ia . (G o v e rn m e n t o f Ind ia has a lre a d y fu n d e d a s im ila r p ro je c t in th e N o rth e a s t reg io n o f th e c o u n try a t a c o s t o f R s. 220 c ro re c o v e rin g 4 8 7 c e n tre s ). T he p ro g ra m m e is on a re v e n u e -s h a rin g b a s is a n d is to be so fo rm u la te d th a t, a fte r an in itia l g e s ta tio n perio d o f tw o to th re e ye a rs , C ID C s w ill be se lf- s u s ta in in g . It w o u ld a lso p ro v id e e m p lo y m e n t to a p p ro x im a te ly 2 5 ,0 0 0 e d u c a te d yo u th in th e ru ra l a re a s o f P u n ja b d u rin g 2 0 0 2 -2 0 0 7 . T h e G o v e rn m e n t o f Ind ia h as a lre a d y m ade p ro v is io n fo r re q u is ite in v e s tm e n t co v e rin g 6 ,0 0 0 C IC s (C ID C s ) to be s e t up a ll o v e r the c o u n try , as re p o rte d in M IT R eport on Tenth Five Year Plan.

C ID C s w ill a lso he lp in im p ro v in g p ro d u c tiv ity and p e rfo rm a n c e o f a g ricu ltu re . S u p p o rt and s e rv ic e s o f va rio u s s ta k e h o ld e rs and e x te n s io n a g e n c ie s , such as P un jab A g ric u ltu re U n ive rs ity , L ud h ian a , S ta te A g ric u ltu re D e p a rtm e n t, M and i B oard , M ark fed , S u g a rfe d , e tc ., and o th e r a g ric u ltu re -re la te d in d u s trie s sh o u ld a lso be ta ke n up fo r u p d a tin g th e la te s t in fo rm a tio n on p ro d u c ts and se rv ic e s , n ew te c h n o lo g ie s and p ra c tices .
IT can be used in all a s p e c ts o f a g ricu ltu re . It can p lay a m a jo r ro le in c ro p m a n a g e m e n t, e n h a n c in g p ro d u c tiv ity and c rop y ie ld s th ro u g h in fo rm a tio n on fa rm p ra c tice s , seeds, o th e r in p u ts o f p ro d u c tio n , w e a th e r in fo rm a tio n , e n h a n c in g re a liza tio n , cu ttin g dow n in te rm e d ia rie s , b e tte r p re - and p os t- h a rv e s t m a n a g e m e n t, w a te r u tiliza tio n and m a n a g e m e n t, p e s t and d ise a se co n tro l, e tc. T h e Land In fo rm a tio n S ys te m can p ro v id e in fo rm a tio n a b o u t m a rke ts , fo o d -p ric in g , im p o rts and e xp o rts , ta riffs and q uo tas , u n d e rp ro d u c tio n and o v e r p ro d u c tio n , and p h ys ica l in fo rm a tio n a b o u t so ils, h y d ro g e o lo g y and ra in fa ll, e tc. IT a p p lic a tio n s can be e ffe c tiv e ly used fo r m a n a g e m e n t and m o n ito rin g o f e n v iro n m e n t re so u rce s , p o llu tio n w a rn in g sys te m s , e n v iro n m e n ta l e m e rg e n c y m a n a g e m e n t s y s te m s fo r flo o d s , fo re s t fire s and o th e r n a tu ra l d isa s te rs .
IT can a ls o be s u ita b ly e m p lo ye d in sm all and tin y in d u s trie s fo r o n lin e and rea l-tim e in fo rm a tio n to he lp sm a ll and m arg in a l a rtisa n s in th e ir sa le s and m a rk e tin g e ffo rts . Th is w ill n o t o n ly he lp th e m earn b e tte r and b o o s t th e ir m ora le , bu t p re s e rv e th e se rare sk ills , w h ich o th e rw is e a re on th e ve rg e o f e x tin c tio n .
T he G o v e rn m e n t o f Ind ia has p ro po sed th e se tting up o f a n e tw o rk ca lle d , V id ya V ah in i, to c a rry th e b e n e fit o f IT to the s tu d e n ts . T o d a y , in Ind ia , th e re a re m ore th a n n ine lakh sc h o o ls c a te rin g to th e n ee ds o f m ore th a n 25 c ro re s tu d e n ts and o ne c ro re te a ch e rs . M os t o f th e s e s c h o o ls have no a cce ss to th e in fo rm a tio n age . U n d e r th e V id ya V a h in i p ro g ra m m e , sc h o o ls and h ig h e r lea rn ing in s titu te s a re p ro p o s e d to be co n n e c te d w ith an in te g ra te d vo ice , d a ta and v id e o n e tw o rk . T h e G o v e rn m e n t o f Ind ia has p ro p o se d to in tro d u ce th is p ro g ra m m e in tw o p ha ses. In th e firs t p hase , i.e ., in th e firs t tw o ye a rs o f the p la n , 6 0 ,0 0 0 s c h o o ls a re p ro po sed to be co n n e c te d to th e n e tw o rk . P u n ja b sh ou ld g e t 5 ,0 0 0 s c h o o ls n e tw o rke d in the firs t p ha se and 5 ,00 0 m ore in th e s e co n d pha se .
It is e s tim a te d th a t ru p e e s tw o lakh w ill be re q u ire d fo r e ach sch o o l, to im p le m e n t the re c o m m e n d a tio n o f G o v e rn m e n t o f Ind ia , It is a lso re c o m m e n d e d th a t all th e s e sch o o ls sh o u ld o n ly be fro m rura l a reas. T im e ly and s p e e d y im p le m e n ta tio n o f th e p ro je c t by the s ta te w ill go a long w a y in fu rth e rin g the use o f IT fo r th e m a sse s .
RESEARCH, DESIGN AND DEVELOPMENT (RD&D)
N a tio n s in ve s tin g in h u m a n re so u rce d e v e lo p m e n t, re se a rch & d e v e lo p m e n t and h igh q u a lity u n iv e rs ity e d u c a tio n have a ch ie ve d w o rld w id e le a d e rs h ip a nd s ch o la rsh ip .
T o d a y , th e Q u a lity -o f-L ife ind ex in th o se n a tio n s is u n p a ra lle l as c o m p a re d to o th e r d e v e lo p in g n a tio n s . In th e libe ra lize d , g lo b a liz e d e n v iro n m e n t, u n d e r th e W T O reg im e , it has b e c o m e im p e ra tiv e to d eve lo p te c h n o lo g ie s , n e w e r p ro d u c ts and s e rv ic e s o f in te rn a tio n a l q ua lity , to rem ain co m p e titive . R e se a rch and d e v e lo p m e n t is th e w a y to m ee t th is c h a lle n g e . In the fie ld o f IT in Ind ia , m o s t o f th e re s e a rc h a nd d e v e lo p m e n t p ro je c ts h ave so fa r been sp o n so re d and fu n d e d by th e G o v e rn m e n t o f Ind ia . H ow e ver, K a rn a ta k a , A n d h ra P ra de sh and M a h a ra s h tra have u n d e rta k e n a fe w d e s ig n and d e v e lo p m e n t p ro je c ts s p o n s o re d and fu n d e d b y th e re s p e c tiv e g o v e rn m e n ts .

RD&D is vital for the growth and development of the IT industry, for Punjab to become a leading IT destination and move up the value chain, Design and development projects with commercial potential should be identified and the participation of the private sector in them encouraged. The state must focus on short-term as well as long-term RD&D projects. Short-term projects with direct applications in industry, involving less risk and a short gestation period, should be taken up on a priority basis. Other important areas Include development o f software for the computerization o f different government departments and application software for rural masses in the local language.
In the longer term, the state must focus on key emerging technologies, such as wireless technology, second generation Internet, software level integration, and motivate MNCs to set up their RD&D centres in Punjab and financial and technical participation of international agencies to leverage their worldwide experience. The concept of subcontracted research with system-integration should be encouraged to help in developing system-integration expertise and design of products.
An exclusive R&D fund has to be set up to formulate and implement these RD&D programmes, Rs. 20 crore may be allocated during 2002-07. In addition, technical and financial support and participation by the Government of India, International agencies, MNCs and private sector are Important.
INVESTMENT WITH SUGGESTED SOURCES DURING 2002-2007(Rs. in crore)
Area Estimated total Investment
To be funded by Punjab Govt
To be funded by GOI
To be funded by Private sector
Human Resource Development
a) HRD Quality improvementb) Setting up an III
60.00150.00
45.00150.00
15.00
IT Infrastructurea) Setting three IT cities at Patiala
(Rs. 175 crore), Jalandhar (175 crore and Ludhiana (Rs. 175 crore and upgrading Mohali (Rs. 50 crore)
b) Venture Capital Additional fund for IT
575.00
30.00
115.00
30.00
460.00
E-Governance0.5 per cent in the first year to 2.0 per cent in the last year of the plan
188.6 188.6 - -
IT for MassesSetting 138 wired CIDCs at block level
372.00 186.00 186.00
Vidya Vahini Programme (GOI) for 10000 Schools
200.00 200.00 -
Research Design & Development20.00 20.00
Total 1595.60 398.60 536.00 661.00

References
M inistry o f Information Technology (MIT), Report for Tenth Plar) (2002-07).
IT Task Force, M inistry o f Information Technology, G overnm ent o f India.
Quarterly NASSCOM Reports.
Information Technology Policy, G overnm ent o f Punjab, 2001.
Information Technology Policies of /Kodhra Pradesh, Karnataka, Kerala, Haryana, Rajasthan, UP.

Chapter 14
DEVELOPMENT PERSPECTIVE
W hile enunciating a deve lopm ent perspective fo r Punjab, an essential prerequisite is to spell out a vision fo r the state - the kind o f econom y, society, polity, ecology and ideology envisaged fo r it, over a given period o f tim e. This style o f dealing w ith the issue is strik ingly d ifferent from the usual style w herein the future agenda is set in the light o f the evolving scene, particularly w ith reference to problem s that have em erged on the way. The intention is to define and w ork out a feasib le dream fo r the state and thus go beyond the conventional d iagnostic and curative approach.
In its bare essentials, the state has to be not only effic ient and progressive econom ically, jus t and harm onious socially, dem ocratic and partic ipatory politically, friendly and prudent ecologically, aesthetic and functional spatially, but a lso civil and sustainab le system ically. In th is light, one can envision Punjab eventua lly as a region which is sub-urban, d isplaying a continuum o f rural and urban, agricu lture and non- agnculture, w ith a h ierarchy of settlem ents interlinked by a free-flow ing transport network; thereby serving as a stage fo r w hat is envisioned. Herein, sym bolically, the role o f a deve lopm ent architect, social scientist and a professional practitioner gets entw ined. Things would have been easy if Punjab w ere a clean slate to w ork on. Certa in ly it is not. This poses a real challenge. The evolved scene has to be redesigned and reconstructed rather than being built anew.
CONTEXT
Som e sa lient features o f Punjab m ay be recapitu lated. It enjoys the h ighest per capita incom e in the country (Rs. 23,043 against the national average o f Rs. 15,562 in 1999-2000), and is highlighted as a model o f agricultural developm ent. Here poverty is not an issue; achieving a higher level o f econom ic w ell-be ing or becom ing more a ffluent is! People can move to a greener pasture anyw here in the w orld if the opportunities at hom e are not a ttractive enough.
Such w as the stim ulus w hich m otivated m any a native o f Punjab to m igrate not only to o ther parts o f India, as d iverse as newly reclaim ed agricultural lands, lucrative urban places or rem ote forested areas, but also to em igrate to several foreign countries including, the United Kingdom , Canada, United States, Austra lia and M iddle East, am ong others. This exposed them to the ethos o f the developed world. No wonder, the popular deve lopm ent perspective seeks transform ation o f the state in the m ould o f a western country. An oft-repeated self-question is; W hy cannot Punjab be like the United States, o r the United Kingdom , or like Israel, o r Denm ark, am ong the sm aller countries? The state, o f course, cannot go by such a paradigm . It has to fabricate its own m odel o f developm ent, consistent w ith ecological conditions, cultural e thos and susta inab ility param eters. Above all, any deve lopm ent perspective envisaged fo r the state has to be in the spirit o f its interconnectivity w ith o ther parts o f the country, particularly the neighbouring states.
One pecu liar feature o f the deve lopm ent process in Punjab m ay be underlined; As soon as a new growth activity is initiated, it p icks up m om entum , and reaches a plateau rather too soon. The green revolution is one such case. It m ade a beginning in 1966; by 1985, it had reached a saturation level and has been seeking a new direction, w hich is m ore rem unerative than the w heat-rice rotation regim e. N ot much

success has been m et on this count. W ater depletion in the tubew ell irrigated lands and w aterlogging in the canal irrigated ones have em erged as serious problem s. Likew ise, the educational and health infrastructure expanded, excelling the national norms, but when the task o f enhancing the quality o f service em erged, the response w as weak. Susta inability o f the developm ent process and provid ing new channels for its flow are now the crux o f the matter. This cannot be ignored as a param eter o f the deve lopm ent perspective.
A new ly acquired econom ic well-being soon gets translated into an aspiration for living in an upgraded habitat. One o f the m ost visible outcom es o f the green revolution has been a rem arkable transform ation o f village settlem ents, particularly by w ay o f conversion o f kutcha houses into pucca. In urban areas too, a w ell- designed house located w ithin a m odern locality, has becom e a priority. An urge to live in standard houses w ith clean and green surroundings has been ignited. Q uality habitat, thus, claim s inclusion as an im perative o f the deve lopm ent perspective.
A sta tem ent on deve lopm ent perspective fo r the state will not be com ple te if we do not take care o f the globalized psyche o f its people. Punjab is an anom aly to the students o f m igration studies. Though well placed econom ically, it has been a net outm igration state fo r the last hundred years or more. Though not a coastal state, it has recorded large scale em igration too. Punjab is an extrovert entity, actively interacting w ith areas all over the world at large. This global d im ension o f the state has to find a place in any form ulation o f a developm ent perspective fo r it.
Finally, as rightly perceived, Punjab is eulogized fo r the progressive outlook, great dynam ism , and exceptional enterprise o f its people. It has also a fa irly laid out infrastructure base. V irtually any problem it faces, or any situation w hich constrains its developm ent, can largely be attributed to a m anagem ent fa ilure. People believe that Punjab can be a model state sim ply if its political and adm in istrative train is on the right track. Thereby, ‘good governance ’ is underlined as the m ost critical aspect o f its deve lopm ent scene. It is deem ed basic to the actualization o f all o ther deve lopm ent perspectives.
W hat should be the tim e fram e fo r the realization o f the deve lopm ent perspective visualized fo r Punjab? The faste r it is the better fo r the people, but tim e targets have to be assigned. In the m edium term , it could be placed at 1 N ovem ber 2016 when Punjab w ould be celebrating the golden anniversary o f its form ation; on the short term , it can be placed at 31 March 2007 when the Tenth Plan gets com pleted: and as a re lative ly long term scenario, it can be dated as 31 D ecem ber 2020, in the sp irit o f a new vision. These three datelines can adopt evolving deve lopm ent d im ensions as the ir top priority: financial recovery as the necessary base (2007); hum an deve lopm ent (education and health) by 2016; and habitat (environm ent) by 2020.
PERSPECTIVE OF THE PLANS: 1966-2002
Let us review w ha t has been the deve lopm ent perspective o f the successive state plans (G overnm ent o f Punjab, 1969-2002). W hich w ere the sectors listed as its priority? W hich strateg ies were deem ed as m ost effective fo r the purpose? Answ ers to these questions are necessary, as the state has invariably p layed a pervasive and ubiquitous role in determ ining the content, pace and quality o f the deve lopm ent process in Punjab. Intentions o f the governm ent, as evolving over tim e, can be d iscerned from the pages o f plan docum ents.

Punjab was reorganized to its present form in 1966. This synchronized w ith the ushering in o f the green revolution. By that time, the state had carried out consolidation o f landhold ings over its entire space, 59 per cent o f the net area sown had been brought under irrigation, virtua lly all the villages had been covered by agricultural credit societies, the Mandi (M arket) Tow nship Act had com e into force to facilitate the d isposal o f agricultural produce, and benefits accruing from research and extension activ ities o f the Punjab Agricu ltura l University, Ludhiana, had started making an impact. A stage had been set which put the state on a fast track to agricultural and rural developm ent.
The years 1966-69 w ere a phase o f Annual Plans, during which the state received special funds fo r its transform ation into a veritable ‘bread basket’ fo r the country facing a pro longed and m assive food-deficit. Two consecutive drought years o f 1964- 65 and 1965-66 had worsened the situation in India. This gave Punjab an opportunity to prove its m ettle. It m et the challenge and contributed 61 per cent o f w heat and eight per cent o f rice procured fo r the public distribution system at the national level in 1968-69.
The Fourth Plan (1969-74) docum ent h ighlighted that the state could take pride in having saved the country from a grave food crisis; and fo r itself, having successfu lly stablised the strides made in the green revolution. Its efforts at d iversifying the econom y tow ards industria lization were yet to make an impact. Inadequacy o f finance, shortage of raw materials, and gap in power supply, to the extent o f less by one-th ird o f dem and, were adduced as the factors responsible.
Taking a cue from above, the Fifth Plan (1974-79) aimed at a bold program m e o f ‘industria lization and developm ent o f in frastructure ’, so as to accelerate the pace o f econom ic growth. M assive investm ent in power was deem ed essentia l fo r the purpose. The assessm ent was that u ltim ately it was industry which could reduce the disparity in the deve lopm ent level o f d ifferent parts o f the state.
The Sixth Plan (1980-85) introduced a new idiom seeking transform ation o f Punjab into a ‘model s ta te ’ during the next ten years. The main com ponents o f such a vision included d iversification of the econom y in favour o f industry: generation o f jobs fo r the unem ployed and underem ployed; reduction in regional, rural-urban and caste- based d isparities; and im provem ent in the overall quality o f life. All th is w as to be achieved through an accelerated rate o f econom ic growth, an e ffic ient and honest adm inistration, and a decentralized pattern o f planning and developm ent.
The Seventh Plan (1985-90) prom ised ‘growth w ith jus tice ’. A m ajor th rust was envisaged fo r correction o f d istortions that m ay have crept in during the preceding plan periods. These included, fo r exam ple, reclam ation o f degraded agricu ltura l land, extension o f irrigation in the subm ontane and o ther backward tracts, im provem ent in delivery o f educational and health facilities, and prom otion of industry, particularly in border d istricts. Augm entation o f pow er supply and initiation o f environm enta l im provem ent schem es w ere listed as priorities. The two annual plans, during 1990- 92, carried forw ard the ongoing deve lopm ent schem es apart from initiating som e new ones, as financed by the Central Governm ent.
‘Generation o f additional em ploym ent’ w as adopted as the core concern o f the S tate ’s Eighth Plan (1992-97). The three border districts o f G urdaspur, A m ritsar and Firozepur, w hich w ere the m ajor victim s o f the statew ide m ilitancy during the eighties, w ere in special focus. Again ‘prom otion o f industry’ was identified as an e ffective route to the realization o f this objective. D iversification o f agriculture, in general, and o f the cropping pattern, in particular; im provem ent o f hum an resource through

education, health and training: and extension and m odernization o f basic infrastructure w ere am ong the o ther tasks listed. In respect o f institutional reforms, decentra lized planning at the d istrict level w as to receive a fu rther im petus; private investm ent w as to be encouraged in all sectors, and viability o f the public sector undertakings was to be ensured.
The Ninth Plan (1997-2002) enum erated the follow ing as the broad lineam ents o f its strategy: v igorous th rust to agriculture and rural developm ent; a great push to irrigation and pow er sectors; im provem ent in quality o f life in both villages and towns; creation o f additional em ploym ent opportunities; and social justice fo r the d isadvantaged. M icro-level planning w as to receive special attention, m ore so in the border districts.
The Tenth Plan (2002-2007) strategy is virtua lly an iteration o f w hat was contem plated in the Ninth Plan. D iversification o f agriculture, as also o f the cropping pattern, has been projected as the m easure to m eet the challenge posed by the stipulations o f the W .T.O . Various deve lopm ent projects, such as Integrated W atershed, Health Care System s, and W ater Supply and Environm ental Sanitation, aided by international agencies, are to continue.
An overview o f the plan docum ents lead us to the fo llow ing conclusions;
• Perspective and strategies indicated fo r various plans rem ained virtua lly the same: d iversification o f the econom y tow ards industry, o f agricu lture towards non-farm activities, and o f the cropping pattern away from the stubborn w heat-rice rotation; irrigation and pow er as the m other sectors; and unem ploym ent as the main challenge.
• Theoretical underpinnings o f the plan docum ents rem ained unspelt. Only the Sixth Plan projected a vision o f m aking Punjab a M odel State. The instrum entalities indicated were a reform ed adm inistration and decentralized planning, w ith a flavour o f good governance.
• The successive plan proposals, by and large, echoed the issues highlighted at the national level. Specificity o f the state level concerns w as not projected in a bold m anner. The plan docum ents were drafted w ith a bureaucratic ethos; the input em anating from the research institutions and university academ ics w as meagre.
• Sub-p lans fo r the backward areas, including the subm ontane tract, flood- plains and border districts found special place in the docum ents. This is as it should have been. It was, however, not clear as to how these sub-plans were integrated w ith m icro-level planning.
• Expenditure exceeded outlay during m ost o f the plan periods. The state could arrange additional resources from the P lanning C om m ission, o r w as able to m obilize these at its own level. The Ninth Plan w as an exception, when the expenditure incurred was only 77 per cent o f the approved outlay. Irrigation and pow er accounted fo r about one-ha lf to m ore than tw o-th irds o f the expenditure under vanous plans. Ironically, both w ere losing sectors financially, under the twin e ffect o f subsidies involved and pilferage.
The status o f the sectoral developm ents o f the state reflects and m irrors the im plem entation o f plan provisions. It is necessary to review the situation in each case and to enunciate sector-specific developm ent perspectives. This is precise ly w hat is being attem pted here. An iteration o f som e o f the bold facts appearing in various chapters o f th is deve lopm ent report becom es unavoidable, a t places, in any such exercise. A ny inform ation o r data is didy acknow ledged at the very outset.

SECTORAL PERSPECTIVES
Economic Growth and Regional Disparity
The m ost w orrisom e feature of Punjab econom y today is the drop in its annual growth rate, from 5.3 per cent during 1980-81 to 1990-91 to 4.7 per cent during 1991- 92 to 1997-98. By com parison, growth rate at the national level moved up from 5.6 to 6.9 per cent during the sam e period. In sym pathy, the annual increase rate o f the s ta te ’s per capita incom e also came down from 3.3 to 2.8 per cent.
A further perusal o f data shows a regular decline in the growth rate o f agricu lture in Punjab since 1985. The s ta te ’s share in the contribution o f w heat to the C entral pool declined from 45 per cent in 1980-81 to 36 per cent in 2000-01, and that o f rice from 73 to 58 per cent during the same period. The livestock sector, w hich w as earlier having an upswing, has been decelerating since 1997. The sam e has been true o f the m anufacturing sector. E lectricity generation rate also suffered a decrease a fter1990. Construction, transport, and trade sectors did d isp lay som e buoyancy. On the whole, the nineties em erge as a difficult phase fo r Punjab econom y. W hy did th ings come to such a pass?
The unhappy dow nw ard turn o f Punjab econom y can be traced to 1984-85, when it becam e a ‘revenue defic it sta te ’ from the status o f a ‘revenue surp lus o ne ’ (G overnm ent o f Punjab, June 2002). The G overnm ent o f Punjab attributes th is to ‘an ever increasing salaries and wage bill o f the em ployees (particu larly since im plem entation o f the Fifth Pay Com m ission recom m endations), m ounting debt burden, heavily subsidized social sector (education and health) and econom ic services (irrigation and electricity), slow growth of revenue, and loss-m aking public sector undertak ings’ (G overnm ent o f Punjab, March 2002). The d ifficult political situation during the eighties has adversely affected both the im position and collection of taxes. This was m ore so during the prolonged phase o f p resident’s rule, when the caution w as not to create any situation that could add fuel to the fire. During the tenure o f e lected governm ents, ‘subsidies on populist lines’ m ade the ir own contribution to worsening the situation. M eanwhile fiscal deficits o f the public sector undertakings w ere also m ounting and adding to the financial m isery o f the governm ent. The recourse fo llowed w as to go in for public borrow ing in a big way, instead o f curing the m alaise. Interest paym ent, as a percentage o f revenue, m oved up from 16.8 in 1990-91 to 29.4 in 2000-01. This w as the highest fo r any m ajor Indian State; the all-India figures w ere 13.1 and 17.6 per cent respectively. Investm ent on deve lopm ent suffered badly. The developm ent expenditure, as a percentage o f total expenditure, steeply fall from 71.9 in 1980-81 to 54.5 in 1997-98, and fu rther down to 46.5 in 1998-99. Im plications o f all th is fo r the sta te ’s econom ic growth rate are not d ifficult to understand.
The fiscal program m e of the Punjab G overnm ent envisages an annual econom ic growth rate o f 5.5 per cent during the Tenth Plan, at constant prices. W ith the current population increase rate being about 1.8 per cent, the annual rise in per capita income would be o f the order o f about 3.7 per cent. The Planning C om m ission expects Punjab to achieve a higher annual growth rate o f 6.4 per cent (agricu lture 4.1% , industry 8.1% and services 8%). This calls fo r a greater e ffort than the state has assigned to itself. The governm ent proposes to stim ulate the econom y by correcting the fiscal im balance, and thereby m aking available a larger share o f the budget fo r developm ent. M ajor steps contem plated include: reform s in the area o f sales tax; revision o f user charges o f transport, irrigation, h igher / p rofessional education, secondary / te rtia ry health care, and drinking w ater supply; and gradual privatization o f public sector undertakings.

In any situation, econom ic growth rate is a function o f three factors: investm ent level, increm enta l ca p ita l-o u tp u t ratio (investm ent required fo r an additional per unit production), and rise in the value added (difference between output and input per unit o f production). In India, gross fixed investm ent in the econom y is about one-fourth o f the gross dom estic product; o f this, 28 per cent is by the public sector. For w ant o f separate inform ation about Punjab, we may assum e that a s im ilar situation prevails here. The relevant m essage fo r our purpose is that, notw ithstanding the crucial role o f public sector investm ent in deve lopm ent (particularly infrastructure and social services), the private sector is m ore critical in term s o f its share and spread of investm ent. Private sector investm ent, however, is se lective o f those locales which are free from law and order problem s, o ffe r quality infrastructure, and provide skilled labour im bued with a strong sense o f w ork culture. A ny schem e o f putting Punjab econom y on an expressw ay has to address itse lf to these issues. As fa r as ‘increm ental c a p ita l- output ra tio ’ and ‘value added ’ aspects are concerned, technologica l upgradation and effic iency prom otion em erge as the main prerequisites.
M ercifully, the p icture o f Punjab as a relatively prosperous and progressive state still persists in the popular mind. As noted earlier, there are valid reasons fo r it. This m ust not lead one to believe that there are no regional d isparities w ithin; these are rather striking, as m easured by any set o f econom ic and social ind icators (Gosal and Krishan 1984). In specific, the central belt o f Punjab, covering Am ritsar, Kapurthala, Ja landhar, Ludhiana, Fatehgarh Sahib and Patiala districts, is relative ly the m ost developed. It is characterized by a very progressive agricu lture, sign ificant concentration o f industry and a high level o f urbanization. The Am ritsar-D elh i railway track and the G rand Trunk road form the econom ic back bone o f th is zone and provide it w ith the necessary dynam ism . The northeastern zone, com prising G urdaspur, Hoshiarpur, R opar and N aw anshahr districts, is com parative ly the least developed. This is attributed to its d issected and undulating topography, sm all size o f landholdings, and relative isolation o f som e o f its parts. The scene is, o f course now changing fo r the better, w ith the W orld Bank sponsored Kandi Area Integrated W atershed D evelopm ent Project being under way, industry com ing in a s ignificant m anner in H oshiarpur and R opar d istricts, and in frastructure getting greatly s trengthened in areas around Chandigarh. The southw estern zone, com prising Firozpur, Moga, M uktsar, Faridkot, Bathinda, M ansa and Sangrur d istricts, are acquiring new dim ensions o f developm ent. It has m ade noticeab le progress in agriculture. Industry is also picking up. The m ost im portant fac to r accounting for its agricu ltura l advancem ent has been the relatively large size o f landholdings, prom oting m echanisation. Industrial deve lopm ent is facilita ted by the availab ility o f agricu ltura l raw m aterials, particularly cotton and rice.
W ithin th is broad fram ew ork o f regional d isparities in Punjab, the governm ent has identified three kinds o f backward areas in the physical s tructure o f the state: the hilly and foothill Kandi tract; the flood-p la ins o f the Ravi, Beas, Satluj and G haggar, and the border belt. Each o f these suffers from its own specific physical and locational problem s. The Kandi tract has an undulating and degraded topography; the flood- p lains are not free from the fu ry o f river-waters during the rainy season; and the border belt w ith Pakistan is the m ost d istant from the state capita l and a typical periphery. Special attention to such problem atical areas is in order.
Rural Development and Agriculture
Am ong the Indian States, Punjab holds place o f pride fo r its outstanding achievem ents in rural developm ent. A healthy m ix o f environm enta l, institutional and technologica l facto rs explains th is situation, evolving since independence and picking

up pace after the s ta te ’s reorganization in 1966. The m ost striking feature o f the Punjab m odel is the governm ent’s m anysided participation in the deve lopm ent process (Chadha, 1986, p.338). Im bedded in the schem e of th ings w as the adoption of agriculture as the lead sector, not only in consonance with the physical a ttributes of the state, but also as a response to the national dem and fo r food. W ith political power in the state having been consistently rural based and drawn from a farm ing background, rural deve lopm ent and agriculture have rem ained a priority. W hat is more, a right sequence o f policies w as fo llow ed fo r the purpose. Beginning w ith consolidation o f landholdings, fo llow ed by reclam ation o f new agricultural lands and synchronous extension o f irrigation through Bhakra canals, and the process being further strengthened by the green revolution strategy o f b iochem ical inputs (high yielding varie ty seeds, chem ical fe rtilizers and irrigation) and m echanical inputs (tractors, th rashers and harvestor-com bines), Punjab agricu lture continued m aking rapid strides over the years. The agrarian structure characterized by m iddle level peasantry, w ith landhold ings o f tw o to four hectares, and predom inance o f ow ner cultivators, w as no less im portant a facto r fo r the success o f th is process. Exogenic factors also played a role in the m odernization o f Punjab agriculture. Exposure o f the state to external influences through em igration to foreign countries, m igration to o ther parts o f India, and tradition in arm y service, had at least a three pronged effect: brought in rem ittances w hich w ere used fo r augm enting agricultural in frastructure at the household level; reduced pressure on agricultural land, thereby saving the landholdings from getting very sm all; and stoked a tendency tow ards achieving higher levels o f opulence.
M ost im portant to the w hole process w as the governm ent’s th rust on ru ra l- agricultural developm ent. The main com ponents o f the strategy included; extension o f irrigation, rural electrification, rural link roads, rural focal points provid ing a variety o f services, closely spaced agricultural m arket centres and, above all, an assured provision o f cred it and agricultural inputs. W idespread infrastructure, which could boost agriculture, w as m ade available. As part o f national policy, the m inim um support price fo r w heat and rice, the s ta te ’s two m ajor crops, p layed a s ignificant role in sustain ing agricu ltura l developm ent, and thereby raising rural incom es. In 1999-2000, only six per cent o f rural households in Punjab w ere below the poverty line, as com pared w ith 27 per cent in rural India.
The em erging scene o f rural Punjab, and w ithin that o f agriculture, is not free from som e serious concerns. N otw ithstanding a com m endable quantita tive expansion o f a variety o f services, notably schools/colleges, d ispensaries/hospita ls, ve terinary centres, e lectrification, link roads, and focal points, the quality o f service provided in every case is fa r from satisfactory. Schools and d ispensaries do not function properly, e lectric ity suffers frequent breakdowns, link roads are not properly m aintained, and several o f the focal points are non-functional. U pgradation o f quality in service provision is now the greatest challenge fo r any e ffo rt to im prove the situation in rural Punjab.
On the agricu ltura l front, the persistence o f w heat-rice rotation, despite efforts a t prom oting d iversification o f the cropping pattern, is causing a serious dam age to the s ta te ’s natural resource base. Rice, in particular, is a w ater-in tensive crop and is not eco-friend ly fo r Punjab. Its popularity, however, could not be conta ined, because it is not only a lucrative crop but also o f assured returns. The consequence is there for every one to see: w ater-tab le depletion in tube-well irrigated areas and w aterlogging in canal irrigated ones. The question rem ains: How to wean the Punjab fa rm er away from the w heat-rice rotation? A serious effort to this e ffect w as m ade as early as in 1986. The situation evolved to the contrary, w ith the rice area increasing from 17 to 26 lakh hectares, and w heat area from 32 to 34 lakh hectares during 1985-86 to

2000-2001. Short-term private econom ic gains are ignoring the long-term public ecological cost.
‘Precision d iversification based on agro-ecological zones o f Punjab ’, is now being recom m ended. In precise term s, rice is to be shifted from tracts ‘v^here sandy and loam y soils predom inate ’ . Production o f basm ati rice, w hich is less w ater-in tensive, should be encouraged through assured support price. A t least 20 per cent o f the area under w heat and rice should be shifted to som e other crops, such as maize, oilseeds, sugarcane and fru its/vegetab les or o ther farm enterprises (Johl and Ray,2001, p .251). The corporate sector, in linkage w ith fa rm ers ’ associations, should be asked not only to im prove quality o f agricultural products, but also prom ote agro- processing industry.
Despite a visible im provem ent in the quality o f life in Punjab villages, particularly by w ay of conversion o f kutcha_houses into pucca ones, m uch rem ains to be done for environm enta l im provem ent o f the rural habitat. Introduction o f ‘U nnat G ram ’ schem e by the Punjab G overnm ent, during the Eighth Plan, w as one creditab le e ffort in this d irection. Pavem ent o f streets, construction o f drains, d isposal o f sullage water, m etalling o f phirnis, and provision o f w ater borne latrines in each house w ere the main planks o f th is schem e. Shortage o f funds perm itted only a lim ited success. In that context, the old abadi part o f every village is invariably very congested, poorly m aintained and ecolog ically deficient. A cu lture o f healthy living needs to be prom oted. Upgradation o f the quality o f rural habitat rem ains an unfin ished agenda item on the deve lopm ent chart o f the state. An e ffective course would be to pool the available funds under all the d istrict level schem es and d isburse these by fo llow ing a policy o f ‘one village, one schem e’ at a time. As at present, funds are spread too thin to cover a num ber o f schem es in a village.
Tow ards that goal, it is suggested that a schem e o f p lanned rural residential colonies be form ulated and im plem ented at the focal points, to begin with. Each o f these colonies could be designed fo r about 250 or m ore housing units o f varying sizes depending upon the dem and at each site, with provision fo r expansion in future. The locality m ust becom e a model in house design, provision o f services, and overall m aintenance. A com ponent o f com m ercial outle ts could be included as part o f the schem e, and thereby cross-subsidize the residential com ponent. The schem e is visualized as self-financing.
It m ay not be known to m any that the proportion o f the Scheduled Caste population in the total is the highest in P un jab-around one-th ird-am ong Indian States. This section o f socie ty is characterized by a sign ificantly h igher birth rate, low er literacy rate, and less incom es/w ages. The pregnancy rate, that is, the percentage o f eligible wom en pregnant at any time, is 6.1 in the case o f Scheduled C astes as com pared w ith 3.5 fo r the rest o f the population. M ost o f them m ay be above the poverty line, but in com parison with o ther sections o f society, their econom ic upliftm ent rem ains a task to contend w ith. Fam ily planning, education and health are the m ajor issues in the ir case.
Putting th ings together, enhancem ent o f the econom ic w ell-be ing a lready achieved, upgradation o f the quality o f life, im provem ent o f the habitat, care o f the Scheduled C astes, and preservation o f the natural resource base, em erge as the main assignm ents in the context o f rural Punjab, w hich accounts fo r a lm ost tw o-th irds of the s ta te ’s population. The precise tasks can be defined as d iversifica tion o f the rural econom y fo r em ploym ent generation, in particular; d iversification o f the cropping pattern, w ith focus on w ater and soil m anagem ent: im provem ent in the quality o f service provision, especia lly in respect o f health, education, water, e lectric ity and

transport: and upgradation o f the habitat, partly by raising planned residential colonies, on a dem onstration basis.
Active invo lvem ent o f the corporate sector and non-governm ent organizations (NG O s) can be an e ffective m easure fo r th is purpose. Both can play a role in generating awareness about the deve lopm ent program m es and schem es launched by the governm ent; im parting training to the youth fo r se lf-em ploym ent: m anaging natural resources; and prom oting education. The corporate sector can, in addition, assist in m arketing agricultural produce, and providing em ploym ent to the youth trained by them fo r a given vocation.
Above all, an e ffort can be made, on organized lines, to involve non-resident Indians (NR Is) fo r the deve lopm ent o f the ir native villages. Em igration from several parts of Punjab has been an ongoing process fo r long, and m any em igrants have garnered big fortunes in the ir new abodes. The w illing ones am ong them can be encouraged, facilita ted and given incentives fo r adoption o f the ir native places fo r upgradation into ‘m odel v illages ’.
Urban Development and Industry
W ith 34 per cent o f its total population living in tow ns/urban agglom erations in 2001, as com pared to 27.8 per cent a t the national level, Punjab is one o f the m ore urbanized states o f India. The sta te ’s 83 lakh urban population is d istributed am ong 157 tow ns/urban agglom erations-139 statutory and 18 census ones. Fourteen tow ns/urban agg lom erations have a population o f a t least one lakh each, and toge ther account fo r 58.4 per cent o f the total urban population. The urban growth rate o f Punjab, 37.6 per cent during the nineties, w as significantly h igher than 29 per cent at the national level. International experience suggests that urbanization gets a m om entum in regions after they becam e 30 per cent urban and sim ultaneously achieve a per capita incom e o f US $ 500. Punjab has been one such case since1991. Pro jections are that the state would becom e urban m ajority by 2020. This w ould reverse the popular im age o f Punjab as a predom inantly rural entity. The im plication is that urban issues are going to gradually assum e g reater im portance. A change in the th rust o f policy would be inevitable.
Som e redeem ing features o f Punjab ’s urbanization are w orthy o f note. Tow ns are a lm ost uniform ly distributed and closely spaced; their average spacing is about 20 km and th is figure is the low est fo r any state, barring Kerala and Goa. The im pact o f agricu ltura l deve lopm ent and associated agro-based industry is evident.
As an outcom e o f this, Punjab is d istinguished by a strong urban-rura l linkage and a narrow urban-rural gap. In fact, average assets per household in rural areas were recorded as double those in urban places. The proportion o f population below the poverty line, a t around six per cent, is virtually the sam e in rural and urban areas. An urban-rural continuum has been taking shape, w hich is m ost m anifest in the corridor deve lopm ent along the roads connecting big cities, such as Ludhiana, Ja landhar and Am ritsar. A tendency has been am ong several agricu ltura l landow ning households to raise an additional estab lishm ent in a nearby town to avail o f better facilities and services is observed. This is giving rise to a class o f people w hose econom ic in terests are partly rural and partly urban.
D espite som e efforts at control, much o f the physical growth o f tow ns has been taking place in a haphazard m anner. Not only cities but also small and m edium tow ns are subject to th is m alady. A change in the m orphology o f all types o f tow ns has becom e necessary to m eet the increased dem and fo r space fo r new land uses, to

re locate fac ility points to a lternative sites, and to cope w ith the fast increasing num ber o f m otor vehicles on the road. The response is visible in the em ergence of new residential colonies, re-siting o f old grain m arkets and bus stands, and laying out o f bypasses to d ivert inter-town traffic.
Illegal encroachm ent on land is a pervasive m alady in all towns. The affected localities could be com m ercial, residential, institutional, industria l, fo r tha t m atter any. O ne m anifest expression o f th is tendency is the pro liferation o f slum s, m ostly on public land. In 2001, the slum population accounted fo r about one-fifth o f the total living in tow ns, each w ith a population o f 50,000 plus.
W hile s lum s are an index o f scarcity o f form al housing a t an affordab le price, inadequacy o f several o ther basic urban services is no less glaring. Even in the four m unicipal corporations o f Ludhiana, Am rtisar, Ja landhar and Patiala, nearly one-th ird o f the population has no access to safe w ater supply and m ore than one-ha lf have to go w ithout the fac ility o f sewerage. In 32 nagar panchayats, safe w ater supply is not availab le to m ore than one-half o f the population and 95 per cent are not covered by sewerage facility. No less than 40 per cent o f roads and streets in Punjab towns require extensive repairs. This is the picture o f the quality o f life in the tow ns o f the m ost prosperous state o f India!
Financial crunch, w hich the urban local bodies are facing, is at the root o f th is sorry state o f affairs. An extrem ely low recovery rate o f user charges is one m ajor cause o f th is situation. The aggregate incom e o f urban local bodies from w ater supply and sewerage charges during 1996-2001 was only Rs. 201 crores as against the projected figure o f Rs. 1353 crores, tha t is hardly around 15 per cent. Even if only the operation and m aintenance cost w ere taken into account, this percentage would have risen to ju s t 47. Actual expenditure on provision o f all ob ligatory services was found to be only around 40 per cent o f w hat w as projected, w ith serious im plications fo r both quantity and quality.
W hat is the w ay out? Q uality o f life in the tow ns o f Punjab dem ands im m ediate attention. This requires not only a m assive input o f financia l resources, but also serious reform in m anagem ent. Effective im plem entation o f the N agarpalika Act is im perative to achieve that goal. Devolution o f decision m aking and financia l powers to urban local bodies has so fa r been hesitant and piecem eal. Parallel functioning o f the state apparatus and the elected body in m anaging urban affa irs is replete with problem s o f co-ord ination in every town.
Urgent reform in the m anagem ent o f m unicipal finances is called for. M ost essential is to rationalize rates o f user charges and im prove their co llection. Selective invo lvem ent o f the private sector on the lines o f the w ater supply and sewerage project at T irupur (Tamil Nadu); m aintenance o f streetlighting, solid w aste removal and local transport, etc., at Rajkot (G ujarat); solid w aste m anagem ent at Hyderabad: and preparation, d istribution and collection o f bills at Ludhiana, can help in reducing the adm in istrative and financial burden on urban local bodies, in addition to improving the qua lity o f the service provided. ‘Floating o f m unicipal bonds to finance urban infrastructure, as has a lready been done by Ahm adabad, Bangalore, H yderabad and som e o ther m unicipal corporations’, is still ano ther w ay o f augm enting the financial resources o f urban local bodies. Involvem ent o f com m unity-based organisations is also valued today as an effective strategy tow ards the coverage and quality o f service provision.
Perspectives on urban developm ent vary. Som e express their preference fo r aesthetics o f the city, by w ay o f its beautification in d iverse ways. A nothe r paradigm

shifts in favour o f healthy cities, providing high-quality services. Still ano ther view cherishes cities as dynam ic econom ic entities, a ttracting a varie ty o f activities, generating em ploym ent and incomes, and yielding revenues fo r the ir proper m aintenance. A perspective fo r Punjab tow ns can be on sim ilar lines: well designed in physical lay-out, equipped w ith a delivery system o f qua lity services, and prom ising ready em ploym ent, through industry in particular.
The industnal structure o f Punjab has rem arkably expanded in size, d iversified in com position, and d ispersed over space since 1966. Even during the politically d ifficu lt e ighties, the state did not lose its industrial m om entum . A long-term view o f 1966- 2001 shows that the num ber o f sm all-scale units m ultiplied m ore than 25 tim es, from 8,023 to 2,00,603; and large and m edium scale units by m ore than five tim es from 122 to 638. The growth of food processing, cotton ginning, hosiery knitting, metal processing, m achine tools, transport equipm ent, and furn iture production units has been phenom enal indeed. Both small and large/m edium scale units have been d ispersing not only to less industria lized parts o f the state as a positive response to institutional incentives, but also to rural areas w herever infrastructure and accessibility posed less problem s. Around 60 per cent o f the large/m edium scale units in Punjab today find a village location, especia lly along the trunk rail and road routes and around big cities, such as Ludhiana, Ja landhar, Am ritsar, and the Chandigarh Union Territory.
N evertheless, regional d isparities in industria lization persist and the ir degree varies by the type o f industry. Ludhiana, Patiala and R opar d istricts account fo r one-ha lf o f the industrial production in the state. Industries using bulky raw m ateria ls, such as steel reroHing and metal products, or requiring specialized skill, such as hosiery, silk textiles and transport vehicles, showed a w eaker tendency to d isperse. On the o ther hand, d irect consum er goods industries, such as food processing, e lectrica l items, and furn iture have d ispersed w idely. Notably the eastern part o f the state today is overshadow ing its western counterpart, which previously w as m ore industria lized. This is a reversal o f an established spatial pattern explained, am ong o the r factors, by the presence o f a sensitive international border on the w est and the location o f the sta te ’s capital to the east.
Punjab cannot be described as industria lly backward as w as the refrain som e tw enty- five years ago, but there can be no slow ing down on th is front; rather, w hat is needed is acceleration. This is necessary fo r hastening the shift from agricu lture to nonagriculture, by generating new em ploym ent opportunities, and also fo r reducing regional d isparities. W hat is required is a fu rther strengthening o f backw ard and forw ard linkages o f industry w ith agriculture.
Such a schem e o f th ings requires a ‘S W O T (strength, w eakness, opportun ity and threat) analysis o f the industria l scene o f Punjab. The state is strong in agricu ltura l raw m ateria ls, infrastructure base, skilled labour, dynam ic entrepreneursh ip, and h igh-incom e/consum ption level o f the people. On the o ther hand, its w eakness lies in its location on the border w ith an unfriendly country, a peripheral position d istant from m ajor national m arkets, absence o f m inerals, and relative ly low industria l wage rates associated w ith the predom inance of unorganized sm all scale units. A s izeable section o f industria l labour here is m igrant from the low incom e states, such as U ttar Pradech and Bihar. They agree to w ork on low wages, and thereby establish an incom e threshold w hich does not find favour w ith the local labour. This is one o f the reasons which d iscourages the local unem ployed from seeking an industria l job. None the less, opportunities fo r industry are rightly being extended through a varie ty o f governm ent incentives and concessions. But then, the stipulations o f W TO have

recently em erged as a threat to industry in the state. Punjab ’s industry is now facing serious com petition not only from w ithin India, but also from other countries.
Hence, as a perspective fo r an appropriate fram ew ork fo r accelerating the process of industria lization in Punjab, three m easures have becom e essential: (i) identification and phoritization o f those industries fo r which the state is m ore advantageously placed; (ii) m odernization o f the m anagerial style and upgradation o f the technologica l level o f industry, presently entrenched in the cu lture o f unorganized sm all-scale industry: and (iii) provision o f special im petus to inform ation technology, both as a strategy fo r em ploym ent generation, and fo r inform ation d issem ination for usage in industry at large. Industries fo r which the state is favourab ly p laced include; ‘liquor and malt, dairy products, leather goods, b lankets, carpets and rugs, hosiery and readym ade garm ents, cotton ginning, cotton textiles, chem icals, paper items, and wood processing ’.
Beyond th is general overview, there are several o ther critical areas which call for attention. The fo rem ost is to w ork fo r a co-ordinated deve lopm ent o f large, m edium, sm all and tiny industries. This can take several form s; ‘(0 sm all scale industry producing com ponent parts, as in bicycle industry, to be refurbished and assem bled by large scale industry, or the o ther w ay round, as in the case o f com puter assem bling; (ii) large industry helping the sm all industry in technological upgradation and hum an resource developm ent, by provid ing train ing facilities; and (iii) both large and sm all industries co-functioning in industrial parks, equipped w ith modern infrastructure facilities w ith both going in fo r cooperative m arketing and ensuring strict qua lity control and both jo in tly running professional courses fo r train ing the educated unem ployed ’.
The corridor industnai developm ent, proliferating along the trunk routes, calls for special attention. A lthough w elcom e as a dynam ic feature o f industria lization, it is not w ithout som e attendant problem s, particularly those pertain ing to transport mobility, environm enta l quality, and service provision. Industry, along the transport routes, should be m ade to grow in the form o f a cluster rather than a ribbon. Such clusters can be developed on planned lines, in proxim ity o f railway stations on the route o f the corridors. Each cluster can specialize in a particular kind o f industry.
Finally, the basic issue is; How to m ake Punjab investm ent-friend ly fo r industrial deve lopm ent? On strateg ic lines this question can be rephrased as; How to attract the prospective industria list to the state? Involved here are not only factors o f location o f an industry, but also considerations o f the quality o f life a t the place which may a ttract the industria list. Therefore, the m ost e ffective strategy w ould be to raise new p lanned industria l tow ns in the proxim ity of Ludhiana, Jalandhar, Am ritsar, Bathinda and Patiala. These should be equipped w ith first rate infrastructura l facilities for industry and qua lity services fo r daily life. An uninterrupted flow o f e lectric ity is vital fo r such a schem e o f things.
Employment
Providing gainful and high-quality em ploym ent to the unem ployed and new entrants to the labourforce is one o f the main targets o f the Tenth Plan. Though relative ly the m ost progressive and prosperous state o f India, Punjab is not free from the twin m aladies o f unem ploym ent and underem ploym ent. A s izeable section o f the agricu ltura l population is being rendered surp lus due to a regular decline in the size o f landhold ings, a long with the rapid growth o f population. The rural service and artisan castes are finding their vocations inadequate and less rewarding. Educated am ong the rural youth are generally keen to get an urban job. M atters are no better in
urban areas, w here an increasing num ber o f local unem ployed is being joined by unem ployed m igrants from rural areas. The size o f reg isters at em ploym ent exchanges is swelling.
The em ploym ent context o f Punjab sign ificantly changed after its reorganization in the present form in 1966. Agricultural m igration to new ly reclaim ed lands in other parts of India, which has been continuing since the closing decades o f the nineteenth century, virtua lly cam e to a halt. R ecruitm ent in defence forces was regulated on the basis o f the share o f the eligible population in d ifferent states in 1974 and th is w as to the d isadvantage o f Punjab. The num ber o f ex-servicem en, seeking re-em ploym ent, is much larger than the new entrants to the defence forces. M eanwhile, avenues o f em igration to o ther countnes remain regulated.
The National Sam ple O rganisation recorded the unem ploym ent rate o f Punjab at 4.2 per cent in 1999-2000, as against 7.3 per cent in India. By that token, there are around four lakh unem ployed persons in Punjab. The num ber o f the underem ployed is placed at another five lakh, going by the percentage o f m arginal w orkers a t 5.4, as a recorded by the 2001 Census.
The com pound annual growth rate o f em ploym ent in Punjab, during 1997-2002, w as only 0.7 per cent, aga inst the growth rate o f the labourforce at 2.3 per cent. This growth rate o f em ploym ent w as the lowest fo r any State o f India, and m uch below the national average o f 2.4 per cent. A rule-of-thum b- estim ate w ould suggest that the econom ic growth rate, should be three tim es the population growth rate, if unem ploym ent w ere to be taken care of. The annual econom ic growth rate o f Punjab had been in the vicinity o f 3 per cent during the n ineties w hile the population growth rate had been around 1.8 per cent. That explains the hse in unem ploym ent rate over the years, a lthough at a m oderate pace. It also suggests tha t the state m ust aim at an econom ic growth rate o f at least 6 per cent, if the stock and flow o f unem ploym ent is to be m anaged.
U nem ploym ent in Punjab is essentia lly educated in nature, 61.6 per cent being m atriculates o r above. Nearly one-fourth o f them are technically, o r professionally trained, being dip lom a holders, engineers, trained teachers and doctors. Educated unem ploym ent is grow ing faste r in rural than in urban areas. How to generate jobs and how to prepare the educate youth fo r se lf-em ploym ent, is the question to reckon. The typical recom m ended line o f action is d iversification of agricu lture to dairying, pom -culture, bee keeping and fishing. There is a fervent achieve to em ulate Denm ark which during the ninetieth century sw iftly shifted from grain farm ing to dairying, figgery and poultry, as soon as Europe got flooded with grains from North Am erica, A rgentnia and Baltic States (Kahlon, 2001, p.89).
A s m atters stand, it is m ost desirable that the pace o f industria lization should be accelerated. Incentives on this count have produced positive results and need to be continued. Sm all-scale industry is to be preferred in view of its labour-intensive character. W ith 20 per cent o f total industrial investm ent, it accounts fo r 80 per cent o f industria l em ploym ent in the state. As detailed above, its integration w ith large/m edium scale industry is a lso very necessary.
For this, industry m ust find its rightful place in district planning. This requires a m eaningful co-ord ination between d ifferent governm ent departm ents. For exam ple, planting o f trees by the Forest D epartm ent could be linked w ith prom otion o f furn iture m anufacturing by the Industries D epartm ent, fo r the ir utilization in local schools by the Education Departm ent.

Though in an incip ient s tage today, the Inform ation Techno logy ( IT .) industry.has all the potentia l o f rapid growth and can provide quality em ploym ent in large num bers. T h e m anpow er requirem ent fo r th is industry during 2002-2007 has been projected at 90,000. N ow it devo lves upon the G overnm ent o f Punjab to provide fo r tra in ing this num ber o f high qua lity m anpower, w ithin a span o f five years.
C onstruction is another activity which can generate jobs in bulk in both secondary and tertia ry sectors. It would be m ost advisable to go in fo r a ‘new c ity ’ project. This should pre ferably be located in the Doaba region but in close proxim ity to Ludhiana. It could a ttract large investm ent from the NRIs, o ffer jobs in thousands, apart from reducing the pressure on Ludhiana. Revival o f the dorm ant proposal o f R anjitnagar as the site could be considered.
In addition, w e m ight explore som e additional avenues o f em ploym ent in o ther spheres and in d ifferent ways. Considering the relative prosperity and life-style o f the people o f Punjab, there is considerable scope for prom oting fast-food jo in ts on m odern lines. The private sector can additionally be harnessed fo r the provision of security, m aintenance and local transport services on organized lines. In the prim ary sector, introduction o f planters, transplanters and (potato) d iggers m ay tem pt even educated youth to jo in the ir fam ily vocation. For fem ales, we could encourage part- tim e em ploym ent in such divisible jobs, as office work, teaching, and health services.
A bove all, em ploym ent exchanges should not rem ain s im ply registration centres o f the unem ployed. They m ust do the job o f data analysis o f the qualifica tions o f the job -seekers and the kind o f p lacem ents they are looking for. On the o ther hand, the unem ployed youth m ust have greater access to inform ation about the kind o f jobs availab le in the m arket, the level o f education required in each case, and the facility o f loan if one opts to go in fo r se lf-em ploym ent. One potentia l skill in which the educated unem ployed youth can be trained is ‘rural m arketing ’ . C reation o f additional job s in teaching will a lso help.
Education
That Punjab, w hich ranks first in per capita income, is the tenth am ong Indian States in term s o f literacy, is a socio-econom ic anom aly Here is a case o f incongruity betw een econom ic and social d im ensions o f developm ent. In the 2001 Census, 70 per cent o f Punjab ’s seven-p lus population w as recorded as literate as com pared w ith 91 per cent in Kerala and 77 per cent in H imachal Pradesh. The all-Ind ia figure w as 65 per cent.
A snapshot o f education in Punjab is as follows:
• P ractically every village in Punjab has a prim ary school, a m iddle school w ithin 2 kms, a high school w ithin 2.5 kms, and a sen ior secondary school w ithin 7 kms, thus exceeding the norm s set by the G overnm ent o f India. O f the nearly 40 lakh school children, 80 per cent a ttend governm ent schools, h ighlighting the contribution o f governm ent to the spread o f education. No less than 78 per cent o f the children, w ho join a school, drop out by the tim e they reach senior secondary level, and one-ha lf o f those w ho appear in the m atriculation exam ination, as regular students, fail to pass. This is a colossal w aste o f educational e ffort on any count!
• The fast grow ing popularity o f private English m edium schools, m ore so in rural areas, puts a question m ark on the quality o f education provided by governm ent schools.

• W ith six universities (two general, one technical, one m edical, one veterinary, and one agricu ltura l) and 287 colleges o f all types, the state is well served by higher level educational and professional institutions. O ne-th ird o f the colleges are located in rural areas. The num ber o f graduate and postgraduate students approaches two lakh, with fem ales exceeding males. Scheduled Caste students account fo r about one-tenth o f all s tudents in co lleges/universities, whereas the Scheduled Caste population around one- third of the total.
• G overnm ent co lleges account fo r only about one-fifth o f the 223 general ca tegory colleges in the state. M ost o f the engineering colleges are run by the private sector, and m edical colleges by governm ent.
• As m uch as 99 per cent o f the prim ary education budget goes tow ards d isbursem ent o f salaries. The corresponding figures are 90 per cent for secondary education, 71 per cent fo r co llege/un iversity education, and 66 per cent fo r professional institutions. Paltry sums are left fo r infrastructura l facilities.
• The state outlay on education w as 7.2 per cent o f the total under the Fourth Plan (1969-74). It declined to 2.9 per cent in the Ninth Plan (1997-2002). In an effort to redress the aggravating situation, the Tenth Plan (2002-2007) proposals provide an outlay o f 6.1 per cent fo r education.
Im provem ent in the qua lity o f school education, particularly in rural areas, is the m ost crucial item in the sphere o f education in Punjab. The state is saturated, as fa r as the d istribution o f schools is concerned; it is the quality which is in short supply. The Punjab Education Policy 2000: Program m e of Action indicates tha t the governm ent is aw are o f the gravity o f the existing situation. A variety o f necessary proposals to strengthen the infrastructure, upgrade the quality o f teachers, and im prove m anagem ent o f school education has been listed. This augurs well fo r the reform o f school education in Punjab.
W e may, however, review here a m oot suggestion made as part o f the s ta te ’s new education policy. W hile the decision to restructure the present four levels o f school education (prim ary, m iddle, high and senior secondary) to two levels (e lem entary and secondary) is m ost w elcom e, the proposal to upgrade every p rim ary school to e lem entary school does not appear feasible. The purpose o f education w ould be better served if a policy o f consolidation rather than o f expansion, as at present, w as fo llowed. A t the first stage, it would be advisable to upgrade only centra lly located prim ary schools to the level o f e lem entary schools, each o f w hich is surrounded by three already existing prim ary schools. O nly at a later stage, the decis ion about upgradation, or continuation, or closure o f the rem aining prim ary schoo ls could be taken, in the light o f the experience gained.
U nder the new dispensation, it would be advisable if the elected bodies, tha t is, the village panchayats and nagarpalikas, w ere asked to regularly m onitor the function ing o f the schools. The policy docum ent is s ilent on th is issue. M ention has been m ade o f the village- and tow n-level education deve lopm ent com m ittees: absence o f any reference to the e lected local bodies is rather intriguing. In all fa irness, involving the existing institutions is a lways better than creating new ones.
Punjab is no less happily placed in term s o f the num ber o f institu tions o f h igher education, both general and professional. Again, w hile proxim ity is no issue, quality certa inly is. Involved here are m atters relating to in frastructu ra l facilities, professional com m itm ent o f the teachers, and the desired culture o f m anagem ent. Faced w ith a severe resource crunch, the state governm ent has recently been extending w ide

space fo r the entry o f the private sector into h igher education, m ore so in the professional fie ld. To w hat extent is increasing privatization o f h igher education desirable and w hat will be its eventual outcom e? This is not easy to predict. Should we assum e tha t there is little room fo r reform ing h igher education and m aking it cost- e ffective w ithin the public sector? In any case, m anagem ent o f privatization, particularly in h igher education, is a serious obligation o f the governm ent. Equally im portant here is to understand that the quality o f h igher education and that o f school education are interlinked. Teachers, o f all d iscip lines and status, have to come through the channel o f higher education and its quality is a function o f the kind o f students w hich school education produces. It is the ‘quality o f the teacher’ which ultim ately determ ines the quality o f the entire system .
Health
On a lm ost all param eters, the health infrastructure in Punjab has expanded phenom enally since 1966. ‘A new h ierarchy o f health outlets, including referral hospitals, com m unity/prim ary health centres, sub-centres, m other and child care units, and fam ily p lanning clinics has evolved in both rural and urban areas, through public secto r’ . Besides, universities and public sector undertakings too provide health facilities to the ir em ployees.
No less spectacu la r has been the expansion o f the private secto r in health services. ‘Its participation is no longer confined to individual private clinics but extends also to
‘ hospitals, polyclin ics, d iagnostic centres, nursing hom es and specia lty prem ises’. The organized private sector, in addition, caters to the health needs o f its em ployees.
A perusal o f data and inform ation about the health sector in Punjab brings out the follow ing facts:
• During 1966-2001, the num ber o f health institutions in the public sector m ultiplied 4.5 tim es, from 496 to 2,229. This rate o f increase w as three tim es faste r in rural areas than in the urban. M ost rapid growth took placQ during 1973-83, when a large num ber o f sub-centres w ere opened all over the state. A kind o f plateau was reached by 1985. The estab lishm ent o f the Punjab Health System s Corporation in 1996-97, th rough W orld Bank assistance, is a m ajor deve lopm ent o f recent years in this context.
• The availab ility o f m edical and param edical personnel also recorded an im pressive increase: The num ber o f doctors per unit o f population becam e tw ofold , m idw ives six to e ight tim es, and nurses five tim es.
• Ironically, the quality o f health services provided by the governm ent has gone down drastica lly over the years. Only one-th ird o f the outdoor patients now opt fo r a public health outlet, as com pared w ith nearly one-ha lf in India. It is a case o f m anagem ent failure. W hile the popularity o f the public sector su ffered, the private sector started flourishing. U nder the evolved scenario, a new responsibility devolves upon the governm ent. It should m ake every effort to regulate the private sector in term s o f registration, facilities provided, and fees charged.
• The average cost o f outdoor treatm ent per occurrence o f illness in the private secto r is one-th ird h igher than that in the public sector. The cost o f hospita lized treatm ent is 2.5 tim es m ore expensive. The average cost o f trea tm ent per occurrence o f illness in the public sector is roughly one-th ird h igher in Punjab than at the all-Ind ia level.

• The birth rate o f Punjab, at 21.5 per thousand in 1999-2000, w as three tim es the death rate at 7.3 per thousand. A continued thrust on fam ily p lanning is necessary to stabilize the size o f the population.
• Som e d im ensions rem ain worrisom e in the sphere o f reproductive and child health: M aternal m orta lity rate o f 369 per lakh w om en is four tim es that o f Kerala; still-b irth rate at 10 per thousand is h igher than the national average o f eight: about 60 per cent o f the deliveries take place at hom e; and nearly one-fourth o f the children born are underweight. No less than 41 per cent o f the w om en su ffe r from anemia. Punjab’s infant m orta lity rate, at 52, is fo rtunate ly low er than India ’s 68.
• On nutrition, 15 per cent o f adults in Punjab have been reported as obese. This percentage is 30 in the case of wom en, the h ighest fo r any state in the country. On the o ther hand, per capita calorie intake in the state declined by a lm ost one-th ird during 1972-94, while it rem ained static in India. Protein intake has com e down, but fa t intake has risen.
The above discussion confirm s that the situation is not happy on the health front in Punjab. The public sector is not delivering the services on the desired lines. There is increasing d isenchantm ent w ith its perform ance. The private sector is proving effective, but is expensive fo r the poor. Preventive and em ergency health services rem ain the dom ain o f the public sector.
A ffordab ility does not seem to be a m ajor issue in the sphere o f health care in Punjab. It is the access to and quality o f service w hich is more critical. The public and private sectors need to define their respective roles in tha t light. A system can be evolved wherein ‘the public sector concentrates m ore on prim ary health care, health education, sanitation, im m unization, em ergency services and specialized treatm ent and the private sector is encouraged and facilitated to take care o f curative services’. Equally crucial fo r the governm ent is to m anage the private sector properly through its m andatory registration, service m onitoring, and fees regulation.
Infrastructure
As a base and concom itant o f the developm ent process, infrastructure is fa irly well organized in both rural and urban segm ents o f Punjab. On the score o f infrastructure rating, the C entre fo r M onitoring Indian Econom y has placed Punjab on the top; with an index w hich is a lm ost tw ice the national average. No less than 94 per cent o f the net area sown here is irrigated, 75 per cent by tube w ells and 25 per cent by canals. V irtually all the 12,729 villages are not only electrified but also linked by pucca road. The 144 regulated markets, fo r disposal o f agricultural produce, are spaced at an average distance o f 20 km from eacn other, and are a ttached to 519 sub-yards d istributed all around. O ver 40 per cent o f the 2,575 bank branches in the state are located in villages. As m any as 597 rural focal points are being deve loped to provide a varie ty o f services to rural populace.
In overall term s, per capita consum ption o f electrical energy, a t about one thousand kwh, in Punjab is the highest am ong all the states. The total consum ption in 2000- 2001 w as 2717 MW; one-ha lf therm al, one-fourth hydel, and the rem aining one- fourth purchased from the national grid. Agricu lture shared 29 per cent o f the total consum ption, industry 42 per cent, and dom estic and o ther uses 29 per cent. Eighty seven per cent o f the households in the state have e lectric ity connection. Dem and for pow er is growing by seven per cent annually. T ransm ission and distribution losses are placed a t 17 per cent and non-technical losses at ano ther n ine per cent. Losses o f this nature, hidden in the free supply o f e lectric ity to agricu ltura l sector, are

not included in th is assessm ent. Revenue per unit is Rs. 2.07 against the cost o f Rs. 2.93, representing a subsidy of over 40 per cent.
Punjab is well served by a dense network o f roads: 1.1 km fo r every one sq km as com pared w ith 0.4 at the national level. Road length, w hich w as only 6 ,000 kms in 1965-66, had increased to 55,000 kms by 2000-01. Intrastate m obility is prim arily by road; the m ost d istant town is w ithin six hours o f bus jou rney from the sta te capital. High speed tra ins connect Punjab with all parts o f the country. S ince in tracity m obility by rail is o f m odest order, it is all the more necessary to strengthen com plem entarity betw een rail and road transport in Punjab. Notably the state does have an international a irport at Am ritsar and a dom estic one, at Ludhiana.
A bout 26,000 public ca ll/stra ight trunk dialling o ffices connect Punjab not only w ithin but also nationally and globally. The 13 lakh connections give a te lephone/popula tion ratio o f 5.5 per thousand persons as com pared with 3.6 at the a ll-India level. P ractically every panchayat in the state is connected by te lephone.
All this is h ighly creditable. This quantita tive scene is, however, not backed up by a quality culture. E lectricity breakdow ns are not infrequent: e lectric ity in villages is availab le only fo r seven hours in a day; and e lectric ity losses in transm ission and distribution are huge. During the nineties, while the num ber o f m otor vehicles m ultiplied tw o tim es to a lm ost 30 lakh, the road length got extended by hardly 20 per cent. Several roads require im m ediate w idening, or repairs, or both. By com parison, w hile the qua lity o f te lephone service has vastly im proved over the years, its quantita tive coverage is fa r from com plete. The waiting list fo r a phone runs into thousands.
Natural Resource
The natural resource base o f Punjab - land, w ater and vegetation - is under great stress. No less than 85 per cent o f the sta te ’s geographical area is under cultivation, o f which 94 per cent is irrigated. C ropping intensity is as high as 186.
A round 40 per cent o f the land is said to be degraded in varying degrees. Included herein are the gully or ravine lands in the northeastern hilly and subm ontane region; so il-fertility depleted pockets in the central zone; w ater-logged tracts in the southw estern region; and m arshy land along rivers and stream s. Nearly 11 lakh tube w ells (85% in the rural and 15% in urban areas) regularly suck underground w ater fo r irrigation, dom estic, industrial and o ther uses. Nearly one-ha lf o f the deve lopm ent b locks (especia lly in the central zone w here w ater table has gone down by five to ten m etres during the last 25 years) report over-explo itation o f subsoil water. Hardly three per cent o f the total area is under actual fo rest cover. Such a s ituation is a sad com m entary on w hat is happening in an agricu ltura lly progressive state, dependent h ighly on soil and w ater. Added to all th is is the fact tha t a lm ost 70 per cent o f Punjab is prone to floods.
The G overnm ent o f Punjab is putting in considerable e ffort to redeem the situation. W atershed deve lopm ent projects have been undertaken in parts o f the Kandi or subm otane tract; w etlands are being raised on system atic lines in h ighly flood-prone areas; and w ater-logg ing is being tackled in all seriousness in the southw estern region. Depletion of underground w ater and fall in so il-fertility are w orsen ing in the w heat-rice rotation region, which covers a lm ost one-ha lf o f the s ta te ’s total area. D iversification o f the cropping pattern is certa in ly a rem edy; the feasib ility o f developing tube well and canal irrigation, as com plem entary to each o ther in the sam e area, should also be explored. F lood-proneness o f a large part o f Punjab is

paradoxical, but understandable, when one realizes that roads and canals at several p laces have been constructed against the grain of the land and thereby obstruct the natural flow o f w ater. The drains, which are m eant to flush out the rain-water, are o ften poorly m aintained, get choked and cause floods. These dra ins should not only be cleared o f any obstructive material on a regular basis, but also be provided with check dam s placed across at a reasonable distance from each other. This will help in harvesting the rain-water, and thereby recharging the underground water.
Finally, to com pensate fo r the gross inadequacy o f forests in Punjab, agro-forestry and social fo restry continue to be a viable proposition. Agro-forestry should be encouraged in flood-prone and w ater-logged areas; and social fo restry on panchayat lands. G overnm ent should prefer plantation o f sheesham over euca lyptus along roads. Since m any saplings, planted by governm ent agencies, get uprooted due to lack o f proper care, it is essential to involve the local population in th is task. Farmers, w hose lands adjoin the plantation sites, may be asked to provide necessary care. Strategies, o f course, will vary in accordance w ith local conditions.
Concluding Remarks
On the whole, Punjab em erges as a grand success story. Despite the constraint, inherent in its location on an international border w ith an unfriendly country and the challenge posed by m ilitancy dunng the eighties, it has the h ighest per capita income in the country, w as the first to w ork out the green revolution, and is now aheading tow ards a phase o f large-scale agro-industrialization. Evolving in the m ode o f a 'cu ltu re o f com petition ’ , the state is taking tim e to acquire a 'cu ltu re o f co-opera tion ’. Hum an developm ent is yet to reach the expected level. For that m atter, Punjab has not been in a position as yet to realize its full potentia l.
Reference
Chadha, G.K (1986), The State and Rural Economic Transformation: The Case of Punjab, 1950-85, Sage Publication, New Delhi.
Gosal, G.S and Gopal Krishan (1984), Regional Disparities in Levels o f Socio-Economic Development in Punjab, Vishal Publications, Kkurukshetra.
Government of Punjab (1969-2002), Five Year Plans, Fourth to Tenth, Department of Planning, Chandigarh.
Government of Punjab (2002 March), While paper on the State’s Finances, Ministry of Finance, Chandigarh.
Government of Punjab (2002 June), Medium Term Fiscal Program, Department of Finance, Chandigarh.
Johl, S.S and S.K. Ray (2002), Future of Agriculture in Punjab, Centre, for Research in Rural and Industrial Development, Chandigarh.
Kahlon, Gurbhagwant Singh, Dairying and Farm Diversification, Punjab Institute for Sustainable Development, Ludhiana

Chapter 15
STRATEGY FOR DEVELOPMENT
A fte r defin ing the deve lopm ent perspective fo r the state in the light o f issues em anating from its perform ance in d ifferent fie lds, we m ay now spell out som e viable strateg ies fo r the realization o f our vision o f Punjab. S tra tegies in respect o f various sectors have been spelt out in the previous chapter, while deliberating on the issue o f perspective in each case. A restatem ent o f the sam e is deem ed unnecessary. The e ffort here is to suggest strategies, which seep through the entire system , instead o f covering specific sectors.
GOOD GOVERNANCE
A stark reality is that, Punjab, o f recent, has not been in a position to sustain the tem po o f its deve lopm ent process. W here does the fau lt lie? One could single out the ‘lack o f good governance ’ as the real m alefactor. A populist political culture, not-so- e ffic ient bureaucracy, sagging w ork culture, lack o f necessary respect fo r law, and above all, system ic corruption are among the param eters describ ing such a situation. The m alady m ay be nationw ide but that is no reason w hy a progressive state like Punjab should have fallen in line. There are, at the sam e tim e, exam ples o f M aharashtra, Karnataka and Andhra Pradesh doing m uch better in governance, at present.
How to rem edy the situation? How to re invent the governm ent? W hat does good governance involve? In the final analysis, it stands fo r conduct o f the affa irs of the state in such a m anner that it enhances the cred itab ility o f those w ho are at the helm o f a ffa irs at each level; is cost and tim e-effective in responding to the needs and aspirations o f the people; and has civil society as its cherished goal. In addition, it has to prom ote econom y, ensure equity, enhance ecology and provide security.
Three im portant observations w ill be in order here. First, the concept o f governance is not understood properly in developing countries, w here it is equated w ith the idea o f ‘contro l’ . This is not the sp irit o f the term . G overnance is a process by which ‘a society so lves its problem s and m eets its needs by using governm ent as an instrum ent’ (O sborne and G aebler 1992, p .24). W ith governm ent at the core, it encom passes also the role o f the private sector, non-governm ent organ izations and individual households, and thereby involves people in its function ing in a variety o f w ays. This contem porary liberal m eaning o f governance m ust be m ade a part o f popular understanding. Secondly, the m indset o f the personnel in the conduct o f governance is a lso to be transform ed. They m ust not project them selves as providers and benefactors, as they have been doing so far. They have to be in the service of the people and fo r that they have to take som e new lessons. The m ost im portant learning w ould be that ‘good governance is driven by som e grand m ission rather than by rigid rules and regulations. It decentra lizes any activ ity requiring m anagem ent and pre-em pts problem s before these arise; and em pow ers citizens in term s o f control over the ir affa irs and treats them as patrons by offering choices betw een a variety of se rv ices’. Finally, the people at large m ust realize that ‘good governance ’ is their right, ra ther than a gift from the state.
Access to inform ation is a condition of good governance, as a facto r o f em pow erm ent o f the people. It enables them to be subjects and not m ere objects o f developm ent. It
is in th is context that the IT revolution assum es trem endous significance. It m ust serve as an instrum ent o f e-governance, am ong other things.
As such, the role of e-governance requires elaboration. This, o f course, begins with networking o f each o f the adm inistrative centres in the hierarchy. Equally essentia l is to net every panchayat and nagarpalika in the system o f e-governance. No less necessary is it to m ake available details o f deve lopm ent schem es, form s fo r availing opportunities offered by the governm ent, and all o ther inform ation o f public interest, on special w ebsites designed fo r the purpose. W idespread train ing o f a large num ber o f personnel in com puter-use is a prerequisite for prom oting such a culture of governance.
EMPOWERING LOCAL BODIES
How to involve all the stakeholders in the grand task o f good governance? The m ost e ffective strategy would be to strengthen the local-level e lected bodies. This calls for genuine faith in the efficacy of the panchayats (rural) and nagarpalikas (urban), as m andated by the 73th and 74th Constitutional Am endm ents. Much rem ains to be done on this count in Punjab. The firs t necessary step would be to devolve to local bodies all the subjects earm arked fo r them in the sphere o f service provision and deve lopm ent planning and to provide the necessary adm inistrative and technical support fo r the purpose. Local bodies, in the ir own turn, should feel obliged to do the fo llow ing: (i) m onitor the quality o f services, such as school, d ispensary, w ater supply, e lectric ity and link roads, m ade available to the ir locality by the state governm ent: (ii) h ighlight village problem s, such as flooding, w ater-logging, and plant d iseases, so as to draw the attention o f those concerned fo r necessary action; (iii) prepare a b lueprint o f a deve lopm ent plan o f the settlem ent; and (iv) take care o f the natural resource base.
All this is easier said than done. It will not translate into a possibility, let a lone be a reality, until the m em bers o f the panchayats and nagarpalikas are m ade aware of the ir obligations and rights, through w ell-designed train ing program m es on a continuing basis. The knowledge, technical skill and governance capacity o f the peoples’ e lected representatives have to be upgraded fo r ushering in a new era. The task is stupendous, as it has to cover a lm ost one lakh persons o f 12,369 gram panchayats, 140 panchayat samitis, and 17 zila parishads in only the rural segm ent o f the state. Thousands o f e lected m em bers o f nagarpalikas are to be taken care of, in addition. The experience o f involving o f the Centre fo r Research in Rural and Industrial Development, Chandigarh, in this grand talk demonstrates the effective contribution that non-government organizations can m ake in this sphere.
MICRO-LEVEL PLANNING
As a concom itant o f political decentra lization at the grassroots level, a genuine thrust to m icro-level planning, w ith a v illage/town or a b lock or a d istrict as the spatia l unit, has to be an essential ingredient o f any developm ent s trategy fo r Punjab. W hat is visualized is an integration o f plans prepared for individual settlem ents, b locks and districts, through involvem ent o f all the stakeholders. This is not the practice at present. Planning and developm ent still remain a governm ent activity, by and large. As a result, the m asses have acquired a sta te-dependency m indset, to the exclusion o f local enterprise and leadership. A call fo r adopting a ‘genuine ’ m ode o f decentra lized planning is m ade here to reverse th is tendency, so tha t a more m eaningful socio-econom ic transform ation gets under w ay through peaceful m eans.

A m icro-level plan is in the nature o f a b lueprint fo r action. This bears resem blance to building a house w hose design is based on a com prehensive understanding of the site -conditions, prevailing architectural style, financial capacity, and future requirem ents. This analogy should not be carried too far. A m icro-region has an a lready evolved structure, which is to be rem odelled. M icro-level p lanning, thus, com es c loser to restructuring an existing house, with a vision. In actual practice, the job m ay involve the fo llow ing tasks; recom m ending location specific pro jects fo r filling spatia l gaps in the distribution o f infrastructure; suggesting w ays to harness the potentia l and solve the problem s o f the m icro-region; review ing the ongoing schem es and indicating as to which should be m ade to continue, o r be m odified, o r even abandoned, o r w hich should be adopted as new; prom oting schem es in the nature o f se lf-help groups; and identifying special areas o f concern, such as backw ard villages, village com m on-lands, and hazard-prone sites. Such an exercise requires a detailed m apping o f land use, settlem ent system , and infrastructure. It a lso dem ands an insight into the socio-econom ic life, political contours, institutional arrangem ents, aspira tions and constraints o f the people. It presum es a com prehensive and intimate know ledge and appreciation o f local conditions.
Not m uch e ffort is visible on this front. The ground experience is tha t the Additional Deputy C om m issioner, expected to take care o f the deve lopm ent agenda, is som etim es not given charge o f the relevant subject. Such defaults should be taken care of. S im ilarly, the office o f the block developm ent officer, vital a t the local level, is subjected to frequent change o f incum bent. A sense o f continu ity in developm ent p lanning is sim ply lacking. It is essential to fo llow the tenets o f developm ent adm inistration, to m ake m icro-level p lanning effective. M atters are likely to im prove if a block is adm inistered by an officer hailing from the Indian Adm in istra tive Services, under the proposed schem e of having the d istrict and the block as the only two tiers o f adm in istrative areas.
ADMINISTRATIVE AREA REFORM
A close scrutiny o f the adm inistrative m ap o f Punjab, down from the division to the district, tahsil and block level, reveals certa in serious d istortions in the organization of the adm in istrative space. Currently, the state is organised into four d ivisions, 17 d istricts, 72 subdivisions, and 140 deve lopm ent blocks. In 1966, Punjab had two d ivisions, 11 districts, 37 subdivisions/tahsils and 117 deve lopm ent blocks. Despite som e efforts at rationalization, F irozpur d istrict rem ains unw ieldy and Kapurthala fragm ented. Boundaries o f three d istricts and seven subdivisions w ere tam pered with to create Fatehgarh Sahib district. It covers an area which is not m uch b igger than an average subdivision in the state. A periodic adm inistrative area reform, not on an ad hoc but on com prehensive basis, em erges as an essential task fo r the sake o f both adm in istrative e ffic iency and developm ent adm inistration.
There are som e other issues to deliberate. Should the state continue w ith its existing system o f d ivisions, d istricts, subdivisions o r developm ent blocks, o r d ispense with d ivisions and subdivisions and retain only d istricts and deve lopm ent b locks? W hat is the re levance o f a division in a small state like Punjab? Do w e need subdivisions when the average num ber o f deve lopm ent blocks in a d istrict is jus t e ight? M ultiplicity o f tiers in adm inistration generates confusion and creates delays (Krishan and Kant, 1998, p.12).
There is still ano ther m oot point fo r deliberation. Should deve lopm ent b locks continue to rem ain exclusively rural, as they w ere originally designed, or should any town/s fa lling w ithin the ir territorial jurisdiction be also included as part o f the block? The rationale o f keeping rural and urban areas separate in any schem e o f th ings is

difficult to jus tify in the present context. Such a difficulty arises especially when one is preparing a block plan, potential fo r rural-urban agro-industrial com plexes and integrated developm ent. How is this possible if tow ns are to be kept out o f reckoning ? This is not the w ay ground realities operate. A block m ust cover both v illages and tow ns located w ithin its spatial param eters. Such a reform is long overdue.
As a deve lopm ent strategy, there is still another w ay o f reform ing the adm inistrative areas. Let the boundaries o f the state assem bly constituencies and those o f blocks correspond with each other, and likew ise the boundaries o f parliam entary constituencies should find conform ity w ith those o f higher-level adm in istrative units, such as d ivisions or a group of d istricts. An arrangem ent on these lines will render the im perative congruence between political, adm inistrative and developm enta l d im ensions o f the state, at all spatial scales.
CIVIL SOCIETY
Punjab m ust strive at evolving itse lf as a civil society to accom plish all this, and also as an ultim ate goal in itself. The basic strands o f such a society include: a genuine faith in pluralism as inherent in every system ; a reinvented dem ocracy, sensitive equally to aspirations o f the m inority as m uch as o f the m ajority; and the presence of all varieties o f civil groups, which function not m erely in their own interest, but for a collective cause, by influencing the decision m akers. Civil society does not allow the governm ent to be authoritarian, but has no design on its part to be a ‘political equ iva lent o f the private sector’. Its aim is to transform differences into com plem entarities, com petition into co-operation, and d istance into proxim ity. Thereby, it ensures identity, dignity and liberty to every individual (Uberoi, 1999, p. 104). A ‘hum ane future is envis ioned ’, w ith the state as a m ore ‘responsive than repressive ’ agent. Cultivation o f appropriate 'cultural va lues and civic virtues’ is basic to the atta inm ent o f such a goal.
Punjab, as a society, is m arked by a s ignificant degree o f structural stratification and spatial segm entation. Structurally, it d isp lays diversity in term s of religion {Sikh, H indu, Christian, M uslim and others); caste (higher, peasant, artisan, service, and Scheduled ones); and status (landowning or landless and native or inm igrants). The urban and rural back-ground, and also the sub-regional identity o f the Majha, Doaba and Malwa, on traditional lines, represent the spatial param eters o f d istinction. This is the context in w hich the question of civil socie ty in Punjab is to be placed.
Punjab is the only S ikh-m ajority state o f India. W ith 63 per cent o f its population Sikh and 34 per cent Hindu in 1991, the state is essentia lly bi-religious. A happy feature is that the two com m unities have a com m on heritage, shared values, and sim ilar life- practices. A tradition o f honouring each o ther’s religion has always existed.
As a fact o f history, the H indus in Punjab w ere m ore urban-based, and the Sikhs concentrated predom inantly in rural areas; the form er m ore in trade and services and the latter in agriculture. O ver time, a kind o f com plem entarity and in terdependence between the two took shape on econom ic lines. W ith the spread o f education and the recent acceleration in the process o f urbanization, accom panied by m igration from villages to towns, the proportion of S ikhs in urban areas has been enlarging. They have been entering into services, trade, transport, industry and o ther urban vocations in an increasing num ber, particularly a fter the form ation o f Punjab in 1966. This has brought the two com m unities on a m ore interactive com m on space and mutual interdependence, a situation which can facilitate the form ation o f a civil society.

Both the Sikh and the Hindu com m unities have their caste d ivisions. The prim ary one is that betw een the Scheduled Castes and the non-Scheduled ones. It is estim ated that am ong the Scheduled Castes, w ho now account fo r around one-th ird o f the s ta te ’s population, m ore than one-half are Hindu and nearly one-ha lf Sikh. They have to contend w ith com m on issues o f econom ic upliftm ent and social m obility. The factor o f religion gets diluted in the ir case. The task o f w orking tow ards a civil socie ty in ttie state gets sim plified, by bringing the two religious groups onto a com m on space.
A notable feature o f the evolving scene o f Punjab’s dem ography is the sizeable inflow o f m igrants, from the Hindi belt, m ainly as agricultural and industria l labourers. They are integrated econom ically w ith the native society, but to w hat extent are they socia lly linked is a m oot question. Som e chauvin ists view th is trend as disturbing as it will a ffect the electoral ca lcu lations o f those w ith vested interest. M ercifully, such a feeling is not pervasive; certa in ly not expected on the part o f a com m unity w hich itself has sought new pastures, not only w ithin the country but .also in fore ign lands. The intention here is to indicate that we should try to cultivate desired perceptions on this front, in the interest o f the civil society that we envision.
Finally, w hat should be the strategy fo r the realization o f a civil socie ty in Punjab? This objective w ill be best achieved if non-governm enta l o rgan izations are encouraged to play a big role, especia lly in rural areas, by w ay o f organizing people to solve the ir problem s. Such groups tend to be plural in com position and are expected to imbibe values, which are civic in nature. Non-governm ental organ izations, on the ir part, have to learn a great deal from the style o f m issionary institutions. They have to w ork with all dedication. In o ther w ords, w hile working tow ards the goal o f designing a civil society, they m ust com bine education, health, and hum an va lues as part o f the ir activities. Secondly, in recognition o f the fact that the Punjab socie ty is h ighly m ateria listic and pragm atic, it w ill be necessary to dem onstrate that a civil society is in the econom ic interest o f each o f its m em bers. They m ust feel convinced that such a system is ind ispensable fo r protecting and sustain ing the ir relative prosperity. A cost-benefit analysis of conflic t resolution on these lines will change their perceptions fo r the better. Finally, it is not m erely education but its qua lity built through the input o f dedicated teachers as a role model, w hich can facilita te th is process. They are the ones w ho produce the decision m akers, adm inistrators, doctors, engineers, and teachers them selves, am ong others, and influence the overall value system o f a society. C ivil socie ty m ust have the ‘teacher’ at the centre o f its a ll-strategic form ulations.
GENDER SENSITIVITY
An issue m ost critical to the creation o f a civil society in Punjab is to render due status to w om en in the overall schem e o f th ings. Despite its im pressive gains in econom ic deve lopm ent, exposure to the developed world, and spread o f education, the socie ty here is not as jus t to the fa ir sex as expected. By and large, a girl child rem ains unw elcom e at birth and wom en face neglect and d iscrim ination in various form s at d ifferen t stages o f their life. In the first post-independence C ensus o f 1951, P unjab ’s sex ratio, w hich is an indicator o f the very survival rate o f the fem ale, w as only 854; even a fte r fifty years it improved to only 874 in the 2001 Census. These figures are m uch below the sex-ratio at birth o f around 950 and are a pointer to the h igher m orta lity rate o f fem ales. Punjab’s total fertility rate, representing the num ber o f children a w om an is likely to bear in her life-tim e, w as h igher than the national average till 1971. In 1998-99, Punjab’s fem ale infant m orta lity rate, a t 65, was d istinctly above the m ale infant m ortality rate o f 50.

M ost w orrisom e is tlie recent rising incidence o f fem ale foeticide, estim ated at around90,000 a year, in response to the easy accessibility o f the pre-birth sound scanning technique. This is m anifest in a sharp decline in the sex ratio o f 0-6 age group from 875 to 793 during the last intercensal decade o f 1991-2001. Urban and rural areas do not d iffer m uch in this regard, signifying that the practice o f fem ale foeticide is fa irly w idespread. This uncivil propensity, which is an evil device to m arry fam ily planning w ith son-craze, is unpardonable and poses a challenge to be m et w ith effectively.
On the o ther hand, the em erging situation is not w ithout som e positive pointers. The 73rd and 74th Constitutional Am endm ents have mandated reservation o f at least one-th ird o f the seats in panchayats and nagarpalikas fo r wom en. This has certa inly changed conditions in the ir favour, as far as political representation at the local level is concerned. The share o f wom en among governm ent em ployees in the state has gone up from 14 per cent in 1981 to 17 percent in 2001. M ost notably, girls outnum ber and outshine boys on the college and university cam puses in the state.
Much rem ains to be done. A basic task is to instill the value o f the daughter in the son-crazy psyche o f Punjab. One necessary step would be to m ake liberal education universal, w herein gender sensitiv ity is convincingly ingrained as a part o f learning. On pragm atic lines, the issue o f the status o f wom en can be addressed through two strategies; (i) sm all fam ily, wherein they are not to bear large num ber o f children restricting the ir mobility, and (ii) econom ic self-reliance, which gives them a greater leverage in taking life-decisions. As such, promotion o f fam ily p lanning and generation o f w om en-friend ly job opportunities em erge as the two basic steps tow ards the realization o f th is goal.
SUSTAINABLE SOCIETY
Finally, any deve lopm ent s trategy for Punjab has to incorporate the e lem ents o f environm ental, po litico-econom ic and socio-cultural sustainabilities. Environm ental sustainability is assured if the inherent productivity of the ecosystem is not m ade to suffer any loss; rather it is enriched in term s o f its constituents, individually and collectively. This is possible if the life-support system is protected from contam ination o f water, degradation o f land, depletion o f soil fertility, rem oval o f vegetation cover, pollution o f air, and loss o f biodiversity. From the view point o f politico-econom ic sustainability, all such m odes o f production and political institutions are to be prom oted, w hich lead to a h igher level o f econom ic well-being and a llow people to participate in decision m aking relevant to the ir day-to-day life, m utual interaction, and integration w ith the w ider global context. Socio-cultural sustainability is a function o f the freedom w hich people enjoy in pursuit o f happiness, harm ony and justice, as also of fu lfillm ent o f the life-values they cherish.
Punjab is not in a com fortable situation on the question o f m ultifaceted sustainability. Econom ic deve lopm ent' has extracted a heavy ecological price; functioning o f the politico-econom ic system is riddled with infirm ities; and socio-cultura l institutions are under the stress o f moral collapse. The question o f sustainability is rarely raised beyond its econom ic param eters. Ethical questions are described as lacking pragm atism . Traditional culture is losing its sheen. W hat to do and w here to go? How to transform Punjab into a prosperous, good-governed and civil society state on a sustainable basis? That is the question.

The d iscussion in this and the preceding chapter allows us to put toge ther the main strands o f the deve lopm ent strategy for Punjab. These include: rejuvenation o f the socio -econom ic dynam ism o f the state; im provem ent in the quality o f life as well o f habitat in both rural and urban areas; upgradation o f the hum an resource base by im proving the quality o f educational and health services; d iversification o f the econom y from agricu lture to non-agriculture, o f agricu lture tow ard non-farm activities, and o f w heat-rice rotation tow ards ecologically viable crop-com binations; and e ffective m anagem ent o f w ater and soil.
Additional issues pertinent to the deve lopm ent perspective can be listed as: How to m ake Punjab investm ent friendly fo r industry? How the state should be m eeting the challenges posed by globalization o f the econom y, labour-replacing new technologies, and overproductive biotechnology? How to prom ote a cu lture o f taking rational locational decisions, wherein econom ics leads politics rather than politics leading econom ics? An item not to be m issed on any agenda o f a developm ent perspective fo r Punjab relates to raising the ‘status o f w om en ’ in society. In the final analysis, ‘rejuvenation, quality, and m anagem ent’ em erge as the three key ingredients o f reinventing Punjab today.
For years a fte r independence, Punjab effectively dem onstrated that it could lead in the m ode o f a m odel state in India. Today, it is craving to be led fo r full the realization o f its potentia l in the m aking o f a prosperous, ju s t and civil society. The tide will turn only when leaders w ith foresight awaken the state from the s lum ber o f past g lory and create a space fo r new dream s to m anifest.
Reference
Krishan, Gopal and Surya Kant (1998), “Administrative Space” in J.S. Grewal and Indu Banga, Punjab in Prosperity and Violence: 1947-1997, K.K. Publishers, New Delhi.
Osborne, David and Ted Gaebler (1992), Reinventing Government, Prentice Hall of India, New Delhi.
Uberoi, J.P.S. (1999), Religion, Civil Society and the State, Oxford University Press, Calcutta.

Chapter 16
CONCLUSION AND POLICY DIRECTION
T he idea o f p re p a rin g a S ta te D e ve lo p m e n t R e p o rt (S D R ) on P u n ja b fo r the p e rio d 2002- 2 00 7 and , th e re a fte r, d e ve lo p in g an o ve rv ie w in th e fo rm o f V is ion 2 02 0 , is an inn ova tive in itia tive ta ken by the P la nn ing C o m m iss io n o f Ind ia . T he p ro ce ss o f g iv in g e xp re ss io n to th is in itia tive has been e d u c a tiv e and rew ard in g fo r all th o s e w h o have p a rtic ip a te d , as c o n tr ib u to rs and e ven b en e fic ia rie s , b e n e fa c to rs and s ta ke h o ld e rs , w ith w h o m w e have had o ccas ion to in te rac t.
T he a b o ve s ta te m e n t n e e d s to be b rie fly e la b o ra te d by in fo rm in g one and all th a t the c o n tr ib u to rs , n u m b e rin g a ro u n d 16, co m p ris in g the m e m b e rs o f th e fa cu lty , had to u n d e rta ke a rig o ro u s e xe rc ise to go th ro u g h th e rep o rts o f th e P la nn ing C om m iss io n o f Ind ia and o f th e S ta te P la nn ing B oard , P un jab . T he k n o w le d g e and in s ig h t a cq u ire d from th e se sy s te m a tic a lly p re pa re d d o c u m e n ts durin g th e long sp an o f 50 ye a rs w a s found ve ry use fu l. T h is e ffo rt w a s fu rth e r su p p le m e n te d by s tu d y in g a n u m b e r o f o th e r d o c u m e n ts p e rta in in g to th e p ro ce ss o f both p lanned and n o n -p la n n e d d e v e lo p m e n t th a t had ta ke n p lace in P un jab , in the co n te x t o f n a tiona l d e v e lo p m e n t. T he e x e rc is e w as fu rth e r e n rich e d by th e kn ow led ge , in fo rm a tion and e x p e rie n c e o f the o ffic ia ls and e xp e rts w o rk in g fo r th e G o v e rn m e n t o f P un jab , th ro u g h in ten s ive , as w e ll as ex ten s ive , in te ra c tio n s w ith th e m e x te n d in g o v e r a period o f tim e . T h is p ro ce ss co n c lu d e d w ith the b e n e fit o f sh a rin g th e v ie w s e m e rg ing fro m th e se d ive rse in te ra c tio n s , on m ore th a n one o cca s io n , w ith the C h ie f M in is te r o f P un jab , w h o s p e n t c o n s id e ra b le tim e to e n s u re th a t th e s ta te b e n e fits fro m su ch an indep th e xe rc ise ca rried o u t by C R R ID . In vo lve m e n t o f th e s ta ke h o ld e rs , re p re se n tin g a g ricu ltu ra l, ind us tria l and se rv ice se c to rs , w a s pe rce ive d as e q u a lly im p o rta n t and a n u m b e r o f in te ra c tive m e e tin g s w e re o rg a n ize d a t d iffe re n t
p la ces in P u n ja b and a t C h a nd iga rh .
T h is d o c u m e n t has been sp e c ific a lly d e s ig n e d to be a re fe rra l p o in t fo r th o se w h o are co n ce rn e d w ith th e p ro c e s s e s o f d e v e lo p m e n t in P un jab . A b o v e all, th is re p o rt w a s p e rce ive d as an a tte m p t to p ro v id e a b a s ic so u rce o f s y s te m a tic in fo rm a tio n and p ra c tica l a n a lys is o f e ach s e c to r o f d e v e lo p m e n t fo r re se a rch e rs , a d m in is tra to rs , be n e fic ia rie s , b e n e fa c to rs and s ta ke h o ld e rs . It is p ro po sed to c o n tin u e w ith th is exerc ise , even a fte r th e p re se n ta tio n o f th e fina l rep o rt to th e P la nn ing C o m m iss io n , by th e team o f re se a rch e rs w h o h ave co n tr ib u te d to it, by e xa m in in g as w e ll as a n a lys in g a n um be r o f re se a rch a b le issues, w h ich w e re le ft o u t o f th e sco p e o f th e rep o rt, p a rtly b e ca u se o f th e tim e co n s tra in t. T h e in ten tion is to go in to g re a te r d e ta ils and d is s e m in a te the fin d in g s by b ring ing o u t m a jo r p u b lica tio n s on th e d iffe re n t issu e s co n ce rn e d . T h e re a re p la ns a lso to o rg a n ize reg io n a l, n a tiona l and in te rn a tio n a l d e b a te a t h om e and a b roa d to e n la rg e th e p a rtic ip a tio n o f c o n ce rn e d ind iv id ua ls , g ro u p s and p a rtic u la rly N o n -R e s id e n t Ind ians, ds w e ll as in s titu tio n s e ng ag ed in th e s tu d y o f th e Ind ian p e rs p e c tiv e o f d e v e lo p m e n t fo cu s in g on P un jab . T h is is h ow th e lo n g -te rm p e rs p e c tiv e o f d e ve lo p in g c o lla b o ra tiv e re se a rch to fe e d th e p ro cess o f b ila te ra l d e v e lo p m e n t b e tw e en s ta te s and so c ie tie s sha ll g e t s tre n g th e n e d , fo r the b e n e fit o f all th o se s tr iv in g to e n la rg e co n ce rn s

in the fie ld o f h u m a n itie s and soc ia l sc ien ce rese a rch , d ire c te d a t p ro m o tin g in itia tive s to w a rd s pea ce and co -o p e ra tive d eve lo pm e n t.
T h e p re se n t S ta te D e ve lo p m e n t R ep o rt on P u n ja b re fle c ts se ve ra l y e a rs ’ e x p e rie n c e s and e x p e rtis e g a th e re d by th e in te rd isc ip lin a ry te a m o f re se a rch e rs o f C R R ID , w h o have a u th o re d th e s e ch ap te rs . T h e y have w o rke d on a n u m b e r o f re se a rch s tu d ie s o f a m u ltid is c ip lin a ry n a tu re o v e r a period o f tim e durin g th e las t tw o d e ca d e s . T h e se s tu d ie s have a d ire c t b ea ring on th e S ta te D e ve lo p m e n t R eport. S o m e o f th e s e a re d iscu sse d b e low in s u p p o rt o f the a bo ve s ta te m e n t.
T he rese a rch p ro g ra m m e a t C R R ID began w ith th e s tu d y o f th e ‘ Im p a c t o f P la s tic In du s try on R ura l U n e m p lo ym e n t in S m all S ca le R ura l and H o u se h o ld In d u s tr ie s ’ . It rece ive d th e a tte n tio n o f no less a person th an o f th e s ta tu re o f M r B S iva ra m a n , M e m b e r P la nn ing C om m iss io n , w h o w ro te an a rtic le based on th e fin d in g s o f th is s tudy. F urther, th e G o v e rn m e n t o f Ind ia a pp o in te d a co m m itte e u n d e r M r G V K R ao to e xa m in e th e issue o f the use o f p la s tics in irr iga tion and a g ricu ltu ra l se c to rs . T h e o th e r s tu dy , w h ich fo llo w e d the e a rlie r one , w a s on th e ‘ Im p a c t o f M ig ra to ry L a b o u r on th e R ura l E co n o m y o f P u n ja b ’ . It ra ised a n u m b e r o f re s e a rc h a b le s o c io -e c o n o m ic , cu ltu ra l and p o litica l issues, w h ich co n tin u e to be d e b a te d even to d a y . A s h o rt w h ile la ter, a m a jo r p ro g ra m m e o f a m u ltid isc ip lin a ry s tu d y on ‘C o m m u n a lism , C o m m u n a l V io le n ce and its Im p a c t on D e v e lo p m e n t and N a tiona l In te g ra tio n ’ w a s s p o n s o re d by th e N a tiona l In te g ra tio n C ounc il. It had been d es ig n e d to c o n d u c t in te n s ive as w e ll as e x te n s iv e fie ld w o rk in se le c te d r io t-p ron e and rio t-free d is tric ts in se ven s ta te s o f Ind ia , nam e ly , A n d h ra P radesh , B ihar, G u ja ra t, M ad hya P radesh , M ah a ra sh tra , R a ja s th a n and U tta r P ra de sh . T he s tu d y e vo ke d th e co nce rn o f p la nn e rs , a d m in is tra to rs , s c h o la rs and p u b lic lea de rs from all w a lks o f life, resu ltin g in the fo rm a tio n o f fresh p o lic ie s by th e S ta te and th e C en tra l G o v e rn m e n ts fo r m ee ting the v iru s o f c o m m u n a l v io le n ce . U n fo rtu n a te ly , like m an y o th e r n a tio n a lly im p o rta n t issues, th e G o v e rn m e n t o f Ind ia and th e S ta te G o v e rn m e n ts d id n o t back up th is p ro g ra m m e . T he sa m e co u ld be sa id a b o u t th e B o rd e r A re a S tu d y u n d e rta ke n by C R R ID to u n d e rs ta n d th e p ro b le m s and p ro s p e c ts o f th e b o rd e r a re a s o f P un jab , Ja m m u and K a sh m ir and R a ja s tha n . T h e K a rg il e p iso d e h as p roved th a t g a th e rin g o f in te llig e n ce and its fa ilu re , resu ltin g in a d ia lo g u e o f she lls , is no t a s u b s titu te fo r s u p p o rtin g in te rd isc ip lin a ry rese a rch on b o rd e r a re a s th a t b rings o u t the a sp ira tio ns , e xp e c ta tio n s , in a d e q u a te o r s lo w d e v e lo p m e n t, h o s tility and o th e r c a u sa tio n s w h ich find co n tin u in g and u n a b a te d e xp re ss io n in v io le n c e and c o u n te rv io le n ce , o f w h ich in n o ce n t m en, w o m e n and ch ild re n a re th e u ltim a te v ic tim s . A lth o u g h th e s tu d y o f the b o rd e r a reas, like o u r e a rlie r s tu d ie s , w a s e n th u s ia s tic a lly c o m m e n d e d and co m m e n te d upon by th e G o v e rn m e n t o f India and o th e rs c o n c e rn e d w ith th is p ro g ra m m e , su p p o rt fo r its c o n tin u ity w a s no t a ssured .
V ie w e d from th e c o n te x t o f p ro v id ing p o licy inpu ts , as p a rt o f th e co n c lu s io n o f th e S ta te D e v e lo p m e n t R eport, it is im p o rta n t to reco rd he re th e need to s tre n g th e n th e P a nch a ya ti Raj In s titu tion s , se t up u n d e r th e 73 ^ A m e n d m e n t to th e Ind ian C o n s titu tio n , and in s titu tio n s o f loca l s e lf g o v e rn m e n t u n d e r th e 74*^ A m e n d m e n t. T h e im p o rta n c e as w e ll as re le va n ce o f th e se in s titu tio n s has been c ited by D r J a m e s D W o lfe n s o h n , P res iden t, T h e W o rld B ank, in h is F o re w o rd to E ntering the 21^^ C entury: W orld D eve lopm ent Report, 1999/2000, as u n d e r :
L oca liza tio n is p ra ise d fo r ra is ing leve ls o f p a rtic ip a tion and invo lve m e n t, and p ro v id ing p e o p le w ith a g re a te r a b ility to sh a p e th e c o n te x t o f th e ir ow n lives. B y lea d in g to d e ce n tra lize d g o v e rn m e n t w h e re m ore d e c is io n s hap pe n a t su b n a tio n a l leve ls , c lo s e r to th e vo te rs , loca liza tion can resu lt in m ore re sp o n s ive and e ffic ie n t loca l g o ve rn a n ce . N a tiona l g o v e rn m e n ts m ay use a s tra te g y o f d e ce n tra liza tio n to d e fu se c iv il s tr ife o r e ven civil w ar. H ow e ver, w h e n poo rly d e s ig n e d , d e ce n tra liza tio n can re su lt in o v e rb u rd e n e d loca l g o v e rn m e n ts w ith o u t th e re so u rces o r th e c a p a c ity to fu lfil th e ir b as ic re sp o n s ib ilit ie s o f p ro v id ing loca l in fra s tru c tu re and se rv ice s . It can a lso th re a te n m a c ro e c o n o m ic s tab ility , if loca l g o ve rn m e n ts , b o rro w in g h e a v ily and sp e n d in g u nw ise ly , need to be ba iled o u t by the n a tio na l g o ve rn m e n t.
T h e s te p th a t n ee ds to be ta ke n by th e g o ve rn m e n t, w ith o u t los ing tim e and w h ich is g o in g to c o n tr ib u te s u b s ta n tia lly to d e ve lo p m e n t, is th e d ive rs ifica tio n o f a g ricu ltu re . Th-') is o f p a ra m o u n t im p o rta n ce to P un jab . It is and sha ll co n tin u e to rem a in an a g ra rian s ta te , w ith th e d e v e lo p m e n t o f sm a ll-sca le ind us trie s as its b a ckb o n e fo r its fu tu re p ro g re ss . Im p ro v e m e n t o f th e q u a lity o f rura l life is a ch ie va b le th ro u g h th e d e v e lo p m e n t o f ru ra l a re as . It is d e e p ly linked w ith th e fu tu re g ro w th , d e v e lo p m e n t and d ive rs ifica tio n o f a g ric u ltu re and s m a ll-sca le ind ustries . W h ile a g ricu ltu re n e e d s d iv e rs ific a tio n , sm a ll- sca le in d u s trie s need u p g ra d a tio n , both in te rm s o f m a n p o w e r and m a ch in e ry , to ca p tu re th e q u a lity -c o n s c io u s m a rk e t a t h om e and a b roa d . T he o th e r a re a s o f p rio rity a re hum an re so u rce d e v e lo p m e n t and in fo rm a tio n te ch n o lo g y . T he o b se rva tio n s , re co m m e n d a tio n s , s u g g e s tio n s and fin d in g s o f th e a u th o rs o f th e report, base d on bo th p rim a ry and s e c o n d a ry da ta , a re co m p re h e n s iv e e no u g h and d oe s n o t b e a r rep e titio n .
A n o th e r m a jo r a rea th a t n ee ds a c le a r p o licy d irec tio n re la te s to g e n e ra tio n o f e m p lo y m e n t. T he sco p e fo r th is lies in d e ve lo p in g co -o p e ra tiv e s in th e rura l a re a s and d e c e n tra liz e d tra in in g and m a n u fa c tu rin g a c tiv itie s by u p g ra d in g th e sk ills o f a va ilab le m a n p o w e r. T h e m o st im p o rta n t u n ta pp e d a rea fo r g e n e ra tin g e m p lo y m e n t on th e one han d , and e n su rin g s u c c e s s o f th e th ird tie r o f d e m o c ra c y on th e o the r, is a c h ie v a b le by us ing th e e x is tin g s tre n g th o f te a ch e rs , a fte r im p artin g in -se rv ice tra in in g to th e m , to tra in , in tu rn , the e le c te d re p re s e n ta tiv e s o f P a nch a ya ti R aj In s titu tio n s a nd lo ca l se lf- g o v e rn m e n ts . S uch tra in in g is a lre a d y be ing im p arte d , th o u g h in a lim ited w a y a n d a t a h ig h e r co s t, to e n a b le th e e le c te d re p re se n ta tive s p re pa re th e ir m ic ro -p la n s and e nsu re th e ir im p le m e n ta tio n on th e su b je c ts tra n s fe rre d to th em . T h e e x p e rie n c e o f th e C R R ID te a m , e n g a g e d fo r th e p as t se ve ra l ye a rs in rese a rch on th e fu n c tio n in g o f P a n ch a ya ti R aj In s titu tio n s and th e loca l se lf-g o v e rn m e n ts and in th e e d u ca tio n and tra in in g o f th e ir e le c te d re p re se n ta tive s , has e s ta b lish e d the need to ta ke a p o licy d e c is io n in th is v ita l a re a o f d e v e lo p m e n t, w h ich w ill n o t invo lve a n y h ea vy fin a n c ia l b u rde n on th e sta te . In s tead , th is w ill be a m a jo r m ea ns o f im p rov ing g o ve rn a n ce , e m p lo y m e n t c rea tion , re ve n u e g e n e ra tio n and h um an re so u rce d eve lo p m e n t.
A s a lre a d y p o in ted ou t, p ra c tica lly all th e c h a p te rs have p ro v id e d c o n c lu s io n s a n d po licy d ire c tio n s . It m ay, th e re fo re , be a p p ro p ria te no t to len g the n th e s ta te m e n t by a vo id in g u n n e c e s s a ry rep e titio n .
N e ve rth e le ss , th e re a re a fe w a re a s o f p rio rities , w h ich need to be looked in to b y the g o v e rn m e n t. T h e re is the u rg e n t need to p re p a re a d is tric t p lan fo r u rban d e ve lo p m e n t, by in vo lv in g e le c te d re p re s e n ta tiv e s o f loca l se lf-g o ve rn m e n ts , o ffic ia ls , m e m b e rs o f the le g is la tive a s s e m b ly and o f p a rlia m e n t, and expe rts . E q ua lly im p o rta n t is th e p re p a ra tio n

o f a s im ila r p lan fo r th e Z ila P a rish ad co ve rin g th e rura l p op u la tio n . S uch p a rtic ip a tio n in th e p la nn ing p ro ce ss a t d iffe re n t leve ls o f th e po litica l sys te m w o u ld g o a long w a y to w a rd s th e p re p a ra tio n o f a w e ll-co n ce ive d d o c u m e n t fo r th e g o v e rn m e n t fo r p u rsu ing its p rio ritie s and d e ve lo p m e n t. F urther, it w o u ld a lso p ro v id e in fo rm a tio n and a cce ss to e x p e rie n c e , to h e lp g e n e ra te th e fin an c ia l, hum an and in fra s tru c tu ra l re so u rce s w h ich a re th e co n s tra in ts fa ce d by the G o ve rn m e n t o f P unjab.
It is in th is c o n te x t th a t th e te am o f c o n tr ib u to rs and e xp e rts , w h ich has p re pa re d the S ta te D e v e lo p m e n t R eport, has ta ken p a ins to ide n tify u n ta p p e d a re a s fo r ra is ing th e se e sse n tia l re so u rce s . T h is v ita l c o m p o n e n t o f d e v e lo p m e n t h as b e co m e a m a jo r ch a lle n g e , w h e n th e m a rke t is g o ing to be th e d ec is ive e c o n o m ic fa c to r o f p ro g ress . A t th e sa m e tim e , th e IT revo lu tio n p ro v id e s a cce ss to re q u is ite in fo rm a tio n and kn ow led ge to s tre n g th e n hum an reso u rce s as the u ltim a te in s tru m e n t o f d e v e lo p m e n t. O ne can on ly h op e th a t th e S ta te D e ve lo p m e n t R ep o rt w ill co n tr ib u te p o s itiv e ly to w a rd s b u ild ing a new P u n ja b e qu ip p e d to fa ce th e ch a lle n g e s o f new tim es.
In c o n c lu s io n , it m ay be s ta te d th a t P u n ja b has to d e ve lo p a m od e l o f its ow n , based on its lim ited n a tu ra l re so u rce s , a b u n d a n t hum an reso u rces , w id e b ase o f a g ricu ltu re and sm a ll-sca le in d u s trie s and w ith m an y o p p o rtu n itie s a va ila b le in th e fie ld o f In fo rm ation T e c h n o lo g y . A ll the p o te n tia l th a t e x is ts can be rea lized w ith th e he lp o f c le a r po licy d ire c tio n s , w h ich a re req u ired to be g iven to tap th e se re so u rce s . T h e g re a te s t
re s o u rc e o f P u n ja b is the n a tive g en iu s , skill and w o rk c u ltu re o f its p eo p le . O n ce th is is m ob ilize d , th e sky is th e lim it.

VISION OF PUNJAB 2020 - PRESENT, FUTURE AND THE PAST
D r K V e n k a ta s u b ra m a n ia n , M em ber, P lann ing C o m m iss io n and C h a irm a n o f th e p ro ject, S ta te D e v e lo p m e n t R e p o rt (S D R ), from the ve ry b eg in n in g has been p e rs is te n tly p u ttin g fo rw a rd the idea o f the p ro je c tio n o f ‘V is ion 2 0 2 0 ’ as p a rt o f the re p o rt on P un jab . He has a lso p e rso n a lly e xp re sse d th e v ie w th a t the C en tre fo r R e se arch in R ura l and Industria l D e v e lo p m e n t (C R R ID ) as an Ins titu tion , and 1 in m y ind iv id ua l ca p a c ity , m u s t e n su re th a t the re p o rt has a d is tin c t c h a ra c te r ve ry d iffe re n t fro m m an y o th e rs he m ig h t h ave co m e a cro ss . A c tu a lly , th e ch a p te rs in the S D R fo r P u n ja b and a lso m y ow n co n tr ib u tio n do p re s e n t a kind o f lo n g -te rm p e rsp e c tive re fle c ting the p e rce p tive v ie w s o f th e s ch o la rs at C R R ID , w ho have been re sp o n s ib le fo r th is report. A ‘V is io n ’, h ow eve r, is a d iffe re n t m atte r. It is th e d om a in o f a h igh ly se ns itive , d isce rn ing , fa r-s ig h te d and in te lle c tu a lly s u p e rio r m ind. It is no m o d e s ty on m y part to sa y th a t I do n o t m atch up to th is c h a lle n g e o f d isce rn in g the fu tu re o f P un jab , p a rticu la rly in the c o n te x t o f th e s e n s e le s s v io le n ce , th a t th is s ta te has g on e th ro u g h in the no t to o d is ta n t p a s t and th e e n v iro n m e n t o f u n ce rta in tie s p re va iling in the w orld today, ca u g h t in the p ro ce ss o f u n p re ce d e n te d
ch an ge .
T he S D R has sy s te m a tic a lly d e a lt w ith each issue and a rea th a t re q u ire s p rio rity in a cce le ra tin g th e p ro ce ss o f d e v e lo p m e n t and soc ia l tra n s fo rm a tio n o f P u n ja b , in th e se ch a lle n g in g tim es . S uch a p e rcep tion is be ing co n s id e re d w ith in th e fra m e w o rk o f the o p p o rtu n itie s re lea se d as a re su lt o f th e e n a c tm e n t o f th e 73 ^ and 74^^ A m e n d m e n ts to th e Ind ian C o n s titu tio n . Th is has o pe ne d up the p o ss ib ility o f se ttin g th e m a sse s o f th is c o u n try in m otion , as th e y p a rtic ip a te in th e d e v e lo p m e n t p ro ce ss th ro u g h th e ir e le c te d re p re s e n ta tiv e s fro m the g ra ss ro o ts upw ards. T h is b rings in to p la y th e fo lk w isdo m , w h ich is the h e ritag e o f o u r a n c ie n t c iv iliza tion and the so u rce o f o u r e n d u rin g s tren g th .
T h is is p a rticu la rly tru e o f P un jab , w h ich has a lw a ys been a b o rd e r te rr ito ry . T h ro ug h th is land have co m e in to o u r c o u n try p eop le from o th e r lands, o th e r c iv iliza tio n s . T h e y have b ro u g h t w ith th e m d iffe re n t c u s to m s and trad ition s . T he s tu rd y P u n ja b i p ea san t, as he d e fe n d e d h is land, a b so rb e d th e bes t th a t w a s in th e n ew cu ltu re in to h is ow n . T h is g ave h im a v ita lity th a t has h e lped h im e m e rg e as a m a jo r c o n tr ib u to r to th e p ro c e s s o f n a tio n - b u ild ing , based on p lu ra lity and h um an ism . T h is fo un d its fin e s t e x p re s s io n in th e fus ion o f ‘S u fis m ’ and th e tra d itio n a l cu ltu re o f the co un try , c re a tin g o v e r a pe rio d o f fe w ce n tu rie s , new sp iritua l c o n c e p ts o f th e B hakti m o v e m e n t on th e o ne h and and S ikh ism on th e o the r. It is th is u n ive rsa lity o f p e rce p tio n s th a t has g ive n a d is tin c tiv e c h a ra c te r to th e p eo p le o f P un jab , irre sp e c tive o f th e ir re lig io us p e rsu a s io n s . It is th is rich tra d itio n th a t has m a d e th is p a rt o f Ind ia a la b o ra to ry o f th e p ro ce ss o f e co n o m ic , soc ia l and cu ltu ra l tra n s fo rm a tio n , th ro u g h the p a rtic ip a tion o f th e p e o p le in b u ild ing th e ir ow n
d estin y .
T h e p eo p le o f P u n ja b have p ro ved th e ir co u ra g e and re s ilie n ce by res tru c tu ring d e m o c ra c y and s tre n g th e n in g d e m o c ra tic ins titu tio ns from o u t o f th e ch a o s and a n a rch y o f a d e ca d e o f p o litica l v io le n ce and ins tab ility . T h is has o nce a ga in p ro ved th e e nd u ring s tre n g th o f th e sp iritu a l and cu ltu ra l h e ritag e o f P unjab, w h ich is n o t o n ly th e p ride o f its p eo p le , bu t a lso o f the p eop le o f Ind ia . It is th e co lle c tive e x p e rie n c e o f th e se peop le , the k n o w le d g e th e y h ave a cqu ire d o ve r ce n tu rie s and th e ir im a g in a tio n and inn o va tive n e ss , w h ich can co n ju re up the ‘V is ion o f P un jab 2 0 2 0 ’ . W h a t fo llo w s is a s u m m a ry o f the

'V is io n o f P u n ja b - 2 0 2 0 ’, as co nce ive d by m y co lle a g u e s . It c o n s titu te s th e e sse n ce o f th e ir p e rce p tio n , born in th e p ro ce ss o f th e ir p re p a ra tio n o f th is report.
D e v e lo p m e n t o f s tron g in te r-re la tio n sh ip s and in te rd e p e n d e n c e o f P u n ja b w ith the n e ig h b o u rin g s ta te s o f H aryana , H im acha l P ra de sh and Ja m m u and K a s h m ir w ill e nsu re s u s ta in a b ility and co n se rva tio n o f na tu ra l re so u rce s o f all th e s ta te s , v iz ., land, w a te r and b io -d ive rs ity . S c ie n tific a ffo re s ta tio n , fo re s t m a n a g e m e n t and e ffic ie n t use o f w a te r re so u rce s o f th e n e ig h b o u rin g hill s ta te s w ill b e n e fit n o t o n ly th e s e s ta te s bu t a lso P un jab and o th e r s ta te s in te rm s o f add itio na l h yd ro -p o w e r, re d uce d flo o d s , d ro u g h t and soil e ro s io n , re ch a rg e o f d e p le tin g u nd e rg rou n d w a te r ta b le and s ta b iliza tio n o f th e c lim a te . S tro ng in te r-s ta te linka ge s w ill e nsu re e ffe c tive co n se rva tio n o f n a tu ra l reso u rce s and m utu a l and lo n g -te rm b e n e fit fo r the p eo p le o f the reg ion . A s a co n s e q u e n c e , th e nation has a w h o le w o u ld p roper.
L oo k in g to w a rd s 2 02 0 one se es th e la n d sca p e o f P u n ja b d o tte d w ith h igh y ie ld ing , re m u n e ra tive , m a rke t-o rie n te d crops, su p p o rte d by te ch n o lo g ie s th a t e n su re e ffic ie n t use o f inp u ts , land and w a te r re so u rce s fo r o p tim u m p ro du c tion p e r un it a rea. M odern cu ltiva tio n p ro c e d u re s w ill be in pos ition w ith th e use o f a q u a -c u ltu re , p o ly -h o use s , d rip and sp rin k le r irr iga tion , b io -fe rtilize rs and b io -p e s tic id e s , v e rm ic u ltu re , b io -te ch n o lo g y , e tc ., w h ich a re co s t e ffe c tive and he lp in c re a se q u a lity p ro du c tion .
T he c o rp o ra te s e c to r w ill be invo lved in fa rm se rv ice s , m arke tin g , e s ta b lish in g o f p ro ce ss in g and va lu e add itio n un its and d e ve lo p in g d ire c t fo rw a rd -b a c k w a rd linkages b e tw e e n th e cu ltiva to rs and the fa c to ry . S tro ng p ro -a c tive a g ri-re s e a rc h and e x ten s ion p ro g ra m m e s w ill be a ttu n e d to p re se n t and fu tu re re q u ire m e n ts , co up le d w ith g o v e rn m e n t po lic ie s in fa v o u r o f fa rm e rs , fa rm in g and a g ro -in d u s try .
B ased on e x p e rie n c e s and co n ce rn s p e rce ive d fro m p rim a ry as w e ll as se co n d a ry in fo rm a tio n , th e v is ion fo r rura l d e v e lo p m e n t m u s t be v ie w e d as an in teg ra l p a rt o f the d e v e lo p m e n t p ro cess . It w ill be re flec ted in a p os itive ch a n g e in rura l a re as , both in a q u a n tita tiv e and a q u a lita tive sense . T h e re w ill be d ive rs ifie d a g ricu ltu re w ith va lue a d d itio n , ce n t p e r c e n t lite racy, u n ive rsa l a cce ss to hea lth se rv ice s , h ig h e r sk ills fo r e m p lo y m e n t fo r all, the w id e s t d isse m in a tio n o f k n o w le d g e th ro u g h In fo rm ation T e c h n o lo g y , c lo s e r ru ra l-u rba n s ta n d a rd s in soc ia l, e co n o m ic , h um an and p hys ica l in fra s tru c tu re , a rura l s o c ie ty se ns itive to g e n d e r e qu a lity , c e n t p e r ce n t c o v e ra g e and a c c e s s to sa fe d rink in g w a te r, e asy a c ce ss to m ic ro -fin a n c e s fo r u nd e rp riv ile g e d se c tio n s o f th e so c ie ty , tra n s fe r o f fu n d s , fu n c tio n s and fu n c tio n a rie s to PR Is, e m p o w e rm e n t o f P a nch a ya ti Raj In s titu tio n s fo r g ood g o ve rn a n ce , and th e e n v iro n m e n t w ill be p ro tec ted .
In th e s p h e re o f th e d e v e lo p m e n t o f ind us trie s , P un jab w ill fo c u s on va lu e -a d d e d a g ro fo o d p ro ce ss in g , ligh t e ng in ee rin g , h o s ie ry and k n o w le d g e -b a s e d ind us trie s , such as b io -te ch n o lo g y , p h a rm a ce u tica l and e le c tro n ics , a tta in a p os ition o f lea de rsh ip and e x c e lle n c e in p ro d u c in g q u a lity p ro du c ts and e m e rg e as a m a jo r e x p o rte r by 2 02 0 , T he SSI s e c to r w ill be he lped to b ridge th e te c h n o lo g ic a l and m a n a g e m e n t g ap s w ith the a d va n ce d w orld . It w ill acqu ire the cu ltu re o f co n tin u in g in n o va tio n , u p g ra d a tio n and m o d e rn iza tio n and a ch ie ve a c o m p e titive e d g e in th e g loba l m a rk e t and th u s a cce le ra te g ro w th and p ro m o te e m p lo y m e n t and e xpo rts . A n ind ustria l In fra s tru c tu re o f in te rna tion a l s ta n d a rd s w ill be c re a te d by se tting up ind us tria l c lus te rs , p a rks and zo n e s w ith the s ta te -o f- th e -a rt te ch n o lo g y . G o ve rn m e n t w ill o n ly be an e ffe c tive fa c ilita to r and e n a b le r in all th e s e a c tiv ites .

P u n ja b ’s fu tu re is u rban . By 2020, P un jab w ill have a b o u t 45 p e r c e n t u rban p opu la tion o r e ven m ore . W e ll m a n a g e d ‘u rb a n iz a tio n ’ w ill fa c ilita te and su s ta in e c o n o m ic g row th, im p rove se rv ice d e live ry and d eve lo p e n v iro n m e n ta l in fra s tru c tu re to im p ro ve q ua lity o f life. T h e ‘u rban d e v e lo p m e n t s tra te g y ’ w ill p ro m o te good g o v e rn a n c e , p ro v id e 100% co ve ra g e o f b a s ic c iv ic se rv ice s and a d e q u a te h ous ing to th e sh e lte rle s s u rban poor, red uce u rban p o ve rty and e n su re e ffic ie n t m a n a g e m e n t o f m u n ic ip a l a sse ts and d e v e lo p m e n t o f m un ic ip a l lands fo r inco m e g en era tio n .
In a d d itio n , th e re w ill be p ro tec tio n o f u rban e n v iro n m e n t, invo lv in g th e p riva te se c to r fo r low co s t and e ffic ie n t d e live ry o f se rv ices , o fflo a d in g fu n c tio n a l and fisca l resp on s ib ilit ie s ; and p e o p le ’s p a rtic ip a tio n in u rban a ffa irs and a ch a n g e o f cu rre n t p o lic ie s and p rac tices , inc lu d ing lega l and a d m in is tra tive re fo rm s. T he v is ion is o f a s u s ta in a b le d e v e lo p m e n t o f u rban a re as o f P u n ja b by 2 02 0 o r even earlie r. In the sh o rt te rm , th e re w ill be full co ve ra g e o f th e p op u la tio n w ith in fra s tru c tu re and se rv ices , and in th e long te rm , a q u a lita tive im p ro v e m e n t o f u rban bas ic c iv ic se rv ices , e n v iro n m e n t and g o ve rn a n ce .
P o ve rty w ill be s u b s ta n tia lly reduced to m ake c ities p ro ductive . U LB s w ill c re a te p ove rty a lle v ia tion fu n d s to p ro v id e e m p lo ym en t, s e cu rity and o p p o rtu n ity - g o a ls e n v isa g e d in the W orld D eve lopm ent R eport 2000-01 - to c rea te ‘c ities w ith o u t s lu m s ’ and p ro tec t u rban e n v iro n m e n t in the long run. T he p eop le w ill be a c tive p a rtic ip a n ts in m un ic ipa l a ffa irs and th us e n su re the su s ta in a b ility o f c ities . T h e y w ill be invo lved in the p re p a ra tio n o f th e d e v e lo p m e n t p lans to m ee t th e ch a lle n g e s and th e g ro w in g n eeds o f u rban p op u la tio n .
P eop le a re a t c e n te r o f a ny v is ion . In th is co n te x t, the d e m o g ra p h ic s ta tu s is no t an in d e p e n d e n t e n tity and in se p a ra b le from the past. In one sp e c tru m , it flo w s from the cu rre n t d e m o g ra p h ic rea lity in the sta te , w h ile a t the o th e r it is in s e p a ra b ly linked to the overa ll s ta n d a rd s o f liv ing and fa ce ts o f w e lfa re . A g ricu ltu ra l g ro w th , industria l d e ve lo p m e n t, u rb a n iza tio n pa tte rn , e du ca tio na l a tta in m e n t, hea lth s ta tu s , in fra s tru c tu re pos ition , rura l d e v e lo p m e n t and p rov is ion o f b as ic a m e n itie s in th e c o u n try in genera l, and in th e s ta te and its s u rro u n d in g s in p a rticu la r, a re key fa c to rs th a t s h a p e th e v is ion o f th e d e m o g ra p h ic s -d y n a m ic s o f P unjab. W h ile a p p ro a ch e s m ay va ry , th e v is ion o f d e m o g ra p h y fo r a ny reg ion d e p e n d s on se cu rin g in teg ra tion o f o p p o rtu n itie s , a ch iev in g c o n ve rg e n ce o f in te res ts , re sp e c tin g critica l soc ia l and cu ltu ra l d ive rs itie s , rem oving e c o n o m ic b a rrie rs o f p o ve rty and d isparity , a pp ro p ria tin g te c h n o lo g y a nd bu ild ing ca p a c ity in th e soc ie ty .
From th e p e rsp e c tive o f p op u la tio n , the v is ion fo r P u n ja b -2 0 2 0 is w o ve n a ro un d a d e m o g ra p h ic reg im e th a t e n co m p a sse s a c h ie v e m e n t o f re p la c e m e n t leve l o f fe rtility , con tro l o f u n d e r-five m o rta lity p a rticu la rly e xce ss in fan t d ea ths , m ak ing p op u la tio n less m a scu lin e in its co m p o s itio n , red uc tio n o f m a te rna l m orta lity , m e e tin g th e u n m e t need o f co n tra ce p tio n , p ro m o tion o f p a rtic ip a tion o f m en in fa m ily p la nn ing , e n c o u ra g e m e n t o f re sp o n s ib le p a re n th o o d , ra is ing th e leve ls o f ins titu tio na l b irths , c re a tio n o f a ven ue s fo r h ea lthy and p ro d u c tive a ge in g , dove ta iling th e S ch ed u le d C as te p o p u la tio n p ro file into w id e r d e m o g ra p h ic co n to u rs , m a ins tre am ing th e in -m ig ra n ts and s te m m in g th e ze s t fo r in te rna tion a l o u tflo w , rem ova l o f g e n d e r d isp a rity , e tc. H ow e ve r, a ch ie v in g th ese d e m o g ra p h ic g oa ls w ill no t be easy, g iven the w a y th e P un jab i so c ie ty is u nd ergo ing rap id se c to ra l tra n s fo rm a tio n s . N ew c ircu m s ta n ce s a re like ly to p ose fre sh ch a llen ge s. P o pu la tio n red uc tio n and d e c lin e in a ve rag e fa m ily s ize m ay e x a c e rb a te so m e o f the d is to rtio n s a lre a d y v is ib le in th e soc ie ty , and m ay w o rse n th e d e e p -ro o te d son-

p re fe re n ce o f P un jab i so c ie ty . N arrow ing d ow n g e n d e r d iffe re n c e s is an e x tre m e ly co m p lica te d m iss ion , as g e n d e r d isp a rity is g o ing to be v e ry p e rs is te n t in fu tu re , in sp ite o f rise in e du ca tio n , u rb a n iza tio n and p ro sp e rity leve ls . H ence , th e v is io n looks fonward to a s tron g po litica l w ill to b ring a b o u t and d e v ise n e w m e th o d s to u s h e r in co m m u n ity p a rtic ip a tio n a t all leve ls.
P u n ja b is like ly to fa ce n e w e r m orb id ity p a tte rn s e m e rg in g b e ca u se o f ris ing p opu la tion , in -m ig ra tio n , u rb a n iza tio n and ind us tria liza tio n . T h e v is ion o f P un jab , fo r us, g oe s a s tep fu rth e r than the G o v e rn m e n t o f In d ia ’s goa l o f ‘H ea lth fo r AH’ . A d is tin c t v is ion o f hea lth a sp ire s fo r a g e n e ra lly h e a lth y p op u la tio n , fre e fro m th e im p a c t o f co m m u n ic a b le and n o n -c o m m u n ic a b le d ise a se s , w ith c lie n t-fr ie n d ly se rv ic e s a t h ea lth and fa m ily w e lfa re ce n tre s . B e s ide s th e c o n tin u a tio n o f th e usua l p re ve n tive h ea lth ca re m ea su res , the s ta te w ill e nsu re p ro v is io n s fo r th e a va ila b ility o f q u a lity h ea lth ca re se rv ic e s (in c lud ing se c o n d a ry and te rtia ry hea lth ca re se rv ice s) to e ve ryo n e , inc lu d in g th e u nd e rp riv ile ge d . T h e hea lth ca re sys te m o f th e fu tu re w ill be m ore s c ie n tific and te c h n o lo g ic a lly a d va n ce d , w ith a c o m p u te rize d hea lth m a n a g e m e n t in fo rm a tio n s ys te m in p os ition .
E d u ca tio n in P un jab w ill e n c o u ra g e the ch ild to g ro w in to an in d e p e n d e n t, se lf-co n fid e n t, e n te rp ris in g hum an be ing , re a d y to co pe w ith th e s o c io -e c o n o m ic and cu ltu ra l tra n s fo rm a tio n s be ing b ro u g h t a b o u t by a d v a n c e m e n ts in sc ie n ce , te c h n o lo g y a nd the p ro ce ss o f g lo ba lisa tio n . E d uca tio n w ill be c h ild -c e n tre d , fo c u s in g on th e to ta l d e v e lo p m e n t o f th e c h ild ’s p e rson a lity , i.e., e xp a n d in g the m en ta l ag ility , phys ica l d e x te rity and e th ica l in teg rity . E duca tion w ill be jo y fu l, re leva n t, c re a tive , inven tive , e n te rp ris in g and sa tis fy in g lea rn ing ac tiv ity , w h ich in cu lca te s a c o h e re n t and a v iab le v a lu e -s y s te m based on a sc ien tific , d e m o c ra tic and m ora l a p p ro a ch to life. T h is w ill u lt im a te ly lead to a soc ie ty , w h ich is h a rm o n io us , v a lu e -o rie n te d , se cu la r, n o n -d o g m a tic and e c o n o m ic a lly p ro du c tive .
H ig h e r e d u ca tio n w ill see o p p o rtu n itie s fo r le ft-o u t yo u th s (1 7 -2 3 ). In fo rm atio n T e c h n o lo g y w ill be p a rt o f g ra d u a te and p o s t-g ra d u a te leve l co u rse s . H ig h e r e du ca tio n w ill be p ra c tica l, re le va n t to se lf-e m p lo ym e n t, jo b s - and m a rk e t-o rie n te d . D eg re e s w ill be linke d w ith in d u s try and m a rke t n eeds. T h e rura l h ig h e r e d u ca tio n a l in s titu tio n a l b ase w ill be a b le to resp on d to rura l d e ve lo p m e n t.
T h e p ro b le m s o f u n e m p lo y m e n t and u n d e re m p lo y m e n t in th e s ta te a re ca use o f c o n c e rn . T h e y m ig h t h ave se rio u s im p lica tio n s fo r th e fu tu re if n o t p ro p e rly ta ke n ca re of. In th e c irc u m s ta n c e s the v is io n -2 0 2 0 in th e a rea is a P u n ja b w ith e m p lo y m e n t o p p o rtu n itie s to a c c o m m o d a te th e su rp lu s la b o u rfo rce a d e q u a te ly . T he se rious ch a lle n g e o f libe ra liza tion , w ith h ig h e r use o f ca p ita l- in te n s iv e te c h n o lo g y , w ill h ave been m e t w ith th e g ro w th o f e m p lo y m e n t c o m m e n s u ra te w ith th e g ro w th o f th e e c o n o m y itse lf c re a tin g h ig h e r e m p lo y m e n t o p p o rtu n itie s in th e long run. T h e re w ill be s u ffic ie n t e m p lo y m e n t o p p o rtu n itie s to a ch ie ve n e a r fu ll e m p lo y m e n t w ith a b o u t e ig h t p e r ce n t g ro w th ra te o f th e e c o n o m y p e r a nn um c o n s is te n tly . L e ve ls o f in v e s tm e n t and sa v in gs ra te s in th e e c o n o m y w ill be h igh. F inanc ia l, h u m a n and m a te ria l re so u rce s w ill be e ffic ie n tly used , and in th e p ro ce ss a u g m e n t th e m s e lv e s . T h e re w ill be a c c o u n ta b ility and e x e m p la ry p u n ish m e n t fo r a ny lapses in th is resp ec t. G ra s s ro o ts o rg a n iz a tio n s w ill be in c re a s in g ly invo lved and th e p eo p le w ill p a rtic ip a te a t th e loca l leve l in d e c is io n m ak ing fo r ra tiona l use o f reso u rces .
E ve ry w o rke r, w h e th e r in the o rg a n ize d , o r th e u n o rg a n ize d se c to r, w ill be p ro v id e d w ith the b a re m in im u m b as ic n e e d s o f R oti, K apra and M akan , h ea lth and e du ca tio n .

N e ce ssa ry c o n d itio n s w ill have been crea ted to end ch ild labou r. L a b o u r in the
u no rg an ized se c to rs , e s p e c ia lly in a g ricu ltu re , w ill be co ve re d by soc ia l se cu rity . S trike s and locko u ts w ill be re d u ce d to th e m in im um , d esp ite e ve ry w o rk e r b e ing a m e m b e r o f the tra d e un ion , one in each fa c to ry . Its a im w ill be to ra ise th e leve l o f p ro du c tiv ity , p ro du c tion , w h ile look ing a fte r th e w e lfa re o f the w o rke rs . C o lle c tive b a rg a in in g and co nc ilia tion w ill be th e m ain m e th od s fo r the reso lu tion o f co n flic ts b e tw e e n th e e m p lo ye r and e m p lo ye e s . A n e n v iro n m e n t o f m utua l u nd e rs ta n d in g and h a rm o n y b e tw e e n the e m p lo ye r and e m p lo y e e s w ill p reva il. P un jab in 2020 w ill be a m ode l s ta te fo r industria l re la tions.
V is ion 2 02 0 fo r P u n ja b d e m a n d s th e a c h ie ve m e n t o f a K n o w le d g e B a sed S o c ie ty th ro u g h e x te n s iv e use o f In fo rm a tio n te chn o lo gy . It w ill be fu lly d e ve lo p e d and bring s tru c tu ra l c h a n g e s in th e fa b ric o f th e soc ie ty . A s u p e r-h ig h w a y in fra s tru c tu re up to the v illa ge leve l w ill be in p la ce by 2 02 0 , fo r an in teg ra te d and ho lis tic d e v e lo p m e n t fo r the m asse s a t la rge . Q u a lity hum an reso u rce w ill be a va ila b le fo r a k n o w le d g e -b a s e d s o c ie ty and k n o w le d g e -b a s e d ind us try . In fo rm ation T e c h n o lo g y in d u s try in P u n ja b w ill have a s ig n ific a n t sh a re o f th e to ta l IT ind ustry o f Ind ia , th ro u g h w o rld c la ss IT c ity - c e n tre s and S T P s. C o lla b o ra tive e ffo rts o f the ind us try , g o v e rn m e n t a nd th e a ca d e m ia w ill e n su re rap id g ro w th and th e ir co n tin uo us inn ova tion and ch a n g e is im p o rta n t to rem a in co m p e titive in th e g loba l e nv iro n m e n t. G o v e rn m e n t e ffo rts w ill go fa r b e yo n d the m ere c o m p u te riz a tio n o f the g o v e rn m e n t se c to r and in tro du ce lin ka g e s fo r im p rov ing d e live ry ch a n n e ls , in fo rm a tion flo w s and p ro cesse s , a c c e ss ib ility and q u a lity o f in te rac tio n w ith c itizen s , b u s in e ss and the th ird tie r o f d e m o cra cy .
T he u ltim a te v is ion o f P u n ja b in 2 0 2 0 is o f an in teg ra te d , p ea ce fu l so c ie ty , w e ll se t on the path o f o nce a ga in lead ing the nation to w a rd s n ew leve ls o f q u a lity o f life o f its peop le . A s ta te w h ich in te ra c ts c re a tiv e ly and p ro d u c tive ly w ith its n e ig h b o u rs a nd w o rks w ith th e res t o f th e p eo p le o f th e c o u n try as a w ho le , to build a new Ind ia w h ich can face th e w orld w ith e c o n o m ic s tren g th , po litica l s tab ility , s e lf co n fid e n ce and pride . P u n ja b o f the d re a m s o f its p eo p le is an in teg ra l part o f th e ir d re a m s fo r India.
S tr ik in g 'a p e rso n a l note , m y v is ion o f the fu tu re o f m y land is roo ted in m y e xp e rie n ce s , as h is to ry w a s m ad e on th is so il. It began w he n 1 w a s on ly 11 and had to leave a w e ll- p ro v id e d fo r co m fo rta b le life. T he n fo llow ed u nce rta in days, m on ths , even y e a rs o f d is tre ss ca use d by th e p a rtition o f India.
T he im a ge s o f b om b in g , bu rn in g o f houses, rape, loo ting , and m a ss m u rd e rs , in the w a ke o f a fra tric id a l w g r o f b ro th e r k illing b ro the r, h ave been se ared in to m y m ind. T he se h o rrify ing im a g e s w e re b ro u g h t to agon iz ing life in m y m ind by th e h e a rt-re n d in g rep e titio n o f th e sa m e b a rb a rism in th e nam e o f re lig ion in G u jara t, a fte r m ore th a n five d e ca d e s o f b u ild ing a po lity , in w h ich people o f all re lig io ns a re equal.
M y v is ion is born o f th e e xp e rie n ce o f th e se c ta ria n m ilita n cy o f re lig io n -b a se d n a tio na lism th a t rocke d P un jab in th e m id -e igh ties , w ith se n se le ss v io le n ce . L ike the s itu a tio n in Ja m m u and K a s h m ir today, w hich is e q u a lly pa in fu l fo r m e, th e e x p e rie n c e o f P u n ja b to o w a s a co n tin u in g b ack lash o f p ro b le m s crea ted and le ft u n re s o lv e d by o u r fo re ig n ru lers . S im ila r, in a sense , is th e trifu rca tion o f P un jab in 1966 in to th re e s e p a ra te s ta te s and un ion te rr ito ry , w h ich has le ft u n reso lved the issues w h ich led to th is reo rg an iza tio n .

M y ‘V is ion o f P un jab 2 0 2 0 ’ tra n sce n d s na tiona l b o u n d a rie s . W e live in an in teg ra te d w orld . T od ay , h u m a n ity is o u r co nce rn , w h e th e r b u ild in g s in te rc o n n e c tio n s a cross na tiona l b o u n d a rie s o r new po litica l, e conom ic , cu ltu ra l and so c ia l s tru c tu re s a t the g ra ss -ro o ts a t hom e. T he re can be no v is ion , w h ich is no t insp ire d by so c ie ta l co nce rn s .
M y ‘V is ion o f P un jab 2 0 2 0 ’ is a so c io -p o litica l and e c o n o m ic tra n s itio n fo r soc ia l tra n s fo rm a tio n , based on a co m m on nationa l w ill, and hen ce w ith o u t v io le n ce . E co no m ic d e v e lo p m e n t m ea su red in s ta tis tica l num be rs c a n n o t co n s titu te a v is ion . It has to tra n s la te in to th e re s to ra tio n to th e p eop le th e ir cu ltu ra l roo ts , fro m w h ich th e y have been u p roo te d by the c o m p le x p ro cess o f d eve lo pm e n t, u su a lly im p o se d fro m th e top. O u r s tren g th has been and c o n tin u e s to be the u n ify ing c h a ra c te r o f o u r v illa g e cu ltu re . T he te c h n o lo g ic a l revo lu tio n , w h ile o pe n ing up o p p o rtu n itie s o f a w id e r in te rac tio n w ith d ive rse cu ltu re s o f the w orld , ca n n o t tra n sce n d the roo ts o f o u r v e ry be ing . T h e rea lity o f the g lo ba l v illa ge has to be seen from th is sm all p o in t on th e w o rld m ap.
Th is d e m a n d s a sh ift o f fo cu s from m ere g a th e ring o f in fo rm a tio n to a cqu is itio n o f k n o w le d g e and its d isse m in a tio n on a m ass ive sca le , n e v e r p o ss ib le be fo re . T h is is the p ro cess to b ridg e the g u lf b e tw e en the nation and th e s ta te th a t has d e ve lo p e d o ve r the years . T h is is o f v ita l im p o rta n ce fo r P un jab to da y, in se a rch o f its ow n d e s tin y in a new w orld o f m in d -b o g g lin g ch an ge . In such a s itua tion the p re s e n t m u s t d ra w its s treng th from the p a s t to build th e fu tu re . T hen a lo ne can be e n su re d a b a la n ce d overa ll d e v e lo p m e n t o f P un jab , co n trib u tin g to the e m e rg e n ce o f a so c ie ty a t p e a ce w ith itse lf and ca rry in g fonA/ard the rich trad ition o f a p lu ra l, in te g ra te d , se cu la r, d e m o c ra tic soc ie ty , w h ich , to m y w a y o f th ink ing , co n s titu te the ‘V is ion o f P u n ja b 2 0 2 0 ’.
Lau gh in g ch ild re n g lo w in g w ith hea lth , h a p p y m others , fie ld s rip p lin g w ith g o lde n corn , w ire s su rg in g w ith e n e rg y s trun g acro ss to w e rs o f s tee l s ta b b in g in to th e b lue sky, the m us ic o f w h e e ls o f ind ustry , th e rhythm o f hum an lab ou r c re a tin g p len ty , a fe s tiva l o f the tr iu m p h o f hum an e n d e a vo u r. S uch is m y ‘V is ion 2 0 2 0 ’ o f P un jab .
Planning Commission
S . *
lib r a r y

CONTRIBUTORS
Author Chapter
Pawan K um ar Sharm a
R. K. G rover
J.P. Gupta
R. K. G rover
K esar Singh, Sun il B ansa l & Sul<hwinder S ingh
S. S. A garw a l
D.P.S. Sandhu
J.P. Gupta &M ano j K. Teotia
A sw in i K um ar Nanda
R ajesh K um ar A ggaw a l & Kom ila Parth i
K uld ip K au r &B indu D uggal
H im a l C hand &Krishan Chand
S.K. Mangal, S. S. A ga rw a l & San jay Gupta
G opal K rishan
G opal K rishan
R ashpa l M alhotra
R ashpa l M alhotra
P ro file o f D e v e lo p m e n t and C h a n g e
D e v e lo p m e n t and M a n a g e m e n t o f N a tu ra l R e so u rce s
F isca l and F in a n c ia l M a n a g e m e n t
D e v e lo p m e n t o f A g ric u ltu re and A llied S e c to rs
R ura l D e v e lo p m e n t
In du s tria l D e v e lo p m e n t
In fra s tru c tu re D e v e lo p m e n t
U rban D e v e lo p m e n t
D e m o g ra p h ic D e v e lo p m e n t
H ea lth
E d uca tio n
L a b o u r and E m p lo y m e n t
In fo rm a tio n T e c h n o lo g y : G ro w th and
D e v e lo p m e n t S tra te g y
D e v e lo p m e n t P e rs p e c tiv e
S tra te g y fo r D e v e lo p m e n t
C o n c lu s io n s and P o lic y D ire c tio n s
V is io n o f P u n ja b 2 0 2 0 : P re se n t, F u tu re and the P a s t

Project Team
R ash pa l M a lho tra
S. K. M anga l
J. P. G u p ta
R. K. G ro v e r
S. S. A g a rw a l
D. P. S. S a nd h u
G o pa l K risha n
K u ld ip K a u r
A s w in i K u m a r N anda
H im a l C ha nd
K rish a n C ha nd
U. S. R a n g n e k a r
K e s a r S in gh
S a n ja y G up ta
R a je sh K u m a r AgganA/al
S u n il B ansa l
S u k h w in d e r S in gh
B in du D ugga l
M an o j K. T e o tia
P a w an K u m a r S h a rm a
K o m ila P a rth i
M ad an M oh an S ingh
G . S. B h a tia
M o n ica M un jia i
P o o n a m K a u s h ik
S o b h a R an i
R itu S h a rm a
H an s Lai
D ire c to r
S e n io r A d v is e r
S e n io r A d v is e r
A d v is e r
A d v is e r
H o n o ra ry F e llow
S e n io r P ro fe s s o r
A s s o c ia te R e se a rch C o o rd in a to r
A s s o c ia te R e se a rch C o o rd in a to r
A s s o c ia te R e se a rch C o o rd in a to r
S e n io r R e se a rch F e llo w
S e n io r R e se a rch F e llo w
S e n io r R e se a rch F e llo w
S e n io r C o m p u te r P ro g ra m m e r
S e n io r R e se a rch F e llow
S e n io r R e se a rch F e llo w
R e se a rch F e llo w
R e se a rch F e llo w
R e se a rch F e llow
R e se a rch A s s is ta n t
R e se a rch In v e s tig a to r
R e se a rch In v e s tig a to r
R e se a rch F e llow
R e se a rch In v e s tig a to r
R e se a rch In v e s tig a to r
R e se a rch In v e s tig a to r
R e se a rch S c h o la r
F ie ld A s s is ta n t

General and Professional Assistance
Overall AdministrationPriti Real Avinash Gupta Sudarshan Sharma Rajesh Sharma Sandipan Sharma Anita Kesar Gursharan Kaur Parveen Negi
Documentation and LibraryMeena Jatana Suman Khosla Mohinder Verma Suresh Kumar Ashok Kumar
Computer AssistanceAshwini Sharma Anita Gupta Hem Singh Thakur Rita Goal Jagtar Singh Bindu Sharma
Secretarial Assi&tanceRajan Thomas K4eenal Barua
ReprographyBraham Singh Prakash Chand