
An Information Stock Model of Customer Behavior in Multichannel Customer Support Services
33
An Information Stock Model of Customer Behavior in Multichannel Customer Support Services Kinshuk Jerath 1 Assistant Professor of Marketing Tepper School of Business Carnegie Mellon University [email protected] Anuj Kumar Assistant Professor of Information Systems Management Warrington College of Business Administration University of Florida [email protected] Serguei Netessine The Timken Chaired Professor of Global Technology and Innovation Technology and Operations Management Department INSEAD [email protected] 1 The authors are listed in alphabetical order and have contributed equally. They would like to thank Marketing Science Institute and the Wharton Customer Analytics Initiative for generous support for this research. They would also like to thank seminar participants at INSEAD, Indian School of Business, The Crossplatform and Multichannel Consumer Behavior conference organized by the Wharton Customer Analytics Initiative, and the Challenges and Opportunities in Managing IT Enabled Multichannel Operations conference at the University of Florida. 1
-
Upload
independent -
Category
Documents
-
view
1 -
download
0
Transcript of An Information Stock Model of Customer Behavior in Multichannel Customer Support Services

An Information Stock Model of Customer Behavior in Multichannel Customer Support Services
Kinshuk Jerath1
Assistant Professor of Marketing Tepper School of Business Carnegie Mellon University
Anuj Kumar Assistant Professor of Information Systems Management
Warrington College of Business Administration University of Florida
Serguei Netessine The Timken Chaired Professor of Global Technology and Innovation
Technology and Operations Management Department INSEAD
1 The authors are listed in alphabetical order and have contributed equally. They would like to thank Marketing Science Institute and the Wharton Customer Analytics Initiative for generous support for this research. They would also like to thank seminar participants at INSEAD, Indian School of Business, The Crossplatform and Multichannel Consumer Behavior conference organized by the Wharton Customer Analytics Initiative, and the Challenges and Opportunities in Managing IT Enabled Multichannel Operations conference at the University of Florida.
1
Abstract
In this paper, we develop a novel information stock-based model to capture patterns in
customers’ observed behavior in a multichannel customer support setting (e.g., web and phone) using
data of a US-based health insurance firm. In case of a query regarding health insurance coverage or
claims, customers can either call the firm's call center to get the desired information from a call center
representative, or visit the web portal and get the desired information themselves. We model a
customer's observed behavior, in terms of her query frequency and channel choice for queries, as a
stochastic function of her latent information stock. Specifically, we assume that each customer has a
latent “information stock” which is a function of the customer’s “information needs” (which arise
when customers file health insurance claims) and “information gains” (which customers obtain when
they contact the firm's support channels to resolve their queries), and other factors such as seasonal
effects (for instance, queries that arise at the time of annual contract renewal). We estimate our model
on individual customer-level data from the firm. Based on the estimates, we find that the average
information gain for a customer from a telephone call is twice as much as that from visiting the web
portal. In addition, customers prefer the telephone channel for health event-related information needs
but, interestingly, prefer the web portal for seasonal information needs that are typically more
structured. We also find that customers are very heterogeneous in terms of their propensity to use the
web channel, and can be broadly classified into “web avoiders” and “web seekers.” Our model is
general enough to be applicable in other similar multichannel contexts and it can be used to aid in call
center management and staffing decisions as it provides very good out-of-sample predictions for
future query volumes on different channels at the aggregate and individual levels, and it can help to
accurately identify customers who are expected to have high telephone call volumes in the near
future.
Keywords: multichannel customer behavior, customer service, call center, empirical OM, probability
modeling.
2
1 Introduction
Investment into after-sales customer support is crucial for customer satisfaction and, therefore, for
customer retention and loyalty. The most visible example of this is a modern-day call center which,
on average, accounts for approximately 70% of business-to-consumer interactions at a firm
(Mandelbaum 2006). Historically, customer service representatives at call centers responded to
customers’ queries over telephone. However, present day call centers offer a number of advanced
technology-enabled support channels to respond to customers' queries. These support channels fall
into two distinct categories: assisted channels where the firm's representatives assist customers via
telephone, email, short message service (SMS) and web chat, and self-service channels where
customers can find desired information via web-based self-service portals and interactive voice
response (IVR) units.
Our main objective in this paper is to build a statistical model that can capture patterns in
customers' observed behavior in a multichannel customer support setting. Subsequently, the estimated
model can be used as a decision support tool to predict future customer activity at the aggregate as
well as individual levels, to evaluate the relative efficacy of the different customer support channels,
and to gain various other insights into customers' usage of assisted and self-service support channels.
Firms deploy a variety of statistical models to predict and manage call center traffic (see Gans
et al. (2003) for a review). However, most of the predictive models assume query arrival as an
exogenous process and then model the service time to allocate resources optimally. These models
typically do not consider customer channel choice and the interactions among different channels. In
this paper, we develop a novel information need-based framework to model channel choice in a
multichannel customer support setting. The key idea behind the model we propose is that customers
use support channels when they want to resolve queries that arise while using the product. In other
words, a customer's observed channel usage behavior is driven by her latent, i.e., unobservable
information need. Note that we use the term "information need" to refer to anything that induces the
customer to contact the firm. For instance, in one case, a customer might want to understand the
process to file a claim for a certain type of medical service that she has availed for the first time; this
would classify as a query to gather information regarding a process she is unfamiliar with. In another
case, a customer might observe that the reimbursement she received after she filed a claim differed
from her expectation, and she might call the firm to resolve this issue; this would classify as a query
for clarification. In both situations, the customer is calling the firm because, at some level, she needs
information about some details of her health insurance plan. Our model allows us to assess the
customer-perceived values of different support channels from transactional data.
3

Our model is general enough to be applicable in a wide variety of scenarios. In this paper, we
implement the model on data from the call center of a large US-based health insurance firm that
offers web- and telephone-based support to its customers. As mentioned earlier, we assume that, for a
customer, product usage leads to an "information need" and support channel usage leads to an
“information gain” which (possibly only partially) satisfies the information need. We model the latent
“transactional information stock" for a customer at a given time as the composite of her information
needs (which, in our context, arise when customers file health insurance claims) and information
gains (which customers obtain when they contact the firm's support channels to resolve their queries)
up to that time. We assume that a customer's observed channel usage behavior is a realization of a
two-stage stochastic process—a query arrival process followed by a channel choice process—with the
rates of the stochastic processes in both stages dependent on the current information stock of the
customer. Besides the “transactional information stock” described above, we also account for a
"seasonal information stock" to allow for queries that occur due to a time event, such as renewing the
insurance contract or changes in contract terms. We estimate the information stock model on
individual-customer-level data on claims and channel usage.
We note that information stock is a theoretical construct that is useful for capturing key
aspects of consumer behavior. In other words, we do not postulate that consumers actually have such
a stock; rather, we argue that invoking the notion of an information stock is a good way to model
observable consumer behavior because it is plausible and intuitive and, as we show empirically, the
model's performance in terms of in-sample fit and out-of-sample predictions for total queries,
telephone queries, and web queries, is very good. The model's strong empirical performance provides
support for our information stock-based modeling approach. Our model is also able to identify, with
high precision, individual customers who are expected to have high probabilities of making telephone
calls to the firm in the near future. This information can be valuable for the firm. For instance, the
firm can proactively attempt to resolve the queries of such identified customers (say, by making calls
to them in lean traffic periods). This can help the firm to increase customer satisfaction, as well as
reduce some of its peak time call volume, hence reducing the customer service representative costs.
Furthermore, the parameter estimates from our model suggest that, in our setting, the
telephone channel provides three times more information than the web channel. Consequently,
customers tend to prefer the telephone channel over the web portal as their information need
increases. We also account for heterogeneity across customers—we find a high degree of
heterogeneity in query propensities, and find a bipolar distribution of web choice probability
indicating the existence of two distinct customer segments: “web avoiders” and “web seekers.” In
4

terms of generation of information needs, we find that health event-related information needs are, on
average, higher than seasonal information needs.
Our research makes several contributions to the literature. First and foremost, to the best of
our knowledge, ours is the first attempt to take a multichannel customer support setting and model the
customer query arrival and channel choice processes by modeling individual customers' information
needs and gains. This model provides highly accurate predictions of future query behavior both at the
aggregate as well as individual levels. Second, our proposed framework utilizes information as a
common denominator to understand determinants of customers' channel usage, with different sources
contributing to this latent construct. This approach allows call center managers to provide a
quantitative evaluation of the customers' information demand and firms' information supply through
different channels. Third, we provide a practical framework that allows a company, using limited
transactional data on customer product and channel usage (usually captured in today's business
environment), to improve quality of service through better estimation of the query arrival process.
The rest of the paper is organized as follows. In the next section, we discuss the related
literature. In Section 3, we describe our research setting and our data, and conduct a preliminary
analysis to support our modeling approach. In Section 4, we develop our models, and in Section 5 we
present our results. In Section 6, we conclude with managerial implications of our research and
outline future research directions.
2 Related Literature
Our work is primarily related to three streams of literature: customer behavior in a service support
environment, policies for call center optimization, and multichannel customer behavior.
It is of great importance for firms to understand customer behavior in support services (Sousa
and Voss 2006), which has motivated several papers on this topic. Bobbitt and Dabholkar (2001) and
Meuter et al. (2005) explored the determinants of adoption and customer satisfaction for self-service
technology (SST) channels using questionnaires and survey tools to elicit customers' preferences
regarding SSTs. However, they did not consider how adoption of SSTs affects demand for other
available alternative channels. Xue et al. (2007) show that the adoption and usage of various service
channels (tellers, ATM and online banking) offered by a large retail bank depends on demographic
characteristics of customers. Campbell et al. (2010) conduct a field study on the impact of online
banking channel adoption on local branches, IVR, ATMs and call centers. They show that the users
who adopted the online banking channel reduced their dependence on the IVR and the ATM
(substitution effect) but increased their consumption of the firm's call center and local branches
5

(augmentation effect). Kumar and Telang (2012) conducted a controlled experiment to develop an
explanatory model of how customers' web portal usage affects their telephone usage. Their main
findings are that for structured queries, web channel could substitute the demand for telephone
channel, while when the customer searches for unstructured information at the web portal, it leads to
more telephone calls (aggravation effect). In contrast, our primary purpose in the present study is to
build a predictive model of customer multichannel behavior that can accurately predict the demand
for different support channels offered by the firm, at both the aggregate and individual levels. Aksin
et al. (2013), focuses on customers' call abandonment decisions as influenced by their wait times,
rather than on which customer service portal to use. In the present work, we address the question of
customer channel usage by developing a probability model to estimate the relative efficacy of
multiple support channels. Besides providing highly accurate predictions of future activity of
customers, our model also provides insights on customers' multichannel behavior.
Call center optimization is a highly researched topic in Operations Management. However,
most of this work has been done primarily using analytical queuing models (Kleinrock 1975); a
comprehensive review of this research is available in Gans et al. (2003). There is a significant body of
work on data-driven statistical models for predicting call center traffic to aid with staffing and
workforce management decisions (Avramidis et al. 2004, Bassamboo and Zeevi 2009, Brown et al.
2005, Cezik and L'Ecuyer 2008, Mehrotra and Fama 2003, Mehrotra et al. 2010, Shen and Huang
2008, Soyer and Tarimcilar 2008, Taylor 2008, 2012, Weinberg et al. 2007). However, this literature
typically models only telephone call arrivals and often assumes exogenous arrival rates for queries. In
the present work, we model both query arrival and channel choice (with telephone as only one of the
various channels that consumers can use to make queries), and make both of these processes
endogenous to the model by making a customer's observed behavior a stochastic function of the
customer's latent information stock, which is dependent on her history of health events and queries
with the firm. Our approach is related to the recent movement in operations management towards
more accurately modeling consumer behavior in operational models (Netessine and Tang 2009).
Additionally, there are related empirical studies that estimate parameters of the queuing systems in
retail, healthcare and fast food settings (Kim et al. 2013, Lu et al. 2013, Pierson et al. 2011) all of
which, again, only have a single stream of customers.
Recent advances in technology have enabled firms and customers to communicate via
multiple channels; therefore, multichannel customer management has become one of the key
challenges faced by practitioners (Neslin et al. 2006). Management of multichannel support services
has become one of the hottest issues as evidenced by industry surveys, trade publications and
6

discussions with top management; it suffices to visit websites of solutions providers such as
Multichannel Merchant and eGain. Sun and Li (2010) study interactions between on-shore and off-
shore call centers. Marketing scholars have also studied issues in multichannel customer management,
focusing primarily on interactions among different sales channels such as online sales, physical store
sales, catalog sales, etc., (Ansari et al. 2008, Danaher et al. 2003, Deleersnyder et al. 2002, Geykens
et al. 2002, Inman et al. 2004, Knox 2007, Shankar et al. 2003). In contrast, there is relatively little
empirical work on multichannel customer support services. This research is an attempt to start filling
this gap.
3 Research Setting, Data Description and Preliminary Analysis
We study customer behavior at a multichannel call center of a major US health insurance firm. The
firm has a customer base of over three million. Customers purchase annual health insurance plans
from the firm and thereafter utilize the plans to get their medical expenditures reimbursed. During the
health plan usage, customers often have queries regarding their plan coverage, status of claims, etc.,
for which they contact the firm. During the study period, the firm offered support to its customers via
telephone (assisted channel) and web portal (self-service channel). For web portal usage, customers
have to first register at the web portal. Thereafter, they can visit the web portal at their convenience
and obtain information regarding their plan benefits, their claim status, details of participating health
providers, general information on diseases, etc. Interacting with a customer via the web portal costs
the firm an order of magnitude less as compare to interacting via the telephone channel. This is in line
with industry estimates that suggest that, per contact occasion, it costs a typical firm $0.24 on average
to interact with a customer via the web portal, whereas it costs $5.50 on average to interact via
telephone (Kingstone 2006). Therefore, the firm in question, like many other similar firms, is
interested in predicting future load on different channels for more efficient resource allocation by
better understanding the determinants of customer channel choice.
We collected data for a random sample of 2462 customers from the web-registered customer
population of the firm. Roughly 35% of the firm's three million customers were registered to use the
web portal, and these customers account for 64% of the total telephone calls to the firm's call center.
From our discussions with the firm's representatives, we learned that customers who are heavier users
of the insurance service are more likely to register on the web portal and also make significantly more
queries—on average, a non-web registered customer makes 0.53 telephone queries per year, whereas
a web-registered customer makes 1.74 telephone queries and 3.13 web visits per year. In other words,
the web-registered customers are also among the most active in terms of telephone queries, and the
firm is interested in learning the multichannel behavior of these customers. Although the results we 7

present are valid only for the customers who use both the web and the telephone channels, our
modeling framework is generic and it can be applied for customers who have access to only telephone
channel.
For the 2462 customers, we constructed an individual-level dataset covering the 30-month
time period from July 2005 to December 2007 by extracting relevant information from several
disparate databases of the firm. Using the claims processing database of the firm, we collected data on
the date of claim filing, the customer out-of-pocket expenses and the provider charges for each claim.
We extracted telephone usage information, specifically, the date of a telephone call, from the
Automatic Call Distributor (ACD) of the call center. Finally, we extracted web portal usage
information from the web informatics database of the firm. Brief summary statistics on claims and
queries are reported in Table 1.
The key idea behind our modeling approach is that filing claims leads to information needs
for customers, to resolve which they contact support services with queries. This directly implies that,
in our data, the queries should be correlated with the number and severity of claims. Before we
develop the full model, we test for this relationship in the data through a simple analysis. Using the
following fixed-effects model, we regress the total monthly number of queries for customer i on the
monthly number of claims she files, controlling for the other relevant variables that may affect the
number of queries:
𝑄𝑄𝑖𝑖𝑖𝑖 = 𝑎𝑎𝑖𝑖 + 𝑔𝑔𝑖𝑖 + 𝑏𝑏1CLM𝑖𝑖𝑖𝑖 + 𝑏𝑏2CHRG𝑖𝑖𝑖𝑖 + 𝜀𝜀𝑖𝑖𝑖𝑖 (1)
where 𝑖𝑖 ∈ {1,2, … ,2462} denotes the customer, 𝑡𝑡 ∈ {0,1,2, … ,29} denotes the months from July 2005
to December 2007, Qit, CLMit, and CHRGit denote, respectively, the total number of queries, total
number of claims and total claim charges (in thousands of dollars). Customer-level fixed effect (𝑎𝑎𝑖𝑖)
accounts for unobserved differences across customers and month-level fixed-effect (𝑔𝑔𝑖𝑖) control for
seasonal variations in queries. For instance, customers are more likely to call in certain months of the
year, such as during the insurance contract renewal month or during allergy seasons.
The estimate of 𝑏𝑏1 is 0.020 and is statistically significant at the 1% level. This indicates that,
Variable Mean Std Dev Median Min Max No. of web queries 7.82 22.08 1 0 356 No. of telephone queries 4.36 5.38 3 0 42 No. of claims 78.26 69.5 60 0 725
No. of claims with customer out-of-pocket expenses
43.25 40.71 31 0 449
Table 1: Summary Statistics for 2462 Customers for July 2005 to December 2007
8

after controlling for other factors that affect queries, and even though we expect certain amounts of
noise, randomness and heterogeneity in how consumers respond to the information need generated by
claims, the total number of monthly queries is strongly positively correlated with the total number of
monthly claims for customers. This result gives confidence in our modeling approach. The estimate
of 𝑏𝑏2 is 0.004 and is statistically significant at the 5% level. This indicates that queries increase for
claims with higher charges. After obtaining these preliminary reassuring results, we now proceed to
develop our model.
4 Model Development
In this section, we first develop time series and probabilistic benchmark models, and then we develop
our information stock based model.
4.1 Model 1: Time Series Benchmark Model
We first model customers' queries with the following linear fixed-effect time series regression
specification:
𝑄𝑄𝑖𝑖𝑖𝑖𝑖𝑖 = 𝛼𝛼𝑖𝑖 + 𝛾𝛾𝑖𝑖 + 𝛽𝛽1.∑𝐶𝐶𝐶𝐶𝐶𝐶𝑖𝑖𝑖𝑖−1 + 𝛽𝛽2.∑ CHRG𝑖𝑖𝑖𝑖−1 + 𝛽𝛽3.∑𝑄𝑄𝑖𝑖𝑖𝑖𝑖𝑖−1 + 𝜀𝜀𝑖𝑖𝑖𝑖𝑖𝑖 (2)
where 𝑖𝑖 ∈ {1,2, … ,2462} denotes the customer, 𝑗𝑗 ∈ {𝑡𝑡𝑡𝑡𝑡𝑡𝑡𝑡𝑡𝑡ℎ𝑜𝑜𝑜𝑜𝑡𝑡,𝑤𝑤𝑡𝑡𝑏𝑏} denotes the channels of query,
and 𝑡𝑡 ∈ {0,1,2, … ,23} denotes the months from July 2005 to June 2007. In the left hand side of
specification (2), Qijt denotes the total queries made by customer i on channel j in month t. In the right
hand side of specification (2), ∑CLMit-1, ∑CHRGit-1, and ∑Qijt-1 denote, respectively, the cumulative
number of claims, claim charges, and queries of type j till month (t-1) for customer i. The
parameters 𝛼𝛼𝑖𝑖 , and 𝛾𝛾𝑖𝑖 , respectively, capture the customer and month fixed-effects. The customer
fixed-effects account for customer level scale differences in queries and the month fixed-effects
account for the seasonality in queries.
4.2 Model 2: Probabilistic Benchmark Model
Invoking queuing theory-based work (Kleinrock 1975) as well as research on call center management
(Gans et al. 2003), we assume that query arrival at the call center is governed by a Poisson process. In
addition, once the query arrives, customers makes a Bernoulli choice between telephone and web
channel. Let 𝜆𝜆𝑖𝑖0 be the baseline mean query arrival rate and 𝑡𝑡𝑖𝑖0 be the baseline web choice probability
for customer i. We allow for seasonality in both the query arrival rate and the web choice probability.
Accordingly, for customer i in month m, the mean query arrival rate is λ𝑖𝑖𝑖𝑖 = λ𝑖𝑖0exp ( 𝐼𝐼𝑖𝑖) and the
9

web choice probability is 𝑡𝑡𝑖𝑖𝑖𝑖 = 𝑡𝑡𝑖𝑖0exp (𝜋𝜋𝑆𝑆𝐼𝐼𝑚𝑚)
[1−𝑝𝑝𝑖𝑖0+𝑝𝑝𝑖𝑖0exp(𝜋𝜋𝑆𝑆𝐼𝐼𝑚𝑚)], where 𝐼𝐼𝑖𝑖 denotes 24 monthly parameters to
be estimated 𝑚𝑚 ∈ {0, 1, 2, … , 23} (we use 24 months of data for estimation). Let 𝑡𝑡𝑖𝑖𝑖𝑖 be the time of
arrival of the jth query for customer i falling in month m, where j= 1, 2, 3, …, xi represents the
sequence number of queries. The likelihood of the observed xi query arrivals for the customer i if her
jth query comes in month m is:
𝐶𝐶𝑖𝑖 = ∏ 𝜆𝜆𝑖𝑖𝑖𝑖e−𝜆𝜆𝑖𝑖𝑚𝑚�𝑖𝑖𝑖𝑖𝑖𝑖− 𝑖𝑖𝑖𝑖(𝑖𝑖−1) �𝑥𝑥𝑖𝑖𝑖𝑖=1 𝑡𝑡𝑖𝑖𝑖𝑖
𝑦𝑦𝑖𝑖𝑖𝑖 (1 − 𝑡𝑡𝑖𝑖𝑖𝑖)�1−𝑦𝑦𝑖𝑖𝑖𝑖�,
where yij = 1 if the jth query for customer i is a web portal visit and 0 otherwise. For i=1, 2, …, N
customers, the likelihood of the observed web and telephone queries for N customers is:
𝐶𝐶 = ∏ �∏ 𝜆𝜆𝑖𝑖𝑖𝑖e−𝜆𝜆𝑖𝑖𝑚𝑚�𝑖𝑖𝑖𝑖𝑖𝑖− 𝑖𝑖𝑖𝑖(𝑖𝑖−1) �+𝐼𝐼𝑚𝑚𝑥𝑥𝑖𝑖𝑖𝑖=1 𝑡𝑡𝑖𝑖𝑖𝑖
𝑦𝑦𝑖𝑖𝑖𝑖 (1 − 𝑡𝑡𝑖𝑖𝑖𝑖)�1−𝑦𝑦𝑖𝑖𝑖𝑖��𝑁𝑁𝑖𝑖=1 .
In this model, 𝜆𝜆𝑖𝑖0 and 𝑡𝑡𝑖𝑖0 are the latent propensities governing customer i's observed
behavior. Furthermore, different customers may have different latent propensities for their query
processes. Some customers may inherently have the tendency to ask more queries than others from
the firm. Moreover, different customers may have different preferences for the channel to use—for
instance, some customers may be very web savvy and therefore prefer the web channel over
telephone, while older customers may prefer the telephone channel. We allow for unobserved
heterogeneity in customers’ behaviors by allowing the baseline query arrival rates λi0 to be distributed
across customers as gamma distribution and baseline web choice probability pi0 as beta distribution.
Specifically, we assume that 𝜆𝜆𝑖𝑖0~ gamma ( 𝛾𝛾,𝜃𝜃) and 𝑡𝑡𝑖𝑖0~ beta (𝑎𝑎, 𝑏𝑏), i.e.,
𝑓𝑓(𝜆𝜆𝑖𝑖0|𝛾𝛾,𝜃𝜃) = 𝜃𝜃𝛾𝛾 𝜆𝜆𝑖𝑖0(𝛾𝛾−1)𝑒𝑒− 𝜃𝜃𝜆𝜆𝑖𝑖0
𝛤𝛤( 𝜃𝜃) and 𝑓𝑓(𝑡𝑡𝑖𝑖0|𝑎𝑎, 𝑏𝑏) = 𝑝𝑝𝑖𝑖0(𝑎𝑎−1) (1−𝑝𝑝𝑖𝑖0(𝑏𝑏−1))
𝐵𝐵(𝑎𝑎,𝑏𝑏).
Note that we do not observe customer-level characteristics in our data and cannot control for
observed heterogeneity. However, controlling for unobserved heterogeneity as explained above
implies that we control for customer identities. We also note that the above model is equivalent to the
NBD/BB model with covariates (Fader and Hardie 2000, Goodhardt et al. 1984, Jeuland et al. 1980,
Schmittlein et al. 1985).
4.3 Model 3: Information Stock Model
We wish to carefully model the query arrival and channel choice processes for customers. An
effective approach to do this, used widely in the marketing and economics literatures, is by modeling
a latent construct that drives observed behavior. For instance, McFadden (1973) introduced the idea
10

that the latent construct, “utility,” drives the stochastic choice process leading to observed consumer
choice. Moe and Fader (2004) examine consumers' dynamic purchase behavior at an e-commerce
website with a latent visit effect that evolves over visits. Netzer et al. (2008) examine alumni gift-
giving behavior by using a nonhomogeneous hidden Markov model in which donors transition from
one latent relationship state with their university to another.
In a similar vein, we model the observed multichannel behavior of a customer as a stochastic
function of a latent propensity of the customer. This latent construct in our model is the information
stock. We assume that, at any point in time, each customer has an “information stock” which
determines her query frequency and channel choice behaviors. The information stock of a customer,
in turn, is determined by the information needs that arise about the insurance contract as she uses the
insurance plan (for instance, queries about their medical coverage, claim processing procedures, and
operational details of the contract), and the information gain that she obtains upon contacting the firm
through the telephone or the web channels. The model we build falls in the class of probability
models of customer behavior (see Fader and Hardie (2009) for a review). We note that information
stock is a theoretical construct that can be used to model customers’ multichannel query behavior
based on an intuitive and plausible “story” that drives the behavior; we do not imply that customers
actually have such a stock, or that it is an accurate description of how customers make their decisions.
As we show shortly, our modeling approach is a very effective one.
We categorize a customer's information stock into two broad categories, as appropriate for
the setting we model. The first category is transactional information stock, which is determined by
the health events faced by a customer. We assume that each insurance claim filed by the customer (or
by a doctor's office on the customer's behalf) after a health event leads to information need C for the
customer. In other words, with each additional claim, the information need of the customer increases
by C. In order to fulfill her information needs, the customer can approach the firm through its support
channels and receive some information gain from contacting the support channels. We assume that
each web portal visit provides the customer with an information gain W, and each telephone call
provides the customer with an information gain T. These information needs and gains determine her
transactional information stock. It is plausible that the information stock declines with time i.e. a
customer is more likely to make a query pertaining to more recent claims. Therefore, we allow for the
decay of transactional information stock with time. Note that transactional information stock varies
across customers based on the number and timings of claims they file and the queries they make;
however, the values of C, W and T are assumed to be the same for all claims, web visits, and
telephone calls, respectively. 11

The claims filed and queries made by customers over a period can be organized into a set of
sequences, where each sequence contains several claims followed by a query. Consider a customer
denoted by i who receives ni0 claims (1, 2, …, ni0) at time ti01, ti02, …, ti0 ni0 and then makes the first
query at time ti1. We denote the net transactional information stock after the first query for customer i
by Ii1, given by: 𝐼𝐼𝑖𝑖1 = ∑ 𝐶𝐶 𝛿𝛿𝐹𝐹(𝑖𝑖𝑖𝑖0𝑣𝑣, 𝑖𝑖𝑖𝑖1 ) − (𝑦𝑦𝑖𝑖1𝑊𝑊 + (1 − 𝑦𝑦𝑖𝑖1)𝑇𝑇)𝑛𝑛𝑖𝑖0𝑣𝑣=1 , where yi1 = 1 if the first query for
customer i is a web portal visit and 0 otherwise, and 𝐹𝐹(𝑥𝑥1, 𝑥𝑥2) is a function that returns a natural
number that denotes the number of months that have passed between calendar time
𝑥𝑥1 and calendar time 𝑥𝑥2 > 𝑥𝑥1 . The parameter 𝛿𝛿 captures the rate at which the transactional
information stock decays with time. We assume that transactional information stock decays at
monthly intervals, i.e., it remains same within a month but decays by a factor of 𝛿𝛿 for every calendar
month that passes. This decay process for information stock is modeled on the lines of the decay
process often used for “ad stock,” i.e., the cumulative lagged effect of advertising, in the advertising
literature (Broadbent 1979, Danaher et al. 2008, Dube et al. 2005, Gijsenberg 2011). Assume that this
customer makes the jth query at time tij and then makes k claims after the jth query at time tij1, tij2, …,
tijk . Between two queries, several claims are filed by the customer. Let nij be the number of claims that
are filed between the jth and (j+1)th query by customer i. We denote the net transactional information
stock after k claims after the jth query for customer i by Iijk, given by
𝐼𝐼𝑖𝑖𝑖𝑖𝑖𝑖 = ∑ � ∑ 𝐶𝐶 𝛿𝛿𝐹𝐹(𝑖𝑖𝑖𝑖(𝑧𝑧−1)𝑣𝑣, 𝑖𝑖𝑖𝑖𝑖𝑖𝑖𝑖 )𝑛𝑛𝑖𝑖(𝑧𝑧−1)𝑣𝑣=1 − {𝑦𝑦𝑖𝑖𝑖𝑖𝑊𝑊 + (1− 𝑦𝑦𝑖𝑖𝑖𝑖)𝑇𝑇} 𝛿𝛿𝐹𝐹(𝑖𝑖𝑖𝑖𝑧𝑧, 𝑖𝑖𝑖𝑖𝑖𝑖𝑖𝑖 )�+ ∑ 𝐶𝐶 𝛿𝛿𝐹𝐹(𝑖𝑖𝑖𝑖𝑖𝑖𝑣𝑣, 𝑖𝑖𝑖𝑖𝑖𝑖𝑖𝑖 )𝑖𝑖
𝑣𝑣=1𝑖𝑖𝑖𝑖=1 (4)
where yiz = 1 if the zth query for customer i is a web portal visit and 0 otherwise. (For clarity, note that Iij is
the net stock of information need for customer i after her jth query. The customer receives several claims
between her two queries. Iijk denotes the net stock of information need for customer i after k claims after
her jth query, i.e., between her jth and (j+1)th query.) We note that our nomenclature implies that when a
customer experiences an information gain, her transactional information stock reduces, and when she
experiences an information need, her transactional information stock increases.
The dynamics in the transactional information stock are shown in Figure 1 using an example
sequence of events for a customer. For this example, at the beginning of Month 1, the transactional
information stock has the value 0. A claim arrives in the middle of the month at time t01 and the
transactional information stock value becomes C. The value remains the same until time t02 when
another claim arrives and the transactional information stock value becomes 2C. This value remains
until time t1 when customer makes a telephone query and the value becomes 2C-T. When the second
month starts, the transactional information stock decays by the multiplier δ to take the value δ*(2C-
T). The value remains at this level until time t11, when another claim arrives and the transactional
12
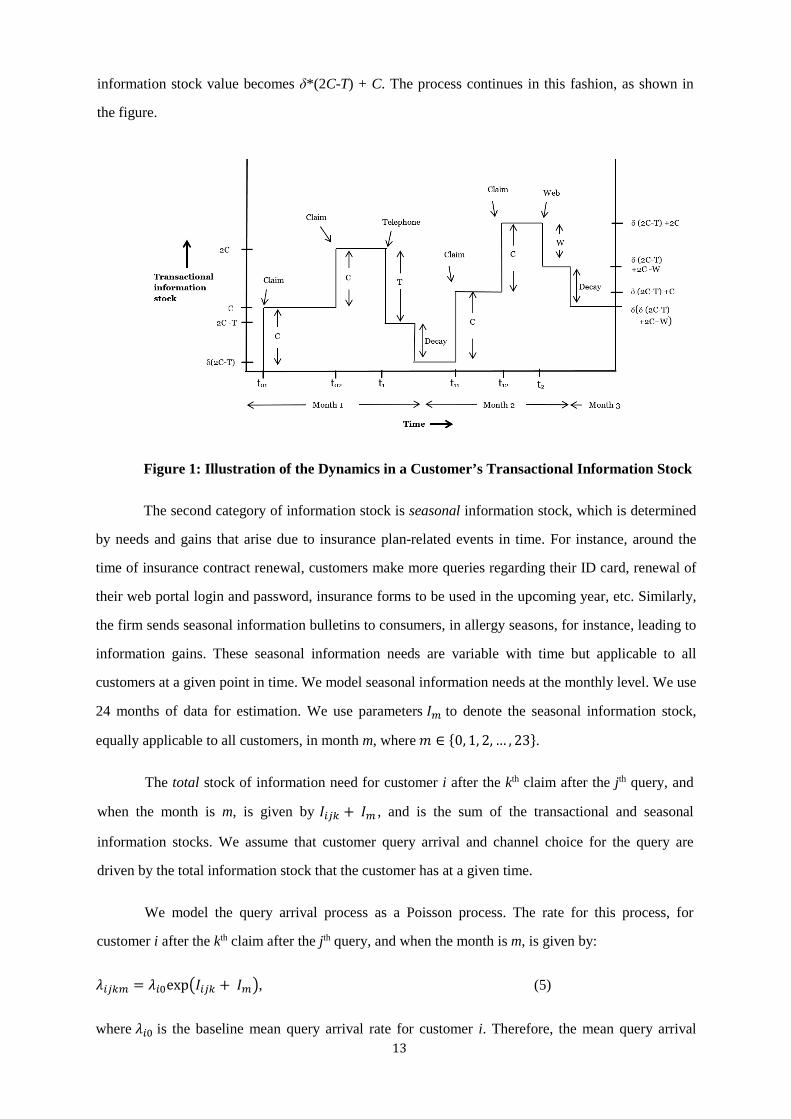
information stock value becomes δ*(2C-T) + C. The process continues in this fashion, as shown in
the figure.
Figure 1: Illustration of the Dynamics in a Customer’s Transactional Information Stock
The second category of information stock is seasonal information stock, which is determined
by needs and gains that arise due to insurance plan-related events in time. For instance, around the
time of insurance contract renewal, customers make more queries regarding their ID card, renewal of
their web portal login and password, insurance forms to be used in the upcoming year, etc. Similarly,
the firm sends seasonal information bulletins to consumers, in allergy seasons, for instance, leading to
information gains. These seasonal information needs are variable with time but applicable to all
customers at a given point in time. We model seasonal information needs at the monthly level. We use
24 months of data for estimation. We use parameters 𝐼𝐼𝑖𝑖 to denote the seasonal information stock,
equally applicable to all customers, in month m, where 𝑚𝑚 ∈ {0, 1, 2, … , 23}.
The total stock of information need for customer i after the kth claim after the jth query, and
when the month is m, is given by 𝐼𝐼𝑖𝑖𝑖𝑖𝑖𝑖 + 𝐼𝐼𝑖𝑖 , and is the sum of the transactional and seasonal
information stocks. We assume that customer query arrival and channel choice for the query are
driven by the total information stock that the customer has at a given time.
We model the query arrival process as a Poisson process. The rate for this process, for
customer i after the kth claim after the jth query, and when the month is m, is given by:
𝜆𝜆𝑖𝑖𝑖𝑖𝑖𝑖𝑖𝑖 = 𝜆𝜆𝑖𝑖0exp �𝐼𝐼𝑖𝑖𝑖𝑖𝑖𝑖 + 𝐼𝐼𝑖𝑖�, (5)
where 𝜆𝜆𝑖𝑖0 is the baseline mean query arrival rate for customer i. Therefore, the mean query arrival 13

rate, 𝜆𝜆𝑖𝑖𝑖𝑖𝑖𝑖𝑖𝑖, will change for a customer with arrival of claims or queries or with a change in month,
i.e., query arrival for a customer is modeled as a non-homogeneous Poisson process with the mean
rate of arrival changing with the customer’s information stock. Note that a higher information stock
denotes a higher information need, which corresponds to a larger query arrival rate.
We assume that, after the customer has decided to make a query, she makes a Bernoulli
choice between using the web and making a telephone call to resolve her query, with a web choice
probability p. Since telephone calls are answered by trained representatives of the firm, it is likely that
when the information need is high, customers prefer making a telephone call. Likewise, it may be
possible that customers prefer the web portal for structured information needs such as seeking
insurance contract-related information, such as applying for a new insurance card. We allow for these
possibilities by modeling the web choice probability, pijm, as a function of the two types of
information stocks. We define the web choice probability for the jth query for customer i, where the jth
query for the customer arrives in month m, as:
𝑡𝑡𝑖𝑖𝑖𝑖𝑖𝑖 = 𝑡𝑡𝑖𝑖0exp (𝜋𝜋𝑇𝑇𝐼𝐼𝑖𝑖𝑖𝑖+𝜋𝜋𝑆𝑆𝐼𝐼𝑚𝑚)
[1−𝑝𝑝𝑖𝑖0+𝑝𝑝𝑖𝑖0exp�𝜋𝜋𝑇𝑇𝐼𝐼𝑖𝑖𝑖𝑖+𝜋𝜋𝑆𝑆𝐼𝐼𝑚𝑚�] , (6)
where, pi0 indicates customer i’s baseline web choice probability independent of information need.
The parameters 𝜋𝜋𝑇𝑇 and 𝜋𝜋𝑆𝑆 are included to make the model flexible by allowing the impacts of the
transactional and seasonal information stocks, respectively, to be different on the channel choice
probability than on the query arrival rate. The values that these parameters take inform us on the
sensitivity of the channel choice probability to the two kinds of information stocks. Note that the
Bernoulli web choice probability pijm for a customer changes with the arrival of claims and queries as
well as with the change of month. (Note that we need channel choice probability only at the time of a
query, and not after every claim, which is why the index k, which denotes claims arriving between
queries in 𝜆𝜆𝑖𝑖𝑖𝑖𝑖𝑖𝑖𝑖, does not appear in the channel choice probability in (6).)
We now develop the likelihood function for the observed data for customer i. For notational
simplicity, we suppress the subscript m for month in the following derivation, i.e., we ignore the
impact of the seasonal information stock and focus on the impact of the transactional information
stock. Incorporating the seasonal information stock via month is straightforward since we only have to
modify the query arrival rate and channel choice probability based on the month at a specific time.
The customer receives ni0 claims (1, 2, …, ni0) at time ti01, ti02, …, ti0 ni0 and then the first query
arrives at time ti1. The processes up to the first query of the customer are: No query up to ti01 at rate
λi00; no query between ti01 and ti02 at rate λi01; … ; no query between ti0(ni0-1) and ti0 ni0 at rate λi0(ni0-1); 14

query arrival at ti1 with rate λi0 ni0 between ti0 ni0 and ti1; channel choice by customer for first query with
web choice probability pi1. Therefore, the likelihood function for customer i up to the first query is:
𝐶𝐶𝑖𝑖1 = 𝑡𝑡∑ −𝜆𝜆𝑖𝑖0𝑢𝑢�𝑖𝑖𝑖𝑖0(𝑢𝑢+1)−𝑖𝑖𝑖𝑖0𝑢𝑢�𝑛𝑛𝑖𝑖0−1𝑢𝑢=0 × 𝜆𝜆𝑖𝑖0𝑛𝑛𝑖𝑖0𝑡𝑡
−𝜆𝜆𝑖𝑖0𝑛𝑛𝑖𝑖0�𝑖𝑖𝑖𝑖1−𝑖𝑖𝑖𝑖0𝑛𝑛𝑖𝑖0� × 𝑡𝑡𝑖𝑖1𝑦𝑦𝑖𝑖1 (1 − 𝑡𝑡𝑖𝑖1)(1−𝑦𝑦𝑖𝑖1),
where yi1 = 1 if the first query for customer i is a web portal visit and 0 otherwise.
The customer receives a total of xi queries with niz claims between zth and (z+1)th query, where
z=0, 1, 2, …, (xi-1). The customer i receives gi claims after the xith query till the end of our period of
observation (tend), which is the same for all customers. The total likelihood function for customer i is:
𝐶𝐶𝑖𝑖 = ∏ �𝑡𝑡−�∑ 𝜆𝜆𝑖𝑖𝑧𝑧𝑢𝑢�𝑖𝑖𝑖𝑖𝑧𝑧(𝑢𝑢+1)−𝑖𝑖𝑖𝑖𝑧𝑧𝑢𝑢�𝑛𝑛𝑖𝑖𝑧𝑧−1𝑢𝑢=0 � × 𝜆𝜆𝑖𝑖𝑖𝑖𝑛𝑛𝑖𝑖𝑧𝑧𝑡𝑡
−𝜆𝜆𝑖𝑖𝑧𝑧𝑛𝑛𝑖𝑖𝑧𝑧�𝑖𝑖𝑖𝑖(𝑧𝑧+1)−𝑖𝑖𝑖𝑖𝑧𝑧𝑛𝑛𝑖𝑖𝑧𝑧�𝑥𝑥𝑖𝑖−1𝑖𝑖=0 × 𝑡𝑡𝑖𝑖(𝑖𝑖+1)
𝑦𝑦𝑖𝑖(𝑧𝑧+1) (1 −
𝑡𝑡𝑖𝑖(𝑖𝑖+1))(1−𝑦𝑦𝑖𝑖(𝑧𝑧+1))� × 𝑡𝑡∑ −𝜆𝜆𝑖𝑖𝑥𝑥𝑖𝑖𝑢𝑢�𝑖𝑖𝑖𝑖𝑥𝑥𝑖𝑖(𝑢𝑢+1)−𝑖𝑖𝑖𝑖𝑥𝑥𝑖𝑖𝑢𝑢�𝑔𝑔𝑖𝑖𝑢𝑢=0 , (7)
where tix𝑖𝑖(g𝑖𝑖+1) = 𝑡𝑡end.
For i=1, 2, …, N customers, the likelihood of observed web and telephone queries is:
𝐶𝐶 = ∏ 𝐶𝐶𝑖𝑖𝑁𝑁𝑖𝑖=1 (8)
As the subscript m for month was suppressed in (7), the Poisson mean query arrival rate λijk
and the Bernoulli web choice probability pij utilized in (7) and (8) are actually λijkm and pijm computed
with appropriate transactional and seasonal information stock components as per Equations (5) and
(6), respectively.
So far we have assumed that all claims for a customer give her the same information need C.
However, claims with different characteristics may lead to different information needs. For instance,
customers are more likely to make queries for claims where they have to pay out-of-pocket charges or
for claims of higher value. Therefore, we allow for different information needs for claims based on
whether the customer has to pay out of her pocket. For customer i’s claim associated with health event
h, we assume that:
𝐶𝐶𝑖𝑖ℎ = 𝐶𝐶0exp (𝛼𝛼𝐿𝐿𝐼𝐼𝐿𝐿𝐵𝐵 ∙ 𝐷𝐷𝐿𝐿𝐼𝐼𝐿𝐿𝐵𝐵,𝑖𝑖ℎ) , (9)
where, DLIAB,ih is a dummy variable which is equal to 1 if the claim has positive customer out-of-
pocket expenses and 0 otherwise, 𝛼𝛼𝐿𝐿𝐼𝐼𝐿𝐿𝐵𝐵 is the impact of a claim with positive customer liability on the
information need created by the claim, and C0 is the baseline information need from a claim which is
constant across all claims and across all customers. Note that we are able to only consider how the
15

above characteristics of health events influence information needs. Clearly, however, our specification
in (9) can be extended easily to incorporate other characteristics of health events.
We account for unobserved heterogeneity across customers in their propensities to make
queries and to use the web portal when they are making a query. Across customers, we assume
gamma-distributed heterogeneity in the baseline query arrival rate, 𝜆𝜆𝑖𝑖0~ gamma(𝛾𝛾,𝜃𝜃), and beta-
distributed heterogeneity in the baseline web-choice probability, 𝑡𝑡𝑖𝑖0~ beta(𝑎𝑎, 𝑏𝑏), i.e.,
𝑓𝑓(𝜆𝜆𝑖𝑖0|𝛾𝛾,𝜃𝜃) = 𝜃𝜃𝛾𝛾𝜆𝜆𝑖𝑖0(𝛾𝛾−1)𝑒𝑒−𝜆𝜆𝑖𝑖0𝜃𝜃
𝛤𝛤(𝛾𝛾) and 𝑓𝑓(𝑡𝑡𝑖𝑖0|𝑎𝑎, 𝑏𝑏) = 𝑝𝑝𝑖𝑖0𝑎𝑎(1−𝑝𝑝𝑖𝑖0)𝑏𝑏
𝐵𝐵(𝑎𝑎,𝑏𝑏).
We note that we have claim and query activity of the consumers recorded at the daily level.
Therefore, we build and estimate the information stock model (and for the probabilistic benchmark
model) at the daily level. However, it is important to note that our probability models are duration
models, i.e., the actual time elapsed between events is appropriately accounted for. We also note that,
in information stock model, there are two components that we have operationalized at the monthly
level: (1) the change in information stock due to seasonality, and (2) the decay in transactional
information stock. This is done primarily to reduce the complexity and computational burden in
estimating the likelihood function.
We do not have data on demographic information for the customers, the content of any
telephone calls made by a customer, or the web pages visited by a customer during a web visit. Our
data are primarily on the “transactions” of the customer with the firm; the main reason for using these
data is that such data are easy to collect and have no related privacy issues, unlike customer
demographic information. Since most firms have ready access to such data, we expect our model to be
useful for a typical firm’s customer support center. Moreover, even with the limited data that we use,
our model demonstrates limited predictive power, as we show shortly.
Without the transactional information stock component, our model reduces to the
Probabilistic Benchmark Model, which is essentially the widely-used NBD/BB model. Looked at
another way, our model is the NBD/BB model augmented with the information stock component, the
conceptualization and development of the latter being our key contribution. We also note that our
model is quite general and can be applied to other similar situations as well. For instance, if there are
more than two support channels, our model can easily be extended to a NBD/Dirichlet model
(Goodhardt et al. 1984) with straightforward adjustments to the expressions for information stocks.
Similarly, our model can be easily estimated for non-web registered customers who have access to
only one channel, i.e., the telephone channel. Necessary tweaks can also be made to the query-arrival 16

process if needed to capture patterns in the data at hand; for instance, instead of the Poisson arrival
process, the more flexible Erlang-2 arrival process can be used for query arrival (Jeuland et al. 1980).
In our specific case, the Poisson arrival process is sufficient.
5 Estimation and Results
5.1 Estimation Procedure
We estimated the parameters of Model 1 using the fixed effect OLS regression routine in STATA. For
estimating the parameters of Models 2 and 3, we use a hierarchical Bayes framework (Gelman et al.
2009). For the information-stock model (Model 3), we group parameters into two sets: (1) information
stock-related parameters (C0, W, T, 𝛿𝛿 , αLIAB, Im, πT, πS), and (2) parameters that determine
heterogeneity in baselines rates across customers (γ, θ, a, b). For our probabilistic benchmark model
(Model 2) we have only the heterogeneity parameters (γT, θT, γW, θW). We use the following Markov
Chain Monte Carlo (MCMC) chains (details are provided in the Online Appendix):
• Draw (λi0, pi0 | C0, W, T, 𝛿𝛿, 𝐼𝐼𝑖𝑖, πT, πS, αLIAB, γ, θ, a, b, datai) using the Metropolis-Hastings
algorithm;
• Draw (C0, W, T, 𝛿𝛿, 𝐼𝐼𝑖𝑖, πT, πS, αLIAB | γ, θ, a, b, λi0 , pi0, datai) using the Metropolis-Hastings
algorithm;
• Draw (γ, θ, a, b| C0, W, T, 𝛿𝛿 , 𝐼𝐼𝑖𝑖 , πT, πS, αLIAB, λi0 , pi0) using the Metropolis-Hastings
algorithm.
We ran 40,000 iterations of the MCMC steps; the first 30,000 iterations were used as initial
burn-in to reach convergence, which we checked visually, and the last 10,000 iterations were used to
infer the posterior distributions of the parameters. We used multiple starting values for the MCMC
chains and confirmed that the parameters converged to the same values.
Identification and Parameter Recovery. We now briefly discuss how the parameters in the proposed
model are identified given the variation in our data. The parameters γ and θ, which determine the
heterogeneity distribution in the baseline query propensities across customers, are identified by the
differences in overall mean query arrival rates across customers. Similarly, the parameters a and b,
which determine the heterogeneity distribution in the baseline web-choice propensities across
customers, are identified by the differences in overall web-choice rates across customers. In addition,
the parametric forms that we assume for these heterogeneity distributions also help in identification.
(Note, however, that we use flexible distributions that can take various shapes.) The set of parameters
Im, which determine seasonal information stock in different months, are identified by the common 17

variation in query rates and web-choice rates across calendar months for all customers. The t
transactional information stock parameters C0, W and T are identified by the variation in the query
rates at different channels for different periods with respect to the average overall claim arrival and
query rates for customers in that period, after controlling for the baseline query rates for the customers
and common monthly variations in query rates across customers. The decay parameter 𝛿𝛿 is identified
by the differences in customers’ actions in periods immediately after a sequence of claims versus
actions several periods after. The parameter αLIAB, which determines the impact on information need
generated by claims for which customers have out-of-pocket expenses, is identified by the variation in
the presence of out-of-pocket expenses across different claims. The parameters πT and πS, which
determine how channel choice is influenced by the transactional and seasonal information stocks,
respectively, are identified by the variation in web-choice probabilities with the changes in the two
categories of information stocks, after controlling for overall channel choice probabilities.
To further check whether the parameters of the proposed model are well identified from the
variations in our data, we conducted a simulation study. In this study, we simulated data from the
model using sets of pre-determined parameter values to cover a variety of cases with respect to the
relative values of the different support channels and the heterogeneity in latent propensities across
customers. Then, using the procedure described above, we estimated the model on the simulated data
to check: (i) whether the recovered parameter values match the actual parameter values used for data
generation, and (ii) whether the estimated parameter values can accurately recover aggregate query
volumes in the data. We find that, in all the cases that we considered, recovery of parameters as well
as of aggregate statistics in the data is very good. This analysis provides confidence in our estimated
parameters. More details are available in the Online Appendix.
5.2 Model Estimates
We calibrated Model 1, Model 2 and Model 3 on the first 24 months of data (from July 2005 to June
2007), and used the last six months of data (July 2007 to December 2007) as a holdout sample.
In Table 2a, we report the estimates for the time series benchmark model (Model 1). These
estimates show that queries (both telephone and web portal) are positively correlated with the lagged
cumulative number of claims, and negatively correlated with the lagged cumulative number of
queries.
Coefficient Estimate (Cluster Corrected Robust Std. Err.) Telephone Queries Web Queries
18

𝛽𝛽1 (impact of cumulative lagged claims) 0.002*** (0.000) 0.002*** (0.000)
𝛽𝛽2 (impact of cumulative lagged provider charges) -0.003 (0.003) -0.006 (0.005)
𝛽𝛽3 (impact of cumulative lagged queries) -0.046*** (0.002) -0.001** (0.000)
R-square 0.71 0.64 *** and ** denote statistically significant coefficient estimates at the 1% and 5%levels, respectively.
Table 2a: Estimation Results for Model 1 (Times Series Benchmark Model)
Probabilistic Benchmark Model (Model 2)
Information Stock Model (Model 3)
In-Sample Fit Statistics Log Marginal Density -112138.41 -110862.89 Log Bayes Factor 1275.52
Parameter Estimates
γ 0.683 [0.638, 0.719]
0.887 [0.835, 0.926]
θ 64.691 [58.526, 70.699]
126.16 [112.02, 136.13]
a 0.490 [0.456, 0.526]
0.492 [0.448, 0.532]
b 0.701 [0.651, 0.777]
0.716 [0.653, 0.798]
C0 (baseline information need from claim)
0.258 [0.209, 0.305]
W (information gain from web visit)
0.835 [0.795, 0.871]
T (information gain from telephone call)
1.801 [1.679, 1.935]
𝛿𝛿 (decay factor) 0.425 [0.406, 0.447]
πT (impact of transactional info stock on query channel choice)
-0.039 [-0.158, -0.077]
πS (impact of seasonal info stock on query channel choice)
0.302 [0.164, 0.432]
0.303 [0.154, 0.474]
αLIAB (impact on information need for claim with customer liability)
-0.007 [-0.250, 0.214]
Table 2b: Estimation Results for Model 2 and Model 3 (for each parameter, we report the posterior mean followed by the 95% credible interval)
In Table 2b, we report the estimation results for the probabilistic benchmark model (Model
2) and the information stock model (Model 3). We report the values of the 23 seasonal information
stock parameters for Model 3 in Table A2 in the Online Appendix. In Table 2b, the higher value of
log marginal density for the information stock model and the large value of the log Bayes factor
suggest that the information stock model fits the observed data better than the probabilistic
benchmark model. Next, we look at model predictions to aid us in determining which model best
fits the data.
19

5.3 Model Predictions
Since a main use of our model is as a predictive tool, we subject it to a rigorous analysis for both
aggregate-level and individual-level predictive accuracy.
Aggregate-Level Predictions. For Models 1, 2 and 3, we predict total queries, telephone queries
and web queries for each customer in our sample for the calibration period (July 2005 to June
2007) as well as the hold-out period (July 2007 to December 2007). To test these predictions from
the models, we aggregate them across the full cohort of customers, and also aggregate them across
time to the monthly level. We report the Mean Absolute Percentage Error (MAPE) values for the
in-sample and out-of-sample predictions from the three models in Table 3. It is clear from this table
that, as compared to the benchmark models, the information stock model makes significantly
superior in-sample and out-of-sample predictions for total queries, telephone queries, as well as
web queries.
In-Sample Predictions Out-of-Sample Predictions Total
Queries Telephone
Queries Web
Queries Total
Queries Telephone
Queries Web
Queries Times Series BM Model (Model 1) 7.30% 7.70% 9.15% 18.77% 18.10% 26.41%
Probabilistic BM Model (Model 2) 5.91% 8.24% 9.50% 11.23% 10.71% 20.10%
Information Stock Model (Model 3) 2.40% 5.11% 3.22% 4.75% 5.10% 10.32%
Table 3: Prediction Errors (MAPE)
Our model could be used by the firm for capacity planning for the telephone and web
channels. An aspect that is important in capacity planning is over-predictions and under-predictions
by the model. While over-prediction of calls results in excess deployment of customer service
representatives (CSRs) and hence extra costs, under-prediction of calls leads to shortage of CSR
deployment and consequently higher call blockage/abandonment rates and call waiting leading to a
higher customer dissatisfaction. To assess this, for each model, we make monthly out-of-sample
predictions (i.e., for the months July 07 to December 07) for telephone queries and web visits and
track whether the model over-predicted or under-predicted for a particular month. We then assign
different importance weights to the over-predictions and under-predictions and find a consolidated
error percentage for the different models, averaged across the six months. In Table 4, we show the
error numbers for different sets of weights for over- and under-prediction. The three rows of the table
consider different relative costs of over- and under-predictions. The first row of the table assumes that
over-predictions and under-predictions are equally weighted (these error numbers are the same as the
20

corresponding error numbers in Table 3), the second row assumes that over-predictions are twice as
costly as under-predictions and the third row assumes that under-predictions are twice as costly as
over-predictions. In each case, we find that the information stock model does significantly better than
the benchmark models for both telephone and web predictions. We have considered other relative
weights of over-prediction and under-prediction errors as well, and this pattern holds consistently.
Overall, we can say that for the purposes of capacity planning, our proposed model will perform
significantly better than the benchmark models, especially if under-predictions of query numbers is
more costly than over-predictions.
Time Series BM Model Probabilistic BM Model Information Stock Model
Over:Under Weight
Telephone Queries
Web Queries
Telephone Queries
Web Queries
Telephone Queries
Web Queries
1:1 18.10% 26.41% 10.71% 20.10% 5.10% 10.32%
2:1 16.58% 30.06% 8.57% 22.49% 5.79% 10.58%
1:2 19.07% 22.76% 12.43% 18.19% 4.24% 10.15%
Table 4: Out-of-Sample MAPE with Different Weights for Over- and Under-Prediction
Individual-Level Predictions. An additional advantage of the information stock model is that it can
predict queries at the individual-customer level based on each customer's calculated information
stock. Using these predictions, we can use the model to better identify, as compared to the benchmark
models, the customers who are likely to make a telephone call in a particular time period (say, one
month). To test how well the model can do this, we compute the calling probability for each customer
for each month in the out-of-sample period (July 2007 to December 2007), and then sort customers in
descending order of their calling probabilities given by the information stock model. We do the same
for the benchmark models as well. We can identify the customers with high calling probability as the
“calling customers” and compare them with the actual calling customers to show the predictive
power of our model at the individual customer level. In Table 5 below, we show how many actual
calling customers are correctly identified by each model for different cumulative quartiles of
customers based on their computed calling probabilities. Clearly, the information stock model
identifies calling customers quite well, and vastly more accurately as compared to the benchmark
models. (Of course, as we take top 100% customers sorted based on the calling probabilities, all
calling customers will be identified.)
21

Top percentile of customers based on
their calling probabilities
% Correctly Identified Calling Customers
Time Series Benchmark Model
Probabilistic Benchmark Model
Information Stock Model
25% 40.13% 57.93% 85.39% 50% 60.72% 75.19% 94.33% 75% 84.82% 90.79% 98.29%
100% 100.00% 100.00% 100.00%
Table 5: Identification of Calling Customers
The analysis above helps to determine the accuracy of the different models in identifying top
calling customers. In addition, we conduct alternative rigorous analysis of the model’s predictive
ability. Specifically, we sort calling customers by the number of actual queries and then segment the
cohort into quartiles by the degree of activity, and then see the performance of the models across
these quartiles. This ensures that we compare the predictive accuracy of the three models on the same
cohort of calling customers. In Table 6, we provide the correctly predicted calling customers in each
quartile from each model in each month of the out-of-sample period. Note that quartile 1 is composed
of the highest-calling customers, and quartile 4 is composed of the lowest-calling customers. The
averaged numbers in the last row of the table clearly show that the information stock model performs
the best (and very well) in terms of identifying calling customers.
Month
Actual number of calling customers in each quartile
Number of correctly predicted calling customers
Info. Stock Model Probabilistic BM Model Time Series BM Model
1st Qrt
2nd Qrt
3rd Qrt
4th Qrt
1st Qrt
2nd Qrt
3rd Qrt
4th Qrt
1st Qrt
2nd Qrt
3rd Qrt
4th Qrt
Jul 69 66 63 59 57 55 51 48 37 41 38 32 29 Aug 72 70 66 60 57 58 48 36 30 38 34 31 25 Sep 62 58 55 50 46 48 41 37 36 35 31 25 22 Oct 69 64 62 59 54 52 46 43 44 38 32 27 24 Nov 63 58 57 54 52 47 43 41 39 37 32 25 24 Dec 52 47 46 42 37 40 35 32 32 36 30 24 22 Average % correctly identified
93.6%
90.1%
83.6%
78.0%
77.4%
68.2%
61.4%
56.8%
58.6%
51.2%
42.5%
37.9%
Table 6: Quartile-wise accuracy in identifying calling customers
So far we have compared the model accuracy in correctly identifying calling customers.
However, to assess the overall predictive power of our model, we need to compare its accuracy in
identifying both calling as well as non-calling customers with that from the benchmark models.
Therefore, we computed rates of true positives (TP; correctly predicted calling customers), false
22

positives (FP; incorrectly predicted calling customers), true negatives (TN; correctly predicted non-
calling customers) and false negatives (FN; incorrectly predicted non-calling customers) from the
different models. For each month, we predict the calling and non-calling customers from each model
and then we can determine the rates of TP, FP, TN and FN. In Table 7, we provide the percentages of
TP, TN, FP and FN, averaged over the six months. From Table 7, we find that the information stock
model does significantly better in correctly identifying the actual calling customers (86.6%) as
compared to the benchmark models (66.2% and 47.7% for the probabilistic benchmark model and the
time series benchmark model, respectively). Moreover, the information stock model also makes
significantly less error in misidentifying the non-calling customers as calling customers (10.7%) as
compared to the benchmark models (27.3% and 40.2% for the probabilistic benchmark model and the
time series benchmark model, respectively). This clearly shows the good performance of the
information stock model in identifying calling and non-calling individuals.
Information Stock Model Probabilistic BM Model Time Series BM Model True Positive 86.6% 66.2% 47.7% False Positive 10.7% 27.3% 40.2% True Negative 98.7% 96.8% 95.3% False Negative 1.5% 4.0% 6.1%
Table 7: Average True Positive, False Positive, True Negative and False Negative Rates
Identification of calling customers with high accuracy can be a great advantage to the firm.
For instance, once the high-calling-probability customers are identified, to resolve their queries pro-
actively and pre-empt some of their calls, the firm's customer service representatives (CSRs) can
make outgoing calls to them in non-peak times of the day when the CSRs are free. In other words,
information about calling customers can be utilized to reduce peak-time telephone calls by using
interventions of the above nature. As the CSRs are deployed at call centers primarily based on the
predicted peak-time call load, making calls to customers in advance may reduce the peak-time call
load and thus save CSR-related costs for the company. For instance, according to Table 5, if the top
25% of customers based on calling probability are considered, the information stock model, on
average, is able to correctly identify approximately 85.39% of the calling customers in a month. If
30% of the total customers make calls at the peak time, then approximately 85.39*0.3=26% of the
total customers making peak time calls would be correctly identified by our model. If we assume that
by making outgoing calls to these customers, calls from half of these customers are avoided, i.e.,
approximately 26/2=13% of total calls are avoided, it would result in significant cost savings for the
firm. For instance, the firm we obtained data from has approximately three million customers making
on average 440,000 calls per month; in this case, making outgoing calls to the identified customers
23

may result in a reduction of roughly 440,000*0.13=57200 peak-time calls per month, or
57200/22=2600 peak time calls per day (assuming 22 working days per month), which can lead to
significant savings.
Note that call centers typically make staff allocation plans at the weekly, daily or, sometimes,
even hourly levels. Even though our analysis is conducted at the monthly level, the results obtained
can be used to make decisions for shorter time frames. For instance, once a planner is given a list of
customers with a high probability of calling in the near future (specifically, in the next one month), he
can use this information to make scheduling and staff allocation decisions for time frames shorter
than one month, as the need may be. Naturally, if we had more data, we could model information
stock not at the monthly but at the weekly or even daily levels, which is expected to improve the
predictive power of the model. Since we are limited to a data sample, we model information stock at
the monthly level; however, we conducted a weekly analysis as well and obtained insights and
predictive performance qualitatively similar to what is presented here.
5.4 Inferences from the Information Stock Model
In this section, we discuss some inferences that can be made using the estimates of the information
stock model. The distribution of the mean query arrival rate across customers in our sample is shown
in the left plot in Figure 2. This long-tailed plot indicates that there is large heterogeneity in the
baseline query arrival rates—a majority of the customers have a low query rate while a few customers
have the propensity to make large numbers of queries. The median number of queries is 2.27 per year.
The distribution of the web choice probability across customers in our sample is shown in the right
plot in Figure 2, and indicates a polarized distribution, i.e., some customers (a relatively larger
number) have quite low web-choice probability and can be classified as “web avoiders,” whereas
other customers (a relatively smaller number) have quite high web-choice probability and can be
classified as “web seekers.” The median web choice probability is 0.36.
24

Figure 2: Distribution of baseline query arrival rate and web-choice probability
The estimated value of the baseline information need from a claim, C0, is 0.258, of the
information gain from a web visit, W, is 0.835, and of the information gain from a telephone call, T, is
1.801. To obtain a more practical sense of how these values compare with each other, it is helpful to
analyze their impact on observable metrics. The metric we focus on is the impact on the expected time
of the next query by a customer. We conduct this analysis as follows. Assume that there is a
representative customer who has zero information stock, i.e., only her baseline propensities are
driving her query behavior, and the expected time until her next query is D days. We (artificially)
endow her with the information that she would need after zC claims, i.e., her information stock is zCC0.
Suppose this reduces the expected time of her next query to D-d1 days. We now (again, artificially)
endow her with the information gain that she would obtain from one telephone call, T, so that her
information stock is zCC0-T. Suppose this gain increases the expected time of her next query to D-
d1+d2 days. We solve for the value of zC for which D-d1+d2=D, i.e., d1=d2; given our parameter
estimates, this value of zC is 6.981. To compare the information gain from a web visit and a telephone
call, suppose the expected time of the next query of a representative hypothetical customer starting
with zero information stock and then endowed with the information gain from one telephone call, T, is
D-d1 days. We solve for the value of zW such that the expected time of the next query of a
representative customer starting with zero information stock and then endowed with the information
gain from zW web visits, zWW, is also D-d1 days. This value of zW is 2.15.
In terms of the above metric, we find that, for a representative customer, the information gain
from one telephone call is sufficient to meet the information need that arises from approximately
25

seven claims. Similarly, the information gain from one telephone call is roughly equivalent to the
information gain from two web portal visits. This analysis leads to the implication that, in our setting,
a telephone call, on average, provides a large information gain to the customer in comparison to other
channels. This result also shows that, in our setting, web visits are significantly less effective than
telephone calls in resolving queries. This, in fact, is very much in line with the expectations of the
firm’s managers whom we briefed on the results of this paper.
Next, we examine the impact of the two types of information stocks on the probability that a
customer uses the web channel to resolve a query. The negative and significant estimate for
𝜋𝜋𝑇𝑇 (−0.039) suggests that the probability of web usage decreases with higher transactional
information stock. Since transactional information stock is generated from health events, this implies
that customers prefer to use the telephone channel for information needs generated by health events.
In contrast, the positive and significant estimate for 𝜋𝜋𝑆𝑆 (0.303) suggests that the probability of web
usage increases with higher seasonal information stock. As pointed out earlier, seasonal information
needs are typically related to the insurance contract, such as requests for ID cards, password/login
updating, etc. This category of information is easy to retrieve on the web portal and thus customers
tend to use the web portal for obtaining this type of information. These results are also in line with the
results of Kumar and Telang (2012), who also studied a health insurance setting and found the web to
be effective in resolving structured queries, but found the telephone to be effective in resolving
unstructured and complex queries.
We find a significant estimate for 𝛿𝛿 (0.425), which translates into approximately 57.5% decay
of transactional information stock in a month. We did not find the estimate of αLIAB to statistically
significant in our data.
It is important to note that the model allows for stochasticity in customer behavior—larger
𝜆𝜆𝑖𝑖𝑖𝑖𝑖𝑖𝑖𝑖 implies that there is a tendency to make queries faster, and larger 𝑡𝑡𝑖𝑖𝑖𝑖𝑖𝑖 implies that there is a
larger tendency to choose the web channel. Therefore, as more claims arrive for a customer,
information needs increase. The customer could make a query even with a small information need that
is generated when a claim arrives, but is more likely to make a query as the information need
increases. A larger information need also makes it more likely that the telephone channel will be used.
Taking an overall view, the insights obtained from our parameter estimates lend face validity
to our modeling approach. Note that the values above are specific to this setting and depend on many
factors, such as the level of training of the customer service representatives who take calls and the
helpfulness and ease-of-use of the website of the company. Needless to say, these values may differ in 26

other settings. The model will have to be re-estimated to be informative for those settings, and is
flexible enough to capture different patterns in other data sets. Before proceeding further, we clarify
an important point, which is that the result that the telephone channel provides more information than
the web channel does not necessarily imply that the web channel is a “bad” channel. To see this, note
that we have conceptualized information as a one-dimensional construct. One can, however, think of
information as a multi-dimensional construct, e.g., one dimension can capture
complicated/unstructured information needs and another dimension can capture simpler/structured
information needs. It may then be the case that the web channel is effective for simple/structured
information needs but for not for complicated/unstructured information needs, while the telephone
channel is effective for both. We have an indication of the same from the result that if information
needs emanate from the seasonal information stock, then consumers tend to prefer the web channel.
However, to fully develop and estimate a model with multiple dimensions of information, we would
need to know more details of the consumers’ interactions with the firm for every query instance (e.g.,
transcripts for the telephone conversations, and the clickstream data for the web visits).
Unfortunately, we do not have data that is rich enough to calibrate such a model. Nevertheless, we
note that our current results align with, or at least do not contradict, the conceptualization above. This
is because simple information needs should be smaller in “magnitude” as compared to complicated
information needs. Since our model shows that the web channel provides less information per
interaction than the telephone channel, it indicates that the web channel should be able to resolve
simple information needs but not the complicated ones.
5.5 Robustness Checks
We conducted various robustness checks and found that there are no qualitative differences in the
parameter values and insights obtained. Some of the variations we considered are the following:
i. We calibrated the model on the first 18 months of data as well as the full 30 months of data
(instead of 24 months of data) and obtained similar parameter estimates.
ii. We also estimated a model with 11 variables for Im to capture seasonal information stock (one for
each calendar month across years, i.e., the same parameter for July 2005 and July 2006, for
August 2005 and August 2006, and so on), and obtained similar estimates to those reported here
for the other parameters.
iii. We used particular features of the data on healthcare provider charges to code health events as
repeat health events (e.g., events associated with multiple claims for a chronic disease). The key
idea is that information needs are low in case of repeat events because the consumer would
27

already have most of the relevant information from previous experience. We find that though
there is an improvement in the in-sample and predictive performance of every model, this
improvement is small.
iv. We checked for possible learning by consumers for the web channel by allowing for higher
information gains in later web visits by using a multiplicative factor; we did not find this effect
and, therefore, dropped this component from the final specification.
v. We estimated our model under the assumption that a telephone call from a customer results in
complete resolution of the customer’s questions, i.e., after a telephone call, the customer’s
information stock becomes zero. We find that our information stock model fits the data better and
leads to superior predictions as compared to this model.
6 Conclusions and Future Work
In this paper, we propose a novel information stock-based framework to endogenously model the
query generation and channel choice processes of customers in a multichannel customer support
services setting. We postulate that each customer has a latent information stock which determines her
behavior. The information stock is determined by information needs which are generated by insurance
claims corresponding to customers' health events, and information gains that customers obtain on
contacting the firm's support center by the telephone or the web channel. This information stock-
based model allows us to use observed customer data—namely the sequence of claims and the query
behavior—to estimate the customer-perceived information values of different support channels. We
thus contribute to the Operations Management literature on call center management by providing a
general methodology which relates the query arrival and support channel choice processes to
customer transaction history, rather than treating the query formation process as exogenous, as is
typical in queuing literature.
We implement the proposed model on individual-customer-level data obtained from a large
US-based health insurance firm. We find that the information stock model can accurately capture
patterns in customers' multichannel query behavior. The model provides accurate predictions for
aggregate query volumes for the different support channels. Furthermore, it is able to identify with
high accuracy the customers who are likely to make queries in the near future. The model therefore
can serve as a useful managerial tool. For instance, making advance outgoing calls to customers who
have high calling probabilities can help to reduce peak-time calls, which can lead to substantial cost
savings for the firm.
We also find that, in our setting, the average information gain from a telephone call is slightly
28

more than double the information gain from visiting the web portal, i.e., the telephone channel, on
average, is significantly more effective than the web channel in resolving customers’ queries.
Regarding channel choice, we find that customers prefer the telephone channel for higher health
event-related information needs while they prefer the web portal for more structured seasonal
information needs. We also find that there is a large degree of heterogeneity in customers' propensity
to use the web portal while making a query—some customers are “web avoiders” while others are
“web seekers.”
The results we obtain are applicable only in the specific situation that we
considered, and are dependent on the intricacies and idiosyncrasies of the particular firm's
infrastructure and operation. Our model, however, is general enough that it can be used in other
similar situations with straightforward adjustments, and can inform the managers about the relative
efficacies of their customer support channels. For instance, the web portal can provide lesser value
than telephone in complex services (such as health insurance) but may provide a higher value in less
complex services (such as personal banking). Comparative studies of this kind, where the value of
different types of customer service channels is determined for different industries and for different
firms in an industry, would be an excellent application of this model and an avenue for future work.
Taking a more strategic perspective, our results have significant managerial implications for
new-generation multichannel customer service operations technologies. At a time when web portals
are becoming a popular choice as a way to reduce the cost of customer service, our results show that
there are more subtle and complex phenomena at play. Our estimates indicate the superior
informational value of the traditional telephone channel over the self-service web portal. This
suggests that the assisted telephone channel is still a dominant customer support channel at least for
complex services such as health insurance. Our estimates also suggest that web portals are effective
for simple, unambiguous tasks (such as seasonal information needs, which are more structured and
routine information needs). We expect our results to extend to other self-service support channels.
Therefore, managers have to make a balanced and careful choice regarding what infrastructure they
should set up for customer support services. The design of the web portal, in terms of ease of access
of information, can be an important dimension in this decision.
The present model can be extended in many different directions in the future. First, we have
conceptualized information as a one-dimensional construct. It may be useful to think of information
as a multi-dimensional construct, e.g., one dimension can capture structured information needs and
another can capture unstructured information needs. Identification of the parameters of such a model
29

would require richer data than we have used here. Second, details on the nature of health events will
allow us to more precisely model the information needs for different types of claims. Our model can
provide additional insights with higher granularity data in this area. Third, currently we treat the claim
arrival process for customers as exogenous, but this process could be endogenous. For instance, based
on how the insurance firm's representatives treat the customer, she may change her claim frequency
(e.g., in an extreme response to unsatisfactory query resolution, she may switch the insurance
company and her claim frequency will become zero). Future work could explore the endogeneity
between claim frequency and query behavior. Fourth, as appropriate for our setting, we have two
channels in the model, namely telephone and web. Future work can extend the model to include more
customer support channels, as the need may be; this would be a fairly straightforward extension.
Finally, we have timing data on the claims and queries of customers, and some data on claim
characteristics. On the one hand, this implies that our model is useful for the typical firm since these
data requirements are not heavy while the model still generates accurate predictions and useful
insights. On the other hand, these data limitations present an opportunity to further enrich the model
by extending it to incorporate more data. Richer data can allow us to add heterogeneity to other model
components, such as the information gains from different web visits and telephone calls and the
information needs from different claims. This would allow the possibility, for instance, that some web
visits lead to an information need rather than a gain (say, because of confusion after obtaining online
information), with the implication that a future query is accelerated rather than delayed. Additional
data such as the transcripts of calls made by customers and the web pages visited by customers during
a web portal visit can allow us to model such dependencies across queries. For instance, from the web
pages visited by a customer, we can determine whether the customer was able to obtain the
information she was looking for or not; if not, a subsequent query may actually be accelerated and the
customer may be more likely to use the telephone channel. We hope future research builds and
improves on the information stock framework proposed in this paper.
References
Ansari, A, C. F. Mela, and S. A. Neslin (2008), "Customer Channel Migration." Journal of Marketing Research 45 (1), 60-76.
Aksin, Z., S. Emadi, B. Ata, and C.-L. Su (2013), "Structural Estimation of Callers' Delay Sensitivity in Call Centers." Management Science 59 (12), 2727-2746.
Avramidis, A. N., A. Deslauriers, and P. L'Ecuyer (2004), "Modeling Daily Arrivals to a Telephone Call Center." Management Science 50 (7), 896-908.
Bassamboo, A., and A. Zeevi (2009), "On a Data-Driven Method for Staffing Large Call Centers." Operations Research 57 (3), 714-726.
30
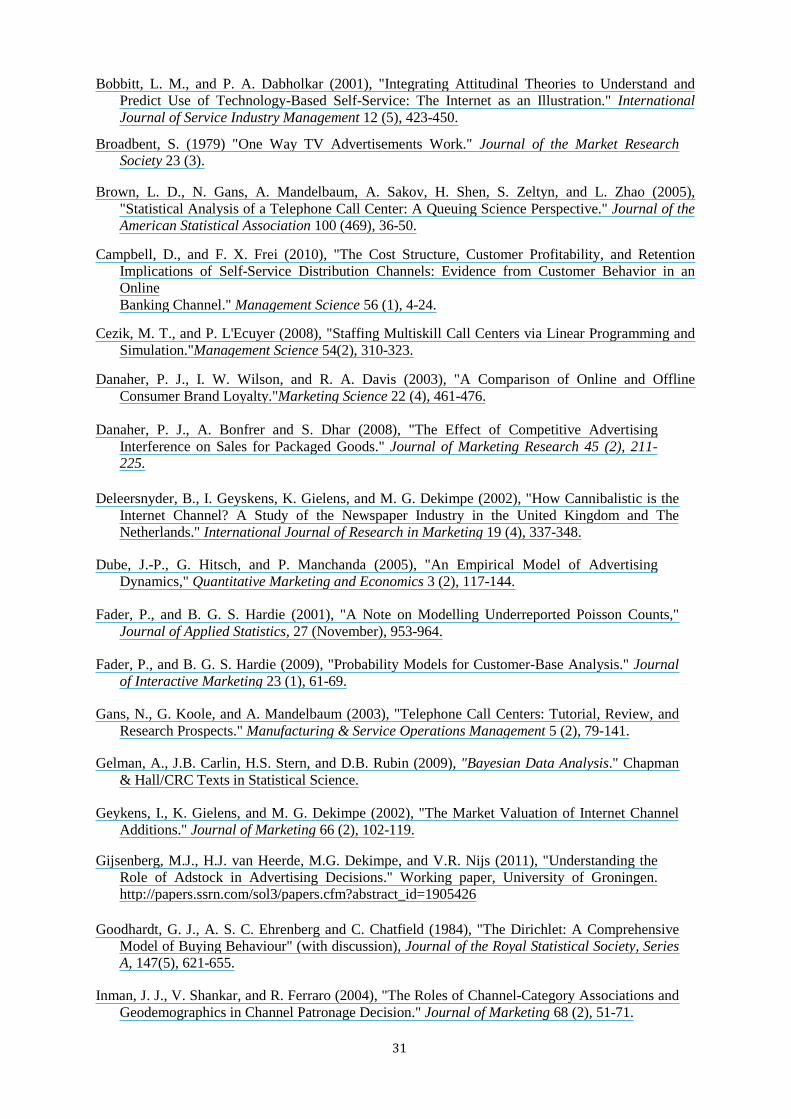
Bobbitt, L. M., and P. A. Dabholkar (2001), "Integrating Attitudinal Theories to Understand and Predict Use of Technology-Based Self-Service: The Internet as an Illustration." International Journal of Service Industry Management 12 (5), 423-450.
Broadbent, S. (1979) "One Way TV Advertisements Work." Journal of the Market Research Society 23 (3).
Brown, L. D., N. Gans, A. Mandelbaum, A. Sakov, H. Shen, S. Zeltyn, and L. Zhao (2005), "Statistical Analysis of a Telephone Call Center: A Queuing Science Perspective." Journal of the American Statistical Association 100 (469), 36-50.
Campbell, D., and F. X. Frei (2010), "The Cost Structure, Customer Profitability, and Retention Implications of Self-Service Distribution Channels: Evidence from Customer Behavior in an Online Banking Channel." Management Science 56 (1), 4-24.
Cezik, M. T., and P. L'Ecuyer (2008), "Staffing Multiskill Call Centers via Linear Programming and Simulation."Management Science 54(2), 310-323.
Danaher, P. J., I. W. Wilson, and R. A. Davis (2003), "A Comparison of Online and Offline Consumer Brand Loyalty."Marketing Science 22 (4), 461-476.
Danaher, P. J., A. Bonfrer and S. Dhar (2008), "The Effect of Competitive Advertising
Interference on Sales for Packaged Goods." Journal of Marketing Research 45 (2), 211-225.
Deleersnyder, B., I. Geyskens, K. Gielens, and M. G. Dekimpe (2002), "How Cannibalistic is the Internet Channel? A Study of the Newspaper Industry in the United Kingdom and The Netherlands." International Journal of Research in Marketing 19 (4), 337-348.
Dube, J.-P., G. Hitsch, and P. Manchanda (2005), "An Empirical Model of Advertising Dynamics," Quantitative Marketing and Economics 3 (2), 117-144.
Fader, P., and B. G. S. Hardie (2001), "A Note on Modelling Underreported Poisson Counts," Journal of Applied Statistics, 27 (November), 953-964.
Fader, P., and B. G. S. Hardie (2009), "Probability Models for Customer-Base Analysis." Journal of Interactive Marketing 23 (1), 61-69.
Gans, N., G. Koole, and A. Mandelbaum (2003), "Telephone Call Centers: Tutorial, Review, and Research Prospects." Manufacturing & Service Operations Management 5 (2), 79-141.
Gelman, A., J.B. Carlin, H.S. Stern, and D.B. Rubin (2009), "Bayesian Data Analysis." Chapman & Hall/CRC Texts in Statistical Science.
Geykens, I., K. Gielens, and M. G. Dekimpe (2002), "The Market Valuation of Internet Channel Additions." Journal of Marketing 66 (2), 102-119.
Gijsenberg, M.J., H.J. van Heerde, M.G. Dekimpe, and V.R. Nijs (2011), "Understanding the Role of Adstock in Advertising Decisions." Working paper, University of Groningen. http://papers.ssrn.com/sol3/papers.cfm?abstract_id=1905426
Goodhardt, G. J., A. S. C. Ehrenberg and C. Chatfield (1984), "The Dirichlet: A Comprehensive Model of Buying Behaviour" (with discussion), Journal of the Royal Statistical Society, Series A, 147(5), 621-655.
Inman, J. J., V. Shankar, and R. Ferraro (2004), "The Roles of Channel-Category Associations and Geodemographics in Channel Patronage Decision." Journal of Marketing 68 (2), 51-71.
31

Jeuland, A. P., Bass, F. M. and Wright, G. P. (1980), "A multibrand stochastic model compounding heterogenous Erlang timing and multinomial choice processes," Operations Research, 28(2), 255-277
Kingstone, S. (2006), "Great Expectations: Self-Service Success can Happen." Yankee Group Report, May. http://www.ccng.com/files/public/Y ankee_SelfService.pdf.
Kleinrock, L. (1975), "Queuing Systems. Volume 1: Theory." Wiley.
Knox, G. A. H. (2007), "Modeling and Managing Customers in a Multichannel Setting." Unpublished Dissertation. University of Pennsylvania.
Kumar, A., and R. Telang (2012), "Does Web Reduce Customer Service Cost? Empirical Evidence from a Call Center." Information Systems Research 23 (3), 721-737.
Kim, S.-H., C. Chan, M. Olivares, and G. Escobar (2013), "ICU Admission Control: An Empirical
Study of Capacity Allocation and its Implication on Patient Outcomes." Working paper, Columbia University.
Lu, Y., A. Musalem, M. Olivares, and A. Schilkrut (2013), "Measuring the Effect of Queues on Customer Purchasing Behavior." Management Science 59 (8), 1743-1763.
Mandelbaum, A. (2006), "Call Centers: Research Bibliography with Abstracts." Technion—Israel Institute of Technology. http://iew3.technion.ac.il/serveng/References/ccbib.pdf.
McFadden, D. (1973), "Conditional Logit Analysis of Qualitative Choice Behavior." In Frontiers of Econometrics, ed. P. Zarembka. 105-142. New York, USA: Academic Press.
Mehrotra, V., and J. Fama (2003), "Call Center Simulation Modeling: Methods, Challenges, and Opportunities." In Proc. 2003 Winter Simulation Conference, eds. S. Chick, P. J. Sanchez, D. Ferrin, and D. J. Morrice. 135-143. Piscataway, NJ: IEEE Press.
Mehrotra, V., O. Ozluk, and R. Saltzman (2010), "Intelligent Procedures for Intraday Updating of Call Center Agent Schedules." Production and Operations Management 19(3), 353-367.
Meuter, M. L., M. J. Bitner, A. L. Ostrom, and S. W. Brown (2005), "Choosing Among Alternative Service Delivery Modes: An Investigation of Customer Trial of Self-Service Technologies." Journal of Marketing 69 (2), 61-83.
Moe, W.W., and P.S. Fader (2004), "Dynamic Conversion Behavior at E-Commerce Sites." Management Science 50 (3), 326-335.
Neslin, S.A., D. Grewal, R. Leghorn, V. Shankar, M. L. Teerling, J. S. Thomas, and P. C. Verhoef (2006), "Challenges and Opportunities in Multichannel Customer Management." Journal of Service Research 9 (2), 95-112.
Netessine, S., and C. Tang (2009), "Consumer-Driven Demand and Operations Management Models." In International Series in Operations Research & Management Science. Series Ed.: Hillier, Frederick S. Springer.
Netzer, O., J.M. Lattin, and V. Srinivasan (2008), "A Hidden Markov Model of Customer Relationship Dynamics." Marketing Science 27 (2), 185-204.
Olivares, M., Y. Lu, A. Musalem, and A. Schilkrut (2012a), "Measuring the Effect of Queues on Customer Purchasing Behavior." Working paper, Columbia University.
Olivares, M., S.-H. Kim, C. Chan, and G. Escobar (2012b), "ICU Admission Control: An Empirical Study of Capacity Allocation and its Implication on Patient Outcomes." Working paper, Columbia University.
Pierson, M., G. Allon, and A. Federgruen (2011), "How Much is a Reduction of Your 32

Customers’ Wait Worth? An Empirical Study of the Fast-Food Drive-Thru Industry Based on Structural Estimation Methods." Manufacturing & Service Operations Management 13 (4), 489-507.
Schmittlein, D. C., A. C. Bemmaor and D. G. Morrison (1985), "Why Does the NBD Model Work? Robustness in Representing Product Purchases, Brand Purchases and Imperfectly Recorded Purchases," Marketing Science, 4 (Summer), 255-266.
Shankar, V., A. K. Smith, and A. Rangaswamy (2003), "The Relationship between Customer
Satisfaction and Loyalty in Online and Offline Environments." International Journal of Research in Marketing 20 (2), 153-175.
Shen, H., and J. Z. Huang (2008), "Interday Forecasting and Intraday Updating of Call Center Arrivals." Manufacturing & Service Operations Management 10 (3), 391-410.
Sousa, R., and C. A. Voss (2006), "Service Quality in Multi-Channel Services Employing Virtual
Channels." Journal of Service Research 8 (4), 356-371.
Soyer, R., and M. M. Tarimcilar (2008), "Modeling and Analysis of Call Center Arrival Data: A Bayesian Approach." Management Science 54(2), 266-278.
Sun, B. and S. Li (2011), "Learning and Acting Upon Customer Information: A Simulation-Based Demonstration on Service Allocations with Offshore Centers." Journal of Marketing Research 48 (1), 72-86.
Taylor, J. W. (2008), "A Comparison of Univariate Time Series Methods for Forecasting Intraday Arrivals at a Call Center." Management Science 54 (2), 253-265.
Taylor, J. W. (2012), "Density Forecasting of Intraday Call Center Arrivals Using Models Based on Exponential Smoothing." Management Science 58 (3), 534-549.
Weinberg, J., L. D. Brown, and J. R. Stroud (2007), "Bayesian Forecasting of an Inhomogeneous Poisson Process with Applications to Call Center Data." Journal of the American Statistical Association 102 (480), 1185-1198.
Xue, M., L. M. Hitt, and P. T. Harker (2007), "Customer Efficiency, Channel Usage, and Firm Performance in Retail Banking." Manufacturing & Service Operations Management 9 (4), 535-558.
33