overtaking customer satisfaction
18
International Journal of Research in Commerce and Management Studies ISSN 2582-2292 Vol. 3, No. 05 Sep-Oct; 2021 https://ijrcms.com Page 52 OVERTAKING CUSTOMER SATISFACTION: EVIDENCE TWO POPULAR DUCK RESTO Umbas Krisnanto and Sabrina Salim Affiliation, Perbanas Institute, Perbanas Street, Setiabudi, Karet Kuningan, Jakarta 12940, Indonesia, DOI: http://dx.doi.org/10.38193/IJRCMS.2021.3505 ABSTRACT The Purpose of this study to find which of the two most popular duck resto in the city made consumer satisfy their taste. The objective is to analyze the effect of product quality, price, store atmosphere and location on customer satisfaction in the two most popular ducks resto in Jakarta. The research sample included 200 respondents who had ever come both Kaleyo dan Slamet Duck Resto. Data collected using questionnaires content Likert 5 points scale. The collected data was analyzed by linear regression. The results both duck resto’s customers had the same positive satisfaction about product quality, price, store atmosphere, and location but in different magnitude. Implications that both Kaleyo and Slamet should pay attention their product quality, price promotion, store atmosphere, and parking space. Originality/Value of this research from the empirical evidence, better the two most popular duck resto to add new dishes or menu choices and special appearance. KEYWORDS: Product Quality; Price; Store Atmosphere; Location; Customer Satisfaction JEL: L83, M31 INTRODUCTION In the pandemic era, made digital transaction more usable for choosing and consuming products offering. Business must increasingly advanced, marked by the development of technology and science so that it has an impact on the map of economic and business strength which is followed by increasingly fierce business competition (Roschk and Hosseinpour, 2020). The industrial sector that has the potential to experience an increase is the business sector in serving food and beverages starting from a small scale such as stalls and tent cafes, medium scale such as restaurants and cafes, to large scale such as restaurants in five star hotels and malls. The emergence of various businesses of a similar nature will gradually have an impact on consumers to be more selective in making choices. There are several strategies that can be carried out by business actors in facing business competition, by improving and maintaining product quality, determining the appropriate price level, creating a comfortable store atmosphere, and determining a strategic business place / location. This study based on research results from Devi, et.al (2017), found that the product quality variable had a significant and positive influence on the consumer satisfaction variable. Meanwhile, Jang and Lee (2019), found
-
Upload
khangminh22 -
Category
Documents
-
view
1 -
download
0
Transcript of overtaking customer satisfaction

International Journal of Research in Commerce and Management Studies
ISSN 2582-2292
Vol. 3, No. 05 Sep-Oct; 2021
https://ijrcms.com Page 52
OVERTAKING CUSTOMER SATISFACTION: EVIDENCE TWO POPULAR DUCK
RESTO
Umbas Krisnanto and Sabrina Salim
Affiliation, Perbanas Institute, Perbanas Street, Setiabudi, Karet Kuningan, Jakarta 12940, Indonesia,
DOI: http://dx.doi.org/10.38193/IJRCMS.2021.3505
ABSTRACT
The Purpose of this study to find which of the two most popular duck resto in the city made consumer
satisfy their taste. The objective is to analyze the effect of product quality, price, store atmosphere and
location on customer satisfaction in the two most popular ducks resto in Jakarta. The research sample
included 200 respondents who had ever come both Kaleyo dan Slamet Duck Resto. Data collected
using questionnaires content Likert 5 points scale. The collected data was analyzed by linear
regression. The results both duck resto’s customers had the same positive satisfaction about product
quality, price, store atmosphere, and location but in different magnitude. Implications that both Kaleyo
and Slamet should pay attention their product quality, price promotion, store atmosphere, and parking
space. Originality/Value of this research from the empirical evidence, better the two most popular
duck resto to add new dishes or menu choices and special appearance.
KEYWORDS: Product Quality; Price; Store Atmosphere; Location; Customer Satisfaction
JEL: L83, M31
INTRODUCTION
In the pandemic era, made digital transaction more usable for choosing and consuming products
offering. Business must increasingly advanced, marked by the development of technology and science
so that it has an impact on the map of economic and business strength which is followed by
increasingly fierce business competition (Roschk and Hosseinpour, 2020). The industrial sector that
has the potential to experience an increase is the business sector in serving food and beverages starting
from a small scale such as stalls and tent cafes, medium scale such as restaurants and cafes, to large
scale such as restaurants in five star hotels and malls. The emergence of various businesses of a similar
nature will gradually have an impact on consumers to be more selective in making choices. There are
several strategies that can be carried out by business actors in facing business competition, by
improving and maintaining product quality, determining the appropriate price level, creating a
comfortable store atmosphere, and determining a strategic business place / location. This study based
on research results from Devi, et.al (2017), found that the product quality variable had a significant
and positive influence on the consumer satisfaction variable. Meanwhile, Jang and Lee (2019), found

International Journal of Research in Commerce and Management Studies
ISSN 2582-2292
Vol. 3, No. 05 Sep-Oct; 2021
https://ijrcms.com Page 53
that there was no influence between product quality and consumer satisfaction. Levy & Weitz (2012)
found that price has a partially significant effect on customer satisfaction. In contrast to research from
Gaol, et.al (2016) found that price has a significant negative effect on customer satisfaction. The
results of research by Berman& Joel (2010) found that the store atmosphere variable has a positive
and significant effect on customer satisfaction. However, according to research conducted by Kristiana
& Muhammad (2017), the atmospheric strore variable partially has no significant effect on consumer
satisfaction. This study is the same as that conducted by Keiningham, et.al (2014) that store
atmosphere has no significant effect on customer satisfaction. The research results of Hussain, et.al
(2015) found that location has a significant effect on customer satisfaction. While Zaibaf, et.al (2013)
found the store atmosphere and store quality positively influence the perception of PLB’s quality,
whereas, the congruence between national brand and store image (NBSI) has a negative influence on
PLB’s quality. Research questions: Does product quality, price, store atmosphere and location affect
consumer satisfaction in Kaleyo and Slamet Duck Resto? How consumers could differentiated their
sensation?
LITERATURE REVIEW AND THE HYPOTHESIS
Hadita (2019) define a product as anything that can be offered to the market for attention, acquisition,
use, or consumption that might satisfy wants or needs. Products include more than just tangible
objects, they include services, events, people, places, organizations, ideas, or a mix of these. Products
are a key element in the overall market offering. Marketing mix planning begins with building
offerings that bring value to target customers. This offering forms the basis on which the company
builds profitable customer relationships.
According to Tjiptono (in Putri, 2014) Price is a monetary unit or other measure including other goods
and services that are exchanged to obtain ownership rights or use of goods and services.
A store is a place where there is trade in a specific product or object such as books, food, drinks and
so on. Shop buildings are usually better than warung (stall, small shop). According to Homburg, et.al
(2014) Atmosphere is the design of an environment or atmosphere stimulates the five senses. Usually,
retailers stimulate consumer perceptions and emotions through lighting, color, smell and music
Keiningham, et.al (2014).
According to Lamb in Kotler & Armstrong (2018) the factors that influence creating a store
atmosphere are as follows: Employee characteristics are important to support the shop's atmosphere,
such as being neat, knowledgeable and service-oriented which will give the impression of readiness
to serve all customer needs which will affect customer judgment. Fixed fixtures look elegant and
consistent with the general atmosphere you want to create. Sounds can be pleasant or irritating for a
customer. Music can also make customers stay longer in the store, businesses can adjust the

International Journal of Research in Commerce and Management Studies
ISSN 2582-2292
Vol. 3, No. 05 Sep-Oct; 2021
https://ijrcms.com Page 54
atmosphere of their music to suit the demographic conditions of the shopper and the merchandise
being sold. Music can create a comfortable and attractive atmosphere to direct customer attention.
Smells can stimulate or disturb consumers who are in the store. It is important for business actors to
pay attention to the aroma that they want to highlight to stimulate the five senses of consumers to buy
or feel satisfied in that place (Sabran, 2012). Color and lighting can create a mood or focus attention.
Reds, oranges and yellows are considered warm colors and intimacy is desirable. Dominant colors
such as blue, green and violet are used to open closed spaces and create an elegant and clean
atmosphere (Elliot, 2015). The appearance of a store also has an influence on the desired atmosphere
and in creating a favorable first impression for consumers. Gaol, et.al (2016) found that location has
an effect but is not significant on consumer satisfaction. According to Abrar, et.al (2017) and
Pahlawan, et al. (2019) Store atmosphere is divided into four important elements that will affect the
desired store atmosphere, which consists of: The shop front is the total physical exterior of the shop
itself. Which includes: signage, entrances, lighting, windows and construction materials. Sounds and
smells can influence consumer psychology. Store fixtures can be planned based on their uses and
aesthetics. Tables, goods shelves, doors are part of the interior decoration. The shop walls also have
an effect on the atmosphere by choosing different wallpapers in each shop that are adjusted to the
conditions of the store. The right air temperature in the store can also affect the comfort and
satisfaction of consumers in the store (Zhong, et.al, 2020). Store Layout is management in terms of
determining store location and facilities. Shop management must also make use of the shop space as
effectively as possible. Things that need to be considered in designing the layout, namely: the
allocation of floor space for sales in the form of space staff and customer room. In addition, it is
necessary to pay attention to the flow of customer traffic to run. The types of interior displays are as
follows: Assortment Displays: a form of interior displays that is used for a variety of different products
that can influence consumers to see, feel, and try the product. Theme-Setting Display: form of interior
displays that use a specific theme with the aim of building an atmosphere or nuance. Ensemble
Displays: the display form is used for one product pair which is a combination of various products.
Display Rack: display form in the form of hanging products. According to Tjiptono (in Priyo, et.al,
2019)) choosing a physical place / location requires careful consideration of the following factors:
Access, namely a location that is traversed or easily accessible by public transportation. Visibility,
which is a location / place that can be seen clearly from a normal viewing distance. Traffic, by going
through the following two considerations: The large number of people passing by can provide great
opportunities for buying to occur, namely purchasing decisions that occur spontaneously, without
planning, and without going through special efforts. And traffic congestion and congestion can also
be obstacles, and consumers find it difficult to visit the store, the difficulty of consumers visiting the
store will make consumers feel dissatisfied and even disappointed because the location is not strategic.
Spacious, comfortable and safe parking space, both for two-wheeled and four-wheeled vehicles.
Expansion, namely the availability of a large enough space if there is expansion at a later date.
Environment, namely the surrounding area that supports the products being offered. For example,

International Journal of Research in Commerce and Management Studies
ISSN 2582-2292
Vol. 3, No. 05 Sep-Oct; 2021
https://ijrcms.com Page 55
restaurants / restaurants are close to residential areas, campuses, schools, offices, stations, and others.
Competition, namely the location of competitors. In determining the location of a restaurant, you
should consider whether it is on the same street / area as other restaurants. Government regulations,
for example provisions prohibiting restaurants or restaurants that are located too close to residential
areas or places of worship. According to Devi and Fanani (2017) the location variable uses the
following indicators: Location affordability, Smooth access to the location, and Proximity to location.
According to Hadita (2019) consumer satisfaction is the feeling of being happy or disappointed by
someone who appears after comparing the performance or product results that are thought of against
the expected performance. According to Hussain, et.al (2015) consumer satisfaction is a situation
shown by consumers when consumers realize that their needs and desires are in accordance with what
is expected and are well fulfilled.
Research hypothesis:
1. The Effect of Product Quality on Customer Satisfaction
Product quality is one of the main tools used by marketers to determine position. The term quality
affects the product, because product quality is closely related to customer value and satisfaction
(Hadita, 2019). The better the quality of the products provided by the company, the higher the
customer satisfaction. Devi, et.al (2017) and Zaibaf, et.al, 2013) show that product quality has a
positive and significant effect on consumer satisfaction. H1: Product quality has a positive and
significant effect on customer satisfaction.
2. The effect of Price on Customer Satisfaction
The price a company provides will fall somewhere between too low to make a profit and too high to
spark demand (Hadita, 2019). The customer's perception of the value of the product determines the
price limit. If customers think that the price of the product is higher than its value, they will not buy
the product, on the contrary, if the price is equal to or lower than what is obtained, the consumer will
be satisfied. In research conducted by Levy & Weitz, (2012), Homburg, et.al, (2014), Suki, (2017)
and Keiningham, et.al, (2014) that the effect of price has a positive and significant effect on customer
satisfaction. H2: Price has a positive and significant effect on customer satisfaction.
3. The effect of Store Atmosphere on Customer Satisfaction
Store atmosphere is an atmosphere or store environment that can stimulate the five senses of
consumers and influence consumers' perceptions and emotions towards the store. A comfortable shop
atmosphere will make consumers want to stay longer, and feel satisfied from what they feel (Homburg,
2014). In research conducted by Hussain and Ali, (2016), Abrar, et.al. (2017), Jalil, et.al, (2016),
Hasanuddin, (2016) found that store atmosphere has a positive effect on consumer satisfaction,
researchers say that a consumer often assesses a restaurant or cafe on his first impression seen from

International Journal of Research in Commerce and Management Studies
ISSN 2582-2292
Vol. 3, No. 05 Sep-Oct; 2021
https://ijrcms.com Page 56
the atmosphere of the cafe or restaurant, be it a layout, lighting, music, color and layout. H3: Store
atmosphere has a positive and significant effect on customer satisfaction.
4. The effect of Location on Customer Satisfaction
Hadita (2019) reveal that business actors often point to three important factors in retail success, namely
location, location and location. It is imperative that a business actor chooses a location that is
accessible to the target market in an area that is consistent with the retail positioning. In the research
conducted by Putri, (2014), the location partially and simultaneously affects customer satisfaction, if
the location is strategic and easy to reach, consumers will feel happy and satisfied. H4: Location has
a positive and significant effect on customer satisfaction.
RESEARCH METHODOLOGY
Hypothesis testing in this study uses quantitative methods to determine the relationship between
variables of product quality, price, store atmosphere and location on customer satisfaction. The unit
of analysis in this research is the people who already have experience in eating at Kaleyo and Slamet.
The population in this study were people who already had the experience of eating at Kaleyo and
Slamet. The sample used was 200 people who already had the experience of eating at both Kaleyo and
Slamet with purposive sampling technique. Research Instruments using Likert scale provides 5 (five)
alternative answers that can be chosen by the respondent. The validity test is used to measure the
validity of the questionnaire as the basis of the study. According to Ghozali (2018) validity is the
degree of accuracy between data that occurs in the object of research and data that can be reported by
researchers. The measurement of the validity test can be done by comparing the calculated r value
with the r table. The conditions that must be met must have the following criteria: a. If r count> r table
then the questionnaire items (statements or indicators) are valid. b. If r count <r table, the questionnaire
items (statements or indicators) are invalid. In this study, the researcher took few respondents to test
whether the statements on the questionnaire were valid. The researcher conducted tests using the IBM
SPSS version 21 application, by comparing the corrected item-total correlation value for each
statement with r table.

International Journal of Research in Commerce and Management Studies
ISSN 2582-2292
Vol. 3, No. 05 Sep-Oct; 2021
https://ijrcms.com Page 57
Table 1. Quality product (X1) validity
No Item r count Kaleyo r count Slamet r table (5%) Results
1 0,933 0,736
0,361
Valid
2 0,807 0,402
3 0,790 0,509
4 0,534 0,391
5 0,666 0,465
6 0,641 0,442
7 0,622 0,416
8 0,627 0,469
9 0,574 0,655
Based on Table 1, all statements are valid because r count> r table is 0.361.
Table 2. Price (X2) validity
No Item r count Kaleyo r count Slamet r table (5%) Results
1 0,676 0.801
0,361
Valid
2 0,670 0,746
3 0,734 0,743
4 0,705 0,788
5 0.675 0,598
Based on Table 2, all statements are valid because r count> r table is 0.361.
Table 3. Store atmosphere (X3) validity
No Item r count Kaleyo r count Slamet r table (5%) Results
1 0,464 0,508
0,361
Valid
2 0,679 0,551
3 0,543 0,406
4 0,699 0,710
5 0,569 0,631
6 0,716 0,687
7 0,540 0,527
8 0,626 0,608
9 0,576 0,672

International Journal of Research in Commerce and Management Studies
ISSN 2582-2292
Vol. 3, No. 05 Sep-Oct; 2021
https://ijrcms.com Page 58
Based on Table 3, all statements are declared valid because r count> r table is 0.361.
Table 4. Location (X4) validity
No Item r count Kaleyo r count Slamet r table (5%) Results
1 0,631 0,745
0,361
Valid
2 0,581 0,758
3 0,592 0,650
4 0,396 0,537
5 0,516 0,716
6 0,508 0,607
7 0,592 0,777
8 0,529 0,598
9 0,528 0,592
Based on Table 4, all statements are declared valid because r count> r table is 0.361.
Table 5. Consumer satisfaction (Y) validity
No Item r count Kaleyo r count Slamet r tabel (5%) Results
1 0,842 0,576
0,361
Valid
2 0,767 0,607
3 0,598 0,569
4 0,642 0,621
5 0,848 0,542
6 0,552 0,630
7 0,801 0,541
8 0,840 0,756
9 0,764 0,603
Based on Table 5, all statements are declared valid because r count> r table is 0.361.
The purpose of the reliability test is to determine the level of reliability of a questionnaire that
describes the variable indicators. A questionnaire is said to be reliable or reliable if there are two or
more researchers in the same object producing the same data, or a group of data when broken down
into two shows no different data. Tested the reliability using Cronbach's alpha which was calculated
using the SPSS version 21 program. The method used was a Likert scale score of 1 - 5, this test
calculates the alpha coefficient. If the results of the alpha coefficient> a significance level of 60% or

International Journal of Research in Commerce and Management Studies
ISSN 2582-2292
Vol. 3, No. 05 Sep-Oct; 2021
https://ijrcms.com Page 59
0.6 then the coefficient is reliable or good reliability. If the alpha coefficient <60% or 0.6 significance
level, the coefficient is not reliable or the reliability is not good.
Table 6 Reliability instrument test
No Variable Instrument
Cronbach’s
Alpha
Kaleyo
Cronbach’s Alpha
Slamet Results
1 Product quality (X1) 0,867 0,631
Reliable
2 Price (X2) 0,717 0,784
3 Store Atmosphere (X3) 0,781 0,766
4 Location (X4) 0,700 0,844
5 Consumer satisfaction (Y) 0,895
0,785
Based on the Table 6, results of the reliability test indicated by the Cronbach's Alpha value, because
the value is greater than 0.600, all the research instruments tested can be used.
Research result
1 Normality test
This normality test is to determine whether the distribution of the dependent research data results and
the independent variables follows or approaches the normal distribution. The test is intended using the
Kolmogorov Smirnov Test (KS), by comparing the distribution of data to be tested for normality with
the standard normal distribution.
Table 7. Kaleyo’s and Slamet’s One-Sample Kolmogorov-Smirnov Test
Kaleyo’s One-Sample Kolmogorov-
SmirnovTest Unstandardized
Residual N 200
Normal
Parametersa,b
Mean 0,0000000
Std.
Deviation
3,01313566
Most
Extreme
Differences
Absolute 0,067
Positive 0,043
Negative -,067
Kolmogorov-Smirnov Z 0,671
Slamet’s One-Sample Kolmogorov-
Smirnov Test Unstandardized
Residual N 200
Normal
Parametersa,b
Mean ,0000000
Std.
Deviation
2,93517089
Most
Extreme
Differences
Absolute ,050
Positive ,035
Negative -,050
Kolmogorov-Smirnov Z ,504
Asymp. Sig. (2-tailed) ,961

International Journal of Research in Commerce and Management Studies
ISSN 2582-2292
Vol. 3, No. 05 Sep-Oct; 2021
https://ijrcms.com Page 60
Asymp. Sig. (2-tailed) 0,759
a. Test distribution is Normal.
b. Calculated from data.
a. Test distribution is Normal.
b. Calculated from data.
Based on Table 7, the results on Kaleyo significance value is 0.759> 0.05 and Slamet significance
value is 0.961> 0.05. So it can be concluded that the research regression model is normally distributed.
Heteroscedasticity Test
A good regression model is that there is homoscedasticity in the model or in other words there is no
heteroscedasticity. According to [4], test heteroscedasticity does not occur if there is no clear pattern
and the dots spread above and below the 0 on the Y axis.
Dependent variable: Kepuasan konsumen (consumer satisfaction)
Figure 1. Kaleyo’s and Slamet’s Heteroscedasticity Test
Based on Figure 1, the regression model on Kaleyo and Slamet did not experience heteroscedasticity.
Multicollinearity Test
The multicollinearity test is intended to measure whether there is a linear relationship between the
independent variables contained in the regression model. To detect a linear regression model
experiencing multicollinearity or it cannot be checked using variance inflation factor (VIF) for each

International Journal of Research in Commerce and Management Studies
ISSN 2582-2292
Vol. 3, No. 05 Sep-Oct; 2021
https://ijrcms.com Page 61
independent variable, that is, if an independent variable has a tolerance value> 0.10 and a VIF value
<10.00.
Table 8. Kaleyo’s and Slamet’s multicolliearity test
Coefficientsa Model Kaleyo’s Collinearity statistics Slamet’s Collinearity statistics
Tolerance VIF Tolerance VIF
1 (Constant)
Product quality ,932 1,073 ,804 1,244
Price ,882 1,134 ,766 1,305
Store Atmp. ,800 1,249 ,805 1,243
Location ,860 1,163 ,802 1,247
a. Dependent Variable: Consumer Satisfaction
Based on the Table 8, all independent variables in the Kaleyo and Slamet study did not occur
multicollinearity because they had a tolerance value> 0.10 and had a VIF value <10.00.
Multiple Linear Regression Analysis
Multiple linear regression test was conducted to determine the effect of independent variables on the
dependent variable.
Table 9. Kaleyo’s and Slamet’s Unstandardized Coefficients
Coefficientsa Model Kaleyo’s Unstandardized
Coefficients Slamet’s Unstandardized Coefficients
B Standard error B Standard error
1 (Constant) 2,002 4,465 5,344 3,368
Product quality ,253 ,072 ,276 ,078
Price ,563 ,131 ,251 ,120
Store Atmp. ,204 ,089 ,269 ,076
Location ,210 ,096 ,169 ,076
a. Dependent Variable: Consumer Satisfaction
Based on Table 9, Kaleyo’s regression: Y = 2,002 + 0,253X1 + 0,563X2 + 0,204X3 + 0,210X4, From
this equation it can be seen that:
a. The constant value is 2.002. This means that if the variable product quality, price, store
atmosphere, and location has a value of 0, then the value of customer satisfaction is 2.002;

International Journal of Research in Commerce and Management Studies
ISSN 2582-2292
Vol. 3, No. 05 Sep-Oct; 2021
https://ijrcms.com Page 62
b. Product quality regression coefficient (b1) of 0.253. This means that if the variable product quality
increases by one unit, it will affect changes in customer satisfaction by 0.253;
c. The price regression coefficient (b2) is 0.563. This means that if the price variable increases by
one unit, it will affect changes in consumer satisfaction by 0.563;
d. Store atmosphere regression coefficient (b3) of 0.204. This means that if the store atmosphere
variable increases by one unit, it will affect changes in customer satisfaction by 0.204;
e. The location regression coefficient (b4) is 0.210. This means that if the location variable increases
by one unit, it will affect changes in customer satisfaction by 0.210.
Slamet’s regression: Y = 5,344 + 0,276X1 + 0,251X2 + 0,269X3 + 0,169X4, From this equation it can
be seen that the equation can be seen that:
a. The constant value is 5,344. This means that if the variable product quality, price, store
atmosphere, and location is 0, then the customer satisfaction value is 5,344;
b. Product quality regression coefficient (b1) of 0.276. This means that if the variable product quality
increases by one unit, it will affect changes in customer satisfaction by 0.276;
c. The price regression coefficient (b2) is 0.251. This means that if the price variable increases by
one unit, it will affect changes in customer satisfaction by 0.251;
d. Store atmosphere regression coefficient (b3) of 0.269. This means that if the store atmosphere
variable increases by one unit, it will affect changes in customer satisfaction by 0.269;
e. The location regression coefficient (b4) is 0.169. This means that if the location variable increases
by one unit, it will affect changes in customer satisfaction by 0.169.
Determination Coefficient
In this study, the coefficient of determination serves to determine the percentage of the influence of
independent and independent variables, this is shown by the magnitude of the coefficient of
determination (R2) between 0 (zero) to 1 (one).
Table 10. Kaleyo’s and Slamet’s Determination Coefficient
Kaleyo’s Determination Coefficient Slamet’s Determination Coefficient
Model R R
Square
Adjusted
R Square Std. Error of
the Estimate
1 ,663a ,439 ,415 3,076
Model R R
Square
Adjusted
R
Square
Std. Error
of the
Estimate
1 ,678a ,460 ,437 2,996
Based on Table 10, Adjusted R Square is 0.415. This shows that 41.5% of Kaleyo product consumer
satisfaction is influenced by product quality variables (X1), price variables (X2), store atmosphere

International Journal of Research in Commerce and Management Studies
ISSN 2582-2292
Vol. 3, No. 05 Sep-Oct; 2021
https://ijrcms.com Page 63
variables (X3), and location variables (X4). While the remaining 58.5% of customer satisfaction of
Kaleyo is influenced by other variables not examined in this study. The coefficient of determination
(Adjusted R Square) is 0.437. Slamet coefficient determination shows 43.7% of customer satisfaction
is influenced by product quality variables (X1), price variables (X2), store atmosphere variables (X3),
and location variables (X4). While the remaining 56.3% of customer satisfaction of Slamet products
is influenced by other variables not examined in this study.
T test hypothesis results
In this study, the t test was carried out to determine whether the independent variables partially had
an influence on the dependent variable. In this t test used the 95% degree of confidence.
Table 11. Kaleyo’s and Slamet’s t test results
Coefficientsa Model Kaleyo’s Coefficients Slamet’s Coefficients
t Sig. t Sig.
1 (Constant) ,448 ,655 1,587 ,116
Product quality 3,512 ,001 3,562 ,001
Price 4,286 ,000 2,098 ,039
Store Atmp 2,290 ,024 3,526 ,001
Location 2,186 ,031 2,222 ,029
a. Dependent Variable: Consumer Satisfaction
Based on the Table 11, Kaleyo t-test can be explained that the t value of Product Quality (X1) is 3.512
> t table 1.985, so partially the Product Quality variable has a significant effect in increasing Consumer
Satisfaction (Y). The t value of the Price (X2) is 4.286> t table 1.985 means that partially the price
variable has an effect on increasing Customer Satisfaction (Y). The t value of the Store Atmosphere
(X3) is 2,290 > t table 1,985, which means that partially the Store Atmosphere variable has an effect
on increasing Customer Satisfaction (Y). The t value of the Location (X4) is 2.186 > t table 1.985,
which means that partially the Location variable has an effect on increasing Customer Satisfaction
(Y).
The results of the t-test on Slamet can be explained that the t value of Product Quality (X1) is 3.562 >
t table 1.985, so partially the Product Quality variable has a significant effect in increasing Customer
Satisfaction (Y). The t value of the Price (X2) is 2.098 > t table 1.985 means that partially the price
variable has an effect on increasing customer satisfaction (Y). The t value of the Store Atmosphere
(X3) is 3.526 > t table 1.985, which means that partially the Store Atmosphere variable has an effect
on increasing customer satisfaction (Y). The t value of the Location (X4) is 2.222 > t table 1.985,
which means that partially the location variable has an effect on increasing customer satisfaction (Y).

International Journal of Research in Commerce and Management Studies
ISSN 2582-2292
Vol. 3, No. 05 Sep-Oct; 2021
https://ijrcms.com Page 64
F test hypothesis results
In this study, the F test was conducted to test whether the independent variables simultaneously had
an influence on the dependent variable. In this F test, 95% confidence level is used.
Table 12. Kaleyo’s and Slamet’s F test results
Kaleyo’s ANOVAa Slamet’s ANOVAa
Model Sum of
Squares
df Mean
Squar
e
F
Sig.
1
Regressi
on
Residual
Total
703,2
898,80
1602,1
1
0
4
9
5
9
9
175,82
3
9,461
18,58
3
,000
b
Model Sum of
Squares
d
f
Mean
Square
F Sig.
1
Regressi
on
Residual
Total
726,09
2
852,90
8
1579,0
00
4
95
99
181,523
8,9
78
20,21
9
,000
b
a. Dependent Variable: Consumer Satisfaction
b. Predictors: (Constant), Product quality, Price, Store Atmosphere, Location
Based on the Table 12, the value of Kaleyo F counts as 18.583 > F table 2.47 with a probability of
0.000 < 0.05 means that the variables of product quality, price, store atmosphere, and location
simultaneously have a significant positive effect in increasing customer satisfaction. The value of
Slamet F counts as 20.219 > F table 2.47 with a probability of 0.000 < 0.05 means that the variables
of product quality, price, store atmosphere, and location simultaneously have a significant positive
effect in increasing customer satisfaction.
DISCUSSION
Product Quality has a significant positive effect in increasing Customer Satisfaction in Kaleyo and
Slamet. Hypothesis 1 test results the variable product quality in Kaleyo has t count 3.512 > t table
1.985 means that product quality partially significant effect in increasing customer satisfaction. Slamet
has a value of t count 3.562 > t table 1.985 means that product quality partially significant effect in
increasing consumer satisfaction. In accordance with Jalil, et.al, (2016) which shows that product
quality has a positive and significant effect on consumer satisfaction. Product quality is one of the
main tools used by marketers to determine the appropriate position even more than what consumers
want (Hadita, 2017).
Price has a significant positive effect in increasing Consumer Satisfaction in Kaleyo and Slamet.
Hypothesis 2 test results the variable price on the Kaleyo has a t count of 4.286 > t table 1.985 means
International Journal of Research in Commerce and Management Studies
ISSN 2582-2292
Vol. 3, No. 05 Sep-Oct; 2021
https://ijrcms.com Page 65
that price has a positive and partially significant effect in increasing customer satisfaction. Slamet has
a t count of 2.098 > t table 1.985 means that the price has a positive and significant partially significant
in increasing customer satisfaction. In accordance with Levy & Weitz, (2012). Price has a positive
effect on consumer satisfaction. Price is the sum of all value provided by customers to benefit from
owning or using a product or service (Hadita, 2017).
Store Atmosphre has a significant positive effect in increasing consumer satisfaction in Kaleyo and
Slamet. Hypothesis 3 test results the store atmosphere variable in Kaleyo has a t count of 2,290 > t
table 1,985 means that store atmosphere has a positive and partially significant effect in increasing
customer satisfaction. Slamet has a t count of 3.526 > t table 1.985, meaning that the store atmosphere
has a positive and significant effect partially in increasing customer satisfaction. In accordance with
the results of research conducted by Hasanuddin, (2016). Store Atmosphere has a positive effect on
customer satisfaction. Store atmosphere is an atmosphere or store environment that can stimulate
consumers' five senses and influence the perceptions and emotions of consumers (Homburg, et.al,
2014).
Location has a significant positive effect in increasing consumer satisfaction in Kaleyo and Slamet.
Hypothesis 4 test results the location variable in the Kaleyo has a t count of 2.186 > t table 1.985
means that the location has a positive and significant effect partially in increasing customer
satisfaction. Slamet has a t count of 2.222 > t table 1.985, meaning that location has a positive and
partially significant effect in increasing customer satisfaction. In accordance with Keiningham,
(2014), location partially and simultaneously has a positive effect on customer satisfaction. Location
including the activities of companies that make products available to target consumers (Hadita, 2019).
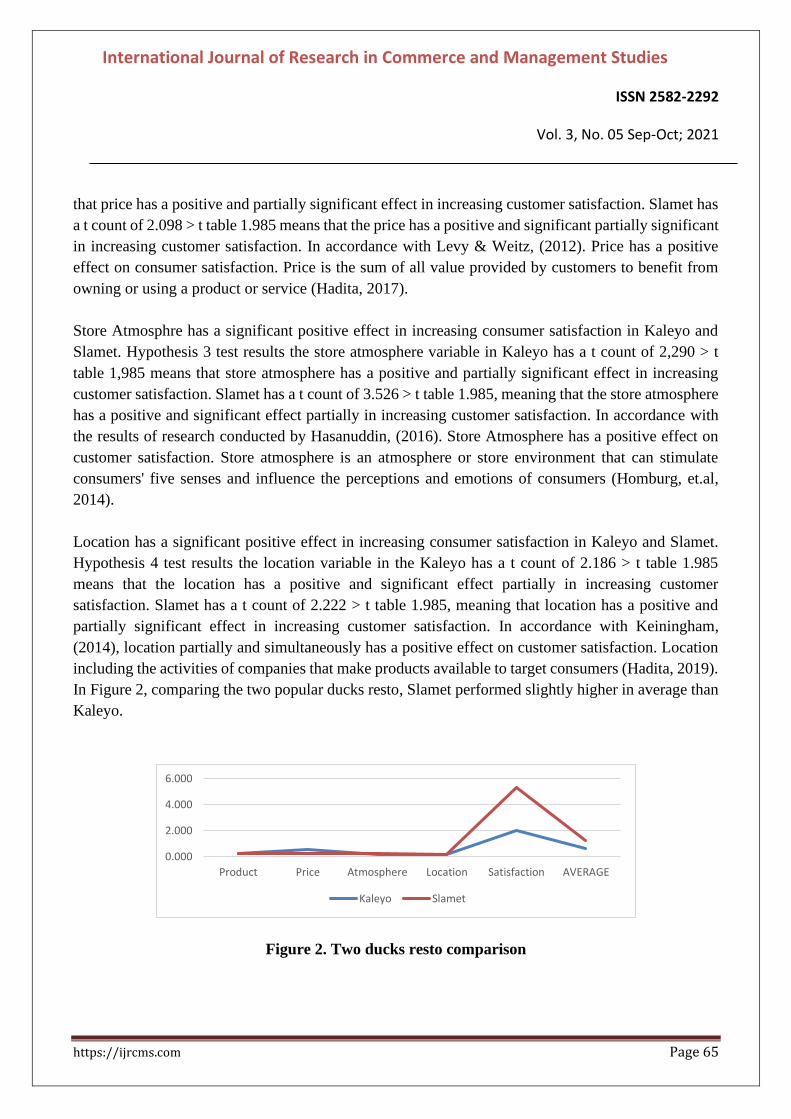
In Figure 2, comparing the two popular ducks resto, Slamet performed slightly higher in average than
Kaleyo.
Figure 2. Two ducks resto comparison
0.000
2.000
4.000
6.000
Product Price Atmosphere Location Satisfaction AVERAGE
Kaleyo Slamet

International Journal of Research in Commerce and Management Studies
ISSN 2582-2292
Vol. 3, No. 05 Sep-Oct; 2021
https://ijrcms.com Page 66
CONCLUSION
Kaleyo Product quality 25.3 unit lower than Slamet’s 27.6 unit. Kaleyo Price 56.3 unit higher than
Slamet’s 25.1 unit. Kaleyo Store atmosphere 20.4 unit lower than Slamet’s 26.9 unit. Kaleyo location
21.0 unit higher than Slamet’s 16.9 unit. Kaleyo another variables 2,002 unit lower than Slamet’s
5,344 unit. Consumer couldn’t differentiate the two most popular duck resto. Customer delighted with
their differentiation. Needs other information to make them different.
Research Implications/Recommendations
1. According quality, Kaleyo should increase the aroma of duck meat so that it can increase consumer
appetite and Slamet should innovate or add to the processing of duck meat.
2. According pricing, Kaleyo should offer a better price so that the purchasing power of consumers
will increase. Slamet should review the price offer.
3. According atmosphere, Kaleyo should re-arrange the layout, such as the cashier layout not to close
to the entrance door, it could slightly disturbing consumer access and it reduces comfort. Slamet
should pay attention to the lighting in the restaurant, so that it is not too dark but not too bright,
4. According location, Kaleyo and Slamet should make more parking spaces or offers valet services.
5. This research is useful as an input for comparing between similar products and how to make it
different.
REFERENCES
Abrar, Kashif; Zaman, Sobia; and Satti, Zoya Wajid. (2017) Impact of Online Store Atmosphere,
Customized Information and Customer Satisfaction on Online Repurchase Intention. lobal
Management Journal for Academic & Corporate Studies 7 (2).
https://gmjacs.bahria.edu.pk/index.php/ojs/article/view/29
Berman, B. & Joel, R. E. (2010). Retail Management: A Strategic Approach. 12th Ed. Jakarta, Pearson.
https://www.hestanto.web.id/store-atmosphere/
Devi, S., Suharyono, and Dahlan Fanani (2017). Pengaruh Store Atmosphere dan Kualitas Produk
Terhadap Kepuasan Pelanggan Studi pada Pelanggan Cafe OTW Food Street Malang. Jurnal
Administrasi Bisnis. 52(1)
http://administrasibisnis.studentjournal.ub.ac.id/index.php/jab/article/view/2161
Elliot, Andrew J. (2015) Color and psychological functioning: a review of theoretical and empirical
work, Front Psychol. 6: 368. doi: 10.3389/fpsyg.2015.00368
Gaol, A. L., Kadarisman Hidayat, and Sunarti (2016). Pengaruh Kualitas Produk Terhadap Tingkat
Kepuasan Konsumen dan Loyalitas Konsumen Smartphone Samsung. Jurnal Administrasi
Bisnis. 38(1).
https://media.neliti.com/media/publications/87302-ID-pengaruh-kualitas-produk-terhadap-
tingka.pdf
Ghozali, I. (2018). Aplikasi Analisis Multivariate dengan Program SPSS 25. Badan Penerbit

International Journal of Research in Commerce and Management Studies
ISSN 2582-2292
Vol. 3, No. 05 Sep-Oct; 2021
https://ijrcms.com Page 67
Universitas Diponegoro, Semarang. Diperoleh dari:
https://bbs.binus.ac.id/management/2019/12/analisis-uji-asumsi-klasik/
Hadita. (2019). Promosi dan Harga pada Kepuasan Pelanggan Restoran Fast Food. Jurnal Bisnis dan
Manajemen. 3(1) pp. 25-38.
https://ejournal.unitomo.ac.id/index.php/manajemen/article/view/1431
Hasanuddin, M. (2016). Analisis Pengaruh Kualitas Pelayanan, Lokasi dan Harga terhadap Kepuasan
Nasabah Melalui Keputusan Pembelian Sebagai Variabel Intervening pada Penjualan Logam
Mulia Emas. Jurnal Riset Bisnis Manejemen. 4(1) pp. 49-66.
https://ejournal.unsrat.ac.id/index.php/jrbm/article/view/12351
Homburg, Christian; Jan Allmann, Martin Klarmann. (2014) Internal and external price search in
industrial buying: The moderating role of customer satisfaction. Journal of Business Research,
67(8):1581-1588, https://doi.org/10.1016/j.jbusres.2013.10.003 .
Hussain, Riaz and Ali, Mazhar (2015). Effect of Store Atmosphere on Consumer Purchase Intention.
International Journal of Marketing Studies, 7(2): pp. 35-42 https://mpra.ub.uni-
muenchen.de/id/eprint/72707
Jalil,Nur Aina Abdul, Amily Fikry, and Anizah Zainuddin. (2016) The Impact of Store Atmospherics,
Perceived Value, and Customer Satisfaction on Behavioural Intention, Procedia Economics and
Finance, 37:538-544. https://doi.org/10.1016/S2212-5671(16)30162-9 .
Jang H-W and Lee S-B. (2019) Applying Effective Sensory Marketing to Sustainable Coffee Shop
Business Management. Sustainability. 11(22) 6430. https://doi.org/10.3390/su11226430
Keiningham, Timothy; Gupta, Sunil; Aksoy, Lerzan; Buoye, Alexander. (2014) The High Price of
Customer Satisfaction. MIT Sloan Management Review; Cambridge. 55(3), 37-46.
https://sloanreview.mit.edu/article/the-high-price-of-customer-satisfaction/
Kotler, P. & Armstrong. (2018). Principles of Marketing. Edisi 15 Global Edition. Pearson.
Kristiana, M. & Muhammad. E. (2017). Pengaruh Store Atmosphere dan Kualitas Layanan terhadap
Kepuasan Konsumen Cafe Heerlijk Gelato Perpustakaan Bank Indonesia Surabaya. Jurnal
Pendidikan Tata Niaga. 1(01).
https://jurnalmahasiswa.unesa.ac.id/index.php/jptn/article/view/18415
Levy, M. & Weitz, B. A. (2012). Retailing Management. New York. America: McGraw-Hill/Irwin.
https://www.hestanto.web.id/store-atmosphere/
Nurhanifah, A. & Sutopo. (2014). Analisis Pengaruh Kualitas Pelayanan, Promosi, dan Lokasi
terhadap Kepuasan Konsumen Studi Kasus pada PT Maharani Tri Utama Mandiri Cabang
Semarang. Diponegoro Journal of Management. 3(4)
https://ejournal3.undip.ac.id/index.php/djom/article/view/12912/12515
Pahlawan, M. R., et al. (2019). Pengaruh Kualitas Produk dan Kualitas Pelayanan terhadap
Peningkatan Kepuasan dan Loyalitas Pelanggan Perusahaan Daerah Air Minum Kota Makassar.
Journal of Business Administration. 3(2)
https://jurnal.polibatam.ac.id/index.php/JABA/article/view/1560

International Journal of Research in Commerce and Management Studies
ISSN 2582-2292
Vol. 3, No. 05 Sep-Oct; 2021
https://ijrcms.com Page 68
Priyo, J.S. & Mohamad, Bahtiar & Adetunji, Raji. (2019). An examination of the effects of service
quality and customer satisfaction on customer loyalty in the hotel industry. International Journal
of Supply Chain Management. 8. 654-663.
https://www.researchgate.net/publication/332166604_An_examination_of_the_effects_of_serv
ice_quality_and_customer_satisfaction_on_customer_loyalty_in_the_hotel_industry/citation/d
ownload
Putri, Lili Harlina (2014). Pengaruh Store Atmosphere terhadap Keputusan Pembelian dan Kepuasan
Pelangan Studi Pada Monopoli Cafe and Resto Soekarno Hatta Malang. Jurnal Administrasi
Bisnis. 15(2) http://administrasibisnis.studentjournal.ub.ac.id/index.php/jab/article/view/640
Reguia, C. (2014). Product Innovation And The Competitive Advantage. European Scientific Journal,
10(10). https://doi.org/10.19044/esj.2014.v10n10p%p
Roschk H and Hosseinpour M. (2020) Pleasant Ambient Scents: A Meta-Analysis of Customer
Responses and Situational Contingencies. Journal of Marketing. 2020;84(1):125-145.
doi:10.1177/0022242919881137
Sabran, Bob (2012). Manajemen Pemasaran. Penerbit: Erlangga.
Setiawan, R., Rusno, R., & Nurfarida, I. N. (2020). Pengaruh Kualitas Pelayanan, Harga dan Store
Atmosphere terhadap Kepuasan Konsumen (Studi pada konsumen Cokelat Klasik Cafe &
Garden Sulfat Malang). Jurnal Riset Mahasiswa Manajemen, 4(2).
https://doi.org/10.21067/jrmm.v4i2.4039
Sintya, L. I., et al. (2018). Pengaruh Harga dan Kualitas Layanan terhadap Kepuasan Pelanggan Jasa
Transportasi Go-jek Online pada Mahasiswa FEB Unsrat Manado. Jurnal EMBA. 6(3)
https://ejournal.unsrat.ac.id/index.php/emba/article/view/20462
Sugiyono. (2017). Metode Penelitian Kuantitatif, Kualitatif, dan R&D. Bandung: CV Alfabeta.
https://widisudharta.weebly.com/metode-penelitian-skripsi.html
Suki, Norazah Mohd (2017) Green products usage: structural relationships on customer satisfaction
and loyalty, International Journal of Sustainable Development & World Ecology, 24:1, 88-95,
DOI: 10.1080/13504509.2016.1169563
Sumardi, Surya, Catarina Cori, Pradnya Paramita (2018) Pengaruh Kualitas Pelayanan, Harga Dan
Store Atmosphere Terhadap Kepuasan Pelanggan Warunk Upnormal Wilayah Jakarta Utara,
Journal for Business and Entrepreneur, 2(2), pp. 1-11.
http://journal.uta45jakarta.ac.id/index.php/JBE/article/view/1728/1163
Sunarti. & Teddy, C. (2019). Analysis of Effects of Products, Price, Promotion and Place on
Purchasing Decision of Vivo Smartphone in Pekanbaru. Jurnal Akuntansi, Kewirausahaan, dan
Bisnis. 4(1). www.ejournal.pelitaindonesia.ac.id
Tarinda, R. & Achmad, Z. (2018). Pengaruh Lokasi dan Kualitas Pelayanan terhadap Kepuasan
Pelanggan pada Scissors Barbershop Malang. Jurnal Aplikasi Bisnis. 4(1).
http://jab.polinema.ac.id/index.php/jab/article/view/173
Vahie, Archana and Paswan, Awdhesh (2006). Private label brand image: its relationship with store

International Journal of Research in Commerce and Management Studies
ISSN 2582-2292
Vol. 3, No. 05 Sep-Oct; 2021
https://ijrcms.com Page 69
image and national brand. International Journal of Retail & Distribution Management 34(1),
67-84. DOI 10.1108/09590550610642828
Zaibaf, Mehdi, Taherikia, Fariz, & Fakharian, Meysam (2013) Effect of Perceived Service Quality on
Customer Satisfaction in Hospitality Industry: Gronroos’ Service Quality Model Development,
Journal of Hospitality Marketing & Management, 22:5, 490-504, DOI:
10.1080/19368623.2012.670893
Zhong, Yongping and Moon, Hee Cheol (2020) What Drives Customer Satisfaction, Loyalty, and
Happiness in Fast-Food Restaurants in China? Perceived Price, Service Quality, Food Quality,
Physical Environment Quality, and the Moderating Role of Gender, Foods, 9:460;
doi:10.3390/foods9040460