Cross-Category Variation in Customer Satisfaction and Retention
12
Marketing Letters 5:1, (1994): 19-30 © 1994 Kluwer Academic Publishers, Manufactured in the Netherlands. Cross-Category Variation in Customer Satisfaction and Retention EUGENE W. ANDERSON* Assistant Professor of Marketing, School of Business Administration, The University of Michigan, 701 Tappan Street, Ann Arbor, M148104, (313) 763-1566, fax (313) 763-5688 Key words: customer satisfaction, repurchase likelihood, goods vs. services A bstract Perceived quality, expectations, customer satisfaction, and effect of customer satisfaction on re- purchase likelihood are found to be higher for products than for services, but repurchase likelihood for products is lower. Retailers have the highest repurchase likelihood and score lowest on the other variables. A set of relevant category characteristics is used to further understand variation in both the levels of these variables and their relationships. QuMity, expectations, satisfaction, and satisfaction's effect on repurchase are higher - and repurchase likelihood is lower - when compe- tition, differentiation, involvement, or experience is high and when switching eosts, difficulty of standardization, or ease of evaluating quality is low. 1. Introduction Customer satisfaction is widely used in evaluating business performance both in- ternally and externally. Internally, customer satisfaction is used to monitor per- formance, allocate resources, and compensate employees. Externally, customer satisfaction provides information to a wide fange of interest groups, including customers, competitors, investors, and public policy makers. These parties may use customer satisfaction to assess a firm's quality, degree of vutnerability to com- petition, value of intangible customer assets, and contribution to general eco- nomic welfare. However, is it reasonable to directly compare customer satisfaction across cat- egories? For example, what if customer satisfaction is relatively easy to achieve or relatively more important in one category compared to another? Understanding such differences has implications for firms making decisions concerning more than one category (such as evaluating performance of category managers oo de- ciding where to invest in improving quality), for investors and policy makers eval- uating the relative performance of firms and industries, and eren for customers *The author gratefully acknowledges the data provided through the funding of the Swedish Post Office and the support of the National Quality Research Center at the University of Michigan Business School. This research has benefitted from the comments of Claes Fornell, Michael D. Johnson, Donald R. Lehmann, Mary Sullivan, and participants in the Customer Satisfaction Work- shop at the University of Michigan Business School.
Transcript of Cross-Category Variation in Customer Satisfaction and Retention

Marketing Letters 5:1, (1994): 19-30 © 1994 Kluwer Academic Publishers, Manufactured in the Netherlands.
Cross-Category Variation in Customer Satisfaction and Retention
EUGENE W. ANDERSON* Assistant Professor of Marketing, School of Business Administration, The University of Michigan, 701 Tappan Street, Ann Arbor, M148104, (313) 763-1566, fax (313) 763-5688
Key words: customer satisfaction, repurchase likelihood, goods vs. services
A bstract
Perceived quality, expectations, customer satisfaction, and effect of customer satisfaction on re- purchase likelihood are found to be higher for products than for services, but repurchase likelihood for products is lower. Retailers have the highest repurchase likelihood and score lowest on the other variables. A set of relevant category characteristics is used to further understand variation in both the levels of these variables and their relationships. QuMity, expectations, satisfaction, and satisfaction's effect on repurchase are higher - and repurchase likelihood is lower - when compe- tition, differentiation, involvement, or experience is high and when switching eosts, difficulty of standardization, or ease of evaluating quality is low.
1. Introduction
Customer satisfaction is widely used in evaluating business performance both in- ternally and externally. Internally, customer satisfaction is used to monitor per- formance, allocate resources, and compensate employees. Externally, customer satisfaction provides information to a wide fange of interest groups, including customers, competitors, investors, and public policy makers. These parties may use customer satisfaction to assess a firm's quality, degree of vutnerability to com- petition, value of intangible customer assets, and contribution to general eco- nomic welfare.
However, is it reasonable to directly compare customer satisfaction across cat- egories? For example, what if customer satisfaction is relatively easy to achieve or relatively more important in one category compared to another? Understanding such differences has implications for firms making decisions concerning more than one category (such as evaluating performance of category managers oo de- ciding where to invest in improving quality), for investors and policy makers eval- uating the relative performance of firms and industries, and eren for customers
*The author gratefully acknowledges the data provided through the funding of the Swedish Post Office and the support of the National Quality Research Center at the University of Michigan Business School. This research has benefitted from the comments of Claes Fornell, Michael D. Johnson, Donald R. Lehmann, Mary Sullivan, and participants in the Customer Satisfaction Work- shop at the University of Michigan Business School.

20 EUGENE W. ANDERSON
comparing "independent" ratings of options from different categories (such as whether to spend this year's bonus on a wide-screen television or a rnountain bike).
The purpose of this paper is to investigate cross-category variation in custorner satisfaction, as well as its antecedents (perceived quality, expectations, and dis- confirrnation) and consequences (in this case, repurchase likelihood). The re- search focus is on both the levels of these variables and their relationships. The objective is to deterrnine whether systernatic variation exists and, if so, to begin the process of understanding its nature.
2. The antecedents and consequences of customer satisfaction
Custorner satisfaction has received considerable attention frorn researchers in marketing (e.g., Oliver, 1980; Churchill and Suprenant, 1982; Oliver and DeSarbo, 1988; Yi, 1991; Fornell, 1992; Anderson and Sullivan, 1993). A review of this research suggests that custorner satisfaction is generally construed to be a postconsumption evaluation dependent on perceived quality or value, expecta- tions, and confirmation/disconfirrnation - the degree (if any) of discrepancy be- tween actual and expected quality (Yi, 1991). Moreover, custorner satisfaction may concern a specific transaction or pertain to an overall evaluation of a partic- ular brand or firm (Oliver, 1980; Johnson and Fornell, 1991; Anderson and For- nell, 1993).
If there is a single phenomena comrnon to studies of customer satisfaction, it is confirrnation/discomfirrnation (C/D) (Yi, 1991). C/D suggests that custorners com- pare the quality they experience with a norm or standard, such as prepurchase expectations about a particular product. Any perceived discrepancy between the two leads to increased or decreased satisfaction (Oliver, 1980). Moreover, as rnight be expected from prospect theory, quality that falls short of expectations has been found to have a greater effect on satisfaction than quality that exceeds expectations (Anderson and Sullivan, 1993).
Expectations a r e a second direct antecedent of custorner satisfaction. Oliver (1980) argues that expectations provide an anchor and C/D provides an adjustrnent in deterrnining custorner satisfaction. In addition, expectations contain informa- tion about future quality affecting customer satisfaction and likelihood of repur- chase (Anderson, Fornell, and Lehrnann, 1993). For exarnple, expectations re- garding the continued reliability of an automobile, prompt service for insurance clairns, or anticipated but unforeseen benefits of owning a personal computer rnay affect current satisfaction with a particular supplier.
A third antecedent of customer satisfaction is quality. As rnight be expected, quality has been shown to have a positive effect on custorner satisfaction (Chur- chill and Suprenant, 1982; Oliver and DeSarbo, 1988; Fornell, 1992). In fact, sev- eral studies suggest that quality's effect on customer satisfaction is often greater than the effect of either C/D or expectations (Churchill and Suprenant, 1982; Oliver and DeSarbo, 1988; Anderson and Sullivan, 1993).
CROSS-CATEGORY VARIATION IN CUSTOMER SATISFACTION AND RETENTION 21
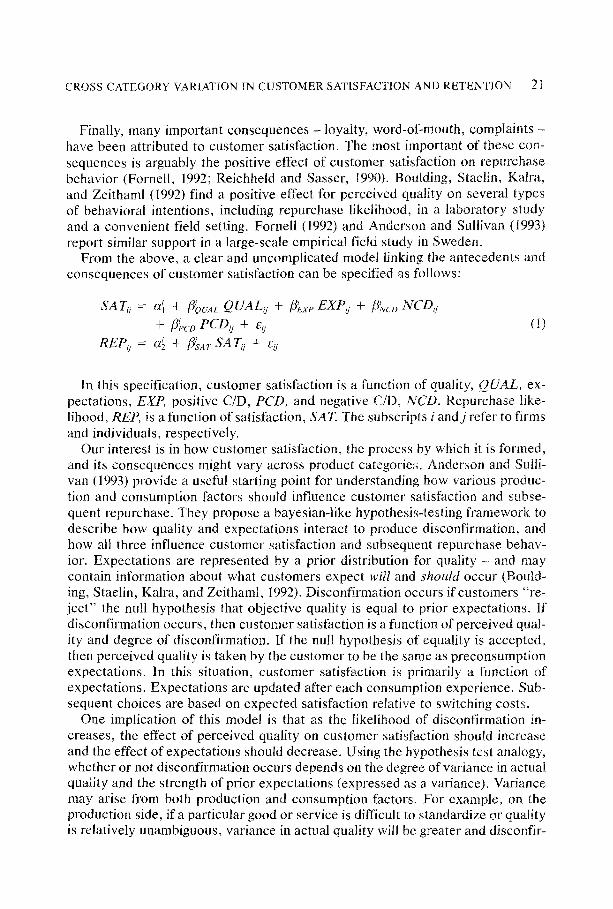
Finally, many irnportant consequences - loyalty, word-oßrnouth, cornplaints - have been attributed to custorner satisfaction. The most irnportant of these con- sequences is arguably the positive effect of custorner satisfaction on repurchase behavior (Fornell, 1992; Reichheld and Sasser, 1990). Boulding, Staelin, Kalra, and Zeitharnl (1992) find a positive effect for perceived quality on several types of behavioral intentions, including repurchase likelihood, in a laboratory study and a convenient field setting. Fornell (1992) and Anderson and Sullivan (1993) report sirnilar support in a large-scaIe ernpirical field study in Sweden.
From the above, a clear and uncomplicated model linking the antecedents and consequences of custorner satisfaction can be specified as follows:
" i S A T U = a] + fiQ~aL QUAL« + fi~xP EXPii + fl~«D NCD«
+ fi~ct)PCDo + Eo- REP o = a~2 + 13~SAr SAT• + eij
(l)
In this specification, custorner satisfaction is a function of quality, QUAL, ex- pectations, EXP, positive C/D, PCD, and negative C/D, NCD. Repurchase like- |ihood, REP, is a function of satisfaction, SAT. The subscripts i andj refer to firrns and individuals, respectively.
Our interest is in how custorner satisfaction, the process by which it is formed, and its consequences rnight vary across product categories. Anderson and Sulli- ran (1993) provide a useful starting point for understanding how various pvoduc- tion and consurnption factors should influence custorner satisfaction and subse- quent repurchase. They propose a bayesian-like hypothesis-testing framework to describe how quality and expectations interact to produce disconfirmation, and how all three influence customer satisfaction and subsequent repurchase behav- ior. Expectations are represented by a prior distribution for quality - and rnay contain information about what custorners expect will and should occur (13ould- ing, Staelin, Kalra, and Zeitharnl, 1992). Di sconfirmation occurs if customers "re- ject" the null hypothesis that objective quality is equal to prior expectations. If disconfirmation occurs, then customer satisfaction is a function of perceived qual- ity and degree of disconfirrnation. If the null hypothesis of equality is accepted, then perceived quality is taken by the customer to be the sarne as preconsumption expectations. In this situation, customer satisfaction is prirnarily a function of expectations. Expectations are updated after each consumption experience. Sub- sequent choices are based on expected satisfaction relative to switching costs.
One irnplication of this rnodel is that as the likelihood of disconfirmation in- creases, the effect of perceived quality on customer satisfaction should increase and the effect of expectations should decrease. Using the hypothesis test analogy, whether or not disconfirrnation occurs depends on the degree of variance in actual quality and the strength of prior expectations (expressed as a variance). Variance rnay arise frorn both production and consurnption factors. For exarnple, on the production side, if a particular good or service is difficult to standardize or quality is relatively unambiguous, variance in actual quality will be greater and disconfir-

22 EUGENE W. ANDERSON
marion more likely to occur. On the consumption side, if customers are more likely to perceive variance in production - perhaps due to involvement or exper- tise - then prior expectations will be tighter and disconfirmation will be more likely to occur.
Cross-category variation may also depend on structural market factors, such as the degree of product differentiation relative to customer heterogeneity, rivalry, or competitiveness within a category, frequency of usage, and switching costs. In terms of product differentiation, if customers have ideal points distant from avail- able products or services, then perceived quality is likely to have a relatively greater effect on satisfaction - disconfirmation of ideal expectations. Hence, when there is less differentiation relative to heterogeneity in a category, we might expect perceived quality to be more important. If there is a strong match between producers' offerings and customer ideal points, then expectations should be higher and more important in determining satisfaction (Anderson and Sullivan, 1993). Obviously, under these conditions, quality, expectations, and satisfaction should also be higher (Johnson and Forneli, 1991).
Competitiveness, as measured by degree of concentration, may affect the level of satisfaction in an industry, as well as the importance of the various antecedents. For example, Fornell and Robinson (1983) find that greater concentration reduces satisfaction. Conversely, as competition increases, firms should deliver higher quality to customers and, consequently, higher satisfaction. Moreover, as concen- tration decreases, satisfaction should increase as customers may search for higher-quality products over time (Anderson and Sullivan, 1993).
Frequency of usage and accumulated experience should influence customer sat- isfaction. Frequency of usage should imply that customers have relatively accu- rate priors and have learned which products match their preferences. Hence, dis- confirmation should be lower, and quality, satisfaction, and repurchase intentions should be higher (Anderson and Sullivan, 1993). Moreover, these later variables should be higher due to customer avoidance of products they dislike over time, as weil as habituation and familiarity (Johnson and Fornell, 1991).
Finally, repurchase intentions should also be higher when switching costs are high (Fornell, 1992; Anderson and Sullivan, 1993). Moreover, demand should be less sensitive to customer satisfaction. Hence, firms should have less incentive to provide high quality, and satisfaction should be correspondingly lower.
3. Cross-category variation in customer satisfaction
A data base suitable for investigating the preceding issues is available from the Swedish Customer Satisfaction Barometer (SCSB) project managed jointly by the National Quality Research Center at the University of Michigan and the Center for Studies of Quality and Productivity at the Stockholm School of Economics. The firms in the study are all major competitors in a wide variety of categories. The services sector includes Airlines, Banking (Public & Business), Charter Travel, Insurance (Life, Auto & Business), Mailorder Houses, Newspapers, and
CROSS-CATEGORY VARIATION IN CUSTOMER SATISFACTION AND RETENTION 23
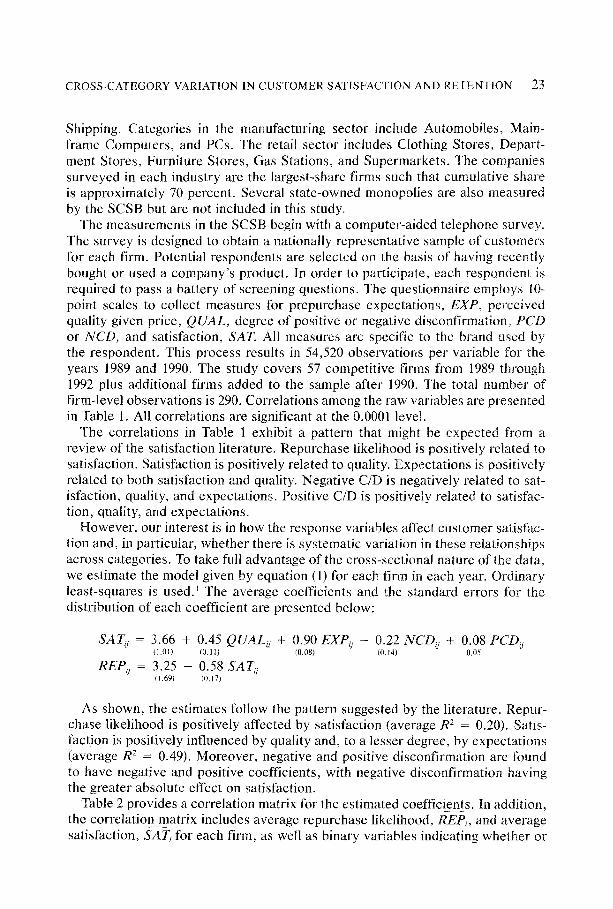
Shipping. Categories in the manufacturing sector inctude Automobiles, Main- frame Computers, and PCs. The retail sector includes Clothing Stores, Depart- ment Stores, Furniture Stores, Gas Stations, and Supermarkets. The companies surveyed in each industry are the largest-share firms such that cumulative share is approximately 70 percent. Several state-owned monopolies are also measured by the SCSB but are not included in this study.
The measurements in the SCSB begin with a computer-aided telephone survey. The survey is designed to obtain a nationally representative sample of customers for each firm. Potential respondents are selected on the basis of having recently bought or used a company's product. In order to participate, each respondent is required to pass a battery of screening questions. The questionnaire employs 10- point scales to collect measures for prepurchase expectations, EXP, perceived quality given price, QUAL, degree of positive or negative disconfirmation, PCD or NCD, and satisfaction, SAT. All measures are specific to the brand used by the respondent. This process results in 54,520 observations per variable for the years 1989 and 1990. The study covers 57 competitive firms from 1989 through 1992 plus additional firms added to the sample after 1990. The total number of firm-level observations is 290. Correlations among the raw variables are presented in Table 1. All correlations are significant at the 0.0001 level.
The correlations in Table 1 exhibit a pattern that might be expected from a review of the satisfaction literature. Repurchase likelihood is positively related to satisfaction. Satisfaction is positively related to quality. Expectations is positively related to both satisfaction and quality. Negative C/D is negatively related to sat- isfaction, quality, and expectations. Positive C/D is positively related to satisfac- tion, quality, and expectations.
However, our interest is in how the response variables affect customer satisfac- tion and, in particular, whether there is systematic variation in these relationships across categories. To take full advantage of the cross-sectional nature of the data, we estimate the model given by equation (1) for each firm in each year. Ordinary least-squares is used. ~ The average coefficients and the standard errors for the distribution of each coefficient are presented below:
SA~i = 3.66 + 0.45 QUAL« + 0.90 EXP« - 0.22 NCD« + 0.08 PCD« (1.01) (0.1 t) (0.08) (0.14) 0.05
REP« = 3.25 + 0.58 SAT« (1.69) (0,17)
As shown, the estimates follow the pattern suggested by the literature. Repur- chase likelihood is positively affected by satisfaction (average R 2 = 0.20). Satis- faction is positively influenced by quality and, to a lesser degree, by expectations (average R 2 = 0.49). Moreover, negative and positive disconfirmation are found to have negative and positive coefficients, with negative disconfirmation having the greater absolute effect on satisfaction.
Table 2 provides a correlation matrix for the estimated coefficients. In addition, the correlation matrix includes average repurchase likelihood, REP,, and average satisfaction, SAT~ for each firm, as well as binary variables indicating whether or

24 E U G E N E W. ANDERS ON
Table 1. Correlations among the raw variables
Repurchase Negative Positive likelihood Satisfaction Quality Expectations C/D C/D
Satisfaction 0.42 Quality 0.35 0.65 Expectations 0.15 0.31 0.31 Negative C/D - 0 . 2 9 - 0 . 4 9 -0 .43 0.16 Positive C/D Ö.24 0.47 0.45 0.33 Means 7.67 7.58 7.04 7.14
-0 .45 2.28 5.35
not the observation pertains to a particular sector (PRODUCT, SERVICE, and RETAILER). As indicated, average repurchase likelihood and the sensitivity of repurchase likelihood to satisfaction, ffSA» are negatively correlated. This suggests that high-repurchase-intention firms may be insulated from changes in satisfac- tion. Switching costs may be more important in such industries, although the rep- utation of the firm may also play a role (Anderson and Sullivan, 1993). For example, the correlations suggest that repurchase likelihood is higher and satis- faction plays less of a role for retailers. This may be due to the importance of location in this sector.
The positive correlation between average satisfaction and/3~A T may indicate that industries in which satisfaction is more important to retention will behave ration- ally by providing higher satisfaction (Fornell, 1992). The correlations also suggest satisfaction is higher for goods than for services or retailers. In addition, average satisfaction and the effect of quality on satisfaction are negatively related. This is consistent with Anderson and Sullivan's (1993) finding that higher-satisfaction firms enjoy a reputation effect insulating them from short-term fluctuations in
Table 2. Correlation matrix for firm-level satisfaction and coefficients
REP, [~iSA7 S~z~Ti ~iQUAL ~iI:'XP [~iN«D [~ipCD
B~',4r - 0 . 2 1 "
SAT~ 0.39* 0.29* ßbuAL --0.14"* --0.12 --0.35*
/3~x e 0.07 - 0.12 - 0.04
ß~«v 0.12 -0 .17"* - 0 . 1 7 "
[3~ec» O. 01 0.07 - O. 20*
PRODUCT - 0 . 0 6 0.37* 0.51" SERVICE - 0.08 0.00 - 0.24* RETAILER 0.15" -0 .35* -0 .20*
-0 .25*
0.23* - 0.00
-0 .22* -0 .23* 0.31"
- 0 . 3 1 " 0.08 -0 .23* -0 .13 0.29* - 0 . 2 1 " - 0 . 0 2 0.06
-0 .17"* - 0 . 0 4 0.24* 0.05
*Indicates significance at the 0.001 level. **lndicates si~nificance at the 0.01 level.

CROSS-CATEGORY VARIATION IN CUSTOMER SATISFACTION AND RETENTION 25
quality. With regards to differences in the importance of the antecedents for dif- ferent sectors, the correlations suggest that (1) satisfaction for services is more sensitive to quality and less sensitive to expectations, (2) satisfaction for products is less sensitive to quality and more sensitive to negative disconfirmation, and (3) satisfaction for retailers is less sensitive to quality and negative disconfirmation.
Table 3 provides a summary of the findings from regressing a firm's average quality, expectations, disconfirmation, satisfaction, and repurchase likelihood, as weil as each coefficient on the set of sector-indicator variables. Following the model posited by equation (I), the satisfaction regression includes average per- ceived quality, expectations, and positive and negative disconfirmation for each firm as these antecedents should be important at the aggregate or firm tevel as well as at the individual level. Similarly, the repurchase-likelihood regression in- cludes satisfaction as an independent variable. The remaining dependent variables are regressed on the sector "main-effects" indicator variables.
The findings reported in Table 3 indicate that quality, expectations, and positive disconfirmation are highest for products relative services. In the main these re- sults, as expected, mirror the correlations in Table 2. In addition, Table 3 provides additional information in terms of the relative levels of the variables in each sec- tor. Retailers have the lowest average levels for each of these antecedents. Neg- ative disconfirmation, on the other hand, is highest for services. Repurchase like- lihood is Iowest for products, services can expect the next lowest loyalty levels, and retailers have the highest. Repurchase likelihood for products depends more on satisfaction relative to services, and retailers are least dependent on satisfac- tion. Satisfaction for services is more sensitive to negative disconfirmation than satisfaction for retailers. Satisfaction for products is least sensitive to quality and most sensitive to negative C/D.
4. Toward understanding cross-category variation in customer satisfaction
Identification of differences between categories in various sectors is interesting, but it raises an important question: Why do we observe these differences?
Table 4 presents an empirical analysis of the cross-category effects discussed previously. A proxy for concentration, CONC, is generated by taking the inverse of the number of competitors comprising 70 percent of the sales in each respective industry. Ease of evaluating quality, QEVAL, is measured as the mean response for each firm's customers to the question, "How difficult or easy is it to evaluate quality (l = very difficult . . . . . 10 = very easy)?" Finally, measures for differ- entiation, DIFF, involvement, INVOLV, frequency of usage, USAGE, switching costs, SC, and the difficulty of standardization, DSTD, are obtained by asking live expert judges to rate each industry on a 10-point scale spanning from very low to very high. OLS estimation is used for each equation. In general, the resid- uals do not appear to violate the standard assumptions, tests for multicollinearity are rejected, and the R 2 statistics increase from the previous analysis. Moreover,

26 E U G E N E W. ANDERSON
" G e..,
e..,
q-
¢:;c5 c5 ~ ~ c5 c 5 ~ ~ ¢5 c5
~ q
e ~
~5
;> . . . . . . . . . . .
2
~ ~'~ G'~ ~ ~ 'h "~" q 'h "~" ~ ~
,..A _ A
w.~5
S ~

C R O S S - C A T E G O R Y V A R I A T I O N I N C U S T O M E R S A T I S F A C T I O N A N D R E T E N T I O N 2'7
0
©
?
õ r,j
ù%
ù4
#4
qb
L~
L)
© r~
,ù 0
L)
,,3
t 'r~ ~ ~ ¢",1 ~ ' ~ " ~ ' ~ ( " q ( " 4
I I I I I
~ . o ~ . ~ ~ ~ . ~.~. o ~ ~ . . _ ' E o
2 Z
~ d d o d d ~ ~ d d ~ ~ i i ! i i ~
t ~
"2. . . ."2. . . . . . .
I I I I ! ~
I r F I I
I I I I I I !
t - ~ OQ ¢ B £ 'q t t q tt '3 ~ t " q ~ ~
I
t ¢3
c . 5 o

28 EUGENE W. ANDERSON
the relatively small impact of the characteristics on the levels and coefficients indicate that the findings may generalize quite weil.
The findings indicate quality and expectations are lower when there is greater concentration. Firms may not be as competitive in such situations, and lower quality is the likely result. The market is rational in having lower expectations in such categories. There is also less positive and negative disconfirmation when concentration is higher. This may be because customers naturally expect tow quatity in less competitive markets. Moreover, these markets are less likely to be innovative or risk taking, leading to fewer positive and negative surprises for buy- e r s .
Greater product differentiation relative to customer heterogeneity leads to higher quality, expectations, and satisfaction, as weil as less negative disconfir- mation. These findings appear to be intuitive. Less intuitive is the finding that repurchase intentions are lower and more sensitive to satisfaction when differen- tiation is high. In this case, it may be that the reason there is greater product differentiation in the first place is that demand is relatively more sensitive to sat- isfaction. Firms in such industries have an incentive to differentiate their offerings and satisfy customers in order to retain customers at a competitive rate.
Table 4 indicates that as involvement increases, so do quality, expectations, and satisfaction. Repurchase intentions are lower and more sensitive to satisfaction. It is likely that firms are acting rationally by providing higher quality and satisfac- tion given the importance of satisfaction to customers when involvement is high. Moreover, customers appear more likely to notice "things gone right or wrong" when involvement is high, as might be expected.
There is less positive and negative disconfirmation as usage increases. Cus- tomers should have well-formed priors that are unlikely to be disconfirmed (An- derson and Sullivan, 1993). Satisfaction is moderately higher in such categories - perhaps because losses loom larger than gains when there is disconfirmation. At the same time, repurchase intentions are higher, and satisfaction depends more on expectations than perceived quality. This is consistent with the ongoing rela- tionship expected between a buyer and supplier in such categories.
Quality is lower, repurchase intentions are higher, and repurchase is less sen- sitive to satisfaction when switching costs are high. When switching costs are low, dernand is likely to be more sensitive to satisfaction, and firms will invest accord- ingly. When switching costs are high, firms will invest fewer resources in improv- ing quality and satisfaction (Fornell, 1992).
Customer satisfaction is lower when quality is more difficult to standardize and easier to evaluate. Both factors lead to greater variance in perceived quality. When there is greater variance in perceived quality, negative disconfirmation is more likely to occur. Even if the variance in quality were evenly distributed, sat- isfaction should be lower given that losses loom larger than gains. However, from an intuitive standpoint, it seems more likely that variance in quality will be skewed toward lower quality. In general, where there is natural variance in per- ceptions of quality due to environmental, supplier, or customer characteristics, then it may be important for firms to identify which types of variance are con-

CROSS-CATEGORY VARIATION IN CUSTOMER SATISFACTION AND RETENTION 29
trollable and prepare to redress dissatisfaction in those areas that are not controI- lable.
Finally, the findings suggest that satisfaction is relatively more sensitive to per- ceived quality when ease of evaluating quality or difficulty of standardizing qual- ity is high or when differentiation or usage is low. Negative disconfirmation is also greater under these conditions. Conversely, expectations increase in importance when differentiation or usage is high and ease of evaluating quality is low. One possible interpretation of these findings is that if there is less variance in perceived quality - less disconfirmation - then satisfaction is driven more by expectations.
5. Summary
This preliminary investigation of cross-sector and cross-category variation in cus- tomer satisfaction and repurchase likelihood yields a variety of findings. Products have higher perceived quality, expectations, and customer satisfaction - but Iower repurchase likelihood - relative to services. Retailers score lowest on quality, e×- pectations, and customer satisfaction hut still enjoy the highest repurchase like- lihood. In addition, the effect of customer satisfaction on repurchase likelihood is greatest for products and lowest for retailers. Quality, expectations, satisfaction, and sensitivity of repurchase likelihood to customer satisfaction - or a combina- tion t h e r e o f - rend to be higher when competition, differentiation, involvement, or experience is high. However, these same measures are likely to be lower when switching costs, difficulty in standardization, or ease of evaluating quality is high. With the exception of competitiveness, repurchase likelihood tends to be low un- der the same set of conditions. These findings appear to be consistent with the notion that firms should respond rationally to demand conditions by providing higher or Iower quality. When repurchase likelihood is higher and less sensitive to customer satisfaction, there is less incentive to invest in quality that provides high customer satisfaction. The market is rational enough to have correspondingly low expectations.
Additionally, customer satisfaction is found to be more sensitive to quality and less sensitive to expectations when there is greater perceived variation in quality. For example, negative disconfirmation is found to be greater when there is less differentiation, greater difficulty of standardizing quality, greater ease of evaluat- ing quality, or customer's involvement is high or experience is low. Customer satisfaction tends to be more sensitive to current quality and less sensitive to expectations under similar conditions. Taken together, these findings suggest a variety of factors that influence variation in production and consumption - the degree of competitiveness and product differentiation, the importance of switch- ing costs, the difficulty of standardizing quality, the ease of evaluating quality, as weil as the level of customer involvement and experience - must be taken into account when comparing customer satisfaction, its antecedents and conse- quences, across categories.
30 EUGENE W. ANDERSON
Notes
1. As a check, the model was also estimated using SUR, 2SLS, and 3SLS. The substantive results do not change.
References
Anderson, Eugene W. (1993). "Firm, Industry, and National Indices of Customer Satisfaction," In T. Swartz, S. Brown, and D.E. Bowen (eds.), Advances In Services Marketing Management. JAI Press, Greenwich, CT.
Anderson, Eugene W., and Claes Fornell. (1993). "A Customer Satisfaction Research Prospec- tus." In Richard Oliver and Roland Rust (eds.), Frontiers In Services Marketing. Newbury Park, CA: Sage.
Anderson, Eugene W., Claes Fornell, and Donald R. Lehmann. (1993). "Customer Satisfaction, Market Share, and Profitability." Working paper, National Quality Research Center, University of Michigan.
Anderson, Eugene W., and Mary W. Sullivan. (1993). "The Antecedents and Consequences of Customer Satisfaction," Marketing Science 12 (Spring), 125-143.
Boulding, William, Richard Staelin, Ajay Kalra, and Valerie Zeithaml. (1992). "Conceputalizing and Testing a Dynamic Process Model of Service Quality," Technical working paper 92-121, Marketing Science Institute (August).
Churchill, Gilbert A., and Carol Suprenant. (1982). "An Investigation into the Determinants of Customer Satisfaction," Journal of Marketing Research 19 (November), 491-504.
Fornell, Claes. (1992). "A National Customer Satisfaction Barometer: The Swedish Experience," Journal of Marketing 56 (January), 1-18.
Fornell, Claes, and William Robinson. (1983). "Industrial Organization and Customer Satisfaction/ Dissatisfaction," Journal ofConsumer Research 9 (March), 403-412.
Johnson, Michael D., and Claes Fornell. (1991). "A Framework for Comparing Customer Satis- faction Across Individuals and Product Categories," Journal of Economic Psychology 12(2) (Fall), 267-286.
Oliver, Richard L. (1980). "A Cognitive Model of the Antecedents and Consequences of Satisfac- tion Decisions," JournaI of Marketing Research 17 (November), 460-469.
Oliver, Richard L., and Wayne DeSarbo. (1988). "Response Determinants in Satisfaction Judg- ments," Journal ofConsumer Research 14 (March), 495-507.
Reichheld, Frederick F., and W. Earl Sasser. (1990). "Zero Defections: Quality Comes to Ser- vices," Harvard Business Review 68 (September-October), 105-111.
Yi, Youjae. (1991). "A Critical Review of Consumer Satisfaction." In Valarie A. Zeithmal (ed.), Review of Marketing 1989. Chicago: American Marketing Association.