CUSTOMER SATISFACTION AND PERCEIVED VALUE IN ...
199
Emilia Peltonen CUSTOMER SATISFACTION AND PERCEIVED VALUE IN B2B RELATIONSHIPS Case: Teo Lehtimäki Ltd. Business Economics 2016 brought to you by CORE View metadata, citation and similar papers at core.ac.uk provided by Theseus
-
Upload
khangminh22 -
Category
Documents
-
view
0 -
download
0
Transcript of CUSTOMER SATISFACTION AND PERCEIVED VALUE IN ...

Emilia Peltonen
CUSTOMER SATISFACTION
AND PERCEIVED VALUE
IN B2B RELATIONSHIPS
Case: Teo Lehtimäki Ltd.
Business Economics
2016
brought to you by COREView metadata, citation and similar papers at core.ac.uk
provided by Theseus

Avainsanat asiakastyytyväisyys, koettu arvo, koettu laatu, asiakassuhteiden tuottavuus
VAASAN AMMATTIKORKEAKOULU International Business
TIIVISTELMÄ
Tekijä Emilia Peltonen Opinnäytetyön nimi Asiakastyytyväisyys ja koettu arvo B2B-suhteissa Vuosi 2016 Kieli englanti Sivumäärä 170 + 4 liitettä Ohjaaja Kim Skåtar & Peter Smeds
Opinnäytetyön toimeksiantaja on suomalainen perheyhtiö Teo Lehtimäki Oy, jonka päätoimialana on moottorikelkkojen varaosien tukkumyynti. Tutkimuksen tarkoituksena oli selvittää, missä määrin yrityksen asiakkaat ovat tyytyväisiä saamaansa palvelun laatuun, sekä miten koettu arvo vaikuttaa toimittajan valintaan. Tutkimuksen ensisijainen tavoite oli löytää keinoja, joiden avulla koettua arvoa, ja siten myös asiakastyytyväisyyttä, voitaisiin parantaa.
Teoriaosuus pitää sisällään keskeiset aiheet tutkimusongelmaan liittyen. Ensimmäinen kappale käsittelee asiakastyytyväisyyttä ja siihen vaikuttavia seikkoja sekä erilaisten tyytyväisyystasojen vaikutusta liikesuhteen jatkumisen kannalta. Seuraava kappale määrittää mitä asiakkaan kokema laatu on, mitkä seikat siihen vaikuttavat ja mihin laadun ulottuvuuteen tutkimus pääasiassa keskittyy. Kolmannessa kappaleessa selvitetään mitä asiakkaan kokema arvo pitää sisällään ja selvitetään sen vaikutus asiakastyytyväisyyteen, sekä esitellään keinoja, joilla arvoa voidaan lisätä. Viimeinen kappale esittelee pitkäaikaisten asiakassuhteiden vaikutusta yrityksen tuottoihin ja selvittää asiakastyytyväisyyden roolin asiakassuhteiden luomisessa, sekä esittelee keinoja asiakassuhteiden hallinnoimiseen. Tutkimusmenetelmänä toimi sekä laadullista että määrällistä tutkimusmenetelmää yhdistelevä kysely, joka koostuu kahdesta osiosta. Ensimmäinen osio pyrki kartoittamaan asiakkaiden yleisiä odotuksia laatuun ja arvoon liittyen, kun taas toinen osio keskittyi selvittämään missä määrin asiakkaat kokevat, että Teo Lehtimäki Oy kykenee vastaamaan heidän odotuksiinsa.
Tutkimustuloksista selvisi, että asiakkaiden yleinen tyytyväisyystaso on korkea. Asiakkaat kokevat, että yritys kykenee vastaamaan heidän tarpeisiinsa ja täyttämään heidän odotuksensa. Vaikka asiakkaat olivatkin valtaosin tyytyväisiä palvelun laatuun sekä tuotevalikoimaan, nosti tutkimus esille myös muutamia parannusehdotuksia, jotka liittyivät pääasiallisesti yrityksen tavoitettavuuteen sesonkiaikana sekä heidän tarjoamiin sähköisiin palveluihin. Moni asiakas ehdottikin extranet -ominaisuuden käyttöönottoa, joka vähentäisi puhelinliikennettä huomattavasti ja siten helpottaisi sekä asiakkaan että Teo Lehtimäki Oy:n toimintaa.

Keywords customer satisfaction, perceived value, perceived quality, customer relationship profitability
VAASAN AMMATTIKORKEAKOULU UNIVERSITY OF APPLIED SCIENCES International Business
ABSTRACT
Author Emilia Peltonen Title Customer Satisfaction and Perceived Value in B2B
Relationships Year 2016 Language English Pages 170 + 4 Appendices Name of Supervisor Kim Skåtar & Peter Smeds
The thesis was written for a Finnish family owned company Teo Lehtimäki Ltd., specializing in the wholesale of snowmobile spare parts. The aim of the study was to determine the extent to which the company’s customers are satisfied with the provided service quality, as well as to determine the influence of perceived value in the choice of supplier. The primary objective was to find out how perceived value, and thus customer satisfaction, could be improved.
The theoretical part consists of the key topics related to the research problem. The first chapter describes customer satisfaction and the factors influencing it as well as the effect of different satisfaction levels on the continuation of a business rela-tionship. The following chapter defines customer perceived quality, the factors influencing it and the quality dimension in which the research mainly focuses on. The third chapter describes what customer perceived value includes, explains its impact on customer satisfaction, and identifies ways to increase value. The last chapter emphasizes the impact of long-term customer relationships on company profits and demonstrates the role of customer satisfaction in creating customer re-lationships, and presents ways to manage customer relationships. The research method utilized in this study was a self-administrative questionnaire combining both qualitative and quantitative research methods, which consists of two parts. The first part sought to identify customers’ overall expectations regarding quality and value, while the second part focused on the determining the extent to which customers perceive that Teo Lehtimäki Ltd. is able to fulfil their expectations.
The results indicate that the customers’ overall satisfaction level is high. The cus-tomers feel that the company is able to meet their needs and fulfill their expecta-tions. Although the customers were mainly satisfied with the service quality and the product range, the research also brought up a few improvement suggestions, which were mainly related to the company’s reachability during the high season as well as the company’s electronic services. Several customers suggested intro-ducing an extranet -feature, which would significantly reduce the phone traffic and thus facilitate both the customer’s and Teo Lehtimäki Ltd.’s operations.

CONTENTS
I INTRODUCTORY PART .................................................................................... 8
1 INTRODUCTION ............................................................................................ 8
1.1 Research problem and objectives ............................................................ 12
1.2 Limitations .............................................................................................. 14
1.3 Structure .................................................................................................. 14
1.4 Case: Teo Lehtimäki Ltd. ....................................................................... 15
II THEORETICAL PART .................................................................................... 18
1 CUSTOMER SATISFACTION ..................................................................... 18
1.1 Definition ................................................................................................ 19
1.2 The satisfaction outcome ........................................................................ 20
1.2.1 Negative disconfirmation: dissatisfaction ................................... 21
1.3 Customer expectations ............................................................................ 23
1.4 Managing expectations – integrated marketing communication ............ 25
2 CUSTOMER PERCEIVED QUALITY ......................................................... 28
2.1 Definition ................................................................................................ 28
2.2 Quality dimensions ................................................................................. 29
2.3 Functional quality dimension .................................................................. 32
2.3.1 Characteristics of a service.......................................................... 34
2.4 Determinants of service quality .............................................................. 35
2.5 Relationship quality ................................................................................ 41
3 CUSTOMER PERCEIVED VALUE ............................................................. 46
3.1 Definition ................................................................................................ 46
3.2 The value of an offering .......................................................................... 47
3.3 Value criterion ........................................................................................ 50
3.4 Perceived benefits ................................................................................... 51
3.5 Perceived sacrifices ................................................................................. 52
3.6 Increasing perceived value ...................................................................... 53
3.7 Relationship value ................................................................................... 55
4 RELATIONSHIP SATISFACTION AND PROFITABILITY...................... 58

4.1 Customer relationship profitability ......................................................... 60
4.2 Customer relationship management ........................................................ 63
5 THEORETICAL FRAMEWORK .................................................................. 66
III EMPIRICAL PART ......................................................................................... 68
6 MARKETING RESEARCH .......................................................................... 68
6.1 Marketing research process..................................................................... 70
6.1.1 Problem definition ....................................................................... 71
6.1.2 Research approach ...................................................................... 72
6.1.3 Research design ........................................................................... 73
6.1.4 Sampling ..................................................................................... 74
6.1.5 Data collection ............................................................................ 76
6.1.6 Data analysis ............................................................................... 77
6.1.7 Results and their implication ....................................................... 79
7 IMPLEMENTATION OF THE RESEARCH ................................................ 81
7.1 Research methodology ............................................................................ 82
7.2 Questionnaire design ............................................................................... 83
7.3 Questionnaire structure ........................................................................... 84
7.3.1 Background information ............................................................. 87
7.3.2 Part 1: quality, value and satisfaction on a general level ............ 89
7.3.3 Part 2: Teo Lehtimäki Ltd. .......................................................... 98
8 ANALYZING THE RESULTS ................................................................... 110
8.1 Background information ....................................................................... 110
8.2 Part 1: quality, value and satisfaction on a general level ...................... 112
8.3 Part 2: Teo Lehtimäki Ltd. .................................................................... 133
8.4 Summary and conclusions .................................................................... 155
9 RELIABILITY AND VALIDITY ............................................................... 162
10 SUGGESTIONS TO FUTURE RESEARCH .............................................. 164
REFERENCES .................................................................................................... 165
APPENDICES (4) ............................................................................................... 171

LIST OF FIGURES AND TABLES
Figure 1. The satisfaction construct. ................................................................................ 20
Figure 2. Quality dimensions. (Grönroos 2007) .............................................................. 30
Figure 3. Total perceived quality. (Grönroos 2007)......................................................... 31
Figure 4. The relationship construct. (Holmlund 1997) ................................................... 42
Figure 5. Relationship quality model. (Liljander & Strandvik 1995) .............................. 45
Figure 6. The profitability effect of loyal customers. (Reichheld 1990). ......................... 60
Figure 7. The customer relationship profitability model. (Storbacka et al. 1994) ........... 61
Figure 8. The stages of marketing research process......................................................... 71
Figure 9. The most important criteria in a supplier: value drivers. ................................ 117
Figure 10. The effect of the product range in the choice of supplier. ............................ 120
Figure 11. The characteristic of the personnel with the biggest impact on satisfaction. 126
Figure 12. Biggest perceived impact on satisfaction...................................................... 132
Figure 13. Teo Lehtimäki Ltd.’s performance in the last service encounter. ................. 133
Figure 14. Teo Lehtimäki Ltd.'s performance in comparison with desired value. ......... 138
Figure 15. Teo Lehtimäki Ltd. and value for money: level of agreement. .................... 139
Figure 16. Perceived benefits of Teo Lehtimäki Ltd.’s offerings: level of agreement. . 140
Figure 17. Teo Lehtimäki Ltd.’s product features: level of agreement. ......................... 141
Figure 18. Website usage frequency and importance of website ................................... 146
Figure 19. Importance of a paper copy of the product catalogue. .................................. 148
Figure 20. Characteristics of Teo Lehtimäki Ltd.’s personnel: level of agreement. ...... 149
Table 1. Determinants of service quality. (Parasuraman et al. 1985) .............................. 36
Table 2. Value criterion. (Walters & Lancaster 1999) ..................................................... 50
Table 3. Bonds in relationships. (Liljander & Strandvik 1995) ....................................... 62
Table 4. Aspects of value: level of importance in the choice of supplier. ...................... 116
Table 5. Product features: level of importance in the choice of supplier. ...................... 119
Table 6. Level of accuracy of statements regarding preference. .................................... 121
Table 7. Characteristics of the personnel: effect in the choice of supplier. ................... 124
Table 8. Behavioral outcomes connected to satisfaction and their likelihood. .............. 129
Table 9. Behavioral outcomes connected to dissatisfaction and their likelihood. .......... 130
Table 10. Behavioral outcomes connected to Teo Lehtimäki Ltd. ................................. 155

LIST OF APPENDICES
APPENDIX 1. Questionnaire (in Finnish) .......................................................... 171
APPENDIX 2. English translation of the questionnaire ..................................... 185
APPENDIX 3. Cover letter (in Finnish) ............................................................. 199
APPENDIX 4. English translation of the cover letter......................................... 200

8
I INTRODUCTORY PART
The thesis is divided into the introductory part, theoretical part, and empirical
part. The introductory part consists of defining the central topics of the thesis and
explaining their relevance to the research. Also the case company is introduced so
that the theoretical framework can be viewed from the case company’s perspec-
tive. The introduction provides an overview of the thesis and states the objectives
of the research as well as its limitations.
1 INTRODUCTION
The purpose of the thesis is to provide the case company with the means to in-
crease customer relationship profitability by increasing customer satisfaction and
customer perceived value. The aim is to define and describe the concept of per-
ceived value and establish a link to customer satisfaction, so that this information
can be applied in the case study.
The study has two main objectives: to measure the current customer satisfaction
levels in connection with the provided service quality, and to reveal the custom-
ers’ perceptions of the value of the company’s offerings as well as the value of the
entire business relationship. Customer satisfaction and customer perceived value
are complementary, nonetheless, distinct concepts (Woodruff & Gardial 1996,
98). Customer satisfaction is a post-purchase evaluation of the perceived perfor-
mance and it measures how well a business is doing, whereas customer perceived
value points at future directions and it is independent of timing (Eggert & Ulaga
2002, 110). The topic concerns all businesses, as high customer satisfaction rat-
ings are considered to be the best indicator of future profits (Kotler 1991, 19), as
well as a strong predictor for behavioral variables connected to profits, such as
repurchase intentions, word-of-mouth, and loyalty (Ravald & Grönroos 1996;
Liljander & Strandvik 1995). A business-to-business perspective is applied
throughout the study focusing on the supplier-customer relationships, as word-of-
mouth, satisfaction, repurchase, and value may function differently in a business-

9
to-business setting than in a business-to-consumer context (Molinari, Abratt &
Dion 2008).
Customer satisfaction is defined as the post-purchase evaluation of the product
and service in view of pre-purchase expectations (Kotler 1991), and it is directly
linked with the customers’ attitudes towards the company, their expectations re-
garding the company’s future performance capabilities, and the customers’ will-
ingness to select the company again (Stauss & Neuhaus 1997, 238). A satisfied
customer who feels that the supplier excels in fulfilling their needs and solving
their problems is likely to choose the supplier again, thus, satisfaction plays a big
role in retaining customers and creating long-term customer relationships (Ravald
& Grönroos 1996; Liljander & Strandvik 1995; Anderson & Sullivan 1993; Grön-
roos 2007, 268). And as the ability to create and maintain strong customer rela-
tionships is considered to be a sustainable foundation for a competitive advantage
(Day 2000, 24), companies should focus on satisfying their customers. Loyal cus-
tomers are also more profitable than price-sensitive customers who perceive little
difference between alternatives (Reiccheld 1996), and customers tend to contrib-
ute more to the revenues as the relationship grows (Reiccheld 1990). Moreover,
maintaining a customer relationship can be up to ten times more economical for
the supplier than acquiring a new one (Heskett, Sasser & Hart 1990). Therefore,
companies should focus on growing customer relationships, and the only way to
promote customer loyalty and build long-term customer relationships is by ensur-
ing that the customers are satisfied with the supplier’s offerings and perceive that
the supplier offers better value compared to competitors.
Quality is said to be the key to value creation and customer satisfaction (Kotler &
Keller 2012, 154; Parasuraman, Zeithaml & Berry 1988). Product and service
quality, customer satisfaction, and company profitability are intimately connected
(Kotler & Keller 2012, 153), making quality an essential part of the theory. The
main focus is on the service quality due to the fact that regardless of the industry,
every business faces service competition (Grönroos 2007, 1), and to attain and

10
keep customers, the company needs to gain a competitive advantage, which can
be obtained by providing superior services. Quality services are linked to custom-
er retention, as companies with superior service quality also have higher customer
loyalty rates compared to their competitors (Kovac, Chernoff, Denneen &
Mukharji 2009). Customer perceived quality is defined as the difference between
the customer’s expectations and the actual experience (Grönroos 2007; Parasura-
man et al. 1988; Grönroos 2007, 73–77), and since the main factor also affecting
customer satisfaction is the expectations the customer has regarding the quality
and whether or not the expectations were fulfilled (Hutt & Speh 2010, 268;
Zineldin 1999, 720), understanding customer expectations – what they are, how
they are formed and what affects them – is a precondition for delivering superior
service quality (Parasuraman, Berry & Zeithaml 1991). The better the company
can determine what customers expect, the better it will be able to provide services
that meet these customer expectations (Molinari et al. 2008). Strategies that are
built on customer quality standards and perceptions will channel resources more
efficiently and meet customer expectations better than those based solely on com-
pany standards (Zeithaml 1988, 18).
However, high quality services are important in terms of satisfaction, but rather
than purchasing goods or services, customers buy the benefits they provide; they
buy offerings consisting of goods, services, information, personal attention, and
other components, thus, the product is the total package of benefits the customer
receives (Levitt 1980). Customers attach value to an offering depending on its
perceived ability to solve the customers’ problems or fulfil their needs (Levitt
1980), and as the business environment is constantly changing, acquiring updated
information through marketing research is essential for the company’s success and
its ability to fulfil customers’ changing needs and requirements (Burns & Bush
2001, 7). Generally, value can be defined as a better service that is adapted to the
customer’s needs (Gwinner, Gremler & Bitner 1998). Customer perceived value is

11
the outcome of a cognitive comparison process where the usefulness of the core
solution1 is evaluated based on the customer’s perception of the benefits received
and the sacrifices made (Zeithaml 1988, 14; Eggert & Ulaga 2002, 110; Monroe
1991). The perceived benefits refer to the perceived monetary value of the eco-
nomic, functional, and psychological benefits the customer expects to gain from
the offering, and the perceived sacrifices refer to the monetary, time, energy, and
psychological costs of evaluating, obtaining, using, and disposing of the offering
(Kotler & Keller 2012, 147). Delivering high value can also mean providing con-
sistent quality at low costs (Heskett, Sasser & Hart 1990).
Since businesses buy mainly for economic rather than emotional reasons (Eggert
& Ulaga 2002, 109), the key to gaining a competitive advantage against competi-
tors with core products of the same quality and price relies on providing the cus-
tomers with better value (Grönroos 2007, 1–5; Leventhal 2006, 431). Providing
superior value to the customers is the essence of running a successful business be-
cause customers are likely to stay loyal to a company that delivers greater value
than their competitors (Dawkins & Reichheld 1990), and even in markets with
relatively little competition, providing customers with superior value is the most
reliable way to achieve sustainable customer satisfaction and loyalty (Jones &
Sasser 1995). Thus, perceived value can also be defined in terms of the custom-
er’s choice in a competitive setting (Gertz & Baptista 1995, 128). As total per-
ceived value is the ratio of total benefits received to total sacrifices incurred, in-
creasing value for customers includes two complementary strategies: increasing
the benefits or reducing the sacrifices (Patterson, Johnson & Spreng 1997, 416;
Monroe 1991). For instance, offering support services that facilitate the use of the
core solution and including effective recovery processes for fixing problems in-
crease the value of the offering. Moreover, services excelling in problem-solving
or meeting customer needs encourage the customer to select a particular company
1 The product or service most directly linked to the company’s core competency: Teo Lehtimäki Ltd.’s core solution is a range of snowmobile spare parts

12
instead of their qualified competitor. (Jones & Sasser 1995, 90; Hutt & Speh
2010, 360.) However, since the perception of value is subjective, individual, and
context-dependent (Zeithaml 1988, 14), identifying the perceived benefits and
sacrifices of a particular company’s customers is essential for being able to deliver
high value for them.
1.1 Research problem and objectives
As obtaining measurable information of customer satisfaction levels and customer
perceptions of quality and value can result in changes in the company’s profitabil-
ity (Anderson, Fornell & Lehmann 1994), the two main objectives of the study
include successfully measuring the current customer satisfaction levels and find-
ing out what creates value for the customer, so that a strategy to further improve
satisfaction by increasing value can be developed.
First, the aim is to measure the current level of customer satisfaction in order to
identify which areas require improvement. Satisfaction is measured in connection
with service quality, as it is one of the key factors in business operations resulting
in satisfied customers. Customer satisfaction is a function of perceived service
quality and disconfirmation (Anderson & Sullivan 1993, 126) and in order to be
able to measure customer satisfaction, the determinants of service quality the cus-
tomers use in the evaluation process have to be identified. Moreover, customer
satisfaction being dependent on how well the experienced quality measures up to
the customer's expectations of quality (Zineldin 1999, 720), the research aims at
revealing customers’ expectations or requirements regarding the service quality
and comparing them with the actual experienced quality to see what areas require
improvement.
Second, just because a customer is satisfied with the service does not necessarily
mean that the service is a good value (Petrick 2002, 120), and even though cus-
tomer satisfaction can be increased by offering superior service quality, the most
reliable way to achieve sustainable customer satisfaction and loyalty is by provid-

13
ing value to the customers (Jones & Sasser 1995), which is why the research takes
both aspects into consideration. Customer perceived value is commonly defined
as a ratio of the total benefits to total sacrifices (Patterson, Johnson & Spreng
1997, 416; Monroe’s 1991; Zeithaml 1988, 14), and by finding out the customer
perceived benefits and sacrifices related to obtaining the offering and maintaining
the relationship, the case company can be presented with the means to improve
customer satisfaction and promote customer loyalty by increasing the total cus-
tomer perceived value.
The research is carried out by utilizing a self-administered questionnaire (SAQ)
that collects both qualitative and quantitative data. Structured, attribute-based
questions are utilized for identifying customer expectations regarding the perfor-
mance as well as how the case company succeeds in fulfilling those expectations,
and unstructured, open-ended questions are utilized to provide more insight into
what customers perceive to be important in business relationships and how they
would describe quality. The aim of research is to provide solutions, and the col-
lected data is utilized to develop functional strategies that assess the particular re-
search problem (Birks & Malhotra 2007, 2): how to increase satisfaction and per-
ceived value.
The research seeks to answer the following questions:
1. What are quality and value as perceived by the key decision makers in the
business relationship?
2. What kind of expectations and requirements do the customers have?
3. To what extent are the customers satisfied with the current service quality
and how could the service quality be improved to fit customer require-
ments better?
4. What has the biggest impact on customer satisfaction?

14
1.2 Limitations
The theoretical framework will be limited to explain the most relevant topics for
this particular research, and the information will be presented in a business-to-
business context as the study focuses on supplier-customer relationships.
Moreover, although product quality has an impact on satisfaction and perceived
value, the study focuses mainly on the quality of the provided services, due to the
fact that the case company’s competitors generally have core products of the same
quality and price, and therefore, the only way to differentiate is by providing su-
perior services (see Grönroos 2007, 1–5; Leventhal 2006, 431).
The study excludes the company’s foreign customers due to lack of resources and
time (for example language barriers in conducting the research and longer re-
sponse time), as well as the case company’s primary interest being in their domes-
tic customer base. Even though foreign customers bring in 40% of the total reve-
nue (Teo Lehtimäki Ltd.’s annual report 2014), the focus is on domestic custom-
ers due to their bigger contribution to the total revenue (60%). Furthermore, as the
aim of every business relationship is to establish a mutually beneficial cooperation
(Hines, Lamming, Jones, Cousins & Rich 2000, 274) the study focuses on the
case company’s key customers that are perceived to provide the most value to the
company.
1.3 Structure
The thesis is divided into three main sections; introductory part, theoretical part,
and empirical part.
The aim of the introduction is to provide an overview of the thesis by describing
the main topics of the thesis and explaining their relevance to the study. Also the
case company, for which the research is conducted for, is introduced. The intro-
duction also defines the objectives of the research as well as the limitations of the
study.

15
The theoretical framework comprises the central theories connected to the main
research areas, customer satisfaction, and perceived value. It defines the main
concepts, such as satisfaction, perceived quality, and perceived value, and demon-
strates the importance of the research from a general business-to-business point of
view and gives examples from the case company’s context. Also the topics of cus-
tomer relationship profitability and customer relationship management are intro-
duced, as they are closely connected to customer satisfaction. The main purpose
of the theoretical part is to present all relevant information that is required for
solving the marketing problem in question and for developing the theoretical
framework that provides the foundation for the entire research (Birks & Malhotra
2007; Burns & Bush 2001, 75).
The empirical part is dedicated to defining the research problems and methodolo-
gy as well as to describing the stages included in the research process, and it pro-
vides basic guidelines for implementing the research and analyzing the results.
The chosen research design is described and the collected data is analyzed. The
major findings of the research are presented and future suggestions are made for
the case company based on the results. Moreover, also the reliability and validity
issues of the research are discussed.
1.4 Case: Teo Lehtimäki Ltd.
Teo Lehtimäki Ltd., founded in 1991, is a Finnish family owned company special-
izing in the wholesale of snowmobile spare parts. The company is headquartered
in Kauhajoki, Southern Ostrobothnia, and has another office in Rovaniemi, Lap-
land. As a wholesaler, the company operates in the business-to-business environ-
ment, offering goods and services to retailers; businesses selling the spare parts to
private consumers. Teo Lehtimäki Ltd.’s primary market is Finnish retailers due
to their bigger contribution (60% in 2014) to the total revenues. Nevertheless, ex-
port plays a big role as well, as the company exports its products to retailers in
Sweden, Norway, Estonia, Russia, and the European Alps region. The company is

16
currently the market leader in wholesale of snowmobile spare parts and has AAA
rating, which is achieved only by 3.8% of companies in Finland.
In order to ensure good technical quality, the company imports its products from
world-class manufacturers, such as Camoplast Solideal, CVTech-IBC Canada and
Wössner Kolben Gmb, who are known for their high-quality products. Teo
Lehtimäki Ltd.’s product range consists of a comprehensive variety of snowmo-
bile spare parts such as Camoplast tracks, Wössner forged pistons, cylinders,
sprockets, idler wheels, shafts, gearbox sprockets, fuel pumps, windshields, ski
skins, carbide runners, clutches, connection rods, brake pads, and so on. The com-
pany also designs and develops special equipment for snowmobiles: for example
the wide ski skins known by the name ‘Vuotsolainen’, lacking a translation into
English, are nowadays used globally in the snowmobile industry. Moreover, in
addition to their main line of products, snowmobile spare parts, the company also
provides selected spare parts for other vehicles, such as ATVs, as well.
However, as most of the company’s competitors import from the same manufac-
turers, meaning that their core products are identical, the only way to outperform
the competition is by providing better quality (Grönroos 2007, 162; Ravald &
Grönroos 1996, 19). In a business-to-business context, quality is seen as an ante-
cedent of successful long-term customer relationships (Athanasopoulou 2009).
Therefore, in addition to providing high-quality products, the company focuses on
delivering their customers with good service. Their idea of good service includes
flexibility and fast deliveries. The customers are offered flexible payment options
and every order is processed and delivered to the customer in a timely manner. In
addition, the company makes an effort to promote long-term customer relation-
ships by occasionally offering long-term customers lower prices among other rela-
tionship benefits. Moreover, the company representatives visit their customers on
regular basis, to promote new products and answer any questions they may have,
which strengthens the bonds between the company and their customers. Another

17
aspect of good service is the fact that orders that were made before these visits are
brought to the customers personally, free of charge. (Teo Lehtimäki Ltd. 2016.)
The company has not invested greatly in marketing communication tactics, as
their main focus is on maintaining good business relationships with existing cus-
tomers. Therefore, customer relationship management is an important aspect of
the study as well. In attaining new customers, the company relies heavily on
word-of-mouth promotion, which only occurs when the customers are satisfied as
only very satisfied customers are likely to recommend the service to others. Con-
sequently, reaching and maintaining high levels of customer satisfaction is essen-
tial for the company’s future success. Other promotional tools used by the compa-
ny to attain new customers includes email marketing to potential customers, the
company’s informative website (www.teolehtimaki.fi) available in nine different
languages, and sales promotion at the annual Kelekkamessut2 where company
promotes new products and provides better value for money for the orders placed
during the trade fair. Their website also consists of useful information regarding
spare part matters, such as instalment and technical advice, which add value to
their offerings. (Teo Lehtimäki Ltd. 2016.)
Customer satisfaction has not been previously measured in the company, and due
to a change in management – Teo Lehtimäki retiring in 2009 and his son and son-
in-law taking over the company – resulting in a few operational changes, the CEO
of the company, Vesa Peltonen, decided that now would be a good time. The as-
sumption is that the customers are mainly satisfied, but as there has been a de-
crease in the company’s sales, presumably due to shorter winters resulting in a
slight decline in demand (snowmobile spare parts being a seasonal product), the
company feels it is necessary to find out what factors influence their customers’
perception of quality and what creates value for them, in order to reveal what kind
of measures could be applied to increase their satisfaction.
2 Finland’s biggest snowmobile trade fair held in Rovaniemi (‘kelekka’ translates roughly into snowmobile and ‘messut’ to trade fair)

18
II THEORETICAL PART
The theoretical part comprises the main topics related to customer satisfaction,
including perceived quality and perceived value. Also customer relationship prof-
itability and customer relationship management are introduced as the focus of the
empirical research is on maintaining profitable, long-term customer relationships.
In addition to providing the means for conducting the empirical study and inter-
preting the results, the importance of the research is demonstrated from a general
business-to-business viewpoint and examples from the case company’s context
are provided. Moreover, since the study focuses on improving the service quality
rather than the product quality, a service perspective is applied throughout the
theory.
1 CUSTOMER SATISFACTION
Customer satisfaction is essential for any business’ success, as satisfaction is di-
rectly linked with the customers’ attitudes towards the company, the customers’
expectations concerning the company’s future performance capabilities, and the
customers’ willingness to continue the relationship or select the company again
(Stauss & Neuhaus 1997, 238). A satisfied customer who has a positive attitude
towards the company is also likely to engage in positive word-of-mouth and rec-
ommend the company to others. Moreover, the confidence in the company’s abil-
ity to fulfil the customer’s needs and meet their expectations increases as a result
of consistently satisfactory performance. Customer satisfaction is in a central role
in creating and maintaining customer relationships as a satisfied customer who
feels that the company excels in fulfilling their needs and solving their problems
is also likely to choose the company again. (Ravald & Grönroos 1996; Liljander
& Strandvik 1995; Anderson & Sullivan 1993; Grönroos 2007, 268.) Since high
customer satisfaction ratings are considered to be the best indicator of future prof-
its (Kotler 1991, 19) and customer satisfaction being a strong predictor for behav-
ioral variables connected to profits, such as repurchase intentions, word-of-mouth,

19
and loyalty (Ravald & Grönroos 1996; Liljander & Strandvik 1995), customer sat-
isfaction should be a priority for any profit-driven business.
1.1 Definition
Customer satisfaction is defined as the post-purchase evaluation of the product
and service quality in the view of pre-purchase expectations (Kotler 1991). Thus,
satisfaction is the result of the customer’s evaluation on how well the customer
experience measures up to the customer's expectations of quality (Zineldin 1999,
720), and a performance that is perceived to equal expectations leads to satisfac-
tion, whereas a performance that fails to meet expectations leads to dissatisfaction
(Parasuraman, Zeithaml & Berry 1988).
Customer satisfaction research is mainly influenced by the disconfirmation para-
digm, which defines satisfaction as a function of perceived quality and disconfir-
mation. The satisfaction outcome depends on the confirmation or disconfirmation
of the performance expectations. The satisfaction construct is illustrated in Figure
1. Confirmation refers to a situation where the performance is perceived to equal
expectations, and therefore, the satisfaction outcome is positive. On the contrary,
disconfirmation refers to the performance failing to meet expectations, and has
two possible outcomes depending on whether the disconfirmation is positive or
negative. Positive disconfirmation occurs when the performance expectations are
exceeded and results in a very satisfied customer, whereas negative disconfirma-
tion means that the performance expectations were not met and the satisfaction
outcome is negative. (Parasuraman et al. 1988; Anderson & Sullivan 1993, 126.)

20
Figure 1. The satisfaction construct.
1.2 The satisfaction outcome
The satisfaction outcome differs depending on the confirmation or disconfirma-
tion of expectations. Stauss and Neuhaus (1997) identify three satisfaction types;
demanding satisfaction, stable satisfaction, and resigned satisfaction, and two dis-
satisfaction types; stable dissatisfaction and demanding dissatisfaction. Since
merely satisfying customers does not guarantee loyalty and only the completely
satisfied customers are genuinely loyal (Jones & Sasser 1995), it is important to
understand the difference among the satisfaction types. Different satisfaction lev-
els imply different issues, thus, require different actions.
Demanding satisfaction is characterized by confidence and positive emotions to-
wards the supplier and willingness to continue the relationship, due to the suppli-
er’s ability to consistently meet the customers’ rising expectations. However, cus-
tomer loyalty is subject to the company’s ability to improve according to the cus-
tomer’s rising demands, and therefore, it is important that the company listens to
the customer and makes an effort to improve according to customer needs. (Stauss
& Neuhaus 1997, 241.)
Stable satisfaction is described a passive satisfaction state, where the customer
perceives that the supplier is able to fulfil the customer’s expectations and does
not perceive any improvement requirements. The customer is confident regarding
the company’s future performance capabilities and is willing to continue the rela-
Satisfaction outcome
Confirmation/ Disconfirmation
Performance expectations
Perceived performance

21
tionship. This kind of satisfaction does not require drastic actions, as the customer
is already satisfied with what is delivered, thus, the focus should be on consistent-
ly delivering a satisfying experience. (Stauss & Neuhaus 1997, 241.)
Resigned satisfaction, however, is not caused by fulfillment of expectations and is
characterized by passive behavior. The customer is not completely happy with the
performance, but feels that it is unrealistic to expect more as the competitors are
not perceived to be able to do any better either. This type of satisfaction implies
that something that the customer requires is missing, and therefore, as soon as an-
other company is able to provide what is missing, the customer will switch to the
competitor. For that reason, the company should seek to identify and fulfil these
requirements before it is too late. (Stauss & Neuhaus 1997, 241.)
1.2.1 Negative disconfirmation: dissatisfaction
Negative disconfirmation occurs when the company fails to fulfil customer expec-
tations and is characterized by disappointment, generally leading to dissatisfaction
(Parasuraman, Zeithaml & Berry 1988). Disconfirmation has a decreasing effect
on customer expectations regarding the supplier’s future performance capabilities,
and therefore also their willingness to choose the supplier again diminishes
(Stauss & Neuhaus 1997, 238). According to Hirschman (1970), a dissatisfied
customer has three options: (1) stop purchasing the supplier’s products or services
or switching to the competitor, (2) communicate their dissatisfaction and demand
improvements, and (3) stay with the supplier due to lack of alternatives, prohibi-
tive switching costs, legal bonds, or other reasons (Gummesson 2002, 87).
Stauss and Neuhaus (1997) identify two dissatisfaction types: stable dissatisfac-
tion and demanding dissatisfaction. Stable dissatisfaction is characterized by the
customer’s disappointment with the supplier’s performance and an assumption
that the supplier’s ability to fulfil their expectations in the future remains low.
These customers do not perceive that an improvement in the performance level is
possible and usually do not communicate their disappointment. On the contrary,

22
demanding dissatisfaction is characterized by demanding behavior, where the cus-
tomer is dissatisfied with the company’s performance and demands improvement.
Nonetheless, the customer does not feel obligated to continue the business rela-
tionship with the company and would not choose them again. (Stauss & Neuhaus
1997, 241.)
According to Anderson and Sullivan (1993), negative disconfirmation has a great-
er impact on customer satisfaction and retention than positive disconfirmation.
Therefore, in order to keep the customer, the service provider has to manage satis-
faction with effective complaints handling and efficient customer service when
the performance fails to meet the customer’s expectations (Anderson & Sullivan
1993). Moreover, the ‘highly dissatisfied’ customers are usually customers who
previously identified themselves as ‘highly satisfied’ but lost their confidence in
the supplier as a result of a service failure or a sequence of unrelated failures, and
can usually be converted back to satisfied ones with effective recovery processes.
If the company excels in compensating the service failure to the customer, the
confidence in the company is not only restored; it is deepened. The key to con-
verting a dissatisfied customer to a satisfied one relies in identifying the underly-
ing reasons for their dissatisfaction, and making an effort to improve in the specif-
ic area the customer feels that the company is not able to deliver in. (Jones &
Sasser 1995; Stauss & Neuhaus 1997, 241; Gummesson 2002, 88.) As already a
mere five percent reduction in customer defections can boost profitability between
25% and 85% (Reichheld & Sasser 1990; Jones & Sasser 1995), the customers
should be provided with frequent opportunities to express their possible dissatis-
faction and the reasons behind it, so that the situation can be fixed and customer
defections prevented. Frequently asking the customers whether they are satisfied
with the company’s performance and their offerings, alongside with providing
free customer service, increases the company’s ability to identify and assist the
customers who experience service or product failures. (Jones & Sasser 1995;
Stauss & Neuhaus 1997, 241.)

23
1.3 Customer expectations
Since the main factor affecting customer satisfaction are the expectations the cus-
tomer has regarding the quality and whether or not the expectations were fulfilled
(Hutt & Speh 2010, 268), understanding customer expectations – what they are,
how they are formed and what affects them – is a precondition for delivering su-
perior service quality (Parasuraman, Berry & Zeithaml 1991). The better the com-
pany can identify customer expectations, the better it will be able to provide ser-
vices that meet these expectations (Molinari, Abratt & Dion 2008).
Expectations can be generally viewed as customers’ predictions of what is likely
to happen during a service encounter or as customer requirements regarding the
quality of a service – what they feel a service provider should offer rather than
would offer (Parasuraman et al. 1991, 42). According to Parasuraman et al.
(1991), customer expectations consist of two levels: desired service and adequate
service. Desired service reflects what the customer hopes to receive and adequate
service refers to what kind of service the customer considers to be acceptable
(Parasuraman et al. 1991). The range of service quality between desired quality
and the level of quality considered acceptable is generally referred to as the zone
of tolerance (Zeithaml, Berry & Parasuraman 1993, 6). The zone of tolerance de-
picts the accepted variation in the performance levels, and if the quality falls short
from the acceptable level, dissatisfaction occurs. To prevent dissatisfaction, the
company has to put an effort into understanding customer expectations.
Ojasalo (1999) identifies three types of expectations: implicit, explicit, and fuzzy
expectations. Implicit expectations are expectations regarding the service that are
so obvious that they are not constantly considered but the customer takes them for
granted (Ojasalo 1999). For instance, an implicit expectation in the case compa-
ny’s context could be the assumption that the company automatically sends out
the annual product catalogue to their customers, because it has been sent out every
year since 1992 and has become something that the customers assume to receive
undoubtedly every year. Therefore, implicit expectations can also be seen as

24
norms of the performance (Smith 2012). Moreover, implicit expectations reflect
the basic elements of the product or service that all competitors are expected to
provide, and a company that is not able fulfil the customer’s implicit expectations
is not likely to be in the customer’s consideration set at all (see Jones & Sasser
1995). Explicit expectations are clear expectations regarding the service that the
customer actively and consciously assumes to be met, and can be further divided
into realistic and unrealistic expectations. For instance, expecting an order to be
sent during the same day is a realistic expectation, but having the order delivered
within the same day is an unrealistic expectation. Unrealistic expectations can be
a result of a vague or unclear sales message or inaccurate word-of-mouth infor-
mation. Fuzzy expectations are customer’s unclear expectations, meaning that the
customer perceives that something is needed but does not recognize what should
be done or how, which makes it nearly impossible for the supplier to fulfil these
kind of expectations as the customer is unable to communicate them. (Ojasalo
1999.)
Moreover, customer expectations reflect both past and current experiences (Smith
2012). For instance, an experience that failed to fulfil the customer’s lowers their
expectations as negative disconfirmation has a negative effect on the customers’
expectations concerning the company’s future performance capabilities (Stauss &
Neuhaus 1997, 238). On the contrary, positive disconfirmation can have an in-
creasing effect on expectations. Thus, the customer expectations provide a refer-
ence point for the level of satisfaction, and depending on whether disconfirmation
is perceived, the customer satisfaction either increases or decreases from the ref-
erence point (Parasuraman et al. 1988; Anderson & Sullivan 1993). Furthermore,
satisfaction is transaction-specific evaluation of the service quality (Boulding,
Kalra, Staelin & Zeithaml 1993) and the customers’ quality perceptions change
over time as a result of added information through for example marketing com-
munication, experiences, and other sources of information, or increased competi-
tion in a product category, and thereby also the customer expectations change
(Zeithaml 1988, 18; Grönroos 2007, 77). Consequently, even if the customer is

25
satisfied with the quality of the company’s offerings, it does not mean that the
same standard and quality will result in satisfaction later on, making continuous
improvement a priority in satisfying customers. The increasing customer expecta-
tions make delivering high quality an important strategic priority for any business
(Hutt & Speh 2010, 215), and managing these expectations plays a big role in en-
suring customer satisfaction.
1.4 Managing expectations – integrated marketing communication
Although expectations are shaped by the customer’s individual needs, they are
also influenced by the company’s marketing communication, sales, image, word-
of-mouth, and public relations (Grönroos 2007, 77). Since the company can influ-
ence customer expectations through marketing communication, it is important to
never overpromise and ensure the consistency of the marketing communication
messages, as satisfaction depends on how well the customer expectations are met
(Parasuraman et al. 1988; Anderson & Sullivan 1993, 126; Grönroos 2007).
To ensure the consistency of the marketing communication messages, integrated
marketing communication strategy can be used. The core idea behind integrated
marketing relies in integrating the content of the company’s marketing messages
to ensure their consistency, which also reduces the probability of unrealistic ex-
pectations. Integrated marketing communication requires identifying different
marketing communication channels and sources, as well as managing them in a
consistent way in order to strengthen the company’s reliability and trustworthiness
(Kotler & Armstrong 2010, 424).
Duncan and Moriarty (1997) identify five different sources of marketing commu-
nication messages: (1) planned and (2) unplanned messages, (3) product and (4)
service messages, as well as (5) the absence of communication (Grönroos 2007).
Planned messages include the company’s planned marketing communication mes-
sages, such as mass communication, brochures, advertising, sales, websites, and
so on. Unplanned messages refer to marketing communication messages the com-

26
pany has no control over, such as word-of-mouth referrals, and news stories. The
product(s) and the provided service(s) are also sources of communication messag-
es, communicating ‘what the company does’ through product appearance, design,
usefulness, and the raw materials used, which in integrated marketing should be in
line with the company’s advertisements and other planned messages. Service
messages are involved in interactions with the service personnel, deliveries,
claims handling, information, and so on, and the company should focus on con-
sistently delivering services that meet customer expectations. Furthermore, also
the absence of communication can be regarded as a source of communication
messages, as it has an impact on the company’s image, usually a negative one,
and often results in a negative experience of the service and might lead to negative
word-of-mouth. (Grönroos 2007.)
The main rule in managing expectations relies in never overpromising and always
keeping the promises made. Furthermore, it is better to under-promise and over-
deliver (Grönroos 2007), as it means that the customer’s expectations are exceed-
ed and results in a very satisfied customer (see Parasuraman et al. 1988). In addi-
tion to managing their planned messages and never making promises they cannot
keep, the company can influence the unplanned messages as well, by consistently
providing good quality products and services that fulfil customer expectations, as
it can encourage the customers to engage in positive word-of-mouth and it has a
positive impact on the company’s image. Moreover, the unplanned messages are
also often viewed as the most reliable ones, whereas the planned messages, such
as advertisements, are considered the least reliable source of communication mes-
sages. Therefore, by consistently keeping promises and delivering quality as well
as avoiding the absence of communication by keeping the customer informed, the
company can ensure that the customers’ expectations are met and that they are
satisfied with the company’s performance, resulting in a positive attitude towards
the company (cf. Stauss & Neuhaus 1997, 238). (Grönroos 2007.)

27
2 CUSTOMER PERCEIVED QUALITY
Since customer satisfaction is dependent on how well the customer experience
measures up to the customer's expectations of quality (Zineldin 1999, 720), the
process of evaluating customer satisfaction related to service quality includes de-
fining the meaning of quality in the context of the service in question, the charac-
teristics of the service and its provider that project a high quality image, and the
criteria customers use in evaluating service quality (Parasuraman et al. 1988, 16).
Strategies that are built on customer quality standards and perceptions will chan-
nel resources more efficiently and meet customer expectations better than those
based solely on company standards (Zeithaml 1988, 18). Therefore, identifying
what customers perceive as quality is essential in terms of the company’s ability
to fulfil their expectations, thus, satisfy their customers.
2.1 Definition
On a general level, quality can be defined as “zero defects – doing it right the first
time” (Zeithaml 1988), as the absence of mistakes or failures indicates that the
product or service is of high quality. Zeithaml (1988) defines perceived quality as
an “overall judgment of the superiority or excellence of a product or a service”,
meaning that the quality is evaluated in a comparison context. Customers general-
ly evaluate the product and service quality relative to the company’s key competi-
tors (Trivedi 2014, 96) and typically choose the company they perceive to provide
the best quality. Consequently, providing quality is an antecedent of successful
long-term customer relationships (Athanasopoulou 2009).
However, the definition of quality might differ depending on the context (Par-
asuraman et al. 1988, 16). For instance, quality in the context of a company
providing accounting services might mean consistently accurate bookkeeping and
confidentiality of the information, whereas quality in a company providing logis-
tics and transportation services might mean punctual distribution and efficient
supply chain management. In the case company’s context it might mean fast de-

28
liveries and good technical assistance. Moreover, the meaning of quality differs
among customers as well, since the perception of quality is very subjective and
individual (Moscoso & Lago 2011), as it reflects the customer’s needs and expec-
tations, and is based on the customer’s quality standards. Although customer
needs, expectations, and requirements differ depending on the context, the prima-
ry requirement of quality is that it fulfills customer needs. ISO (International Or-
ganization for Standardization) defines quality as “the features and characteristics
of a product or service that bears its ability to satisfy stated or implied needs”
(ISO 8402-1986). Therefore, it is important to identify what features of the prod-
uct and service communicate high quality, and to differentiate from the competi-
tion by customizing products and services to better fit the customers’ needs
(Trivedi 2014, 96).
2.2 Quality dimensions
According to Grönroos (2007, 77), perceived quality has two dimensions: the
technical quality of the outcome and the functional quality of the process. The
technical quality is an objective3 evaluation of what is received during the perfor-
mance, which is usually a tangible product, for example a snowmobile track mat.
On the other hand, the functional quality refers to a subjective evaluation of how
the snowmobile track mat is delivered. The functional quality includes the cus-
tomer’s evaluation of different aspects of the service process, such as the respon-
siveness and friendliness of the service personnel (Parasuraman et al. 1985, 46–
47). The total quality is thereby a combination of the product quality and the ser-
vice quality. Moreover, also the company’s image has an impact on the total qual-
ity, and the image functions as a filter. For instance, a good image can have a pos-
itive effect on the total perceived quality. The quality dimensions are portrayed in
Figure 2. (Grönroos 2007, 77.)
3 (of a judgement) not influenced by personal feelings or opinions in considering and representing facts (http://www.oxforddictionaries.com/definition/english/objective)

29
Figure 2. Quality dimensions. (Grönroos 2007)
Furthermore, as the perceived quality is usually described as the difference be-
tween the customer’s expectations and the actual experience (Grönroos 2007; Par-
asuraman et al. 1988), also the customer’s expectations influence the total per-
ceived quality. Customer expectations are influenced by the company’s marketing
communication, sales, image, word-of-mouth, public relations, as well as the cus-
tomer needs and values (Grönroos 2007, 77). The model of total perceived quali-
ty, depicted in Figure 3, illustrates how quality perceptions are formed and what
affects them. Similarly to the disconfirmation paradigm (see Parasuraman et al.
1988), the total perceived quality depends on the size of the gap between expected
quality and experienced quality, and determines how well the expectations were
fulfilled. The smaller the gap is between the expected and experienced quality, the
better the company was able to meet customer expectations, and thereby the better
the total perceived quality. (Grönroos 2007, 77.)

30
Figure 3. Total perceived quality. (Grönroos 2007)
Customer satisfaction is thereby also dependent on the total perceived quality and
the satisfaction level increases as the size of the gap decreases. Therefore, the sat-
isfaction among the company’s customers is also a good indicator of the product
and service quality that the customers are receiving (Jones & Sasser 1995). High
perceived quality is a result of the experienced quality fulfilling the requirements
of the expected quality, resulting in satisfaction. On the contrary, the total per-
ceived quality is low when the experienced quality fails to meet the preceding ex-
pectations and often results in dissatisfaction. (see Parasuraman et al. 1988; Kotler
1991; Zineldin 1999, 720.) Therefore, it is important that customer expectations
are managed with integrated marketing communication and ensuring that empty
promises are not made. The company also has to put effort into understanding
customer expectations in order to be able to provide products and services that
meet these expectations.
Also Crosby and Stephens (1987) identify that the customer’s overall satisfaction
has three components: satisfaction with the product, the company, and the sales-
person. The evaluation of customer’s overall satisfaction includes thereby an as-
sessment on how well each component fulfilled their expectations; the technical

31
quality of offering such as its durability and performance, the company’s perfor-
mance in terms of for example on-time delivery and invoicing accuracy, and the
functional quality connected to the personnel such as their trustworthiness, exper-
tise, and problem-solving skills.
Quality is said to be the most profitable way to run a business (Reichheld &
Sasser 1990) due to its major strategic benefits in contributing to market share and
return on investment (Anderson & Zeithaml 1984) as well as decreasing manufac-
turing costs and improving productivity (Garvin 1983). According to Jones and
Sasser (1995), high-quality products and related services that are designed to meet
customer needs lead to high levels of customer satisfaction, resulting in a signifi-
cant increase in customer loyalty, which is the single most important driver of
long-term revenues. Quality services are directly linked to customer retention and
companies with superior service quality also have higher customer loyalty rates
than their competitors (Kovac, Chernoff, Denneen & Mukharji 2009). Therefore,
providing quality is beneficial for both the customer and the supplier, as long-term
customers are more profitable than price-sensitive customers who perceive little
difference among offerings (Reiccheld 1996).
2.3 Functional quality dimension
The study focuses mainly on the functional quality dimension: service quality.
Services are often misleadingly considered to be something that is provided by a
certain type of organization, overlooking the ‘hidden’ services provided by, for
instance, a wholesaler, and viewing services as a sector rather than a business log-
ic. Hidden service components are services that support the customer’s value-
creating process but are seldom considered as services by the customers. For in-
stance, the logistics and distribution networks included in selling process ensure
that the customer receives a specific product on time, but the customer normally
perceives only the service encounter where the product is purchased, excluding
the additional services required from the supplier’s part to make the sale. Also for
instance maintenance, complaints handling, and invoicing are services that are

32
provided during the usage of the core product but are rarely considered as ser-
vices. (Grönroos 2007, 2.)
The main focus is on service quality, due to the fact that case company operates as
a wholesaler, their core products consisting of a variety of snowmobile spare
parts, and as snowmobile spare part manufacturers are a limited and a very specif-
ic branch, most of the company’s competitors import from the same manufactur-
ers, resulting in a situation where the offered core product is identical. In situa-
tions where companies are competing with identical core products, the only way
of outperforming the competition is by providing better services (Grönroos 2007,
5; Levitt 1980). Moreover, building a competitive advantage based solely on the
company’s core product is nearly impossible; the only exception being the com-
pany having a sustainable technological advantage or continuously lower costs,
which is rarely the case.
Furthermore, regardless of whether the company’s core product is a good or a ser-
vice, or whether the company operates on consumer markets or business-to-
business markets, products are practically always combinations of the tangible
and the intangible, resulting in a situation where service competition concerns
every business (Grönroos 2007, 5; Levitt 1980). Service competition is a competi-
tive situation where a company, rather than competing solely with the core prod-
uct, competes with its total service offering (Grönroos 2007, 5; Leventhal 2006,
431). Even though a competitive distinction can be achieved through developing
superior product features, companies that are competing with identical offerings,
differentiate with the execution, i.e. how the product is delivered to the customer.
Features of the execution include, for instance, the efficiency of the business
transactions, the responsiveness to inquiries and complaints, clarity and speed of
confirmations, and so on. In other words, companies differentiate with the quality
of their services rather than the tangible products. As a result, the offered product
is differentiated from the competition, although the generic product (cf. core
product) is identical. (Levitt 1980.) Therefore, the functional quality dimension

33
plays a bigger role in retaining customers and creating strong relationships, and by
developing and improving the functional quality dimension, the company can add
substantial value for its customers and thereby create a competitive advantage
against their competitors (Grönroos 2007).
2.3.1 Characteristics of a service
Services are different from goods; they are acts, deeds, performances, and efforts
(Lovelock & Gummesson 2004) designed to deliver value for customers. A ser-
vice is a complex phenomenon that can generally be described with four funda-
mental characteristics: intangibility, perishability, variability, and inseparability.
Intangibility refers to the fact that a service lacks physical existence or form – a
service cannot be seen or touched. The perishability of a service refers to the fact
that a service exists only at the time of the production – it cannot be produced and
warehoused before consumption. The variability of services means that, depend-
ing on the particular situation and context, a service encounter has various possi-
ble outcomes. The inseparability of services means that it is not possible to sepa-
rate a service from the service provider, nor the production and consumption of
the service. (Kotler & Keller 2012, 380–383; Withey & Lancaster 2007, 267;
Grönroos 2007, 51–54.)
Services can therefore be defined as processes that consist of series of intangible
activities, produced and consumed simultaneously, in which the customer partici-
pates as a co-producer (Grönroos 2007, 53). Therefore, even if the service provid-
ed was the very same, different customers can have different perceptions of the
quality of the service. A service encompasses the whole ‘experience’ through
which we satisfy customers’ needs and create value for them (Moscoso et al.
2011). These processes, the service encounters where the customer-supplier inter-
action takes place, are called moments of truth due to the fact that it is the situa-
tion where the service provider has the opportunity to demonstrate the functional
quality to the customer. After the service encounter is finished, the service provid-
er has lost the opportunity to demonstrate the service quality, and the customer

34
has already made an evaluation of the service. Therefore, in order to achieve good
perceived quality, it is important to correct any possible mistakes during the mo-
ment of truth. (Grönroos 2007; Gummesson 2002)
For instance, an example of a moment of truth could be placing an order through
phone; during this phone call, the customer evaluates for example the responsive-
ness of the personnel and the consistency of the information. It is important that
the personnel has enough knowledge of the products and procedures. In case the
personnel has to double check product prices or delivery times too many times, it
does not transmit a reliable image to the potential customer and might lead to can-
celation of the order. Another example of a moment of truth could be an encoun-
ter at the Kelekkamessut trade fair; the customer evaluates the company’s poten-
tial quality, i.e. the supplier’s ability to fulfill their needs, based on the infor-
mation received from the company representatives. If they fail to convince the po-
tential customer during the time spent listening to the information available about
the company and their offerings, it is unlikely that the customer will use the sup-
plier’s services in the future. Therefore, it is important that the company acknowl-
edges the characteristics of a service and strives to provide the best service quality
in each moment of truth.
2.4 Determinants of service quality
Although quality might have different meanings depending on the context and
service in question, the criteria that customers use in evaluating service quality is
basically the same regardless of the service type. Parasuraman et al. (1985) identi-
fy different determinants of service quality that customers use when evaluating
the service quality. A determinant of service quality is essentially a feature of a
service that determines whether the service is perceived to be of high quality or
not. In other words, it reflects what is required from a service in order to be per-
ceived as a quality service by the customers. Customers’ perceptions of service
quality can be characterized by a set of determinants of service quality including
reliability, responsiveness, competence, access, courtesy, communication, credi-

35
bility, security, understanding/knowing the customer, and tangibles, which are de-
scribed in Table 1. (Parasuraman et al. 1985, 46–47.)
Table 1. Determinants of service quality. (Parasuraman et al. 1985)
Determinant Description
Reliability Consistency in performance and dependability
Responsiveness Willingness or readiness to provide service
Competence Possession of the required skills and knowledge to per-
form the service
Access Approachability and ease of contact or reachability
Courtesy Politeness, respect, consideration, and friendliness of
contact personnel
Communication Keeping customers informed in a language they can
understand and listening to them
Credibility Trustworthiness, believability, honesty, and having the
customer’s best interest at heart
Security Freedom from danger, risk, or doubt
Understanding/knowing
the customer
Making the effort to understand the customer’s needs
Tangibles Physical evidence of the service; the appearance of the
office/warehouse, equipment, personnel, and materials
As the process of evaluating customer satisfaction related to the quality of the ser-
vice includes defining what service quality is in the context of the service in ques-
tion (Parasuraman et al. 1988, 16), the determinants are explained in the case
company’s context.
Reliability of the service means for example consistently meeting promised deliv-
ery dates, accurate invoicing, and having good product availability. Reliability of
the service is important, as it also increses the trust for the supplier and decreases
the customer perceived sacrifices. If the supplier continuously fails to meet prom-

36
ised delivery dates or fails to have the required products in stock, the dissatisfied
customer might defect and switch to the competitor. Therefore, it is important that
the provided service is reliable and consistent, and that the customer can count on
that the supplier is able to deliver and keep their promises. (Parasuraman et al.
1985, 47.)
Responsiveness is a characteristic of the personnel and refers to their willigness to
provide the service, including for instance answering phone calls quickly or call-
ing the customer back, and replying promptly to customers’ requests. Also send-
ing out the product as soon as they receive the order communicates the person-
nel’s willigness to provide the service to the customer. The responsiveness of the
personnel has an effect on the customer’s attitude towards the company and there-
by also influences their satisfaction (cf. Stauss & Neuhauss 1997). (Parasuraman
et al. 1985, 47.)
Competence refers to the possession of the required skills and knowledge to per-
form the service. The personnel has to have extensive knowledge of snowmobile
spare part market as well as the products they are offering, so that they are able to
solve any problems the customers might have regarding the installation for exam-
ple. Personnel who are experts in their field also have a better ability to serve the
customers and provide useful technical advice that adds value to their offerings.
(Parasuraman et al. 1985, 47.)
Access refers to the service being easily accessable, which can be ensured by con-
venient operation hours and location as well as good reachability through phone
and email. Access is also closely related to responsiveness, as reachability also
transmits an image that the company is willing to provide the service. If the cus-
tomer has to wait in line for long or has to wait for the company to call back, also
the company’s willingness to provide the service is questionable. (Parasuraman et
al. 1985, 47.)

37
Courtesy is also a characteristic of the service personnel and refers to their polite-
ness, respect, consideration, and friendliness. Good-mannered, friendly employees
have a big effect on the perceived service quality. Many times the service is rated
according to the personnel’s politeness and friendliness, and a friendly personnel
can have a big impact on the customer’s service experience. (Parasuraman et al.
1985, 47.)
Communication is also important and it refers to keeping customers informed as
well as listening to them. This includes informing the customers about new prod-
ucts, keeping them updated with the company’s operations, explaining the price
components of the service, and so on. Absense of communication often results in
a bad service experience and might lead to negative word-of-mouth (Grönroos
2007). Therefore, it is important to keep customers informed about important
things. Moreover, it also means providing the service in a language they can un-
derstand and the company currently provides their services in three languages in-
cluding Finnish, Swedish, and English. Furthermore, communication also includes
listening to the customer and making improvements according to their requests.
(Parasuraman et al. 1985, 47.)
Credibility refers to the trustworthiness of the company and having the customer’s
best interest at heart. A good reputation and image can have a positive effect on
the perceived service quality and the company’s credibility (Grönroos 2007, 77).
Credibility is also a characteristic of the contact personnel and refers to their
trustworthiness and honesty, which includes for example keeping the promises
that are made. (Parasuraman et al. 1985, 47.)
Security refers to freedom from danger, risk, or doubt. It includes physical safety,
financial security, and confidentiality, which are not issues in the case company
context. (Parasuraman et al. 1985, 47.)
Understanding/knowing the customer means making the effort to understand the
customer’s needs and to provide individual attention and customized service. As

38
the relationship continues, the service processes become smoother and faster, and
fewer mistakes occur due to the fact that the supplier knows what their customers
want and how they want it (Reichheld 1990). The better the customer perceives
that the supplier knows and understands their needs and is able to provide a per-
sonalized service, the better the perceived service quality is, and therefore, the
higher the customer satisfaction. (Parasuraman et al. 1985, 47.)
Tangibles include the physical evidence of the service, such as the appearance of
equipment, personnel, and materials, which should also be of good quality. For
instance, distinctive communication materials such as the product catalogue
should be clear and facilitate the use of the core product (see Jones & Sasser 1995,
90). (Parasuraman et al. 1985, 47.)
The determinants of service quality are mainly used to assess the quality of the
service in a particular service encounter and customers are likely to reevaluate the
determinants in each service encounter due to the heterogeneity (cf. variability) of
services (Parasuraman et al. 1985, 48). Moreover, in addition to evaluating the
service quality based on the determinants of service quality, also the supplier’s
total service offering has an impact on the choice of supplier. According to Jones
and Sasser (1995, 90), customer satisfaction is influenced by four elements of the
service offering:
the basic elements of the product or service that all competitors are ex-
pected to provide
basic support services increase the effectiveness and usability of the prod-
uct or service
a recovery process for fixing problems or bad experiences
extraordinary services that excel in meeting customer preferences or in
solving their particular problems, making the product or service seem cus-
tomized

39
First of all, if the supplier fails to provide the basic elements of the product or ser-
vice, the supplier is the customer is not likely to choose the supplier at all, as they
represent the core requirements that have to be met for being in the customer’s
consideration set (see Menon, Homburg, & Beutin 2005, 4–7; Hutt & Speh 216).
Therefore, if Teo Lehtimäki Ltd. fails to provide the basic elements that are re-
quired from all snowmobile spare part wholesalers, such as snowmobile track
mats4, the customer does not perceive that the product variety is able to fulfil their
needs and is likely to choose another supplier. Teo Lehtimäki Ltd. provides a
wide range of snowmobile spare parts from world-class manufacturers, including
products that are not available anywhere else, such as the Vuotsolainen -ski skins,
and is expanding their product variety according to customer requests. Basic sup-
port services include services that increase the effectiveness and usability of the
product or service, including for instance the company’s free customer assistance
regarding spare part matters, such as installment, and sending a confirmation to
the customer as the product has been delivered. Moreover, recovery processes for
fixing problems or bad experiences also have a big impact on customer satisfac-
tion, as a dissatisfied customer can be converted back to a satisfied one with effec-
tive recovery processes, which include the supplier’s ability to fix problems
quickly and compensate the bad experience, as well as preventing them by provid-
ing product guarantees and having reasonable return policies. Although snowmo-
bile spare parts are generally designed to be durable, a damaged or malfunctioning
product is always replaced to the customer free of charge (Teo Lehtimäki Ltd.
2016). Extraordinary services that excel in meeting customer’s preferences or
solving their particular problem usually encourage the customer to choose a par-
ticular supplier over the qualified competitor, and include providing individual
attention and personalized services, as well as special treatment. (Jones & Sasser
1995, 90.)
4 An essential product category in the snowmobile market that generally generates the biggest profits (Teo Lehtimäki Ltd. 2016)

40
As a conclusion, customer satisfaction relies on the company’s ability to identify
and meet the specific customer expectations that the customers perceive to have
the biggest impact on their satisfaction, as well as making an effort to continuous-
ly improve in these areas, in order to achieve an optimum level of satisfaction
among the company’s customers. The satisfaction (or dissatisfaction) of the ma-
jority of the company’s customers helps the company to decide which of the four
elements; the basic elements of the product or service, basic support services, re-
covery processes, or extraordinary services excelling in meeting customer prefer-
ences, the company should focus on delivering (Jones & Sasser 1995). For in-
stance, if Teo Lehtimäki Ltd.’s customers perceive that the company is able to ful-
fil their expectations regarding the overall product and service quality, yet do not
identify themselves as ‘completely satisfied’, it could mean that the company
lacks the extraordinary services that excel in meeting customer preferences and
should therefore focus on improving in that area. Moreover, since customers eval-
uate the service quality relative to the supplier’s key competitors and are likely to
choose the supplier that is perceived to provide the best quality, the company can
differentiate from the competition by customizing their services to fit the custom-
ers’ needs better through identifying the features of service quality that the cus-
tomers value the most (Trivedi 2014, 96).
2.5 Relationship quality
Even though high-quality goods and services are important in the initial phase of
the relationship, as the relationship goes on, relationship quality becomes more
important than the quality of a single service encounter (Ravald & Grönroos 1996,
24). Relationship satisfaction is the joint evaluation of the business relationship
by important individuals in both companies of the relationship and it encompasses
the entire relationship as an offering: it reflects the entire value creation structure
of interrelated production processes from the beginning of the relationship
(Holmlund & Strandvik 1999, 686). The main difference between service quality
and relationship quality is the fact that relationship quality includes the efforts to

41
improve the quality of relationships, not just the quality of goods and services
(Gummesson 2008, 17). Moreover, in a business-to-business context, satisfaction
results from evaluating all essential aspects of the business relationship
(Geyskens, Steenkamp & Kumar 1999, 223).
A relationship comprises of a series of interactive service encounter between the
companies over time (Buttle 2009, 27), and the customer’s satisfaction after each
service encounter has an impact on their overall satisfaction – it either increases or
decreases from the baseline level (Parasuraman et al. 1988; Anderson & Sullivan
1993, 126–127). According to Holmlund (1997), relationships consist of acts, epi-
sodes and sequences, all of which have an impact on the relationship satisfaction.
Interrelated acts, such as a phone call, inquiry, and placing an order, together form
an episode, for example a product delivery process, and similarly, interrelated epi-
sodes form sequences. A sequence can be defined in terms of a time period, a
product package, a campaign, or a project. Finally, several sequences form a rela-
tionship. (Holmlund 1997, 96.) The relationship construct is depicted in Figure 4.
Figure 4. The relationship construct. (Holmlund 1997)
Making a distinction between the satisfaction related to one episode and the over-
all satisfaction related to the entire relationship is important, mainly because it
demonstrates the difference between new customers and long-term customers. Ep-
isode level offers a simplified explanation to how satisfaction is formed, whereas
the relationship level takes into consideration all aspects of the entire relationship.
Furthermore, a satisfied customer who perceives a high relationship value is also
said to be more tolerant towards occasional inferior performances (Ravald &
Relationship
Sequence
Episode
Act Act Act
Episode
Act Act
Sequence
Episode
Act Act Act

42
Grönroos, 1996). For instance, even if a long-term customer might be dissatisfied
with the quality of the most recent episode, it does not necessarily have a big im-
pact on the behavioral outcomes, such as word-of-mouth, if the overall relation-
ship quality is perceived to be high and the company’s overall image positive. On
the contrary, if the supplier fails to provide good quality in the beginning of the
relationship when the bonds are not yet created and the commitment is weak, the
customer is likely to be dissatisfied and discontinue the relationship. Consequent-
ly, although the relationship level satisfaction has a bigger impact on the length of
the relationship and is more important in terms of long-term customer relation-
ships and relationship profitability than the episode level satisfaction, the episode
perspective has to be taken into consideration as well, since positive episode value
enhances the relationship value and a positive relationship value increases the re-
lationship satisfaction (Ravald & Grönroos 1996, 24).
Liljander and Strandvik (1995) make a distinction between episode level and rela-
tionship level quality in their model of relationship quality, depicted in Figure 5.
The model also demonstrates the connection between the main topics of the the-
sis; quality, value, and satisfaction, and incorporates them in a quality framework.
According to the model, the perceived quality of one episode is evaluated by
comparing the experienced quality with a comparison standard, which incorpo-
rates the customer’s expectations (cf. Parasuraman et al. 1988; Kotler 1991;
Zineldin 1999, 720; Anderson & Sullivan 1993, 126), whereas the relationship
quality is an evaluation of the perceived performance across all episodes in the
relationship. The comparison standard can be for instance competitor, excellent
service, adequate, ideal, or brand norm. Value is determined by the zone of toler-
ance, which in episode level is the accepted variation in the performance levels
between desired quality and the level of quality considered acceptable (Zeithaml
et al. 1993, 6). If the quality falls short from the acceptable level, the value is per-
ceived low, and leads to dissatisfaction (cf. Parasuraman et al. 1988; Kotler 1991;
Zineldin 1999, 720; Anderson & Sullivan 1993, 126). The evaluation of value al-
so includes the sacrifices made, such as the price paid of the offering or time spent

43
waiting, and it is compared to the episode quality. If the episode is perceived to
offer enough benefits to justify the price, the perceived value is good (cf. Gallo
2015). Similarly, the zone of tolerance in the relationship level depicts the accept-
ed accumulation variation in the performance within the entire relationship, and
the relationship value, and therefore also the relationship satisfaction, is deter-
mined by the comparison of relationship quality and sacrifice, i.e. the overall ser-
vice quality across episodes and the perceived sacrifice across all service episodes
in the relationship. The episode satisfaction is the customer’s cognitive evaluation
of how well the supplier was able to meet their expectations based on the personal
experience of one service episode (cf. Parasuraman et al. 1988; Kotler 1991;
Zineldin 1999, 720; Anderson & Sullivan 1993, 126), and takes the episode sacri-
fice into consideration in the evaluation. Satisfaction, both episode level and rela-
tionship level, increases behavioral variables connected to profits, such as cus-
tomer loyalty and commitment (cf. Ravald & Grönroos 1996), as well as strength-
ens the bonds that tie the customer to the company. (Liljander & Strandvik 1995;
Grönroos 2007, 127-130.)

44
Figure 5. Relationship quality model. (Liljander & Strandvik 1995)
The model also suggests that customer satisfaction is a result of comparing the
perceived quality, either episode or relationship level, with the perceived sacrifice.
As businesses generally base their purchasing decisions on economic factors ra-
ther than emotional, customer perceived value is therefore an essential element in
business-to-business relationships and has a significant effect on customer satis-
faction (Eggert & Ulaga 2002, 109).

45
3 CUSTOMER PERCEIVED VALUE
Although companies can differentiate by offering better products and services
than their competitors, also the price aspect of the offering has to be taken into
consideration in business-to-business context as purchasing decisions are largely
made based on economic reasons (Eggert & Ulaga 2002, 109). Perceived value is
the customer’s evaluation of the perceived quality compared with the perceived
sacrifice. The lower the perceived sacrifice is, the better the perceived value.
Providing better value is the key to gaining a competitive advantage against com-
petitors with core products of the same quality and price (Grönroos 2007, 1–5;
Leventhal 2006, 431). Even in markets with relatively little competition, such as
the snowmobile spare part market, providing customers with greater value than
their competitors is the most reliable way to achieve sustainable customer satis-
faction and loyalty (Jones & Sasser 1995; Khalifa 2004; Dawkins & Reichheld
1990). Perceived value has also been argued to be the most important indicator of
repurchase intentions (Parasuraman & Grewal 2000), and customers tend to
choose a supplier that provides the best value, making the ability to provide supe-
rior value one of the most successful competitive strategies (Ravald & Grönroos
1996, 19; Parasuraman 1997; Dawkings & Reichheld 1990; Jones & Sasser 1995,
90; Hutt & Speh 2010, 360).
3.1 Definition
Customer perceived value is commonly defined as “the customer’s overall as-
sessment of the utility of a product or a service based on perceptions of what is
received and what is given” (Zeithaml 1988, 14). Monroe (1991) defines per-
ceived value as the ratio of the total benefits received to total sacrifices incurred:
Customer perceived value CPV = Perceived benefitsPerceived sacrifice

46
The perceived benefits refer to the perceived monetary value of the economic,
functional, and psychological benefits the customer expects to gain from the offer-
ing, and the perceived sacrifices refer to the monetary, time, energy, and psycho-
logical costs of evaluating, obtaining, using and disposing of the offering (Kotler
& Keller 2012, 147).
According to Boksberger and Melsen (2009), value has two dimensions: transac-
tion-specific value and end-state value. Transaction-specific value refers to the
customer’s evaluation of the value in a specific transaction, one service encounter,
and includes variables such as service excellence, service recovery, value creation,
and pricing. The end-state value comprises service profit chain, relationship mar-
keting, and customer lifetime value. Also according to Lindgreen and Wynstra
(2005), value has two aspects: the value of goods and services and the value of the
supplier-customer relationships.
3.2 The value of an offering
The value of an offering is usually evaluated based on its perceived quality in re-
lation to the cost of acquiring it (Fornell, Johnson, Anderson, Cha & Bryant 1996,
9). If the cost of acquiring the offering is perceived to be too high in comparison
with the perceived quality, the offering is not perceived to provide good value.
Therefore, delivering high value can mean delivering consistent quality at low
costs (Heskett, Sasser & Hart 1990). The value of an offering can also be estimat-
ed based on its value for money, meaning that the offering is perceived to provide
good value when the ratio of the price, quality, and quantity is considered ac-
ceptable (Stevens 1992, 44). If the perceived price is higher than the customer
finds acceptable for the quality and quantity received, the perceived value of the
offering is low. Consequently, even if a product or service is of high quality, it
does not automatically mean that it provides value for the customer. Therefore, in
creating a competitive advantage, the company should take also other aspects into
consideration, such as the price of the offering and other related sacrifices.

47
Moreover, according to Parasuraman and Grewal (2000) customers evaluate dif-
ferent components of value: acquisition value, transaction value, in-use value, and
redemption value. The acquisition value is the benefit relative to monetary costs
that customers get by acquiring the service. Transaction value includes the com-
parison between the internal reference price of the customer and the actual price
offered by the supplier; it is the ‘pleasure’ obtained by getting a good price deal.
In-use value can be characterized as the utility derived from using the service,
whereas the redemption value refers to the residual benefit received at the time of
trade-in or termination. (Parasuraman & Grewal 2000.)
According to Gallo (2015), rational buyers evaluate the value of an offering by
adding up the estimated benefits of the offering and comparing them to the cost of
acquiring it, and make purchases based on whether the offering is perceived to
offer enough benefits to justify the price, or if it offers more value compared to
what another supplier is able to offer. Also Eggert and Ulaga (2002, 110) define
the customer perceived value in business-to-business framework as “the trade-off
between the benefits and sacrifices of the company’s offering, as perceived by the
key decision-makers in the customer’s organization, also taking into consideration
the competitors’ offerings.” The key-decision makers refer to the individuals of
the customer companies that are in direct contact with the supplier and have an
impact on the choice of supplier, including for example purchasing managers, im-
port managers, supply chain managers, operations managers, and the CEOs of the
companies. As customers typically choose the alternative that is perceived to offer
the highest value, value can be seen as the customer’s choice or preference in a
competitive setting (Gertz & Baptista 1995, 128).
Similarly, Woodruff (1997, 142) defines perceived value as the “customer’s per-
ceived preference for and evaluation of those product attributes, attribute perfor-
mances, and consequences arising from use that facilitate achieving the custom-
er’s goals and purposes in use situations.”, indicating that the customers evaluate
the value of an offering based on its ability to fulfil their needs in particular use

48
situations. As customers might have different needs depending on the situation
and due to the heterogeneity of services, also customer perceived value is highly
context-dependent (Zeithaml 1988, 14). For instance, in a situation where the cus-
tomer receives an urgent order from their customer, the supplier that is able to de-
liver the ordered product within the shortest timeframe is likely to be perceived to
provide the best value in that situation, even if the monetary price was a bit high-
er.
Furthermore, the perception of value is also subjective and individual (Zeithaml
1988, 14) as customers attach value to an offering depending on its perceived abil-
ity to help solve the particular customers’ problems or fulfil their needs (Levitt
1980). Both the customer’s perception of value and their expectations regarding
the service are subjective and depend on the particular customer as well as per-
ceived alternatives, and even in situations where the provided service is the exact-
ly same, the perceived value will still be different depending on the individual
customer (Moscoso & Lago 2011). Therefore, value can also be defined as a bet-
ter service that is adapted to the customer’s needs (Gwinner, Gremler & Bitner
1998). Zeithaml (1988) identifies four meanings of value: value is low price, val-
ue is whatever the customer wants in an offering, value is the quality that the cus-
tomer receives for the price paid, and value is what the customer receives for what
they give.
Since there are often differences between the customers’ value perceptions and the
supplier’s definition of value (Gallo 2015), and as the customers’ willingness to
continue the relationship depends on the value created for them, the benefits of
continuing the particular business relationship should be actively communicated
to the customers (Trivedi 2014, 96). Due to the nature of perceived value, know-
ing your customers and finding out how to best deliver value for them becomes an
important part of developing the company’s business strategy.

49
3.3 Value criterion
According to Grant (1995), creating a competitive advantage against competitors
includes four steps: constructing a value chain based on different activities of the
supplier and its customers, identifying the individual customers’ value drivers and
value differentiation variables, choosing the key variables and reinforcing them,
and identifying what creates value for the customers. Customer value drivers in-
clude for instance company brand characteristics, customer services, customer re-
sponse effectiveness, supply chain management, and logistics, including order
management, product availability, and delivery frequency and reliability. (Walters
& Lancaster 1999, 700.)
The customer’s value criterion comprises of the characteristics of the offering that
are considered to be the main reason for choosing a particular supplier instead of a
qualified competitor. The customers tend to choose a supplier whose offerings
enhance the customer perceived value. Similarly to the determinants of service
quality, the value criterion are used in the comparison process where the customer
compares the benefits and sacrifices in relation to what the competitors have to
offer. The supplier’s ability to provide value is determined by criterion such as
security, convenience, performance, economy, aesthetics, and reliability, which
are described in Table 2. (Walters & Lancaster 1999, 697.)
Table 2. Value criterion. (Walters & Lancaster 1999)
Value criterion Features
Security Brand strength, service/warranty
Convenience Location, time
Performance Choice, quality, cost/effectiveness
Economy Price, value drivers, relative price levels with competitors
Aesthetics Design and conformity
Reliability Consistency of quality, continuity of benefits and costs

50
Value in business markets can thereby be defined as the monetary value of the
technical, economic, service, and social benefits the customer receives in ex-
change for the price paid for obtaining the offering (Anderson & Narus 1998).
Companies can deliver value to their customers by adding differentiation by in-
creasing their service quality, providing exclusive features, increasing the func-
tionality (e.g. performance and quality) of their offerings, and/or decreasing total
sacrifices (Cox 2004; Walters & Lancaster 1999, 700). Since total perceived value
is the comparison between total benefits received and total sacrifices incurred, in-
creasing the total perceived value includes two complementary strategies: increas-
ing the benefits and reducing the sacrifices (Patterson & Spreng 1997, 416; Mon-
roe 1991).
3.4 Perceived benefits
Perceived benefits are the ‘get’ components of perceived value, and by increasing
the benefits, customer perceived value can be increased (Patterson et al. 1997,
416; Monroe 1991; Kotler & Keller 2012, 147).
According to Zeithaml (1988, 14), the benefit components of value include salient
intrinsic attributes, extrinsic attributes, perceived service quality, and other rele-
vant high level abstractions. Similarly to the physical attributes, intrinsic attributes
include the physical structure of the product, for example durability, features, per-
ceived quality, and performance (Garvin 1987). The better the quality of the prod-
uct is, the less likely it is that the customer has to waste valuable time on filing
complaints, returns, and refunds. Therefore, a good product can have a decreasing
effect on customer sacrifices and thereby increase the total perceived value of the
offering. Extrinsic attributes are product-related, external attributes, including for
example the price of the product, brand name, and level of advertising (Zeithaml
1988). The evaluation of service quality is based on the excellence or superiority
of the service compared to services that are regarded as substitutes by the custom-

51
ers (Zeithaml 1988, 5). Good service quality has a decreasing effect on customer
sacrifices and thereby an increasing effect on the perceived value of the offering.
Benefits can be divided into core benefits and add-on benefits; the core benefits
represent the core requirements that have to be met for being in the customer’s
consideration set (such as a specific product) and the add-on benefits consist of
differentiating attributes that create added value in the relationship and encourage
the customer to select a certain supplier instead of the qualified competitor (Men-
on et al. 2005, 4–7; Hutt & Speh 216). The basic elements of the core solution
that all competitors are expected to provide, basic support service (for example
technical assistance) that makes the use of the core solution more efficient or easy,
a recovery process for fixing problems, and extraordinary services excelling in
problem-solving or meeting customer needs that they make the core solution seem
customized, have a great impact on satisfaction as well as the choice of supplier.
Companies can increase the value of their offerings by providing support services
that facilitate the use of the core solution5, as well as including effective recovery
processes for fixing problems. Services excelling in problem-solving or meeting
customer needs encourage the customer to select a particular company instead of
their qualified competitor. (Jones & Sasser 1995, 90; Hutt & Speh 2010, 360.)
3.5 Perceived sacrifices
Perceived sacrifice is what is given up to obtain an offering (Zeithaml 1988, 10).
Generally, business-to-business customers evaluate the price of the offering based
on its value for money; the ratio of the price, quality, and quantity is considered
acceptable (Stevens 1992, 44). If the perceived price is higher than the customer
finds acceptable for the quality and quantity received, the perceived value is low.
Price is an important variable in business-to-business markets as purchasing deci-
sions are generally based on economic factors rather than emotional factors (Eg-
5 The product or service most directly linked to the company’s core competency: Teo Lehtimäki Ltd.’s core solution is a range of snowmobile spare parts

52
gert & Ulaga 2002, 109). According to Zeithaml (1988), customers encode prices
in ways that are meaningful to them. In a business-to-business setting this means
that customers might not always remember the actual price of the product but rec-
ognize the product’s value in terms of their revenues, which can lead to differ-
ences in customers’ perceptions of the price. However, as Teo Lehtimäki Ltd. is
also a profit-driven business, rather than lowering prices, they should focus on
reducing other customer sacrifices, such as time and effort. In addition to the
monetary costs related to the offering, the perceived sacrifice includes also non-
monetary costs included in evaluating, obtaining, using, and disposing of the of-
fering, such as time, energy, and psychological costs (Kotler & Keller 2012). Sim-
ilarly, Petrick (2002, 123) identifies time, effort, search costs, brand image, and
convenience as the non-monetary costs included in the perceived sacrifice. Also
according to Ravald and Grönroos (1996, 21–22), total customer perceived sacri-
fice includes all the monetary and non-monetary costs the buyer faces when mak-
ing a purchase: purchase price, acquisition cost, transportation, installation, order
handling, repairs and maintenance, and risk of failure or poor performance. Rather
than lowering prices, the company can maximize the value for money by increas-
ing the functionality of the offerings and reducing the total costs (Cox 2004, 413).
Ensuring good service quality also has a decreasing effect on customer sacrifices
as zero defects mean that using the supplier’s offerings does not require high sac-
rifices from the customer’s part.
3.6 Increasing perceived value
According to Monroe (1990), customers value a decrease in sacrifices more than
an increase in benefits, which can be done by offering better, customized services
that excel in solving the particular customer’s problems. The less time and effort
the customer has to put into evaluating, obtaining, and using the offering, the low-
er the perceived sacrifice is, and therefore, the more value they derive from using
a particular supplier’s services.

53
In order to improve customer satisfaction, companies intend to add more value to
the core product by improving product and service quality or including supporting
services (Ravald & Grönroos 1996, 19), which is also the only way to gain a
competitive advantage against competitors with identical core products (Grönroos
2007, 1–5; Leventhal 2006, 431). These supporting services include for example
after-sales service, warranties, recycling, and technical assistance. By adding
something to the core product that is perceived to be important, beneficial or of
unique value for the customer, the customer benefits increase as well as the per-
ceived value of the offering (Ravald & Grönroos 1996, 25). Thereby, customer
perceived value can be described as the result of comparing the core solution and
additional services with the price and relationship costs (Grönroos 2007):
Customer perceived value = Core solution + Additional servicesPrice + Relationship costs
The benefits include the core solution and additional services, which together in-
crease the customer perceived value. The sacrifices include the price and relation-
ship costs. Grönroos (2007) identifies three types of relationship costs: direct rela-
tionship costs, indirect relationship costs, and psychological costs. Direct relation-
ship costs refer to costs incurred due to internal systems the customer has to main-
tain due to the supplier’s solutions, such as software, equipment, and personnel.
Indirect relationship refer to costs that are result from time and resources devoted
to maintain the relationship, and are often caused by service failures, such as de-
livery delays, inaccurate invoicing, or poor recovery processes. Indirect costs are
minimized when the customer can rely on the supplier, which is generally a result
of providing a consistent and reliable service. Lack of trust also results in psycho-
logical costs characterized by the customer’s worry and insecurity of the suppli-
er’s ability to deliver an acceptable level of service quality. (Grönroos 2007.)
The most successful way of providing value is in terms of reducing the customer
perceived sacrifice, so that the relationship costs are minimized and customer per-
formance improved (Ravald & Grönroos 1996, 21). Teo Lehtimäki Ltd. can re-

54
duce customer perceived sacrifices by for instance simplifying processes. If the
customer has to put a lot of time and effort into obtaining the product, for example
by having to send several inquiries and not receiving a reply within the expected
timeframe, the perceived sacrifice is high and thereby the perceived value of the
offering is low. In order to avoid these kind of situations where the perceived sac-
rifice is high, features of the services that reduce the perceived sacrifice have to be
identified and increased. By knowing the customer, the company is able to pro-
vide a customized service, i.e. providing the customers with exactly what custom-
ers wants, and how they want it.
Moreover, as Teo Lehtimäki Ltd. operates as a wholesaler, their main focus
should be in logistics, which includes effective order management, having good
product availability, and ensuring delivery frequency and reliability. Effective or-
der management ensures that the products are delivered fast and the delivery con-
tains the right products. Product availability can be ensured by keeping track of
the customers’ purchases within certain product categories and making sure that
the required products are available in the warehouse when the customers need
them. Perhaps one of the most important aspects could be delivery frequency and
delivery, as Teo Lehtimäki Ltd. operates in the business-to-business market,
meaning that their customers also have a responsibility to deliver the products to
their customers on time (Gummesson 2002). Other possible areas for differentia-
tion in the case company’s context, in addition to better services and fast deliver-
ies, include for example payment options and the possibilities to get assistance
(Eriksson, Hilletoft & Hilmola 2013), that increase the perceived value of their
offerings.
3.7 Relationship value
The relationship itself might have a major effect on the total customer perceived
value (Ravald & Grönroos 1996, 23), and thereby also on customer satisfaction.
In a long-term relationship with the supplier, the customer benefits include attrib-
utes, such as safety, credibility, security, continuity, that together increase the trust

55
for the supplier, and thereby encourage customer loyalty (Ravald & Grönroos
1996, 24).
Customer value characterizes the customer’s overall assessment of the business
relationship, based on the perception of the benefits received and sacrifices made
(Menon et al. 2005, 5). Customer satisfaction is the result of the customer’s per-
ception of the received value in one transaction or the entire business relationship
(Molinari et al. 2008). A successful way to provide value is reducing sacrifices by
minimizing the relationship costs for the customer (Ravald & Grönroos 1996, 19),
or alternatively, by maximizing the relationship benefits. The perceived value in
relationships includes also the relationship benefits and sacrifices in addition to
the benefits and sacrifices of one episode (Grönroos 2007):
Customer perceived value = Episode benefits + Relationship benefitsEpisode sacrifice + Relationship sacrifice
Episode benefits and sacrifices refer to what is received and what is given during
one single service encounter (episode), which can be for example receiving a track
mat for a discounted pre-season price; the benefit includes the product and the
supporting services, such as fast and easy ordering process, and the sacrifice in-
cludes the monetary price paid as well as other sacrifices, such as time spent wait-
ing. In this case, the episode sacrifice is reduced by offering the customer a lower
price than normal, which has an increasing effect on the total perceived value. Re-
lationship benefits of the same situation include the possibility of ordering prod-
ucts for a reduced price; a new customer might not have this possibility. Another
relationship benefit could be having confidence in the supplier as a result of con-
sistent and reliable service; the customer knows that the product will be received
on time.
The relationship benefits, i.e. the benefits for the customers of maintaining a rela-
tionship with a supplier, can be categorized into three types: confidence, social
benefits, and special treatment (Gwinner, Gremler & Bitner 1988, 101–114). Con-

56
fidence includes reduced anxiety, increased faith in the supplier, and a general
feeling of trustworthiness of the supplier, which is a result of consistent and relia-
ble services that have increased the customer’s satisfaction and resulted in posi-
tive expectations towards the supplier’s future performance capabilities. There-
fore, confidence has a decreasing effect on the relationship costs (cf. Grönroos
2007). Moreover, the stronger the customer’s trust in the supplier is, the less likely
they are to perceive competitors as substitutes, and therefore, the smaller the
chance of them switching suppliers is (Storbacka, Strandvik & Grönroos 1994).
Social benefits include personal recognition by the personnel, the customer being
familiar with the personnel, and the development of friendship with the personnel.
Moreover, Gummesson (2002) suggests that the supplier needs to put more effort
on creating personal relationships with the customers, since it is a strong bond ty-
ing customers to the company, and increases customer retention. Special treatment
means extra services, special prices, and higher priority than other customers,
which increase the value of the business relationship (Gwinner et al. 1988, 101–
114.)
Gwinner et al. (1998) define value as a better service that is adapted to the cus-
tomer’s needs. As the business relationship continues, the processes become
smoother and faster due to the fact that the supplier knows its customers and is
thereby able to provide a customized service that excels in meeting customer ex-
pectations and fulfilling their needs, which in turn reduces the customers’ non-
monetary sacrifices, such as time and effort. Consequently, a long-term supplier
might be perceived to provide the superior value than their competitors who are
not able to provide the same kind of customized services due to lack of knowledge
of the customer’s needs and preferences. Since the customers’ willingness to con-
tinue the relationship depends on the value created for them, the benefits of con-
tinuing the particular business relationship should be actively communicated to
the customers (Trivedi 2014, 96).

57
4 RELATIONSHIP SATISFACTION AND PROFITABILITY
The company’s ability to create and maintain strong customer relationships is a
foundation for sustainable competitive advantage (Day 2000, 24), and the key is
in the supplier’s ability to provide superior value for its customers (see Ravald &
Grönroos 1996, 19; Parasuraman 1997; Dawkings & Reichheld 1990; Jones &
Sasser 1995, 90; Hutt & Speh 2010, 360). Satisfied customers are less likely to
switch to suppliers, which also complicates competitors’ market entry as well as
them gaining market share (Buchanan & Gilles 1990). Teo Lehtimäki Ltd. oper-
ates as a wholesaler of snowmobile spare parts, a very specific and limited mar-
ket, which means that there is also only a limited amount of snowmobile spare
part dealers, making the ability to create and maintain customer relationships es-
sential for the company’s success. By successfully satisfying their customers, the
company increases their willingness to continue the relationship, and thereby in-
creases customer loyalty.
According to Reiccheld (1990), customers also contribute more to the profits as
the business relationship grows. Since long-term customers are less likely to
switch suppliers, they also become less price-sensitive, which can lead to stable
unit purchase volumes and therefore an increase in the supplier’s total sales vol-
ume (Buchanan & Gilles 1990). Moreover, maintaining a customer relationship
can be up to ten times more economical for the supplier than acquiring a new one
(Heskett, Sasser & Hart 1990; Reiccheld 1990). The customer’s willingness to
choose the supplier again decreases the acquisition costs, as the acquisition cost of
a customer is a one-time investment. Therefore, the longer the relationship, the
lower the amortized cost. Moreover, the supplier’s ability to fulfill the customer
expectations increases as a result of gaining experience with its customers. By
knowing its customers and their expectations, the supplier is able to customize
their services and processes to fit a particular customer’s needs, and as a result,
fewer mistakes are made, the service processes become smoother and faster, lead-
ing to a reduction in the supplier’s expenses as well as the customer perceived

58
sacrifices. In addition, since customers know what to expect from the company
and have fewer problems, they become more familiar with the processes, the con-
sistency in their order placement increases, and thereby they also become less ex-
pensive to serve. (Buchanan & Gilles 1990; Reichheld 1990; Grönroos 2007.)
Moreover, the customers’ attitudes towards the company and whether the custom-
er perceives the company to be capable of fulfilling their expectations have an ef-
fect on the word-of-mouth they spread; a satisfied customer is likely to engage in
positive word-of-mouth promotion and referrals (Buchanan & Gilles 1990; Stauss
& Neuhaus 1997), and since Teo Lehtimäki Ltd. is relying heavily on word-of-
mouth promotion in getting new customers, satisfying their current customers is
also an important part of their strategy for acquiring new customers.
The profitability effect of long-term customer relationships is illustrated in Figure
6. Acquisition cost refers to the overall expenses connected to ‘convincing’ a cus-
tomer to choose a certain supplier over another, including for example the product
cost and the research and marketing expenses. The base profit includes the price
paid by customers during the first years of the relationship, which do not yet cover
the producing costs of the service – only after some years the accumulated base
profits have covered the initial acquisition expenses. Revenue growth refers to
customers’ increasing contribution to profits as the relationship grows. Cost sav-
ings refer to reduced operating expenses, fewer mistakes, and increased efficiency
to meet customer expectations. Referrals, a result of satisfying customers, have a
favorable effect on profit as well, since new customers are acquired with lower
acquisition costs than normal. Price premium refers to the fact that long-term cus-
tomers often pay a higher price than new customers, due to for example introduc-
tory offers. (Reichheld 1990.)

59
Figure 6. The profitability effect of loyal customers. (Reichheld 1990).
The company’s revenue growth, cost savings, referrals and price premium all in-
crease as the relationship with the customer lengthens, confirming that creating
and maintaining customer relationships has a positive impact on company profita-
bility. And since customer satisfaction impacts the customers’ willingness to con-
tinue the relationship, the supplier’s ability to satisfy its customers is the key to
creating, and maintaining, profitable customer relationships. (Reichheld 1990;
Stauss & Neuhaus 1997, 238.)
4.1 Customer relationship profitability
The customer relationship profitability model, depicted in Figure 7, demonstrates
how quality, value, satisfaction, and profitability are connected. By establishing a
link from perceived value to customer satisfaction, from customer satisfaction to
relationship strength, from relationship strength to relationship length, and lastly,
from relationship length to customer relationship profitability, the model shows
that profitability ultimately depends on the value created for customers. It also
highlights the importance of strong relationships in relation to company profitabil-
ity.
0 1 2 3 4 5 6An
nu
al c
ust
omer
pro
fit
Year
Price premium
Referrals
Cost savings
Revenue growth
Base profit
Acquisition cost

60
Figure 7. The customer relationship profitability model. (Storbacka et al. 1994)
Perceived value is the result of comparing customer perceived quality and per-
ceived sacrifice. The customer is satisfied when the perceived value is high, as it
indicates high perceived quality and low perceived sacrifice. Customer satisfac-
tion is therefore defined as the result of receiving high quality at low sacrifice.
Customer satisfaction is important in building strong relationships due to the fact
that it promotes customer commitment and creating different kinds of bonds be-
tween the supplier and the customer (Grönroos 2007, 162; Ravald & Grönroos
1996, 19). Bonds are exit barriers that tie the customer to the supplier and
strengthen the relationship. The more bonds there are connecting the customer to
the supplier, the stronger the relationship is. For example, a customer tied by only
a legal bond can terminate the relationship after the contract expires, whereas a
customer tied by also a knowledge bond and psychological bond is more commit-
ted to the supplier and therefore more likely to continue the relationship. There-
fore, the creation of bonds is essential in building long-term relationships.
(Liljander & Strandvik 1995.) Different kind of bonds are explained in Table 3.

61
Table 3. Bonds in relationships. (Liljander & Strandvik 1995)
Type of bond Description
Legal bond A contract between the customer and supplier
Economic bond Price reductions based on relationship and financial incen-tives for retention
Technological
bond
The purchase of a specific product that requires the use of a specified deal for repairs/maintenance and/or original spare parts from manufacturer or supplier
Geographical
bond
Limited possibilities to obtain the service from other sup-pliers due to distance or lack of transportation
Time bond Suitable/flexible business hours
Knowledge bond Supplier knows the customer and how to fulfil their needs
Social bond Customer and supplier know each other well. The main characteristic is mutual trust
Cultural bond
Customers may identify themselves with a subculture (e.g. language, country) and therefore relate more strongly to certain companies
Ideological bond Choice of supplier based on personal values
Psychological
bond
The customer is convinced of the superiority of the supplier (brand image)
Another upside to strong customer relationships is the fact that customers become
more tolerant towards occasional inferior performances as the relationship grows
(Ravald & Grönroos, 1996). The stronger the relationship, the less critical epi-
sodes affect it. A critical episode is a situation where the supplier’s performance
fails to meet the customer’s expectations, for example by providing inferior quali-
ty in a service encounter. The length of the relationship depends on how the situa-
tion is solved. Since negative disconfirmation has a greater impact on customer
satisfaction and retention positive disconfirmation, in order to keep the customer,
the service provider has to manage satisfaction with effective complaints handling

62
and efficient customer service when the performance fails to meet the customer’s
expectations (Anderson & Sullivan 1993). For example, if the ordered product is
out of stock, it results in a longer delivery time and therefore an increase in cus-
tomer perceived sacrifice. The supplier can compensate the increased customer
sacrifice caused by the delay by for example offering a free delivery or a dis-
counted price, or suggesting a substitutive product. Consistently providing good
quality and having the customer’s best interest at heart is essential for the continu-
ity of customer relationships. Moreover, the strength of the relationship also de-
termines the amount of perceived alternatives. As a result of knowing its custom-
ers, the supplier is able to offer customized solutions to fit the customer’s needs or
solve their problems (episode configuration), which decreases the relationship
costs as well as reduces the possibility of the customer perceiving a competitor as
a substitute.
4.2 Customer relationship management
As the length and strength of the business relationship depends on how satisfied
the customer is with the relationship as a whole (Storbacka et al. 1994), it is not
about what kind of offering the supplier provides but rather what kind of relation-
ship the supplier is capable of maintaining (Ravald & Grönroos 1996, 23).
According to Grönroos (2007), the purpose of marketing is to identify potentially
profitable customers and establish relationships with them, as well as maintaining
and enhancing the relationships, and when necessary, terminating relationships
with customers so that the economic objectives of both the supplier and the cus-
tomers are met. Also Gummesson (2008, 30) states that the fundamental property
of every business-to-business relationship is collaboration. Therefore, the aim of
every customer-supplier relationship should be to establish a collaborative rela-
tionship that is founded on a mutually beneficial cooperation (Hines, Lamming,
Jones, Cousins & Rich 2000, 274). Central to every business relationship is the
exchange process where value delivered and received (Day 2000, 24). The suppli-
er provides goods and services in order to operationally increase the revenue that

63
they can receive from a particular customer, as well as to commercially maximize
the monetary price that can be obtained from delivering a specific product or ser-
vice, whereas the customer is concerned operationally with the functionality of the
offering – its performance, quality, on-time delivery and so on, and commercially
with the total relationship costs incurred (Cox 2004, 413). Teo Lehtimäki Ltd.
provides goods and services to their customers in exchange for money, and the
customers provide money and other resources (for example access to new mar-
kets) in exchange for goods and services (Cox 2004, 415).
Customer relationship management, CRM, refers to building and maintaining cus-
tomer relationships that create value for the company (Kumar 2010). CRM recog-
nizes the long-run value of the customers, both potential and current ones, and
seeks to increase profits and company value by developing, maintaining, and en-
hancing prosperous, long-term supplier-customer relationships (Berry 1983, 25;
Morgan and Hunt 1994, 22; Grönroos 1990, 138; Payne & Frow 2005, 168).
CRM strategies can be used for decreasing the company’s total marketing costs,
increasing the customer profitability, thus, the company profitability (Kumar
2010), and therefore, implementing a CRM strategy would be worthwhile for the
case company as well.
CRM generally refers to practices, strategies, and technologies that are used for
managing and analyzing customer-supplier interactions throughout the business
relationship, with the aim of improving the relationships with as well as increas-
ing retention and sales (Rouse 2014). Companies can introduce a CRM database
to facilitate managing the relationships, which they can also use to support the
company’s future marketing decisions. A CRM database consists of information
about a company’s business partners, products, business transactions, and market-
ing attributes. According to Johannes (2013), a CRM database has generally three
technical divisions: general data, address data, and relationship data. General data
consists of general information, such as customers’ order history, used marketing
tactics, and other relevant information. Address data includes the business part-

64
ners’ physical mailing address as well as communication data such as telephone
and mobile numbers, fax numbers, and email address. Relationship data connects
business partners to one and other and describes the interactions between them,
and includes information about the contact person. The customer information
submitted to the CRM database is normally acquired from orders, enquiries, cus-
tomer service contacts, research questionnaires, and so on. Therefore, the research
provides data that the company could add to their CRM database. (Johannes 2013;
Stone & Woodcock 1995.)

65
5 THEORETICAL FRAMEWORK
The theoretical framework provides an overview of the theories discussed in the
theoretical part and describes their relevance in connection to the research. The
research has two objectives: to measure the current customer satisfaction levels in
connection with the provided service quality, and to reveal the customers’ percep-
tions of the value of the company’s offerings as well as the value of the relation-
ship. The main topics include customer satisfaction, customer perceived quality,
customer perceived value, and customer relationship profitability.
The first topic is customer satisfaction, which is defined as the post-purchase
evaluation of the product and service quality in the view of pre-purchase expecta-
tions (Kotler 1991). The reason why customer satisfaction is essential for any
business’ success is the fact that satisfaction determines the customers’ willing-
ness to continue the relationship (Stauss & Neuhaus 1997, 238). The different sat-
isfaction outcomes are explained alongside with their implication. In addition to
identifying customer expectations and consistently striving to fulfil these expecta-
tions, also the importance of effective recovery processes in connection to satis-
faction is emphasized. Another important aspect in satisfying customers is the
consistency in the company’s marketing communication messages, and the role of
integrated marketing communication in establishing satisfaction is discussed.
The second chapter describes customer perceived quality, which is strongly con-
nected to satisfaction as satisfaction is dependent on how well the customer expe-
rience measures up to the customer's expectations of quality (Zineldin 1999, 720).
Different definitions for quality are given and the two dimensions of quality are
explained. As the research aims to measure satisfaction levels in connection with
the provided service quality, the functional quality dimension is chosen as a focus
point and different characteristics of services are identified. Also the determinants
of service quality used in evaluating the quality of a service are described. Moreo-
ver, the difference between episode quality and relationship quality is explained

66
alongside with their impact on satisfaction, and the link to the next topic, per-
ceived value is recognized.
The topic of customer perceived value includes explaining its role in creating a
competitive advantage against competitors with core products of the same quality
and price (Grönroos 2007, 1–5; Leventhal 2006, 431). Customer perceived value
is defined as “the customer’s overall assessment of the utility of a product based
on perceptions of what is received and what is given” (Zeithaml 1988, 14). The
benefits and sacrifices included in customer value perceptions are identified, and
different ways to increase customer perceived value are introduced. The chapter
also describes value from two aspects: the value of goods and services and the
value of the supplier-customer relationships (Lindgreen & Wynstra 2005), and the
difference between episode and relationship level benefits and sacrifices.
The last chapter makes a connection between satisfaction, quality, and value and
ties the thesis together, and emphasizes their importance in connection to custom-
er relationship profitability. Also the reason why long-term customer relationships
are more profitable is explained and also the concept of customer relationship
management is briefly introduced alongside with its connection to the study.

67
III EMPIRICAL PART
The empirical part is dedicated to defining the research problem(s) and introduc-
ing the research methodology. The first chapter defines what marketing research
is and what kinds of processes are normally involved. The research process of the
conducted study is described in detail and the chosen research method(s) exam-
ined. The research results and the major findings are presented, and suggestions
for future research are discussed as well. Also the reliability and validity issues of
the research are discussed.
6 MARKETING RESEARCH
Marketing research refers to the process of designing, gathering, documenting,
and analyzing relevant and useful information that is connected to a particular re-
search problem or question that needs solving (Nair 2009; Burns & Bush 2001, 7;
Blythe 2012, 98). Marketing research is typically conducted to find solutions to a
particular problem a company is facing, such as a decrease in sales, or it can also
be used for identifying and defining marketing opportunities (Burns & Bush 2001,
9). Generally, the core function of marketing research is to provide support to the
company’s marketing decisions (Birks & Malhotra 2007, 2; Churchill & Iacobuc-
ci 2010, 3; Burns & Bush 2001, 7).
The American Marketing Association’s (AMA) definition of marketing research
is widely used in the literature (see e.g. Burns & Bush 2001; Churchill & Iacobuc-
ci 2010; Kolb 2008; Brassington & Pettitt 2007) as it summarizes the functions of
marketing research:
“Marketing research is the function which links the consumer, customer, and public to the marketer through information – information used to identi-fy and define marketing opportunities and problems; generate, refine, and evaluate marketing actions; monitor marketing performance; and improve our understanding of marketing as a process.”

68
Marketing research can be utilized to support all aspects of marketing, and de-
pending on the aim of the research it can focus on for example product, pricing,
distribution, promotion, buying behavior, or general corporate research (Churchill
& Iacobucci 2010, 5). As this particular study involves revealing what creates
value for customers and how it could be increased to enhance loyalty, the research
focuses on the buying behavior aspect of marketing and involves subcategories
such as satisfaction, segmentation, awareness, preferences, and behavior (Church-
ill & Iacobucci 2010, 5).
In addition to supporting the company’s decision-making processes, marketing
research also enables the company to monitor and reflect upon their previous
marketing decisions and to evaluate the successfulness of those decisions (Birks
& Malhotra 2007, 2; Burns & Bush 2001, 12). Therefore, marketing research can
be seen as a learning tool – depending on the problem that needs solving, the aim
of marketing research is to provide the company with new, relevant information
connected to the marketing problem and to offer solutions. Moreover, as the busi-
ness environment is constantly changing, acquiring updated information through
marketing research is essential for the company’s success and its ability to fulfil
customers’ changing needs and requirements (Burns & Bush 2001, 7).
Marketing research is included in all stages of the information management pro-
cess; defining what kind of information is required to solve the particular research
problem, designing the method for gathering the data and implementing it, analyz-
ing the collected information, as well as interpreting the findings and their impli-
cation on the research problem (Nair 2009; Churchill & Iacobucci 2010, 5). The
aim of marketing research is to provide solutions, and therefore, it is important
that the collected data is relevant and can be utilized to develop functional strate-
gies that assess the particular research problem (Birks & Malhotra 2007, 2). The
collected data, raw facts, is analyzed to gain information about their implication,

69
which is then analyzed to gain knowledge about what should be done (Kolb 2008,
12).
In this case, the marketing research process includes collecting data on Teo
Lehtimäki Ltd.’s customers’ expectations regarding the performance, their current
satisfaction levels, and the perceived value of the relationship, and then utilizing
that information for creating useful strategies that enhance the company’s ‘attrac-
tiveness’ and increase customer retention and loyalty (Churchill & Iacobucci
2010, 3). Depending on the results, this can mean for instance developing new,
improved services, increasing the service quality or the functionality of their of-
ferings, or decreasing the total sacrifices (Cox 2004; Walters & Lancaster 1999,
700). The aim of the research is to find out what would be the best and most effi-
cient way to solve this particular marketing problem, which is how to increase
customer satisfaction and perceived value, and thereby customer loyalty and re-
tention.
6.1 Marketing research process
Although the stages of a marketing research process are basically the same, the
description and division of the processes differ depending on the source. For in-
stance, according to Bernard (2006, 69), the ideal research process consists of four
stages; problem, method, data collection and analysis, and support/reject hypothe-
sis/theory, whereas Birks and Malhotra (2007) divide the research process into six
stages; problem definition, developing the research approach, defining the re-
search design, data collection, data analysis, and preparing and presenting the re-
sults, and Burns and Bush (2001, 71) identify 11 stages; establishing the need for
marketing research, defining the research problem, establishing the research ob-
jectives, determining the research design, identifying the types and sources of in-
formation, determining the methods of accessing data, designing data collection
forms, sampling, collecting the data, analyzing the data, and preparing and pre-
senting the final research report.

70
Regardless of the source, the research process and the procedures included are ba-
sically the same; the research starts with defining the problem that requires solv-
ing, developing the best research approach and method for solving that particular
problem, collecting the required data and analyzing it to understand its implica-
tions, and finally, offering a solution to the problem. However, marketing re-
search is not always a step-by-step process and every research is different (Burns
& Bush 2001, 71). The research process of this particular study (adapted from
Birks & Malhotra 2007 and Burns & Bush 2001) is illustrated in Figure 8.
Figure 8. The stages of marketing research process.
6.1.1 Problem definition
Problem definition refers to understanding the marketing problem that needs solv-
ing and research support (Birks & Malhotra 2007). As mentioned before, it can be
connected to any aspect of marketing; product, pricing, distribution, promotion,
buying behavior, or general corporate research (Churchill & Iacobucci 2010, 5). It
is important that the marketing problem is defined properly, so that the following
stages of the research process concentrate on solving that particular problem and
Problem definition
Research approach
Research design
Sampling
Data collection
Data analysis
Results and their implication
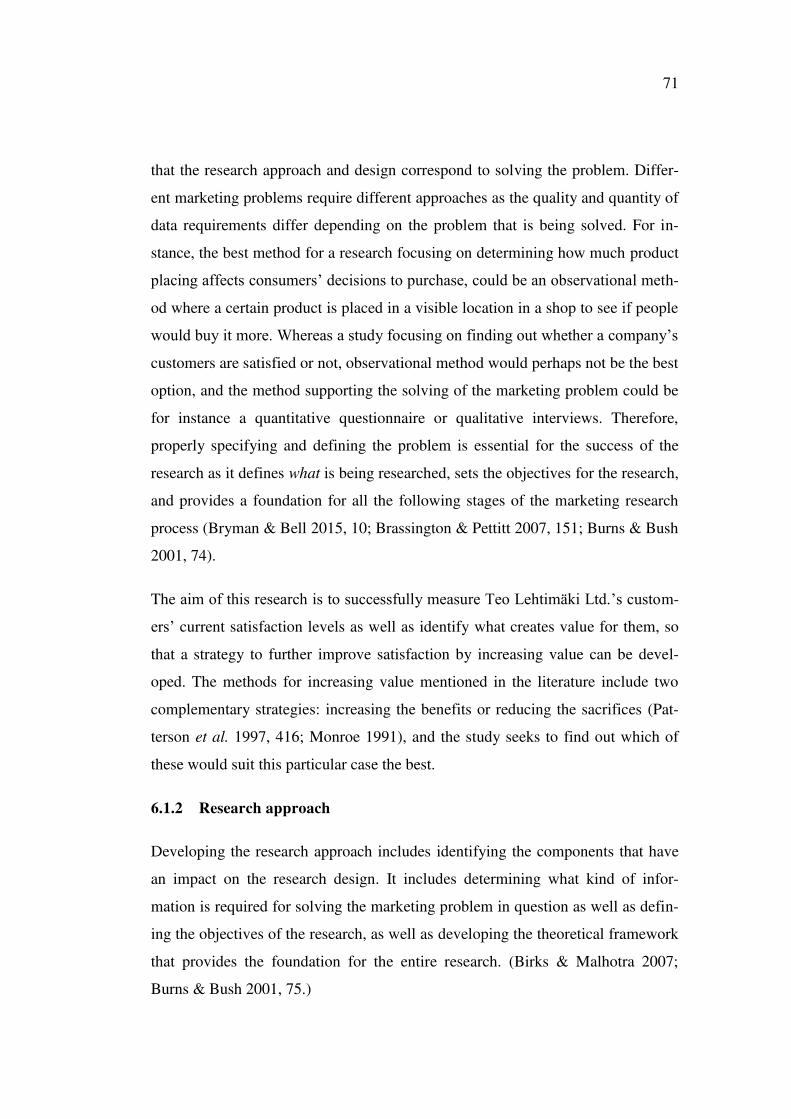
71
that the research approach and design correspond to solving the problem. Differ-
ent marketing problems require different approaches as the quality and quantity of
data requirements differ depending on the problem that is being solved. For in-
stance, the best method for a research focusing on determining how much product
placing affects consumers’ decisions to purchase, could be an observational meth-
od where a certain product is placed in a visible location in a shop to see if people
would buy it more. Whereas a study focusing on finding out whether a company’s
customers are satisfied or not, observational method would perhaps not be the best
option, and the method supporting the solving of the marketing problem could be
for instance a quantitative questionnaire or qualitative interviews. Therefore,
properly specifying and defining the problem is essential for the success of the
research as it defines what is being researched, sets the objectives for the research,
and provides a foundation for all the following stages of the marketing research
process (Bryman & Bell 2015, 10; Brassington & Pettitt 2007, 151; Burns & Bush
2001, 74).
The aim of this research is to successfully measure Teo Lehtimäki Ltd.’s custom-
ers’ current satisfaction levels as well as identify what creates value for them, so
that a strategy to further improve satisfaction by increasing value can be devel-
oped. The methods for increasing value mentioned in the literature include two
complementary strategies: increasing the benefits or reducing the sacrifices (Pat-
terson et al. 1997, 416; Monroe 1991), and the study seeks to find out which of
these would suit this particular case the best.
6.1.2 Research approach
Developing the research approach includes identifying the components that have
an impact on the research design. It includes determining what kind of infor-
mation is required for solving the marketing problem in question as well as defin-
ing the objectives of the research, as well as developing the theoretical framework
that provides the foundation for the entire research. (Birks & Malhotra 2007;
Burns & Bush 2001, 75.)

72
In this case, according to the theoretical framework developed in the previous sec-
tion, it includes collecting relevant information related to customer satisfaction
and perceived value, such as the determinants of service quality, customer expec-
tations, and perceived sacrifices in business-to-business relationships, in order to
be able to conduct the research and obtain useful data that corresponds to the re-
search problem. In order to be able to measure customer satisfaction, attributes of
the customer experience that create value for the customers and increase the per-
ception of quality have to be identified and the customer satisfaction measurement
process then designed according to the attributes (Gouillart 2011).
6.1.3 Research design
Developing the research design includes defining how the data will be gathered
(Birks & Malhotra 2007). The research design is developed based on the infor-
mation defined in the previous stages, and depending on the aim of the research,
there are three different types of research that can be utilized: exploratory re-
search, descriptive research, and causal research. The emphasis in the exploratory
research is on discovering new ideas and insights, and it is typically carried out
for a problem that has not been clearly defined. Descriptive research determines
the frequency with which something occurs or describes the relationship between
two variables, and is typically used to describe the characteristics of the popula-
tion or the marketing phenomena being studied. Causal research design concen-
trates on cause-and-effect relationships which are normally studied through differ-
ent kinds of experiments. (Churchill & Iacobucci 2010, 58–59; Burns & Bush
2001, 77–78; Kolb 2008, 24.) This study utilizes a combination of exploratory and
descriptive research; open-ended questions to discover new insights to further im-
prove the case company’s business relationships, and attribute-based questions to
describe the frequency of the variables and the relationship between them.
Developing the research design also includes designing the content of the chosen
data collection method. This study uses a self-administered questionnaire as the
data collection method. Designing a questionnaire it includes determining the con-

73
tent of individual questions, the structure of the questions (unstructured or struc-
tured), the order of the questions as well as the format and layout of the question-
naire. There are several factors that have to be taken into consideration regarding
the question wording, format and order: the questions should be clear and unam-
biguous, meaning that they are expressed in a way that makes it completely clear
what is meant, so that every respondent understands the question in the same way,
and also the vocabulary used in the questions should fit the target population’s
core vocabulary and not contain words that they are not familiar with. Moreover,
each question should focus on one particular topic or issue and the respondents
have to have enough knowledge about the topics to be able to answer. (Burns &
Bush 2001, 347–352; Bernard 2006, 270–271.)
6.1.4 Sampling
Sampling refers to the process of choosing a sample from the population that is in
line with the research. The sampling process begins with defining the target popu-
lation, which consists of sample units that can be for instance individuals, house-
holds, firms, organizations, countries, and so on. The population is the group that
is being studied, and it is specified by the objectives of the research. (Churchill &
Iacobucci 2010, 283; Burns & Bush 2003, 334.) In this case, the population is Teo
Lehtimäki Ltd.’s most valuable domestic customers. The next step is to select the
best sampling approach and to determine the sample size (Burns & Bush 2001,
410). The aim of the sampling process is to obtain a representative sample that
reflects the population accurately and can be seen as a small-scale version of it
(Bryman & Bell 2015, 187). There are basically two types of sampling approaches
that can be applied in the process of selecting the sample from the population:
probability sampling and non-probability sampling (Bryman & Bell 2015, 187;
Brassington & Pettitt 2007, 164–165).
Probability sampling, a sampling approach where the sample is selected by ran-
dom and each unit in the population has an equal chance of being admitted to the
sample (Bryman & Bell 2015, 187; Brassington & Pettitt 2007, 164–165), in-

74
cludes four different techniques to choose from: simple random, systematic, strati-
fied, and cluster. In simple random sampling, every unit is selected independently
from each other by random, whereas in systematic sampling, the units are chosen
according to the sampling interval, which depends on the population and sample
size; when a sample of 20 is selected from a population of 100, a random starting
point is chosen and every fifth (100÷20=5) unit is admitted to the sample. Strati-
fied sampling includes dividing the population into subpopulations (strata) as ho-
mogenously as possible, for instance according to demographic characteristics,
and selecting a sample from each subpopulation by random. This technique max-
imizes the variance between groups and minimizes the variance within groups,
thus, reduces sampling error. Cluster sampling divides the population into inter-
nally heterogeneous groups (clusters), based on for example geographic character-
istics, and draws the sample from one of the clusters. For instance, if the popula-
tion is Finland, it can be divided into 19 regions (clusters), of which one is chosen
as the cluster of which the sample is selected from by random. (Bernard 2006,
149–158; Bryman & Bell 2015, 190–193.) There are a number of approaches for
determining the sample size in probability sampling, such as the arbitrary ap-
proach, which states that the sample should be at least 5 % of the total population,
the conventional approach, where the sample size is based on what is estimated or
believed to be accurate, and the confidence interval approach, where the sample is
calculated according to the believed variability within the population, the desired
accuracy, and required confidence level (Burns & Bush 2001, 423–436).
Non-probability sampling, a sampling approach where the sample is not chosen
by random and some units are more likely to be admitted to the sample than oth-
ers (Bryman & Bell 2015, 187; Brassington & Pettitt 2007, 164–165), the differ-
ent techniques include: quota, snowball, convenience, and judgmental sampling.
Quota sampling aims in creating a sample with the same structure as the popula-
tion by dividing the population into different subpopulations of interest based on
specified characteristics, and the sample is chosen according to the proportion of
each sample in the population. Snowball sampling is a network sampling method

75
that chooses an initial group of respondents from the population by random and
continues as a chain of referrals as each respondent recommends other units from
the population. In convenience sampling, the sample consists of respondents with
convenient accessibility and proximity. Examples of studies utilizing convenience
sampling are for instance street interviews and magazine questionnaires. Judg-
mental sampling, which is the sampling technique used in the case study, is based
on the researcher’s judgement of elements that are considered interesting or sig-
nificant for the study. (Bernard 2006, 187–194.) In contrast to probability sam-
pling, non-probability sampling has only one reasonable way to determine the
sample size; the sample size is based on the researcher’s judgement about the val-
ue of the information relative to the cost of acquiring it (Burns & Bush 2001,
445).
As this study utilizes the judgmental sampling technique, where the sample is
chosen based on the CEO’s assessment of the company’s key customers, also the
sample size is determined by judgement. A sample size of 30 customer companies
was estimated to be appropriate and to include enough variation. The main reason
for choosing judgmental sampling method was the fact that in order to find out
how satisfaction could be increased by increasing benefits or reducing sacrifices,
the respondents have to be familiar with the company and its offerings, and alt-
hough the company has approximately 400 domestic customers listed in their sys-
tem, only a small percentage are frequently in contact the company. Therefore, the
respondents were chosen based on judgment and the sample includes only cus-
tomers who are familiar with the company and its offerings; customers were se-
lected based on either purchasing frequency or relationship length. (Peltonen
2016)
6.1.5 Data collection
Data collection is the stage where the information that is required for solving the
particular marketing problem is gathered by the means defined in the previous
stage (Birks & Malhotra 2007). For example, exploratory research would require

76
conducting the interviews, descriptive research distributing the questionnaires,
and causal research implementing the experiment. The data collection of this par-
ticular study was done through an online self-administrative questionnaire created
in e-lomake6 and distributed to the selected sample of the population though
email.
In addition, the data collection phase also includes pretesting and pilot work,
which takes place before implementing the actual data collection process, with the
aim of discovering possible errors and confirming that the research measures what
it is supposed to measure (Bordens & Abbott 2011, 27; Blythe 2012, 104). In this
study, the pretesting was done in cooperation with three key decision-makers of
the case company and the questionnaire design and content was adjusted accord-
ing to their wishes, without compromising the validity of the research design.
Normally pretesting and pilot work includes testing the research by conducting a
miniature version of it with respondents similar to the actual sample (Bordens &
Abbott 2011, 28; Blythe 2012, 104; Burns & Bush 2001, 370–371). After piloting,
the actual questionnaire was distributed through e-lomake to the sample of 30 cus-
tomers, with weekly reminders, and the respondents were given a four weeks’
time to answer. When a saturation effect is noticed or an acceptable response rate
is received, the data can be analyzed.
6.1.6 Data analysis
Preparing and analyzing the data refers to editing, coding and verifying the gath-
ered data and analyzing it (Birks & Malhotra 2007). In this stage, the collected
data is analyzed and connections to the theoretical framework developed in the
second stage are made. The aim is to interpret the results in a way that answers the
research question(s) defined in the first stage. For instance, one research area of
this particular study was to identify customer expectations, which was done
6 E-lomake (https://e-lomake.puv.fi/) is online software used for designing and publishing online forms and questionnaires as well as managing the results that can be converted to Excel or SPSS.

77
through asking the respondents to describe what factors they consider in choosing
of a supplier, i.e. what do they expect from a supplier. The respondents were also
directly asked to rate on a scale from one to five, how well they perceive Teo
Lehtimäki Ltd. to fulfil their expectations. By interpreting the answers and com-
paring the expected or desired performance with their actual experience with Teo
Lehtimäki Ltd., conclusions regarding the quality of the relationship can be made
and strategies to improve the satisfaction can be developed. The responses were
transferred from e-lomake into Excel, which was used for analyzing the data.
Data can be divided into two categories: qualitative and quantitative data. Qualita-
tive data is generally in the form of text, audio, video or image, and is generally
obtained in exploratory and causal research, whereas quantitative data consists of
numbers or values, normally obtained in descriptive research. This research col-
lected both qualitative data through the unstructured, open-ended questions, and
quantitative data through the structured, multiple-choice questions. Moreover,
there are also two types of analysis; qualitative analysis, which includes using
visualization methods, such as hierarchical clustering, in order to identify patterns
and making connections, and quantitative analysis, which is numerical or statisti-
cal analysis, where the collected data is statistically analyzed. (Bernard 2006,
451–453.)
Regardless of the type of the data or analysis, the data analysis process generally
consists of three different stages: editing, tabulating, and interpreting the data
(Blythe 2012, 108). Editing data refers to discarding inconsistent or spoiled re-
sponses, tabulating data includes totaling and cross-tabulating the responses, and
interpreting data includes making conclusions about the obtained data in connec-
tion to solving the marketing problem (Blythe 2012, 108).
In this research, all the responses are valid and there was no need for discarding
data in the editing stage. Tabulating includes calculating the mean (the average),
median (the middle value) and mode (the most frequent value) of the quantitative
responses as well as the standard deviation (how closely the values are clustered

78
around the mean value), to support the interpretation process. Different values are
compared using cross-tabulation. Interpreting data includes interpreting what the
numbers, values, tables, charts, etc., constructed in the tabulating stage actually
mean and what is their implication. The qualitative data, text, is analyzed by mak-
ing connections between the responses and identifying differences and similari-
ties. Moreover, different kinds of charts are utilized to illustrate the differences
and similarities of the answers as well as the distribution of opinions. The quanti-
tative data is analyzed statistically by calculating and comparing values and iden-
tifying patterns between them. Also the quantitative data is visualized with differ-
ent kinds of charts and tables.
In addition, the data analysis process normally includes also coding, where re-
sponse categories are assigned with a numerical value (Burns & Bush 2001, 82–
83). As the questionnaire included several scale-questions measuring frequency,
importance, level of agreement, and so on, coding the responses was a big part of
the process. However, as the questionnaire was designed in e-lomake, the numeri-
cal values of the alternatives were done as the questionnaire was designed. More-
over, both the questionnaire and the responses required to be translated into Eng-
lish as the original language of the research is Finnish. The questionnaire was de-
signed in Finnish, meaning that some things might get lost in translation.
6.1.7 Results and their implication
Preparing and presenting the report is the last stage of the marketing research pro-
cess, and it includes preparing a report that summarizes the entire research and
presents the results and major findings. It includes presenting the research ques-
tion(s) or problem(s), describing the chosen research approach and research de-
sign, describing the data collection process and analysis. (Birks & Malhotra
2007.) In this case, results were analyzed and the major findings were presented,
which also included preparing a list of improvement areas for the case company
as well as a strategy to improve the customer satisfaction. The results of the con-
ducted study are presented in ANALYZING THE RESULTS. Moreover, also the

79
validity and reliability issues of the research are discussed and suggestions for fu-
ture research are given.

80
7 IMPLEMENTATION OF THE RESEARCH
This study was conducted for Teo Lehtimäki Ltd., a Finnish family owned com-
pany specializing in the wholesale of snowmobile spare parts. As a wholesaler,
the company operates in the business-to-business environment, offering goods and
services to retailers, giving the study a business-to-business perspective. The re-
search provides insight to Teo Lehtimäki Ltd.’s customers’ perceptions of service
quality, expectations, perceived value, and their overall relationship satisfaction.
The primary reason for conducting the research was simply to find out how satis-
fied the customers are with the business relationship in general, and to identify
what kind of improvements could be made to strengthen the relationship.
The company’s primary market, Finnish retailers, was chosen as a focus group for
this particular study, mainly due to their bigger contribution (60% in 2014) to the
total revenues as well as the CEO’s specific request to focus only on their domes-
tic customers. Moreover, since business-to-business relationships based on a mu-
tually beneficial cooperation (Hines et al. 2000, 274), the sampling technique used
was judgmental sampling and only the company’s key customers were admitted to
the sample. As a result, the sample included 30 customer companies. The re-
sponse rate was 73 %, with 22 responses.
Apart from collecting customers’ background information, such as relationship
length and contribution to revenues, the customers remain anonymous and the in-
dividual results are not given to the case company. The aim is to provide the case
company with an idea of how satisfied their customers are regarding the different
aspects affecting the choice of supplier, such as service quality and product varie-
ty, and to provide the company with a comprehensive list of improvement ideas
that could further increase the customers’ overall satisfaction.
The research results should provide an answer to the following questions:
1. What are quality and value as perceived by the key decision makers in the business relationship?

81
2. What kind of expectations and requirements do the customers have?
3. To what extent are the customers satisfied with the current service quality and how could the service quality be improved to fit customer require-ments better?
4. What has the biggest impact on customer satisfaction?
7.1 Research methodology
The research is carried out by utilizing a self-administered questionnaire (SAQ)
that combines attribute-based measurement instruments and qualitative measure-
ment instruments. Attribute-based measurement instruments are measurement
models that are based on attributes describing the features of a service and qualita-
tive measurement instruments are measurement models based on the assessment
of critical incidents (Grönroos 2007, 83). The aim of the attribute-based meas-
urement instruments is to find out product and service features that contribute to
customers’ value perceptions and which features increase their willingness to con-
tinue the relationship. A qualitative measurement instrument is utilized in the
form of open-ended questions, providing the respondents a chance to freely ex-
press their thoughts in terms of, for instance, in what kind of situation did they
perceive that the case company failed to deliver. (Bernard 2006, 258–261.)
The main reason behind choosing this particular research method was to increase
the customers’ willingness to talk about sensitive topics, such as the underlying
reasons for their possible dissatisfaction. The majority of the respondents have
been cooperating with the case company for several years and might be hesitant to
impress their negative feelings that could possibly damage the relationship. The
chosen research method provides the respondents with anonymity and since there
is no interviewer included, they might be more willing to answer more honestly
(Bernard 2006, 259–260). Moreover, SAQ is also more economic and less time-
consuming than the alternative research method that was considered as option B;
face-to-face interviews (Bernard 2006, 258). After discussing the possible re-
search methods with the CEO of Teo Lehtimäki Ltd., an agreement was reached

82
and the decision to implement the research through SAQ was made. Another ad-
vantage of using SAQ includes avoiding interviewer bias (the interviewer affects
the question phrasing or the responses), which is the biggest drawback of face-to-
face interviews (Blythe 2012, 108), as all respondents receive the same questions.
Moreover, it allows asking a bit more complex questions than in an interview, as
the respondent has time to read and think about each question and, if necessary,
revise them. It also enables asking attribute-based batteries, which are widely used
in the case study. Most importantly, SAQ might encourage the respondents to talk
about sensitive topics more openly and give more honest answers compared to a
situation where an interviewer is present. (Bernard 2006, 258–261; Bryman &
Bell 2015, 240–241.)
On the contrary, the biggest disadvantage of SAQ is the fact that there is no con-
trol over how the respondents interpret the questions or a possibility to explain
questions in case the respondent does not understand them since there is no inter-
viewer involved (Bernard 2006, 260; Bryman & Bell 2015, 242). Therefore, it is
important that the questions are designed in a way that eliminates any possibility
of misunderstandings: clear and unambiguous questions, simple vocabulary, and
each question focusing on one particular topic (Burns & Bush 2001, 347–352;
Bernard 2006, 270–271). Moreover, since SAQ is interviewer absent, there is no
opportunity to ask the respondent to elaborate their answers or give more details
in the open-ended questions (Bryman & Bell 2015, 242).
7.2 Questionnaire design
The questionnaire uses mainly two types of questions: quantitative, attribute-
based questions for identifying customer expectations regarding the performance,
what affects the choice of supplier, as well as how the case company succeeds in
fulfilling those expectations, and qualitative, open-ended questions to provide
more insight into what customers perceive to be important in business relation-
ships and how they would describe good quality.

83
The majority of the attribute-based questions are scaled-response questions, which
measure for instance frequency, level of importance, level of agreement, probabil-
ity, and thereby produce numeric data. The scales utilized in the questionnaire are
mainly interval scales that measure opinions and superiority, and the range is from
one to five. The reason behind choosing a scale from one to five is that it is simple
and clear; it has a clear minimum, maximum, and mean. A 1–10 scale is utilized
to measure Teo Lehtimäki Ltd.’s performance and overall satisfaction, in order to
get more specific information about the range in opinions. For measuring satisfac-
tion a 1–5 scale would not be enough because the intervals are very small. How-
ever, it is suitable for questions that measure level of agreement since the intervals
are clear: 1=strongly disagree, 2=somewhat disagree, 3=neutral, 4=somewhat
agree, 5=strongly agree.
All the questions, both quantitative and qualitative, are short, simple and clear, so
that they are easy to understand and reasonably fast to answer. Moreover, the
questions are designed to be unambiguous, meaning that they are expressed in a
way that makes it completely clear what is meant, so that every respondent under-
stands the question in the same way. Each question focuses on one particular topic
and the respondents have enough knowledge about the topics to be able to answer.
Moreover, any information the respondents might not know is specified in the
questionnaire. Also the vocabulary used in the questions is simple and fits the tar-
get population’s core vocabulary and does not contain complicated words. (Burns
& Bush 2001, 347–352; Bernard 2006, 270–271.)
7.3 Questionnaire structure
A questionnaire begins with a brief introduction and it should identify the re-
searcher or the sponsor, describe the purpose of the research, explain the criteria
in respondent selection, as well as request participation (Burns & Bush 2001,
357). The questionnaire was distributed to the customers through email and the
customers’ email addresses were provided by Teo Lehtimäki Ltd. Each email was
sent separately and a personalized cover letter was written to each respondent in

84
order to increase their willingness to take part in the research. The original cover
letter can be found in APPENDIX 3 and the English translation in APPENDIX 4.
The purpose of the cover letter was to explain what was being researched and
why, how the respondents were selected, and to briefly explain the research struc-
ture and length as well as how much time is required to answer each question
carefully. Moreover, the cover letter was designed to encourage the respondents to
answer, to reserve enough time for it, as well as to contact the researcher in case
of any questions or doubts. Due to the sampling technique, the questionnaire was
accessible only with a user ID and password, which were provided in the email.
The questionnaire itself also begins with an introduction, where the purpose of the
research is repeated; “The purpose of this study is to determine the satisfaction
level of Teo Lehtimäki Ltd.’s customers, as well as the factors affecting it.”, the
structure of the questionnaire is explained in more detail; “The questionnaire con-
sists of two parts; the first part seeks to define what factors influence the customer
perceived quality and value on a general level, and the second part concentrates
on finding out the extent to which Teo Lehtimäki Ltd. meets customer expectations
as well as how satisfied the customers are regarding the service quality and relat-
ed issues.”, and the respondents are provided with more detailed information re-
garding the questionnaire, such as their anonymity and the importance of provid-
ing correct information; “Apart from obtaining certain background information,
the respondents remain anonymous and answers are nor given directly to the
company. Respondents are divided into groups based on the length of the custom-
er relationship as well as the amount and frequency of purchase transactions.
Suggestions for improvement are forwarded in accordance with the office that is
mainly dealt with.”, and they are also informed that the questionnaire is quite long
and requires investing time in it; “For the best possible outcome, the research is
quite diverse and extensive, which also means that it may require investing some
time in completing it. I hope that you would use plenty of time to respond to the
questionnaire as well as to reflect on the questions.” Moreover, although the
question wording and formatting was done according to the advice in the relating

85
literature, the respondents were encouraged to contact the researcher in case
something was unclear nonetheless; “If any question is unclear or raises ques-
tions, do not hesitate to contact me by e-mail: (researcher’s email address).” The
respondents are thanked in advance for investing time in completing the question-
naire and the fact that the research is actually conducted for them as it aims in
making improvements according to their wishes; “A big thank you in advance to
all respondents. We hope that the survey would bring up as many improvement
and development ideas as possible, so that Teo Lehtimäki Ltd. would be able to
improve the quality of their services and thus customer satisfaction.” And lastly,
the respondents were encouraged to contact the researcher at any point – before,
during or after the research – if necessary; “Finally, I would like to emphasize that
all kinds of suggestions for improvement are welcome, and if you think of some-
thing after submitting your answer, feel free to send me your ideas via email!”
The questionnaire consists of two main sections: part one includes questions re-
garding general customer perceptions of quality, value and satisfaction, and part
two focuses on quality, value and satisfaction in relation to Teo Lehtimäki Ltd.’s
performance, and the main reason for this division was to first discover what the
customers expect in general form any supplier and then comparing those answers
to the responses in the second part to see how Teo Lehtimäki Ltd.’s performance
fits those requirements.
The questions included in the questionnaire sent to the customers are explained
one by one, and as every question should have a clear purpose (Bernard 2006,
272), the reason for asking that particular question is identified as well. Since the
target population of the research is explicitly the company’s Finnish customers,
the questionnaire is in Finnish. The questions are also translated into English. The
original questionnaire can be found in APPENDIX 1 and the English translation
in APPENDIX 2.

86
7.3.1 Background information
The first section consists of four questions regarding the respondents’ background
information: relationship length, purchasing frequency, purchasing amount per
year, and contact office. The aim of this section is to gather information about the
respondents so that they can be identified in the analysis part. Moreover, their re-
sponses are compared in order to see whether there are differences in satisfaction
levels, perceived service quality, and perceived value among the groups.
Relationship length
1. How long have you been a customer of Teo Lehtimäki Ltd.?
Since long-term customers tend to be more tolerant against inferior performances
and the relationship benefits, such as safety and credibility, increase over time
(Ravald & Grönroos 1996), the purpose of this question is to provide insight into
whether the length of the business relationship has an impact on customer satis-
faction and perceived value. Moreover, also Teo Lehtimäki Ltd.’s ability to fulfil
the customers’ expectations increases over time due to episode configuration
(Storbacka et al. 1994), and therefore, long-term customers are estimated to per-
ceive the company to succeed in fulfilling their expectations. Furthermore, long-
term customers are also likely to be satisfied with the relationship since they have
chosen to continue the relationship; satisfaction has an increasing effect on the
customers’ willingness to choose the company again (Stauss & Neuhaus 1997,
238).
Purchasing frequency
2. How often do you order products from Teo Lehtimäki Ltd.?
The respondents are grouped according to their purchase frequency to see if cus-
tomers who place orders more often, thus, are more in contact with the case com-
pany, have a different perception of the quality of the provided services than cus-

87
tomers who order less frequently. The question is a multiple choice question and
the alternatives include: several times a week, once a week, 2–3 times a month,
approximately once a month, and less frequently. Customers who order at least 2–
3 times a month are considered to be able to provide the best insight into the level
of the service quality and the company’s performance. However, also the relation-
ship length has to be taken into consideration, as a customer who has been with
the company for several years but currently orders once a month or less frequently
might still be more familiar with the processes and personnel compared to a new
customer who orders on weekly basis.
Purchasing amount per year
3. With what amount do you purchase spare parts from Teo Lehtimäki Ltd.
per year?
Customer satisfaction is seen as a strong predictor of repurchase intentions and
loyalty (Ravald & Grönroos 1996), and according to Reiccheld (1990) customers
tend to contribute more to the profits as the business relationship grows. However,
as satisfaction and repurchase may function differently in a business-to-business
setting (Molinari et al. 2008), the aim is to find out whether customer satisfaction
is actually connected to the customers’ contribution to revenues or are their pur-
chase decisions based on purely economic factors relationships (Eggert & Ulaga
2002, 109).
Contact office
4. Which office are you mainly in contact with?
Teo Lehtimäki Ltd. has two offices: the headquarters in Kauhajoki and another
office in Rovaniemi. The function of this question is to find out whether the pro-
vided quality is consistent inside the company; the respondents are asked to an-
swer to the questions of the second part (measuring Teo Lehtimäki Ltd.’s perfor-
mance) based on the office they selected in this section. If there are differences in

88
satisfaction levels, the aim is to find out reasons behind the difference and to pro-
vide the particular office with improvement suggestions.
7.3.2 Part 1: quality, value and satisfaction on a general level
Part one concentrates on identifying the customers’ perceptions on good service
quality, to what extent does the product range and personnel affect the choice of
supplier, as well as on finding out to what extent does satisfaction affect the cus-
tomers’ willingness to continue the relationship. The aim of the section is clarified
to the respondents as well; “This section seeks to identify the customers' points of
view on what good service includes, the extent to which the product variety and
personnel affect the choice of supplier, as well as the extent to which satisfaction
affects the continuation of the business relationship The section includes four dif-
ferent themes: choice of supplier, quality, personnel, and satisfaction..” Moreo-
ver, since satisfaction is the function of perceived quality and disconfirmation
(Parasuraman et al. 1988), part one functions as a comparison standard for part
two and the respondents’ expectations and whether they are fulfilled or not can be
interpreted from their answers (Grönroos 2007, 99–100).
In order to make the structure of the questionnaire clear and coherent, the ques-
tions are divided into four sections according to the topic category (see Burns &
Bush 2001, 363): (1) choice of supplier, (2) quality, (3) personnel, and (4) satis-
faction. The division also facilitates the analysis part, as the data is already
grouped according to the topic. Each section consists of 4–6 questions, including
both multiple-choice and open-ended questions.
Choice of supplier
1. Which are the main factors that affect the choice of supplier*?
The question seeks to identify the core benefits and add-on benefits that the cus-
tomers evaluate in choosing a supplier; what are the core requirements that have
to be met for being in the customer’s consideration set and what kind of add-on

89
benefits encourage the customer to select a certain supplier instead of the qualified
competitor (Menon et al. 2005, 4–7; Hutt & Speh 216). Choice of supplier is de-
fined with a star (*) so that the respondents understand that the choice of supplier
refers to both the customers’ willingness to choose a supplier over the qualified
competitor, as well as their willingness to continue the relationship with a particu-
lar supplier i.e. their willingness to choose the supplier again (Stauss & Neuhaus
1997, 238).
2. How would you describe good service and what is it characterized by?
This question seeks to determine how the customers define good service and pro-
vides insight into what kind of service they think a supplier should offer (Oliver
1981, 33). By asking the customers to describe good service, also the desired ser-
vice – what the customers hope to receive (Parasuraman et al. 1991) is defined.
Moreover, it provides insight into what kind of expectations they have in general
in terms of service quality and the better the customers’ expectations can be iden-
tified, the better Teo Lehtimäki Ltd. will be able to provide services that meet cus-
tomer expectations (Molinari et al. 2008).
3. How important do you perceive that the following factors are in choosing
a supplier*? (1=not at all important, 2=not very important, 3=neutral,
4=quite important, 5=very important)
3.1. The supplier offers products and services with a better price-quality
ratio
3.2. The supplier offers better services at a competitive price
3.3. The supplier provides better quality for the price
3.4. The supplier offers the best discounts and payment terms
3.5. The supplier offers value for money
3.6. The supplier offers competitive prices
3.7. The supplier is able to offer products and services according to
The supplier needs
3.8. The supplier offers products that are easy to use
3.9. The supplier knows the customers and their needs
3.10. The supplier is an expert in their field
3.11. The supplier offers the best advice

90
3.12. The supplier offers a personalized service
Since customers tend to choose a supplier that provides them with the best value
(Dawkings & Reichheld 1990; Jones & Sasser 1995, 90; Hutt & Speh 2010, 360;
Ravald & Grönroos 1996, 16), this question seeks to identify the individual cus-
tomers’ value drivers and value differentiation variables so that they can be rein-
forced and used for creating a competitive advantage in the case company’s con-
text (Walters & Lancaster 1999, 700). The first six questions measure the im-
portance of value for money, and the rest of the questions measure the perceived
benefits of the products and services. The aim is to find out what are the differen-
tiating attributes that create added value for the customers and encourage them to
select a certain supplier instead of the qualified competitor (Menon et al. 2005, 4–
7; Hutt & Speh 216). For instance, if offering the best discounts and payment
terms is perceived as a very important factor in choosing the supplier, and offering
the best advice is seen as not very important, it is obvious that the customer
chooses a supplier based on value for money and would value a decrease in the
monetary sacrifices more than an increase in the benefits. According to Monroe
(1990), customers value a decrease in sacrifices over an increase in benefits, and
this question should provide insight into whether it applies to Teo Lehtimäki
Ltd.’s customers.
4. Which of the previous criteria do you consider the most important in the
choice of supplier*?
Since the previous question enables rating all of the aspects of value as ‘very im-
portant’, this question aims to find out which one is the single most important fac-
tor affecting the choice of supplier. It also defines one of the core requirements
that have to be met for being in the customer’s consideration set (Hutt & Speh
216).

91
Quality
1. What is a good product or product range characterized by?
Although the study focuses mainly on the functional quality dimension, also the
technical quality dimension is taken into consideration (see Grönroos 2007, 77),
as good products and a good product range can be seen as benefits that can have a
decreasing effect on total perceived sacrifices (see Monroe 1991; Ravald & Grön-
roos 1996, 21). This question provides a general overview what the customers are
looking for in a particular product or product range.
2. How important do you perceive that the following factors are in choosing
a supplier? (1=not at all important, 2=not very important, 3=neutral,
4=quite important, 5=very important)
2.1. Product durability
2.2. Products fit our needs
2.3. Products are easy to use
2.4. Product availability
2.5. Product quality
2.6. Versatility of the product range
2.7. Good price-quality ratio of the products
2.8. Profits gained from the products over time
This question seeks to answer basically the same question as the previous one but
provides alternatives. The alternatives include different characteristics of prod-
ucts, such as durability, ease of use, and quality, as well as characteristics of a
product range, such as product versatility and product availability. Moreover, two
alternatives (2.7. and 2.8.) measure the importance of the monetary value of the
products. The aim of this question is to provide a comparison standard to a similar
question in part two that measures Teo Lehtimäki Ltd.’s product quality. The re-
sponses indicate what kind of requirements the customers have related to prod-
ucts. For instance, if the versatility of the product range is rated as very important
in this part, and Teo Lehtimäki Ltd.’s product range is not considered to be versa-

92
tile, the company should expand their product range to increase the customer per-
ceived benefits.
3. How much does the product range affect the choice of supplier?
□ Very little
□ Quite little
□ Not a lot or a little
□ Quite a lot
□ Very much
The aim of this question is to find out how much do the customers perceive that
the product range affect choosing a supplier, and the responses are taken into con-
sideration in part two that measures how satisfied the customers are in terms of
Teo Lehtimäki Ltd.’s product range.
4. Could you choose a supplier based solely on the product range?
In connection to the previous questions, also this question aims to find out how
important the product range is, and whether the customers would choose a suppli-
er based solely on their product variety.
5. How accurate is the following statement: I favor a supplier who…
(1=completely inaccurate, 2=somewhat inaccurate, 3=not accurate nor in-
accurate, 4=somewhat accurate, 5=completely accurate)
5.1. …stands out with its expertise
5.2. …stands out for its ability to provide systematic solutions to
our problems
5.3. …seeks to understand and respond to the customers’ needs
5.4. ...provides a fast and flexible service
5.5. ...succeeds in providing quality service on the first try
5.6. ...consistently fulfils the promised delivery dates of orders
5.7. ...invoices correctly and the invoices are reliable
5.8. ...responds quickly and comprehensively to complaints
5.9. ...additionally provides technical advice
Since customers generally evaluate service quality relative to the supplier’s key
competitors and are likely to choose the supplier who provides the best quality

93
(Trivedi 2014, 96), this question measures what kind of supplier do the customers
favor and what kind of characteristics are desirable in a supplier. The statements
measure the importance of certain determinants of service quality, including com-
petence, reliability, understanding the customer, and responsiveness (see Par-
asuraman et al. 1985, 46–47). The same characteristics are measured in part two
in Teo Lehtimäki Ltd.’s context, and the responses are compared in order to iden-
tify areas of improvement.
6. Do you think that a company’s website is an important part of the service
offering?
Also the tangibles are an important part of the service offering and can provide
additional value to the customers (see Hutt & Speh 2010, 216). ‘Tangibles’ as a
determinant of service quality is defined as the physical evidence of the service,
such as the appearance of the equipment and materials (Parasuraman et al. 1985,
47), including the company’s website. A useful and informative company website
can be seen as a basic support service that increases the effectiveness and usability
of the offering (Jones & Sasser 1995, 90). For instance, Teo Lehtimäki Ltd.’s
websites include technical advice, installation instructions, and recommendations
on how to use the spare parts, and so on, which can increase the effectiveness and
usability of the offerings and provide added value for the customers.
Personnel
1. How would you describe good customer service personnel?
This question seeks to determine how the customers describe good customer ser-
vice personnel and identifies what kinds of characteristics of the personnel the
customers perceive to project a high quality image (see Parasuraman et al. 1988,
16). It also provides more insight into the desired service (see Parasuraman et al.
1991).

94
2. How big of an effect do the following characteristics of the personnel have
on the choice of supplier? Why? (1=very low, 2=somewhat low, 3=neither
high nor low, 4=quite high, 5=very high)
2.1. The reliability and consistency of the service
2.2. The personnel’s attitude and willingness to provide the service
2.3. The competence and professionalism of the personnel
2.4. The personnel’s vast knowledge of the market and the products
2.5. Personnel’s courtesy and friendliness
2.6. Keeping the customers up to date
2.7. Reachability
In connection to the same topic, this question seeks to answer basically the same
question but provides alternatives and asks for the reason why. The alternatives
include different characteristics of personnel and the service they provide. The
measured determinants of service quality include reliability, responsiveness, com-
petence, access, courtesy, and communication (see Parasuraman et al. 1985, 46–
47). The aim is to find out to what extent these characteristics of the personnel
affect the choice of supplier, i.e. how important they perceived to be in terms of
satisfaction.
Moreover, this question provides a comparison standard to a similar question in
part two that finds out which characteristics the customers would use for describ-
ing Teo Lehtimäki Ltd.’s personnel, with the aim to identify improvement areas.
For instance, if the reachability of the personnel is rated high in this part, and cus-
tomers perceive that Teo Lehtimäki Ltd.’s personnel is not easy to contact, the
company should make an effort to improve in this area in order to reduce custom-
er perceived sacrifices.
3. Which of the previously mentioned features of the personnel is the most
important for your satisfaction? Why?
Since the previous question enables evaluating all of the characteristics of the per-
sonnel to have a ‘very high’ effect on the choice of supplier, this question seeks to
determine which of the characteristics of the personnel the customers perceive to

95
be the most important in terms of their satisfaction, as well as the reason behind
their choice.
4. Could you choose a supplier based solely on the personnel?
In connection to the previous questions, the aim of this question to find out the
extent to which the personnel has an effect on the choice of supplier.
Satisfaction
1. What are the main factors that affect whether you are satisfied with a sup-
plier or not? (You can list factors connected to service quality, personnel,
products, and so on.)
The aim of this question is to provide an overview of the factors that the custom-
ers perceive to affect their satisfaction the most, and identifies the factors that
have the biggest impact on their willingness to continue a business relationship
(Stauss & Neuhaus 1997, 238).
2. If you are satisfied with the supplier’s offerings, how likely would it be
that you would: (1=very unlikely, 2=rather unlikely, 3=neutral, 4=quite
likely, 5=very likely)
2.1. Recommend the supplier to other companies
2.2. Tell positive things about the supplier to other companies
2.3. Encourage other companies to use the supplier’s services
2.4. Compare other companies to the supplier’s performance
2.5. Do more business with the supplier in the coming years
2.6. Expect the business relationship with the supplier to last a long time
2.7. Continue doing business with the supplier even if prices increased
slightly
2.8. Perceive the continuation of the business relationship to be important
Customer satisfaction is considered to have a positive effect on repurchase inten-
tions, word-of-mouth, and loyalty (Ravald & Grönroos 1996; Liljander &
Strandvik 1995). Satisfaction has a positive impact on the customers’ attitudes
towards the company, the customers’ expectations concerning the company’s fu-

96
ture performance capabilities, and the customers’ willingness to continue the rela-
tionship (Stauss & Neuhaus 1997, 238), and the aim of this question is to find out
the likelihood of the satisfied customers recommending the supplier, engaging in
positive word-of-mouth, continuing the relationship even if prices increased
slightly, etc.
3. If you are not satisfied with the supplier’s offerings, how accurate is the
following statement: (1=completely inaccurate, 2=somewhat inaccurate,
3=not accurate or inaccurate, 4=somewhat accurate, 5=completely accu-
rate)
3.1. I would not recommend the supplier to other companies
3.2. I would tell negative things about the supplier to other companies
3.3. I would not do more business with the supplier in the coming years
3.4. I would not perceive the continuation of business relationship as im-
portant
3.5. I would perceive that changing the supplier would be profitable
On the contrary, the aim of this question is to find out how likely it is that the cus-
tomers would engage in negative word-of-mouth and switch suppliers if they were
dissatisfied. According to a study, a dissatisfied customer is likely to tell 10–20
people, whereas a satisfied customer tells only five people (Gummesson 2002,
92–93), however, as word-of-mouth may function differently in a business-to-
business setting than in a business-to-consumer context (Molinari et al. 2008), the
aim of these two questions is to find out what behavior is likely in case of confir-
mation/disconfirmation. Moreover, as a result of losing confidence in the suppli-
er’s ability to deliver, the possibility of them switching to the competitor increases
(cf. Gummesson 2002, 87; Stauss & Neuhaus 1997, 238), and this question seeks
to find out how likely it is that the customers would end the relationship.
4. To what extent do you believe that satisfaction is a prerequisite for the
continuation of the business relationship?
Satisfaction plays a big role in retaining customers and creating long-term cus-
tomer relationships (Ravald & Grönroos 1996; Liljander & Strandvik 1995; An-

97
derson & Sullivan 1993; Grönroos 2007, 268), and this question enables the cus-
tomers to tell with their own words how important they view satisfaction to be,
and whether they view it as a condition for continuing a business relationship.
5. Which of the following has the biggest impact in terms of your satisfac-
tion?
5.1. Versatility of the product range
5.2. The quality of the products
5.3. Personalized and reliable service
5.4. Better products and services for the price-quality ratio
The last question of the first part aims in summarizing the questions asked so far
and making a conclusion on what the customers perceive to be most important
factor regarding satisfaction. It also tests the reliability of the measurement in-
strument and the respondents are expected to be consistent in their responses, oth-
erwise the reliability of the research is questionable.
7.3.3 Part 2: Teo Lehtimäki Ltd.
Part two concentrates on determining the extent to which Teo Lehtimäki Ltd. is
able to meet customer expectations of quality and other related factors. The pur-
pose is to find out how customer satisfaction could be improved. The aim of the
section is clarified to the respondents as well; “This section seeks to determine the
extent to which Teo Lehtimäki Ltd. meets customer expectations regarding quali-
ty, as well as other related factors. The aim is to find out how customer satisfac-
tion could be improved. Therefore, it is important that you try to answer the open-
ended questions as comprehensively as possible. No answer or opinion is stupid
but rather very important in terms of opportunities for improvement. Thanks in
advance for your time!”
Similarly to part one, the questions are divided into different sections according to
the topic category (see Burns & Bush 2001, 363): (1) Teo Lehtimäki Ltd.’s per-
formance & relationship value, (2) Teo Lehtimäki Ltd.’s products, (3) Teo
Lehtimäki Ltd.’s service quality, (4) Teo Lehtimäki Ltd.’s personnel, and (5) Teo

98
Lehtimäki Ltd. & satisfaction. Each section consists of 2–10 questions, including
both multiple-choice and open-ended questions.
Teo Lehtimäki Ltd.‘s performance & relationship value
1. In connection to the last service encounter, which of the following state-
ments are accurate? You can choose several.
□ My experience was as good as it was supposed to be
□ The service was of very good quality
□ The service was excellent
□ The service fulfilled my expectations
□ The service was bad
□ The service did NOT fulfil my expectations
A relationship consists of acts, episodes, and sequence (Holmlund 1997), and this
question aims in measuring the company’s performance during the last episode.
The episode level satisfaction influences the customers’ expectations regarding
the company’s future performance capabilities (Stauss & Neuhaus 1997, 238), and
has an impact on the overall relationship satisfaction (Liljander & Strandvik
1995).
2. How would you describe Teo Lehtimäki Ltd.’s product and service quali-
ty?
The aim is to find out whether the customers are satisfied with the product and
service quality, and what kind of characteristics do they use to describe them. In
part one, the customers described good service and good product or product range,
which gives insight into their expectations regarding the quality. The aim is to
compare the desired service (see Parasuraman et al. 1991) to the perceived per-
formance, as well as compare their product quality description to the their re-
quirements connected to product quality, in order to see how well the company is
able to fulfil their expectations.

99
3. How well do you perceive Teo Lehtimäki Ltd. to fulfil your expectations?
□ Extremely well
□ Quite well
□ Not well or poorly
□ Quite poorly
□ Extremely poorly
This question provides insight into how well the customers perceive that the com-
pany is currently fulfilling their expectations, and as customer satisfaction de-
pends on how well the customer experience measures up to the customer's expec-
tations of quality (Zineldin 1999, 720), it also provides insight into their overall
satisfaction level. If the customers perceive that the company is fulfilling their ex-
pectations extremely well, it indicates that they are also satisfied with the compa-
ny, whereas if they perceive that their expectations are met extremely poorly, it
indicates that the customers are very unsatisfied.
4. How would you describe the business relationship with Teo Lehtimäki
Ltd.? (You can freely describe for example why you have chosen Teo
Lehtimäki Ltd., what kind of service do you usually receive, and so on.)
Although high-quality goods and services are important in the initial phase of the
relationship, the relationship quality becomes more important than the quality of a
single service encounter as the relationship goes on (Ravald & Grönroos 1996,
24). The question seeks to find out how the customers would describe their rela-
tionship with Teo Lehtimäki Ltd., and provides insight into the relationship quali-
ty. Moreover, the relationship itself might have a major effect on the total custom-
er perceived value (Ravald & Grönroos 1996, 23), and the customer perceptions
of the value of the relationship can be interpreted from their responses.

100
5. Do you perceive that the business relationship provides value for you?
□ Yes
□ No
The question finds out whether the customers perceive that the relationship pro-
vides value, and the details are discovered in the following question.
6. To what extent do you agree that, in comparison with other suppliers, Teo
Lehtimäki Ltd... (1=strongly disagree, 2=somewhat disagree, 3=neither
disagree nor agree, 4=somewhat agree, 5=strongly agree)
6.1. ...offers products and services with a better price-quality ratio
6.2. ...offers better services at a competitive price
6.3. ...provides better quality for the price
6.4. ...offers the best discounts and payment terms
6.5. ...offers value for money
6.6. ...offers competitive prices
6.7. ...is able to offer products and services when the customer needs
them
6.8. ...offers products that are easy to use
6.9. ...knows the customers and their needs
6.10. ...is an expert in their field
6.11. ...offers the best advice
6.12. ...offers a personalized service
Customers tend to choose a supplier that provides them with the best value
(Dawkings & Reichheld 1990; Jones & Sasser 1995, 90; Hutt & Speh 2010, 360;
Ravald & Grönroos 1996, 16), and this question measures the perceived value of
Teo Lehtimäki Ltd.’s offerings. A similar question was asked in part one, measur-
ing the importance of the same aspects of value in choosing a supplier, and by
comparing the answers, the attributes that create added value for the customers
and encourage them to select Teo Lehtimäki Ltd. instead of the qualified competi-
tor can be identified (Menon et al. 2005, 4–7; Hutt & Speh 216).

101
Teo Lehtimäki Ltd.’s products
1. To what extent do you agree that Teo Lehtimäki Ltd.’s… (1=strongly dis-
agree, 2=somewhat disagree, 3=neither disagree nor agree, 4=somewhat
agree, 5=strongly agree)
1.1....products are durable
1.2....products fit our requirements
1.3....product range is versatile
1.4....products are easy to use
1.5....products provide a good profit over time
1.6....the price-quality ratio of the products is good
1.7....product availability is good
Good products and a good product range can be seen as benefits that can have a
decreasing effect on total perceived sacrifices (see Monroe 1991; Ravald & Grön-
roos 1996, 21), and this question seeks to find out how the customers would de-
scribe Teo Lehtimäki Ltd.’s products and product range. The importance of each
characteristic was determined in part one, identifying what kind of requirements
the customers have related to products. The responses are compared in order to
recognize improvement areas.
2. Is there something missing from Teo Lehtimäki Ltd.’s product range?
What?
The product range should fit the customer’s needs and requirements, and the bet-
ter it meets customer needs, the better value the customer perceives (Levitt 1980).
The purpose of this question is to find out what the customers perceive to be miss-
ing from the product range. If there are several suggestions and similarities among
the responses, the case company should consider making that addition in their
product range in order to increase the total perceived value, and thereby customer
satisfaction and loyalty (see Kotler & Keller 2012, 154; Parasuraman et al. 1988).

102
Teo Lehtimäki Ltd.’s service quality
1. Would you describe Teo Lehtimäki Ltd.’s service quality as ’good’? Why?
Why not?
The aim is to find out whether the customers perceive that the overall quality of
the provided services to be good, as well as the reason why. Good service quality
was defined in part one.
2. To what extent do you agree that Teo Lehtimäki Ltd… (1=strongly disa-
gree, 2=somewhat disagree, 3=neither disagree nor agree, 4=somewhat
agree, 5=strongly agree) If you answered 1, 2 or 3, could you specify?
2.1. ...stands out among the competitors with their expertise
2.2. ...stands out for the ability to provide systematic solutions to our
problems
2.3. ...seeks to understand and respond to customers’ needs
2.4. ...offers a fast and flexible service
2.5. ...succeeds in providing quality service on the first try
2.6. ...consistently fulfills the promised delivery dates of orders
2.7. ...invoices correctly and the invoices are reliable
2.8. ...responds quickly and comprehensively to complaints
2.9. ...provides technical advice, which is very important
2.10. ...provides fast deliveries
The question gives insight into possible improvement areas in terms of their ser-
vice quality and measures their overall performance. The company’s perceived
performance is compared to the expected performance that was measured in part
one.
3. To what extent has Teo Lehtimäki Ltd. fulfilled your expectations in terms
of service quality?
As the main factor affecting customer satisfaction is the expectations the customer
has regarding the service and whether or not the expectations were fulfilled (Hutt
& Speh 2010, 268), this question provides insight into customer satisfaction and
sheds light on whether their service quality requires improving.

103
4. What kind of expectations has Teo Lehtimäki Ltd. not been able to fulfil?
A performance that fails to meet expectations generally leads to dissatisfaction
(Parasuraman et al.1988), and the aim of this question is to identify what kind of
expectations the company has not been able to fulfil, so that the company’s ability
to identify features of a service that require improvement and situations to avoid.
5. What kind of improvement suggestions would you give in connection Teo
Lehtimäki Ltd.’s service? (e.g. reachability, willingness to provide the ser-
vice, etc.)
Also this question seeks to identify what kind of expectations the company has
not fulfilled and features of the service that the customers have not been satisfied
with, and provides insight into what could be improved in terms of their services
in order to reach higher satisfaction levels. It also provides insight into customer
perceived sacrifices.
6. How often do you use Teo Lehtimäki Ltd.’s website?
□ Several times a week
□ Once a week
□ 2–3 times a month
□ Approximately once a month
□ Less frequently
The aim of this question is to find out how often do the customers use the compa-
ny’s website. The following question seeks to find out how they would describe
the website and a customer who uses it several times a week might be able to pro-
vide a better insight into what could be improved than a customer who uses is less
frequently than once a month. Moreover, the importance of a company’s website
as a part of their service offering was measured in part one, and customers who
perceive the website to be important but do not use Teo Lehtimäki Ltd.’s website
very often, might be a sign that they are not satisfied with the content.

104
7. How would you describe Teo Lehtimäki Ltd.’s website?
(e.g. usefulness, clarity, versatility, etc.)
The company’s website can be an important part of the service offering and can
provide additional value to the customers (see Hutt & Speh 2010, 216), but only if
they are useful and increase the effectiveness and usability of the offerings (see
Jones & Sasser 1995, 90). Currently Teo Lehtimäki Ltd.’s websites include tech-
nical advice, installation instructions, and recommendations on how to use the
spare parts, and so on, which can increase the effectiveness and usability of the
offerings and provide added value for the customers. This question seeks to simp-
ly find out how the company’s website could be improved.
8. How important is receiving a paper copy of Teo Lehtimäki Ltd.’s annual
product catalogue?
□ Very important
□ Quite important
□ Neutral
□ Not very important
□ Not at all important
The aim of this question is to find out how much added value does the paper ver-
sion of the company’s product catalogue provide for the customers. Not many
companies nowadays send out paper versions as everything tends to be online.
Sending out the paper version is a big expense for the company and it will not be
sent out the upcoming season if the customers do not perceive that it is important
to receive it. The catalogue is currently provided in Finnish, Swedish, and Eng-
lish, and sent to customers before the season starts.
9. Would a mere online product catalogue suffice?
□ Yes
□ No
In connection to the previous question, the aim is to find out if the paper version
of the product catalogue necessary or if an online catalogue would be enough.

105
10. What kind of improvement suggestions do you have regarding Teo
Lehtimäki Ltd.’s product catalogue?
The aim is to discover more insight into how to improve the product catalogue to
fit customer requirements and needs, so that the added value of the offerings could
be maximized.
Teo Lehtimäki Ltd.’s personnel
1. To what extent do you agree that, in comparison with the personnel of oth-
er suppliers, Teo Lehtimäki Ltd.’s personnel… (1=strongly disagree,
2=somewhat disagree, 3=neither disagree nor agree, 4=somewhat agree,
5=strongly agree) If you answered 1, 2 or 3, could you specify?
1.1. ...is more competent and professional
1.2. ...has a better attitude
1.3. ...provides a reliable and consistent service
1.4. ...has enough knowledge about the market and the products
1.5. ...is reachable through phone
1.6. ...is reachable through email
1.7. ...is polite and respectful
1.8. ...offers better advice
The alternatives include different characteristics of personnel and the service they
provide, and seek to find out to which extent the characteristics describe Teo
Lehtimäki Ltd.’s personnel in comparison with other suppliers. By interpreting the
responses, possible improvement areas can be identified. Moreover, the im-
portance of the determinants was measured in part one, which defined what are
the most desirable characteristics in a service provider, and is used as a reference
point.
2. Which of the following descriptions fit Teo Lehtimäki Ltd.’s personnel?
You can choose several.
□ The service is reliable and consistent
□ Customers are kept up to date about important issues
□ Phone calls are responded to quickly (or called back)

106
□ Emails are responded to promptly
□ Orders are delivered on time
□ I contact the company for technical advice as well
□ None of the above
This question aims in discovering the company’s strong points and improvement
areas. The points that get the most responses are the ones the company is currently
doing well in, whereas the points that are either not chosen or chosen only by one
or two respondents are the points that require improvement. The questions meas-
ure different determinants of service quality.
3. What could be improved in terms of personnel performance?
This question seeks to identify what the customers perceive the personnel could
improve in, and provides insight into how the performance has not met customer
expectations or requirements.
4. If you have been in contact with both offices, have you noticed a differ-
ence in...
If you answered yes, could you specify?
4.1. …their reachability?
4.2. …their willingness to provide the service?
4.3. …the reliability and consistency of the service?
4.4. …their qualifications?
Since the service should be consistent within the company, and regardless of
which office they contact, the personnel should be able to provide the same level
of service quality. The aim of this question is to find out whether the company has
succeeded in providing consistent service within the two offices, and if not, how
the situation can be fixed.

107
5. What grade would you give to Teo Lehtimäki Ltd.’s personnel’s overall
performance? (on a scale of 1–10; 1=fail, 10=excellent)
As the personnel is responsible for the provided service quality, this question also
gives insight into how good the perceived service quality is and how satisfied the
customers are regarding the service quality.
Teo Lehtimäki Ltd. & satisfaction
1. Could you give examples of situations where you have been extremely sat-
isfied with the provided service?
The aim of this question is to find out in what kind of situations the customers
have felt extremely satisfied so that individual needs can be identified and the
overall performance improved accordingly. Moreover, it provides examples of
situations where the customers’ expectations have been exceeded (see Parasura-
man, Zeithaml & Berry 1988; Eggert & Ulaga 2002, 109; Anderson & Sullivan
1993, 126).
2. Could you give examples of situations where you have not been satisfied
with the provided service? Could you also tell how the situation was
solved?
The aim of this question is to identify what has occurred in situations where the
customers have been dissatisfied with the company’s performance, so that an ef-
fort can be made to improve in the specific area the customers feel that the com-
pany has not able to deliver in, as well as to prevent it from happening again (see
Jones & Sasser 1995; Gummesson 2002, 88). Moreover, based on the responses,
recovery process for fixing problems or bad experiences can be developed (Jones
& Sasser 1995, 90).

108
3. How satisfied are you with Teo Lehtimäki Ltd.’s overall performance? (on
a scale 1–10; 1=extremely unsatisfied, 5=neutral, 10=extremely satisfied)
What is the main reason for this?
The purpose of this question is to find out how satisfied the customers are in terms
of the entire relationship as well as to reveal the underlying reason. Especially if
the score is low, it is important to know what the reason for it is, so that the prob-
lem can be addressed and fixed.
4. Which of the following statements are accurate in your case?
□ I highly recommend Teo Lehtimäki Ltd. to other companies
□ I will tell positive things about Teo Lehtimäki Ltd. to other companies
□ I will encourage other companies to use Teo Lehtimäki Ltd.’s services
□ I compare other companies to Teo Lehtimäki Ltd.’s performance
□ I am very satisfied with Teo Lehtimäki Ltd.’s overall performance
□ I will do more business with Teo Lehtimäki Ltd. in the coming years
□ I expect the business relationship with Teo Lehtimäki Ltd. to last
□ I will maintain the relationship with Teo Lehtimäki Ltd.
□ I would continue doing business with Teo Lehtimäki Ltd. even if pric-
es increased slightly
□ I perceive the continuation of the business relationship to be important
□ None of the above
This question measures the customers’ attitudes towards the company, the cus-
tomers’ expectations concerning the company’s future performance capabilities,
and the customers’ willingness to continue the relationship, which are all in-
creased when the customer is satisfied (Stauss & Neuhaus 1997, 238). The same
behavioral variables were measured in part one, which works as a reference point;
if a customer answered positively to recommending a company to others in case
they are satisfied but are not willing to recommend Teo Lehtimäki Ltd., it means
that they are not completely satisfied with the company’s performance.

109
8 ANALYZING THE RESULTS
The responses to the questions are presented one-by-one and the central infor-
mation interpreted from the data is presented. An overall view of the results and
their implication is provided in Summary and conclusions –chapter.
8.1 Background information
The customers are divided into different groups according to the length of the re-
lationship, purchasing frequency, purchasing amount per year, and contact office,
in order to find out whether there are differences in satisfaction levels, perceived
service quality, and perceived value among the groups.
1. Length of the relationship
The average relationship length was 11 years, which was also the mode of the
sample. The shortest relationship was one year whereas the longest was 25 years.
The relationship length was distributed as follows: 1, 2, 2, 5, 6, 6, 7, 7, 10, 10, 11,
11, 11, 11, 12, 14, 15, 16, 20, 21, 21, 25. Based on the length of the relationship,
the respondents were divided into four groups: 1–2 years (3 respondents), 5–7
years (5 respondents), 10–12 years (7 respondents), 14–16 years (3 respondents),
and 20–25 years (4 respondents). The 64 % of the respondents have been cooper-
ating with the Teo Lehtimäki Ltd. for 10 years or more, and therefore, have been
cooperating with both the old and the new composition of the company, and might
provide insight into how the change has affected the service quality.
2. Purchasing frequency
The customers were grouped into five groups, depending on their purchasing fre-
quency: several times a week (4 customers), once a week (4 customers), 2–3 times
a month (8 customers), approximately once a month (5 customers), and less fre-
quently (1 customer). The average purchasing frequency was approximately 2–3
times per month, which was also the mode of the sample as it was the purchasing

110
frequency of 36 % of the sample. As customers who purchase several times a
week or once a week contribute to another 36 % of the sample, altogether 72 % of
the respondents are in contact with the case company several times a month and
can be assumed to be familiar with the processes and personnel. Moreover, 23 %
of the respondents purchase at least once a month, and the average relationship
length of those respondent was 12.4 years, meaning that even though they do not
purchase very often in comparison to the majority of the respondents, they still
have several years of experience with the company and should therefore be able to
provide useful insight into the company’s perceived performance and possible
improvements. Only one of the customer companies purchases less frequently
than once a month, which was also the newest (one year) customer in the sample.
95 % of the customers admitted to the sample are in contact with the company at
least on monthly basis, meaning that they are familiar with the processes and the
personnel, and should therefore be able to provide useful insight into the possible
improvement areas.
3. Purchasing amount per year
The average purchasing amount was 12,000 € per year, with a minimum of 1,500
€ and a maximum of 45,000 € per year. 18 % of the respondents purchase with
more than 25,000€ per year, 23 % with more than 10,000€, and 23 % of the re-
spondents purchase with less than 5,000€. 40 % of the respondents with a pur-
chasing amount of more than 10,000€ per year are considered to be the most valu-
able customers in monetary value, and they are also long-term customers with an
average relationship length of 13 years.
4. Contact office
Customers mainly choose the office based on location due to shorter delivery
times; Kauhajoki delivers mainly to South and Central Finland, whereas
Rovaniemi is in charge of customers located in Northern Finland. 91 % of the re-
spondents cooperate with the office in Kauhajoki and only 9 % with Rovaniemi.

111
Therefore, the results will mainly be for the headquarters in Kauhajoki. However,
the results will also provide the Rovaniemi office with insight on how to improve
their services, as the first part is dedicated to revealing customer expectations and
features of the desired service (Parasuraman et al. 1991).
8.2 Part 1: quality, value and satisfaction on a general level
This part of research focuses on revealing customer expectations and requirements
regarding product and service quality as well as behavioral variables connected to
satisfaction, and will function as a comparison standard for the second part of the
research, which concentrates on evaluating Teo Lehtimäki Ltd.’s performance.
The main idea of this part was to confirm the theories related to the topic and to
see what the customers expect and what kind of requirements they have.
Choice of supplier
1. Main factors affecting the choice of a supplier
91 % of the customers listed product variety and availability as the most important
factors distinguishing the supplier from its competitors. Customers choose a sup-
plier based on their ability to fulfil their needs (Levitt 1980), and having a good
product variety that corresponds to customer needs and requirements as well as
good availability of those products has an impact on the choice of supplier (see
Walters & Lancaster 1999, 700). If the customer perceives that the product range
does not correspond to their needs, they are likely to choose a supplier with a
more suitable product range. Other factors related to products include the quality
of the products, which reduces the perceived sacrifices as the risk of having to put
time and effort into filing complaints (Zeithaml 1988). In addition, one respondent
mentioned that having a product variety that consists of spare parts for old snow-
mobile models as well is important when choosing a supplier.
Other factors that were frequently mentioned by the respondents included good
service quality and price. Service quality as such was mentioned in 36 % of the

112
responses. However, as service quality is generally evaluated based on the deter-
minants of service quality (Parasuraman et al. 1988, 46–47), also the determinants
of service quality mentioned in the responses can be interpreted to indicate that
good service quality is an important factor that creates value for the customers.
When taking into consideration both service quality and the determinants, service
quality was mentioned in 73 % responses. The determinants include the reliability
of the service, which was mainly mentioned in the context of deliveries, as well as
personalized service and friendly personnel, and the reachability of the company
(Parasuraman et al. 1988, 46–47). Consequently, the customers expect a supplier
to not only provide good products but also deliver good service quality, and ex-
pect the personnel to have vast knowledge of the market and the products. Ac-
cording to the respondents, the sales person should be able to for example recom-
mend similar spare parts if a certain part is out of stock. Moreover, also the im-
portance of technical advice connected to the maintenance and instalment of the
products was listed as an important factor by two respondents, which emphasizes
the value of the supporting services (Ravald & Grönroos 1996, 19).
The price of the products was also frequently mentioned. Price is an important
factor in business-to-business operations, as both companies in the relationship
are profit-driven businesses. 46 % of the respondents mentioned price, among
other factors, as a main factor in the choice of supplier. However, none of the re-
spondents listed price alone. Some respondents specified that the price should be
competitive and reasonable, and one respondent said that there should be possibil-
ity for negotiation. Consequently, the customers evaluate the potential value of a
supplier’s offerings as they mentioned good products and services as well as a
competitive price. Perceived value is defined as the ratio of the perceived benefits
and the perceived sacrifice (Monroe 1991), and although it was not specifically
mentioned, the results indicate that the customers choose a supplier based on the
value they are able to provide; having a product variety that fulfills the customer’s
needs as well as having those products available when the customer needs them,

113
reduces the customer’s non-monetary sacrifice, such as time and effort, increasing
the total perceived value (Grönroos 2007).
2. Describing the characteristics of good service
The responses include a lot of similarities to the responses to the previous ques-
tion, indicating that good customer service affects the customer’s choice of sup-
plier. The respondents mainly listed basic elements of a service that all competi-
tors are expected to provide (Jones & Sasser 1995), such as on-time deliveries and
personnel reachability.
Reachability and the consistency and reliability of the deliveries were the two
most frequently mentioned determinants of service quality (Parasuraman et al.
1988, 46–47). Reachability was mentioned in 50 % of the responses, which was
also the most frequent answer. Customers expect to be able to reach the company
when necessary, whether it is for placing an order, making an inquiry or asking
for technical advice, and whether it is through phone or email. 41 % of the re-
spondents mentioned the importance of on-time deliveries and the reliability of
the deliveries, which can be seen as the respondents’ value criteria in the supplier-
customer context (see Walters & Lancaster 1999, 700). One respondent specified
that they have the responsibility to deliver the products to their customer on time
as well, and if the supplier fails send a product when promised, it has a negative
effect on the customer’s customer as well (Gummesson 2002, 79).
Apart from being reachable, other characteristics of the personnel mentioned in
the responses include expertise, extensive knowledge regarding the market, good
attitude, ability and willingness to provide technical advice, trust, and taking the
customer’s individual needs and requests into account (Parasuraman et al. 1988,
46–47). Expertise was one of the top answers and was mentioned in 27 % of the
responses, indicating that customers expect that the personnel has enough
knowledge of the market so that they are able to provide the customers with useful
technical advice regarding spare part matters. In other words, a good supplier is

114
able to solve any problem the customer may have in terms of the snowmobile
spare parts.
Moreover, also the importance of recovery processes for fixing problems (Jones &
Sasser 1995) was mentioned by 27 % of the respondents; they defined good ser-
vice as taking responsibility in case mistakes occur as well as fixing them imme-
diately. Consequently, good service does not necessarily mean that every service
encounter goes perfectly; it can also mean being able to fix situations where
something goes wrong (Jones & Sasser 1995). The customers acknowledge the
reality that service failures and mistakes can occur sometimes and that good ser-
vice includes fixing the situation fast. Only a few customers mentioned the ex-
traordinary services that excel in meeting customer preferences or in solving their
particular problems (Jones & Sasser 1995), indicating that the customers expect to
simply receive what was promised when promised (Grönroos 2007).
3. The importance of perceived value in the choice of supplier
The respondents were asked to rate the certain aspects of value by their im-
portance (1=not at all important, 2=not very important, 3=neutral, 4=quite im-
portant, 5=very important) in choosing the supplier. The variance among the dif-
ferent aspects of value was minor and all of them scored important. Moreover, the
standard deviation was below 0.7, meaning that also the difference among re-
spondents was small and the responses are clustered closely around the mean val-
ue. The average (mean) of each aspect is shown in Table 4, alongside with the
most frequent response (mode). The responses are ordered from highest to lowest
according to the average.

115
Table 4. Aspects of value: level of importance in the choice of supplier.
Statement: mean mode
The supplier is able to offer products and services when the cus-
tomer needs them
4.91 5
The supplier is an expert in their field 4.86 5
The supplier offers a personalized service 4.77 5
The supplier offers the best advice 4.59 5
The supplier provides better quality for the price 4.50 5
The supplier knows the customers and their needs 4.50 5
The supplier offers competitive prices 4.45 4
The supplier offers products and services with a better price-quality
ratio
4.41 4
The supplier offers better services at a competitive price 4.36 4
The supplier offers value for money 4.36 5
The supplier offers the best discounts and payment terms 4.32 4
The supplier offers reasonable prices 4.14 4
The supplier offers products that are easy to use 4.05 4
On average, the most important factor in choosing a supplier was the supplier’s
ability to offer products and services when the customers need them, which was
also mentioned in the previous questions in the context of expectations regarding
the supplier’s reachability and ability to deliver products on time. The second
most important what that the supplier is an expert in their field, which was also
frequently mentioned in the previous questions in the context of the supplier’s
knowledge of the market and their ability to provide assistance. The third most
important factor was offering a personalized service; the customers are more like-
ly to choose a supplier who provides them with customized services since provid-
ing customized services also means being able to fulfil an individual customer’s
needs better (see Menon et al. 2005, 4–7; Hutt & Speh 216). The difference be-
tween the lowest and highest average was only 0.96, which is not significant.
Therefore, all the aspects are quite important or very important in the choice of a

116
supplier and should be taken into consideration in Teo Lehtimäki Ltd.’s opera-
tions.
4. The most important criteria in a supplier
The respondents were asked to choose one criteria that affects their choice of a
supplier the most, i.e. which is the most important characteristic or feature of a
supplier in their opinion. Their responses provide insight into their value criterion
that is considered to be the main reason for choosing a particular supplier instead
of a qualified competitor (Walters & Lancaster 1999, 697). By identifying the in-
dividual customers’ value drivers and value differentiation variables, Teo
Lehtimäki Ltd. can build a competitive advantage against competitors by reinforc-
ing them (Walters & Lancaster 1999, 700). Although all of the criteria scored high
in the previous question, only seven of them were mentioned by the respondents
in this part. The distribution of the responses is illustrated in Figure 9. The criteria
connected to service quality are in shades of blue and the ones related to the value
for money are in shades of purple.
Figure 9. The most important criteria in a supplier: value drivers.
As can be seen from the figure, the majority of the respondents chose features
connected to services. The most frequent answer (mode) was that the supplier is
an expert in their field, which was chosen by six respondents. Therefore, the abil-
ity to provide technical advice is an important value driver and by reinforcing it,
Teo Lehtimäki Ltd. can increase the value of their offerings (Walters & Lancaster
1999, 700). Also the second and third most important criteria were connected to
27%
18%
18%
14%
9%
9%
5%
Expert in their field
Personalized service
Offering products and services when the customer needs them
Offering products and services with a better price-quality ratio
Better quality at a competitive price
Better quality for the price
Value for money

117
service quality; personalized service was chosen by four respondents and suppli-
er’s ability to offer products and services when the customers need them were
both perceived as the most important criteria by four respondents. The rest of the
responses took the price of the offering into consideration; three respondents said
that offering products and services with a better price-quality ratio was the most
important criteria, two respondents chose providing better quality at a competitive
price, two respondents said that the supplier’s ability to provide better quality for
the price was the most important criteria in choosing a supplier, and one respond-
ent chose a supplier based on the value for money (Fornell et al. 1996, 9;
Zeithaml 1988). Therefore, the best way to add more value to the core product is
by improving the company’s service quality and including supporting services
(Ravald & Grönroos 1996, 19), without neglecting the importance of a good
price-quality ratio of the products.
Quality
1. Describing the characteristics of a good product and product range
All of the respondents mentioned product quality, of which 30 % specified that
the durability of the products is the single most important quality feature. A good
product that is durable and of good quality reduces the risk of having to waste
time and effort in returning or changing it and therefore a durable product reduces
the perceived sacrifice as well (Petrick 2002, 123; Garvin 1987). One respondent
mentioned the importance of a functioning warranty despite the good quality of
the product (see Walters & Lancaster 1999, 697). Also the importance of a wide
product range and good product availability was mentioned in 46 % of the an-
swers. If one supplier has to offer all the products the customers have demand for,
the perceived sacrifice is reduced as the customer does not have to invest time and
other resources into finding another supplier for certain products or product cate-
gories (see Kotler & Keller 2012). Three respondents underlined the importance
of the product range being up-to-date and correspond to the demand, as the cus-
tomer needs change constantly (see Zeithaml 1988, 18; Burns & Bush 2001, 7).

118
Moreover, three respondents also mentioned extrinsic attributes of the benefit
component (Zeithaml 1988), as they mentioned the quality-price ratio and the fact
that the products should be priced accordingly.
2. The importance of product features in the choice of supplier
The respondents were asked to rate certain product features by their importance
(1=not at all important, 2=not very important, 3=neutral, 4=quite important,
5=very important) in choosing a supplier. Again, the difference between the dif-
ferent product features was small and all of them scored important. The standard
deviation is between 0.43 and 0.69, meaning that also the difference among re-
spondents’ opinions was small. The average (mean) of each aspect is shown in
Table 5, alongside with the most frequent response (mode).
Table 5. Product features: level of importance in the choice of supplier.
Product features: mean mode
The product availability 4.77 5
The products fit the customer’s requirements 4.68 5
The quality of the products 4.68 5
The durability of the products 4.55 5
The products’ good price-quality ratio 4.41 4
The versatility of the product range 4.23 4
The profits gained from the products over time 4.09 4
The products are easy to use 3.95 4
The responses are in line with the answers of the previous question, confirming
the validity of the measurement (see Bordens & Abbott 2011, 130). On average,
the most important features of the products and product range are the availability
of the products, their compatibility with the customer’s requirements, and their
quality, all of which have a decreasing effect on customer perceived sacrifices
(see Zeithaml 1988).

119
3. The extent to which the product range affects the choice of a supplier
The respondents were asked to rate the extent to which the product range affects
the choice of a supplier. The question is a multiple-choice question and the op-
tions include very little, quite little, not a lot or a little, quite a lot, and very much.
The distribution of the responses is illustrated in Figure 10.
Figure 10. The effect of the product range in the choice of supplier.
As the majority, 73 %, of the respondents said that the product range does affect
the choice of supplier either quite a lot or very much, a conclusion can be made
that the product range has a considerable effect on the choice of supplier and it
should be extensive enough and adjusted according to customer needs. Therefore,
the product range is the core benefit that has to be included in the supplier’s offer-
ing in order to be in the customer’s consideration set (Menon et al. 2005, 4–7;
Hutt & Speh 216). However, 27 % did not perceive that the product range has that
big of an effect on their choice of supplier, indicating that they perceive that other
factors, such as the service quality, play a bigger role in the choice of supplier.
4. Choosing a supplier based solely on the product range
23 % of the respondents could choose a supplier based solely on the product
range. One of the respondents who said that product range affects the choice of
supplier very much, would however not choose a supplier based solely on the
product range. 39 % of the respondents who said that the product range affects the
choice of supplier ‘quite a bit’ would choose a supplier based only on the product
range. Thus, the product range is an important part of the customers’ evaluation
4% 5%
18%
59%
14% Very littleQuite littleNot a lot or a littleQuite a lotVery much

120
regarding the supplier’s ability to fulfil their needs and should therefore be versa-
tile enough to ensure being in the customers’ consideration set (Menon et al.
2005, 4–7).
5. The level of accuracy of the statements regarding preference
The respondents were asked to rate the accuracy (1=completely inaccurate,
2=somewhat inaccurate, 3=not accurate or inaccurate, 4=somewhat accurate,
5=completely accurate) of nine statements connected to features of the provided
service. The statements are listed in Table 6 according to the mean, and the mode
of each point is shown as well.
Table 6. Level of accuracy of statements regarding preference.
Statement: mean mode
I favor a supplier who offers a fast and flexible service 4.82 5
I favor a supplier who consistently fulfills the promised delivery
dates
4.64 5
I favor a supplier who seeks to understand and respond to customer
needs
4.59 5
I favor a supplier who in addition offers technical advice 4.59 5
I favor a supplier who invoices correctly and the bills are reliable 4.55 5
I favor a supplier who stands out among the competitors with their ex-
pertise
4.45 5
I favor a supplier who succeeds in providing a quality service on the
first try
4.32 4
I favor a supplier who responds quickly and thoroughly to complaints 4.32 4
I favor a supplier who stands out for the ability to provide systematic
solutions to our problems
4.09 4
The difference between the answers is not significant and all of the statements are
regarded as somewhat accurate or completely accurate, meaning that features of
the supplier described in Table 6 are important, and should be taken into consid-
eration in the case company’s context in order to increase the value of their offer-

121
ings. The supplier’s ability to offer a fast and flexible service is the most im-
portant feature according to the mean value, and the second most important is the
supplier’s ability to consistently fulfil the promised delivery dates, both of which
were also mentioned several times in the previous questions that measured what
affects the choice of supplier and what is considered as good service quality.
These responses will later on be compared with Teo Lehtimäki Ltd.’s perfor-
mance to see how well the performance meets the desired performance.
6. Whether a company’s website are an important part of the service offering
86 % of the respondents perceive the website to be an important part of the ser-
vice offering, and therefore, it can be considered to be included in the basic sup-
port services that increases the effectiveness and usability of the offering (Jones &
Sasser 1995, 90). For that reason, if the responses in the second part indicate that
there is room for improvement in Teo Lehtimäki Ltd.’s website, making those im-
provements would increase the total customer benefits and add value for the cus-
tomers.
Personnel
1. Describing good customer service personnel
The definitions of good customer service included several similarities and the re-
spondents identified a set of different features of good customer service. The re-
spondents’ definitions of good service should be used as a guideline in the case
company’s customer service: this is the kind of customer service they should aim
in providing as it reflects the customers’ desired service (see Parasuraman et al.
1991). Some responses were more thorough than others but each answer provided
a valid point on what is good service and also included a lot of similarities as well.
The most frequent characteristic of good service was that the customer is treated
as an individual and the service is personalized to fit a particular customer’s needs
and requests (Jones & Sasser 1995, 90), mentioned by 63 % of the respondents.

122
Treating the customer as an individual means listening to them and taking their
requests into consideration in the business operations. For instance, one respond-
ent said that good service includes taking the requests from the ‘field’ (referring to
the customer and the customer’s customer) into consideration and that for instance
customer’s requests regarding new products should not be ignored. The supplier’s
ability to update their inventory according to demand as well as removing unnec-
essary products from the range was also mentioned in the previous questions re-
garding the choice of supplier. Listening to the customer is perceived as an im-
portant feature (see Parasuraman et al. 1985, 46–47) and it was mentioned by
eight respondents. For instance, a customer of 21 years said that good service in-
cludes listening to the customer and seeking to find the best solution for that spe-
cific customer’s needs or problems. Therefore, the better the customer perceives
that the supplier knows and understands their needs and is able to provide a per-
sonalized service, the better the perceived service quality is (Parasuraman et al.
1985, 47).
The ability to provide technical advice was identified as an important value driver
in the previous questions (Walters & Lancaster 1999, 700), and it was again men-
tioned in six responses. The respondents pointed out that the supplier should be an
expert in their field and have extensive knowledge about for example the suitabil-
ity of the spare parts to different snowmobile types as the retailer might not have
that information available. One respondent pointed out that the supplier should be
able to answer any question related to the market and if not, they should find out
and get back to the customer, which is related to another response that indicated
that the supplier should be willing to help the customer and provide the service.
The personnel’s competence is perceived as an important determinant of service
quality since it increases their ability to serve the customers and provide technical
advice, and also their responsiveness, i.e. willigness to provide the service, is per-
ceived to be an important feature of the personnel that has an impact on the cus-
tomers’ satisfaction (Parasuraman et al. 1985, 47).

123
In addition to helpfulness, other characteristics of the personnel that were fre-
quently mentioned in the responses include honesty, reliability, trustworthiness,
patience, friendliness, and reachability (Parasuraman et al. 1985, 46–47). The re-
spondents value a supplier who keeps their promises. One respondent also pointed
out that if the supplier over-promises something, the customer should be compen-
sated somehow (see Grönroos 2007). Fixing problems and offering solutions was
perceived as a characteristic of good service by three respondents (Jones & Sasser
1995). Moreover, one respondent said that, in addition to focusing on the custom-
er’s needs and problems, and offering solutions to those problems, the personnel
should be able to have a friendly conversation with the customer as well, especial-
ly if it is a company they have been cooperating with for years. This respondent
has been Teo Lehtimäki Ltd.’s customer for 16 years, meaning that having a non-
work related, friendly conversation with the personnel is perceived as a relation-
ship benefit that adds value for the customer (Gwinner et al. 1988, 101–114).
2. The personnel’s effect in the choice of supplier
The respondents were asked to rate characteristics of the personnel according to
their effect (1=very small, 2=somewhat small, 3=neither small nor big, 4=quite
big, 5=very big) on the choice of supplier. Moreover, the respondents were pro-
vided with a possibility to specify why. The characteristics are listed in Table 7
according to the mean, and the mode of each point is provided as well.
Table 7. Characteristics of the personnel: effect in the choice of supplier.
Characteristic of the personnel: mean mode
Reachability 4.86 5
Personnel qualifications and professionalism 4.77 5
The reliability and consistency of the service 4.64 5
Staff attitude and their willingness to provide the service 4.59 5
Vast knowledge regarding the markets and products 4.41 5
The staff courtesy and friendliness 4.32 5
Communication (keeping the customer up to date) 4.32 5

124
All of the characteristics were perceived to have a significant effect on the choice
of supplier and as the difference between the perceived importance of the charac-
teristics was not remarkable, they should all be taken into consideration in Teo
Lehtimäki Ltd.’s performance. The respondents’ observations regarding the rea-
son why the characteristics are important are briefly described.
Reachability was perceived to be an important characteristic of the personnel due
to the fact that orders are generally placed through phone or email and if the cus-
tomer is unable to contact the supplier, there will not be a sale, and thereby it is
also in the supplier’s best interest to be reachable. One respondent pointed out that
also problems are usually solved though phone, which makes the supplier’s reach-
ability essential from the customer’s point of view. Moreover, customers expect
the personnel to have sufficient information about the products so that they can
turn to the company in terms of technical advice and other problems, not only for
placing orders. This was also covered in the previous question that defined good
service personnel. One responded pointed out that the personnel has to have ex-
tensive knowledge about the spare parts, as the retailer cannot always know which
product is suitable for a specific end-customer. Also the reliability and consisten-
cy of the service was perceived to have a very high effect on the choice of suppli-
er, and the respondents specified that the customer has to be able to trust the sup-
plier, for example, that they send out correct products, that their invoicing is relia-
ble and correct, and so on. Staff attitude and their willingness to provide the ser-
vice was also perceived to be important and one respondent pointed out that bad
service usually drives customers away. Investing in good service quality pays off,
as it generally leads to satisfied, long-term customers (Grönroos 2007). Vast
knowledge regarding the markets and products is also helpful in the process of
updating the inventory and eliminating unnecessary products from the range. One
respondent said that if the supplier does not know what they are selling and sends
out wrong parts, everyone loses. Therefore, it is important that the supplier has
extensive knowledge regarding the suitability of the products for different snow-
mobile types and models. Communication, as in keeping the customer up to date,

125
was also perceived important and one respondent pointed out that it is essential in
order to know about possible changes, and suggested that customers could be sent
a newsletter once or twice a year informing about new products and any possible
changes in the company’s operations. (Parasuraman et al. 1985, 46–47.)
3. The characteristic with the biggest impact on satisfaction and the reason why
The respondents were asked to choose one of the characteristics listed in the pre-
vious question that they perceive to have the biggest impact on their satisfaction
as well as to specify why. However, only 41 % of the respondents specified the
reason behind their choice. The distribution of the responses is illustrated in Fig-
ure 11.
Figure 11. The characteristic of the personnel with the biggest impact on satisfac-
tion.
36 % of the respondents chose reachability as the most important feature of the
personnel. The customers feel that it is important to be able to reach the supplier
in case of any problems or questions regarding prices, product availability, deliv-
ery times, and so on. Two respondents said that if they are unable to contact the
supplier, there will not be a sale, and that in the worst case they would contact the
competitor. Another respondent said that ‘a seasonal branch requires rapid react-
ing’ and another referred to the fact that they have to keep the promises made to
their customers (Gummesson 2002), meaning that it is essential that the supplier is
reachable for product availability inquiries. Moreover, one of the respondents said
36%
23% 18%
14%
9% Reachability
Personnel qualifications and professionalism
The reliability and consistency of the service
Staff attitude and their willingness to provide the service
Vast knowledge regarding the markets and products

126
that reachability is the most important characteristic since orders are normally
placed trough phone and also possible problems are solved over the phone. The
importance of the personnel’s reachability was emphasized in the previous ques-
tion as well.
23 % of the respondents felt that a qualified and professional personnel was the
most important factor in terms of their satisfaction. The main reason was identi-
fied to be the reduced sacrifices in terms of time and effort (Petrick 2002, 123);
one respondent said that knowledge about the products is essential, as ‘sending
out wrong products does not benefit anyone’. One responded pointed out that a
qualified and professional personnel facilitates the retailer’s job, as they can be
sure that the information obtained is correct and that the products are suitable for
the specified use. Therefore, a qualified and professional personnel reduces the
customers’ perceived sacrifices and increases the total value of the relationship.
Having a vast knowledge of the markets and products is also connected to the
qualifications of the staff, and it was chosen by two customers. One of them speci-
fied that it is important as it enables them to contact the supplier for advice and
assistance regarding the markets and products.
Four respondents perceived the reliability and consistency of the service to be the
single most important factor in terms of their satisfaction, and one of them speci-
fied that it ensures that everything goes smoothly and no mistakes occur (Grön-
roos 2007). Moreover, the reliability and consistency of the service reduces the
perceived sacrifice, as the customer can be sure that the orders will arrive on time,
the invoicing is correct, and so on. Three respondents chose staff attitude and will-
ingness to provide the service as the most important factor in terms of their satis-
faction. One respondent said that if the personnel’s attitude is good and they are
willing to provide the service, it is very likely that they would use their services in
the future as well. Therefore, the personnel should not only be experts in their
field who are easily reached and who provide a reliable and consistent service, but

127
they should also be willing to serve the customer and ensure a good experience in
each service encounter (Parasuraman et al. 1985; Grönroos 2007).
4. Choosing a supplier based solely on the personnel
50 % of the respondents would not choose a supplier based solely on the person-
nel, 36 % would, and 14 % cannot say. Furthermore, 20 % of the respondents who
would not choose a supplier based solely on the product range would, however,
do so based only on the personnel. Moreover, 71 % of the respondents who would
choose a supplier based only on the product range would also do so based only on
the personnel, meaning that these respondents take both the personnel and the
product range into consideration and that they are equally important. In addition,
the respondents who answered ‘cannot say’ are respondents who would not
choose a supplier based only on the product range, indicating that the personnel
might have a bigger effect on the choice of the supplier, however, it is not the only
factor affecting the choice.
Satisfaction
1. The factors with the biggest influence on satisfaction
The respondents were asked to list the main factors with the biggest impact on
their satisfaction to get a better picture how to increase satisfaction. The responses
also communicate the respondents’ expectations as satisfaction requires fulfilment
of customer expectations (Parasuraman et al. 1988). The responses included a lot
of similarities and some of the responses were more comprehensive than others.
Factors connected to services and service quality were mentioned in 91 % of the
responses, of which 20 % included only service characteristics. The impact of
good service quality on satisfaction is therefore significant, however, as the ma-
jority of the responses (80%) included also other factors related to products and
pricing, a conclusion can be made that it is the totality of the services, products,
and pricing that has the biggest impact on the customers’ satisfaction, and thereby
the customer perceived value (Storbacka et al. 1994).

128
2. Likelihood of certain behavioral outcomes in connection to satisfaction
The respondents were asked to rate the likelihood (1=very unlikely, 2=rather un-
likely, 3=neutral, 4=quite likely, 5=very likely) of certain behavioral outcomes in
connection to satisfaction. The behavioral outcomes are listed in Table 8 accord-
ing to the mean value, and the mode of each point is provided as well.
Table 8. Behavioral outcomes connected to satisfaction and their likelihood.
Behavioral outcomes: mean mode
Expecting the business relationship with this supplier to continue
for a long time
4.77 5
Telling positive things about the supplier to other companies 4.73 5
Recommending the supplier to other companies 4.68 5
Continuing doing business with the supplier even if prices were to
slightly increase
4.68 4
Perceiving the continuation of the business relationship important 4.68 5
Maintaining the business relationship with the supplier 4.68 5
Encouraging other companies to use the supplier’s services 4.64 5
Doing more business with the supplier in the upcoming years 4.45 5
Using the supplier as a comparison standard 3.95 4
The behavioral outcomes with the highest mean value included expecting the
business relationship to continue for a long time; satisfaction increases the cus-
tomer’s willingness to continue the relationship (Stauss & Neuhaus 1997, 238),
and telling positive things about the supplier to other companies; satisfaction also
increases the customer’s willingness to provide positive word-of-mouth (Ravald
& Grönroos 1996; Liljander & Strandvik 1995). 68 % of the respondents are very
likely to recommend the company to others when they are satisfied and 27 % are
quite likely to do so. 68 % of the respondents said that it is very likely that they
would perceive the continuation of the relationship to be important and the re-
maining 32 % quite likely. The behavioral outcome with the biggest standard de-
viation (0.76) was continuing doing business with the supplier even if prices were

129
to slightly increase. However, only one respondent said that it is rather unlikely
that they would continue the relationship, if the prices were to slightly increase.
Three respondents chose neutral, indicating that if the supplier is perceived to
provide value despite the increase in prices, it is likely that they would continue
the relationship, whereas if the service was not that good to begin with, switching
suppliers would be probable. All in all, the responses indicate that satisfaction has
a substantial impact on the customers’ willingness to continue the relationship and
it increases the probability of positive word-of-mouth and referrals (see Anderson
& Sullivan 1993; Ravald & Grönroos 1996; Liljander & Strandvik 1995).
3. The accuracy of certain behavioral outcomes in connection to dissatisfaction
The respondents were asked to rate the accuracy (1=completely inaccurate,
2=somewhat inaccurate, 3=not accurate nor inaccurate, 4=somewhat accurate,
5=completely accurate) of certain statements regarding behavioral outcomes con-
nected to dissatisfaction. The behavioral outcomes are listed in Table 9 according
to the mean value, and the most frequent answer is also shown.
Table 9. Behavioral outcomes connected to dissatisfaction and their likelihood.
Behavioral outcome: mean mode
Switching suppliers would seem worthwhile 3.00 1
I would not recommend the supplier to other companies 2.91 1
I would not do more business with the supplier in the future 2.86 4
I would not perceive the continuation of the business relationship im-
portant
2.86 1
I would not encourage other companies to use the supplier’s services 2.82 1
I would tell negative things about the supplier to other companies 2.18 1
In contrast to the previous question, there was a lot of variance between the an-
swers and the average standard deviation was 1.5. The minimum of each behav-
ioral outcome was 1 and the maximum 5. As many as five respondents answered
‘completely inaccurate’ to each question, which does not correspond to the theo-
retical part; according to the theory, dissatisfaction decreases the customer’s will-

130
ingness to continue the business relationship (Stauss & Neuhaus 1997, 241).
However, these respondents who answered ‘completely inaccurate’ to each point,
stated in the following question that satisfaction is either ‘essential’ or ‘very im-
portant’ for the continuation of the relationship, making it questionable whether
they have correctly understood the rating system.
46 % of the respondents would perceive switching suppliers to be worthwhile if
they were dissatisfied with their current supplier. 64 % of the respondents would
not engage in negative word-of-mouth even if they were dissatisfied, and three
respondents stated that they would tell negative things about the supplier to other
companies. Although not many of the respondents admitted that they would en-
gage in negative word-of-mouth, the supplier should still ensure not to give a rea-
son for negative word-of-mouth.
4. Whether satisfaction is a prerequisite for the continuation of a business rela-
tionship
All of the responses imply that satisfaction is a prerequisite for the continuation of
a business relationship (see Athanasopoulou 2009), and one respondent specified
that ‘normally bad suppliers get eliminated’. Two respondents underlined the im-
portance of the supplier’s overall performance and the totality.
5. Biggest impact on satisfaction
The respondents were asked to choose which of the following factors have the
biggest impact on their satisfaction: the versatility of the product range, the quali-
ty of the products, personalized and reliable service, or better products and ser-
vices for the price-quality ratio. Although it has become evident in the previous
questions that all of them are important for the customers, they were allowed to
select only one of the alternatives to see which could be identified their value
driver (Walters & Lancaster 1999, 700). The distribution of the responses is
shown in Figure 12.

131
Figure 12. Biggest perceived impact on satisfaction.
Even though the versatility of the product range came off as highly important in
the previous sections, only one respondent chose it as the most important factor.
Also product quality was mentioned frequently in the previous questions regard-
ing satisfaction and what affects it, however, only two respondents selected prod-
uct quality as the single most important factor affecting their satisfaction. Better
products and services for the price-quality ratio was chosen as the most important
factor by 32 % of the respondents, indicating that value does play a big role in
customer satisfaction.
The majority of the customers rated personalized and reliable service as the most
important, which underlines the importance of service quality and its ability to
fulfil customer’s individual needs (Parasuraman et al. 1985, 47). Personalized
service refers to succeeding in fulfilling the customer’s expectations and needs,
which has a big impact on satisfaction, and reliable service refers to the customer
not having to worry if the order is going to be invoiced correctly, whether the de-
livery will arrive on time, or whether the supplier sends out the correct product, all
of which reduce customer perceived sacrifices (Kotler & Keller 2012; Petrick
2002, 123; Ravald & Grönroos 1996, 24; Grönroos 2007).
All in all, although product quality and variety have been frequently mentioned in
the previous sections as an important factor in choosing a supplier as well as in
terms of the customers’ satisfaction, the majority of the respondents perceive that
the functional quality dimension (Grönroos 2007) has a bigger impact on their sat-
isfaction, and the case company should focus on providing better that are adapted
55%
32%
9%
4%
Personalized and reliable service
Better products and services for the price-quality ratio
The quality of the producss
Versatility of the product range

132
to the customer’s needs (Gwinner et al. 1998). Moreover, the best way to add
more value to the core product is by improving the company’s service quality and
including supporting services (Ravald & Grönroos 1996, 19).
8.3 Part 2: Teo Lehtimäki Ltd.
This section includes similar questions to the first part, but they are asked in the
case company’s context. The aim of the previous part was to gain an understand-
ing of what customers expect and require in a supplier, which features of a ser-
vice, product or personnel do they value over others, and the answers are com-
pared to the customers’ evaluations of Teo Lehtimäki Ltd’s performance. Moreo-
ver, as the customers were divided into different groups, their answers will be
compared in this section to see if there is any difference between for example a
customer who has been with the company for over 20 years and a customer of less
than 10 years.
Teo Lehtimäki Ltd.’s performance & relationship value
1. Evaluation of the performance in the last service encounter
The respondents were asked to select which of the seven statements, shown in
Figure 13, describe the last service encounter with Teo Lehtimäki Ltd. Two alter-
natives are not shown at all as none of the respondents perceived the service to
have been bad or not meet their expectations. The distribution and frequency of
the responses can be seen in Figure 13.
Figure 13. Teo Lehtimäki Ltd.’s performance in the last service encounter.
All of the respondents perceived good service quality in the last service encounter,
and five respondents regarded it as excellent. All in all, the respondents felt like
40%
12% 14%
20%
14% My experience was as good as it was supposed to be
The service was of very good quality
The service was excellent
The service met my expectations
The service was good quality right the first time

133
their expectations were fulfilled and the service quality was acceptable but for the
majority it did not exceed their expectations.
2. Describing Teo Lehtimäki Ltd.’s product and service quality
The product and service quality was mainly described as good or excellent, and
one respondent described it as above average. One respondent said that, during the
five years of cooperation with Teo Lehtimäki Ltd., there has not been a situation
where they have been disappointed. Two respondents mentioned the professional-
ism of the personnel and one respondent specifically pointed out that the Kauha-
joki office provides an excellent service. Eight respondents mentioned the good
price-quality ratio of the products and services, indicating that the products and
services provide value for the customers (Zeithaml 1988, 10).
Although the majority of the respondents said that the products are of good or ex-
cellent quality, one responded pointed out that some of the products are not very
durable, and as the durability of the products had an average of 4.55, Teo
Lehtimäki Ltd. could look into replacing the products that are not very durable
with a better alternative, if possible. However, a customer of 15 years said that the
service quality has always been good, and that the product quality is what is ad-
vertised, indicating that although there might be products that are less durable or
of lesser quality than others, the company does not make empty promises, which
is important in terms of fulfilling expectations (Grönroos 2007). One respondent
said that the product variety should be expanded, whereas another respondent said
that it corresponds to their customers’ needs from all over Finland, and another
respondent said that Teo Lehtimäki Ltd. offers products that are not available an-
ywhere else, which confirms the fact that different customers have different needs.
All of the customers were happy with the provided service but were hoping that
the company would reduce the non-monetary sacrifices by updating their electron-
ic services to the competitors’ levels, mainly referring to the extranet -feature
which allows customers to view information regarding product availability, con-

134
tract prices of the products, and so on, and also enables placing orders online.
Currently the main source of information is via phone or email as the company’s
website does not include information about product availability or prices, and or-
ders are also placed though either phone or email. Including this extranet -feature
to the company’s offerings would not only reduce the customers’ perceived sacri-
fice (Kotler & Keller 2012; Petrick 2002, 123), as they have to always call and
check for availability or for placing an order, but also facilitate Teo Lehtimäki
Ltd.’s operations as it would reduce the phone traffic significantly. Therefore, ac-
quiring the extranet -feature is something the company should seriously consider
doing, as it would benefit both the customer and the company itself.
3. Teo Lehtimäki Ltd.’s ability to fulfil expectations
The respondents were asked to rate Teo Lehtimäki Ltd.’s ability to fulfil their ex-
pectations on a scale from one to five, one being extremely poorly and five ex-
tremely well. The average was 4.59, with a minimum of 4, and a mode of 5 indi-
cating that the customers perceive that Teo Lehtimäki Ltd. is generally able to ful-
fill their expectations. 59 % of the respondents perceive that the company suc-
ceeds excellently in fulfilling their expectations, and the remaining 41 % that the
company is able to fulfil their expectations ‘quite well’. Consequently, although
the overall service and product quality is regarded as good, 41 % of the respond-
ents perceive that there is still room for improvement.
4. Describing the business relationship with Teo Lehtimäki Ltd.
The relationship with Teo Lehtimäki Ltd. was mainly described as good, indicat-
ing that the relationship value is perceived to be good (Grönroos 2007). One re-
spondent said that Teo Lehtimäki Ltd. provides a flexible service and offers quali-
ty products, which is why they have been a customer for 16 years now. Teo
Lehtimäki Ltd.’s flexible service was mentioned in two other responses as well,
which was also identified as a value driver in the first part of the questionnaire,
alongside with providing a fast service, and the speed of the company’s deliveries

135
was mentioned as a value driver in four responses. Three respondents said that
Teo Lehtimäki Ltd.’s expertise is outstanding and the main reason for choosing
them instead of the competitors. The importance of the personnel’s expertise was
also emphasized in the questions of the first section regarding choice of supplier
and satisfaction, and the ability to provide technical advice was identified as the
most important criteria in a supplier by 27 % of the respondents (Walters & Lan-
caster 1999, 700).
A customer of 15 years said that Teo Lehtimäki Ltd. provides products that other
importers do not have and that the quality of the products is good, especially the
repaired crankshafts and cylinders, and underlined that the provided service has
always been friendly and good. One respondent specified that the reason why they
chose Teo Lehtimäki Ltd. is the fact that the company’s product range fits their
needs perfectly (see Levitt 1980). Creating a competitive advantage is important
for a company’s success, and providing exclusive products is one way to create it
(Menon et al. 2005, 4–7; Hutt & Speh 216).
Another way to create a competitive advantage is by providing personalized, bet-
ter services, which was also mentioned in some responses. For example, two re-
spondents described the relationship as close and personal, and said that the pro-
vided service is excellent. A customer of seven years described Teo Lehtimäki
Ltd. as a ‘reliable partner’, indicating that the relationship itself might have a ma-
jor effect on the total customer perceived value (Ravald & Grönroos 1996, 23). A
customer of 21 years said that the relationship is stable, and pointed out that the
service quality has improved over the years. A customer of 20 years said that they
are satisfied with the service as all the deliveries arrive on time, complaints are
dealt with quickly, and also mentioned that they have received additional, extra
services as well (see Jones & Sasser 1995, 90). Also another respondent men-
tioned the extra services provided by Teo Lehtimäki Ltd., by mentioning that the
personal company visits that aim in promoting new products provide them with
additional value (Grönroos 2007).

136
5. Perceived value of the business relationship
All of the respondents state that the relationship with Teo Lehtimäki Ltd. provides
value for them.
6. Teo Lehtimäki Ltd.’s performance in comparison with other suppliers
The customers were asked to rate their level of agreement (1=strongly disagree,
2=somewhat disagree, 3=neither disagree nor agree, 4=somewhat agree,
5=strongly agree) of 12 statements that required them to compare Teo Lehtimäki
Ltd. to other suppliers. In part one, the same statements were rated according to
their importance (1=not at all important, 2=not very important, 3=neutral, 4=quite
important, 5=very important) in choosing a supplier, which is used as a reference
point for the desired performance. The importance in choosing a supplier and Teo
Lehtimäki Ltd.’s perceived performance is illustrated in Figure 14.

137
Figure 14. Teo Lehtimäki Ltd.'s performance in comparison with desired value.
The first six questions measure the importance of value for money; to what extent
do the customers agree that Teo Lehtimäki Ltd. offers products and services with
a better price-quality ratio, better services at a competitive price, better quality for
the price, the best discounts and payment terms, value for money, and competitive
prices. In general, Teo Lehtimäki Ltd. is perceived to offer value for money, how-
ever, some respondents point out that the competitors offer the same core products
and might offer certain products for a lower price, but say that it depends greatly
on the product in question. According to part one, offering better products and
services for the price-quality ratio has the biggest impact on 32 % of the respond-
ents’ satisfaction. Moreover, 37 % of the respondents regarded providing value
for money as the most important criteria in a supplier. Although the majority of
4.77
4.59
4.86
4.5
4.05
4.91
4.45 4.36 4.32
4.5
4.36 4.41
4.73
4.41
4.68
4.5
4.23
4.64
3.95
4.18
3.86 3.86
4.05
3.77
3
4
5Perceived importancein choosing a supplier
Teo Lehtimäki Ltd.'sperformance

138
the respondents agree that Teo Lehtimäki Ltd. provides value for money with bet-
ter quality, some respondents are not completely satisfied with the price-quality
ratio, but also point out that it depends on the order and product in question. The
distribution of responses is illustrated in Figure 15.
Figure 15. Teo Lehtimäki Ltd. and value for money: level of agreement.
Nevertheless, in a situation where the competitors have identical core products,
the key to gaining a competitive advantage is in adding value by providing better
supporting services (Grönroos 2007, 1–5; Leventhal 2006, 431), therefore, rather
than reducing the customers’ monetary sacrifice, the company should focus on
delivering a better service than the competitors to add value for the customers.
Questions 7–12 measure the perceived benefits of the products and services; to
what extent do the customers agree that Teo Lehtimäki Ltd. is able to offer prod-
ucts and services when the customer needs them, offers products that are easy to
use, knows the customers and their needs, is an expert in their field, offers the best
advice, and offers a personalized service. The level of agreement was significantly
better in comparison with the statements measuring value for money. Offering
personalized services yielded the highest average (4.73) , which was also regarded
to have the biggest impact on the customer’s satisfaction in part one by 55 % of
the respondents, and offering products that are easy to use the lowest (4.23),
which was also the least important of the statements in choosing a supplier. More-
over, the performance also fulfills better the desired service defined in part one, as
the values are closely clustered to the value representing their importance. The
1
4
1
9
7
5
7
15
16
7
11
11
10
3
5
6
4
6
4
0 2 4 6 8 10 12 14 16 18 20 22
offers competitive prices
offers value for money
offers the best discounts and payment terms
provides better quality for the price
offers better services at a competitive price
offers products and services with a better…
Somewhat disagree Neither agree or disagree Somewhat agree Completely agree

139
average of each statement was above 4, meaning that the respondents agree that
Teo Lehtimäki Ltd. succeeds in providing value for the customers with their ser-
vices. Apart from three responses, all the statements were either completely or
somewhat agreed with. 73 % of the respondents completely agree that Teo
Lehtimäki Ltd. is an expert in their field, and only one respondent neither agree or
disagree, and the rest of the respondents somewhat agree, indicating that the ma-
jority of the respondents perceive the personnel’s expertise to be better than the
competitors’. Offering the best advice compared to other suppliers was perceived
to be completely accurate by half of the respondents, nine respondents said it to be
somewhat accurate, and two customers neither agreed nor disagreed. Apart from
offering products that are easy to use, the most frequent answer (mode) to the
statements was ‘completely agree’, indicating that the company knows their cus-
tomers, succeeds in providing personalized services, and offers valuable advice as
they are regarded as experts in the snowmobile spare part field. The distribution of
the responses can be seen in Figure 16.
Figure 16. Perceived benefits of Teo Lehtimäki Ltd.’s offerings: level of agree-
ment.
1
2
8
17
11
5
9
6
14
5
11
16
11
16
0 2 4 6 8 10 12 14 16 18 20 22
offers products and services when the…offers products that are easy to use
knows the customers and their needs
is an expert in their field
offers the best advice
offers a personalized service
Neither agree or disagree Somewhat agree Completely agree

140
Teo Lehtimäki Ltd.’s products
1. Teo Lehtimäki Ltd.’s products
The respondents were asked to rate their level of agreement (1=strongly disagree,
2=somewhat disagree, 3=neither disagree nor agree, 4=somewhat agree,
5=strongly agree) of different product-related statements. The distribution of the
opinions is illustrated in Figure 17.
Figure 17. Teo Lehtimäki Ltd.’s product features: level of agreement.
According to the responses in part one, the most important features connected to
the products were the availability of the products, that they fit the customer’s re-
quirements, and that the product quality is good. According to the responses, Teo
Lehtimäki Ltd. can be assumed to have good product availability most of the time,
however, 13 respondents indicate that there might be some room for improve-
ment. The products are also viewed to fit their requirements, indicating that Teo
Lehtimäki Ltd.’s product range is fulfils the customers’ needs, but on the other
hand, there might also be something missing from the product range as 18 % do
not agree or disagree that the product range is versatile and 64 % agree only to
some extent – the issue is assessed in the following question. Durability can be
seen as a quality feature of snowmobile spare parts, and 36 % of the respondents
completely agree that Teo Lehtimäki Ltd.’s products are durable and the rest
somewhat agree, indicating that some products might be more durable than others.
1
4
8
1
4
12
9
10
14
14
13
14
9
9
4
7
5
9
8
0 2 4 6 8 10 12 14 16 18 20 22
product availability is good
the price-quality ratio of the products is good
products provide a good profit over time
products are easy to use
product range is versatile
products fit our requirements
products are durable
Neither agree or disagree Somewhat agree Completely agree

141
The majority of the respondents agree that the products are of good quality, the
product range is versatile, and the product availability is good. However, not all of
the respondents agree that the products provide value for money, which was also
indicated in the previous questions. 25 % of the respondents who neither agree nor
disagree that the products provide a good profit over time, indicated in part one
that the profits are an important factor in choosing a supplier.
2. Possible shortcomings in Teo Lehtimäki Ltd.’s product range
55 % of the respondents did not perceive that anything was missing from Teo
Lehtimäki Ltd.’s product range, including one respondent who neither agreed nor
disagreed that the product range is versatile, indicating that it is versatile enough
as no suggestions were given. The remaining 45 % of the respondents said that the
product range could be more versatile. Their suggestions included adding drive
belts to the product range, investing in better quality ski runners, extending to
ATV spare parts, adding more electric parts to the product range, and increasing
the variety of spare parts for new snowmobile models. One respondent also men-
tioned that there is an increasing demand for reasonably priced exhaust systems,
namely power pipes, and that the company should invest in those.
As a good product range can be seen as a benefit that can have a decreasing effect
on total perceived sacrifices (see Monroe 1991; Ravald & Grönroos 1996, 21), the
company could increase differentiation and increase the perceived value of their
offerings by expanding the product range according to customer suggestions.
Moreover, as listening to the customer was mentioned by 36 % of the respondents
when they were asked to describe good service personnel in part one, the compa-
ny should take their suggestions regarding the product range into consideration.
Furthermore, the supplier’s ability to update their inventory according to demand
was also mentioned in the other questions regarding the factors that affect the
choice of supplier. By adding the requested spare parts into their product range,
the company is able to provide better value for them and succeed better in ful-
filling their needs (Ravald & Grönroos 1996, 19).

142
Teo Lehtimäki Ltd.’s service quality
1. Teo Lehtimäki Ltd.’s service quality
Every respondent said that Teo Lehtimäki Ltd.’s service is good and the reason
varied from the personnel’s friendliness to their expertise. One respondent said
that the quality of the service is not only good but excellent and that there has not
been one negative event during their history of six years. Three respondents said
that the company’s expertise and reachability makes a difference. One respondent
said that the overall service quality can be regarded as high, but that their electron-
ic services require updating.
2. Teo Lehtimäki Ltd.’s performance and service quality
The respondents were asked to rate their level of agreement (1=strongly disagree,
2=somewhat disagree, 3=neither disagree nor agree, 4=somewhat agree,
5=strongly agree) on different statements measuring their performance and ser-
vice quality as well as indicate the reason for their response if they answered 1, 2,
or 3. The average level of agreement ranges from 4.23 to 4.56, which implies that
the majority of the respondents feel that the company’s performance and service
quality is good. However, a few improvement areas can be identified from the re-
sponses as well. The major findings of are presented.
Based on the average (above 4.50) and the most frequent answer being ‘strongly
agree’ (=5), the areas the company is currently doing well in include their ability
to understand and respond to customers’ needs, provide a quality service, consist-
ently fulfil the promised delivery dates of orders, and provide useful technical ad-
vice, which all add value to their offerings. Moreover, based on the average
(4.64), standard deviation (0.49), and the most frequent answer (5), the company
is currently excelling in providing fast deliveries and a fast and flexible service,
which is also what their business is built on according to the company’s website.
The importance of fast and on-time deliveries was also mentioned by 41 % of the

143
respondents when they were asked to describe characteristics of good service in
part one.
According to the most frequent answer, the majority of the respondents perceive
that the company stands out for their expertise and the ability to provide systemat-
ic solutions to the customers’ problems, and also responds fairly quickly and
comprehensively to complaints. The majority of the respondents perceive Teo
Lehtimäki Ltd.’s invoicing to be correct and reliable, however, according to four
respondents there is room for improvement in the company’s invoicing, as the in-
voices sometimes arrive late and occasionally include errors. Since the sample
size is fairly small, the company should pay more attention to their invoicing and
ensure that the information is correct, as there might be other customers in the to-
tal population who encounter the same problem.
3. Teo Lehtimäki Ltd.’s ability to fulfil expectations in terms of service quality
46 % of the respondents state that Teo Lehtimäki Ltd. has been able to fulfil their
expectations well. 41 % of the respondents say that Teo Lehtimäki Ltd. has been
able to fulfil their expectations regarding the service quality extremely well, as
they used phrases such as ‘perfectly’, ‘100%’, ‘always’, ‘the service quality is im-
peccable’, ‘we are extremely satisfied’, ‘very good quality, no need for com-
plaints’, and so on. Although all of the respondents regarded the service quality to
be good in the first question, 14 % of the responses indicate that there is still room
for improvement, as they said that the company has fulfil their expectations ‘rea-
sonably’, ‘99%’ and ‘fairly well’. Since the main factor affecting customer satis-
faction is whether or not the expectations were fulfilled (Hutt & Speh 2010, 268),
based on the responses, Teo Lehtimäki Ltd.’s customers’ overall satisfaction level
can be regarded as good.
4. Expectations that Teo Lehtimäki Ltd. has not been able to fulfil
73 % of the respondents said either that there has not been such a situation or that
they cannot think of one. Five of the six respondents that did have expectations

144
that are not fulfilled said that the extranet -feature is the main thing that is missing
from the company’s offerings, and that other electronic services require updating
as well. One respondent mentioned that Rovaniemi often sends wrong products,
indicating that the Rovaniemi office should pay more attention to order handling.
5. Improvement suggestions in connection Teo Lehtimäki Ltd.’s service
59 % of the respondents did not have any improvement suggestions regarding the
company’s service, and the remaining 41 % pointed out that the electronic ser-
vices could be updated, the accuracy of order processing should be improved, and
the reachability could be better.
The main area of improvement is in the company’s electronic services as it was
mentioned by 78 % of the respondents who had improvement suggestions. They
said that acquiring the extranet -feature, which has been previously mentioned on
several occasions, would facilitate and speed up the ordering process as product
availability could be checked online. Currently all inquiries and orders are placed
either though phone or email, and as two respondents said that there is room for
improvement in Teo Lehtimäki Ltd.’s reachability, introducing the extranet -
feature would decrease the perceived sacrifices, as the customers could check
product availability and place orders without having to call the company and pos-
sibly wait in line or wait for them to call back. Therefore, the extranet -feature
would increase the total perceived value of the company’s offerings, and as it
would decrease the phone traffic, it would be a mutually beneficial investment.
In addition to the extranet -feature and better reachability, one respondent – the
same respondent who indicated in the previous question that they have received
wrong products on several occasions – pointed out that Rovaniemi should im-
prove the accuracy of order processing, as the customers also have a responsibility
to deliver the products to their customer on time, and if the delivered product is
not correct, it has a negative effect on the customer’s customer as well, as they
have to wait longer for the correct part (Gummesson 2002, 79).

145
6. Frequency of using Teo Lehtimäki Ltd.’s website
83 % of the respondents use the company’s website at least on monthly basis. Part
one identified which respondents perceive the website to be an important part of a
company’s service offering and the frequency of using Teo Lehtimäki Ltd.’s web-
site is illustrated in Figure 18 with the perceived importance.
Figure 18. Website usage frequency and importance of website
Two respondents who perceive the website to be an important part of a company’s
offerings use Teo Lehtimäki Ltd.’s website less frequently than once a month,
which might mean that the website does not offer them additional value or fulfil
their needs. On the other hand, one respondent who did not view website to be an
important part of a company’s offerings, uses Teo Lehtimäki Ltd.’s website once
a week, which can mean that they find it to add value to the offerings. The next
question seeks to find out the underlying reason for website usage and possible
improvement areas.
7. Describing Teo Lehtimäki Ltd.’s website
The majority of the respondents say that they are not satisfied with the website
and that improvements should be made. The main criticism assesses the outdated
layout; four respondents point out that the website is outdated and should be up-
dated to correspond to the current standard. Also the clarity of the website shares
opinions; five respondents perceive that the website is clear and easy to use
whereas three respondents think that they are incoherent and confusing. Three re-
2
4
6
7
2
1
0% 20% 40% 60% 80% 100%
less frequently
approximately once a month
once a week
several times a week
perceive website to be important do not perceive website to be important

146
spondents say that the website is useful as soon as they got the hang of it but state
that the layout could be clearer. One respondent point out that the product cata-
logue is easier to use for checking the product variety. On the other hand, the re-
spondents seem to be very satisfied with the content, which they describe as com-
prehensive, and point out that the website includes a lot of valuable information
including technical advice, useful installation instructions, and recommendations
on how to use the spare parts, which is a redeeming quality. One respondent
pointed out that the websites are also useful for their customers, as they can ex-
plore the product range before placing an order and find useful information re-
garding installation. However, the respondents also mention the missing extranet -
feature, which would provide added value for the customers. They list features of
extranet that would increase the perceived benefits; the ability to check product
availability online, search for spare parts by snowmobile model, check prices, as
well as place orders. Moreover, one respondent says that introducing a feature that
enables the customer to find a substituting product for a spare part with the origi-
nal product number would be an excellent addition.
86 % of the respondents perceive that the company’s website are an important
part of the service offering and can provide additional value to the customers (see
Hutt & Speh 2010, 216), and therefore, in order to increase the usefulness of the
website, the layout should be updated and improved to correspond to customers’
requirements. Moreover, also introducing the extranet -feature would significantly
increase the usefulness of the website and by making the requested improvements,
the company’s website would increase the effectiveness and usability of the offer-
ings (see Jones & Sasser 1995, 90).
8. The importance of a paper copy of Teo Lehtimäki Ltd.’s annual product cata-
logue
According to the responses, the paper version of the company’s annual product
catalogue provides added value for the customers and is perceived to be an im-
portant part of the company’s service offering by the majority of the respondents.

147
The distribution of the level of importance of receiving a paper copy of the cata-
logue is illustrated in Figure 19.
Figure 19. Importance of a paper copy of the product catalogue.
9. Only an online product catalogue
82 % of the respondents do not think that an online catalogue alone would be
enough. Four respondents, three of which said that receiving the paper version
was quite important, state that an online catalogue would suffice.
10. Improvement suggestions regarding Teo Lehtimäki Ltd.’s product catalogue
The main improvement suggestions relate to the layout of the catalogue, including
a clearer product catalogue and more product pictures. One respondent suggested
that the layout and structure of the catalogue could be similar to the one of Duell
Bike Center. The respondents also suggested what could be improved in terms of
the content of the catalogue, including an alphabetical index, which would facili-
tate the use of the catalogue, and having the original product number visible in the
catalogue to be able to compare products, and including the product’s aptitude to
the product information/description. The current catalogue does not include prices
and several customers hoped that the suggested retail price would be added to the
catalogue. By adding the requested features and making the suggested improve-
ments, the usefulness of the catalogue can be increased, which also makes the use
of the core solution more efficient or easy (see Jones & Sasser 1995, 90). On the
other hand, one respondent pointed out that they are extremely satisfied that they
59%
32% 4%
5% Very important
Quite important
Not very important
Not at all important

148
receive the product catalogue in Swedish as it provides them with added value
(see Hutt & Speh 216), and did not offer any suggestions for improvement.
Teo Lehtimäki Ltd.’s personnel
1. Teo Lehtimäki Ltd.’s personnel in comparison with other suppliers
The respondents were asked to compare Teo Lehtimäki Ltd. to other suppliers and
state their level of agreement (1=strongly disagree, 2=somewhat disagree,
3=neither disagree nor agree, 4=somewhat agree, 5=strongly agree) regarding cer-
tain characteristics of the personnel. The distribution of opinions is shown in Fig-
ure 20.
Figure 20. Characteristics of Teo Lehtimäki Ltd.’s personnel: level of agreement.
The overall performance of the personnel is good according to the responses. The
majority of the respondents regard the personnel to be competent and profession-
al, to have a better attitude, and to provide a reliable and consistent service, alt-
hough a few respondents did not completely agree. The personnel is regarded to
be polite and respectful and to offer better advice than other suppliers by the ma-
jority of the respondents. Moreover, the company seems to be more reachable
through email than phone, which indicates that there is room for improvement in
their reachability through phone. Respondents who neither agreed or disagreed
indicated that the statements fit the Kauhajoki office better than Rovaniemi.
0
0
0
3
1
2
3
2
8
9
11
7
10
13
9
10
14
13
11
12
11
7
11
10
0 2 4 6 8 10 12 14 16 18 20 22
offers better advice
is polite and respectful
is reachable through email
is reachable through phone
has enough knowledge about the market…provides a reliable and consistent service
has a better attitude
is more competent and professional
Neither agree or disagree Somewhat agree Completely agree

149
2. Describing Teo Lehtimäki Ltd.’s personnel
The respondents were asked to choose statements that they think describe Teo
Lehtimäki Ltd.’s personnel. 91 % of the respondents stated that phone calls are
responded to quickly or the customer is promptly called back. In the first part of
the questionnaire, reachability was considered to have the biggest impact on satis-
faction by 36 % of the respondents. 86 % of the respondents regarded the provid-
ed service as reliable and consistent, and 73 % felt that orders are delivered on
time. Although the company was perceived to respond faster to emails, 54 % did
not choose the alternative ‘emails are responded to promptly’ in this question,
meaning that also the reachability through email could be improved. 41 % if the
respondents contact the company for technical advice, indicating that the person-
nel is viewed as experts in their field. 32 % of the respondents perceive that cus-
tomers are kept up to date about important issues. One respondent previously sug-
gested that the company could send a newsletter once or twice a year informing
about new products and any possible changes in the company’s operations, which
would be a good idea as the majority of the respondents did not choose the alter-
native to describe Teo Lehtimäki Ltd.
3. Improvements in terms of personnel performance
Most of the respondents did not have any improvement suggestions. Two re-
spondents pointed out that Rovaniemi requires a little bit of training and technical
advice. One respondent, who chose Rovaniemi as their contact office, said that the
reachability is not very good during the high season, and suggested that the prob-
lem could be fixed by introducing the extranet -feature. Another respondent also
mentioned that increasing the amount of the company’s electronic services would
decrease the amount of phone calls. A third respondent also said that Rovaniemi
should improve their reachability.

150
4. Difference among offices
77 % of the total sample has been in contact with both offices, 47 % of which
have noticed a difference in their performance. Eight respondents perceived that
there are differences in the reachability of the different offices, and specified that
Kauhajoki is more reachable and answers better to phone calls. On the contrary,
nine respondents had not noticed a difference. Four respondents had noticed a dif-
ference in the willingness to provide the service, specifying that the Kauhajoki
office seems to be more willing to provide the service than Rovaniemi, whereas
13 had not. According to four respondents, also the reliability and consistency of
the service differs depending on the office, and Rovaniemi’s deliveries tend to
contain more defects and deficiencies. Five respondents state that they have per-
ceived a difference in personnel qualifications and that Kauhajoki is more compe-
tent. All in all, the respondents who perceive that there is a difference in the per-
formances among the two offices perceive Kauhajoki office to succeed better.
However, 53 % of the respondents who have been in contact with both offices
have not noticed a difference in their performance.
5. Teo Lehtimäki Ltd.’s personnel’s overall performance
The respondents were asked to rate the personnel’s overall performance on a scale
from 1 to 10, 1 being fail and 10 excellent. The average for the personnel’s overall
performance is 8.77 with a standard deviation of 0.75, meaning that the overall
performance is perceived to be very good and the difference between responses
was small. The most frequent answer was 9, which was answered by 12 respond-
ents. Three respondents gave 10 out of 10 for the personnel’s overall performance,
six gave an 8, and one rated the overall performance as 7. Consequently, the ma-
jority of the respondents are satisfied with the personnel’s overall performance,
however, there seems to be room for improvement as well.

151
Teo Lehtimäki Ltd. & satisfaction
1. Situations where the customers have been extremely satisfied with the provided
service
Situations where the customers have been extremely satisfied with the provided
service include for example the company responding quickly to product inquiries,
providing fast deliveries, offering useful technical advice, and being reachable.
Three respondents, however, could not think of a particular situation.
The respondents mentioned extraordinary services that excel in meeting customer
preferences or in solving their particular problems (Jones & Sasser 1995, 90). For
instance, one respondent said that they are extremely satisfied that they have been
able to pick up products during evenings and weekends, i.e. outside of the compa-
ny’s office hours. One respondent also mentioned that they are very satisfied that
Vesa is reachable outside of the office hours as well. Flexibility in the opening
hours and reachability makes the service easily accessable and therefore increases
the total perceived quality (Parasuraman et al. 1985, 47). Other responses also in-
dicate that the company generally responds fast to phone calls and emails.
One respondent points out two occasions when Teo Lehtimäki Ltd. has provided
them with exceptional service; when the ordered products were personally deliv-
ered to their shop without extra cost, and on the other occasion the company had
provided exceptional technical advice regarding a product they had ordered.
Moreover, 32 % of the respondents mentioned situations where they have re-
ceived exceptional advice regarding the suitability of the products, instalment, or
other kind of technical advice, and pointed out that the company stands out for
their expertise.
Fast deliveries seemed to be the main reason for satisfaction. For instance, one
respondent said that they had ordered a track mat in the afternoon and were sur-
prised as the product was delivered to them the next morning. Also another re-
spondent mentioned a similar situation where they had ordered a product in the

152
morning and received it during the same day. They point out that not many sup-
pliers are able to provide the same kind of service, indicating that Teo Lehtimäki
Ltd.’s fast deliveries add value for the customers and differentiate them from the
competition (Cox 2004; Walters & Lancaster 1999, 700). Moreover, several re-
spondents say that the company generally provides fast deliveries.
On the other hand, one respondent mentioned a situation where they had ordered a
product based on the information provided on the website and as the product was
not suitable after all, the company replaced the product and paid for the expenses.
Also another respondent said that in case they have had to return a product, it has
always been easy and effortless, which indicates that Teo Lehtimäki Ltd.’s recov-
ery process for fixing problems or bad experiences have a positive impact on sat-
isfaction (Jones & Sasser 1995, 90).
2. Situations where the customers have not been satisfied with the provided ser-
vice and how the situation was solved
77 % of the respondents had not experienced a situation where they have not been
satisfied with the provided service. The remaining 23 % listed situations where
they have not received correct products, delays in deliveries, and problems with
reachability during high season. One respondent said that he ordered springs from
the Rovaniemi office and they failed to deliver the right product three times,
which led the customer to purchase from the competitor. It seems as if the situa-
tion was not fixed, which indicates that the Rovaniemi office should put more ef-
fort in improving their recovery systems. On the other hand, another customer of
the Rovaniemi office also said that defective and incorrect deliveries have been
the main reason for dissatisfaction, but that the situation has normally been fixed
by the next day. Another complaint connected to deliveries includes the fact that
sometimes the deliveries take longer than expected. One respondent said that
reachability is not very good during high season and that the problem could be
fixed by introducing the extranet -feature.

153
3. Satisfaction related to Teo Lehtimäki Ltd.’s overall performance
Three respondents said to be extremely satisfied with the company’s overall per-
formance, and specified that the main reason is the excellent service they provide
as well as their expertise and vast knowledge of the market. 12 respondents are
very satisfied (=9) with the overall performance due to the service and fast deliv-
eries. Six respondents are satisfied (=8) and say that the totality is functional and
the relationship has been good. One respondent is somewhat satisfied (=7) and
said that Rovaniemi should improve their service. As a result, the overall satisfac-
tion is good (average 8.77) but certain aspects of the service offering should be
improved in order to reach a higher level of satisfaction.
4. Behavioral outcomes connected to satisfaction
The respondents were asked to choose behavioral outcomes that they perceive to
be accurate in their case, revealing the customers’ attitudes towards the company,
the customers’ expectations concerning the company’s future performance capa-
bilities, and the customers’ willingness to continue the relationship (Stauss &
Neuhaus 1997, 238). According to the responses, the respondents expect the rela-
tionship with Teo Lehtimäki Ltd. to last and regard the continuation to be im-
portant. The majority of the respondents state that they are very satisfied with the
overall performance, and 68 % of the respondents will encourage other companies
to use Teo Lehtimäki Ltd.’s services. The behavioral outcomes and the frequency
of responses are illustrated in Table 10.

154
Table 10. Behavioral outcomes connected to Teo Lehtimäki Ltd.
Behavior: Frequency
I expect the business relationship with Teo Lehtimäki Ltd. to last 22
I perceive the continuation of the business relationship to be important 19
I am very satisfied with Teo Lehtimäki Ltd.’s overall performance 16
I will encourage other companies to use Teo Lehtimäki Ltd.’s services 15
I will maintain the relationship with Teo Lehtimäki Ltd. 15
I will tell positive things about Teo Lehtimäki Ltd. to other companies 14
I highly recommend Teo Lehtimäki Ltd. to other companies 11
I will do more business with Teo Lehtimäki Ltd. in the coming years 10
I would continue doing business with Teo Lehtimäki Ltd. even if prices
increased slightly
10
I compare other companies to Teo Lehtimäki Ltd.’s performance 8
None of the above 0
8.4 Summary and conclusions
The main findings of the research are presented in this chapter and the conclu-
sions and suggestions for the case company are made. The research had four main
research questions that the research aimed to answer, and they are addressed one-
by-one.
1. What are quality and value as perceived by the key decision makers in the busi-
ness relationship?
Customer perceptions regarding quality were identified by asking them to de-
scribe good service quality. Reachability and the consistency and reliability of the
deliveries were the two most frequently mentioned determinants of service quality
(Parasuraman et al. 1988, 46–47). In a business-to-business context, the most im-
portant feature of service quality was the supplier’s ability to deliver products on
time, as the customers have the responsibility to deliver them to their customers as
promised (Gummesson 2002). Other definitions of quality included characteristics
of the personnel such as their expertise and extensive knowledge regarding the

155
market and products, and thereby their ability as well as their willingness to pro-
vide technical advice if necessary (Parasuraman et al. 1988, 46–47). Good service
quality was also described as taking the customer’s individual needs and requests
into account and providing a personalized service. Quality was also defined as
‘zero defects – doing it right the first time’ (Zeithaml 1988), or alternatively, as
the ability to fix problems fast in case of service failures (Jones & Sasser 1995). In
general, quality was defined as a good service that fulfils the customers’ expecta-
tions and offers them added value.
Value was defined in terms of what factors affect the choice of supplier, since cus-
tomers choose a supplier whose offerings enhance the customer perceived value
(Walters & Lancaster 1999, 697). The majority of the respondents listed product
variety and availability as the most important factors distinguishing the supplier
from its competitors. Customers choose a supplier based on their ability to fulfil
their needs (Levitt 1980), and having a good product variety that corresponds to
customer needs and requirements as well as good availability of those products
increases the total perceived value. Also the quality of the products was viewed
important as it reduces the perceived sacrifices since the risk of having to put time
and effort into filing complaints is reduced by ensuring good product quality
(Zeithaml 1988). Perceived value also depends on the price of the offering and the
respondents frequently mentioned a good price-quality or reasonably priced prod-
ucts as an important factor in choosing a supplier (Zeithaml 1988). Moreover, also
features of service quality were mentioned in terms of the supplier’s knowledge of
the market and their ability to provide assistance and technical advice. Therefore,
the best way to add more value to the core product is by improving the service
quality and including supporting services (Ravald & Grönroos 1996, 19), without
neglecting the importance of a good price-quality ratio of the products.
2. What kind of expectations and requirements do the customers have?
Generally, the customers expect to receive what was promised when was prom-
ised (Grönroos 2007), and the company is perceived to succeed in this well. The

156
customers’ quality and value definitions also provide insight into what kind of ex-
pectations and requirements they have, indicating that customers generally expect
to receive a good service, get the ordered products delivered on time, and to re-
ceive free customer service and technical advice when necessary.
Customers also listed different requirements regarding the offered services that
would improve the company’s future performance capability and add value to
their offerings, and the main improvement suggestions that were mentioned in the
responses included updating the company’s electronic services to the competitors’
level, mainly referring to the extranet -feature, as well as other communication
materials, such as the product catalogue, and also a newsletter informing about
new products and any possible changes in the company’s operations was request-
ed to be sent once or twice a year to keep the customers up-to-date about im-
portant matters. Other areas of improvement included invoicing accuracy and or-
der handling. Moreover, the customers requested some additions to be made to the
product variety in order to increase the total perceived value of the offering.
The main area of improvement is in the company’s electronic services as it was
mentioned by 78 % of the respondents who had improvement suggestions. They
suggested that acquiring the extranet -feature, which was mentioned in several
other context as well, would facilitate and speed up the ordering process as prod-
uct availability could be checked online. Currently all inquiries and orders are
placed either though phone or email, and as there was some criticism regarding
the company’s reachability during high season, introducing the extranet -feature
would decrease the customer perceived sacrifices, as the customers could check
product availability and place orders without having to call the company and pos-
sibly wait in line or wait for them to call back. Other benefits of the extranet -
feature include the ability to search for spare parts by snowmobile model and to
check prices. Also introducing a feature that enables the customer to find a substi-
tuting product for a spare part with the original product number was proposed as it
would be an excellent addition that adds value to the offerings. Therefore, the ex-

157
tranet -feature would increase the total perceived value of the company’s offerings
and as it would also decrease the phone traffic, it would be a mutually beneficial
investment.
Also the company’s website was perceived to require some improvements and the
main criticism assessed the outdated layout of the website and the customers
pointed out that it should be updated to correspond to the current standard. Alt-
hough the content of the website was describes as comprehensive and it was per-
ceived to include a lot of valuable information including technical advice, installa-
tion instructions, and recommendations on how to use the spare parts, some re-
spondents suggested that the layout should also be clearer so that website would
be easier to use. As the company’s website can be seen as a basic support service
that increases the effectiveness and usability of the product or service (Jones &
Sasser 1995, 90), the added value can be increased by improving the usefulness of
the website according to the customers’ suggestions.
Other communication materials, including the product catalogue, was also per-
ceived to require improvements in order to maximize its added value. The cus-
tomers hope for a clearer product catalogue with more product pictures and they
suggested that the layout and structure of the catalogue could be similar to the one
of Duell Bike Center. Distinct features of the catalogue that were mentioned in-
cluded an alphabetical index, which would facilitate the use of the catalogue, also
having the original product number visible in the catalogue was requested so that
the customers would be able to compare products, and some customers suggested
including the product’s aptitude to the product description. Moreover, the current
catalogue does not include prices and including the prices as well as the suggested
retail price to the catalogue was requested by several customers. By adding the
requested features and making the suggested improvements, the usefulness of the
catalogue can be increased, which also makes the use of the core solution more
efficient or easy (see Jones & Sasser 1995, 90).

158
Some responses also indicate that the company should improve their invoicing
accuracy, as the invoices were said to sometimes arrive late and occasionally in-
clude errors. By improving their invoicing accuracy, unnecessary customer sacri-
fices are minimized and the total perceived quality thereby increased. Moreover,
the results also imply that the Rovaniemi office should focus on improving the
accuracy of their order handling and processing as they were perceived to send
wrong products on several occasions, which also has a negative effect on the cus-
tomer’s customer, as also they have to wait longer for the correct part
(Gummesson 2002, 79). Sending out correct products is regarded as the basic el-
ements of the service that all competitors are expected to provide (Jones & Sasser
1995, 90), and it is essential that the situation is corrected.
Moreover, although the majority of the respondents regard the product quality to
be good and even excellent, the results also indicate that some products are of
lower quality, mainly referring to the durability of the products, therefore, Teo
Lehtimäki Ltd. could look into replacing the products that are not very durable
with a better alternative if possible, in order to increase the perceived value of
their offerings. Customers also requested some additions to be made to the prod-
uct range, including drive belts, investing in better quality ski runners, extending
to ATV spare parts, adding more electric parts, and increasing the variety of spare
parts for new snowmobile models. Also the increasing demand for reasonably
priced exhaust systems, namely power pipes, was mentioned and the company
could look into investing in those.
3. To what extent are the customers satisfied with the current service quality and
how could the service quality be improved to fit customer requirements better?
The majority of the respondents are satisfied with the provided service and the
company’s overall performance was rated on average as 8.77/10. The standard
deviation was 0.75, meaning that the difference between responses is not signifi-
cant. In general, the customers are satisfied with the provided service quality, and
have pointed out features such as the company’s fast deliveries, the personnel’s

159
expertise and willingness to provide the service, and their reachability. Although
the customers were generally satisfied with the provided service, the results also
brought up possible areas of improvement. According to the answers, the re-
spondents are very satisfied with the service that the Kauhajoki office provides.
However, respondents who expressed their dissatisfaction specified that the main
reason is the difference in service quality between the two offices, and that the
main areas of improvement for the Rovaniemi office would be in their reachabil-
ity and willingness to provide the service as well as in their order and delivery
management as the deliveries tend to contain more defects and deficiencies. Some
suggested training for the Rovaniemi office so that their ability to provide tech-
nical advice would be updated to the Kauhajoki office’s standard. Moreover, the
company is generally perceived to be more reachable through email than phone,
which indicates that the company’s reachability through phone could be slightly
improved.
4. What has the biggest impact on customer satisfaction?
According to the results, the totality of the services, products, and pricing has the
biggest impact on the customers’ satisfaction. The customers evaluate both the
benefits and the sacrifices of the offerings, and mentioned also a few relationship
benefits in their responses, such as confidence and special treatment (Gwinner et
al. 1988, 101–114). Benefits that were perceived to have the biggest impact on
satisfaction included good service quality, the reliability and consistency of the
service, good product variety and the good price-quality ratio of those products,
and most importantly, on-time deliveries. As the company’s customers consist of
retailers who have a responsibility to deliver the products to their customers on
time (Gummesson 2002), the reliable and on-time deliveries seemed to have the
biggest impact on their satisfaction. Moreover, the customers value a supplier who
is able to provide a personalized service and has the ability to solve any problems
the customer is facing. The ability to provide technical advice was identified as an
important value driver and although Teo Lehtimäki Ltd. was already perceived to

160
provide good technical advice, by reinforcing it the value of their offerings can be
increased (Walters & Lancaster 1999, 700). Some respondents mentioned sacri-
fices, including mostly the monetary sacrifice of the offerings as well as time and
effort required from the customer’s part when service failures occur (Kotler &
Keller 2012; Petrick 2002, 123). Consequently, Teo Lehtimäki Ltd. can reinforce
customer satisfaction by continuing to ensure that deliveries are sent on time, con-
tinuously improving their service quality in general to avoid any mistakes from
happening, and striving to treat the customers as individuals and find solutions to
their individual problems and needs.

161
9 RELIABILITY AND VALIDITY
As the research results should not be assumed to provide the ultimate truth, the
reliability and validity issues of the research should be evaluated (Churchill &
Iacobucci 2010, 7).
The reliability of a research refers to its ability to provide similar results if the re-
search was repeated under similar conditions. Reliability is the consistency of the
responses, and the less variability there is, the more reliable the measure is. (Bor-
dens & Abbott 2011, 130; Burns & Bush 2001, 329.) There are several methods
for assessing the reliability of a measure, such as test-retest, equivalent forms, and
split-half. The idea behind the test-retest reliability is to repeat the same question
later on, i.e. retest the same phenomena, and compare the responses. Equivalent
forms reliability measures the reliability of the responses by using equivalent
questions, meaning that the questions might have different wording but they
measure the same phenomena, to see if the respondents answer them identically.
Split-half reliability includes splitting the sample into half and comparing their
responses among the two groups to ensure that they are consistent. (Burns & Bush
2001, 330–331.) The reliability assessment method used in this research was
equivalent forms reliability, where similar questions were asked in the question-
naire to ensure that the respondents are consistent in their answers. For instance,
‘How well do you perceive Teo Lehtimäki Ltd. to fulfil your expectations?’ and
‘What kind of expectations has Teo Lehtimäki Ltd. not been able to fulfil?’ both
measure whether the customers perceive that the company is able to fulfil their
expectations but use different wording. Therefore, the responses should also be
equivalent, meaning that if a respondent feels that Teo Lehtimäki Ltd. has been
able to fulfil their expectations extremely well, there should not be expectations
they have not fulfilled, and the other way around.
When assessing the validity of a research, normally two perspectives are taken
into consideration: internal and external validity. Internal validity refers to the de-
gree to which the research measured what it was designed to measure, and the re-

162
search is internally valid if it measured what it was supposed to, and external va-
lidity refers to the degree to which the research results can be generalized to a
larger population. (Bordens & Abbott 2011, 114, 118, 133.) The aim of the con-
ducted research was to measure the current customer satisfaction levels in connec-
tion with the provided service quality, and to reveal the customers’ perceptions of
the value of the services as well as the value of the entire business relationship.
The results indicate that the research has internal validity since it measured what it
was supposed to measure and the results provide an answer to all the research
questions. The research has external validity as well and the results can be gener-
alized to the entire population as the responses were consistent with each other
and differences in the perceived service quality or satisfaction was minor.
Moreover, the validity of a research can be assessed by evaluating the accuracy of
the measurement instrument used in the research. There are several different ap-
proaches, such as face, predictive, and convergent validity, for evaluating the va-
lidity of a measurement. (Burns & Bush 2001, 332.) Face validity refers to how
well a measurement instrument appears to measure what it is supposed to meas-
ure. The face validity of a question is evaluated by its appearance, which is a sub-
jective assessment made by the researcher and therefore it is also the weakest as-
sessment method. (Bordens & Abbott 2011, 133; Burns & Bush 2001, 333.) Pre-
dictive validity is concerned with the extent to which a question predicts or relates
to other questions, and whether it predicts another measure as is expected. For in-
stance, a respondent who answers that it is very important to receive a paper copy
of Teo Lehtimäki Ltd.’s annual product catalogue, should answer in the negative
to the question that asks if a mere online product catalogue would suffice. If the
(researcher’s) logical predictions are supported by the findings, predictive validity
has been established. Convergent validity is evaluated by using two different data
collection methods to obtain the same information. For instance, if the results of
the questionnaire were to be supported with a face-to-face interview, the research
would have convergent validity. (Burns & Bush 2001, 333–334.)

163
10 SUGGESTIONS TO FUTURE RESEARCH
Since the aim of the research was to find out how customer satisfaction could be
increased by providing better value for the customers, and the research results
provide the case company the means to do so, a follow-up research could be con-
ducted in the future in order to find out how well the company was able to imple-
ment the changes and to see if there is a difference in satisfaction levels.
Moreover, since the sample size was quite small and specific, the research aiming
to find out the company’s most valuable customers’ perceptions of the offerings
and the relationship in general, a wider research could be carried out in order to
find out the actual percentage of the company’s customers who are satisfied. The
same questionnaire template could be used focusing mainly on part two that con-
centrates on Teo Lehtimäki Ltd.’s performance.
Furthermore, as only 9 % of the respondents were customers of the Rovaniemi
office, a separate research using the same questionnaire template could be imple-
mented with a sample consisting of solely Rovaniemi’s customers. The research
could provide more insight into how big of a percentage of their customers agree
on the improvement areas that were identified in this research and would provide
the office with a more comprehensive list of improvements. Moreover, as the
Rovaniemi office was mainly brought up in the context of negative disconfirma-
tion, a research with a bigger sample might also bring up features that they are
currently excelling in.
And lastly, the company also exports its products to retailers in Sweden, Norway,
Estonia, Russia, and the European Alps region, and it would be interesting to see
what kind of differences international customers perceive in the service quality
and the company’s offerings. As the questionnaire is already translated into Eng-
lish, the necessary material for conducting the research is already prepared and
therefore would not require as much resources as this study.

164
REFERENCES
Anderson, E. W. & Sullivan, M. W. 1993. The Antecedents and Consequences of Customer Satisfaction for Firms. Marketing Science Vol 12.
Anderson, E. W., Fornell, C. & Lehmann, D. R. 1994. Customer Satisfaction, Market Share, and Profitability. Journal of Marketing Vol 58, Pp. 53-66.
Anderson, J. C. & Narus, J. A. 1998. Business Marketing: Understand What Cus-tomers Value. Harvard Business Review.
Athanasopoulou, P. 2009. Relationship Quality: A Critical Literature Review and Research Agenda. European Journal of Marketing, Vol. 43 Pp. 583-610.
Bernard, R. H. 2006. Research Methods in Anthropology: Qualitative and Quanti-tative Approaches. 4th Edition. Altamira Press.
Berry, L. L. 1983. Relationship Marketing. Emerging Perspectives on Services Marketing. Pp. 25–28 Chicago: American Marketing Association.
Birks, D. & Malhotra, N. 2007. Marketing Research: An Applied Approach. 3rd Ed. Essex. Pearson Education Limited.
Blythe, J. 2012. Essentials of Marketing. 5th Edition. Pearson Education.
Boksberger, P. E. & Melsen, L. 2009. Perceived Value: A Critical Examination of Definitions, Concepts and Measures for the Service Industry. Journal of Service Marketing 2011, pp. 229–240. Emerald Group Publishing Limited.
Boulding, W., Kalra, A., Staelin, R. & Zeithaml, V. A. 1993. A Dynamic Process Model of Service Quality: From Expectations to Behavioral Intentions. Journal of Marketing Research, Vol 30, Pp. 7-27.
Brassington, F. & Pettitt, S. 2007. Essentials of Marketing. Pearson Education.
Bryman, A. & Bell, E. 2015. Business Research Methods. 4th Edition. Oxford University Press.
Buchanan, R. & Gilles, C. 1990. Value Managed Relationship: The Key to Cus-tomer Retention and Profitability. European Management Journal, Vol 8, No 4, 1990.
Burns, A. C. & Bush, R. F. 2001. Marketing Research. 3rd Edition. Prentice Hall, Inc.
Burns, A. C. & Bush, R. F. 2003. Marketing Research: Online Research Applica-tions. 4th Edition. Pearson Education, Inc. Prentice Hall, Inc.

165
Buttle, Francis. 2009. Customer Relationship Management: Concept and Tech-nologies. 2nd Ed. Oxford. Elsevier Ltd.
Churchill, A. G. & Iacobucci, D. 2010. Marketing Research: Methodological Foundations. 10th Edition. Canada. South-Western Cengage Learning.
Cox, A. 2004. Business Relationship Alignment: On the Commensurability of Value Capture and Mutuality in Buyer and Supplier Exchange. Supply Chain Management: An International Journal, Vol 9. Emerald Group Publishing Ltd. ProQuest Ebrary.
Crosby, L. A. & Stephens, N. 1987. Effects of Relationship Marketing on Satis-faction, Retention, and Prices in the Life Insurance Industry. Journal of Marketing Research, Vol. 24, No. 4. pp. 404-411.
Dawkins, P. M. & Reichheld, F. F. 1990. Customer Retention as a Competitive Weapon. Directors and Boards Vol 4, Pp. 42-7.
Day, G. S. 2000. Managing Market Relationships. Academy Of Marketing Sci-ence 28, Pp. 24-30.
Eggert, A. & Ulaga, W. 2002. Customer Perceived Value: A Substitute For Satis-faction In Business Markets? The Journal of Business & Industrial Marketing. DOI: 10.1108/08858620210419754
Erikson, D., Hilletoft, P. & Hilmola, O-P. 2013. Creating Value through Whole-saler and Retailer Interface. Industrial Management & Data Systems, Vol 113. Www.Emeraldinsight.Com/0263-5577.Htm
Fornell, C., Johnson, M. D., Anderson, E. W., Cha, J. & Bryant, B. B. 1996. The American Customer Satisfaction Index: Nature, Purpose, and Findings. Journal of Marketing, 60(4): 7-18.
Gertz, D. & Baptista, J. 1995. Grow To Be Great: Breaking The Downsizing Cy-cle. New York: The Free Press.
Gordon, I. H. 1999. Relationship Marketing: New Strategies, Techniques And Technologies To Win The Customers You Want And Keep Them Forever. John Wiley & Sons Canada.
Grönroos, C. 2007. Service Management and Marketing: Customer Management in Service Competition. 3rd Edition. Jon Wiley & Sons Ltd.
Gummesson, E. 2002. Total Relationship Marketing. 32nd Edition. Butterworth-Heinemann, Oxford, UK.

166
Gwinner, K. P., Gremler, D. D. & Bitner, M. J. 1988. Relational Benefits In Ser-vice Industries: The Customer’s Perspective. Journal of the Academy Of Market-ing Science 26. 101-114.
Heskett, J. L., Sasser, W. E. & Hart, C. W. L. 1990. Breaktrhough Service. The Free Press, New York.
Hines, P., Lamming, P., Jones, D., Cousins, P. & Rich, N. 2000. Value Stream Management: Strategy and Excellence in the Supply Chain. Financial Times. Prentice Hall, London.
Holmlund, M. 1997. Perceived Quality in Business Relationships. Swedish School Of Economics and Business Administration.
Hutt, M. D. & Speh, T. W. 2010. Business Marketing Management: B2B. 10th Edition. South-Western, Cengage Learning.
ISO 9000:2005. Quality Management Systems — Fundamentals and Vocabulary. Https://Www.Iso.Org/Obp/Ui/#Iso:Std:Iso:9000:Ed-3:V1:En
Johannes, S. 2013. SAP CRM: Technical Principles and Programming. 1st Edi-tion. Maryland, United States.
Jones, T. O. & Sasser, W. E. Jr. 1995. Why Satisfied Customers Defect. Harvard Business Review.
Kolb. B. 2008. Marketing Research: A Practical Approach. SAGE.
Kotler, P. & Armstrong, G. 2010. Principles of Marketing. Pearson Education.
Kotler, P. & Keller, K. L. 2012. Marketing Management. 14th Edition. Pearson Education Limited.
Kotler, P. 1991. Marketing Management – Analysis, Planning, Implementation and Control. 7th Edition. Englewood Cliffs, N.J Prentice-Hall.
Kovac, M., Chernoff, J., Denneen, J. & Mukharji, P. 2009. Balancing Customer Service and Satisfaction. Harvard Business Review. Https://Hbr.Org/2009/03/Strike-A-Balance-Between-Custo
Kumar, V. 2010. Customer Relationship Management. Part 1. Marketing Strategy. John Wiley & Sons, Ltd. DOI: 10.1002/9781444316568.Wiem01015.
Leventhal, R. C. 2006. Journal of Marketing: Customer Loyalty, Retention, and Customer Relationship Management. Emerald Group Publishing Ltd. ProQuest Ebrary.

167
Levitt, T. 1980. Marketing Success Through Differentiation – Of Anything. Har-vard Business Review. Https://Hbr.Org/1980/01/Marketing-Success-Through-Differentiation-Of-Anything
Liljander, V. & Strandvik, T. 1995. The Relation between Service Quality, Satis-faction and Intentions.
Lindgreen, A. And Wynstra, F. 2005. Value In Business Markets: What Do We Know? Where Are We Going? Industrial Marketing Management 34.
Lovelock, C. & Gummesson, E. 2004. Whither Services Marketing? In Search Of a New Paradigm and Fresh Perspectives. Journal of Services Research Vol 7, Pp. 20-41.
Menon, A., Homburg, C. & Beutin, N. 2005. Understanding Customer Value in Business-To-Business Relationships. Journal of Business-To-Business Marketing 12.
Molinari, L. K., Abratt, R. & Dion, P. 2008. Satisfaction, Quality and Value and Effects on Repurchase and Positive Word-Of-Mouth Behavioral Intentions in A B2B Services Context. Journal of Services Marketing, Vol 22, Pp. 363-373.
Monroe, K. B. 1991. Pricing – Making Profitable Decisions. McGraw-Hill, New York, NY.
Morgan, R. M. & Shelby D. Hunt, S. D. 1994. The Commitment-Trust Theory of Relationship Marketing. Journal of Marketing, 58 (3), 20-38.
Moscoso, P. G. & Lago, A. 2011. Desarrollo De Un Modelo De Servicios Innovador Para Un Crecimiento Rentable. IESE Business School Universidad De Navarra. Http://Www.Iese.Edu/Research/Pdfs/Op-0197.Pdf
Nair, S. R. 2009. Marketing Research. Himalaya Publishing House. Mumbai, In-dia.
Ojasalo, J. 1999. Quality Dynamics in Professional Services. Hanken Swedish School of Economics Finland.
Oliver, R. 1981. Measurement and Evaluation of Satisfaction Process in Retail Settings. Journal of Retailing 57.
Parasuraman, A. Zeithaml, V. A., & Berry, L. L. 1985. A Conceptual Model of Service Quality and Its Implications for Future Research. Journal of Marketing Vol 49.

168
Parasuraman, A. Zeithaml, V. A., & Berry, L. L. 1988. SERVQUAL: A Multiple Item Scale for Measuring Consumers’ Perceptions of Service Quality. Journal of Retailing Vol 64.
Patterson, P. G., Johnson, L. W. & Spreng, R. A. 1997. Modeling the Determi-nants of Customer Satisfaction for Business-To-Business Professional Services. Journal of the Academy Of Marketing Science, Vol 25, Pp. 4-17.
Payne, A. & Frow, P. 2005. A Strategic Framework for Customer Relationship Management. Journal of Marketing, 69 (4), 167–176.
Peppers, D. & Rogers, M. 2005. Customers Don’t Grow In Trees. Fast Company. 25-26.
Petrick, J. F. 2002. Development of a Multi-Dimensional Scale for Measuring the Perceived Value of a Service. Journal of Leisure Research, Vol 34.
Reiccheld, F. & Sasser, W. 1990. Zero Defections: Quality Comes To Services. Harvard Business Review. Https://Hbr.Org/1990/09/Zero-Defections-Quality-Comes-To-Services/Ar/1
Rouse, M. 2014. Customer Relationship Marketing. Http://Searchcrm.Techtarget.Com/Definition/CRM
Smith, S. 2012. Customer Expectations: 7 Types All Exceptional Researchers Must Understand. Qualtrics, LLC. Https://Www.Qualtrics.Com/Blog/Customer-Expectations/
Stauss, B. & Neuhaus, P. 1997. The Qualitative Satisfaction Model. International Journal of Service Industry Management. Vol 8, Pp 236-249.
Stevens, B. 1992. Research Notes and Communications: Price Value Perceptions of Travelers. Journal of Travel Research, 31.
Stone, M. & Woodcock, N. 1995. Relationship Marketing. Kogan Page, London, UK.
Storbacka, K., Strandvik, T. & Grönroos, C. 1994. Managing Customer Relation-ship for Profit: The Dynamics of Relationship Quality. International Journal of Service Industry Management, Vol 5, No 5, 1994, Pp 21-28.
Trivedi, M. 2014. Relationship Management. 1st Edition. Amazon International.
Walters, D. & Lancaster, G. 1999. Value-Based Marketing and Its Usefulness to Customers. Management Decision, Pp. 697-708. University Press.

169
Woodruff, R. B. & Gardial, S. F. 1996. Know Your Customer: New Approaches To Understanding Customer Value And Satisfaction. Blackwell, Cambridge, MA.
Zeithaml, V. A. 1988. Consumer Perceptions of Price, Quality and Value: A Means-End Model and Synthesis of Evidence. Journal of Marketing. Vol 52.
Zeithaml, V. A., Berry, L. L. & Parasuraman, A. 1993. The Nature and Determi-nants of Customer Expectations of Service. Journal of the Academy Of Marketing Science, 21 (winter), 1-12.
Zineldin, M. 1999. Exploring the Common Ground of Total Relationship Man-agement (TRM) and Total Quality Management (TQM). Management Decision Vol 37. Http://Dx.Doi.Org/10.1108/00251749910299138

170
APPENDIX 1
Teo Lehtimäki Oy:n asiakastyytyväisyys
Tutkimuksen tarkoitus
Tutkimuksen tarkoituksena on selvittää Teo Lehtimäki Oy:n asiakkaiden
tyytyväisyystaso, sekä taustalla vaikuttavat seikat.
Kysely koostuu kahdesta osasta; ensimmäisessä osassa pyritään määrittelemään mitkä
seikat vaikuttavat asiakkaan kokemaan laatuun ja arvoon yleisellä tasolla, ja toinen osa
keskittyy selvittämään missä määrin Teo Lehtimäki Oy täyttää asiakkaiden odotukset
sekä miten tyytyväisiä asiakkaat ovat palvelun laatuun ja siihen liittyviin seikkoihin.
Muutamien taustaseikkojen selvittämisestä huolimatta, vastaajien nimettömyyttä
vaalitaan, eikä vastauksia luovuteta suoraan yritykselle.
Vastaajat jaetaan ryhmiin asiakassuhteen pituuden sekä ostotapahtumien määrän ja
tiheyden perusteella. Parannusehdotukset välitetään eteenpäin sen mukaan, kumman
toimipisteen kanssa ollaan pääosin tekemisissä.
Parhaan tuloksen saamiseksi tutkimus on monipuolinen ja laaja, mikä myös tarkoittaa
sitä, että vastaamiseen saattaa kulua tovi. Toivoisin kuitenkin, että käyttäisitte kunnolla
aikaa kyselyyn vastaamiseen sekä kysymysten miettimiseen. Jos jokin kohta on epäselvä
tai herättää kysymyksiä, älkää epäröikö ottaa minuun yhteyttä sähköpostitse: (tutkijan
sähköposti)
Iso kiitos jo etukäteen kaikille vastanneille. Toivomme, että kysely toisi esille
mahdollisimman paljon parannus- ja kehitysideoita, jotta Teo Lehtimäki Oy saisi
valmiudet parantaa palvelujensa laatua ja siten asiakastyytyväisyyttä.
Haluan vielä korostaa, että kaikenlaiset parannusehdotukset ovat tervetulleita, ja jos niitä
tulee mieleen vielä kyselyn täyttämisen jälkeen, saa niitä vapaasti lähettää minulle
sähköpostitse!

171
Asiakkaan taustatiedot
Taustatietojen perusteella asiakkaat luokitellaan eri ryhmiin tulosten analysointivaiheessa.
Siksi onkin erittäin tärkeää, että taustatiedot ovat oikein.
1. Kuinka pitkään olette olleet Teo Lehtimäki Oy:n asiakkaana? (Liikesuhteen
alkamispäivämäärä tai mahdollisimman tarkka arvio liikesuhteen pituudesta)
2. Kuinka usein tilaatte tuotteita Teo Lehtimäki Oy:ltä?
□ Useita kertoja viikossa
□ Kerran viikossa
□ 2–3 kertaa kuukaudessa
□ Noin kerran kuukaudessa
□ Harvemmin
3. Kuinka suurella summalla tilaatte varaosia Teo Lehtimäki Oy:ltä vuodessa?
4. Kumman toimipisteen kanssa olette pääosin tekemisissä?
□ Kauhajoki
□ Rovaniemi

172
OSA 1: laatu, arvo ja tyytyväisyys yleisellä tasolla
Tämä osio pyrkii kartoittamaan asiakkaiden näkökulmia siihen, mitä hyvä palvelu pitää
sisällään, missä määrin tuotevalikoima ja henkilökunta vaikuttavat tavarantoimittajan
valintaan, sekä missä määrin tyytyväisyys vaikuttaa liikesuhteen jatkumiseen. Osio
sisältää neljä eri aihealuetta: toimittajan valinta, laatu, henkilöstö, ja tyytyväisyys.
Toimittajan valinta
1. Mitkä seikat päällimmäisenä vaikuttavat tavarantoimittajan valintaan*? Kertokaa
vapaasti omin sanoin.
2. Voisitteko lyhyesti kuvailla omin sanoin millaista hyvä palvelu on teidän mielestänne
ja mikä sille on ominaista?
3. Kuinka tärkeiksi koette seuraavat seikat tavarantoimittajan valinnassa*? (1=ei
ollenkaan tärkeää, 2=ei oikein tärkeää, 3=neutraali, 4=melko tärkeää, 5=erittäin tärkeää)
3.1. Tavarantoimittaja tarjoaa hinta-laatu suhteeltaan parempia tuotteita ja palveluja
3.2. Tavarantoimittaja tarjoaa parempia palveluja kilpailukykyiseen hintaan
3.3. Tavarantoimittaja tarjoaa parhaat alennukset ja maksuehdot
3.4. Tavarantoimittaja tarjoaa vastinetta rahalle
3.5. Tavarantoimittaja tarjoaa kilpailukykyiset hinnat
3.6. Tavarantoimittaja kykenee tarjoamaan tuotteita ja palveluja silloin
kun asiakas niitä tarvitsee
3.7. Tavarantoimittaja tarjoaa helppokäyttöisiä tuotteita
3.8. Tavarantoimittaja tuntee asiakkaat ja heidän tarpeensa
3.9. Tavarantoimittaja on asiantuntija alallaan
3.10. Tavarantoimittaja tarjoaa parhaat neuvot
3.11. Tavarantoimittaja tarjoaa henkilökohtaista palvelua
4. Mikä edellä mainituista seikoista on teidän mielestänne tärkein kriteeri
tavarantoimittajan valinnassa*?
*Tavarantoimittajan valinnalla viitataan asiakkaan halukkuuteen valita tietty toimittaja kilpailijoiden
joukosta, sekä asiakkaan halukkuuteen valita kyseinen toimittaja uudelleen. (HUOM! tämä pätee myös
muiden osioiden kysymyksiin, joissa viitataan "tavarantoimittajan valintaan")

173
Laatu
1. Mikä on teidän mielestänne ominaista hyvälle tuotteelle tai tuotevalikoimalle?
2. Miten tärkeiksi koette seuraavat tuotevalikoimaan liittyvät seikat tavarantoimittajan
valinnassa? (1=ei ollenkaan tärkeää, 2=ei oikein tärkeää, 3=neutraali, 4=melko tärkeää,
5=erittäin tärkeää)
2.1. Tuotteiden kestävyys
2.2. Tuotteiden sopivuus tarpeisiimme
2.3. Tuotteiden helppokäyttöisyys
2.4. Tuotteiden saatavuus
2.5. Tuotteiden laatu
2.6. Tuotevalikoiman monipuolisuus
2.7. Tuotteiden hyvä hinta-laatu suhde
2.8. Tuotteista ajan mittaan saatu voitto
3. Miten paljon tuotevalikoima vaikuttaa tavarantoimittajan valintaan?
□ Erittäin vähän
□ Melko vähän
□ Ei paljon eikä vähän
□ Melko paljon
□ Erittäin paljon
4. Voisitteko valita tavarantoimittajan pelkän tuotevalikoiman perusteella?
□ Kyllä □ En
5. Kuinka oikeassa seuraava väittämä on kohdallanne: Suosin tavarantoimittajaa, joka...
(1=täysin väärässä, 2=melko väärässä, 3=ei oikeassa eikä väärässä, 4=melko oikeassa,
5=täysin oikeassa)
5.1. ...erottuu kilpailijoiden keskuudessa asiantuntemuksellaan
5.2. ...erottuu kyvyllään tarjota järjestelmällisiä ratkaisuja ongelmiimme
5.3. ...pyrkii ymmärtämään ja vastaamaan asiakkaan tarpeisiin
5.4. ...tarjoaa nopeaa ja joustavaa palvelua
5.5. ...onnistuu ensimmäisellä kerralla tarjoamaan laadukasta palvelua
5.6. ...täyttää johdonmukaisesti tilausten luvatut toimituspäivät
5.7. ...laskuttaa virheettömästi ja laskut ovat luotettavia
5.8. ...vastaa nopeasti ja perusteellisesti valituksiin
5.9. ...tarjoaa lisäksi teknistä neuvontaa
6. Koetteko, että yrityksen nettisivut ovat tärkeä osa palveluvalikoimaa?
□ Kyllä □ En

174
Henkilöstö
1. Miten kuvailisitte hyvää asiakaspalvelijaa?
2. Miten suuri vaikutus seuraavilla henkilöstön ominaisuuksilla on tavarantoimittajan
valinnassa? (1=erittäin pieni, 2=melko pieni, 3=ei suuri eikä pieni, 4=melko suuri,
5=erittäin suuri) Miksi?
2.1. Palvelun luotettavuus ja yhdenmukaisuus
2.2. Henkilöstön asenne ja palvelualttius
2.3. Henkilöstön pätevyys ja ammattitaitoisuus
2.4. Henkilöstön laaja tietopohja markkinoista ja tuotteista
2.5. Henkilöstön kohteliaisuus ja ystävällisyys
2.6. Asiakkaiden ajan tasalla pitäminen
2.7. Henkilöstön tavoitettavuus
3. Millä edellä mainituista henkilöstön ominaisuuksista on eniten merkitystä
tyytyväisyyteenne? Miksi?
4. Voisitteko valita tavarantoimittajan pelkän henkilöstön perusteella?
□ Kyllä
□ En
□ En osaa sanoa

175
Tyytyväisyys
1. Mitkä seikat pääasiassa vaikuttavat siihen, oletteko tyytyväinen toimittajaan vai ette?
(Voitte luetella palvelun laatuun, henkilöstöön, tuotteisiin, jne., liittyviä seikkoja)
2. Jos koette olevanne tyytyväisiä toimittajan tarjoamiin tuotteisiin ja palveluihin, miten
todennäköistä olisi että: (1=erittäin epätodennäköistä, 2=melko epätodennäköistä,
3=neutraali, 4=melko todennäköistä, 5=erittäin todennäköistä)
2.1. Suosittelisitte toimittajaa muille yrityksille
2.2. Kertoisitte positiivisia asioita toimittajasta muille yrityksille
2.3. Kannustaisitte muita yrityksiä ostamaan toimittajan palveluja
2.4. Vertaisitte muita yrityksiä toimittajaan
2.5. Tulisitte tekemään enemmän liiketoimintaa toimittajan kanssa lähivuosina
2.6. Odottaisitte liikesuhteen tämän toimittajan kanssa kestävän pitkään
2.7. Jatkaisitte liiketoimintaa toimittajan kanssa vaikka hinnat nousisivat hieman
2.8. Kokisitte liikesuhteen jatkumisen tärkeäksi
3. Jos ette koe olevanne tyytyväisiä toimittajan tarjoamiin tuotteisiin ja palveluihin, miten
hyvin seuraavat väittämät pitävät paikkansa? (1=erittäin huonosti, 2=melko huonosti,
3=ei hyvin eikä huonosti, 4=melko hyvin, 5=erittäin hyvin)
3.1. En suosittelisi toimittajaa muille yrityksille
3.2. Kertoisin negatiivisia asioita toimittajasta muille yrityksille
3.3. En tulisi tekemään enempää liiketoimintaa toimittajan kanssa lähivuosina
3.4. En kokisi liikesuhteen jatkumista tärkeäksi
3.5. Kokisin toimittajan vaihtamisen kannattavaksi
4. Missä määrin olette sitä mieltä, että tyytyväisyys on edellytys liikesuhteen
jatkumiselle?
5. Millä seuraavista on suurin merkitys teidän tyytyväisyyteenne?
□ Tuotevalikoiman monipuolisuus
□ Tuotteiden laatu
□ Henkilökohtainen palvelu ja palvelun luotettavuus
□ Hinta-laatu suhteeltaan paremmat tuotteet ja palvelut

176
OSA 2: Teo Lehtimäki Oy
Tämä osio keskittyy selvittämään missä määrin Teo Lehtimäki Oy täyttää asiakkaiden
odotukset laatuun sekä muihin seikkoihin liittyen. Osio on jaettu pääosin aihealueen
mukaan: yleinen suorituskyky ja liikesuhteen arvo, tuotteet, palvelun laatu, henkilöstö, ja
tyytyväisyys.
Tarkoituksena on selvittää, miten asiakastyytyväisyyttä voitaisiin parantaa. Siksi onkin
tärkeää, että yrittäisitte miettiä avoimiin kysymyksiin mahdollisimman perusteellisia
vastauksia. Mikään vastaus/mielipide ei ole tyhmä, vaan kaikki ovat erittäin tärkeitä
parannusmahdollisuuksien kannalta. Kiitos jo etukäteen ajastanne!
Teo Lehtimäki Oy: suorituskyky & liikesuhteen arvo
1. Viimeisintä palvelutapahtumaa ajatellessa, mikä seuraavista väittämistä on totta?
Voitte valita useampia.
□ Kokemukseni oli niin hyvä kuin sen pitikin olla
□ Palvelu oli erittäin hyvälaatuisia
□ Palvelu oli erinomaista
□ Palvelu täytti odotukseni
□ Palvelu oli huonoa
□ Palvelu EI täyttänyt odotuksiani
2. Miten kuvailisitte Teo Lehtimäki Oy:n tuotteiden ja palvelujen laatua?
3. Kuinka hyvin koette Teo Lehtimäki Oy:n vastaavan odotuksiinne?
□ Erittäin hyvin
□ Melko hyvin
□ Ei hyvin eikä huonosti
□ Melko huonosti
□ Erittäin huonosti

177
4. Kuinka luonnehtisitte liikesuhdetta Teo Lehtimäki Oy:n kanssa?
(Voitte vapaasti kertoa esim. miksi olette valinneet juuri Teo Lehtimäki Oy:n, millaista
palvelua olette tottuneet saamaan, jne.)
5. Koetteko liikesuhteen tuottavan teille arvoa?
□ Kyllä □ En
6. Missä määrin olette samaa mieltä siitä, että muihin tavarantoimittajiin verrattuna, Teo
Lehtimäki Oy... (1=täysin eri mieltä, 2=melko eri mieltä, 3=ei eri mieltä eikä samaa
mieltä, 4=melko samaa mieltä, 5=täysin samaa mieltä) Jos vastasitte 1, 2 tai 3, voisitteko
tarkentaa?
6.1. ...tarjoaa hinta-laatu suhteeltaan parempia tuotteita ja palveluja
6.2. ...tarjoaa parempia palveluja kilpailukykyiseen hintaan
6.3. ...tarjoaa parempaa laatua hintaan suhteutettuna
6.4. ...tarjoaa parhaat alennukset ja maksuehdot
6.5. ...tarjoaa vastinetta rahalle
6.6. ...tarjoaa kilpailukykyiset hinnat
6.7. ...kykenee tarjoamaan tuotteita ja palveluja silloin kun asiakas niitä tarvitsee
6.8. ...tarjoaa helppokäyttöisiä tuotteita
6.9. ...tuntee asiakkaat ja heidän tarpeensa
6.10. ...on asiantuntija alallaan
6.11. ...tarjoaa parhaat neuvot
6.12. ...tarjoaa henkilökohtaista palvelua

178
Teo Lehtimäki Oy:n tuotteet
1. Missä määrin olette samaa mieltä siitä, että Teo Lehtimäki Oy:n... (1=täysin eri mieltä,
2=melko eri mieltä, 3=ei eri mieltä eikä samaa mieltä, 4=melko samaa mieltä, 5=täysin
samaa mieltä)
1.1. ...tuotteet ovat laadultaan kestäviä
1.2. ...tuotteet sopivat tarpeisiinne
1.3. ...tuotevalikoima on monipuolinen
1.4. ...tuotteet ovat helppokäyttöisiä
1.5. ...tuotteista ajan mittaan saatu voitto on merkittävä
1.6. ...tuotteiden hinta-laatu suhde on hyvä
1.7. ...tuotteiden saatavuus on hyvä
2. Puuttuuko Teo Lehtimäki Oy:n tuotevalikoimasta mielestänne jotain? Mitä?

179
Teo Lehtimäki Oy:n palvelun laatu
1. Luonnehtisitteko Teo Lehtimäki Oy:n tarjoamaa palvelun laatua 'hyväksi'?
Miksi? Miksi ette?
2. Missä määrin olette samaa mieltä siitä, että Teo Lehtimäki Oy... (1=täysin eri mieltä,
2=melko eri mieltä, 3=ei eri mieltä eikä samaa mieltä, 4=melko samaa mieltä, 5=täysin
samaa mieltä) Jos vastasitte 1, 2 tai 3, voisitteko tarkentaa?
2.1. ...erottuu kilpailijoiden keskuudessa asiantuntemuksellaan
2.2. ...erottuu kyvyllään tarjota järjestelmällisiä ratkaisuja ongelmiimme
2.3. ...pyrkii ymmärtämään ja vastaamaan asiakkaan tarpeisiin
2.4. ...tarjoaa nopean ja joustavan palvelun
2.5. ...onnistuu ensimmäisellä kerralla tarjoamaan laadukasta palvelua
2.6. ...täyttää johdonmukaisesti tilausten luvatut toimituspäivät
2.7. ...laskuttaa virheettömästi ja laskut ovat luotettavia
2.8. ...vastaa nopeasti ja perusteellisesti valituksiin
2.9. ...tarjoama tekninen neuvonta on erittäin tärkeää
2.10. ...tarjoaa nopeat toimitusajat
3. Missä määrin Teo Lehtimäki Oy on täyttänyt odotuksenne palvelun laadun kannalta?
4. Millaisiin odotuksiin Teo Lehtimäki Oy ei ole kyennyt vastaamaan?

180
5. Millaisia parannusehdotuksia antaisit Teo Lehtimäki Oy:n palveluun liittyen?
(esim. tavoitettavuus, palvelualttius jne.)
6. Kuinka usein käytätte Teo Lehtimäki Oy:n nettisivuja?
□ Useita kertoja viikossa
□ Kerran viikossa
□ 2–3 kertaa kuukaudessa
□ Noin kerran kuukaudessa
□ Harvemmin
7. Millaisiksi luonnehtisitte Teo Lehtimäki Oy:n nettisivuja?
(esim. hyödyllisyys, selkeys, monipuolisuus jne.)
8. Miten tärkeäksi koette Teo Lehtimäki Oy:n vuosittaisen tuoteluettelon saamisen
paperiversiona?
□ Erittäin tärkeäksi
□ Melko tärkeäksi
□ En osaa sanoa
□ En kovin tärkeäksi
□ En lainkaan tärkeäksi
9. Riittäisikö pelkkä nettiluettelo?
□ Kyllä
□ Ei
10. Millaisia parannusehdotuksia teillä olisi Teo Lehtimäki Oy:n tuoteluetteloon liittyen?

181
Teo Lehtimäki Oy:n henkilöstö
1. Missä määrin olette samaa mieltä siitä, että muiden toimittajien henkilöstöön
verrattuna, Teo Lehtimäki Oy:n henkilöstö...(1=täysin eri mieltä, 2=melko eri mieltä,
3=ei eri mieltä eikä samaa mieltä, 4=melko samaa mieltä, 5=täysin samaa mieltä) Jos
vastasitte 1, 2 tai 3, voisitteko tarkentaa?
1.1. ...on pätevämpi ja ammattitaitoisempi
1.2. ...omaa paremman asenteen
1.3. ...tarjoaa luotettavaa ja yhdenmukaista palvelua
1.4. ...omaa riittävästi tietoa markkinoista ja tuotteista
1.5. ...on helposti tavoitettavissa puhelimitse
1.6. ...on helposti tavoitettavissa sähköpostitse
1.7. ...on kohtelias ja kunnioittava
1.8. ...tarjoaa parempaa neuvontaa
2. Mitkä seuraavista kuvauksista sopivat Teo Lehtimäki Oy:n henkilöstöön? Voitte valita
useamman.
□ Palvelu on luotettavaa ja yhdenmukaista
□ Asiakkaat pidetään hyvin ajan tasalla tärkeistä asioista
□ Puheluihin vastataan nopeasti (tai soitetaan nopeasti takaisin)
□ Sähköposteihin saa nopeasti vastauksen
□ Lähetykset lähtevät ajallaan
□ Otan yritykseen yhteyttä myös teknisten neuvojen merkeissä
□ Ei mikään yllä olevista
3. Mitä henkilöstöön liittyviä seikkoja olisi teidän mielestänne varaa parantaa?
4. Jos olette olleet tekemisissä molempien toimipisteiden kanssa, oletteko huomanneet
eroa... Jos vastasitte kyllä, voisitteko tarkentaa?
4.1. ...henkilöstön tavoitettavuudessa? □ Kyllä □ En
4.2. ...henkilöstön palvelualttiudessa? □ Kyllä □ En
4.3. ...palvelun luotettavuudessa tai yhdenmukaisuudessa? □ Kyllä □ En
4.4. ...henkilöstön pätevyydessä? □ Kyllä □ En
5. Minkä arvosanan antaisit Teo Lehtimäki Oy:n henkilöstön yleiselle suorituskyvylle?
(asteikolla 1-10, 1=hylätty, 10=erinomainen)

182
Teo Lehtimäki Oy & tyytyväisyys
1. Voisitteko antaa esimerkkejä tilanteista, joissa olette kokeneet olevanne erittäin
tyytyväisiä saamaanne palveluun?
2. Voisitteko antaa esimerkkejä tilanteista, joissa ette ole kokeneet olevanne tyytyväisiä
saamaanne palveluun? Voisitteko lisäksi kertoa miten tilanne ratkaistiin?
3. Kuinka tyytyväinen olet Teo Lehtimäki Oy:n kokonaissuoritukseen? (asteikolla 1-10;
1=erittäin tyytymätön, 5=neutraali, 10=erittäin tyytyväinen) Mikä on päällimmäinen syy
tähän?
4. Mitkä seuraavista väittämistä ovat teidän kohdallanne totta?
□ Suosittelen suuresti Teo Lehtimäki Oy:tä muille yrityksille
□ Tulen kertomaan positiivisia asioita Teo Lehtimäki Oy:stä muille yrityksille
□ Kannustan muita yrityksiä ostamaan palveluja Teo Lehtimäki Oy:ltä
□ Vertaan muita yrityksiä Teo Lehtimäki Oy:n toimintaan
□ Olen erittäin tyytyväinen Teo Lehtimäki Oy:n yleiseen suorituskykyyn
□ Tulen tekemään enemmän liiketoimintaa Teo Lehtimäki Oy:n kanssa lähivuosina
□ Odotan liikesuhteen Teo Lehtimäki Oy:n kanssa kestävän pitkään
□ Tulen todennäköisesti säilyttämään liiketoiminnan Teo Lehtimäki Oy:n kanssa
□ Jatkaisin liiketoimintaa Teo Lehtimäki Oy:n kanssa vaikka hinnat nousisivat
hieman
□ Koen liikesuhteen jatkumisen tärkeäksi
□ Ei mikään yllä olevista

183
KIITOS!
Iso kiitos vastauksestanne!
Jos teillä jäi mieleen jotain, mitä toivoisitte, että Teo Lehtimäki Oy ottaisi huomioon
toiminnassaan, kertokaa siitä avoimesti alla olevaan kenttään. Myös kommentteja kyselyn
rakenteesta ja sisällöstä otetaan mielellään vastaan.
Jos teihin saa ottaa yhteyttä lisäkysymysten sattuessa, jättäkää sähköpostiosoitteenne alla
olevaan kenttään:
Kaikenlaiset parannusehdotukset ovat tervetulleita, ja jos niitä tulee mieleen kyselyn
täyttämisen jälkeen, lähettäkää niitä vapaasti minulle sähköpostitse: (tutkijan sähköposti)
Huom! Myöskään sähköpostitse lähetettyjä kommentteja ei luovuteta suoraan yritykselle.
Tietojen tallentamiseksi, painakaa vielä "Seuraava >>" ja vahvistakaa tietojen lähetys
painamalla "Valmis"

184
APPENDIX 2
Teo Lehtimäki Ltd.’s customer satisfaction
Purpose of the study
The purpose of this study is to determine the satisfaction level of Teo Lehtimäki Ltd.’s customers, as well as the factors affecting it.
The questionnaire consists of two parts; the first part seeks to define what factors influ-
ence the customer perceived quality and value on a general level, and the second part
concentrates on finding out the extent to which Teo Lehtimäki Ltd. meets customer ex-
pectations as well as how satisfied the customers are regarding the service quality and
related issues.
Apart from obtaining certain background information, the respondents remain anonymous
and answers are nor given directly to the company.
The respondents are divided into groups based on the length of the customer relationship
as well as the amount and frequency of purchase transactions. Suggestions for improve-
ment are forwarded in accordance with the office that is mainly dealt with.
For the best possible outcome, the research is quite diverse and extensive, which also
means that it may require investing some time in completing it. I hope that you would use
plenty of time to respond to the questionnaire as well as to reflect on the questions. If any
question is unclear or raises questions, do not hesitate to contact me by e-mail: (research-
er’s email)
A big thank you in advance to all respondents. We hope that the survey would bring up as
many improvement and development ideas as possible, so that Teo Lehtimäki Ltd. would
be able to improve the quality of their services and thus customer satisfaction.
Finally, I would like to emphasize that all kinds of suggestions for improvement are wel-
come, and if you think of something after submitting your answer, feel free to send me
your ideas via email!

185
Customer’s background information
The customers are divided into different groups in the analysis part.
Therefore, it is very important that the information is correct.
1. How long have you been a customer of Teo Lehtimäki Ltd.?
(The start date of the relationship or an accurate estimate of the length of the relationship)
2. How often do you order products from Teo Lehtimäki Ltd.?
□ Several times a week
□ Once a week
□ 2–3 times a month
□ Approximately once a month
□ Less frequently
3. With what amount do you purchase spare parts from Teo Lehtimäki Ltd. per year?
4. Which office are you mainly in contact with?
□ Kauhajoki
□ Rovaniemi

186
PART 1: quality, value and satisfaction on a general level
This section seeks to identify the customers' points of view on what ‘good service’ in-
cludes, the extent to which the product variety and personnel affect the choice of supplier,
as well as the extent to which satisfaction affects the continuation of the business rela-
tionship. The section includes four different themes: value, quality, personnel, and satis-
faction.
Choice of supplier
1. Which are the main factors that affect the choice of supplier*?
2. How would you describe good service and what is it characterized by?
3. How important do you perceive that the following factors are in choosing a supplier*?
(1=not at all important, 2=not very important, 3=neutral, 4=quite important, 5=very im-
portant)
3.1. The supplier offers products and services with a better price-quality ratio
3.2. The supplier offers better services at a competitive price
3.3. The supplier provides better quality for the price
3.4. The supplier offers the best discounts and payment terms
3.5. The supplier offers value for money
3.6. The supplier offers competitive prices
3.7. The supplier is able to offer products and services according to customer needs
3.8. The supplier offers products that are easy to use
3.9. The supplier knows the customers and their needs
3.10. The supplier is an expert in their field
3.11. The supplier offers the best advice
3.12. The supplier offers a personalized service
4. Which of the previous criteria do you consider the most important in the choice of sup-
plier*?
*Choice of supplier refers to the customer’s willingness to choose a specific supplier among the competitors, as well as the customer’s willingness to choose a particular supplier again. (NB! This applies to the questions
in the following sections that refer to ”choice of supplier”)

187
Quality
1. What is a good product or product range characterized by?
2. How important do you perceive that the following factors are in choosing a supplier?
(1=not at all important, 2=not very important, 3=neutral, 4=quite important, 5=very im-
portant)
2.1. Product durability
2.2. Products fit our needs
2.3. Products are easy to use
2.4. Product availability
2.5. Product quality
2.6. Versatility of the product range
2.7. Good price-quality ratio of the products
2.8. Profits gained from the products over time
3. How much does the product range affect the choice of supplier?
□ Very little
□ Quite little
□ Not a lot or a little
□ Quite a lot
□ Very much
4. Could you choose a supplier based solely on the product range?
□ Yes □ No
5. How accurate is the following statement: I favor a supplier who… (1=completely inac-
curate, 2=somewhat inaccurate, 3=not accurate nor inaccurate, 4=somewhat accurate,
5=completely accurate)
5.10. ...stands out with its expertise
5.11. ...stands out for its ability to provide systematic solutions to our problems
5.12. ...seeks to understand and respond to the customers’ needs
5.13. ...provides a fast and flexible service
5.14. ...succeeds in providing quality service on the first try
5.15. ...consistently fulfils the promised delivery dates of orders
5.16. ...invoices correctly and the invoices are reliable
5.17. ...responds quickly and comprehensively to complaints
5.18. ...additionally provides technical advice
6. Do you think that a company’s website is an important part of the service offering?
□ Yes □ No

188
Personnel
1. How would you describe good customer service personnel?
2. How big of an effect do the following characteristics of the personnel have on the
choice of a supplier? (1=very low, 2=somewhat low, 3=neither high nor low, 4=quite
high, 5=very high)
2.8. The reliability and consistency of the service
2.9. The personnel’s attitude and willingness to provide the service 2.10. The competence and professionalism of the personnel
2.11. The personnel’s vast knowledge of the market and the products
2.12. Personnel’s courtesy and friendliness
2.13. Keeping the customers up to date
2.14. Reachability
3. Which of the previously mentioned features of the personnel is the most important for
your satisfaction? Why?
4. Could you choose a supplier based solely on the personnel?
□ Kyllä
□ En
□ En osaa sanoa

189
Satisfaction
1. What are the main factors that affect whether you are satisfied with a supplier or not?
(You can list factors connected to service quality, personnel, products, and so on.)
2. If you are satisfied with the supplier’s offerings, how likely would it be that you would: (1=very unlikely, 2=rather unlikely, 3=neutral, 4=quite likely, 5=very likely)
2.1. Recommend the supplier to other companies
2.2. Tell positive things about the supplier to other companies
2.3. Encourage other companies to use the supplier’s services
2.4. Compare other companies to the supplier’s performance
2.5. Do more business with the supplier in the coming years
2.6. Expect the business relationship with the supplier to last a long time
2.7. Continue doing business with the supplier even if prices increased slightly
2.8. Perceive the continuation of the business relationship to be important
3. If you are not satisfied with the supplier’s offerings, how accurate is the following
statement: (1=completely inaccurate, 2=somewhat inaccurate, 3=not accurate or inaccu-
rate, 4=somewhat accurate, 5=completely accurate)
3.1. I would not recommend the supplier to other companies
3.2. I would tell negative things about the supplier to other companies
3.3. I would not do more business with the supplier in the coming years
3.4. I would not perceive the continuation of business relationship as important
3.5. I would perceive that changing the supplier would be profitable
4. To what extent do you believe that satisfaction is a prerequisite for the continuation of
the business relationship?
5. Which of the following has the biggest impact in terms of your satisfaction?
□ Versatility of the product range
□ The quality of the products
□ Personalized and reliable service
□ Better products and services for the price-quality ratio

190
PART 2: Teo Lehtimäki Ltd.
This section seeks to determine the extent to which Teo Lehtimäki Ltd. meets customer
expectations regarding quality, as well as other related factors. The section is divided ac-
cording to the theme: Teo Lehtimäki Ltd.’s performance and relationship value, prodcuts, service quality, personnel, and satisfaction.
The aim is to find out how customer satisfaction could be improved. Therefore, it is im-
portant that you try to answer the open-ended questions as comprehensively as possible.
No answer or opinion is stupid but rather very important in terms of opportunities for im-
provement. Thanks in advance for your time!
Teo Lehtimäki Ltd.‘s performance & relationship value
1. In connection to the last service encounter, which of the following statements are accu-
rate? You can choose several.
□ My experience was as good as it was supposed to be
□ The service was of very good quality
□ The service was excellent
□ The service fulfilled my expectations
□ The service was bad
□ The service did NOT fulfil my expectations
2. How would you describe Teo Lehtimäki Ltd.’s product and service quality?
3. How well do you perceive Teo Lehtimäki Ltd. to fulfil your expectations?
□ Extremely well
□ Quite well
□ Not well or poorly
□ Quite poorly
□ Extremely poorly

191
4. How would you describe the business relationship with Teo Lehtimäki Ltd.? (You can
freely describe for example why you have chosen Teo Lehtimäki Ltd., what kind of ser-
vice do you usually receive, and so on.)
5. Do you perceive that the business relationship provides value for you?
□ Kyllä □ En
6. To what extent do you agree that, in comparison with other suppliers, Teo Lehtimäki
Ltd… (1=strongly disagree, 2=somewhat disagree, 3=neither disagree nor agree, 4=somewhat agree, 5=strongly agree)
6.13. ...offers products and services with a better price-quality ratio
6.14. ...offers better services at a competitive price
6.15. ...provides better quality for the price
6.16. ...offers the best discounts and payment terms
6.17. ...offers value for money
6.18. ...offers competitive prices
6.19. ...is able to offer products and services when the customer needs them
6.20. ...offers products that are easy to use
6.21. ...knows the customers and their needs
6.22. ...is an expert in their field
6.23. ...offers the best advice
6.24. ...offers a personalized service

192
Teo Lehtimäki Ltd.’s products
1. To what extent do you agree that Teo Lehtimäki Ltd.’s… (1=strongly disagree,
2=somewhat disagree, 3=neither disagree nor agree, 4=somewhat agree, 5=strongly
agree)
1.1. ...products are durable
1.2. ...products fit our requirements
1.3. ...product range is versatile
1.4. ...products are easy to use
1.5. ...products provide a good profit over time
1.6. ...the price-quality ratio of the products is good
1.7. ...product availability is good
2. Is there something missing from Teo Lehtimäki Ltd.’s product range? What?

193
Teo Lehtimäki Ltd.’s service quality
1. Would you describe Teo Lehtimäki Ltd.’s service quality as ’good’? Why? Why not?
2. To what extent do you agree that Teo Lehtimäki Ltd… (1=strongly disagree, 2=somewhat disagree, 3=neither disagree nor agree, 4=somewhat agree, 5=strongly
agree) If you answered 1, 2 or 3, could you specify?
2.1. ...stands out among the competitors with their expertise
2.2. ...stands out for the ability to provide systematic solutions to our problems
2.3. ...seeks to understand and respond to customers’ needs
2.4. ...offers a fast and flexible service
2.5. ...succeeds in providing quality service on the first try
2.6. ...consistently fulfills the promised delivery dates of orders
2.7. ...invoices correctly and the invoices are reliable
2.8. ...responds quickly and comprehensively to complaints
2.9. ...provides technical advice, which is very important
2.10. ...provides fast deliveries
3. To what extent has Teo Lehtimäki Ltd. fulfilled your expectations in terms of service
quality?
4. What kind of expectations has Teo Lehtimäki Ltd. not been able to fulfil?

194
5. What kind of improvement suggestions would you give in connection Teo Lehtimäki
Ltd.’s service? (e.g. reachability, willingness to provide the service, etc.)
6. How often do you use Teo Lehtimäki Ltd.’s website?
□ Several times a week
□ Once a week
□ 2–3 times a month
□ Approximately once a month
□ Less frequently
7. How would you describe Teo Lehtimäki Ltd.’s website?
(e.g. usefulness, clarity, versatility, etc.)
8. How important is receiving a paper copy of Teo Lehtimäki Ltd.’s annual product cata-
logue?
□ Very important
□ Quite important
□ Neutral
□ Not very important
□ Not at all important
9. Would a mere online product catalogue suffice?
□ Yes
□ No
10. What kind of improvement suggestions do you have regarding Teo Lehtimäki Ltd.’s product catalogue?

195
Teo Lehtimäki Ltd.’s personnel
1. To what extent do you agree that, in comparison with the personnel of other suppliers,
Teo Lehtimäki Ltd.’s personnel… (1=strongly disagree, 2=somewhat disagree, 3=neither disagree nor agree, 4=somewhat agree, 5=strongly agree) If you answered 1, 2 or 3, could
you specify?
1.1. ...is more competent and professional
1.2. ...has a better attitude
1.3. ...provides a reliable and consistent service
1.4. ...has enough knowledge about the market and the products
1.5. ...is reachable through phone
1.6. ...is reachable through email
1.7. ...is polite and respectful
1.8. ...offers better advice
2. Which of the following descriptions fit Teo Lehtimäki Ltd.’s personnel? You can choose several.
□ The service is reliable and consistent
□ Customers are kept up to date about important issues
□ Phone calls are responded to quickly (or called back)
□ Emails are responded to promptly
□ Orders are delivered on time
□ I contact the company for technical advice as well
□ None of the above
3. What could be improved in terms of personnel performance?
4. If you have been in contact with both offices, have you noticed a difference in… If you answered yes, could you specify?
4.5. ...the reachability? □ Yes □ No
4.6. ...their willingness to provide the service? □ Yes □ No
4.7. ...the reliability and consistency of the service? □ Yes □ No
4.8. ...their qualifications? □ Yes □ No
5. What grade would you give to Teo Lehtimäki Ltd.’s personnel’s overall performance? (on a scale of 1–10; 1=fail, 10=excellent)

196
Teo Lehtimäki Ltd. & satisfaction
1. Could you give examples of situations where you have been extremely satisfied with
the provided ser-
vice?
2. Could you give examples of situations where you have not been satisfied with the pro-
vided service? Could you also tell how the situation was solved?
3. How satisfied are you with Teo Lehtimäki Ltd.’s overall performance? (on a scale 1–10; 1=extremely unsatisfied, 5=neutral, 10=extremely satisfied) What is the main reason
for this?
4. Which of the following statements are accurate in your case?
□ I highly recommend Teo Lehtimäki Ltd. to other companies
□ I will tell positive things about Teo Lehtimäki Ltd. to other companies
□ I will encourage other companies to use Teo Lehtimäki Ltd.’s services
□ I compare other companies to Teo Lehtimäki Ltd.’s performance
□ I am very satisfied with Teo Lehtimäki Ltd.’s overall performance
□ I will do more business with Teo Lehtimäki Ltd. in the coming years
□ I expect the business relationship with Teo Lehtimäki Ltd. to last
□ I will maintain the relationship with Teo Lehtimäki Ltd.
□ I would continue doing business with Teo Lehtimäki Ltd. even if prices increased
slightly
□ I perceive the continuation of the business relationship to be important
□ None of the above

197
THANK YOU!
A big thanks for your response!
If there is anything else you would like Teo Lehtimäki Ltd. to take into account in their
operations, please write it in the comment section below. Also comments about the ques-
tionnaire structure and content are welcome.
If you can be contacted in case of additional questions, please leave your email in the
comment section below:
All kinds of improvement suggestions are welcome, and if something comes to mind after
filling out the questionnaire, please feel free to send them to me though email: (research-
er’s email) NB! Comments sent via email will not be given directly to the company.
To save the data, please click ”Next >>” and confim sending the data by clicking ”Done”

198
APPENDIX 3
Hyvä (asiakkaan nimi),
Teen asiakastyytyväisyystutkimusta Teo Lehtimäki Oy:lle, joka on toivonut, että
osallistuisitte tutkimukseen. Tutkimus suoritetaan kyselylomakkeen kautta, johon
pääsette käsiksi alla olevasta linkistä:
#url#
Tarvitsette seuraavan tunnuksen ja salasanan kirjautuaksenne:
Tunnus: #tunnus# Salasana: #salasana#
Kysely korvaa ensisijaisen tutkimusmenetelmän, haastattelun, joten kyselylomake
on hieman normaalia pidempi. Toivoisin kuitenkin, että käyttäisitte vastaamiseen
ja kysymysten miettimiseen reippaasti aikaa. Suosittelen varaamaan vähintään
puoli tuntia vastaamiseen, jotta ehtisitte rauhassa miettiä jokaista
kysymystä. Parhaan tuloksen saamiseksi kyselyssä on myös hieman toistoa.
Suurin osa kysymyksistä on monivalintakysymyksiä. Yrittäkää myös miettiä
mahdollisimman tyhjentäviä vastauksia avoimiin kysymyksiin.
Kiitos jo etukäteen ajastanne!
Jos teille tulee vielä kyselyn täyttämisen jälkeen jotain mieleen, voi minulle laittaa
sähköpostia joko tähän osoitteeseen tai henkilökohtaiseen sähköpostiini:
(sähköpostiosoite).
Vastausintoa ja oikein mukavat päivänjatkot!
Ystävällisin terveisin,
Emilia Peltonen

199
APPENDIX 4
Dear (customer’s name),
I am conducting a customer satisfaction research for Teo Lehtimäki Ltd., who has
requested that you would take part in the study. Research is carried out through a
questionnaire, which you can access through the link below:
# Url #
You will need the following user ID and password to login:
ID: # ID # Password: # password #
The survey replaces the primary research method, interviews, and therefore the
questionnaire is slightly longer than normal. I would hope, however, that you
would invest enough time for answering the questions and reflection. I recom-
mend reserving at least half an hour to respond, so that you would have enough
time to think about each question. For the best results, the survey also contains a
bit of repetition. Most of the questions are multiple-choice questions. Try to an-
swer as comprehensively as possible to the open-ended questions.
Thanks in advance for your time!
If something comes to mind after completing the survey, you can send me email
to either this address or my personal email: (email address).
Have a nice day!
Regards,
Emilia Peltonen