Differences in Occupants' Satisfaction and Perceived ... - MDPI
16
buildings Article Differences in Occupants’ Satisfaction and Perceived Productivity in High- and Low-Performance Offices Özgür Göçer 1, * , Christhina Candido 1 , Leena Thomas 2 and Kenan Göçer 3 1 Sydney School of Architecture, Design and Planning, The University of Sydney, Sydney, NSW 2006, Australia 2 School of Architecture, Faculty of Design Architecture and Building, University of Technology Sydney, Sydney, NSW 2007, Australia 3 Faculty of Engineering and Architecture, Beykoz University, Istanbul 34805, Turkey * Correspondence: [email protected] Received: 5 July 2019; Accepted: 26 August 2019; Published: 30 August 2019 Abstract: This paper reports the results from a dataset comprising 9794 post-occupancy evaluation (POE) surveys from 77 Australian open-plan offices. This paper specifically focuses on a sub-set of 20 offices (n = 2133), identified from ranking 10 offices each, with the least (n = 1063) and highest (n = 1070) satisfaction scores, respectively. The satisfaction scores were evaluated on the basis of seven factors (i.e., building/office aesthetics and quality, thermal comfort and indoor air quality, noise distraction and privacy, personal control, connection to outdoor environment, maintenance and visual comfort, and individual space). Using the POE survey data from 20 offices, regression analyses and two-way ANOVA tests were carried out to understand the differences in occupants’ satisfaction and perceived productivity arising from open-plan offices. According to the statistically significant regression analyses results, it was identified that building/office aesthetics and quality (β = 0.55, p < 0.001) and noise distraction and privacy (β = 0.33, p < 0.001) were the two strongest predictors contributing perceived productivity in low-performance offices. Two-way ANOVA test results for the 10 high-performance offices indicate that the perceived productivity was strongly associated with the office’s physical configuration, the employees’ working experience, and the working hours at that office. Keywords: indoor environmental quality; open-plan offices; user satisfaction; perceived productivity; office design; post-occupancy evaluation 1. Introduction Office spaces with either no internal walls or few internal freestanding or partial-height partitions are commonly referred to as “open-plan”, and this layout became the most common typology found in corporate real estate over the last decades [1,2]. This spatial configuration has been found to facilitate a non-hierarchical working environment [3,4] while enabling communication and collaboration [5], and reduced space requirements and operating costs [6]. Despite these benefits, there is a growing body of research and anecdotal evidence from industry pointing to several issues related to poor indoor environmental quality (IEQ) performance and its negative impacts on office workers [7–10]. IEQ has been proven to negatively affect occupants [11,12]. In order to get rid of the problem of measuring productivity caused by varied outputs from office occupiers, most of the researchers have done productivity studies based on self-assessment questionnaires with a subjective rating [13]. A literature search indicates that key findings of research conducted on satisfaction and perceived productivity can be grouped under the following four key topics of investigation: • Thermal comfort conditions and indoor air quality (IAQ) [7,11,14–18]; Buildings 2019, 9, 199; doi:10.3390/buildings9090199 www.mdpi.com/journal/buildings
-
Upload
khangminh22 -
Category
Documents
-
view
2 -
download
0
Transcript of Differences in Occupants' Satisfaction and Perceived ... - MDPI
buildings
Article
Differences in Occupants’ Satisfaction and PerceivedProductivity in High- and Low-Performance Offices
Özgür Göçer 1,* , Christhina Candido 1 , Leena Thomas 2 and Kenan Göçer 3
1 Sydney School of Architecture, Design and Planning, The University of Sydney, Sydney, NSW 2006, Australia2 School of Architecture, Faculty of Design Architecture and Building, University of Technology Sydney,
Sydney, NSW 2007, Australia3 Faculty of Engineering and Architecture, Beykoz University, Istanbul 34805, Turkey* Correspondence: [email protected]
Received: 5 July 2019; Accepted: 26 August 2019; Published: 30 August 2019�����������������
Abstract: This paper reports the results from a dataset comprising 9794 post-occupancy evaluation(POE) surveys from 77 Australian open-plan offices. This paper specifically focuses on a sub-set of20 offices (n = 2133), identified from ranking 10 offices each, with the least (n = 1063) and highest(n = 1070) satisfaction scores, respectively. The satisfaction scores were evaluated on the basis ofseven factors (i.e., building/office aesthetics and quality, thermal comfort and indoor air quality,noise distraction and privacy, personal control, connection to outdoor environment, maintenance andvisual comfort, and individual space). Using the POE survey data from 20 offices, regression analysesand two-way ANOVA tests were carried out to understand the differences in occupants’ satisfactionand perceived productivity arising from open-plan offices. According to the statistically significantregression analyses results, it was identified that building/office aesthetics and quality (β = 0.55,p < 0.001) and noise distraction and privacy (β = 0.33, p < 0.001) were the two strongest predictorscontributing perceived productivity in low-performance offices. Two-way ANOVA test results for the10 high-performance offices indicate that the perceived productivity was strongly associated withthe office’s physical configuration, the employees’ working experience, and the working hours atthat office.
Keywords: indoor environmental quality; open-plan offices; user satisfaction; perceived productivity;office design; post-occupancy evaluation
1. Introduction
Office spaces with either no internal walls or few internal freestanding or partial-height partitionsare commonly referred to as “open-plan”, and this layout became the most common typology found incorporate real estate over the last decades [1,2]. This spatial configuration has been found to facilitatea non-hierarchical working environment [3,4] while enabling communication and collaboration [5],and reduced space requirements and operating costs [6]. Despite these benefits, there is a growingbody of research and anecdotal evidence from industry pointing to several issues related to poor indoorenvironmental quality (IEQ) performance and its negative impacts on office workers [7–10]. IEQ hasbeen proven to negatively affect occupants [11,12]. In order to get rid of the problem of measuringproductivity caused by varied outputs from office occupiers, most of the researchers have doneproductivity studies based on self-assessment questionnaires with a subjective rating [13]. A literaturesearch indicates that key findings of research conducted on satisfaction and perceived productivity canbe grouped under the following four key topics of investigation:
• Thermal comfort conditions and indoor air quality (IAQ) [7,11,14–18];
Buildings 2019, 9, 199; doi:10.3390/buildings9090199 www.mdpi.com/journal/buildings
Buildings 2019, 9, 199 2 of 16
• Visual comfort, access to daylight, and view [19–21];• Noise distraction, lack of privacy, and communication [22–27];• Office design [28–33].
For the first topic, thermal comfort and IAQ, research reveals that when these two IEQ dimensionsare combined, the situation imposes significant pressure on the overall energy consumption ofcommercial buildings, due to heating, ventilation, and air-conditioning (HVAC) systems used to keepindoors habitable. While some studies document direct linkages of temperature and self-reportedperformance at work [34–36], there is still disagreement about “ideal” set-points. Some authorssuggest lower temperatures to address distraction and complaints [37] while others make the casein favor of warmer indoors, without losses on reported perceived productivity [38,39]. The otherdimension that has been studied was “ventilation rate” (i.e., supply of outdoor air) due to its indirectinfluence on workers’ performance, caused by the impact of ventilation on thermal comfort, air quality,and concentration of indoor generated pollutants [40,41]. In addition, another key finding in fullyair-conditioned open-plan offices is that occupants prefer to have a higher-degree of control over theirimmediate surroundings, including but not limited to thermostats, shading devices, and operablewindows [27]. Interpersonal differences when it comes to occupants’ thermal preferences have alsobeen extensively documented [16,17].
For a second topic of investigation, Veitch [42] indicated that occupants with access to daylightwithin 5 m report higher satisfaction levels than the others without a window. A study by Heschong [43]shows that access to daylight would positively impact on mental function and attention. Further,the same study found that there is a strong relationship between various characteristics of views andhealth. However, the glare potential from windows and/or from a large light source was found tobe a distracting factor, adversely affecting productivity [19,20]. Occupants indicated that despite theissues of noise and glare caused by operable windows, they would still prefer them for having a directconnection to the outdoors [44]. Furthermore, the literature supports the argument that having accessto external views and appropriate daylighting conditions improves the mood of office workers and hasa positive impact on their satisfaction [31,45–47].
The third IEQ-related topic, acoustics, is perhaps the one that received the most attention recently.The aim of increasing social interaction and communication has led to a predominant design goalof diminishing the walls used to separate cellular offices. However, there is significant evidencethat proves transition to more open office spaces by minimizing spatial boundaries decreased socialinteraction and face-to-face communication [48,49]. It is observed that those office workers preferto send e-mails instead of face-to-face collaboration and donning headphones to shut out theircolleagues. Hence, without a physical barrier, they become clearly open for informal interaction,which can be detrimental for productivity [26]. In addition, open-plan arrangements reduce privacyand acoustic comfort [24,50–53]. Hongisto et al. [54] denoted that it is not the sound level of noise,but the intelligibility of irrelevant background noise that determines the distracting power of speech.In addition, Lee et al. [25] found that some of the workers who have high noise-sensitivity could beadversely affected by open-plan office arrangement, due to loss of speech privacy.
Finally, the literature search indicated that “office layout” has also been investigated againstIEQ. Office design that proposes optimum balance between encouraging positive interactions andreducing negative distractions [55] could play a significant role in mitigating adverse effects ofopen-plan offices on workers’ satisfaction and perceived productivity. Studies following occupants’pre- and post-relocation scenarios demonstrate that the implementation of well-designed office conceptshave a significant impact on workers’ perceived productivity and health, specifically in long-termsituations [31,32,56–58].
When combined, research in open-plan offices has covered much ground on the negative aspectsof poor IEQ on people. Although extremely relevant, this type of research does not necessarily supportidentification of design strategies that are highly rated by occupants or, consequently, assist in gatheringevidence around open-plan office designs that actually work. In addition, there is also a knowledge
Buildings 2019, 9, 199 3 of 16
gap in understanding which IEQ dimensions receive higher scores in premises where low or highperceived productivity results are reported by workers.
Therefore, this paper aims to identify and compare differences found in open-plan officeswith low and high scores given by occupants on overall satisfaction and perceived productivity.To this end, this paper acquired a dataset of 9794 post-occupancy evaluation (POE) surveys from77 Australian open-plan offices to rank offices based on occupants’ satisfaction scores on seven variables(building/office aesthetics and quality, thermal comfort and indoor air quality, noise distraction andprivacy, personal control, connection to the outdoor environment, maintenance and visual comfort,and individual space) and perceived productivity. As a result, a total of 20 offices (n = 2133) werethen investigated in detail, consisting of 10 offices with the lowest scores (low-performance offices)and 10 with the highest scores (high-performance offices). For these 20 selected offices, traditionallyinvestigated key organizational and spatial factors (the type of work, time spent at work area, windowproximity, and workplace arrangement) were also analyzed, in order to understand differences inreported perceived productivity arising from open-plan offices.
2. Materials and Methods
2.1. Dataset
This paper interrogated a dataset of 9794 post-occupancy evaluation (POE) surveys conductedwith the BOSSA (building occupant survey system Australia) time-lapse questionnaire in 77 Australianoffices (n = 9794), out of which 20 cases studies (n = 2133) were analyzed in detail for this study. As all theoffices are located in Australia, there might be some similarities. The BOSSA time-lapse questionnaireis based on 29 core items, asking occupants to rate their satisfaction on spatial comfort, individual space,indoor air quality, thermal comfort, noise distraction and privacy, visual comfort, personal control,and building image on a seven-point scale (dissatisfied–satisfied). In addition, occupants were alsoasked to rate their perceived productivity, which was based on a self-assessed measure of their overallsatisfaction with their work area, perceived health, and overall satisfaction with the building. Basicinformation about occupants’ descriptive characteristics (i.e., gender, age, type of work, time spent atwork, work experience) are also included. Candido et al. [58] provide a comprehensive detail on theBOSSA time-lapse questionnaire.
2.2. Data Analysis
2.2.1. Factor Analysis with the Use of Dataset (n = 9794)
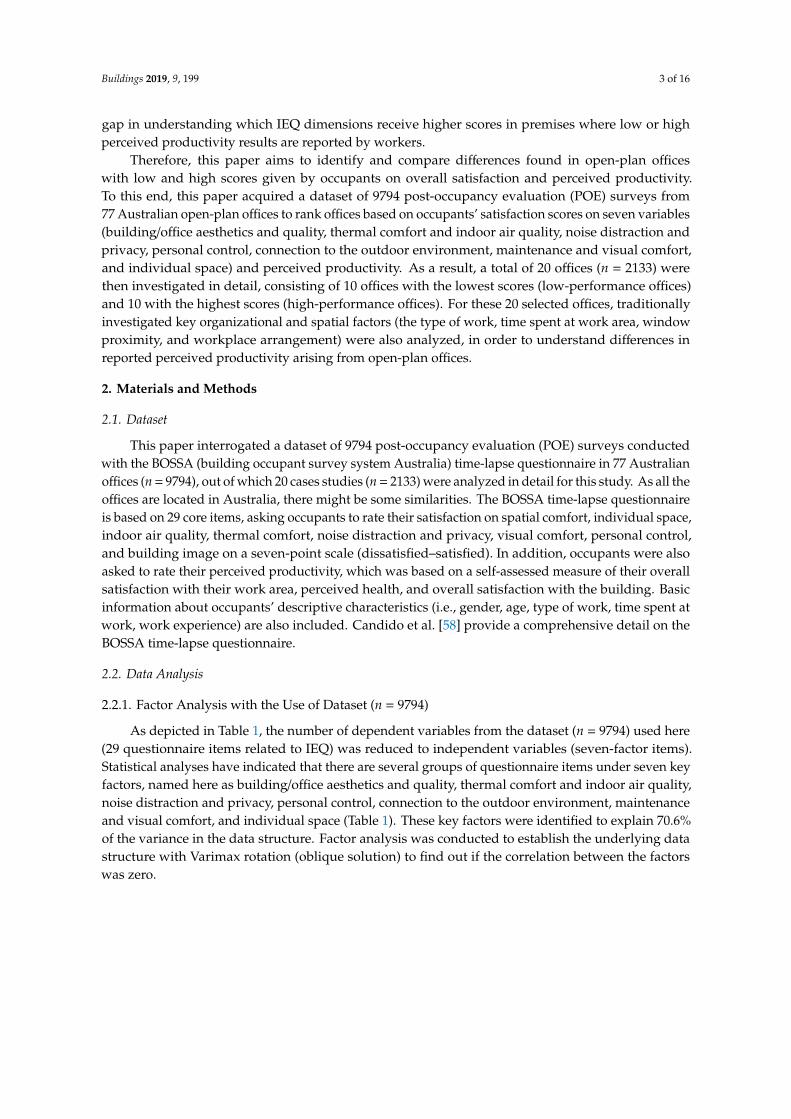
As depicted in Table 1, the number of dependent variables from the dataset (n = 9794) used here(29 questionnaire items related to IEQ) was reduced to independent variables (seven-factor items).Statistical analyses have indicated that there are several groups of questionnaire items under seven keyfactors, named here as building/office aesthetics and quality, thermal comfort and indoor air quality,noise distraction and privacy, personal control, connection to the outdoor environment, maintenanceand visual comfort, and individual space (Table 1). These key factors were identified to explain 70.6%of the variance in the data structure. Factor analysis was conducted to establish the underlying datastructure with Varimax rotation (oblique solution) to find out if the correlation between the factorswas zero.
Buildings 2019, 9, 199 4 of 16
Table 1. Component loading of each factor and questionnaire item.
Factors Questionnaire ItemsComponent Loading the Contribution of Each Variable on Principal Components
1 2 3 4 5 6 7
Building/officeaesthetics and quality
Space for breaks 0.723 0.248 0.126 0.161 0.240Space to collaborate 0.715 0.208 0.108 0.142 0.125 0.156Building aesthetics 0.698 0.248 0.103 0.173 0.371Work area aesthetics 0.693 0.254 0.148 0.139 0.373 0.146 0.104Interaction with colleagues 0.604 0.184 0.180 0.376Personalization of work area 0.519 0.142 0.272 0.170 0.159 0.348Comfort of furnishing 0.518 0.266 0.185 0.140 0.234 0.337
Thermal Comfort andIndoor Air Quality
Humidity 0.196 0.808 0.103 0.124 0.165 0.150Air movement 0.258 0.791 0.127 0.130 0.156 0.144 0.144Air quality 0.288 0.790 0.120 0.149 0.210 0.109Temperature in winter 0.176 0.739 0.129 0.167Temperature in summer 0.194 0.738 0.116 0.175 0.118
Noise distraction andPrivacy
Sound privacy 0.134 0.123 0.830 0.267Visual privacy 0.824 0.174 0.112 0.145Unwanted interruption 0.184 0.130 0.798 0.129 0.205Overall noise 0.176 0.214 0.749 0.141 0.190
Personal Control
Personal control of air movement 0.133 0.169 0.161 0.873Personal control of cooling & heating 0.131 0.174 0.179 0.864Personal control of artificial lighting 0.145 0.824 0.113 0.138Degree of freedom to adapt 0.235 0.385 0.237 0.552 0.176 0.133 0.140
Connection tooutdoor environment
Access to daylight 0.179 0.130 0.865 0.180 0.114External view 0.258 0.122 0.125 0.849 0.121Connection to outdoors 0.414 0.157 0.159 0.180 0.709 0.106
Maintenance & VisualComfort
Personal control shading 0.163 0.112 0.162 0.273 0.671 0.201Cleanliness 0.489 0.242 0.143 0.611Maintenance 0.551 0.282 0.118 0.591Lighting 0.104 0.274 0.127 0.158 0.209 0.584 0.287
Individual space Amount of workspace 0.201 0.170 0.228 0.102 0.141 0.775Storage space 0.277 0.121 0.762
Buildings 2019, 9, 199 5 of 16
2.2.2. Identifying Focus Groups: Ten Lowest and Highest Performing Offices
The factor analysis process identified seven IEQ factors as the underlying structure of the BOSSAtime-lapse survey. Factor scores can be assigned to a surveyed office based on these seven factors.Factor scores were computed by averaging the individual questionnaire item scores (mean response hasbeen selected on the seven-point rating scale for this analysis) comprising each factor. Mean responsesfrom those 77 offices became the basis of creating a dataset (n = 9794), consisting of scores for the sevenIEQ factors. The mean score of the dataset is an average of the 77 offices’ scores, giving equal weightto every office included in the dataset. The differences between the baseline and an individual officescore can be indicative of whether or not that office is performing better than offices in the dataset.Each questionnaire item receives equal weight. By using mean satisfaction score results on seven keyfactors, 10 cases with lower and higher satisfaction levels were identified. The mean values of each ofthe 10 lowest- and highest-performing offices (named here as 10-LPO and 10-HPO, respectively) werecompared against the dataset (n = 9794) mean score.
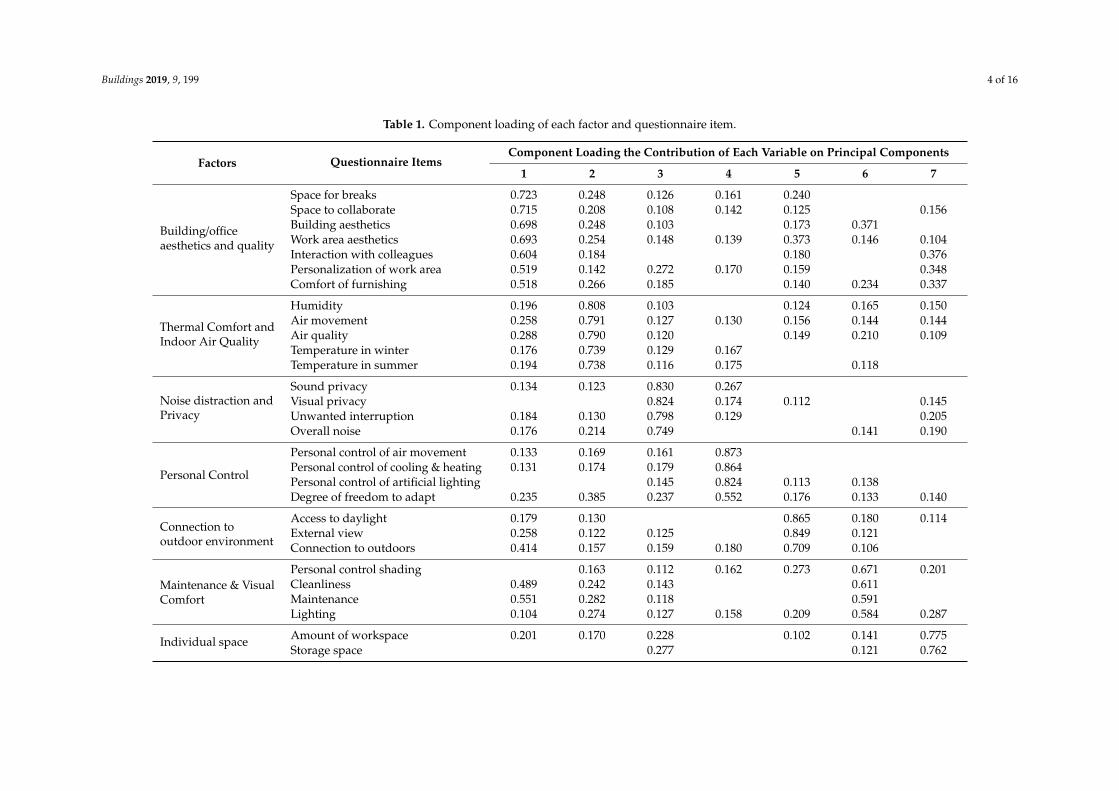
POE surveys represented in the 20 case studies were conducted at least six months after occupantsoccupied the office between the years of 2016 and 2017. Table 2 depicts basic information for all20 offices, including sample sizes, office layout, tenant, tenant certification, and desk arrangement.Surveys are often conducted due to requirements from the Green Building Council of Australia’s(GBCA) green star rating scheme. Therefore, a significant portion of offices investigated here are greenstar-certified spaces. In addition, these offices are located within a building that holds a valid ratingawarded by the National Australian Built Environment Rating System (NABERS), which is typical forcommercial office buildings in Australia. The office tenants are from various industry types, includingconsultancy, non-profit organizations, government, design and consultancy, and tertiary education.Sample sizes varied widely (from 25 to 383 questionnaires), which was expected considering eachorganization occupied just one or several floors within a building, which is common practice foroffice buildings in Australia. Offices are mostly consisting of open-plan typology (with and withoutpartitions) and five of them have occupants’ seating in a non-fixed location (Table 2).
Table 2. Basic information about surveyed offices.
FocusGroup Ranking Sample Size
N = 2133 Office Layout Tenant TenantCertification
WorkplaceArrangement
10-L
PO
1 82 Private office &Private office shared
with others 8.7%;open-plan with high
partitions 24.6%;open-plan with low
partitions 61.0%;open-plan without
partitions 5.6%
Technology Green Star Fixed location2 78 Design & consultancy - Fixed location3 82 Consultancy - Fixed location4 28 Property industry Green Star Fixed location5 30 Design & consultancy Green Star Fixed location6 232 Government - Fixed location7 383 Finance Green Star Non-fixed location8 26 Tertiary education Green Star Fixed location9 25 Tertiary education - Non-fixed location10 97 Technology Green Star Fixed location
10-H
PO
1 112 Private office &Private office shared
with others 2.6%;open-plan with high
partitions 2.9%;open-plan with low
partitions 21.3%;open-plan without
partitions 73.2%
Government - Fixed location2 25 Property industry Green Star Non-fixed location3 32 Design & consultancy Green Star Fixed location4 322 Property industry Green Star Fixed location5 57 Non-profit Green Star Fixed location6 28 Property industry Green Star Non-fixed location7 300 Consultancy Green Star Non-fixed location8 51 Property industry Green Star Fixed location9 39 Property industry Green Star Fixed location10 104 Property industry Green Star Fixed location
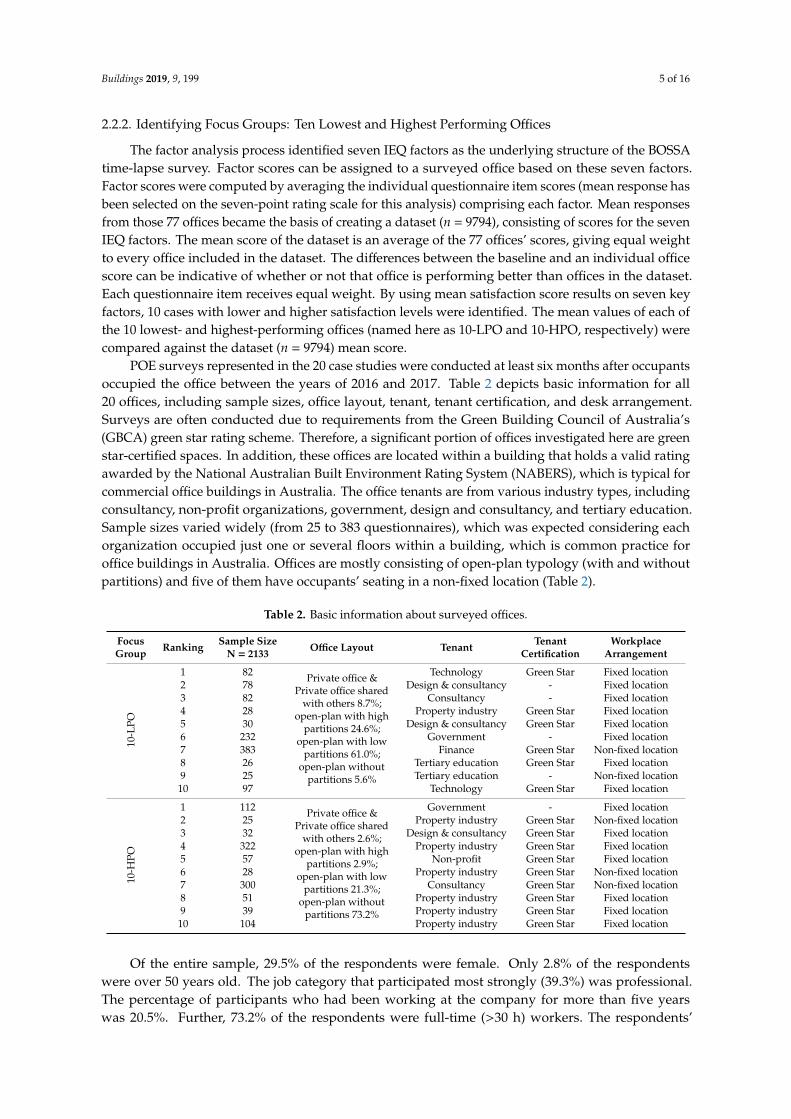
Of the entire sample, 29.5% of the respondents were female. Only 2.8% of the respondentswere over 50 years old. The job category that participated most strongly (39.3%) was professional.The percentage of participants who had been working at the company for more than five yearswas 20.5%. Further, 73.2% of the respondents were full-time (>30 h) workers. The respondents’
Buildings 2019, 9, 199 6 of 16
(office workers’) profiles are summarized in Table 3. The data were analyzed using statistical methods,with the use of SPSS version 24.
Table 3. Summary of occupant profiles in focused groups (10 lowest-performing offices (LPO) and10 highest-performing offices (HPO)).
Gender Female 29.5% Male 55.3% Prefer not to Respond 15.1%
Age Over 50 years old 31–50 years old 30 years old or under2.8% 55.4% 41.8%
Job category Administrative Technical Professional Managerial Other21.4% 13.7% 39.3% 18.1% 7.5%
Working experienceat the office
>5 years 2–5 years 1–2 years 7–12 months <6 months20.5% 17.5% 11.9% 23.1% 26.9%
Working hours ina typical week
>30 h 11–30 h <10 h or less73.2% 20.4% 6.3%
2.2.3. Further Analyses with the Focus Groups
Apart from the 29 questionnaire items used in the factor analysis above, the BOSSA time-lapsesurvey also has the question for perceived productivity. Since the factor analysis extracted sevenIEQ factors that are uncorrelated (orthogonal) with each other, the association of seven factors withthe four global evaluations can now be examined by regression analysis. Since both dependent andindependent variables are numeric, three separate linear regression analyses for dataset and each focusgroup (10-LPO and10-HPO) were conducted. Linear regression analyses were done for each of factoritem taken as the independent variable, where perceived productivity was the dependent variable.
As a useful technique to reveal and determine the relationships between three or more independentvariables, two-way ANOVA analyses were carried out for each focus group; 10-LPO and 10-HPO. In thisstudy, the significance level was determined to be 0.05. With the help of ANOVA analysis, the effectsbetween more than one categorical independent variable on the dependent variable could be observed.The analyses were done to investigate the interrelations between the categorical variables of spatialconfiguration such as office layout, workplace arrangement, being close to a window, and descriptiveproperties of employees such as age, gender, working experience, type of work, and working hours ina week.
3. Results
3.1. Identifying High- and Low-Performance Offices
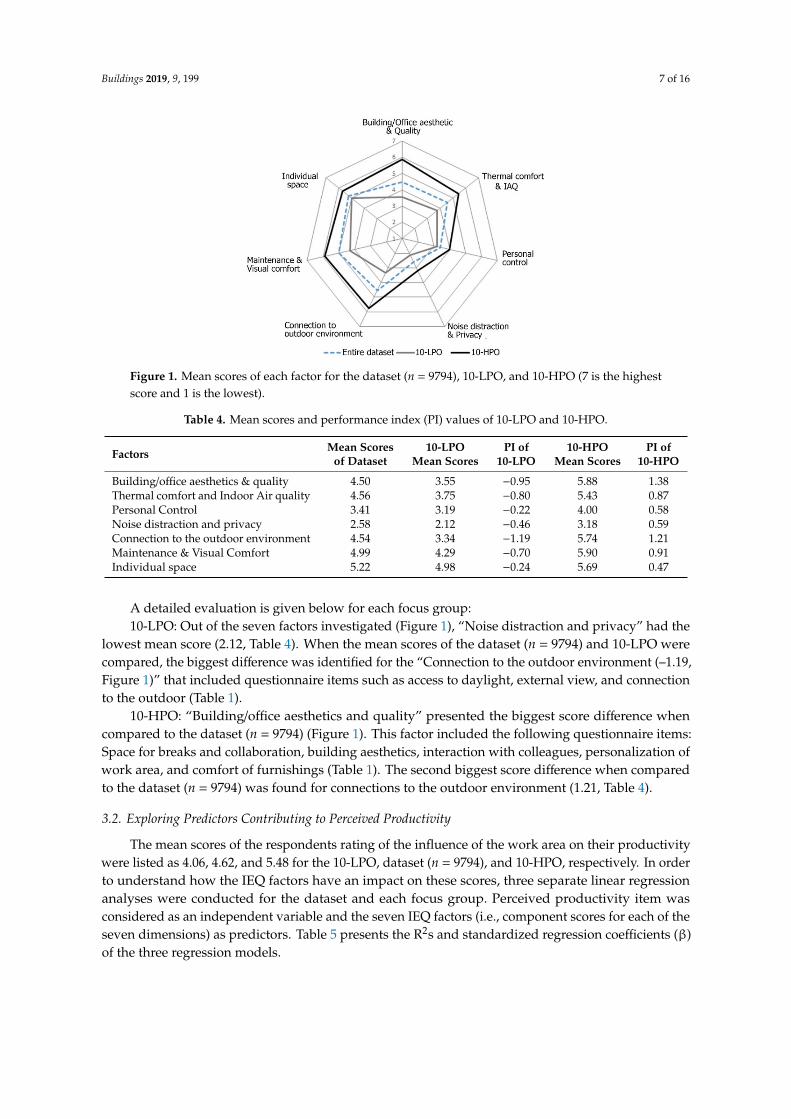
The 10 lowest- and 10 highest-performing offices could be selected by ranking the mean scoresfor the seven IEQ factors. The mean values of each of the 10 lowest and highest performing officeswere compared against the dataset (n = 9794) mean score, as seen in Figure 1. In order to comparethe offices’ mean scores against the dataset (n = 9794), a performance index (PI) was used. A positivevalue indicates the office is performing better, while a negative value indicates the office performanceis worse than the mean score of 77 offices (Table 4).
In general, ‘Noise distraction and privacy’ and ‘Personal control’ consistently presented the lowestscores, while ‘Individual space’ was the factor that had the highest score for the dataset (n = 9794) and10-LPO, and ‘Maintenance and Visual Comfort’ and ‘Building/office aesthetics and quality’ resulted inhigh scores for 10-HPO. When the mean scores of 10-HPO and 10-LPO were compared, the biggestgaps were recorded for the two factors ‘Connection to the outdoor environment’ and ‘Building/officeaesthetics and quality’.
Buildings 2019, 9, 199 7 of 16
Buildings 2019, 9, x FOR PEER REVIEW 6 of 16
independent variables are numeric, three separate linear regression analyses for dataset and each focus group (10-LPO and10-HPO) were conducted. Linear regression analyses were done for each of factor item taken as the independent variable, where perceived productivity was the dependent variable.
As a useful technique to reveal and determine the relationships between three or more independent variables, two-way ANOVA analyses were carried out for each focus group; 10-LPO and 10-HPO. In this study, the significance level was determined to be 0.05. With the help of ANOVA analysis, the effects between more than one categorical independent variable on the dependent variable could be observed. The analyses were done to investigate the interrelations between the categorical variables of spatial configuration such as office layout, workplace arrangement, being close to a window, and descriptive properties of employees such as age, gender, working experience, type of work, and working hours in a week.
3. Results
3.1. Identifying High- and Low-Performance Offices
The 10 lowest- and 10 highest-performing offices could be selected by ranking the mean scores for the seven IEQ factors. The mean values of each of the 10 lowest and highest performing offices were compared against the dataset (n = 9794) mean score, as seen in Figure 1. In order to compare the offices’ mean scores against the dataset (n = 9794), a performance index (PI) was used. A positive value indicates the office is performing better, while a negative value indicates the office performance is worse than the mean score of 77 offices (Table 4).
Figure 1. Mean scores of each factor for the dataset (n = 9794), 10-LPO, and 10-HPO (7 is the highest score and 1 is the lowest).
Table 4. Mean scores and performance index (PI) values of 10-LPO and 10-HPO.
Factors Mean Scores of Dataset
10-LPO Mean Scores
PI of 10-LPO
10-HPO Mean Scores
PI of 10-HPO
Building/office aesthetics & quality 4.50 3.55 −0.95 5.88 1.38 Thermal comfort and Indoor Air quality 4.56 3.75 −0.80 5.43 0.87
Personal Control 3.41 3.19 −0.22 4.00 0.58 Noise distraction and privacy 2.58 2.12 −0.46 3.18 0.59 Connection to the outdoor environment 4.54 3.34 −1.19 5.74 1.21 Maintenance & Visual Comfort 4.99 4.29 −0.70 5.90 0.91 Individual space 5.22 4.98 −0.24 5.69 0.47
In general, ‘Noise distraction and privacy’ and ‘Personal control’ consistently presented the lowest scores, while ‘Individual space’ was the factor that had the highest score for the dataset (n =
Figure 1. Mean scores of each factor for the dataset (n = 9794), 10-LPO, and 10-HPO (7 is the highestscore and 1 is the lowest).
Table 4. Mean scores and performance index (PI) values of 10-LPO and 10-HPO.
Factors Mean Scoresof Dataset
10-LPOMean Scores
PI of10-LPO
10-HPOMean Scores
PI of10-HPO
Building/office aesthetics & quality 4.50 3.55 −0.95 5.88 1.38Thermal comfort and Indoor Air quality 4.56 3.75 −0.80 5.43 0.87Personal Control 3.41 3.19 −0.22 4.00 0.58Noise distraction and privacy 2.58 2.12 −0.46 3.18 0.59Connection to the outdoor environment 4.54 3.34 −1.19 5.74 1.21Maintenance & Visual Comfort 4.99 4.29 −0.70 5.90 0.91Individual space 5.22 4.98 −0.24 5.69 0.47
A detailed evaluation is given below for each focus group:10-LPO: Out of the seven factors investigated (Figure 1), “Noise distraction and privacy” had the
lowest mean score (2.12, Table 4). When the mean scores of the dataset (n = 9794) and 10-LPO werecompared, the biggest difference was identified for the “Connection to the outdoor environment (–1.19,Figure 1)” that included questionnaire items such as access to daylight, external view, and connectionto the outdoor (Table 1).
10-HPO: “Building/office aesthetics and quality” presented the biggest score difference whencompared to the dataset (n = 9794) (Figure 1). This factor included the following questionnaire items:Space for breaks and collaboration, building aesthetics, interaction with colleagues, personalization ofwork area, and comfort of furnishings (Table 1). The second biggest score difference when comparedto the dataset (n = 9794) was found for connections to the outdoor environment (1.21, Table 4).
3.2. Exploring Predictors Contributing to Perceived Productivity
The mean scores of the respondents rating of the influence of the work area on their productivitywere listed as 4.06, 4.62, and 5.48 for the 10-LPO, dataset (n = 9794), and 10-HPO, respectively. In orderto understand how the IEQ factors have an impact on these scores, three separate linear regressionanalyses were conducted for the dataset and each focus group. Perceived productivity item wasconsidered as an independent variable and the seven IEQ factors (i.e., component scores for each of theseven dimensions) as predictors. Table 5 presents the R2s and standardized regression coefficients (β)of the three regression models.
Buildings 2019, 9, 199 8 of 16
Table 5. Results of regression data analyses for 10-LPO and 10-HPO.
Factors Items(Independent Variables)
Dataset (n = 9794) PerceivedProductivity
10-LPO PerceivedProductivity
10-HPO PerceivedProductivity
R2 β R2 β R2 β
Building/office aesthetics andquality 0.171 * 0.41 0.108 * 0.32 0.115 0.33
Thermal comfort & Air quality 0.076 0.27 0.068 0.26 0.077 0.27Personal control 0.122 * 0.34 0.072 * 0.26 0.209 * 0.45
Noise distraction & privacy 0.028 0.16 0.038 0.19 0.026 0.16Connection to the outdoor
environment 0.040 0.20 0.004 0.06 0.029 0.17Maintenance & Visual Comfort 0.037 0.19 0.040 0.19 0.015 0.12
Individual space 0.049 0.22 0.035 0.18 0.251 * 0.50
* The two strongest predictors were indicated as in bold. Note: p-values for all factor items are statistically significant(p < 0.001).
‘Building/office aesthetics and quality’ (for dataset β = 0.41 and for 10-LPO β = 0.32, p < 0.001)and ‘Personal control’ (for dataset β = 0.34 and for 10-LPO β = 0.26, p < 0.001) (Table 5) were thetwo strongest predictors contributing to perceived productivity within 10-LPO. Meanwhile, the twostrongest predictors contributing to the perceived productivity of 10-HPO regression results were‘Individual space’ (β = 0.50, p < 0.001), and ‘Personal control’ (β = 0.45, p < 0.001) (Table 5). The IEQfactor “Individual space” consists of questionnaire items regarding amount of workspace and storagespace. “Personal control” IEQ factor consists of the questionnaire items regarding personal controlover air movement, cooling and heating, artificial lighting, and degree of freedom to adapt.
3.3. Human, Organizational, and Spatial Factors Related to Perceived Productivity
To understand the key drivers for perceived productivity arising out of the open-plan officessurveyed within this research study, focus groups were studied in detail. The relationship betweenthe categorical variables, consisting of human- and organizational-related factors (gender, age,working experience, working hours, working experience, job category, workplace arrangement)and spatial-related factors (office layout, window proximity) and their combined impact on perceivedproductivity have been investigated by performing two-way ANOVA test for each categorical variablecombination. However, no significant relationship was found for the focus group 10-LPO. On the otherhand, significant relationships were found for the combination of some variables for the focus group10-HPO. According to the results (Table 6), it was observed that perceived productivity was mostlyrelated to the occupants’ working experience and hours at that office, window proximity, office layout,and workplace arrangement.
Table 6. Results of two-way ANOVA tests done for 10-HPO.
Relationship between Source Sum ofSquares df Mean
Square F Sig.
Work area close to awindow & Office layout
Window 0.044 1 0.044 0.022 0.881Office_layout 14.512 4 3.628 1.842 0.118Window*Office_layout 26.359 3 8.786 4.462 0.004
Work area close to awindow & Workingexperience
Window 63.160 1 63.160 31.836 0.000Time_bldg 6.994 4 1.749 0.881 0.474Window*Time_bldg 27.082 4 6.770 3.413 0.009
Office layout & Workinghours in a week
Office_layout 12.001 4 3.000 1.457 0.213Hours_week 12.925 2 6.462 3.137 0.044Office_layout*Hours_week 32.535 8 4.067 1.974 0.047
Buildings 2019, 9, 199 9 of 16
Table 6. Cont.
Relationship between Source Sum ofSquares df Mean
Square F Sig.
Office layout & Workingexperience
Office_layout 9.559 5 1.912 0.942 0.453Time_bldg 13.229 4 3.307 1.630 0.164Office_layout*Time_bldg 61.413 16 3.838 1.891 0.018
Office layout &Workspace arrangement
Office_layout 22.578 5 4.516 2.215 0.051Workspace_arrangement 5.553 1 5.553 2.724 0.099Office_layout *Workspace_arrangement 20.669 4 5.167 2.535 0.039
* refers the relationship between the categorical variables and their combined impact on perceived productivity.
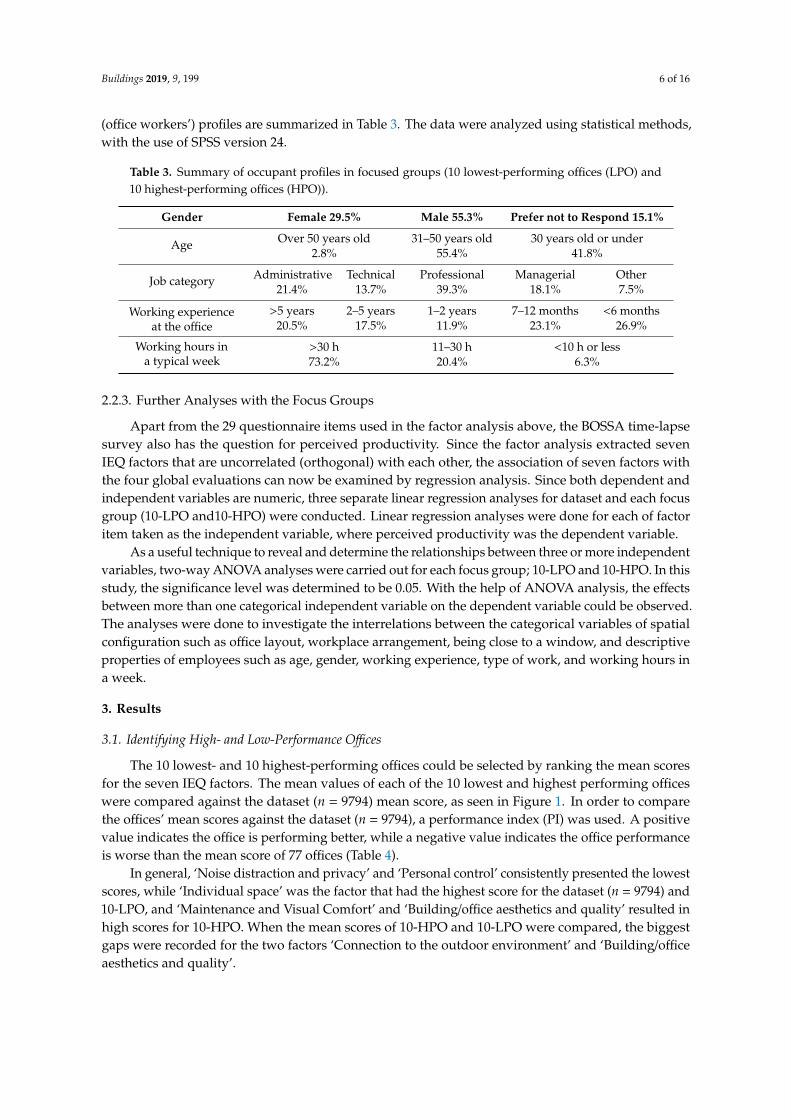
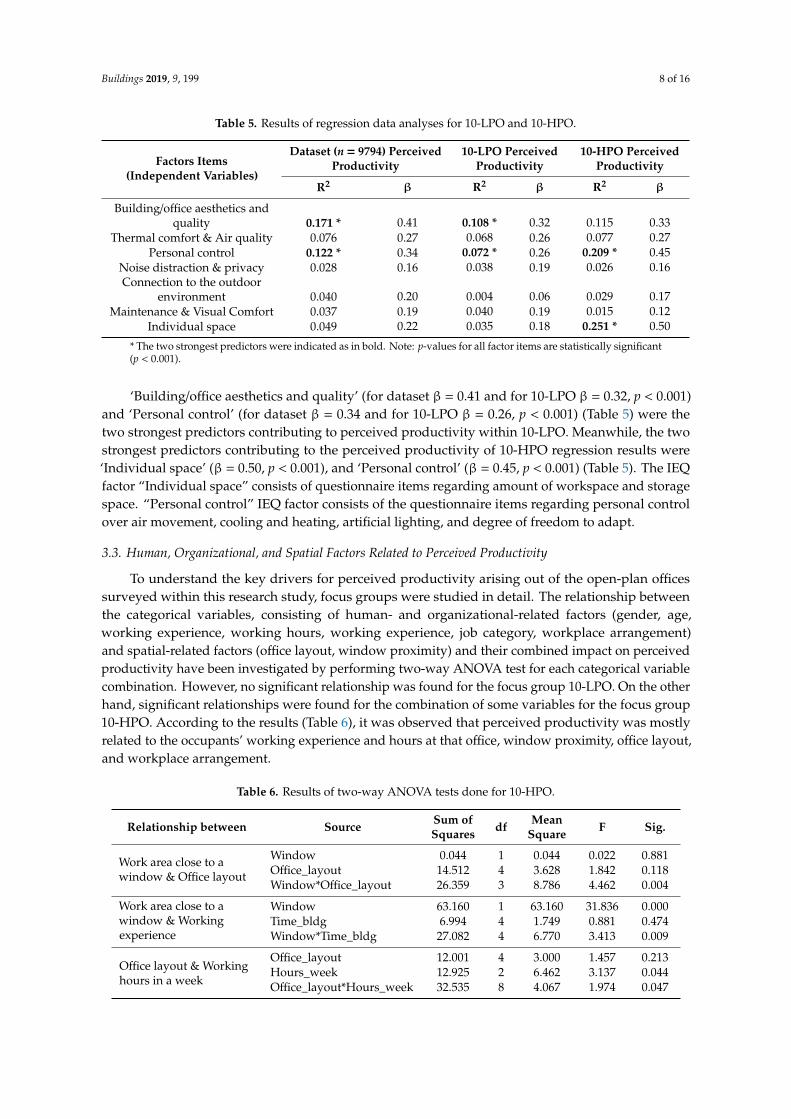
The influence of spatial factors (window proximity and office layout) on perceived productivitywas further explored. Figure 2 shows the relationship of window proximity to the office layout andworking experience. The occupants in private offices have stated a higher perceived productivity forthese two options. Considering the fact that 73.2% of office workers are working in open-plan officeswithout partitions, the influence of these key factors on this office layout gains more importance.Having a workspace close to a window positively affects perceived productivity, especially for theopen-plan office with low partitions and without partitions. Duration of employment (i.e., workexperience) is seen as another determinant factor when it is interrelated with window proximity.When the employment duration was taken into account, the group working for more than five yearshas been most adversely affected by the lack of outdoor environment connection.Buildings 2019, 9, x FOR PEER REVIEW 9 of 16
Figure 2. Two-way ANOVA results of window proximity influence on perceived productivity by office layout and working experience (4 = neither negative nor positive, 7 = very positive).
The working hours’ relationship with the other key factors was also investigated; 73.2% of respondents have been working for more than 30 h in a week. The study with the focus group, 10-HPO, indicates that open-plan office with low partitions is the best type of office layout considering long working hours (Figure 3).
Working experience is another determinant factor when it is interrelated with office layout. Although the newcomers (less than one year) have represented high scores at private and shared offices, the level of perceived productivity has dramatically decreased when the working experience increased by two to five years. The open-plan office with low partitions has the best performance among the other open-plan office types when longer working periods (more than five years) have been taken into account (Figure 3).
The workplace arrangement has been classified in to two group; Fixed location, which includes exclusive and shared use of the same workstation, and non-fixed location, which varies (e.g., activi-based workspace, flexi-desk, etc.) with activities. According to Figure 3, it can be concluded that having a non-fixed location workstation has a positive effect on perceived productivity, except for shared offices.
Figure 2. Two-way ANOVA results of window proximity influence on perceived productivity by officelayout and working experience (4 = neither negative nor positive, 7 = very positive).
Buildings 2019, 9, 199 10 of 16
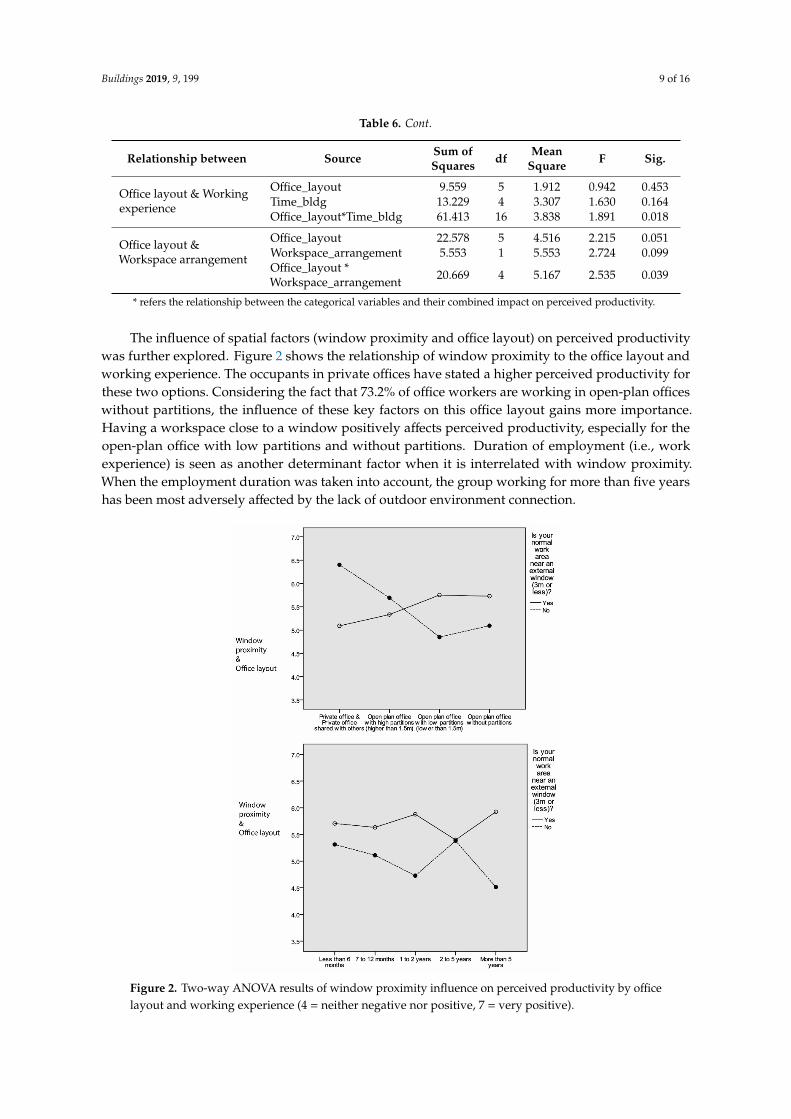
The working hours’ relationship with the other key factors was also investigated; 73.2% ofrespondents have been working for more than 30 h in a week. The study with the focus group, 10-HPO,indicates that open-plan office with low partitions is the best type of office layout considering longworking hours (Figure 3).Buildings 2019, 9, x FOR PEER REVIEW 10 of 16
Figure 3. Two-way ANOVA results of office layout influence on perceived productivity by working hours and experience and workplace arrangement (4 = neither negative nor positive, 7 = very positive).
4. Discussion
The results of the analyses based on seven IEQ factors and ranking the 77 offices according to their mean scores of these seven factors are discussed below under the headings of occupants’ satisfaction and perceived productivity.
Figure 3. Two-way ANOVA results of office layout influence on perceived productivity by workinghours and experience and workplace arrangement (4 = neither negative nor positive, 7 = very positive).
Working experience is another determinant factor when it is interrelated with office layout.Although the newcomers (less than one year) have represented high scores at private and sharedoffices, the level of perceived productivity has dramatically decreased when the working experienceincreased by two to five years. The open-plan office with low partitions has the best performance
Buildings 2019, 9, 199 11 of 16
among the other open-plan office types when longer working periods (more than five years) have beentaken into account (Figure 3).
The workplace arrangement has been classified in to two group; Fixed location, which includesexclusive and shared use of the same workstation, and non-fixed location, which varies (e.g., activi-basedworkspace, flexi-desk, etc.) with activities. According to Figure 3, it can be concluded that havinga non-fixed location workstation has a positive effect on perceived productivity, except for shared offices.
4. Discussion
The results of the analyses based on seven IEQ factors and ranking the 77 offices according to theirmean scores of these seven factors are discussed below under the headings of occupants’ satisfactionand perceived productivity.
4.1. Occupants’ Satisfaction
LPO: In accordance with the IEQ factor mean scores for 10-LPO, “Noise distraction and privacy”has the lowest mean score with a significant difference (Figure 1). This finding is compatible with thestudies that identified it as the main issue in open-plan offices [24,50–53]. Office workers not onlycomplained about background noise, but also noise coming from the outdoors and HVAC systems.
When the mean scores of 10-LPO and 10-HPO were compared, the difference in “Building/officeaesthetic and Quality” and connection to the outdoor environment IEQ factors was very striking.Depending on the complaints of occupants outlined below, it was observed that the spatial-relatedissues caused a decrease in satisfaction level. The complaints about office design included insufficientprivate room and/or quiet room for the purposes that require concentration and focusing, limitedaccess to daylight and external view, and overcrowded desks. It was also recorded that, with the lackof an adequate number of meeting rooms for collaborative work, kitchen, relaxation areas, and evenworkstations were used for meetings. Some quotations from the occupant surveys are given below:
“Lunchroom and kitchen areas are frequently used as work areas due to lack of collaboration space”.
“ . . . there are not enough desks for officers and what desks there are overcrowded and noisy due to theovercrowding . . . ” there is no space to store field equipment which is usually stored under desk andthen reduces space for ease of using workspace and can cause back issues and pose as trip hazards”.
“ . . . kitchen area is too small only has two seats. desk size is so small there is nowhere to eat my lunch,also seat opposite a wall and have no view.”
Apart from this, occupants were also complaining about their basic demands for physicalrequirements such as fresh air and thermal comfort. The following statements have indicated how theoccupants provide response to their work environment:
“Staff on southeastern side have lap rugs and wear their outdoor coats inside, staff on the other sideare wearing summer clothes”.
“ . . . people on one side of the building can be boiling while people on the other side are freezing”.
“CO2 levels are too high and oxygen too low, particularly in the afternoon the air does not seem fresh.This has a significant impact on my alertness and productivity”.
The ratio of complaints on IEQ factor “Thermal comfort and IAQ” was documented as 15.2% andthe request–response dissatisfaction rate was very high at 54.7%.
“The responsiveness of building management to fix air conditioning issues is abhorrent.”
HPO: The analysis shows that, for the users of the studied 10-HPOB, the most pleasant andsatisfactory dimension is the “Maintenance and visual comfort” (the mean score is 5.90, Table 4).However according to the PI, which allows us to make a comparative assessment among dataset
Buildings 2019, 9, 199 12 of 16
and highest- and lowest-performing buildings, “Building/office aesthetics and quality” presented thebiggest score difference (Figure 1, Table 4). This factor includes the following questionnaire items: Spacefor breaks and collaboration, building aesthetics, interaction with colleagues, personalization of workarea, and comfort of furnishing (Table 1). The second highest score difference when comparedto the entire dataset was found for “Connection to the outdoor environment” (1.21, Table 4),which includes questionnaire items access to daylight, external view, and connection to the outdoors(Table 1). This finding supports the significance of innovative design [28,32], communication andcollaboration [26,59], and aesthetics [60] on office worker’s satisfaction. With respect to occupants’satisfaction, the study showed significant relationships with access to daylight and view as indicatedin other similar studies [45–47].
The satisfaction rate of “Thermal comfort and Indoor Air quality” factor was higher (the meanscore is 5.43, Table 4), which includes the following questionnaire items: Temperature in winter andsummer, air movement, air quality, and humidity. Only 6.3% of the occupants have indicated that theyhave complaints on any of the issues such as indoor air temperature, air movement, lighting, and other.People who want temperature warmer was the in the first order in the complaint list with the 25.0%.The request response dissatisfaction rate was 33.3%.
The most unsatisfactory IEQ factor is ‘Noise distraction and privacy” (the mean score is 3.18,Table 4). This finding is consistent with the outcomes of relevant studies found in the literature.The comparatively lowest mean score of the IEQ factors points out that the noise level and acousticproblems still exists although the design of the building was satisfactory.
In accordance with the PI, the lowest value is “Individual space”, which covers the items as theamount of workspace and storage space. This is a concomitant failure of the design solution in newworking spaces by shrinking the overall amount of space dedicated to individual work and increasingcollaborative and group spaces [61].
4.2. Perceived Productivity
The importance of spatial design was emphasized by many researchers [28–30,32], but it isobserved that individual space and IEQ factor “Personal control” are becoming the occupant’s priorityin a well-designed office. The recent studies on open-plan offices have highlighted the importanceof individual space and personal control as having significant and positive impact on perceivedproductivity [12,21].
The regression analyses in Table 5 have demonstrated that the two strongest predictors were‘Individual space’ (β = 0.50, p < 0.001) and ‘Personal control’ (β = 0.45, p < 0.001) for perceivedproductivity. This reflects that more attention should be paid to solve the problems of the rising voiceof inadequate personal storage and work area and adjusting noise level and maintaining privacy.
There is a significant difference between the perceived productivity scores of the occupantswho have a connection to an external window with more than five years’ experience and the others.These findings coincided with the results of the studies verifying that making visual contact with theoutdoors reduces office workers’ stress and promotes their quality of life [45,62].
The other determinant factor for perceived productivity was the height of partitions, for 10-HPOespecially. Open-plan offices with higher partitions have lower value when compared with otheropen-plan office types, especially for the occupants working long hours, whereas it is the opposite foroccupants working less than 10 hours (Table 6). When it is considered that 73.2% (Table 3) of employeesare working long hours, it is evident that a workstation with an open-plan office with low partitionshas shown the best performance for 10-HPO.
5. Conclusions
Over the last decades, the major issues arising from open-plan offices have been identified anddiscussed in length in academia and industry. From the inadequacies of indoor environmental quality(IEQ) provided in these offices, to links with lower productivity levels, a considerable body of work has
Buildings 2019, 9, 199 13 of 16
been devoted to understanding occupants’ dissatisfaction in such working environments. This paperhas focused on results from perceived productivity observed in high- and low-performance open-planoffices in Australia. Seven factors, namely building/office aesthetics and quality, thermal comfortand indoor air quality, noise distraction and privacy, personal control, connection to the outdoorenvironment, maintenance and visual comfort, and individual space were included in the analysis.Results from this study suggest links between high perceived productivity levels and office design.The top 10 offices where high levels of satisfaction were reported from occupants presented highsatisfaction results for space for breaks and collaboration, building and work aesthetics, interactionwith colleagues, personalization of work area, and furnishing comfort. Results also flag the need formore workspace and storage, as well as personal control over systems and adaptability.
In addition, this study also reported results from analysis on key traditionally investigated human(gender, age), organizational (the type of work, type spent at work area, and workplace arrangement)and spatial factors (window proximity and office layout). The spatial features and organizationalfactors showed links with perceived productivity reported by occupants, especially for the occupantsthat are working longer hours in a week and having longer experience at that work, open-plan officeswith low partitions performed better than the others. If the open-plan office design was supported bynon-fixed workspace arrangement, then the influence of workspace on perceived productivity wouldbe higher.
A limitation of this study is its reliance on availability and access to offices, where all werelocated in Australia. This might have created a familiarity. Since there is not a universally acceptedmeasurement of productivity, a self-assessed measure was used. Similar research has found this asa justifiable consideration [13].
Consequently, the above study also points towards the shortcomings of open-plan offices,including its impact on satisfaction and perceived productivity support. Combined, results from low-performance offices suggest that open-plan offices investigated here could benefit from:
• Improved building and workplace aesthetics,• Abundant use of zoning, strategically placed to accommodate several work-related activities
including, but not limited to quietness, focus, and concentration,• Abundant use of space for breaks, collaboration, and communication,• Maximizing occupants’ access to daylight and connecting to outdoor environments.
Author Contributions: The authors contributed to the paper in the following way: Conceptualization, Ö.G.,C.C., and L.T., Formal analysis, Ö.G. and K.G., Writing—Original Draft preparation, Ö.G., C.C., L.T., and K.G.,Funding: C.C.
Funding: This research was funded by the University of Sydney’s DVC Research Bridging Support Grant(G199771) and Cachet Group (G192167).
Acknowledgments: Authors would like to express their gratitude to all organizations and occupants for dedicatingtheir time to participate in this study.
Conflicts of Interest: The authors declare no conflict of interest.
References
1. Hedge, A. The open-plan office: A systematic investigation of employee reactions to their work environment.Environ. Behav. 1982, 14, 519–542. [CrossRef]
2. Durval, C.L.; Charles, K.E.; Veitch, J.A. Open-Plan Office Density and Environmental Satisfaction; IRC ResearchReport RR-150; National Research Council Canada: Ottawa, ON, Canada, 2002.
3. Andrew, H.; Wheeler, P.; Whitehead, C. The Distributed Workplace: Sustainable Work Environments. London;Spon Press: New York, NY, USA, 2004.
4. Van der Voordt, T.J.M. Productivity and Employee Satisfaction in Flexible Workplaces. J. Corp. Real Estate2004, 6, 133–148. [CrossRef]
Buildings 2019, 9, 199 14 of 16
5. Brunia, S.; De Been, I.; Van Der Voordt, T.J. Accommodating new ways of working: Lessons from bestpractices and worst cases. J. Corp. Real Estate 2016, 18, 30–47. [CrossRef]
6. Arundell, L.; Sudholz, B.; Teychenne, M.; Salmon, J.; Hayward, B.; Healy, G.N.; Timperio, A. The Impact ofActivity Based Working (ABW) on Workplace Activity, Eating Behaviours, Productivity, and Satisfaction.Int. J. Environ. Res. Public Heal. 2018, 15, 1005. [CrossRef] [PubMed]
7. Huizenga, C.; Abbaszadeh, S.; Zagreus, L.; Arens, E.A. Air quality and thermal comfort in office buildings:Results of a large indoor environmental quality survey. In Proceedings of the Healthy Buildings 2006, Lisbon,Portugal, 4–8 June 2006.
8. Brager, G.; Baker, L. Occupant satisfaction in mixed-mode buildings. Build. Res. Inf. 2009, 37, 369–380.[CrossRef]
9. Leaman, A.; Bordass, B. Assessing building performance in use 4: The Probe occupant surveys and theirimplications. Build. Res. Inf. 2001, 29, 129–143. [CrossRef]
10. De Been, I.; Beijer, M. The influence of office type on satisfaction and perceived productivity support. J. Facil.Manag. 2014, 12, 142–157. [CrossRef]
11. Kamaruzzaman, N.S.; Egbu, C.O.; Zawawi, E.M.A.; Ali, A.S.; Che-Ani, A.I. The effect of indoor environmentalquality on occupants’ perception of performance: A case study of refurbished historic buildings in Malaysia.Energy Build. 2011, 43, 407–413. [CrossRef]
12. Appel-Meulenbroek, R.; Clippard, M.; Pfnür, A. The effectiveness of physical office environments foremployee outcomes: An interdisciplinary perspective of research efforts. J. Corp. Real Estate 2018, 20, 56–80.[CrossRef]
13. Haynes, B.P. Office productivity: A theoretical framework. J. Corp. Real Estate 2007, 9, 97–110. [CrossRef]14. Hunn, B.D.; Haberl, J.S.; Davies, H.; Owens, B. Measuring commercial building performance: Protocols for
energy, water, and indoor environmental quality. ASHRAE J. 2012, 54, 48–56.15. Cao, B.; Ouyang, Q.; Zhu, Y.; Huang, L.; Hu, H.; Deng, G. Development of a multivariate regression model
for overall satisfaction in public buildings based on field studies in Beijing and Shanghai. Build. Environ.2012, 47, 394–399. [CrossRef]
16. Deuble, M.P.; De Dear, R.J. Green occupants for green buildings: The missing link? Build. Environ. 2012,56, 21–27. [CrossRef]
17. Gou, Z.; Prasad, D.; Lau, S.S.-Y. Impacts of green certifications, ventilation and office types on occupantsatisfaction with indoor environmental quality. Arch. Sci. Rev. 2014, 57, 196–206. [CrossRef]
18. Hua, Y.; Göçer, Ö.; Göçer, K. Spatial mapping of occupant satisfaction and indoor environment quality ina LEED platinum campus building. Build. Environ. 2014, 79, 124–137. [CrossRef]
19. Baird, G.; Thompson, J. Lighting conditions in sustainable buildings: Results of a survey of users’ perceptions.Arch. Sci. Rev. 2012, 55, 102–109. [CrossRef]
20. Rodriquez, R.G.; Pattini, A. Tolerance of discomfort glare from a large area source for work on a visualdisplay. Light. Res. Technol. 2014, 46, 157–170. [CrossRef]
21. McCunn, L.J.; Kim, A.; Feracor, J. Reflections on a retrofit: Organizational commitment, perceived productivityand controllability in a building lighting project in the United States. Energy Res. Soc. Sci. 2018, 38, 154–164.[CrossRef]
22. Kaarlela-Tuomaala, A.; Helenius, R.; Keskinen, E.; Hongisto, V. Effects of acoustic environment on workin private office rooms and open-plan offices—Longitudinal study during relocation. Ergonomics 2009,52, 1423–1444. [CrossRef]
23. Kim, J.; De Dear, R. Workspace satisfaction: The privacy-communication trade-off in open-plan offices.J. Environ. Psychol. 2013, 36, 18–26. [CrossRef]
24. Danielsson, C.B.; Bodin, L.; Wulff, C.; Theorell, T. The relation between office type and workplace conflict:A gender and noise perspective. J. Environ. Psychol. 2015, 42, 161–171. [CrossRef]
25. Lee, P.J.; Lee, B.K.; Jeon, J.Y.; Zhang, M.; Kang, J. Impact of noise on self-rated job satisfaction and healthin open-plan offices: A structural equation modelling approach. Ergonomics 2016, 59, 222–234. [CrossRef][PubMed]
26. Haynes, B.; Suckley, L.; Nunnington, N. Workplace productivity and office type: An evaluation of officeoccupier differences based on age and gender. J. Corp. Real Estate 2017, 19, 111–138. [CrossRef]
27. Göçer, Ö.; Göçer, K.; Ergöz Karahan, E.; Ilhan Oygür, I. Exploring mobility & workplace choice in a flexibleoffice through post-occupancy evaluation. Ergonomics 2018, 61, 226–242. [PubMed]
Buildings 2019, 9, 199 15 of 16
28. Meijer, E.M.; Frings-Dresen, M.H.; Sluiter, J.K. Effects of office innovation on office workers’ health andperformance. Ergonomics 2009, 52, 1027–1038. [CrossRef]
29. Nicoll, G.; Zimring, C. Effect of innovative building design on physical activity. J. Public Health Policy 2009,30, S111–S123. [CrossRef]
30. Gray, T.; Birrell, C. Are Biophilic-Designed Site Office Buildings Linked to Health Benefits and HighPerforming Occupants? Int. J. Environ. Res. Public Heal. 2014, 11, 12204–12222. [CrossRef]
31. Candido, C.; Zhang, F.; Kim, J.; de Dear, R.; Thomas, L.; Stapasson, P.; Joko, C. Impact of workspace layouton occupant satisfaction, perceived health and productivity. In Proceedings of the Windsor Conference 2016:Making Comfort Relevant, Windsor: NCEUB Network for Comfort and Energy Use in Buildings, Windsor,UK, 7–10 April 2016.
32. Candido, C.; Thomas, L.; Haddad, S.; Zhang, F.; Mackey, M.; Ye, W. Designing activity-based workspaces:Satisfaction, productivity and physical activity. Build. Res. Inf. 2019, 47, 275–289. [CrossRef]
33. Candido, C.; Chakraborty, P.; Tjondronegoro, D. The Rise of Office Design in High-Performance, Open-PlanEnvironments. Buildings 2019, 9, 100. [CrossRef]
34. Seppanen, O.; Fisk, W.J.; Lei, Q.H. Effect of Temperature on Task Performance in Office Environment(No. LBNL-60946); Ernest Orlando Lawrence Berkeley National Laboratory: Berkeley, CA, USA, 2006.
35. Tanabe, S.I.; Nishihara, N.; Haneda, M. Indoor temperature, productivity, and fatigue in office tasks. HVAC&RRes. 2007, 13, 623–633.
36. Frontczak, M.; Wargocki, P. Literature survey on how different factors influence human comfort in indoorenvironments. Build. Environ. 2011, 46, 922–937. [CrossRef]
37. Wyon, D.P.; Wargocki, P. Room Temperature Effects on Office Work; Taylor & Francis: London, UK, 2006;pp. 181–192.
38. Zhang, F.; Haddad, S.; Nakisa, B.; Naim Rastgoo, M.; Candido, C.; Tjondronegoro, D.; de Dear, R. The effectsof higher temperature set points during summer on office workers’ cognitive load and thermal comfort.Build. Environ. 2017, 123, 176–188. [CrossRef]
39. Zhang, F.; De Dear, R.; Hancock, P. Effects of moderate thermal environments on cognitive performance:A multidisciplinary review. Appl. Energy 2019, 236, 760–777. [CrossRef]
40. Lei, Q.H.; Seppänen, O.; Fisk, W.J. Ventilation and performance in office work. Indoor Air 2006, 16, 28–36.41. Wargocki, P.; Wyon, D.P.; Baik, Y.K.; Clausen, G.; Fanger, P.O. Perceived Air Quality, Sick Building Syndrome
(SBS) Symptoms and Productivity in an Office with Two Different Pollution Loads. Indoor Air 1999, 9, 165–179.[CrossRef] [PubMed]
42. Veitch, J. Lighting for high-quality workplaces. In Creating the Productive Workplace; Taylor & Francis: London,UK, 2006; p. 7.
43. Heschong, L. Windows and office worker performance. In Creating the Productive Workplace; Taylor & Francis:London, UK, 2006; p. 277.
44. Heerwagen, J.; Zagreus, L. The Human Factors of Sustainable Building Design: Post Occupancy Evaluation of thePhilip Merrill Environmental Center, Annapolis, MD; University of California: Berkeley, CA, USA, 2005.
45. Aries, M.B.; Veitch, J.A.; Newsham, G.R. Windows, view, and office characteristics predict physical andpsychological discomfort. J. Environ. Psychol. 2010, 30, 533–541. [CrossRef]
46. Veitch, J.A.; Galasiu, A.D. The Physiological and Psychological Effects of Windows, Daylight, and View at Home:Review and Research Agenda; NRC-IRC Research Report RR-325; National Research Council of Canada:Ottawa, ON, Canada, 2012.
47. Lottrup, L.; Stigsdotter, U.K.; Meilby, H.; Claudi, A.G. The workplace window view: A determinant of officeworkers’ work ability and job satisfaction. Landsc. Res. 2015, 40, 57–75. [CrossRef]
48. De Croon, E.; Sluiter, J.; Kuijer, P.P.; Frings-Dresen, M. The effect of office concepts on worker health andperformance: A systematic review of the literature. Ergonomics 2005, 48, 119–134. [CrossRef]
49. Bernstein, E.S.; Turban, S. The impact of the ‘open’ workspace on human collaboration. Philos. Trans. R. Soc.B Boil. Sci. 2018, 373, 20170239. [CrossRef]
50. Sundstrom, E.; Town, J.P.; Rice, R.W.; Osborn, D.P.; Brill, M. Office Noise, Satisfaction, and Performance.Environ. Behav. 1994, 26, 195–222. [CrossRef]
51. Banbury, S.P.; Berry, D.C. Office noise and employee concentration: Identifying causes of disruption andpotential improvements. Ergonomics 2005, 48, 25–37. [CrossRef] [PubMed]

Buildings 2019, 9, 199 16 of 16
52. Veitch, J.A.; Charles, K.E.; Farley, K.M.; Newsham, G.R. A model of satisfaction with open-plan officeconditions: COPE field findings. J. Environ. Psychol. 2007, 27, 177–189. [CrossRef]
53. Haapakangas, A.; Helenius, R.; Keskinen, E.; Hongisto, V. Perceived acoustic environment, work performanceand well-being–survey results from Finnish offices. In Proceedings of the 9th International Congress onNoise as a Public Health Problem (ICBEN), Foxwoods, CT, USA, 21–25 July 2008.
54. Hongisto, V.; Haapakangas, A.; Haka, M. Task performance and speech intelligibility-a model to promotenoise control actions in open offices. In Proceedings of the 9th International Congress on Noise as a PublicHealth Problem (ICBEN), Foxwoods, CT, USA, 21–25 July 2008.
55. Haynes, B.P. The impact of office layout on productivity. J. Facil. Manag. 2008, 6, 189–201. [CrossRef]56. McElroy, J.C.; Morrow, P.C. Employee reactions to office redesign: A naturally occurring quasi-field
experiment in a multi-generational setting. Hum. Relations 2010, 63, 609–636. [CrossRef]57. Rolfö, L.V. Relocation to an activity-based flexible office—Design processes and outcomes. Appl. Ergon. 2018,
73, 141–150. [CrossRef] [PubMed]58. Candido, C.; Kim, J.; de Dear, R.; Thomas, L. BOSSA: A multidimensional post-occupancy evaluation tool.
Build. Res. Inf. 2016, 44, 214–228. [CrossRef]59. Kim, J.; Candido, C.; Thomas, L.; De Dear, R. Desk ownership in the workplace: The effect of non-territorial
working on employee workplace satisfaction, perceived productivity and health. Build. Environ. 2016,103, 203–214. [CrossRef]
60. Bjerke, R.; De Paoli, D.; Ind, N. The impact of aesthetics on employee satisfaction and motivation. EuroMed J.Bus. 2007, 2, 57–73. [CrossRef]
61. Steiner, J. The art of space management: Planning flexible workspaces for people. J. Facil. Manag. 2006,4, 6–22. [CrossRef]
62. Aminu, Y.A.; Kandar, M.Z.; Ossen, D.R.; Jibril, J.D.; Bornoma, A.H.; Abubakar, A.I. Importance of a ViewWindow in Rating Green Office Buildings. Adv. Mater. Res. 2013, 689, 180–183. [CrossRef]
© 2019 by the authors. Licensee MDPI, Basel, Switzerland. This article is an open accessarticle distributed under the terms and conditions of the Creative Commons Attribution(CC BY) license (http://creativecommons.org/licenses/by/4.0/).