Optimality conditions on fields in microstructures and controllable differential schemes
Upload
carleton-caCategory
view
2download
0
NRC Publications Archive (NPArC)Archives des publications du CNRC (NPArC)
Office Occupants? Evaluations of an Individually-Controllable Lighting SystemVeitch, J. A.; Donnelly, C. L.; Galasiu, A. D.; Newsham, G. R.; Sander, D. M.; Arsenault, C. D.
Contact us / Contactez nous: [email protected].
http://nparc.cisti-icist.nrc-cnrc.gc.ca/npsi/jsp/nparc_cp.jsp?lang=frL’accès à ce site Web et l’utilisation de son contenu sont assujettis aux conditions présentées dans le site
Web page / page Web
http://nparc.cisti-icist.nrc-cnrc.gc.ca/npsi/ctrl?lang=enhttp://nparc.cisti-icist.nrc-cnrc.gc.ca/npsi/ctrl?lang=fr
LISEZ CES CONDITIONS ATTENTIVEMENT AVANT D’UTILISER CE SITE WEB.
READ THESE TERMS AND CONDITIONS CAREFULLY BEFORE USING THIS WEBSITE.
Access and use of this website and the material on it are subject to the Terms and Conditions set forth athttp://nparc.cisti-icist.nrc-cnrc.gc.ca/npsi/jsp/nparc_cp.jsp?lang=en
http://www.nrc-cnrc.gc.ca/irc
Office Occupants’ Evaluat ions of an Individually-Con trollable Light ing
System
I R C - R R - 2 9 9
V e i t c h , J . A . ; D o n n e l l y , C . L . ; G a l a s i u , A . D . ; N e w s h a m , G . R . ; S a n d e r , D . M . ; A r s e n a u l t , C . D .
March 30, 2010
The material in this document is covered by the provisions of the Copyright Act, by Canadian laws, policies, regulations and international agreements. Such provisions serve to identify the information source and, in specific instances, to prohibit reproduction of materials without written permission. For more information visit http://laws.justice.gc.ca/en/showtdm/cs/C-42 Les renseignements dans ce document sont protégés par la Loi sur le droit d'auteur, par les lois, les politiques et les règlements du Canada et des accords internationaux. Ces dispositions permettent d'identifier la source de l'information et, dans certains cas, d'interdire la copie de documents sans permission écrite. Pour obtenir de plus amples renseignements : http://lois.justice.gc.ca/fr/showtdm/cs/C-42


© 2010 Her Majesty in Right of Canada. National Research Council of Canada, Ottawa, ON K1A 0R6
Office Occupants’ Evaluations of an Individually-Controllable Lighting System
Jennifer A. Veitch, Cara L. Donnelly, Anca D. Galasiu, Guy R. Newsham, Dan M. Sander and Chantal D. Arsenault
Research Report No. 299
National Research Council Canada Institute for Research in Construction
Ottawa, Ontario
2010-04-12

Occupants’ Evaluations of Individually-Controlled Lighting
NRC-IRC RR-299 2 of 81
Office Occupants’ Evaluations of an Individually-Controllable Lighting System
Jennifer A. Veitch, Cara L. Donnelly, Anca D. Galasiu, Guy R. Newsham, Dan M. Sander and Chantal D. Arsenault
Executive Summary
We conducted a field study on four floors of an office building in Burnaby, British Columbia, Canada. This was a typical deep-plan office building with cubicle accommodation and large windows. Individually-controllable workstation-specific suspended direct-indirect (WSDI-C) luminaires located centrally in each workstation provided lighting over most of the floor area. The luminaire had three control systems designed to reduce energy use (see Figure A): • An integrated occupancy sensor (OS), used to detect the presence or absence of
people and turn the direct downlight on and off accordingly. • An integrated light sensor (LS), used to monitor the light levels and dim the direct downlight to maintain the occupant’s preset preferred light level; the primary purpose of this control was to use daylight to offset electric lighting. • Individual control (IC), consisting of a graphical slider on the occupant’s computer screen allowing both on/off switching or dimming of the direct downlight to a preferred level. One half of one
floor featured a conventional ceiling-recessed parabolic-louvered lighting system for comparison with zonal on-off switching. The installed lighting power density in office areas served by the WSDI-C system was approximately 5.6 W/m2, versus 10 W/m2 in the office area with conventional lighting. The illuminance in the centre of the cubicles at desktop height was similar under both lighting systems, at 400 – 450 lux.
Data were collected from more than 80 workstations throughout 2005 to examine how the controls were used, the magnitude of the energy savings attributable to the controls, and whether provision of controls (and access to windows) improved environmental satisfaction, and job satisfaction-related outcomes. Data on control and energy use were collected during three distinct periods: • Phase 1: January 18 to March 11, light sensor was de-activated. • Phase 2: March 12 and October 2, all controls were in operation. • Phase 3: October 3 to December 31, all controls were in operation, and an
awareness campaign was conducted in which monthly e-mails were sent from management reminding employees about the availability of the individual control system, and how to use it. The control and energy use data were reported elsewhere [Galasiu et al., 2007]. This
report concerns the occupants’ evaluations of the office lighting as reported in three surveys:
Figure A. Illustration of the WSDI-C installation, and the three control options of the WSDI-C downlights.
LS
OS
IC

Occupants’ Evaluations of Individually-Controlled Lighting
NRC-IRC RR-299 3 of 81
two during Phase 2, and one during Phase 3. The survey included items on office and lighting appraisals, environmental satisfaction, and questions related to job satisfaction.
The WSDI-C system was associated with a superior indoor environment. Appraisals of the luminous environment and of environmental satisfaction were significantly and consistently higher for the occupants with WSDI-C compared to those with conventional lighting. For example, when presented with the statement, “Overall, the lighting is comfortable”, approximately 75% of respondents with the conventional lighting agreed, compared to ~95% of respondents with the WSDI-C. There was also a smaller beneficial effect for occupants seated in perimeter workstations. Although there was no direct link between provision of WSDI-C/window access and job satisfaction-related outcomes, there was an indirect link. Occupants with higher environmental satisfaction also had higher job satisfaction, higher organizational commitment, and lower intent to turnover (see Figure B).
Figure B. Full model of the linkages between indoor environment conditions and job satisfaction tested in this study.
The awareness campaign exhibited mixed results. It did stimulate occupants to use
the controls more frequently. However, the tendency was for preferred light levels to increase, perhaps because the campaign was conducted in late Fall-early Winter. This resulted in diminished energy savings. The increased awareness did not improve occupant satisfaction, perhaps because satisfaction was already high for occupants with WSDI-C.
Window
Proximity Personal Control
over Lighting
Satisfaction with Ventilation
Satisfaction with Lighting
Satisfaction with Privacy & Acoustics
Overall Environmental
Satisfaction
Job Satisfaction Organizational Commitment
Intent to Turnover

Occupants’ Evaluations of Individually-Controlled Lighting
NRC-IRC RR-299 4 of 81
Table of Contents 1 Introduction ............................................................................................................... 5
1.1 Lighting Controls and Energy Use ..................................................................... 5 1.2 Environmental satisfaction................................................................................. 5
2 Method ..................................................................................................................... 6 2.1 Site and Lighting ................................................................................................ 6 2.2 Research Design ............................................................................................... 8 2.3 Communications and Recruitment .................................................................. 10 2.4 Dependent Measures ...................................................................................... 11
3 Results ................................................................................................................... 11 3.1 Participants ...................................................................................................... 13
3.1.1 T1 dataset ................................................................................................. 13 3.1.2 T2 dataset. ................................................................................................ 13 3.1.3 T3 dataset. ................................................................................................ 14 3.1.4 BG dataset. ............................................................................................... 15 3.1.5 RM dataset. .............................................................................................. 16
3.2 Office Lighting Appraisals ................................................................................ 17 3.2.1 T1 results. ................................................................................................. 17 3.2.2 T2 results. ................................................................................................. 22 3.2.3 T3 results. ................................................................................................. 27 3.2.4 Summary: Office lighting appraisals. ........................................................ 33
3.3 Environmental Satisfaction .............................................................................. 33 3.3.1 General MANCOVA model. ...................................................................... 33 3.3.2 T1 results. ................................................................................................. 47 3.3.3 T2 results. ................................................................................................. 48 3.3.4 T3 results. ................................................................................................. 49 3.3.5 BG results. ................................................................................................ 50 3.3.6 RM results. ............................................................................................... 51 3.3.7 Summary: Environmental satisfaction. ..................................................... 52
3.4 Job Satisfaction ............................................................................................... 53 3.4.1 Analytic model. ......................................................................................... 53 3.4.2 T1 results. ................................................................................................. 56 3.4.3 T2 results. ................................................................................................. 57 3.4.4 T3 results. ................................................................................................. 59 3.4.5 Summary: Job satisfaction. ...................................................................... 61
3.5 Qualitative Office Appraisals ........................................................................... 61 3.5.1 T1 results. ................................................................................................. 62 3.5.2 T2 results. ................................................................................................. 65 3.5.3 T3 results. ................................................................................................. 68 3.5.4 Summary: Qualitative appraisals. ............................................................. 71
4 Discussion .............................................................................................................. 71 5 Conclusions ............................................................................................................ 73 References ................................................................................................................ 74 Acknowledgements ................................................................................................... 77 Appendix A: Online Questionnaire ............................................................................ 78

Occupants’ Evaluations of Individually-Controlled Lighting
NRC-IRC RR-299 5 of 81
1 Introduction
1.1 Lighting Controls and Energy Use As part of the national commitment to reduce greenhouse gas production and to
improve the state of the natural environment, Canadian buildings need to use less energy. Offices were reported in 2003 to have used 42% of the total energy used by the commercial/institutional sector, with lighting accounting for as much as 13.5% of the total building energy use, and 33% of the electricity use [NRCan, 2005]. Several research studies have generated promising results suggesting that large amounts of electrical energy can be saved by using good, optimized lighting control systems such as daylight-linked dimming and occupancy sensors [Maniccia et al., 1999; Jennings et al., 2000; Lee & Selkowitz, 2006]. Personal dimming controls were also shown to reduce energy use, while increasing occupant satisfaction [Boyce et al., 2003; Newsham et al., 2004].
Nevertheless, despite the fact that various energy saving technologies have been available to the building industry for some time, their implementation continues to be very slow. This is not surprising, however, given the scarcity of long-term performance assessments of real lighting installations incorporating such technologies that show that these systems do work as asserted and justify their higher investment cost. Even fewer studies have surveyed concurrently the opinions and preferences of the users of these systems. Most investigations either took place in laboratory settings, or reported failures in attaining the projected energy savings, revealing significant problems with their calibration and user acceptability [Bordass et al., 1994; Love, 1995; Slater, 1995 &1996].
A review of the scientific literature to date showed that there is almost no information available on the long-lasting success of energy-saving control systems when used in combination in real buildings. This project was designed to partially remedy this gap and to generate information that could improve the uptake of such lighting controls in buildings. The study took place in a real office building featuring an innovative lighting control system with the potential to save large amounts of electrical energy [Suvagau & Hughes, 2002]. It included the long-term monitoring of the lighting system, along with an evaluation of the building’s facades’ occlusion with internal blinds, and the evaluation of the occupants’ satisfaction with the lighting system and their work environment. The energy monitoring data have been previously reported elsewhere [Galasiu et al., 2007]. This report addresses only the occupants’ evaluation of the lighting system in their offices.
1.2 Environmental satisfaction Herzberg’s theory of motivation suggested that satisfactory working conditions had
no influence on positive employee attitudes and behaviour [Osland et al., 2000]. More recently, however, environmental psychology research has made clear that the physical work environment does influence various organizational outcomes, such as job satisfaction and individual and group performance [e.g., Brill, Weidemann, & BOSTI, 2001]. These attitudes and behaviours are essential to an organization’s bottom line. Therefore, the effects of the physical working environment can no longer be ignored.
NRC’s Cost-effective Open-Plan Environments (COPE) project, using survey data from 779 participants in 9 buildings, generated a statistically significant overall model linking satisfaction with lighting, ventilation, and privacy and acoustics to overall environmental satisfaction. Overall environmental satisfaction in turn was positively correlated with job satisfaction [Veitch et al., 2007]. Other aspects of the COPE research elucidated relationships between the physical environment and satisfaction with lighting, ventilation, and privacy and acoustics [Veitch et al., 2003 & 2005; Charles et al., 2006]. For example, the effect of distance to the nearest outside window at three levels (window in the workstation, window within 5 m from workstation, and window further than 5 m from

Occupants’ Evaluations of Individually-Controlled Lighting
NRC-IRC RR-299 6 of 81
workstation) revealed that closer proximity to a window was associated with higher rates of satisfaction with lighting. Previous research also showed that having personal control over lighting has a direct positive influence on overall environmental satisfaction [Boyce et al., 2003]. These findings suggest that the provision of lighting control systems and windows leads to more job satisfaction through their positive influence on environmental satisfaction.
Several studies have demonstrated the effect of job satisfaction on important aspects of organizational productivity. For example, using structural equation modeling, Williams and Hazer [1986], Gaertner [1999], and Yoon and Thye [2002] found that higher job satisfaction led to greater organizational commitment. Yousef [2002] demonstrated that job satisfaction mediated the relationship between job characteristics and organizational commitment. Research has also found that higher job satisfaction was correlated with lower employee turnover [Harter et al., 2002]. Likewise, lower levels of organizational commitment among employees have been linked to higher intent to turnover [Carlopio, 1996; Lambert et al., 2001]. Wilson et al. [2004] found job satisfaction and organizational commitment to be significantly related to turnover intentions.
Generally, the literature suggests an indirect path linking the provision of personal lighting control systems and windows to important organizational outcomes. That is, access to environmental controls and windows increases satisfaction with the environment [Boyce et al., 2003; Veitch et al., 2005]; satisfaction with the environment increases job satisfaction [Veitch et al., 2007]; job satisfaction increases organizational commitment [e.g., Yoon & Thye, 2002], and organizational commitment decreases turnover intentions [e.g., Carlopio, 1996]. Although there exists a logical chain of research findings linking environmental controls and window proximity to organizational outcomes, there has been as yet no direct test of this path in which a single sample provided data on all of these measures. This was the focus of the survey portion of the present study. The hypothesis tested was that satisfaction with the physical environment will be higher among participants with personal control over lighting and window access, and that there will also be small benefits for job satisfaction, organizational commitment, and intent to turnover associated with having access to these office features.
2 Method
2.1 Site and Lighting The office building incorporating the lighting control system investigated in this study
was a 12-storey rectangular, curtain-wall, green-tinted glazed structure located at sea level in large urban area in southwestern British Columbia at a latitude of 49°11’ and a longitude of 123°10’.
The host organization occupied the upper four floors in this building, their offices consisting mostly of open-plan areas (75% of total floor area) furnished with cubicle-type workstations and no private offices. A few enclosed areas are located at the core of the building providing shared spaces for meeting rooms, break rooms, and storage. Each floor had an approximate area of 835 m2. The height of the partitions between the workstations varied from 0.84 m next to the windows, to 1.25 m between two adjacent workstations, and 1.42 m next to the aisles. The building was remote from nearby constructions that could prevent ample daylight admittance into the open-plan space, and the fully-glazed façades offered in all four cardinal directions a distant view of both city and mountain landscape.
The lighting in the test areas consisted of individually controllable workstation-specific direct-indirect luminaires (abbreviated WSDI-C) suspended at about 0.3 meters below the ceiling and located centrally in each workstation (Figure 1). When fully on, each light fixture provided an average illuminance of 450 lux in the center of the workstation at 0.85 m above the floor (desktop height).

Occupants’ Evaluations of Individually-Controlled Lighting
NRC-IRC RR-299 7 of 81
Figure 1. Typical installation of the WSDI-C fixtures.
Each WSDI-C luminaire (Figure 1) consisted of 3x32 W 3500 K fluorescent lamps
connected by a network to a central control computer and to each occupant’s desktop computer. The fixture also included an occupancy sensor and a daylight photosensor.
The lamp in the center of the luminaire was equipped with a static electronic ballast and directed the light mainly upward, toward the ceiling, ensuring constant general lighting around the open-plan space. During the study, the uplights were controlled centrally based on a daily schedule that kept them continuously on at full power from 7:30 AM to 5 PM on workdays (Monday to Friday). During other times, the uplights were turned on by an integrated occupancy sensor when sensing occupancy in the vicinity.
The two lamps at the sides directed the light mainly downward, toward the desktop. The downlights were controlled during the study based on the following three control options (Figure 2): • An integrated occupancy sensor (OS), used to detect the presence or absence of
people and turn the downlight on and off accordingly. It consisted of an infrared motion sensor mounted directly on the light fixture and connected to a single low-voltage dimmable ballast that controlled both lamps of the downlight at the same time. The motion sensor automatically detected vacancy in the workspace and if the occupant was absent during a preset time, the sensor prompted the downlight to gradually dim down to zero and switch-off. When presence was detected, the downlight was automatically restored to the previously set lighting level. • An integrated light sensor (LS), used to monitor the surrounding light levels and dim the downlight when sufficient light (from either daylight or neighbouring electric light) was present to maintain the occupant preset light level. The light sensor consisted of a photocell mounted directly on the light fixture and connected to the dimmable ballast that controlled both lamps of the downlight simultaneously. • An individual control (IC), consisting of an on-screen slider located on the occupants desktop computers that allowed both on/off switching or dimming of the downlight to a preferred level.

Occupants’ Evaluations of Individually-Controlled Lighting
NRC-IRC RR-299 8 of 81
Figure 2. Illustration of the three control options of the WSDI-C downlights.
The field installation comprised a total of 195 WSDI-C fixtures distributed over three
and a half floors as shown in Table 1. A total of 104 WSDI-C fixtures were located in workstations situated at the perimeter of the building with direct access to windows; 56 WSDI-Cs were located in 2nd row workstations adjacent to the perimeter workstations at distances between 2.5 and 4.5 meters from the windows; and 35 WSDI-Cs were located at the core of the building at distances greater than 5.0 meters from the closest window.
The other half of floor D featured a conventional ceiling-recessed fluorescent lighting system comprising 2x4 parabolic-louvered luminaires with 2x32-T8 lamps (3500 K) and electronic ballasts. This area had zonal on/off switching, and the lights were on from 7:30 AM to 5 PM on workdays (Monday to Friday). The average illuminance provided by this system at desktop height in the center of the workstations was about 400 lux. The 195 WSDI-C fixtures replaced a total of 530 such lighting fixtures, which reduced the lighting power density in the areas where they were installed by almost half (5.6 W/m2 versus 10 W/m2).
Table 1. Distribution of the WSDI-C fixtures per floor and location relative to windows. Perimeter
Workstations 2
nd Row
WorkstationsInterior/Core Workstations
Total WS per floor
Floor A 31 19 3 53 Floor B 20 12 7 39 Floor C 35 19 19 73 Floor D 18 6 6 30 Total WS per distance to windows 104 56 35
2.2 Research Design This was a quasi-experimental investigation in which non-random groups of
participants were compared. Data on the demographic characteristics of the groups were used to ensure the approximate equivalence of the groups. Although this type of research does not permit the strong causal inference of a laboratory experiment, it has the potential for wider application because of its field setting [Cook & Campbell, 1979].
There were four independent variables of interest in this study: personal control over lighting, window proximity, an awareness campaign, and time.
Personal control over lighting consisted of two experimental groups: • individuals who had personal control over lighting through the WSDI-C system at their workstation (control);
LS
OS
IC

Occupants’ Evaluations of Individually-Controlled Lighting
NRC-IRC RR-299 9 of 81
• individuals who had conventional ceiling-recessed lighting with no personal control at their workstation (no control). Window proximity included three experimental groups: • individuals working in perimeter workstations with direct access to windows (window row); • individuals working in 2nd row workstations adjacent to the perimeter workstations and located at distances between 2.5 to 4.5 meters from the nearest window (aisle 2); • individuals working in workstations located at the core of the building at distances greater than 5 meters from the nearest window (aisle 3-5). The effect of workstation orientation (North vs. South vs. East vs. West vs. Corner
workstation) could not be examined due to the inadequate sample size of the experimental group in each category.
Survey data were collected at three times. The first survey administration took place in April 2005 (T1 dataset), the second in August 2005 (T2 dataset), and the third in November 2005 (T3 dataset).
Some participants completed more than one survey administration, which enabled repeated-measures analyses to examine change in effects over time (RM dataset). Time was an additional independent repeated-measures variable of interest in this study (T1 vs. T2 ). Typically, no change in effects over time would have been predicted.
An awareness campaign was implemented between T2 and T3. The campaign consisted of monthly e-mail reminders to all employees having WSDI-C lighting, reminding them about the WSDI-C control system, providing them with information on how to use it, and encouraging them to save energy by using the on-screen lighting controls:
[Let's Walk the Talk]. Just a reminder about the lighting system we have here at work -- let's take
full advantage of the benefits this system provides us... Lighting represents one of the major end users of energy in office buildings,
accounting typically for as much as 30% of the total building energy consumption. Energy use can be substantially reduced by using lighting control systems such as the one installed on our premises, which gives you personal control of the light level in your workstation via your computer. To learn more about the lighting system and to find instructions on installation and/or set up, please see the attached document. The awareness campaign was intended to increase use of the lighting controls, and
we expected that the increased awareness of the lighting controls should further increase lighting and environmental satisfaction. Therefore, the change in effects from pre-intervention (T1 and T2) to post-intervention (T3) was examined.
Because there were participants who only completed one survey administration either at T1, T2, or T3, between-groups analyses were also conducted to examine effects across time (BG dataset). Thus, time also served as a between-groups independent variable. There were only 8 participants who solely participated at T2, which was too few to form a separate group for analysis. Therefore, the T2 participants were combined with the T1 participants to form a pre-intervention group. The effects across time were examined by comparing the pre-intervention group with the T3 group, or the post-intervention group.
To summarize (see Table 2), this longitudinal field experiment: (1) examined the effects of personal control over lighting and window proximity using
five different non-independent datasets (T1, T2, T3, BG, and RM datasets);

Occupants’ Evaluations of Individually-Controlled Lighting
NRC-IRC RR-299 10 of 81
(2) compared pre-intervention (T1 and T2) effects versus post-intervention (T3) effects using the BG dataset; and
(3) examined change in effects from T1 to T2 to T3, and from pre-intervention to post-intervention, using the RM dataset.
Table 2. Summary of research datasets.
Dataset T1 April 2005 (Pre-intervention)
T2 August 2005 (Pre-intervention)
Intervention (awareness campaign)
T3 November 2005 (Post-intervention)
T1 X T2 X T3 X RM Participants who completed more than one survey administration BG Participants who completed only one survey administration
Organized in this way, this research design provided partial replications of the field
investigation. Replication is important because it strengthens the reliability of the conclusions of a study. For example, demonstrating once that personal control over lighting leads to satisfied employees would be interesting, but demonstrating it three times is convincing. In particular, comparisons using the BG and RM datasets were independent of one another. Obtaining similar results with these two datasets would provide strong evidence of a reliable effect.
2.3 Communications and Recruitment At each occasion, all occupants on the four floors were invited by e-mail to
participate in the survey. The e-mail message contained a link to the secure NRC site for the survey located on a server in Ottawa. Appendix A shows the online questionnaire.
The first page of the web site included a detailed consent form. The participants were asked to click on an “I consent” button to indicate that they understood and agreed to the conditions under which they took part in this research. Their decision to participate was voluntary and the participants were free to end their participation at any time during the survey. The questionnaire was administered over the Internet from a secure NRC website. Because it was essential for the outcome of the project to be able to link the responses of the participants with the location of their workstation in the open-plan workspace, each participant was provided with a unique ID access code to enter on the consent form when accessing the online survey. This was used together with information from the site to match the respondent to the unique IP address identifying each light fixture in the local area network. To increase the response rate, two reminder e-mails were sent to non-responding occupants at each survey occasion, at intervals of one week after the initial e-mail invitation.
Only the NRC project team had access to all the employees’ identifying information, and all the data conveying this information were held in secured storage controlled by the principal investigator.
The incentive to participate in the surveys was $1 per participating employee for the 1st survey, and $5 per participating employee for each of the 2nd and 3rd surveys. The payment was made to a charity supported by the host organization at the completion of each phase of the project and totalled C$1066 over the life of the project.
A follow-up thank-you e-mail message was sent to all participants following the close of each survey administration.

Occupants’ Evaluations of Individually-Controlled Lighting
NRC-IRC RR-299 11 of 81
2.4 Dependent Measures There were four constructs of interest in this study: office lighting appraisals,
environmental satisfaction, job satisfaction, and overall office appraisals. The online survey was composed of scales designed to measure these constructs.
Office Lighting Appraisals. Office lighting appraisal was measured with the Office Lighting Survey (OLS). The OLS items were developed by Eklund and Boyce [1996]. One strength of this survey is the availability of normative data for comparison. This scale was used in previous research where it was very useful in evaluating lighting conditions [Boyce et al., 2003]. These 10 items are in agree/disagree format.
Environmental Satisfaction. Four dependent variables were used as measures of environmental satisfaction: satisfaction with lighting, satisfaction with ventilation, satisfaction with privacy and acoustics, and overall environmental satisfaction. The set of questions used in these scales were those used in previous NRC research, which resulted in a series of research reports detailing the inter-relationships between physical environmental conditions, satisfaction with the physical environment, and overall environmental satisfaction [Veitch et al., 2003 & 2007]. There were a total of twenty questions relating to environmental satisfaction, all of which were rated on 7-point scales.
Job Satisfaction. Four dependent variables were used as measures of job satisfaction: job satisfaction (COPE), job satisfaction [Hackman & Oldham, 1980], organizational commitment, and intent to turnover. The two-item job satisfaction (COPE) scale was used in previous NRC research [Veitch et al., 2003 & 2007]. The three-item job satisfaction scale was developed by Hackman and Oldham [1980], and is among the most popular tools to measure this construct. The six-item scale of organizational commitment was developed by Meyer et al. [1993]. This scale uses the Allen and Meyer three-component conceptualization of organizational commitment [1990], which has been extensively tested and validated [Allen & Meyer, 1996]. The three-item scale of intent to turnover was developed by Colarelli [1984]. The fourteen items relating to job satisfaction were all measured on 7-point scales.
Overall Office Appraisals. Three open-ended questions were used to measure overall office appraisals. These questions offered an opportunity for participants to provide more detailed information about their satisfaction with the office design. These qualitative data were analyzed using inductive content analysis.
The survey also included demographic questions: age, sex, education level, and job type. On average, participants completed the entire survey in eight minutes.
3 Results Table 3 summarizes the scales, the number of items used in each scale, each
scale’s range, and the statistical techniques used to analyze the data. Conservative practices from the behavioural sciences guided the data analysis. For in-depth discussions of the statistical techniques used in this study, consult general works such as those by Ghiselli et al. [1981]; Keppel [1982]; Kerlinger and Lee [2000]; and Tabachnick and Fidell [2001].
Analysis of each dataset began with data cleaning and screening using recommended practices [e.g., Kerlinger & Lee, 2000; Kline, 1998; Tabachnick & Fidell, 2001]. Scale scores for the dependent variables were calculated using the rules for these established scales. Descriptive statistics were examined for all variables to test common statistical assumptions, such as normality of distribution, and also looked for outlying values and missing data. For missing data, if the number of cases was small, the analysis proceeded with the data that was available. If the number of cases was large, or there was evidence of a systematic loss, that variable was dropped from the analysis.

Occupants’ Evaluations of Individually-Controlled Lighting
NRC-IRC RR-299 12 of 81
The dependent variables were normally distributed after the removal of outliers; thus, no subsequent data transformations were necessary to convert the distributions to normality, which would have only complicated interpretation. The number of participants included varies slightly from one analysis to another because of missing data.
Table 3. Summary of dependent measures and analysis strategy.
Construct Dependent Measure
# of Items
Scale Range Cronbach's g Analysis Strategy
Office Lighting Appraisals
Office lighting survey 10 agree/disagree; worse/same/better
N/A Chi-squared
Environmental Satisfaction
Satisfaction with lighting
5 1 (very unsatisfied) to 7 (very satisfied)
.55 - .82 MANCOVA
Satisfaction with ventilation
3 1 (very unsatisfied) to 7 (very satisfied)
.80 - .85
Satisfaction with privacy & acoustics
10 1 (very unsatisfied) to 7 (very satisfied)
.92 - .93
Overall environmental satisfaction
2 1 (very unsatisfied) to 7 (very satisfied); 1 (30% less productive) to 7 (30% more productive)
.34 - .62
Job Satisfaction Job satisfaction (COPE)
2 1 (very unsatisfied) to 7 (very satisfied)
.42 - .85
Job satisfaction (Hackman & Oldham)
3 1 (very strongly disagree) to 7 (very strongly agree)
.89 - .94
Organizational commitment
6 1 (very strongly disagree) to 7 (very strongly agree)
.82 - .91
Intent to turnover 3 1 (very strongly disagree) to 7 (very strongly agree)
.70 - .85
Overall Office Appraisals
“What do you like most about your office?”
1 Open-ended N/A Content Analysis
“What do you like least about your office?”
1
“What would you change about your office?”
1
Note. Cronbach’s alpha (g) is a test of the reliability, or internal consistency reliability, of a scale and has possible values from 0-1 [Kerlinger & Lee, 2000]. As a general rule of thumb, alpha coefficients of .5 or above are acceptable.
With two exceptions, all scales demonstrated acceptable internal consistency.
Overall environmental satisfaction and job satisfaction (COPE) had low g coefficients in some of the datasets. However, for consistency, the scales were used in subsequent analyses because their respective items were inter-correlated in the expected direction, and their g coefficients were acceptable in most datasets.
For each dataset, outliers were identified by examining frequency distributions of standardised scores. Individuals with scores on any variable greater than 3 standard deviations from the mean were excluded from analysis. Each dataset was also examined to see whether the participating employees were representative of the overall workplace composition, using workplace population statistics provided by the host organization to provide the expected cell counts for a chi-squared (ȋ2) test.

Occupants’ Evaluations of Individually-Controlled Lighting
NRC-IRC RR-299 13 of 81
3.1 Participants Overall, the participants in this study were generally senior employees with more
experience than the overall population at the host organization. This potential source of bias will be discussed below.
3.1.1 T1 dataset E-mail invitations were sent to 207 employees at T1. Data were collected from 87
participants (3 incomplete surveys), yielding a response rate of 40.5%. After identifying and deleting three outliers, the final sample size was 81 for the T1 dataset. However, window location was unknown for six respondents.
Table 4 summarizes the T1 sample and the comparison to the workplace population. Findings revealed that the T1 sample had been employed by the host organization for a longer time than the overall workplace population.
Table 4. T1 sample characteristics.
Lighting Control Window Proximity No Yes Window 6 36 Aisle 2 3 12 Aisle 3-5 6 12 Location missing 3 3 T1 Sample % Population % Sex female 57 47 male 43 53 ȋ2
(1) 3.12 Age 20-30 12 18 31-40 32 36 41-50 32 27 51-60 20 18 over 60 4 1 ȋ2
(4) 8.62 Job Type administrative 25 22 technical 19 11 professional 35 47 managerial 21 20 ȋ2
(3) 7.43 Tenure at host 0-1 15 10 2-5 21 27 5-10 16 10 11-15 19 32 16-20 7 7 20+ 22 14 ȋ2
(5) 14.46* Note. N = 81. * p<=.05. ** p<=.01. *** p<=.001.
3.1.2 T2 dataset. E-mail invitations were sent to 193 employees at T2. Data were collected from 86
participants (3 incomplete surveys), yielding a response rate of 43%. After identifying and deleting five outliers, the final sample size was 78 for the T2 dataset. However, workstation location was unknown for five participants. As shown in Table 5, ȋ2 Goodness-of-Fit tests

Occupants’ Evaluations of Individually-Controlled Lighting
NRC-IRC RR-299 14 of 81
revealed that the T2 sample was older, had lower job status, and more tenure compared to the overall workplace population.
Table 5. T2 sample characteristics.
Lighting Control Window Proximity No Yes Window 8 37 Aisle 2 2 14 Aisle 3-5 4 8 Location missing 1 4 T2 Sample % Population % Sex female 53 47 male 47 53 ȋ2
(1) 0.97 Age 20-30 11 18 31-40 31 36 41-50 28 27 51-60 22 18 over 60 8 1 ȋ2
(4) 38.00*** Job Type administrative 29 22 technical 19 11 professional 32 47 managerial 19 20 ȋ2
(3) 10.52* Tenure at host 0-1 15 10 2-5 18 27 5-10 13 10 11-15 22 32 16-20 6 7 20+ 26 14 ȋ2
(5) 15.38** Note. N = 78. * p<=.05. ** p<=.01. *** p<=.001.
3.1.3 T3 dataset. E-mail invitations were sent to 189 employees at T3. Data were collected from 91
participants (3 incomplete), yielding a response rate of 46.5%. After identifying and deleting two outliers, the final sample size was 86 for the T3 dataset. Workstation location was unknown for 11 participants. As shown in Table 6, ȋ2 Goodness-of-Fit tests revealed that the T3 sample was older than the overall workplace population.

Occupants’ Evaluations of Individually-Controlled Lighting
NRC-IRC RR-299 15 of 81
Table 6. T3 sample characteristics. Lighting Control Window Proximity No Yes Window 10 40 Aisle 2 3 10 Aisle 3-5 6 6 Location missing 1 10 T3 Sample % Population % Sex female 53 47 male 47 53 ȋ2
(1) 0.23 Age 20-30 11 18 31-40 26 36 41-50 33 27 51-60 23 18 over 60 7 1 ȋ2
(4) 37.56*** Job Type administrative 27 22 technical 16 11 professional 32 47 managerial 25 20 ȋ2
(3) 7.72 Tenure at host 0-1 12 10 2-5 28 27 5-10 10 10 11-15 22 32 16-20 6 7 20+ 22 14 ȋ2
(5) 7.11 Note. N = 86. * p<=.05. ** p<=.01. *** p<=.001.
3.1.4 BG dataset. The BG participants were those who only participated in one survey administration,
either at T1, T2, or T3. There were 45 BG participants in total, none of whom were identified as outliers; however, window proximity was unknown for three participants at T1 and three at T3. As shown in Table 7, ȋ2 Goodness-of-Fit tests revealed that the BG sample had a higher proportion of females with less tenure compared to the overall workplace population.

Occupants’ Evaluations of Individually-Controlled Lighting
NRC-IRC RR-299 16 of 81
Table 7. BG sample characteristics. T1 T2 T3 Lighting Control Lighting Control Lighting Control Window Proximity No Yes No Yes No Yes Window 2 4 2 1 6 4 Aisle 2 1 2 0 2 2 2 Aisle 3-5 0 6 0 2 1 2 Location missing 2 1 0 0 0 3 BG Sample Population Sex % female 67 47 % male 33 53 ȋ2
(1) 6.99** Age % 20-30 18 18 % 31-40 29 36 % 41-50 38 27 % 51-60 13 18 % over 60 2 1 ȋ2
(4) 3.79 Job Type % administrative 24 22 % technical 18 11 % professional 40 47 % managerial 18 20 ȋ2
(3) 2.58 Tenure at host % 0-1 18 10 % 2-5 33 27 % 5-10 11 10 % 11-15 16 32 %16-20 16 7 % 20+ 7 14 ȋ2
(5) 13.68* Note. N = 45. * p<=.05. ** p<=.01. *** p<=.001.
3.1.5 RM dataset. The RM participants were those who participated in more than one survey
administration. There were 79 RM participants in total, but six were identified as outliers. After deleting the outliers, the total sample size was 73, although window proximity was unknown for three participants. As shown in Table 8, ȋ2 Goodness-of-Fit tests revealed that the RM sample was older, had fewer professionals, and were more tenured as compared to the overall workplace population.

Occupants’ Evaluations of Individually-Controlled Lighting
NRC-IRC RR-299 17 of 81
Table 8. RM sample characteristics. Lighting Control Window Proximity No Yes Window 4 41 Aisle 2 2 13 Aisle 3-5 4 6 Location missing 2 1 RM Sample
%Population %
Sex % female 49 47 % male 51 53 ȋ2
(1) 0.16 Age % 20-30 12 18 % 31-40 32 36 % 41-50 29 27 % 51-60 19 18 % over 60 8 1 ȋ2
(4) 39.90*** Job Type % administrative 25 22 % technical 19 11 % professional 33 47 % managerial 23 20 ȋ2
(3) 8.17* Tenure at host % 0-1 15 10 % 2-5 19 27 % 5-10 15 10 % 11-15 19 32 %16-20 4 7 % 20+ 27 14 ȋ2
(5) 19.39** Note. N = 73. * p<=.05. ** p<=.01. *** p<=.001.
We also compared the RM participants to the T1 and T2 participants who did not
continue (those in the BG groups for those times). Participants who dropped out were not significantly different from those who remained in the study.
3.2 Office Lighting Appraisals The OLS was used to measure office lighting appraisals. In this section, Pearson ȋ2
tests were used to test for differences in the pattern of OLS responses across experimental groups. Particularly, the tables of responses for personal control over lighting conditions (control vs. no control), and then for window proximity conditions (window row vs. aisle 2 vs. aisle 3-5) were examined. In addition, ȋ2 Goodness-of-Fit tests were used to compare the results for each of the above experimental groups against the normative data. The normative values were used as the expected values, and the difference between the observed and the expected values was tested. OLS data from T1, T2, and T3 were each analyzed.
3.2.1 T1 results. Table 9 shows that personal control over lighting yielded more positive lighting
appraisals overall. A larger proportion of participants with control (90%) compared to those without control (72%) and to the normative data (69%) agreed that the lighting was

Occupants’ Evaluations of Individually-Controlled Lighting
NRC-IRC RR-299 18 of 81
comfortable. Similarly, a smaller proportion of participants with control compared to those without control and to the normative data agreed that the lighting was uncomfortably bright (5% vs. 22% vs. 16%) and poorly distributed (11% vs. 22% vs. 25%). Likewise, 65% of those with control compared to 11% without control and 22% of the normative data agreed that lighting was better than lighting in similar workplaces in other buildings. Participants without control responded similarly to the normative data, except in regards to flicker: 22% of participants without control compared to 4% of the normative data agreed that the lights flicker throughout the day.
Table 9. T1 OLS appraisals by personal control over lighting. 1. Overall, the lighting is comfortable. Between-Groups Norm: 69% Agree ゅ2
(1) = 3.98* Control Count of total 57 of 63 % Agree 90 ゅ2
(1) 13.59*** No control Count of total 13 of 18 % Agree 72 ゅ2
(1) 0.09 2. The lighting is uncomfortably bright for the tasks that I perform. Between-Groups Norm: 16% Agree ゅ2
(1) = 5.41* Control Count of total 3 of 63 % Agree 5 ゅ2
(1) 5.92* No control Count of total 4 of 18 % Agree 22 ゅ2
(1) 0.52 3. The lighting is uncomfortably dim for the tasks that I perform. Between-Groups Norm: 14% Agree ゅ2
(1) = 1.89 Control Count of total 4 of 63 % Agree 6 ゅ2
(1) 3.06 No control Count of total 3 of 18 % Agree 17 ゅ2
(1) 0.11 4. The lighting is poorly distributed here. Between-Groups Norm: 25% Agree ゅ2
(1) = 1.47* Control Count of total 7 of 63 % Agree 11 ゅ2
(1) 6.48* No control Count of total 4 of 18 % Agree 22 ゅ2
(1) 0.07

Occupants’ Evaluations of Individually-Controlled Lighting
NRC-IRC RR-299 19 of 81
5. The lighting causes deep shadows. Between-Groups Norm: 15% Agree ゅ2
(1) = 0.02 Control Count of total 4 of 63 % Agree 6 ゅ2
(1) 3.70 No control Count of total 1 of 18 % Agree 6 ゅ2
(1) 1.26 6. Reflections from the light fixtures hinder my work. Between-Groups Norm: 19% Agree ゅ2
(1) = 14.73*** Control Count of total 0 of 63 % Agree 0 ゅ2
(1) 0 No control Count of total 4 of 18 % Agree 22 ゅ2
(1) 0.12 7. The light fixtures are too bright. Between-Groups Norm: 14% Agree ゅ2
(1) = 1.89 Control Count of total 4 of 63 % Agree 6 ゅ2
(1) 3.06 No control Count of total 3 of 18 % Agree 17 ゅ2
(1) 0.11 8. My skin is an unnatural tone under the lighting. Between-Groups Norm: 9% Agree ゅ2
(1) = 0.02 Control Count of total 4 of 63 % Agree 6 ゅ2
(1) 0.54 No control Count of total 1 of 18 % Agree 6 ゅ2
(1) 0.26 9. The lights flicker throughout the day. Between-Groups Norm: 4% Agree ゅ2
(1) = 10.29** Control Count of total 1 of 63 % Agree 2 ゅ2
(1) 0.96 No control Count of total 4 of 18 % Agree 22 ゅ2
(1) 15.57***

Occupants’ Evaluations of Individually-Controlled Lighting
NRC-IRC RR-299 20 of 81
10. How does the lighting compare to similar workplaces in other buildings? Between-Groups Norm: 19% worse – 60% same – 22% better ゅ2
(2) = 18.81*** Worse Same Better Control Count 3 of 63 19 of 63 41 of 63 % 5 30 65 ゅ2
(2) 69.90*** No control Count of total 5 of 18 11 of 18 2 of 18 % 28 61 11 ゅ2
(2) 1.72 Note. * p<=.05. ** p<=.01. *** p<=.001.
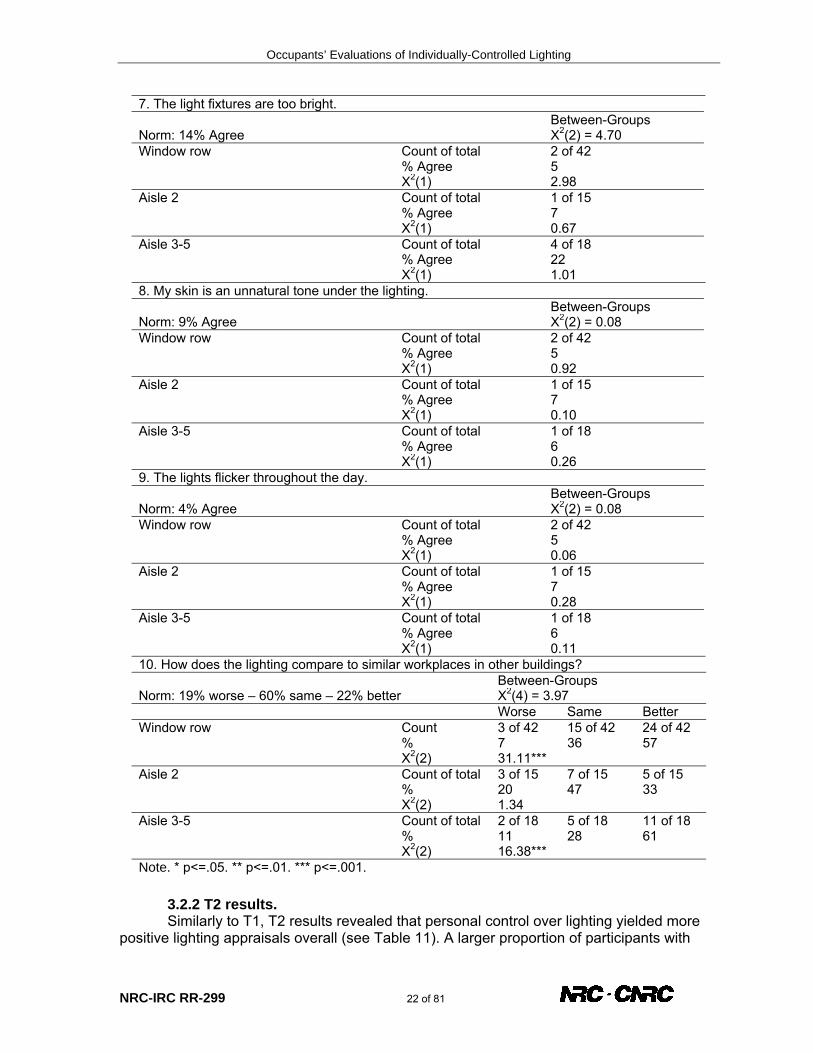
Table 10 shows that workstations located in a window row yielded more positive
lighting appraisals overall. A larger proportion of window row participants compared to the normative data agreed that the lighting was comfortable (90% vs. 69%) and better than lighting in similar workplaces in other buildings (57% vs. 22%). Similarly, a smaller proportion of window row participants compared to the normative data agreed that the lighting was uncomfortably bright (5% vs. 16%) and hindered work (2% vs. 19%). Although a larger proportion of window row participants had more positive lighting appraisals compared to aisle 2-5 participants, the differences were not significant. Aisle 2-5 participants responded similarly to the normative data with one exception: 61% of aisle 3-5 participants compared to 22% of the normative data agreed that the lighting was better than lighting in similar workplaces in other buildings.
Table 10. T1 OLS appraisals by window proximity. 1. Overall, the lighting is comfortable. Between-Groups Norm: 69% Agree ゅ2
(2) = 1.17 Window row Count of total 38 of 42 % Agree 90 ゅ2
(1) 9.06** Aisle 2 Count of total 12 of 15 % Agree 80 ゅ2
(1) 0.85 Aisle 3-5 Count of total 16 of 18 % Agree 89 ゅ2
(1) 3.33 2. The lighting is uncomfortably bright for the tasks that I perform. Between-Groups Norm: 16% Agree ゅ2
(2) = 2.47 Window row Count of total 2 of 42 % Agree 5 ゅ2
(1) 3.95* Aisle 2 Count of total 1 of 15 % Agree 7 ゅ2
(1) 0.97 Aisle 3-5 Count of total 3 of 18 % Agree 17 ゅ2
(1) 0.01

Occupants’ Evaluations of Individually-Controlled Lighting
NRC-IRC RR-299 21 of 81
3. The lighting is uncomfortably dim for the tasks that I perform. Between-Groups Norm: 14% Agree ゅ2
(2) = 2.37 Window row Count of total 3 of 42 % Agree 7 ゅ2
(1) 1.64 Aisle 2 Count of total 2 of 15 % Agree 13 ゅ2
(1) 0.01 Aisle 3-5 Count of total 0 of 18 % Agree 0 ゅ2
(1) 0 4. The lighting is poorly distributed here. Between-Groups Norm: 25% Agree ゅ2
(2) = 0.11 Window row Count of total 6 of 42 % Agree 14 ゅ2
(1) 2.57 Aisle 2 Count of total 2 of 15 % Agree 13 ゅ2
(1) 1.09 Aisle 3-5 Count of total 2 of 18 % Agree 11 ゅ2
(1) 1.85 5. The lighting causes deep shadows. Between-Groups Norm: 15% Agree ゅ2
(2) = 1.34 Window row Count of total 3 of 42 % Agree 7 ゅ2
(1) 2.03 Aisle 2 Count of total 1 of 15 % Agree 7 ゅ2
(1) 0.82 Aisle 3-5 Count of total 0 of 18 % Agree 0 ゅ2
(1) 0 6. Reflections from the light fixtures hinder my work. Between-Groups Norm: 19% Agree ゅ2
(2) = 3.28 Window row Count of total 1 of 42 % Agree 2 ゅ2
(1) 7.54** Aisle 2 Count of total 0 of 15 % Agree 0 ゅ2
(1) 0 Aisle 3-5 Count of total 2 of 18 % Agree 11 ゅ2
(1) 0.73
Occupants’ Evaluations of Individually-Controlled Lighting
NRC-IRC RR-299 22 of 81
7. The light fixtures are too bright. Between-Groups Norm: 14% Agree ゅ2
(2) = 4.70 Window row Count of total 2 of 42 % Agree 5 ゅ2
(1) 2.98 Aisle 2 Count of total 1 of 15 % Agree 7 ゅ2
(1) 0.67 Aisle 3-5 Count of total 4 of 18 % Agree 22 ゅ2
(1) 1.01 8. My skin is an unnatural tone under the lighting. Between-Groups Norm: 9% Agree ゅ2
(2) = 0.08 Window row Count of total 2 of 42 % Agree 5 ゅ2
(1) 0.92 Aisle 2 Count of total 1 of 15 % Agree 7 ゅ2
(1) 0.10 Aisle 3-5 Count of total 1 of 18 % Agree 6 ゅ2
(1) 0.26 9. The lights flicker throughout the day. Between-Groups Norm: 4% Agree ゅ2
(2) = 0.08 Window row Count of total 2 of 42 % Agree 5 ゅ2
(1) 0.06 Aisle 2 Count of total 1 of 15 % Agree 7 ゅ2
(1) 0.28 Aisle 3-5 Count of total 1 of 18 % Agree 6 ゅ2
(1) 0.11 10. How does the lighting compare to similar workplaces in other buildings? Between-Groups Norm: 19% worse – 60% same – 22% better ゅ2
(4) = 3.97 Worse Same Better Window row Count 3 of 42 15 of 42 24 of 42 % 7 36 57 ゅ2
(2) 31.11*** Aisle 2 Count of total 3 of 15 7 of 15 5 of 15 % 20 47 33 ゅ2
(2) 1.34 Aisle 3-5 Count of total 2 of 18 5 of 18 11 of 18 % 11 28 61 ゅ2
(2) 16.38*** Note. * p<=.05. ** p<=.01. *** p<=.001.
3.2.2 T2 results. Similarly to T1, T2 results revealed that personal control over lighting yielded more
positive lighting appraisals overall (see Table 11). A larger proportion of participants with

Occupants’ Evaluations of Individually-Controlled Lighting
NRC-IRC RR-299 23 of 81
control compared to the normative data agreed that the lighting was comfortable (95% vs. 69%) and better than lighting in similar workplaces in other buildings (66% vs. 22%). Likewise, a smaller proportion of participants with control compared to the normative data agreed that the lighting was uncomfortably bright (5% vs. 16%), poorly distributed (6% vs. 25%), caused deep shadows (2% vs. 15%), hindered work (5% vs. 19%), was too bright (2% vs. 14%), and caused unnatural skin tones (2% vs. 9%). Although a larger proportion of participants with control compared to those without control had more positive lighting appraisals, results revealed only one significant between-groups difference: 66% of participants with control compared to 20% of participants without control agreed that the lighting was better than lighting in similar workplaces in other buildings. Participants without control responded similarly to the normative data.
Table 11. T2 OLS appraisals by personal control over lighting. 1. Overall, the lighting is comfortable. Between-Groups Norm: 69% Agree ゅ2
(1) = 1.48 Control Count of total 60 of 63 % Agree 95 ゅ2
(1) 20.23*** No control Count of total 13 of 15 % Agree 87 ゅ2
(1) 2.19 2. The lighting is uncomfortably bright for the tasks that I perform. Between-Groups Norm: 16% Agree ゅ2
(1) = 0.09 Control Count of total 3 of 63 % Agree 5 ゅ2
(1) 5.92* No control Count of total 1 of 15 % Agree 7 ゅ2
(1) 0.97 3. The lighting is uncomfortably dim for the tasks that I perform. Between-Groups Norm: 14% Agree ゅ2
(1) = 0.00 Control Count of total 4 of 63 % Agree 6 ゅ2
(1) 3.06 No control Count of total 1 of 15 % Agree 7 ゅ2
(1) 0.67 4. The lighting is poorly distributed here. Between-Groups Norm: 25% Agree ゅ2
(1) = 2.76 Control Count of total 4 of 63 % Agree 6 ゅ2
(1) 11.69** No control Count of total 3 of 15 % Agree 20 ゅ2
(1) 0.20

Occupants’ Evaluations of Individually-Controlled Lighting
NRC-IRC RR-299 24 of 81
5. The lighting causes deep shadows. Between-Groups Norm: 15% Agree ゅ2
(1) = 1.36 Control Count of total 1 of 62 % Agree 2 ゅ2
(1) 8.72** No control Count of total 1 of 14 % Agree 7 ゅ2
(1) 0.68 6. Reflections from the light fixtures hinder my work. Between-Groups Norm: 19% Agree ゅ2
(1) = 0.09 Control Count of total 3 of 63 % Agree 5 ゅ2
(1) 8.30** No control Count of total 1 of 15 % Agree 7 ゅ2
(1) 1.48 7. The light fixtures are too bright. Between-Groups Norm: 14% Agree ゅ2
(1) = 4.52 Control Count of total 1 of 63 % Agree 2 ゅ2
(1) 8.06** No control Count of total 2 of 15 % Agree 13 ゅ2
(1) 0.01 8. My skin is an unnatural tone under the lighting. Between-Groups Norm: 9% Agree ゅ2
(1) = 4.52 Control Count of total 1 of 63 % Agree 2 ゅ2
(1) 4.23* No control Count of total 2 of 15 % Agree 13 ゅ2
(1) 0.34 9. The lights flicker throughout the day. Between-Groups Norm: 4% Agree ゅ2
(1) = 4.12 Control Count of total 0 of 63 % Agree 0 ゅ2
(1) 0 No control Count of total 1 of 15 % Agree 7 ゅ2
(1) 0.28

Occupants’ Evaluations of Individually-Controlled Lighting
NRC-IRC RR-299 25 of 81
10. How does the lighting compare to similar workplaces in other buildings? Between-Groups Norm: 19% worse – 60% same – 22% better ゅ2
(2) = 12.43** Worse Same Better Control Count 1 of 62 20 of 62 41 of 62 % 2 32 66 ゅ2
(2) 73.42*** No control Count of total 2 of 15 10 of 15 3 of 15 % 13 67 20 ゅ2
(2) 0.39 Note. * p<=.05. ** p<=.01. *** p<=.001.
In terms of window proximity, T2 results were also similar to those observed at T1.
That is, workstations located in a window row yielded more positive lighting appraisals overall (see Table 12). A larger proportion of window row participants compared to the normative data agreed that the lighting was comfortable (98% vs. 69%) and better than lighting in similar workplaces in other buildings (62% vs. 22%). Similarly, a smaller proportion of window row participants compared to the normative data agreed that the lighting was uncomfortably bright (2% vs. 16%), uncomfortably dim (2% vs. 14%), poorly distributed (7% vs. 25%), hindered work (4% vs. 19%), and was too bright (2% vs. 14%). Only one significant between-groups difference was observed wherein 25% of aisle 3-5 participants compared to 0% in aisle 2 and 2% in the window row agreed that the lighting was uncomfortably bright for the tasks that they perform. Aisle 2-5 participants responded similarly to the normative data.
Table 12. T2 OLS appraisals by window proximity. 1. Overall, the lighting is comfortable. Between-Groups Norm: 69% Agree ゅ2
(2) = 3.84 Window row Count of total 44 of 45 % Agree 98 ゅ2
(1) 17.42*** Aisle 2 Count of total 15 of 16 % Agree 94 ゅ2
(1) 4.58* Aisle 3-5 Count of total 10 of 12 % Agree 83 ゅ2
(1) 1.15 2. The lighting is uncomfortably bright for the tasks that I perform. Between-Groups Norm: 16% Agree ゅ2
(2) = 10.69** Window row Count of total 1 of 45 % Agree 2 ゅ2
(1) 6.36* Aisle 2 Count of total 0 of 16 % Agree 0 ゅ2
(1) 0 Aisle 3-5 Count of total 3 of 12 % Agree 25 ゅ2
(1) 0.72

Occupants’ Evaluations of Individually-Controlled Lighting
NRC-IRC RR-299 26 of 81
3. The lighting is uncomfortably dim for the tasks that I perform. Between-Groups Norm: 14% Agree ゅ2
(2) = 2.63 Window row Count of total 1 of 45 % Agree 2 ゅ2
(1) 5.19* Aisle 2 Count of total 2 of 16 % Agree 13 ゅ2
(1) 0.03 Aisle 3-5 Count of total 1 of 12 % Agree 8 ゅ2
(1) 0.32 4. The lighting is poorly distributed here. Between-Groups Norm: 25% Agree ゅ2
(2) = 1.69 Window row Count of total 3 of 45 % Agree 7 ゅ2
(1) 8.07** Aisle 2 Count of total 2 of 16 % Agree 13 ゅ2
(1) 1.33 Aisle 3-5 Count of total 0 of 12 % Agree 0 ゅ2
(1) 0 5. The lighting causes deep shadows. Between-Groups Norm: 15% Agree ゅ2
(2) = 3.49 Window row Count of total 0 of 43 % Agree 0 ゅ2
(1) 0 Aisle 2 Count of total 1 of 16 % Agree 6 ゅ2
(1) 0.96 Aisle 3-5 Count of total 0 of 12 % Agree 0 ゅ2
(1) 0 6. Reflections from the light fixtures hinder my work. Between-Groups Norm: 19% Agree ゅ2
(2) = 0.30 Window row Count of total 2 of 45 % Agree 4 ゅ2
(1) 6.20* Aisle 2 Count of total 1 of 16 % Agree 6 ゅ2
(1) 1.69 Aisle 3-5 Count of total 1 of 12 % Agree 8 ゅ2
(1) 0.89

Occupants’ Evaluations of Individually-Controlled Lighting
NRC-IRC RR-299 27 of 81
7. The light fixtures are too bright. Between-Groups Norm: 14% Agree ゅ2
(2) = 5.89 Window row Count of total 1 of 45 % Agree 2 ゅ2
(1) 5.19* Aisle 2 Count of total 0 of 16 % Agree 0 ゅ2
(1) 0 Aisle 3-5 Count of total 2 of 12 % Agree 17 ゅ2
(1) 0.07 8. My skin is an unnatural tone under the lighting. Between-Groups Norm: 9% Agree ゅ2
(2) = 3.79 Window row Count of total 1 of 45 % Agree 2 ゅ2
(1) 2.52 Aisle 2 Count of total 2 of 16 % Agree 13 ゅ2
(1) 0.24 Aisle 3-5 Count of total 0 of 12 % Agree 0 ゅ2
(1) 0 9. The lights flicker throughout the day. Between-Groups Norm: 4% Agree ゅ2
(2) = 3.49 Window row Count of total 0 of 43 % Agree 0 ゅ2
(1) 0 Aisle 2 Count of total 1 of 16 % Agree 6 ゅ2
(1) 0.21 Aisle 3-5 Count of total 0 of 12 % Agree 0 ゅ2
(1) 0 10. How does the lighting compare to similar workplaces in other buildings? Between-Groups Norm: 19% worse – 60% same – 22% better ゅ2
(4) = 2.54 Worse Same Better Window row Count 1 of 45 16 of 45 28 of 45 % 2 36 62 ゅ2
(2) 44.98*** Aisle 2 Count of total 1 of 16 8 of 16 7 of 16 % 6 50 44 ゅ2
(2) 5.13 Aisle 3-5 Count of total 1 of 12 5 of 12 6 of 12 % 8 42 50 ゅ2
(2) 5.73 Note. * p<=.05. ** p<=.01. *** p<=.001.
3.2.3 T3 results. Consistent with T1 and T2, personal control over lighting yielded more positive
lighting appraisals at T3 (see Table 13). A larger proportion of participants with control

Occupants’ Evaluations of Individually-Controlled Lighting
NRC-IRC RR-299 28 of 81
compared to those without control and to the normative data agreed that the lighting was comfortable (94% vs. 75% vs. 69%) and better than lighting in similar workplaces in other buildings (57% vs. 25% vs. 22%). Likewise, a smaller proportion of participants with control compared to those without control and to the normative data agreed that the lighting was uncomfortably bright (3% vs. 20% vs. 16%), poorly distributed (12% vs. 35% vs. 25%), and too bright (2% vs. 20% vs. 14%). Also, a smaller proportion of participants with control compared to the normative data agreed that lighting caused deep shadows (6% vs. 15%) and hindered work (5% vs. 19%). Participants without control responded similarly to the normative data.
Table 13. T3 OLS appraisals by personal control over lighting. 1. Overall, the lighting is comfortable. Between-Groups Norm: 69% Agree ゅ2
(1) = 5.88* Control Count of total 62 of 66 % Agree 94 ゅ2
(1) 19.19*** No control Count of total 15 of 20 % Agree 75 ゅ2
(1) 0.34 2. The lighting is uncomfortably bright for the tasks that I perform. Between-Groups Norm: 16% Agree ゅ2
(1) = 6.81** Control Count of total 2 of 66 % Agree 3 ゅ2
(1) 8.26** No control Count of total 4 of 20 % Agree 20 ゅ2
(1) 0.24 3. The lighting is uncomfortably dim for the tasks that I perform. Between-Groups Norm: 14% Agree ゅ2
(1) = 0.83 Control Count of total 8 of 66 % Agree 12 ゅ2
(1) 0.19 No control Count of total 1 of 20 % Agree 5 ゅ2
(1) 1.35 4. The lighting is poorly distributed here. Between-Groups Norm: 25% Agree ゅ2
(1) = 5.58* Control Count of total 8 of 66 % Agree 12 ゅ2
(1) 5.84* No control Count of total 7 of 20 % Agree 35 ゅ2
(1) 1.07

Occupants’ Evaluations of Individually-Controlled Lighting
NRC-IRC RR-299 29 of 81
5. The lighting causes deep shadows. Between-Groups Norm: 15% Agree ゅ2
(1) = 1.64 Control Count of total 4 of 66 % Agree 6 ゅ2
(1) 4.14* No control Count of total 3 of 20 % Agree 15 ゅ2
(1) 0.00 6. Reflections from the light fixtures hinder my work. Between-Groups Norm: 19% Agree ゅ2
(1) = 0.83 Control Count of total 3 of 66 % Agree 5 ゅ2
(1) 8.96** No control Count of total 2 of 20 % Agree 10 ゅ2
(1) 1.05 7. The light fixtures are too bright. Between-Groups Norm: 14% Agree ゅ2
(1) = 9.58** Control Count of total 1 of 66 % Agree 2 ゅ2
(1) 8.54** No control Count of total 4 of 20 % Agree 20 ゅ2
(1) 0.60 8. My skin is an unnatural tone under the lighting. Between-Groups Norm: 9% Agree ゅ2
(1) = 1.78 Control Count of total 6 of 66 % Agree 9 ゅ2
(1) 0.00 No control Count of total 4 of 20 % Agree 20 ゅ2
(1) 2.96 9. The lights flicker throughout the day. Between-Groups Norm: 4% Agree ゅ2
(1) = 3.34 Control Count of total 0 of 66 % Agree 0 ゅ2
(1) 0 No control Count of total 1 of 20 % Agree 5 ゅ2
(1) 0.05

Occupants’ Evaluations of Individually-Controlled Lighting
NRC-IRC RR-299 30 of 81
10. How does the lighting compare to similar workplaces in other buildings? Between-Groups Norm: 19% worse – 60% same – 22% better ゅ2
(2) = 17.87*** Worse Same Better Control Count 2 of 65 26 of 65 37 of 65 % 3 40 57 ゅ2
(2) 49.53*** No control Count of total 7 of 20 8 of 20 5 of 20 % 35 40 25 ゅ2
(2) 4.15 Note. * p<=.05. ** p<=.01. *** p<=.001.
Also consistent with T1 and T2, workstations located in a window row yielded more
positive lighting appraisals at T3 (see Table 14). A larger proportion of window row participants compared to the normative data agreed that the lighting was comfortable (92% vs. 69%) and better than lighting in similar workplaces in other buildings (54% vs. 22%). Also, a smaller proportion of window row participants compared to the normative data agreed that the lighting was uncomfortably bright (4% vs. 16%), hindered work (2% vs. 19%), and was too bright (2% vs. 14%). Two significant between-groups differences were observed: 2% of window row participants compared to 8% in aisle 2 and 25% in aisle 3-5 agreed that the reflections from the light hindered work; and 6% of window row participants compared to 31% in aisle 2 and 25% in aisle 3-5 agreed that lighting caused unnatural skin tones. Aisle 2-5 participants responded similarly to the normative data with one exception: 31% of aisle 2 participants compared to 9% of the normative data agreed that lighting caused unnatural skin tones.
Table 14. T3 OLS appraisals by window proximity. 1. Overall, the lighting is comfortable. Between-Groups Norm: 69% Agree ゅ2
(2) = 3.08 Window row Count of total 46 of 50 % Agree 92 ゅ2
(1) 12.37*** Aisle 2 Count of total 12 of 13 % Agree 92 ゅ2
(1) 3.30 Aisle 3-5 Count of total 9 of 12 % Agree 75 ゅ2
(1) 0.20 2. The lighting is uncomfortably bright for the tasks that I perform. Between-Groups Norm: 16% Agree ゅ2
(2) = 2.52 Window row Count of total 2 of 50 % Agree 4 ゅ2
(1) 5.36* Aisle 2 Count of total 1 of 13 % Agree 8 ゅ2
(1) 0.67 Aisle 3-5 Count of total 2 of 12 % Agree 17 ゅ2
(1) 0.00

Occupants’ Evaluations of Individually-Controlled Lighting
NRC-IRC RR-299 31 of 81
3. The lighting is uncomfortably dim for the tasks that I perform. Between-Groups Norm: 14% Agree ゅ2
(2) = 2.54 Window row Count of total 4 of 50 % Agree 8 ゅ2
(1) 1.50 Aisle 2 Count of total 3 of 13 % Agree 23 ゅ2
(1) 0.89 Aisle 3-5 Count of total 1 of 12 % Agree 8 ゅ2
(1) 0.32 4. The lighting is poorly distributed here. Between-Groups Norm: 25% Agree ゅ2
(2) = 0.39 Window row Count of total 9 of 50 % Agree 18 ゅ2
(1) 1.31 Aisle 2 Count of total 3 of 13 % Agree 23 ゅ2
(1) 0.03 Aisle 3-5 Count of total 3 of 12 % Agree 25 ゅ2
(1) 0.00 5. The lighting causes deep shadows. Between-Groups Norm: 15% Agree ゅ2
(2) = 4.18 Window row Count of total 3 of 50 % Agree 6 ゅ2
(1) 3.18 Aisle 2 Count of total 1 of 13 % Agree 8 ゅ2
(1) 0.54 Aisle 3-5 Count of total 3 of 12 % Agree 25 ゅ2
(1) 0.94 6. Reflections from the light fixtures hinder my work. Between-Groups Norm: 19% Agree ゅ2
(2) = 8.25* Window row Count of total 1 of 50 % Agree 2 ゅ2
(1) 9.39** Aisle 2 Count of total 1 of 13 % Agree 8 ゅ2
(1) 1.09 Aisle 3-5 Count of total 3 of 12 % Agree 25 ゅ2
(1) 0.28

Occupants’ Evaluations of Individually-Controlled Lighting
NRC-IRC RR-299 32 of 81
7. The light fixtures are too bright. Between-Groups Norm: 14% Agree ゅ2
(2) = 4.30 Window row Count of total 1 of 50 % Agree 2 ゅ2
(1) 5.98* Aisle 2 Count of total 1 of 13 % Agree 8 ゅ2
(1) 0.43 Aisle 3-5 Count of total 2 of 12 % Agree 17 ゅ2
(1) 0.07 8. My skin is an unnatural tone under the lighting. Between-Groups Norm: 9% Agree ゅ2
(2) = 7.16* Window row Count of total 3 of 50 % Agree 6 ゅ2
(1) 0.55 Aisle 2 Count of total 4 of 13 % Agree 31 ゅ2
(1) 7.52** Aisle 3-5 Count of total 3 of 12 % Agree 25 ゅ2
(1) 3.75 9. The lights flicker throughout the day. Between-Groups Norm: 4% Agree ゅ2
(2) = 5.32 Window row Count of total 0 of 50 % Agree 0 ゅ2
(1) 0 Aisle 2 Count of total 0 of 13 % Agree 0 ゅ2
(1) 0 Aisle 3-5 Count of total 1 of 12 % Agree 8 ゅ2
(1) 0.59 10. How does the lighting compare to similar workplaces in other buildings? Between-Groups Norm: 19% worse – 60% same – 22% better ゅ2
(4) = 7.68 Worse Same Better Window row Count 2 of 50 21 of 50 27 of 50 % 4 42 54 ゅ2
(2) 32.20*** Aisle 2 Count of total 3 of 13 4 of 13 6 of 13 % 23 31 46 ゅ2
(2) 5.47 Aisle 3-5 Count of total 3 of 11 4 of 11 4 of 11 % 27 36 36 ゅ2
(2) 2.48 Note. * p<=.05. ** p<=.01. *** p<=.001.

Occupants’ Evaluations of Individually-Controlled Lighting
NRC-IRC RR-299 33 of 81
3.2.4 Summary: Office lighting appraisals. Taken together, patterns of responses for the set of items in the OLS were consistent
across T1, T2, and T3. The overall findings suggest that people with personal control over lighting and/or with workstations located in a window row have more positive lighting appraisals. Given the consistency in responding, lighting appraisals did not seem to be influenced by the awareness campaign that occurred between T2 and T3.
3.3 Environmental Satisfaction 3.3.1 General MANCOVA model. Four dependent variables were used as measures of environmental satisfaction:
satisfaction with lighting, satisfaction with ventilation, satisfaction with privacy and acoustics, and overall environmental satisfaction. We analyzed this set of variables as a multivariate construct using MANCOVA.
Because of the missing data for window proximity, we decided to conduct separate analyses for lighting control and window proximity. This maintained the largest possible sample size for the lighting control comparisons, which were of greatest interest to us.
We were specifically interested in testing the main effects and interactions of the following planned comparisons: • For personal control over lighting, we tested for differences between control versus
no control conditions. • For window proximity, we compared window row versus aisle 2, window row versus aisle 3-5, and aisle 2 versus aisle 3-5. • For time, we examined T1 versus T2, T1 versus T3, T2 versus T3. • For the awareness campaign, we tested pre-intervention (T1 + T2) versus post-intervention (T3). We expected to find that personal control over lighting, window row locations, and
T3, post-intervention, would yield higher mean ratings of satisfaction with lighting and overall environmental satisfaction as compared to the other conditions. No effects were expected on satisfaction with ventilation or satisfaction with privacy and acoustics.
Preliminary testing for experimental group equivalency revealed significant differences in sex, age, education, job type, and tenure. Education was selected as a single covariate to account for these differences in the analyses because it substantially correlated with the other possible covariates and with the dependent variables (bivariate correlations for T1, T2, T3, BG, and RM datasets are shown in Tables 15 to 19). Only one optimal covariate was selected, as statistical power is reduced with each added covariate (Tabachnick & Fidell, 2001).
Our interpretation of the MANCOVA results followed standard rules: we interpreted significant planned comparisons if the multivariate test was significant and if at least one univariate test was significant. Significant interactions among the planned comparisons were further probed using post hoc tests to ascertain the exact nature of the interaction. A significant interaction means that the effect of one variable is different depending on the level of the second variable. The nature of the interaction qualifies the interpretation of the main effect. Therefore, statistically significant interactions of our planned comparisons were interpreted first, followed by statistically significant main effects. The practice of interpreting significant effects in this manner limits the possibility of Type I statistical errors.
We also reported effect sizes for all statistically significant effects. Our effect sizes are reported as percentages of variance explained (Ș2
partial). We interpreted them using Cohen’s [1988] guidelines for small, medium, and large effects. A small effect explains ~1% of the variance, a medium effect ~9%, and a large effect ~25%.

Occupants’ Evaluations of Individually-Controlled Lighting
NRC-IRC RR-299 34 of 81
Table 15. Bivariate Correlations at T1.
Age Sex Job Cat. Educ. Tenure Sat. w/ Ltg
Sat. w/ Vent
Sat. w/ Pr & Acoust.
Overall Env. Sat.
Job Sat. (COPE)
Job Sat. (H & O) Org. Com.
Age r 1.00
p .
Sex r 0.13 1.00
p 0.25 .
Job Category r 0.01 0.30 1.00
p 0.91 0.01 .
Education r -0.17 0.32 0.49 1.00
p 0.13 0.00 0.00 .
Job Tenure r 0.68 0.11 0.00 -0.29 1.00
p 0.00 0.33 0.97 0.01 .
Sat. w/ Ltg. r 0.19 0.06 0.03 -0.04 0.28 1.00
p 0.09 0.58 0.77 0.75 0.01 .
Sat. w/ Vent. r 0.05 0.18 0.06 0.18 0.06 0.43 1.00
p 0.67 0.11 0.59 0.10 0.57 0.00 .
Sat. w/ Pr. r 0.01 -0.08 -0.18 -0.28 0.11 0.52 0.43 1.00
& Acous. p 0.93 0.49 0.11 0.01 0.34 0.00 0.00 .
Overall Env. r -0.10 -0.04 -0.22 -0.12 -0.04 0.48 0.34 0.64 1.00
Sat. p 0.39 0.71 0.05 0.27 0.75 0.00 0.00 0.00 .
Job Sat. r 0.12 -0.04 0.04 -0.19 0.13 0.22 0.32 0.44 0.25 1.00
(COPE) p 0.30 0.72 0.74 0.10 0.26 0.05 0.00 0.00 0.03 .
Job Sat. r 0.20 0.06 0.06 -0.18 0.17 0.17 0.23 0.28 0.10 0.78 1.00
(H & O p 0.08 0.56 0.60 0.10 0.12 0.13 0.04 0.01 0.37 0.00 .
Org. Commit. r 0.26 0.05 -0.08 -0.33 0.24 0.22 0.26 0.46 0.20 0.77 0.76 1.00
p 0.02 0.65 0.46 0.00 0.03 0.05 0.02 0.00 0.08 0.00 0.00 .
Intent to r -0.17 -0.06 0.12 0.24 -0.20 -0.15 -0.21 -0.22 -0.17 -0.62 -0.68 -0.69
Turnover p 0.12 0.60 0.29 0.03 0.07 0.17 0.06 0.05 0.12 0.00 0.00 0.00
Note. r = Pearson correlation coefficient. p = Significance level, 2-tailed. N = 81.

Occupants’ Evaluations of Individually-Controlled Lighting
NRC-IRC RR-299 35 of 81
Table 16. Bivariate Correlations at T2.
Age Sex Job Cat. Educ. Tenure Sat. w/ Ltg
Sat. w/ Vent
Sat. w/ Pr & Acoust.
Overall Env. Sat.
Job Sat. (COPE)
Job Sat. (H & O) Org. Com.
Age r 1.00
p .
Sex r 0.16 1.00
p 0.15 .
Job Category r -0.10 0.41 1.00
p 0.38 0.00 .
Education r -0.29 0.33 0.53 1.00
p 0.01 0.00 0.00 .
Job Tenure r 0.68 0.23 -0.04 -0.38 1.00
p 0.00 0.05 0.73 0.00 .
Sat. w/ Ltg. r 0.41 0.13 0.05 -0.06 0.22 1.00
p 0.00 0.27 0.69 0.60 0.05 .
Sat. w/ Vent. r 0.07 0.07 -0.12 0.00 0.12 0.39 1.00
p 0.54 0.55 0.31 0.99 0.29 0.00 .
Sat. w/ Pr. r 0.09 -0.13 -0.30 -0.29 0.04 0.41 0.46 1.00
& Acous. p 0.44 0.27 0.01 0.01 0.74 0.00 0.00 .
Overall Env. r -0.02 0.01 -0.21 -0.07 -0.15 0.36 0.54 0.61 1.00
Sat. p 0.89 0.96 0.06 0.55 0.19 0.00 0.00 0.00 .
Job Sat. r 0.15 -0.06 -0.02 -0.09 0.10 0.22 0.45 0.53 0.35 1.00
(COPE) p 0.18 0.59 0.83 0.45 0.36 0.05 0.00 0.00 0.00 .
Job Sat. r 0.29 -0.14 -0.14 -0.25 0.16 0.27 0.27 0.43 0.26 0.68 1.00
(H & O p 0.01 0.23 0.22 0.03 0.16 0.02 0.02 0.00 0.02 0.00 .
Org. Commit. r 0.23 0.06 -0.02 -0.17 0.25 0.28 0.36 0.47 0.24 0.71 0.61 1.00
p 0.04 0.61 0.85 0.13 0.03 0.01 0.00 0.00 0.04 0.00 0.00 .
Intent to r -0.20 0.17 0.20 0.30 -0.12 -0.07 -0.22 -0.42 -0.23 -0.58 -0.73 -0.49
Turnover p 0.09 0.13 0.08 0.01 0.29 0.57 0.06 0.00 0.04 0.00 0.00 0.00
Note. r = Pearson correlation coefficient. p = Significance level, 2-tailed. N = 78.

Occupants’ Evaluations of Individually-Controlled Lighting
NRC-IRC RR-299 36 of 81
Table 17. Bivariate Correlations at T3.
Age Sex Job Cat. Educ. Tenure Sat. w/ Ltg
Sat. w/ Vent
Sat. w/ Pr & Acoust.
Overall Env. Sat.
Job Sat. (COPE)
Job Sat. (H & O) Org. Com.
Age r 1.00
p .
Sex r 0.06 1.00
p 0.61 .
Job Category r -0.01 0.38 1.00
p 0.96 0.00 .
Education r -0.26 0.37 0.45 1.00
p 0.02 0.00 0.00 .
Job Tenure r 0.63 0.16 0.01 -0.30 1.00
p 0.00 0.15 0.91 0.01 .
Sat. w/ Ltg. r 0.13 0.08 0.01 -0.03 0.16 1.00
p 0.25 0.49 0.94 0.80 0.15 .
Sat. w/ Vent. r 0.01 0.27 0.00 0.08 0.08 0.49 1.00
p 0.96 0.01 0.98 0.49 0.49 0.00 .
Sat. w/ Pr. r -0.05 0.02 -0.14 -0.08 -0.11 0.48 0.49 1.00
& Acous. p 0.68 0.83 0.19 0.45 0.34 0.00 0.00 .
Overall Env. r -0.05 0.18 -0.12 -0.03 -0.05 0.43 0.43 0.75 1.00
Sat. p 0.63 0.10 0.28 0.80 0.62 0.00 0.00 0.00 .
Job Sat. r 0.10 -0.04 -0.06 -0.12 0.09 0.20 0.17 0.39 0.21 1.00
(COPE) p 0.37 0.70 0.59 0.26 0.41 0.06 0.13 0.00 0.05 .
Job Sat. r 0.25 0.01 -0.01 -0.13 0.14 0.23 0.22 0.43 0.31 0.72 1.00
(H & O p 0.02 0.95 0.94 0.22 0.20 0.03 0.05 0.00 0.00 0.00 .
Org. Commit. r 0.09 0.08 0.01 -0.07 0.21 0.18 0.31 0.40 0.27 0.68 0.58 1.00
p 0.42 0.49 0.93 0.51 0.06 0.10 0.00 0.00 0.01 0.00 0.00 .
Intent to r -0.07 0.06 0.16 0.32 -0.09 -0.22 -0.29 -0.34 -0.22 -0.74 -0.59 -0.59
Turnover p 0.55 0.58 0.14 0.00 0.42 0.05 0.01 0.00 0.04 0.00 0.00 0.00
Note. r = Pearson correlation coefficient. p = Significance level, 2-tailed. N = 86.

Occupants’ Evaluations of Individually-Controlled Lighting
NRC-IRC RR-299 37 of 81
Table 18. Bivariate Correlations for BG participants.
Age Sex Job Cat. Educ. Tenure Sat. w/ Ltg
Sat. w/ Vent
Sat. w/ Pr & Acoust.
Overall Env. Sat.
Job Sat. (COPE)
Job Sat. (H & O) Org. Com.
Age r 1.00
p .
Sex r 0.14 1.00
p 0.36 .
Job Category r 0.06 0.24 1.00
p 0.71 0.11 .
Education r -0.12 0.32 0.47 1.00
p 0.44 0.03 0.00 .
Job Tenure r 0.62 0.25 0.14 0.09 1.00
p 0.00 0.09 0.35 0.57 .
Sat. w/ Ltg. r 0.00 0.35 0.23 0.33 0.13 1.00
p 1.00 0.02 0.12 0.03 0.41 .
Sat. w/ Vent. r -0.04 0.13 0.09 0.29 -0.14 0.46 1.00
p 0.80 0.38 0.58 0.06 0.36 0.00 .
Sat. w/ Pr. r -0.25 0.16 -0.04 0.07 -0.10 0.53 0.55 1.00
& Acous. p 0.09 0.28 0.81 0.67 0.50 0.00 0.00 .
Overall Env. r -0.12 0.13 0.05 0.09 -0.02 0.40 0.45 0.73 1.00
Sat. p 0.43 0.40 0.74 0.55 0.92 0.01 0.00 0.00 .
Job Sat. r -0.03 0.00 0.10 -0.05 0.03 -0.06 0.12 0.31 0.15 1.00
(COPE) p 0.86 1.00 0.50 0.73 0.82 0.70 0.45 0.04 0.34 .
Job Sat. r 0.18 0.09 0.17 -0.14 0.17 0.04 0.04 0.26 0.06 0.72 1.00
(H & O p 0.23 0.55 0.25 0.35 0.27 0.78 0.78 0.09 0.68 0.00 .
Org. Commit. r -0.01 0.15 0.13 0.02 0.08 -0.04 -0.01 0.21 0.00 0.70 0.68 1.00
p 0.93 0.31 0.38 0.89 0.60 0.80 0.94 0.17 1.00 0.00 0.00 .
Intent to r -0.13 -0.02 -0.17 0.21 -0.11 -0.01 -0.02 -0.15 0.03 -0.75 -0.76 -0.65
Turnover p 0.38 0.90 0.26 0.17 0.46 0.94 0.90 0.32 0.84 0.00 0.00 0.00
Note. r = Pearson correlation coefficient. p = Significance level, 2-tailed. N = 45.

Occupants’ Evaluations of Individually-Controlled Lighting
NRC-IRC RR-299 38 of 81
Table 19. Bivariate Correlations for RM participants.
Age Sex Job category Educ.
Job tenure
Sat. w/ Ltg T1
Sat. w/ Ltg T2
Sat. w/ Ltg T3
Pretest: Sat. w/ Ltg
Sat. w/ Vent. T1
Sat. w/ Vent. T2
Sat. w/ Vent. T3
Sex r 0.06
p 0.60
N 73.00
Job category r -0.07 0.39
p 0.53 0.00
N 73.00 73.00
Education r -0.28 0.37 0.48
p 0.02 0.00 0.00
N 73.00 73.00 73.00
Job tenure r 0.64 0.13 -0.01 -0.31
p 0.00 0.27 0.95 0.01
N 73.00 73.00 73.00 73.00
Satisfaction r 0.39 0.08 -0.03 -0.06 0.33
with lighting p 0.00 0.56 0.83 0.68 0.01
T1 N 57.00 57.00 57.00 57.00 57.00
Satisfaction r 0.39 0.14 -0.04 -0.13 0.30 0.84
with lighting p 0.00 0.27 0.78 0.29 0.01 0.00
T2 N 68.00 68.00 68.00 68.00 68.00 52.00
Satisfaction r 0.19 -0.02 -0.07 -0.17 0.25 0.73 0.69
with lighting p 0.14 0.88 0.60 0.18 0.05 0.00 0.00
T3 N 61.00 61.00 61.00 61.00 61.00 45.00 56.00
Pretest: r 0.41 0.11 -0.02 -0.11 0.34 0.97 0.96 0.71
Satisfaction p 0.00 0.38 0.89 0.35 0.00 0.00 0.00 0.00
with Lighting N 73.00 73.00 73.00 73.00 73.00 57.00 68.00 61.00
Satisfaction r 0.18 0.21 0.05 0.19 0.14 0.46 0.44 0.29 0.46
w/ vent. p 0.19 0.11 0.71 0.16 0.30 0.00 0.00 0.05 0.00
T1 N 57.00 57.00 57.00 57.00 57.00 57.00 52.00 45.00 57.00
Note. r = Pearson correlation coefficient. p = Significance level, 2-tailed. N =sample size for this variable pair.

Occupants’ Evaluations of Individually-Controlled Lighting
NRC-IRC RR-299 39 of 81
Table 19. Bivariate Correlations for RM participants – continued.
Age Sex Job category Educ.
Job tenure
Sat. w/ Ltg T1
Sat. w/ Ltg T2
Sat. w/ Ltg T3
Pretest: Sat. w/ Ltg
Sat. w/ Vent. T1
Sat. w/ Vent. T2
Sat. w/ Vent. T3
Satisfaction r 0.06 0.07 -0.21 -0.03 0.17 0.46 0.44 0.26 0.42 0.75
w/ vent. p 0.63 0.56 0.08 0.79 0.17 0.00 0.00 0.05 0.00 0.00
T2 N 68.00 68.00 68.00 68.00 68.00 52.00 68.00 56.00 68.00 52.00
Satisfaction r -0.01 0.16 -0.08 -0.03 0.09 0.18 0.26 0.39 0.21 0.59 0.66
w/ vent. p 0.91 0.21 0.53 0.82 0.50 0.24 0.05 0.00 0.10 0.00 0.00
T3 N 61.00 61.00 61.00 61.00 61.00 45.00 56.00 61.00 61.00 45.00 56.00
Pretest: r 0.11 0.16 -0.06 0.08 0.15 0.48 0.42 0.27 0.42 0.94 0.94 0.67
Satisfaction p 0.35 0.18 0.59 0.50 0.21 0.00 0.00 0.04 0.00 0.00 0.00 0.00
w/ vent. N 73.00 73.00 73.00 73.00 73.00 57.00 68.00 61.00 73.00 57.00 68.00 61.00
Satisfaction r 0.18 -0.10 -0.26 -0.30 0.15 0.43 0.43 0.32 0.43 0.32 0.41 0.32
with privacy & p 0.18 0.46 0.05 0.02 0.27 0.00 0.00 0.03 0.00 0.02 0.00 0.03
acoustics T1 N 57.00 57.00 57.00 57.00 57.00 57.00 52.00 45.00 57.00 57.00 52.00 45.00
Satisfaction r 0.07 -0.18 -0.41 -0.34 0.05 0.51 0.42 0.44 0.44 0.25 0.40 0.33
with privacy & p 0.56 0.14 0.00 0.00 0.69 0.00 0.00 0.00 0.00 0.07 0.00 0.01
acoustics T2 N 68.00 68.00 68.00 68.00 68.00 52.00 68.00 56.00 68.00 52.00 68.00 56.00
Satisfaction r 0.02 -0.20 -0.23 -0.21 -0.07 0.42 0.39 0.43 0.37 0.31 0.43 0.38
with privacy & p 0.87 0.13 0.07 0.10 0.62 0.00 0.00 0.00 0.00 0.04 0.00 0.00
acoustics T3 N 61.00 61.00 61.00 61.00 61.00 45.00 56.00 61.00 61.00 45.00 56.00 61.00
Pretest: Sat. r 0.09 -0.18 -0.35 -0.31 0.04 0.47 0.41 0.37 0.41 0.28 0.41 0.32
w/ Privacy & p 0.43 0.12 0.00 0.01 0.74 0.00 0.00 0.00 0.00 0.03 0.00 0.01
Acoustics N 73.00 73.00 73.00 73.00 73.00 57.00 68.00 61.00 73.00 57.00 68.00 61.00
Overall r -0.10 -0.08 -0.34 -0.11 -0.14 0.37 0.32 0.30 0.35 0.25 0.40 0.19
environmental p 0.48 0.54 0.01 0.43 0.29 0.00 0.02 0.05 0.01 0.06 0.00 0.22
sat. T1 N 57.00 57.00 57.00 57.00 57.00 57.00 52.00 45.00 57.00 57.00 52.00 45.00
Overall r 0.00 0.09 -0.29 -0.10 -0.11 0.47 0.36 0.32 0.37 0.30 0.50 0.29
environmental p 0.99 0.49 0.02 0.42 0.39 0.00 0.00 0.01 0.00 0.03 0.00 0.03
sat. T2 N 68.00 68.00 68.00 68.00 68.00 52.00 68.00 56.00 68.00 52.00 68.00 56.00
Note. r = Pearson correlation coefficient. p = Significance level, 2-tailed. N = sample size for this variable pair.

Occupants’ Evaluations of Individually-Controlled Lighting
NRC-IRC RR-299 40 of 81
Table 19. Bivariate Correlations for RM participants – continued.
Age Sex Job category Educ.
Job tenure
Sat. w/ Ltg T1
Sat. w/ Ltg T2
Sat. w/ Ltg T3
Pretest: Sat. w/ Ltg
Sat. w/ Vent. T1
Sat. w/ Vent. T2
Sat. w/ Vent. T3
Overall r -0.08 0.09 -0.22 -0.14 -0.01 0.35 0.36 0.35 0.32 0.15 0.41 0.35
environmental p 0.56 0.49 0.09 0.27 0.92 0.02 0.01 0.01 0.01 0.31 0.00 0.01
sat. T3 N 61.00 61.00 61.00 61.00 61.00 45.00 56.00 61.00 61.00 45.00 56.00 61.00
Pretest: O/A r -0.03 -0.01 -0.35 -0.12 -0.17 0.46 0.33 0.25 0.33 0.29 0.49 0.23
Env. p 0.78 0.92 0.00 0.33 0.16 0.00 0.01 0.05 0.00 0.03 0.00 0.08
Satisfaction N 73.00 73.00 73.00 73.00 73.00 57.00 68.00 61.00 73.00 57.00 68.00 61.00
Job r 0.09 -0.12 0.09 -0.13 0.08 0.34 0.27 0.43 0.32 0.33 0.24 0.41
satisfaction p 0.49 0.39 0.49 0.34 0.54 0.01 0.06 0.00 0.01 0.01 0.09 0.01
(COPE) T1 N 57.00 57.00 57.00 57.00 57.00 57.00 52.00 45.00 57.00 57.00 52.00 45.00
Job r 0.11 -0.10 -0.08 -0.03 0.10 0.32 0.25 0.45 0.27 0.31 0.41 0.51
satisfaction p 0.35 0.40 0.53 0.80 0.44 0.02 0.04 0.00 0.02 0.03 0.00 0.00
(COPE) T2 N 68.00 68.00 68.00 68.00 68.00 52.00 68.00 56.00 68.00 52.00 68.00 56.00
Job r 0.15 -0.21 -0.23 -0.13 0.10 0.43 0.49 0.52 0.46 0.37 0.31 0.27
satisfaction p 0.26 0.10 0.07 0.32 0.44 0.00 0.00 0.00 0.00 0.01 0.02 0.03
(COPE) T3 N 61.00 61.00 61.00 61.00 61.00 45.00 56.00 61.00 61.00 45.00 56.00 61.00
Pretest: Job r 0.09 -0.09 0.02 -0.02 0.08 0.35 0.25 0.44 0.29 0.36 0.39 0.50
Satisfaction p 0.42 0.44 0.85 0.89 0.51 0.01 0.04 0.00 0.01 0.01 0.00 0.00
(COPE) N 73.00 73.00 73.00 73.00 73.00 57.00 68.00 61.00 73.00 57.00 68.00 61.00
Job r 0.20 -0.02 0.00 -0.14 0.14 0.35 0.29 0.43 0.32 0.29 0.23 0.38
satisfaction p 0.14 0.88 0.98 0.29 0.30 0.01 0.04 0.00 0.01 0.03 0.10 0.01
(H& O) T1 N 57.00 57.00 57.00 57.00 57.00 57.00 52.00 45.00 57.00 57.00 52.00 45.00
Job r 0.27 -0.17 -0.15 -0.22 0.14 0.36 0.33 0.41 0.36 0.29 0.26 0.33
satisfaction p 0.02 0.16 0.21 0.08 0.24 0.01 0.01 0.00 0.00 0.03 0.04 0.01
(H& O) T2 N 68.00 68.00 68.00 68.00 68.00 52.00 68.00 56.00 68.00 52.00 68.00 56.00
Job r 0.28 -0.18 -0.15 -0.27 0.13 0.51 0.56 0.50 0.53 0.43 0.24 0.31
satisfaction p 0.03 0.17 0.26 0.04 0.33 0.00 0.00 0.00 0.00 0.00 0.07 0.02
(H & O) T3 N 61.00 61.00 61.00 61.00 61.00 45.00 56.00 61.00 61.00 45.00 56.00 61.00
Note. r = Pearson correlation coefficient. p = Significance level, 2-tailed. N = sample size for this variable pair.

Occupants’ Evaluations of Individually-Controlled Lighting
NRC-IRC RR-299 41 of 81
Table 19. Bivariate Correlations for RM participants – continued.
Age Sex Job category Educ.
Job tenure
Sat. w/ Ltg T1
Sat. w/ Ltg T2
Sat. w/ Ltg T3
Pretest: Sat. w/ Ltg
Sat. w/ Vent. T1
Sat. w/ Vent. T2
Sat. w/ Vent. T3
Pretest: Job r 0.28 -0.14 -0.12 -0.21 0.11 0.38 0.34 0.45 0.36 0.33 0.25 0.36
Satisfaction p 0.02 0.24 0.32 0.08 0.36 0.00 0.00 0.00 0.00 0.01 0.04 0.00
(H & O) N 73.00 73.00 73.00 73.00 73.00 57.00 68.00 61.00 73.00 57.00 68.00 61.00
Org. r 0.32 -0.03 -0.05 -0.25 0.25 0.38 0.28 0.39 0.36 0.31 0.31 0.41
commitment p 0.02 0.85 0.74 0.06 0.07 0.00 0.04 0.01 0.01 0.02 0.02 0.00
T1 N 57.00 57.00 57.00 57.00 57.00 57.00 52.00 45.00 57.00 57.00 52.00 45.00
Org. r 0.22 -0.05 -0.14 -0.16 0.25 0.29 0.32 0.38 0.33 0.28 0.35 0.42
commitment p 0.07 0.71 0.27 0.19 0.04 0.04 0.01 0.00 0.01 0.05 0.00 0.00
T2 N 68.00 68.00 68.00 68.00 68.00 52.00 68.00 56.00 68.00 52.00 68.00 56.00
Org. r 0.15 -0.12 -0.08 -0.12 0.24 0.38 0.40 0.40 0.38 0.24 0.41 0.41
commitment p 0.25 0.38 0.52 0.35 0.06 0.01 0.00 0.00 0.00 0.12 0.00 0.00
T3 N 61.00 61.00 61.00 61.00 61.00 45.00 56.00 61.00 61.00 45.00 56.00 61.00
Pretest: r 0.28 -0.05 -0.08 -0.16 0.26 0.36 0.33 0.43 0.37 0.31 0.36 0.44
Org. p 0.01 0.66 0.52 0.16 0.03 0.01 0.01 0.00 0.00 0.02 0.00 0.00
Commitment N 73.00 73.00 73.00 73.00 73.00 57.00 68.00 61.00 73.00 57.00 68.00 61.00
Intent to r -0.18 -0.01 0.23 0.16 -0.16 -0.28 -0.27 -0.45 -0.29 -0.25 -0.29 -0.55
turnover T1 p 0.18 0.95 0.08 0.23 0.23 0.03 0.06 0.00 0.03 0.06 0.04 0.00
N 57.00 57.00 57.00 57.00 57.00 57.00 52.00 45.00 57.00 57.00 52.00 45.00
Intent to r -0.14 0.28 0.26 0.26 -0.07 -0.15 -0.11 -0.35 -0.12 -0.11 -0.18 -0.37
turnover T2 p 0.26 0.02 0.03 0.03 0.58 0.29 0.36 0.01 0.33 0.43 0.15 0.01
N 68.00 68.00 68.00 68.00 68.00 52.00 68.00 56.00 68.00 52.00 68.00 56.00
Intent to r -0.07 0.23 0.32 0.33 -0.05 -0.33 -0.34 -0.49 -0.30 -0.23 -0.32 -0.43
turnover T3 p 0.58 0.07 0.01 0.01 0.69 0.03 0.01 0.00 0.02 0.13 0.02 0.00
N 61.00 61.00 61.00 61.00 61.00 45.00 56.00 61.00 61.00 45.00 56.00 61.00
Pretest: r -0.18 0.21 0.28 0.24 -0.09 -0.24 -0.17 -0.44 -0.20 -0.20 -0.24 -0.45
Intent to p 0.13 0.07 0.02 0.04 0.47 0.07 0.16 0.00 0.10 0.14 0.05 0.00
Turnover N 73.00 73.00 73.00 73.00 73.00 57.00 68.00 61.00 73.00 57.00 68.00 61.00
Note. r = Pearson correlation coefficient. p = Significance level, 2-tailed. N = sample size for this variable pair.

Occupants’ Evaluations of Individually-Controlled Lighting
NRC-IRC RR-299 42 of 81
Table 19. Bivariate Correlations for RM participants – continued.
Pretest: Sat. w/ Vent.
Sat. w/ pr. & ac. T1
Sat. w/ pr. & ac. T2
Sat. w/ pr. & ac. T3
Pretest:Sat. w/ pr. & ac.
Overall Env. Sat. T1
Overall Env. Sat. T2
Overall Env. Sat. T3
Pretest: O/A Env. Sat.
Job Sat. (COPE) T1
Job Sat. (COPE) T2
Job Sat. (COPE) T3
Satisfaction r 0.37
with privacy & p 0.00
acoustics T1 N 57.00
Satisfaction r 0.35 0.87
with privacy & p 0.00 0.00
acoustics T2 N 68.00 52.00
Satisfaction r 0.39 0.84 0.86
with privacy & p 0.00 0.00 0.00
acoustics T3 N 61.00 45.00 56.00
Pretest: Sat. r 0.36 0.97 0.97 0.87
w/ Privacy & p 0.00 0.00 0.00 0.00
Acoustics N 73.00 57.00 68.00 61.00
Overall r 0.31 0.59 0.60 0.67 0.60
environmental p 0.02 0.00 0.00 0.00 0.00
sat. T1 N 57.00 57.00 52.00 45.00 57.00
Overall r 0.44 0.47 0.56 0.53 0.57 0.49
environmental p 0.00 0.00 0.00 0.00 0.00 0.00
sat. T2 N 68.00 52.00 68.00 56.00 68.00 52.00
Overall r 0.30 0.50 0.57 0.66 0.57 0.62 0.65
environmental p 0.02 0.00 0.00 0.00 0.00 0.00 0.00
sat. T3 N 61.00 45.00 56.00 61.00 61.00 45.00 56.00
Pretest: O/A r 0.40 0.60 0.66 0.63 0.66 0.88 0.91 0.68
Env. p 0.00 0.00 0.00 0.00 0.00 0.00 0.00 0.00
Satisfaction N 73.00 57.00 68.00 61.00 73.00 57.00 68.00 61.00
Note. r = Pearson correlation coefficient. p = Significance level, 2-tailed. N = sample size for this variable pair.

Occupants’ Evaluations of Individually-Controlled Lighting
NRC-IRC RR-299 43 of 81
Table 19. Bivariate Correlations for RM participants – continued.
Pretest: Sat. w/ Vent.
Sat. w/ pr. & ac. T1
Sat. w/ pr. & ac. T2
Sat. w/ pr. & ac. T3
Pretest:Sat. w/ pr. & ac.
Overall Env. Sat. T1
Overall Env. Sat. T2
Overall Env. Sat. T3
Pretest: O/A Env. Sat.
Job Sat. (COPE) T1
Job Sat. (COPE) T2
Job Sat. (COPE) T3
Job r 0.33 0.42 0.45 0.59 0.44 0.22 0.11 0.13 0.18
satisfaction p 0.01 0.00 0.00 0.00 0.00 0.10 0.46 0.41 0.17
(COPE) T1 N 57.00 57.00 52.00 45.00 57.00 57.00 52.00 45.00 57.00
Job r 0.42 0.37 0.46 0.61 0.44 0.31 0.32 0.31 0.37 0.78
satisfaction p 0.00 0.01 0.00 0.00 0.00 0.03 0.01 0.02 0.00 0.00
(COPE) T2 N 68.00 52.00 68.00 56.00 68.00 52.00 68.00 56.00 68.00 52.00
Job r 0.30 0.42 0.49 0.55 0.45 0.26 0.38 0.31 0.33 0.67 0.72
satisfaction p 0.02 0.00 0.00 0.00 0.00 0.08 0.00 0.02 0.01 0.00 0.00
(COPE) T3 N 61.00 45.00 56.00 61.00 61.00 45.00 56.00 61.00 61.00 45.00 56.00
Pretest: Job r 0.45 0.41 0.48 0.63 0.46 0.27 0.28 0.30 0.32 0.95 0.95 0.65
Satisfaction p 0.00 0.00 0.00 0.00 0.00 0.04 0.02 0.02 0.01 0.00 0.00 0.00
(COPE) N 73.00 57.00 68.00 61.00 73.00 57.00 68.00 61.00 73.00 57.00 68.00 61.00
Job r 0.30 0.29 0.34 0.50 0.31 0.14 0.11 0.05 0.12 0.82 0.72 0.70
satisfaction p 0.03 0.03 0.01 0.00 0.02 0.31 0.43 0.75 0.39 0.00 0.00 0.00
(H& O) T1 N 57.00 57.00 52.00 45.00 57.00 57.00 52.00 45.00 57.00 57.00 52.00 45.00
Job r 0.27 0.37 0.43 0.52 0.42 0.35 0.29 0.19 0.36 0.64 0.68 0.65
satisfaction p 0.03 0.01 0.00 0.00 0.00 0.01 0.02 0.16 0.00 0.00 0.00 0.00
(H& O) T2 N 68.00 52.00 68.00 56.00 68.00 52.00 68.00 56.00 68.00 52.00 68.00 56.00
Job r 0.27 0.43 0.43 0.53 0.41 0.34 0.37 0.34 0.34 0.57 0.62 0.80
satisfaction p 0.03 0.00 0.00 0.00 0.00 0.02 0.01 0.01 0.01 0.00 0.00 0.00
(H & O) T3 N 61.00 45.00 56.00 61.00 61.00 45.00 56.00 61.00 61.00 45.00 56.00 61.00
Pretest: Job r 0.29 0.34 0.44 0.54 0.41 0.23 0.27 0.17 0.28 0.78 0.70 0.70
Satisfaction p 0.01 0.01 0.00 0.00 0.00 0.08 0.03 0.18 0.02 0.00 0.00 0.00
(H & O) N 73.00 57.00 68.00 61.00 73.00 57.00 68.00 61.00 73.00 57.00 68.00 61.00
Org. r 0.33 0.54 0.53 0.61 0.55 0.26 0.30 0.13 0.30 0.79 0.77 0.68
commitment p 0.01 0.00 0.00 0.00 0.00 0.05 0.03 0.39 0.02 0.00 0.00 0.00
T1 N 57.00 57.00 52.00 45.00 57.00 57.00 52.00 45.00 57.00 57.00 52.00 45.00
Note. r = Pearson correlation coefficient. p = Significance level, 2-tailed. N = sample size for this variable pair.

Occupants’ Evaluations of Individually-Controlled Lighting
NRC-IRC RR-299 44 of 81
Table 19. Bivariate Correlations for RM participants – continued.
Pretest: Sat. w/ Vent.
Sat. w/ pr. & ac. T1
Sat. w/ pr. & ac. T2
Sat. w/ pr. & ac. T3
Pretest:Sat. w/ pr. & ac.
Overall Env. Sat. T1
Overall Env. Sat. T2
Overall Env. Sat. T3
Pretest: O/A Env. Sat.
Job Sat. (COPE) T1
Job Sat. (COPE) T2
Job Sat. (COPE) T3
Org. r 0.35 0.44 0.44 0.44 0.44 0.24 0.25 0.24 0.26 0.67 0.71 0.60
commitment p 0.00 0.00 0.00 0.00 0.00 0.09 0.04 0.07 0.03 0.00 0.00 0.00
T2 N 68.00 52.00 68.00 56.00 68.00 52.00 68.00 56.00 68.00 52.00 68.00 56.00
Org. r 0.35 0.46 0.43 0.50 0.41 0.20 0.26 0.30 0.22 0.59 0.72 0.62
commitment p 0.01 0.00 0.00 0.00 0.00 0.18 0.05 0.02 0.09 0.00 0.00 0.00
T3 N 61.00 45.00 56.00 61.00 61.00 45.00 56.00 61.00 61.00 45.00 56.00 61.00
Pretest: r 0.36 0.51 0.49 0.52 0.49 0.24 0.27 0.23 0.26 0.75 0.77 0.66
Org. p 0.00 0.00 0.00 0.00 0.00 0.07 0.02 0.08 0.03 0.00 0.00 0.00
Commitment N 73.00 57.00 68.00 61.00 73.00 57.00 68.00 61.00 73.00 57.00 68.00 61.00
Intent to r -0.28 -0.19 -0.29 -0.41 -0.23 -0.24 -0.25 -0.24 -0.23 -0.52 -0.52 -0.72
turnover T1 p 0.03 0.15 0.04 0.00 0.08 0.08 0.08 0.11 0.08 0.00 0.00 0.00
N 57.00 57.00 52.00 45.00 57.00 57.00 52.00 45.00 57.00 57.00 52.00 45.00
Intent to r -0.16 -0.26 -0.38 -0.47 -0.37 -0.17 -0.26 -0.25 -0.28 -0.49 -0.52 -0.52
turnover T2 p 0.20 0.06 0.00 0.00 0.00 0.24 0.03 0.06 0.02 0.00 0.00 0.00
N 68.00 52.00 68.00 56.00 68.00 52.00 68.00 56.00 68.00 52.00 68.00 56.00
Intent to r -0.22 -0.36 -0.49 -0.53 -0.43 -0.23 -0.28 -0.37 -0.25 -0.48 -0.55 -0.70
turnover T3 p 0.09 0.02 0.00 0.00 0.00 0.12 0.03 0.00 0.06 0.00 0.00 0.00
N 61.00 45.00 56.00 61.00 61.00 45.00 56.00 61.00 61.00 45.00 56.00 61.00
Pretest: r -0.22 -0.23 -0.39 -0.48 -0.35 -0.18 -0.30 -0.28 -0.27 -0.53 -0.54 -0.63
Intent to p 0.06 0.08 0.00 0.00 0.00 0.18 0.01 0.03 0.02 0.00 0.00 0.00
Turnover N 73.00 57.00 68.00 61.00 73.00 57.00 68.00 61.00 73.00 57.00 68.00 61.00
Note. r = Pearson correlation coefficient. p = Significance level, 2-tailed. N = sample size for this variable pair.

Occupants’ Evaluations of Individually-Controlled Lighting
NRC-IRC RR-299 45 of 81
Table 19. Bivariate Correlations for RM participants – continued.
Pretest: Job Sat. (COPE)
Job sat. (H & O) T1
Job sat. (H & O) T2
Job sat. (H & O) T3
Pretest: Job sat. (H & O)
Org. com. T1
Org. com. T2
Org. com. T3
Pretest: Org. com.
Intent to turnover T1
Intent to turnover T2
Intent to turnover T3
Job r 0.81
satisfaction p 0.00
(H& O) T1 N 57.00
Job r 0.66 0.68
satisfaction p 0.00 0.00
(H& O) T2 N 68.00 52.00
Job r 0.55 0.70 0.77
satisfaction p 0.00 0.00 0.00
(H & O) T3 N 61.00 45.00 56.00
Pretest: Job r 0.72 0.92 0.93 0.77
Satisfaction p 0.00 0.00 0.00 0.00
(H & O) N 73.00 57.00 68.00 61.00
Org. r 0.81 0.77 0.65 0.62 0.77
commitment p 0.00 0.00 0.00 0.00 0.00
T1 N 57.00 57.00 52.00 45.00 57.00
Org. r 0.73 0.67 0.65 0.57 0.69 0.83
commitment p 0.00 0.00 0.00 0.00 0.00 0.00
T2 N 68.00 52.00 68.00 56.00 68.00 52.00
Org. r 0.69 0.64 0.48 0.59 0.51 0.80 0.85
commitment p 0.00 0.00 0.00 0.00 0.00 0.00 0.00
T3 N 61.00 45.00 56.00 61.00 61.00 45.00 56.00
Pretest: r 0.79 0.75 0.66 0.61 0.72 0.96 0.96 0.84
Org. p 0.00 0.00 0.00 0.00 0.00 0.00 0.00 0.00
Commitment N 73.00 57.00 68.00 61.00 73.00 57.00 68.00 61.00
Note. r = Pearson correlation coefficient. p = Significance level, 2-tailed. N = sample size for this variable pair.

Occupants’ Evaluations of Individually-Controlled Lighting
NRC-IRC RR-299 46 of 81
Table 19. Bivariate Correlations for RM participants – continued.
Pretest: Job Sat. (COPE)
Job sat. (H & O) T1
Job sat. (H & O) T2
Job sat. (H & O) T3
Pretest: Job sat. (H & O)
Org. com. T1
Org. com. T2
Org. com. T3
Pretest: Org. com.
Intent to turnover T1
Intent to turnover T2
Intent to turnover T3
Intent to r -0.53 -0.59 -0.53 -0.68 -0.61 -0.57 -0.56 -0.70 -0.60
turnover T1 p 0.00 0.00 0.00 0.00 0.00 0.00 0.00 0.00 0.00
N 57.00 57.00 52.00 45.00 57.00 57.00 52.00 45.00 57.00
Intent to r -0.52 -0.50 -0.70 -0.56 -0.68 -0.47 -0.44 -0.41 -0.47 0.68
turnover T2 p 0.00 0.00 0.00 0.00 0.00 0.00 0.00 0.00 0.00 0.00
N 68.00 52.00 68.00 56.00 68.00 52.00 68.00 56.00 68.00 52.00
Intent to r -0.48 -0.55 -0.65 -0.68 -0.65 -0.53 -0.54 -0.54 -0.54 0.82 0.82
turnover T3 p 0.00 0.00 0.00 0.00 0.00 0.00 0.00 0.00 0.00 0.00 0.00
N 61.00 45.00 56.00 61.00 61.00 45.00 56.00 61.00 61.00 45.00 56.00
Pretest: r -0.53 -0.60 -0.68 -0.63 -0.71 -0.57 -0.52 -0.53 -0.55 0.93 0.94 0.88
Intent to p 0.00 0.00 0.00 0.00 0.00 0.00 0.00 0.00 0.00 0.00 0.00 0.00
Turnover N 73.00 57.00 68.00 61.00 73.00 57.00 68.00 61.00 73.00 57.00 68.00 61.00
Note. r = Pearson correlation coefficient. p = Significance level, 2-tailed. N = sample size for this variable pair.

Occupants’ Evaluations of Individually-Controlled Lighting
NRC-IRC RR-299 47 of 81
We used weighted-means analysis (SSTYPE1 in SPSS GLM) when conducting the MANCOVAs because we had unequal sample sizes. This weighted approach assumes that the difference in the number of participants in each experimental group is meaningful (i.e., reflects the population), and thus, gives more weight to values from larger groups [Tabachnick & Fidell, 2001]. T1, T2, T3, BG, and RM datasets were each analyzed, but the specific planned comparisons tested differed by dataset.
3.3.2 T1 results. We analyzed two main effects in the T1 dataset: the main effect of personal control
over lighting, and the main effect of window proximity. We did not examine the interaction (personal control over lighting X window proximity) because the cell counts were insufficient to ensure adequate statistical power.1
The multivariate test for the main effect of personal control over lighting was statistically significant, and was associated with medium-sized significant univariate tests for satisfaction with lighting, satisfaction with privacy and acoustics, and overall environmental satisfaction (Table 20). These effects were medium-sized in terms of explained variance. The descriptive statistics (Table 21) reveal that people with control were significantly more satisfied with their lighting, privacy and acoustics, and overall environmental conditions.
Table 20. Significant T1 MANCOVA results for effect of personal control over lighting on environmental satisfaction controlling for education. Effect Variable
Wilks' 】 F Df p Ș2partial
T1 Control versus No Control 0.81 4.43*** 4,75 0.00 0.19 Satisfaction with lighting 9.89*** 1,78 0.00 0.11 Satisfaction with ventilation 2.55 1,78 0.12 0.03 Satisfaction with privacy & acoustics 13.32*** 1,78 0.00 0.15 Overall environmental satisfaction 12.29*** 1,78 0.00 0.14 Note. The Ș2
partial statistic is the proportion of variance explained, with a range from 0 – 1. *** p < .001
Table 21. Descriptive statistics for statistically significant T1 results for effect of personal control over lighting on environmental satisfaction controlling for education. Variable Effect
N M ADJ M SD Min Max
T1 Satisfaction with lighting Control 63 5.63 5.64 1.02 2.40 7.00 No Control 18 4.76 4.73 1.23 2.80 7.00 T1 Satisfaction with privacy & acoustics Control 63 4.25 4.28 1.11 1.70 6.40 No Control 18 3.29 3.20 1.30 1.10 5.40 T1 Overall environmental satisfaction Control 63 3.82 3.83 1.10 2.00 5.50 No Control 18 2.83 2.78 1.18 1.00 5.00 Note. The ADJ M is the adjusted mean when the covariate “education” is at its mean value and held constant across experimental groups. Scales range from 1 (very unsatisfied) to 7 (very satisfied).
There was no statistically significant effect of window proximity on environmental
satisfaction at T1.
1 Power to detect significant multivariate results is reduced when the number of dependent
variables (in our case 4) exceeds the number of cases in each cell (Tabachnick & Fidell, 2001). There were fewer than 4 cases in some of the cells.

Occupants’ Evaluations of Individually-Controlled Lighting
NRC-IRC RR-299 48 of 81
3.3.3 T2 results. The T2 dataset was analyzed in the same way as the T1 dataset. Consistent with T1,
the multivariate test for the main effect of personal control over lighting was statistically significant, and was associated with medium-sized significant univariate tests for satisfaction with lighting, satisfaction with privacy and acoustics, and overall environmental satisfaction (Table 22). The descriptive statistics (Table 23) revealed that people with control versus those without control were more satisfied with their lighting, privacy and acoustics, and overall environmental conditions.
Table 22. Significant T2 MANCOVA results for effect of personal control over lighting on environmental satisfaction controlling for education. Effect Variable
Wilks' 】 F Df P Ș2partial
T2 Control versus No Control 0.82 4.01** 4,72 0.01 0.18 Satisfaction with lighting 4.83* 1,75 0.03 0.06 Satisfaction with ventilation 2.74 1,75 0.10 0.04 Satisfaction with privacy & acoustics 9.23*** 1,75 0.00 0.11 Overall environmental satisfaction 13.99*** 1,75 0.00 0.16 Note. The Ș2
partial statistic is the proportion of variance explained, with a range from 0 – 1. * p < .05. **p < .01. *** p < .001.
Table 23. Descriptive statistics for statistically significant T2 results for effect of personal control over lighting on environmental satisfaction controlling for education. Variable Effect
N M ADJ M SD Min Max
T2 Satisfaction with lighting Control 63 5.73 5.73 0.76 3.50 7.00 No Control 15 5.21 5.21 1.06 2.80 7.00 T2 Satisfaction with privacy & acoustics Control 63 4.42 4.42 0.97 2.20 6.20 No Control 15 3.53 3.50 1.57 1.30 6.10 T2 Overall environmental satisfaction Control 63 4.10 4.10 1.13 1.50 6.00 No Control 15 2.93 2.93 0.88 2.00 5.00 Note. The ADJ M is the adjusted mean when the covariate “education” is at its mean value and held constant across experimental groups. Scales range from 1 (very unsatisfied) to 7 (very satisfied).
Unlike the T1 result, a main effect of window proximity on environmental satisfaction
was found at T2. Both planned comparisons had statistically significant multivariate tests combined with statistically significant univariate tests for satisfaction with lighting (Table 24). As shown in Table 25 people with workstations in a window row more satisfied with their lighting than people in any row without a window.

Occupants’ Evaluations of Individually-Controlled Lighting
NRC-IRC RR-299 49 of 81
Table 24. Significant T2 MANCOVA results for effect of window proximity on environmental satisfaction controlling for education. Effect Variable
Wilks' 】 F Df P Ș2partial
T2 Window Row versus Aisle 2 0.74 5.74*** 4,66 0.00 0.26 Satisfaction with lighting 11.11*** 1,69 0.00 0.14 Satisfaction with ventilation 0.74 1,69 0.39 0.01 Satisfaction with privacy & acoustics 0.81 1,69 0.37 0.01 Overall environmental satisfaction 0.43 1,69 0.51 0.01 T2 Window Row versus Aisle 3-5 0.78 4.73*** 4,66 0.00 0.22 Satisfaction with lighting 6.51** 1,69 0.01 0.09 Satisfaction with ventilation 3.23 1,69 0.08 0.05 Satisfaction with privacy & acoustics 0.22 1,69 0.64 0.00 Overall environmental satisfaction 0.10 1,69 0.75 0.00 Note. The Ș2
partial statistic is the proportion of variance explained, with a range from 0 – 1. **p < .01. *** p < .001.
Table 25. Descriptive statistics for statistically significant T2 results for effect of window proximity on environmental satisfaction controlling for education. Variable Effect
N M ADJ M SD Min Max
T2 Satisfaction with lighting Window Row 45 5.90 5.91 0.67 4.20 7.00 Aisle 2 16 5.16 5.16 0.78 3.50 6.60 Aisle 3-5 12 5.30 5.26 1.11 2.80 7.00 Note. The ADJ M is the adjusted mean when the covariate “education” is at its mean value and held constant across experimental groups. Scales range from 1 (very unsatisfied) to 7 (very satisfied).
3.3.4 T3 results. The analysis of the T3 dataset was the same as for T1 and T2. Note that the T3
survey occurred after the awareness campaign. Consistent with T1 and T2, the multivariate test for the main effect of personal control over lighting was statistically significant and was associated with medium-sized significant univariate tests for satisfaction with lighting, satisfaction with privacy and acoustics, and overall environmental satisfaction. Inconsistent with T1 and T2, however, there was also a medium-sized significant univariate tests for satisfaction with ventilation (Table 26). The descriptive statistics (see Table 27) revealed that people with control were more satisfied with their lighting, ventilation, privacy and acoustics, and overall environmental conditions.
Table 26. Significant T3 MANCOVA results for effect of personal control over lighting on environmental satisfaction controlling for education. Effect Variable
Wilks' 】 F Df P Ș2partial
T3 Control versus No Control 0.82 4.31*** 4,80 0.00 0.18 Satisfaction with lighting 8.21** 1,83 0.01 0.09 Satisfaction with ventilation 6.17* 1,83 0.02 0.07 Satisfaction with privacy & acoustics 14.44*** 1,83 0.00 0.15 Overall environmental satisfaction 12.90*** 1,83 0.00 0.14 Note. The Ș2
partial statistic is the proportion of variance explained, with a range from 0 – 1. *p < .05. **p < .01. *** p < .001.

Occupants’ Evaluations of Individually-Controlled Lighting
NRC-IRC RR-299 50 of 81
Table 27. Descriptive statistics for statistically significant T3 results for effect of personal control over lighting on environmental satisfaction controlling for education. Variable Effect
N M ADJ M SD Min Max
T3 Satisfaction with lighting Control 66 5.60 5.60 1.52 2.40 7.00 No Control 20 4.76 4.75 1.03 2.00 6.40 T3 Satisfaction with ventilation Control 66 4.89 4.89 1.78 2.00 7.00 No Control 20 3.97 3.98 1.29 1.33 6.33 T3 Satisfaction with privacy & acoustics Control 66 4.17 4.18 1.68 2.30 6.10 No Control 20 3.04 3.01 1.02 1.10 5.60 T3 Overall environmental satisfaction Control 66 4.02 4.03 1.39 2.00 6.00 No Control 20 2.95 2.94 1.11 1.50 5.50 Note. The ADJ M is the adjusted mean when the covariate “education” is at its mean value and held constant across experimental groups. Scales range from 1 (very unsatisfied) to 7 (very satisfied).
Consistent with T1, but not T2, there was no statistically significant effect of window
proximity on environmental satisfaction at T3.
3.3.5 BG results. The BG dataset allowed tests of personal control over lighting, time (pre-intervention
vs. post-intervention), and window proximity. We analyzed the interaction of personal control X time, but were not able to examine interactions with window proximity because of insufficient sample sizes. We expected to observe a significant interaction between personal control over lighting and time. Particularly, we expected higher mean ratings of environmental satisfaction among post-intervention participants with personal control over lighting, as this would support a potential intervention effect.
However, no support of an intervention effect was obtained: there were no interactions with time. There was a significant multivariate test for the main effect of personal control over lighting, which was associated with medium-sized significant univariate tests for satisfaction with lighting, satisfaction with ventilation, satisfaction with privacy and acoustics, and overall environmental satisfaction (Table 28). People with control over their lighting were more satisfied with their lighting, ventilation, privacy and acoustics, and overall environmental conditions (see Table 29 for descriptive statistics).
Table 28. Significant BG MANCOVA results for effect of personal control over lighting on environmental satisfaction controlling for education. Effect Variable
Wilks' 】 F Df p Ș2partial
BG Control versus No Control 0.74 3.28* 4,37 0.02 0.26 Satisfaction with lighting 5.98* 1,40 0.02 0.13 Satisfaction with ventilation 8.68** 1,40 0.01 0.18 Satisfaction with privacy & acoustics 5.66* 1,40 0.02 0.12 Overall environmental satisfaction 7.89* 1,40 0.01 0.17 Note. The Ș2
partial statistic is the proportion of variance explained, with a range from 0 – 1. *p < .05. **p < .01.

Occupants’ Evaluations of Individually-Controlled Lighting
NRC-IRC RR-299 51 of 81
Table 29. Descriptive statistics for statistically significant BG results for effect of personal control over lighting on environmental satisfaction controlling for education. Variable Effect
N M ADJ M SD Min Max
BG Satisfaction with lighting Control 29 5.21 5.26 0.96 2.00 7.00 No Control 16 4.50 4.43 1.36 2.00 6.00 BG Satisfaction with ventilation Control 29 4.35 4.51 1.38 2.00 6.00 No Control 16 3.35 3.27 1.46 1.00 6.00 BG Satisfaction with privacy & acoustics Control 29 4.14 4.14 1.01 3.00 6.00 No Control 16 3.16 3.16 1.61 1.00 6.00 BG Overall environmental satisfaction Control 29 3.86 3.90 1.19 2.00 6.00 No Control 16 2.81 2.73 1.40 1.00 6.00 Note. The ADJ M is the adjusted mean when the covariate “education” is at its mean value and held constant across experimental groups. Scales range from 1 (very unsatisfied) to 7 (very satisfied).
There was no statistically significant difference between the three window proximity
groups on environmental satisfaction in the BG analysis.
3.3.6 RM results. The following interaction effects of personal control and window proximity over time
were examined using the RM dataset: • personal control over lighting from T1 to T2 to T3; • personal control over lighting from pre-intervention to post-intervention; • window proximity from T1 to T2 to T3; • and, window proximity from pre-intervention to post-intervention. Again, the interactions between control over lighting and window proximity were not
examined because of small cell counts. As with the BG dataset, we expected a significant interaction between personal
control over lighting and time. We expected higher mean ratings of environmental satisfaction among T3/post-intervention participants with personal control over lighting, as this would support a potential intervention effect.
Again, however, no support of an intervention effect was obtained. Consistent with T1, T2, T3, and BG findings, we only observed a significant multivariate test for the main effect of personal control over lighting. This was associated with a medium-sized significant univariate test for overall environmental satisfaction (Table 30). People with control were more satisfied with their overall environmental conditions at all survey times (Table 31).
Table 30. Significant RM MANCOVA results for effect of personal control over lighting on environmental satisfaction controlling for education. Effect Variable
Wilks' 】 F Df p Ș2partial
RM Control versus No Control 0.75 2.85* 4,34 0.04 0.25 Satisfaction with lighting 0.01 1,37 0.94 0.00 Satisfaction with ventilation 0.38 1,37 0.54 0.01 Satisfaction with privacy & acoustics 3.59 1,37 0.07 0.09 Overall environmental satisfaction 4.45* 1,37 0.04 0.11 Note. The Ș2
partial statistic is the proportion of variance explained, with a range from 0 – 1. *p < .05.

Occupants’ Evaluations of Individually-Controlled Lighting
NRC-IRC RR-299 52 of 81
Table 31. Descriptive statistics for statistically significant RM results for effect of personal control over lighting on environmental satisfaction controlling for education. Variable Effect
N M ADJ M SD Min Max
T1 Overall environmental satisfaction Control 48 3.94 4.01 1.04 2.00 6.00 No Control 9 3.39 3.16 1.19 2.00 5.00 T2 Overall environmental satisfaction Control 58 4.08 4.01 1.12 2.00 6.00 No Control 10 3.00 2.96 0.71 2.00 4.00 T3 Overall environmental satisfaction Control 53 4.10 4.04 1.12 2.00 6.00 No Control 8 3.12 3.00 1.55 2.00 5.00 Note. The ADJ M is the adjusted mean when the covariate “education” is at its mean value and held constant across experimental groups. Scales range from 1 (very unsatisfied) to 7 (very satisfied).
Consistent with T2 only, a main effect of window proximity on environmental
satisfaction was found with the RM dataset (no time, and therefore, no intervention effect was observed). The multivariate test was statistically significant, and was associated with a medium-sized significant univariate test for satisfaction with lighting (Table 32). As shown in Table 33, people with workstations in a window row versus those with workstations in aisle 2 were significantly more satisfied with their lighting at pre-intervention and post-intervention. However, there was no difference for the contrast between the window row and aisles 3-5.
Table 32. Significant RM MANCOVA results for effect of window proximity on environmental satisfaction controlling for education. Effect Variable
Wilks' 】 F Df P Ș2partial
RM Window Row versus Aisle 2 0.75 4.51*** 4,54 0.00 0.25 Satisfaction with lighting 8.65** 1,57 0.01 0.13 Satisfaction with ventilation 1.75 1,57 0.19 0.03 Satisfaction with privacy & acoustics 0.00 1,57 0.10 0.00 Overall environmental satisfaction 0.00 1,57 0.10 0.00 Note. The Ș2
partial statistic is the proportion of variance explained, with a range from 0 – 1. **p < .01. ***p < .001.
Table 33. Descriptive statistics for statistically significant RM results for effect of window proximity on environmental satisfaction controlling for education. Variable Effect
N M ADJ M SD Min Max
PRE Satisfaction with lighting Window Row 45 5.99 6.02 0.62 4.40 7.00 Aisle 2 15 5.22 5.20 0.89 3.25 6.60 POST Satisfaction with lighting Window Row 41 5.93 5.93 0.65 5.00 7.00 Aisle 2 12 5.38 5.37 1.07 4.00 7.00 Note. The ADJ M is the adjusted mean when the covariate “education” is at its mean value and held constant across experimental groups. Scales range from 1 (very unsatisfied) to 7 (very satisfied).
3.3.7 Summary: Environmental satisfaction. It is clear from these results that having individual control over lighting benefits
environmental satisfaction. This effect was observed in all of the ways in which the data were analyzed: across three survey administrations (T1, T2, and T3 datasets), among people who participated in only one survey administration (BG dataset), and among people

Occupants’ Evaluations of Individually-Controlled Lighting
NRC-IRC RR-299 53 of 81
who participated in more than one survey administration (RM dataset). This finding mirrors that obtained for office lighting appraisals and suggests that people with personal control over lighting are more satisfied with their physical working environments as compared to people without control. Given the evidence for this effect at T1 and T2, it is unsurprising that there was no change in environmental satisfaction at T3, following the awareness campaign.
Some inconsistency between datasets was observed in terms of the effects of personal control over lighting on the satisfaction measures. That is, significant effects on satisfaction with lighting, privacy and acoustics, and overall environmental satisfaction were observed with T1, T2, T3, and BG datasets; the significant effect on satisfaction with ventilation was only observed with T3 and BG datasets; and with the RM dataset, we only observed a significant effect on overall environmental satisfaction. These inconsistencies may be due to the differences in sample size across the datasets, or to individual differences between the participants at various times. Alternatively, this variability may also be linked to the change in seasons across the survey administrations. Nevertheless, we still observed a consistent significant main effect of personal control over lighting on environmental satisfaction. Thus, we can conclude quite confidently that personal control yields more environmental satisfaction, regardless of the season.
Interestingly, the effect size for personal control over lighting was greatest for satisfaction with privacy and acoustics. This might have a cause other than differences in lighting control. This satisfaction scale included an individual question on ability to alter physical conditions, and therefore directly addresses the presence of controls. Additionally, other differences between the workstations in the two lighting control conditions in addition to the lighting equipment could have influenced satisfaction with privacy and acoustics. For instance, the no-control workstations were on a different floor of the building; perhaps people on this floor speak more on the telephone, or travel to and from more often, than those on the WSDI-C floors.
Although window proximity was shown to have a significant effect on office lighting appraisals, it had less of an effect on environmental satisfaction than personal control over lighting. Only a few significant effects were observed, and these were not consistent. This might be an artefact of collecting data from people in one building that is designed in such a way that even participants located in aisle 3-5 (furthest from window) may in some cases have a view of the window. Comparisons in buildings in which distance from a window means a lack of window access would be expected to return more consistent results. Moreover, the statistical power of contrasts involving window proximity was limited because of the smaller sample sizes.
3.4 Job Satisfaction 3.4.1 Analytic model. Four dependent variables were used as measures of job satisfaction: job satisfaction
(COPE), job satisfaction [Hackman & Oldham, 1980], organizational commitment, and intent to turnover. We considered it possible that there might be direct effects of lighting control or window proximity on job satisfaction, and therefore we conducted MANCOVAs as for the environmental satisfaction data. However, no significant effects were observed.
This finding is consistent with previous NRC research suggesting that direct effects of environmental conditions on job satisfaction are few [Veitch, Charles et al. 2003]. However, previous NRC research suggests that environmental conditions indirectly affect job satisfaction (and its consequences) through environmental satisfaction [Veitch et al. 2007]. Therefore, we tested this indirect effect using mediated regression. Figure 3 displays the full path model that we addressed in these analyses. This model was derived from published literature, including NRC research.

Occupants’ Evaluations of Individually-Controlled Lighting
NRC-IRC RR-299 54 of 81
Figure 3. Full model of the linkages between indoor environment conditions and job
satisfaction tested in this study. The strongest test of such a model would use structural equation modeling (SEM) to
conduct a simultaneous test of all of the links in the proposed model. However, it is recommended to have at least 100 cases, and 10 cases per linkage, in SEM analyses [Kline, 1998], including the linkages between individual survey items and composite measures. Clearly, the present samples (the largest N = 86) would not allow testing of the complex model in its entirety. Instead, we used a more limited technique using a series of regression analyses to test mediation [Baron & Kenny, 1986]. This technique allows testing of parts of a larger model, which can then be linked logically.
We accepted the results of the environmental satisfaction analyses (above) as demonstrating the connection between personal control over lighting and window proximity on environmental satisfaction. The remainder of the chain we tested using three partial models, which are shown schematically in Figure 4.
For Partial Model A, we tested whether overall environmental satisfaction mediated the relationship between satisfaction with lighting, ventilation, and privacy and acoustics on job satisfaction. For Partial Model B, we tested whether job satisfaction mediated the relationship between overall environmental satisfaction and organizational commitment. Finally, for Partial Model C, we tested whether organizational commitment mediated the relationship between job satisfaction and intent to turnover. Note that paths involving job satisfaction were tested twice, once for each job satisfaction measure.
To test each partial model, we followed the procedure set out by Baron and Kenny [1986]. We:
1. Regressed the dependent variable (overall environmental satisfaction) on the independent variables (personal control over lighting and window proximity)
2. Regressed the mediators (satisfaction with lighting, ventilation, and privacy and acoustics) on the independent variables
3. Regressed the dependent variable on the independent variables and the mediators
A mediated relationship is indicated if the following conditions are satisfied in the results of the regressions:
Window
Proximity Personal Control
over Lighting
Satisfaction with Ventilation
Satisfaction with Lighting
Satisfaction with Privacy & Acoustics
Overall Environmental
Satisfaction
Job Satisfaction Organizational Commitment
Intent to Turnover

Occupants’ Evaluations of Individually-Controlled Lighting
NRC-IRC RR-299 55 of 81
• Step 1 betas (standardized beta-weights) must be significant. • Step 2 betas must be significant. • The effect of the mediators on the dependent variable in Step 3: betas must be significant. • The effect of the independent variables on the dependent variable: betas must be smaller in Step 3 than in Step 1. These betas don’t have to be significant in Step 3:
o If betas = 0 in Step 3, then one has complete mediation o If betas ≠ 0 in Step 3, then one has partial mediation (common)
Fig. 4a. Partial Model A
Fig. 4b. Partial Model B
Fig. 4c. Partial Model C
Figure 4. Schematic diagrams of the three partial models tested in this study. We tested the partial models separately for T1, T2, and T3 datasets, thereby
providing partial internal replications (the study was not robust enough, nor are the methods well established to use analysis across survey times). This is not a perfect test of the model because the tests are not independent (some of the same people participated at each time). However, it provides support to theoretically-derived predictions and provides guidance for further research.
Satisfaction with
Ventilation
Satisfaction with
Lighting
Satisfaction with
Privacy & Acoustics
Overall
Environmental
Satisfaction
Job Satisfaction
Overall
Environmental
Satisfaction
Job Satisfaction Organizational
Commitment
Job Satisfaction Organizational
Commitment
Intent to
Turnover

Occupants’ Evaluations of Individually-Controlled Lighting
NRC-IRC RR-299 56 of 81
Note that significant paths do not imply causality. One can test for mediation with the same variables in the opposite direction and get a different mathematical outcome. However, the relative strength of the test does not indicate causality either, only whether or not mediation is supported in a particular direction. The choice of which direction to test should be determined by logic, theory, and supporting literature.
3.4.2 T1 results. Results for Partial Model A indicate that overall environmental satisfaction did not
successfully mediate the relationship between satisfaction with lighting, ventilation, and privacy and acoustics on either measure of job satisfaction (see Table 34). Satisfaction with privacy and acoustics had a direct effect on job satisfaction by the COPE job satisfaction measure.
Table 34. T1 results for Partial Model A. Step 1 IVs DV: Job Sat. (COPE) DV: Job Sat. (H & O) Sat. w/ Ltg く -0.07 -0.01 Sat. w/ Vent.く 0.18 0.13 Sat. W/ Pr. & Ac. く .39** 0.23 F (3,77) 7.00*** 2.66 Total R2
0.21 0.09 Adjusted R2
0.18 0.06 Step 2 IVs DV: O/A Env. Sat. Sat. w/ Ltg く 0.194 Sat. w/ Vent.く 0.031 Sat. w/ Pr. & Ac. く 0.525*** F (2,72) 20.13*** Total R2
0.440 Adjusted R2
0.418 Step 3 IVs DV: Job Sat. (COPE) DV: Job Sat. (H & O) Sat. w/ Ltg く -0.05 0.02 Sat. w/ Vent.く 0.18 0.14 Sat. w/ Pr. & Ac. く 0.43** 0.31* O/A Env. Sat. く -0.06 -0.16 F (4,76) 5.24*** 2.29 Total R2
0.22 0.11 Adjusted R2
0.18 0.06
Note. N = 81. * p<=.05. ** p<=.01. *** p<=.001. β are standardized regression coefficients.
For Partial Model B (Table 35), we tested whether job satisfaction mediated the
relationship between overall environmental satisfaction and organizational commitment. The test results did not indicate a mediating relationship using either measure of job satisfaction. Indeed, there was no relationship between overall environmental satisfaction and organizational commitment at T1. However, job satisfaction was strongly related to organizational commitment.

Occupants’ Evaluations of Individually-Controlled Lighting
NRC-IRC RR-299 57 of 81
Table 35. T1 results for Partial Model B. Step IVs DV: Org. Com. 1 O/A Env. Sat. く 0.20 F (1,79) 3.21 Total R2
0.04 Adjusted R2
0.03 Step IVs DV: Job Sat. (COPE) DV: Job Sat.
(H & O) 2 O/A Env. Sat. く 0.25* 0.10 F (1,79) 5.14* 0.82 Total R2
0.06 0.01 Adjusted R2
0.05 -0.00 Step IVs DV: Org. Com 3
Job Sat. (COPE) Job Sat. (H & O)
O/A Env. Sat. く 0.01 0.12 Job Sat. 0.77*** 0.75*** F (4,76) 55.66*** 56.75*** Total R2
0.59 0.59 Adjusted R2
0.58 0.58
Note. N = 81. * p<=.05. ** p<=.01. *** p<=.001. β are standardized regression coefficients.
For Partial Model C, we tested whether organizational commitment explained the
relation between job satisfaction and intent to turnover. The results are shown in Table 36, and show mediation to be supported using either measure of job satisfaction.
Table 36. T1 results for Partial Model C. Step IVs DV: Intent to Turnover Job Sat.
(COPE) Job Sat. (H & O)
1 Job Sat. く -0.621*** -0.685*** F (1,79) 49.64*** 69.84*** Total R2
0.386 0.469 Adjusted R2
0.378 0.463 Step IVs DV: Org. Com. Job Sat. (COPE) Job Sat.
(H & O) 2 Job Sat. く 0.767*** 0.760*** F (1,79) 112.72*** 108.22*** Total R2
0.588 0.578 Adjusted R2
0.583 0.573 Step IVs DV: Intent to Turnover 3
Job Sat. (COPE) Job Sat. (H & O)
Job Sat. く -0.217 -0.374** Org. Com. く -0.527*** -0.409*** F (2,78) 39.02*** 45.74*** Total R2
0.500 0.540 Adjusted R2
0.487 0.528
Note. N = 81 * p<=.05. ** p<=.01. *** p<=.001. β are standardized regression coefficients.
3.4.3 T2 results. Partial model A was not supported: Overall environmental satisfaction did not
successfully mediate the relationship between satisfaction with lighting, ventilation, and

Occupants’ Evaluations of Individually-Controlled Lighting
NRC-IRC RR-299 58 of 81
privacy and acoustics on either measure of job satisfaction (see Table 37). However, as at T1, satisfaction with privacy and acoustics had a strong relationship to job satisfaction; at T2 the relationship held for both measures of job satisfaction.
Table 37. T2 results for Partial Model A. Step 1 IVs DV: Job Sat. (COPE) DV: Job Sat. (H & O) Sat. w/ Ltg く -0.06 0.10 Sat. w/ Vent.く 0.27* 0.07 Sat. W/ Pr. & Ac. く 0.43*** 0.36** F (3,74) 12.55*** 6.19*** Total R2
0.34 0.20 Adjusted R2
0.31 0.17 Step 2 IVs DV: O/A Env. Sat. Sat. w/ Ltg く 0.07 Sat. w/ Vent.く 0.30** Sat. W/ Pr. & Ac. く 0.44*** F (2,72) 20.67*** Total R2
0.46 Adjusted R2
0.43 Step 3 IVs DV: Job Sat. (COPE) DV: Job Sat. (H & O) Sat. w/ Ltg く -0.06 0.10 Sat. w/ Vent.く 0.29* 0.08 Sat. W/ Pr. & Ac. く 0.45*** 0.39** O/A Env. Sat. く -0.06 -0.06 F (4,73) 9.36*** 4.63** Total R2
0.34 0.20 Adjusted R2
0.30 0.16
Note. N = 78. * p<=.05. ** p<=.01. *** p<=.001. β are standardized regression coefficients.
Mediation was supported for Partial Model B, but not for Partial Model C. That is, job
satisfaction (both measures) successfully mediated the relationship between overall environmental satisfaction and organizational commitment (see Table 38), but organizational commitment did not mediate the relationship between job satisfaction (both measures) and intent to turnover (see Table 39).

Occupants’ Evaluations of Individually-Controlled Lighting
NRC-IRC RR-299 59 of 81
Table 38. T2 results for Partial Model B. Step IVs DV: Org. Com. 1 O/A Env. Sat. く 0.24* F (1,76) 4.57 Total R2
0.06 Adjusted R2
0.04 Step IVs DV: Job Sat. (COPE) DV: Job Sat.
(H & O) 2 O/A Env. Sat. く 0.35*** 0.26* F (1,79) 10.92*** 5.49* Total R2
0.13 0.07 Adjusted R2
0.11 0.06 Step IVs DV: Org. Com 3
Job Sat. (COPE) Job Sat. (H & O)
O/A Env. Sat. く -0.01 0.09 Job Sat. 0.71*** 0.59*** F (2,75) 37.26*** 23.36*** Total R2
0.50 0.38 Adjusted R2
0.49 0.37
Note. N = 78. * p<=.05. ** p<=.01. *** p<=.001. β are standardized regression coefficients.
Table 39. T2 results for Partial Model C. Step IVs DV: Intent to Turnover Job Sat.
(COPE) Job Sat. (H & O)
1 Job Sat. く -0.58*** -0.73*** F (1,76) 38.14*** 84.63*** Total R2
0.33 0.53 Adjusted R2
0.33 0.52 Step IVs DV: Org. Com. Job Sat. (COPE) Job Sat.
(H & O) 2 Job Sat. く 0.71*** 0.61*** F (1,76) 75.46*** 46.02*** Total R2
0.50 0.38 Adjusted R2
0.49 0.37 Step IVs DV: Intent to Turnover 3
Job Sat. (COPE) Job Sat. (H & O)
Job Sat. く -0.46*** -0.68*** Org. Com. く -0.16 -0.07 F (2,75) 19.96*** 42.27*** Total R2
0.35 0.53 Adjusted R2
0.33 0.52
Note. N = 78. * p<=.05. ** p<=.01. *** p<=.001. β are standardized regression coefficients.
3.4.4 T3 results. As at T1 and T2, Partial Model A was not supported at T3: Overall environmental
satisfaction did not successfully mediate the relationship between satisfaction with lighting, ventilation, and privacy and acoustics on either measure of job satisfaction (see Table 40). However, satisfaction with privacy and acoustics showed a medium-to-strong direct association with job satisfaction.

Occupants’ Evaluations of Individually-Controlled Lighting
NRC-IRC RR-299 60 of 81
Table 40. T3 results for Partial Model A. Step 1 IVs DV: Job Sat. (COPE) DV: Job Sat. (H & O) Sat. w/ Ltg く 0.04 0.03 Sat. w/ Vent.く -0.05 -0.01 Sat. W/ Pr. & Ac. く 0.40** 0.42*** F (3,77) 5.06** 6.26*** Total R
2 0.16 0.19
Adjusted R2 0.13 0.16
Step 2 IVs DV: O/A Env. Sat. Sat. w/ Ltg く 0.07 Sat. w/ Vent.く 0.06 Sat. W/ Pr. & Ac. く 0.69*** F (3,82) 36.41*** Total R
2 0.57
Adjusted R2 0.56
Step 3 IVs DV: Job Sat. (COPE) DV: Job Sat. (H & O) Sat. w/ Ltg く 0.05 0.04 Sat. w/ Vent.く -0.04 -0.00 Sat. W/ Pr. & Ac. く 0.53** 0.45** O/A Env. Sat. く -0.19 -0.04 F (4,81) 4.21** 4.66** Total R
2 0.17 0.19
Adjusted R2 0.13 0.15
Note. N = 86. * p<=.05. ** p<=.01. *** p<=.001. β are standardized regression coefficients.
Consistent with T2, but not T1, Partial Model B test results did indicate that job
satisfaction successfully mediated the relationship between overall environmental satisfaction and organizational commitment using either measure of job satisfaction (see Table 41).
Table 41. T3 results for Partial Model B. Step IVs DV: Org. Com. 1 O/A Env. Sat. く 0.27* F (1,84) 6.72* Total R
2 0.07
Adjusted R2 0.06
Step IVs DV: Job Sat. (COPE) DV: Job Sat. (H & O)
2 O/A Env. Sat. く 0.21* 0.31** F (1,84) 3.93* 8.75** Total R
2 0.05 0.09
Adjusted R2 0.03 0.08
Step IVs DV: Org. Com 3
Job Sat. (COPE) Job Sat. (H & O)
O/A Env. Sat. く 0.13 0.11 Job Sat. 0.65*** 0.54*** F (2,83) 38.70*** 21.60*** Total R
2 0.48 0.34
Adjusted R2 0.47 0.33
Note. N = 86. * p<=.05. ** p<=.01. *** p<=.001. β are standardized regression coefficients.
Consistent with T1, but not T2, Partial Model C test results supported the mediating role of organizational commitment in the relationship between job satisfaction and intent to

Occupants’ Evaluations of Individually-Controlled Lighting
NRC-IRC RR-299 61 of 81
turnover (see Table 42). However, Partial Model C was only supported for Hackman and Oldham’s measure of job satisfaction [1980].
Table 42. T3 results for Partial Model C. Step IVs DV: Intent to Turnover Job Sat.
(COPE) Job Sat. (H & O)
1 Job Sat. く -0.74*** -0.59*** F (1,84) 104.18*** 43.76*** Total R
2 0.55 0.34
Adjusted R2 0.55 0.34
Step IVs DV: Org. Com. Job Sat. (COPE) Job Sat.
(H & O) 2 Job Sat. く 0.68*** 0.58*** F (1,84) 73.13*** 41.81*** Total R
2 0.47 0.33
Adjusted R2 0.46 0.32
Step IVs DV: Intent to Turnover 3
Job Sat. (COPE) Job Sat. (H & O)
Job Sat. く -0.64*** -0.37*** Org. Com. く -0.16 -0.38*** F (2,83) 54.22*** 32.39*** Total R
2 0.57 0.44
Adjusted R2 0.56 0.43
Note. N = 86. * p<=.05. ** p<=.01. *** p<=.001. β are standardized regression coefficients.
3.4.5 Summary: Job satisfaction. Overall, the three sets of mediated regressions showed good consistency. Partial
model A (3 satisfaction measures å overall environmental satisfaction å job satisfaction) did not show mediation by overall environmental satisfaction, but did show direct effects of satisfaction with privacy and acoustics on job satisfaction at all three times. Partial model B (OES å job satisfaction å organizational commitment) was supported at T2 and T3. Partial model C (job satisfaction å organizational commitment å intent to turnover) was supported at T1 and T3. Partial models B and C were supported with large effect sizes. Given the modest sample sizes, the limited variability in the data, and the seasonal variations one would expect in the environmental satisfaction measures, the results are remarkably robust.
3.5 Qualitative Office Appraisals Three open-ended questions were used as measures of overall office appraisals: • What do you like most about your office? • What do you like least about your office? • What would you change about your office? These open-ended questions offered an opportunity for participants to provide more
detailed information about their satisfaction with their office environment. These data were analyzed qualitatively. A research assistant blind to the study’s purposes used inductive content analysis to analyze the open-ended responses. In inductive content analysis, the analyst constructs categories of topics that were created and expressed by the participants [Luborsky, 1994; Marshall & Rossman, 1995; Patton, 1990; Strauss & Corbin, 1998]. That is, the analyst generates categories through analysis of the local use of language.
The first step of analysis, open coding, involved a microanalysis of each response [Strauss & Corbin, 1998]. By thoroughly analyzing each response, the analyst was able to

Occupants’ Evaluations of Individually-Controlled Lighting
NRC-IRC RR-299 62 of 81
generate a list of codes that emerged from the data. Each code represents a main topic [Marshall & Rossman, 1995]. The second step, creating categories, involved using the method of constant comparisons to group conceptually similar codes/topics into categories [Glasser, 1964-65; Strauss & Corbin, 1998]. Categories were internally consistent but distinct from one another [Guba, 1978]. Investigator triangulation helps to ensure credible findings [Seale, 1999]. Thus, as the final step in this analysis strategy, a second analyst recoded the responses to each question using the list of codes generated by the first analyst. Intraclass correlation (rI) was used to test interrater reliability [Hunter & Koopman, 1990]. The second analyst also reviewed the first analyst’s categories of codes; any disagreements were resolved together.
The T1, T2, and T3 datasets were analyzed separately, following the procedure outlined above. Note that data were analyzed over the whole sample (not split by experimental group). We were interested in obtaining additional information regarding general perceptions of the office environment, regardless of one’s location in the building or whether one had personal control over lighting.
3.5.1 T1 results. The T1 open-ended results for the question “What do you like most about your
office?” are summarized in Table 43. Interestingly, the open-ended responses are a good mirror to the quantitative findings. That is, lighting (f = 47, 50) was considered the major strength of the office with aspects of the window (f = 35, 36) and personal control of lighting (f = 9, 9) being top contributors. Intraclass correlation indicated excellent agreement between both analysts (rI =.98, p<.05).
The T1 open-ended results for the question “What do you like least about your office?” are summarized in Table 44. Participants found that disturbances (f = 40, 45), indoor air (f = 40, 39), and office design (f = 23, 27) were top weaknesses of the office. Given that lighting was considered a major strength, it is not surprising that lighting (f = 14, 17) was considered a minor weakness. Intraclass correlation indicated excellent agreement between both analysts (rI =.97, p<.05).
The T1 open-ended results for the question “What would you change about your office?” are summarized in Table 45. As expected, the three major weaknesses, disturbances (f = 42, 38), indoor air (f = 24, 25), and office design (f = 18, 19), received the most frequently reported suggestions for improvement. Likewise, lighting, the major strength, was a less frequent suggested improvement (f = 10, 13). Intraclass correlation indicated excellent agreement between both analysts (rI =.91, p<.05).

Occupants’ Evaluations of Individually-Controlled Lighting
NRC-IRC RR-299 63 of 81
Table 43. T1 responses for “What do you like most about your office?” Category name Codes in category Frequency (f) counts of codes
1st analyst 2
nd analyst
Light
View Windows Control of lighting Natural light Lighting
16 11 9 8 3
16 12 9 8 5
Total 47 50
Office Design
Size of workstation Office layout Workstation Enough privacy Work environment
11 10 6 4 3
9 12 8 4 4
Total 34 37
Communication
Co-workers Social interaction Close proximity to co-workers Teamwork
15 5 3 1
18 4 5 2
Total 24 29
Job
Variety of job tasks Challenged Freedom of thought Learning
3 1 1 1
2 2 1 1
Total 6 6
Location Location 5 4
Total 5 4
Aesthetic Appearance Colour scheme 1 2
Total 1 2

Occupants’ Evaluations of Individually-Controlled Lighting
NRC-IRC RR-299 64 of 81
Table 44. T1 responses for “What do you like least about your office?” Category name Codes in category Frequency (f) counts of codes
1st analyst 2
nd analyst
Disturbances No privacy Distractions due to office layout Noise Noisy HVAC system Height of partitions
15 13 7 3 2
17 11 12 3 2
Total 40 45
Indoor Air Wrong temperature Fluctuating temperature Poor air quality Lack of fresh air Poor temperature control No control of HVAC system Drafty Doors
13 8 6 4 4 2 2 1
13 8 5 4 4 1 3 1
Total 40 39
Office Design Office layout Size of workstation Lack of storage Lack of meeting rooms
10 7 4 2
14 7 4 2
Total 23 27
Light Glare from windows Lighting Not near window No control of lighting Lack of natural light
4 4 4 1 1
4 4 4 3 2
Total 14 17
Aesthetic Appearance Appearance/clutter No plants Colour scheme Furniture
2 2 1 1
3 2 1 1
Total 6 7
SBS symptoms SBS symptoms 4 4
Total 4 4

Occupants’ Evaluations of Individually-Controlled Lighting
NRC-IRC RR-299 65 of 81
Table 45. T1 responses for “What would you change about your office?” Category name Codes in category Frequency (f) counts of codes
1st analyst 2
nd analyst
Disturbances
Height of partitions Less noise More privacy Have enclosed offices Fewer distractions Add partitions Want background music
11 9 8 7 4 2 1
10 9 8 4 3 3 1
Total 42 38
Indoor Air
Balance HVAC Better airflow Having control of temperature Change temperature Change HVAC system Better air quality
8 6 4 2 2 2
3 6 4 5 4 3
Total 24 25
Office design Size of workstation More storage space Office layout More meeting rooms Remove partitions
8 4 3 2 1
8 5 4 1 1
Total 18 19
Light
Lighting Want desk lamp Want window Want control of lighting Glare from window
4 2 2 1 1
5 2 4 1 1
Total 10 13
Location Location 3 4
Total 3 4
Teamwork Teamwork 2 2
Total 2 2
Aesthetic Appearance Colours/appearance 1 2
Total 1 1
3.5.2 T2 results. T2 open-ended results for the question “What do you like most about your office?”
are summarized in Table 46. The open-ended responses replicated those from T1 in that lighting (f = 45, 45) was considered the major strength of the office with aspects of the window (f = 26, 28) and personal control of lighting (f = 8, 8) being top contributors. Intraclass correlation indicated excellent agreement between both analysts (rI =.97, p<.05).

Occupants’ Evaluations of Individually-Controlled Lighting
NRC-IRC RR-299 66 of 81
Table 46. T2 responses for “What do you like most about your office?” Category name Codes in category Frequency (f) counts of codes
1st analyst 2
nd analyst
Light
View Lighting Windows Control of lighting Natural light
11 11 8 8 7
12 9 7 8 9
Total 45 45
Office Design
Size of workstation Office layout Work environment Enough privacy Workstation
8 7 4 4 2
9 7 3 4 3
Total 25 26
Communication
Co-workers Social interaction Close proximity to co-workers
17 4 2
17 5 3
Total 23 25
Location Location 8 9
Total 8 9
Aesthetic Appearance Cleanliness Colour scheme
3 2
4 2
Total 5 6
Job
The work Variety of job tasks
2 1
2 0
Total 3 2
The T2 open-ended results for the question “What do you like least about your
office?” are summarized in Table 47. Consistent with T1, participants considered disturbances (f = 50, 50), office design (f = 25, 28), and indoor air (f = 18, 20) the three major weaknesses of the office. Also, lighting was still considered only a minor weakness (f = 8, 8). Intraclass correlation indicated excellent agreement between both analysts (rI =.98, p<.05).

Occupants’ Evaluations of Individually-Controlled Lighting
NRC-IRC RR-299 67 of 81
Table 47. T2 responses for “What do you like least about your office?” Category name Codes in category Frequency (f) counts of codes
1st analyst 2
nd analyst
Disturbances No privacy Distractions due to office layout Noise Height of partitions No walls Noisy HVAC system
18 16 10 3 2 1
17 13 13 4 2 1
Total 50 50
Office Design Office layout Size of workstation More space Lack of storage Lack of meeting rooms Employees in different buildings Elevators
8 5 4 2 2 2 2
11 6 4 2 2 1 2
Total 25 28
Indoor Air Wrong temperature Temperature Fluctuating temperature Poor air quality No control of HVAC system
7 3 3 3 2
7 3 3 4 3
Total 18 20
Light Lighting Glare from windows Lack of natural light
4 3 1
4 3 1
Total 8 8
Location Location 2 3
Total 2 3
The T2 open-ended results for the question “What would you change about your
office?” are summarized in Table 48. Again, responses were as expected and paralleled those from T1. That is, the three major weaknesses, disturbances (f = 37, 36), indoor air (f = 18, 18), and office design (f = 12, 15), received the most frequently reported suggestions for improvement. Also, participants suggested fewer improvements for lighting (f = 8, 8), which was considered the office’s major strength. Intraclass correlation indicated excellent agreement between both analysts (rI =.97, p<.05).

Occupants’ Evaluations of Individually-Controlled Lighting
NRC-IRC RR-299 68 of 81
Table 48. T2 responses for “What would you change about your office?” Category name Codes in category Frequency (f) counts of codes
1st analyst 2
nd analyst
Disturbances
Have enclosed offices Less noise Height of partitions More privacy Fewer distractions Access to quiet areas
10 9 6 5 4 3
10 9 6 6 2 3
Total 37 36
Office design Size of workstation More space More storage space
8 5 5
7 6 5
Total 18 18
Indoor Air
Balance HVAC Better air quality Having control of temperature Change temperature Better airflow
3 3 2 2 2
4 4 2 2 3
Total 12 15
Light
Want window Have control of lighting Glare from window
4 2 2
4 2 2
Total 8 8
Location Location Office Relocation
2 2
1 3
Total 4 4
Aesthetic Appearance Colours/appearance 2 3
Total 2 3
3.5.3 T3 results. The T3 open-ended results for the question “What do you like most about your
office?” are summarized in Table 49. The open-ended responses replicated those from T1 and T2. Lighting (f = 41, 43), particularly window aspects (f = 25, 28) and personal control over lighting (f = 9, 9), was considered the major strength of the office. Intraclass correlation indicated excellent agreement between both analysts (rI =.97, p<.05).

Occupants’ Evaluations of Individually-Controlled Lighting
NRC-IRC RR-299 69 of 81
Table 49. T3 responses for “What do you like most about your office?” Category name Codes in category Frequency (f) counts of codes
1st analyst 2
nd analyst
Light
View Control of lighting Natural light Windows Lighting
10 9 8 7 7
10 9 10 8 6
Total 41 43
Office Design
Office layout Size of workstation Comfort Enough privacy Fitness Center Workstation Work environment
5 4 4 3 3 2 2
7 2 2 3 3 2 3
Total 23 22
Communication
Co-workers Social interaction
13 2
13 2
Total 15 15
Aesthetic Appearance Cleanliness Modern
4 2
4 3
Total 6 7
Location Location 5 6
Total 5 6
Job
The work Teamwork
2 2
2 2
Total 4 4
The T3 open-ended results for the question “What do you like least about your
office?” are summarized in Table 50. Consistent with T1 and T2, disturbances (f = 31, 34), office design (f = 22, 26), and indoor air (f = 20, 19) were considered the three major weaknesses of the office. Lighting was again found to be only a minor weakness (f = 11, 11). Intraclass correlation indicated excellent agreement between both analysts (rI =.97, p<.05).

Occupants’ Evaluations of Individually-Controlled Lighting
NRC-IRC RR-299 70 of 81
Table 50. T3 responses for “What do you like least about your office?” Category name Codes in category Frequency (f) counts of codes
1st analyst 2
nd analyst
Disturbances No privacy Distractions due to office layout Noise Sometimes work from home
12 10 7 2
12 12 8 2
Total 31 34
Office Design Office layout Size of workstation Workspace Lack of storage
10 7 3 2
13 8 3 2
Total 22 26
Indoor Air Poor air quality Fluctuating temperature Wrong temperature
10 7 3
9 6 4
Total 20 19
Light Lighting No window Glare from windows
6 3 2
6 3 2
Total 11 11
Aesthetic Appearance Appearance 4 3
Total 4 3
Location Location 2 4
Total 2 4
SBS symptoms Health problems 2 4
Total 2 4
The T3 open-ended results for the question “What would you change about your
office?” are summarized in Table 51. Results coincide with those from T1 and T2, with the three major weaknesses, disturbances (f = 39, 36), indoor air (f = 21, 21), and office design (f = 17, 19) receiving the most frequently reported suggestions for improvement. Also, fewer improvements were suggested for the office’s major strength, lighting (f = 10, 10). Intraclass correlation indicated excellent agreement between both analysts (rI =.97, p<.05).

Occupants’ Evaluations of Individually-Controlled Lighting
NRC-IRC RR-299 71 of 81
Table 51. T3 responses for “What would you change about your office?” Category name Codes in category Frequency (f) counts of codes
1st analyst 2
nd analyst
Disturbances
More privacy Less noise Height of partitions Have enclosed offices More partitions Access to quiet areas Fewer distractions
11 11 5 4 3 3 2
11 9 6 5 1 3 1
Total 39 36
Indoor Air
Better air quality Balance HVAC Control of temperature Change temperature
8 5 5 3
8 4 5 4
Total 21 21
Office design Size of workstation More space More storage space More space between workers Customized workstation
7 4 2 2 2
6 6 2 2 3
Total 17 19
Light
Glare from window/light Want window Have control of lighting Want LCD monitor
3 3 2 2
3 3 2 2
Total 10 10
Location Office relocation 3 3
Total 3 3
3.5.4 Summary: Qualitative appraisals. Lighting was considered a major strength and a minor weakness across T1, T2, and
T3. Likewise, lighting received the least number of suggested improvements at all three times. For the most part, participants liked having personal control over lighting and access to a window. Taken together, these qualitative remarks indicate that participants are generally satisfied with their lit office environment. This is an important observation because satisfaction with lighting is a precursor to job satisfaction and other outcomes related to the organization’s bottom-line through its direct effect on environmental satisfaction. Overall, the qualitative data mirrored the quantitative data, and just as with the quantitative findings, because the qualitative findings were consistent across time it is unlikely that they were influenced by the awareness campaign.
4 Discussion The survey portion of this longitudinal field investigation examined the effects of
personal control over lighting and window proximity on office lighting appraisals, environmental satisfaction, and job satisfaction. In-depth open-ended feedback regarding the overall office environment’s strengths, weaknesses, and areas for improvement was also obtained. We studied these effects at three times over a period of seven months, both before and after implementing an awareness campaign.
The results showed that personal control over lighting and, to a lesser extent, window proximity, had a positive direct effect on office lighting appraisals and environmental satisfaction. The results replicate previous research showing benefits associated with

Occupants’ Evaluations of Individually-Controlled Lighting
NRC-IRC RR-299 72 of 81
individual control over workplace lighting [Boyce et al., 2003; Newsham et al., 2004]. Indeed the finding that ~90% of occupants rated the individually-controlled lighting as comfortable, versus ~70% for the non-controllable lighting, is precisely the result observed by Boyce et al. [2003] using the OLS.
Individual control over lighting and, to a lesser extent, window proximity, had a positive indirect effect on job satisfaction and its consequences through environmental satisfaction. Figure 5 shows the results graphically. The direct relationships from personal control over lighting to the four measures of environmental satisfaction were found using MANCOVA analyses, both within the three survey times and in the independent tests of the BG and RM participants. The results were broadly similar for the various ways in which the data were analysed.
Similarly, large, statistically significant intercorrelations between the four measures of environmental satisfaction were found in all of the five datasets (Tables 15-19). Although unidirectional paths to environmental satisfaction were expected in the mediated regressions (in which all three subtypes were entered at the same time into one predictive equation), only satisfaction with privacy and acoustics showed statistical significance (tests in step 2 of Partial Model A, Tables 34, 37, and 40). The high intercorrelations between the three subtypes account for this result. Overall, the results for this portion of the model are consistent with the COPE field study results to the extent to which a direct comparison is possible (different statistical techniques were used here because of the smaller sample size) [Veitch et al., 2007].
The path from overall environmental satisfaction, through job satisfaction and organizational commitment to intent to turnover was observed in various of the mediated regressions. Although not all paths were statistically significant at all times, we are confident in the overall logical chain because each path was supported at more than one time and because the results are consistent with predictions based on the literature. For example, Carlopio [1996] observed a relationship between satisfaction with the physical environment and job satisfaction, organizational commitment, and intent to turnover.
Figure 5. Graphical summary of relationships in survey data.
Window
Proximity
Personal Control over
Lighting
Satisfaction with
Ventilation
Satisfaction with
Lighting
Satisfaction with
Privacy & Acoustics
Overall
Environmental
Satisfaction
Job Satisfaction Organizational
Commitment
Intent to
Turnover

Occupants’ Evaluations of Individually-Controlled Lighting
NRC-IRC RR-299 73 of 81
There was no evidence that the awareness campaign had any influence on any of the outcomes. This is probably because satisfaction with the individual control over lighting was already high even at T1, which occurred only a few months after the lighting system was overhauled and recommissioned in preparation for the study (work that may have acted like an awareness campaign for many users).
The quantitative findings were also supported by the qualitative open-ended responses. Personal control over lighting and windows were considered the office environment’s top strengths. Three respondents expressed this best, as follows:
[What do you like most about your office?]. - I have large windows that let in natural light. Also the view gives you a break
from the day. The lighting system is great, dimming the lights when full output is not needed.
- Large windows which allows for lots of natural light. Also the personal lighting control is helpful because I can adjust how much light I want.
- The view. Amount of natural light. Ability to change the amount of light. When personal control over lighting or windows were mentioned as weaknesses or
areas for improvement, it was because respondents were unsatisfied with not having these features. Four respondents expressed this best, as follows:
[What do you like least about your office?]. - The lighting. The floor I’m now on doesn’t have the same lighting
technology. I no longer have my dedicated overhead luminaire that I could control the intensity through my PC. We’re stuck with general lighting. Quite a difference.
[What would you change about your office?]. - Possibly have the same lighting as the other floors. The other floors have
lighting controls so individuals can control their lighting easily. How – not sure because the lighting is set on our floor.
- No natural lighting at my desk. - Change lighting to more natural light by moving my office to a window.
Although the results of this study were generally as expected, there were some
inconsistencies observed over time, as well as some unexpected results. These may stem from limitations of the present study: small sample size, limited variability presented by data from a single organization in a single building, seasonal differences between survey times, and uncontrolled variation between groups (e.g., office furnishings differences other than lighting and lighting controls; demographic variables other than those measured). These are inevitable characteristics of a quasi-experiment. Nonetheless, these results are impressive for their consistency with a wide variety of investigations from the environmental psychology and organizational psychology literatures [e.g., Boyce et al., 2003; Carlopio, 1996; Lambert et al., 2001; Veitch et al., 2007; Wilson et al. 2004].
5 Conclusions The energy use study showed that if installed independently, the individual controls
would have delivered the lowest energy savings compared to the other control options (average savings of less than 10% compared to full WSDI-C use) [Galasiu et al., 2007]. Adding individual control to the lighting system already controlled by occupancy and light sensors provided very little additional energy saving benefit. However, the ability of the occupants to choose their own preferred light level with the individual on–screen control is an important benefit not offered by the other two control options. The results of the occupant

Occupants’ Evaluations of Individually-Controlled Lighting
NRC-IRC RR-299 74 of 81
surveys conducted in this study showed that the workstations including personal lighting controls received more favourable office appraisals, and that the occupants of those workstations had higher levels of environmental satisfaction. These findings were observed at all three survey occasions and replicate observations from previous research at NRC and elsewhere [Boyce et al., 2003; Newsham et al., 2004].
Although there was no direct link between provision of WSDI-Cs/window access and job satisfaction-related outcomes, there was an indirect link. Occupants with higher environmental satisfaction also had higher job satisfaction, higher organizational commitment, and lower intent to turnover (voluntarily leave their job). This supports the findings from previous research [Carlopio, 1996; Veitch et al 2007], and the potential value to organizations of providing a satisfactory indoor environment through the provision of personal controls, access to windows, or other measures.
In this study, there were no reported accounts of occupants’ dissatisfaction with the photocontrolled lighting because of the lights going on/off inappropriately or because of distracting light level transitions. The occupancy sensing was also not perceived negatively or reported as triggering the lights to go off inappropriately while working on tasks that did not require frequent movement. On-triggering from passers-by was also not raised as an issue in this installation, which overall suggests a satisfactory installation of the WSDI-C lighting system. However, it should not be overlooked that continuous calibration and correct maintenance throughout the life of the system is key to its energy saving potential, as well as to the occupants’ satisfaction and acceptance of the system.
References Allen, N. J., Meyer, J. P., The measurement and antecedents of affective, continuance and
normative commitment to the organization, Journal of Occupational Psychology, 63(1):1-18, 1990.
Allen, N. J., Meyer, J. P., Affective, continuance, and normative commitment to the organization: An examination of construct validity, Journal of Vocational Behaviour, 49(3): 252-276, 1996.
Baron, R. M., Kenny, D. A., The moderator-mediator variable distinction in social psychological research: Conceptual, strategic and statistical considerations, Journal of Personality and Social Psychology, 51: 1173-1182, 1986.
Bordass, W., Heasman, T., Leaman, A., Perry, M.J., Daylight use in open plan offices: The opportunities and the fantasies, Proceedings of National Lighting Conference and Daylighting Colloquium, Cambridge, Robison College, London, UK:CIBSE, pp. 243-256, 1994.
Boyce, P.R., Veitch, J. A., Newsham, G. R., Myer, M., Hunter, C., Lighting quality and office work: A field simulation study, Richland, WA, USA, Pacific Northwest National Laboratory, 2003, Available at: http://irc.nrc-cnrc.gc.ca/pubs/fulltext/b3214.1/
Brill, M., Weidemann, S., & the BOSTI Associates, Disproving widespread myths about workplace design, Jasper, IN: Kimball International, 2001.
Carlopio, J. R., Construct validity of a physical work environment satisfaction questionnaire, Journal of Occupational Health Psychology, 1(3): 330-344, 1996.
Charles, K. E., Veitch, J. A., Newsham, G. R., Marquardt, C. J. G., & Geerts, J., Satisfaction with ventilation in open-plan offices: COPE field findings, In E. de Oliveira Fernandes, M. Gameiro da Silva, & J. Rosado Pinto (Eds), Proceedings of Healthy Buildings 2006: Creating a healthy indoor environment for people (Vol. 2, pp. 93-98). Lisboa, Portugal: International Society of Indoor Air Quality and Climate, 2006, Available at: http://irc.nrc-cnrc.gc.ca/pubs/fulltext/nrcc46788/.
Cohen, J., Statistical power analysis for the behavioral sciences (2nd ed.),Hillsdale, NJ: Erlbaum, 1988.

Occupants’ Evaluations of Individually-Controlled Lighting
NRC-IRC RR-299 75 of 81
Colarelli, S. M., Methods of communication and mediating processes in realistic job previews, Journal of Applied Psychology, 69: 633-642, 1984.
Cook, T. D., Campbell, D. T., Quasi-experimentation: Design and analysis for field settings, Boston, MA: Houghton Mifflin, 1979.
Eklund, N. H., Boyce, P. R., The development of a reliable, valid and simple office lighting survey, Journal of Illuminating Engineering Society, 25(2): 25-40, 1996.
Gaertner, S., Structural determinants of job satisfaction and organizational commitment in turnover models, Human Resource Management Review, 9(4): 479-493, 1999.
Galasiu A. D., Newsham G. R., Suvagau C., Sander D. M., Energy saving lighting control systems for open-plan offices: a field study, Leukos 4(1):7-29, 2007.
Ghiselli, E. E., Campbell, J. P., Zedeck, S., Measurement theory for the behavioral sciences, San Francisco, CA: W. H. Freeman, 1981.
Glasser, B. G., The constant comparative method of qualitative analysis, Social Problems, 12: 436-445, 1964-65.
Guba, E. G., Toward a methodology of naturalistic inquiry in educational evaluation, Los Angeles, CA: UCLA Center for the Study of Evaluation, 1978.
Hackman, J. R., & Oldham, G. R., Work Redesign, Reading, MA: Addison-Wesley, 1980. Harter, J. K., Schmidt, F. L., & Hayes, T. L., Business-unit-level relationship between
employee satisfaction, employee engagement, and business outcomes: a meta-analysis, Journal of Applied Psychology, 87(2): 268-279, 2002.
Hunter, M. A., Koopman, R., Interobserver agreement and reliability of infant visual fixation data. Infant behaviour and development, 13(1): 109-116, 1990.
Jennings, J.D., Rubinstein, F. M., DiBartolomeo, D., Blanc, S. L., Comparison of control options in private offices in an advanced controls testbed, Journal of the Illuminating Engineering Society, vol. 29(2):39-60, 2000.
Keppel, G., Design and analysis: A researcher’s handbook (2nd ed.), Englewood Cliffs, NJ: Prentice-Hall, 1982.
Kerlinger, F. N., Lee, H. B., Foundations of behavioral research (4th ed.), Fort Worth, TX: Harcourt College, 2000.
Kline, R. B., Principles and practice of structural equation modeling, New York: Guilford Press, 1998.
Lambert, E. G., Hogan, N. L., Barton, S. M., The impact of job satisfaction turnover intent: A test of a structural measurement model using a national sample of workers, The Social Science Journal, 38: 233-250, 2001.
Lee, E.S., Selkowitz, S.E., The New York Times Headquarters daylighting mock-up: Monitored performance of the daylighting control system, Energy and Buildings, 38(7): 914-929, 2006.
Love, J., Field performance of daylighting systems with photoelectric controls, Proceedings of the 3rd European Conference on Energy-Efficient Lighting – Right Light 3, Newcastle, England, pp. 75-82, 1995.
Luborsky, M. R., The identification and analysis of themes and patterns, In Gubrium, J. F., & Sankar, A. (Eds.), Qualitative methods in aging research, pp. 189-210, Thousand Oaks, CA: Sage, 1994.
Maniccia, D., Rutledge, B., Rea, M. S., Morrow, W., Occupant use of manual lighting controls in private offices, Journal of the Illuminating Engineering Society, 28(2): 42-56, 1999.
Marshall, C., Rossman, G. B., Designing qualitative research (2nd ed.), Thousand Oaks, CA: Sage, 1995.
Meyer, J. P., Allen, N. J., Smith, C. A., Commitment to organizations and occupations: Extension and test of a three-component conceptualization, Journal of Applied Psychology, 78(4): 538-551, 1993.

Occupants’ Evaluations of Individually-Controlled Lighting
NRC-IRC RR-299 76 of 81
Natural Resources Canada (NRCan), Energy Use Data Handbook, 1990 and 1997 to 2003, June 2005, Available at: http://oee.nrcan.gc.ca/corporate/statistics/neud/dpa/data_e/handbook05/Datahandbook2005.pdf
Newsham, G. R., Veitch, J. A., Arsenault, C., Duval, C., Effect of dimming control on office worker satisfaction and performance. Proceedings of the IESNA Annual Conference, Tampa, FL, USA, pp. 19-41, 2004, Available at: http://irc.nrc-cnrc.gc.ca/fulltext/nrcc47069/
Newsham; G.R. & Mancini, S., The Potential for demand-responsive lighting in non-daylit offices, Leukos, 3(2): 105-120, 2006.
Osland, J., Kolb, D., & Rubin, I., Organizational behaviour: An experiential approach (7th ed.), Upper Saddle River, NJ: Prentice Hall, 2000.
Patton, M. Q., Qualitative evaluation and research methods, Newbury Park, CA: SAGE Publications, 1990.
Seale, C., The quality of qualitative research, Thousand Oaks, CA: Sage, 1999. Slater, A., Occupant use of lighting controls: A review of current practice, problems, and how
to avoid them, Proceedings of the CIBSE National Conference, Eastbourne, London, pp. 204-209, 1995.
Slater, A., Lighting controls in offices: How to improve occupant comfort and energy efficiency, Proceedings of the CIBSE National Lighting Conference, Bath, pp. 178-184, 1996.
Strauss, A., Corbin, J., Basics of qualitative research: Techniques and procedures for developing grounded theory, Thousand Oaks, CA: Sage, 1998.
Suvagau, V. C., Hughes, R., Performance evaluation of intelligent personal controls for open office lighting, Proceedings of CIE-CNRI “Light & Lighting 2002: Comfort and Efficiency within Interior and Exterior Lighting Systems”, Bucharest, Romania, 1:146-157, 2002.
Tabachnick, B. G., Fidell, L. S., Using multivariate statistics (4th ed.), Boston, MA: Allyn & Bacon, 2001.
Veitch, J. A., Charles, K. E., Farley, K. M. J., & Newsham, G. R., A model of satisfaction with open-plan office conditions: COPE field findings, Journal of Environmental Psychology, 27(3): 177-189, 2007.
Veitch, J. A., Charles, K. E., Newsham, G. R., Marquardt, C. J. G., Geerts, J., Environmental satisfaction in open-plan environments: 5. Workstation and physical condition effects, NRC/IRC Research Report RR-154, Ottawa, ON: National Research Council Canada, Institute for Research in Construction, 2003, Available at: http://irc.nrc-cnrc.gc.ca/fulltext/rr154/
Veitch, J. A., Donnelly, C. L., Galasiu, A. D., & Sander, D. M. (2008, June). Organizational behaviours to save energy: the case of lighting controls [Summary]. Canadian Psychology, 49(2a), 116.
Veitch, J. A., Geerts, J., Charles, K. E., Newsham, G. R., Marquardt, C. J. G., Satisfaction with lighting in open-plan offices: COPE field findings, Proceedings of Lux Europa 2005 (Berlin, Germany), pp. 414-417, 2005, Available at: http://irc.nrc-cnrc.gc.ca/pubs/fulltext/nrcc48164/
Williams, L. J. Hazer, J. T., Antecedents and consequences of satisfaction and commitment in turnover models: A reanalysis using latent variable structural equation methods, Journal of Applied Psychology, 71(2): 219-231, 1986.
Wilson, M. G., DeJoy, D. M., Vandenberg, R. J., Richardson, H. A., McGrath, A. L., Workstation characteristics and employee health and well-being: Test of a model of healthy work organization, Journal of Occupational and Organizational Psychology, 77(4): 565-588, 2004.

Occupants’ Evaluations of Individually-Controlled Lighting
NRC-IRC RR-299 77 of 81
Yoon, J. Thye, S. R., A dual process model of organizational commitment: Job satisfaction and organizational support, Work and Occupations, 29(1): 97-124, 2002.
Yousef, D. A., Job satisfaction as a mediator of the relationship between job stressors and affective, continuance, and normative commitment: A path analytical approach, International Journal of Stress Management, 9(2): 99-112, 2002.
Acknowledgements This project was a collaboration between government and private-sector partners:
National Research Council of Canada Institute for Research in Construction (projects B3222 and B3228), Panel on Energy Research and Development (PERD), Public Works and Government Services Canada (PWGSC), BC Hydro Power Smart, and Ledalite Architectural Products.
Special thanks and appreciation go to Cristian Suvagau, Sunny Dhannu, Roy Hughes, Tyler Nitsch, Caroline Ngan, Kevin White, Rico Luk, Zorawar Bhatia, Jindra Ryvola Ron Scott, John Meyer, Christoph Reinhart, Roger Marchand, Benoit Cailleau, and Sophie Boissard for various contributions to the project.
A version of this report was presented at the Canadian Psychological Association 69th Annual Convention in Halifax, June 2008 [Veitch et al., 2008].

Occupants’ Evaluations of Individually-Controlled Lighting
NRC-IRC RR-299 78 of 81
Appendix A: Online Questionnaire

Occupants’ Evaluations of Individually-Controlled Lighting
NRC-IRC RR-299 79 of 81

Occupants’ Evaluations of Individually-Controlled Lighting
NRC-IRC RR-299 80 of 81

Occupants’ Evaluations of Individually-Controlled Lighting
NRC-IRC RR-299 81 of 81
Copyright © 2022 FDOKUMEN