PRACTICES RELATED TO CUSTOMER SATISFACTION, INCLUDING RESULTS OF SURVEYS MEASURING CUSTOMER...
170
ANNUAL REPORT 2013 20 3
-
Upload
independent -
Category
Documents
-
view
4 -
download
0
Transcript of PRACTICES RELATED TO CUSTOMER SATISFACTION, INCLUDING RESULTS OF SURVEYS MEASURING CUSTOMER...

ANNUAL REPORT 2013
20 3

About this report
The Finnair Group’s main field of business is the provision of air transport and travel services.
The purpose of the Annual Report – encompassing objectives of what were previously published as
separate Financial and Sustainability Reports – is to measure and account for the financial, economic,
social and environmental performance of this enterprise, and to identify and explain the strategic
business ramifications of this performance. Shareholders, investors, analysts, media, customers,
employees, other interested stakeholders and the general public at large comprise the report’s
intended audience.
Finnair sees sustainability as a critical and strategic aspect of business performance, thus the Annual
Report embeds material sustainability disclosures in its annual reporting framework. The scope of the
report is defined according to the Finnair Group’s material activities in 2013 across all its units. For
more information on how materiality is determined, see the materiality and stakeholder matrix on
pages 12–13.
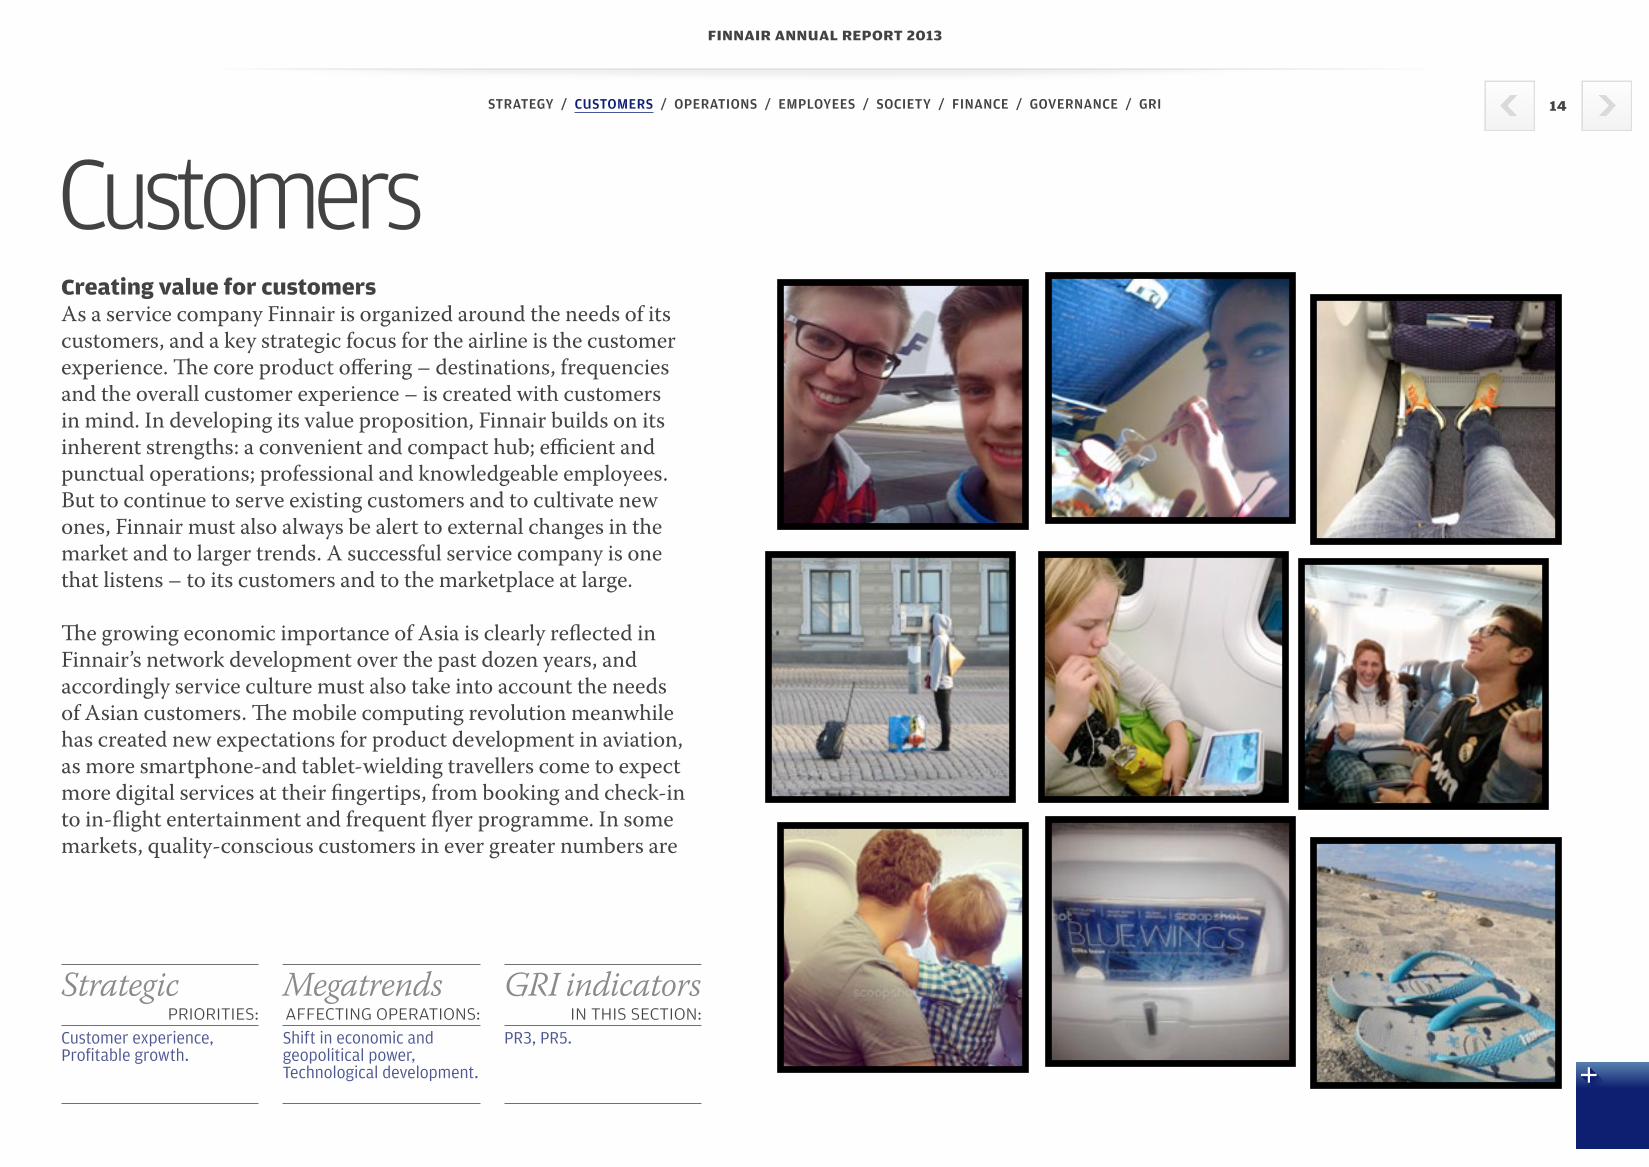
Finnair has a strong presence in social media, and we wanted to try a new form of engagement
and image gathering. In this annual report we have crowdsourced images through Finnish mobile
application Scoopshot. We asked the world’s air travelers to show us what they find magical about
air travel, what’s the best part of the journey, and what delights them. The task was valid for two
weeks, starting from December 10, 2013. The annual report includes also images from our employ-
ees, the cabin attendant Noora Kunttu and the pilot Tomi Tervo. They both have Instagram accounts:
finnairnoora and finnairtomi.
CONTENTSAbout this report 2CEO’s review 3STRATEGY 5Strategy 6Megatrends 9Key Performance Indicators 11
The triple bottom line 12
CUSTOMERS 14Social indicators 19
OPERATIONS 21Environmental indicators 28
EMPLOYEES 38Social indicators 43
SOCIETY 51Stakeholder Engagement 55 Social indicators 56
FINANCE 58The Report of the Board of Directors 59
Financial statements 78
Financial indicators 123
GOVERNANCE 125Management principles 125
Corporate Governance Statement 2013 131
Risk management and major risks 142
Remuneration Statement 2013 147
Board of Directors 156
Executive Board 157
Reporting principles 158
GRI matrix 160
Information for shareholders 167
Glossary 168
Contact information 169
FINNAIR ANNUAL REPORT 2013
STRATEGY / CUSTOMERS / OPERATIONS / EMPLOYEES / SOCIETY / FINANCE / GOVERNANCE / GRI 2

CEO’s review2013 – A year of improving competitiveness and reducing costsLike many recent years, 2013 was eventful for Finnair. For me, it was my first year at Finnair. Since the beginning of June, I have learned a great deal about the airline business and Finnair, and the significance of both to Finland. My meetings with our personnel, customers, business partners, shareholders and other stakeholders have made it clear that Finnair holds a very special position in the hearts of Finns.
There are strong links between the success of the company’s Asian strategy and Finnish air connections, which in turn play a signifi-cant role in the lives of Finns and the Finnish business sector. Finnair offers connections from Finland to some 60 destinations in Europe and 13 destinations in Asia. The strong connections it provides promote the international success of Finnish industry, while also facilitating investment in Finland by foreign industry. The link between the company’s success and Finnish GDP is obvious. Helsinki Airport – our home – is Finland’s second-largest hub of jobs. By being successful, we can create new jobs at Finnair and indirectly create new jobs in other areas of the airline business cluster.
Finnair has a very strong brand that we must continue to develop, grow and protect, even as the company undergoes what is perhaps the largest transformation in its history – a transformation that is also painful in certain ways. Our goal is to make Finnair a company that combines the best of its 90-year history with the courage to adapt and learn, allowing it to continue operating as a strong player in its industry through this period of consolidation. In recent years, the company has concluded many strategic partnerships in the area of aviation services, and entered joint businesses with other
airlines. These have put Finnair on the right path toward improved operational quality and cost-efficiency.
The customer is at the heart of what we do. Recognising this, we began a strategic devel-opment effort in 2013 aimed at improving our service in order to respond to customer needs even better than before, thereby increasing sales. More information on the results of these efforts will become available in 2014.
Financially, 2013 did not live up to our expec-tations. Our turnover fell by two per cent from 2012, totalling 2.4 billion euros. The main factor slowing down turnover growth was the fall in euro-denominated revenue due to the substan-tial depreciation of the Japanese yen, but in the second half of the year the weaker-than-ex-pected development of cargo and leisure traffic also contributed to the decrease in turnover for the full year. Our operating profit was -4.8 million euros. This is unsat-isfactory, as our target was to record a profit for the year. Our result was also affected by tight competition and the continued high price of fuel. In the fourth quarter, our result was also negatively affected by measures taken to look after our customers in preparation for labour action. Cancelled flights resulted in additional expenses. These costs led to our operating result showing a loss for the full year.
Nevertheless, our goal is to make Finnair a sustainably profitable and growing company. Profitable growth is our most important objec-
FINNAIR ANNUAL REPORT 2013
STRATEGY / CUSTOMERS / OPERATIONS / EMPLOYEES / SOCIETY / FINANCE / GOVERNANCE / GRI 3

tive. However, we will not be able to grow – or be profitable – unless we improve our cost structure and competitiveness.
The year 2013 was encouraging in this respect: we achieved the targeted permanent annual cost reduction of 140 million euros set in August 2011 ahead of schedule. Cost reductions have been system-atically sought in several different categories, including fleet, avia-tion service, catering, sales, distribution and personnel costs. Our progress in the first cost-reduction program shows that, by exam-ining things with an open mind, operations can be optimised, competitiveness can be improved and the necessary cost reductions can be achieved.
In the collective labour agreements concluded with cabin crew, pilots and the Finnish Aviation Union IAU, it was agreed that nego-tiations on cost reductions be postponed until the first half of 2014. The sought cost reductions primarily involve personnel-related costs in all personnel groups. Our previously set cost reduction targets remain unchanged.
Many of our structures associated with wages and working hours originate from the era of closed markets. Renegotiating these struc-tures to match current labour market practices is challenging, but we are determined to move forward with Finnair’s structural changes and cost reductions in cooperation with personnel and their representatives. I hope we will reach company-specific agree-ments on the cost reductions necessary for Finnair and its personnel well ahead of the deadline set for the negotiations. However, at the same time, we must assess other options to prepare for the contin-gency that, despite our best efforts, the necessary agreements on cost reductions are not reached through negotiations. I nevertheless
remain confident that we can work together through the ongoing negotiations to achieve the best possible outcome for the future of Finnair and its personnel.
Finnair is currently preparing for two significant waves of invest-ment: In 2015, we will take delivery of the first of our new Airbus 350 long-haul aircraft, and in the coming two years we must also make decisions on the renewal of our European fleet to ensure future competitiveness and energy efficiency. These investments are essential for our future, and Finnair must be a strong player in its industry in order to finance the required capital expenditure. We are convinced that this is possible if we do the right things, at the right time, and in the right way, with courage and an open mind. We have decided that we will be winners in our industry.
I would like to extend my warmest thanks to all Finnair personnel for the year 2013 and their contribution to achieving our shared goals. I also wish to thank our customers, business partners and shareholders for their trust in the company.
Pekka Vauramo
FINNAIR ANNUAL REPORT 2013
STRATEGY / CUSTOMERS / OPERATIONS / EMPLOYEES / SOCIETY / FINANCE / GOVERNANCE / GRI 4

years
MEGATRENDS
STRATEGIC FOCUS AREAS
Cost competitiveness Customer experience
International winning teamProfi
table
growth
Shift in economica
l and
political p
ower to Asia
Urbanisation
Sustainability
Digitalisation and connectivity
FINNAIR IN THE
WORLD
OPERATIONS EXCELLENCEVISION
To double revenue from Asian tra�c by 2020 from the 2010 level, to be the most desired option in tra�c between Asia and Europe, and to be the
number one airline in the Nordic countries.
The process of operating and developing Finnair's network in the most e�cient way by combining profitable growth, market developments and customer satisfaction
Finnair's customer promise DESIGNED FOR YOU
StrategyFINNAIR IN THE WORLD
FINNAIR ANNUAL REPORT 2013
STRATEGY / CUSTOMERS / OPERATIONS / EMPLOYEES / SOCIETY / FINANCE / GOVERNANCE / GRI 5

STRATEGYThe core of Finnair’s strategy is taking advantage of the growing demand for traffic between Europe and Asia. The strategy is based on the growing markets in Asia, the fastest connections between Europe and Asia, high-quality service, and cost- efficient, punctual operations. Helsinki’s geographical location provides Finnair with a natural competitive advantage, as the fastest routes between many destinations in Europe and megacities in Asia go through Helsinki. In implementing its strategy, Finnair is committed to creating added value for its customers and shareholders.
Finnair’s vision is to
• Double its revenue from Asian traffic by 2020 compared with the level of 2010.
• Be the most desired option in traffic between Asia and Europe and among the three largest airlines on routes between Asia and Europe that do not have a direct flight connection.
• Be the number one airline in the Nordic countries and grow in this home market.
A growing and competitive industryThe implementation of Finnair’s strategy and the development of its operations are affected by global megatrends, such as the shift in economic and political focus to Asia, accelerating urbanisation, technological development and an increasing emphasis on social and environmental responsibility in business. These megatrends and their significance to aviation and Finnair are discussed in more detail on pages 9–10.
Finnair is pursuing business and leisure travellers as well as cargo customers in the fast growing Asian economies, Finland and particularly those European cities that do not provide direct connec-tions to Asia. Approximately 26 million people travel annually between Finnair’s current Asian and European destinations, and an estimated 65 per cent of these are transfer passengers without direct connections to their final destination.* Asian traffic already represents approximately half of Finnair’s passenger traffic, and Japan is currently Finnair’s second-largest market after Finland. In the future, the share of traffic represented by China in particular is expected to grow. According to a forecast by Airbus**, air traffic between Asia and Western Europe will grow at an average rate of 4.3 per cent annually during the next 20 years, which will provide Finnair with substantial opportunities for growth.
While the growth prospects in aviation are good, airlines face a chal-lenging outlook. The airline business is a highly competitive and capital-intensive industry with on average small margins. Decisions on significant fleet investments must be made several years before price-conscious travellers make their purchase decisions, and the industry is very sensitive to global economic cycles and other external factors. European network carriers, Finnair included, have revised their operating models and adjusted their cost base in recent years in response to competition from low-cost airlines and airlines based in the Middle East. At the same time, the continuing high price of jet fuel necessitates greater fuel efficiency and investments in a modern, cost-efficient fleet. Intense competition has led to increased consol-idation, alliances and joint ventures in the industry, with the aim of improving capacity discipline and profitability.
* Finnair estimate.** Source: Airbus’ Global Market Forecast for 2013-2032.
FINNAIR ANNUAL REPORT 2013
STRATEGY / CUSTOMERS / OPERATIONS / EMPLOYEES / SOCIETY / FINANCE / GOVERNANCE / GRI 6

HELSINKI
New York
BeijingShanghai
Xi’an
TokyoNagoya
Osaka
Seoul
SingaporeBangkok
Hanoi
Hong Kong
Delhi
Chongqing
Focus areas in strategy implementationFinnair’s four focus areas in the implementation of the company’s strategy are: • Profitable growth• Cost competitiveness• Customer experience • International winning team
Guided by these focus areas, Finnair has gone through a substantial structural change over the past three years. This has shaped Finnair into an airline that is focused on its core business and has entered into partnerships for aviation support services and European feeder traffic. These strategic partnerships have allowed Finnair to simulta-neously improve the quality of its operations and achieve cost reduc-tions important for its competitiveness. At the same time, Finnair’s capacity to adapt to changes in the market has improved, although the company must still develop its competitiveness further.
Finnair is investing in not only charting new market possibilities and improving profitability, but also in developing customer service and leadership, as satisfied customers and a competent, well-managed staff are key requirements for growth. In addition to optimisation of its supply chain, Finnair wants to be a competent and active partner that produces value to its partners. Finnair holds a strong position in the oneworld alliance – chosen as the highest-quality airline alli-ance*** – as an expert in traffic between Asia and Europe. In 2013, Finnair increased its cooperation within oneworld by entering a joint business for North Atlantic traffic and in 2014 it will join a similar joint business on flights between Europe and Japan.
Finnair offers the fastest routes between
Northern Asia and Europe
13 Asian megacities
More than 60 destinations in Europe
*** Source: Skytrax World Airline Awards report published in summer 2013.
FINNAIR ANNUAL REPORT 2013
STRATEGY / CUSTOMERS / OPERATIONS / EMPLOYEES / SOCIETY / FINANCE / GOVERNANCE / GRI 7

Finnair has taken steps to prepare for the opportunities presented by the growth of Asian traffic by placing an order in the last decade for eleven Airbus 350 XWB aircraft, the deliveries of which will begin in the second half of 2015. In addition to this, Finnair also has options for the delivery of eight more A350 aircraft. Upgrades to the long-haul fleet will increase capacity and significantly improve travelling comfort. The improved fuel efficiency and lower emissions of the new fleet also respond to growing requirements for more environ-mentally friendly and responsible operations.
Finnair’s strategic strengths
• Competitive advantage due to geographical location• Excellent operational quality and efficiency• Top-class service – Northern Europe’s best airline***• Modern, fuel-efficient fleet• Good financing position for implementing future fleet
investments• Quality and capacity of Helsinki Airport
*** Source: Skytrax World Airline Awards report published in summer 2013.
Read more
On megatrends on pages 9–10On key performance indicators on page 11On business risks on pages 142–146
FINNAIR ANNUAL REPORT 2013
STRATEGY / CUSTOMERS / OPERATIONS / EMPLOYEES / SOCIETY / FINANCE / GOVERNANCE / GRI 8

MegatrendImpact on the industry and Finnair Our response
Economic and political focus shifts to developing countries, particularly Asia
• Traffic between Asia and Europe grows
• Intense competition continues
• Increased importance of understanding Asian markets
• Renewal of the long-haul fleet from 2015 onwards
• New Asian destinations, additional flights
• Increasing Finnair’s understanding of Asian markets
• Good stakeholder relations
• Fastest route between Asia and Europe
Accelerating urbanisation • New markets are created
• Intensifying competition
Technological progress, the increase in the significance of network connections and digitalisation will all continue
• Increasing significance of online services and network connections
• New opportunities for serving customers
• Developing online services
• Developing the service experience
Increasing significance of responsibility
• Increase in regulation and reporting requirements
• Increasing significance of open communication
• A more environmentally friendly and efficient fleet and operations
• Monitoring the supply chain
MEGATRENDSMegatrends are phenomena that have a strong impact on the future and consumer behaviour in the long term. These phenomena also have a significant effect on the airline industry and Finnair’s business operations.
Economic and political focus shifts from the United States and Europe to developing countriesThe gradual shift in economic and political focus from the United States and Europe to developing countries, and Asia in particular, is the strongest of the megatrends affecting the aviation industry. Asian corporations are becoming globalised and their significance in the world market is growing. The middle class is growing rapidly in many Asian countries.
Asian travel will increase, and competition on Asian routes will intensify, as Asian airlines expand their operations to interconti-nental flights. As traffic increases, airlines and governments will also have to negotiate for more traffic rights and flight permits. Asian customers determine the expected standard of quality for service and products, and non-Asian airlines must increase their under-standing of Asian culture and customers.
In response to this shift and the opportunities it presents, we are investing in a modern fleet and new destinations and increasing capacity to Asian markets. We also invest in building and main-taining strong relationships with Asian opinion leaders and policy-makers. We will increase our understanding of Asian cultures and provide fast transfers between Asia and Europe, with a particular focus on onward connections.
FINNAIR ANNUAL REPORT 2013
STRATEGY / CUSTOMERS / OPERATIONS / EMPLOYEES / SOCIETY / FINANCE / GOVERNANCE / GRI 9

UrbanisationMigration flows from rural areas to cities are continuing to accel-erate, particularly in China and other developing countries. Espe-cially in Asia, the number of cities with more than five million inhab-itants will grow, as will the number of connections between such cities. New markets will be created for airlines as traffic between these megacities grows. Competition will intensify as regional airlines begin to operate these routes.
We take advantage of urbanisation and the opportunities it presents by investing in a modern fleet and new destinations, as well as by increasing our flight frequency to current Asian destinations. We also invest in building and maintaining strong relationships with Asian opinion leaders and policymakers. We will also increase our understanding of Asian cultures and provide fast connec-tions between Asia and Europe, with a particular focus on onward connections.
Technological progress, increase in the significance of network connections and digitalisationTechnological progress is leading to changes in purchasing behav-iour, the comparability of prices and services online, and immediate feedback. Consumers want and expect network connections every-where they go. Social media spreads news rapidly and requires busi-nesses to react quickly.
Airlines must anticipate changes, adapt to them and provide oppor-tunities for buying, using services and sending feedback online. Consumers want network access before, during and after their flights. They increasingly want digital entertainment services during flights. More advanced customer identification will also allow
airlines to offer tailored services and a personalised customer expe-rience.
We will invest in developing digital services, entertainment systems and the service experience.
Our Designed for You concept corresponds to consumer wishes for individually tailored services, while the Quality Hunters project is focused on service development.
Increasing significance of responsibilityPolitical decision-makers, consumers and other stakeholders require businesses to operate more responsibly and transparently. Regulation and reporting obligations will increase, and businesses are required to be more diligent in monitoring the ethical dimen-sions of their supply chains. Consumers monitor the responsibility of companies’ operations and give feedback on social media.
The airline industry will face stricter regulations on emissions and noise, with increased regulation resulting in added costs such as tax-like payments. Airlines must increasingly cooperate on issues related to safety, emissions, noise and passenger rights.
We respond to these changes by investing in a more environmentally friendly and cost-efficient fleet, developing our operations towards greater efficiency and responsibility, improving our supply chain monitoring and participating in joint projects in the industry. We will also continue to develop our reporting and stakeholder commu-nications related to responsibility.
FINNAIR ANNUAL REPORT 2013
STRATEGY / CUSTOMERS / OPERATIONS / EMPLOYEES / SOCIETY / FINANCE / GOVERNANCE / GRI 10

Indicator (KPI) and target level Actions taken in 2013 Performance in 2013
Customer experience • Customer satisfaction, read more on page 20. • Developing the product, service and network to better meet customer needs. Read more on pages 14-20.
86% of customers graded their customer stisfaction as “good” or “very good”
Profitable growth • Operational result at least 6% of turnover • Launch of new routes to Xi’an and Hanoi.
• Seeking additional revenue through product and service development.
• Implementation of the cost reduction programs commenced in 2011 and 2012. Read more on pages 59-60.
• Financing arrangements carried out in 2013 to maintain a strong balance sheet. Read more on page 62.
Operational result -0.2% of turnover
• EBITDAR at least 17% of turnover EBITDAR 7% of turnover
• Positive economic added value in excess of 8% of the cost of capital (WACC pre-tax)
Negative operational result
ROCE 2.3%
Adjusted gearing 77.6%• Adjusted gearing no more than 140%
• To pay, on average, at least one-third of the earnings per share as a dividend during an economic cycle. The aim is to also take into account the company’s earnings trend and outlook, financial situation and capital needs for any given period.
The Board proposes that no dividend be paid for 2013.
• Increase in RASK (Revenue per Available Seat Kilometre)
RASK declined by 3.8% compared to 2012.
Cost competitiveness • CASK (Cost per Available Seat Kilometre) excluding fuel decreases from 2012 level.
• Implementation of the cost reduction programs commenced in 2011 and 2012. Read more on pages 59-60.
• Optimisation of the fleet and route network.
• Replacing Boeing 757 aircraft with new Airbus 321 Sharklet aircraft. Read more on pages 23 and 64.
• Reducing emissions, Read more on pages 23 and 28-37.
CASK excluding fuel decreased by 1% compared to 2012.
• Fuel consumption per available seat kilometre (ASK) will decrease.
Fuel consumption / ASK decreased by 1.9% compared to 2012.
• Emissions per available seat kilometre will decrease. CO2 emissions / ASK decreased by 6.3% compared to
2012.
NOx emissions / ASK decreased by 5.3% compared to 2012.
International winning team
• The 4D well-being at work index. Read more on page 38.
• Management and training programs. Read more on pages 40-41 and 45-46.
Well-being at work index 3.8/5
Absences due to sickness decreased by 0.3%-points to 4.6% in 2013.• Decrease in absences due to sickness.
KEY PERFORMANCE INDICATORS
FINNAIR ANNUAL REPORT 2013
STRATEGY / CUSTOMERS / OPERATIONS / EMPLOYEES / SOCIETY / FINANCE / GOVERNANCE / GRI 11

THE TRIPLE BOTTOM LINEKati Ihamäki, VP Sustainable Development
Sustainability is integral to Finnair’s overall business strategy and operations, and as such, the company’s annual reporting framework should ideally reflect this reality. This is especially true in an industry like aviation, where an airline’s greatest environmental impact, CO2 emissions, is a byproduct its single largest cost item by far, fuel. In our business financial and environmental impact are in close align-ment.
In the broader corporate world, however, the historical practice has been to separate financial and sustainability reporting, and up until now that has been Finnair’s practice as well. But at many compa-nies the need to integrate these two streams of information has been nonetheless increasingly clear to shareholders, analysts, personnel, governments, media and other stakeholders. Companies in the fore-front of corporate reporting are looking at ways to combine and streamline their reporting practices toward the “triple bottom line” – financial, social and environmental results. And so at Finnair, this year we have sought to include this information within one annual report.
Assessing materialityBut first, all reporting depends on identifying and assessing mate-riality – that is, the topics considered significant to economic, envi-ronmental and social impact or those that influence stakeholder decisions. For this report those topics were identified by means of a survey of a range of stakeholders, including customers and frequent flyers, investors, suppliers, employees, authority representatives and media. We also conducted workshops with subject-matter experts
from throughout the company to identify issues and trends of mate-rial interest.
From this survey it became clear that many issues are clearly impor-tant to both stakeholders and management. Passenger health and safety as well as employee safety figure toward the top of the universal list of priorities, along with fuel efficiency, future compet-itiveness, environmental legislation, business continuity and cost efficiency. Stakeholders expressed a concern for climate change and working conditions. Lobbying, public policy and noise pollution were toward the bottom of the priority list for both stakeholders and management, although even for these factors the survey reflected a moderate concern on behalf of both parties.
By reporting accurately on these material topics and meaningfully engaging with stakeholders on them, we not only secure our opera-tions but also earn our license to grow. It is our hope that this annual report stands as a thorough yet succinct account of our operations, and a cogent case for our value proposition.
FINNAIR ANNUAL REPORT 2013
STRATEGY / CUSTOMERS / OPERATIONS / EMPLOYEES / SOCIETY / FINANCE / GOVERNANCE / GRI 12

SOCIAL INDICATORS
ECONOMIC INDICATORS
ENVIRONMENTAL INDICATORS
01 Passenger health
and safety
02 Employee safety
03 Anti-corruption
and bribery
04 Ethical code
05 Future competitiveness
06 Business continuity
07 Cost-efficiency
08 Strategic strengths and
weaknesses
09 Economic performance
10 Business strategy and
its connection to corporate responsibility
11 Fuel efficiency
12 Environmental legislation
and regulation
13 Efficient airtraffic
management
14 Energy
Impo
rtan
ce t
o st
akeh
olde
rs
Importance to management
5 = extremely important
4 = very important
3 = important
01
02
03
04 05
06
07
13
09
14
08
1012
11
MATERIALITY MATRIX
FINNAIR ANNUAL REPORT 2013
STRATEGY / CUSTOMERS / OPERATIONS / EMPLOYEES / SOCIETY / FINANCE / GOVERNANCE / GRI 13
GRI indicators IN THIS SECTION:
PR3, PR5.
MegatrendsAFFECTING OPERATIONS:Shift in economic and geopolitical power, Technological development.
StrategicPRIORITIES:
Customer experience, Profitable growth.
CustomersCreating value for customersAs a service company Finnair is organized around the needs of its customers, and a key strategic focus for the airline is the customer experience. The core product offering – destinations, frequencies and the overall customer experience – is created with customers in mind. In developing its value proposition, Finnair builds on its inherent strengths: a convenient and compact hub; efficient and punctual operations; professional and knowledgeable employees. But to continue to serve existing customers and to cultivate new ones, Finnair must also always be alert to external changes in the market and to larger trends. A successful service company is one that listens – to its customers and to the marketplace at large.
The growing economic importance of Asia is clearly reflected in Finnair’s network development over the past dozen years, and accordingly service culture must also take into account the needs of Asian customers. The mobile computing revolution meanwhile has created new expectations for product development in aviation, as more smartphone-and tablet-wielding travellers come to expect more digital services at their fingertips, from booking and check-in to in-flight entertainment and frequent flyer programme. In some markets, quality-conscious customers in ever greater numbers are
FINNAIR ANNUAL REPORT 2013
STRATEGY / CUSTOMERS / OPERATIONS / EMPLOYEES / SOCIETY / FINANCE / GOVERNANCE / GRI 14

Distribution of passenger revenue, %
%
Asia 43% Europe 36% Leisure 9% Domestic 8% North Atlantic 4%
also seeking more personalised services and value-added travel experiences. These trends and more inform the development of Finnair’s value proposition.
The most direct indicators of how well Finnair listens to customers – and acts on what it learns – are Finnair’s own customer satisfaction surveys. External ratings such as those provided by Skytrax are also telling, being roughly indicative of the general service level and how it compares in the sector at large. From a commercial perspective, how well Finnair is meeting (or even creating) demand in its chosen markets can in part be measured by total Revenue Available Seat Kilometres (RASK) and then comparing that measurement with competitor benchmarks.
Asian expansion brings new service challengesFinnair has flown to Bangkok since 1976, Tokyo since 1983 and Beijing since 1988, but around the beginning of the 21st century the airline began in earnest to reorient its overall network strategy around Asia-Europe traffic, in response to rapid industrial invest-ment and economic growth in the East. The new Asian prosperity is here to stay, indeed it’s only just getting started, and Finnair’s Asian revenue is growing with it – our aim is to double it between 2010 and 2020. Finnair is accordingly tasked with meeting the needs of the growing numbers of Asian customers.
As the largest Asian country with the most room to grow, much of the focus is necessarily on China. According to the UN World Tourism Organisation, in 2012 China surpassed the US and Germany as the largest outbound tourism market in the world. Chinese investment in European companies is meanwhile growing dramatically – totalling some EUR 9.5 billion in 2012, up 21 per
cent from 2011 – and fueling demand for long-haul business travel between China and Europe. On Finnair’s routes from the Western Chinese cities Xi’an and Chongqing, for example, the majority of passengers are Chinese, which of course means developing the customer experience to suit Chinese needs and expectations, from in-flight meals and service to duty-free shopping options.
This is also why all of Finnair’s Asian routes are served by at least three locally-based cabin crew members able to provide service in customers’ native languages. In-flight entertainment options on long-haul flights are also always available in Asian languages. At Helsinki Airport, customers can be sure to find signage and help in Chinese, Korean, Japanese and Russian in addition to Finnish and
Revenue passenger kilometres by traffic area
Asia 50% Europe 29% Leisure 12% Domestic 3% North Atlantic 5%
%
FINNAIR ANNUAL REPORT 2013
STRATEGY / CUSTOMERS / OPERATIONS / EMPLOYEES / SOCIETY / FINANCE / GOVERNANCE / GRI 15

English, and Finnair’s Duty Free shops are staffed with personnel able to speak several languages. Japanese and South Korean citizens with biometric passports are able to complete border formalities with automated passport control gates as well.
Mobile technology and social media: new possibilities, new expectationsAnother dramatic change in the marketplace over the past decade is the digital communications revolution reshaping customer expec-tations every day. Paperless ticketing has been the norm at Finnair for years now, and Finnair supports the goals of IATA’s Fast Travel, an automation program for commercial aviation covering check-in, baggage drop, document check, boarding, flight rebooking and bag recovery. In 2013 Finnair was awarded Fast Travel Gold status by IATA for introducing automated and digital mobile processes for all of these activities at Helsinki Airport and many outstations, reducing queues at airports and giving customers more options for self-service during their journey.
Social media meanwhile has transformed how customers get infor-mation, interact with each other and connect with brands. In the UK, for example, more people spend more time on Facebook than watch television, and that trend is broadly similar in most of the other territories where Finnair operates. A much-cited study by market research firm Nielsen also confirms the unsurprising conclu-sion that overwhelming majorities, in virtually all markets, place much more trust in “earned” online product reviews by strangers than they do in paid advertisements.
Customers, in other words, are already talking about Finnair in social media whether the company actively engages with them or
not. This is why Finnair now engages with customers in various social media in six languages: English, Finnish, Swedish, Chinese, Japanese and Korean. The company’s objective with this engagement is to listen and learn, improve brand awareness, support sales and – last but not certainly not least – solve customers’ problems. This last function is especially vital when operations are subject to significant disruption. (See sidebar “Customer communications in social media in case of disruption” for more information.)
Social media also brings new dimensions to the passenger journey itself. In March 2013 Finnair introduced an optional social check-in service whereby passengers’ Facebook profiles are linked with the seat map during the seat-selection process, enabling greater socia-bility on board for those wishing to open themselves up to new expe-riences when travelling. Customers can also more easily share their flight information on different social networks if they so choose. Alternatively, passengers can travel “incognito” as before; in this hyper-connected world, for some customers it is just as important to occasionally disconnect as to connect.
Integrated approach to customer serviceIn 2013 Finnair recognised that to meet its customer service objec-tives and to maintain and grow its market position, that a more holistic organisational focus on customer service would be required. Accordingly, Finnair’s customer service functions, which formerly stood alone in their own division, were merged into the Operations or Commercial divisions. The change underlined the role that all employees across the organisation have to play in serving customers, whether in front line customer-facing positions or not.
FINNAIR ANNUAL REPORT 2013
STRATEGY / CUSTOMERS / OPERATIONS / EMPLOYEES / SOCIETY / FINANCE / GOVERNANCE / GRI 16

Additionally, Finnair’s Commercial division is undergoing further changes in order to better gauge, react to and cultivate market needs. Product development and marketing are now combined into one team, ensuring that market outreach activities are closely informed by the real customer experience and vice versa. More emphasis is also now being placed on improving e-commerce capa-bilities, business analytics and decision-making processes. Finally, the Finnair Plus program and the value it generates for customers has taken on new priority, as oneworld, the global alliance to which Finnair belongs, grows in membership and provides Finnair Plus customers even more benefits and more opportunities to “earn and burn” points on more world-class airlines’ route networks.
oneworld for allThe oneworld alliance is in fact in the midst of its biggest expansion in history. In 2013, Malaysia Airlines and Qatar Airways entered the alliance, adding two top-tier carriers to the collection of leading brands from each global region: airberlin, American Airlines, British Airways, Cathay Pacific Airways, Finnair, Iberia, Japan Airlines, LAN Airlines, Qantas, Royal Jordanian and S7 Airlines. Also coming soon in 2014 is SriLankan Airlines, as well as Brazil’s TAM and the other members of the LATAM Airlines Group not already in oneworld. In addition, US Airways’ network will soon inte-grate with the oneworld map as part of its merger with American Airlines. After this expansion drive is complete, oneworld will stand as the global quality alliance par excellence, serving almost a thou-sand airports in more than 150 countries with 14,000 daily depar-tures, carrying 480 million passengers a year on a combined fleet of almost 3,500 aircraft, all the while generating some USD 140 billion in annual revenues.
But within oneworld, increasing joint business activity between member airlines is also creating more value for customers. In July 2013 Finnair joined the transatlantic joint business founded by fellow alliance partners American Airlines, British Airways and Iberia. Finnair customers flying to North America can now book flights to dozens more North American cities on one single ticket at
Customer service in social media in case of disruptionSocial media provides powerful platforms for marketing and raising brand awareness, but for companies these activities are not credible without first providing solid, meaningful customer service. This means engaging with customers on their own terms and providing them with relevant information.
In November Finnair’s social media presence was put to the test when the company faced warnings of strikes by the Finnish Flight Attendants’ Association and the Finnish Aviation Union. The warnings necessitated the canceling of 130 flights with some 10,000 passengers affected. Throughout the disruption, Finnair reinforced its social media team with volunteers to serve and inform customers of the unfortunate situation.
While phone lines were busy and the volume of Finnair-related social media conversation increased more than tenfold, Finnair made sure all the latest information was always first available via Twitter, Facebook and Finnair’s website. Finnair also served individual customers so they could make all necessary ticket changes directly on Twitter.
Finnair also created YouTube videos to instruct customers on what to do if their flight was cancelled, which were then spread by Finnair and the general public through Twitter and Facebook. The selection of channels, speed of information, and useful content were well received with many thanks, even from customers who had to reschedule their trips.
Finnair’s active communication in social media was later recognised in Finland as industry best practice. As Pekka Aula, a media and communications professor at the University of Helsinki, wrote in Helsingin Sanomat: “Finnair’s way of communicating is something that many other companies will follow.”
You can find Finnair on Twitter at www.twitter.com/Finnair and on Facebook at www.facebook.com/Finnair.
FINNAIR ANNUAL REPORT 2013
STRATEGY / CUSTOMERS / OPERATIONS / EMPLOYEES / SOCIETY / FINANCE / GOVERNANCE / GRI 17

a more competitive price, while customers of the other three airlines now also have better access to 13 cities in Finland and the rest of Europe.
In 2014, Finnair is set to enter a similar joint business between oneworld members Japan Airlines and British Airways on traffic between Japan and the European Union, which would, like the other joint business, create more network connectivity and more competi-tive pricing for customers of all three airlines. Both moves are exam-ples of Finnair pursuing tighter cooperation within the oneworld alliance to improve network connectivity and better serve the needs of intercontinental customers, delivering much more route options and value to customers than any single airline could on its own.
Highlights in product developmentA successful airline listens to customers and the marketplace and continuously develops its offering. New products and services developed in 2013 included:
Automatic check-in: Passengers flying from Helsinki Airport and many other outstations are now checked in automatically before their flight if they haven’t already done so. Mobile boarding passes are also sent to customers’ phones.
Social check-in: Those who like to meet new people or open themselves to new experiences while travelling are now able to link their Facebook profile with the seat map during check-in. Of course, “incognito” travel is still an option.
Marimekko textiles and tableware: The design collaboration first announced in 2012 became a light and visually refreshing reality on board all Finnair aircraft starting from May 2013.
New Signature Meals: Finnair partnered with Michelin-starred chef Pekka Terävä and noted fusion gourmet chef Tomi Björck to create new menus for long-haul Business Class, combining the best of Nordic and Asian cuisine to create a distinctly Finnair flavour.
Full-flat beds: Finnair began the process of retrofitting most of the rest of its widebody fleet with seats in Business Class that convert to fully flat beds. After the retrofit is complete in 2014, 12 of Finnair’s 15 widebody aircraft will feature the new seats, with the rest due to be retired from service after the arrival of Airbus A350 XWB aircraft in 2015.
In-flight entertainment renewal: On long-haul flights, Finnair nearly doubled its inflight entertainment options with a choice of 72 movies and more than 150 TV shows available on demand in both Economy and Business Class. Inflight entertainment is included in the price of the ticket in both classes on all long-haul flights. Meanwhile, on Finnair’s new Airbus A321s with Sharklets, which are mostly operated on medium-haul and leisure or charter routes, passengers can hire Samsung Tab 3 tablet computers at a cost of EUR 10. The tablets come preprogrammed with dozens of hours of video and music, as well as games and newspapers.
FINNAIR ANNUAL REPORT 2013
STRATEGY / CUSTOMERS / OPERATIONS / EMPLOYEES / SOCIETY / FINANCE / GOVERNANCE / GRI 18

SOCIAL INDICATORS
PR3
TYPE OF PRODUCT AND SERVICE INFORMATION REQUIRED BY PROCEDURES, AND INFORMATION REQUIREMENTSFinnair’s operations are regulated by numerous official regulations and international agree-ments. For the customer, the most important product information issues relate to the condi-tions of carriage and customer’s rights.
The duty to disclose relating to the conditions of carriage is based on the Montreal Conven-tion, and the content of the Convention has also been codified in official regulations. Finnair’s General Conditions of Carriage are enclosed with travel and cargo documents, and are also available on the company website. The special conditions for package tours are based on the EU Directive 90/314/EEC. The conditions relating to package tours provided by Finnair are to be found in tour operators’ travel documents, travel brochures and websites.
The airline has a duty to communicate the passenger’s rights if a passenger is denied access to a flight, the passenger’s flight is cancelled or the flight is delayed. This duty is based on EC Reg-ulation 261/2004. At the same time, the airline must inform customers of whom they can file a complaint with. Finnair complies with these regulations in its customer service operations.
A customer’s protection of privacy is prescribed by the Finnish Personal Data Act 22.4.1999/523.
LINKS:
Finnair’s General Conditions of Carriage
• http://www.finnair.com/INT/GB/info/conditions-of-carriage
Finnair Notice on Passenger Rights
• https://www.finnair.com/go/documents/PDFs/Finnair-Notice-on-Passenger-Rights-2012.pdf
Cargo guidelines and conditions of carriage
• http://www.finnaircargo.com/en/cargo/guidelines.html • http://www.aurinkomatkat.fi/matkaehdot
(Aurinkomatkat general conditions of travel, in Finnish)• http://www.area.fi/ehdot-ja-saannot
(Area and SMT guidelines and general conditions of travel, in Finnish)
Montreal Convention
• http://eur-lex.europa.eu/LexUriServ/LexUriServ.do?uri=CELEX:22001A0718(01):en:HTML
EU Package Travel Directive
• http://eur-lex.europa.eu/LexUriServ/LexUriServ.do?uri=CELEX:31990L0314:en:HTML
Minimum Air Transport Passenger Rights when passengers are denied boarding against their will or a flight is cancelled or delayed.
• http://eur-lex.europa.eu/LexUriServ/LexUriServ.do?uri=CELEX:32004R0261:en:NOT
Finnish Personal Data Act
• http://www.finlex.fi/en/laki/kaannokset/1999/19990523
FINNAIR ANNUAL REPORT 2013
STRATEGY / CUSTOMERS / OPERATIONS / EMPLOYEES / SOCIETY / FINANCE / GOVERNANCE / GRI 19

PR5
PRACTICES RELATED TO CUSTOMER SATISFACTION, INCLUDING RESULTS OF SURVEYS MEASURING CUSTOMER SATISFACTIONFinnair monitors the customer feedback it receives and reports on the feedback to the depart-ment concerned at least once per month. In urgent matters, contact is established and feed-back is relayed immediately. In 2013, customer feedback was used particularly in redesigning Finnair’s website to make it more customer friendly. We have also improved customer com-munications in exceptional situations concerning air traffic based on the feedback we have received. Proactive customer compensation during cabin service has also been developed fur-ther. One of our main goals remains improving the overall customer experience based on feed-back. Customer feedback is also important for the motivation of customer service personnel.
Finnair monitors customer satisfaction daily on its scheduled flights, and the results are re-ported monthly. The customer satisfaction survey covers all of Finnair’s scheduled traffic des-tinations and also part of the scheduled traffic destinations operated by Flybe. Until the end of 2013, the survey was carried out by means of questionnaire forms distributed to pre-deter-mined random seats on flights. The survey’s key indicators are the general rating of the flight experience as well as ratings of various elements such as booking, airport services and in-flight services. From the beginning of 2014, customer satisfaction is monitored by means of a web-based survey sent to the customer 1-7 days after his or her flight. On Asian routes, Finnair also participates in IATA’s competitor monitoring surveys, which track the quality of service expe-rienced by the customer in comparison to the most important competitors.
Overall, Finnair’s customer satisfaction remains close to the level seen in recent years, achiev-ing the previously set target. Of all customers completing the survey in 2013, 86 per cent rated their experience as “very good” or “good”. The strengths of the service included efficient and smooth ground services and effective transfers at Helsinki Airport. Customers also appreci-ate Finnair’s cabin environments and friendly in-flight service. Development areas include in-
Finnair’s customer satisfaction with flight as a whole in 2013
Very poor Poor Fair Good Very good
Intercontinental Business Class
Intercontinental Economy Class
Europe Business Class
Europe Economy Class
flight entertainment and meals. Finnair took further measures to improve the customer expe-rience in 2013, including the introduction of Marimekko tableware and cabin textiles in spring and summer 2013. From September, customers have been served meals designed by Pekka Terävä and Tomi Björck, two of Finland’s most renowned chefs. The in-flight entertainment selection was also increased substantially in the autumn by, for example, nearly doubling the number of films available.
Finnair’s customer satisfaction surveys also cover the services of LSG Sky Chefs Finland. In addition to customer satisfaction surveys at the group level, Finnair’s subsidiaries also com-mission their own customer satisfaction surveys.
FINNAIR ANNUAL REPORT 2013
STRATEGY / CUSTOMERS / OPERATIONS / EMPLOYEES / SOCIETY / FINANCE / GOVERNANCE / GRI 20

GRI indicators IN THIS SECTION:
EN1, EN3, EN4, EN5, EN8, EN16, EN19, EN20, EN22, EN26.
MegatrendsAFFECTING OPERATIONS:Urbanisation, Technological development, Sustainability.
StrategicPRIORITIES:
Profitable growth, Cost competitiveness.
OperationsWorld class operationsWhen Finnair was founded 90 years ago, its first challenges in a diffi-cult northern climate were immediate and practical. As an airline literally born on the ice – Helsinki’s frozen Katajanokka harbour was Finnair’s first airport – Finnair has of necessity taken pride in a culture of operational excellence, even in unforgiving conditions. But Bruno Lucander, the company’s entrepreneurial founder, would have been the first to point out that it’s not just the weather that can be harsh or unpredictable when operating an airline.
In 2013, the market for commercial aviation continued to grow glob-ally, with its centre of gravity shifting tectonically toward Asia. The reorientation of global air traffic presents new opportunities but also new risks for airlines such as Finnair looking to meet rising demand from the east. The rising global appetite for oil is driving structur-ally higher fuel prices, putting new pressure on airlines to be more fuel-efficient. At the same time, more governments than ever are also demanding measurable action to be more fuel-efficient and reduce emissions of greenhouse gases, as we see with the EU’s Emis-sions Trading Scheme and with agreement at the UN’s ICAO to reach a global framework by 2020 on a “market-based measure” to offset emissions. Meanwhile, barriers to entry in the sector have never been lower and overall competition never more cut-throat, driving the need for even more efficiencies in airline operations.
FINNAIR ANNUAL REPORT 2013
STRATEGY / CUSTOMERS / OPERATIONS / EMPLOYEES / SOCIETY / FINANCE / GOVERNANCE / GRI 21

To survive and thrive in these circumstances, Finnair must draw on its long institutional experience of safety and efficiency and rise to the challenge in all aspects of its operations, from the apron to the cockpit, from network planning to fleet management. Key opera-tional performance indicators include Cost per Available Seat Kilo-metre (CASK), fuel burn/CO2 emissions, aircraft utilisation, on time performance, connection reliability and bags left behind.
Safety firstWhen developing operations the first and foremost consideration is always safety. As the foundation for the company’s and indeed the sector’s success as a whole, safety and risk prevention are built into Finnair’s operating culture, and numerous official regulations are binding upon the group’s activities, starting with European Union OPS-1 regulations governing the operation of commercial aircraft. Additionally, as a member of the International Air Transport Asso-ciation (IATA), Finnair adheres to IATA Operational Safety Audit requirements, which are to some extent stricter than the European OPS regulations. Compliance with regulations of all of the airline’s operations is ensured by an annual audit, and possible deviations from requirements are designated for rapid correction.
Although regulations create the framework for flight safety, an effec-tive airline needs a comprehensive safety culture to match that is best described by the term “Just Culture.” This term means that all kinds of human slip-ups and errors are permitted, but inten-tional violation of regulations is unacceptable. Finnair’s entire safety philosophy is based on the idea that no single human error causes an accident, rather safety networks built into the system are able to catch errors and mitigate their impact. Various protection networks in the company’s operating systems are designed with the key objec-
When developing operations the first and foremost consideration
is always safety
FINNAIR ANNUAL REPORT 2013
STRATEGY / CUSTOMERS / OPERATIONS / EMPLOYEES / SOCIETY / FINANCE / GOVERNANCE / GRI 22

Next-generation Airbus A350 XWB takes flight The Airbus A350 XWB, the backbone of Finnair’s future long-haul growth strategy, will set new standards in fuel efficiency, noise performance and passenger comfort. Airbus’s A350 project, in development since 2004, reached a major milestone on June 14, 2013 when MSN 1, the first A350 test aircraft, took off on its maiden test voyage.
Thousands more test hours are still to be logged before Finnair, as European launch customer, takes possession of its first of eleven A350s (with options for eight more) in the second half of 2015. The aircraft will be 25 per cent more fuel efficient than the previous generation of comparable long-range twin-aisle aircraft, representing a step-change in cost-efficiency and environmental performance in Finnair’s long-haul operations.
Miika Haatio, manager of Finnair’s A350 program, was on hand at the Airbus facility in Toulouse for the aircraft’s first test flight. “It was definitely a wonderful experience,” he remembers. “I think everybody there felt like a little kid, seeing the aircraft flying for the first time.”
and profitable growth in a sector where fuel costs are high and soci-etal pressure to reduce CO2 emissions is growing. An imperfect but telling indicator of an airline’s environmental performance is its average fleet age. At the end of 2013 the average age of the fleet operated by Finnair was 9.9 years, against the IATA overall average of 10.2 years. All Finnair Airbus aircraft belong to the latest aircraft generation.
tive of stopping the advance of a possibly damaging course of events and the materialisation of risk.
An effective safety culture has another dimension: reporting. Personnel – traditionally pilots in particular but also other workers – report the risks associated with their work and events that occur. The company applies a safety reporting system in which reports on air safety, maintenance safety, ground safety and cabin safety are produced. According to Just Culture principles, those making reports suffer no consequences on the basis of safety reporting, because the aim is to learn from events and further develop safety processes. A safety report cannot, however, be used to wash one’s hands of safety violations – intentional violations are unacceptable.
At Finnair all safety reports are interpreted and given a risk classi-fication according to the seriousness of the event. Events that seri-ously jeopardise safety are rare and almost without exception a sepa-rate safety investigation is launched in respect of them. A safety investigation may be carried out by the authority concerned, such as the Accident Investigation Board of Finland. If authorities decide not to carry out an investigation, Finnair performs an internal safety investigation. In cases related to flying, the safety investigator is always an experienced pilot specially trained in the subject. The safety investigator (or investigators) always carries out the investiga-tion independently and the company’s management has no opportu-nity to influence the course of the investigation.
Fuel efficiency and a modern fleetA commitment to safety and comfort entails more than regula-tions, process and culture; it is also embodied in a modern, energy- and cost-efficient fleet – a prerequisite for cost competitiveness
FINNAIR ANNUAL REPORT 2013
STRATEGY / CUSTOMERS / OPERATIONS / EMPLOYEES / SOCIETY / FINANCE / GOVERNANCE / GRI 23

In September 2013 Finnair made important progress toward the twin goals of fuel-efficiency and greener operations when it became the world’s first commercial operator of Airbus A321 aircraft equipped with new, fuel-saving Sharklet wing tip devices. The extended-range, single-aisle aircraft, which has the lowest fuel burn, operating cost, emissions and noise footprint in its class, is quieter and more comfortable for passengers than the older aircraft it replaces, as well as about 7 per cent more fuel-efficient per seat. Representing a substantial reduction in costs and CO2 emissions, three A321s with Sharklets entered the fleet in 2013, with another two due in the first half of 2014.
The five A321s with Sharklets replace Finnair’s four Boeing 757s that were used mainly for leisure and charter flights, enabling more flex-ibility and interoperability between European scheduled and leisure flights, driving up aircraft utilisation and thus improving returns on the fleet investment. The new aircraft also complete Finnair’s shift to all-Airbus operations, bringing further cost efficiencies in mainte-nance and pilot training.
World-class performance and partnerships enable a network strategyThe scheduling flexibility made possible by the commonality and simplified maintenance regime of an all-Airbus fleet also helps achieve excellence in on-time performance, connection relia-bility and bags left behind, without which Finnair’s strategic focus on network traffic through Helsinki would not be tenable. World-class quality and punctuality create the basis both for Finnair’s value proposition and its drive toward profitable growth, and are priori-tised accordingly. 09 10 11 12 13
Jet fuel consumption
1,000,000
800,000
600,000
400,000
200,000
0
tonnes
741,883
09 10 11 12 13
Direct CO2 emissions in passenger traffic
3,000,000
2,500,000
2,000,000
1,500,000
1,000,000
500,000
0
tonnes
2,336,930
FINNAIR ANNUAL REPORT 2013
STRATEGY / CUSTOMERS / OPERATIONS / EMPLOYEES / SOCIETY / FINANCE / GOVERNANCE / GRI 24

To insure swift turnarounds of aircraft and smooth connections, personnel at Finnair’s hub and network control centres work round the clock looking after the status of all aircraft and customers. Good cooperation with the Finnish Border Guard and Finavia, the oper-ator of Helsinki Airport which guarantees a minimum connection time of 35 minutes, is also essential.
Another key component of punctuality and operational excellence is close coordination with strategic vendors. 2013 was a notable year in that it was Finnair’s first full year of operations with outsourced apron, catering, and engine and component maintenance services – functions which previously had been performed for Finnair in house. In choosing world-class partners for these functions – Swissport, LSG Sky Chefs and SR Technics respectively – Finnair increased quality and achieved record levels of operational perfor-mance while reducing costs at the same time. The airline has achieved a similar result with its “thin route” Embraer and ATR flight operations as well, with its strategic partner Flybe Finland.
But Finnair’s new operational model in which it works in cooper-ation with a wider ecosystem of strategic suppliers is not without risk. Before, Finnair largely had “no one to blame but itself” in the event of a significant disruption or operational difficulty. Now, however, if a key vendor is facing operational difficulties for what-ever reason, those difficulties are likely to be felt by Finnair as well, which then must take ultimate responsibility. This risk is mitigated to a large extent by close cooperation, coordination and perfor-mance review with mission-critical partners, and by the fact that while key partners each excel in different core competences, they all share the same ultimate business objective of serving passengers
with a quality air travel experience. When disruptions occur, as they inevitably must sometimes do in an unpredictable world, Finnair works to ensure that the least inconvenience is felt for the greatest number of passengers in the network, with a particular priority on transfer passengers.
Setting the standard for environmental performanceMore than 95 per cent of an airline’s environmental impact is related to flight operations, as every kilogram of fuel burned produces 3.25 kilograms of CO
2. In 2013 Finnair made important environmental
progress when it was certified as a Stage 1 operator in IATA’s Environmental Assessment Program (IEnvA), a new and innovative environmental management system designed to independently assess and improve the environmental management of an airline. Acting in the belief that, as with safety, the whole sector would benefit from a more systematic approach to environmental management, Finnair is part of a pilot group of IATA member airlines that has been developing and participating in the program.
The environmental standards that underpin IEnvA are based on recognised environmental management system (EMS) principles (such as ISO 14001) and have been developed by a joint team of environmental consultants and leading airlines, including Finnair. Airline assessments, however – including Finnair’s – are undertaken by independent accredited Environmental Assessment Organisations that have demonstrated competencies in EMS auditing.
The initial scope of IEnvA is limited to flight operations and corporate activities, but new modules covering ground operations and maintenance are currently under development.
-24%Commitment to reduce CO
2
emissions per seat by 2017.
FINNAIR ANNUAL REPORT 2013
STRATEGY / CUSTOMERS / OPERATIONS / EMPLOYEES / SOCIETY / FINANCE / GOVERNANCE / GRI 25

The results of a commitment to operational quality and smooth hub operations were seen in 2013 with Finnair’s performance in monthly reports generated by FlightStats, an independent travel data provider. The firm’s well-publicised “league table” for on-time performance routinely showed Finnair to rank in the Top 5 of major international airlines for punctuality – and in April, May, August and November Finnair was found to be No. 1 globally, a remarkable achievement considering the scope of the competition and some-thing that can make all Finnair employees and partners proud. With 89.73 per cent of flights arriving within 15 minutes of the sched-uled time, Finnair finished 2013 as the world’s second most punctual major airline network. The connectivity rate for all transfer passen-gers, meanwhile, exceeded 98 per cent, and 6.8 bags per 1000 were left behind, against the industry benchmark of 10 bags per 1000.
Also figuring in the top ranks in FlightStats’ monthly reviews were several of Finnair’s fellow members of the oneworld alliance, which overall was named the best alliance for punctuality in 2012 and again in 2013. This wider, global network of quality is increasing in commercial importance for Finnair as it enters more codeshare cooperation and joint businesses with other airlines, such as that with fellow oneworld members American Airlines, British Airways and Iberia on transatlantic services. This world provides precious few guarantees, but with the track records established by Finnair and other key partners, passengers can feel reasonably confident that if they are transferring through Helsinki, they can count on a safe, hassle-free and pleasant air travel experience. That expectation is the asset at the core of Finnair’s value proposition and it must be safeguarded.
Finnair leaves fewer bags behind than average
6.8 bags per 1,000
Finnair
Industry benchmark
10 bags per 1,000
FINNAIR ANNUAL REPORT 2013
STRATEGY / CUSTOMERS / OPERATIONS / EMPLOYEES / SOCIETY / FINANCE / GOVERNANCE / GRI 26

A
B
C
1
2
3
CDA
A B C
11-12 km
Information graphics: Tero Harsunen
Finnair’s Network Control Center works 24 hours a day to ensureaccurate and smooth flight operations.
Employee well-being and work capacity are monitored by Finnair Health Services, which is also responsible for providing aviation medical services and regular check-ups for flying personnel.
We seek ways to reduce heat, electricity and water consumption in our offi ces. We also sort bio-, paper and energy waste for collection and recycling.
1
C
B
A
3
2
Finnair aircraft land with aContinuous Descent Approach(CDA) whenever possible. CDAlandings reduce noise, fuelconsumption and emissions.
Well-maintained and clean engines consume less fuel and emit fewer greenhouse gases. Finnair Technical Operations works under an environmental permit and aims to reduce the environmental impact from, for example, the use of chemicals in aircraft maintenance.
Finnair’s promise of service is a promise of peace of mind, and our professional and experienced personnel are the keys to fulfilling this. All Asian flights also include cabin crew from the destination country in Asia. When 1 kg of fuel is burned, 3.15 kg of CO2 is discharged into the atmosphere. Greenhouse gas emissions
are by far an airline’s largest environmental impact. Finnair improves fuel efficiency and reduces emissions by technological, operational, infrastructural and economic means.
In 2013, 67% of cabin waste was reutilised, meaning it was either reused as material or incinerated for use as energy. EU regulations concerning catering waste originating from outside the EU prevent Finnair from reutilising more.
When Finnair Cargo maximises aircraftpayload we can fly with fuller planes,which reduces emissions per tonne oftransported goods.
Finnair offerscustomers severaloptions for checking in
• Check-in kiosk• Baggage drop
by the check-in kiosks
Check invia Internet
Check invia text message
THE WORLD OF FINNAIR
FINNAIR ANNUAL REPORT 2013
STRATEGY / CUSTOMERS / OPERATIONS / EMPLOYEES / SOCIETY / FINANCE / GOVERNANCE / GRI 27

EN1
MATERIALS USED BY WEIGHT OR VOLUMEThe emphasis of Finnair’s use of materials is mainly on transport fuels, particularly jet fuel. In this report, fuels will be treated mainly as energy and the consumption of fuels is reported in section EN3. In addition to flight operations and fuel burn, significant material flows are cre-ated in LSG Sky Chefs Finland, Finnair Technical Services and Finnair Engine Service, as well as Finnair Cargo.
Meal services for Finnair flights from Helsinki are supplied by Finnair’s partner LSG Sky Chefs Finland. As one of Finland’s largest kitchens, it consumes a substantial amount of ma-terials and also represents a considerable proportion of the material consumption in Finnair’s supply chain. The raw materials used in catering services consist mainly of foodstuffs and the materials required for packaging them. Most of the materials used are renewable. Finnair con-tinuously develops its service concepts and, from September 2013, customers have been served meals designed by Pekka Terävä and Tomi Björck, two of Finland’s most renowned chefs. As part of its development efforts, Finnair began using frozen meals produced outside Finland for hot meal service in addition to the meals designed by the chefs. The shift to frozen meals is reflected in a decrease in the company’s own purchases of meat, fish and vegetables com-pared to the previous year. Overall, the increase in the volume of foodstuffs was in line with the growth in passenger volumes in 2013.
In May 2013, Finnair introduced Marimekko for Finnair design products aboard its air-craft. The Marimekko for Finnair product range includes porcelain tableware, bedding and food service textiles, as well as disposable products used in food and beverage service, such as coffee cups and paper napkins. The Ilmo series tableware produced under the Marimek-ko for Finnair design cooperation feature highly durable porcelain that is 15 per cent lighter compared to Finnair’s previous tableware. The lighter material supports Finnair’s aim of de-creasing the total weight of aircraft in order to reduce the environmental impacts of flying. The new Marimekko for Finnair products completely replaced the previous tableware and textiles, which required a substantial investment and is reflected as an increase in materials under other purchases in 2013.
The most significant consumption of materials by Finnair Cargo companies arises from the storage of cargo as well as preparing and protecting cargo for transportation. Cargo to be transported is protected with plastic, because the loading and unloading of aircraft and the transport of cargo between the terminal and the aircraft takes place outside, which requires that cargo be protected from the weather.
Unit2013
1,000 kg2012
1,000 kg2011
1,000 kg2013
1,000 l2012
1,000 l2011
1,000 l2013
1,000 pcs2012
1,000 pcs2011
1,000 pcs
Plastic 312 319 218
Paper (not office) 150 270 260
Cardboard 165,912 110 100
Textiles 65 50 87
Metals* 35 35 53
Chemicals** 751.4236 708 222
Porcelain 45 17 18
Glass 15 9 10
Board 42.7
Loading pallets (wood) 124 n/a 85
Office paper (reams) 27 29 33
Propylene glycol*** 1,596 5,282 1,442
Food purchases 3,399 3,050 3,023
* This figure does not include metals used by Finnair Technical Services, because the statistics system used for metal raw material consumed in Technical Services cannot provide comparable data. Finnair Technical Services does not manufacture products, however, so as a user of raw materials it is not a significant player on an industrial scale.
** Chemicals consumption figures for 2011 do not include dry ice used in catering operations. Dry ice is, by a significant margin, Finnair’s third-largest category of chemicals purchases behind jet fuel and propylene glycol. For this reason, the 2011 figure is not directly comparable with the chemical consumption figures for 2012-13.
ENVIRONMENTAL INDICATORS
Aircraft de-icing is a significant area of material use in Finnair’s operations. In cold weather, ice and frost forms and snow falls on the fuselage and wings of aircraft. They must be removed before take-off for flight safety reasons. A mixture of propylene glycol and hot water is used for de-icing. More information on de-icing agents is given in section EN21.
Finnair Technical Services’ most important environmental aspects relate to the use of spare parts and chemicals. Due to the use of chemicals, Technical Services has an environmental permit. In 2013, the operations of Finnair Technical Services were scaled back considerably, which is reflected in a substantial decrease in chemicals consumption. The most significant change with respect to the use of chemicals in 2013 was the discontinuation of engine service operations and the related surface finishing department. The spare parts and components needed for the maintenance of aircraft are to a large extent repairable goods. In line with stand-ard industry practice, aircraft components are repaired whenever safety aspects and official regulations allow, because the components are very expensive. This means that the lifecycle of aircraft components is typically long. The amounts of components and spare parts are not reported, however, because no universal or meaningful comparable data are available on them.
FINNAIR ANNUAL REPORT 2013
STRATEGY / CUSTOMERS / OPERATIONS / EMPLOYEES / SOCIETY / FINANCE / GOVERNANCE / GRI 28

Finnair Technical Services’ use of chemicals 2009-2013, in tonnesCHEMICAL GROUP 2013 2012 2011 2010 2009
Glues and sealing agents 0.7 0.9 2.7 3.2 2.6Paints and varnishes 3.4 9.1 16.5 24.4 17.5Surface finishing agents 5.8 6.4 11.3 24.5 19.3Cleaning agents and detergents 31.2 38.6 41.2 48.2 47.4Solvents 8.7 19.8 29 26.4 26.4Lubricants and oils 111.6 93.4 105.4 86.0 92.7Total 161.4 168.2 205.9 212.8 205.8
EN3
DIRECT ENERGY CONSUMPTION BY PRIMARY ENERGY SOURCEFinnair’s direct primary energy consumption consists of the use of transport fuels. Aviation is very energy-intensive. Globally, Finnair’s largest environmental load arises from flying and particularly from the use of fossil jet fuel.
In 2013, Finnair’s total consumption of jet fuel decreased by over 43 million kilogrammes, or nearly 6 per cent, compared to the previous year. The savings in fuel consumption were achieved by, among other things, route network optimisation, developing flight and taxi prac-tices and reducing the empty weight of aircraft. Finnair also improved its fuel efficiency rela-tive to available capacity: in 2013 Finnair’s fleet consumed nearly two per cent less jet fuel per available passenger kilometre and over two per cent less jet fuel per available tonne kilometre compared to 2012. Due to fuel savings measures and improved utilisation rates, every pas-senger kilometre flown and every tonne kilometre of payload transported were operated with less fuel consumed.
In 2013, Finnair’s ground vehicles consumed a substantially lower amount of fuel than in the previous year. As this was primarily due to the outsourcing of ground services, the figures are not fully comparable to the previous year’s fuel consumption figures.
Finnair’s primary energy consumption 2010-2013Jet fuel 2013 2012 2011
Jet fuel (Jet A-1), 1,000 kg 741,883 785,176 800,449MWh 8,924,852 9,445,665 9,629,398
GJ 32,129,469 34,004,395 34,665,834Change % -5.5 -1.9 13.6
Ground vehicles 2013 2012 2011
Petrol, 1,000 l 10 21 27MWh 94 185 247GJ 338 664 888Change % -52.4 -25.2 -14.7
Diesel, 1,000 l 41 77 200MWh 412 771 1,996GJ 1,483 2,777 7,187Change -46.8 -61.4 -9.3
Fuel oil, 1,000 l 10 269 1,213MWh 96 2,687 12,131GJ 347 9,673 43,670Change % -96.4 -77.9 -27.6
Total 2013 2012 2011
MWh 8,925,455 9,449,308 9,643,772GJ 32,131,637 34,017,509 34,717,579Change % -5.5 -2 13.5
In addition to Finnair’s fleet’s energy and fuel consumption, the company’s energy bal-ance sheet also includes the transportation capacity that Finnair Cargo purchases from other companies. In 2013, transport of the cargo entrusted to Finnair Cargo by other air-lines required 29,220 tonnes of jet fuel in total. This is equal to approximately 1,265,459 GJ. The amount includes cargo flights that were operated solely due to Finnair Cargo.
FINNAIR ANNUAL REPORT 2013
STRATEGY / CUSTOMERS / OPERATIONS / EMPLOYEES / SOCIETY / FINANCE / GOVERNANCE / GRI 29

Fuel consumption and fuel efficiency in flying 2005–2013 2005 2006 2007 2008 2009 2010 2011 2012 2013
Consumption, tonnes
617,275 655,454 763,454 831,423 712,487 704,885 800,449 785,176 741,883
g/RPK* 38.5 38.3 38.2 38.0 36.0 35.1 36.3 33.8 32.2g/ASK* 28.4 29.2 29.0 28.6 27.3 27.0 26.8 26.4 25.9g/RTK 342.5 335.3 332.5 330.0 313.5 283.0 297.1 281.2 270.0g/ATK 195.7 195.3 193.5 186.9 183.7 184.7 183.7 182.2 178.0
* Fuel consumption adjusted to passenger traffic.RPK = revenue passenger kilometres.ASK = available seat kilometres.RTK = revenue tonne kilometres, i.e. capacity use according to payload weight.ATK = available tonne kilometres, i.e. capacity according to payload weight.RPK and ASK describe passenger traffic performance and RTK and ATK describe performance according to payload capacity (passengers + baggage + cargo).
1312111009
Passenger traffic fuel efficiency 2009–2013
40
30
20
10
0
grams
g/RPK g/ASKAdjusted to passenger traffic
32.2
25.9
1312111009
Payload fuel efficiency 2009–2013
400
300
200
100
0
grams
g/RTK g/ATK
270
178
FINNAIR ANNUAL REPORT 2013
STRATEGY / CUSTOMERS / OPERATIONS / EMPLOYEES / SOCIETY / FINANCE / GOVERNANCE / GRI 30

EN4
INDIRECT ENERGY CONSUMPTION BY PRIMARY SOURCEIn 2013, Finnair’s indirect energy consumption amounted to 103,438 MWh. Of this amount, electricity consumption accounted for 46,104 MWh, while heating energy accounted for 56,200 MWh. Both electricity and heating consumption declined by over 10 per cent from the previ-ous year. This reduction in energy consumption was primarily the result of the moving office operations to a newly constructed energy-efficient building named the House of Travel and Transportation (HOTT). The move took place gradually, starting in June 2013. Geothermal energy accounts for 80 per cent of HOTT’s energy consumption. The building is categorised in Energy Class A and LEED Platinum environmental certification was received in early 2014.
Energy consumption of Finnair’s properties in 2010–2013Indirect energy consumption 2013 2012 2011
Electricity MWh 46,104 52,584 54,721 GJ 165,974 189,302 196,996Change % -12.3 -3.9 -2.3
Heat MWh 56,200 63,002 59,551 GJ 202,320 411,379 455,072Change % -10.8 5.8 -15.4
Total MWh 102,304 115,586 114,272 GJ 368,294 416,110 411,379Change % -11.5 1.1 -9.6Change from 2007, % -12.5 -4.8 -2.2
Of the heat energy consumed by Finnair, 90 per cent was consumed in the operating loca-tions situated at Helsinki-Vantaa Airport. The heat energy was delivered by district heating, of which 44 per cent was produced by natural gas, 56 per cent by coal and 0.04 per cent by heavy fuel oil. The CO2 emissions created from the production of heat energy in 2013 amounted to 18,078 t/CO2.
Finnair buys electricity from the electricity derivatives market via the Finnish national grid. According to the company that maintains the grid, most of the production is carbon neutral, but part is produced by fossil fuels. The different energy sources and their relative proportions are not known, nor is the amount of primary energy required to produce the electricity.
EN5
ENERGY SAVED DUE TO CONSERVATION AND EFFICIENCY IMPROVEMENTSOwing to the energy-intensive nature of its industry, Finnair is determined to improve the energy efficiency of its operations, particularly by striving to reduce jet fuel consumption. Fleet modernisation is the single most significant measure by which Finnair reduces its ener-gy consumption. Next-generation aircraft consume approximately 20 per cent less fuel than their predecessors. The carbon dioxide emissions of the aircraft have also declined by a corre-sponding amount. In late 2013, Finnair received three of five new A321 Sharklet aircraft that replace its old Boeing 757 aircraft.
The on-going fuel savings program resulted in savings of over two per cent in jet fuel con-sumption in 2013 compared to the previous year. This corresponds to nearly 16 million kilo-grammes of fuel saved per year, which in turn translates to a decrease in CO2 emissions of more than 50 million kilogrammes. Finnair has paid attention to fuel consumption in a number of different areas. The weight of aircraft has a significant effect on fuel consumption. The use of new technology and high-quality lightweight materials have enabled the company to reduce the empty weight of its aircraft. Weight control is also one of the most important selection cri-teria in all purchasing of aircraft components and equipment.
Finnair has invested in fuel efficiency in many different ways in its operational functions. For example, ground operations employ single engine taxiing whenever possible. In addition, the use of APU engines has been optimised (the auxiliary power unit, or APU, generates electric-ity and pressurised air for various aircraft systems). Together, these measures result in annu-al fuel savings of several million kilogrammes. The economical flying training for all Finnair pilots, which began in 2012, continued in the period under review. The aim of the training is to implement consistent operating practices and disseminate information on the factors that influence overall flight economy. These include optimal airspeed and altitude. Flight planning is also aimed at achieving optimal fuel efficiency by selecting the most economical route al-ternatives and negotiating more efficient overflight routes. In 2013, Finnair obtained several new flight routes, particularly in Asian traffic, that reduce flight times and thereby improve fuel economy.
As a partner of Finavia, Finnair has already participated for many years in the development of new kinds of landing practice. In Continuous Descent Approach (CDA) landing, the air-craft’s altitude is reduced gradually throughout the entire landing stage. A landing performed in the traditional way includes horizontal flight stages, when the aircraft’s engines have to be used now and then with greater power. This means that the aircraft’s consumption of fuel and
FINNAIR ANNUAL REPORT 2013
STRATEGY / CUSTOMERS / OPERATIONS / EMPLOYEES / SOCIETY / FINANCE / GOVERNANCE / GRI 31

air emissions are higher than in a CDA landing. In addition, the approach method implement-ed in late 2013, which is aimed at better optimisation of the parallel runways at Helsinki-Van-taa Airport, is expected to result in significant reductions in fuel consumption and emissions.
In March, Finnair participated in the international Earth Hour for the fourth time by switch-ing off its advertising lights at the airport and in various properties for a whole weekend and informing personnel of ways to conserve energy at work as well as when off duty.
In October, Finnair organised its annual energy conservation week, during which informa-tion and energy conservation tips were disseminated to personnel. There were several themes during the week, and personnel were encouraged to discuss and consider the significance of energy conservation as well as new ways to save energy.
Finnair Facilities Management Oy has joined an energy efficiency agreement between the Confederation of Finnish Industries, the Finnish Ministry of Employment and the Economy and industry associations. The parties to the agreement are committed to reducing properties’ energy consumption by nine per cent from the 2007 level by 2016. Finnair’s properties imple-mented several energy conservation measures in 2013. The most significant of these measures were related to changes in the ventilation scheduling of aircraft hangars, changes to automated building services, valve replacements and upgrades to automation systems.
The combined effect of these measures is an estimated reduction in energy consumption of 25,631 GJ per year.
Energy efficiency has been given special consideration at Finnair’s new head office HOTT, which was commissioned in summer 2013. Document printing is avoided and workstations do not have their own waste baskets. Instead, paper waste is sorted directly into collection boxes near the photocopiers and the kitchen on each floor has collection points for biowaste, energy fraction, glass and metal.
EN6
INITIATIVES TO PROVIDE ENERGY-EFFICIENT OR RENEWABLE ENERGY-BASED PRODUCTS AND SERVICES, AND REDUCTIONS IN ENERGY REQUIREMENTS AS A RESULT OF THESE INITIATIVESIn its customer service functions, Finnair is aiming to increasingly move towards digital ser-vices to avoid paper consumption. The packaging materials for in-flight products have also been selected to maximise their recyclability.
Finnair’s subsidiary Finland Travel Bureau (FTB) merged in 2013 with another Finnair sub-sidiary, Area. The merger formed the largest Finnish business travel agency, FTB. In all of its operations, FTB monitors and strives to reduce paper consumption. FTB sends all documen-tation related to travel, invoicing and travel management to customers electronically. Com-munications are also carried out electronically. In recent years, FTB has been active in utilis-ing virtual meeting technology in its internal meetings and training, which reduces the com-pany’s need for travel.
EN8
TOTAL WATER WITHDRAWAL BY SOURCE
Finnair’s water consumption 2011–2013Water consumption 2013 2012 2011
Water, m3 89,587 100,098 116,315Change % -10.5 -13.9 -4.3
In 2013, the water used by Finnair was taken from the municipal water supply network. The primary water source is Lake Päijänne.
EN16
TOTAL DIRECT AND INDIRECT GREENHOUSE GAS EMISSIONSNearly all of Finnair Group’s greenhouse gas emissions arise from flight operations. Flying pri-marily causes two kinds of direct greenhouse gas emissions: carbon dioxide and water vapour. Water vapour is the most important greenhouse gas in the atmosphere, but it is not generally examined directly as a human-derived greenhouse gas emission, because the water vapour in the atmosphere is mainly the result of natural evaporation. Air transport is in a special posi-tion in this respect, because the water vapour generated by the engines is released high in the atmosphere, increasing the atmosphere’s H2O content above the cloud layer. However, not much is yet known about the effect of water vapour emissions from aviation.
In 2010, Finnair Group set an ambitious target for cutting its carbon dioxide emissions. Finnair’s target is to reduce its CO2 emissions by 24 per cent per seat by 2017, using the 2009 level as the baseline.
FINNAIR ANNUAL REPORT 2013
STRATEGY / CUSTOMERS / OPERATIONS / EMPLOYEES / SOCIETY / FINANCE / GOVERNANCE / GRI 32

In 2013, the greenhouse gas emissions of Finnair’s own fleet amounted to approximately 2,336,930 tonnes of carbon dioxide. This figure does not include wet lease operations, which refers to Finnair flights operated with leased aircraft and crew in circumstances where the company’s own equipment is unavailable.
These figures also include the capacity acquired from other operators by Finnair Cargo. In 2013, this cargo capacity produced approximately 92,000 tonnes of carbon dioxide in total. The amount includes cargo flights that were operated solely due to Finnair Cargo.
Information on truck transport used by Finnair Cargo is absent from this report. Finnair Cargo purchases transport services from truck companies, and the statistical practices of these companies do not allow actual emissions to be calculated at present. Finnair Cargo’s main part-ners in truck traffic use vehicles classified as EURO 4 at a minimum.
Finnair’s direct and indirect greenhouse gas emissions 2011-2013CO
2, tonnes H
2O, tonnes
Direct greenhouse gas emissions, tonnes
2013 2012 2011 2013 2012 2011
Flying, AY 2,236,930 2,473,304 2,521,414 964,447 1,020,729 1,040,583Ground equipment, AY 160 979 3,870Indirect greenhouse gas emissionsElectricity n/a* n/a 10,070Heat n/a** 18,799 14,850Total 2,337,090 2,493,081 2,550,203 964,447 1,020,729 1,040,583Change % -6.3 -2.2 13.7
*will be available 3/2014**will be available 6/2014
1312111009
Passenger traffic unit-specific CO
2 emissions 2009–2013
140
120
100
80
60
40
20
0
grams
g/RPK g/ASK
RKP = revenue passanger kilometresASK = available seat kilometresRTK = revenue tonne kilometres, i.e. capacity use according to payload weightATK = available tonne kilometres, i.e. capacity use according to payload weight
RPK and ASK describe passanger traffic performance and RTK and ATK describe performance according to payload capacity (passangers + baggage + cargo).
Adjusted to passenger traffic
101.4
81.6
1312111009
Payload traffic unit-specific CO
2 emissions 2009–2013
1,200
1,000
800
600
400
200
0
grams
g/RTK g/ATK
850.5
560.7
FINNAIR ANNUAL REPORT 2013
STRATEGY / CUSTOMERS / OPERATIONS / EMPLOYEES / SOCIETY / FINANCE / GOVERNANCE / GRI 33

EN19
EMISSIONS OF OZONE-DEPLETING SUBSTANCESThe Finnair Group does not use agents that destroy the ozone layer in the upper atmosphere. Aircraft fire extinguishing systems, which use halon fire-extinguishing agents, constitute an exception. Halon must be used in aircraft fire-extinguishing systems, as alternative agents approved for civil aviation use are not yet available on the market. The types of halon used in Finnair aircraft are Halon 1301 and Halon 1211. In 2013, one extinguisher containing Halon 1301 gas was set off, resulting in 10 kilogrammes of halon being released into the atmosphere.
Halons released into the atmosphereKg 2013 2012 2011
Halon 1211 1.45 0 0.3Halon 1301 10 10.4 8.3Total 11.45 10.4 8.6CFC equivalent Total 104.35 104 84
The ODP (ozone depleting potential) of halon 1211 is 3 and that of halon 1301 is 10. The ODP of a chemical compound is the relative amount of degradation to the ozone layer it can cause, using the ozone depleting potential of a CFC compound as the reference point.
EN20
NITROGEN AND SULPHUR OXIDES (NOx, SOX), AND OTHER SIGNIFICANT AIR
EMISSIONSIn 2013, the total nitrogen oxide emissions from Finnair flight operations declined by approx-imately five per cent compared to the previous year. The decline is due to decreased fuel con-sumption. The figure excludes the NOx emissions of the Sharklet aircraft that began operat-ing in December, as well as those caused by wet lease operations.
Besides carbon dioxide, nitrogen oxides (NOx) are the most significant air emission arising from flying. NOx emissions arise from combustion processes that take place at high temper-atures. Nitrogen oxides contribute to the formation of ozone in the lower atmosphere, but de-stroy methane, which is a powerful greenhouse gas, in the atmosphere. The impact of nitrogen oxides is complex and in many respects still not fully understood.
The basis of the calculation of NOx emissions produced by the engines of Finnair aircraft are emission figures in relation to route lengths reported by engine and aircraft manufactur-ers. In Finnair, these values are applied to actual fuel consumption figures separately for each individual route. In addition, the figures are compared with documents based on engine cer-tifications maintained by the UN’s International Civil Aviation Organisation (ICAO).
NOx emissions arising from Finnair flight operations 2011-2013
2013 2012 2011
NOx emissions, Mkg 5.3 5.6 6.0
In addition to NOx emissions, Finnair’s operations give rise to volatile organic compound (VOC) emissions. VOC emissions are harmful to the environment by, for example, contribut-ing to the formation of ozone in the lower atmosphere. Lower-atmosphere ozone, moreover, is harmful to both human and animal health and flora. Finnair’s VOC emissions are derived mainly from hydrocarbons that remain uncombusted during the combustion of transport fuels as well as from chemicals used in Technical Services. Finnair Technical Services’ envi-ronmental permit specifies an upper annual limit for VOC emissions and Technical Servic-es’ emissions are considerably lower than this.Due to substantial scaling down of operations, the VOC emissions of Finnair Technical Services declined by more than a third in 2013 com-pared to the previous year.
FINNAIR ANNUAL REPORT 2013
STRATEGY / CUSTOMERS / OPERATIONS / EMPLOYEES / SOCIETY / FINANCE / GOVERNANCE / GRI 34

Finnair Technical Services VOC emissions in 2013
VOC, 1,000 kg
Aliphatic hydro-
carbons
Aromatic hydro-
carbons Ketones Alcohols
Halogenated hydro-
carbons Various Total
Paints and varnishes 1.4 1.4Paint removal agents 0.3 0.1 0.4Glues and sealing agents
0.1 0.1
Solvents 0.9 0.1 0.2 0.9 1.1 3.1Anti-corrosion agents 0.1 0.1Cleaning agents 3.6 0.0 3.6Washing benzene / washing solvents
1.6 1.6
Total 2.5 0.1 0.2 4.7 0.1 2.6 10.1
EN21
TOTAL WATER DISCHARGEWastewaters produced by the Finnair Group are discharged into the municipal sewerage net-work. The exception is a water-propylene glycol mixture used in aircraft de-icing, which Fina-via primarily collects and transports to the waste water treatment facility for processing. Small amounts of the mixture also flow into small streams and ditches that surround Helsinki-Van-taa Airport. The area’s streams and ditches run into the River Vantaa and the River Kerava. Finavia reports on these emissions in its environmental report.
According to a study conducted by a third party and completed in January 2014, the bedrock potassium concentration at the airport are elevated compared to natural concentration levels, but the concentrations are still considered low. The potassium concentration of groundwater towards the Päijänne tunnel have not changed significantly. The computational impact of the use of de-icing agents on surface waters and groundwater is minor. According to research into the effects of propylene glycol during winter 2012–2013, the streams and ditches surrounding the airport showed slightly elevated levels resulting from glycol. However, the airport’s oper-ations were not perceptible in analysis results from the River Vantaa and the River Kerava. Fi-navia, which maintains Helsinki-Vantaa Airport, issues reports on the propylene glycol and the amounts thereof that end up in the soil and waterways in connection with aircraft de-icing.
1312111009
0.4
0.3
0.2
0.1
0.0
grams
0.230.19
Unit-specific NOx emissions,
passenger traffic 2009–2013
g/RPK g/ASKAdjusted to passenger traffic
1312111009
4.00
3.00
2.00
1.00
0.00
grams
1.95
1.29
Unit-specific NOx emissions,
relative to payload capacity 2009–2013
g/RTK g/ATK
0 9 10 1 1 1 2 1 3
Development of use of solvent-containing chemicals and VOC emissions in Finnair Technical Services 2009–2013
100,000
80,000
60,000
40,000
20,000
0
kg
VOC emissions Solvent-containing chemicals
29,400
10,100
FINNAIR ANNUAL REPORT 2013
STRATEGY / CUSTOMERS / OPERATIONS / EMPLOYEES / SOCIETY / FINANCE / GOVERNANCE / GRI 35

EN22
TOTAL WEIGHT OF WASTE BY TYPE AND DISPOSAL METHODThe total amount of waste generated by Finnair increased by 16 per cent, or nearly 700 tonnes, from the previous year. The increase in the quantity of waste is primarily explained by the in-crease in the number of flights. The waste recovery rate decreased as waste outside the EU increased as a result of the EU Animal by-products Regulation. This type of waste is not re-cyclable and its disposal requires special handling. In other respects, the waste recovery rate improved further in 2013.
Waste generated by Finnair according to final disposal method1,000 kg 2013 2012 2011
Composting** 60.9 395 461Change, % -84.6 -14.3 -1.7Recycling 1,912.31 1,116 1,374Change, % 71.3 -18.7 9.8Energy use 1,297.64 1,259 1,349Change, % 3.0 -6.6 78.5Landfill site 1,595.72 1,264 1,671Change, % 26.3 -24.4 -23.4Other** 0 144 157Change, % -100.0 -8.6 -3.5Total 4,867 4,178 5,011Change, % 16.5 -16.6 4.0Re-utilisation % 67.2 69.8 66.7Recycling % 40.5 39.6 39.7
* Waste in the Other category is included in the Recycling category in reporting for 2013
** The decrease in the amount of composted waste is due to the discontinuation of the use of bakery waste for bioethanol produc-tion in early 2013.
The majority of Finnair’s hazardous waste is generated by Finnair Technical Services. In 2013, the amount of hazardous waste generated by Technical Services increased by 85% from the previous year. This is due to the closure of the surface finishing plant located in an engine ser-vice facility sold by Finnair. The amount of waste metal is also substantially higher than in 2012. This is due to structural changes in Technical Services as well as the emptying of premises.
Hazardous waste generated by Finnair 2013 2012 2011
Hazardous waste, tonnes 204.4 110.4 175.2change, % 85.1 -37.0 49.5Re-utilisable* 38.2 24.0 41.9Re-utilisation % 18.7 21.7 23.9
* Reutilisable hazardous waste includes waste kerosene, which is used as a co-com-bustion agent in processing hazardous waste, and part of solvent waste, which Finnair’s partner cleans and returns to Technical Services for reuse.
09 10 11 12 13
Amounts of waste 2009–2013
6,000
5,000
4,000
3,000
2,000
1,000
0
Composting Recycling Energy use Landfill site* Other**
tonnes
1312111009
Amounts of waste and utilisation percentage 2009–2013
8,000
7,000
6,000
5,000
4,000
3,000
2,000
1,000
0
80
70
60
50
40
30
20
10
0
Total, tonnes Utilisation, %
5,188
57,35
1312111009
Finnair Technical Services’ hazardous waste 2009–2013
250
200
150
100
50
0
tonnes
204.4
FINNAIR ANNUAL REPORT 2013
STRATEGY / CUSTOMERS / OPERATIONS / EMPLOYEES / SOCIETY / FINANCE / GOVERNANCE / GRI 36

TRAVEL AGENCIESAurinkomatkat-Suntours participates in environmental protection projects at its holiday des-tinations. Loving Andaman Sea is a project in Krabi, Thailand, to promote responsible tourism at the local limestone cliffs. The project organises volunteer cleaning days on beaches in Krabi approximately once per month. The project includes many travel businesses from the Krabi region, and Aurinkomatkat became the first foreign enterprise to join the project in 2011. Au-rinkomatkat staff and many customers have participated in the volunteer cleaning days, with thousands of kilogrammes of litter removed from the beaches.
In Fuerteventura and Gran Canaria, Aurinkomatkat participates, in cooperation with its local agent, in a campaign organised by the charitable organisation Fundacion Seur to collect hard plastic bottle caps. The proceeds received from recycling companies are used for the medical care of children from low-income families and the purchasing of required equipment. The families receiving assistance are selected by the foundation. Aurinkomatkat customers can hand bottle caps collected during their holiday to staff on the way to their return flight, who will then have them delivered to the campaign’s collection boxes. Through their participation in the campaign, Aurinkomatkat and its customers support both local child welfare charity work as well as environmental protection.
Aurinkomatkat also participates in many assistance projects that customers may also par-ticipate in (see page 56).
EN26
INITIATIVES TO MITIGATE ENVIRONMENTAL IMPACTS OF PRODUCTS AND SERVICES, AND EXTENT OF IMPACT MITIGATIONOne typical adverse environmental effect of air transport is noise. The noise produced by air-craft is mainly engine noise and aerodynamic noise. The level of engine noise is greater in take-offs, while the level of aerodynamic noise grows during approaches.
In the Finnair Group, noise pollution is reduced by modernising the aircraft fleet and by planning takeoffs and landings at less undesirable times from a noise perspective. However, Finnair also operates flights in the evenings and at night, at which times noise is perceived to be more disruptive.
Finnair fleet noise values
Aircraft type Engine typeTakeoff noise / ICAO noise limit
Approach noise / ICAO noise limit
A340-311 CFM56-5C2 95.0/103.7 97.2/104.7A340-313 CFM56-5C4 95.4/104.1 97.0/104.9A330-302 GE-CF6-80E1A4/B 92.2/98.1 99.1/104.4B757-200 P&W 2040 89.7/94.1 98.1/102.0A319-112 CFM56-5B6/2P 83.4/90.9 94.7/100.2A319-112 CFM56-5B6/2P 84.6/91.2 94.7/100.3A320-214 CFM56-5B4/2P 83.6/91.3 96.0/100.4A320-214 CFM56-5B4/2P 84.9/91.6 96.0/100.6A321-211 CFM56-53/2 86.4/92.2 97.0/100.9A321-211 CFM56-5B3/2P 88.3/92.5 97.0/101.1A321-231 V2533-A5 88.3/92.8 95.6/101.3Embraer 190 GE CF34-10E 86.1/89.2 92.7/99.2Embraer 170 GE CF34-8ES 84.1/89.0 94.9/98.2
FINNAIR ANNUAL REPORT 2013
STRATEGY / CUSTOMERS / OPERATIONS / EMPLOYEES / SOCIETY / FINANCE / GOVERNANCE / GRI 37

GRI indicators IN THIS SECTION:
LA1, LA2, LA4, LA6, LA7, LA8, LA9, LA10, LA12, LA13, HR5, HR6, HR7, SO5
MegatrendsAFFECTING OPERATIONS:Shift in economic and geopolitical power, Technological development, Sustainability
StrategicPRIORITIES:
Customer experience, International winning team.
FINNAIR ANNUAL REPORT 2013
STRATEGY / CUSTOMERS / OPERATIONS / EMPLOYEES / SOCIETY / FINANCE / GOVERNANCE / GRI 38
Our greatest resourceThere are lots of business models that sound ideal on paper, but at the heart of any enterprise are the boots on the ground – or indeed, in the air. Finnair’s employees – their skills, knowledge, presence, decision-making and attitude – determine ultimate business success or failure. Are all employees working together toward common goals? Do they understand the competition and the business land-scape? How international is their outlook? Is work taking place in an environment conducive to health and wellbeing? Are there opportu-nities for work rotation and career development? Does the working culture attract and retain top talent? Do management and labour unions work together in constructive, strategic partnership? Getting the answers to these questions right is essential in driving Finnair’s value creation.
Wellbeing at work: 4D surveyTwice in 2013, as per the annual plan, Finnair carried out its 4D survey, which collects and delivers information on the status of the work community in order to promote personnel well-being and develop the work culture.
Employees

FINNAIR ANNUAL REPORT 2013
STRATEGY / CUSTOMERS / OPERATIONS / EMPLOYEES / SOCIETY / FINANCE / GOVERNANCE / GRI 39
In the annual extensive 4D survey everyone has the chance to express their opinion on four aspects of the survey, i.e. my line manager, my work community, my personal aspect and my health and well-being. The survey gauges the level and development of employees’ commitment to Finnair, its strategy, ways of working and organisational renewal. Based on the survey results, we aim at rein-forcing things that are well and further developing things that need to be improved. Up to date information on the status of work and working environment are the basis for enhancing wellbeing at work.
Each autumn, Finnair also measures day-to-day wellbeing at work, job satisfaction and general satisfaction through the implementation of a condensed 4D Pulse survey. The average scores of the 4D Pulse survey can be seen as a general index of occupational wellbeing and job satisfaction in the work community.
Finnair HR is responsible for implementing both 4D surveys, and the data collected is treated with strict confidence and used only for scientific purposes without personal identification informa-tion. Feedback is always given on a general level in order to protect individual anonymity. In addition to the survey, the company has a systematic process and a set of operating models for processing the results in the work communities. The aim is to activate the work community to discuss ways to improve wellbeing-at-work based on an analysis of the survey results.
The participation rate in the spring 2013 survey was 53 per cent and the autumn survey was 56 per cent. The wellbeing-at-work index for the group as a whole in spring 2013 was 4.0 and in fall 2013 3.8 on a scale of 1 to 5, with 5 being the highest score.
09 10 11 12 13
Number of persons employed by Finnair at year-end
8,000
6,000
4,000
2,000
0
5,803
Employee wellbeing in 2013
1 = Poor 3.9% 2 = 11.4% 3 = 29.1% 4 = 42.7% 5 = Excellent 12.9%
%
Employees by group
%
Finnish Aviation Union IAU 14% Finnish Aviation Employees Association SLV 5% Finnair Technical Employees’ Association FT 5% Finnair White-Collar Employees Association FYT 12% Travel agents 5% Finnish Airline Pilots’ Association (SLL) 12% Finnish Cabin Crew Union (SLSY) 29% Other 3% Outside Finland 12% Management positions 2%

FINNAIR ANNUAL REPORT 2013
STRATEGY / CUSTOMERS / OPERATIONS / EMPLOYEES / SOCIETY / FINANCE / GOVERNANCE / GRI 40
Building the international winning teamOne important way Finnair’s leadership and working culture is developed is through the International Winning Team philosophy. Finnair’s customers – and the airline’s prospects for survival and growth – are mostly international, and this requires employees with an international outlook, experience and competence. Accordingly a member of the Finnair Executive Board is nominated to be respon-sible for each of five competence areas:
• Airline Business Understanding: How we understand the airline industry, the market environment, our business model and way we execute it
• Change Management: How we lead the change, new competitive circumstances and fresh business challenges
• Project Management: How Finnair implements new projects and builds and extends its business according to the project method-ology
• Process Management: How we use processes to develop and enhance our operations and business
• Partner Management: How Finnair focuses on the core airline business and manages relationships with strategic suppliers and other partners
The aim of our Human Resources development is to provide our employees with concrete tools to manage daily tasks and to ensure employees’ professional skills respond to the needs of the business. New employees are provided with on the job training and induction. Finnair has systematically used tools developed based on its lead-ership principles (goal-oriented, developing, incentivising, caring and fair) to support supervisors and teams in their day-to-day work. Finnair’s Takeoff and Runway development programs for super-visors also continued in 2013, further strengthening the compa-ny’s consistent leadership culture and improving the capacity of managers to lead their teams, their businesses and themselves.
Finnair’s talent review and successor planning processes also play an important role in the management and development of the organ-isation. Talent review is based on Finnair’s management principles and Performance Dialogue process. The talent review has helped improve the company’s successor planning and career rotation

We like it HOTT In July 2013 the Finnair Group began moving many of its functions into one building, the newly constructed House of Travel and Transportation, or HOTT. More than just a change of address, with the new premises Finnair wanted to take advantage of the opportunity to strengthen cooperation and communication between units, improve wellbeing at work and lighten the Group’s energy and environmental footprint.
The new seven-storey building, located near Helsinki Airport and owned by insurance company Ilmarinen, features open-plan work spaces for all employees and numerous meeting rooms and conference facilities of various sizes, as well as “working cafes” for more impromptu meetings or collaboration. Other amenities in the building include a gym and changing rooms free for all employees, as well as a café, cafeteria and Finnair Sky Shop open to the general public. By bringing in formerly isolated units and functions under one roof, employees have more opportunities to get to know their colleagues from other parts of the business and increase mutual understanding of work roles, thus creating better conditions for cooperation and for developing the working culture.
The new, spatially consolidated work environment also represents a significant cost savings over previous arrangements; Finnair now leases approximately 25,000 m2 less floor space than it did formerly. The new eco-friendly building controls energy costs too, and satisfies requirements for Platinum certification according to the Leadership in Energy and Environmental Design (LEED) standard for green buildings.
opportunities and allowed the organisation to systematically focus its personnel development efforts on certain target groups.
Codes for successThe manner and ethical norms in which the international winning team operates matter as much as the work itself. In a logistically demanding business with global reach in many different legal juris-dictions and cultural traditions, good intentions and instincts are not enough to protect the company from undue risk – clear ethical guidelines and principles for doing business must be articulated as well. This is why in 2012 the Board of Directors approved a new Code of Conduct applying to all management and employees, and this code was further explained and highlighted to personnel in 2013. E-learning package was also introduced in 2013. The full text of the Code can be found at www.finnairgroup.com in the Corporate Responsibility section.
As an airline, however, we are only at the tip of a very deep supply chain. Of equal importance, then, are ethical principles in the Supplier Code of Conduct, which governs all procurement decisions and also came into force in 2012. It can also be at www.finnairgroup.com in the Corporate Responsibility section.
These formal declarations of principles are intended to help us build a strong and fair business on a solid foundation of ethics that will stand the test of time.
FINNAIR ANNUAL REPORT 2013
STRATEGY / CUSTOMERS / OPERATIONS / EMPLOYEES / SOCIETY / FINANCE / GOVERNANCE / GRI 41

A matter of trust: Relations with employees and labour unionsFinnair is going through a structural change aiming at improving profitability and competitiveness. Our goal is to save 200 million euros in annual costs by the end of 2014. The savings are being sought from all functions, including employee costs, and they apply to all employee groups.
Finnair’s employee relationships are governed by collective labour agreements (CLAs). In the fall of 2013, agreements based on Finland’s central incomes policy settlement were reached with the Finnish Flight Attendants’ Union (SLSY), the Finnish Avia-tion Union (IAU) and Finnair employee groups belonging to Trade Union Pro. A similar agreement was made with the Finnish Airline Pilots’ Association (SLL) in December.
The negotiation process was difficult and it led to strike threats by IAU and SLSY in November. There was also a threat of support strikes related to the intended change of employer union of the catering subcontractor LSG Sky Chefs. There were deficiencies in catering due to industrial actions of the LSG employees, while 130 flights had to be cancelled because of the threat of strikes. Although the strike threat caused significant financial losses, the terms of employment were finally agreed on without strikes, lockouts or industrial actions at Finnair.
In addition to the labour agreements, agreement on savings nego-tiations was reached based on the crisis clauses defined in the central incomes policy settlement. The aggregate of agreements was reached to secure Finnair’s future.
The aim of the agreement is, in addition to the goals of the central incomes policy settlement, to agree on the measures to secure jobs and the future of the company in case of exceptional financial diffi-culties.
Finnair’s employee and employer unions stated that at the time of the signing of labour agreements Finnair is in exceptional financial circumstances as defined in the central incomes policy settlement. Thus, an agreement was made to start or continue local savings negotiations with each union. As communicated earlier, with the savings agreement Finnair aims at saving 60 million euros part of which must come from personnel costs, including flight crew costs.
The new collective labour agreements are now in place and negotia-tions to reach the savings are ongoing. The aim is to reach the targets in 2014 in a way acceptable to all parties.
The CLA negotiations, though concluded peacefully, highlighted a difficult issue still facing Finnair: The company must secure its future in the long term, but naturally it is difficult for employees to give up current benefits even if they are above the current market level. Although industrial action is seldom in the ultimate interest of anyone at Finnair or Finnair’s customers, it nonetheless remains a serious risk to Finnair’s commercial objectives, which depend on operational quality and punctuality.
FINNAIR ANNUAL REPORT 2013
STRATEGY / CUSTOMERS / OPERATIONS / EMPLOYEES / SOCIETY / FINANCE / GOVERNANCE / GRI 42

SOCIAL INDICATORS
LA1
TOTAL WORKFORCE BY EMPLOYMENT TYPE, EMPLOYMENT CONTRACT AND REGIONThe number of Finnair employees decreased significantly in 2013 as a result of the structur-al change in progress at the company. At the end of 2013, the number of Finnair’s employees was 5,803, which is 565 fewer than in the previous year. Geographically, the greater part of per-sonnel works in Finland, the majority at Helsinki-Vantaa Airport or in its immediate vicinity.
There are 710 Finnair employees working outside Finland. Of these, 263 are employed in sales and customer service duties for Finnair’s passenger and cargo traffic. A total of 321 peo-ple worked for travel agencies and tour operators based in the Baltic countries, in financial management and as guides at Aurinkomatkat-Suntours’ holiday destinations. Personnel based abroad are included in the total number of Finnair employees.
Full-time staff accounted for 95 per cent of Finnair employees, and 96 per cent of staff were employed on a permanent basis. The average age of employees was 44 years.
LA1 Fixed-term and permanent employees as of 31 December 2013
Airline business
Aviation services
Travel services
Other functions
Total 3,677 1,106 730 290
Fixed-term (%) 4.0 1.1 6.0 2.4
Permanent (%) 96.0 98.9 94.0 97.6
Full-time and part-time employees as of 31 December 2012Total 3,677 1,106 730 290Part-time (%) 6.0 2.2 1.4 1.7Full-time (%) 94.0 97.8 98.6 98.3
LA2
TOTAL NUMBER AND RATE OF EMPLOYEE TURNOVER BY AGE GROUP, GENDER AND REGIONNumber and proportion of those who ended their employment (voluntarily, made redundant, retired or as a result of a fatality).
Airline business
Aviation services
Travel services
Other functions
Total
Total 3,677 1,106 730 290 5,803
Departed 154 416 114 13 697
Turnover, %* 4.1 27.4 14.1 5.1 10.9
* Turnover figures do not include changes in personnel numbers due to outsourcing and the ending of fixed-term employment contracts. Finnair personnel working abroad are included in the figures. Finnair does not maintain turnover statistics in relation to gender, age group or other diversity aspects.
LA6
PERCENTAGE OF TOTAL WORKFORCE REPRESENTED IN FORMAL JOINT MANAGEMENT WORKER HEALTH AND SAFETY COMMITTEES THAT HELP MONITOR AND ADVISE ON OCCUPATIONAL HEALTH AND SAFETY PROGRAMSAt Finnair, co-operation on occupational health and safety is organised in compliance with Finnish occupational health and safety legislation. Personnel have representation in official oc-cupational health and safety committees at the company level or the business unit level. The occupational health and safety of Finnair’s personnel abroad is also taken into consideration in the work of the committees.
The occupational health and safety committees operate at the company level, representing various personnel groups. In large subsidiaries, employees are also represented by occupa-tional health and safety delegates at the department level, whose task is to participate in occu-pational health and safety activity in pairs with the employer’s representatives at the job level. Occupational health and safety delegates are selected via elections for terms of two years at a time. The previous term commenced at the beginning of 2012, and at the end of 2013 employ-ees organised occupational health and safety elections for the 2014-2015 term.
FINNAIR ANNUAL REPORT 2013
STRATEGY / CUSTOMERS / OPERATIONS / EMPLOYEES / SOCIETY / FINANCE / GOVERNANCE / GRI 43

The number of occupational health and safety delegates and their operating areas were ad-justed at the end of 2013 to correspond with the significant structural changes in the organi-sation. In addition, several changes pertaining to the occupational health and safety managers representing the employer took effect on 1 January 2014. The changes are aimed at facilitating and improving the efficiency of occupational health and safety activities and bridging the gap between the employer’s representatives and the employee delegates.
LA7Rates of injury, occupational diseases, lost days and absenteeism, and total number of work-related fatalities by company and function2013 Number of
work-related accidents
Number of workplace accidents
Workplace accident frequency (number of accidents per one mil-
lion working hours)
Number of business trip
accidents
Sickness days due to work-related
accidents
Airline’s flight personnel 68 53 9 15 483Airline’s ground personntel 49 27 28 22 280Finnair Technical Services Oy 35 29 10 6 165Finnair Engine Service Oy 1 0 2 1 12Cargo Oy and FCTO Oy 4 2 12 2 69Finncatering Oy 18 16 31 2 32Finnair Flight Academy Oy 0 0 0 0 0Travel Retail Oy 4 4 17 0 20Aurinkomatkat Oy 0 0 0 6 0Area Oy 6 1 6 5 38Finland Travel Bureau Ltd 5 0 1 5 5Amadeus Oy 0 0 0 0 0
Total 190 (2012=255)
132 (2012=182)
10 (2012=15)
64 (2012=73)
1,104 (2012=1,415)
The figures do not include Finnair’s leased employees or subcontractors.Finncatering had 1 suspected case of occupational disease in 2013.Flight personnel had 1 suspected case of occupational disease in 2013.There were no fatalities in 2013 (the most recent fatality was in 2005). Work-related accidents are divided into workplace accidents and business trip accidents.Sickness days due to work-related accidents This figure includes days of sickness absence caused by accidents that occurred in 2013, where the duration of the incapacity to work was at least one day in addition to the day of the accident. The day of the accident is not included in the calculation.Workplace accident frequency = number of workplace accidents per one million working hours. Workplace accidents include all accidents that incurred treatment expenses and occurred at the workplace or during work.Airline’s ground personnel = Group management, HR, support services, ground crew, operative ground personnel and Travel Retail.
Employee health and safety issues are also handled by Finnair’s informal Trust Forum. Mem-bers of the Executive Board, HR management, delegates and occupational health and safety organisations are invited to join the forum. The forum provides background information on and discusses matters such as equality and non-discrimination, planning and changes per-taining to employees on a broad basis.
FINNAIR ANNUAL REPORT 2013
STRATEGY / CUSTOMERS / OPERATIONS / EMPLOYEES / SOCIETY / FINANCE / GOVERNANCE / GRI 44

LA8
EDUCATION, TRAINING, COUNSELLING, PREVENTION AND RISK-CONTROL PROGRAMS IN PLACE TO ASSIST WORKFORCE MEMBERS, THEIR FAMILIES, OR COMMUNITY MEMBERS REGARDING SERIOUS DISEASES
Occupational health services and wellbeing-at-work activitiesAt Finnair, the Finnair Health Services unit is responsible for activities relating to occupation-al health and working capacity. Finnair Health Services, Finnair Aeromedical Centre FAeMC (subsequently referred to as Health Services) coordinates and is responsible for the implemen-tation of occupational health care in the entire Finnair group. Finnair Health Services is one of Finland’s leading experts in aviation medicine.
The Finnair Group engages in active communication on occupational health issues by utilis-ing its internal communication channels and by arranging special occupational health theme days. As an authorised aviation medicine centre, Finnair Health Services also provides aviation medical examinations for the company’s pilots, cabin crew and external aviators.
The operations, services and methods of Finnair Health Services are based on industry best practices, customer-focused work, leading expertise and the active production and applica-tion of research evidence as well as effective processes. Finnair Health Services’ main research cooperation partners are the Finnish Institute of Occupational Health and the National Insti-tute for Health and Welfare.
The operational and service quality of Finnair Health Services is based on the European Foundation for Quality Management’s EFQM Excellence Model. The quality system is used to ensure that Finnair Health Services meets the requirements for good occupational health care practice in both aviation healthcare and aviation medicine services. Finnair Health Ser-vices has dedicated and up-to-date quality manuals for occupational health care as well as aviation medicine. A project to update and revise the quality manuals began in 2013 and will continue in 2014.
Occupational health activitiesOccupational health care is responsible for providing advice and guidance based on informa-tion and experience at the workplace to develop well-being at work. Preventive occupation-al health care activities include influencing employees’ health-related habits, identifying risk factors to health, providing advice and guidance for health-promoting choices and protect-
ing oneself from health problems, diseases and reduced work capacity before symptoms or problems arise.
In its activities, Finnair Health Services has focused in particular on developing screening and care practices for illnesses that compromise and affect working capacity. In the aviation industry, some employees work in exceptional conditions and at atypical working hours. In 2013, Finnair Health Services participated in a Finnish Institute of Occupational Health re-search project aimed at producing information on identifying sleep and alertness disorders associated with irregular working hours and preventing the problems they cause.
Workplaces and occupational health care have cooperated in many ways to improve oper-ating practices that help employees to continue to work and remain in working life despite in-dividual health restrictions and ageing. These practices include referral to rehabilitation, trial work placements, the lightening of workloads, job modification, flexible working hours and the use of part-time sick leave supported by part-time sick leave allowance from the Social In-surance Institution of Finland.
Finnair uses an early intervention operating model for the management of risks related to working capacity. The operating model is included in group-level operating guidelines.
The operating principles of Finnair’s substance abuse program is designed to contribute to an intoxicant-free workplace and work community. Identifying substance abuse problems, early intervention, treatment and rehabilitation help reduce the negative health effects of sub-stance abuse and influence service quality, productivity, occupational safety and working at-mosphere. This also contributes to flight safety.
Promoting employee health and working capacity through various career stagesEmployees are invited to medical check-ups every three to five years, depending on their work-related exposure to risk factors, their duties and their age, in order to promote their health and working capacity. Medical examinations were carried out for a total of 986 employ-ees in 2013. The examinations have a broad focus on various health risks (including diabe-tes and cardiovascular diseases) as well as musculoskeletal disorders, psychological disorders and other serious illnesses that may compromise working capacity, operating capacity and the connection between work and health. Work placement medical examinations are conducted for new recruits and employees whose jobs, working conditions or work-related medical re-quirements change. Returning examinations are also conducted for employees returning to work after extended periods of incapacity to work.
Medical examinations pertaining to exposure at work include examinations concentrat-ing on the effects of cosmic radiation, carcinogenic substances, solvents and other chemicals,
FINNAIR ANNUAL REPORT 2013
STRATEGY / CUSTOMERS / OPERATIONS / EMPLOYEES / SOCIETY / FINANCE / GOVERNANCE / GRI 45

noise, vibration and working night shifts. In minimising exposure to such work-related health hazards, the primary focus is on implementing working methods and procedures that involve minimal exposure to hazards. Aviation operations require the use of effective chemicals and special attention is paid to chemical hazards and protection from them. Cosmic radiation as-sessments were conducted for a total of 24 pregnant members of flight personnel in 2013. All flight personnel can check their cumulative radiation exposure by accessing a browser-based system that provides information on actual hours of flight duty performed and a mathemati-cal calculation of accumulated cosmic radiation exposure. Finnair Health Services has mon-itored the radiation exposure of all flight personnel on a quarterly basis. Radiation exposure levels have not exceeded the annual maximum level (6 mSv).
Finnair Health Services has offered employees inoculations against work-related infectious diseases and influenza. The Health Services unit actively monitors the epidemiological situa-tion of various infectious diseases and issues instructions to employees as necessary. In addi-tion, Health Services continuously monitors the epidemiological situation and other risks in Finnair’s destination countries.
Representatives of Finnair Health Services participate in the development of workplace meals and crew meals for flight personnel. The services of a nutritional therapist have been added to occupational health care services, and in special cases employees have the opportunity to obtain a referral from occupational health services for personal counselling visits by a nutri-tional therapist.
As in previous years, rehabilitation to maintain working capacity was carried out in coop-eration with workplaces, the Social Insurance Institution of Finland and Avire Oy. In 2013, a total of three rehabilitation courses customised to the requirements of specific jobs began, with 10 participants selected by occupational health care in each. The courses targeted office workers, pursers and Technical Services employees.
As the company has implemented particularly substantial structural changes over the past few years, redundancies, layoffs and other changes have been unavoidable. Finnair Health Services has supported employees, work communities and supervisors in coping with these changes. Support has been actively offered to individual laid-off employees and work com-munities to help them identify coping strategies and find a new direction in life. Occupation-al health physicians and nurses have been responsible for group and individual-level support measures related to the structural changes in their respective areas of responsibility.
Occupational health care services have engaged in student cooperation with Metropolia University of Applied Sciences and, in 2013, this cooperation resulted in three health events aimed at employees. In spring 2013, a two-day health event was implemented for technical
services personnel in cooperation with graduating nursing students with the theme “Mainte-nance for the Man”, and in October a one-day health event was organised for ground service personnel and a one-day Cancer Prevention event was organised as part of the Pink Ribbon campaign. The event was implemented in cooperation with the Cancer Society of Finland.
Wellbeing-at-work programThe principles of Finnair’s wellbeing-at-work program for the period 2011–2015 apply to all business units and their employees. The aim of the program is to promote the effectiveness and functionality of the work community and to ensure the wellbeing of personnel through all career stages. The program contributes to employee productivity, the company’s compet-itiveness and attractiveness as an employer as well as the implementation of the social com-ponent of corporate responsibility.
The members of the wellbeing-at-work steering group in 2013 were the Director of Finnair Health Services,
Finnair’s Head of Occupational Safety, Finnair Cargo’s HR manager and the group’s director in charge of human resource development. The steering group met 10 times in 2013.
Exercise program in 2013As in the previous year, in 2013, Finnair focused on increasing the day-to-day activity of em-ployees whose exercise habits were below current recommendations. The exercise program was designed and implemented in cooperation between the UKK Institute, UKK Health Ser-vices and Finnair Health Services. The effect of the six-month exercise program on the par-ticipants’ day-to-day activity and fitness variables will be evaluated, and the project’s final re-port and effectiveness analysis will be completed in early 2014. In 2013, a total of 60 Finnair employees participated in the project.
Three THROTTLE fitness groups were launched in 2013, two with a focus on exercise and one with a focus on weight management. The programs were implemented in cooperation with Finnair’s partner Avire Oy and with support from the Social Insurance Institution of Fin-land. A total of 47 Finnair employees participated in THROTTLE fitness groups.
Finnair also implemented a new form of support for exercise in 2013: CREW and TEAM ex-ercise allowances. These discretionary allowances were directed at group exercise. FINNAIR TEAM exercise allowance is intended for the promotion of work community development, well-being and communality. Both allowances are granted in part or in full based on separate applications and are available to all employees. The TEAM allowance can be used to fund ex-ercise activities—for example, in conjunction with team development days—while the CREW
FINNAIR ANNUAL REPORT 2013
STRATEGY / CUSTOMERS / OPERATIONS / EMPLOYEES / SOCIETY / FINANCE / GOVERNANCE / GRI 46

allowance can be used to fund various events, such as marathons and other mass sporting events. In 2013, Finnair employees used the CREW allowance to participate in the Yritysmara-ton 2013 (Company Marathon 2013) event, the Midnight Run event and the Pink Ribbon run. More than 300 Finnair employees benefited from the allowance in 2013.
On 29 July 2013, Finnair opened a modern fitness centre available to all employees at its new HOTT office building. Going forward, instructor-led group exercise classes will be organised in the fitness centre’s group exercise room.
Workshops to support change managementFinnair’s most important personnel development project in 2013 was Network, which com-bines the development of well-being at work, managerial work and change management at the team level. Network is comprised of sets of three workshops led by Finnair managers and supervisors, internal facilitators and external experts. The workshop themes are leadership, well-being and change. They introduce team supervisors to practical methods for promoting well-being and change as a project that involves all team members. In the first phase of Net-work in autumn 2013, workshops were organised for the employees who moved to Finnair’s new head office, HOTT, comprising approximately 800 employees and their 93 supervisors. The project will continue in these teams in spring 2014, and the Network operating models will also be applied in other areas of the Finnair organisation. The monitoring of the project is based on indicators regularly used by Finnair, complemented by project-specific questions and external reference material (Aalto University CityWorkLife study).
LA9
HEALTH AND SAFETY TOPICS COVERED IN FORMAL AGREEMENTS WITH TRADE UNIONSFinnair’s primary occupational safety forums are the joint occupational health and safety com-mittees of personnel and the employer.
The development of occupational health and safety is based on the occupational health and safety action plan, the focal areas of which are updated annually.
The focal areas in 2013 were:• Assessing the current status of occupational safety and planning the further develop-
ment of operations on the basis of the assessment• Establishing specific operating methods
• An operating model for preventing inappropriate conduct and harassment• Early intervention operating model• Developing and compiling statistics on accidents and hazardous situations and the way
such cases are investigated • Further increasing awareness of 3T (a system for reporting hazardous situations, acci-
dents and damage to property and the environment) • Harmonising processes used in hazard identification and risk assessment procedures as
well as workplace risk assessments.• Developing shared occupational safety practices for workplaces, occupational safety
perspectives of subcontracting chains and supplier networks• Including occupational safety as part of normal supervisory and managerial work (ma-
terials, competence)• Developing occupational safety training, induction training and communications
The current state of occupational safety was evaluated at the unit level. This was done by risk assessment surveys using 3T. Continued common development areas include harmonising occupational health and safety activities between units and the development of consistent sta-tistical practices and reporting. The unit-specific development areas were related to, among other things, the need to revise and update risk assessments, developing supervisors’ occu-pational safety expertise and improving communication with personnel. The actions were incorporated into the action plans for 2013 and 2014. The investigation of accidents and haz-ardous situations was highlighted as one area of development. The aim of the investigations is to identify the causes of accidents and hazardous situations to develop measures to prevent similar accidents in the future and to learn from accidents through the entire line organisa-tion. The operating model created for accident investigations was developed in cooperation with personnel representatives. The investigation model improved the investigation of serious accidents by, among other things, developing reporting and the work of investigation teams. The development of reporting continues.
The development of shared occupational safety rules for workplaces continued in 2013 through cooperation between the various actors at the airport, but also by assessing and supporting the safety efforts of subcontractors and updating the relevant rules and procedures. The key cooperation partner was Finavia and the cooperation took place via a forum that Finnair’s rep-resentatives also participated in.
As an aviation industry employer, Finnair actively develops the occupational safety of its employees in cooperation with representatives of labour market organisations in a transport
FINNAIR ANNUAL REPORT 2013
STRATEGY / CUSTOMERS / OPERATIONS / EMPLOYEES / SOCIETY / FINANCE / GOVERNANCE / GRI 47

and logistics group coordinated by the Centre of Occupational Safety. The working group pro-motes occupational safety, occupational health and safety cooperation and the development of working life in aviation industry workplaces. The themes of the working group in 2013 in-cluded, among other things, making the airport a safe workplace, producing and publishing an aviation industry occupational safety video, developing occupational safety training in the aviation industry and preventing violence in customer service.
• http://ttk.fi/toimialat/kuljetus_ja_logistiikka/ilmailuala
LA11
PROGRAMS FOR SKILLS MANAGEMENT AND LIFELONG LEARNING THAT SUPPORT THE CONTINUED EMPLOYABILITY OF EMPLOYEES AND ASSIST THEM IN MANAGING CAREER ENDINGS
With the help of the Finnair Flight Academy (FFA), Finnair supports the development of per-sonnel skills actively and by diverse means. Finnair Flight Academy provides personnel de-velopment programs in the areas of flight training, safety and service training, and technical services training.
The strategic competence development has been part of the Finnair Group’s HR since the beginning of 2013. In 2013, the Human Resource Development (HRD) team implemented the following strategic competence development projects and training programs, among others:
A. Development of managerial and supervisory work
• Revised Manager Induction for all new supervisors• Runway supervisor training for team supervisors• Takeoff supervisor training for business management• Management team development• Mentoring pilot involving members of the Group’s Executive Board acting as mentors• Project competence: project manager certification, round 1 • Process competence: process training course (online course)• Airline business competence – developing an online course • Partnership management - training• “Tekniikan uusi arki” supervisor training
Supervisors in technical services each participated in a four-day intensive training event with the following themes:
1. Strategy, changes in the operating environment and operating methods, and how to manage them
2. Leadership at Finnair 3. Administrative responsibilities 4. Continuous development of operations 5. Managerial communication
LA10
AVERAGE HOURS OF TRAINING PER YEAR PER EMPLOYEE BY EMPLOYEE CATEGORY
In 2013, Finnair provided training for its employees via the Finnair Aviation Academy amount-ing to 160853 student hours in total. Relative to company’s total number of personnel, this corresponds to 31hours per employee. The figures do not include courses arranged within departments nor training provided by parties outside the company
2013 employees office staff flight personnel management totalStudent hours 41,149 23,531 95,071 1,102 160,853
Persons per personnel group 1,005 1,690 2,382 106 5,183
Average hours per person 40.9 13.9 39.9 10.4 31
2013 2012 2011 2010
Student hours 160,853 145,753 203,899 117,156
Average student hours per person 31 22.9 27.3 15.4
FINNAIR ANNUAL REPORT 2013
STRATEGY / CUSTOMERS / OPERATIONS / EMPLOYEES / SOCIETY / FINANCE / GOVERNANCE / GRI 48

B. Customised personnel development solutions and projects
• Change management and personnel competence development under the AJB (Atlantic Joint Business) project
• “Tekniikan uusi arki” workshops for all technical services personnel. A total of 599 em-ployees participated in three three-hour workshops each. The aim of the workshops is for the group to learn to independently assess and develop its performance and working methods. They encourage work communities to take responsibility and initiative in de-velopment activities, and motivates each employee to generate ideas on how to develop their own work. The themes of the workshops were:
1. Historical development of work 2. Describing and analysing the Finnair Technical Operations operating system 3. Development ideas and their analysis and prioritisation• Global sales skills training – revised sales training• Sales Motivator program for cabin crew• Travel Retail sales training
C. Team development and coaching • Individual coaching programs for key individuals• Network project to provide tools for supervisors and teams to implement changes in the
spirit of responsibility and to discuss rules and procedures when working methods are revised.
D. Professional competence development and induction training
• WeWin induction training for new recruits• The permanent themes include making the airport a safe workplace, developing occu-
pational safety training in the aviation industry, occupational health awareness for su-pervisors, and occupational safety card training.
• Other professional training organised in 2013 included driver training for Ground Cus-tomer Service and Cargo, outstation training, first aid and emergency training, recur-rent training, systems training and cooperation with educational institutes.
Personnel development is strategy-oriented and it utilises, in addition to traditional class-room training, e-learning, job rotation, on the job training, coaching and mentoring. Training and development needs are collected and analysed in the company’s various business units
and subsidiaries as well as at the departmental and individual level as part of the personnel planning process and in conjunction with performance and development reviews.
The new flight training solutions of Finnair Flight Academy (FFA) emphasise the benefits of economical flying. Their aim is to reduce operative costs, improve training models and re-duce emissions. The International Air Transport Association (IATA) has estimated that in-efficient operational models increase operational costs by as much as 2–8 per cent. The Re-verse Green™ training module covers all areas of flying that have an effect on overall economy in relation to skills and attitude. The Fit to Fly™ recurrent training program offers the same elements in annual training sessions. Multifly™, organised in collaboration with Patria Pilot Training, provides newly qualified pilots with extensive skills in economical flying, also in the challenging Nordic conditions. FFA has also continuously developed new online learning solutions that open up new pedagogic opportunities for the implementation of competence throughout the organisation.
The Finnair Aviation Academy, founded in 1964, is a special vocational educational estab-lishment maintained by Finnair Plc, which operates as a special educational establishment under the Act on Vocational Adult Education (631/1998). Its task is to arrange further voca-tional training leading to a vocational or special vocational qualification as well as other fur-ther vocational training required for the practice of Finnair Plc’s and its subsidiaries’ opera-tions (Further Vocational Training Arrangement Permit 551/530/2006, 13 December 2006). As a privately-owned educational establishment, the Aviation Academy funds its operations in accordance with government aid practices and it is a member of Business Education Estab-lishments ELO (Elinkeinoelämän oppilaitokset Elo ry).
FINNAIR ANNUAL REPORT 2013
STRATEGY / CUSTOMERS / OPERATIONS / EMPLOYEES / SOCIETY / FINANCE / GOVERNANCE / GRI 49

LA13
COMPOSITION OF GOVERNANCE BODIES AND BREAKDOWN OF EMPLOYEES PER CATEGORY BY GENDER, AGE GROUP, MINORITY GROUP MEMBERSHIP AND OTHER INDICATORS OF DIVERSITYAt the end of 2013, 55 per cent of Finnair’s personnel were women and 45 per cent were men. Three of the seven members of Finnair’s Board of Directors are women.
The average age of Finnair’s personnel in 2013 was 44 years. Of the personnel, 30 per cent were over 50 years of age, while four per cent were under 30 years of age. The employees’ av-erage number of years in service was 17. Employees who have worked for Finnair for over 20 years account for 40 per cent of personnel, while 10 per cent have worked for Finnair for over 30 years. Finnair does not maintain statistics on ethnic minorities.
All personnelGender structure %
Women (%) 55
Men (%) 45
Age structure years
Under 30 years old 5
30-50-year-olds 65
Over 50 years old 30
Senior management (assistant directors, department directors, Executive Board) Gender structure %
Women (%) 31
Men (%) 69
Age structure years
Under 30 years old 1
30-50-year-olds 68
Over 50 years old 31
FINNAIR ANNUAL REPORT 2013
STRATEGY / CUSTOMERS / OPERATIONS / EMPLOYEES / SOCIETY / FINANCE / GOVERNANCE / GRI 50

Finnair in the worldAviation is such an integral part of modern life that it’s too diffi-cult to contemplate how the world would be without it. Unravel-ling the tapestry of international trade, communications and culture woven by commercial aviation, both passenger and cargo, is both impossible. But it’s worth taking a closer look at the patterns in that tapestry to take stock of its significance and be aware of our own place in society.
Connecting FinnsLike any business, aviation has its positive and negative external impacts. The positives are easy to list, if not always easy to quantify. Finnair, like many airlines, recognises its own responsibility to iden-tify and mitigate the most obvious negatives, including noise pollu-tion and greenhouse gas emissions. But we also need to understand the wider picture of how our operations affect the communities where we operate – and to act accordingly.
Finnair’s home country clearly benefits from the infrastructure value of connections between cities and markets, internally and externally. Finland is a small country in terms of population but relatively big in European terms. Residents of towns and cities in northern Finland have grown accustomed to air connections with the capital region a thousand kilometres or so to the south. These domestic connections
GRI indicators IN THIS SECTION:
HR7, SO1, SO5.
Society
MegatrendsAFFECTING OPERATIONS:Shift in economic and geopolitical power, Technological development, Sustainability.
StrategicPRIORITIES:
Profitable growth, Cost competitiveness.
FINNAIR ANNUAL REPORT 2013
STRATEGY / CUSTOMERS / OPERATIONS / EMPLOYEES / SOCIETY / FINANCE / GOVERNANCE / GRI 51

were pioneered by Finnair but are now also offered by other opera-tors at fares comparable to – and sometimes even lower than – the state railways. Only commercial considerations determine where Finnair flies, however, and as the airline has grown, its focus and competence has largely shifted to connecting Helsinki to dozens of major economic centres in Europe and Asia.
As a result of the Asian strategy developed by Finnair and Finavia (the operator of Helsinki Airport) the Helsinki capital region, with a population of just over one million, is served by an airport that is significantly larger and more internationally connected than most airports for comparably-sized cities in the wider region. In 2013, for instance, more than 15 million passengers passed through Helsinki Airport while the figure for Gothenburg in Sweden was about 5 million and for Vilnius in Lithuania, 2.5 million. This difference is thanks to transfer traffic, which makes the majority of Helsinki’s direct connections commercially possible.
Northern lightOn the face of it, Helsinki’s northerly location on the geographical fringe of Europe seems like a disadvantage. But the Asian strategy has converted Finnish remoteness into an advantage by proving Helsinki’s credentials as a highly credible, fast and uncongested hub for transfers between Europe and Asia.
In turn, this scenario has opened up opportunities for Finnish companies, facilitating more exports to more foreign markets, cutting long-distance transport costs and attracting more high-ly-skilled workers to the capital metropolitan area from other EU countries. There is a direct connection between the rise of aviation in Finland, the improved connectivity that it brings and a boost in
annual GDP that can be measured in billions of euros. According to a 2012 report by Oxford Economics, aviation accounts for nearly 4 per cent of Finland’s GDP.
This local scenario fits in with the global picture described by IATA’s estimate that $6.4 trillion worth of goods travel by air – or 35 per cent of all world trade by value. Moreover, Finnair has played a direct role in making it easier for Asians from Singapore to Delhi and from Hong Kong to Tokyo to travel to more than 40 European countries. Boosted by the 80-plus weekly departures from Helsinki to Asian destinations, the great cities of Asia are likewise within easy reach for Finnish and northern European travellers.
Finland’s example shows how aviation plays a key and leading role in a modern, advanced economy. For a small country and in a global context, Finland’s economic, technological and cultural develop-ment has been exceptionally agile and the connectivity that comes with aviation can take a share of the credit for this. Commercially, Finnish businesses have been able to keep pace with increased globalisation because of the fast supply chains and sophisticated logistics made possible by frequent and reliable air services.
Looking outwardFounded in 1923, just six years after Finland gained independence, Finnair has a history that runs in parallel to and is closely linked with that of its home country. While its business landscape has become furiously competitive, the Finnair brand maintains an emotional connection with the Finnish population and society. While Finland remains Finnair’s largest single market, the majority of its sales are secured outside the country. As the company grows it therefore must be ever more international and outward looking.
FINNAIR ANNUAL REPORT 2013
STRATEGY / CUSTOMERS / OPERATIONS / EMPLOYEES / SOCIETY / FINANCE / GOVERNANCE / GRI 52

Finnair’s confidence in its ability to grow and achieve its strategic goals is based on the relationships built up between Finnair and its numerous stakeholders, from customers and employees to regu-lators and other authorities throughout its route network. As the first European airline to fly nonstop to destinations such as Tokyo, Beijing, Chongqing and Xi’an, the airline believes in nurturing and sustaining positive long-term relationships with the communi-ties it serves. Good relations and proactive openness – particularly on issues relating to safety and the environment – are essential for Finnair to retain its “license to operate.”
Climate change: To measure is to knowA major component of Finnair’s stakeholder engagement activities is its participation in the Carbon Disclosure Project, the world’s only global environmental disclosure system. Finnair is a leader in the quality of climate change data submitted to the global marketplace through the CDP, a status which was confirmed in the CDP Nordic 260 Climate Change Report 2013. The report tracks how the world’s
largest listed companies act in response to climate change. For the 2nd consecutive year, in 2013 Finnair achieved a position in CDP’s Nordic 260 Climate Disclosure Leadership Index (CDLI). Compiled by First Carbon Solutions on behalf of CDP, this index highlights companies listed on the Nordic stock exchanges that have displayed a strong approach to the disclosure of climate change information. Finnair’s score in 2013 was 96, improving on its 2012 score of 92. Companies are scored out of 100 on the completeness and standard of their submissions, completed at the request of 722 investors representing $87 trillion in assets.
Airline customers in an increasingly discerning and well-informed global society demand transparency and concrete action of this kind. They prove that a demonstrable policy of corporate responsibility is an advantage for the whole spectrum of stakeholders, from share-holders who seek greater profitability to local communities that seek affluence from a global economy with the lowest possible cost to the environment.
Good relations and proactive openness with stakeholders are essential for our license to operate.
FINNAIR ANNUAL REPORT 2013
STRATEGY / CUSTOMERS / OPERATIONS / EMPLOYEES / SOCIETY / FINANCE / GOVERNANCE / GRI 53

Changes for goodFinnair also demonstrates its commitment to corporate responsi-bility in philanthropic actions that are not immediately central to its business operations but no less significant. The most conspicuous example has been the annual cooperation with UNICEF in the form of the Christmas Change for Good campaign, inviting passengers to contribute change of any currency using envelopes distributed on aircraft. Finnair Plus members have also been able to contribute Plus Points to the campaign all year round.
By the end of 2013, Finnair’s various Change for Good campaigns had collected about 1.1 million euros since 1994, benefitting a number of good causes from sanitation and hygiene for the chil-dren of Bihar in India to the Schools for Asia program in the latest campaign. Vietnam, Finnair’s latest Asian destination country, is one of the target countries for Schools for Asia, supporting work to improve the education prospects of children in remote loca-tions and belonging to ethnic minority groups. Cooperation with UNICEF is set to continue in the form of a new and innovative “pay per booking” option, devised with travel booking engine provider Amadeus and inviting contributions from customers as they book their tickets online.
Through Plus Point donations, Finnair and its customers also support the Finnish Association for Nature Conservation’s reforesta-tion projects in Madagascar, the Pink Ribbon breast cancer research campaign, and the Association of Friends of the University Chil-dren’s Hospital in Helsinki.
The emphasis in all these cooperation activities with NGOs is always on partnership. Finnair believes in more than just philanthropy, but in working together to create social and economic value. That is the basis for building enduring, positive relationships.
A global solution to climate changeFinnair recognises its responsibility to account for and reduce its carbon footprint, and for several years now Finnair has voiced its support for a global market-based measure for offsetting greenhouse gas emissions that would complement the industry’s technological, operational and infrastructural efforts to reduce emissions. A market-based measure is essential to IATA’s goal of achieving carbon-neutral growth in the aviation sector and ultimately in the interest of all countries and airlines. Such a measure has proved difficult to agree on, however, as the diverse nations with diverse interests in the UN’s ICAO – the global governing body for civil aviation – have been unable to find common ground.
This finally changed in September 2013 during ICAO’s 38th Assembly, when the organisation reached a landmark agreement committing member states to developing a global market-based measure by 2020. In the meantime, the agreement also calls for member states to avoid creating or implementing their own emissions offsetting schemes without multilateral agreement with the states affected by such schemes.
Prior to the agreement, the EU had begun applying its Emissions Trading Scheme to European aviation, while “stopping the clock” on applying the scheme to foreign operators taking off or landing in the EU as well, at least while work at ICAO was underway. It is not yet clear now whether the EU intends to ultimately apply its offsetting scheme to all airlines using its airspace, only to European carriers operating routes entirely within Europe, or indeed cease applying the scheme to aviation entirely. The prospect of the EU carrying out its own offsetting scheme on foreign carriers has prompted sharp opposition in other countries, particularly China, Russia, India and the United States. In the aviation industry’s view, it will also likely distort competition and promote “carbon leakage” whereby carriers fly longer (and thus more CO2-emitting) routes in order to avoid EU airspace.
As ICAO now proceeds with work to design and eventually implement the global market-based measure to control emissions, Finnair hopes that consensus can be found within Europe on action that best supports that global process.
FINNAIR ANNUAL REPORT 2013
STRATEGY / CUSTOMERS / OPERATIONS / EMPLOYEES / SOCIETY / FINANCE / GOVERNANCE / GRI 54

Subjects Channels
Customers The travel experience, customer service issues, product quality, on time performance, emissions and noise reduction, safety, recycling, responsible tourism, charity and corporate responsibility projects via Finnair Plus.
Surveys, research, written feedback, Finnair websites, social media, customer events, Blue Wings magazine, customer service encounters at every stage of the journey.
Personnel Occupational health and wellbeing at work, target setting, Code of Conduct and ethical issues, changes to improve productivity, increasing trust, reducing environmental impact on the job, career assistance for employees made redundant.
Personnel magazine, intranet, internal blogs, theme weeks, personnel events, 4D Wellbeing At Work survey, occupational health unit, performance dialogue sessions, discussions with labour organisations, Career Gate.
Shareholders and investors
Market environment and competitive landscape, company’s operations, goals, strategy and financial position.
Stock exchange bulletins of periodic and on-going information regarding financial development including interim reports, financial statements, report of the Board of Directors and Corporate Governance Statement; other, non-periodic stock exchange bulletins; Annual General Meeting; investor, analyst and media meetings and events; corporate website; Carbon Disclosure Project.
Aviation sector Safety, emissions reduction, emissions trading, air traffic management, biofuel supply chain development, sustainable tourism, economic impact of sector.
Membership in IATA and AEA; membership in STLN for sustainable tourism; oneworld alliance member; cooperation with Finavia and other airport operators; sector seminars and working groups; manufacturers.
Authorities and government
Safety, emissions trading, air traffic management, supply chain responsibility, economic contributions of aviation, impact of operations on environment and noise, traffic continuity, biofuels, employee relations.
Dialogue with Finnish and foreign authorities and governments; events and other cooperation with Finnish Consumer Agency, Flight Safety Authority (TraFi), embassies and other relevant Finnish and foreign actors.
NGOs and companies with sustainability approach
Greenhouse gas emissions reduction, environmental remediation, public health measures, disaster relief, wildlife protection, common interest projects for sustainability and development cooperation, supply chain responsibility.
Cooperation with Finnish Association for Nature Conservation, Baltic Sea Action Group, UNICEF, Finnish Red Cross and other NGOs. Member of the Carbon Disclosure Project. Partnerships with sustainable design firms such as Tikau, U6 and GlobeHope.
Suppliers Cooperation efforts to reduce emissions and other environmental impacts, monitoring of responsibility everywhere in the value chain.
Contractual cooperation, Finnair procurement guidelines and Supplier Code of Conduct, extranet.
Media Company strategy and business, emissions reduction, personnel relations, financial sustainability, economic contributions of aviation, ethics, charitable cooperation projects, trends in traffic, biofuels, emission trading, noise, impact of aviation on local economy and mobility.
Press releases, press conferences, visits by reporters, press trips, interviews, websites, media desk, social media, Blue Wings magazine.
General public Customer service, product quality, labour relations, economic contributions of aviation, ethics, emissions reduction, presence in local economies, charitable cooperation projects, corporate citizenship.
Communications via media, websites, e-mail and lectures; social media including blogs, Facebook, Twitter and Sina Weibo.
FINNAIR ANNUAL REPORT 2013
STRATEGY / CUSTOMERS / OPERATIONS / EMPLOYEES / SOCIETY / FINANCE / GOVERNANCE / GRI 55
How Finnair communicates and cooperates with stakeholders
STAKEHOLDER ENGAGEMENT

HR7
OPERATIONS IDENTIFIED AS HAVING SIGNIFICANT RISK FOR INCIDENTS OF FORCED OR COMPULSORY LABOUR, AND MEASURES TAKEN TO CONTRIBUTE TO THE ELIMINATION OF FORCED OR COMPULSORY LABOURFinnair does not approve of the use of forced labour in any part of its value chain. With respect to the aviation industry, the company has not identified any risk for incidents of forced labour. This is a consequence both of the general nature of the industry and the strict official regulation and supervision of the industry. Nevertheless, the aviation industry and Finnair’s operations do interact with global sectors in which the use of forced labour cannot be excluded. The tex-tile industry is one such sector. Finnair’s uniforms and workwear are acquired from suppliers that have addressed ethical issues in their own operations.
SO1
NATURE, SCOPE AND EFFECTIVENESS OF ANY PROGRAMS AND PRACTICES THAT ASSESS AND MANAGE THE IMPACTS OF OPERATIONS ON COMMUNITIES, INCLUDING ENTERING, OPERATING AND EXITINGAs a company, Finnair is not deemed to have a significant direct impact on local communities outside Finland. For this reason, no programs relating to the assessment and management of the impacts of operations on local communities have been considered necessary.
However, Finnair recognises that the tourism industry has significant impacts on local com-munities around the world. Of Finnair’s subsidiaries, the tour operator Aurinkomatkat-Sun-tours and the travel agencies Area Oy and Finland Travel Bureau Ltd, in particular, occupy a special position in respect of their opportunities for influence in this field. In 2010, Finnair joined the international Sustainable Travel Leadership Network, which promotes sustaina-ble tourism. Finnair and the tour operators and travel agencies belonging to it have signed the Helsinki Declaration, which aims to promote sustainable tourism.
Aurinkomatkat-Suntours has also selected local recipients of support at various destinations to give customers a concrete opportunity to support local residents. This policy has been suc-cessful in providing support to those in need.
Mayan child project
Aurinkomatkat-Suntours participates in the Juntos Calentermos el Invierno project together with dolphin excursion organiser Delphinus and a local representative, Hotelbeds Playa del Carmen, in Mexico.
The purpose of the project is to collect toys and warm clothing in partnership with the local DIF aid organisation for poor Mayan children living in palm leaf huts. Temperatures in the region can be as low as 6 degrees Celsius. Aurinkomatkat-Suntours communicates informa-tion on the project to customers prior to their travel date to give them the opportunity to pack warm clothing or school supplies to give to the local children.
Phuket children project
Aurinkomatkat-Suntours participates in a project to help local children in Phuket in part-nership with its long-term partner, the English-Thai company Siam Safari Nature Tours. The project helps children from low-income rural families in schools and orphanages on the out-skirts of Phuket. Customers are informed of the project before their travel date to give them the opportunity to pack clean used clothing, toys and notebooks suitable for children aged 4-16.
Helping poor children in Langkawi Aurinkomatkat-Suntours supports a local charitable organisation in Langkawi. The organ-isation was established to help in the daily lives of local low-income families. The efforts to improve their daily living conditions include food donations, helping families with children’s school fees and training women to earn additional income through activities such as making textiles and handicrafts. Interested customers are invited to participate by bringing clothing and toys for local children. Multivitamin tablets for children are also much needed. On loca-tion, Aurinkomatkat-Suntours guides sell small cookbooks featuring recipes from this mul-ticultural country. Customers can also make a small cash donation at the destination to help local families in their daily lives. Further information is available at www.langkawicharity.com
LINKS (IN FINNISH):• http://www.aurinkomatkat.fi/hyva-tietaa/hotellit/hotelliluokitus• http://www.smal.fi/index.php?402
(Helsinki Declaration)• http://www.sustainabletravelinternational.org/
(an international cooperation network for sustainable travel in which Finnair is involved)
SOCIAL INDICATORS
FINNAIR ANNUAL REPORT 2013
STRATEGY / CUSTOMERS / OPERATIONS / EMPLOYEES / SOCIETY / FINANCE / GOVERNANCE / GRI 56

SO5
PUBLIC POLICY POSITIONS AND PARTICIPATION IN PUBLIC POLICY DEVELOPMENT AND LOBBYINGFinnair monitors the political operating environment of the aviation industry and openly par-ticipates in discussion on industry regulation. The objectives of Finnair’s advocacy work are to anticipate regulation that applies to the company, as well as to influence such regulations in a fair and transparent manner. In order to optimally allocate our resources, our advocacy work is focused on promoting our most important goals at the national and international levels.
Finnair’s key societal stakeholders are ministries of transportation and civil aviation authori-ties. Finnair representatives participate in legislative and industry-related hearings in the Finn-ish Parliament and in government ministries and also otherwise meet with policymakers to discuss regulation that affects its business.
Finnair’s most important advocacy targets are regulations that have an impact on traffic rights, cost factors and international trade relationships.
Restricted air traffic rights are defined by air transport agreements between countries or groups of countries. As Finnair aims to provide its customers with the most direct and com-prehensive routes between Europe and key Asian destinations, the company cooperates with the authorities to secure rights to scheduled flights in Southeast Asia and overflight rights in Russia.
Finnair’s advocacy work related to cost factors is primarily focused on labour market pol-icy, consumer law and environmental policy. EU emissions trading, which started in 2012, extends to air traffic and is a significant issue for Finnair, which operates in and from the EU area. Finnair engages in advocacy work to achieve a global emissions trading agreement for air transport instead of regional systems.
Finnair cooperates with various associations and chambers of commerce in the majority of its advocacy work pertaining to regulations on civil aviation and economic activity. Finnair is actively involved not only in international aviation industry organisations such as AEA and IATA, but also the Confederation of Finnish Industries, its industry organisations and several chambers of commerce in key operating countries.
Finnair is commited to UN initiatives2013 Finnair joined United Nations Global Compact, a corporate responsibility initiative that comprises more than 8,000 businesses around the world. The project was proposed by Kofi Annan, then Secretary General of the UN, in 1999 and launched the following year. Partici-pating businesses agree to make human rights, fair labour standards, environmental respon-sibility and anti-corruption core parts of their operations, and communicate with stakehold-ers on their efforts to implement the Global Compact’s ten principles.
In 2011 Finnair has also signed the United Nations Women’s Empowerment Principles. The Principles gives guidance on the empowerment of women in the workplace, marketplace and community.
The Women’s Empowerment Principles are the result of a collaboration between the Unit-ed Nations Development Fund for Women (UNIFEM, part of UN Women) and the United Nations Global Compact.
The Principles emphasize corporates to promote gender equality and women’s empower-ment. The Women’s Empowerment Principles seek to point the way to best practice by elab-orating the gender dimension of good corporate citizenship, the UN Global Compact, and business’ role in sustainable development.
FINNAIR ANNUAL REPORT 2013
STRATEGY / CUSTOMERS / OPERATIONS / EMPLOYEES / SOCIETY / FINANCE / GOVERNANCE / GRI 57

GRI indicators IN THIS SECTION:
EC1, EC2, EC3, EC4, EC6, EC9
MegatrendsAFFECTING OPERATIONS:Shift in economic and geopolitical power, Technological development, Sustainability
StrategicPRIORITIES:
Profitable growth, Cost competitiveness
FinanceFinnair’s objective is to create sustainable economic added value by producing flight services profitably, cost-competitively and in harmony with the needs of the environment and society. Finnair’s financial performance 2013 is described in the Board of Directors Report, Financial Statements and Financial indicators available in this section. Economic responsibility is discussed under manage-ment principles in the Governance section of this report.
FINNAIR ANNUAL REPORT 2013
STRATEGY / CUSTOMERS / OPERATIONS / EMPLOYEES / SOCIETY / FINANCE / GOVERNANCE / GRI 58

THE REPORT OF THE BOARD OF DIRECTORSBusiness Environment Global air traffic is currently undergoing a structural change, the typical characteristics of which are market liberalisation, increasing competition, overcapacity, consolidation, allianc-es and specialisation. European network carriers, Finnair included, continued to implement structural change and cost-reduction programs in 2013 to improve their competitiveness in the prevailing tight competitive situation. Capacity growth in the market was conservative. Various partnerships increased, especially in international long-haul traffic.
The demand for passenger traffic in Europe grew in 2013 despite many European countries still being in recession. Combined with the conservative stance airlines have taken towards increasing their capacity, this led to improved load factors. The weakness of the Finnish econ-omy was reflected in home market demand, especially in the second half of the year. Demand grew in passenger traffic between Asia and Europe but, at the same time, competition in this market increased as competitors launched new routes, particularly to Southeast Asia. Meas-ured in passenger volume, the market for flights between Helsinki and Finnair’s European des-tinations grew by 4.2 per cent, while the market between Finnair’s Asian and European des-tinations grew by 1.8 per cent.* Finnair was successful in increasing its market share in both traffic areas.* Unit revenue was under pressure in passenger traffic.
The demand for leisure traffic developed positively in the first half of 2013 as industry oper-ators adjusted their package tour supply to better match demand. However, the market took a turn in the summer as consumers’ uncertainty regarding their own economic situation began to slow down sales and decrease market prices. All industry operators cancelled their winter season tours to Egypt due to unrest in the country, which was reflected in the volumes and revenues for the fourth quarter.
Cargo traffic continued to suffer from overcapacity and weak demand in 2013, which put average yields in traffic between Europe, the Nordic region and Asia under substantial pres-sure. High fuel prices also had a negative effect on the result for cargo traffic. However, there were early signs of a slight recovery in demand late in the year, especially in Asia.
The price of the largest individual cost factor of airlines, i.e. jet fuel, has stabilised at a high level, and the increase in fuel costs levelled out in 2013. The US dollar is a significant expense currency in Finnair’s operations, while the Japanese yen is a significant income currency. The dollar-euro exchange rate remained fairly stable in 2013, but the yen depreciated substantially
against the euro as a result of stimulus measures implemented by the Bank of Japan.
Strategy implementation and partnershipsFinnair’s vision is to be the number one airline in the Nordic region and the most desired op-tion for travel between Asia and Europe. In addition, its aim is to double its revenue from Asian traffic by 2020, using 2010 as the point of reference.
Finnair continued to implement its growth strategy in 2013, launching new summer season routes in June to Xi’an in China and Hanoi in Vietnam. This increased the number of Finnair’s Asian destinations to 13. The sales of the new routes were in line with expectations, and the company will continue flying to both cities in summer 2014.
At the beginning of July, Finnair increased its cooperation with fellow oneworld alliance members by joining the transatlantic joint business founded by American Airlines, British Airways and Iberia. The cooperation has started well and the first months of the transatlantic joint business were in line with expectations. In October, competition authorities approved the company’s entry into the joint business established by Japan Airlines and British Airways for flights between Japan and Europe. Japan is one of Finnair’s most important markets, and the joint business is expected to enter into effect in the first half of 2014.
The airlines participating in the joint businesses cooperate commercially by sharing revenue and by coordinating capacity, flight schedules and fares. The aim of the participating airlines is to improve the efficiency of their operations, expand their networks and provide the public travelling between Europe and Japan with improved intercontinental connections.
Progress of the structural change and cost-reduction program Finnair continued the implementation of its structural change and cost-reduction programs in 2013. During the first half of the year, the focus was on seeking cost reductions under the first program commenced in August 2011. The cost-reduction target of 140 million euros set for that program was achieved by the end of June 2013, six months ahead of schedule. Cost reductions have been systematically sought in several different categories, including fleet, avi-ation service, catering, sales, distribution and personnel costs.
The second cost-reduction program, with a target of 60 million euros, was announced in Oc-tober 2012. In August 2013, Finnair stated that, as part of this cost-reduction program, it aims to reduce crew costs by approximately 35 million euros and technical services and customer service personnel costs by approximately 8 million euros. In the autumn, Finnair continued negotiations with personnel and their trade union representatives regarding the solutions and
* Finnair’s estimate. The estimate is based on travel agencies’ MIDT data and Finnair’s estimates of airlines’ own sales through their own sales channels, such as websites.
FINNAIR ANNUAL REPORT 2013
STRATEGY / CUSTOMERS / OPERATIONS / EMPLOYEES / SOCIETY / FINANCE / GOVERNANCE / GRI 59

schedules for achieving these cost reduction targets. During the negotiations on new collec-tive labour agreements, the trade unions representing Finnair’s cabin crew, technical staff and ground handling personnel issued strike warnings. To prepare for the potential strikes and look after customers, Finnair had to significantly restrict its traffic in mid-November. Even if the strikes were avoided in the final stages of negotiations, the strike threat and later the sup-port strike threats issued by labour unions caused uncertainty and harm to our passengers, and resulted in a considerable loss of turnover as well as additional costs from, for example, the rerouting of passengers.
The strikes were cancelled on 15 November 2013, as Finnair’s employer union the Associ-ation of Support Service Industries (PALTA) reached an agreement with the Finnish Cabin Crew Union (SLSY) and The Finnish Aviation Union (IAU) on a new collective labour agree-ment in line with the national framework agreement, known as the Finnish Employment and Growth Pact, and also agreed on the schedule and processes of separate, company-specific ne-gotiations related to Finnair’s cost reductions. According to the agreement, Finnair and SLSY will negotiate on reaching the cost reductions necessary for Finnair by 28 April 2014. If cost reduction targets are met, cabin personnel will be protected from layoffs for two years. Corre-sponding negotiations with the IAU to reach a company-specific labour agreement for tech-nical staff have progressed quite far, and these negotiations will continue. In addition, Finnair and the IAU will continue company-specific negotiations on labour agreements for ground handling personnel. In December, Finnair and the Finnish Air Line Pilots’ Association (SLL) agreed on a new collective labour agreement in line with the national framework agreement, and also agreed that they will negotiate on reaching the cost reductions necessary for Finnair by 13 June 2014.
Finnair’s objective in the negotiations is primarily to achieve a level of costs and wages that corresponds with market wages and costs in the industry, primarily by implementing changes to wage structures and working hours. Achieving the targets of the cost-reduction program is essential for improving the company’s competitiveness, as high fuel prices, cost reduction measures taken by competitors, intensified competition and fleet investments in the coming years require a substantial improvement in profitability. The long-term return objective set for the company by Finnair’s Board of Directors is an operating profit margin of six per cent.
Finnair continues to pursue savings in all of the first cost-reduction program’s categories. As of the third quarter of 2013, Finnair has monitored the progress of its two cost-reduction programs combined. The combined total target is to reduce annual costs permanently by 200 million euros by the end of 2014. The point of reference for the cost reduction target is the company’s unit cost level in 2010. By the end of 2013, Finnair had achieved a total cost re-
duction of 155 million euros, which was reflected in decreased air traffic unit costs in 2013. At the same time, the company has been able to move a substantial share of fixed costs to vol-ume-based variable costs.
Financial performance in 2013Finnair’s turnover in 2013 declined by two per cent from 2012, totalling 2,400.3 million euros (2,449.4). Capacity grew by 2.6 per cent year-on-year. The main factor slowing down turnover growth was the fall in euro-denominated revenue due to the depreciation of the Japanese yen, but in the second half of the year the weaker-than-expected development of cargo and leisure traffic and lost turnover resulting from the strike threat also contributed to the decrease in turnover for the full year. Operational costs excluding fuel amounted to 1,736.6 million euros (1,758.4). Fuel costs, including hedging and costs incurred from emissions trading, increased slightly year-on-year and totalled 689.9 million euros (670.3). Personnel costs decreased by 10.6 per cent as a result of the implementation of structural changes, to 383.9 million euros (429.2), but part of the costs are now seen in the form of higher costs for outsourced catering and maintenance services. The euro-denominated operational costs were largely unchanged from the comparison year at 2,426.5 million euros (2,428.7), despite the increase in capacity. The operational result weakened substantially year-on-year and was -4.8 million euros (43.2).
131211
CASK ex. fuel development since 2010*
%
0
-3
-6
-9
-12
-15
* 2010 figure adjusted for ash cloud and industrial actions.
-12.3
09 10 11 12 13
Turnover
3,000
2,500
2,000
1,500
1,000
500
0
€ million
2,400.3
FINNAIR ANNUAL REPORT 2013
STRATEGY / CUSTOMERS / OPERATIONS / EMPLOYEES / SOCIETY / FINANCE / GOVERNANCE / GRI 60

Finnair’s income statement includes the change in the fair value of derivatives and in the val-ue of foreign currency denominated fleet maintenance reserves that took place during the pe-riod under review but will fall due later. This is an unrealised valuation result based on IFRS, where the result has no cash flow effect and which is not included in the operational result. The change in the fair value of derivatives and in the value of foreign currency denominated fleet maintenance reserves amounted to 21.7 million euros (-4.0). Non-recurring items stood at -26.8 million euros (-27.6), with the majority being associated with the result of the employee consultations in technical services concluded in June. The non-recurring costs in 2012 were also primarily related to structural changes in technical services.
The operating result was -8.8 million euros (33.8). In April, Finnair sold its entire holding of shares in Norwegian Air Shuttle ASA and recorded a capital gain of 34 million euros as fi-nancial income. The result before taxes for 2013 was 10.1 million euros (14.8). The result after taxes was 11.0 million euros (10.5).
Unit revenue per available seat kilometre (RASK) declined, primarily due to the depreciation of the Japanese yen, by 3.8 per cent compared to 2012 and amounted to 6.24 euro cents (6.49). Excluding the effect of exchange rate fluctuations, passenger unit revenue declined by 0.7 per cent year-on-year. Unit cost per available seat kilometre (CASK) decreased by 0.1 per cent and amounted to 6.57 euro cents (6.58). Unit cost excluding fuel (CASK excl. fuel) decreased by one per cent to 4.46 euro cents (4.50) as a result of good progress in the cost reduction program.
Balance sheet on 31 December 2013The Group’s balance sheet totalled 2,200.6 million euros at the end of 2013 (2,231.3 million euros on 31 December 2012). Shareholders’ equity totalled 691.8 million euros (775.3), which is 5.41 euros per share (6.06). Shareholders’ equity decreased in 2013 primarily due to the re-payment of the outstanding share of the hybrid bond issued in 2009.
Shareholders’ equity includes a fair value reserve which is affected by changes in the fair val-
Distribution of operating expenses € 2,426.5 million%
Fuel 28.4% Personnel 15.8% Other costs 9.0% Traffic charges 9.2% Ground handling and catering 10.6%
Maintenance 6.6% Depreciation 5.0% Other rental payments 6.3% Tour operations 3.7% Sales and marketing 3.0% Aircraft leasing 2.4%
%
EUR USD JPY
Distribution of revenue by currency
Distribution of costs by currency
100
80
60
40
20
0
CNY SEK Other
Distribution of revenue and costs by currency in 2013
09 10 11 12 13
Operational result, EBIT*
50
0
-50
-100
-150
-200
-250
2
0.0
-2
-4
-6
-8
-10
% of turnover * Operating result excluding changes in the fair values of derivates and in the value of foreign currency denominated fleet maintenance reserves, non-recurring items and capital gains.
€ million %
-4.8
-0.2
09 10 11 12 13
Result before taxes
50
0
-50
-100
-150
€ million
10.1
09 10 11 12 13
Operational result, EBIT*
50
0
-50
-100
-150
-200
-250
2
0.0
-2
-4
-6
-8
-10
% of turnover * Operating result excluding changes in the fair values of derivates and in the value of foreign currency denominated fleet maintenance reserves, non-recurring items and capital gains.
€ million %
-4.8
-0.2
09 10 11 12 13
Result before taxes
50
0
-50
-100
-150
€ million
10.1
FINNAIR ANNUAL REPORT 2013
STRATEGY / CUSTOMERS / OPERATIONS / EMPLOYEES / SOCIETY / FINANCE / GOVERNANCE / GRI 61

ues of oil and currency derivatives used for hedging as well as actuarial gains and losses relat-ed to defined benefit plans according to IAS 19. The value of the item at the end of 2013 was -14.7 million euros (0.3) after deferred taxes, and it is mainly comprised of actuarial losses.
Cash flow and financial position in 2013Finnair has a strong financial position, which supports business development and future in-vestments. In 2013, net cash flow from operating activities amounted to 107.0 million euros (154.7) and net cash flow from investments totalled 16.1 million euros (-54.2).
The equity ratio was 32.0 per cent (35.4) and gearing was 19.5 per cent (18.0). The adjust-ed gearing was 77.6 per cent (77.8). At the end of the period under review, interest-bearing debt amounted to 593.0 million euros (569.0) and interest-bearing net debt stood at 134.2 million euros (138.4).
The company’s liquidity remained strong in 2013. The Group’s short term cash and cash equivalents in balance sheet amounted to 458.8 million euros (430.5) at the end of the period. In addition to the cash funds on the balance sheet, the Group has the option of re-borrowing employment pension fund reserves worth approximately 430 million euros from its employ-ment pension insurance company. Drawing these reserves requires a bank guarantee. The Group’s entirely unused 200 million euro syndicated credit agreement, which was intended as reserve funding, matured at the end of June. Finnair negotiated a new 180 million euro syn-dicated credit agreement that will mature in July 2016. The limit is currently unused.
In October, Finnair redeemed the outstanding share of 52.4 million euros of the hybrid bond issued in 2009. The original size of the hybrid bond issued in 2009 was 120 million euros and it was partly redeemed in November 2012. The size of the new hybrid loan issued by Finnair in November 2012 is 120 million euros. In August, Finnair issued a 150 million euro bond that will mature in five years. The bond pays an annual coupon of five per cent, and it was listed on NASDAQ OMX Helsinki Ltd on 2 September 2013.
Advance payments related to fixed asset investments totalled 66.0 million euros (32.7).At the end of the year, 44.5 million euros of Finnair’s short-term commercial paper program
totalling 200 million euros were in use. Net cash flow from financing amounted to -47.4 mil-lion euros (-98.9). Financial expenses amounted to 19.7 million euros (-25.5) and financial in-come to 42.6 million euros (7.9). Financial income includes a capital gain of 34 million euros recorded on the sale of shares in Norwegian Air Shuttle ASA.
Aircraft sale and leaseback agreementsFinnair’s policy is to own approximately half of the fleet it operates. Various sources and in-struments are used for fleet financing to ensure the lowest possible financing costs and the best possible operational flexibility and continuity.
In the second half of 2013, Finnair made sale and leaseback agreements on five new A321 Sharklet aircraft, two in September and three in December. In December, Finnair also signed memoranda of understanding on the sale and leaseback of four Finnair-owned Airbus 330 aircraft and two new Airbus 350 aircraft.
The agreements concerning new aircraft are expected to be concluded at the time of deliv-ery in 2014–2015, while the agreements concerning A330 aircraft are expected to be conclud-ed in the first half of 2014. The financing arrangements are part of the fleet renewal program, which involves transitioning from the current Airbus 340 and 330 fleet to the next-generation Airbus 350 aircraft. Arrangements associated with the fleet renewal program as a whole are not estimated to have a substantial effect on the company’s result for 2014 and 2015.
Capital expenditureIn 2013, capital expenditure, excluding advance payments, totalled 42.0 million euros (41.4) and was primarily related to one spare engine and the company’s fleet. Capital expenditure for the full year 2014, including advance payments related to fixed assets, is estimated at approx-imately 133 million euros, with investments in the fleet representing a majority of this total.
The current state of the credit market and Finnair’s good debt capacity enables the financ-ing of future fixed-asset investments on competitive terms. The company has 36 unencum-
FINNAIR ANNUAL REPORT 2013
STRATEGY / CUSTOMERS / OPERATIONS / EMPLOYEES / SOCIETY / FINANCE / GOVERNANCE / GRI 62

bered aircraft, the balance sheet value of which corresponds to approximately 47 per cent of the value of the entire fleet of 1.1 billion euros. The balance sheet value includes three finance lease aircraft.
Fleet Finnair’s fleet is managed by Finnair Aircraft Finance Oy, a wholly-owned subsidiary of Finnair Plc. At the end of 2013, Finnair itself operated 45 aircraft, of which 15 are widebody and 30 narrowbody aircraft. There were no changes to the size of Finnair’s fleet in 2013. However, the composition of the fleet changed somewhat as Finnair received three new A321 Sharklet air-craft in the second half of the year and removed two Boeing 757 from the fleet as their leases expired. Finnair also removed from its fleet one Embraer 170 aircraft in the second quarter of the year, leasing the aircraft to an airline outside the Group.
The leases of the remaining two Boeing 757 aircraft will expire in the first half of 2014, at which time Finnair will take delivery of the last two Airbus A321 Sharklet aircraft. After this,
09 10 11 12 13
Interest bearing liablities and liquid funds
900
800
700
600
500
400
300
200
100
0
Interest bearing liabilities Liquid funds
€ million
593.0
458.8
09 10 11 12 13
Return on equity (ROE) and return on capital employed (ROCE)
5
0
-5
-10
-15
Return on Equity (ROE) Return on Capital Employed (ROCE)
%
1.5 2.3
09 10 11 12 13
Equity ratio, gearing and adjusted gearing
120
100
80
60
40
20
0
Equity ratio Gearing Adjusted gearing
%
32.0
19.5
77.6
09 10 11 12 13
Capital expenditure and net cash flow from operations
400
300
200
100
0
-100
-200
Capital expenditure Net cash flow from operations
€ million
42.0
107.0
FINNAIR ANNUAL REPORT 2013
STRATEGY / CUSTOMERS / OPERATIONS / EMPLOYEES / SOCIETY / FINANCE / GOVERNANCE / GRI 63

the company will operate an all-Airbus fleet. In addition to the aircraft operated by Finnair, its balance sheet includes 25 other aircraft
owned by the company. These aircraft are operated by other airlines, mainly by Flybe Finland. The average age of the fleet operated by Finnair was 9.9 years at the end of the year and that of the Finnair owned fleet operated by other airlines 5.2 years. Finnair also has eight leased air-craft that it has subleased to be operated by other airlines.
A350 AIRCRAFTFinnair has an A350 XWB order book of 11 firm orders and eight options. Some of these air-craft will replace aircraft currently in use in long-haul traffic. Finnair estimates that the first four A350 XWB wide-body aircraft will be delivered and added to the fleet in the second half of 2015. The remaining seven aircraft are estimated to be delivered to Finnair by the end of 2017. Finnair is evaluating alternatives to minimise the effects that any possible delays in de-
liveries may have.Finnair has the possibility to adjust the size of its fleet flexibly according to demand and out-
look due to its lease agreements with different durations.
Fleet operated by Finnair on 31.12.2013 Leased
Seats # Own (operational leasing) (finance leasing) Average ageChange from
31.12.2012 OrderedAdd.
options
Narrow-body fleetAirbus A319 138/123 9 7 2 12.4Airbus A320 165 10 6 4 11.4Airbus A321 209/196 9 4 5 8.7 +3 2
Boeing B757 227 2 0 2 15.7 -2
Embraer 170 76 0 -1Wide-body fleetAirbus A330 297/271/263 8 4 1 3 4.2Airbus A340 270/269 7 5 2 10.9Airbus A350 na. 11 8Total 45 26 16 3 9.9 0 13 8
Fleet owned by Finnair and operated by other airlines on 31.12.2013* Leased
Seats # Own (operational leasing) (finance leasing) Average ageChange from
31.12.2012 OrderedAdd.
options
ATR 72 68–72 12 12 4.4Embraer 170 76 5 5 7.5 +1Embraer 190 100 8 8 5.0 Total 25 25 5.2 +1 0 0
* All ATR aircraft, all E190 aircraft and two E170 aircraft have been leased to Flybe Nordic and three E170 aircraft to other parties outside the Group.
FINNAIR ANNUAL REPORT 2013
STRATEGY / CUSTOMERS / OPERATIONS / EMPLOYEES / SOCIETY / FINANCE / GOVERNANCE / GRI 64

Business area development in 2013The segment reporting of Finnair Group’s financial statements is based on business areas. The reporting business areas are Airline Business, Aviation Services and Travel Services.
Airline Business This business area is responsible for scheduled passenger and charter traffic as well as cargo sales, customer service and service concepts, flight operations and activity connected with the procurement and financing of aircraft. The Airline Business segment comprises the Com-mercial, Operations and Resources Management functions as well as the subsidiaries Finnair Cargo Oy, Finnair Cargo Terminal Operations Oy, Finnair Flight Academy Oy and Finnair Aircraft Finance Oy.
Key figures 2013 2012 Change %
Turnover and result
Turnover, EUR million 2,174.0 2,187.0 -0.6Operating result, EBIT, EUR million 24.8 30.2 -17.8
Operating result, % of turnover 1.1 1.4 -0.3%-pPersonnelAverage number of employees 3,619 3,660 -1.1
The turnover of Airline Business in 2013 remained largely unchanged from the previous year and amounted to 2,174.0 million euros (2,187.0 in 2012). The main factor slowing down turnover growth was the fall in euro-denominated revenue due to the depreciation of the Jap-anese yen, but in the second half of the year the weaker-than-expected development of cargo and leisure traffic and lost turnover resulting from preparations for potential industrial action also contributed to the decrease in turnover for the full year. Operating profit totalled 24.8 mil-lion euros (30.2).
The demand for air travel grew in 2013 despite the weak economic situation. Finnair traf-fic measured in revenue passenger kilometres grew by 5.1 per cent, while total capacity in-creased by 2.6 per cent. The overall passenger load factor increased by 1.9 percentage points to 79.5 per cent.
Measured in revenue passenger kilometres, Asian traffic grew by 5.1 per cent in 2013, while capacity grew by 1.4 per cent. The load factor in Asian traffic rose by 2.8 percentage points to 80.3 per cent over the same period. Measured in revenue passenger kilometres, European traffic grew by 11.7 per cent and domestic traffic by 0.1 per cent on the comparison period. Load factors increased by 1.9 percentage points and 1.3 percentage points to 75.9 per cent and 64.8 per cent, respectively.
Traffic performance 2013 2012 2011 2010 2009
Passengers, thousands 9,269 8,774 8,013 7,139 7,433Available Seat Kilometres, millions 31,162 30,366 29,345 25,127 26,260Revenue Passenger Kilometres, millions 24,776 23,563 21,498 19,222 19,934Passenger Load Factor, % 79.5 77.6 73.3 76.5 75.9
Cargo tonnes, 1,000 kg 146,654 148,132 145,883 123,154 89,234Available Tonne Kilometres*, millions 4,709.2 4,646.7 4,570.6 3,807.8 3,920.1Revenue Tonne Kilometres, millions 3,107.4 3,029.0 2,823.5 2,471.2 2,297.7Overall Load Factor*, % 66.0 65.2 61.8 64.9 58.6
*Cargo ATK’s for the year 2013 are restated due to more accurate metrics implemented in calculation.– Available seat kilometres, ASK: Total number of seats available, multiplied by the number of kilometres flown.– Revenue passenger kilometres, RPK: Number of revenue passengers carried, multiplied by kilometres flown.– Passenger load factor: Share of revenue passenger kilometres of available seat kilometres.– Available tonne kilometres, ATK: Number of tonnes of capacity for carriage of passengers, cargo and mail, multiplied by kilo-
metres flown.– Revenue tonne kilometres, RTK: Total revenue load consisting of passengers, cargo and mail, multiplied by kilometres flown.– Overall load factor: Share of revenue tonne kilometres of available tonne kilometres.
09 10 11 12 13
Number of passengers
10
8
6
4
2
0
million
9.27
09 10 11 12 13
Available seat kilometres (ASK) and revenue passenger kilometres (RPK)
35,000
30,000
25,000
20,000
15,000
10,000
5,000
0
Available Seat Kilometres (ASK) Revenue Passenger Kilometres (RPK)
24,776
31,162
FINNAIR ANNUAL REPORT 2013
STRATEGY / CUSTOMERS / OPERATIONS / EMPLOYEES / SOCIETY / FINANCE / GOVERNANCE / GRI 65
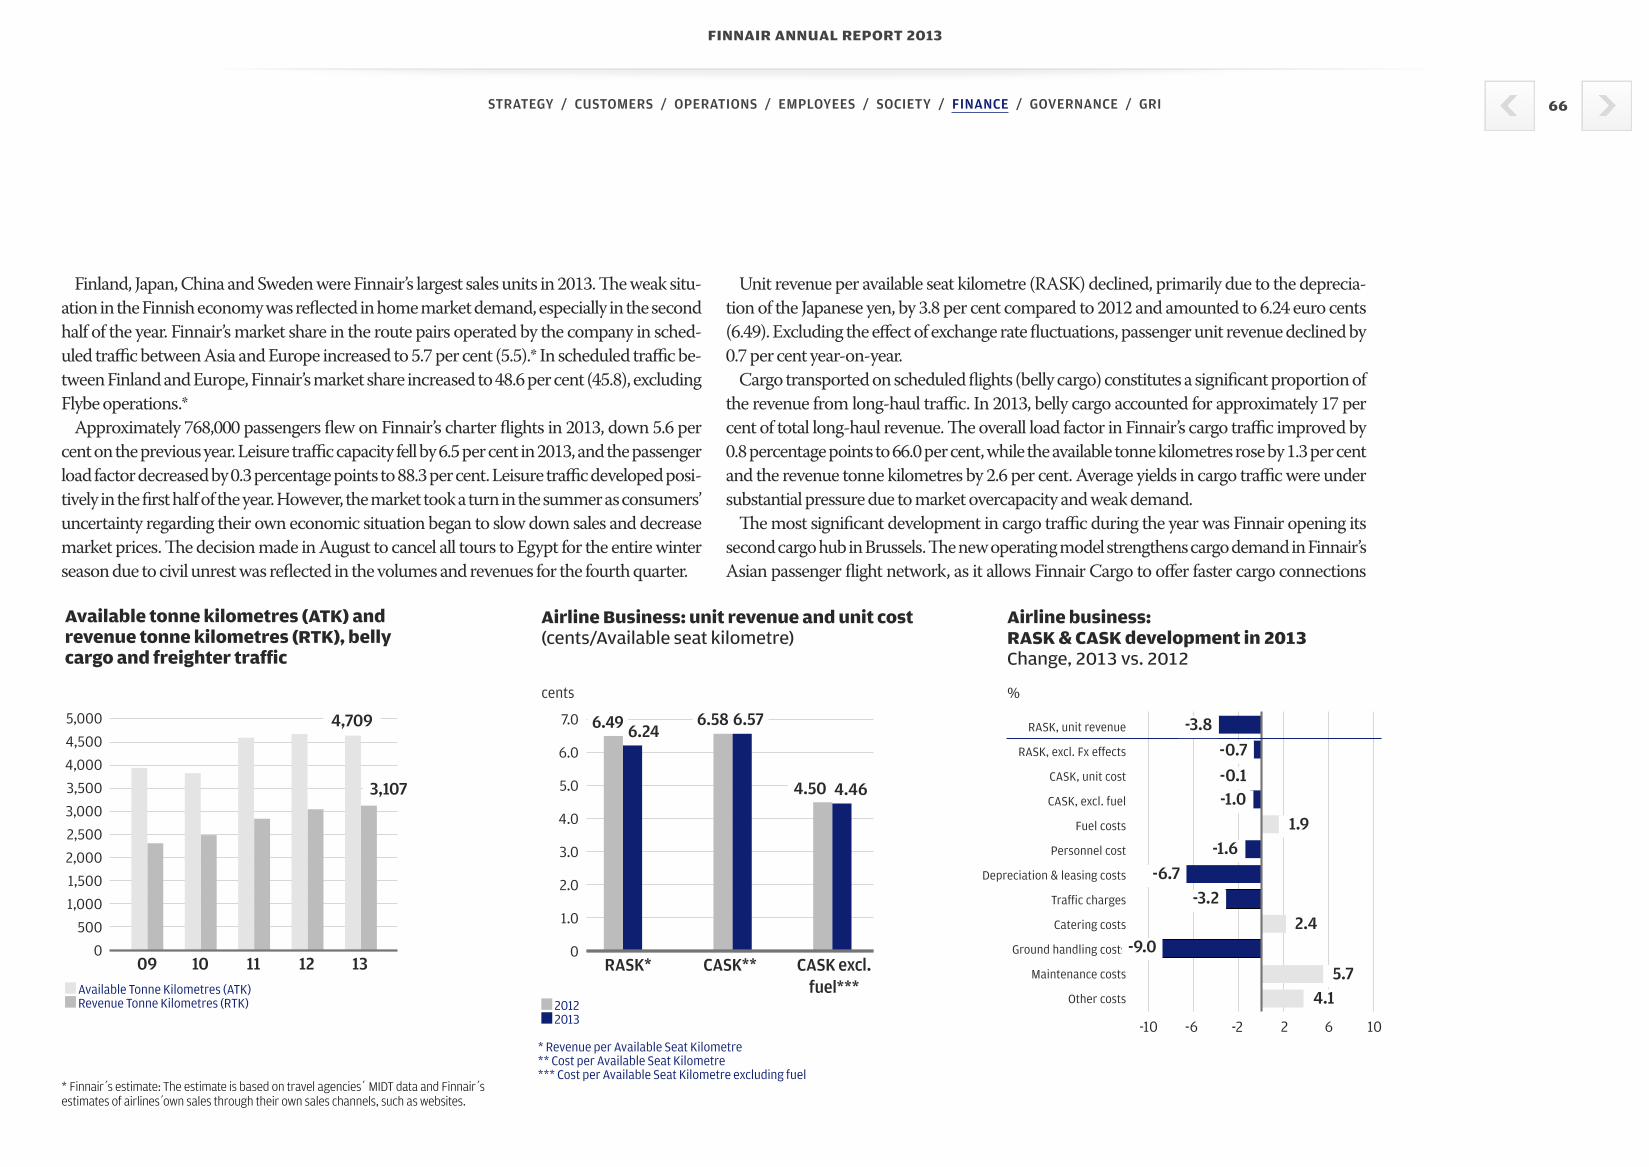
Finland, Japan, China and Sweden were Finnair’s largest sales units in 2013. The weak situ-ation in the Finnish economy was reflected in home market demand, especially in the second half of the year. Finnair’s market share in the route pairs operated by the company in sched-uled traffic between Asia and Europe increased to 5.7 per cent (5.5).* In scheduled traffic be-tween Finland and Europe, Finnair’s market share increased to 48.6 per cent (45.8), excluding Flybe operations.*
Approximately 768,000 passengers flew on Finnair’s charter flights in 2013, down 5.6 per cent on the previous year. Leisure traffic capacity fell by 6.5 per cent in 2013, and the passenger load factor decreased by 0.3 percentage points to 88.3 per cent. Leisure traffic developed posi-tively in the first half of the year. However, the market took a turn in the summer as consumers’ uncertainty regarding their own economic situation began to slow down sales and decrease market prices. The decision made in August to cancel all tours to Egypt for the entire winter season due to civil unrest was reflected in the volumes and revenues for the fourth quarter.
Unit revenue per available seat kilometre (RASK) declined, primarily due to the deprecia-tion of the Japanese yen, by 3.8 per cent compared to 2012 and amounted to 6.24 euro cents (6.49). Excluding the effect of exchange rate fluctuations, passenger unit revenue declined by 0.7 per cent year-on-year.
Cargo transported on scheduled flights (belly cargo) constitutes a significant proportion of the revenue from long-haul traffic. In 2013, belly cargo accounted for approximately 17 per cent of total long-haul revenue. The overall load factor in Finnair’s cargo traffic improved by 0.8 percentage points to 66.0 per cent, while the available tonne kilometres rose by 1.3 per cent and the revenue tonne kilometres by 2.6 per cent. Average yields in cargo traffic were under substantial pressure due to market overcapacity and weak demand.
The most significant development in cargo traffic during the year was Finnair opening its second cargo hub in Brussels. The new operating model strengthens cargo demand in Finnair’s Asian passenger flight network, as it allows Finnair Cargo to offer faster cargo connections
09 10 11 12 13
Available tonne kilometres (ATK) and revenue tonne kilometres (RTK), belly cargo and freighter traffic
5,000
4,500
4,000
3,500
3,000
2,500
2,000
1,500
1,000
500
0
Available Tonne Kilometres (ATK) Revenue Tonne Kilometres (RTK)
3,107
4,709
Airline Business: unit revenue and unit cost (cents/Available seat kilometre)
7.0
6.0
5.0
4.0
3.0
2.0
1.0
0
2012 2013
* Revenue per Available Seat Kilometre** Cost per Available Seat Kilometre*** Cost per Available Seat Kilometre excluding fuel
cents
4.50 4.46
6.58 6.57
RASK* CASK** CASK excl. fuel***
6.246.49
Airline business: RASK & CASK development in 2013Change, 2013 vs. 2012
%
RASK, unit revenue
RASK, excl. Fx effects
CASK, unit cost
CASK, excl. fuel
Fuel costs
Personnel cost
Depreciation & leasing costs
Traffic charges
Catering costs
Ground handling costs
Maintenance costs
Other costs
-3.8
1.9
-0.7
-0.1-1.0
-1.6-6.7
-3.2
-9.02.4
5.74.1
-10 10 -6 -2 2 6
* Finnair s estimate: The estimate is based on travel agencies MIDT data and Finnair s estimates of airlines own sales through their own sales channels, such as websites.
FINNAIR ANNUAL REPORT 2013
STRATEGY / CUSTOMERS / OPERATIONS / EMPLOYEES / SOCIETY / FINANCE / GOVERNANCE / GRI 66

between Central Europe and Asia. Finnair Cargo operated separate wet-leased cargo flights to Hong Kong and New York throughout the year. The cargo aircraft route to Chicago was discontinued in May after the successful launch of the Brussels hub. Cargo flights to Mumbai were discontinued in September due to weakened forecasts of Indian cargo volume and yield as well as the significant depreciation of the Indian rupee. In the third quarter, Finnair Cargo purchased the cargo capacity on the daily Tokyo-Helsinki flights launched by Japan Airlines at the beginning of June, allowing it to offer two daily flights to Tokyo. A new cargo route was also launched to Hanoi, the capital of Vietnam, at the turn of October–November. Separate cargo flights accounted for approximately 37 per cent of total cargo traffic in 2013.
The arrival punctuality of Finnair’s flights was very good in 2013, with 89.6 per cent of sched-uled flights (84.9) and 89.0 (84.5) per cent of all traffic arriving on schedule.
Air traffic services and products Route network and alliancesFinnair offers connections between Asia and Europe with over 200 route pairs and also oper-ates more than 800 flights weekly from Helsinki to other Finnish and European destinations. In the summer season, Finnair operated at most 81 flights to Asia per week.
Malaysia Airlines joined the oneworld alliance in January 2013 and Qatar Airways in Octo-ber 2013. In addition, TAM Airlines, a member of the LATAM Airlines Group, announced in March and US Airways announced in December that they will join the oneworld alliance in March 2014. Also SriLankan Airlines is planning to join the oneworld alliance in 2014. For Finnair’s customers, new airlines joining oneworld enables better connections to destinations outside the Finnair network.
At the beginning of July, Finnair joined the transatlantic joint business founded by Amer-ican Airlines, British Airways and Iberia, and in October, competition authorities approved the company’s entry into the joint business established by Japan Airlines and British Airways for flights between Japan and Europe.
Other renewals and servicesIn March, Finnair launched a social check-in service for its customers. Passengers can link their travel information with their Facebook profile when checking in online and view the public Facebook information of other passengers who have enabled the service. Using the service is voluntary and it can be disabled at any time.
In March–April, Finnair carried out a trial of tablet devices and wireless Internet service on board one of its Airbus A330 wide-body aircraft, and all of the new A321 Sharklet aircraft have Samsung 3 tablet devices available to passengers for a fee. The entertainment systems of Finnair’s aircraft were also upgraded in 2013, nearly doubling the selection of entertainment on long-haul flights in both Economy and Business Class.
Textiles and tableware designed by Finnish design house Marimekko for Finnair aircraft were introduced on flights in May, with Finnair also adding new Marimekko products to the Finnair PlusShop and in-flight sales selection.
Business Class in-flight dining on Finnair’s long-haul flights departing from Helsinki was re-newed in September with the launch of meals designed by two renowned Finnish chefs, Pekka Terävä and Tomi Björck. Finnair also renewed its Economy class meal service earlier in the year.
Also in early October, Finnair announced it will open a new Premier Lounge at Helsinki Airport in spring 2014.
AwardsThe International Air Transport Association (IATA) presented a Fast Travel Gold Award to Finnair in June in recognition of Finnair’s implementation of IATA’s Fast Travel program at Helsinki Airport. Designed to reduce queues at airports and give passengers more options for self-service during their journey.
The aviation research institution Skytrax named Finnair Northern Europe’s Best Airline at the World Airline Awards™ in June. Finnair has now won the award for four consecutive years and is the only airline in the Nordic countries with a four-star Skytrax rating. The oneworld alliance, of which Finnair is a member, was named Best Alliance at the awards. World Airline Awards™ is the most extensive and respected commercial airline rating in the industry. The classification is based on the impartial assessments of 18 million passengers. The participat-ing passengers represent a total of 160 countries.
In early October, Finnair was named Best European Airline at the annual Asia-Pacific TTG Travel Awards. The readers of TTG’s travel magazines highlighted Finnair’s punctuality, ser-vice quality and quick connections.
FINNAIR ANNUAL REPORT 2013
STRATEGY / CUSTOMERS / OPERATIONS / EMPLOYEES / SOCIETY / FINANCE / GOVERNANCE / GRI 67

Aviation ServicesAfter the structural changes in Technical Services and catering implemented in 2012, the Avi-ation Services segment consists of aircraft maintenance and the operations of Finncatering Oy and Finnair Travel Retail Oy. The business operations of Finnair Catering Oy, which were transferred to LSG Sky Chefs on 1 August 2012, are included in the segment’s figures for the comparison year until 31 July 2012. In addition, most of Finnair’s property holdings, office services and the management and maintenance of properties related to the company’s oper-ational activities also belong to the Aviation Services business area. Over half of the business area’s turnover comes from outside the Group.
Key figures 2013 2012 Change %
Turnover and resultTurnover, EUR million 196.3 319.5 -38.6Operating result, EBIT, EUR million -35.2 -1.3 <-200
Operating result, % of turnover -17.9 -0.4 -17.5%-pPersonnelAverage number of employees 1,215 1,984 -38.8
The turnover of Aviation Services for the full year 2013 declined from the previous year due to the outsourcing of the engine and equipment maintenance operations to Finnair’s outsourc-ing partner in July 2012 and the transfer of Finnair Catering Oy’s operations to LSG in August 2012. In addition, Technical Services operations were adjusted in the first half of 2013 to cor-respond with the size of the current fleet.
The segment’s turnover in 2013 amounted to 196.3 million euros (319.5). The operating re-sult was a loss of -35.2 million euros (-1.3), primarily as a result of non-recurring items related to structural changes in Technical Services.
Travel Services (Tour Operators and Travel Agencies) This business area consists of the tour operator Aurinkomatkat (Suntours), its subsidiary op-erating in Estonia, and the business travel agencies that were combined in December, namely Area, Finland Travel Bureau (FTB) and FTB’s subsidiary Estravel, which operates in the Baltic countries, as well as Amadeus Finland, which produces travel sector software and solutions. Aurinkomatkat serves leisure travellers, offering its customers package tours, tailored itiner-aries, flight and hotel packages, flights and cruises, as well as golf, sailing and skiing holidays.
Key figures 2013 2012 Change, %
Turnover and resultTurnover, EUR million 251.7 284.4 -11.5Operating result, EBIT, EUR million 1.6 4.9 -67.7
Operating result, % of turnover 0.6 1.7 -1.1%-pPersonnelAverage number of employees 751 855 -12.2
The turnover of Travel Services for the full year 2013 amounted to 251.7 million euros (284.4) and its operating result was 1.6 million euros (4.9).
Supply and demand were balanced in the Finnish package tour market in the first half of 2013, with the advance booking rate, load factor and price level increasing in the spring season. In June, however, consumers’ uncertainty regarding their own economic situation and the pleas-ant summer weather in Finland slowed down sales and put downward pressure on prices. Au-rinkomatkat cancelled all of its winter season travel to Egypt at the end of August due to travel restrictions in force in the country, which was reflected in the turnover of package tours, particu-larly in the fourth quarter. Weak demand decreased unit revenue from package tours, particu-larly in the second half of the year, while the biggest cost item, i.e. a flight’s unit cost, increased.
Finnair began to replace Boeing 757 aircraft used in leisure traffic with new Airbus 321 Shar-klet aircraft in the second half of the year.
Business travel continued to decrease in Finland in 2013, which was reflected in the sales and profitability of business travel agencies. Faced with a recession, the client companies of busi-
FINNAIR ANNUAL REPORT 2013
STRATEGY / CUSTOMERS / OPERATIONS / EMPLOYEES / SOCIETY / FINANCE / GOVERNANCE / GRI 68

ness travel agencies have reduced and restricted employee travel. Finnair subsidiaries Finland Travel Bureau and Area merged in December to form FTB, the largest Finnish business trav-el agency. The aim of merging the two travel agencies is to achieve volume synergies and sig-nificant reductions in costs by eliminating overlapping functions. In business travel agencies, the number of flights booked in Finland decreased in 2014 by six per cent year-on-year. The market share growth of international online travel agencies in Finland turned and their sales in Finland declined along the market.
Group structureThe companies that are part of the Finnair Group are presented in the notes to the financial statements in notes 1.3 Subsidiaries and 1.6 Investments in associates and joint ventures.
Finnair’s subsidiary Finnair Facilities Management Ltd (FAMA) was merged with its parent company Finnair Plc on 31 March 2013. All employees of FAMA were transferred to Finnair Plc with existing employment conditions. In the future the former FAMA operations will form the new group Facility Services team which will operate under the group Procurement function.
Governance
RESOLUTIONS OF THE ANNUAL GENERAL MEETINGFinnair Plc.’s Annual General Meeting, held on 27 March 2013, confirmed the financial state-ments for 2012 and discharged the members of the Board of Directors and the CEO from li-ability. The Annual General Meeting adopted the Board’s proposal to pay a dividend of 0.10 euros per share. The dividends were paid on 10 April 2013.
Board of DirectorsThe Annual General Meeting elected Klaus W. Heinemann as the Chairman of the Board of Di-rectors. Of the previous members of the Board of Directors, Maija-Liisa Friman, Jussi Itävuori, Merja Karhapää, Harri Kerminen and Gunvor Kronman continue on the newly elected Board, with Ambassador Antti Kuosmanen elected as a new member. The term of office of the mem-bers of the Board of Directors ends at the close of the first Annual General Meeting following their election. The Annual General Meeting decided that the remuneration paid to the Board of Directors will remain unchanged. The Chairman of the Board of Directors will be paid an an-nual fee of 61,200 euros, the Deputy Chairman a fee of 34,200 euros and the ordinary members a fee of 30,000 euros. Members of the Board of Directors will also receive fees for participating in Board and Board Committee meetings at the amount of 600 euros per meeting for members residing in Finland and 1,200 euros per meeting for members residing abroad.
Until the Annual General Meeting 2013, the Chairman of the company’s Board of Direc-tors was Harri Sailas.
AuditorsAuthorised Public Accountants PricewaterhouseCoopers continues as Finnair’s auditor, with APA Mikko Nieminen acting as the principal auditor. Auditor’s fees are paid in accordance with the auditor’s reasonable invoice.
The Board’s authorisationsThe Annual General Meeting authorised the Board of Directors to decide on the repurchase of the company’s own shares and/or use of shares as collateral. The authorisation applies to a maximum of 5,000,000 shares and is valid until 27 September 2014. The Annual General Meeting also authorised the Board of Directors to decide on the disposal of a maximum of 5,000,000 of the company’s own shares. The authorisation is valid until the end of the next An-nual General Meeting, but no longer than until 30 June 2014.
Shareholders’ Nomination BoardThe Annual General Meeting decided to establish a permanent Shareholders’ Nomination Board. The task of the Nomination Board is to prepare and present to the Annual General Meeting, and, if necessary, to an Extraordinary General Meeting, a proposal on the remuner-ation of the members of the Board of Directors, a proposal on the number of members of the Board of Directors and a proposal on the members of the Board of Directors. In addition, the task of the Nomination Board is to seek candidates as potential board members. The Nom-ination Board was established to operate until the General Meeting of the company decides otherwise. The members of the Nomination Board will be nominated annually and their term of office will end when new members are nominated to replace them. The Nomination Board will submit its proposals to the Board of Directors by 31 January each year.
The Company’s three largest shareholders are each entitled to appoint one member to the Nomination Board. The right to nominate is determined on the basis of the registered hold-ings in Finnair’s shareholder register as of the first weekday in September. The following per-sons were appointed to Finnair’s Shareholders’ Nomination Board: Eero Heliövaara, Director General of the Government Ownership Steering Department, Prime Minister’s Office (Chair-man); Robin Backman, Portfolio Manager, KEVA; and Per Wennberg, Director, Skagen funds.The fourth member is the Chairman of the Company’s Board of Directors.
FINNAIR ANNUAL REPORT 2013
STRATEGY / CUSTOMERS / OPERATIONS / EMPLOYEES / SOCIETY / FINANCE / GOVERNANCE / GRI 69

CHANGES IN THE COMPANY’S SENIOR MANAGEMENTPekka Vauramo (M.Sc.) took his position as CEO of Finnair on 1 June 2013. He succeeds Mika Vehviläinen, who left the company on 28 February 2013.
Anssi Komulainen, Head of Customer Service, left Finnair’s Executive Board and Manage-ment Board on 31 August 2013. Customer service functions were moved partly to Finnair’s Commercial Division headed by Allister Paterson and partly to Operations headed by Ville Iho. Finnair did not appoint a successor to Komulainen.
At the end of December, Finnair announced that the head of Travel Services and a mem-ber of Finnair’s Executive Board, D.Sc. (Econ.), Kaisa Vikkula will leave Finnair on 31 January 2014. As the companies belonging to the Travel Services business area will now report to Al-lister Paterson, the head of Finnair’s Commercial Division, Finnair did not appoint a succes-sor to Vikkula.
INSIDER ADMINISTRATIONFinnair complies with the Insider Guidelines of NASDAQ OMX Helsinki Ltd that entered into force on 1 July 2013. Finnair’s Board of Directors has approved Finnair’s insider guide-lines, which contain guidelines for permanent and project-specific insiders as well as the or-ganisation and procedures of the company’s insider controls. These insider guidelines have been distributed to all insiders.
CORPORATE GOVERNANCE STATEMENTFinnair Plc’s Corporate Governance Statement 2013 is presented on pages 131–141, and it is available on the company’s website.
Personnel The number of Finnair employees decreased significantly in 2013 due to the structural chang-es in the company. The Group employed an average of 5,859 (6,784) people in 2013, which is 13.6 per cent fewer than in the previous year. The Airline Business segment employed an aver-age of 3,619 (3,660) people during the year, Aviation Services 1,215 (1,984) people and Travel Services 751 (855) people. A total of 274 (285) people were employed in other functions. The number of employees was 5,803 (6,368) on 31 December 2013.
Of the personnel, 710 people worked outside Finland. Of these, 389 were employed in sales and customer service duties in Finnair’s passenger and cargo traffic. A total of 321 people worked for travel agencies and tour operators based in the Baltic countries and as guides at Aurinkomatkat holiday destinations.
Full-time staff accounted for 95.5 per cent of employees, and 96.4 per cent of staff were em-ployed on a permanent basis. The average age of the employees was 44 years. Of the person-nel, 30 per cent are over 50 years of age, while five per cent are under 30 years of age. The em-ployees’ average number of years in service was 17. Employees having worked for Finnair for over 20 years account for 40 per cent of the staff, while 10 per cent have worked for Finnair for over 30 years. Of Finnair Group’s personnel, 55 per cent are women and 45 per cent are men.
EMPLOYEE CONSULTATIONS CONDUCTED IN 2013In 2013, Finnair conducted employee consultations related to personnel reductions with rep-resentatives of personnel in ground customer services, financial functions, technical services, Finnair Cargo, Aurinkomatkat-Suntours and in business travel agencies. The majority of the consultations were related to projects associated with the implementation of Finnair’s struc-tural change and cost-reduction program and in reorganizing Finnair’s travel agencies.
The estimated maximum need for reductions totalled about 450 jobs. As a result of the ne-gotiations conducted, a total of over 350 jobs were to be reduced. Some of these reductions will materialize only in 2014. By offering part-time jobs and new positions to over 50 people, Finnair was able to avoid some redundancies.
Following the employee consultations in Technical Services, Finnair offered the employees to be dismissed an additional support package. This was due to the very limited employment opportunities in the Finnish aircraft technology and maintenance sector. The package includ-ed not only monetary payments, but also re-employment support with the aim of finding new employment through Finnair’s Career Gate service.
In the last quarter of 2013, Finnair trade union, the Association of Support Service Industries (PALTA), reached an agreement with the Finnish Cabin Crew Union (SLSY), Trade Union PRO, the Finnish Aviation Union (IAU) and the Finnish Air Line Pilots’ Association (SLL) on a new collective labour agreement in line with the national framework agreement, known as the Finnish Employment and Growth Pact. The agreement included wages raises in line with the Finnish Employment and Growth Pact and also the schedule and processes of separate, company-specific negotiations related to Finnair’s cost reductions.
PERSONNEL INCENTIVE SCHEMESIncentive bonuses for 2013, based mainly on financial performance and quality indicators, are estimated to be paid to personnel to an amount of approximately 5.1 million euros, including social security costs. The criteria based on the Group’s result for the personnel profit bonus were not met in 2013.
FINNAIR ANNUAL REPORT 2013
STRATEGY / CUSTOMERS / OPERATIONS / EMPLOYEES / SOCIETY / FINANCE / GOVERNANCE / GRI 70

The remuneration of personnel, including Employee Share Savings Plan FlyShare, is dis-cussed in more detail in the Remuneration Statement 2013 on pages 147–155.
Shares and shareholders
SHARES AND SHARE CAPITALOn 31 December 2013, the number of Finnair shares entered in the Trade Register was 128,136,115, and the registered share capital was 75,442,904.30 euros. The company’s shares are quoted on the NASDAQ OMX Helsinki Stock Exchange. Each share confers one vote at the General Meeting.
GOVERNMENT OWNERSHIPAt the end of 2013, the Finnish Government owned 55.8 per cent of Finnair’s shares and votes. According to the decision made by the Finnish Parliament on 20 June 1994, the Government must own more than half of Finnair Plc’s shares, and decreasing ownership below this level is subject to a Parliament decision.
SHARE OWNERSHIP BY MANAGEMENTOn 31 December 2013, members of the company’s Board of Directors and the CEO did not own any Finnair shares. Members of the Executive Board owned a total of 299,716 shares, rep-resenting 0.23 per cent of all shares and votes.
OWN SHARESFinnair acquired a total of 600,000 of its own shares in 2013. Finnair’s Board of Directors de-cided on the acquisition of shares at its meeting of 18 December 2012, pursuant to the au-thorisation to acquire the company’s own shares given by the Annual General Meeting of 28 March 2012. Also during 2013, the company transferred 708,679 of its own shares as incentive bonuses to key personnel belonging to the performance share plan in effect from 2010 to 2012, and a further 22,340 shares as incentive bonuses to members of the FlyShare employee share savings plan. On 31 December 2013, Finnair held a total of 279,168 (410,187) of its own shares, representing 0.2 per cent of the total share capital.
Finnair plc largest shareholders as at 31 december 2013 Number of shares % Changes 2013
1 State of Finland; Office of Counsil of State 71,515,426 55.8 02 Skagen Global Funds 6,308,221 4.9 419,7923 KEVA (Local Government Pensions Institution) 5,285,642 4.1 -496,1734 Ilmarinen Mutual Pension Insurance Company 2,675,564 2.1 650,0005 Nordea Funds 2,640,810 2.1 2,066,9526 State Pension Fund 2,100,000 1.6 07 Veritas Pension Insurance Company 1,530,000 1.2 08 Tiiviste-Group Oy 1,500,000 1.2 09 Fennia Pension Insurance Company 1,300,000 1.0 010 Evli Funds 1,050,900 0.8 256,77111 Etra Invest Oy 1,000,000 0.8 012 Taaleritehdas Arvo Markka Osake Fund 1,000,000 0.8 497,17013 OP Funds 849,769 0.7 -675,23114 Finnair Plc Staff Fund 701,935 0.5 139,22415 Varma Mutual Pension Insurance Company 600,000 0.5 0
Nominee registered 10,015,872 7.8 1,672,538Others 18,061,976 14.1Total 128,136,115 100.0
Acquisition and delivery of own shares and returns of shares
Number of shares Acquisition value, EUR
Average price, EUR
2004 422,800 2,275,666.49 5.382005 -37,800 -209,838.54 5.552005 150,000 1,516,680.00 10.112006 -383,097 -2,056,847.88 5.372007 0 0.00 02008 235,526 1,538,956.35 6.532009 0 0.00 02010 22,758 114,719.52 5.042011 0 0.00 0.002012 0 0.00 0.002013 600,000 1,684,650.10 2.812013 -731,019 -4,055,744.86 5.5531 Dec 2013 279,168 808,241.18 2.90
FINNAIR ANNUAL REPORT 2013
STRATEGY / CUSTOMERS / OPERATIONS / EMPLOYEES / SOCIETY / FINANCE / GOVERNANCE / GRI 71

SHAREHOLDER AGREEMENTSFinnair is not aware of any shareholder agreements pertaining to share ownership or the use of voting rights.
CHANGE OF CONTROL PROVISIONS IN MATERIAL AGREEMENTSSome of Finnair’s financing agreements include a change of control clause under which the financier shall be entitled to request prepayment of the existing loan or to cancel the availabil-ity of a loan facility in the event that some other person than the State of Finland acquires the control of Finnair either through majority of the voting rights or otherwise.
SHARE-BASED INCENTIVE SCHEMES
Employee share savings plan FlyShareAt the end of March 2013, the Board of Directors of Finnair decided to launch FlyShare, an employee share savings plan for Finnair employees. The objective of the plan is to encourage the employees to become shareholders in the company, and thereby strengthen the employ-ees’ interest in the development of Finnair’s shareholder value and to reward them over the long term. Over 1,000 Finnair employees, or approximately one fifth of all employees, partici-pated in the first phase of the share savings plan. In the fourth quarter of 2013, a total of 22,340 Finnair shares held by the company were transferred to FlyShare program participants as in-centive bonuses. The share savings plan is described in more detail in Remuneration State-ment on pages 147–155.
Shareholding by number of shares owned
1–200 0.6% 201–1,000 2.4% 1,001–10,000 5.0% 10,001–100,000 4.1% 100,001–1 000,000 5.7% 1 000,001– 74.4% Registered in the name of nominee 7.8%
%
Shareholding by type
Public bodies 66.9% Households 10.1% Registered in the name of a nominee 7.8% Outside Finland 5.1% Private companies 4.9% Financial institutions 4.4% Associations 0,8%
%
Breakdown of shares at 31 december 2013
Number of shares %
Number of shareholders %
1–200 712,142 0.6 7,501 47.6201–1,000 3,012,611 2.4 5,670 35.91,001–10,000 6,464,691 5.0 2,355 14.910,001–100,000 5,261,192 4.1 207 1.3100,001–1,000,000 7,276,779 5.7 18 0.11,000,001– 95,373,903 74.4 11 0.1Registered in the name of nominee 10,015,872 7.8 10 0.1Not converted into the book entry system 18,925 0 - -Total 128 136 115 100.0 15,772 100.0
Shareholders by type at 31 December 2013
Number of shares %
Number of shareholders %
Public bodies 85,766,753 66.9 14 0.1Households 12,916,483 10.1 15,125 95.9Registered in the name of a nominee 10,015,872 7.8 10 0.1Outside Finland 6,530,186 5.1 50 0.3Private companies 6,272,034 4.9 510 3.2Financial institutions 5,594,345 4.4 22 0.1Associations 1,021,517 0.8 41 0.3Not converted into the book entry system 18,925 0.0 - -Total 128,136,115 100.0 15,772 100.0
FINNAIR ANNUAL REPORT 2013
STRATEGY / CUSTOMERS / OPERATIONS / EMPLOYEES / SOCIETY / FINANCE / GOVERNANCE / GRI 72

Key personnel’s performance share planIn February 2013, Finnair’s Board of Directors approved a new performance share plan for Finnair’s key personnel. The share plan replaces the previous plan that expired at the end of 2012. The purpose of the share plan is to encourage the management to work to increase long-term shareholder value and also to commit the management to the company. The share plan is described in more detail in a Stock Exchange Release published on 8 February 2013. Long term incentive plan follows the guidelines issued by Cabinet Committee on Economic Policy.
The share plan consists of annually commencing individual plans within which the partici-pants have the opportunity to earn Finnair shares as a long-term incentive reward, if the per-formance targets set by the Board of Directors are achieved. The commencement of each new plan is subject to a separate approval of Finnair Board of Directors. Finnair’s Board approved in February 2013 also the 2013 – 2015 share plan and its performance criteria.
Share-based incentive schemes are described in Finnair’s Remuneration Statement 2013 on pages 147–155 and on the company’s website.
Share price development and tradingAt the end of December 2013, Finnair’s market value stood at 354.9 million euros (305.0), and the closing price of the share was 2.77 euros (2.38). During the January–December period, the highest price for the Finnair share on the NASDAQ OMX Helsinki Stock Exchange was 3.25 euros (2.64), the lowest price 2.40 euros (1.67) and the average price 2.85 euros (2.24). Some 26.0 million (19.7) of the company’s shares, with a total value of 74.2 million euros (44.1), were traded. Traded shares represent 20.3 per cent (15.4) of all shares.
Number of shares and share prices 2013 2012 2011
Average number of shares adjusted for share issue pcs 128,136,115 128,136,115 128,136,115Average number of shares adjusted for share issue (with diluted effect)
pcs 128,136,115 128,136,115 128,136,115
The number of shares adjusted for share issue at the end of financial year
pcs 128,136,115 128,136,115 128,136,115
The number of shares adjusted for share issue at the end of financial year(with diluted effect)
pcs 128,136,115 128,136,115 128,136,115
Number of shares, end of the financial year pcs 128,136,115 128,136,115 128,136,115
Trading price highest EUR 3.25 2.64 5.37
Trading price lowest EUR 2.4 1.67 2.3
Market value of share capital Dec. 31 EUR mill. 355 305 295
No. of shares traded pcs 26,024,070 19,668,495 21,422,076
No. of shares traded as % of average no. of shares % 20.31 15.35 16.72
09 10 11 12 13
6
5
4
3
2
1
0
Finnair share 2009–2013
Average price
EUR
Comparison NASDAQ OMX Helsinki
09 10 11 12 13
200
150
100
50
0
Finnair OMX Helsinki benchmark OMX Helsinki Travel and leisure OMX Helsinki
Comparison European Airlines
09 10 11 12 13
200
150
100
50
0
Finnair European Airlines
FINNAIR ANNUAL REPORT 2013
STRATEGY / CUSTOMERS / OPERATIONS / EMPLOYEES / SOCIETY / FINANCE / GOVERNANCE / GRI 73

Dividend policy and the Board’s proposal for the distribution of profitThe aim of Finnair’s dividend policy is to pay, on average, at least one-third of the earnings per share as a dividend during an economic cycle. In paying dividends, the aim is to also take into account the company’s earnings trend and outlook, financial situation and capital needs for any given period. In 2013, earnings per share from the result of the period (before hybrid bond interest) was 0.08 (0.08) euros, and earnings per share was 0.02 (0.01) euros.
Finnair Plc’s distributable equity amounted to 284,038,140.67 euros on 31 December 2013. The Board of Directors proposes to the Annual General Meeting that no dividend is paid for 2013.
Corporate responsibility In March, Finnair published its annual Sustainability Report, which is based on the Global Re-porting Initiative (GRI). The report details and assesses the financial, social and environmental sustainability of the Finnair Group’s activities in 2012 and proactively discusses topics such as the airline’s efforts to reduce greenhouse gas emissions, developments in carbon trading and air traffic management, aviation’s role in trade and economic development and the impact of restructuring on personnel.
In June, Finnair was certified as a pioneer in environmental management in IATA’s Environ-mental Assessment (IEnvA) Program. The program is designed to independently assess and improve the environmental management of an airline. It helps airlines improve fuel efficiency, reduce waste and limit greenhouse gas emissions. Finnair is part of a pilot group of airlines that has been developing and participating in the program. The airline assessments are undertak-en by independent accredited environmental assessment organisations.
In October, Finnair placed among the leading companies in the Carbon Disclosure Pro-ject (CDP), which assesses the quality of environmental reporting related to climate change published by companies from the perspective of identifying business risks and opportuni-ties. Finnair was also included in the CDP Nordic 260 Climate Disclosure Leadership Index (CDLI) for the second consecutive year. The index highlights those companies listed on the Nordic stock exchanges that have displayed a particularly progressive approach to the disclo-sure of information regarding climate change. The Carbon Disclosure Project is the world’s only global environmental disclosure system and represents 722 international investors with assets of over 87 trillion dollars.
Also in 2013, Finnair began employee training on its Code of Conduct updated at the end of 2012. An eLearning course related to the topic was published near the end of the year, and training will continue in 2014.
Significant near term risks and uncertainties Due to the short booking horizon in passenger and cargo traffic, long-term forecasting of Finnair’s business operations is difficult. Aviation is an industry that is globally sensitive to eco-nomic cycles and also reacts quickly to external disruptions, seasonal variation and changes in economic trends. Finnair has implemented a comprehensive risk management process to ensure that risks are identified and mitigated as much as possible. The risks and uncertainties described here are considered to potentially have a significant impact on Finnair’s business, financial result and future outlook within the next 12 months.
The achievement of the strategic advantages and cost reductions sought through Finnair’s partnership projects involve risks due to, for example, changes in partners’ business operations.
Negotiations on cost reductions between Finnair and the trade unions representing its em-ployees involve risks that, if realised, could have an effect on the achievement of the company’s cost reduction targets, the uninterrupted continuity of its operations and the company’s repu-tation. The achievement of targets in other cost reduction categories included in the cost-re-duction program also involve risks.
The aviation industry is affected by a number of regulatory programs at the EU and interna-tional levels. Estimating the impact of the regulatory changes on airlines’ operational activities and/or costs in advance is difficult. Examples of such regulatory programs include internation-al regulation related to emission trading and other environmental regulation, EU regulations on privacy protection and the decision made by the Court of Justice of the European Union in October 2012 regarding flight passengers’ rights. The European Commission’s proposal is-sued in October 2013 regarding the expansion of emissions trading concerning flights with-in the EU (so-called stop the clock model or intra-EU ETS) has been met with opposition in certain countries outside the EU, which may have a negative effect on the growth potential of Finnair’s Asian traffic, especially in the medium term. The new proposal may also lead to ad-ditional costs.
Finnair’s risk management and risks related to companys operations are described in more detail on pages 142–146 and on the company’s website at www.finnairgroup.com.
FINNAIR ANNUAL REPORT 2013
STRATEGY / CUSTOMERS / OPERATIONS / EMPLOYEES / SOCIETY / FINANCE / GOVERNANCE / GRI 74

Seasonal variation and sensitivities in business operations Due to the seasonal variation of the airline business, the Group’s turnover and profit are gen-erally at their lowest in the first quarter and at their highest in the third quarter of the year. The growing proportional share of Asian traffic increases seasonal fluctuation due to desti-nation-specific seasons in Asian leisure and business travel.
A one-percentage-point change in the passenger load factor or the average yield in passen-ger traffic has an effect of approximately 15 million euros on the Group’s operating result. A one-percentage-point change in the unit cost of scheduled passenger traffic has an effect of approximately 17 million euros on the operating result.
In addition to operational activities, fuel price development has a key impact on Finnair’s result, as fuel costs are the company’s most significant cost item. A 10-per-cent change in the world market price of fuel has an effect of approximately 29 million euros on Finnair’s oper-ating result at an annual level (for the following 12 months on a rolling basis), taking hedging into account. Without hedging, a 10-per-cent change would have an effect of approximately 63 million euros on Finnair’s operating result at an annual level.
Finnair’s foreign exchange risk arises primarily from fuel and aircraft purchases, aircraft leasing payments and sales revenue denominated in foreign currencies. Slightly less than 60 per cent of the Group’s turnover is denominated in euros. In 2013, the most important other foreign sales currencies were the Japanese yen (10 per cent of turnover), the Chinese yuan (6 per cent), the Swedish crown (5 per cent) and the US dollar (4 per cent). Approximately half of the Group’s operating costs were denominated in foreign currencies. The most important purchasing currency was the US dollar, which accounted for slightly over 40 per cent of all op-erating costs. Significant dollar-denominated expense items are aircraft leasing payments and fuel costs as well as traffic charges. The largest investments, namely the acquisition of aircraft and their spare parts, are mainly denominated in US dollars.
A 10-per-cent change in the euro-dollar exchange rate has an effect of approximately 21 million euros on Finnair’s operating result at an annual level (for the following 12 months on a rolling basis), taking hedging into account. Without hedging, a 10-per cent change would have an effect of approximately 68 million euros on Finnair’s operating result at an annual lev-el. The sensitivity analysis assumes that the Chinese yuan and the Hong Kong dollar continue to correlate strongly with the US dollar. A 10-per cent change in the euro-yen exchange rate has an effect of approximately 6 million euros on Finnair’s operating result at an annual level
(for the following 12 months), taking hedging into account. Without hedging, a 10-per-cent change would have an effect of approximately 18 million euros on Finnair’s operating result at an annual level.
The company protects itself against the risks of currency, interest rate and jet fuel positions by using different derivative instruments, such as forward contracts, swaps and options, ac-cording to the risk management policy verified by the Board of Directors. Fuel purchases are hedged for 24 months forward on a rolling basis, and the degree of hedging decreases towards the end of the hedging period. The higher and lower limits of the degree of hedging are 90 and 60 per cent for the following six months. At the end of 2013, the hedging ratio for fuel purchas-es was 74 per cent for the first half of 2014 and 66 per cent for the whole year. The hedging ra-tio for a dollar basket over the following 12 months was 67 per cent, and the hedging ratio for a yen basket was 71 per cent.
Other events in 2013Finnair inaugurated its new head office at Tietotie 9 in Vantaa, Finland in July. All of the Group’s functions in the Helsinki region, with the exception of flying crew and technical services, moved to the new HOTT Building (House of Travel and Transportation) by the end of 2013.
Events after the financial year
PROPOSALS OF THE SHAREHOLDERS’ NOMINATION BOARD TO THE ANNUAL GENERAL MEETINGOn 31 January 2014, the Shareholders’ Nomination Board submitted its proposal on the com-position of the Board of Directors to be chosen in Finnair’s 2014 Annual General Meeting, and on the Chairman of the Board of Directors and the remunerations of the members of the Board of Directors. The Nomination Board proposes that present members of the Board of Directors Ms Maija-Liisa Friman, Mr Klaus W. Heinemann, Mr Jussi Itävuori, Mr Harri Ker-minen and Ms Gunvor Kronman be re-elected, and that Ms Jaana Tuominen and Mr Nigel Turner be elected as new members to the Board of Directors. The Nomination Board further proposes that Mr Klaus W. Heinemann be re-elected as Chairman of the Board. The Nom-ination Board also proposes, that the annual remunerations of the members of the Board of Directors would remain unchanged. In addition, the Nomination Board proposes, that the meeting fees payable to Board members residing in Finland remain unchanged and to Board members residing abroad the fee of 2,400 (1,200) euros would be paid per meeting of the Board or its Committee.
FINNAIR ANNUAL REPORT 2013
STRATEGY / CUSTOMERS / OPERATIONS / EMPLOYEES / SOCIETY / FINANCE / GOVERNANCE / GRI 75
2014–2016 PERFORMANCE SHARE PLANOn 10 February 2014, Finnair Board of Directors approved a new performance share plan, covering years 2014–2016, for the key personnel of the Finnair Group. The share plan is a part of Finnair’s long-term share-based incentive arrangement that Finnair Board of Directors ap-proved in 2013, and which consists of annually commencing individual plans.
More information on the long-term share-based incentive arrangement and annual share plans is available on Finnair’s website www.finnairgroup.com under Governance section.
AIRCRAFT SALE AND LEASEBACKSThe sale and leaseback agreements of two Airbus 330 aircraft owned by Finnair were finalized on 26 February 2014. The Memorandum of Understanding (MoU) on the transactions was signed on 13 December 2013. The MoU includes also two ordered Airbus 350 aircraft, and sale and leaseback agreements for these two are expected to be concluded in H2 2015, when the first two A350s ordered by Finnair are delivered.
Outlook for 2014 The ongoing uncertain economic outlook in Europe and Asia is contributing to weak consum-er demand in some of our main markets. Air traffic is expected to grow moderately in 2014. Finnair, however, will not be able to benefit from that growth without progress in its cost sav-ings program and its target cost structure in place.
Finnair estimates its turnover to be close to previous year’s level in 2014. Fuel costs are ex-pected to remain high. The outcome of Finnair’s ongoing cost-saving negotiations will have a significant impact on financial performance in 2014, and therefore the company will recon-sider giving guidance for its full-year 2014 financial performance after the savings negotiations have been concluded.
FINNAIR PLCBoard of Directors
FINNAIR ANNUAL REPORT 2013
STRATEGY / CUSTOMERS / OPERATIONS / EMPLOYEES / SOCIETY / FINANCE / GOVERNANCE / GRI 76

KEY FIGURES 2013 2012 2011 2010 2009
Earnings/share EUR 0.02 0.01 -0.75 -0.24 -0.76Earnings/share adjusted for option rights (with diluted effect)
EUR 0.02 0.01 -0.75 -0.24 -0.76
Result/share (number of shares at the end of financial year)
EUR 0.02 0.01 -0.75 -0.24 -0.76
Equity/share EUR 5.41 6.06 5.89 6.67 6.45Dividend/share* EUR 0.00 0.10 0.00 0.00 0.00
Dividend/earnings* % 0.0 121.2 0.0 0.0 0.0Dividend yield % 0.0 4.2 0.0 0.0 0.0Cash flow from operating activities/share
EUR 0.84 1.21 0.40 0.59 -0.94
P/E ratio 155.88 174.96 -3.07 -21.09 -4.93Equity ratio % 32.0 35.4 32.6 36.2 34.2Net debt-to-equity (Gearing) % 19.5 18.0 43.3 27.8 26.8Adjusted gearing % 77.6 77.8 108.4 79.6 90.0Return on equity (ROE) % 1.5 1.4 -10.9 -2.7 -12.1Return on capital employed (ROCE) % 2.3 2.8 -5.2 -0.4 -7.8
CASH FLOW 2013 2012 2011 2010 2009
Operational cash flow EUR mill. 107 155 51 76 -115in relation to turnover % 4.5 6.3 2.2 3.7 -6.3
PERSONNEL 2013 2012 2011 2010 2009
Personnel on average 5,859 6,784 7,467 7,578 8,797
* The dividend for year 2013 is a proposal of the Board of Directors to the Annual General Meeting.
FINANCIAL INDICATORS 2009–2013
INCOME STATEMENT 2013 2012 2011 2010 2009
Turnover EUR mill. 2,400 2,449 2,258 2,023 1,838change % -2.0 8.5 11.6 10.1 -18.5
Operational result EUR mill. -5 43 -61 -5 -171in relation to turnover % -0.2 1.8 -2.7 -0.2 -9.3
Operating profit, EBIT EUR mill. -9 34 -88 -13 -115in relation to turnover % -0.4 1,4 -3.9 -0.7 -6.3
Net financial income (+)/expenses (-) EUR mill. 23 -18 -22 -20 -10in relation to turnover % 1.0 -0.7 -1.0 -1.0 -0.5
Net interest expenses EUR mill. -10 -13 -14 -16 -6in relation to turnover % -0.4 -0.5 -0.6 -0.8 -0.3
Profit before taxes EUR mill. 10 15 -111 -33 -125in relation to turnover % 0.4 0.6 -4.9 -1.6 -6.8
BALANCE SHEET 2013 2012 2011 2010 2009
Non-current assets EUR mill. 1,424 1,501 1,621 1,514 1,596Current assets EUR mill. 759 699 736 827 842Assets held for sale EUR mill. 18 32 0 71 19Assets total EUR mill. 2,201 2,231 2,357 2,412 2,457Shareholders' equity and non-controlling interests
EUR mill. 692 775 747 853 825
Liabilities total EUR mill. 1,509 1,456 1,610 1,558 1,632Equity and liabilities total EUR mill. 2,201 2,231 2,357 2,412 2,457Gross capital expenditure EUR mill. 42 41 204 183 347
in relation to turnover % 1.7 1.7 9.0 9.1 18.9Average capital employed EUR mill. 1,314 1,413 1,550 1,636 1,353Dividend for the financial year * EUR mill. 0 13 0 0 0Interest bearing debt EUR mill. 593 569 729 765 829Liquid funds EUR mill. 459 430 403 527 607Interest bearing net debt EUR mill. 134 138 326 238 221
in relation to turnover % 5.6 5.6 14.4 11.7 12.0
FINNAIR ANNUAL REPORT 2013
STRATEGY / CUSTOMERS / OPERATIONS / EMPLOYEES / SOCIETY / FINANCE / GOVERNANCE / GRI 77

FINANCIAL STATEMENTS 1 JANUARY–31 DECEMBER 2013
HOW TO READ FINNAIR FINANCIAL STATEMENT?
Finnair financial statement hs been preseneted in a style that attempts to make it less complex and give more relevant picture of the whole by combining notes to business related sections. Each section sets out the accounting policies applied in producing these notes together with any critical accounting estimations and sourc-es of uncertainty.
Notes to the financial statement have been combined in a new way into sections based on their context. The aim is to give a more relevant picture of the Finnair Group and its business. The content of each section is described and explained in the beginning of that section and marked with .
Specific accounting principles are attached to the relevant note. The accounting principles can be recognised from mark .
Critical accounting estimates and sources of uncertainty have been presented together with the relevant note and specified with character .
CONTENTS Consolidated income statement 79
Consolidated statement of comprehensive income 79
Consolidated balance sheet 80
Consolidated cash flow statement 81
Consolidated statement of changes in equity 82
NOTES TO THE FINANCIAL STATEMENTS
1 CONSOLIDATION 83
1.1 Accounting principles 83
1.2 Critical accounting estimations and sources of uncertainty 84
1.3 Subsidiaries 85
1.4 Acquisitions and disposals 85
1.5 Non current assets and liabilities held for sale 85
1.6 Investments in associates and joint ventures 86
2 SEGMENTS AND INCOME 87
2.1 Segment information 87
2.2 Operating income 88
2.2.1 Turnover by currency 88
2.2.2 Other operating income 88
2.2.3 Trade and other receivables 88
2.2.4 Deferred income 89
3 OPERATING EXPENSES 89
3.1 Production for own use 89
3.2 Operational expenses by currency 89
3.3 Other rents 89
3.4 Other expenses 89
3.5 Accruals related to other expenses 90
3.6 Inventories 90
3.7 Provisions 90
3.8 Items excluded from operational result 91
3.9 Employee benefits 91
3.9.1 Employee benefit expenses and share-based payments 91
3.9.2 Pensions 94
4 AIRCRAFT AND OTHER INTANGIBLE AND TANGIBLE ASSETS AND LEASING ARRANGEMENTS 96
4.1 Intangible assets 96
4.2 Tangible assets 97
4.3 Depreciation and impairment 98
4.4 Leasing arrangements 98
5 CAPITAL STRUCTURE AND FINANCING COSTS 100
5.1 Financial income and expenses 100
5.2 Financial assets 100
5.2.1 Non-current loan and other receivables 101
5.2.2 Other current financial assets 101
5.2.3 Cash and cash equivalents 101
5.3 Financial liabilities 101
5.4 Contingent liabilities 103
5.5 Management of financial risks 103
5.6 Classification of financial assets and liabilities 104
5.7 Offsetting financial assets and liabilities 105
5.8 Derivatives 106
5.9 Equity-related information 108
6 OTHER NOTES 110
6.1 Income taxes 110
6.2 Related party transactions 112
6.3 Disputes and litigation 112
6.4 Events after the closing date 112
6.5 Change of accounting principle 112
7 PARENT COMPANY FINANCIAL STATEMENTS 113
Calculation of key indicators 121
Board of Directors' proposal on the dividend 121
Signing of the Report of the Board of Directors and the Financial Statements 121
Auditor's report 122
FINNAIR ANNUAL REPORT 2013
STRATEGY / CUSTOMERS / OPERATIONS / EMPLOYEES / SOCIETY / FINANCE / GOVERNANCE / GRI 78

EUR mill. Note 2013 2012
Turnover 2.1, 2.2.1 2,400.3 2,449.4Production for own use 3.1 2.5 1.7Other operating income 2.2.2 18.8 20.8Capital gains on sales of tangible fixed assets * 3.8 1.1 22.2Operating income total 2,422.8 2,494.1Staff costs 3.9 383.9 429.2Fuel costs 689.9 670.3Lease payments for aircraft 57.5 66.2Other rents 3.3 152.0 123.2Aircraft materials and overhaul 161.2 133.1Traffic charges 222.3 226.0Ground handling and catering expenses 257.3 247.2Expenses for tour operations 89.4 96.8Sales and marketing expenses 72.9 75.7Depreciation and impairment 4.3 122.1 130.8Other expenses 3.4 218.1 230.2Operational expenses total 3.2 2,426.5 2,428.7Operational result -4.8 43.2Fair value changes of derivatives and foreign currency denominated fleet maintenance reserves
3.8 21.7 -4.0
Non-recurring items 3.8 -26.8 -27.6Operating expenses total 2,431.6 2,460.3Operating profit -8.8 33.8Financial income 5.1 42.6 7.9Financial expenses 5.1 -19.7 -25.5Share of profits from associates and joint ventures 1.6 -4.0 -1.4Profit before taxes 10.1 14.8Income taxes 6.1 1.0 -4.3Profit for the financial year 11.0 10.5
Attributable toOwners of the parent company 10.8 10.2Non-controlling interests 0.3 0.3
Earnings per share from profit attributable to shareholders of the parent companyEarnings per share (diluted and undiluted) 0.02 0.01
* Not included in the operational result.
CONSOLIDATED INCOME STATEMENT
EUR mill. Note 2013 2012
Profit for the financial year 11.0 10.5Other comprehensive income itemsItems that may be reclassified to profit or loss in subsequent periodsTranslation differences 5.9 0.0 0.0Change in fair value of available-for-sale financial assets 5.9 -13.8 20.8Change in fair value of hedging instruments 5.9 -5.3 -48.3Tax effect 4.4 6.7Items that will not be reclassified to profit or loss in subsequent periodsActuarial gains and losses from defined benefit plans 3.9.2 0.4 -47.8Tax effect -0.6 11.7Other comprehensive income items total -15.0 -56.9Comprehensive income for the financial year -3.9 -46.4
Attributable toOwners of the parent company -4.2 -46.6Non-controlling interests 0.3 0.2
CONSOLIDATED STATEMENT OF COMPREHENSIVE INCOME
FINNAIR ANNUAL REPORT 2013
STRATEGY / CUSTOMERS / OPERATIONS / EMPLOYEES / SOCIETY / FINANCE / GOVERNANCE / GRI 79

EUR mill. Note 31 Dec 201331 Dec 2012
Restated1 Jan 2012
Restated
ASSETSNon-current assetsIntangible assets 4.1 19.3 25.5 32.3Tangible assets 4.2 1,309.8 1,362.6 1,468.2Investments in associates and joint ventures 1.6 8.2 12.3 13.7Loan and other receivables 5.2.1 20.5 22.7 24.6Pension receivables 3.9.2 0.0 0.0 43.5Deferred tax receivables 6.1 65.8 77.6 75.2Non-current assets total 1,423.6 1,500.7 1,657.5
Current assetsInventories 3.6 19.9 17.1 48.9Trade and other receivables 2.2.3 237.1 217.5 183.2Derivative financial instruments 5.8 43.6 33.6 100.1Other financial assets 5.2 335.9 363.5 353.8Cash and cash equivalents 5.2.3 122.9 67.0 49.5
Current assets total 759.4 698.7 735.5
Assets held for sale 1.5 17.7 31.9 0.0
ASSETS TOTAL 2,200.6 2,231.3 2,393.0
CONSOLIDATED BALANCE SHEET
EUR mill. Note 31 Dec 201331 Dec 2012
Restated1 Jan 2012
Restated
EQUITY AND LIABILITIESEquity attributable to owners of the parent Share capital 5.9 75.4 75.4 75.4Other equity 5.9 615.7 699.0 703.6
691.1 774.4 779.0Non-controlling interests 0.7 0.9 0.7Equity total 691.8 775.3 779.7
Non-current liabilitiesDeferred tax liability 6.1 72.6 91.6 107.3Borrowings 5.3 410.9 413.5 516.0Pension obligations 3.9.2 10.6 3.6 0.0Provisions 3.7 69.3 82.3 86.9Non-current liabilities total 563.4 591.0 710.2
Current liabilitiesProvisions 3.7 40.5 38.2 46.0Borrowings 5.3 207.5 174.2 229.9Trade payables 61.6 70.3 69.1Derivative financial instruments 5.8 29.1 18.5 17.0Deferred income 2.2.4 340.8 288.0 267.1Employee benefit related accruals 3.9 94.7 104.3 102.8Other expenses related accruals 3.5 169.0 169.3 171.2Current liabilities total 943.2 862.8 903.1
Liabilities related to assets held for sale 1.5 2.3 2.2 0.0
Liabilities total 1,508.9 1,456.0 1,613.3
EQUITY AND LIABILITIES TOTAL 2,200.6 2,231.3 2,393.0
FINNAIR ANNUAL REPORT 2013
STRATEGY / CUSTOMERS / OPERATIONS / EMPLOYEES / SOCIETY / FINANCE / GOVERNANCE / GRI 80

EUR mill. 2013 2012
Cash flow from operating activitiesProfit for the financial year 11.0 10.5Non-cash transactions 1) 97.3 119.5Other adjustments to profit for the financial year
Financial income -42.6 -7.9Financial expenses 19.7 23.3Share of results from associates and joint ventures 4.0 1.4Income taxes -1.0 4.3
Changes in working capital 35.8 22.2Interest paid -12.1 -16.7Other financial expenses paid -3.8 -6.0Received interest income 1.4 4.2Taxes paid -2.7 -0.1Cash flow from operating activities 107.0 154.7
Cash flow from investing activitiesInvestment in associates and joint ventures 0.0 -0.7Investments in intangible assets -2.3 -4.8Investments in tangible assets -61.0 -53.3Net change in financial interest bearing assets at fair value through profit or loss 2) 14.6 -5.2Net change in shares classified as available for sale 53.7 0.1Sales of tangible assets 8.9 10.6Dividends received 1.2 0.1Change in non-current receivables 1.0 -1.0Cash flow from investing activities 16.1 -54.2
Cash flow from financing activities Proceeds from loans 150.0 71.0Loan repayments and changes -115.0 -207.9Hybrid bond repayments -52.4 -67.7Proceeds from hybrid bond 0.0 120.0Hybrid bond interest and expenses -15.4 -14.3Purchase of own shares -1.7 0.0Dividends paid -13.0 0.0Cash flow from financing activities -47.4 -98.9
Change in cash flows 75.7 1.6
Change in liquid fundsLiquid funds, at beginning 256.1 254.5Change in cash flows 75.7 1.6Liquid funds, at end 3) 331.8 256.1
CONSOLIDATED CASH FLOW STATEMENT
Notes to consolidated cash flow statement
1) Non-cash transactions:
EUR mill. 2013 2012
Depreciation 122.1 130.8Employee benefits 7.3 12.3Fair value changes in derivatives and changes in exchange rates of fleet overhauls -21.7 4.0Other adjustments -10.5 -27.6
Total 97.3 119.5
2) Net change in financial interest bearing assets maturing after more than three months.
3) Liquid funds
Financial assets include cash and cash equivalents and investments, which are reported in the separate accounts of balance sheet. The balancing of items is presented below:EUR mill. 2013 2012
Other financial assets 335.9 363.5Cash and cash equivalents 122.9 67.0Short-term cash and cash equivalents in balance sheet 458.8 430.5Maturing after more than three months -126.5 -141.1Shares available for sale -0.4 -33.3Total 331.8 256.1
Cash and cash equivalents include cash and bank deposits as well as other highly liquid financial assets which mature within three months. Such items are e.g. certificate of deposits and commercial papers. Balance sheet items are presented in notes 5.2.2 Other current financial assets and 5.2.3 Cash and cash equivalents.
FINNAIR ANNUAL REPORT 2013
STRATEGY / CUSTOMERS / OPERATIONS / EMPLOYEES / SOCIETY / FINANCE / GOVERNANCE / GRI 81

EUR mill.Share
capitalOther
restricted funds
Hedging reserve and other OCI items
Unrestricted equity funds
Retained earnings
Hybrid bond
Owners of the parent
company
Non-controlling
interestsEquity
total
Shareholders equity 1 Jan 2013 75.4 168.1 0.0 247.1 112.6 171.1 774.3 0.9 775.2Profit for the financial year 10.8 10.8 0.3 11.0Change in fair value of available-for-sale financial assets -10.4 -10.4 -10.4Change in fair value of hedging instruments -4.2 -4.2 -4.2Actuarial gains and losses from defined benefit plans -0.2 -0.2 -0.2Translation differences 0.0 0.0 0.0Comprehensive income for the financial year total 0.0 0.0 -15.0 0.0 10.8 0.0 -4.2 0.3 -3.9Dividend -12.7 -12.7 -0.5 -13.2Purchase of own shares -1.7 -1.7 -1.7Share-based payments 1.9 -0.3 1.5 1.5Hybrid bond repayment -52.1 -52.1 -52.1Hybrid bond interests and expenses -14.1 -14.1 -14.1Shareholders equity 31 Dec 2013 75.4 168.1 -15.0 247.3 96.3 118.9 691.1 0.7 691.8
EUR mill.Share
capitalOther
restricted funds
Hedging reserve and other OCI items
Unrestricted equity funds
Retained earnings
Hybrid bond
Owners of the parent
company
Non-controlling
interestsEquity
total
Shareholders equity 31 Dec 2011 75.4 168.1 29.8 247.2 111.9 119.4 751.8 0.7 752.5Change in accounting principles (IAS 19) 27.2 27.2 27.2Shareholders equity 1 Jan 2012 75.4 168.1 57.0 247.2 111.9 119.4 779.0 0.7 779.7Profit for the financial year 10.3 10.3 0.2 10.5Change in fair value of available-for-sale financial assets 15.7 15.7 15.7Change in fair value of hedging instruments -36.5 -36.5 -36.5Actuarial gains and losses from defined benefit plans -36.1 -36.1 -36.1Translation differences 0.0 0.0 0.0Comprehensive income for the financial year total 0.0 0.0 -56.9 0.0 10.3 0.0 -46.6 0.2 -46.4Purchase of own shares 0.3 0.3 0.3Hybrid bond repayment, interests and expenses -10.1 -68.3 -78.4 -78.4Proceeds from hybrid bond 120.0 120.0 120.0Shareholders equity 31 Dec 2012 75.4 168.1 0.1 247.2 112.5 171.1 774.4 0.9 775.3
Hybrid bond at the end of 2013 includes the 120 million euro hybrid loan issued in 2012, which after deduction of transaction costs amounts to 118.9 million euros. The decrease of 52.1 million euros in hybrid bond during 2013 relate to redemption of the outstanding share of the previous hybrid bond issued in 2009. More information on hybrid bond can be found in note 5.9 Equity-related information.
CONSOLIDATED STATEMENT OF CHANGES IN EQUITY
FINNAIR ANNUAL REPORT 2013
STRATEGY / CUSTOMERS / OPERATIONS / EMPLOYEES / SOCIETY / FINANCE / GOVERNANCE / GRI 82

DESCRIPTION OF THE COMPANYThe Finnair Group engages in worldwide air transport operations and supporting services. The Group’s operations are divided into the Air-line Business, Aviation Services and Travel Services business areas. The Group’s parent company is Finnair Plc, which is domiciled in Helsin-ki at the registered address Tietotie 9, Vantaa. The parent company is listed on the NASDAQ OMX Helsinki Stock Exchange. The Board of Directors of Finnair Plc has approved these financial statements for publication at its meeting on 10 February 2014. Under Finland’s Limit-ed Liability Companies Act, shareholders have the option to accept or reject the financial statements in the Annual General meeting of the shareholders, which will be held after the publication of the financial statements.
BASIS OF PREPARATIONFinnair Plc’s consolidated financial statements for 2013 have been prepared according to the International Financial Reporting Standards (IFRS) and IFRIC interpretations in effect on 31 December 2013 and as adopted by the European Union. The notes to the consolidated fi-nancial statements also comply with Finnish accounting and corporate law.
The 2013 consolidated financial statements have been prepared based on original acquisition costs, except for financial assets recognis-able through profit and loss at fair value, financial assets available-for-sale, and derivative contracts, which have been valued at fair value. Financial statement data is presented in millions of euros, rounded to the nearest one hundred thousand euro. This means that the sum of the individual figures may differ from the total shown.
Presentation of Consolidated Income Statement and Balance SheetThe IAS 1 Presentation of Financial Statements standard does not define ‘operating result’. The Group has defined it as follows: operating profit is the net amount including turnover and other operating income, less purchase costs adjusted by change in inventories and costs arising from production for own use, less costs arising from employee benefits, depreciation and possible impairment losses as well as oth-er operating expenses. Exchange rate differences and changes in fair values of derivatives are included in operating profit if they arise from items related to business operations; otherwise they are recognised in financial items. Operating result excludes financial items, share of results from associates and joint ventures and income taxes.
Consolidated income statement includes, in addition to operating result, operational result which is presented to better reflect the Group’s business performance when comparing results to previous periods. Operational result doesn’t include capital gains and losses, changes in the value of foreign currency denominated fleet maintenance reserves, changes in the unrealised fair value of derivatives or non-recurring items.
In Consolidated balance sheet, assets and liabilities are classified as current when they are expected to realize within 12 months or when they are classified as liquid funds or financial assets or liabilities classified as at fair value through profit or loss. Other assets and liabilities are classified as non-current assets or liabilities.
Use of estimatesThe preparation of financial statements in accordance with IFRS standards requires Group management to make certain estimates and judgements in applying the accounting principles. Information about the judgement exercised by management in applying the Group’s ac-counting principles and the areas where estimates and judgements have biggest impact in the financial statements are presented in the note 1.2 Critical accounting estimations and sources of uncertainty.
HOW SHOULD THE FINNAIR’S ACCOUNTING PRINCIPLES BE READ?
Finnair describes the accounting principles in conjunction with each note in the aim of providing enhanced understanding of each accounting area. General consolidation principles are described as part of this note (accounting principles), while the ones more directly related to a specific note are attached to the corresponding note. The Group focuses on describing the accounting choic-es made within the framework of the prevailing IFRS policy and avoids repeating the actual text of the standard, unless Finnair considers it particularly important to the understanding of the note’s content. Refer to the table below to see the note in which each accounting principle is listed and for the relevant and material IFRS standard.
Accounting principle Note Nr. IFRS
Consolidation principles of subsidiaries Subsidiaries 1.3 IAS 27Non-controlling interests and transactions with non-controlling interests
Subsidiaries 1.3 IAS 27
Assets and liabilities held for sale Non-current assets and liabilities held for sale 1.5 IFRS 5Associates and joint ventures Investments in associates and joint ventures 1.6 IAS 28Segment reporting Segment information 2.1 IFRS 8Revenue recognition, other income and trade receivables
Operating income 2.2 IAS 18, IAS 39, IFRS 7
Inventories Inventories 3.6 IAS 2Provisions Provisions 3.7 IAS 37Employee benefits and share-based payments Employee benefits 3.9 IAS 19, IFRS 2Pensions Pensions 3.9.2 IAS 19Intangible assets Intangible assets 4.1 IAS 38Tangible assets Tangible assets 4.2 IAS 16Depreciation and amortization, Impairment testing
Intangible assets, Tangible assets 4.1, 4.2 IAS 16, IAS 36, IAS 38
Operating and finance lease arrangements Leasing arrangements 4.4 IAS 17Interest and dividend income Financial income and expenses 5.1 IAS 18, IAS 39Financial assets and impairment of financial assets, cash and cash equivalents
Financial assets 5.2 IAS 39, IFRS 7
Financial liabilities Financial liabilities 5.3 IAS 39, IFRS 7Contingent liabilities Contingent liabilities 5.4 IAS 37Derivative contracts and hedge accounting Derivatives 5.8 IAS 39, IFRS 7Equity, dividend and treasury shares Equity-related information 5.9 IAS 32, IAS 33Income and deferred taxes Income taxes 6.1 IAS 12
1. CONSOLIDATION
Notes under Consolidation –section include basis of preparation and description of general accounting principles as well as notes that provide information relating to consolidation principles and methods. Aim of the section is to provide an overall picture of the group’s structure and principles applied in preparing consolidated financial statements. Notes include in addition to general consolidation prin-ciples, information about subsidiaries, associated companies and joint ventures held, acquired or sold by the group as well as informa-tion about assets held for sale.
1.1 ACCOUNTING PRINCIPLES
NOTES TO THE FINANCIAL STATEMENTS
= Content of the section
FINNAIR ANNUAL REPORT 2013
STRATEGY / CUSTOMERS / OPERATIONS / EMPLOYEES / SOCIETY / FINANCE / GOVERNANCE / GRI 83

The identified main critical estimates and sources of uncertainty are presented in connection to the items considered to be af-fected, attached to the corresponding note. The table below shows where to find more information about those presentations.
Critical accounting estimations and sources of uncertainty Note number Note
Impairment testing 4.1, 4.2 Intangible assets, Tangible assetsJudgements of classifying lease arrangements 4.4 Leasing arrangementsFinnair Plus Customer Loyalty Program 2.2 Operating incomeDeferred taxes 6.1 Income taxesPension obligations 3.9.2 Pensions
1.2 CRITICAL ACCOUNTING ESTIMATIONS AND SOURCES OF UNCERTAINTY
The preparation of financial statements requires the use of estimates and assumptions relating to the future, and the actual outcomes may dif-fer from the estimates and assumptions made. In addition, discretion has to be exercised in applying the accounting principles of the financial statements. Estimates are based on management’s best view on the closing date. Possible changes in estimates and assumptions are entered into the accounts in the financial period during which the estimates and assumptions are adjusted and in all subsequent financial periods.
Application of new and amended IFRS standards and IFRIC interpretationsThe following standards have been adopted by the group for the first time for the financial year beginning on 1 January 2013:• IAS 19, ‘Employee benefits’ was revised in 2011, and it changed accounting for defined benefit plans by eliminating the corridor approach.
Accordingly actuarial gains and losses are immediately recognised in the period they occur in equity. The revised standard did not have material effect to group’s results; however it impacted equity through other comprehensive income (OCI).
• Amendment to IAS 1, ‘Financial statement presentation’ regarding other comprehensive income. The main change resulting from the amendments is a requirement to classify items presented in ‘other comprehensive income’ (OCI) to those that are potentially reclassifia-ble to profit or loss subsequently and to those that cannot be reclassified through profit and loss. The amendment changed presentation of other comprehensive income and did not have impact on group’s results and financial position.
• Amendment to IFRS 7, ‘Financial instruments: Disclosures’, on asset and liability offsetting. This amendment includes new disclosure and it did not impact group’s results or financial position.
• IFRS 13, ‘Fair value measurement’, aims to improve consistency by providing a precise definition of fair value and a single source of fair value measurement and disclosure requirements for use across IFRSs. The change did not impact group’s results or financial position.
• Annual Improvements to IFRSs 2009-2011 Cycle, issued in May 2012 . The improvements primarily remove inconsistencies and clarify wording of standards. Amendments did not have an impact on Finnair’s financial statements.
Finnair will apply the following new or amended standards and interpretations starting from 1 January 2014. • IFRS 10, ‘Consolidated financial statements’ identifies the concept of control as the determining factor in whether an entity should be in-
cluded within the consolidated financial statements of the parent company. • IFRS 11, ‘Joint arrangements’ focuses on the rights and obligations of the parties to the arrangement rather than its legal form. There are
two types of joint arrangements: joint operations and joint ventures. Joint operations arise where the investors have rights to the assets and obligations for the liabilities of an arrangement. A joint operator accounts for its share of the assets, liabilities, revenue and expenses. Joint ventures arise where the investors have rights to the net assets of the arrangement; joint ventures are accounted for using the equity method. Due to new standard, IAS28 was revised to be in consistent with new standard.
• IFRS 12, ‘Disclosures of interests in other entities’ includes the disclosure requirements for all forms of interests in other entities, includ-ing joint arrangements, associates, structured entities and other off balance sheet vehicles.Finnair has assessed the effect of the new standards by evaluating the nature of ownership interests in its current holdings. Based on the
evaluation, new standards of IFRS 10, 11 and 12 will not change the existing consolidation method for currently held subsidiaries, associ-ated companies and joint ventures. Those that have currently been classified as joint ventures will continue to be accounted for by using equity method.
Other amendments, interpretations or new standards effective on or after 1 January 2014 are not expected to have any significant im-pact on Finnair’s financial statement.
GENERAL CONSOLIDATION PRINCIPLES
ConsolidationConsolidation, consolidation method and classification of ownership interests depends on whether group has power to control, significant influence or other interests in the entity. When group has power to control the entity, it is consolidated as subsidiary in the group according to principles described in the note 1.3 Subsidiaries. When group has significant influence over an entity but does not have power to control, entity is accounted with equity method according to principles set in note 1.6 Investments in associates and joint ventures. If group does not have power to control nor significant influence in entity, its ownership interests are classified as financial assets available for sale and ac-counted for according to principles described in the note 5.2 Financial assets.
Translation of foreign currency itemsItems included in each subsidiary’s financial statements are valued in the foreign currency that is the main currency of operating environ-ment of each subsidiary (“operational currency”). The consolidated financial statements have been presented in euros, which is the parent company’s operational and presentation currency. The income statements and Balance Sheets of foreign subsidiaries have been translated into euros using following principles:• Monetary items denominated in foreign currency have been translated into the operating currency using the mid-market exchange rates
on the closing date.• Advance payments made and received are entered at the exchange rate of the operating currency on the date of payment. • Non-monetary items have been translated into the operating currency using the exchange rate on the date of the transaction. • Translation differences on operations are included in the income statement’s operating profit, and translation differences on foreign cur-
rency loans are included in financial items.
Translation differences of shareholders’ equity items arising from eliminations of the acquisition cost of foreign subsidiaries are recog-nised in the other comprehensive income. When a foreign subsidiary is sold, related translation differences are recognised in the income statement as part of the gain or loss arising from the sale. Goodwill arising from an acquisition of a foreign entity is treated as an asset of that entity and translated at the closing rate.
= Critical accounting estimates
FINNAIR ANNUAL REPORT 2013
STRATEGY / CUSTOMERS / OPERATIONS / EMPLOYEES / SOCIETY / FINANCE / GOVERNANCE / GRI 84
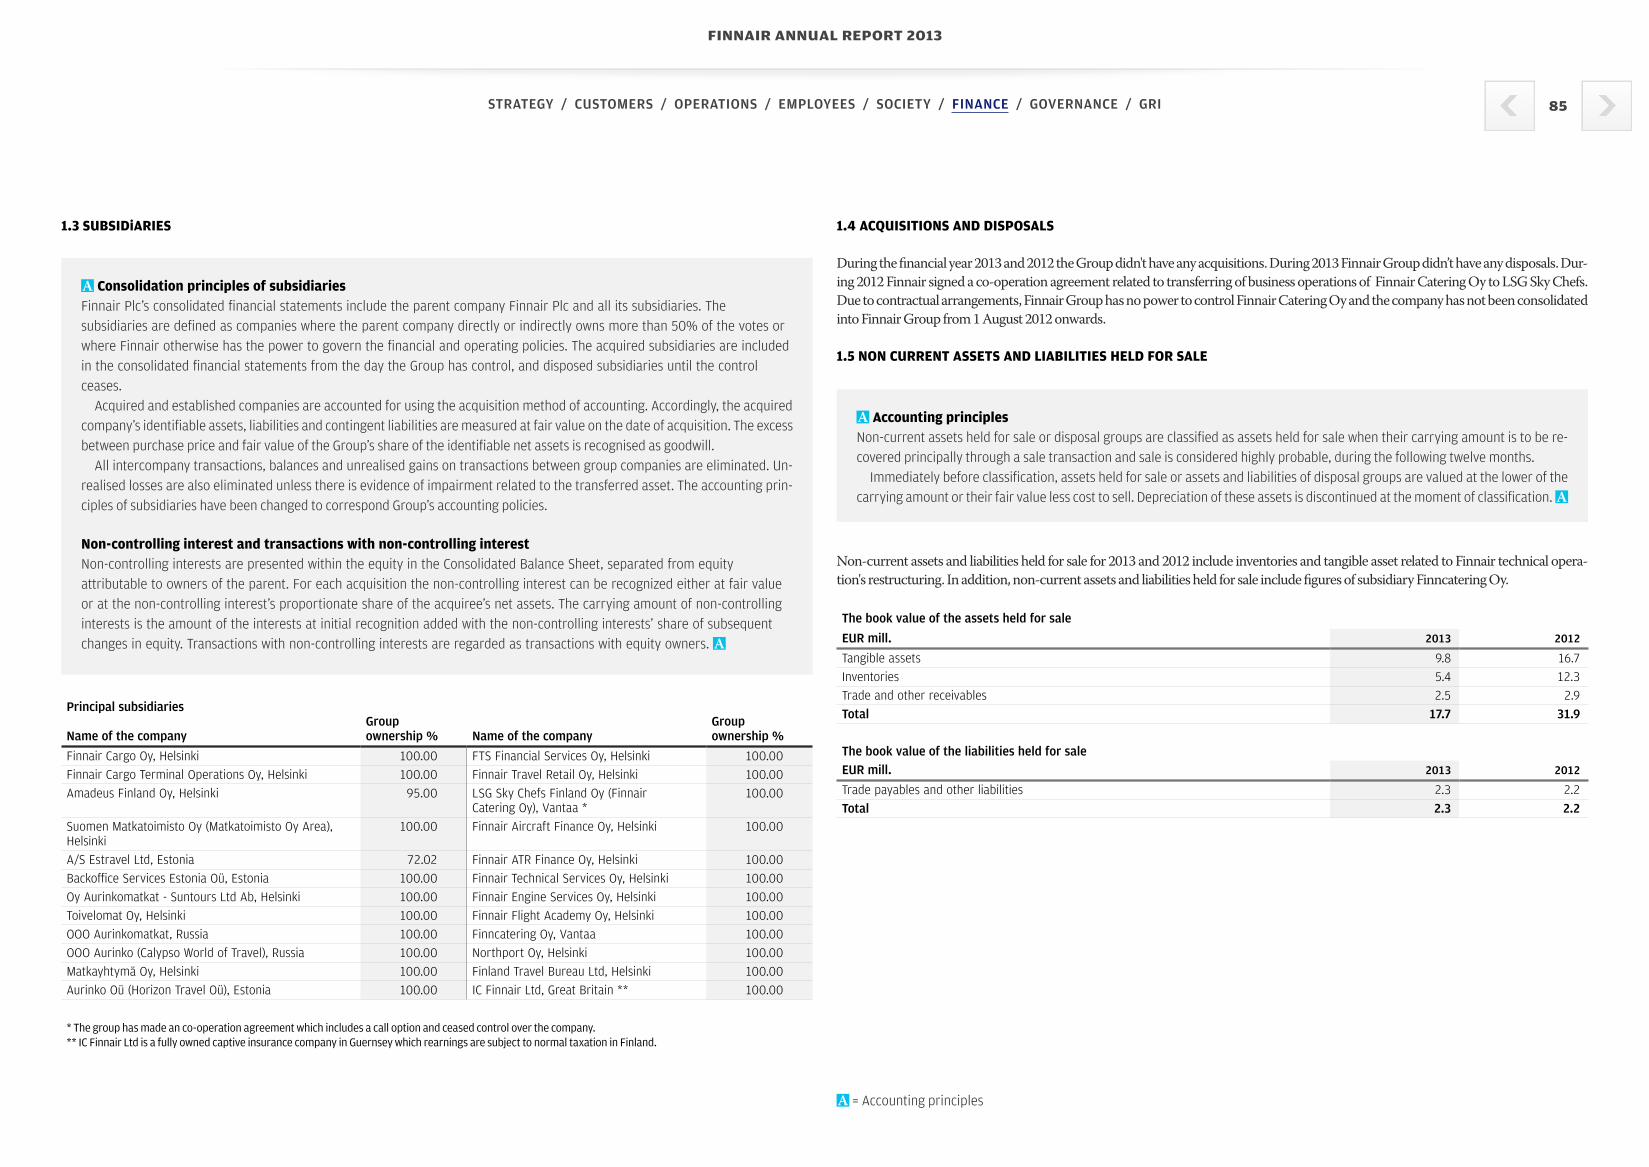
Consolidation principles of subsidiariesFinnair Plc’s consolidated financial statements include the parent company Finnair Plc and all its subsidiaries. The subsidiaries are defined as companies where the parent company directly or indirectly owns more than 50% of the votes or where Finnair otherwise has the power to govern the financial and operating policies. The acquired subsidiaries are included in the consolidated financial statements from the day the Group has control, and disposed subsidiaries until the control ceases.
Acquired and established companies are accounted for using the acquisition method of accounting. Accordingly, the acquired company’s identifiable assets, liabilities and contingent liabilities are measured at fair value on the date of acquisition. The excess between purchase price and fair value of the Group’s share of the identifiable net assets is recognised as goodwill.
All intercompany transactions, balances and unrealised gains on transactions between group companies are eliminated. Un-realised losses are also eliminated unless there is evidence of impairment related to the transferred asset. The accounting prin-ciples of subsidiaries have been changed to correspond Group’s accounting policies.
Non-controlling interest and transactions with non-controlling interest Non-controlling interests are presented within the equity in the Consolidated Balance Sheet, separated from equity attributable to owners of the parent. For each acquisition the non-controlling interest can be recognized either at fair value or at the non-controlling interest’s proportionate share of the acquiree’s net assets. The carrying amount of non-controlling interests is the amount of the interests at initial recognition added with the non-controlling interests’ share of subsequent changes in equity. Transactions with non-controlling interests are regarded as transactions with equity owners.
Principal subsidiaries Name of the company
Group ownership %
Name of the company
Group ownership %
Finnair Cargo Oy, Helsinki 100.00 FTS Financial Services Oy, Helsinki 100.00Finnair Cargo Terminal Operations Oy, Helsinki 100.00 Finnair Travel Retail Oy, Helsinki 100.00Amadeus Finland Oy, Helsinki 95.00 LSG Sky Chefs Finland Oy (Finnair
Catering Oy), Vantaa *100.00
Suomen Matkatoimisto Oy (Matkatoimisto Oy Area), Helsinki
100.00 Finnair Aircraft Finance Oy, Helsinki 100.00
A/S Estravel Ltd, Estonia 72.02 Finnair ATR Finance Oy, Helsinki 100.00Backoffice Services Estonia Oü, Estonia 100.00 Finnair Technical Services Oy, Helsinki 100.00Oy Aurinkomatkat - Suntours Ltd Ab, Helsinki 100.00 Finnair Engine Services Oy, Helsinki 100.00Toivelomat Oy, Helsinki 100.00 Finnair Flight Academy Oy, Helsinki 100.00OOO Aurinkomatkat, Russia 100.00 Finncatering Oy, Vantaa 100.00OOO Aurinko (Calypso World of Travel), Russia 100.00 Northport Oy, Helsinki 100.00Matkayhtymä Oy, Helsinki 100.00 Finland Travel Bureau Ltd, Helsinki 100.00Aurinko Oü (Horizon Travel Oü), Estonia 100.00 IC Finnair Ltd, Great Britain ** 100.00
* The group has made an co-operation agreement which includes a call option and ceased control over the company.** IC Finnair Ltd is a fully owned captive insurance company in Guernsey which rearnings are subject to normal taxation in Finland.
1.3 SUBSIDiARIES 1.4 ACQUISITIONS AND DISPOSALS
During the financial year 2013 and 2012 the Group didn't have any acquisitions. During 2013 Finnair Group didn’t have any disposals. Dur-ing 2012 Finnair signed a co-operation agreement related to transferring of business operations of Finnair Catering Oy to LSG Sky Chefs. Due to contractual arrangements, Finnair Group has no power to control Finnair Catering Oy and the company has not been consolidated into Finnair Group from 1 August 2012 onwards.
1.5 NON CURRENT ASSETS AND LIABILITIES HELD FOR SALE
Non-current assets and liabilities held for sale for 2013 and 2012 include inventories and tangible asset related to Finnair technical opera-tion's restructuring. In addition, non-current assets and liabilities held for sale include figures of subsidiary Finncatering Oy.
The book value of the assets held for sale
EUR mill. 2013 2012
Tangible assets 9.8 16.7Inventories 5.4 12.3Trade and other receivables 2.5 2.9Total 17.7 31.9
The book value of the liabilities held for saleEUR mill. 2013 2012
Trade payables and other liabilities 2.3 2.2Total 2.3 2.2
Accounting principlesNon-current assets held for sale or disposal groups are classified as assets held for sale when their carrying amount is to be re-covered principally through a sale transaction and sale is considered highly probable, during the following twelve months.
Immediately before classification, assets held for sale or assets and liabilities of disposal groups are valued at the lower of the carrying amount or their fair value less cost to sell. Depreciation of these assets is discontinued at the moment of classification.
= Accounting principles
FINNAIR ANNUAL REPORT 2013
STRATEGY / CUSTOMERS / OPERATIONS / EMPLOYEES / SOCIETY / FINANCE / GOVERNANCE / GRI 85

Associates are companies in which the Group usually holds 20–50% of the voting right or in which the Group has significant in-fluence but in which it does not exercise control. Companies where the Group has joint control with another entity are considered as joint ventures. The Group’s interests in associated companies and jointly controlled entities are accounted for using the equity method. The investment in associates and joint ventures include goodwill recognised at the time of acquisition. The Group recog-nises its share of the post-acquisition results in associates and joint ventures in the income statement. When the Group’s share of losses in an associate or a joint venture equals or exceeds its interest in the associate or joint venture, the Group does not recog-nise further losses, unless it has incurred obligations on behalf of the associate or joint venture.
Results from the transactions between the Group and its associates and joint ventures are recognised only to the extent of unre-lated investor's interests in the associates. The Group determines at each reporting date whether there is any objective evidence that the investment in the associates or joint ventures is impaired. In case of such indications, Group calculates the amount of im-pairment as the difference between the recoverable amount of the associate and its carrying value. The impairment is recognized in share of profits from associates and joint ventures.
Accounting policies of associates and joint ventures have been changed where necessary to correspond with the accounting policies adopted by the Group. If financial statements for the period are not available, the share of the profit of certain associated company or joint venture is included in the consolidated accounts based on the preliminary financial statements or latest avail-able information.
1.6 INVESTMENTS IN ASSOCIATES AND JOINT VENTURES
The Group’s share of the result in associates and joint ventures, and information on assets and liabilities of principal associates and joint ventures are presented in the following tables.
EUR mill. 2013 2012
At the beginning of the financial year 12.3 13.7Shares of results -4.0 -1.4Additions 0.0 3.3Disposals 0.0 -3.3At the end of the financial year 8.2 12.3
Financial Statement information on the Group's principal associates and joint ventures 31.12.2013
EUR mill. Domicile Assets Liabilities Turnover Profit/Loss Holding %
Amadeus Estonia Estonia 0.7 0.3 1.2 0.4 33.25Nordic Global Airlines Oy Finland 8.0 5.0 27.7 0.0 40.00Flybe Nordic Ab * Sweden 43.6 54.6 236.1 -15.8 40.00
Kiinteistö Oyj Lentäjäntie 1 Finland 26.5 20.2 1.5 0.0 28.33Total 78.7 80.1 266.5 -15.5* According to official financial statment of Flybe Finland Oy as per 31 March 2013, which is holding-company Flybe Nordic Ab's subsidiary and responsible of the operations in the Flybe Nordic group.
Financial Statement information on the Group's principal associates and joint ventures 31.12.2012
EUR mill. Domicile Assets Liabilities Turnover Profit/Loss Holding %
Amadeus Estonia Estonia 0.7 0.4 0.7 0.2 33.25Nordic Global Airlines Oy Finland 7.2 4.2 28.6 0.6 40.00Flybe Nordic Ab Sweden 11.2 7.6 26.6 -5.5 40.00Kiinteistö Oyj Lentäjäntie 1 Finland 27.4 19.5 1.4 0.0 28.33Total 45.8 31.3 56.6 -4.9
All the associated companies and joint ventures of Finnair are unlisted. Amadeus Finland's associated company Amadeus Estonia ensures consistent products and services to Finnish travel companies operating in Estonia and helps to increase cooperation between Estonian trav-el agencies and Finnish travel service providers. Nordic Global Airlines Oy is a freight airline co-owned by Finnair Cargo Oy, Ilmarinen and Neff Capital Management. Flybe Nordic, owned by Finnair Plc and Flybe UK, is a regional airline operating in the Nordic countries and the Baltic states. During 2012 the shares of the Finnish Aircraft Maintenance Oy were exchanged to Flybe Nordic shares. The transaction did not effect the share of ownerships.
= Accounting principles
FINNAIR ANNUAL REPORT 2013
STRATEGY / CUSTOMERS / OPERATIONS / EMPLOYEES / SOCIETY / FINANCE / GOVERNANCE / GRI 86

2 SEGMENTS AND INCOME Business segment data 2013
EUR mill. Airline
Business Aviation Services
Travel Services
Group eliminations
Group functions
Group total
External turnover 2,052.5 96.8 251.0 2,400.3Internal turnover 121.4 99.4 0.7 -221.6 0.0Turnover 2,174.0 196.3 251.7 -221.6 2,400.3Operating profit 24.8 -35.2 1.6 -8.8Operational result 5.7 -13.6 3.1 -4.8Share of profits from associates and joint ventures -4.0Financial income 42.6Financial expenses -19.7Income taxes 1.0Non-controlling interests -0.3Profit for the financial year 10.8
Depreciation and impairment 113.2 7.4 1.5 122.1
Average number of employees 3,619 1,215 751 274 5,859Employees at the end of year 3,677 1,106 730 290 5,803
Business segment data 2012
EUR mill. Airline
Business Aviation Services
Travel Services
Group eliminations
Group functions
Group total
External turnover 2,050.5 116.0 282.9 2,449.4Internal turnover 136.5 203.5 1.5 -341.5 0.0Turnover 2,187.0 319.5 284.4 -341.5 2,449.4Operating profit 30.2 -1.3 4.9 33.8Operational result 39.6 -2.0 5.6 43.2Share of profits from associates and joint ventures -1.4Financial income 7.9Financial expenses -25.5Income taxes -4.3Non-controlling interests -0.3Profit for the financial year 10.2
Depreciation and impairment 112.9 16.5 1.4 130.8
Average number of employees 3,660 1,984 855 285 6,784Employees at the end of year 3,784 1,518 810 256 6,368
Segment reportingOperating segments are reported in a manner consistent with the internal reporting provided to the chief operating decision-mak-er. The chief operating decision maker, who is responsible for allocating resources and assessing performance of the operating segments, has been identified as the Board of Directors. Segments are defined based on Group's business areas.
Reporting segments are based on the Group’s business area based internal organisational structure and financial reporting to management. The reporting segments are Airline Business, Aviation Services and Travel Services.
Airline Business is responsible for scheduled passenger and charter traffic as well as cargo sales, customer service and service concepts, flight operations and activity connected with the procurement and financing of aircraft. The Airline Business segment comprises Finnair air traffic, Finnair Cargo Oy, Finnair Cargo Terminal Operations Oy, Finnair Flight Academy Oy and Finnair Aircraft Finance Oy.
Aviation Services consists after the structural changes in 2012 of aircraft maintenance and the operations of Finncatering Oy and Finnair Travel Retail Oy. The business operations of Finnair Catering Oy, which were transferred to LSG Sky Chefs on 1 August 2012, are included in the segment’s figures for the comparison year until 31 July 2012. In addition, most of Finnair’s property holdings, office services and the management and maintenance of properties related to the company’s operational activities also belong to the Aviation Services business area.
Travel Services consists of the Group’s domestic and foreign travel agency operations as well as tour operations and travel sector soft-ware business operations. The following companies belong to the Travel Services segment: Oy Aurinkomatkat-Suntours Ltd Ab, Matkay-htymä Oy, Toivelomat Oy, Horizon Travel Oü, OOO Aurinko, Amadeus Finland Oy, Finland Travel Bureau Ltd, Matkatoimisto Oy Area and A/S Estravel.
Transactions between segments are based on commercial terms. Items excluded from operating profit are not allocated to segments. Personnel working in group functions is presented separately, but costs from group functions are allocated to segments.
= Content of the section = Accounting principles
Segments and income include segment information and notes related to revenue and other operating income both from income state-ment and balance sheet perspective.
2.1 SEGMENT INFORMATION
FINNAIR ANNUAL REPORT 2013
STRATEGY / CUSTOMERS / OPERATIONS / EMPLOYEES / SOCIETY / FINANCE / GOVERNANCE / GRI 87

2.2 OPERATING INCOME
Revenue recognitionRevenue comprises the fair value consideration received or receivable at the time of delivery of products or upon fulfilment of services. Revenue is shown net of discounts and indirect taxes. Revenue is recognised as described below.
Airline Business sales are recognised as revenue when the flight is flown in accordance with the flight traffic program. The rec-ognition as revenue of unused flight tickets is based on the expiry dates of the tickets.
Finnair Plus' Customer Loyalty Program offers to customers a possibility to use earned loyalty points to acquire services or goods from the Group's supply of services. The consideration receivable from the customer is allocated between the components of the arrangement using fair values. The arrangement is a multiple-element arrangement and the revenue is recognised partly when the original acquisition is purchased and the rest when the accrued points are used to acquire a service or a good.
Aviation Services provide aircraft maintenance services mainly for group companies and due to restructurings decreasingly to external parties. The related revenue is recognised when the service has been completely performed. Revenue related to trav-el retail and catering businesses are mostly sale of goods and recognised at the moment the goods are transferred to the buyer.
Revenue related to Travel Services is recognised when the service has been performed, i.e. in case of tour operation services at the date of departure and in commission sales at the time of sale. In commission based sales, only the part of commission is included in the revenue.
Public grantsPublic grants, for example government aid for professional training, have been recognised in other operating income. Public grants that the Group may receive for tangible asset acquisitions are recognised as a reduction in original acquisition cost and depreci-ated along with the original asset during the useful life.
Trade receivablesTrade receivables are recognised at fair value. When the Group has objective evidence that it may not be able to collect all trade receivables that are due, a bad debt provision is recognised. Financial difficulties that indicate that a customer is going into bank-ruptcy, financial restructuring or substantial delays in payments are examples of objective evidence that might cause trade re-ceivables to be impaired. Impairment of trade receivables is recognised in other operating expenses.
Finnair Plus Customer Loyalty ProgramValuation and revenue recognition related to Finnair Plus -debt requires judgement of management especially related to fair valuation of unused points and timing of revenue recognition related to points expected to expire. The points of the Finnair Plus Customer Loyalty Program are valued according to the IFRIC 13 to the market value. The market value is determined from the al-location of the used points. Each form of uses is valued using the best estimates for the market value. The liability recognised is the total of accumulated points where the points expected to lapse are decreased. The net amount of points are valued using the above explained method and that amount is recognised as a liability in balance sheet.
2.2.1 Turnover by currencyEUR mill. 2013 2012
EUR 1,389.7 1,387.0JPY 230.4 305.3CNY 135.3 72.2SEK 115.0 106.1USD 83.4 75.4
Other currencies 446.6 503.5Total 2,400.3 2,449.4
Currency hedging policies are described in the note 5.5 Management of financial risks.
2.2.2 Other operating income
EUR mill. 2013 2012
Rental income 10,6 8,4Other income 8,2 12,4Total 18,8 20,8
2.2.3 Trade and other receivablesEUR mill. 2013 2012
Trade receivables 123.2 120.7Prepaid expenses, accrued income and other receivables total 113.9 96.8
Receivables from associates and joint ventures 36.1 22.5Other prepaid expenses, accrued income and other receivables 77.8 74.3
Total 237.1 217.5
The fair value of trade receivables do not materially differ from balance sheet value.Receivables from associates and joint ventures are mainly receivables from Flybe.Prepaid expenses, accrued income and other receivables include mainly aircraft lease prepayments.
= Content of the section = Accounting principles = Critical accounting estimates
Operating income -section includes both income statement and balance sheet notes that relate to turnover and operating income, The aim is to provide more coherent picture of income related items effecting Finnair's result and financial position. Trade receivables and deferred income containing mainly prepaid flight tickets and travel tour services are presented in connection with this section, because those are an essential part in revenue recognition.
FINNAIR ANNUAL REPORT 2013
STRATEGY / CUSTOMERS / OPERATIONS / EMPLOYEES / SOCIETY / FINANCE / GOVERNANCE / GRI 88

Trade receivables by currency
EUR mill. 2013 2012
EUR 60.6 61.6USD 15.8 16.9JPY 8.3 7.8CNY 5.5 4.2SEK 5.1 4.5Other currencies 27.8 25.8Total 123.2 120.7
2.2.4 Deferred income
EUR mill. 2013 2012
Unflown air transport revenues 255.6 204.6Advances received for tour operations 32.7 35.8Loyalty program Finnair Plus 32.2 32.5Other items 20.3 15.0Total 340.8 288.0
Deferred income includes prepaid, yet unflown flights (255,6) and package tours (32,7), whose departure date is in future. Finnair Plus lia-bility (32,2) comprises unused points accumulated by the air travel and purchases of loyalty customers. These points are recognised at fair value based on the estimated timing and value of their realisation.
Other items in deferred income consists of several items, none of which are individually significant.
3 OPERATING EXPENSES
Operating expenses -section include the income statement and balance sheet notes related to operating expenses, aiming to provide better overview of business operations and related expenses. Inventories, that inherently relate to overhaul expenses, as well as heavy maintenance provisions of aircraft are included in the operating expenses -section. Accrued expenses, like liabilities related to jet fuel and traffic charges, are also presented in this section. All the income statement and balance sheet items related to employee benefits are also presented in this section as a separate note. Employee benefits include the different forms of benefits, like share-based payments and pensions as well as their effect to balance sheet, and information on management remuneration. 3.1 PRODUCTION FOR OWN USE
EUR mill. 2013 2012
Component production 2.0 1.4Heavy maintenance 0.6 0.3Total 2.5 1.7
3.2 OPERATIONAL EXPENSES BY CURRENCY
EUR mill. 2013 2012
EUR 1,302.5 1,254.1USD 983.9 1,036.9JPY 31.6 34.8CNY 15.9 10.7SEK 13.2 14.1Other currencies 79.5 78.0Total 2,426.5 2,428.7
Currency hedging policies are described in the note 5.5 Management of financial risks.
3.3 OTHER RENTS
EUR mill. 2013 2012
Rental of cargo capasity 18.7 18.4Other rental of flight capasity 93.2 63.3Office and other rents 40.1 41.5Total 152.0 123.2
3.4 OTHER EXPENSES
EUR mill. 2013 2012
IT expenses and booking fees 82.3 84.5Other items 135.8 145.7Total 218.1 230.2
Other items consists of several items, none of which are individually significant. = Content of the section
Aging analysis of trade receivables 2013 2012
Not overdue 112.6 116.3Overdue less than 60 days 5.1 0.8Overdue more than 60 days 5.5 3.6Total 123.2 120.7
The Group has recognised credit losses from trade receivables 0.8 million euros (3.6) during the financial year. Trade receivables do not con-tain significant credit risk because of diversity in customer basis. The maximum exposure to credit risk at the reporting date is the carrying value of each class of receivable mentioned above. The Group does not hold any collateral as security.
FINNAIR ANNUAL REPORT 2013
STRATEGY / CUSTOMERS / OPERATIONS / EMPLOYEES / SOCIETY / FINANCE / GOVERNANCE / GRI 89

Audit fees in other expenses
EUR mill. 2013 2012
PricewaterhouseCoopers Oy Auditor's fees 0.2 0.2 Tax advising 0.1 0.0
Other fees 0.1 0.1Total 0.4 0.3
3.5 ACCRUALS RELATED TO OTHER EXPENSES
EUR mill. 2013 2012
Jet fuels and traffic charges 78.3 80.8Aircraft materials and overhaul 11.9 12.0Expenses for tour operations 10.3 11.9Other items 68.6 64.7Total 169.0 169.3
Other items consists of several items, none of which are individually significant.
3.6 INVENTORIES
EUR mill. 2013 2012
Materials and supplies 19.8 15.1Work in progress 0.1 2.0Total 19.9 17.1
The cost of inventories recognised as expense and included in aircraft materials was 33.6 million euros (32.5). In the financial year a write-down of 0.1 million euros (2.1) was recognised as expense related to inventories. Inventories recognised as assets held for sale were 1.3 mil-lion euros in financial year 2013 (12.3).
3.7 PROVISIONS
InventoriesThe Group's inventories include the aircraft spare parts and work in progress related to overhaul of aircrafts. Inventories are car-ried at the lower of acquisition cost and net realisable value. Inventory valuation is based on the average cost method. The acqui-sition costs of inventories also include a proportion of variable and fixed production overheads.
ProvisionsProvisions are recognised when the Group has a present legal or constructive obligation as the result of a past event, the fulfil-ment of the payment obligation is probable, and a reliable estimate of the amount of the obligation can be made. The amount to be recognised as provisions corresponds to the management's best estimate of the expenses that will be necessary to meet the obligation at the end of the reporting period.
Restructuring provisions are recognised when the Group has prepared a detailed restructuring plan and has begun to imple-ment the plan or has announced it. A restructuring plan must include at least the following information: the operations affected, the main operating points affected, the workplace locations, working tasks and estimated number of the people who will be paid compensation for the ending of their employment, the likely costs and the date of implementation of the plan.
The Group is obliged to return leased aircraft at the required redelivery condition. To fulfil these maintenance obligations the Group has recognised airframe heavy maintenance, engine maintenance and engine life limited part provisions. The basis for the provision is flight hours flown during the maintenance period.
EUR mill.
Aircraft maintenance
provisionRestructuring
provision 2013
Aircraft maintenance
provisionRestructuring
provision 2012
Provision at the beginning of period 109.7 10.8 120.5 115.8 17.1 132.9Provision for the period 20.2 17.4 37.6 19.2 10.8 30.0Provision used -33.1 -10.8 -43.9 -24.1 -17.1 -41.2Exhange rate differences -4.5 -4.5 -1.2 -1.2Total 92.4 17.4 109.8 109.7 10.8 120.5
Of which non-current 69.3 69.3 82.3 82.3Of which current 23.1 17.4 40.5 27.4 10.8 38.2Total 92.4 17.4 109.8 109.7 10.8 120.5
Non-current aircraft maintenance provisions are expected to be used by 2020.The restructuring provision for personnel and the rents of empty premises is part of the structural change of the Group.
= Accounting principles
FINNAIR ANNUAL REPORT 2013
STRATEGY / CUSTOMERS / OPERATIONS / EMPLOYEES / SOCIETY / FINANCE / GOVERNANCE / GRI 90

3.9 EMPLOYEE BENEFITS
3.9.1 EMPLOYEE BENEFIT EXPENSES AND SHARE-BASED PAYMENTS
Share-based paymentsFinnair provides a number of share-based compensation plans for its employees, under which the Group receives services from employees as consideration for share-based payments. For the awards to be paid on share-based incentive plans for key per-sonnel, performance criteria set by the Board of Directors need to be met. Share-based savings plan for employees (FlyShare) requires the employees to remain in Finnair's service for the defined period but does not depend on any performance criteria.
The total expense for share-based payments is recognised over the vesting period, which is the period over which all of the specified vesting conditions are to be satisfied. The portion of the earned reward that the participants receive in shares is accounted for as an equity settled transaction, and the portion of the earned reward settled in cash covering the tax and other charges, is accounted for as cash settled transaction. The equity-settled share awards are valued based on the market price of the Finnair share as of the grant date, and recognized as an employee benefit expense over the vesting period with corresponding entry in the equity. The liability resulting from the cash-settled transactions is measured based on the market price of the Finnair share at the balance sheet date and accrued as an employee benefit expense for service period with corresponding entry in the liabilities until the settlement date.
Termination benefitsTermination benefits are payable when employment is terminated by the Group before the normal retirement date, or whenever an employee accepts voluntary redundancy in exchange for these benefits. The Group recognises termination benefits when it is demonstrably committed to a termination when the entity has a detailed formal plan to terminate the employment of current employees without possibility of withdrawal. In the case of an offer made to encourage voluntary redundancy, the termination benefits are measured based on the number of employees expected to accept the offer. For accounting principles related to Pensions, see note 3.9.2 for more information
3.8 ITEMS EXCLUDED FROM OPERATIONAL RESULT
Operational result do not include non-recurring items and other items affecting comparability. Fair value changes of derivatives recognised through income statement and fair value changes of foreign currency denominated fleet maintenance reserves are considered as items af-fecting comparability in Finnair.
EUR mill. 2013 2012
Fair value changes of derivatives 17.2 -5.2Fair value changes of foreign currency denominated fleet maintenance reserves 4.5 1.2Capital gains on sales of tangible assets 1.1 22.2Non-recurring items -26.8 -27.6Total -4.0 -9.4
= Accounting principles
Staff costs
EUR mill. 2013 2012
Wages and salaries 304.4 341.8Pension expenses 58.6 64.1
Defined contribution schemes 51.1 57.3Defined benefit schemes 7.5 6.8
Other social expenses 20.9 23.3Total 383.9 429.2Staff costs included in non-recurring items 17.9 12.2Total staff costs in income statement 401.8 441.4
In Finnair, the total salary of personnel consists of fixed pay, short- and long-term incentives, fringe benefits and other personnel benefits. The total amount of short-term incentives recognised for 2013 were 5.1 million euros (8.2). In addition to staff costs, non-recurring items include personnel related restructuring costs of 17.9 million euros (12.2) as agreed in the Group's statutory employer-employee negotia-tions. Including non-recurring items, total staff costs amounted to 401.8 million euros (441.4).
Transfer to Personnel Fund
Finnair has a Personnel Fund that is owned and controlled by personnel. A share of Finnair’s profits is allocated to the fund. The share of profit allocated to the fund is determined on the basis of the targets set by the Board of Directors. The CEO and other members of the Ex-ecutive Board are not members of the Personnel Fund. Personnel Fund is obliged to invest part of the bonus in Finnair Plc’s shares. In 2013 profits were not allocated to the fund. From 2012 results a total of 5 million euros were transferred to the fund, of which 4.8 million euros was recognised during 2012 and 0.2 million euros in 2013 results.
Employee benefit related accruals
EUR mill. 2013 2012
Holiday payments 66.4 66.0Other employee related accrued expenses 28.3 38.3Employee benefit related accruals total 94.7 104.3
Other employee related accrued expenses mainly include witholding tax and accrued expenses related to social security costs. In addition, restructuring provisions included in the current provisions amounted to 15.7 million euros (10.8).
FINNAIR ANNUAL REPORT 2013
STRATEGY / CUSTOMERS / OPERATIONS / EMPLOYEES / SOCIETY / FINANCE / GOVERNANCE / GRI 91
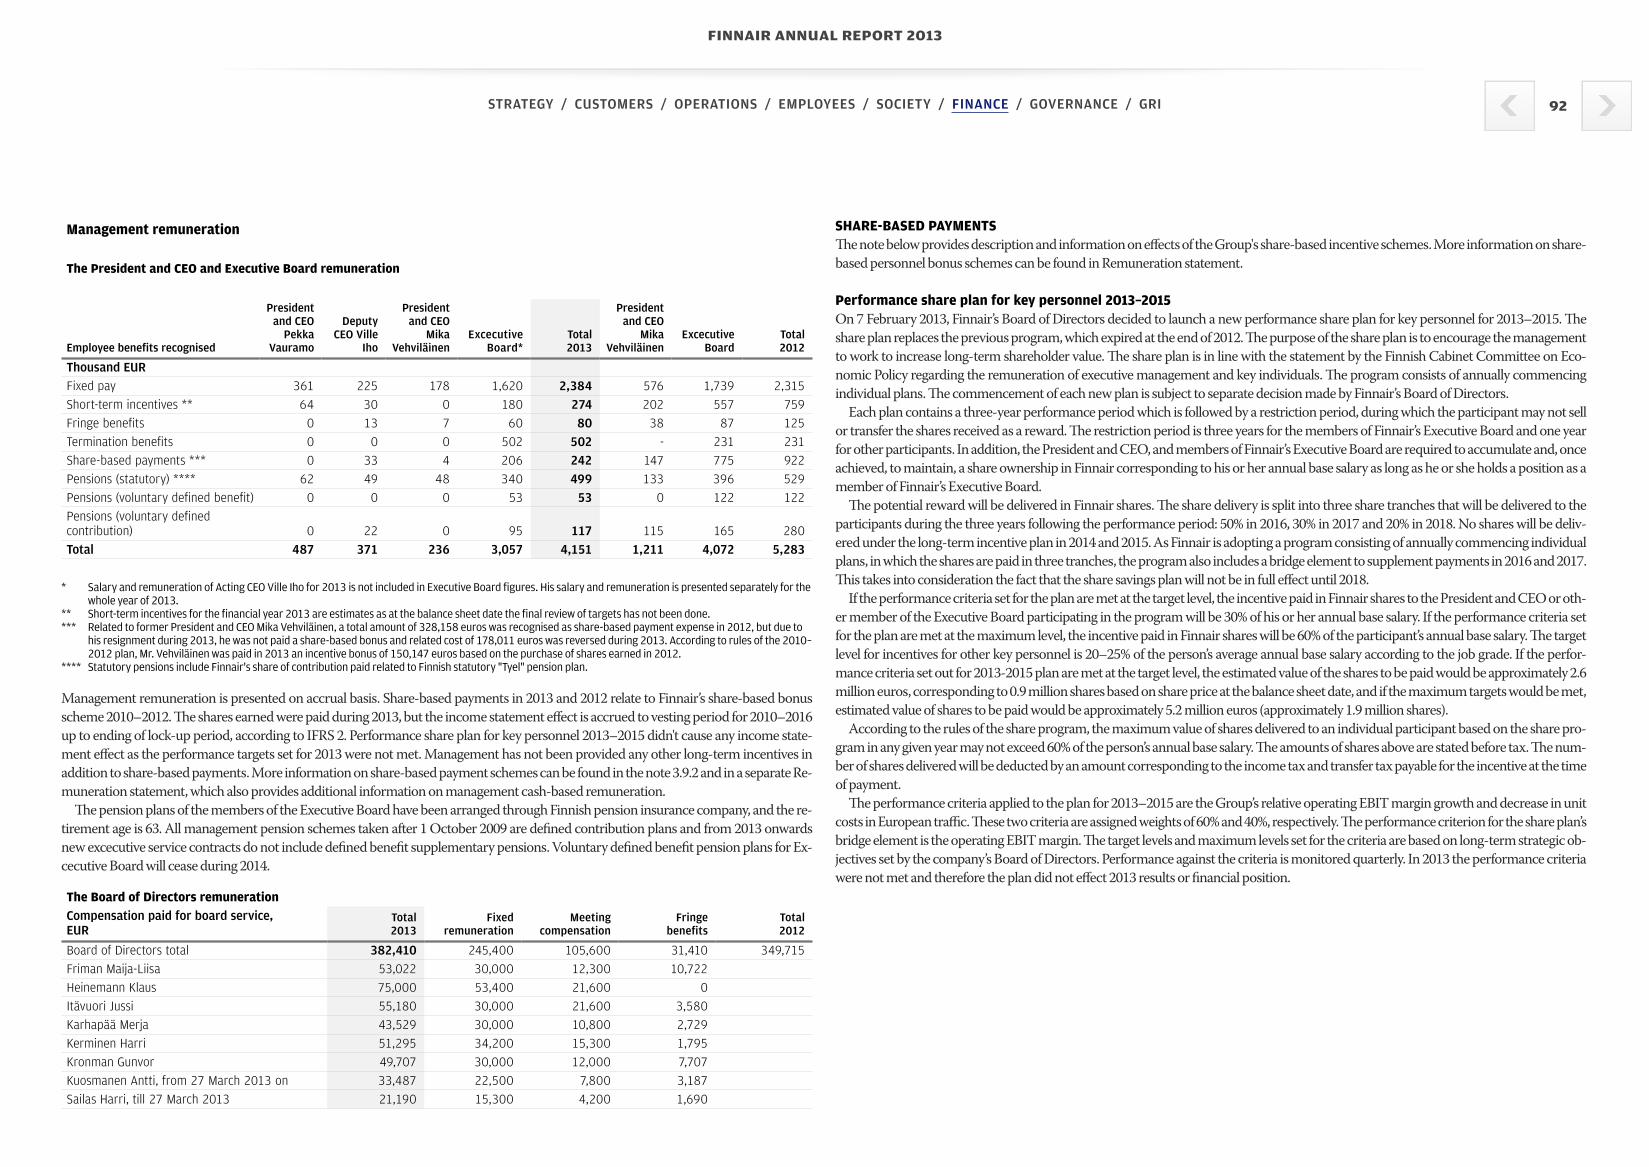
Management remuneration
The President and CEO and Executive Board remuneration
Employee benefits recognised
President and CEO
Pekka Vauramo
Deputy CEO Ville
Iho
President and CEO
Mika Vehviläinen
Excecutive Board*
Total 2013
President and CEO
Mika Vehviläinen
Excecutive Board
Total 2012
Thousand EURFixed pay 361 225 178 1,620 2,384 576 1,739 2,315Short-term incentives ** 64 30 0 180 274 202 557 759Fringe benefits 0 13 7 60 80 38 87 125Termination benefits 0 0 0 502 502 - 231 231Share-based payments *** 0 33 4 206 242 147 775 922Pensions (statutory) **** 62 49 48 340 499 133 396 529Pensions (voluntary defined benefit) 0 0 0 53 53 0 122 122Pensions (voluntary defined contribution) 0 22 0 95 117 115 165 280Total 487 371 236 3,057 4,151 1,211 4,072 5,283
* Salary and remuneration of Acting CEO Ville Iho for 2013 is not included in Executive Board figures. His salary and remuneration is presented separately for the whole year of 2013.
** Short-term incentives for the financial year 2013 are estimates as at the balance sheet date the final review of targets has not been done.*** Related to former President and CEO Mika Vehviläinen, a total amount of 328,158 euros was recognised as share-based payment expense in 2012, but due to
his resignment during 2013, he was not paid a share-based bonus and related cost of 178,011 euros was reversed during 2013. According to rules of the 2010–2012 plan, Mr. Vehviläinen was paid in 2013 an incentive bonus of 150,147 euros based on the purchase of shares earned in 2012.
**** Statutory pensions include Finnair's share of contribution paid related to Finnish statutory "Tyel" pension plan.
Management remuneration is presented on accrual basis. Share-based payments in 2013 and 2012 relate to Finnair’s share-based bonus scheme 2010–2012. The shares earned were paid during 2013, but the income statement effect is accrued to vesting period for 2010–2016 up to ending of lock-up period, according to IFRS 2. Performance share plan for key personnel 2013–2015 didn't cause any income state-ment effect as the performance targets set for 2013 were not met. Management has not been provided any other long-term incentives in addition to share-based payments. More information on share-based payment schemes can be found in the note 3.9.2 and in a separate Re-muneration statement, which also provides additional information on management cash-based remuneration.
The pension plans of the members of the Executive Board have been arranged through Finnish pension insurance company, and the re-tirement age is 63. All management pension schemes taken after 1 October 2009 are defined contribution plans and from 2013 onwards new excecutive service contracts do not include defined benefit supplementary pensions. Voluntary defined benefit pension plans for Ex-cecutive Board will cease during 2014.
The Board of Directors remunerationCompensation paid for board service,EUR
Total 2013
Fixed remuneration
Meeting compensation
Fringe benefits
Total 2012
Board of Directors total 382,410 245,400 105,600 31,410 349,715Friman Maija-Liisa 53,022 30,000 12,300 10,722Heinemann Klaus 75,000 53,400 21,600 0Itävuori Jussi 55,180 30,000 21,600 3,580Karhapää Merja 43,529 30,000 10,800 2,729Kerminen Harri 51,295 34,200 15,300 1,795Kronman Gunvor 49,707 30,000 12,000 7,707Kuosmanen Antti, from 27 March 2013 on 33,487 22,500 7,800 3,187Sailas Harri, till 27 March 2013 21,190 15,300 4,200 1,690
SHARE-BASED PAYMENTSThe note below provides description and information on effects of the Group's share-based incentive schemes. More information on share-based personnel bonus schemes can be found in Remuneration statement.
Performance share plan for key personnel 2013–2015 On 7 February 2013, Finnair’s Board of Directors decided to launch a new performance share plan for key personnel for 2013–2015. The share plan replaces the previous program, which expired at the end of 2012. The purpose of the share plan is to encourage the management to work to increase long-term shareholder value. The share plan is in line with the statement by the Finnish Cabinet Committee on Eco-nomic Policy regarding the remuneration of executive management and key individuals. The program consists of annually commencing individual plans. The commencement of each new plan is subject to separate decision made by Finnair’s Board of Directors.
Each plan contains a three-year performance period which is followed by a restriction period, during which the participant may not sell or transfer the shares received as a reward. The restriction period is three years for the members of Finnair’s Executive Board and one year for other participants. In addition, the President and CEO, and members of Finnair’s Executive Board are required to accumulate and, once achieved, to maintain, a share ownership in Finnair corresponding to his or her annual base salary as long as he or she holds a position as a member of Finnair’s Executive Board.
The potential reward will be delivered in Finnair shares. The share delivery is split into three share tranches that will be delivered to the participants during the three years following the performance period: 50% in 2016, 30% in 2017 and 20% in 2018. No shares will be deliv-ered under the long-term incentive plan in 2014 and 2015. As Finnair is adopting a program consisting of annually commencing individual plans, in which the shares are paid in three tranches, the program also includes a bridge element to supplement payments in 2016 and 2017. This takes into consideration the fact that the share savings plan will not be in full effect until 2018.
If the performance criteria set for the plan are met at the target level, the incentive paid in Finnair shares to the President and CEO or oth-er member of the Executive Board participating in the program will be 30% of his or her annual base salary. If the performance criteria set for the plan are met at the maximum level, the incentive paid in Finnair shares will be 60% of the participant’s annual base salary. The target level for incentives for other key personnel is 20–25% of the person’s average annual base salary according to the job grade. If the perfor-mance criteria set out for 2013-2015 plan are met at the target level, the estimated value of the shares to be paid would be approximately 2.6 million euros, corresponding to 0.9 million shares based on share price at the balance sheet date, and if the maximum targets would be met, estimated value of shares to be paid would be approximately 5.2 million euros (approximately 1.9 million shares).
According to the rules of the share program, the maximum value of shares delivered to an individual participant based on the share pro-gram in any given year may not exceed 60% of the person’s annual base salary. The amounts of shares above are stated before tax. The num-ber of shares delivered will be deducted by an amount corresponding to the income tax and transfer tax payable for the incentive at the time of payment.
The performance criteria applied to the plan for 2013–2015 are the Group’s relative operating EBIT margin growth and decrease in unit costs in European traffic. These two criteria are assigned weights of 60% and 40%, respectively. The performance criterion for the share plan’s bridge element is the operating EBIT margin. The target levels and maximum levels set for the criteria are based on long-term strategic ob-jectives set by the company’s Board of Directors. Performance against the criteria is monitored quarterly. In 2013 the performance criteria were not met and therefore the plan did not effect 2013 results or financial position.
FINNAIR ANNUAL REPORT 2013
STRATEGY / CUSTOMERS / OPERATIONS / EMPLOYEES / SOCIETY / FINANCE / GOVERNANCE / GRI 92

Finnair Plc’s share-based bonus scheme 2010–2012The Board of Directors of Finnair Plc approved a share-based bonus scheme for 2010–2012 on 4 February 2010. In the share bonus scheme, key individuals had the possibility of receiving company shares and cash for a three-year performance period according to how financial targets set for the performance period have been achieved.
The Board of Directors decided annually the financial targets to be set for each performance period. Achieving the targets set for the per-formance period determined how large proportion of the maximum bonus and of the incentive based on the acquisition of Finnair shares will be paid. In a three-year period, the total of the share bonuses, however, could not exceed three years’ gross earnings.
Incentive bonus based on the purchase of sharesIf key individuals belonging to the share bonus scheme purchased Finnair Plc shares during 2010-2012, they were paid a cash incentive bo-nus in the spring of the year following the acquisitions. The incentive bonus was equal to the proportion of the value of the shares, acquired by the key individual, corresponding to the percentage fulfilment of set targets. This bonus will be supplemented by a cash sum, which in most cases will correspond to taxes and tax-related payments arising to key individuals from the receipt of their bonus. In any single year of the performance period the number of shares acquisition taken into account is at most half of the key individual's share bonus allocation, i.e. the number of shares that the key individual can at most receive as a share bonus for the year in question. The size of the cash bonus is determined as follows: number of shares acquired by key individual x the company's share price at the time of payment x the target realisa-tion percentage x 2.5.
Shares delivered based on the plan and effects of the plan on results and financial positionShares were earned annually in the period 2010–2012. The long-term incentive for the three-year period was achieved at an average level of 43%. This share-based incentive for the full three-year period was paid in spring 2013, and total amount of 708,679 shares were delivered. At the same time, a cash bonus intended for payment of taxes was paid, amounting to 1.5 times the value of the shares at the time of pay-ment. After the payment of shares, there is a three-year embargo on their sale and shares are held in lock-up. A total amount of 5,297,346 euros was paid related to the plan, of which 1,795,580 euros was delivered as shares, 2,693,370 euros paid as cash to cover tax payments and 808,396 euros paid as incentive bonus based on the purchase of shares.
The income statement effect related to the plan has been accrued to vesting period 2010-2016 based on the applied IFRS 2 standard. The effect on 2013 results for the program totalled 857,134 euros (2,450,437) of which the amount settled in shares amounted to 534,461 euros.
FlyShare employee share savings plan 2013–2014On 27 March 2013, Finnair’s Board of Directors decided to launch FlyShare, an employee share savings plan. The objective of the plan is to encourage employees to become shareholders in the company, and to thereby strengthen the employees’ interest in the development of Finnair’s shareholder value and reward them in the long term.
Through the plan, each eligible Finnair employee is offered the opportunity to save part of his or her salary to be invested in Finnair shares. The maximum monthly savings are 8% and the minimum 2% of each participant’s gross base salary per month, with the annual maximum savings set at EUR 8,000 per participant. Shares are purchased with the accumulated savings at the market price quarterly, after the publi-cation dates of Finnair’s interim reports. The first purchases of shares were made in October–November 2013.
To increase the attractiveness of the plan, Finnair awarded 20 bonus shares in October 2013 to each employee that participated in at least the first three months of the plan. The related effect has been recognised as expense during period. In spring 2016, Finnair will award each participating employee one share for each two shares purchased. The awarded additional shares are taxable income for the recipient. The cost related to additional shares delivered at 2016 is recognised as expense during vesting period.
Total savings during 2013-2014 cannot exceed 2.5 million euros, which calculated with the closing share price of 30 December 2013 (2.77 euros per share) would correspond approximately 0.9 million shares.
Effect of FlyShare share savings plan on Group's results and financial position, thousand EUR 2013
Fair value of matching rights delivered during period 275Total income statement effect of share-based payments 76 Share-based payments, share-settled 69 Liabiltity related to share-based payments at the closing date 7
FINNAIR ANNUAL REPORT 2013
STRATEGY / CUSTOMERS / OPERATIONS / EMPLOYEES / SOCIETY / FINANCE / GOVERNANCE / GRI 93

3.9.2 PENSIONS
Change in accounting principlesFinnair has adopted the revised standard concerning employee benefits (IAS19 revised) from 2013 onwards due to which account-ing principles of pensions have changed. Previously applied corridor method in recognising actuarial gains and losses is no longer used. All the actuarial gains and losses are recognised as they occur through other comprehensive income. Items recognized in other comprehensive income are no longer recycled through profit and loss. The standard has been applied retrospectively and comparative figures of 2012 have been restated to be in line with the new changed accounting principles. The effect of the restate-ment is presented in the note 6.5 Change of accounting principle.
Revised accounting principlesPension schemes are classified as defined benefit and defined contribution plans. Payments made into defined contribution pen-sion plans are recognised in the income statement in the period to which the payment applies. Typically defined benefit plans de-fine an amount of pension benefit that an employee will receive on retirement, usually dependent on one or more factors such as age, years of service and compensation. Current service cost is the present value of the post employment benefit, which is earned by the employees during the year and it is recognised as employee benefit expense. The liability recognised in the balance sheet in respect of defined pension plans is the present value of the defined benefit obligation at the end of the reporting period less the fair val-ue of plan assets, The defined benefit obligation is calculated annually by independent actuaries using the projected unit credit method. The present value of the defined benefit obligations is determined by discounting the estimated future cash flows using interest rates of high-quality corporate bonds that are denominated in the currency in which the benefits will be paid, and that have terms to maturity approximating to the terms of the related pension obligation.
Actuarial gains and losses arising from experience adjustments and changes in actuarial assumptions are charged or credited to equity in other comprehensive income in the period in which they arise.
The present value of the pension obligations depends on a number of factors that are determined on an actuarial basis using a number of assumptions. Any changes in these assumptions will impact the carrying amount of pension obligations. The note below includes description of exposure to most significant risks and sensitivity analysis on impacts of changes in actuarial assumptions.
Description of pension plans in FinnairThe statutory pension plan of the employees of the Group’s Finnish companies has been arranged in a Finnish pension insurance company. The statutory pension plan is a defined contribution plan. The Group's foreign sales offices and subsidiaries have various defined contri-bution plans that comply with local rules and practices. The voluntary pension schemes of the parent company’s five members of the Ex-cecutive Board are arranged in a pension insurance company and the retirement age under these agreements is in average 63 years. These pension schemes are also defined contribution schemes except for 2 persons who have a defined benefit scheme, that will end during 2014. Other (voluntary) pension plans of the Group’s domestic companies have been arranged in Finnair Plc’s Pension Fund, in which the pen-sion schemes are defined benefit plans. These pension plans cover old age pensions, disability and survivors' pensions. According to Finnish legislation the pension fund is fully funded.
Exposure to most signifigant risksVolatility of plan assets: Some of the plan assets are invested in equities which causes volatility but which are in the long run expected to pro-vide higher returns than corporate bonds. Discount rate of plan obligations is defined based on interest rates of corporate bonds.
Changes in bond yield: A decrease in corporate bond yields increases plan obligations due to the fact that the pension obligation is dis-counted to net present value with a rate that is based on corporate bond rates. The increase is partly netted with the increase of bond fair values in plan assets.
Life expectancy: The most significant part of the provided pension benefits relate to old age pensions. Therefore, an increase in life ex-pectancy rate results in an increase of plan obligations.
Inflation risk: Pension obligations are linked to inflation which is why higher inflation leads to increased obligations. As only some of the plan assets increase with inflation, an increase in inflation will likely decrease the solvency of the pension plan.
Defined benefit pension schemesEUR mill. 2013 2012
Items recognised in the income statementCurrent service costs 8.0 7.2Past service cost -0.4 2.3Settlements and curtailments 0.0 -0.3
Service cost total 7.6 9.2Net interest expenses -0.1 -2.3Included in personnel expenses total 7.5 6.8
Amounts recognised through other comprehensive incomeExperience adjustment on plan obligation 16.5 18.1Changes in financial actuarial assumptions 0.2 64.9Changes in demographical actuarial assumptions -0.8 0.0Net return on plan assets -16.3 -35.1Amounts recognised through other comprehensive income total -0.4 47.8
Number of persons involved, pension fund 5,048 5,271Management pension (defined benefit), persons involved 2 4
Items recognised in the balance sheetEUR mill. 2013 2012
Present value of funded obligations 406.9 392.5Fair value of scheme assets -396.3 -388.8Net defined benefit liability 10.6 3.6
The net defined benefit liability in 2013 includes 10.5 million euros (3.1) related to defined benefit plans insured through pension fund and 0.1 million euros (0.5) related to defined benefit plans of management.
Plan assets of the pension fund include Finnair Plc shares with a fair value of 0.4 million euros (0.3) and buildings used by the Group with a fair value of 36.2 million euros (36.2). = Accounting principles
= Critical accounting estimates
FINNAIR ANNUAL REPORT 2013
STRATEGY / CUSTOMERS / OPERATIONS / EMPLOYEES / SOCIETY / FINANCE / GOVERNANCE / GRI 94

Changes in pension obligationsEUR mill. 2013 2012
Net present value of pension obligations at 1 January 392.5 309.4Current service cost 8.0 7.2
Past service cost -0.4 2.3
Settlements and curtailments 0.0 -0.7
Interest expense 12.4 14.1
Expenses recognised in income statement 19.9 22.8
Changes in actuarial assumptions -0.6 64.9
Experience adjustment on plan obligation 16.5 18.1Remeasurements recognised through OCI 15.9 82.9Benefits paid -21.5 -22.7
Net present value of pension obligations 406.9 392.5
Changes in plan assetsEUR mill. 2013 2012
Fair value of plan assets at 1 January 388.8 352.9
Expected return on plan assets 12.5 16.5
Settlements and curttailments 0.0 -0.4
Items recognised through profit and loss 12.5 16.0
Acturial gain (loss) on plan assets 16.3 35.1
Items recognised through OCI 16.3 35.1
Contributions paid 0.2 7.5
Benefits paid -21.5 -22.7
Fair value of plan assets at 31 December 396.3 388.8
Plan assets are comprised as follows% 2013 2012
Listed shares 22.0 18.8
Debt instruments 50.0 55.7
Property 17.0 17.2
Other 11.0 8.3
Total 100.0 100.0
Defined benefit schemes: principal actuarial assumptions2013 2012
Discount rate 3.25% 3.25%
Inflation 2.0% 2.0%
Annual rate of future salary increases 3.00% 3.00%
Future pension increases 2.10% 2.10%
Estimated remaining years of service 13 12
Defined benefit schemes: principal actuarial assumptions
Actuarial assumptionChange in
assumption
Impact when increase in assumption,
EUR mill. %
Impact when decrease in assumption,
EUR mill. %
Discount rate 0.25% -13.4 -3.29 13.0 3.19Inflation 0.25% 14.1 3.47 -13.6 -3.35Annual rate of future salary increases 0.25% 3.8 0.93 -3.8 -0.92Future pension increases 0.25% 10.3 2.53 -10.1 -2.47Life expectancy at birth 1 year 10.8 2.67 -10.6 -2.61
According to Finnish legislation, pension fund needs to be fully funded. Expected contribution payments for future five years are approxi-mately 38 million euros. The amount of payments depends on future returns on plan assets.
The weighted average duration of defined benefit obligation is 13.92 years. The weighted average duration is calculated with discount rate 3.25%.
Sensitivity analysisSensitivity analysis describes the effect of change in actuarial assumptions to net defined benefit obligation. The analysis is based on a change in an assumption while holding all other assumptions constant. The method used is the same as which has been applied when measuring the defined benefit obligation recognised in balance sheet.
FINNAIR ANNUAL REPORT 2013
STRATEGY / CUSTOMERS / OPERATIONS / EMPLOYEES / SOCIETY / FINANCE / GOVERNANCE / GRI 95

4 AIRCRAFT AND OTHER INTANGIBLE AND TANGIBLE ASSETS AND LEASING ARRANGEMENTS
Aircraft and other intangible and tangible assets and leasing arrangements include particularly notes related to aircraft fleet. Notes related to the aircraft operated by the Group, both owned and leased aircraft under different kind of lease arrangements, are combined in this section so that the overview of the fleet would be easier to perceive.
4.1 INTANGIBLE ASSETS
Intangible assets are stated at historical cost less accumulated amortisation and impairment loss if applicable. Depreciation and impairment of intangible assets are based on the following expected economic lifetimes:• Goodwill: impairment testing• Computer software: 3–8 years• Other intangible assets: 3–10 years
GoodwillGoodwill represents the excess of the cost of an acquisition over the fair value of the Group's share of the net identifiable assets of the acquired subsidiary at the date of acquisition. Goodwill on acquisition of subsidiaries is included in intangible assets. Good-will is tested annually for impairment and carried at cost less accumulated impairment losses. Impairment losses on goodwill are not reversed. Gains and losses on the disposal of an entity include the carrying amount of goodwill relating to the entity sold.
Goodwill is allocated to cash-generating units for the purpose of impairment testing. The allocation is made to those cash-gen-erating units that are expected to benefit from the business combination in which the goodwill arose, identified according to op-erating segment.
Other intangible assetsOther intangible assets include mainly computer software, capitalised renovation costs of office rentals and connection fees. Major software development costs are capitalised when they are expected to generate economic value over a one year period. Acquired user rights and licenses are as computer software at the acquisition cost, including the costs of making the license and software ready for use. Maintenance and and minor development costs are recognised as expense at the time they occur. Computer software and other intangible assets are depreciated over a useful life of 3–10 years, except for connection fees which are not depreciated.
Research and development costsExcept for major software development costs, research and development costs are expensed as they occur. Research and devel-opment of aircraft, systems and operations is conducted primarily by the manufacturers.
ImpairmentOn every closing date the Group reviews individual intangible asset items for any indication of impairment losses. An asset's car-rying amount is written down immediately to its recoverable amount if it is greater than the estimated recoverable amount. The need for impairment is examined on the cash generating unit level.
Assets that have an indefinite useful life, such as goodwill, are not subject to amortisation and are tested annually for impair-ment.
Intangible assets 2013
EUR mill. GoodwillOther
intangible assets Total
Acquisition costAcquisition cost 1 Jan 2013 1.2 97.6 98.8Additions 1.5 1.5Disposals -5.3 -5.3Transfer between items 0.5 0.5Acquisition cost 31 Dec 2013 1.2 94.2 95.5
Accumulated depreciation and impairmentAccumulated depreciation and impairment 1 Jan 2013 0.0 -73.4 -73.4Depreciation -8.1 -8.1Accumulated planned depreciation of disposals 5.3 5.3Accumulated depreciation and impairment 31 Dec 2013 0.0 -76.2 -76.2
Book value 31 Dec 2013 1.2 18.0 19.3
Intangible assets 2012
EUR mill. GoodwillOther
intangible assets Total
Acquisition costAcquisition cost 1 Jan 2012 1.2 100.2 101.4Additions 4.8 4.8Disposals -7.4 -7.4Acquisition cost 31 Dec 2012 1.2 97.6 98.8
Accumulated depreciation and impairmentAccumulated depreciation and impairment 1 Jan 2012 0.0 -69.1 -69.1Depreciation -11.1 -11.1Accumulated planned depreciation of disposals 6.8 6.8Accumulated depreciation and impairment 31 Dec 2012 0.0 -73.4 -73.4
Book value 31 Dec 2012 1.2 24.3 25.5
The goodwill is recognised 0.5 million euros in Airline Business and 0.7 million euros in Travel Services. The recoverable cashflows used in the impairment test are determined based on value-in-use calculations in both segments. The cash-flow projections for the next year are based on forecasts approved by management and after that period the cashflows are extrapolated by using 2 % growth factor.
Travel Services' goodwill is allocated to the business operations of Aurinko Oü (former Horizon Travel Oü) and the key assumptions used for value in use calculations are as follows:WACC pretax 10.0%EBITDA 1.0%Growth rate 2%
The increase of WACC by 27.5 per cent points in the whole period under review or the decrease of EBITDA by 67 % means that the recov-erable amount is equal to carrying amount for the asset. = Content of the section
= Accounting principles
FINNAIR ANNUAL REPORT 2013
STRATEGY / CUSTOMERS / OPERATIONS / EMPLOYEES / SOCIETY / FINANCE / GOVERNANCE / GRI 96

4.2 TANGIBLE ASSETS
Tangible assets are stated at historical cost less accumulated depreciation and impairment loss if applicable. The cost of an as-set includes costs directly attributed to preparing an asset for its intended use. Tangible assets comprise mainly aircraft and buil-dings. The acquisition cost of aircraft is allocated to the aircraft body, engines and heavy maintenance and these are depreciated as separate assets. Depreciation of tangible assets is based on the following expected economic lifetimes:• Buildings, over 50 years from time of acquisition to a residual value of 10% or 3–7% of the diminishing balances• Aircraft and engines (aircraft) as well as flight simulators (other equipment) on a straight-line basis as follows:
- Airbus A320 and Embraer fleet, over 20 years to a residual value of 10%- Airbus A330 fleet, over 18 years to a residual value of 10%- New Airbus A340 family aircraft, over 15 years to a residual value of 10%- Used jet aircraft more than six years old, over 10 years to a residual value of 10%- Turboprop aircraft, over 12 years to a residual value of 10%- Aircraft to be withdrawn, fully on a straight-line basis during the useful life outlined in the fleet modernization plan
• Heavy maintenance of aircraft, on a straight-line basis during the maintenance period• Embraer components (aircraft), over 20 years to a residual value of 10%• Airbus components (aircraft), over 15 years to a residual value of 10%• Other tangible assets, 23% of the diminishing balances
Land areas are not depreciated. The residual values and estimated useful lives of assets are assessed at each closing date and if they differ significantly from previous estimates, the depreciation periods and residual values are changed accordingly.
Significant expenses of modernisation and improvement projects (mainly aircraft modifications) are recognised as a separate asset when it is probable that future economic benefits associated with the item will flow to the Group and the acquisition cost can be measured reliably. The carrying amount of the replaced parts is written down. Other repair and maintenance expenses are charged to the income statement during the financial period in which they are incurred.
Gains on disposal of tangible assets are included in operating income in the income statement, and losses in non-recurring items. Gains and losses are not included in operational result.
ImpairmentOn every closing date the Group reviews individual tangible asset items for any indication of impairment losses. An asset's car-rying amount is written down immediately to its recoverable amount if it is greater than the estimated recoverable amount. The need for impairment is examined on the cash generating unit level.
The recoverable amount is the higher of the asset's fair value less costs to sell and its value in use. The value in use is based on the expected discounted future net cash flows obtainable from the asset or cash-generating unit. An impairment loss is recog-nised in the income statement when the carrying amount of the asset is greater than the recoverable amount. If the recoverable amount of the asset has changed after the impairment loss was recognised, the impairment loss is reversed up to the carrying amount, excluding impairment loss, of the asset.
Impairment testingThe recoverable amounts of cash generating units have been determined in calculations based on value in use. The preparation of these calculations requires the use of estimates. Estimates are based on budgets and forecasts, which inherently contain some degree of uncertainty. The main uncertainty factors in calculations are the USD/EUR and JPY/EUR exchange rates, unit revenue, estimated sales volumes and jet fuel price.
= Accounting principles = Critical accounting estimates
Tangible assets 2013
EUR mill. Land Buildings AircraftOther
equipmentAdvances
paid Total
Acquisition costAcquisition cost 1 Jan 2013 0.7 148.0 1,987.3 84.3 32.7 2,253.0Additions 0.1 33.5 2.2 37.9 73.7Disposals -1.8 -12.7 -14.5Transfer between items 3.4 1.9 -4.7 0.6Transfer to assets held for sale -5.6 -5.6Acquisition cost 31 Dec 2013 0.7 148.1 2,016.9 75.7 66.0 2,307.3
Accumulated depreciation and impairmentAccumulated depreciation and impairment 1 Jan 2013 0.0 -110.5 -729.7 -50.2 -890.4Depreciation -1.8 -107.5 -5.9 -115.2Accumulated planned depreciation of disposals 1.7 6.3 8.0Accumulated depreciation of assets classified as held for sale 0.0 0.0Accumulated depreciation and impairment 31 Dec 2013 0.0 -112.3 -835.5 -49.8 0.0 -997.6
Book value 31 Dec 2013 0.7 35.8 1,181.4 25.9 66.0 1,309.8
Tangible assets 2012
EUR mill. Land Buildings AircraftOther
equipmentAdvances
paid Total
Acquisition costAcquisition cost 1 Jan 2012 0.7 160.4 2,022.1 98.7 6.5 2,288.4Additions 0.2 33.5 3.3 26.2 63.2Disposals -12.6 -53.9 -8.0 -74.5Transfer to assets held for sale -14.4 -9.7 -24.1Acquisition cost 31 Dec 2012 0.7 148.0 1,987.3 84.3 32.7 2,253.0
Accumulated depreciation and impairmentAccumulated depreciation and impairment 1 Jan 2012 0.0 -108.4 -658.1 -53.7 -820.2Depreciation -2.2 -110.8 -6.6 -119.6Accumulated planned depreciation of disposals 0.1 35.2 3.5 38.8Accumulated depreciation of assets classified as held for sale 4.0 6.6 10.6Accumulated depreciation and impairment 31 Dec 2012 0.0 -110.5 -729.7 -50.2 0.0 -890.4
Book value 31 Dec 2012 0.7 37.5 1,257.6 34.1 32.7 1,362.6
The value of aircraft that have been pledged as a security for external loans amount to EUR 599.7 million (740.9).Other equipment includes office equipment, furnishings, cars and transportation vehicles used at airports.
FINNAIR ANNUAL REPORT 2013
STRATEGY / CUSTOMERS / OPERATIONS / EMPLOYEES / SOCIETY / FINANCE / GOVERNANCE / GRI 97

Impairment testThe impairment test of the aircraft based on the fair value and value-in-use has been prepared on the closing date. The test based on value-in-use did not cause any need for impairment.
The recoverable amount of a cash-generating unit is determined based on value-in-use calculations, which are based on Groups' assump-tions. These calculations are prepared based on management estimate of future pre-tax cash flow and profit for 2014. The forecast for the years 2015–2020 is based on the main assumptions and fleet forecast used as the basis for the best estimate. The residual value used in the calculation represents the estimated value of aircrafts in 2020. The fair values of aircrafts are based on bulletins of two independent aircraft valuators.
The key assumptions used for value-in-use calculations are as follows:WACC pretax 8.00%EUR USD 1.34 exchange rateInflation 2%RASK base level 6.17 (c/ASK)
2014 2015 2016
Fuel, USD/ton 980 980 980RASK change, % 2.0% 2.0% 2.0%
The value-in-use calculation is sensitive to all key assumptions. The most sensitive is RASK (revenue per available seat kilometer), and after that the fuel price and exchange rate EUR/USD. The decrease of RASK by 3 per cent during the period under review will decrease the recov-erable amount to equal the carrying amount for the asset. The average fuel price increase by 11 per cent decrease the recoverable amount so that it would equal the carrying amount.
The value-in-use calculation of aircraft is sensitive to USD exchange rate, the USD strengthening of 11 per cent will decrease the recover-able amount so that the impairment should be recognised. However, the strengthening of the USD by 6 per cent would increase the euro equivalent of the current market values of the aircraft above the carrying value. The decrease of yen by 40 per cent during the period under review will decrease the recoverable amount to equal to the carrying amount of the asset.
Investment commitmentsAt the end of financial year investment commitments totalled 974 million euros (1,000) including firm aircraft orders. The total commit-ment fluctuates between the order and the delivery of the aircraft mainly due to exchange rate EUR/USD and the escalation clauses includ-ed in airline purchase agreements. The final amount of the commitment in relation to each aircraft is only known at the time of the delivery.
4.3 DEPRECIATION AND IMPAIRMENT
EUR mill. 2013 2012
Depreciation of tangible assetsBuildings 1.8 2.2Aircraft 107.5 110.8Other equipment 4.7 6.6
114.0 119.6Depreciation of intangible assetsOther intangible assets 8.1 11.2
Total 122.1 130.8
In addition, non-recurring items include depreciation of other equipment 1.2 million euros (0,1).
The Group as the lesseeLease agreements of tangible assets, where a substantial part of the risks and rewards of ownership are transferred to the Group, are classified as finance leases. Finance leases are capitalised at the commencement of the lease term at the lower of the fair val-ue of the leased property and the present value of the minimum lease payments. A corresponding sum is recognised as a finance lease liability. The lease payments are allocated between finance charges and the reduction of the outstanding liability. The cor-responding rental obligations, net of finance charges, are included in the non-current or current interest-bearing liabilities. The interest element of the finance cost is charged to the income statement over the lease term so as to achieve a constant interest rate on the remaining balance of the liability for each period. Asset items acquired under finance leases are depreciated over the shorter of the useful life of the asset or the lease term.
Lease agreements of tangible assets, where the lessor retains a substantial part of the risks and rewards, are classified as op-erating leases. Payments under operating leases are charged to the income statement over the lease term.
The Group as the lessor The agreements, where the Group is the lessor, are accounted for as operating leases, when a substantial part of the risks and rewards of ownership are not transferred to the lessee. The assets are included in the tangible assets and they are depreciated during their useful life. Depreciation is calculated using the same principles as the tangible assets for own use. Under the provi-sions of certain aircraft lease agreements, the lessee is required to pay periodic additional rent or maintenance reserve which accumulate funds for maintenance related to the usage of the aircraft. The Company's obligations to make contributions or reim-bursements for such maintenance are recognised as liabilities. Contributions or reimbursements to the lessee upon acceptance of evidence of qualifying maintenance work are charged against the existing liabilities. The rents for premises are recognized in income statement as other operating income over the lease term and the rents for aircraft as turnover.
Sale and leasebackIf sale and leaseback transaction is resulting in a finance lease agreement, the difference between the selling price and the car-rying amount of the asset sold is deferred and amortised over the lease period.
If sale and leaseback transaction is resulting in an operating lease agreement, the difference between the selling price and the carrying amount of the asset sold is recognised in the income statement when the selling price is based on fair value. Otherwise the sales gain or loss is deferred and amortised over the lease period.
The classification of lease arrangements in Group's Airline Business to financial and other leases requires management dis-cretion in interpretation and application of accounting standards. Where the management has made a judgement that risks and rewards of ownership belong to Group the lease is handled as a financial lease otherwise as other lease.
4.4 LEASING ARRANGEMENTS
= Accounting principles = Critical accounting estimates
FINNAIR ANNUAL REPORT 2013
STRATEGY / CUSTOMERS / OPERATIONS / EMPLOYEES / SOCIETY / FINANCE / GOVERNANCE / GRI 98
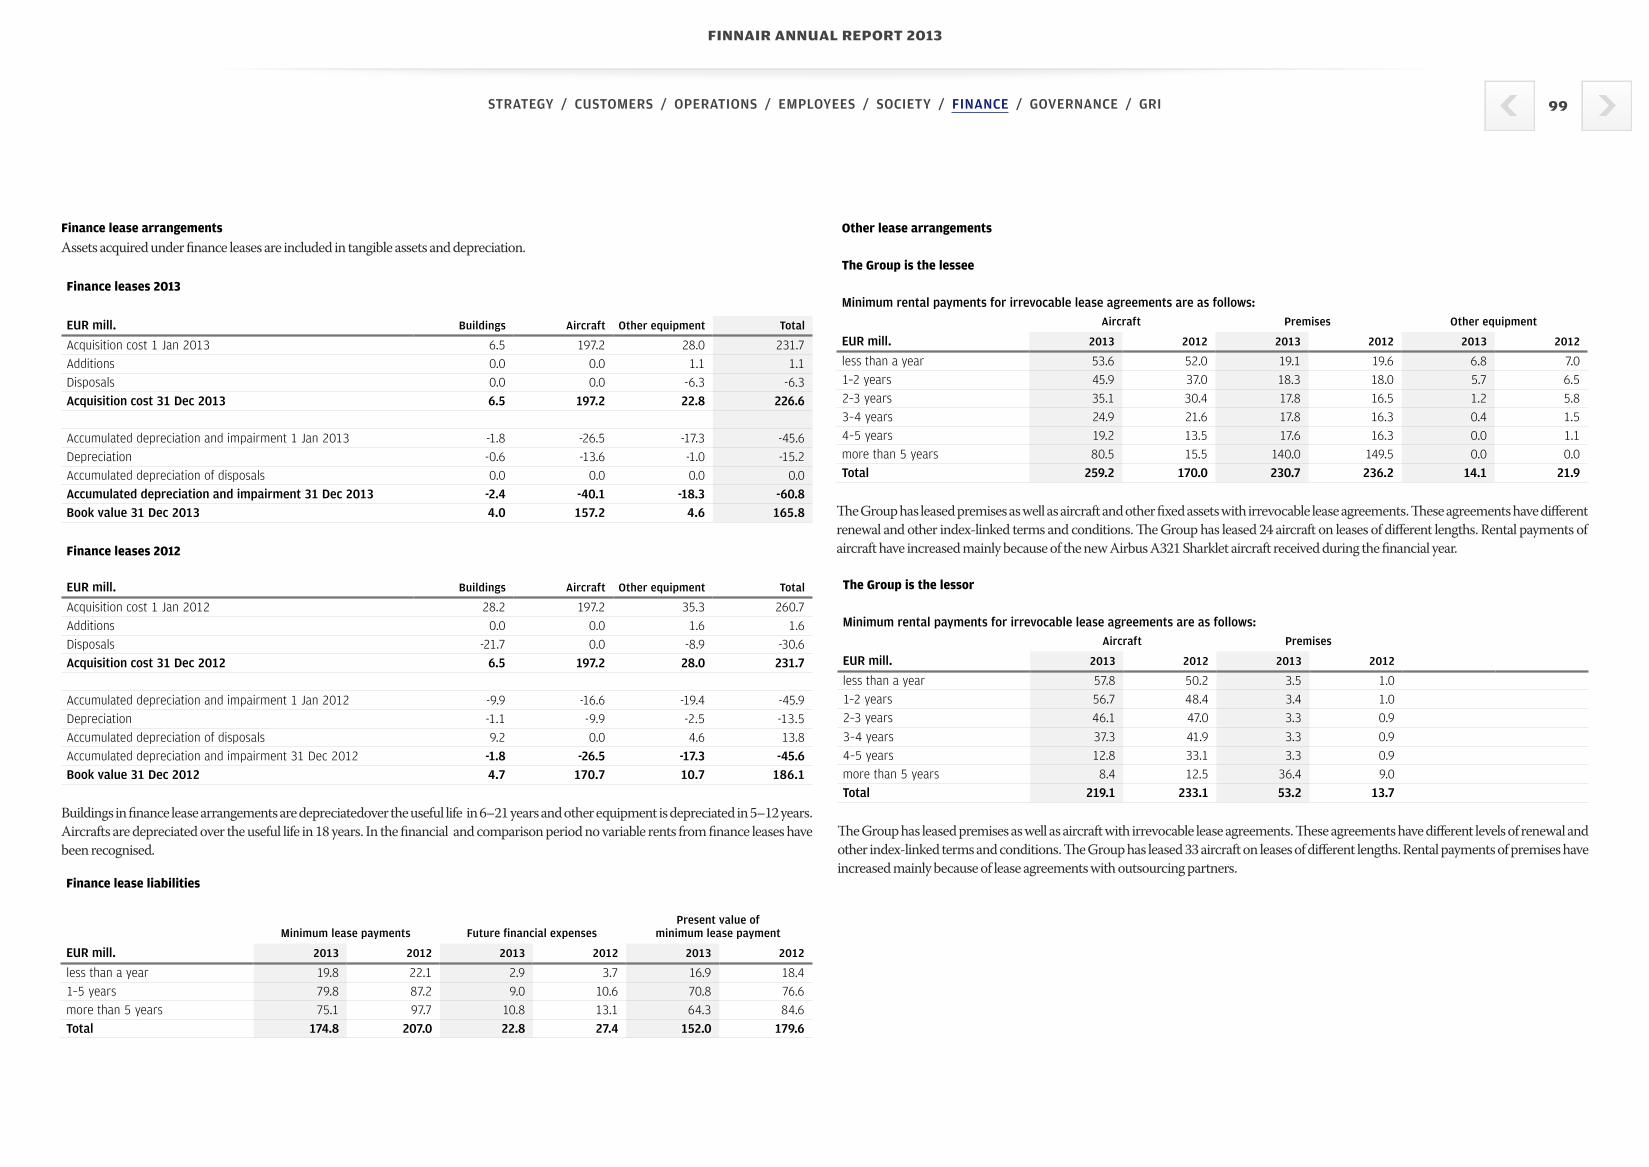
Finance lease arrangements
Assets acquired under finance leases are included in tangible assets and depreciation.
Finance leases 2013
EUR mill. Buildings Aircraft Other equipment Total
Acquisition cost 1 Jan 2013 6.5 197.2 28.0 231.7Additions 0.0 0.0 1.1 1.1Disposals 0.0 0.0 -6.3 -6.3Acquisition cost 31 Dec 2013 6.5 197.2 22.8 226.6
Accumulated depreciation and impairment 1 Jan 2013 -1.8 -26.5 -17.3 -45.6Depreciation -0.6 -13.6 -1.0 -15.2Accumulated depreciation of disposals 0.0 0.0 0.0 0.0Accumulated depreciation and impairment 31 Dec 2013 -2.4 -40.1 -18.3 -60.8Book value 31 Dec 2013 4.0 157.2 4.6 165.8
Finance leases 2012
EUR mill. Buildings Aircraft Other equipment Total
Acquisition cost 1 Jan 2012 28.2 197.2 35.3 260.7Additions 0.0 0.0 1.6 1.6Disposals -21.7 0.0 -8.9 -30.6Acquisition cost 31 Dec 2012 6.5 197.2 28.0 231.7
Accumulated depreciation and impairment 1 Jan 2012 -9.9 -16.6 -19.4 -45.9Depreciation -1.1 -9.9 -2.5 -13.5Accumulated depreciation of disposals 9.2 0.0 4.6 13.8Accumulated depreciation and impairment 31 Dec 2012 -1.8 -26.5 -17.3 -45.6Book value 31 Dec 2012 4.7 170.7 10.7 186.1
Buildings in finance lease arrangements are depreciatedover the useful life in 6–21 years and other equipment is depreciated in 5–12 years. Aircrafts are depreciated over the useful life in 18 years. In the financial and comparison period no variable rents from finance leases have been recognised.
Other lease arrangements
The Group is the lessee
Minimum rental payments for irrevocable lease agreements are as follows:Aircraft Premises Other equipment
EUR mill. 2013 2012 2013 2012 2013 2012
less than a year 53.6 52.0 19.1 19.6 6.8 7.01–2 years 45.9 37.0 18.3 18.0 5.7 6.52–3 years 35.1 30.4 17.8 16.5 1.2 5.83–4 years 24.9 21.6 17.8 16.3 0.4 1.54–5 years 19.2 13.5 17.6 16.3 0.0 1.1more than 5 years 80.5 15.5 140.0 149.5 0.0 0.0Total 259.2 170.0 230.7 236.2 14.1 21.9
The Group has leased premises as well as aircraft and other fixed assets with irrevocable lease agreements. These agreements have different renewal and other index-linked terms and conditions. The Group has leased 24 aircraft on leases of different lengths. Rental payments of aircraft have increased mainly because of the new Airbus A321 Sharklet aircraft received during the financial year.
The Group is the lessor
Minimum rental payments for irrevocable lease agreements are as follows:Aircraft Premises
EUR mill. 2013 2012 2013 2012
less than a year 57.8 50.2 3.5 1.01–2 years 56.7 48.4 3.4 1.02–3 years 46.1 47.0 3.3 0.9
3–4 years 37.3 41.9 3.3 0.94–5 years 12.8 33.1 3.3 0.9more than 5 years 8.4 12.5 36.4 9.0Total 219.1 233.1 53.2 13.7
The Group has leased premises as well as aircraft with irrevocable lease agreements. These agreements have different levels of renewal and other index-linked terms and conditions. The Group has leased 33 aircraft on leases of different lengths. Rental payments of premises have increased mainly because of lease agreements with outsourcing partners.
Finance lease liabilities
Minimum lease payments Future financial expensesPresent value of
minimum lease payment
EUR mill. 2013 2012 2013 2012 2013 2012
less than a year 19.8 22.1 2.9 3.7 16.9 18.41–5 years 79.8 87.2 9.0 10.6 70.8 76.6more than 5 years 75.1 97.7 10.8 13.1 64.3 84.6Total 174.8 207.0 22.8 27.4 152.0 179.6
FINNAIR ANNUAL REPORT 2013
STRATEGY / CUSTOMERS / OPERATIONS / EMPLOYEES / SOCIETY / FINANCE / GOVERNANCE / GRI 99

5 CAPITAL STRUCTURE AND FINANCING COSTS
5.1 FINANCIAL INCOME AND EXPENSES
The notes from financial assets and liabilities and equity has been gathered into capital structure and financing costs-section to give a better overall view of the Groups financial position.
EUR mill. 2013 2012
Interest income from financial assets classified as held for trading 2.6 4.5Other interest income 1.7 1.2Dividend income 0.1 0.1Exchange gains 1.5 0.3Other financial income * 36.7 1.8Financial income total 42.6 7.9
Interest expenses for financial liabilities valued at amortised acquisition cost -11.7 -13.1Interest on finance leases -2.5 -5.5Exchange losses -2.7 -2.0Other financial expenses -2.8 -4.9Interest rate swaps, fair value hedges 1.2 0.0Fair value adjustment to bond book value attributable to interest rate risk -1.2 0.0Financial expenses total -19.7 -25.5
Financial expenses, net 22.9 -17.6
* Other financial income in 2013 include a capital gain on the sale of Norwegian Air Shuttle ASA's shares of 34 million euros.
According to testing of the effectiveness of Group’s hedge accounting both cash flow and fair value hedging are effective. Thus, as in the comparison year 2012, no inefficiency is included in financial items for 2013. Financial income includes an identical amount of profits and losses for fair value hedging instruments and for hedging items resulting from the hedged risk.
Interest income and expensesInterest income and expenses are recognised on a time-proportion basis using the effective interest method. More detailed in-formation about financial assets in note 5.2 Financial assets and about interest bearing liabilities in note 5.3 Financial liabilities.
Dividend incomeDividend income is recognised when the company has acquired a legal right to receive the dividends.
Financial assetsIn the Group, financial assets have been classified according to the IAS 39 standard “Financial Instruments: Recognition and Meas-urement” into the following categories: financial assets at fair value through profit and loss (assets held for trading), held-to-ma-turity investments, loans and other receivables, as well as available-for-sale financial assets. The classification is made at the ac-quisition date based on purpose of the acquisition. All purchases and sales of financial assets are recognised on the trade date.
The financial assets recognised at fair value through profit and loss include assets held for trading purposes and assets meas-ured at fair value through profit and loss on initial recognition. Financial assets at fair value through profit and loss have mainly been acquired to obtain a gain from short-term changes in market prices. All those derivatives that do not meet the requirements for the application of hedge accounting are classified as financial assets at fair value through profit and loss and are valued at each balance sheet date at fair value. Realised and unrealised gains and losses arising from changes in fair value are recognised in the income statement in the period in which they arise. Unrealised gains are excluded from operational result, while realized are recognised either in other operating income and expenses or in financial items. Financial assets at fair value through profit and loss as well as those maturing within 12 months are included in current assets.
Held-to-maturity investments are financial assets that are not derivative contracts and which mature on a specified date and which a company has the firm intent and ability to hold to maturity. They are valued at amortised cost and they are included in non-current assets. On the closing date the Group had no assets belonging to the said group.
Investments which do not have a maturity date and which date of sales has not been decided are classified as available-for-sale financial assets. Available-for-sale financial assets are presented in the balance sheet in short-term financial assets. A change in the fair value of available-for-sale financial assets is recognised in the fair value reserve of other comprehensive income, from which it is transferred to the income statement when sold. Unquoted shares are valued in the Finnair Group at their acquisition price when fair value cannot be reliably measured.
Loan receivables and other receivables are recognised at amortised cost using the effective interest method. Loans and other receivables include trade receivables, deferred charges, other long term receivables and security deposits for aircraft operation-al lease agreements.
Derecognition of financial assets takes place when the Group has lost its contractual right to receive the cash flows or when it has substantially transferred the risks and rewards outside the Group.
Finnair Group assesses on each closing date whether there is any objective evidence that the value of a financial asset item or group of items has been impaired. Principles of impairment of financial assets are described below. The loss is recognised through profit and loss.
Impairment of financial assetsThe Group assesses at the end of each reporting period whether there is objective evidence that financial asset or group of fi-nancial assets is impaired. A financial asset or a group of financial assets is impaired and impairment losses are incurred only if there is objective evidence of impairment as a result of one or more events that occurred after the initial recognition of the asset (a ‘loss event’) and that loss event (or events) has reliably estimated impact on the estimated future cash flows of the financial asset or group of financial assets.
When a receivable is impaired, the carrying amount is written down to its recoverable amount. Recoverable amount is the esti-mated future cash flow discounted with the original effective interest rate of the instrument. The unwinding of discounting is rec-ognised as interest income from there on. Interest income on impaired loans is recognised using the original effective interest rate.
Cash and cash equivalentsCash and cash equivalents consist of cash reserves and short-term bank deposits maturity under three months. Foreign exchange-de-nominated items have been converted into euros using the mid-market exchange rates at the closing date.
5.2 FINANCIAL ASSETS
= Content of the section = Accounting principles
FINNAIR ANNUAL REPORT 2013
STRATEGY / CUSTOMERS / OPERATIONS / EMPLOYEES / SOCIETY / FINANCE / GOVERNANCE / GRI 100

5.2.1 Non-current loan and other receivables
EUR mill. 2013 2012
Loan receivables 10.2 10.2Other receivables 10.3 12.5Total 20.5 22.7
Other receivables are lease collateral for aircraft operational lease agreements.
In the event that other contractual parties are not able to fulfil their obligations relating to financial instruments, the maximum amount of credit risk equals to balance sheet values excluding the fair value of guarantees. Receivables do not exposue the Group to significant credit risk. The fair values of receivables are presented in note 5.6 Classification of financial assets and liabilities.
5.2.2 Other current financial assets
EUR mill. 2013 2012
Commercial papers and certificates 255.4 290.7Money market funds 35.0 34.6Deposits, maturing after 3 months 45.1 5.0Listed shares 0.0 32.3Unlisted shares 0.4 1.0Total 335.9 363.5
Ratings of counterpartiesBetter than A 89.7 38.9A 81.3 117.6BBB 63.7 40.7BB 10.0 10.0Unrated 91.3 156.4Total 335.9 363.5
In year 2013 all of the listed shares which were classified as available for sale investments were sold. During year 2012 there have not been any acquisitions or sales and the change in value was caused by changes in currency exchange rates and stock prices. Investing of the Group's financial assets and risk management policy are described in more detail in note 5.5 Management of financial risks. IFRS classification and fair values of financial assets are presented in note 5.6 Classification of financial assets and liabilities.
5.2.3 Cash and cash equivalents
EUR mill. 2013 2012
Cash and bank deposits 57.8 14.6Deposits, maturing in less than 3 months 65.1 52.4Total 122.9 67.0
Items include cash and bank deposits realised on demand. Foreign currency cash and bank deposits have been valued at mid-market ex-change rates on the closing date. The reconciliation of cash and cash equivalents is illustrated in notes of consolidated cash flow statement.
5.3 FINANCIAL LIABILITIES
Financial liabilitiesFinancial liabilities are initially recognised at fair value on the basis of the original consideration received. Transactions costs have been included in the original book value of the financial liabilities. Thereafter, all non-derivative financial liabilities are valued at amortised cost using the effective interest method. Financial liabilities are included in long- and short-term liabilities and they can be interest-bearing or non-interest-bearing. Loans that are due for payment within 12 months are presented in short-term li-abilities. Foreign currency loans are valued at the mid-market exchange rate on the closing date and translation differences are recognised in financial items.
Accounts payable are recognised initially at fair value and subsequently measured at amortised cost using the effective inter-est method.
Derecognition of financial liabilities takes place when Group has filled the contractual obligations.
Non-current liabilities
EUR mill. 2013 2012
Bank loans 114.1 254.9Bonds 150.6 0.0Finance lease liabilities 120.8 139.8Interest-bearing liabilities total 385.5 394.7Non-interest-bearing liabilities 25.4 18.8Total 410.9 413.5
Non-interest-bearing liabilities include mainly lease and maintenance reserves related to the aircraft leased to other airlines.
Current interest-bearing liabilities
EUR mill. 2013 2012
Bank loans 139.6 66.2Commercial papers 44.5 80.9Finance lease liabilities 14.8 16.7Other loans 8.6 10.4Total 207.5 174.2
= Accounting principles
FINNAIR ANNUAL REPORT 2013
STRATEGY / CUSTOMERS / OPERATIONS / EMPLOYEES / SOCIETY / FINANCE / GOVERNANCE / GRI 101

The currency mix of non-current interest-bearing liabilities (including cross currency interest rate swaps) is as follows:
EUR mill. 2013 2012
EUR 564.6 526.5USD 29.0 42.4Total 593.6 568.9
Weighted average effective interest rate on non-current interest-bearing liabilities was 3.1 % (2.1%).
Interest rate re-fixing period of interest-bearing liabilities
2013 2012
Up to 6 months 64.2% 87.0%6-12 months 0.0% 0.0%1-5 years 35.0% 12.0%More than 5 years 0.8% 1.0%Total 100.0% 100.0%
Maturity dates of interest-bearing financial liabilities 31 Dec 2013 2014 2015 2016 2017 2018 Later Total
Bank loans, fixed interest 8.5 48.3 0.0 0.0 0.0 0.0 56.8Bank loans, variable interest 131.1 14.7 14.7 12.2 9.8 14.4 196.9Bonds 0.0 0.0 0.0 0.0 151.2 0.0 151.2Commercial papers 44.5 0.0 0.0 0.0 0.0 0.0 44.5Finance lease liabilities 14.8 14.8 15.4 16.1 16.7 57.7 135.6Other loans 8.6 0.0 0.0 0.0 0.0 0.0 8.6Interest-bearing liabilities total 207.5 77.8 30.1 28.3 177.7 72.1 593.6Payments from currency derivatives 844.1 273.1 0.0 0.0 0.0 0.0 1,117.2Income from currency derivatives -843.0 -274.3 0.0 0.0 0.0 0.0 -1,117.3Commodity derivatives -10.1 -4.3 0.0 0.0 0.0 0.0 -14.4Interest rate derivatives 0.0 0.5 0.0 -0.2 -1.2 0.0 -0.9Trade payables and other liabilities 696.9 0.0 0.0 0.0 0.0 0.0 696.9Interest payments 13.5 8.6 7.3 6.2 6.1 0.0 41.7Total 908.9 81.4 37.4 34.3 182.6 72.1 1,316.7
Maturity dates of interest-bearing financial liabilities 31 Dec 2012 2013 2014 2015 2016 2017 Later Total
Bank loans, fixed interest 10.5 40.8 18.0 0.0 0.0 0.0 69.3Bank loans, variable interest 55.7 129.6 14.9 14.9 12.4 24.3 251.8Commercial papers 80.9 0.0 0.0 0.0 0.0 0.0 80.9Finance lease liabilities 16.7 16.6 16.1 16.7 16.0 74.4 156.5Other loans 10.4 0.0 0.0 0.0 0.0 0.0 10.4Interest-bearing liabilities total 174.2 187.0 49.0 31.6 28.4 98.7 568.9Payments from currency derivatives 560.8 256.7 0.0 0.0 0.0 0.0 817.5Income from currency derivatives -566.6 -258.8 0.0 0.0 0.0 0.0 -825.4Commodity derivatives 2.4 0.7 0.1 0.0 0.0 0.0 3.2Trade payables and other liabilities 650.3 0.0 0.0 0.0 0.0 0.0 650.3Interest payments 9.3 5.3 0.9 0.4 0.2 0.2 16.3Total 830.4 190.9 50.0 32.0 28.6 98.9 1,230.8
Part of the loans are secured by bank guarantees which are due earlier than underlining bank loans. Bank loan repayments include these loans 89 million euros in year 2014 and 37.8 million euros in year 2015. Bank loans include one non-current currency and interest rate swap and one interest rate swap that hedge two loans. Interest rate re-fixing period in variable interest loans is 3 or 6 months. Fixed interest bond maturing in 2018 does not include the amortized cost of 0.6 million euros which was paid in 2013. The minimum lease payments, discount values and present values of finance lease liabilities are presented in note 4.4 Leasing arrangements.
FINNAIR ANNUAL REPORT 2013
STRATEGY / CUSTOMERS / OPERATIONS / EMPLOYEES / SOCIETY / FINANCE / GOVERNANCE / GRI 102

5.4 CONTINGENT LIABILITIES
5.5 MANAGEMENT OF FINANCIAL RISKS
Principles of financial risk managementThe nature of the Finnair Group’s business operations exposes the company to variety of financial risks: foreign exchange, interest rate, credit and liquidity, and commodity price risks. The Group’s policy is to limit the uncertainty caused by such risks on cash flow, financial perfor-mance and equity.
The management of financial risks is based on the risk management policy approved by the board of directors. The policy specifies the minimum and maximum levels permitted for each type of risk. Financial risk management is directed and supervised by the Financial Risk Steering Group. Practical implementation of risk management policy and risk management have been centralised in the parent company’s finance department.
In the risk management of foreign exchange, interest rate and jet fuel positions, and electricity price risk, the company uses different de-rivative instruments, such as forward contracts, swaps and options. Derivatives are designated at inception as hedges for future cash flows (cash flow hedges), hedges for firm orders (hedges of the fair value of firm commitments) or as financial derivatives not qualifying for hedge accounting (economic hedges). In terms of the hedging of future cash flows (cash flow hedging), the Finnair Group implements, in accord-ance with IAS 39 hedge accounting principles, foreign exchange hedging of lease payments, interest rate hedging to issued bond (fair val-ue hedging), hedging of jet fuel price and foreign exchange risks and hedging of electricity price risk and as hedges of the fair value of firm commitment aircraft purchases.
Fuel price risk in flight operationsFuel price risk means the cash flow and financial performance uncertainty arising from fuel price fluctuations.
Finnair hedges against jet fuel price fluctuations using jet fuel forward contracts and options. As the underlying asset of jet fuel derivatives, the Jet Fuel CIF Cargoes NWE index is used, because around 65 per cent of Finnair’s fuel purchase contracts are based on the benchmark price index for North and West Europe jet fuel deliveries.
Finnair applies the principle of time-diversification in its fuel hedging for Scheduled Passanger traffic, which makes up 90 per cent of the risk. The hedging horizon according to the risk management policy is two years. Under the risk management policy, hedging must be in-creased in each quarter of the year so that the hedge ratio for Finnair’s Scheduled Passenger Traffic for the first six months is more than 60 per cent and so that thereafter a lower hedge ratio applies for each period. By allocating the hedging, the fuel cost per period is not as low as the spot-based price when prices fall, but when spot prices rise the fuel cost rises more slowly. Finnair hedges the fuel price risk of Leisure traffic according to own policy, at least 60 per cent of the jet fuel consumption is hedged.
In terms of the accounting, the fuel hedges are recognised in Finnair in two different ways. In terms of the fuel consumption of Finnair, the first approximately 40 percentage points per period are treated in accounting as cash-flow hedging in accordance with IAS 39 hedge ac-
counting principles. Changes in the fair value of derivatives defined as cash-flow hedging in accordance with IAS 39 are posted directly to the fair value reserve included in equity. The change in fair value recognised in the equity hedging reserve is posted to income statement at the period time as the hedged transaction. Changes in the fair value of hedges outside hedge accounting – which do not fulfil IAS 39 hedge accounting criteria – are recognised in other operating expenses over the tenor time of the derivative. At the end of the financial year, Scheduled Passenger Traffic had hedged 74 per cent of its fuel purchases for the first six months of 2014 and 57 per cent for the second half of the year. The Leisure Traffic has hedged 60 per cent of its fuel purchases for the remaining winter season and 60 per cent of its purchases for the coming summer season. At the end of the financial year Leisure Traffic has no jet fuel price or ex-change rates price clauses with tour operators. In the financial year 2013, fuel used in flight operations accounted for somewhat over one fourth compared to the Group’s turnover. At the end of the financial year, the forecast for 2014 is the same, somewhat over one fourth compared to the Group's turnover. On the closing date, a 10 per cent rise in the market price of jet fuel – excluding hedging activity calculated using Scheduled Passenger Traffic’s forecasted flights for 2013 – increases annual fuel costs by an estimated 60 million euros. On the closing date – taking hedging into account – a 10 per cent rise in fuel lowers operating profit by around 29 million euros. Situation as at 31 December represents well the mean of a calendar year.
Electricity price riskThe costs of electricity are less than one per cent of the Finnair Group's costs but due to the high volatility the price risk is hedged. The Group applies the principle of time-diversification in its electricity price risk hedging. The hedging horizon is six years.
In terms of the accounting, the electricity hedges are recognised as cash flow hedges. Changes in the fair value of derivatives defined as cash-flow hedging in accordance with IAS 39 are posted directly to the fair value reserve included in equity. The change in fair value rec-ognised in the equity hedging reserve is posted to income statement at the period time as the hedged transaction. Changes in the fair value of hedges outside hedge accounting – which do not fulfil IAS 39 hedge accounting criteria – are recognised in other operating expenses over the tenor time of the derivative.
Foreign exchange riskForeign exchange risk means the cash flow and financial performance uncertainty arising from exchange rate fluctuations.
Finnair Group’s foreign exchange risk arises mainly from fuel and aircraft purchases, aircraft leasing payments and foreign currency in-comes. Somewhat under 60 per cent of Group turnover is denominated in euros. The most important foreign sales currencies are the Japa-nese yen (10 %, percentage of turnover), the Chinese yuan (6 %), the Swedish crown (5 %) and the US dollar (4 %). Approximately half of the Group’s operating costs are denominated in foreign currencies. The most important purchasing currency is the US dollar, which accounts for somewhat over 40 per cent of all operating costs. Significant dollar-denominated expense items are fuel costs and aircraft leasing pay-ments. The largest investments - aircraft and their spare parts - also take place mainly in US dollars.
The risk management policy divides the foreign exchange position into two parts, a profit and loss position and an investment position. The profit and loss position mainly consists of dollar costs and revenues in a number of different currencies. The purpose of currency
risk hedging - for P&L exposure – is to cut the volatility of cash flows and operating income due to fluctuating currency prices. This is done by layering hedges for the biggest two currencies and utilising diversification benefits of the portfolio of various currencies. The hedging limits are set only for the main contributors of currency risk, the US dollar and the Japanese yen. For these two currencies, the hedging ho-rizon is two years which is divided into four six-month periods. In order to achieve time diversification, the minimum hedge ratio for the closest six-month period is 60% with a decreasing slope ending at 0% for the fourth six-month period. Even though the policy doesn’t re-quire hedging of smaller currency flows, it is allowed, in which case the layered hedging strategy is partially applied although no minimum hedging ratio is required.
The investment position includes all foreign exchange-denominated aircraft investments for which a binding procurement contract has been signed. According to the risk management policy, at least half of the investments recognised in the balance sheet must be hedged after the signing of a firm order. New hedges in investment position will be made as IAS 39 fair value hedge of a firm commitment.
At the end of the financial year, Finnair had a hedging ratio of 67 per cent in the USD-basket and 71 per cent in JPY for the coming 12 months. On the closing date – without hedging – a 10 per cent strengthening of the US dollar against the euro has a negative impact on the annual result of around 68 million euros and a 10 per cent weakening of the Japanese yen against the euro has a negative impact on the annual result of around 18 million euros. On the closing date – taking hedging into account – a 10 per cent strengthening of the US dollar weakens the result by around 21 million euros and a 10 per cent weakening of the Japanese yen weakens the result by around 6 million eu-
Contingent liabilities are possible obligations resulting from previous events, the existence of which will only be ascertained once the uncertain event that is beyond the Group's control materialises. Existing obligations that are not likely to require the ful-filment of a payment obligation or the amount of which cannot be reliably determined are also considered contingent liabilities. Conditional liabilities are presented in the notes.
EUR mill. 2013 2012
Other pledges given on own behalf 503.7 633.5Guarantees on behalf of group companies 67.6 65.3Guarantees on behalf of others 2.3 2.5Total 573.6 701.3
Contingent liabilities include mainly pledging of aircraft for guarantee of loans and guarantees related to tour operations.
FINNAIR ANNUAL REPORT 2013
STRATEGY / CUSTOMERS / OPERATIONS / EMPLOYEES / SOCIETY / FINANCE / GOVERNANCE / GRI 103

EUR mill.
Hedge accounting
items
Financial assets at fair value through
profit and loss
Available for sale financial
assetsLoans and
receivablesValued at
amortised costBook value
31 Dec 2012Financial assetsReceivables 22.7 22.7Other financial assets 330.3 330.3Trade and other receivables 217.4 217.4Derivatives 26.5 7.1 33.6Listed shares 32.3 32.3Unlisted shares 1.0 1.0Cash and cash equivalents 67.0 67.0Book value total 26.5 337.4 33.3 307.1 704.3Fair value total 26.5 337.4 33.3 307.1 704.3
Financial liabilitiesInterest bearing liabilities 402.0 402.0Finance lease liabilities 156.5 156.5Derivatives 14.7 4.5 19.2Trade payables and other liabilities 786.8 786.8Fair value total 14.7 4.5 1,345.3 1,364.5Book value total 14.7 4.5 1,345.3 1,364.5
Interest rate derivatives (currency and interest-rate swaps) are included in derivatives. In other notes they are included in bank loans or bonds. The item other financial assets mainly includes USD-denominated security deposits for leased aircraft. Trade payables and other li-abilities include: trade payables, deferred expenses, pension obligations as well as other interest-bearing and non-interest-bearing liabilities. Group has 72.6 million euros (91.6) of deferred tax liabilities that are not included in this note, but presented in the note 6.1 Income taxes.The valuation principles of financial assets and liabilities are outlined in the accounting principles in notes 5.2 Financial assets and 5.3 Fi-nancial liabilities.
ros. In the above numbers, the USD-basket risk includes also the Chinese yuan and the Hong Kong dollar, whose historical correlation with the dollar is high. Situation as at 31 December represents well the mean of a calendar year.
Interest rate riskInterest rate risk means the cash flow and financial performance uncertainty arising from interest rate fluctuations.
In Finnair Group the interest rate risk is measured using the interest rate re-fixing period. If necessary, interest rate derivatives are used to adjust the interest rate re-fixing period. According to the risk management policy, the mandate for the investment portfolio’s interest rate re-fixing period is 0-12 months and for interest-bearing liabilities 0–24 months. On the closing date the investment portfolio’s interest rate re-fixing period was 4 months and for interest-bearing liabilities approximately 16 months. On the closing date a one percentage point rise in interest rates increases the annual interest income of the investment portfolio about 3.0 million euros and the interest expenses of the loan portfolio about 3.1 million euros. Situation as at 31 December represents well the mean of a calendar year.
Borrowings issued at fixed rates expose the group to fair value interest rate risk. The group is applying hedge accounting (fair value hedge) to hedge the fair value interest rate risk of its 150 million euro fixed rate unsecured bond issued in August 2013.
Credit riskThe Group is exposed to counterparty risk when investing its cash reserves and in using derivative instruments. The credit risk is managed by making contracts, within the framework of risk management policy of counterparty risk limits, only with financially sound domestic and foreign banks, financial institutions and brokers. Liquid assets are also invested, within company-spesific limits, in bonds and commercial papers issued by conservatively selected companies. This way risk towards single counterparties are not significant. Change in fair value of groups loans rise from changes in FX and interest, not from credit risk. Groups' maximum exposure to credit risk is other financial assets presented in note 5.2.2, cash and cash equivalent presented in note 5.2.3 and trade receivables presented in note 2.2.3.
Liquidity riskThe goal of the Finnair Group is to maintain good liquidity. Liquidity is ensured by cash reserves, bank account limits, liquid money market investments and committed credit facilities. With respect to aircraft acquisitions, the company’s policy is to secure financing, for example through committed loans, at a minimum of 6 months before delivery. Counterparties of groups' long term loans are solid financial institu-tions with good reputation.
The Group’s liquid assets were 458.4 million euros at the end of financial year 2013. Finnair Plc has a domestic commercial paper pro-gramme of 200 million euros, of which 44.5 million euros was used on the closing date. In addition, Finnair has a 180 million euro commit-ted credit facility unused. The credit facility includes a finance covenant based on adjusted gearing. The covenant level of adjusted gearing is 175 per cent, while at the closing date the figure was 77.6 per cent. The maximum level set by the Board of Directors is 140 per cent.
Capital managementThe aim of the Group’s capital management is, with the aid of an optimum capital structure, to support business operations by ensuring normal operating conditions and to increase shareholder value with the best possible return being the goal. An optimum capital structure also ensures lower capital costs. The capital structure is influenced for example via dividend distribution and share issues. The Group can vary and adjust the level of dividends paid to shareholders or the amount of capital returned to them or the number of new shares issued, or can decide on sales of asset items in order to reduce debt. It is the aim the Finnair´s dividend policy to pay on average at least one third of the earnings per share as dividend during an economic cycle.
The development of the Group’s capital structure is monitored continuously using adjusted gearing. When calculating adjusted gearing, adjusted interest-bearing net debt is divided by the amount of shareholders’ equity. The Group’s adjusted gearing at the end of 2013 was 77.6 per cent (76.8).
5.6 CLASSIFICATION OF FINANCIAL ASSETS AND LIABILITIES
EUR mill.
Hedge accounting
items
Financial assets at fair value through
profit and loss
Available for sale financial
assetsLoans and
receivablesValued at
amortised costBook value
31 Dec 2013Financial assetsReceivables 20.5 20.5Other financial assets 290.4 45.0 335.5Trade and other receivables 236.2 236.2Derivatives 18.2 26.8 45.0Unlisted shares 0.4 0.4Cash and cash equivalents 122.9 122.9Book value total 18.2 317.2 0.4 424.6 760.4Fair value total 18.2 317.2 0.4 424.6 760.4
Financial liabilitiesInterest bearing liabilities 457.4 457.4Finance lease liabilities 135.6 135.6Derivatives 21.6 7.9 29.5Trade payables and other liabilities 36.0 774.9 810.9Book value total 21.6 7.9 36.0 1,367.9 1,433.4Fair value total * 21.6 7.9 36.0 1,372.7 1,438.2
* The issued bond was quoted at 103.6 as per 31.12.2013 which explains the difference between book value and fair value.
FINNAIR ANNUAL REPORT 2013
STRATEGY / CUSTOMERS / OPERATIONS / EMPLOYEES / SOCIETY / FINANCE / GOVERNANCE / GRI 104

Fair value hierarchy of financial assets and liabilities valued at fair valueFair values at the end of the reporting period EUR mill. 31 Dec 2013 Level 1 Level 2 Level 3
AssetsFinancial assets at fair value through profit and lossSecurities held for trading 290.4 35.0 255.4Derivatives held for tradingCurrency and interest rate swaps 1.4 1.4
- of which in fair value hedge accounting 1.2 1.2Currency derivatives 27.9 27.9
- of which in fair value hedge accounting 4.4 4.4- of which in cash flow hedge accounting 0.1 0.1
Commodity derivatives 15.7 13.4 2.3- of which in cash flow hedge accounting 12.5 12.5
Financial assets available-for-sale Share investmentsTotal 335.4 35.0 298.1 2.3
LiabilitiesFinancial liabilities recognised at fair value through profit and lossDerivatives held for tradingInterest rate swaps 0.5 0.5
- of which in fair value hedge accounting 0 0Currency derivatives 27.7 27.7
- of which in fair value hedge accounting 2.2 2.2- of which in cash flow hedge accounting 18.7 18.7
Commodity derivatives 1.3 1.3- of which in cash flow hedge accounting 0.7 0.7
Total 29.5 29.5
During the financial year no significant transfers took place between fair value hierarchy Levels 1 and 2.
The fair values of hierarchy Level 1 are based fully on quoted (unadjusted) prices in active markets of the same assets and liabilities. The fair values of Level 2 instruments are based to a significant extent on input data other than the quoted prices included in Level 1, but however on data that are observable either directly (price) or indirectly (derived from price) for the said asset or liability. The fair values of Level 3 in-struments on the other hand are based on asset or liability input data that are not based on observable market information (unobservable inputs), rather to a significant extent on confirmations supplied by counterparties based on generally accepted valuation models.
The fair value hierarchy level to which a certain item valued at fair value is classified in its entirety is determined in accordance with the re-quirements of IFRS 7 based on the lowest level of input significant to the overall fair value of the said item. The significance of the input data has been assessed in its entirety in relation to said item valued at fair value.
Reconciliation of financial assets and liabilities valued at fair value according to Level 3Fair value at the end of the reporting period
Recognised at fair value through profit and loss
Available-for-sale share investments Total
EUR mill.Securities held
for tradingDerivatives held
for trading
Opening balance - -1 - -1Profits and losses in income statement, total - 0.6 0 0.6In comprehensive income - 0 - -Purchases (and sales) - - - -Settlements (and issues) - 2.7 - 2.7Transfers to and from Level 3 - - - -Closing balance 0 2.3 0 2.3
Total profits and losses recognised for the period for assets held at the end of the reporting periodIn other operating expenses 0 0.6 0 0.6
During the financial year, no transfers took place to or from fair value hierarchy Level 3 in the fair value levels of financial assets and liabili-ties. According to management estimates, the changing of input data used in determining the fair value of financial instruments valued at Level 3 to some other possible alternative assumption would not significantly change the fair value of items valued at fair value in Level 3, given the relatively small amount of the said assets and liabilities.
5.7 OFFSETTING FINANCIAL ASSETS AND LIABILITIES
EUR mill. 2013 2012
Derivative assets gross amounts 46.1 37.7Gross amounts of recognised financial liabilities set off in the balance sheet 0.0 0.0Net amounts of financial assets presented in the balance sheet 46.1 37.7Enforceable master netting agreement -30.7 -21.3Derivative assets net amount 15.4 16.4
Derivative liabilities gross amounts 30.7 22.9Gross amounts of recognised financial assets set off in the balance sheet 0.0 0.0Net amounts of financial liabilities presented in the balance sheet 30.7 22.9Enforceable master netting agreement -30.7 -21.3Derivative liabilites net amount 0.0 1.6
For the financial assets and liabilities subject to enforceable master netting arrangements or similar arrangements above, each agreement between the Group and the counterparty allows for net settlement of the relevant financial assets and liabilities when both elect to settle on a net basis. In the absence of such an election, financial assets and liabilities will be settled on a gross basis, however, each party to the master netting agreement or similar agreement will have the option to settle all such amounts on a net basis in the event of default of the other party. Per the terms of each agreement, an event of default includes failure by a party to make payment when due; failure by a party to perform any obligation required by the agreement (other than payment) if such failure is not remedied within periods of 30 to 60 days after notice of such failure is given to the party; or bankruptcy.
FINNAIR ANNUAL REPORT 2013
STRATEGY / CUSTOMERS / OPERATIONS / EMPLOYEES / SOCIETY / FINANCE / GOVERNANCE / GRI 105

Derivative contracts and hedge accountingAccording to its risk management policy, Finnair Group uses foreign exchange, interest rate and commodity derivatives to reduce the exchange rate, interest rate and commodity risks which arise from group's balance sheet items, currency denominated purchase contracts, anticipated currency denominated purchases and sales as well as future jet fuel purchases.
The derivatives are initially recognised in the balance sheet at original acquisition cost (fair value) and thereafter are subsequently valued at fair value in each financial statement and interim report. Derivative instruments are valued in the balance sheet at fair val-ue, which is determined as the value at which the instrument could be exchanged between knowledgeable, willing and independent parties, with no compulsion in the sales situation to sell or buy. The fair values of derivatives are determined as follows:
The fair values of all derivatives are calculated using the exchange rates, interest rates, volatilities and commodity price quota-tions on the closing date. The fair values of currency forward contracts are calculated at the present value of future cash flows. The fair values of currency options are calculated using generally accepted option valuation models. The fair values of interest rate swap contracts are calculated at the present value of future cash flows. The fair values of interest rate and currency swap contracts are calculated at the present value of future cash flows. The fair values of interest rate options are calculated using generally accepted option valuation models. The fair values of commodity forward contracts are calculated at the present value of future cash flows. The fair values of commodity options are calculated using generally accepted option valuation models.
Gains and losses arising from changes in the fair value are presented in the financial statements according to the original classifi-cation of the derivative. Gains and losses on derivatives qualifying for hedge accounting are recognised in accordance with the under-lying asset being hedged. Derivative contracts are designated at inception as future cash flows hedges, hedges of binding purchase contracts (cash flow hedges or fair value hedges) or as derivatives not meeting the hedge accounting criteria or to which hedge ac-counting is not applied (economic hedges). Hedging of the fair value of the net investment of foreign units or embedded derivatives have not been used.
At the inception of hedge accounting, Finnair Group documents the relationship between the hedged item and the hedging instru-ment as well as the Group’s risk management objectives and the strategy for the inception of hedging. The Group documents and as-sesses, at the inception of hedging and at least in connection with each financial statements, the effectiveness of hedge relationships by examining the capacity of the hedging instrument to offset changes in the fair value of the hedged item or changes in cash flows. The values of derivatives in a hedging relationship are presented in the balance sheet item short–term financial asset and liabilities.
Finnair Group implements the IFRS hedge accounting principles in the hedging of future cash flows (cash flow hedging). Principles are applied to the price and foreign currency risk of jet fuel, price risk of electricity, foreign currency risk of aircraft lease payments and aircraft purchases.
The change in the fair value of effective portion of derivative instruments that fulfil the terms of cash flow hedging are entered di-rectly in the fair value reserve of other comprehensive income to the extent that the requirements for the application of hedge ac-counting have been fulfilled. The gains and losses recognised in fair value reserve are transferred to the income statement in the period in which the hedged item is entered in the income statement. When an instrument acquired for the hedging of cash flow ma-tures or is sold or when the criteria for hedge accounting are no longer fulfilled, the gain or loss accrued from hedging instruments remain in equity until the forecast transaction takes place. However, if the forecast hedged transaction is no longer expected to oc-cur, the gain or loss accrued in equity is released immediately to the income statement.
The effectiveness of hedging is tested on a quarterly basis. The effective portion of hedging is recognised in the fair value reserve of other comprehensive income, from which it is transferred to income statement when the hedged item is realised or, in terms of investments, as an acquisition cost adjustment.
Fair value hedging is implemented in respect of firm orders for new aircraft and to hedge the fixed interest rate bond. The bind-ing purchase agreements for new aircraft´s are treated under IFRS as firm commitments in which fair value changes of hedged part arising from foreign currency movements are recognised in the balance sheet as an asset item and corresponding gains or losses recognised through profit and loss. Similarly the fair value of instruments hedging these purchases is presented in the balance sheet as a liability or receivable and the change in fair value is recognised through profit and loss.
Changes in the fair value of derivatives to hedge the fixed interest rate bond that are designated and qualify as fair value hedg-es are recorded in the income statement, together with any changes in the fair value of the hedged bond that is attributable to the hedged risk. The gain or loss relating to the effective portion of interest rate swap hedging fixed rate borrowings is recognised in the income statement within financial income and expenses. The gain or loss relating to the ineffective portion is recognised in the income statement within in other operating income and expenses. The change in fair value of the bond is recognised in the income statement within financial income and expenses.
If the hedge no longer meets the criteria for hedge accounting, the adjustment to the carrying amount of a hedged item for which the effective interest method is used is amortised to profit or loss over the period to maturity.
Finnair Group uses foreign exchange and interest rate swap contracts in the hedging of the interest rate and foreign exchange risks of foreign currency denominated loans. The translation difference arising from foreign exchange and interest–rate swap contracts that fulfil the conditions of hedge accounting is recognised concurrently against the translation difference arising from the loan. Oth-er changes in fair value are recognised in terms of the effective portion in the fair value reserve of other comprehensive income. In-terest income and expenses are recognised in financial income and expenses.
Finnair Group uses jet fuel swaps (forward contracts) and options in hedging the price risk of jet fuel. Changes in the fair value of jet fuel hedging derivatives are recognised directly in the fair value reserve of other comprehensive income in respect of derivatives de-fined as cash-flow hedges that fulfil the requirements of IFRS hedge accounting. Accrued gains and losses on derivatives recognised in shareholders’ equity are recognised in the income statement as income or expenses for the financial period in which the hedged item is recognised in the income statement. If a forecasted cash flow is no longer expected to occur, the accrued gains and losses re-ported in the shareholder’s equity are presented directly as other income and expenses for the financial period. Changes in the fair value of derivative contracts, so far as the IFRS hedge accounting criteria are not fulfilled, are presented in other operating income and expenses during their term to maturity.
Finnair Group uses electricity derivative contracts in hedging the price risk of electricity. The electricity price risk hedges are recog-nised as cash flow hedges. Changes in the fair value of derivatives defined as cash-flow hedging in accordance with IFRS are posted directly to the fair value reserve of other comprehensive income. The recognised change in fair value is posted to income statement at the period time as the hedged transaction. Changes in the fair value of hedges outside hedge accounting (which do not fulfil IFRS hedge accounting criteria) are recognised in other operating expenses over the tenor time of the derivative.
The change in the fair value of derivatives not qualifying for hedge accounting and which are arranged to hedge operational cash flow are recognised in the income statement item other operating expenses. Changes in the fair value of interest rate derivatives not qualifying for hedge accounting are recognised in the income statement’s financial income and expenses.
5.8 DERIVATIVES
= Accounting principles
FINNAIR ANNUAL REPORT 2013
STRATEGY / CUSTOMERS / OPERATIONS / EMPLOYEES / SOCIETY / FINANCE / GOVERNANCE / GRI 106

2013 2012
EUR mill. Nominal value Positive fair values Negative fair values Fair net value Nominal value Positive fair values Negative fair values Fair net value
Currency derivatives *Hedge accounting items (forward contracts):Jet fuel currency hedging 370.5 0.0 -17.1 -17.0 413.5 5.7 -5.4 0.3Hedging of aircraft acquisitions
Fair value hedging 244.1 4.4 -2.3 2.2 291.1 15.2 -1.8 13.4Cash flow hedging 0.0 0.0 0.0 0.0 0.0 0.0 0.0 0.0
Hedging of lease payments 58.3 0.1 -1.7 -1.6 40.3 0.3 -0.5 -0.2Hedge accounting items total 672.9 4.5 -21.0 -16.4 744.9 21.2 -7.7 13.5
Items outside hedge accounting:Operational cash-flow hedging (forward contracts) 407.9 7.3 -4.9 2.4 173.3 0.7 -1.6 -0.9Operational cash-flow hedging (options)
Call options 149.8 16.1 0.0 16.1 105.5 5.9 0.0 5.9Put options 169.5 0.0 -0.8 -0.8 110.5 0.0 -0.8 -0.8
Balance sheet hedging (forward contracts) 20.4 0.0 -1.2 -1.2 47.8 0.4 -0.4 0.0Items outside hedge accounting total 747.5 23.4 -6.9 16.5 437.1 7.0 -2.8 4.2
Currency derivatives total 1,420.4 27.9 -27.8 0.1 1,182.0 28.2 -10.5 17.7
Commodity derivatives **Hedge accounting items: Jet fuel forward contracts, tonnes 563,550 12.5 -0.7 11.8 574,660 5.3 -7.0 -1.7Electricity derivatives, MWh 17,568 0.0 0.0 0.0 0 0.0 0.0 0.0Hedge accounting items total 12.5 -0.7 11.8 5.3 -7.0 -1.7
Items outside hedge accounting:Jet fuel forward contracts, tonnes 18,000 0.8 0.0 0.8 0 0.0 0.0 0.0Options
Call options, jet fuel, tonnes 201,000 3.4 0.0 3.4 214,000 3.1 0.0 3.1Put options, jet fuel, tonnes 201,000 0.0 -1.1 -1.1 301,000 0.0 -4.1 -4.1
Electricity derivatives, MWh 71,100 0.1 -0.6 -0.5 91,536 0.0 -0.5 -0.5Items outside hedge accounting total 4.3 -1.6 2.6 3.1 -4.6 -1.5
Commodity derivatives total 16.8 -2.3 14.4 8.4 -11.6 -3.2
Interest rate derivativesHedge accounting items:Interest rate swaps 150.0 1.2 0.0 1.2 0.0 0.0 0.0 0.0Hedge accounting items total 150.0 1.2 0.0 1.2 0.0 0.0 0.0
Items outside hedge accounting:Cross currency interest rate swaps 17.3 0.2 0.0 0.2 22.9 1.0 0.0 1.0Interest rate swaps 25.0 0.0 -0.5 -0.5 25.0 0.0 -1.1 -1.1Items outside hedge accounting total 42.3 0.2 -0.5 -0.3 47.9 1.0 -1.1 -0.1
Interest rate derivatives total 192.3 1.4 -0.5 0.9 47.9 1.0 -1.1 -0.1
Derivatives total *** 46.1 -30.7 15.4 37.6 -23.2 14.4
* A change in the fair value of currency derivatives in hedge accounting is recognised in the hedging reserve of shareholders’ equity, from where it is offset in the result against the hedged item. This is recognised as cash flow hegding. Exceptions to this are firm commitment hedges of aircraft purchases and hedging fixed interest rate bond qualifying for hedge accounting, whose fair value changes of hedged part arising from foreign currency movements (aircraft purchases) and fair value changes (fixed interest rate bond) is recognised in the balance sheet as an asset item and any corresponding gains or losses recognised through profit and loss. Similarly the fair value of instruments hedging these purchases and bond are presented in the balance sheet as a liability or receivable and the change in fair value is recognised through profit and loss. This is recognised as fair value hedging. A change in the fair value of operational cash flow hedging outside hedge accounting is recognised in the in-come statement’s other operating income and expenses, and a change in fair value of balance sheet hedges is recognised in financial items.
** The effective portion of a change in the fair value of commodity derivatives in hedge accounting is recognised in the hedging reserve of shareholders’ equity, from where it is offset against the hedged item when expired. A change in the fair value of commodity derivatives outside hedge accounting is recognised in the income state-ment other operating expenses. Realised gains and losses are instead recognised against the hedged item.The jet differential is the price difference between jet fuel and gasoil.
*** The positive/negative fair value of derivatives 31 Dec 2013 are shown as balance sheet receivables and liabilities. Jet fuel options 31 Dec 2013 were shown as a net amount in receivables.
FINNAIR ANNUAL REPORT 2013
STRATEGY / CUSTOMERS / OPERATIONS / EMPLOYEES / SOCIETY / FINANCE / GOVERNANCE / GRI 107

Ratings of derivative counterparties
EUR mill. 2013 2012
Better than A 11.6 9.9A 2.9 4.6BBB 0.9 -0.1BB - -Unrated - -Total 15.5 14.4
5.9 EQUITY-RELATED INFORMATION
Shareholders’ equityThe nominal value of shares has been recognised in the share capital before an amendment to the Articles of Association regis-tered on 22 March 2007.
Share issue profits that arose related to increases in share capital between 1997-2006 have been recognised in the share pre-mium account. In addition, before the change in Limited Liability Companies Act in 2006 the gains on sale of treasury shares were recognised in share premium.
Share issue profits that arose before 1997 have been recognised in the legal reserve.The share issue profit from the 2007 share issue, less transaction expenses and tax, has been recognised in the invested un-
restricted equity fund. The acquisitions of own shares can also be recognised unless they are recognised in retained earnings. In addition, share-based payments according to IFRS 2 are recognised in invested unrestricted equity fund.
Hedging reserve and other OCI items include changes in the fair value of derivative instruments used in cash-flow hedging, in ad-dition to actuarial gains and losses related to defined benefit pension plans, fair value gains and losses of available for sale financial assets and translation differences arising from consolidating foreign subsidiaries that have another reporting currency than euro.
Retained earnings include profit from previous financial years, less dividends distributed and acquisitions of own shares unless they are recognised in the invested unrestricted equity fund. Changes in accounting principles and errors are also recognised in the results of previous financial years.
A hybrid bond on equity terms is recognised in shareholders’ equity (after equity belonging to shareholders). The bond has no maturity date, but the company has the right to redeem it four years after the date of issue. The hybrid bond is unsecured and is in a weaker preference position than promissory notes. Its preference position is, however, better than other items listed in the company’s shareholders’ equity. A holder of a hybrid bond note has no shareholder rights, nor does the bond dilute the owner-ship of the company’s shareholders. The bond is recognised originally at fair value. Transactions expenses have been included in the original carrying amount of the bond.
DividendThe dividend liability to the company’s shareholders is recognised as a liability in the consolidated financial statements when the Annual General Meeting has decided on the dividend distribution.
Treasury sharesWhen the company have acquired its own shares or subsidiaries have acquired the parent company shares, the company’s share-holders’ equity is deducted by an amount consisting of the consideration paid less transaction costs after taxes unless the own shares are cancelled. No gain or loss is entered in the income statement for the sale or issue of own shares; the consideration re-ceived is presented as a change in shareholders’ equity.
Number of registered shares
Share capital, EUR
Share premium, EUR
Legal reserve, EUR
1 Jan 2012 128,136,115 75,442,904.30 20,407,351.01 147,712,376.3931 Dec 2012 128,136,115 75,442,904.30 20,407,351.01 147,712,376.3931 Dec 2013 128,136,115 75,442,904.30 20,407,351.01 147,712,376.39
Number of own shares
Price, EUR
Average price, EUR
1 Jan 2012 410,187 3,179,335.94 7.7531 Dec 2012 410,187 3,179,335.94 7.75Purchase of own shares 600,000 1,684,650.10 2.81Assignment of own shares -731,019 -4,055,744.86 5.55
31 Dec 2013 279,168 808,241.18 2.90
All issued shares are fully paid. The share has no nominal value.
Obligation to redeem clauseThe Articles of Association have no obligation to redeem clause.
CHANGES IN RESERVES INCLUDED IN SHAREHOLDERS’ EQUITY
Other restricted fundsThere has been no changes during 2013 or 2012 in other restricted equity funds.
Unrestricted equity fundsThe changes in unrestricted equity funds during 2013 relate to purchase of treasury shares and share-based payments related to Group's long-term incentive plan 2010-2012.
Hedging reserve and other OCI itemsThe items included in hedging reserve and other OCI items is presented below:
= Accounting principles
EUR mill. 2013 2012
Translation differences -0.3 -0.2Jet fuel price hedging 11.8 -1.7Jet fuel currency hedging -17.0 0.3Hedging of lease payments -1.6 -0.2Electricity pricehedging 0.0 0.0Available for sale financial assets 0.0 13.8The actuarial gains and losses of defined benefit plan -11.5 -11.8Deferred tax asset (liability) 3.7 -0.1Total -15.0 0.1
FINNAIR ANNUAL REPORT 2013
STRATEGY / CUSTOMERS / OPERATIONS / EMPLOYEES / SOCIETY / FINANCE / GOVERNANCE / GRI 108

Maturity dates of fair values recognised in the hedging reserve
EUR mill. 2014 2015 2016 2017 2018 Later Total
Translation differences -0.3 -0.3Jet fuel price hedging 7.3 4.4 0.1 11.8Jet fuel currency hedging -14.0 -3.0 -17.0Hedging of lease payments -1.4 -0.2 -1.6Electricity price hedging 0.0Available for sale financial assets 0.0The actuarial gains and losses of defined benefit plan -11.5 -11.5Deferred tax asset (liability) 3.9 -0.2 0.0 3.7Total -15.7 1.0 0.1 0.0 0.0 -0.3 -15.0
Derivatives in income statementDuring 2013, -3.9 million euros (50.0) has been recognised from fair value reserve as a change in expenses in the income statement. Of this, -3.4 million euros (47.8) is an adjustment of fuel expenses, -0.3 million euros (2.5) an adjustment of aircraft lease expenses and -0.2 million euros (-0.3) an adjustment of electricity expenses.
Finnair hedges against price fluctuation with derivatives based on its risk management policy. Hedge accounting is not or can not be ap-plied to all hedging relationships. For this fuel purchases hedging outside IFRS hedge accounting, -0.6 million euros (3.7) was realised and recognised as an adjustment to fuel expenses and 18.8 million euros (9.3) in other operating expenses in the income statement during 2013.
Sensitivity analysis of the fair value reserveIf the price of Jet fuel CIF NWE had been 10 per cent higher, the balance of the reserve would have been 40.5 million euros (43.2) higher. Correspondingly, a 10 per cent weaker Jet fuel CIF NWE price would have reduced the reserve by 40.5 million euros (43.2). In terms of the US dollar, a 10 per cent weaker level would have lowered the balance of the fair value reserve by 42.6 million euros (45.1) and a 10 per cent stronger dollar would have had a positive impact of 42.6 million euros (45.1). Elctricity price hedging was ineffective at the end of the year 2013, thus their valuation would have had no impact to the balance of the fair value reserve (0.0). The effect of change in interests to the fair value reserve in own equity is not essential. The enclosed sensitivity figures do not take into account any change in deferred tax liability (tax assets).
Own shares (Treasury shares)The acquisition cost of own shares held by the Group is included in invested distributable funds. For further information on the share bonus scheme see Note 3.9.1. Total amount of the acquisition cost of own shares held by the Group is 0.8 million euros.
Hybrid bondShareholders’ equity (after equity belonging to shareholders) includes a 120 million euro hybrid bond issued in 2012. The hybrid bond cou-pon is fixed 8.875 per cent per year for the first 4 years and therafter at least 11.875 per cent per year. Finnair can postpone intrest payment, if it does not distribute dividends or any other equity to its shareholders. The bond has no maturity date, but the company has the right to redeem it 4 years after the date of issue. The hybrid bond is unsecured and in a weaker preference position than promissory notes. A holder of hybrid bond notes has no shareholder rights.
Earnings per shareThe undiluted earnings per share figure is calculated by dividing the profit for the financial year attributable to the parent company's share-holders by the weighted average number of shares outstanding during the financial year. When calculating the earnings per share adjusted by dilution, the weighted average of the number of shares takes into account the diluting effect resulting from changing into shares all po-tentially diluting shares. The fair value of the share is based on the weighted average price of the shares in trading.
EUR mill. 2013 2012
Profit for the financial year, EUR mill. 10.8 10.2Interest of hybrid bond, EUR mill. -8.5 -8.5Weighted average number of shares, 1000 pcs 128.1 128.1Undiluted and diluted earnings per share, EUR 0.02 0.01Effect of own shares 0.00 0.00
DividendThe Board of Directors proposes to the Annual General Meeting that no dividend is paid for 2013. The Annual General Meeting on 27 March 2013 decided to distribute a dividend of 0.10 euros per share. The total dividend was 12.7 million euros, based on the number of shares registered on 3 April 2013. The dividend was paid on 10 April 2013.
Finnair Plc's distributable equity
EUR mill. 31 Dec 2013
Retained earnings at the end of financial year 0.0Unrestricted equity funds 250.5Hedging reserve -4.2Result for the financial year 37.7Distributable equity total 284.0
FINNAIR ANNUAL REPORT 2013
STRATEGY / CUSTOMERS / OPERATIONS / EMPLOYEES / SOCIETY / FINANCE / GOVERNANCE / GRI 109

6 OTHER NOTES
Other notes include all such notes that do not specifically relate to any previous subject matters.
6.1 INCOME TAXES
Income taxes
EUR mill. 2013 2012
Taxes for the financial year Current tax 0.2 0.1Adjustments recognised for current tax of prior periods 0.8 0.2Deferred taxes -2.0 4.0Total -1.0 4.3
The table below explains the difference between teorethical tax cost calculated with Finnish nominal tax rate (24.5%) and tax expense in the consolidated income statement:
EUR mill. 2013 2012
Profit before taxes 10.1 14.8Taxes calculated using the Finnish tax rate 2.5 3.6Effect of the tax rate change -4.5 0.0Different tax rates of foreign subsidiaries 0.0 0.0Share of result in associates and joint ventures 1.0 0.2Tax-exempt income -0.4 0.3Non-deductible expenses 0.5 0.0Adjustments recognised for taxes of prior periods -0.1 0.2Income taxes, total -1.0 4.3Effective tax rate -9.8% 29.2%
Effective tax rate was -9.8% (29.2%). Finnish Parliament decided in December 2013 to lower corporate income tax rate from 24.5% to 20%, which caused a one-time positive effect of 4.5 million euros in income statement 2013. Although the tax rate change is valid from 1 of Jan-uary 2014 onwards, the change effected taxes in income statement already in 2013 due to revaluation of deferred taxes. Tax rate excluding the effect of tax rate change was 27.5%.
Utilising deferred tax assets related to tax losses requires management to make expectations of future performance of oper-ations.
The tax expense for the period includes current and deferred tax and adjustments to previous years’ taxation. Tax is recognised in the income statement, except to the extent that it relates to items recognised in other comprehensive income or other equity items.
Deferred taxes are calculated for temporary differences between accounting and taxation using the valid tax rates for future years at the closing date. Deferred tax asset is recognised to the extent that realisation of the related tax benefit through future profits is probable. Temporary differences arise mainly from sales of tangible assets, depreciation, revaluations of derivative con-tracts, defined benefit pension scheme and unused tax losses. Deferred tax is recognised for subsidiaries’ undistributed earnings only when related tax effects are probable.
= Content of the section = Accounting principles = Critical accounting estimates
FINNAIR ANNUAL REPORT 2013
STRATEGY / CUSTOMERS / OPERATIONS / EMPLOYEES / SOCIETY / FINANCE / GOVERNANCE / GRI 110

DEFERRED TAX ASSETS AND LIABILITIES
Changes in deferred taxes during 2013:
EUR mill. 2012
Recognised in the income
statement
Recognised in shareholders’
equity 2013
Deferred tax assetsConfirmed losses 69.6 -12.4 1.5 58.6Employee benefits 0.0 -0.6 2.7 2.2Finance leasing 0.9 -0.3 0.0 0.6Capitalisation of overhead expenses 1.1 -0.1 0.0 1.0Heavy maintenance allocations 0.5 -0.5 0.0 0.0Engine maintenance allocations 0.5 -0.5 0.0 0.0Finnair Plus 1.5 -1.5 0.0 0.0Other temporary differences 3.4 -1.3 0.0 2.1Valuation of derivatives at fair value 0.1 0.0 1.2 1.3Total 77.6 -17.3 5.4 65.8
Deferred tax assets that can be used after more than 12 months 8.5 0.6
EUR mill. 2012
Recognised in the income
statement
Recognised in shareholders’
equity 2013
Deferred tax liabilitiesAccumulated depreciation difference 2.5 0.0 0.0 2.5Gains from sale of tangible fixed assets 81.4 -15.5 0.0 65.9Employee benefits -0.9 -2.4 3.3 0.0Other temporary differences 5.6 -1.5 0.0 4.1Valuation of derivates at fair value 3.0 0.0 -3.0 0.0Total 91.6 -19.3 0.3 72.6
Deferred tax liabilities that are expected to realise after 12 months or more 88.6 69.6
Confirmed tax losses expire earliest within 6-10 years.Distributing retained earnings of foreign subsidiaries as dividends would cause a tax effect of 0.4 million euros (0.8).
Changes in deferred taxes during 2012:
EUR mill. 2011
Recognised in the income
statement
Recognised in shareholders’
equity 2012
Deferred tax assetsConfirmed losses 64.4 4.6 0.6 69.6Finance leasing 1.1 -0.2 0.0 0.9Revenue recognition 0.1 0.0 0.0 0.1Capitalisation of overhead expenses 0.6 0.5 0.0 1.1Heavy maintenance allocations 1.0 -0.5 0.0 0.5Engine maintenance allocations 2.3 -1.8 0.0 0.5Other temporary differences 2.7 0.6 0.0 3.3Finnair Plus 3.0 -1.5 0.0 1.5Valuation of derivates at fair value 0.0 0.0 0.1 0.1Total 75.2 1.7 0.7 77.6
Deferred tax assets that can be used after more than 12 months 10.8 8.5
EUR mill. 2011
Recognised in the income
statement
Recognised in shareholders’
equity 2012
Deferred tax liabilitiesAccumulated depreciation difference 2.5 0.0 0.0 2.5Gains from sale of tangible fixed assets 80.1 1.3 0.0 81.4Other temporary differences 3.7 0.8 0.4 4.9Hybrid bond, interest 0.7 0.0 0.0 0.7Employee benefits 1.8 -2.7 0.0 -0.9Valuation of derivates at fair value 9.7 0.0 -6.7 3.0Total 98.5 -0.6 -6.3 91.6
Deferred tax liabilities payable after more than 12 months 91.9 88.6
FINNAIR ANNUAL REPORT 2013
STRATEGY / CUSTOMERS / OPERATIONS / EMPLOYEES / SOCIETY / FINANCE / GOVERNANCE / GRI 111

The following transactions have taken place with associated companies and joint ventures:
EUR mill. 2013 2012
Sales of goods and servicesAssociates 4.7 4.5Joint ventures 60.8 20.5Purchases of goods and servicesAssociates 20.3 17.7Joint ventures 85.5 81.2Receivables and liabilitiesCurrent receivables from associates 3.1 0.1Current liabilities to associates 3.5 0Current receivables joint ventures 32.9 22.4Current liabilities to joint ventures 4.5 8.7
Effect of restatement to 2012 consolidated income statement
EUR mill. Reported
IAS 19 Employee
Benefits
De-icing and cleaning of
aircraftOther
adjustment Restated
Operating income 2,494.1 0.0 0.0 0.0 2,494.1Staff costs 426.9 1.7 0.0 0.6 429.2Fleet materials and overhaul 156.0 0.0 -22.9 0.0 133.1Ground handling and catering expenses 224.3 0.0 22.9 0.0 247.2Sales and marketing expenses 74.3 0.0 0.0 1.4 75.7Other expenses 232.2 0.0 0.0 -2.0 230.2Other expenses total 1,344.9 0.0 0.0 0.0 1,344.9Operating result, EBIT 35.5 -1.7 0.0 0.0 33.8
Profit before taxes 16.5 -1.7 0.0 0.0 14.8Income taxes -4.7 0.4 0.0 0.0 -4.3Profit for the financial year 11.8 -1.3 0.0 0.0 10.5
Effect of the restatement to the 2012 opening and closing date balance sheet 1 January
201231 December
2012
EUR mill. Reported Adjustment Restated Reported Adjustment Restated
ASSETSNon-current assetsFinancial assets and pension receivables 32.1 36.0 68.1 33.1 -10.4 22.7Other non-current assets 1,589,4 0.0 1,589.4 1,478.0 0.0 1,478.0Non-current assets total 1,621.5 36.0 1,657.5 1,511.1 -10.4 1,500.7Short-term receivables total 735.5 0.0 735.5 730.6 0.0 730.6Assets total 2,357.0 36.0 2,393.0 2,241.7 -10.4 2,231.3
Shareholders' equity and liabilitiesShareholders' equity 75.4 0.0 75.4 75.4 0.0 75.4Other equity 676.4 27.2 703.6 709.2 -10.2 699.0Equity attributable to shareholders of the parent company 751.8 27.2 779.0 784.6 -10.2 774.4Non-controlling interests 0.7 0.0 0.7 0.9 0.0 0.9Equity total 752.5 27.2 779.7 785.5 -10.2 775.3Deferred tax liability 98.5 8.8 107.3 94.9 -3.3 91.6Pension obligations 0.0 0.0 0.0 0.5 3.1 3.6Other long-term liabilities 602.9 0.0 602.9 495.8 0.0 495.8Long-term liabilities total 701.4 8.8 710.2 591.2 -0.2 591.0Short-term liabilities total 903.1 0.0 903.1 865.0 0.0 865.0Liabilities total 1,604.5 8,8 1,613,3 1,456.2 -0.2 1,456.0Shareholders' equity and liabilities total 2,357.0 36.0 2,393.0 2,241.7 -10.4 2,231.3
Transactions with related parties are with arms length, and are with similar terms than transactions carried out with independent parties. Guarantees and other commitments made on behalf of related parties are presented in note 5.4 Contingent liabilities. Management remuner-ation is presented in note 3.9. Management has not been granted any loans and there has not been any other transactions with management.
Finnair pension fundThe Finnair pension fund in Finland is a stand-alone legal entity which mainly provides additional pension coverage to Finnair's personnel in the form of defined benefit plan, and manages related pension assets. The assets include Finnair's shares representing 0.1% (0.1%) of the company's outstanding shares. Real estate and premises owned by the pension fund have been mainly leased to Finnair. In 2013 Finnair didn't pay any contributions to the fund (7.5).
6.3 DISPUTES AND LITIGATION
Finnair reports only cases of which the interest is 400,000 euros or more and that are not insured.On 31 December 2013 there were no such disputes pending.
6.4 EVENTS AFTER THE CLOSING DATE
There have not been other remarkable events after closing date as told in the Board of Director's report
6.5 CHANGE OF ACCOUNTING PRINCIPLE
From 1 January 2013 Finnair Group has adopted the amendments to IAS 19 Employee Benefits. The change is allocated for the Airline Business segment. Previously applied corridor method in recognising actuarial gains and losses is no longer used. All the actuarial gains and losses are recognised as they occur through other comprehensive income. Items recognised in other comprehensive income are no longer recycled through profit and loss. The standard also requires net interest expense / income to be calculated as the product of the net defined benefit liability / asset.
The grouping of de-icing, cleaning of aircraft and a few other expenses have been changed.
6.2 RELATED PARTY TRANSACTIONS
Related party of Finnair group includes its subsidiaries, management, associated companies and joint ventures and Finnair pension fund. Subsidiaries are listed in the note 1.3 and associates and joint ventures in the note 1.6. Related party transactions include such operations that do not eliminate in group's consolidated financial statement.
Finnish government owns 55.8% (55.8%) of Finnair's shares. All the transactions with other government owned companies are with arms length basis.
FINNAIR ANNUAL REPORT 2013
STRATEGY / CUSTOMERS / OPERATIONS / EMPLOYEES / SOCIETY / FINANCE / GOVERNANCE / GRI 112

7 PARENT COMPANY FINANCIAL STATEMENTS
FINNAIR PLC INCOME STATEMENT
EUR mill. Note 2013 2012
Turnover 2 2,012.7 2,015.2Other operating income 3 37.6 10,1Operating income total 2,050.3 2,025.3
Materials and services 4 1,125.9 1,098.9Staff costs 5 272.9 287.4Depreciation 6 8.1 6.3Other operating expenses 7 718.4 702.7Operating expenses total 2,125.3 2,095.3
Operating profit/loss -75.0 -70.0
Financial income and expenses 8 30.2 -6.0
Profit/loss before extraordinary items -44.8 -76.0
Extraordinary items 9 103.6 74.8
Profit/loss before appropriations and taxes 58.8 -1.2
Appropriations 10 0.2 0.0Income taxes 11 21.3 -0.2
Profit/loss for the financial year 37.7 -1.0
FINNAIR PLC BALANCE SHEET
EUR mill. Note 2013 2012
ASSETS
Non-current assetsIntangible assets 12 12.0 13.2Tangible assets 13 39.7 2.0Investments 14
Shares in group companies 449.1 489.7Shares in associated companies 15.4 13.1Other investments 0.4 0.7
Loan and other receivables 15 68.9 299.9Non-current assets total 585.5 818.6
Current assetsCurrent receivables 16 915.0 478.8Marketable securities 17 335.5 362.6Cash and bank equivalents 18 118.2 62.1Current assets total 1,368.7 903.4
ASSETS TOTAL 1,954.1 1,722.0
EQUITY AND LIABILITIES
Equity 19Share capital 75.4 75.4Share premium account 24.7 24.7Legal reserve 147.7 147.7Hedging reserve -4.2 9.3Unrestricted equity funds 250.5 250.4Retained earnings 0.0 13.7Profit/loss for the financial year 37.7 -1.0Equity total 531.9 520.3
Accumulated appropriations 20 9.1 0.0
Provisions 21 94.0 109.7
LiabilitiesNon-current liabilities 22 322.3 237.3Current liabilities 23 996.8 854.7Liabilities total 1,319.1 1,092.0
EQUITY AND LIABILITIES TOTAL 1,954.1 1,722.0
FINNAIR ANNUAL REPORT 2013
STRATEGY / CUSTOMERS / OPERATIONS / EMPLOYEES / SOCIETY / FINANCE / GOVERNANCE / GRI 113

FINNAIR PLC CASH FLOW STATEMENT
EUR mill. 2013 2012
Cash flow from operating activitiesProfit/loss before extraordinary items -44.8 -76.0Depreciation 8.1 6.3Other non-cash transactions -39.7 4.7Financial income and expenses -30.2 6.0Changes in working capital -18.9 -0.5Interest and other financial expenses paid -26.6 -23.9Received interest and other financial income 12.0 18.7Taxes paid 0.0 -0.1Cash flow from operating activities -140.0 -64.8
Cash flow from investing activities Investments in intangible and tangible assets -3.6 -4.1Other investments 0.0 -3.8Proceeds from sales of other investments 54.1 0.0Dividends received 5.1 0.1Change in long-term receivables 26.4 25.3Cash flow from investing activities 82.0 17.5
Cash flow from financing activitiesProceeds from loans 150.0 70.8Loan repayments and changes -71.1 -152.8Hybrid bond repayments -52.4 -67.7Proceeds from hybrid bond 0.0 120.0Received group contributions 74.8 105.0Purchase of own shares -1.7 0.0Dividends paid -12.7 0.0Cash flow from financing activities 87.0 75.3
Change in cash flows 28.9 28.0
Change in liquid fundsLiquid funds, at beginning 424.7 396.7Change in cash flows 28.9 28.0Liquid funds, at end 453.6 424.7
NOTES TO FINNAIR PLC FINANCIAL STATEMENTS
1. ACCOUNTING PRINCIPLES
The financial statements of Finnair Plc have been prepared in accordance with the Finnish Accounting Standards (FAS).
Foreign currency itemsBusiness transactions in foreign currencies have been valued using the exchange rate at the date of transaction. Receivables and liabilities on the balance sheet date are valued using the exchange rate on the balance sheet date. Advances paid and received are valued in the balance sheet using the exchange rate at the date of payment. Exchange rate differences on trade receivables and payables are treated as the adjust-ments to turnover and other operating expenses. Exchange rate differences on other receivables and liabilities are entered under financial income and expenses.
Derivative contractsAccording to its risk management policy, Finnair uses foreign exchange, interest rate and commodity derivatives to reduce the risks which arise from the company's currency denominated purchase contracts, forecasted purchases and sales as well as future jet fuel purchases. De-rivative contracts are valued using the rates on the balance sheet date according to Accounting Act 5:2 a §. The accounting principles related to derivative contracts and hedge accounting are described more specifically in Group's accounting principles in the section 5.8 Derivatives.
Financial assets and liabilitiesFinancial assets have been classified into the following categories: financial assets at fair value through profit or loss (assets held for trading), held-to-maturity investments, loans and other receivables. The classification is made on the basis of the purpose of the acquisition of the financial assets in connection with the original acquisition. All purchases and sales of financial assets are recognised on the trade date. Lia-bilities are recognised at acquisition cost. Financial assets at fair value through profit and loss as well as assets and liabilities maturing within 12 months are included in current liabilities.
Finnair assesses on each closing date whether there is any objective evidence that the value of a financial asset item or group of items has been impaired. If there is objective evidence that an impairment loss has arisen for loans and other receivables entered at amortised acqui-sition cost on the balance sheet or for held-to-maturity investments, the size of the loss is determined as the difference of the book value of the asset item and the present value of expected future cash flows of the said financial asset item discounted at the original effective interest rate. The loss is recognised through profit and loss.
Other financial assets and liabilities are recognised at fair value. Other financial assets include trade receivables, accrued income and pre-paid expenses as well as other non-current receivables like loan receivables and other investments as well as the securities for aircraft leases. Other financial liabilities include trade payables, accruals and deferred income.
De-recognition of financial assets takes place when the company has lost its contractual right to receive the cash flows or when it has sub-stantially transferred the risks and rewards outside the company.
Fixed assets and depreciationThe balance sheet values for fixed assets are based on original acquisition costs less planned depreciation. Land areas are not depreciated. Planned depreciation is based on the expected economic lifetimes:
• IT software: 3–8 years• Other intangible assets: 3–10 years• Buildings: over 50 years from time of acquisition to a residual value of 10% or 3–7% of the diminishing balances• Other tangible assets 23% of the diminishing balances
FINNAIR ANNUAL REPORT 2013
STRATEGY / CUSTOMERS / OPERATIONS / EMPLOYEES / SOCIETY / FINANCE / GOVERNANCE / GRI 114

Research and development costsExcept for major software development costs, research and development costs are expensed as they occur. Research and development of aircraft, systems and operations is conducted primarily by the manufacturers.
LeasingLease payments for aircraft are significant. Annual lease payments are treated as rental expenses. Lease payments due in future years under aircraft lease contracts are presented as off-balance sheet items.
Extraordinary itemsExtraordinary items consist of income and expenses which deviate from the ordinary activities of the company, such as group contributions.
AppropriationsThe difference between total and planned depreciation is shown as accumulated appropriations in the balance sheet and the change during the financial year in the income statement.
Income taxesIncome taxes in the income statement include taxes calculated for the financial year based on Finnish tax provisions, adjustments to taxes in previous financial years and the change in deferred taxes.
Pension schemesThe mandatory pension cover of the company’s domestic employees has primarily been arranged through a Finnish pension insurance company and other additional pension cover through the Finnair pension fund or a Finnish pension insurance company. Since 1992, the pension fund has no longer accepted employees other than pilots for additional pension coverage. The Finnair pension fund’s pension ob-ligation is fully covered with respect to additional coverage. Pension fund liabilities are presented in the notes to the financial statements.
ProvisionsProvisions in the balance sheet and entered as expenses in the income statement comprise those items which the company is committed to covering through agreements or otherwise in the foreseeable future and which have no corresponding revenue and whose monetary value can be reasonably assessed.
The company is obliged to return leased aircraft at the required redelivery condition. To fulfil these maintenance obligations the company has recognised provisions based on flight hours flown during the maintenance period. Restructuring provisions are recognised when the company has prepared a detailed restructuring plan and has begun to implement the plan or has announced it.
2. TURNOVER AND OPERATING PROFIT BY BUSINESS AREAEUR mill. 2013 2012
Turnover by divisionAirline Business 2,012.7 2,015.2
Distribution of turnover by market areas based on flight routes, % of turnoverFinland 17% 17%Europe 38% 37%Other countries 45% 46%
Total 100% 100%
Operating profit by business areaAirline Business -75.0 -70.0
3. OTHER OPERATING INCOMEEUR mill. 2013 2012
Rental income 28.5 0.0Capital gains on sales of tangible assets 0.0 0.0Other income 9.1 10.1Total 37.6 10.1
4. MATERIALS AND SERVICESEUR mill. 2013 2012
Ground handling and catering expenses 179.3 170.1Fuel costs 667.4 639.1Aircraft materials and overhaul 183.5 194.9IT expenses 48.0 43.0Other items 47.7 51.8Total 1,125.9 1,098.9
5. STAFF COSTSEUR mill. 2013 2012
Wages and salaries 220.0 226.1Pension expenses 36.4 44.1Other social expenses 16.5 17.1Total 272.9 287.4
Salary and bonus expenses of Chief Executive Officer and Members of the Board of DirectorsChief Executive Officer and his debuty 0.9 0.8Board of Directors 0.4 0.3
Personnel on averageAirline Business 3,436 3,484Other functions 139 144
Total 3,575 3,628
FINNAIR ANNUAL REPORT 2013
STRATEGY / CUSTOMERS / OPERATIONS / EMPLOYEES / SOCIETY / FINANCE / GOVERNANCE / GRI 115

6. DEPRECIATIONEUR mill. 2013 2012
Planned depreciation and amortisationOn other long-term expenditure 5.4 5.8On buildings 0.8 0.0On other equipment 1.8 0.5Total 8.1 6.3
7. OTHER OPERATING EXPENSESEUR mill. 2013 2012
Lease payments for aircraft 238.9 251.0Other rents for aircraft capacity 93.0 63.3Office and other rents 30.3 15.8Traffic charges 218.3 220.1Sales and marketing expenses 59.5 60.9Other expenses 78.4 91.7Total 718.4 702.7
8. FINANCIAL INCOME AND EXPENSESEUR mill. 2013 2012
Dividend incomeFrom group companies 4.0 0.0From other companies 1.1 0.1
Total 5.1 0.1
Interest incomeFrom group companies 10.6 14.5From associates and joint ventures 0.6 0.0From other companies 2.0 4.5
Total 13.3 18.9
Other financial incomeFrom group companies 8.4 0.0From other companies 1.1 0.0
Total 9.4 0.0
Gains on disposal of shares 35.2 0.0
Interest expensesTo group companies -1.6 -1.6To other companies -20.1 -17.3
Total -21.6 -18.8
Other financial expensesTo group companies -6.1 0.0To other companies -2.9 -4.9
Total -9.0 -4.9
Exchange gains and losses -2.2 -1.2
Financial income and expenses total 30.2 -6.0
9. EXTRAORDINARY ITEMSEUR mill. 2013 2012
Received group contribution 103.6 74.8
10. APPROPRIATIONSEUR mill. 2013 2012
Change in depreciation difference 0.2 0.0
11. DIRECT TAXESEUR mill. 2013 2012
Income taxes on regular business operations -15.5 -22.7Income taxes on extraordinary items 25.4 18.3Change in deferred taxes 11.5 4.1Total 21.3 -0.2
12. INTANGIBLE ASSETSEUR mill. 2013 2012
Other long-term expenditureAcquisition cost 1 January 39.1 35.2
Additions 0.4 3.9Effect of the merger 5.0 0.0Disposals -1.8 0.0
Acquisition cost 31 December 42.6 39.1
Accumulated depreciation 1 January -25.9 -20.1Accumulated planned depreciation of disposals 1.8 0.0Effect of the merger -1.1 0.0Depreciation -5.4 -5.8
Accumulated depreciation 31 December -30.6 -25.9
Book value 31 December 12.0 13.2
FINNAIR ANNUAL REPORT 2013
STRATEGY / CUSTOMERS / OPERATIONS / EMPLOYEES / SOCIETY / FINANCE / GOVERNANCE / GRI 116

13. TANGIBLE ASSETS
Tangible assets 2013
EUR mill.
Land
Buildings
Other equipment
Advances paid
Total
Acquisition cost 1 January 2013 0.0 0.0 8.5 0.0 8.5
Additions 2.1 1.1 3.2
Effect of the merger 0.7 51.0 3.0 3.0 57.8
Disposals -5.3 -5.3
Acquisition cost 31 December 2013 0.7 51.0 8.3 4.1 64.1
Accumulated depreciation 1 January 2013 0.0 0.0 -6.5 0.0 -6.5
Accumulated planned depreciation of disposals 4.3 4.3
Effect of the merger -18.4 -2.3 -20.7
Depreciation -0.8 -0.8 -1.6
Accumulated depreciation 31 December 2013 0.0 -19.3 -5.2 0.0 -24.5
Book value 31 December 2013 0.7 31.7 3.1 4.1 39.7
The share of machines and equipment in the book value of tangible assets 31 December 2013 3.0
Tangible assets 2012
EUR mill.
Land
Buildings
Other equipment
Advances paid
Total
Acquisition cost 1 January 2012 8.3 8.3Additions 0.2 0.2Disposals 0.0 0.0
Acquisition cost 31 December 2012 0.0 0.0 8.5 0.0 8.5
Accumulated depreciation 1 January 2012 -6.0 -6.0Accumulated planned depreciation of disposals 0.0 0.0Depreciation -0.5 -0.5
Accumulated depreciation 31 December 2012 0.0 0.0 -6.5 0.0 -6.5
Book value 31 December 2012 0.0 0.0 2.0 0.0 2.0
The share of machines and equipment in the book value of tangible assets 31 December 2012 1.9
Associates Share of parent company %
Suomen Ilmailuopisto Oy, Pori 49.50Flybe Nordic, Sweden 40.00Kiinteistö Oyj Lentäjäntie 1, Vantaa 28.33
Group companies Share of parent company %
Share of parent company %
Finnair Cargo Oy, Helsinki 100.00 Finnair Technical Services Oy, Helsinki 100.00Finnair Cargo Terminal Operations Oy, Helsinki 100.00 Finnair Engine Services Oy, Helsinki 100.00Amadeus Finland Oy, Helsinki 95.00 Finnair Flight Academy Oy, Helsinki 100.00Suomen Matkatoimisto Oy, Helsinki 100.00 Northport Oy, Helsinki 100.00Area Baltica Reisiburoo AS, Estonia 100.00 Finland Travel Bureau Oy, Helsinki 100.00Back Office Services Estonia Oü, Estonia 100.00 Kiinteistö Oy LEKO 8, Vantaa 100.00Oy Aurinkomatkat - Suntours Ltd Ab, Helsinki 100.00 Kiinteistö Oy Air Cargo Center 1, Vantaa 100.00FTS Financial Services Oy, Helsinki 100.00 IC Finnair Ltd, Great Britain ** 100.00Finnair Travel Retail Oy, Helsinki 100.00 Finnvero Gmbh, Germany 100.00LSG Sky Chefs Finland Oy, Helsinki * 100.00 A/S Aero Airlines, Estonia 100.00Finnair Aircraft Finance Oy, Helsinki 100.00 Norvista Travel Ltd, Canada 100.00
* The group has made an co-operation agreement which includes a call option and ceased control over the company
** IC Finnair Ltd is a fully owned captive insurance company in Guernsey which rearnings are subject to normal taxation in Finland.
Finnair Facilities Management Oy was merged with the parent company on 31 March 2013.
14. INVESTMENTSEUR mill. 2013 2012
Group companiesAcquisition cost 1 January 489.7 489.7
Additions 0.0 0.0Effect of the merger -40.6 0.0Disposals 0.0 0.0
Book value 31 December 449.1 489.7
Associates and joint venturesAcquisition cost 1 January 13.1 9.4
Additions 0.0 3.7Effect of the merger 2.2 0.0
Book value 31 December 15.4 13.1
Shares in other companiesAcquisition cost 1 January 0.7 0.7
Additions 0.0 0.0Effect of the merger 0.0 0.0Disposals -0.4 0.0
Book value 31 December 0.4 0.7
FINNAIR ANNUAL REPORT 2013
STRATEGY / CUSTOMERS / OPERATIONS / EMPLOYEES / SOCIETY / FINANCE / GOVERNANCE / GRI 117

15. LOAN AND OTHER RECEIVABLESEUR mill. 2013 2012
Non-current loan receivablesFrom group companies 14.5 223.5
From associates and joint ventures 9.9 9.9From other companies 0.2 0.3
Total 24.7 233.7
Deferred tax assets 1 January 66.2 65.7From profit/loss for the financial period -9.8 4.3From temporary differences -13.1 -3.9From valuation of derivates at fair value 1.1 0.0
Deferred tax assets 31 December 44.2 66.2
Loan and other receivables total 68.9 299.9
16. CURRENT RECEIVABLES EUR mill. 2013 2012
Short-term receivables from group companiesTrade receivables 33.7 25.1Accrued income and prepaid expenses 106.2 73.8Other receivables 379.9 172.2
Total 519.8 271.0
Short-term receivables from associates and joint venturesTrade receivables 0.0 0.0Accrued income and prepaid expenses 206.6 38.6
Total 206.6 38.6
Short-term receivables from othersTrade receivables 109.1 95.4Prepaid expenses 69.1 34.0Other receivables 10.3 39.7
Total 188.5 169.1
Short-term receivables total 915.0 478.8
17. INVESTMENTSEUR mill. 2013 2012
Short-term investments at fair value 335.5 362.6
18. CASH AND BANK EQUIVALENTSEUR mill. 2013 2012
Funds in group bank accounts and deposits maturing in three months 118.2 62.1
19. SHAREHOLDERS' EQUITYEUR mill. 2013 2012
Share capital 1 January 75.4 75.4Share capital 31 December 75.4 75.4
Share premium account 1 January 24.7 24.7Share premium account 31 December 24.7 24.7
Legal reserve 1 January 147.7 147.7Legal reserve 31 December 147.7 147.7
Hedging reserve 1 January 9.3 28.1Change -13.6 -18.8
Hedging reserve 31 December -4.2 9.3
Unrestricted equity funds 1 January 250.4 250.4Purchase of own shares -1.7 0.0Share-based payments 1.9 0.0
Unrestricted equity funds 31 December 250.5 250.4
Retained earnings 1 January 12.7 13.7Dividend -12.7 0.0
Retained earnings 31 December 0.0 13.7
Profit/loss for the financial year 37.7 -1.0
Shareholders' equity total 531.9 520.3
Distributable equityHedging reserve -4.2 0.0Unrestricted equity funds 250.5 250.4Retained earnings 0.0 13.7Profit/loss for the financial year 37.7 -1.0
Total 284.0 263.1
20. ACCUMULATED APPROPRIATIONSEUR mill. 2013 2012
Accumulated depreciation difference 1 January 0.0 0.0Effect of the merger 9.3 0.0Change in depreciation difference -0.2 0.0
Accumulated depreciation difference 31 December 9.1 0.0
FINNAIR ANNUAL REPORT 2013
STRATEGY / CUSTOMERS / OPERATIONS / EMPLOYEES / SOCIETY / FINANCE / GOVERNANCE / GRI 118

21. PROVISIONSEUR mill. 2013 2012
Provisions 1 January 109.7 115.8Provision for the period 21.9 19.2Provision used -33.1 -24.1
Exhange rate differences -4.5 -1.2Provisions 31 December 94.0 109.7Of which long-term 69.3 82.3Of which short-term 24.8 27.4Total 94.0 109.7Long-term aircraft maintenance provisions are expected to be used by 2020.
22. NON-CURRENT LIABILITIESEUR mill. 2013 2012
Deferred tax liability from valuation of derivates at fair value 0.0 3.0Loans from group companies 1.0 1.0Loans from financial institutions 48.2 58.7Bonds 151.2 0.0Hybrid loan 120.0 172.4Other liabilities 1.8 2.1Total 322.3 237.3
Maturity of interest-bearing liabilies2014 55.02015 48.32016 0.02017 0.02018 151.22019 and later 121.0Total 375.5
23. CURRENT LIABILITIESEUR mill. 2013 2012
Current liabilities to group companiesTrade payables 25.7 34.4Accruals and deferred income 24.5 23.0Other liabilities 138.9 143.1
Total 189.1 200.5
Current liabilities to associates and joint venturesTrade payables 0.0 2.1Accruals and deferred income 164.3 32.3Total 164.3 34.4
Current liabilities to othersLoans from financial institutions 10.5 32.7Commercial papers 44.5 80.9Trade payables 52.8 55.0Accruals and deferred income 514.2 414.9Other liabilities 21.5 36.4Total 643.4 619.8
Current liabilities total 996.8 854.7
Accruals and deferred incomeUnflown air transport revenues 255.6 204.6Jet fuels and traffic charges 248.9 101.4Holiday payments 52.3 50.2Loyalty program Finnair Plus 32.2 32.5Other items 114.1 81.4
Total 703.0 470.1
FINNAIR ANNUAL REPORT 2013
STRATEGY / CUSTOMERS / OPERATIONS / EMPLOYEES / SOCIETY / FINANCE / GOVERNANCE / GRI 119

EUR mill. 2013 2012
Other lease paymentsWithin one year 27.5 6.3After one year and not later than 5 years 80.9 10.5Later than 5 years 140.0 0.0
Total 248.4 16.7
Operating lease obligations have increased due to the merger of the Group's facilities management subsidiary to parent company.
Pension obligationsTotal obligation of pension fund 317.8 302.2Mandatory portion covered - -Non-mandatory benefit covered -317.8 -302.2
Uncovered obligation of pension fund 0.0 0.0Obligation for pensions paid directly by the company 0.0 0.0Total 0.0 0.0
25. DERIVATIVES31 Dec 2013 31 Dec 2012
EUR mill. Nominal value Fair value Nominal value Fair value
Currency derivativesHedge accounting items:Jet fuel currency hedging (forward contracts) 370.5 -17.0 413.5 0.3
Hedge accounting items total 370.5 -17.0 413.5 0.3
Items outside hedge accounting:Operational cash-flow hedging (forward contracts) 407.9 2.4 173.3 -0.9
Operational cash-flow hedging (options)Call options 149.8 16.1 105.5 5.9
Put options 169.5 -0.8 110.5 -0.8
Items outside hedge accounting total 727.2 17.7 389.3 4.2
Currency derivatives total 1,097.7 0.7 802.8 4.5
Commodity derivativesHedge accounting items:
Jet fuel forward contracts, tonnes 563,550 11.8 574,660 -1.7
Electricity derivatives, MWh 17,568 0.0 - -
Hedge accounting items total 11.8 -1.7
Items outside hedge accounting:Jet fuel forward contracts, tonnes 18,000 0.8 0 0.0
OptionsCall options, jet fuel, tonnes 201,000 3.4 214,000 3.1
Put options, jet fuel, tonnes 201,000 -1.1 301,000 -4.1
Electricity derivatives, MWh 71,100 -0.5 - -
Items outside hedge accounting total 2.6 -1.0
Commodity derivatives total 14.4 -2.7
Interest rate derivativesHedge accounting items:
Interest rate swaps 150.0 1.2 0.0 0.0
Hedge accounting items total 150.0 1.2 0.0 0.0
Items outside hedge accounting:Interest rate swaps 25.0 -0.5 25.0 -1.1
Items outside hedge accounting total 25.0 -0.5 25.0 -1.1
Interest rate derivatives total 175.0 0.7 25.0 -1.1
Derivatives total 15.8 0.7
24. COLLATERAL, CONTINGENT LIABILITIES AND OTHER COMMITMENTSEUR mill. 2013 2012
Guarantees and contingent liabilitiesOn behalf of group companies 571.3 698.8On behalf of associates 2.0 2.0On others companies 0.3 0.5
Total 573.5 701.3
Aircraft lease paymentsWithin one year 223.6 239.4After one year and not later than 5 years 658.3 721.0
Later than 5 years 139.9 184.4Total 1,021.7 1,144.8
Parent company has leased the aircraft fleet from the fully owned subsidiary.
FINNAIR ANNUAL REPORT 2013
STRATEGY / CUSTOMERS / OPERATIONS / EMPLOYEES / SOCIETY / FINANCE / GOVERNANCE / GRI 120

Operational result:Operating profit excluding capital gains, fair value changes in derivatives, changes in the exchange rates of fleet overhauls and non-recurring items
Operational EBITDA:Operational result + depreciation
Operational EBITDAR:Operational result + depreciation + lease payments for aircraft
Shareholders' equity:Equity attributable to owners of the parent
Gross capital expenditure:Investments in intangible and tangible assets - prepayments during the financial year
Average capital employed:Balance sheet total - non-interest-bearing liabilities
Interest-bearing net debt:Interest-bearing liabilities - other current financial assets - cash and cash equivalents
Earnings/share:Profit for the financial year - hybrid bond interest
Average number of shares during the financial year, adjusted for share issues
Equity/share:Shareholders' equity
Number of shares at the end of the financial year, adjusted for share issues
Dividend/earnings, %:Dividend/share
x 100Earnings/share
Dividend yield, %:Dividend/share
x 100Share price at the end of the financial year
Cash flow from operating activities/share:Cash flow from operating activities
Average number of shares during the financial year, adjusted for share issues
Price/earnings ratio (P/E):Share price at the end of the financial year
Earnings/share
Equity ratio, %:Shareholders' equity + non-controlling interests
x 100Balance sheet total - advances received
Gearing, %:Net interest-bearing liabilities
x 100Shareholders' equity + non-controlling interests
Adjusted gearing, %:Net interest-bearing liabilities + 7 x lease payments for aircraft
x 100Shareholders' equity + non-controlling interests
Return on equity (ROE), %:Profit for the financial year
x 100Shareholders' equity + non-controlling interest (average)
Return on capital employed (ROCE), %:Profit before taxes + financial expenses
x 100Average capital employed
CALCULATION OF KEY INDICATORS
FINNAIR ANNUAL REPORT 2013
STRATEGY / CUSTOMERS / OPERATIONS / EMPLOYEES / SOCIETY / FINANCE / GOVERNANCE / GRI 121

AUDITOR’S REPORT (TRANSLATION FROM THE FINNISH ORIGINAL)
To the Annual General Meeting of Finnair OyjWe have audited the accounting records, the financial statements, the report of the Board of Directors and the administration of Finnair Oyj for the year ended 31 December, 2013. The financial statements comprise the consolidated statement of financial position, income statement, statement of comprehensive income, statement of changes in equity and statement of cash flows, and notes to the consolidated financial statements, as well as the parent company’s balance sheet, income statement, cash flow statement and notes to the financial statements.
Responsibility of the Board of Directors and the Managing DirectorThe Board of Directors and the Managing Director are responsible for the preparation of consolidated financial statements that give a true and fair view in accordance with International Financial Reporting Standards (IFRS) as adopted by the EU, as well as for the preparation of financial statements and the report of the Board of Directors that give a true and fair view in accordance with the laws and regulations governing the preparation of the financial statements and the report of the Board of Directors in Finland. The Board of Directors is responsible for the appropriate arrangement of the control of the company’s accounts and finances, and the Managing Director shall see to it that the accounts of the company are in compliance with the law and that its financial affairs have been arranged in a reliable manner.
Auditor’s ResponsibilityOur responsibility is to express an opinion on the financial statements, on the consolidated financial statements and on the report of the Board of Directors based on our audit. The Auditing Act requires that we comply with the requirements of professional ethics. We conducted our audit in accordance with good auditing practice in Finland. Good auditing practice requires that we plan and perform the audit to obtain reasonable assurance about whether the financial statements and the report of the Board of Directors are free from material misstatement, and whether the members of the Board of Directors of the parent company or the Managing Directors are guilty of an act or negligence which may result in liability in damages towards the company or whether they have violated the Limited Liability Companies Act or the articles of association of the company.
An audit involves performing procedures to obtain audit evidence about the amounts and disclosures in the financial statements and the report of the Board of Directors. The procedures selected depend on the auditor’s judgment, including the assessment of the risks of material misstatement, whether due to fraud or error. In making those risk assessments, the auditor considers internal control relevant to the entity’s preparation of financial statements and report of the Board of Directors that give a true and fair view in order to design audit procedures that are appropriate in the circumstances, but not for the purpose of expressing an opinion on the effectiveness of the company’s internal control. An audit also includes evaluating the appropriateness of accounting policies used and the reasonableness of accounting estimates made by management, as well as evaluating the overall presentation of the financial statements and the report of the Board of Directors. We believe that the audit evidence we have obtained is sufficient and appropriate to provide a basis for our audit opinion.
Opinion on the Consolidated Financial StatementsIn our opinion, the consolidated financial statements give a true and fair view of the financial position, financial performance, and cash flows of the group in accordance with International Financial Reporting Standards (IFRS) as adopted by the EU.
Opinion on the Company’s Financial Statements and the Report of the Board of DirectorsIn our opinion, the financial statements and the report of the Board of Directors give a true and fair view of both the consolidated and the parent company’s financial performance and financial position in accordance with the laws and regulations governing the preparation of the financial statements and the report of the Board of Directors in Finland. The information in the report of the Board of Directors is consistent with the information in the financial statements.
Other OpinionsWe support that the financial statements and the consolidated financial statements should be adopted. The proposal by the Board of Directors regarding the use of the profit shown in the balance sheet is in compliance with the Limited Liability Companies Act. We support that the Members of the Board of Directors and the Managing Directors of the parent company should be discharged from liability for the financial period audited by us.
Helsinki, 28 February, 2014
PricewaterhouseCoopers OyAuthorised Public Accountants
Mikko NieminenAuthorised Public Accountant
FINNAIR ANNUAL REPORT 2013
STRATEGY / CUSTOMERS / OPERATIONS / EMPLOYEES / SOCIETY / FINANCE / GOVERNANCE / GRI 122

FINANCIAL INDICATORS
EC1 Direct economic value generated and distributed, including revenues, operating costs, employee compensation, donations and other community investments, retained earnings, and payments to capital providers and governments
EUR million 2013 2012 2011
Direct economic valueConsolidated turnover 2,400.3 2,449.4 2,257.7Other operating income 18.8 20.8 13.9Financial income 42.6 7.9 9Total 2,461.7 2,478.1 2,280.6
Distributed economic value*Cash paid outside the company, materials and services, other operating expenses 1,918.2 1,839.8 1,7486Payments to personnel** 408.0 420.3 447.9Payments made to shareholders and loan providers Dividend*** 12.8 0 0 Interest and other financial expenses 19.7 25.5 30.6Payments to government **** 9.6 7.7 8.5Donations and other charitable payments n/a n/a n/aDistributed, total 2,368.3 2,293.3 2,235.6Economic value retained for operational development 93.4 184.8 45.0Investments in tangible and intangible assets as well as acquisitions of subsidiaries 42.0 41,4 158,6Operational result -4.8 43.2 -60.9Return on capital employed (ROCE), % 2.3 2.8 -5.2
* Includes EUR 34 million capital gain from the sale of Norwegian Air Shuttle ASA’s shares in 2013. ** Payments to personnel include wages and salaries and paid contributions related to pension plans. More information on payments to personnel is available in Finnair’s 2013 Remuneration Statement on pages 147–155. *** A dividend of EUR 0.10 per share was paid for 2012, amounting to EUR 12.8 million. The Board of Directors proposes to the Annual General Meeting 2014, that no dividend be paid for 2013.**** Includes paid income taxes, social security payments and taxes on property.
EC2 Financial implications and other risks and opportunities for the organisation’s activities due to climate changeIn combating climate change, the main measures are directed at reducing the combustion of fossil fuels. The jet fuel used by Finnair is fossil fuel and fuel costs are Finnair’s single most significant cost item. Therefore, all the factors influ-encing the price of jet fuel similarly influence Finnair’s operating costs.
The need to reduce fuel consumption and the resultant carbon dioxide emissions has a significant impact on the company’s business operations. Finnair’s long-term goal is to reduce emissions per seat by 24 per cent by 2017, using 2009 as the baseline.
In order to reduce its fuel consumption, Finnair follows a strategy comprised of four elements: technological develop-ment, improvement of operational efficiency, development of infrastructure and support of the global emissions trad-ing scheme. Finnair operates a modern fleet and invests in fuel-efficient next-generation aircraft in the coming years to maintain its competitive advantage.
For several years now Finnair has voiced its support for a global market-based measure for offsetting greenhouse gas emissions that would complement the industry’s technological, operational and infrastructural efforts to reduce emis-sions. These measures are described on page 54 under the title “A global solution to climate change”. In 2013, Finnair participated in European Union’s Emissions Trading Scheme (EU-ETS), which concerned only Intra-European flights. The direct costs incurred by Finnair from emissions trading totalled approximately EUR 2.6 million in 2013. The direct costs of emissions trading in the coming years are difficult to estimate due to potential regulatory changes.
Finnair is a leading airline in carbon dioxide emissions reporting and reducing emissions. The risks, opportunities, financial effects and management methods related to climate change are described in detail in Finnair’s responses to the Carbon Disclosure Project (CDP) report. Finnair placed among the leading airlines in the Carbon Disclosure Pro-ject (CDP) 2013 report and was also included in the CDP Nordic 260 Climate Disclosure Leadership Index (CDLI) for the second consecutive year. The CDP is the world’s only global environmental disclosure system and represents 722 international investors from around the world. Finnair has participated in the CDP since 2007.
EC3 Coverage of the organisation’s defined benefit plan obligationsAll Finnair employees are covered by pension security in accordance with the Employee Pensions Act (TyEL). Pension contributions amount to 16.8 per cent of salaries and 12.7 per cent of total personnel expenses. In addition, some em-ployees are covered by an additional pension fund benefit and management by an additional benefit in accordance with their contracts. Of group personnel, around 46.3 per cent are covered by the additional pension fund benefit. Finnair’s pension liability (Finnish Accounting Standards) in respect of its own pension fund was EUR 333.9 million at the end of 2013. Pension liabilities are covered in full.
FINNAIR ANNUAL REPORT 2013
STRATEGY / CUSTOMERS / OPERATIONS / EMPLOYEES / SOCIETY / FINANCE / GOVERNANCE / GRI 123

EC4 Significant financial assistance received from governmentThe Finnish Government does not support Finnair’s operations financially. The Finnair Aviation College constitutes an exception. The Finnair Aviation College, founded in 1964, is a special vocational educational establishment main-tained by Finnair Plc, which operates as a special educational establishment under the Act on Vocational Adult Edu-cation (631/1998).
The Finnair Aviation College’s task is to arrange further vocational training leading to a vocational or special voca-tional qualification as well as other further vocational training required for the practice of Finnair Plc’s and its subsidi-aries’ operations (Further Vocational Training Arrangement Permit 551/530/2006, 13 December 2006). As a private-ly-owned educational establishment, the Finnair Aviation College funds its operations in accordance with government aid practices. In 2013, the Finnair Aviation College received a total of approximately EUR 2.2 million.
EC6 Policy, practices and proportion of spending on locally-based suppliers at significant locations of operationThe key objective of procurement at Finnair is to secure competitiveness, customer experience, operational excellence and compliance with laws and regulations. The majority of Finnair purchases are determined by the Finnair flight net-work and related geographical scope of relevant service and goods suppliers. A considerable part of the services Finnair requires for flight operations are sourced locally because of the nature of the operations. At the group level, Finnair mon-itors and collects spend data on purchases from all suppliers and from all regions. Finnair supplier qualification princi-ples include, both locally and globally, compliance with air operation laws and regulations, conformance to Finnair qual-ity requirements, price competitiveness and general reliability and responsibility of a supplier toward the environment, employees and the local community. Many of the group’s procurement categories are officially regulated, in which case possible suppliers must be approved by the authorities. For example, all purchases relating to flight safety are of this type.
The company wide Supplier Code of Conduct defines the overall policy on sustainability and ethics of Finnair pro-curement activities.
Finnair’s largest single procurement item is jet fuel, which is also the most significant operational expense item. In jet fuel procurement, Finnair gives significant weight on financial factors and reliability of supply. The jet fuel is typically procured locally on each flight destination from some 60 different suppliers.
Most of the hotels used in the program of Finnair Group’s subsidiary Aurinkomatkat-Suntours Ltd are small and medium-sized hotels, which are, as a rule, locally owned. For example, in Aurinkomatkat’s biggest summer destination country, Greece, more than 90 per cent of the hotels used by Aurinkomatkat in summer 2013 were in local ownership.
In addition, Aurinkomatkat has a local representative at each of its destinations, from whom the company purchases, among other things, ground transfers, tour arrangements and other operational services. Finnair’s travel agency SMT,
which was formed in 2013 by merging Finnair’s subsidiaries Area Oy and Finland Travel Bureau Ltd, is specialised in business travel and also uses local agents when preparing travel programs and making group bookings.
EC9 Understanding and describing significant indirect economic impacts, including the extent of impactsAviation is a significant industry for Finnish society and the national economy. The accessibility created by airline traf-fic is a necessity for Finland’s global competitiveness and its economic impact is considerable; aviation is estimated to account for up to 4 per cent of GDP, employment and tax revenue (Source: “Economic Benefits from Air Transport in Finland,” Oxford Economics, 2012). Finnair’s effective Asian strategy is a key element of the GDP contribution of avia-tion. More information on the economic impact of aviation is available on pages 51–57 in this report. Further informa-tion is also available at www.benefits ofaviation.aero and on the IATA website at www.iata.org.
FINNAIR ANNUAL REPORT 2013
STRATEGY / CUSTOMERS / OPERATIONS / EMPLOYEES / SOCIETY / FINANCE / GOVERNANCE / GRI 124

GovernanceMANAGEMENT PRINCIPLESGeneral management principlesResponsibility is integral to all Finnair operations. Finnair’s Code of Conduct is based on the principle that everything Finnair does must – and will be – evaluated against the highest eth-ical business standards.
CONFORMING WITH LAWS AND REGULATIONSBusiness operations are based on internationally accepted ethical principles governing busi-ness partnerships and interest group relationships. Company specific authorities on the gov-ernance of Finnair include principles, policies and guidelines issued by Finnair’s Board of Di-rectors. In financial reporting, Finnair applies the rules relating to listed companies as well as international financial reporting standards. Most of Finnair’s operational activities are based on official regulations and are subject to official supervision.
Within the group, the legality and acceptability of operations is monitored as part of Finnair’s general control and audit processes. The responsibility for regulatory compliance lies with the persons defined and approved by the authorities. Finnair is also subject to supervision relat-ing to finances and information security. Internal control and audit roles and responsibilities are compliant with the Finnish Companies Act, the Finnish Corporate Governance Code for Listed Companies and the regulations governing the aviation industry.
Finnair’s governance model, control environment and activities, internal audit and the roles and responsibilities related to these are described in detail in Finnair’s Corporate Governance Statement on pages 131–141.
PUBLIC AFFAIRS AND LOBBYINGAviation is a strictly regulated industry. As such, it is important for us to participate in discus-sions and decision-making that concern Finnair’s operating conditions.
Finnair pursues its interests in an ethically sustainable manner by appropriately introduc-ing its views, perspectives and technical expertise where necessary. The company does not pressurise or support political decision-makers in any way. Finnair monitors the legality and ethicality of public affairs and lobbying activities as part of the company’s general supervision and audit processes.
The aim of Finnair’s lobbying activities is to maintain relationships concerning relevant pol-icy and to participate in relevant negotiations and the operations of advocacy organisations.
When lobbying on various civil aviation and industry regulation issues, Finnair typically co-operates with various organisations and chambers of commerce. Finnair is an active member of various aviation industry associations, such as AEA and IATA, but also in the Confedera-tion of Finnish Industries (EK) and its sub-associations and in several chambers of commerce.
COMMUNICATIONSFinnair aims at open, honest and timely communications. In line with these principles, Finnair’s communications are also in compliance with regulations governing listed companies and lim-ited liability companies, as well as the obligations of the Finnish Act on Cooperation within Un-dertakings and the communications guidelines of the State Ownership Steering Department.
Finnair takes different perspectives into consideration and respects all stakeholders’ views of our operations. Responsibility must also be reflected in all of the company’s operations and strategy, including communications and brand building. Responsible communication is one of the fundamental requirements for maintaining good relations with all stakeholders.
Finnair’s internal communications is based on reciprocity. Every employee has the duty to communicate matters related to their area of responsibility to the relevant target groups. Those in supervisory roles have a further duty to communicate goals, operations and results to their own work community and create a work environment that enables genuine construc-tive discussion.
CORRUPTION AND BRIBERY: ZERO TOLERANCEFinnair does not condone corruption in any form. Identifying and assessing corruption risks are part of the general risk assessment carried out by the company and its business units.
Finnair’s procurement policy sets clear principles to ensure ethical purchasing. Finnair ex-pects its suppliers also to act in accordance with the company’s ethical standards. Supervi-sion relating to the prevention of corruption is the responsibility of each Finnair employee as well as those in charge of business functions and the internal audit. The internal audit moni-tors compliance with the key principles of the Code of Conduct as part of analysing and con-trolling business processes.
Accepting or giving bribes is strictly forbidden. Giving and accepting business gifts should be avoided where possible without acting contrary to good manners. Suspected cases of brib-ery must be reported to the company’s Internal Auditing department and, where necessary, relevant training will be arranged for new recruits.
FINNAIR ANNUAL REPORT 2013
STRATEGY / CUSTOMERS / OPERATIONS / EMPLOYEES / SOCIETY / FINANCE / GOVERNANCE / GRI 125

FAIR COMPETITIONThe airline industry is a highly competitive sector globally and new competitors are constantly entering the market. Finnair complies with competition law in all operations, and its Finnair Legal Affairs Department regularly assesses the risks related to competition law associated with partnership agreements and other operations. The department is responsible for issuing instructions and arranging training on competition law. Internal Auditing verifies compliance with competition law as part of general process and control audits.
Economic responsibility
ECONOMIC OPERATING PRINCIPLESFinnair’s objective is to create sustainable economic added value by producing flight servic-es profitably, cost-competitively and in harmony with the needs of the environment and so-ciety. Responsible operations are the cornerstone of profitable business activity, and Finnair takes into account the effects of its operations on the environment and society. These effects are identified and assessed by the company’s corporate social responsibility and risk manage-ment organisations, which work under the authority of the CEO.
Finnair’s Board of Directors has set the company’s financial targets, which are outlined in material directed at investors. As a public limited company, Finnair is committed to earning a profit for its shareholders. The company’s profit distribution principles are expressed in Finnair’s dividend policy. Finnair’s financial reporting aims to provide, as transparently as possible, in-formation about Finnair’s financial position and development.
Finnair’s strategy and market environment is described in this report on pages 5-8. Finnair’s financial performance in 2013 is described on pages 58-124.
ECONOMIC EFFECTS OF AN AIRLINEAviation is a significant industry for Finnish society and the national economy. The accessibil-ity created by airline traffic is a necessity for Finland’s global competitiveness and its econom-ic impact is considerable. The importance of air transport for Finland is more fully described on pages 51-55.
Profitability in a highly competitive industry that is sensitive to cyclical fluctuations requires structural changes, which Finnair, like other airlines, is implementing. The company’s Career Gate operating model helps Finnair personnel find employment as quickly as possible when it is necessary to reduce staff. Significant changes in the company’s operations are required in order to achieve the planned cost reductions. These changes also apply to the company’s per-
sonnel, and personnel reductions cannot be avoided.
Environmental responsibility
THE PRINCIPLES APPLIED AND ENVIRONMENTAL ORGANIZATIONFinnair’s goal is to be the leading airline in the field of environmental responsibility. We take environmental aspects into consideration in all our operations, and support the International Air Transport Association (IATA) target of zero-emission aviation. We comply with current environmental legislation, but our environmental work aims at exceeding statutory require-ments and being a pioneer in evaluating, reporting and reducing environmental impacts.
Our environmental organisation has existed in various forms since the late 1980s, and we have reported on our environmental impacts since 1997. The environmental organisation has nowadays been replaced by our corporate responsibility organisation, which in addition to en-vironmental aspects also covers social responsibility. Finnair’s corporate responsibility policy also defines our strategy for environmental management.
We manage corporate responsibility at the group level, and each unit has individuals respon-sible for environmental activities and guidelines. The Finnair Board of Directors has a nominat-ed board member for corporate responsibility. In addition to group level, all units have named persons responsible for environmental operations and instructions. Environmental training is available for our entire personnel, and we highlight important themes and best practices with different internal and external campaigns.
In 2013 Finnair was certified as a Stage 1 operator in IATA’s Environmental Assessment (IEn-vA) Program, a new environmental management system designed to independently assess and improve the environmental management of an airline. The environmental standards that underpin IEnvA are based on recognised environmental management system (EMS) princi-ples (such as ISO 14001) and have been developed by a joint team of environmental consult-ants and leading airlines, including Finnair. Airline assessments, however are undertaken by independent accredited Environmental Assessment Organisations that have demonstrated competencies in EMS auditing.
Finnair participates actively in IATA’s environmental committee and AEA Environmental Committee, as well as in industry workgroups in Finland and the Nordic countries, promot-ing the reduction of the aviation sector’s environmental load.
FINNAIR ANNUAL REPORT 2013
STRATEGY / CUSTOMERS / OPERATIONS / EMPLOYEES / SOCIETY / FINANCE / GOVERNANCE / GRI 126

MAIN AREAS IN ENVIRONMENTAL RESPONSIBILITYApproximately 95 per cent of an airline’s environmental impact arises from engine emissions. In addition to carbon dioxide emissions and noise, air transport causes other emissions that affect air quality and the climate, and an effort must be made to reduce them by all possible means. Our actions are focused on four areas: technological advances, operational improve-ments, infrastructure development and market-related means, such as emissions trading. In all these areas we cooperate closely with various players, such as aircraft and engine manufac-turers, airports, air traffic control and the relevant authorities.
In all our operations, we strive to reduce waste and to lower our energy consumption. At Finnair’s operating locations, whether on the ground or in the air, every effort is made to recycle glass, paper and metal and collect energy waste which can be used as an industrial energy source.
An open dialogue with different stakeholders and continuous development of operations according to the latest available information are prerequisites for environmental responsibil-ity. We report on our environmental impacts regularly in annual reports and as a part of the Carbon Disclosure Project (CDP). In addition we communicate directly with various parties about our operations and gladly answer questions posed by interest groups.
For more information on measures to reduce fuel consumption and emissions, see pages 28-37.
Social Responsibility
MAIN AREAS IN SOCIAL RESPONSIBILITYFinnair is a company in a complex, highly technical business, and it has operations and sup-ply chain partners in dozens of different countries, each with varying laws and customs. The most important social responsibility areas concern personnel, supply chain personnel and-customers, particularly with respect to safety.
Human rights Finnair signed in 2013 the United Nation’s Global Compact initiative and undertook to com-ply with the Global Compact’s ten principles of corporate responsibility, which relate to hu-man rights, labor, environment and anti-corruption.
Finnair’s ethical guidelines (Finnair supplier code of conduct) set clear principles to ensure ethical purchasing. Finnair also expects its suppliers to act according to the company’s ethical operating practices and its Supplier Code of Conduct. Conforming with the UN’s Universal Declaration of Human Rights and all applicable laws and statutes is an absolute minimum re-
quirement. A procurement steering group operating under Finnair’s management is respon-sible for the steering, development and coordination of the group’s procurement activity. The management of each business unit must ensure that individuals handling procurement activity have at their disposal up-to-date procurement guidelines and that the guidelines are adhered to. In addition, subsidiaries and business units have their own, more detailed, procurement guidelines, which specify more detailed criteria under the general procurement guidelines, taking into account the special needs of each operating unit.
Auditing is performed in certain product and service groups. Auditing focuses on quality and safety factors. With respect to procurement covered by official regulations, only opera-tors approved by the International Air Transport Association (IATA) can act as suppliers or subcontractors to Finnair.
No child labourFinnair does not condone the use of child or forced labour at any stage of its value chain.
PERSONNEL
Management, development and training and employee well-beingFinnair’s strategic focus areas related to management and work culture, staff development and training, occupational health and wellbeing, occupational safety and Finnair’s Code of Con-duct are described on page 41.
Promoting equality and zero-tolerance for discriminationFinnair does not discriminate based on gender, age, ethnic or national origin, nationality, lan-guage, religion, conviction, opinion, health, disability, sexual orientation or other personal at-tributes or circumstances.
Finnair does not condone disturbances or harassment in the work community. Reporting infractions is every employee’s right and the company is determined to take steps to intervene in all cases brought to its knowledge.
It is the duty of every group employee to act so that no one is accorded an unequal status. Business unit managers are responsible for ensuring that any equality issues arising in their units are resolved. The group conducts equality planning and develops anti-discrimination practices continually as part of normal human resources management. The legality and reg-ulatory compliance of operations is also monitored as part of the group’s general monitoring and audit processes.
FINNAIR ANNUAL REPORT 2013
STRATEGY / CUSTOMERS / OPERATIONS / EMPLOYEES / SOCIETY / FINANCE / GOVERNANCE / GRI 127

Finnair offers equal opportunities for everyone with regard to recruitment, work perfor-mance, career progression and development. Finnair implements the equal pay principle based on the Finnish Equality Act.
Finnair gives both men and women equal opportunities for balancing work and family life. In 2011, Finnair became the first Finnish company to sign on to the United Nations Women’s Empowerment Principles, which give guidance on the empowerment of women in the work-place, marketplace and community.
No tolerance for harassment Finnair complies with procedures jointly agreed by the employer and employees for the pre-vention of harassment and inappropriate conduct. The procedure is based on the Finnish Act on Occupational Safety and Health and complies with the model recommended by the Finn-ish Ministry of Social Affairs and Health.
Freedom of association and collective negotiationFreedom of association and the collective right to negotiate on occupational issues are rec-ognised as fundamental rights in Finland. There is a long tradition of trade union activity in the company. Labour market culture in the company has been constructed in such a way that the organisation of workers and collective negotiations between the company and employee groups are part of normal activity.
In Finland, all of Finnair’s workers have the right and opportunity to agree on terms of em-ployment collectively. Management’s working terms are agreed on locally.
The dialogue between Finnair and its staff in 2013 is described on page 42. Personnel and management remuneration principles are described on pages 147–155.
PRODUCT RESPONSIBILITY AND CUSTOMER CAREAs an airline, Finnair’s mission is to carry customers and their goods safely and on time to their destinations. The Finnair Group’s business units and subsidiaries play their part in supporting the comprehensive achievement of this goal. The objective is to ensure the wellbeing of cus-tomers and a smooth, trouble-free travel experience in every respect. The most significant product responsibility aspects in the Finnair Group’s operations are flight safety, food safe-ty, responsibility for individual customers, and responsibility for the cargo carried by Finnair.
At Finnair situations that deviate from the norm are prepared for in advance. The group has developed processes for various unexpected situations and these are continually updated and maintained. Customers must be able to trust in the fact that they will be cared for throughout
the entire service chain. As a result, Finnair pays great attention to the selection of partners and takes ultimate responsibility for the customer experience.
SafetyFlight safety is always the highest priority in all operations, and in this area no compromises are made on any grounds. Safety is also Finnair’s first priority in ground operations and at every stage of the customer journey.
Flight safety work extends to all operations that impact on flight safety. Risk prevention is built into the company’s operating culture, and numerous official regulations guide the group’s activities. In case of human error, various protection networks have been created in the com-pany’s operating systems with the key objective of stopping the advance of a possibly damag-ing course of events and the materialisation of risk.
The rules and regulations related to flight operations and Finnair’s safety culture are de-scribed on pages 22–23.
At Finnair, responsibility for operational safety rests with the manager responsible for each area of operations. The Department of Safety and Quality produces risk information for man-agement using the latest methods. A quality management system is used to monitor the effec-tiveness of all measures and general compliance with regulations. The operation of the quality system is the responsibility of the company’s Quality Manager, who serves at the same time as the Flight Safety Director.
Within the framework of the quality management system, the company’s safety-critical el-ements are audited annually. Everyone who works in roles that influence flight safety partic-ipates regularly in safety training courses, whose content and scheduling is monitored both internally and by the authorities. Safety-related information is disseminated throughout the organization via a dedicated safety magazine. In addition, separate safety bulletins are pub-lished for flight personnel as required.
At Finnair all safety reports are interpreted and given a risk classification according to the seriousness of the event. In serious cases, corrective measures are initiated immediately. A corrective measure may be, for example, the changing of a faulty component and immedi-ate checking of the rest of the fleet to make sure that the same event does not recur. In risk assessment and classification we use the Event Risk Classification (ERC) method, created by the Airbus-led Airline Risk Management Solutions (ARMS) working group, which was in-troduced for airlines’ use in 2009. This method represents the industry’s latest risk knowledge and helps Finnair produce more standardised and objective risk information for management use. We examine risks identified by the ERC more deeply using the Safety Issue Risk Assess-
FINNAIR ANNUAL REPORT 2013
STRATEGY / CUSTOMERS / OPERATIONS / EMPLOYEES / SOCIETY / FINANCE / GOVERNANCE / GRI 128

ment (SIRA) method, which is also a tool produced by the ARMS working group. In the SIRA method, an attempt is made to identify all scenarios connected with the perceived risk, and numerical probabilities based on international data are assigned to all of these scenarios. The numerical possibilities obtained in this way must fulfil the requirements set by management and the authorities.
In addition to risks identified due to reporting, we survey flight safety risks monthly with flight personnel and flight safety professionals in a designated Hazard Identification Team (HIT) and by monitoring daily flights on the basis of flight recordings. The purpose is to identify risks and to make a deeper SIRA analysis of the risks identified. The interpretation of individual flights is called Flight Data Management (FDM). At best, an aircraft records in its “black box” more than one thousand flight parameters many times per second. The black box re-cordings are downloaded after flights and analysed by a special program. In this way, we can verify later that every flight has been carried out taking into account the company’s methods and the limita-tions of each type of aircraft. Any anomalies are always investigated separately in cooperation with the flight crew in question and a safety analyst.
Events that seriously jeopardise safety are rare and almost without exception a separate safety investigation is launched in respect of them. A safety investigation may be carried out by the authority concerned (Accident Investigation Board of Finland). If the authority decides not to carry out an investigation, Finnair performs an internal safety investigation. In cases related to flying, the safety investigator is always an experienced pilot specially trained in the subject. The safety investigator (or investigators) always carries out the investigation independently and the company’s management has no opportunity to influence the course of the investigation. This ensures independence and objectivity also in those cases where the perceived shortcomings may relate to the organisation’s activities.
Customer careFor exceptional situations, Finnair has its own cross-organisational unit. All flight traffic irreg-ularities are handled centrally from Helsinki, thereby gathering all of the available information into one place. In this way, a more detailed overall picture of the multiplier effects and costs of the irregularities is obtained, and efforts are made to minimize inconvenience to the customer.
Monitoring and supervision of customer service activity is based on regular auditing, cus-tomer feedback and customer satisfaction surveys, as well as various surprise campaigns and measurements performed by external parties. Our partners’ operations are also continually evaluated. Monitoring is systematic and is used to set targets and check that they are being met. Staff expertise is ensured through training.
Customer dataFinnair respects the privacy of its customers and is committed to ensuring that personal de-tails and other customer information are processed appropriately. We do our best to guaran-tee the confidentiality, security and accuracy of customer data under all circumstances. At all stages of travel we process personal details in compliance with the legislation on personal data and regulations issued by the authorities in the countries in which we operate.
Package toursIt is in the interests of the group’s tour operators to promote sustainable tourism, which ben-efits local businesses and organisations. Package travel operations carried out by Finnair sub-sidiaries comply with the Finnish Package Travel Act and general industry terms and condi-tions. The Finnish Consumer Ombudsman supervises the contractual practices of package travel service providers and compliance with the requirements concerning guarantees against bankruptcy. The guarantees of tour operators belonging to the Finnair Group are in the form of bank guarantees.
Cargo and ground handlingIn cargo transport, Finnair and its subsidiary Finnair Cargo are responsible for transporting customers’ cargo in the condition in which it has been entrusted to us, and in compliance with international and national regulations. The aim is to offer cargo customers efficient, trouble-free logistics services. This means, among other things, that cargo entrusted to Finnair Cargo for transport is delivered to its destination exactly as agreed with the customer.
The Ground Operations unit, which belongs to the group’s parent company, is responsible for the acquisition, quality criteria and quality control of ground handling services required at airports. The unit’s task is to ensure that the ground services used by Finnair fulfil the require-ments set for them, both in terms of quality and in respect of safety and official regulations.
To deliver on their service promises, both Finnair Cargo and the Ground Operations unit apply a systematic evaluation process when selecting subcontractors and partners that provide terminal and other ground handling services. Partners are required, for example, to ensure and maintain the expertise of their personnel, and also to ensure that vehicles, equipment and premises are appropriate. In addition to quality audits at airports, Finnair also regularly per-forms quality inspections that continually monitor both its own and subcont-ractors’ work.
Finnair Cargo and Ground Operations quality managers are responsible for maintaining and updating their own quality systems and ensuring that operations comply with requirements.
FINNAIR ANNUAL REPORT 2013
STRATEGY / CUSTOMERS / OPERATIONS / EMPLOYEES / SOCIETY / FINANCE / GOVERNANCE / GRI 129

Ground Operations also has an area manager, responsible for airport operations, who has a significant role in monitoring operations’ compliance with regulations. If some activity does not to some extent comply with the operations manual or prevailing legislation, the deviation is documented and corrective measures effected immediately.
FURTHER INFORMATION:More information about IATA safety and quality audits: www.iata.org
FINNAIR ANNUAL REPORT 2013
STRATEGY / CUSTOMERS / OPERATIONS / EMPLOYEES / SOCIETY / FINANCE / GOVERNANCE / GRI 130

CORPORATE GOVERNANCE STATEMENT 2013
CONTENTS Regulatory framework 131Governing bodies 131
General Meetings 132Shareholders’ Nomination Board 132Board of Directors 133The Committees of the Board 135 Company management 137
Main features of the internal control and risk managementsystem pertaining to the financial reporting process 139
Description of the overall system 139Control environment 139Risk Assessment 139Control activities 140Information and communication 140Monitoring and improvement 141Internal Audit 141
Regulatory frameworkThis Corporate Governance Statement is issued pursuant to the Finnish Corporate Govern-ance Code 2010 for listed companies. It sets out the governing bodies and the principles of governance of Finnair Plc. Finnair complies with the recommendations of the Code without exceptions.
The principal legislative authorities on corporate governance of Finnish listed companies are the Companies Act, the Securities Market Act, the regulation and guidelines issued by the Financial Supervision, the rules and instructions for listed companies issued by NAS-DAQ OMX Helsinki Exchange and the Finnish Corporate Governance Code, all of which are complied with by Finnair. Company specific authorities on the governance of Finnair are the Articles of Association and the principles, policies and guidelines issued by Finnair’s Board of Directors.
The Articles of Association, the published policies and other additional information on Finnair’s corporate governance can be found at Finnair’s internet site at www.finnairgroup.com. The Corporate Governance Code is publicly available on the website of the Securities Market Association’s website at www.cgfinland.fi.
This statement has been approved by Finnair’s Board of Directors and it has been pre-pared as a separate report from the Board of Directors’ Report. Finnair’s auditing firm, PricewaterhouseCoopers, has verified that the description of the main features of the inter-nal control and risk management related to the financial reporting process contained herein are consistent with the financial statements.
Governing bodies The governing bodies of Finnair pursuant to the Companies Act and the Articles of Associ-ation are the General Meeting of Shareholders, the Board of Directors (the “Board”) and the Chief Executive Officer (the “CEO”).
The roles of the governing bodies are described below.
Governing bodies of Finnair
Shareholders
AuditorsAnnual General MeetingShareholders'
Nomination Committee
Audit Committee
Board of Directors
Remuneration Committee
CEO
FINNAIR ANNUAL REPORT 2013
STRATEGY / CUSTOMERS / OPERATIONS / EMPLOYEES / SOCIETY / FINANCE / GOVERNANCE / GRI 131

General MeetingsThe ultimate authority in Finnair is vested in the General Meeting of shareholders. An An-nual General Meeting (the “AGM”) must be held each year by the end of May.
The competence of the General Meeting of Shareholders is set out in the Companies Act and in Finnair’s Articles of Association. The AGM shall annually decide on the following matters: • adoption of the financial statements and the consolidated financial statements• the use of the profit shown on the balance sheet • the discharging of the Members of the Board and the CEO from liability• the appointment of the Members of the Board and their remunerations • the election and remuneration of the auditor.
In accordance with Finnair’s Articles of Association, the AGM elects also the Chairman of the Board.
The Board convenes the General Meetings of Shareholders by publishing a notice not ear-lier than three months and not later than three weeks before the date of the meeting and al-ways at least nine days before the record date of the meeting. The notice shall be published as a stock exchange release and on Finnair’s website.
Each shareholder who is registered on the record date as a shareholder in the company’s public register of shareholders, maintained by Euroclear Finland Oy, has the right to partici-pate in the General Meeting of Shareholders. If a holder of nominee-registered shares wish-es to participate in the meeting, he or she has to register temporarily in the register of share-holders. Furthermore, in order to attend the meeting, a shareholder must register for the meeting in the manner defined in the notice convening the meeting.
A shareholder has the right to have a matter falling within the competence of the General Meeting of Shareholders addressed by the meeting, if the shareholder so demands in writ-ing from the Board by the date announced on Finnair’s internet site.
The minutes of the General Meeting of Shareholders and the voting results, if any, shall be made available to shareholders on Finnair’s internet site within two weeks of the meeting.
2013 Annual General MeetingFinnair’s AGM 2013 was held in Helsinki on 27 March. A total of 281 shareholders, repre-senting close to 63 per cent of the shares and voting rights of the company, participated ei-ther in person or by proxy representatives. All Board members elected by the 2012 AGM and all candidates for Board membership in 2013 AGM were present in the meeting, as well as Finnair’s Executive Board and the auditors of the company.
Shareholders’ Nomination Board The AGM 2013 decided to establish a permanent Shareholders’ Nomination Board. The term of the Nomination Board continues until the General Meeting of the company decides otherwise. The previous practice since 2008 was that a Shareholders’ Nomination Commit-tee was established annually by the AGMs.
The purpose and task of the Nomination Board is to prepare and present to the AGM, and, if necessary, to an Extraordinary General Meeting, proposals on the remuneration of the members of the Board, on the number of members of the Board and on the members of the Board. In addition, the task of the Nomination Board is to seek potential future candi-dates for Board members. The Nomination Board shall forward its proposals to the compa-ny’s Board by 31 January each year.
The Nomination Board shall consist of four members, who shall be nominated annual-ly. The company’s three largest shareholders shall appoint three of the members, and the Chairman of the Board shall serve as the fourth member. The company’s largest sharehold-ers entitled to appoint members to the Nomination Board shall be determined on the basis of the registered holdings in the company’s shareholder register held by Euroclear Finland Ltd as of the first working day in September each year. In the event that a shareholder does not wish to exercise its right to appoint a representative, such right shall pass to the next largest shareholder.
The members of the Nomination Board are not remunerated by Finnair for their mem-bership in the Nomination Board. The members’ expenses are reimbursable in accordance with the company’s expense policy. In addition, the Nomination Board’s costs of using ex-ternal experts shall be borne by the company.
2012 Nomination Committee and 2013 Nomination BoardThe proposal for the 2013 AGM was made by a Nomination Committee that was estab-lished by the 2012 AGM. Based on the largest shareholdings as at 1 November 2012, the Committee consisted of representatives of State of Finland, Keva and Skagen Global Verdi-papirfond, and the Chairman of The Board of Finnair.• Mr. Jarmo Väisänen, b. 1951, Licentiate in Political Science, Senior Financial Counsellor
in Prime Minister’s Office (Ch.);• Mr. Robin Backman, b. 1971, M. Sc. (Econ.), Portfolio Manager in Keva; • Mr. Per Wennberg, b. 1969, B. Sc. (Hon.) in Business Management, Skagen’s Managing
Director in Sweden; and• Mr. Harri Sailas, see details on page 134.
FINNAIR ANNUAL REPORT 2013
STRATEGY / CUSTOMERS / OPERATIONS / EMPLOYEES / SOCIETY / FINANCE / GOVERNANCE / GRI 132

The Committee convened two times and all members were present in the meetings. On 30 January, 2013, the Shareholders’ Nomination Committee submitted to the Board its pro-posal for the AGM held on 27 March 2013.
The Nomination Board established by the 2013 AGM consisted of the representatives of three largest shareholders as at the first working day September and of the Chairman of the Board. The shareholders were the State of Finland, Keva and Skagen Global Verdipapirfond and the composition of the Nomination Board the following: • Mr. Eero Heliövaara, b. 1956, M. Sc. (Econ.), M. Sc. (Eng.), Director General in the Own-
ership Steering in the Prime Minister’s Office (Ch.);• Mr. Robin Backman, see details above; • Mr. Per Wennberg, see details above; and• Mr. Klaus Heinemann, see details on page 134.
The Nomination Board convened three times and all members were present in the meet-ings. On 31 January, 2014, the Shareholders’ Nomination Board submitted to the Board its proposal for the AGM to be held on 27 March 2014. The Nomination Board proposed that present members of the Board of Directors Ms Maija-Liisa Friman, Mr Klaus W. Heine-mann, Mr Jussi Itävuori, Mr Harri Kerminen and Ms Gunvor Kronman be re-elected, and that Ms Jaana Tuominen and Mr Nigel Turner be elected as new members to the Board of Directors. The Nomination Board further proposed that Mr Klaus W. Heinemann be re-elected as Chairman of the Board.
The Shareholders’ Nomination Board proposed that the remunerations of the members of the Board would remain unchanged and thereby be the following: annual remuneration to the Chairman €61,200, to the Vice Chairman €32,400 and to other members €30,000 each. The Committee further proposes that for each meeting of the Board or the commit-tees of the Board a fee of €600 be paid to the members of the Board that reside in Finland and a fee of €2,400 be paid to the members that reside abroad.
Board of DirectorsThe Chairman and the Members of the Board are elected by the AGM. According to the Articles of Association, the Board consists of the Chairman and a minimum of four and a maximum of seven other members. The Board elects a Deputy Chairman from among its members. The term of office of the members of the Board ends at the close of the first AGM following their election.
According to the Companies Act, the Board represents all shareholders of Finnair and has the general duty to act diligently in the interests of the company. Under law, the Board is ac-countable to the shareholders for the appropriate governance of the company and for ensur-ing that the operations of the company are run adequately.
The accountability for the company’s governance pertains specifically to the assurance of the effectiveness of the Company’s system of internal controls. The main features of the company’s system of internal controls and risk management are described later in this re-port. Finnair has a number of policies issued by the Board, designed to enhance the internal controls. The policies are regularly updated and communicated to the personnel.
In addition to the Boards’ statutory tasks, certain significant matters are reserved for Board decision, as set out in the Board’s charter. The Board sets the company’s strategic aims and monitors the implementation of the same by the management, approves oth-er significant strategic matters, investments, divestments and capital commitments and approves the business and financial plans, significant partnerships and other major con-tracts. The Board reviews the performance of the management and it appoints and re-moves the CEO and other members of the executive management and determines their levels of remuneration. The Board also attends the succession planning of the manage-ment. The Board establishes and regularly evaluates the group’s personnel policies, in-cluding the compensation structures. The Board’s charter is available on Finnair’s website in its entirety.
The Board evaluates its work annually. The Board’s gender distribution in the composition elected by 2013 AGM is four men and three women.
FINNAIR ANNUAL REPORT 2013
STRATEGY / CUSTOMERS / OPERATIONS / EMPLOYEES / SOCIETY / FINANCE / GOVERNANCE / GRI 133

Members of the Board and their independenceThe 2013 AGM held on 27 March elected Mr. Klaus Heine-mann as Chairman of the Board and Ms. Maija-Liisa Friman, Mr. Jussi Itävuori, Ms. Merja Karhapää, Mr. Harri Kerminen, Ms. Gunvor Kronman and Mr. Antti Kuosma-nen as other members of the Board. The Board elected Mr. Harri Kerminen as its Vice Chairman.
Board members represent a diverse range of business and other backgrounds, bringing a broad spectrum of views and experiences to Board deliberations. The Board assessed the independence of its members and concluded that all oth-er members are non-executive members independent of the Company and its major shareholders except Mr. Ant-ti Kuosmanen. Based on the assessment Mr. Kuosmanen is non-executive member independent of the Company and dependent of its major shareholders, because he is em-ployed by Finnair’s largest shareholder the State of Finland.
All members of the Board elected in the 2012 AGM were independent of the company and its significant sharehold-ers (see tables below).
Members of the Board in 2013 and their attendance in Board and Committee meetingsIn 2013, the Board met 11 times (eight meetings with the composition elected by the 2013 AGM and three meetings with the composition elected by the 2012 AGM). In addi-tion, the Board made per capsulam decisions twice during the year. See the table below for information on the Board members’ participation in the meetings during 2013.
Members of the Board elected in the 2013 AGMParticipation in
Board meetings in 2013Participation in Commit-
tee meetings in 2013
Name Personal Information Audit Remuneration
Mr. Klaus W. Heinemann • Chairman of the Board since 27 March 2013• Member of the Board since 28 March 2012• B. 1951, B.Sc. (Econ.)• Main occupation: Board professional• Committee membership: Audit Committee
11/11 6/6
Mr. Harri Kerminen • Member of the Board since 24 March 2011• Vice Chairman of the Board since 28 March 2012• B. 1951, M. Sc. Tech, MBA• Main occupation: Board professional• Committee memberships: Audit and Remuneration Committees
11/11 6/6 5/6
Ms. Maija-Liisa Friman • Member of the Board since 28 March 2012• B. 1952, M.Sc. (Eng.)• Main occupation: Board professional• Committee memberships: Audit Committee (Chairman)
11/11 6/6
Mr. Jussi Itävuori • Member of the Board since 28 March 2012• B. 1955, M. Sc. (Econ.)• Main occupation: Board professional• Committee memberships: Remuneration Committee (Chairman)
11/11 6/6
Ms. Merja Karhapää • Member of the Board since 28 March 2012• B. 1962, Master of Laws, PG IPR Diploma• Main occupation: Chief Legal Officer, Sanoma Group • Committee memberships: Audit Committee
11/11 5/6
Ms. Gunvor Kronman • Member of the Board since 28 March 2012• B. 1963, Master of Arts• Main occupation: CEO of Swedish-Finnish Cultural Centre• Committee membership: Remuneration Committee from 27 March 2013
11/11 6/6
Mr. Antti Kuosmanen • Member of the Board since 27 March 2013• B. 950, BA, M.Sc. (Mathematics, Economics and Statistics).• Main occupation: Ambassador• Committee membership: Remuneration Committee (since 23 September 2013)
8/8 2/2
Members of the Board until the end of the 2013 AGMParticipation in
Board meetings in 2013Participation in Committee
meetings in 2013
Name Personal Information Audit Remuneration
Mr. Harri Sailas • Chairman of the Board until 27 March 2013• B. 1951, M. Sc. (Econ.)• Main occupation: President and CEO of Ilmarinen Mutual Pension Insurance Company• Committee membership: Remuneration Committee (Chairman until 27 March 2013)
3/3 2/2
More information on the Members of the Board is available on Finnair’s website.
FINNAIR ANNUAL REPORT 2013
STRATEGY / CUSTOMERS / OPERATIONS / EMPLOYEES / SOCIETY / FINANCE / GOVERNANCE / GRI 134

The Committees of the Board The Board delegates certain of its functions to the Audit Committee and to the Remunera-tion Committee. The Board appoints the Committee members and their Chairs from among the members of the Board. The minimum number of members is three in both Committees.
Each Committee meets regularly under their respective charters. The Committees’ tasks and the work carried out by them during the year are described in their respective sections below. The Committees report on their work regularly to the Board but they do not have de-cision-making powers independent from the Board, except where expressly authorised by the Board. Copies of the Committees’ charters are available on Finnair’s website.
Audit CommitteeThe Audit Committee assists the Board in its task to ensure the proper governance of the com-pany, in particular, by considering the accounting and financial reporting, the Company’s in-ternal control systems and the work of the external auditors. The Audit Committee address-es concerns pertaining to control matters as raised by the management or the auditors of the company. These are reported to the Board by the Audit Committee. The Audit Committee ensures that appropriate action is taken by the management to rectify identified shortcomings.
According to the Corporate Governance Code, the members of the Committee must be sufficiently qualified to perform the responsibilities of the Committee.
The main duties of the Audit CommitteeThe Audit Committee shall:• monitor the financial status of the company • monitor the reporting process of financial statements and interim reports and assess the
draft financial statements and interim reports • assess the efficiency of the company’s internal controls, internal auditing and risk man-
agement system• monitor the statutory audit and review all material reports from the auditor • assess the independence of the auditors, in particular with regard to their ancillary services• prepare for the Board proposals to the Annual General Meeting regarding the election
of the auditor(s) and their remunerations• review the auditors’ and internal auditors’ audit plans and reports• review the company’s corporate governance statement • prepare for the Board the group’s risk management policies• prepare for the Board decisions on significant changes in the accounting principles or in
the valuations of the group’s assets;• assess the group’s compliance with laws and regulations; and• maintain contact with the auditors.
The Board’s work in 2013The Board met 11 times in 2013. In addition to its regulatory duties, the Board’s ac-tions included the following: • Appointed Mr Pekka Vauramo as the new CEO of the company in April. Mr. Ville
Iho was appointed as deputy CEO for the period 1 March through 31 May 2013;• Approved a share saving plan targeted to the entire staff and a long-term share
incentive plan targeted to the key employees, and set the personnel fund’s bonus criteria for 2013;
• Set the semi-annual short term incentive targets for the CEO and the Executive Board members and assessed their performance against the expiring targets.
• Approved a €29 million investment in improved travel comfort through a retro-fit of full flat business class seats to Finnair’s long-haul aircraft;
• Approved the entry into a joint business agreement on trans-Atlantic traffic with American Airlines, British Airways and Iberia;
• Approved the entry into a joint business agreement on Europe-Japan traffic with British Airways and Japan Airlines;
• Resolved to divest the company’s stake in Norwegian Air Shuttle;• Evaluated the company’s strategy, followed the implementation of the existing
strategic initiatives and set the focus areas for new initiatives; • Approved the changes in the corporate structures in the group’s cargo and travel
service businesses as well in the facilities management;• Reviewed the attainment of the targeted service levels and cost savings in the
outsourced core services; • Confirmed the company’s financial risk management policies, reviewed the mid
and long term investment and funding plans, approved the sale and leaseback agreements of new Airbus A321 Sharklet aircraft, approved the sale and lease-back agreements of four Airbus A330 aircraft and two new Airbus 350 aircraft, resolved to renew the Revolving Credit Facility of €180 million and to issue a €150 million senior bond as well as to buy-back the outstanding amount of the 2009 Hybrid Bond, ca. €52 million;
• Resolved to change the company’s disclosure policy on financial guidance from quarterly to full-year guidance. Revised the financial guidance in October and November;
• Assessed and developed its working practices.
FINNAIR ANNUAL REPORT 2013
STRATEGY / CUSTOMERS / OPERATIONS / EMPLOYEES / SOCIETY / FINANCE / GOVERNANCE / GRI 135

In 2013, the Audit Committee members were Ms. Maija-Liisa Friman (Chairman), Mr. Klaus W. Heinemann, Ms. Merja Karhapää and Mr. Harri Kerminen. All Committee members were independent of the Company and of its significant shareholders.
The Audit Committee met six times in 2013 with an aggregate attendance rate of 96%. The CEO, the CFO, the Head of Internal Audit and Risk Management as well as external auditor also participated in the Committee’s meetings. Finnair’s General Counsel acted as the secre-tary of the Audit Committee. The Committee held closed sessions as well as sessions where the External or Internal Auditors participated without the presence of the members of the management. The Committee also performed its annual self-evaluation.
Remuneration CommitteeThe Remuneration Committee assists the Board in matters pertaining to the compensation and benefits of the CEO and other senior management, their performance evaluation, ap-pointment and successor planning. The Committee assists the Board also in establishing and evaluating the group’s compensation structures and other personnel policies.
The main duties of the Remuneration CommitteeThe Committee prepares the following matters for the Board:• compensations, pensions, benefits and other material terms of the contract of the CEO• compensations, pensions and benefits of the top executives of the group, and other ma-
terial terms of their contracts to the extent that the same deviate from the customary practice
• nominations of the CEO and other top executives• top executives’ succession planning• composition of the Executive Board• equity-based incentive plans• the principal compensation policies and practices regarding the personnel• management’s participation in the boards’ of directors of the group and of external com-
panies• major organisational changes• proposals of awarding the members of the management honorary decorations and
titles.
The members of the Remuneration Committee elected after 2013 AGM were Mr Jussi Itävuori (Chairman), Mr Harri Kerminen and Ms Gunvor Kronman. Mr Antti Kuosmanen was ap-pointed to the Committee in September 23, 2013. Before the 2013 AGM, the Committee com-prised of Mr Harri Sailas (Chairman), Mr Jussi Itävuori, Mr Harri Kerminen and Ms Gunvor Kronman. All Committee members were independent of the Company and of its significant shareholders.
The Remuneration Committee met six times in 2013 with an aggregate attendance rate of 95%. Four of the meetings were held with the composition that was in place after the 2013 AGM and two with the composition in place after the 2012 AGM. The CEO and the Head of HR were invited to the meetings to assist the Committee. Finnair’s General acted as the Com-mittee’s secretary.
The Audit Committee’s activities in 2013In addition to its customary tasks, the Audit Committee attended selected focus areas, such as
revenue management and forecasting, fleet capacity allocation, procurement, financial process-
es and accounting principles, maintenance costs, and partner management.
The Audit Committee also:
• Reviewed the Treasury and other Financial Risk Policies and the mid and long term investment
and funding plans;
• Reviewed the risk management process, the risk and control environment, the top risks for
2013 and the related risk management measures. The Committee reviewed and approved a
risk-based internal audit plan and assessed the sufficiency of the resources in the internal con-
trol functions.
• Followed the progress of the risk management development project that was started in 2012;
• Discussed with the CEO, the CFO and the auditors the company’s accounting policies and the
estimates and judgements that were applied in preparing the reports;
• Recommended to the Board that its changed the financial guidance in October and November;
• Assessed the auditor’s performance and Proposed to the 2013 AGM that PricewaterhouseCoop-
ers was re-elected as the auditor for the fiscal year 2013. A tender process for the auditing ser-
vices was last carried out in 2012;
• Performed an annual self-assessment at the end of 2013 and prepared an annual plan for 2014.
The areas of specific attention in 2014 will comprise staff costs and productivity, trans-Atlan-
tic and Europe-Japan joint businesses, financial risks management, internal controls, aircraft
finance and impairment, and vendor management.
FINNAIR ANNUAL REPORT 2013
STRATEGY / CUSTOMERS / OPERATIONS / EMPLOYEES / SOCIETY / FINANCE / GOVERNANCE / GRI 136

The Remuneration Committee’s work in 2013In 2013, the Committee prepared for the Board approval a share saving plan targeted to the
entire staff and a long-term share incentive plan targeted to the key employees. The Commit-
tee also reviewed the senior management’s compensation levels compared to the market and
assessed their performance under the long and short term incentive targets, and assisted the
Board in determining their semi-annual targets for 2013 as well as the personnel fund’s bonus
criteria for 2013. The Committee reviewed Finnair’s compensation policies and practices, assist-
ed the Board in determining the targets of the next rolling share bonus plan and assessed the
development needs of the share bonus scheme.
The Committee discussed with the management the strategically vital labour cost savings
and the targets and results of the collective labour agreement negotiations. The Committee as-
sessed its meeting practices and tasks, and will propose a revised charter to the Board for ap-
proval early 2014.
Company management
Finnair’s corporate structureFinnair has three business areas: Airline Business, Aviation Services and Travel Services (tour operators and travel agencies) and its financial reporting is based on this grouping. Shared functions in Finnair’s Group Administration are Finance and Control, Human Resources, Communications and Corporate Responsibility, Corporate Development, Legal Affairs and Internal Audit.
The CEOThe CEO is appointed by the Board. The CEO manages the company’s day-to-day opera-tions in accordance with guidelines and instructions issued by the Board. The CEO’s instruc-tions from the Board include, in particular, the implementation of Finnair’s strategy, driving of structural change and improving the company’s profitability. The CEO acts as the Chair-man of the Executive Board.
The Board determines the CEO’s compensation and sets his short and long term incentive targets. The main contents of the CEO’s contract, including his compensation and benefits, are described in the Remuneration Statement and on Finnair’s internet pages.
Company management
Internal auditCEO
Board of Directors
Executive ManagementFinance and Control, HR, Corporate Communications and Corporate Responsibility, Legal affairs,
Resource Management, Flight Operations, Commercial Division, Travel Services.
Traffic Planning Board
Process and IT Steering Group
Procurement Steering Group
Brand and Product Board
Executive Board Subsets
Business Development
Reports to Board's Audit Committee
The CEO of Finnair is Mr. Pekka Vauramo, b. 1957, M. Sc. (Mining). He started in his posi-
tion in June 1, 2013. Mr. Mika Vehviläinen was the CEO until February 28, 2013, and between March 1 and May 31 Finnair’s COO, Mr. Ville Iho was the Acting CEO.
Executive BoardThe Executive Board of the Company is led by the CEO and it comprises the senior man-
agement responsible for Finnair’s business operations, finance and control, human resources, communications and corporate responsibility and legal affairs. The members’ respective roles and their shareholdings in Finnair are more fully described on the company’s web pages. The senior management is appointed and removed by the Board, which also determines their re-muneration and other terms of employment.
The duties of the Executive Board include group-wide development projects, the definition of principles and procedures that guide the company’s activities, and the preparation of mat-ters to be dealt with by the Board. The Executive Board also acts as Finnair’s risk management steering group.
In 2013, Finnair’s Executive Board met twice a month on average. The main focus of the Ex-ecutive Board was the leadership development of key personnel throughout the group, strat-egy assessment and development, risk management and the group’s financial status. The Ex-ecutive Board also sought to improve route profitability, fleet and crew utilisation, operational
FINNAIR ANNUAL REPORT 2013
STRATEGY / CUSTOMERS / OPERATIONS / EMPLOYEES / SOCIETY / FINANCE / GOVERNANCE / GRI 137

quality and customer service, In addition, the Executive Board met nearly every week to tend to Finnair’s profitability and productivity improvement programs.
Subsets of the Executive BoardThe Executive Board delegates certain of its functions to four subsets. These Groups’ decision making authority is derived from that of the Executive Board, set by the Board by way of the approval limits, policies and instructions.
Network Planning Group is responsible for fleet and network strategy and short and long-term traffic planning of Finnair’s scheduled, leisure and cargo traffic, among other things. The Group is headed by SVP Resource Management and meets monthly.
Process and IT Steering Group makes decisions on IT and process development projects and sets the priorities, budgets and targets for the same. It also approves significant projects, in-vestments and supplier contracts in the area of IT. The Group is headed by CFO and meets bi-monthly.
Procurement Steering Group is responsible for Finnair’s Procurement Policy, procurement category structure and related development projects. It also approves significant supplier con-tracts (with the exception of IT contracts) and their related governance models. The Group is headed by the CFO and meets at least quarterly.
Brand and Product Board is responsible for strategic brand steering and management as well as product decisions. It decides, for example, on brand development activities, service identity and visual identity of Finnair. The Board is headed by the CEO and meets bi-monthly.
Management Board Finnair Management Board is principally a communication and co-operation forum designed for the personnel’s participation in the company’s governance processes, especially with regard to matters that affect the personnel. The focus of the Management Board work is on enhanc-ing communication and understanding between the personnel groups and the management as to the implementation of the company’s strategic objectives and on sharing information and discussing plans and projects that affect Finnair’s personnel. Management Board also discusses the business plans and financial performance of the Group, the operational qual-ity and customer satisfaction as well as significant development projects. The Management Board comprises the Executive Board members, certain senior managers and the represent-atives of all personnel groups.
In 2013, the Management Board met seven times.
Corporate Governance in Finnair subsidiariesFor major subsidiaries, the members of the boards of directors are selected from individuals belonging to Finnair’s senior management and from representatives proposed by personnel groups. The key tasks of the boards of directors of subsidiaries include strategy preparation, approving operational plans and budgets, and deciding on investments and commitments within the scope of instructions issued by Finnair’s Board.
The subsidiaries of Finnair are presented in the Financial Statements 2012 under Note 3.1 Subsidiaries.
Governance principles in key partnerships and outsourcings Finnair has equity partnership in Flybe Finland Oy through Flybe Nordic AB (ownership 40%) and in Nordic Global Airlines Ltd (ownership 40%). Flybe Finland is a Finnish regional pas-senger airline operating ATR turboprop and Embraer 170 and 190 aircraft. Part of its route network is designed to provide convenient feeder connections to Finnair’s European and long haul routes. Nordic Global Airlines Ltd is a Finnish full freight airline and its home base is in Finland. Nordic Global Airlines provides cargo capacity mainly to Finnair Cargo Ltd. Finnair’s influence over the governance of these companies is secured by shareholding and various con-tractual rights.
Finnair has entrusted certain important operational services to world class service providers. LSG Sky Chefs Finland Oy runs the former catering businesses of Finnair at Helsinki Airport. It supplies Finnair’s catering services pursuant to a multi-year agreement designed to ensure Finnair’s receipt of high quality services, cost savings and other benefits. Other similar long-term arrangements exist in the ground handling services, with Swissport Finland Ltd, and in the engine and component services with a Swiss company SR Technics. In addition to a require-ment of continued cost competitiveness, these agreements contain service level requirements with baselines meeting or exceeding the levels achieved by Finnair prior to the outsourcing.
All Finnair’s partners are expected to comply with Finnair’s Code of Conduct and Finnair’s Supplier Code of Conduct, and Finnair is entitled to audit the Supplier’s governance and se-curity practices to ensure this.
Finnair’s Code of Conduct and Supplier Code of Conduct are available on Finnair’s website.
FINNAIR ANNUAL REPORT 2013
STRATEGY / CUSTOMERS / OPERATIONS / EMPLOYEES / SOCIETY / FINANCE / GOVERNANCE / GRI 138

Main features of the internal control and risk management system pertaining to the financial reporting process
Description of the overall systemThe objective of internal control and risk management system pertaining to the financial re-porting process is to provide the Board, the Executive Management and other key stakeholders with a reasonable assurance of the reliability and correctness of financial and operational re-porting, as well as compliance with associated laws, regulations and internal policies. It is built on the principles of Finnair’s overall system of risk management which is aligned with com-monly accepted COSO ERM framework and ISO 31000:2009 standard for risk management.
Control environmentFinnair’s Code of Conduct and management system form the foundation for its control envi-ronment and background for awareness and implementation of control activities across the organisation. Guiding principles of internal control and risk management in Finnair are doc-umented in the Group Risk Management Policy. Other key steering instruments supporting control over reporting include, but are not limited to, Annual Accounts drafting principles, Code of Conduct, Treasury Policy, Procurement Policy, Credit Policy and Disclosure Policy.
Finnair’s Board of Directors holds the overall responsibility for the company’s internal con-trol and risk management. The Board has delegated the implementation of efficient control environment and measures to ensure the reliability of financial reporting to the CEO. Group CFO is responsible for governing financial reporting control environment and acting as the risk owner of reporting risks. The line organizations of business units and group-wide func-tions have the main responsibility for executing day to day control activities pertaining to the financial reporting process.
Internal Audit assesses the control environment as well as the status and effectiveness of planned control and risk management activities. To ensure the independence of the Internal Audit activity, Internal Audit has a direct functional reporting line to the Audit Committee of Finnair Board and it is positioned to operate administratively under the CEO. The Audit Committee appointed by the Board of Directors oversees the financial reporting process and overall maturity of the internal control and risk management system. The described roles and responsibilities are in accordance with the Finnish Companies Act, and the Finnish Corpo-rate Governance Code. The following picture summarises the roles of the listed stakeholders in the implementation of the internal control and risk management system.
The role in the implementation of the internal control and risk management system
Exte
rnal
aud
itors
Operational level
Ultimate responsibility
Third line of defense
Second line of defense
THREE LINES OF DEFENCE
First line of defense
Business segments and common functionsDay to day control and risk management activities pertaining to the financial reporting process
Corporate functionsOversight and continuous improvement of the internal control and risk management environment
Internal AuditAssessment of internal control environment, day to day control and risk management activities, and overall maturity of the internal control and risk management system
The Board of DirectorsReasonable assurance of the achievement of companys' strategic and operational objectives, reliability of financial and operational reporting, as well as compliance with laws and regulations and internal policies
Risk AssessmentObjective of Finnair’s financial reporting risk assessment is to identify, evaluate and prioritise the most significant threats to the reliability of internal and external reporting at the Group, reporting area, unit, function and process levels. Processes related to financial reporting are subject to on-going risk assessment by the business unit controllers, financial controllers and shared service centre as part of their daily and weekly activities.
In 2013, as a part of internal controls development project, the processes with material im-pact on financial reporting were defined and risks threatening the reliability and accuracy of financial reporting were assessed in a coordinated manner. Changes in internal and external environment were taken into account as part of the process.
FINNAIR ANNUAL REPORT 2013
STRATEGY / CUSTOMERS / OPERATIONS / EMPLOYEES / SOCIETY / FINANCE / GOVERNANCE / GRI 139

Control activities Financial reporting instructions have been prepared to be followed across the organization. The instructions outlining the content and schedule for the reporting aim to increase the over-all controllability of the financial reporting process and ensure that financial statement fulfils the requirements set in the IFRS standards and other applicable principles.
Risk related to financial reporting are managed through controls aiming to provide reason-able assurance that the information of interim reports and year-end reports are correct and that they have been prepared in accordance with legislation, applicable accounting standards and other requirements for listed companies. These control activities are• preventive, detective and corrective in nature;• integrated into reporting processes in business units, group-wide functions and
subsidiaries; • operationalized through the implementation of Policies, Guidelines and Principles,• captured in Control Catalogs; • supported by Manuals and Standards, Process Descriptions and Work Instructions;• monitored and continuously improved through a dedicated governance model.
As part of group-wide internal control development project in 2013, responsibilities over re-porting controls were reviewed and updated to reflect the recent changes in the organization. These roles are illustrated in the below matrix:
Role Description
Control Environment Owner: Group CFO Responsible for governing financial reporting control environment and acting as the risk owner of reporting risks.
Control Catalog Owner: Process Owners Owner of the process controls defined in the control catalogue.Control Performer / Reviewer Responsible for executing / monitoring key control(s) defined in the
control catalogue.Internal Audit Responsible for audit of reporting processes and related controls
according to the annual audit plan.
The main components and roles associated with control planning, implementation and mon-itoring are summarized below:
Set Guidelines and Approve Policies
Report Audit Findings
Implement Policies and Guidelines
Identify Risks and Define Controls
Apply Controls
Internal Audit
Boardof Directors
Executive Board
Control Environment
Owner
Control Catalog Owner
Control Performer/Reviewer
Control Catalogs
Group Policies
Guidelines, Requirements, Principles
Manuals and Standards
Process Descriptions
Work Instructions
Information and communicationInformation and communication system provides means for Finnair’s personnel to capture and communicate information related to risk assessments and control activities across com-pany’s operations. The system aims at providing required personnel access to adequate and timely information on accounting and reporting as well as on related controls. Information regarding control requirements is communicated through common policies, dedicated guide-lines and process level procedure descriptions.
FINNAIR ANNUAL REPORT 2013
STRATEGY / CUSTOMERS / OPERATIONS / EMPLOYEES / SOCIETY / FINANCE / GOVERNANCE / GRI 140

The CFO, supported by Investor Relations function, is responsible for the disclosure of fi-nancial information and fulfilment of the communication obligations of a listed company. In-vestor Relations holds the responsibility over planning and implementation of investor com-munications and daily contact with investors and analysts.
Monitoring and improvementFinnair’s internal control and risk management system is subject to both on-going and period-ical monitoring activities to gain reasonable assurance over its appropriateness and effective-ness. On-going monitoring is built into the normal, recurring operating activities of operations and is the responsibility of corporate management, business units and group-wide functions.
Internal Audit focus areas in 2013 and 2014
2013 Key Activities
Finnair continued to implement and develop the revised mission, vision, strategy and operat-
ing model of its Internal Audit during 2013. Main focus areas of Internal Audit for the year 2013
were based on and aligned with corporate strategy, results of risk analysis and changes in inter-
nal processes. As part of the Audit Plan, special attention was given to IT environment, strategic
partnerships and China sales units.
2014 Key Activities
Internal Audit Plan for 2014 has been approved by the Audit Committee of the Board of Direc-
tors in December 2013. Special audit focus areas will relate to sales strategy implementation
and business resilience. Use of data analytics as part of audit work will be further enhanced and
developed.
Internal AuditThe Internal Audit is established by the Board of Directors, and its responsibilities are defined by the Audit Committee of the Board of Directors as part of their oversight function.
The mission of Internal Audit in Finnair is to provide independent, objective assurance and consulting services designed to add value and improve the organization’s operations. Internal Audit helps the organization to mitigate factors that might undermine its business objectives by bringing a systematic, disciplined approach to evaluate and improve the effectiveness of risk management, control, and governance processes.
Focus areas in 2013 and 2014
2013 Key Activities
A development project on internal controls over financial reporting was conducted. As part of
the development project the key processes with material impact on the financial reporting were
defined and related risks were assessed and control activities reviewed.
In addition, internal control guidelines were defined and related governance model implemen-
tation was launched to enable structured approach for assessing risks and defining, monitoring
and testing controls as well as reporting the outcome of control processes.
2014 Key Activities
Regular self-assessment of risks and controls will be performed as set in the annual calendar
of internal control activities. Specific attention will be put into the critical process areas where
changes in the roles and responsibilities have recently occurred.
Furthermore, control catalogue documentation in additional key process areas identified af-
ter the first phase implementation will be carried out to further extend the coverage of control
framework and associated control activities.
FINNAIR ANNUAL REPORT 2013
STRATEGY / CUSTOMERS / OPERATIONS / EMPLOYEES / SOCIETY / FINANCE / GOVERNANCE / GRI 141

RISK MANAGEMENT AND MAJOR RISKS
Risk ManagementFinnair operates in a global and highly competitive environment that is sensitive to econom-ic fluctuations. In executing its strategy, Finnair and its operations are exposed to a broad range of risks and opportunities. To exploit value creation opportunities, Finnair is prepared to take and manage risks within the limits of its risk-bearing capacity (rewarded risks). In re-lation to reliability of reporting, compliance with laws and regulations, and flight safety mat-ters, Finnair’s objective is to minimise risks (unrewarded risks). The purpose of risk manage-ment is to provide a systematic approach to the management of rewarded and unrewarded risks in all areas of Finnair’s operations.
Policy and frameworkIn Finnair risk is considered as the potential for loss caused by an internal or external event or series of events that can adversely affect the implementation of strategy, achievement of business objectives or shareholder value. Both negative events and unrealised positive events are considered as risk.
Group Risk Management Policy defines the overall framework for risk management in the whole of Finnair Group. The framework, while taking into account industry specif-ic requirements, is aligned with commonly accepted COSO ERM framework and ISO 31000:2009 standard for risk management.
Dedicated Risk Management Principles have been established to support the implemen-tation of Group Risk Management Policy in the following contexts: Treasury, New ventures, Programs and Projects, Supply Chain, Flight Safety, Corporate Security and Information Se-curity.
Policy implementation responsibilitiesThe Board of Directors holds the ultimate responsibility of Enterprise Risk Management system in Finnair. It is responsible for approving Group Risk Management Policy, setting Finnair Group`s Risk Appetite and overseeing the effectiveness of Risk Management.
Finnair Group`s CEO holds the responsibility over the appropriateness of the Group`s Risk Management and oversight of Group Risk Management Policy implementation. The CEO, supported by the Risk Management Steering Group consisting of the members of Ex-ecutive Board, is also responsible for reviewing Group Risk Management Policy and risk management priorities.
Business units, Group-wide functions and subsidiaries of Finnair Group are responsi-ble for implementing Group Risk Management Policy into their management systems and aligning with it their risk management guidelines, procedures and strategies.
Process
Establish context and set objectivesFinnair Group`s Risk Management System ensures that management has a process in place to set objectives, that the chosen strategies support their achievement and associated uncer-tainties are analysed and managed within the boundaries of Finnair`s risk bearing capacity.
Control risks
Inform and communicate
Monitor and continuously
improveIntegrate risks
Evaluate risks
Control risks
CONTROL ENVIRONMENT
Establish context and set objectives
Identify risks and opportunities
Analyse risks
FINNAIR ANNUAL REPORT 2013
STRATEGY / CUSTOMERS / OPERATIONS / EMPLOYEES / SOCIETY / FINANCE / GOVERNANCE / GRI 142

Risk AssessmentRisk assessments are executed according to the Annual Cycle defined in Group Risk Man-agement Policy. Finnair’s risk assessment process takes place as an integral part of strategy process and operational objective setting across the organisation to enable a holistic view on risks and opportunities.
Risk assessment in Finnair Group includes the following phases:• identification of external and internal events affecting the achievement of objectives;• distinction between risks and opportunities;• analysis of identified risks;• integration (aggregation) of risks;• evaluation and prioritisation of risks based on their significance and likelihood.
To ensure the coverage of risk identification and systematise the risk assessment activities, Finnair has established a common risk model, a common risk assessment criteria and a common risk repository. As part of strategic risk assessments, also strategic assumptions as-sociated with company objectives are identified and their implications analysed.
A dedicated Risk Coordinator Forum has been established to support coordination of risk assessment activities in business segments, group-wide functions and subsidiaries and to ensure these activities conform to the requirements set in Group Risk Management Policy.
Risk response and control activities Risk management strategies shall be applied to prioritised risks in order to reach reasonable assurance that their outcomes fall within an acceptable level. These Risk management strat-egy options include:• Acceptance of risk • Avoidance of risk • Transfer of risk • Reduction of risk
The President and CEO, supported by the Risk Management Steering Group, is responsible for defining risk management strategies and procedures, and setting risk management pri-orities. Risk owners in business segments, group-wide functions and process levels hold the responsibility for planning and implementing control measures to ensure an acceptable lev-el of residual risk and that the relevant risk interdependencies have been appropriately ac-knowledged.
Information and communicationRisk management information system aims at providing means for Finnair’s personnel to capture and communicate information related to execution of risk assessments and control activities across company’s operations. Identified risks and their control measures are doc-umented in risk logs for follow-up purposes. Dedicated information systems are in place to identify and analyse operational risk events and support associated operational audit activ-ities. Risk management information system will be subject to further development during the year of 2014.
Risk reporting to the Board of Directors and to the Risk Management Steering Group takes place on quarterly basis under the coordination of Group Internal Audit and Risk Management function. Status of Risk Management development activities and implemen-tation of strategic controls are reported to the Audit Committee of the Board of Directors six times per year. In addition to the periodical business risk reporting, there are several re-porting lines associated with financial and operational risk reporting to both internal and external stakeholders.
Monitoring and continuous improvementFinnair’s risk management system is subject to both on-going and periodical monitoring activities to gain reasonable assurance over its appropriateness and effectiveness. The con-tinuous improvement activities associated with the risk management system are based on PDCA (Plan-Do-Check-Act) cycle consistent with ISO 31000:2009.
On-going monitoring is built into the normal, recurring processes and operational activ-ities, and is the responsibility of corporate management, business segments and common functions. The effectiveness of all flight safety related control activities and the general com-pliance with official regulations are monitored through a quality system. Within the scope of the quality system, the safety-critical elements of the company are audited annually.
The Audit Committee of the Board of Directors is responsible for regularly reviewing and monitoring the implementation of Group Risk Management Policy and the Risk Man-agement process. Group Internal Audit and Risk Management, in cooperation with Risk Management specialists is responsible for assessment and development of the maturity of the risk management system. In order to ensure well-coordinated risk management devel-opment activities across the organisation and exchange of best practices, a dedicated Risk Manager Forum consisting of risk management specialists has been established. The forum has meetings on quarterly basis.
FINNAIR ANNUAL REPORT 2013
STRATEGY / CUSTOMERS / OPERATIONS / EMPLOYEES / SOCIETY / FINANCE / GOVERNANCE / GRI 143

Governance model and reporting lines associated with FInnair Group s Risk Management system Focus areas in 2013 and 2014
In 2013 development activities were focused on the implementation of the revised internal Group
Risk Management Policy in cooperation with business segments and common functions. As part
of this work group-wide Risk Management governance model was established, strategic risk as-
sessments were integrated into group strategy process and dedicated Risk Management Prin-
ciples were formed to support the management of context specific risks.
As part of continuous improvement of the Risk Management system, the following activities
have been planned for the year 2014: Formal Risk appetite and tolerance setting, gap analysis
of Business Continuity Management capabilities as well as further development of group-wide
risk management information system in cooperation with key internal stakeholders.
Risk management information system
Board of Directors
CEO
Risk Management Steering Group
Risk Manager Forum
Business units
Group-wide functions
SubsidiariesRisk
Coordinator Forum
Risk Management
specialists
Audit Committee
Group Internal Audit and Risk Management
FINNAIR ANNUAL REPORT 2013
STRATEGY / CUSTOMERS / OPERATIONS / EMPLOYEES / SOCIETY / FINANCE / GOVERNANCE / GRI 144

Major risksGlobally, the airline industry is one of the sectors most sen-sitive to external shocks, seasonalities and cyclical changes in economic conditions. Finnair carries out a comprehen-sive risk management process, to ensure that risks are iden-tified and mitigated where possible, although many remain outside our full control. A more detailed overview of the risk management process and internal control can be found in our Governance section of this document.
The risks and uncertainties described below are consid-ered to have significant effect on Finnair’s business, financial results and future prospects. This list is not intended to be exhaustive.
Risk Definition Our risk responses include, but are not limited to:
External
Economic volatility The risk that major economic volatility or other large scale economic disturbances slow down travelling.
• On-going analysis of market trend development• Periodical risk assessments• Contingency planning• Risk diversification through active vendor portfolio management• Structural changes• Fleet ownership strategy
Traffic charges and flight permissions.
The price and availability of over-flight rights as well as the price of traffic charges, such as arrival, departure and navigation charges result in a negative impact Finnair’s business operations and profit margin.
• Continuous monitoring of political environment• Lobbying • Active cooperation with key stakeholders
Country risk The risk that sudden changes in demand, political upheaval, cultural factors, natural disasters, pandemic or other disturbances in destination countries slow down travelling and/or hinder Finnair’s ability conduct business.
• Continuous monitoring and market intelligence• Group level risk assessments• Foreign unit risk assessments• Contingency planning• Crisis communication planning• Network diversification
Competitors The risk of competitors or new entrants to the market taking actions to establish sustainable competitive advantage over Finnair.
• Continuous monitoring of competitor activities• Scenario analysis• Contingency planning• Product development program(s)• Cost-competitiveness program(s)• Active alliance cooperation
Alliances and Joint Businesses
The risk that other alliances and/or joint businesses gain competitive advantage over oneworld, Finnair’s joint businesses and/or lack of performance and missing of targets.
• Active alliance cooperation• Joint business governance model• Dedicated alliance and joint business teams• Project and process management methodology
implementation• Joint continuous process improvement activities• Internal controls over joint business processes
Partners and suppliers
The risk that quality and availability issues and/or unexpected costs associated with partnerships and suppliers have adverse effect on Finnair s product and profit margin or suppliers gain bargaining power over Finnair.
• Supplier diversification • Supplier relationship management program• Supplier risk assessments• Dedicated procurement specialists per supplier category• Contingency planning
Market risk The risk of incurring additional costs due adverse movements of the interest rates, unsuccessful currency position and/or rise of jet fuel price.
• Treasury policy approved by the Board of Directors• Internal controls over Treasury policy implementation• Continuous monitoring of hedging ratio(s)• Scenario analysis
FINNAIR ANNUAL REPORT 2013
STRATEGY / CUSTOMERS / OPERATIONS / EMPLOYEES / SOCIETY / FINANCE / GOVERNANCE / GRI 145

Risk Definition Our risk responses include, but are not limited to:
Internal
Strategy implementation
The risk that the implementation of Finnair’s strategic programs and projects fail.
• Formal project management methodology implemented in all strategic projects including risk identification, assessment and mitigation planning
• Program management office (PMO), project owner, project manager and experienced project teams are in place to oversee delivery and track progress of all projects
• Steering group in place with senior management involvement
Human capital The risk that Finnair is not able to execute its strategy due to inadequate quality, commitment or resourcing of human capital.
• Strategic competency management• Continuous improvement of HR processes• Change management program• Employee wellbeing strategy• Internal communication management• Union relations management • Contingency planning• Active and open communication with key stakeholders
Capacity planning The risk that insufficient capacity threatens Finnair’s ability to meet customer demands, or excess capacity threatens Finnair’s ability to generate competitive profit margins.
• Network strategy• Demand forecasting• Route performance monitoring• Deviation analysis• Continuous process improvement
Operational disruptions
The risk that Finnair is unable to continue critical operations and processes due to unavailability of resources such as information and supporting information technologies.
• Business impact analysis• Disruption risk and vulnerability assessments• Business continuity planning and testing• IT disaster recovery planning and testing• Supplier portfolio diversification• Third party requirements • Third party audits
Revenue management
The risk that Finnair is not capable of performing competitive revenue management to optimize its revenues per seat kilometre.
• Revised global sales strategy and revenue optimization process
• Daily monitoring of booking trends, issued sales, advance booking reports
• Monitoring of key variables such as market shares, pricing structure and yields of other relevant airlines as well as route profitability
• Control measures to ensure timeliness and integrity of revenue management information
• Executive level monitoring and performance evaluation
FINNAIR ANNUAL REPORT 2013
STRATEGY / CUSTOMERS / OPERATIONS / EMPLOYEES / SOCIETY / FINANCE / GOVERNANCE / GRI 146

REMUNERATION STATEMENT 2013
CONTENTS Introduction 147 Remuneration structure 147Base salary 149Variable pay linked to company and individual performance 149
Short Term Incentives 149 Long Term Incentives 149
Management remuneration principles and decision-making procedure 151 Remuneration of the Board of Directors 152 Management’s remuneration 153
Supplementary pensions 154 Termination of the service contract and severance pay 154 Other benefits 155
IntroductionThis remuneration statement describes Finnair’s remuneration policies and the remunera-tion of the senior management, i.e. the Board of Directors, the CEO and the members of the Executive Board in 2013. Further information is also available on the company website at www.finnairgroup.com. We have prepared this remuneration statement based on Recom-mendation 47 of the Finnish Corporate Governance Code for Listed Companies published by the Finnish Securities Market Association, and it also covers other key components of re-muneration that we believe the readers are interested in.
Remuneration structureFinnair’s aim is to recruit, motivate and develop employees to allow them to successfully im-plement the company’s strategy. A motivating, fair, competitive and transparent remuneration structure has a significant effect on the company’s ability to achieve this aim. Remuneration must also be competitive in terms of its costs. From the perspective of the competitive situ-ation in the aviation industry and the implementation of Finnair’s strategy, it is essential that the labour costs for all personnel groups are in line with market level.
Remuneration and incentive structures take into consideration the effectiveness and costs of different forms of remuneration. Finnair’s remuneration policies are compliant with local legislation, regulations and practices. The overall remuneration of Finnair’s different person-nel groups are compared annually to the local pay levels in similar tasks in every country in which the company operates.
The salary and other incentive structures applicable to the CEO, the members of the Exec-utive Board, senior salaried employees, engineers and personnel based in units abroad are as follows:I. Fixed pay: base salary, based on Finnair’s job gradingII. Variable pay: short and long-term incentives linked to company and individual perfor-
manceIII. Employee benefits: perquisites and other personnel benefits
Salaries, addendums and other compensation components of personnel groups other than those mentioned above are, for the most part, defined in their respective Finnish collective agreements. For these groups, Finnair’s labour costs determined by collective agreements are substantially higher than current market levels. Outside Finland, Finnair follows the pay prac-tices and collective agreements of each country of operation. At the end of 2013, Finnair’s EUR 200 million performance improvement program had achieved the targeted cost reductions of approximately EUR 155 million in areas other than labour costs. The majority of the EUR 60 million supplementary cost reduction program, announced in October 2012, is targeted at personnel costs, with the aim of achieving labour costs that are in line with market levels. Collective labour agreements are available on the company website at www.finnairgroup.com
Employment benefits for all personnel include a staff ticket benefit in line with company pol-icy, as well as a Sickness Fund for employees based in Finland. Certain personnel groups also have a car benefit and mobile phone benefit in line with company policy.
Finnair aims to make work rewarding and interesting through not only monetary incen-tives, but also by offering opportunities for development and job rotation within the company. Finnair systematically develops the competencies of employees and aims to create opportuni-ties for promotions according to employees’ development. Employees are satisfied at Finnair, as evidenced by a high average duration of employment and a very low employee turnover.
FINNAIR ANNUAL REPORT 2013
STRATEGY / CUSTOMERS / OPERATIONS / EMPLOYEES / SOCIETY / FINANCE / GOVERNANCE / GRI 147

Computational monthly earnings of Finnair’s Finnish personnel groups in 2013**
Employee Group25%
quartile* Median*75%
quartile*2012
Median*
Executive Board 17,634 18,998 23,167 19,787Finnish Airline Pilots' Association (SLL) 7,511 10,469 15,105 10,089Management positions 7,502 9,004 12,502 9,118Finnair White-Collar Employees Association 4,553 5,333 5,998 5,134Finnair Engineers' Association 4,907 5,305 6,645 5,224Finnair Technical Employees' Association 4,189 4,877 5,644 4,714Finnish Aviation Union (IAU), Technical services 3,803 4,577 4,991 4,349Finnish Cabin Crew Union (SLSY) 3,575 4,152 4,795 4,201Finnish Aviation Union (IAU), Ground services 3,457 3,825 4,315 3,674Finnish Aviation Employees Association 3,214 3,486 3,963 3,434
* The median pay describes the average salary of each group, or the point where half of the employees in the group earn more than the amount, and half earn less. One quarter of the employees earn less than the lowest quartile and one quarter of the employees earn more than the highest quartile.
** Computational monthly earnings: Taxable gross earnings divided by 12 months. The calculations only include employees who earned pay for the full year. Temporary cabin crew layoffs have been eliminated from the calculations. The calculations do not include tax exempt benefits or other untaxed forms of compensation, such as daily allowances. Also rewards from the share plans (long-term incentive program for key personnel, employee share savings plan) are excluded. The data does not include pilots in supervisor roles.
Average years of service in different personnel groups in 2013Personnel Group Average Years of Service
Executive Board 7.37Management positions 13.65Finnish Airline Pilots' Association (SLL) 15.20Finnair White-Collar Employees Association 15.77Finnair Engineers' Association 21.62Finnair Technical Employees' Association 25.62Finnish Aviation Union (IAU), Technical services 20.66Finnish Cabin Crew Union (SLSY) 19.39Finnish Aviation Union (IAU), Ground services 16.71Finnish Aviation Employees Association 18.85All 18.34
Finnair’s goal is to have a motivating,
fair, competitive and transparent
remuneration structure
FINNAIR ANNUAL REPORT 2013
STRATEGY / CUSTOMERS / OPERATIONS / EMPLOYEES / SOCIETY / FINANCE / GOVERNANCE / GRI 148

Base salary is based on job gradingFinnair uses job grading as the basis for determining the base salary of the CEO, members of the Executive Board, senior salaried employees, engineers and personnel based in units abroad.
Job grading is based on the significance of the job and responsibility within the organ-isation, rather than hierarchical reporting relationships. Job grading is tied to the job. If a person changes from one job to another, his or her job grade may change. From the point of view of both personal and organisational development, maintaining mobility between grades is important. During his or her career, an employee can move horizontally between jobs with the same grade, or vertically between jobs with different grades.
Variable pay linked to company and individual performanceThe aim of variable pay in the form of short and long-term incentives is to achieve a flexible and incentivising pay structure that is linked to the company’s success and the individual’s own performance. In addition, long-term share-based incentives are aimed at committing key individuals and management to the company and to bring their interests in line with the interests of shareholders. Performance targets are set by Finnair’s Board of Directors.
Short-Term Incentives (STI)
Short-term incentive scheme Finnair utilises performance-driven short-term incentives throughout its management. The incentive scheme is comprised of a process of target setting, performance evaluation and performance review. At the target level, the short-term variable pay ranges from 2.5–30% of base salary, depending on the job grade. If an individual exceeds his or her targets substan-tially, the variable pay may, at a maximum, reach 5–60% of the annual base salary.
The final amount of the variable pay is determined by Finnair’s result factor. The factor multiplies the pay-out by a factor of 0.5–1.5, depending on the company’s financial result (operational EBIT). This multiplier is designed to adjust the variable pay to the company’s financial performance. The short-term incentive scheme is based on the company’s six-month budgeting period and the variable pay is paid semi-annually. The variable pay is cal-culated based on the individual’s base salary for the period in question.
The short-term incentives for the CEO and other members of the Executive Board are
determined on the basis of the half-year targets set by the Board of Directors. The targets are based on the company’s business targets set by the Board of Directors for the period in question and on the targets set for the business area for which the individual in question is responsible. The short-term incentive for members of the Executive Board corresponded to 20% of the base salary at the target level in 2013 and 40% of the base salary at the maximum level. The corresponding figures for the CEO were 30% at the target level and 60% at the maximum level. The result factor described above also applies to the short-term incentive of the CEO and other members of the Executive Board.
According to the government guidelines issued by the Finnish Cabinet Committee on Economic Policy on 13 August 2013, the short-term incentive for an individual may not ex-ceed 60% of the annual base salary in any given year.
Personnel FundFinnair has a Personnel Fund that is owned and controlled by personnel. A share of Finnair’s profits is allocated to the fund. The share of profit allocated to the fund is determined on the basis of the targets set by the Board of Directors. The CEO and other members of the Exec-utive Board are not members of the Personnel Fund. In 2013, Finnair allocated EUR 5 mil-lion to the Personnel Fund based on the company’s result in 2012.
Long-Term Incentives
FlyShare 2013–2014On 27 March 2013, Finnair’s Board of Directors decided to launch FlyShare, an employee share savings plan. The objective of the plan is to encourage employees to become share-holders in the company, and to thereby strengthen the employees’ interest in the develop-ment of Finnair’s shareholder value and reward them in the long term.
Participation in the share savings plan is voluntary. The plan commenced on 1 July 2013, with the first savings period being 12 months. Over 1,000 Finnair employees, or approxi-mately one fifth of all those invited to participate, participated in the first phase of the share savings plan. Subsequent savings periods will be decided on by the Board of Directors.
Through the plan, each eligible Finnair employee is offered the opportunity to save part of his or her salary to be invested in Finnair shares. The maximum monthly savings are 8% and the minimum 2% of each participant’s gross base salary per month, with the annual maxi-mum savings set at EUR 8,000 per participant. Shares are purchased with the accumulated savings at the market price quarterly, after the publication dates of Finnair’s interim results.
FINNAIR ANNUAL REPORT 2013
STRATEGY / CUSTOMERS / OPERATIONS / EMPLOYEES / SOCIETY / FINANCE / GOVERNANCE / GRI 149

The first purchases of shares were made in October–November 2013. Any dividends paid on purchased shares during the savings period will be automatically reinvested in Finnair shares on the purchase date following the payment of dividend. In spring 2016, Finnair will award each participating employee one share for each two shares purchased. The awarded additional shares are taxable income for the recipient.
To increase the attractiveness of the plan, Finnair awarded 20 bonus shares in October 2013 to each employee that participated in at least the first three months of the plan.
Performance share plan for key personnel 2013–2015 On 7 February 2013, Finnair’s Board of Directors decided to launch a new performance share plan for key personnel for 2013–2015. The share plan replaces the previous program, which expired at the end of 2012. The purpose of the share plan is to encourage the manage-ment to work to increase long-term shareholder value. The share plan is in line with the gov-ernment guidelines regarding the remuneration of executive management and key individ-uals.
The program consists of annually commencing individual plans within which the partici-pants have the opportunity to earn Finnair shares as a long-term incentive reward, provid-ed that the performance targets set by the Board of Directors are achieved. The commence-ment of each new plan is subject to separate decision by Finnair’s Board of Directors.
Each plan contains a three-year performance period which is followed by a restriction pe-riod, during which the participant may not sell or transfer the shares received as a reward. The restriction period is three years for the members of Finnair’s Executive Board and one year for other participants. In addition, the CEO and members of Finnair’s Executive Board are required to accumulate and, once achieved, to maintain, a share ownership in Finnair
corresponding to his or her annual base salary as long as he or she holds a position as a member of Finnair’s Executive Board.
The potential reward will be delivered in Finnair shares. For members of the Executive Board, the share delivery is split into three share tranches that will be delivered to during the three years following the performance period: 50% in 2016, 30% in 2017 and 20% in 2018. For other participants, the shares will be delivered in two tranches, 50% each, during the two years following the performance period.
As a consequence of transfer from previous fixed three year structure to rolling structure, new plan will not be in full effect until 2018. Because of this, a one-off bridge element has been added to the plan to supplement payments in 2016 and 2017 if separate performance target is reached. No shares will be delivered under the long-term incentive plan in 2014 and 2015.
If the performance criteria set for the plan are met at the target level, the incentive paid in Finnair shares to the CEO or other member of the Executive Board participating in the plan will be 30% of his or her annual base salary. If the performance criteria set for the plan are met at the maximum level, the incentive paid in Finnair shares will be 60% of the partic-ipant’s annual base salary. For other key personnel, the target level for incentives is 20–25% and maximum 40–50% of the person’s average annual base salary according to the job grade.
According to the rules of the share program, the maximum value of shares delivered to an individual participant based on the share program in any given year may not exceed 60% of the person’s annual base salary.
The amounts of shares above are stated before tax. The number of shares delivered will be deducted by an amount corresponding to the income tax and transfer tax payable for the in-centive at the time of payment.
FINNAIR ANNUAL REPORT 2013
STRATEGY / CUSTOMERS / OPERATIONS / EMPLOYEES / SOCIETY / FINANCE / GOVERNANCE / GRI 150

A person is not entitled to the incentive if he or she resigns or is dismissed before the date of payment. In addition, during the restriction period the Board of Directors is entitled, at its discretion, to reclaim already delivered shares from a person included in the share plan who resigns or whose service in the company is terminated.
The Board of Directors is also entitled, subject to a particularly weighty reason, to change or cancel the incentive or to postpone its payment. The Board of Directors is entitled to re-move a participant from the share plan if the person has committed a significant offence or acted in a manner detrimental to the company or contrary to the company’s interests.
As of 31 December 2013, the share plan includes 51 persons, including the CEO and 7 members of the Executive Board.
The performance criteria applied to the plan for 2013–2015 are the Group’s relative oper-ating EBIT margin growth and decrease in unit costs in European traffic. These two criteria are assigned weights of 60% and 40%, respectively. The performance criterion for the share plan’s bridge element is the operating EBIT margin.
The target levels and maximum levels set for the criteria are based on long-term strategic objectives set by the company’s Board of Directors. Performance against the criteria is mon-itored quarterly.
Remuneration decision-making procedure
Executive Board
The Shareholder’s Nomination Committee
Prepares proposal on Board’s remuneration.
Annual General Meeting
Decides on the Board’s remuneration.
CEO
Board of Directors
• Decides on the CEO’s and Executive Board members remuneration.
• Decides on the incentives, performance-related variable pays and share-based incentive schemes pertaining to the company as a whole.
• Sets company level targets of the short-term incentive scheme.
Remuneration Committee
Prepares remuneration related matters and proposals for the Board.
Management remuneration decision-making procedure
The Board of Directors’ remuneration: The Shareholders’ Nomination Committee pre-pares annually its proposal for the remuneration of the members of the Board of Directors. The Annual General Meeting of shareholders makes the final decision on the Board’s remu-neration.The remuneration of the CEO and the Executive Board: The Board decides on the salary, incentive schemes and associated targets of the CEO and other members of the Executive Board based on preparatory work carried out by the Board’s Remuneration Committee. De-cisions on remuneration have been made with consideration of the government guidelines.
FINNAIR ANNUAL REPORT 2013
STRATEGY / CUSTOMERS / OPERATIONS / EMPLOYEES / SOCIETY / FINANCE / GOVERNANCE / GRI 151

Remuneration of the Board of Directors in 2013
The Annual General Meeting (AGM) decides annually on the remuneration and other financial benefits of the members of the Board of Directors and its commit-tees. The election and remuneration of the members of the Board are prepared by the Nomination Committee formed by the representatives of the company’s largest shareholders. The remuneration of the Board of Directors and its committees is paid in cash.
The members of the Board of Directors are not covered by the company’s share incentive scheme or other incentive schemes.
The annual remuneration and meeting compensation decided by the 2013 AGM for the members of the Board of Directors are: • Chairman’s annual remuneration, 61,200 euros • Deputy Chairman’s annual remuneration, 32,400 euros • Other Board members’ annual remuneration, 30,000 euros • Meeting compensation paid to members residing in Finland, 600 euros per Board or
committee meeting• Meeting compensation paid to members residing abroad, 1,200 euros per Board or
committee meeting.
The members of the Board of Directors are entitled to a daily allowance and compen-sation for travel expenses in accordance with Finnair’s general travel rules. In addi-tion, the members of the Board of Directors have a limited right to use staff tickets in accordance with Finnair’s staff ticket rules. However, the members of the Board of Directors are not in an employment or service relationship with the company and therefore are not entitled to other financial benefits.
Finnair’s remuneration for members of the Board of Directors has remained unchanged since 2008.
Remuneration paid to Board of Directors in 2013Annual
remunera-tion*
Board meetings
Committee meetings
Meeting compensa-
tion
Meeting compen-
sations in total
Taxable income**
Total
Members 1.1.-31.12.2013Klaus Heinemann (chairman from 27.3.2013)
53,400 11/11 6/6 1,200 21,600 0 75,000
Harri Kerminen (deputy chairman)
34,200*** 11/11 11/12 600 15,300 1,795 51,295
Maija-Liisa Friman 30,000 11/11 6/6 600 12,300 10,722 53,022Gunvor Kronman 30,000 11/11 6/6 600 12,000 7,707 49,707Jussi Itävuori 30,000 11/11 6/6 1,200 21,600 3,580 55,180Merja Karhapää 30,000 11/11 5/6 600 10,800 2,729 43,529
Members 1.1.-27.3.2013Harri Sailas (chairman)
15,300 3/3 2/2 600 4,200 1,690 21,190
Members 27.3.-31.12.2013Antti Kuosmanen 22,500 8/8 2/2 1,200 7,800 3,187 33,487
Remunerations paid to the Board in 2013. Remuneration for some of the 2012 meetings was paid in early 2013 and is included in the reporting above. * The remuneration is expressed at the annual level but paid in monthly instalments. ** Taxable benefits include Finnair staff tickets. The members of the Board have a right to use staff tickets in accordance with Finnair’s staff ticket rule.
*** Annual remuneration of Harri Kerminen includes EUR 1,800 of unpaid remuneration from 2012.
FINNAIR ANNUAL REPORT 2013
STRATEGY / CUSTOMERS / OPERATIONS / EMPLOYEES / SOCIETY / FINANCE / GOVERNANCE / GRI 152

Management remuneration in 2013
In 2013, Finnair’s CEO was Mr Mika Vehviläinen (until 28 February 2013) and Mr Pekka Vauramo (from 1 June 2013). Mr Ville Iho served as Acting CEO from 27 January 2013 to 31 May 2013. In 2013, the Executive Board comprised nine members in addition to the CEO. Anssi Komulainen resigned from the Executive Board during 2013. In addition, on 31 De-cember 2013 Kaisa Vikkula announced that she will leave Finnair on 31 January 2014. The Executive Board is presented on page 157.
The long-term incentives paid to management and other key individuals in spring 2013 were based on the three-year share-based bonus scheme that started in 2010 and ended in 2012. The scheme is described in more detail in the remuneration statements for 2011 and 2012 as well as in the Financial Reports for 2010, 2011 and 2012, under Note 26, Share based payments. The Board of Directors approved the scheme on 4 February 2010, and its terms
took into account the government guidelines regarding the remuneration of executive man-agement and key individuals valid at the time.
The performance criteria for the three-year scheme were achieved as shown in the table on the following page. In spring 2013, the participants were paid the shares earned over the course of the three-year scheme as well as an incentive based on the purchase of shares dur-ing 2012. The incentive based on the purchase of shares for 2010 was paid in 2011. The in-centive based on the purchase of shares for 2011 was not paid due to the targets for the peri-od in question not being achieved. The shares paid in spring 2013 are subject to a restriction on their sale until the end of 2015. In addition, the shares for which incentive based on the purchase of shares were paid in 2011 and 2013 were subject to an embargo on their sale un-til the end of 2013.
After Mr Mika Vehviläinen resigned on 27 January 2013, the Board of Directors and Mr Vehviläinen agreed that the six-month notice period stipulated by his service contract would
Summary of the remunerations paid to the CEO and other Executive Board members CEO Executive Board
Salary and other remuneration paid, euros per year
2013Mika Vehviläinen
(CEO until 28.2.)Ville Iho
(Acting CEO 27.1.–31.5.)Pekka Vauramo
(CEO from 1.6.)
2012Mika Vehviläinen
2013 2012
Base SalaryThe monthly salaries of the CEO and members of the Executive Board are decided by the Board of Directors.
In total, euros 178,039 225,040 360,500 576,227 1,620,049 1,739,005
Employee benefitsEmployee benefits are desrcribed on page 155
Car benefit, taxable valuePhone benefit, taxable value
Housing benefit, taxable value
1,89040
4,699
12,540240
0
0140
0
11,340240
26,816
58,0802,240
0
84,0832,600
0In total, euros 6,629 12,780 140 38,396 60,320 86,683
Short-term incentivesPrinciples are described on page 149.
Target payout, %Target achievement, % of base salary
20%53%
20%19%
30%0%
20%26%
20%18%
20%26%
In total, euros 94,382 43,299 0 147,442 289,699 445,807Long-term incentivesLong-term incentive plan 2010–2012
Share-based incentive, paid in cashShare-based incentive, paid in shares, in euros
Purchasing incentive, in euros
00
150,147
102,85068,56749,572
000
000
640,910427,273265,766
000
In total, euros 150,147 220,989 0 0 1,333,949 0SALARY AND OTHER REMUNERATION PAID IN TOTAL 429,197 502,108 360,640 762,065 3,304,017 2,271,495
Salary and remuneration of Acting CEO Ville Iho for 2013 not included in Executive Board figures. His salary and remuneration is presented separately for the whole year of 2013. Salary and remuneration of Anssi Komulainen in 2013 is included in Executive Board figures for his Executive Board membership period only (1.1.-31.8.2013). Base salary includes pay for holiday period and additional holiday pay. Base salary 2013 of CEO Mika Vehviläinen, who left Finnair on 28 February 2013, includes compensation of 88,000 EUR for accumulated holiday.Earnings period for short term incentives paid in 2012 was 1 Jul 2011 - 30 Jun 2012 and for short term incentives paid in 2013 1 Jul 2012 - 30 Jun 2013. Short term incentives paid 2013 have been compared against base salaries paid 2013. Short term incentive of former CEO Mika Vehviläin-en was earned 1.7.2012-31.12.2012 and actual achievement was 34%.Value of share based long-term incentive is based on share price (2.5337 EUR) at the time of payment. Earnings period for purchase incentive was previous year. Purchase incentive was not paid in 2012 because earnings criteria was not full filled 2011.
FINNAIR ANNUAL REPORT 2013
STRATEGY / CUSTOMERS / OPERATIONS / EMPLOYEES / SOCIETY / FINANCE / GOVERNANCE / GRI 153

be shortened to one month. Mr Vehviläinen, who left Finnair on 28 February 2013, was not paid a share-based bonus under the long-term incentive scheme for 2010–2012, but he was paid an incentive bonus based on the purchase of shares earned in 2012, which he would have received pursuant to the rules of the share-based bonus scheme even in the event that his notice period had not been shortened.
Actual percentage achieved of the performance criteria for the long-term incentive scheme in 2010–2012 Year Criterion Minimum
(0%)Target (50%) Maximum
(100%)Actual
(%)Actual
(%)
2010ROCE % 0% 2% 4% 0%
32.3%EBITDAR (EUR million) 112 162 212 64.6%
2011ROCE % 0% 2% 4% 0%
0%EBITDAR (EUR million) 193 243 293 0%
2012Adjusted gearing % 105% 91.5% 75% 94.6%
97.3%EBITDAR (EUR million) 100 160 220 100%
The long-term incentive for the three-year period was achieved at an average level of 43%. This share-based incentive for the full three-year period was paid in spring 2013.
Supplementary pensions
The CEO
The CEO, Mr Pekka Vauramo, accumulates pension and his retirement age is defined in ac-cordance with the Finnish Employees’ Pensions Act. Mr Vauramo does not have a supple-mentary pension benefit.
Finnair’s previous CEO, Mr Mika Vehviläinen, was covered by the defined contribution pension scheme for the company’s senior management. Mr Vehviläinen resigned from his position on 27 January 2013 and his service at the company ended on 28 February 2013. As his service at Finnair lasted less than 48 months, he lost his right to his supplementary pen-sion.
Mr Ville Iho, who served as the company’s Acting CEO in 2013, is covered by the defined contribution pension scheme. Mr Iho’s annual contribution equals 10% of the income for the year (income being defined in accordance with the Finnish Employees’ Pensions Act). The supplementary pension includes vested rights and the retirement age is 63 years.
Executive Board
The members of the Executive Board accumulate pension in accordance with the Finnish Employees’ Pensions Act. In addition, the company has a supplementary pension scheme that includes some of the members of the Executive Board.
All pension arrangements for members of the Executive Board are collective within the meaning of the Finnish tax laws. All supplementary pensions taken for the executives after 1 October 2009 are defined contribution schemes. The supplementary defined contribution pension arrangement applied to five members of the Executive Board in 2013. The annu-al contribution equals 10% of the income for the year (income being defined in accordance with the Finnish Employees’ Pensions Act). The supplementary pension includes vested rights. The retirement age is 63 years.
All supplementary pension agreements concluded prior to 1 October 2009 are defined benefit schemes. The retirement age under these defined benefit schemes is 62 years. These schemes applied to two members of the Executive Board in 2013. The amount of the de-fined benefit pension is 60% of the annual income determined by the average earnings for the four years preceding retirement, excluding the years with the lowest and highest earn-ings during the four-year period. The supplementary pension includes vested rights. In 2014, there are no Executive Board memebers with defined benefit supplementary agreements.
New CEO and Executive Board member service contracts concluded after 1 January 2013 will not include supplementary pension benefits.
Termination of the service contract and severance pay
The CEO
According to Mr Pekka Vauramo’s service contract, both the CEO and the company have the right to terminate the service contract without a spesific cause. The notice period is six months for both the company and the CEO. In the event that the company terminates the service contract, the CEO is entitled to a severance pay corresponding to total salary for twelve months (base salary + taxable value of benefits) in addition to the salary for the notice period. The severance pay does not apply if the CEO resigns or retires.
According to the service contract of Mr Ville Iho, who served as Acting CEO from 27 Jan-uary to 31 May 2013, both parties have the right to terminate the service contract without a spesific cause. The notice period is six months for both the company and the executive. In the event that the company terminates the service contract, the executive is entitled to a sev-erance pay corresponding to total salary for twelve months (base salary + taxable value of
FINNAIR ANNUAL REPORT 2013
STRATEGY / CUSTOMERS / OPERATIONS / EMPLOYEES / SOCIETY / FINANCE / GOVERNANCE / GRI 154

benefits) in addition to the salary for the notice period. The severance pay does not apply if the executive resigns or retires.
According to the service contract of Mr Mika Vehviläinen, the previous CEO, both the CEO and the company had the right to terminate the service contract without cause. The notice period was twelve months for the company and six months for the CEO. In the event of the company terminating the service contract, the CEO would have been entitled to a severance pay corresponding to total salary for twelve months (base salary + taxable value of benefits) in addition to the salary for the notice period. As Mr Vehviläinen resigned from the company on 27 January, the severance pay did not apply. The Board of Directors and Mr Vehviläinen further agreed to reduce the duration of the notice period to one month.
Executive Board
According to service agreements, both parties have the right to terminate the service con-tract without a specific cause. The notice periods for the company and for the current mem-bers of the Executive Board vary based on the time they began their service in the company. The maximum notice period is six months for both parties. In the event that the company terminates the agreement, the member of the Executive Board is entitled to a severance pay corresponding to the base salary of twelve months in addition to the salary for the notice pe-riod. This severance pay does not apply if the contract of employment is cancelled, if the ex-ecutive terminates the contract or retires.
Under a new policy confirmed by the Board of Directors in 2012, the notice period for ser-vice contracts signed after 1 January 2013 is six months for both the company and the mem-ber of the Executive Board. In the event that the company terminates the agreement, the member of the Executive Board is entitled to a severance pay corresponding to nine months’ base salary in addition to the salary for the notice period. This severance pay does not apply if the contract of employment is cancelled, if the executive terminates the contract or retires.
Other benefits
The CEO
CEO Mr Pekka Vauramo’s benefits include life insurance, free-time accident insurance, travel insurance, management liability insurance and medical insurance. The life insurance coverage starts at 20% of annual pay and increases each year. The total sum may not, however, exceed EUR 500,000. The CEO also has a mobile phone benefit in line with company policy.
The benefits of Mr Ville Iho, who served as Acting CEO, include free-time accident insur-ance, travel insurance and management liability insurance. Mr Iho also has a car benefit and mobile phone benefit in line with company policy.
Previous CEO Mr Mika Vehviläinen’s benefits included life insurance, free-time accident insurance, travel insurance, management liability insurance and medical insurance. He also had a car benefit, mobile phone benefit and housing benefit in line with company policy.
Executive Board
The benefits of the members of the Executive Board include free-time accident insurance, travel insurance, management liability insurance and, for non-Finnish members, medi-cal insurance. They also have a car benefit and mobile phone benefit in line with company policy.
Management remuneration, the company’s long-term incentive plan and pension contribu-tions are also described in the Financial Report, in note 3.9 Employee Benefits.
FINNAIR ANNUAL REPORT 2013
STRATEGY / CUSTOMERS / OPERATIONS / EMPLOYEES / SOCIETY / FINANCE / GOVERNANCE / GRI 155

BOARD OF DIRECTORS 31.12.2013
Klaus Heinemannb. 1951, Diplom Kaufmann, German citizen.Chairman of the Finnair Board of Directors since 27 March 2013, member since 2012.Committee memberships: Audit Committee.Main occupation: Board professional.Key positions of trust: Chairman of the Board of Directors of AerData, member of the Advisory Board of Skyworks Holdings LLC.
Merja Karhapääb. 1962, LLM, PG IPR Diploma, Finnish Citizen.Chairman of the Finnair Board of Directors since 2012.Committee memberships: Audit CommitteeMain occupation: Chief Legal Officer Sanoma GroupKey positions of trust: Member of the Boards of Biotie Therapies Corporation, De Vijver Media N.V. (Belgium) and SBS Broadcasting B.V:n (The Netherlands), Expert Member of IPR Court and Chairman of the Law Committee of the Confederation of Finnish Industries.
Harri Kerminenb . 1951, M.Sc. (Eng.), MBA, Finnish citizen.Vice Chairman of the Finnair Board of Directors since 2012, member since 2011.Committee memberships: Audit Committee and Remuneration Committee.Main occupation: Board professional.Key positions of trust: Member of the Boards of Outokumpu Oyj, Tikkurila Oyj, Normet Oy and Achema Group. Chairman of the Boards of Finpro ry and MetGen Oy. Member of the Board of TT Foundation of the Confederation of Finnish Industries.
Gunvor Kronmanb. 1963, MA, Finnish citizen.Member of the Finnair Board of Directors since 2012.Committee memberships: Remuneration Committee.Main occupation: CEO of Swedish-Finnish Cultural Centre.Key positions of trust: Chairman of the Board of Plan Finland and Vice Chairman of the Boards of Crisis Management Initiative, Finnish Broadcasting Company YLE and Kalevala Jewelry. Member of the Boards of Finnish Red Cross Blood Service, Helsinki University, Konstsamfundet, Swedish Royal National Theater Dramaten (Sweden), Rand Corporations and Augusta Victoria Hospital (Palestine).
Maija-Liisa Frimanb. 1952, M.Sc. (Chem. Eng.), Finnish citizen.Member of the Finnair Board of Directors since 2012.Committee memberships: Audit Committee (Chairman).Main occupation: Board professional.Key positions of trust: Vice Chairman of the Board of Neste Oil Oyj, member of the Boards of Talvivaara Plc, LKAB, the Finnish Securities Market Association and Boardman Oy. Chairman of the Board of Ekokem Oy and Helsinki Deaconess Institute.
Antti Kuosmanenb. 1950, M.Sc. (Mathematics, Economics and Statistics), Finnish citizen. Member of the Finnair Board of Directors since 2013.Committee memberships: Remuneration Committee.Main occupation: Ambassador, Finland’s official ASEM representative, leading Asia advisor in the Ministry of Foreign AffairsKey positions of trust: -
Jussi Itävuorib. 1955, M. Sc. (Econ.), Finnish citizen.Member of the Finnair Board of Directors since 2012.Committee memberships: Remuneration Committee (Chairman).Main occupation: Senior Partner, RJI Partners Limited.Key positions of trust: Member of the Board of Patria Plc.
The Board of Directors was elected in 2013 Annual General Meeting held on 27 March 2013. More detailed information about the members of the Board of Directors and their ownership of Finnair shares can be found at www.finnairgroup.com
FINNAIR ANNUAL REPORT 2013
STRATEGY / CUSTOMERS / OPERATIONS / EMPLOYEES / SOCIETY / FINANCE / GOVERNANCE / GRI 156

EXECUTIVE BOARD 31.12.2013
Pekka Vauramob. 1957, M. Sc. (Mining), President and CEO as of 1 June 2013. Before joining Finnair, Mr. Vauramo worked for cargo and load handling company Cargotec between 2007 and 2013, and for mining and construction company Sandvik between 1985 and 2007.
Sami Sareliusb. 1971, LLM, SVP and General Counsel, in Finnair’s service since 1998.
Erno Hildénb. 1971, M.Sc. (Econ.), CFO, in Finnair’s service since 1997. Mr. Hilden’s previous posts include VP for Finnair Leisure Flights business unit and various business development posts in Finnair corporate management. Prior to his present position he was Finnair Plc’s COO.
Arja Suominenb. 1958, MA, e-MBA, SVP Corporate Communications and Corporate Responsibility, in Finnair’s service since 2011. Ms. Suominen previously worked for Nokia, mainly in communications positions, ultimately as Nokia’s Senior Vice President, Communications.
Ville Ihob. 1969, M.Sc. (Technology), COO, in Finnair’s service since 1998. Mr. Iho acted as deputy CEO between 27 January and 1 June 2013. He has previously held various posts in Finnair Plc’s Scheduled Traffic. Prior to his present position he was Finnair Plc’s SVP Resources Management.
Manne Tiensuub. 1970, M. Sc. Psych., SVP Human Resources, in Finnair’s service since 2010. Mr. Tiensuu previously worked for Glaston Oyj and Nokia Oyj.
Gregory Kaldahlb. 1957, B.Sc. (Education), SVP Resources Management, in Finnair’s service since 2011. Mr. Kaldahl previously worked for several airlines. His latest position was VP, Resource Planning for United Airlines.
Kaisa Vikkulab. 1960, D.Sc. (Econ), SVP Travel Services, in Finnair’s service since 2006. Vikkula previously worked in the finance and capital markets, as an investor relations and communications director for Partek Plc and Managing Director of Mascus Ltd.
Allister Patersonb. 1960, MBA, SVP Commercial Division, in Finnair’s service since 7 January 2013. Paterson has previously worked in the transportation sector, in senior leadership positions in Air New Zealand and as a CEO of Air Canada Vacations. Prior to joining Finnair he worked as a CEO of Seaway Marine Transport.
Mr. Anssi Komulainen worked as SVP Customer Service until 31 August 2013. More detailed information about the members of the Executive Board and their ownership of Finnair shares can be found at www.finnairgroup.com
FINNAIR ANNUAL REPORT 2013
STRATEGY / CUSTOMERS / OPERATIONS / EMPLOYEES / SOCIETY / FINANCE / GOVERNANCE / GRI 157

REPORTING PRINCIPLESFinnair began reporting on its environmental impact in 1997 and in 2008 was one of the first airlines in the world to communicate its corporate responsibility issues by applying the Global Reporting Initiative (GRI) reporting framework.
This annual report has been compiled in accordance with the GRI’s G3 Guidelines. In addition to the parent company, the report covers subsidiaries and business units that support flight operations in Finland as well as the group’s subsidiaries that provide and sell travel services in Finland.
The Finnair Group does not report on the operations of foreign subsidiaries, because as minor operators they are deemed not to be of key significance with respect to the group’s corporate responsi-bility issues. Possible exceptions to this are mentioned separately in connection with each key figure. The Finnair Group, moreover, does not report on outsourced operations.
The Finnair maintenance organization consists of two companies Finnair Technical Services Oy and Finnair Engine Services Oy. This approach is justified by the fact that the operations of both technical services subsidiaries are the repair and maintenance of aircraft and their components, and for this reason their corporate responsibility aspects are convergent at the group level.
Information sources, measurement and calculation methodsThe information of the report has been collected from the group’s internal statistics systems and also from various subcontractors. In terms of measurement and calculation methods, the GRI G3 calcu-lation guidelines have been adhered to whenever the available data have so allowed. If some other measurement or calculation method has been used, this is mentioned in connection with the key figure concerned. The figures have been presented in time series when this has been appropriate and reliably possible.
Reported business units and subsidiaries
Operating segment Business unit/subsidiary Included in report Justification
AIRLINE BUSINESS Airline Business YesFinnair Cargo Oy YesFinnair Cargo Terminal Operations Oy YesFinnair Aircraft Finance Oy and FAF subsidiaries Yes
AVIATION SERVICES Finnair Technical Services Oy YesFinnair Engine Services Oy Yes/LSG Sky Chefs Finland YesFinnair Facilities Management Oy Yes
TRAVEL SERVICES Oy Aurinkomatkat - Suntours Ltd Ab Yes- Aurinko Oü, Estonia (Horizon Travel Oü) No Foreign subsidiary
of a subsidiary (travel agency)
- OOO Aurinko (Calypso World of Travel), Russia No Foreign subsidiary of a subsidiary (travel agency)
Finnair Travel Retail Oy, Helsinki YesFinland Travel Bureau Ltd. (FTB) Yes- A/S Estravel Ltd No Foreign subsidiary
of a subsidiary (travel agency)
Area Travel Agency Ltd. YesBack Office Services Estonia Oü, Estonia NoAmadeus Finland Oy Yes
OTHER FUNCTIONS Group Administration YesJoint functions YesFTS Financial Services Oy YesFinnair Flight Academy Oy Yes
Yes
FINNAIR ANNUAL REPORT 2013
STRATEGY / CUSTOMERS / OPERATIONS / EMPLOYEES / SOCIETY / FINANCE / GOVERNANCE / GRI 158

Figures on economic responsibility are mainly derived from the financial statements. Other information with respect to economic responsibility is derived from the group’s various operators.
Finnair’s largest single material cost item is jet fuel. In this report, jet fuel is treated, however, as energy, because in terms of its purpose and environmental effects it is sensible to understand jet fuel as stored energy. Fuels are also reported on the basis of their mass and volumes.
In terms of flying, emissions values and fuel consumption figures are derived from the company’s own monitoring systems and based on actual consumption. Because Finnair has prepared for the EU emis-sions trading system, the emissions calculations are also verified by an external party.
In relation to material streams, amounts of waste, and energy consumption of properties, data have been obtained from service providers, goods suppliers and on the basis of invoices paid. With respect to Finnair Technical Operations, environmental data are also obtained from monitoring and measuring systems required by their environmental permits. In terms of Technical Operations’ use of materials, only chemicals are reported, because the statis-tical practice of raw materials and spare parts does not allow a comparable way of presentation. Finnair Technical Operations is not, however, a significant user of raw materials, and its main envi-ronmental aspects relate to storage and use of chemicals. Meal services for Finnair flights from Helsinki are supplied by Finnair’s partner LSG Sky Chefs Finland. As one of Finland’s largest kitchens, it consumes a substantial amount of materials and also represents a considerable proportion of the material consumption in Finnair’s supply chain.
Information on personnel comes from Finnair’s HR information system and from parties responsible for the wellbeing of employees. Acci-dent statistics are obtained from the insurance company and they are updated retroactively, as a result of which the 2012 figures may be subject to further adjustment. Information relating to human rights and local communities are derived from procurement agreements, from personnel responsible for procurement, subcontractors and, in terms of the impact of tourism, mainly from Aurinkomatkat-Suntours, which as a tour oper-ator occupies a key position in this respect. Operational conformity with laws and regulations has been confirmed with the group’s Legal Affairs department. Customer satisfaction data, on the other hand, are based on customer satisfaction surveys and on feedback received by the group.
Effect of any re-statements of information provided in earlier reportsThere have been no changes in the methods of data collection and calculation used despite the change in report format. Information on changes in individual KPIs is provided under the section on the indicator in question.
Changes pertaining to the group’s organisational structure and the calculation of the financial statement data are described in more detail in the financial section of this report.
Reporting prioritiesIn 2013, Finnair discontinued publication of separate Corporate Responsibility and Financial Reports. All of the same data now can be found in one integrated Annual Report.
The report highlights and discusses the material issues to Finnair’s operations. More information about the materiality assessment process can be found on pages 12–13.
FINNAIR ANNUAL REPORT 2013
STRATEGY / CUSTOMERS / OPERATIONS / EMPLOYEES / SOCIETY / FINANCE / GOVERNANCE / GRI 159

GRI MATRIX
GRI GUIDELINES FINNAIR GROUP REPORT
GRI INDICATOR INCLUDED PAGE/CONTENTS SHORTCOMINGS/ANOMALIES/JUSTIFICATIONS
1. Strategy and Analysis
1.1 Statement by the CEO Yes 3-4
1.2 Description of key impacts, risks, and -opportunities Yes 3-10, 12-18, 21-27, 38-43, 51-55, 59-69, 142-146
2. Organisational Profile
2.1 Name of the organisation Yes Finnair Plc
2.2 Primary brands, services and/or brands Yes 7, 14-18, 27, 51-54, 64-68
2.3 Operational structure of the organisation Yes 27, 64-69, 137
2.4 Location of organisation’s headquarters Yes HOTT, Tietotie 9, Vantaa, Finland
2.5 Georgaphical location of operations Yes 7, 65-69
2.6 Nature of ownership and legal form Yes 65-69, 71-74
2.7 Markets served Yes 7, 65-69
2.8 Scale of the reporting organisation Yes 60-70
2.9 Significant changes during the reporting period regarding size, structure or ownership Yes 59-74
2.10 Awards received in the reporting period Yes 16, 26, 53, 67, 74
3 Report Parameters
3.1 Reporting period Yes 1.1.2013 - 31-12.2013
3.2 Date of most recent report Yes March 2013
3.3 Reporting cycle Yes Annual.
3.4 Contact point for questions regarding the reports o rits contents Yes Finnair Plc Tietotie 9 A, 01053 Finnair. Kati Ihamäki, VP Sustainable Development, kati.ihamaki(a)finnair.com
3.5 Process for defining report content Yes 12-13
3.6 Boundary of the report content Yes 12-13, 158-159
3.7 Specific limitations on the scope or boundary of the report Yes 158-159
3.8 Basis for reporting on joint ventures, subsidiaries, leased facilities and outsourced operations Yes 65-69, 158-159
3.9 Data measurements techniques and the bases of calculations Yes 158-159 Possible anomalies are mentioned separately for each indicator.
3.10 Explanation of the effect of any re-statements of information provided in earlier reports Yes 158-159
3.11 Significant changes from the previous reporting periods in the scope, bounday or measurements methods applied in the report
Yes 65-70, 158-159
3.12 GRI Content Index Yes 160-166
3.13 Policy and current practice with regard to seeking external assurance for the report Yes The report has not been externally assured
4 Governance, Commitments and Engagement
4.1 Governance structure of the organisation Yes 131-141, 156
4.2 Status of the chair of the highest governance body Yes 133
4.3 Independence of Members of the Board of Directors Yes 134
4.4 Mechanisms for shareholders and employees to influence actions of Board of Directors Yes 131-141
4.5 Linkage between compensation for Members of the Board of Directors and senior managers to the organisation’s social and environmental performance
Yes 125-130, 135-137, 147-155
4.6 Process to prevent conflicts of interests in Board work Yes 131-141
FINNAIR ANNUAL REPORT 2013
STRATEGY / CUSTOMERS / OPERATIONS / EMPLOYEES / SOCIETY / FINANCE / GOVERNANCE / GRI 160

GRI GUIDELINES FINNAIR GROUP REPORT
GRI INDICATOR INCLUDED PAGE/CONTENTS SHORTCOMINGS/ANOMALIES/JUSTIFICATIONS
4.7 Process for determination the qualifications of Members of the Board in areas of strategic management and corporate responsibility
Yes 131-141
4.8 Mission, values and codes of conduct Yes 3-10, 41, 51-54, 57, 125-130, 139
4.9 Board’s procedures for overseeing management of corporate performance Yes 131-141
4.10 Process for evaluating the Board of Directors’ own performance Yes 131-141
4.11 Application of the precautionary principle Yes 131-141
4.12 Commitment to external corporate responsibility initiatives Yes 11, 22, 37, 53-57
4.13 Memberships in organisations, associations and advocacy organisations Yes 25, 53-57
4.14 List of interest groups engaged by the organisation Yes 12-13, 55-57
4.15 Basis of identification and selection of interest groups Yes 9-13, 55
4.16 Approaches to engagement with interest groups Yes 9-13, 55
4.17 Key topics and concerns raised through interest-group engagement Yes 9-13, 55
5 Management Approach and Performance Indicators
Economic Performance Indicators
Approach to management of economic responsibility 126
EC1 Direct economic value generated and distributed, including revenues, operating costs, employee compensation, donations and other community investments, retained earnings, and payments to capital providers and governments
Partly 123 Level and amount of community support not reported, because funds and other investments in community projects consist of items that cannot be separated from the group’s financial statement information. Finnair’s objective is to include the level of community support in the 2013 report.
EC2 Financial implications and other risks and opportunities for the organisation’s activities due to climate change
Yes 123
EC3 Coverage of pension obligations Yes 123
EC4 Significant financial assistance received from government Yes 124
EC5 Range of ratios of standard entry level wage compared to local minimum wage at significant locations of operation
No Nearly all of the Finnair Group’s personnel fall within the sphere of collective bargaining agreements, so this indicator not deemed to be essential for the group.
EC6 Policy, practices, and proportion of spending on locally-based suppliers at significant locations of operation
Partly 124 Finnair has no local procurement policy as such, and does not compile information at Group Level on the local characteristics of its suppliers.
EC7 Procedures for local hiring and proportion of senior management hired from the local community at locations of significant operation
Partly Indicator is not essential for the Finnair Group operations, because Finnair has no significant operating locations abroad. In Finland, Finnair’s employees, including senior management, are mainly Finnish.
EC8 Development and impact of infrastructure investments and services provided primarily for public benefit (through commercial, in-kind, or pro bono engagement)
No In the reporting period, the Finnair Group has not made infrastructure investments for the public benefit.
EC9 Understanding and describing significant indirect economic impacts, including the extent of impacts Yes 124
Environmental Performance Indicators
Approach to management of environmental responsibility Yes 126-127
EN1 Materials used by weight or volume Yes 28-29
EN2 Percentage of materials used that are recycled input materials No Not an essential indicator for the sector, because the aviation industry is such an externally regulated sector that companies’ room for manoeuvre is in many respects restricted. Insofar as there is discretion, the percentage of recycled materials is not ascertained at group level.
EN3 Direct energy consumption by primary energy source Yes 29-30
EN4 Indirect energy consumption by primary energy source Yes 31 With respect to electricity, the primary energy sources are not ascertained for 2013, because they depend e.g. on the prevailing hydro-power roduction capacity and the share of hydropower in the grid at any given time.
EN5 Energy saved due to conservation and efficiency improvements Yes 31-32
EN6 Initiatives to provide energy-efficient or renewable energy based products and services, and reductions in energy requirements as a result of these initiatives
Yes 32
FINNAIR ANNUAL REPORT 2013
STRATEGY / CUSTOMERS / OPERATIONS / EMPLOYEES / SOCIETY / FINANCE / GOVERNANCE / GRI 161
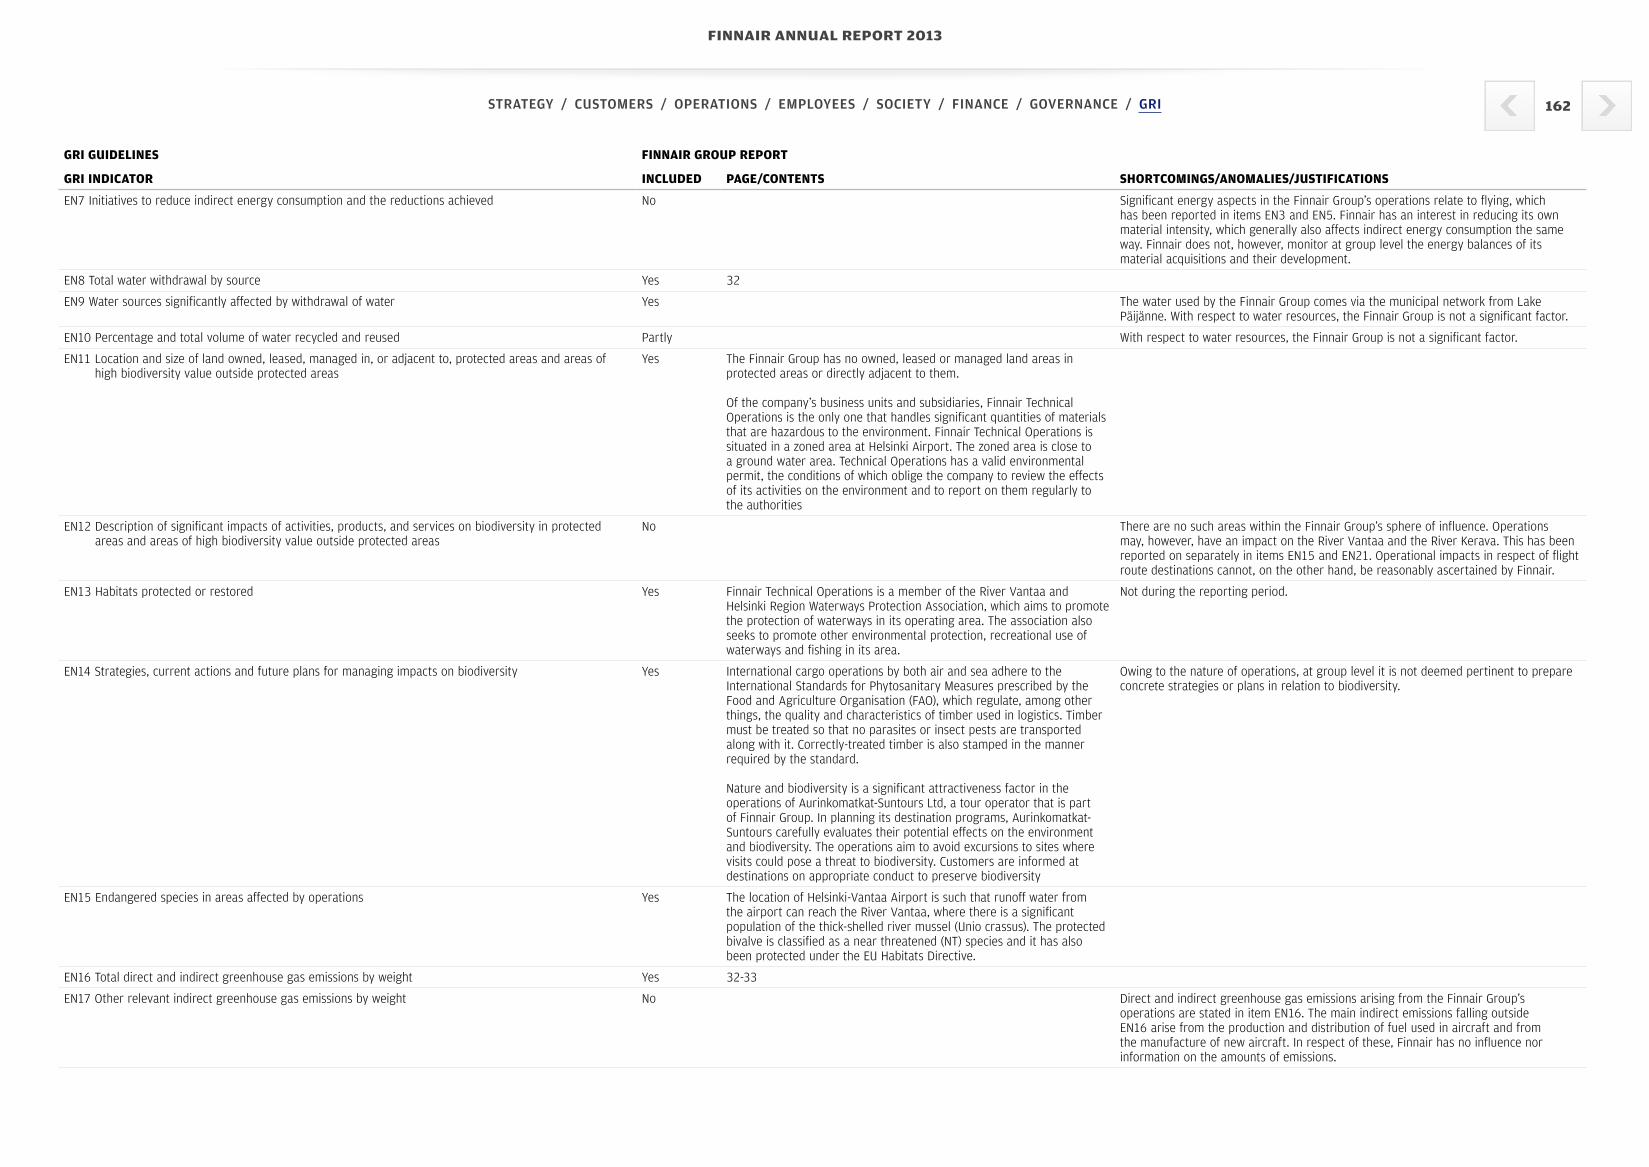
GRI GUIDELINES FINNAIR GROUP REPORT
GRI INDICATOR INCLUDED PAGE/CONTENTS SHORTCOMINGS/ANOMALIES/JUSTIFICATIONS
EN7 Initiatives to reduce indirect energy consumption and the reductions achieved No Significant energy aspects in the Finnair Group’s operations relate to flying, which has been reported in items EN3 and EN5. Finnair has an interest in reducing its own material intensity, which generally also affects indirect energy consumption the same way. Finnair does not, however, monitor at group level the energy balances of its material acquisitions and their development.
EN8 Total water withdrawal by source Yes 32
EN9 Water sources significantly affected by withdrawal of water Yes The water used by the Finnair Group comes via the municipal network from Lake Päijänne. With respect to water resources, the Finnair Group is not a significant factor.
EN10 Percentage and total volume of water recycled and reused Partly With respect to water resources, the Finnair Group is not a significant factor.
EN11 Location and size of land owned, leased, managed in, or adjacent to, protected areas and areas of high biodiversity value outside protected areas
Yes The Finnair Group has no owned, leased or managed land areas in protected areas or directly adjacent to them.
Of the company’s business units and subsidiaries, Finnair Technical Operations is the only one that handles significant quantities of materials that are hazardous to the environment. Finnair Technical Operations is situated in a zoned area at Helsinki Airport. The zoned area is close to a ground water area. Technical Operations has a valid environmental permit, the conditions of which oblige the company to review the effects of its activities on the environment and to report on them regularly to the authorities
EN12 Description of significant impacts of activities, products, and services on biodiversity in protected areas and areas of high biodiversity value outside protected areas
No There are no such areas within the Finnair Group’s sphere of influence. Operations may, however, have an impact on the River Vantaa and the River Kerava. This has been reported on separately in items EN15 and EN21. Operational impacts in respect of flight route destinations cannot, on the other hand, be reasonably ascertained by Finnair.
EN13 Habitats protected or restored Yes Finnair Technical Operations is a member of the River Vantaa and Helsinki Region Waterways Protection Association, which aims to promote the protection of waterways in its operating area. The association also seeks to promote other environmental protection, recreational use of waterways and fishing in its area.
Not during the reporting period.
EN14 Strategies, current actions and future plans for managing impacts on biodiversity Yes International cargo operations by both air and sea adhere to the International Standards for Phytosanitary Measures prescribed by the Food and Agriculture Organisation (FAO), which regulate, among other things, the quality and characteristics of timber used in logistics. Timber must be treated so that no parasites or insect pests are transported along with it. Correctly-treated timber is also stamped in the manner required by the standard.
Nature and biodiversity is a significant attractiveness factor in the operations of Aurinkomatkat-Suntours Ltd, a tour operator that is part of Finnair Group. In planning its destination programs, Aurinkomatkat-Suntours carefully evaluates their potential effects on the environment and biodiversity. The operations aim to avoid excursions to sites where visits could pose a threat to biodiversity. Customers are informed at destinations on appropriate conduct to preserve biodiversity
Owing to the nature of operations, at group level it is not deemed pertinent to prepare concrete strategies or plans in relation to biodiversity.
EN15 Endangered species in areas affected by operations Yes The location of Helsinki-Vantaa Airport is such that runoff water from the airport can reach the River Vantaa, where there is a significant population of the thick-shelled river mussel (Unio crassus). The protected bivalve is classified as a near threatened (NT) species and it has also been protected under the EU Habitats Directive.
EN16 Total direct and indirect greenhouse gas emissions by weight Yes 32-33
EN17 Other relevant indirect greenhouse gas emissions by weight No Direct and indirect greenhouse gas emissions arising from the Finnair Group’s operations are stated in item EN16. The main indirect emissions falling outside EN16 arise from the production and distribution of fuel used in aircraft and from the manufacture of new aircraft. In respect of these, Finnair has no influence nor information on the amounts of emissions.
FINNAIR ANNUAL REPORT 2013
STRATEGY / CUSTOMERS / OPERATIONS / EMPLOYEES / SOCIETY / FINANCE / GOVERNANCE / GRI 162

GRI GUIDELINES FINNAIR GROUP REPORT
GRI INDICATOR INCLUDED PAGE/CONTENTS SHORTCOMINGS/ANOMALIES/JUSTIFICATIONS
EN18 Initiatives to reduce greenhouse gas emissions and reductions achieved Partly In the Finnair Group’s operations, energy consumption and greenhouse gas emissions go hand in hand. Thus all actions taken during the year to reduce energy consumption also affect in the same way and to the same extent the greenhouse gas emissions arising from the group’s activities.
EN19 Emissions of ozone-depleting substances by weight Yes 34
EN20 NOx, SOx and other significant air emissions by type and weight Yes 34-35
EN21 Total water discharge by quality and destination Yes 35 The amounts of glycol used in ice prevention and de-icing of aircraft that end up in waterways are reported by and are the responsibility of the airport maintainer.
EN22 Total weight of waste by type and disposal method Yes 36
EN23 Total number and volume of significant spills Yes No significant spills.
EN24 Weight of transported, imported, exported, or treated waste deemed hazardous No The Finnair Group does not transport nor treat hazardous waste. The amounts and treatment of hazardous waste arising from the group operations are reported in item EN22.
EN25 Water bodies and related habitats significantly affected by the organisation’s discharges of wastewater and runoff
Partly The Finnair Group’s wastewater is directed to the municipal wastewater treatment plant. In terms of treated wastewater, the Finnair Group’s specific impact cannot be isolated. The impacts of Helsinki-Vantaa airside runoff are outlined in items EN11, EN15 and EN21.
EN26 Initiatives to mitigate environmental impacts of products and services, and extent of impact mitigation Partly 37 See also EN5, EN6 and EN16.
EN27 Percentage of products sold and their packaging materials that are reclaimed by category No Not an essential indicator for the Finnair Group, because the Finnair Group, excludingLSG Skychef does not manufacture products.
EN28 Monetary value of significant fines and total number of nonmonetary sanctions for non-compliance with environmental laws and regulations
Yes No known cases.
EN29 Significant environmental impacts of transporting products and other goods and materials used for the organisation’s operations, and transporting members of the workforce
No The significant environmental impacts arising from the Finnair Group’s operations come mainly from flying. The impacts of transportation in support of operations are not known, but they are marginal compared with the environmental impacts of flying.
EN30 Total environmental protection expenditures and investments by type Partly Altogether, 2.5 million euros were spent on waste management, maintenance, environmental training, environmental certification, various membership fees and environmental studies.
The Finnair Group’s statistical practices do not enable reporting according to GRI requirements. In addition, in all procurement environmental aspects are in-built, so the separation of environmental investments is not deemed to meaningful.
Social Performance Indicators
Approach to management of labour practices and decent work conditions Yes 127
LA1 Total workforce by employment type, employment contract, and region Yes 43
LA2 Total number and rate of employee turnover by age group, gender, and region Partly 43 Finnair does not keep track of employee turnover by gender, age group or other diversity aspects.
LA3 Benefits provided to full-time employees that are not provided to temporary or part-time employees by major operations
Partly Finnair employees enjoy the same benefits irrespective of type of employment. Some benefits are such that they enter into effect only after employment has lasted a certain period of time. An exception is Finnair’s Financial Services Office, which only serves permanent employees who are its members.
LA4 Percentage of employees covered by collective bargaining agreements. Yes All Finnair employees in Finland have the right and opportunity to agree on their terms of employment through collective bargaining. Senior management constitutes an exception to this, as its terms of employment are agreed on locally.
In addition to flight crew, Finnair currently has employees abroad in 30 countries (approximately 220 employees). The employment contracts and terms of employment are based on local legislation. Employees have the opportunity to agree on their terms of employment through collective bargaining in countries in which that is the local practice.
FINNAIR ANNUAL REPORT 2013
STRATEGY / CUSTOMERS / OPERATIONS / EMPLOYEES / SOCIETY / FINANCE / GOVERNANCE / GRI 163

GRI GUIDELINES FINNAIR GROUP REPORT
GRI INDICATOR INCLUDED PAGE/CONTENTS SHORTCOMINGS/ANOMALIES/JUSTIFICATIONS
LA5 Minimum notice period regarding significant operational changes Yes Significant operational changes in Finland are governed by the Finnish Act on Cooperation within Undertakings. Depending on the matter in question, the minimum time period applied can range from one day to six weeks. The collective bargaining agreements that concern Finnair do not include provisions that run counter to these legislative provisions. For redundancies and layoffs, the minimum notice period pursuant to the Act on Co-operation within Undertakings applies in addition to the statutory notice period for redundancies and layoffs prior to the termination of employment or payment of wages. The statutory notice period for layoffs is two weeks and the notice period for employees made redundant ranges from 14 days to six months depending on the duration of their employment. Some collective bargaining agreements contain provisions on notice periods for layoffs that are more advantageous to employees.
LA6 Percentage of total workforce represented in formal joint management-worker health and safety committees that help monitor and advise on occupational health and safety programmes
Yes 43-44
LA7 Rates of injury, occupational diseases, lost days and absenteeism, and number of work-related fatalities by region
Partly 44 The objective is to make the entire indicator according to GRI in the 2014 report.
LA8 Education, training, counselling, prevention, and risk-control programmes in place to assist workforce members, their families or community members regarding serious diseases
Yes 45-47 Finnair Group programmes in the event of serious diseases relate only to the group’s personnel.
LA9 Health and safety topics covered in formal agreements with trade unions Partly 47-48 The Central Organisation of Finnish Trade Unions SAK and the Confederation of Finnish Industries EK identify the health and safety of an individual employee, non-discrimination and equality as the bases for the regulations in their collective agreements.
LA10 Average hours of training per year per employee by employee category Yes 48 Finnair Group is a multi-sector company which has numerous different employee groups and job classifications. The classifications used by different subsidiaries and business units are not sufficiently comparable. Therefore training hours have been counted using the whole group’s employee numbers. Group employees working abroad are also included in the figures.
LA11 Programmes for skills management and lifelong learning Yes 48-49
LA12 Percentage of employees receiving regular performance and career development reviews Yes Finnair’s development and career reviews cover all personnel. The aim of the updated PD review process implemented throughout the company at the beginning of 2011 is to have all personnel attend a PD review at least twice per year.
LA13 Composition and diversity of governance bodies and personnel groups Yes 50
LA14 Ratio of basic salary of men to women by employee category No As a multi-sector company, the Finnair Group has numerous different employee groups and job classifications. The group’s statistics do not enable a reporting practice according to GRI guidelines, nor for the above reason is this appropriate.
Approach to management of human rights issues Yes 127
HR1 Percentage and total number of significant investment agreements that include human rights clauses or that have undergone human rights screening
Partly In 2013, investment agreements were such that no risk of human rights violations could be identified. As such there are no specific clauses in these agreements relating to human rights. Finnair does not conduct human rights screening itself.
Finnair has its own ethical guidelines for suppliers and subcontractors and all suppliers are required to comply with them. All partners and subcontractors, moreover, are obliged to comply with the principles of the UN Universal Declaration of Human Rights as well as local legislation.
HR2 Percentage of significant suppliers and contractors that have undergone screening on human rights and actions taken
Yes Finnair has its own ethical guidelines for suppliers (supplier code of conduct) and subcontractors and all suppliers are required to comply with them. All partners and subcontractors, moreover, are obliged to comply with the principles of the UN Universal Declaration of Human Rights as well as local legislation.
Finnair and its tour operator and travel agency subsidiaries have separately signed the Helsinki Declaration, which aims to promote sustainable and ethically acceptable tourism.
FINNAIR ANNUAL REPORT 2013
STRATEGY / CUSTOMERS / OPERATIONS / EMPLOYEES / SOCIETY / FINANCE / GOVERNANCE / GRI 164

GRI GUIDELINES FINNAIR GROUP REPORT
GRI INDICATOR INCLUDED PAGE/CONTENTS SHORTCOMINGS/ANOMALIES/JUSTIFICATIONS
HR3 Total hours of employee training on policies and procedures concerning aspects of human rights that are relevant to operations, including the percentage of employees trained
Partly Aurinkomatkat-Suntours Ltd provides training to all new guides in respect of the company’s work against child sex tourism. The number of training hours relating to human rights is not separated from the total number of training hours given. The human rights theme was highlighted in the training on the new Code of Conduct started in 2013.
HR4 Total number of incidents of discrimination and actions taken Yes There was one suspected case of occupational discrimination at Finnair in 2013. The prosecutor decided to press charges in the matter. The case will be dealt in court during spring 2014.
HR5 Operations identified in which the right to exercise freedom of association and collective bargaining may be at significant risk
No The indicator is not essential, because as a Finnish company Finnair operates in a labour market culture in which employees’ rights to organise and negotiate working conditions collectively are recognised fundamental rights.
HR6 Operations identified as having significant risk for incidents of child labour, and measures taken to contribute to the elimination of child labour
Yes Finnair does not approve of the use of child labour in any part of its value chain. With respect to the aviation industry, the company has not identified any risk for incidents of child labour. This is a consequence both of the general nature of the industry and the strict official regulation and supervision of the industry. Nevertheless, the aviation industry and Finnair’s operations do interact with sectors in which the exploitation of child labour cannot be excluded. One such sector is the textile industry. The uniforms and workwear used in the company are acquired from suppliers that have addressed this issue in their own operations.
On excursions, Aurinkomatkat-Suntours guides monitor the operations at excursion sites and destinations for the use of child labour. If any problems are detected, the excursion destinations and the contents of the excursions are changed as necessary. In order to prevent child prostitution, Aurinkomatkat-Suntours has a clause in its hotel contracts that entitles the company to immediately terminate the contract if child prostitution is detected in the hotel.
HR7 Operations identified as having significant risk for incidents of forced or compulsory labour, and measures taken to contribute to the elimination of forced or compulsory labour
Yes 55
HR8 Percentage of security personnel trained in the organization’s policies or procedures concerning aspects of human rights that are relevant to operations
No The Finnair Group does not have its own security personnel.
HR9 Total number of incidents of violations involving rights of indigenous people and actions taken Yes No known cases.
Approach to management of community responsibility Yes 125-126
SO1 Programs related to the assessment and management of the impacts of operations on local communities
Yes 55 Finnair does not have group-level programs to assess and manage the impact of operations on local communities.
SO2 Percentage and total number of business units analysed for risks related to corruption Yes All Finnair business units run an analysis of risks related to corruption as part of the company’s general risk survey.
SO3 Percentage of employees trained in organisation’s anticorruption policies and procedures Partly Comprehensive percentages and figures are not available, because training is conducted independently by business units and subsidiaries themselves. Finnair Flight Academy has not organised any anti-corruption training in 2013
SO4 Actions taken in response to incidents of corruption Yes No cases.
SO5 Public policy positions and participation in public policy development and lobbying Yes 55
SO6 Total value of financial and in-kind contributions to political parties Yes Finnair makes no contributions of any kind to political parties.
SO7 Total number of legal actions for anti-competitive behaviour, anti-trust, and monopoly practices and their outcomes
Yes No cases.
SO8 Monetary value of significant fines and total number of nonmonetary sanctions for non- compliance with laws and regulations.
No cases.
Approach to management of product responsibility Yes 128-130
PR1 Life cycle stages in which health and safety impacts of products and services are assessed for improvement, and percentage of significant products and services categories subject to such procedures
Yes Finnair continuously develops its customer service and evaluates the opertions of its business partners. We have a responsibility to the customer for the overall quality of our operations, regardless of whether we procude the service ourselves or outsource it to a business partner.
PR2 Total number of incidents of non-compliance with regulations and voluntary codes concerning health and safety impacts of products and services
Yes No cases.
FINNAIR ANNUAL REPORT 2013
STRATEGY / CUSTOMERS / OPERATIONS / EMPLOYEES / SOCIETY / FINANCE / GOVERNANCE / GRI 165

GRI GUIDELINES FINNAIR GROUP REPORT
GRI INDICATOR INCLUDED PAGE/CONTENTS SHORTCOMINGS/ANOMALIES/JUSTIFICATIONS
PR3 Type of product and service information required by procedures, and percentage of significant products and services subject to such information requirements
Yes 19
PR4 Total number of incidents of non-compliance with regulations and voluntary codes concerning health and safety impacts of products and services
Yes No cases.
PR5 Practices related to customer satisfaction, including results of surveys measuring customer satisfaction Yes 20
PR6 Programmes for adherence to laws, standards, and voluntary codes related to marketing communications, including advertising, promotion, and sponsorship
Yes Finnair acts in accordance with all generalrules, laws, recommendations and good marketing practices relating to advertising and sponsorship. The main standards include marketing legislation (most significantly the Finish Consumer Protection Act), the Finnish Consumer Agency’s guidelines on the marketing of flights (based on European Parliament and Council Directive (2005/28/EC)) and the principles relating to good advertising practice issued by the Council on Ethics in Advertising.
PR7 Total number of incidents of non-compliance with regulations and voluntary codes concerning marketing communications
Yes No cases.
PR8 Total number of substantiated complaints regarding breaches of customer privacy and losses of customer data
Yes No cases.
PR9 Monetary value of significant fines for non-compliance with laws and regulations concerning the provision and use of products and services
Yes No cases.
FINNAIR ANNUAL REPORT 2013
STRATEGY / CUSTOMERS / OPERATIONS / EMPLOYEES / SOCIETY / FINANCE / GOVERNANCE / GRI 166

INFORMATION FOR THE SHAREHOLDERS
Annual General MeetingThe Annual General Meeting of Finnair Plc. will be held on Thursday 27 March 2014, at 15:00 at the Helsinki Exhibition & Convention Centre at the address Messuaukio 1, Helsinki, Fin-land. The reception of persons who have registered for the meeting and the distribution of vot-ing tickets will commence at 14.00. Coffee is served before the commencement of the AGM.
The notice to convene the AGMThe notice to convene the AGM and the proposals of the Board of Directors to the AGM will be published as a stock exchange release and on Finnair’s corporate website. The notice will contain the agenda for the AGM. Shareholders are entitled to having an issue put on the An-nual General Meeting’s agenda, provided that such an issue requires a decision by the Annual General Meeting according to the Finnish Companies Act, and provided that they request it in writing in due time to be included in the notice.
The right the participate in the AGMEach shareholder who is registered on Monday, 17 March 2014 in the Company’s register of shareholders maintained by the Euroclear Finland Oy has the right to participate in the AGM.
Registration for the AGMThe shareholder who wants to participate in the general meeting and exercise their voting right can register to the meeting at the latest on Monday 24 March 2014 at10 a.m. Registra-tion can be done:- In the internet at http://www.finnairgroup.com,- By e-mail to: [email protected], - By phone from Monday to Friday at 9.00–16.00 in the number: +358 20 770 6866, - By fax: +358 9 694 0205 or - By mail to: Finnair Plc., Register of shareholders, HEL-AAC/ 502 01053 FINNAIR.
A holder of nominee registered shares is advised to request without delay necessary instruc-tions regarding the registration in the shareholder’s register of the company, the issuing of proxy documents and registration for the general meeting from his/her custodian bank. The account management organization of the custodian bank will register a holder of nominee reg-istered shares, who wants to participate in the general meeting, to be temporarily entered into the shareholders’ register of the company at the latest on Monday 24 March 2014 at 10 a.m.
AGM 2012 –Important dates17 March 2014 Record date 24 March 2014 at 10 am EET Deadline for giving notice of attendance27 March 2014 at 2 pm EET the reception of persons registered to the AGM will commence and at 3 pm EET the AGM will commence
Board of Directors’ proposal on dividend Finnair Plc’s distributable equity amounted to 284,038,140.67 euros on 31 December 2013. The Board of Directors proposes to the Annual General Meeting that no dividend is paid for 2013.
Financial information in 2014In 2014, interim reports will be published as follows:• Q1 on Wednesday 7 May 2014 • Q2 on Friday 15 August 2014 • Q3 on Friday 31 October 2014
Financial report, financial statements and interim reports are published in Finnish and English. The material is available on the company website. Shareholders can subscribe or un-subscribe for the releases at www.finnairgroup.com
Silent periodFinnair’s silent period starts three weeks prior to publishing of its interim financials and four weeks prior to publishing of annual financial results. Finnair will not comment on its business or meet with capital market representatives during that period.
Change of addressShareholders are kindly requested to report changes of address to the custodian of their book- entry account.
Changes in contact informationEuroclear Finland Ltd maintains a list of Company shares and shareholders. Shareholders who wish to make changes to their personal and contact information are kindly asked to contact their own account operator directly. Finnair cannot make these changes.
Assessments regarding Finnair as an investment objectAccording to information held by Finnair, at least the following analysts publish investor analyses of the company: ABG Sundal Collier, Evli Bank, Carnegie Investment Bank, HSBC, Nordea and Pohjola Bank. Finnair does not accept any responsibility for the views or opinions expressed by the analysts.
FINNAIR ANNUAL REPORT 2013
STRATEGY / CUSTOMERS / OPERATIONS / EMPLOYEES / SOCIETY / FINANCE / GOVERNANCE / GRI 167

GLOSSARY
AEA The Association of European Airlines
Carbon Disclosure Project
An international, not-for-profit organization providing a global system for companies and cities to measure, disclose, manage and share vital environmental information.
CASK Cost per available seat kilometre
First Carbon Solutions
First Carbon Solutions (FCS) is an environmental sustainability company that provides consulting, software and data management to businesses and governments
IATA International Air Transport Association, a trade association representing and serving the airline industry worldwide
iENVA The IATA Environmental Assessment (IEnvA) program is an evaluation designed to independently assess and improve the environmental management of an airline
ICAO International Civil Aviation Organization, an agency of the United Nations promoting safe and orderly development of international civil aviation
IOSA The IATA Operational Safety Audit (IOSA) program is an internationally recognized and accepted evaluation system designed to assess the operational management and control systems of an airline
Just Culture Organizational culture aiming at assigning the consequences for an unsafe act in a fair way based on an understanding of an individual’s accountability and responsibilities within the context of the systems and circumstances that the individual was operating
LEED Certificate Leadership in Energy and Environmental Design (LEED) is a set of rating systems for the design, construction, operation, and maintenance of green buildings, homes and neighborhoods
NGO Non-governmental organization
Open Skies Open skies is an international policy concept that calls for the liberalization of the rules and regulations of the international aviation industry—especially commercial aviation—in order to create a free-market environment for the airline industry
RASK Revenue per available seat kilometre
Skytrax Research company that evaluates commercial airlines and their services
STLN Sustainable Travel Leadership Network
UNWTO UN World Tourism Organization
FINNAIR ANNUAL REPORT 2013
STRATEGY / CUSTOMERS / OPERATIONS / EMPLOYEES / SOCIETY / FINANCE / GOVERNANCE / GRI 168

CONTACT INFORMATION
House of Travel and Transportation Finnair Plc Tietotie 9 A (Helsinki Vantaa Airport) 01053 FINNAIR
Tel. 0600 0 81881 (1,25 euro/answered call + normal call charges)
www.finnair.com www.finnairgroup.com
FINNAIR ANNUAL REPORT 2013
STRATEGY / CUSTOMERS / OPERATIONS / EMPLOYEES / SOCIETY / FINANCE / GOVERNANCE / GRI 169