
Using SERVQUAL to Assess the Customer Satisfaction Level
29
Journal of Economics and Public Finance ISSN 2377-1038 (Print) ISSN 2377-1046 (Online) Vol. 2, No. 1, 2016 www.scholink.org/ojs/index.php/jepf 57 Using SERVQUAL to Assess the Customer Satisfaction Level: A Study of an Urban Cooperative Bank Seema Sharma 1* 1 Department of Finance, Sydenham Institute of Management Studies, Research and Entrepreneurship Education (SIMSREE), University of Mumbai, Mumbai, India * Seema Sharma, E-mail: [email protected] Abstract The SERVQUAL instrument was developed in 1988 by Zeithaml, Parasuraman and Berry as a multi-item scale developed to assess customer perceptions of service quality in service industry. Customers judge service quality as low or high depending upon whether the service performance meets their expectation or not. The purpose of this research is to determine the impact of service quality of an urban cooperative bank on its customers and to throw light on the satisfaction level of the customers, so that the managers in the organization can improve the quality of the services rendered. Using SERVQUAL tool, five service quality dimensions using two segments in the form of a questionnaire consisting of 22 questions each have been used for the customers. The result shows that the overall perception of the quality of service provided by the bank under study is within the acceptable limit for the five aspects of service quality measured. Nevertheless, difference between the expectation of excellent service quality and perceived service quality throws light on the need for improvement by bridging the customer service gaps in certain areas of service delivery by the bank. Thus the research intends to add to the limited body of knowledge pertaining to the service quality of the bank under study. Keywords SERVQUAL, customer satisfaction, service quality, customer expectation, perception, service delivery, urban cooperative bank 1. Introduction Service quality and customer satisfaction are the two factors, which influence the purchase intentions in service environment (Taylor & Baker, 1994). Once people have formed an opinion, they often stick to it and inadequately update their beliefs in lieu of new information (Edwards, 1968). Service rendered by the banking sector is of paramount importance. The traditional style of banking is changing and there is more to be offered to the client in the competitive banking world. Better quality of services provided by the bank has a positive influence on satisfaction of its customers and it directly contributes
-
Upload
khangminh22 -
Category
Documents
-
view
0 -
download
0
Transcript of Using SERVQUAL to Assess the Customer Satisfaction Level

Journal of Economics and Public Finance ISSN 2377-1038 (Print) ISSN 2377-1046 (Online)
Vol. 2, No. 1, 2016
www.scholink.org/ojs/index.php/jepf
57
Using SERVQUAL to Assess the Customer Satisfaction Level:
A Study of an Urban Cooperative Bank
Seema Sharma1*
1 Department of Finance, Sydenham Institute of Management Studies, Research and Entrepreneurship
Education (SIMSREE), University of Mumbai, Mumbai, India
* Seema Sharma, E-mail: [email protected]
Abstract
The SERVQUAL instrument was developed in 1988 by Zeithaml, Parasuraman and Berry as a
multi-item scale developed to assess customer perceptions of service quality in service industry.
Customers judge service quality as low or high depending upon whether the service performance meets
their expectation or not. The purpose of this research is to determine the impact of service quality of an
urban cooperative bank on its customers and to throw light on the satisfaction level of the customers,
so that the managers in the organization can improve the quality of the services rendered. Using
SERVQUAL tool, five service quality dimensions using two segments in the form of a questionnaire
consisting of 22 questions each have been used for the customers. The result shows that the overall
perception of the quality of service provided by the bank under study is within the acceptable limit for
the five aspects of service quality measured. Nevertheless, difference between the expectation of
excellent service quality and perceived service quality throws light on the need for improvement by
bridging the customer service gaps in certain areas of service delivery by the bank. Thus the research
intends to add to the limited body of knowledge pertaining to the service quality of the bank under
study.
Keywords
SERVQUAL, customer satisfaction, service quality, customer expectation, perception, service delivery,
urban cooperative bank
1. Introduction
Service quality and customer satisfaction are the two factors, which influence the purchase intentions in
service environment (Taylor & Baker, 1994). Once people have formed an opinion, they often stick to
it and inadequately update their beliefs in lieu of new information (Edwards, 1968). Service rendered
by the banking sector is of paramount importance. The traditional style of banking is changing and
there is more to be offered to the client in the competitive banking world. Better quality of services
provided by the bank has a positive influence on satisfaction of its customers and it directly contributes
www.scholink.org/ojs/index.php/jepf Journal of Economics and Public Finance Vol. 2, No. 1, 2016
58 Published by SCHOLINK INC.
to profitability of banking industry (Ladhari et al., 2011). A service firm has no products, only
interactive processes for the clients to consume (Christian, 1991). Service quality is becoming more
critical for the banks to maintain their market shares (Naceur, Hussein, & Hassan, 2003).
Customer satisfaction and increased perception are the effect of the cognition stored in investor’s
memory, which results in a behaviour manifestation of investment by the investor (Sharma, 2015).
Many banks believe that high customer satisfaction leads to greater customer loyalty (Yi, 1991;
Anderson & Sullivan, 1993; Boulding et al., 1993), which in turn, leads to future revenue (Fornell,
1992; Bolton, 1998). Many organizations (including banks) resort to superior quality, have been found
to be market leaders in terms of sales, long-term customer loyalty and retention (Anderson & Sullivan,
1993; Boulding et al., 1993; Eklo & Westlund, 2002). Examples of such banks include Hongkong &
Shanghai Bank (HSBC), Standard Chartered (StanChart) and Citibank (Munusamy et al., 2010).
Customer expectations are beliefs about a service that serve as standards against which service
performance is judged (Zeithaml et al., 1993), which customers think a service provider should offer,
rather than, on what might be on offer (Parasuraman et al., 1988). According to the service quality
theory (Oliver, 1980), it is predicted that customers will judge that quality as “low” if performance does
not meet their expectations and that as “high” when performance exceeds expectations. Quality spells
superiority or excellence (Taylor & Baker, 1994; Zeithaml, 1988). The behavioral intentions are also
influenced by the standards of service quality (Bitner, 1990; Cronin & Taylor, 1992, 1994; Choi et al.,
2004; Sharma, 2015).
COSMOS Bank is an urban cooperative bank, headquartered in the metropolis of Pune in Maharashtra,
India. Established in 1906, the Cosmos Co-operative Bank Ltd. is the second oldest & second largest
bank urban cooperative bank in India. It has attained multi state scheduled status in 1997. The bank is a
professionally managed financial institution. Financial setup of the bank as on 31/03/2015 is USD 3.70
bn, comprising of deposits of USD 2.17 bn and advances of USD 1.53 bn. Cosmos Bank operates
through 140 branches in India, spread across 7 states and has a presence in 39 major cities across the
country (https://www.cosmosbank.com/about-cosmosbank.html).
The cooperative banks work as a balance center for the ordinary customers and their indebtedness
(Gupta & Jain, 2012). The cooperative system of formal credit delivery has been chronically affected
by lack of transparency, non-adaptation to the members’ needs and loss of credibility (Sharma, 2014).
Urban cooperative banks ranked a very significant position in the Indian banking sector (Anbalgan et
al., 2012). The Urban cooperative banks are enjoying a predominant position in the banking industry
(Gnanasekaran et al., 2012). Cooperative banks are involved in local development and contribute to the
sustainable development of the region situated (Pathak et al., 2012).
SERVQUAL is the most widely used instrument to assess the customer satisfaction level in the service
based industry. Its internal validity and reliability has been well established over the years. The
applicability of SERVQUAL in banking sector has revealed various results. Cronin and Taylor (1992)
have studied that perceived service quality has positive effect on satisfaction of customer in four
www.scholink.org/ojs/index.php/jepf Journal of Economics and Public Finance Vol. 2, No. 1, 2016
59 Published by SCHOLINK INC.
service sectors i.e., dry cleaning, fast food, pest control and banking. Boppana and Nagarjuna (2006)
suggested that performance of banking in terms of profitability, productivity, asset quality and financial
management has become important to study the economy. Dutta and Basak (2008) suggested that
cooperative banks should improve their recovery performance, adopt new system of computerized
monitoring of loans, implement proper prudential norms and organize regular workshops to sustain in
the competitive banking environment.
2. Statement of Problem
Urban cooperative banks are located in urban and semi-urban areas. They started with only simple
banking operations but now their services have increased many folds. These banks provide most
services such as savings and current accounts, safe deposits lockers, loan or mortgages to private and
business customers (Gupta & Jain, 2012). A distinguishing feature of cooperative banking is the fact
that this type of banking principally caters to small business and individuals and serves a niche market
(Datta & Basak, 2008). Decentralised networks and greater flexibility in decision making processes, as
a result of their autonomy, confers upon them the significant privilege to deliver services tailored to
specific local conditions and needs, thus removing various barriers or lack of mutual understanding
during service delivery (Katarachia, 2013). In behavioral finance, service quality and customer
satisfaction have been closely related constructs. Atterassopoules (2003) found that service quality has
a positive influence on customer satisfaction.
In the last two decades, it has been noticed that for the success of any product, customer satisfaction is
very important (Manjappa, Osmane, & Niranjan, 2010). There are no in depth studies conducted in so
far as the customer service delivery and customer satisfaction provided by the urban cooperative banks
is concerned. The present study has been conducted with an objective to identify the gap between the
expectations of the customers of the quality of services ought to be provided by the bank, and their
perceptions of the quality of services actually delivered by the bank.
3. Research Question
This research answers the question as to how satisfied the customers of the COSMOS urban
cooperative bank are with the services provided by the bank. The research finds answer to the
following:
“What is the gap between the customers’ expectations of the service quality provided by the bank and
their perception of the service quality actually delivered by the bank?”
The research uses the SERVQUAL tool to answer the research question and attain the research
objective. The results of this study would help the bank to focus on the performance gaps, if any, which
will enable the management to prescribe and implement initiatives to fill these gaps, thus increasing the
quality of service provided by the bank, achieving increased positive customer perception.
www.scholink.org/ojs/index.php/jepf Journal of Economics and Public Finance Vol. 2, No. 1, 2016
60 Published by SCHOLINK INC.
4. Literature Review
4.1 SERVQUAL Overview
The SERVQUAL instrument was developed by Valerie, Parasuraman and Leonard to study the service
quality. They stated that services, as opposed to goods, are intangible. They are performances and
experiences rather than objects. Services, as opposed to goods are heterogeneous, their performances
often varied from producer to producer, from customer to customer, and from day to day (Zeithaml,
Parasuraman, & Berry, 1990). The SERVQUAL developers did an exploratory study, which consisted
of 12 customer focus group interviews of customers of retail banking, credit card, securities brokerage
and product repair & maintenance industries. They chose these service industries because they felt that
they varied along key attributes used to categorize services, and because they were looking for service
quality insights that would “transcend the boundaries of specific industries”. The focus group
composition was varied in order to ensure that the findings would generalize to a variety of settings.
SERVQUAL developers stated that if a customer has an expectation of what constitutes excellent
service quality before receiving service and the actual service exceeds the expectation, then the
customer will evaluate the service quality as excellent. On the contrary, if the actual service falls short
of the expectation, then the customer will evaluate the service quality as something less than excellent.
They defined service quality, as perceived by customers, as “the extent to discrepancy between
customers’ expectation or desires and their perception”.
The SERVQUAL developers identified ten dimensions from their focus group interview—tangibles,
reliability, responsiveness, competence, courtesy, credibility, security, access, communication and
understanding the customer. There were 97 items corresponding to these 10 dimensions. Each of these
97 items was incorporated into a pair of statements, 22 in number. Thus, SERVQUAL customer
perception tool consisted of 22 statements to ascertain the general expectation of customers and 22
matching statements to measure customers’ assessment of a specific organization within the service
industry. The response to these statements was elicited by way of a 7-point Likert Scale. Difference
between the perception and expectation of the customers was calculated to ascertain the gap. After
various statistical analyses, overlapping items were removed and the remaining items were regrouped
in 5 dimensions. The reliability and validity of these 22 items and 5 dimensions was confirmed
thereafter. These 5 dimensions are:
1) Tangibles—physical facilities, equipment, staff appearance, etc.
2) Reliability—ability to perform service independently and accurately.
3) Responsiveness—willingness to help and respond to customers’ need.
4) Assurance—ability of staff to inspire confidence and trust in customers.
5) Empathy—the extent to which caring individual service is given.
www.scholink.org/ojs/index.php/jepf Journal of Economics and Public Finance Vol. 2, No. 1, 2016
61 Published by SCHOLINK INC.
4.2 Service Quality and Its Impact on Customer Satisfaction
Quality spells superiority or excellence (Taylor & Baker, 1994; Zeithaml, 1988) or as the consumer’s
overall impression of the relative inferiority/superiority of the organization and its services (Bitner &
Hubbert, 1994; Keiningham et al., 1994-1995). Consumer behavioural intentions are also influenced by
the standards of service quality (Bitner, 1990; Cronin & Taylor, 1992, 1994; Choi et al., 2004, Sharma,
2015). A business that caters to the customers’ needs will inevitably gain loyalty of their customers,
thus resulting in repeat business as well as potential referrals (Nabi, 2012). A review of the relevant
literature indicates that service quality is closed tied to customer satisfaction (Wisniewski & Donnelly,
1996; Hernon, Nitecki, & Altman, 1999; Sureschander, Rajendran, & Nitecki, 2002).
Customer satisfaction is defined as “the number of customers or percentage of total customers, whose
reported experience with a firm, its products, or its services (ratings) exceeds specified satisfaction
goals” (Zeithaml, Parasuraman, & Berry, 1990). Many empirical studies have shown that customer
satisfaction secures future revenues (Bolton, 1998; Fornell, 1992), reduces future transaction costs
(Reichheld & Sasser, 1990), decreases price elasticity (Anderson, 1996), and minimizes the likelihood
of customers defecting if quality falters (Anderson & Sullivan, 1993). Fornell (1992) stated that
customer loyalty involves satisfaction, switching barriers and having a voice. Loyal customers are not
necessarily the satisfied customers, but satisfied customers tend to be the loyal customers. Generally,
those ELSS mutual funds, which provide for better after-sales service, are able to attract more investors
and more investments (Sharma, 2015). If customers perceived that they are obtaining additional
benefits from their relationship with establishment employees, their satisfaction level with the service
provider will increase (Beatty et al., 1996).
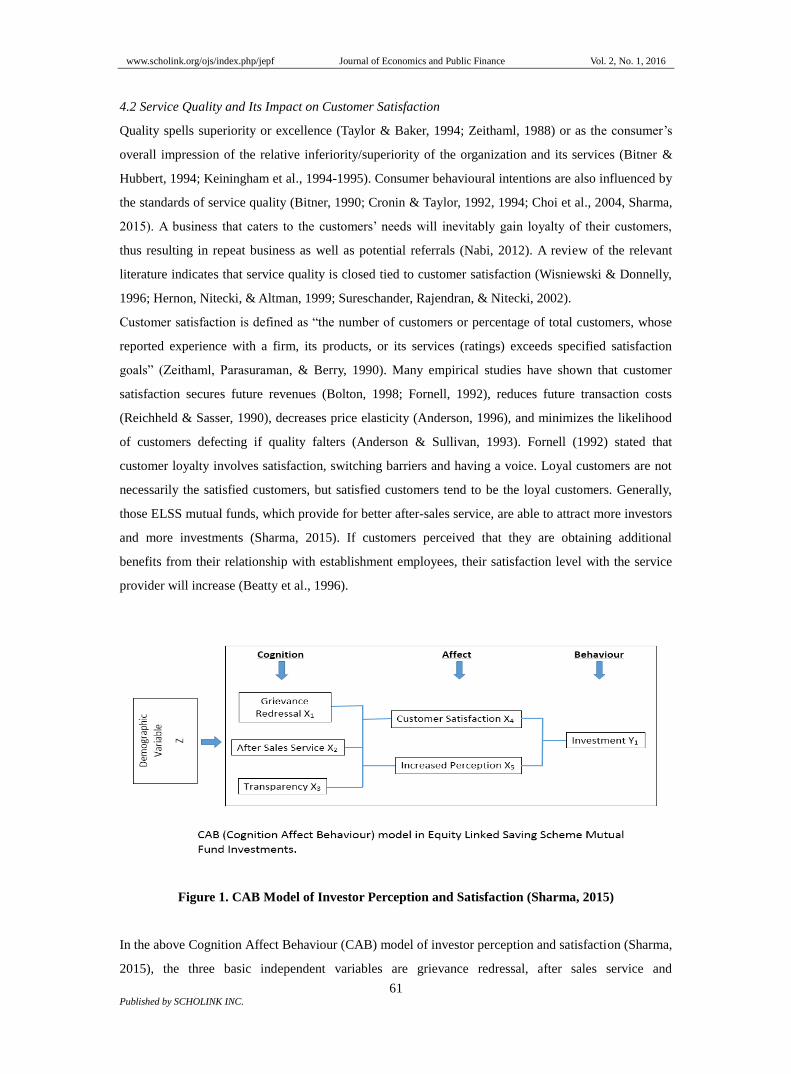
Figure 1. CAB Model of Investor Perception and Satisfaction (Sharma, 2015)
In the above Cognition Affect Behaviour (CAB) model of investor perception and satisfaction (Sharma,
2015), the three basic independent variables are grievance redressal, after sales service and

www.scholink.org/ojs/index.php/jepf Journal of Economics and Public Finance Vol. 2, No. 1, 2016
62 Published by SCHOLINK INC.
transparency, which affect customer satisfaction and increased perception and finally, affect the
investment (the dependent variable). The CAB model goes to show that the willingness of the ELSS
mutual funds to be empathetic to the customer’s needs and to deliver accordingly so as to improve the
service experience at every step, starting from the entry to exit, wins the trust of the investors.
In the private sector, customer satisfaction and loyalty are secured through high quality products and
services. They provide customer value for their money and are seen as being essential for the long-term
survival and success of all organizations (Donnelly, Wisniewski, Dalrymple, & Curry, 1995). Service
quality is both directly and indirectly related to bank loyalty via satisfaction (Bloemer, De Ruyter, &
Peters, 1998). Seema (2014) stated that another factor which has acted as a catalyst in the criticality of
bank-SHG (self-help group) interrelation is the overburdened bank staff, who become irritable because
they struggle to operate rural branches.
In modern banking system maintaining and developing long term customer relationships is essential for
competitive business (Camarero, 2007). SERVQUAL is a well-known research instrument for
evaluating service quality in banking industry. Most of the studies utilized SERVQUAL for evaluating
service quality of banking industry (Arasali et al., 2005; Zhou, 2004; Chi et al., 2003). Satisfaction is a
result of matching actual pre-purchase and consumption experience with the expected reward from the
brand (Nadanasabai, 2011). Keith Hunt defines customer satisfaction as “a comparison of consumer
expectations with perceptions regarding the actual service encounter”.
SERVQUAL is an instrument for measuring customer perceptions of service quality (Parasuraman,
Zeithaml, & Berry, 1988). A number of published studies have also invoked the SERVQUAL
framework (Crompton & Mackay, 1989; Webster, 1989; Woodside, Frey, & Daly, 1989; Johnson,
Dotson, & Dunlap, 1988) and have assessed the scale’s reliability and validity (Babakus & Boller, 1991;
Brensinger & Lambert, 1990; Carman, 1990; Finn & Lamb, 1991). SERVQUAL is the most widely
used and tested general measure of service quality (Bennington & Cummane, 1998). This instrument
has been widely adopted by both managers (Parasuraman et al., 1991) and academics (Babakus &
Boller, 1992; Crompton & MacKay, 1989) to evaluate customer perceptions of service quality for a
variety of services (Marcin et al., 2002). Cronin and Taylor (1992) developed a performance-based
measure of service quality labeled SERPERF with an argument that “performance” rather than
“perception-expectation” determines service quality and provides substantial evidence to show
expectations have little or no impact on the evaluation of consumers, particularly in relation to service
quality. They included the same 22 items of perception as that of SERVQUAL but excluded the items
of expectations.
www.scholink.org/ojs/index.php/jepf Journal of Economics and Public Finance Vol. 2, No. 1, 2016
63 Published by SCHOLINK INC.
5. Methodology
The present research involves the use of customer perception tool SERVQUAL. This tool was applied
to the bank customers in order to identify and assess the extent to which services offered by the bank
under study meet quality standards or customer expectations and to delineate the areas where there is
scope of improvement in the service delivery which would result in increased perception on the part of
customers.
As the bank under study is an urban cooperative bank, the research sample consisted of 200 urban
customers of the bank. Primary data collection was done using facilitated survey method. These
respondents were selected at random from 10 branches of the bank, all situated within the municipal
limits of the metropolis of Pune. Thus, the sample size from each branch was 20. A structured
questionnaire was used by the author, consisting of 22 questions each, adjusted to the 5 service
dimensions of the services evaluated. Before filling in the questionnaire, the respondents were briefed
in detail about the two sets of questionnaire, which they required to fill in. The first set of questions was
used to measure the customers’ expectations of the services offered, and the second set was used to
measure the perception regarding the actual services delivered by the bank. All responses were
attributed on a Likert scale of 7 degrees of intensity, varying from strongly disagree at 1 to strongly
agree at 7. As all respondents were the bank customers, there was no elimination of any respondent’s
survey and all the 200 surveys were found to be usable and valid.
Once the questionnaire was filled, the average score of 200 responses was calculated for both sets of 22
questions. Then, average expectation scores and the average perception scores for 5 dimensions of
tangibles, reliability, responsiveness, assurance and empathy were obtained. For each question, the gap
in the performance (P) and the expectation (E) was reached by using the formula (P)-(E). The average
dimension weight was taken from the individual weight assigned by 200 respondents to each of the 5
dimensions from a total dimension weight of 100 points for all 5 dimensions. The average unweighted
gap score for each dimension was then calculated by dividing the (P)-(E) for each question with the
number of questions used to assess that dimension. Similarly, the weighted gap score for that
dimension was obtained by multiplying the average unweighted gap score for that dimension with the
average dimension weight of that dimension. The data finally obtained in this way was analyzed using
tables, bar charts and other statistical diagrams for data analysis and interpretation.
5.1 SERVQUAL Dimensions—Dimension Weight/Dimension Importance Scores
Though all 5 dimensions of customer service have been found to be important for the customers in the
present study, yet the respondents have given different weights to different dimensions as has been
revealed during the course of analysis of data obtained. During the course of briefing, the respondents
were asked to divide a total of 100 points among the 5 dimensions based on the perceived importance
of these dimensions to them. They were asked to assign highest points to the dimension which they
perceived as the most important to them and least points to the least important dimension in such a way
that the combined total of all 5 dimensions came to be 100. The ranking obtained from the 200

www.scholink.org/ojs/index.php/jepf Journal of Economics and Public Finance Vol. 2, No. 1, 2016
64 Published by SCHOLINK INC.
respondents from most important to least important dimension was as:
1) Reliability
2) Responsiveness
3) Assurance
4) Empathy
5) Tangibles
Table 1. Dimension Weights
Sr. no. Dimension Dimension weights
1. Tangibility 11.75
2. Reliability 40.20
3. Responsiveness 22.40
4. Assurance 13.58
5. Empathy 12.07
Total 100
Figure 2. Dimension Weights
The above table and pie diagram show that the customers attach maximum importance to the reliability
dimension of the customer service by the bank, followed by the responsiveness dimension. Then come
the assurance and empathy, showing that customers rate the actual performance of services in a given
time frame higher than the mere promises or oral assurances of the bank. The tangibility dimension is
rated the last, showing that the appearance, materials and physical facilities are not so important for the
www.scholink.org/ojs/index.php/jepf Journal of Economics and Public Finance Vol. 2, No. 1, 2016
65 Published by SCHOLINK INC.
customers, as long as they get services delivered in a time bound manner, reliably and responsibly.
5.2 The Perception Threshold of Customer Service Satisfaction
Azim (2008) has justified the assumption of 80% perception threshold as the benchmark of customer
satisfaction in his study on the customer service assessment of Shahjalal Islami Bank Limited. He has
based this 80% threshold level on the arguments put forth by Heskett, Sasser and Schlesinger (1997).
Whereas Ferdous has based his view in his study on a private sector bank, the concepts of loyalty,
customer retention and adding new customers apply to the present study of urban cooperative bank too
with equal depth. The gamut of banking services provided by the both types of banks is similar. So, the
present study also assumes 80% perception threshold as the customer satisfaction benchmark.
80% perception threshold would mean a score of minimum 5.6 out of maximum possible score of 7 for
any dimension as well as for the each sub category of the dimension. If the score comes to be less than
5.6, then it is rated as a non-acceptable level of satisfaction for that dimension or that sub category.
6. Results
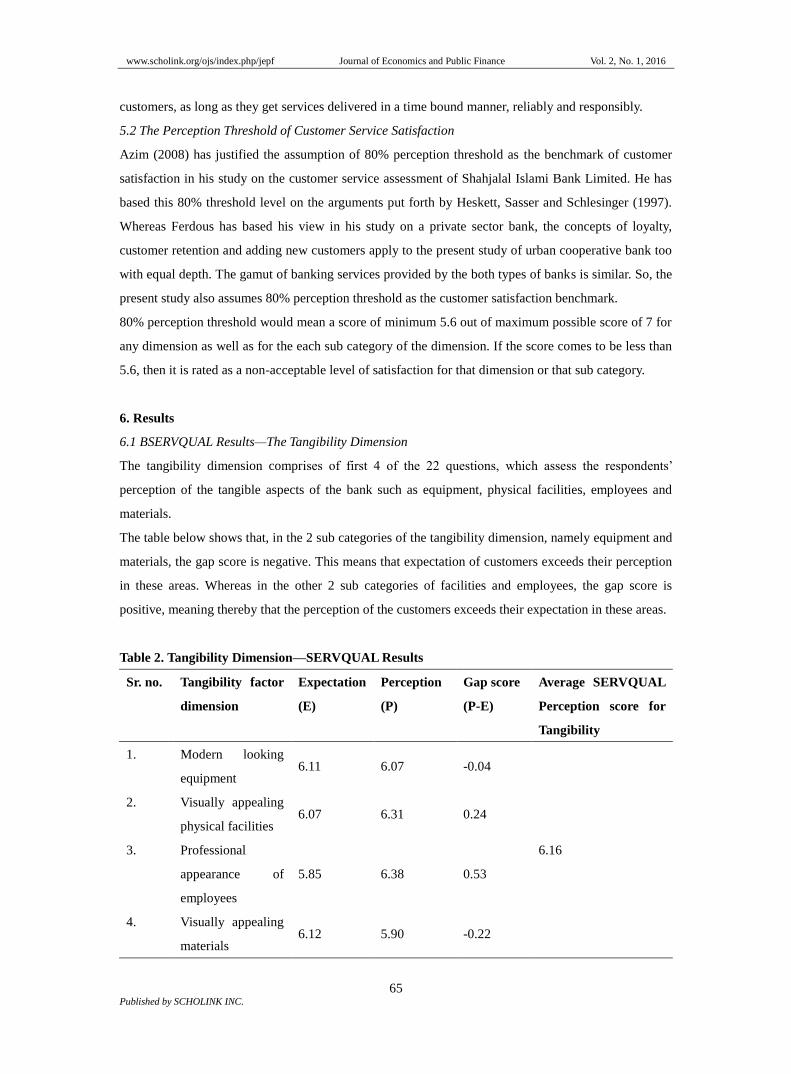
6.1 BSERVQUAL Results—The Tangibility Dimension
The tangibility dimension comprises of first 4 of the 22 questions, which assess the respondents’
perception of the tangible aspects of the bank such as equipment, physical facilities, employees and
materials.
The table below shows that, in the 2 sub categories of the tangibility dimension, namely equipment and
materials, the gap score is negative. This means that expectation of customers exceeds their perception
in these areas. Whereas in the other 2 sub categories of facilities and employees, the gap score is
positive, meaning thereby that the perception of the customers exceeds their expectation in these areas.
Table 2. Tangibility Dimension—SERVQUAL Results
Sr. no. Tangibility factor
dimension
Expectation
(E)
Perception
(P)
Gap score
(P-E)
Average SERVQUAL
Perception score for
Tangibility
1. Modern looking
equipment 6.11 6.07 -0.04
6.16
2. Visually appealing
physical facilities 6.07 6.31 0.24
3. Professional
appearance of
employees
5.85 6.38 0.53
4. Visually appealing
materials 6.12 5.90 -0.22
www.scholink.org/ojs/index.php/jepf Journal of Economics and Public Finance Vol. 2, No. 1, 2016
66 Published by SCHOLINK INC.
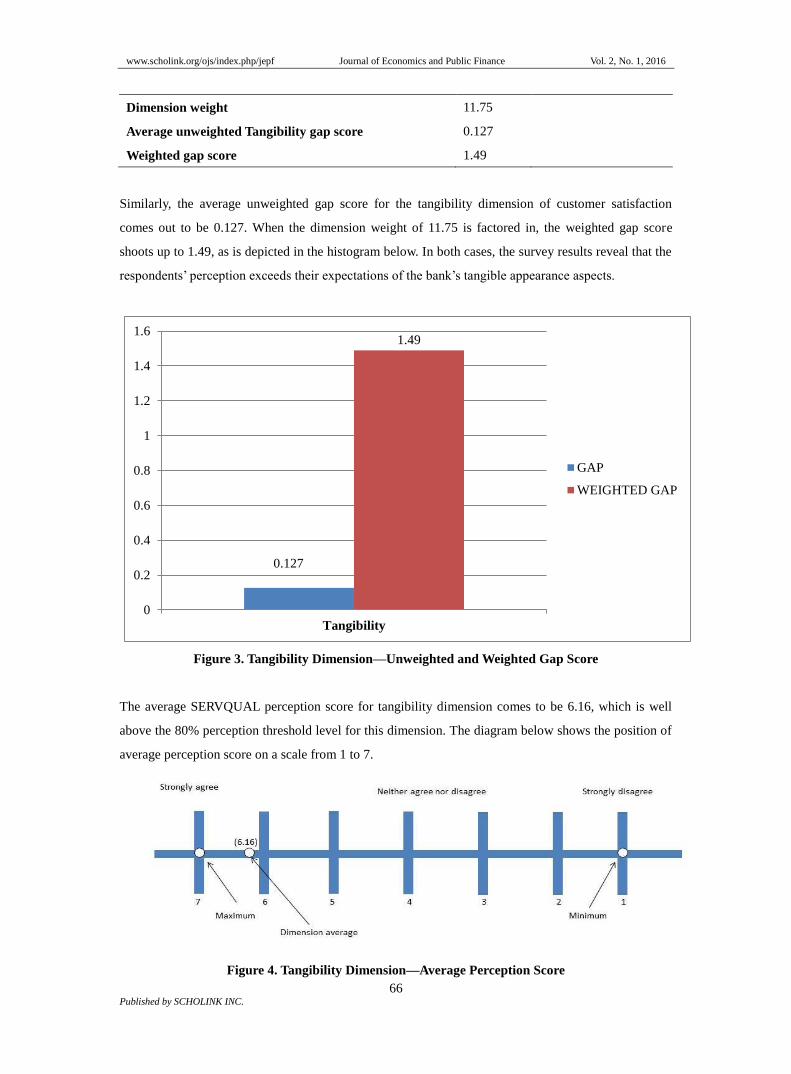
Dimension weight 11.75
Average unweighted Tangibility gap score 0.127
Weighted gap score 1.49
Similarly, the average unweighted gap score for the tangibility dimension of customer satisfaction
comes out to be 0.127. When the dimension weight of 11.75 is factored in, the weighted gap score
shoots up to 1.49, as is depicted in the histogram below. In both cases, the survey results reveal that the
respondents’ perception exceeds their expectations of the bank’s tangible appearance aspects.
0.127
1.49
0
0.2
0.4
0.6
0.8
1
1.2
1.4
1.6
Tangibility
GAP
WEIGHTED GAP
Figure 3. Tangibility Dimension—Unweighted and Weighted Gap Score
The average SERVQUAL perception score for tangibility dimension comes to be 6.16, which is well
above the 80% perception threshold level for this dimension. The diagram below shows the position of
average perception score on a scale from 1 to 7.
Figure 4. Tangibility Dimension—Average Perception Score
www.scholink.org/ojs/index.php/jepf Journal of Economics and Public Finance Vol. 2, No. 1, 2016
67 Published by SCHOLINK INC.
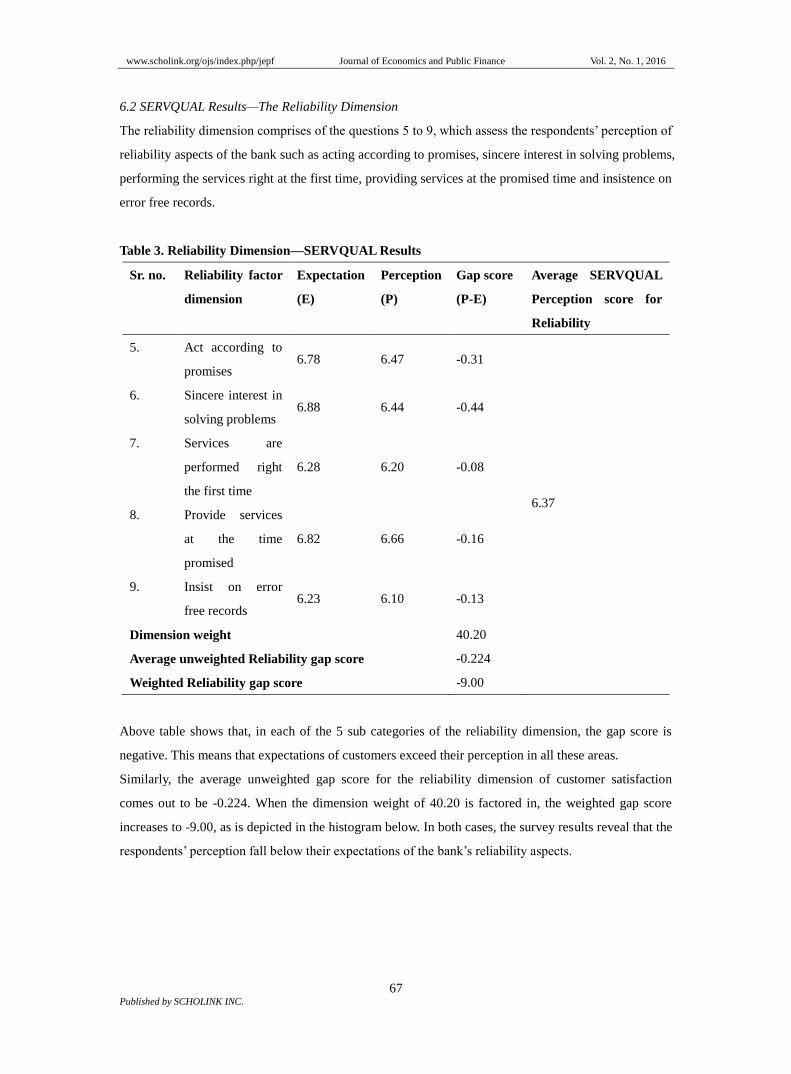
6.2 SERVQUAL Results—The Reliability Dimension
The reliability dimension comprises of the questions 5 to 9, which assess the respondents’ perception of
reliability aspects of the bank such as acting according to promises, sincere interest in solving problems,
performing the services right at the first time, providing services at the promised time and insistence on
error free records.
Table 3. Reliability Dimension—SERVQUAL Results
Sr. no. Reliability factor
dimension
Expectation
(E)
Perception
(P)
Gap score
(P-E)
Average SERVQUAL
Perception score for
Reliability
5. Act according to
promises 6.78 6.47 -0.31
6.37
6. Sincere interest in
solving problems 6.88 6.44 -0.44
7. Services are
performed right
the first time
6.28 6.20 -0.08
8. Provide services
at the time
promised
6.82 6.66 -0.16
9. Insist on error
free records 6.23 6.10 -0.13
Dimension weight 40.20
Average unweighted Reliability gap score -0.224
Weighted Reliability gap score -9.00
Above table shows that, in each of the 5 sub categories of the reliability dimension, the gap score is
negative. This means that expectations of customers exceed their perception in all these areas.
Similarly, the average unweighted gap score for the reliability dimension of customer satisfaction
comes out to be -0.224. When the dimension weight of 40.20 is factored in, the weighted gap score
increases to -9.00, as is depicted in the histogram below. In both cases, the survey results reveal that the
respondents’ perception fall below their expectations of the bank’s reliability aspects.

www.scholink.org/ojs/index.php/jepf Journal of Economics and Public Finance Vol. 2, No. 1, 2016
68 Published by SCHOLINK INC.
Figure 5. Reliability Dimension—Unweighted and Weighted Gap Score
The average SERVQUAL perception score for reliability dimension comes to be 6.37, which is well
above the 80% perception threshold level for this dimension. The diagram below shows the position of
average perception score on a scale from 1 to 7.
Figure 6. Reliability Dimension—Average Perception Score
6.3 SERVQUAL Results—The Responsiveness Dimension
The responsiveness dimension comprises of the questions 10 to 13, which assess the respondents’
perception of the responsiveness aspects of the bank such as informing when services will be
performed, providing prompt services, willingness to help and never too busy to respond to service
requests.

www.scholink.org/ojs/index.php/jepf Journal of Economics and Public Finance Vol. 2, No. 1, 2016
69 Published by SCHOLINK INC.
Table 4. Responsiveness Dimension—SERVQUAL Results
Sr. no. Responsiveness
factor dimension
Expectation
(E)
Perception
(P)
Gap score
(P-E)
Average SERVQUAL
Perception score for
Responsiveness
10. Inform exactly
when services
will be provided
6.01 5.83 -0.18
6.25
11. Provide prompt
services 6.18 6.08 -0.10
12. Always willing to
help 6.26 6.30 0.04
13. Never too busy to
respond to
service requests
6.95 6.82 -0.13
Dimension weight 22.40
Average unweighted Responsiveness gap score -0.09
Weighted Responsiveness gap score -2.02
Above table shows that, in the 3 sub categories of the responsiveness dimension, namely informing
when services will be performed, providing prompt services and never too busy to respond to service
requests, the gap score is negative. This means that expectations of customers exceed their perception
in these areas. Whereas in the 4th sub category of willingness to help, the gap score is positive,
meaning thereby that the perception of the customers exceeds their expectation in this area.
Similarly, the average unweighted gap score for the responsiveness dimension of customer satisfaction
comes out to be -0.09. When the dimension weight of 22.40 is factored in, the weighted gap score
jumps to -2.02, as is depicted in the histogram below. In both cases, the survey results reveal that the
respondents’ perception exceeds their expectations of the bank’s responsiveness aspects.

www.scholink.org/ojs/index.php/jepf Journal of Economics and Public Finance Vol. 2, No. 1, 2016
70 Published by SCHOLINK INC.
Figure 7. Responsiveness Dimension—Unweighted and Weighted Gap Score
The average SERVQUAL perception score for responsiveness dimension comes to be 6.25, which is
well above the 80% perception threshold level for this dimension. The diagram below shows the
position of average perception score on a scale from 1 to 7.
Figure 8. Responsiveness dimension—Average Perception Score
6.4 SERVQUAL Results—The Assurance Dimension
The assurance dimension comprises of the questions 14 to 17, which assess the respondents’ perception
of assurance aspects of the bank such as employee behaviour instills confidence, customers’ feeling of
security in transactions, courteous employees and knowledge of employees to answer questions.

www.scholink.org/ojs/index.php/jepf Journal of Economics and Public Finance Vol. 2, No. 1, 2016
71 Published by SCHOLINK INC.
Table 5. Assurance Dimension—SERVQUAL Results
Sr. no. Assurance factor
dimension
Expectation
(E)
Perception
(P)
Gap score
(P-E)
Average SERVQUAL
Perception score for
Assurance
14. Employee behavior
instills confidence 6.00 5.70 -0.30
6.03
15. Customers feel
secure in their
transactions
6.58 6.31 -0.27
16. Employees are
consistently
courteous
5.86 6.04 0.18
17. Employee have the
knowledge to
answer questions
6.39 6.07 -0.32
Dimension weight 13.58
Average unweighted Assurance gap score -0.18
Weighted Assurance gap score -2.44
Above table shows that, in the 3 sub categories of the assurance dimension, namely employee
behaviour instills confidence, customers’ feeling of security in transactions and knowledge of
employees to answer questions, the gap score is negative. This means that expectations of customers
exceed their perception in these areas. Whereas in the 4th sub category of courteous employees, the gap
score is positive, meaning thereby that the perception of the customers exceeds their expectation in this
area.
Similarly, the average unweighted gap score for the assurance dimension of customer satisfaction
comes out to be -0.18. When the dimension weight of 13.58 is factored in, the weighted gap score rises
to -2.44, as is depicted in the histogram below. In both cases, the survey results reveal that the
respondents’ perception exceeds their expectations of the bank’s responsiveness aspects.

www.scholink.org/ojs/index.php/jepf Journal of Economics and Public Finance Vol. 2, No. 1, 2016
72 Published by SCHOLINK INC.
Figure 9. Assurance Dimension—Unweighted and Weighted Gap Score
The average SERVQUAL perception score for assurance dimension comes to be 6.03, which is well
above the 80% perception threshold level for this dimension. The diagram below shows the position of
average perception score on a scale from 1 to 7.
Figure 10. Assurance Dimension—Average Perception Score
6.5 SERVQUAL Results—The Empathy Dimension
The empathy dimension comprises of the questions 18 to 22, which assess the respondents’ perception
of empathy aspects of the bank such as individual attention, convenient working hours, personal
attention, has the best interest of customers at heart and employees understanding the customers’ needs.
The table shows that, in each of the 5 sub categories of the empathy dimension, the gap score is
negative. This means that expectations of customers exceed their perception in all these areas.

www.scholink.org/ojs/index.php/jepf Journal of Economics and Public Finance Vol. 2, No. 1, 2016
73 Published by SCHOLINK INC.
Table 6. Empathy Dimension—SERVQUAL Results
Sr. no. Empathy factor
dimension
Expectation
(E)
Perception
(P)
Gap score
(P-E)
Average SERVQUAL
Perception score for
Empathy
18. Provides
individual
attention
5.91 5.76 -0.15
5.74
19. Has convenient
operating hours 5.87 5.58 -0.29
20. Employees
provide personal
attention
5.75 5.29 -0.46
21. Has the best
interest of the
customers at
heart
6.06 5.96 -0.10
22. Employees
understand the
needs of their
customers
6.28 6.11 -0.17
Dimension weight 12.07
Average unweighted Empathy gap score -0.234
Weighted Empathy gap score -2.82
Similarly, the average unweighted gap score for the empathy dimension of customer satisfaction comes
out to be -0.234. When the dimension weight of 12.07 is factored in, the weighted gap score jumps to
-2.82, as is depicted in the histogram below. In both cases, the survey results reveal that the
respondents’ perception fall below their expectations of the bank’s reliability aspects.

www.scholink.org/ojs/index.php/jepf Journal of Economics and Public Finance Vol. 2, No. 1, 2016
74 Published by SCHOLINK INC.
Figure 11. Empathy Dimension—Unweighted and Weighted Gap Score
The average SERVQUAL perception score for empathy dimension comes to be 5.74, which is little
above the 80% perception threshold level for this dimension. The diagram below shows the position of
average perception score on a scale from 1to 7.
Figure 12. Empathy Dimension—Average Perception Score
6.6 SERVQUAL Results—Quantitative Findings by Dimensions
Table 7. Average Perception Scores of 5 Dimensions
Sr. no. Dimension Maximum possible score Average SERVQUAL
Perception (P) score
1. Tangibility 7 6.16
2. Reliability 7 6.37
www.scholink.org/ojs/index.php/jepf Journal of Economics and Public Finance Vol. 2, No. 1, 2016
75 Published by SCHOLINK INC.
3. Responsiveness 7 6.25
4. Assurance 7 6.03
5. Empathy 7 5.74
80% threshold score 5.60
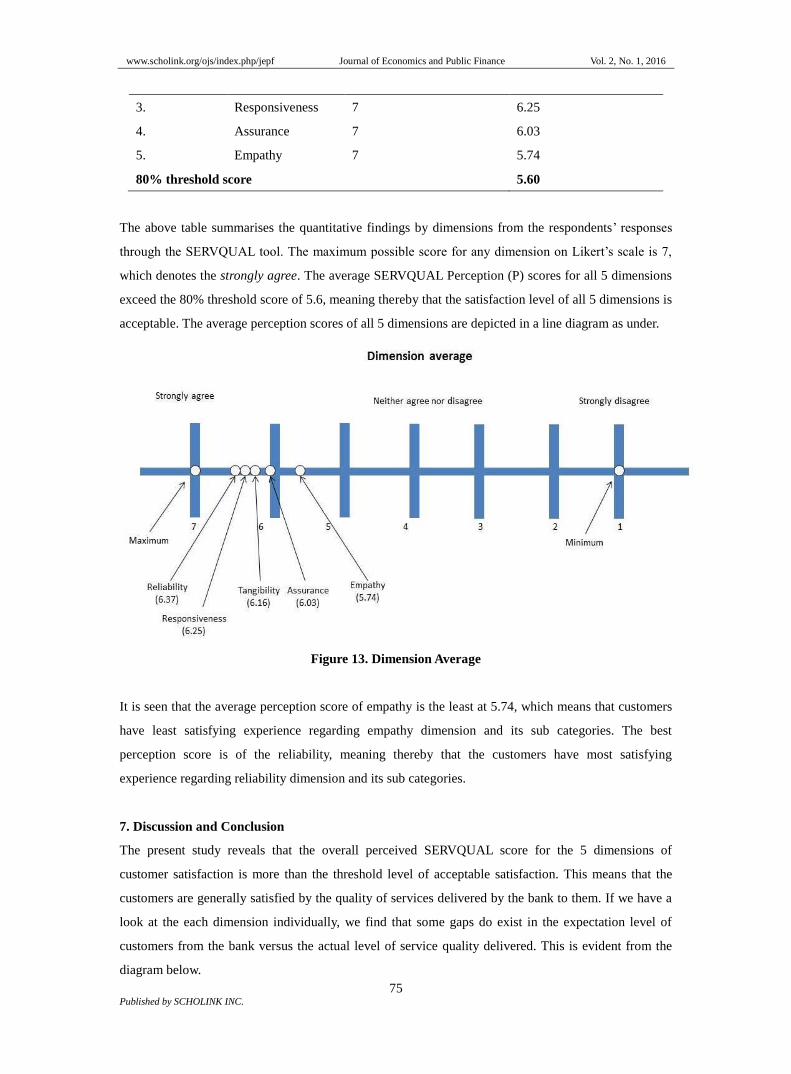
The above table summarises the quantitative findings by dimensions from the respondents’ responses
through the SERVQUAL tool. The maximum possible score for any dimension on Likert’s scale is 7,
which denotes the strongly agree. The average SERVQUAL Perception (P) scores for all 5 dimensions
exceed the 80% threshold score of 5.6, meaning thereby that the satisfaction level of all 5 dimensions is
acceptable. The average perception scores of all 5 dimensions are depicted in a line diagram as under.
Figure 13. Dimension Average
It is seen that the average perception score of empathy is the least at 5.74, which means that customers
have least satisfying experience regarding empathy dimension and its sub categories. The best
perception score is of the reliability, meaning thereby that the customers have most satisfying
experience regarding reliability dimension and its sub categories.
7. Discussion and Conclusion
The present study reveals that the overall perceived SERVQUAL score for the 5 dimensions of
customer satisfaction is more than the threshold level of acceptable satisfaction. This means that the
customers are generally satisfied by the quality of services delivered by the bank to them. If we have a
look at the each dimension individually, we find that some gaps do exist in the expectation level of
customers from the bank versus the actual level of service quality delivered. This is evident from the
diagram below.
www.scholink.org/ojs/index.php/jepf Journal of Economics and Public Finance Vol. 2, No. 1, 2016
76 Published by SCHOLINK INC.
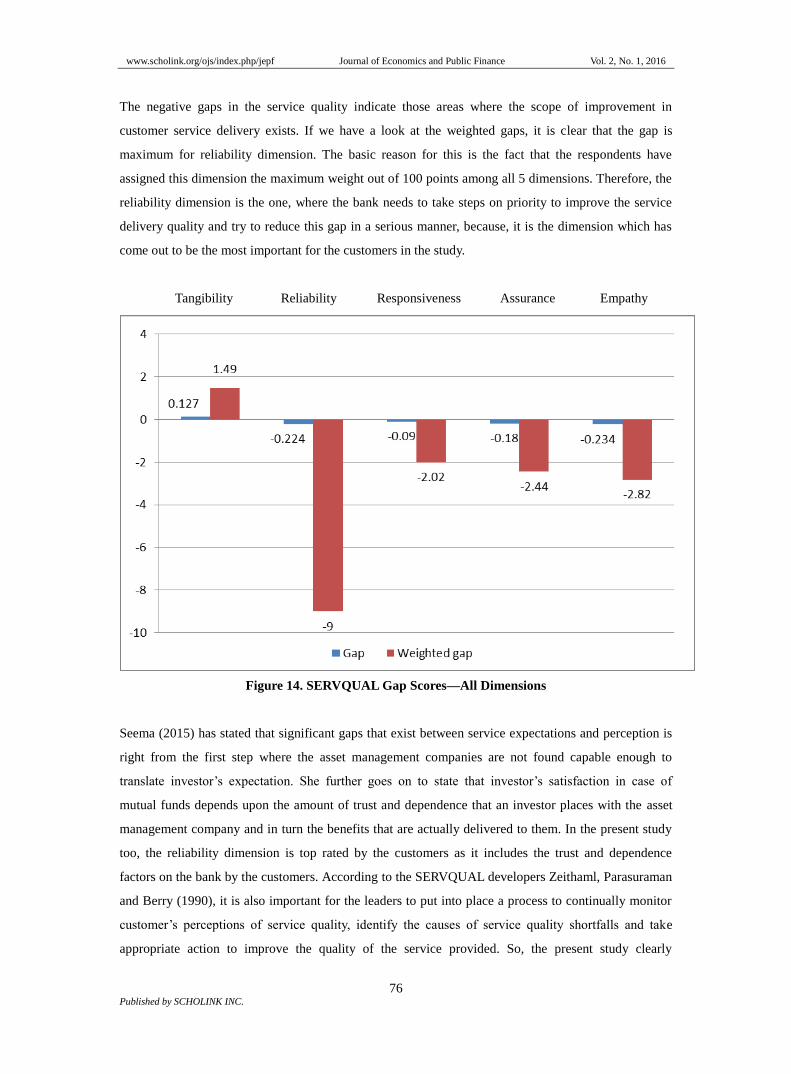
The negative gaps in the service quality indicate those areas where the scope of improvement in
customer service delivery exists. If we have a look at the weighted gaps, it is clear that the gap is
maximum for reliability dimension. The basic reason for this is the fact that the respondents have
assigned this dimension the maximum weight out of 100 points among all 5 dimensions. Therefore, the
reliability dimension is the one, where the bank needs to take steps on priority to improve the service
delivery quality and try to reduce this gap in a serious manner, because, it is the dimension which has
come out to be the most important for the customers in the study.
Tangibility Reliability Responsiveness Assurance Empathy
Figure 14. SERVQUAL Gap Scores—All Dimensions
Seema (2015) has stated that significant gaps that exist between service expectations and perception is
right from the first step where the asset management companies are not found capable enough to
translate investor’s expectation. She further goes on to state that investor’s satisfaction in case of
mutual funds depends upon the amount of trust and dependence that an investor places with the asset
management company and in turn the benefits that are actually delivered to them. In the present study
too, the reliability dimension is top rated by the customers as it includes the trust and dependence
factors on the bank by the customers. According to the SERVQUAL developers Zeithaml, Parasuraman
and Berry (1990), it is also important for the leaders to put into place a process to continually monitor
customer’s perceptions of service quality, identify the causes of service quality shortfalls and take
appropriate action to improve the quality of the service provided. So, the present study clearly

www.scholink.org/ojs/index.php/jepf Journal of Economics and Public Finance Vol. 2, No. 1, 2016
77 Published by SCHOLINK INC.
identifies such areas, out of the 22 sub categories of the 5 dimensions, where the perceived gap is
higher than the average gap. The following table shows all these 22 sub categories.
Table 8. Gap Score of 22 Sub Categories
Sr. Statement Gap Remarks
1. Tangibility—Equipment -0.04 Fails to match customers’ expectations
2. Tangibility—Physical facilities 0.24 Exceeds customers’ expectations
3. Tangibility—Employees 0.53 Exceeds customers’ expectations
4. Tangibility—Materials -0.22 Fails to match customers’ expectations
5. Reliability—Acts according to promise -0.31 Fails to match customers’ expectations
6. Reliability—Sincere interest in solving
problems
-0.44 Fails to match customers’ expectations
7. Reliability—Performs service right the
first time
-0.08 Fails to match customers’ expectations
8. Reliability—Provides service at
promised time
-0.16 Fails to match customers’ expectations
9. Reliability—Error free records -0.13 Fails to match customers’ expectations
10. Responsiveness—Employees tell
exactly when services will be performed
-0.18 Fails to match customers’ expectations
11. Responsiveness—Employees give
prompt service
-0.10 Fails to match customers’ expectations
12. Responsiveness—Employees willing to
help
0.04 Exceeds customers’ expectations
13. Responsiveness—Employees never too
busy to respond to customers’ requests
-0.13 Fails to match customers’ expectations
14. Assurance—Employees’ behaviour
instills confidence
-0.30 Fails to match customers’ expectations
15. Assurance—Customers feel safe in
transactions
-0.27 Fails to match customers’ expectations
16. Assurance—Consistently courteous
employees
0.18 Exceeds customers’ expectations
17. Assurance—Employees have knowledge
to answer questions
-0.32 Fails to match customers’ expectations
18. Empathy—Provides individual attention -0.15 Fails to match customers’ expectations
19. Empathy—Convenient operating hours -0.29 Fails to match customers’ expectations
20. Empathy—Employees provide personal -0.46 Fails to match customers’ expectations

www.scholink.org/ojs/index.php/jepf Journal of Economics and Public Finance Vol. 2, No. 1, 2016
78 Published by SCHOLINK INC.
attention
21. Empathy—Has the best interest of
customers at heart
-0.10 Fails to match customers’ expectations
22. Empathy—Employees understand
customers’ needs
-0.17 Fails to match customers’ expectations
Thus, it is evident that the performance of bank on service delivery and customer satisfaction exceeds
the expectations of the customers in only 3 areas—physical facilities, appearance of employees and
willingness of employees to help customers. In remaining 19 areas, the bank’s performance has been
found lacking vis-à-vis what customers expect in terms of service delivery. Therefore, these are the
areas identified by the present study wherein the bank will have to take corrective action to obtain a
higher level of customer perception towards service quality compared to the expected.
Hence, it can be concluded that the application of SERVQUAL customer perception instrument and the
detailed analysis of the results in case of the COSMOS bank have revealed that the overall perception
of the service quality and customer satisfaction delivered by the bank is acceptable for all 5 dimensions
of service quality. Further, the analysis of difference between the expectation of excellent service
delivery and perceived service quality has revealed a scope for improvement in all but 4 areas. Taking
into consideration the dimension weight and weighted gap scores in case of 5 dimensions, the areas
which require the most effort from the bank are found to be responsiveness, reliability, empathy and
assurance.
8. Recommendations
Sharma (2015) has suggested that service quality and customer satisfaction have been conceptualized
as a distinct, but closely related constructs. There is a positive relationship between the two constructs.
In this background, the present study tries to provide the bank with a framework for moving forward to
achieve its commitment of improved service delivery and customer satisfaction. The present study
recommends the following action to be taken by the bank so as to increase service quality and customer
satisfaction.
8.1 Immediate Intervention
This would require the bank to take urgent and immediate steps in those areas of service delivery,
where the SERVQUAL perception gap is found to be more than 20 basis points. These areas are
tabulated as under.

www.scholink.org/ojs/index.php/jepf Journal of Economics and Public Finance Vol. 2, No. 1, 2016
79 Published by SCHOLINK INC.
Table 9. Intervention Areas for Immediate Attention
Sr. Action area Gap
20. Empathy—Employees provide personal attention -0.46
6. Reliability—Sincere interest in solving problems -0.44
17. Assurance—Employees have knowledge to answer questions -0.32
5. Reliability—Acts according to promise -0.31
14. Assurance—Employees’ behaviour instills confidence -0.30
19. Empathy—Convenient operating hours -0.29
15. Assurance—Customers feel safe in transactions -0.27
4. Tangibility—Materials -0.22
For some of the other areas, like materials, it is easy to intervene and bring about immediate changes to
meet up any shortage in physical facilities such as provisions of chairs and drinking water in waiting
areas, ample numbers of forms, filling up the employee vacancies, provision of parking space etc. But
for areas related to personal attention, sincere interest in problem solving, employee behaviour
instilling confidence and safety feeling in transactions, the intervention would be required in the terms
of sensitivity and behavioral training for the employees. For the areas like knowledge of employees, the
subject training would be required, along with the refresher courses on core banking operations for the
capacity building of the employees. For the operating hours, the bank would need to have a relook at its
working hours policy on weekends and long public holidays, with a specific emphasis on after office
hours banking facilities. This is important as the bank should be welcoming to the investor all the time
and respect investor’s choice with all energy and enthusiasm (Sharma, 2015).
8.2 Medium Term Intervention
The study suggests and recommends medium term intervention strategy in those areas of service
delivery, where the SERVQUAL perception gap is found to be more than 10 but less than 20 basis
points. These areas may not require urgent attention because the bank’s performance in service delivery
and customer satisfaction in these areas is not as bad vis-à-vis the areas identified for immediate
intervention. Such areas are shown below.
Table 10. Intervention Areas for Medium Term Attention
Sr. Action area Gap
9. Reliability—Error free records -0.13
13. Responsiveness—Employees never too busy to respond to
customers’ requests
-0.13
18. Empathy—Provides individual attention -0.15
8. Reliability—Provides service at promised time -0.16
www.scholink.org/ojs/index.php/jepf Journal of Economics and Public Finance Vol. 2, No. 1, 2016
80 Published by SCHOLINK INC.
22. Empathy—Employees understand customers’ needs -0.17
10. Responsiveness—Employees tell exactly when services will be
performed
-0.18
For areas such as error free records, the bank should utilize IT tools to maintain better records and data
management, which is relatively easier to achieve. But for areas related to responsiveness dimension,
individual attention, understanding customers’ needs, the intervention would be required in the terms of
sensitivity and behavioral training for the employees. But this would also require the support from the
bank management in terms of realistic targets, so that employees find some time to cater to the
responsiveness and empathy needs of the customers. For providing services at promised time, training
in productive time management and speedy disposal would be required, along with the refresher
courses on core banking operations for the capacity building of the employees. Grievance redressal
increases the perception either on positive or the negative side (Sharma, 2015), so the bank should take
care to address the customer issues in such a way, so as to achieve the increases perception by the
customers.
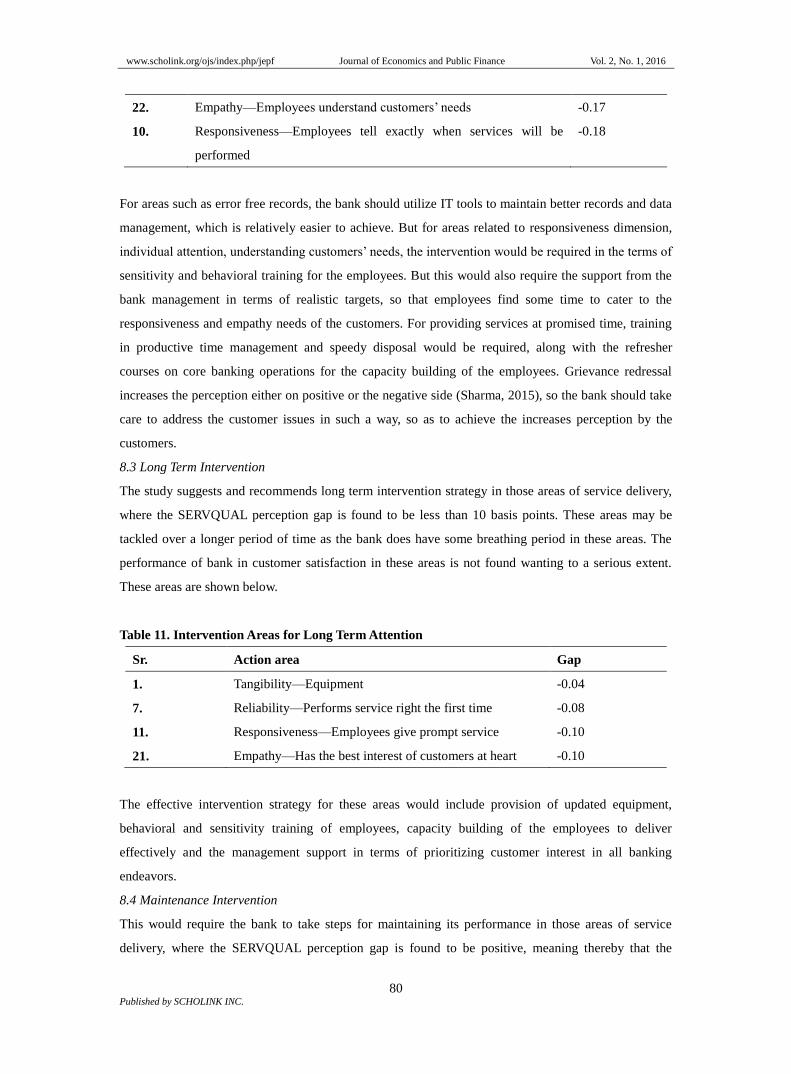
8.3 Long Term Intervention
The study suggests and recommends long term intervention strategy in those areas of service delivery,
where the SERVQUAL perception gap is found to be less than 10 basis points. These areas may be
tackled over a longer period of time as the bank does have some breathing period in these areas. The
performance of bank in customer satisfaction in these areas is not found wanting to a serious extent.
These areas are shown below.
Table 11. Intervention Areas for Long Term Attention
Sr. Action area Gap
1. Tangibility—Equipment -0.04
7. Reliability—Performs service right the first time -0.08
11. Responsiveness—Employees give prompt service -0.10
21. Empathy—Has the best interest of customers at heart -0.10
The effective intervention strategy for these areas would include provision of updated equipment,
behavioral and sensitivity training of employees, capacity building of the employees to deliver
effectively and the management support in terms of prioritizing customer interest in all banking
endeavors.
8.4 Maintenance Intervention
This would require the bank to take steps for maintaining its performance in those areas of service
delivery, where the SERVQUAL perception gap is found to be positive, meaning thereby that the

www.scholink.org/ojs/index.php/jepf Journal of Economics and Public Finance Vol. 2, No. 1, 2016
81 Published by SCHOLINK INC.
customer experience exceeds the expectation. These areas are tabulated as under.
Table 12. Intervention Areas for Maintenance of Service Delivery Standards
Sr. Action area Gap
3. Tangibility—Employees 0.53
2. Tangibility—Physical facilities 0.24
16. Assurance—Consistently courteous employees 0.18
12. Responsiveness—Employees willing to help 0.04
The bank seems to have taken efforts to inculcate the courteousness in its employees, even better than
what an ordinary customer would expect, they are found to be always willing to help, are presentable in
terms of their physical appearance. All the 10 branches of the bank studied for this research were found
to be visually appealing and pleasant to the respondents. Nevertheless, the management must not be lax
in its efforts to maintain the high service delivery standards in these areas, else it wouldn’t be long
before the customer perception gaps creep in and pull down the standards.
9. Managerial Implications
The findings of the study on primary data worked upon by the SERVQUAL tool has brought out
number of managerial implications for the banking industry at large and the urban cooperative bank,
under study, in particular. Considering that grievance redressal has effect on customer satisfaction and
the perception, it becomes imperative that the bank should treat the customers fairly all the time. The
service requirements and issues raised by the customers should be dealt with courtesy and in time, so as
to obtain an increase in positive perception about the bank. The bank has to build up the procedures and
train its employees so as to build and sustain a healthy and long-term relationship with the customers.
The ordinary customers are usually burdened with banking procedures and paper work, so, a little help
from the bank will go a long way in putting them at ease and gain their confidence for.
10. Limitations of the Study and Scope for Further Study
The present research limits itself to the application of SERVQUAL tool to assess and achieve the
research objective. Hence, it becomes obvious that any limitations of the tool itself are reflected in the
present study too. One of the issues with the SERVQUAL based studies is that the customer
expectations and perception can be compared only after the service is actually delivered, but the
expectations are formed much before the actual service delivery, thereby causing a loss of reliability of
the tool to some extent (Palmer, 2005). Further, the service expectations of customers are usually based
on previous service experiences. So, it is a possibility that the expectations change with every instance
of service delivery, affecting the perception too. Thus, a scenario appears, in which, for the same

www.scholink.org/ojs/index.php/jepf Journal of Economics and Public Finance Vol. 2, No. 1, 2016
82 Published by SCHOLINK INC.
service, customers have different levels of expectations and perception for every instance of delivery of
the same service (Oh, 1999). This results in a loss of internal validity for the tool over a period of time.
The SERVQUAL model only aims to measure the functional aspect of service process and does not
recognize the technical aspect of service delivery as an important part of the entire service process
(Lenka et al., 2009).
The present study is confined to only one urban cooperative bank, it can be made broad spectrum by
taking more number of variables into account. One of the ways to do so would be to consider
demographic variables for grouping the respondents and then find out the results for comparison. Also,
the study can be broadened to a comparative research involving other nationalized, private and rural
cooperative banks. The further studies on the subject may be used to develop a charter of customer
rights at the level of banks, as well as the service delivery institutions. As the present study is based
purely upon customers as respondents data, there is further scope to undertake the study with primary
data based on structured questionnaire designed for both the banks and the customers. Further, banks
and other financial institutions can be brought under the study to have more representative inferences.
References
Anderson, E. W., & Sullivan, M. W. (1993). The antecedents and consequences of customer satisfaction
for firms. Marketing Science, 12, 125-143.
Anderson, E. W. (1996). Customer satisfaction and price tolerance. Marketing Lett., 7(3), 19-30.
Athanassopoulos et al. (2003). Assessing the effects of multiple transaction points on the perceived
overall performance of the provider. Production and Operation Management, 12(2), 224-245.
Babakus, E., & Boller, G. W. (1992). An empirical assessment of the SERVQUAL scale. Journal of
Business Research, 24(3), 253-268.
Bennington, L., & Cummane, J. (1998). Measuring service quality: A hybrid methodology. Total
Quality Management, 9(6), 395-406.
Bloemer, J., De Ruyter, K., & Peters, P. (1998). Investigating drivers of bank loyalty: The complex
relationship between image, service quality and satisfaction. International Journal of Bank
Marketing, 16(7), 276-286.
Bolton, R. N. (1998). A dynamic model of the duration of the customer’s relationship with a continuous
service provider: The role of customer satisfaction. Marketing Science, 17(1), 45-65.
Camarero, C. (2007). Relationship orientation or service quality? What is the trigger of performance in
financial and insurance services? International Journal of Bank Marketing, 25, 406-426.
Carman, J. M. (1990). Consumer perception of service quality: An assessment of the SERVQUAL
dimensions. Journal of Retailing, 66(1), 33-52.
Chi, C. C., Lewis, B. R., & Park, W. (2003). Service quality measurement in the banking sector in
South Korea. International Journal of Bank Marketing, 21, 191-201.
Choi, K.-S. et al. (2004). The relationships among quality, value, satisfaction and behavioural intention

www.scholink.org/ojs/index.php/jepf Journal of Economics and Public Finance Vol. 2, No. 1, 2016
83 Published by SCHOLINK INC.
in health care provider choice. Journal of Business Research, 57, 913-921.
Crompton, J. L., & McKay, K. J. (1989). Users’ perceptions of the relative importance of service
quality dimensions in selected public recreation programs. Leisure Sciences, 11, 367-375.
Cronin, J. J., & Taylor, S. A. (1992). Measuring service quality: A re-examination and extension.
Journal of Marketing, 56, 55-68.
Donnelly, M., Wisniewski, M., Dalrymple, J., & Curry, A. (1995). Measuring service quality in local
government: The SERVQUAL approach. International Journal of Public Sector Management,
8(7).
Dutta, U., & Basak, A. (2008). Appraisal of financial performance of urban cooperative banks—A case
study. The Management Accountant, Case Study, 172-174.
Edwards, W. (1968). Conservatism in human information, processing. In B. Klienmutz (Ed.), Formal
Representation of Human Judgments (pp. 17-52). New York: Wiley.
Eklof, J., & Westlund, A. H. (2002). The pan-European customer satisfaction index
programme—Current work and the way ahead. Total Quality Management, 13(8), 1099-1106.
Farris, P. W., Bendle, N. T., Pfeifer, P., & Reibstein, D. I. (2010). Marketing matrix: The definitive
guide to measuring market performance. The Marketing Accountability Standards Board (MASB).
Ferdous, A. (2008). Assessing customer satisfaction of Shahjlal Islami Bank (Keraniganj Branch),
Retrieved from http://www.scribd.com/doc/53660885/40/Calculation-of-Unweighted-
SERVQUAL-Score
Finn, D. W., & Lamb, C. W. (1991). An evaluation of the SERVQUAL scales in a retailing setting.
Advances in Consumer Researches, 18, 483-490.
Fornell, C. (1992). A national customer satisfaction barometer: The Swedish experience. Journal of
Marketing, 56, 6-21.
Gnanasekaran, E., Anabalgan, M., & Nazar, N. (2012), A study on the urban cooperative bank’s success
and growth in Vellore District—Statistical analysis. International Journal of Advanced Research
in Computer Science and Software Engineering, 2(3), 434-437.
Gronroos, C. (1991). The marketing strategy continuum: Towards a marketing concept for the 1990s.
Management Decision, 29(1).
Gupta, J., & Jain, S. (2012). A study on cooperative banks in India with special reference to lending
practices. International Journal of Scientific and Research Publication, 2(10), 1-6.
Hernon, P., & Nitecki, D. A. (1999). Service quality and customer satisfaction: An assessment and
future directions. Journal of Academic Librarianship, 9-17.
Heskert, J. L., Sasser, W. E., & Schlesinger L. A. (1997). The service profit chain. New York, NY: The
Free Press. Retrieved from https://www.cosmosbank.com/about-cosmosbank.html
Hunt, K. (1991). Customer loyalty, dissatisfaction and complaining behavior. Journal of Social Issues,
47(1), 109-110.
Katarachia, A. (2013). Measuring service quality and satisfaction in Greek cooperation banking: An
www.scholink.org/ojs/index.php/jepf Journal of Economics and Public Finance Vol. 2, No. 1, 2016
84 Published by SCHOLINK INC.
exploratory study. Satisfaction with Cooperation Banking, 26, 55-75.
Ladhari et al. (2011). Bank service quality: Comparing Canadian and Tunisian customer perceptions.
International Journal of Bank Marketing, 29, 224-246.
Lenka, U., Suar, D., & Mohapatra, K. J. (2009). Service quality, customer satisfaction, and customer
loyalty in Indian commercial banks. Journal of Entrepreneurship, 18, 47-64.
Manjappa, D. H., Osmane, & Niranjan, R. (2010). Determinants of investment pattern in Indian
manufacturing industries—A panel data study. Indian Journal of Economics & Business, 9(1),
25-30.
Munusamy, J., Chelliah, S., & Mun, W. H. (2010). Service quality delivery and its impact on customer
satisfaction in the banking sector in Malaysia. International Journal of Innovation, Management
and Technology, 1(4), 398-404.
Nabi, N. (2012). Customer expectations of service quality: A study on private banks of Bangladesh.
World Review of Business Research, 2, 172-186.
Nadanasabai, R. (2011). A study on the impact of customer relationship management on customer
loyalty with special reference to cellular operators in Chennai city (Unpublished thesis). School of
Management Studies, Jawaharlal Nehru Technological University, Hyderabad.
Oh, H. (1999). Service quality, customer satisfaction, and customer value: A holistic perspective.
International Journal of Hospitality Management, 18(1), 67-82.
Oliver, R. (1980). A cognitive model of the antecedents and consequences of satisfaction decisions.
Journal of Marketing, 17(10), 460-469.
Palmer, A. (2005). Principles of service marketing. London: The McGraw-Hill Companies.
Pont, M., & McQuilken, L. (2002). Testing the fit of the BANKPERF data. Conference Proceedings,
ANZMAC, 861-867.
Reichheld, F. F., & Sasser, W. E. (1990). Zero defections: Quality comes to services. Harward Business
Review, 68(5), 105-111.
Sharma, S. (2014). Inevitability of moneylenders in financial inclusion in rural India: A perspective of
Latur district of Maharashtra state, India. European Academic Reasearch, 2(3), 4296-4307.
Sharma, S. (2014). Microfinance game: Bank’s dilemma—A study of underprivileged self-help groups
in Latur district of Maharashtra state, India. Review of Research, 3(8).
Sharma, S. (2015). ELSS mutual funds in India: Investor perception and satisfaction. International
Journal of Finance and Accounting, 4(2), 131-139.
Sureshchandar, G., & Rajendran, C. A. (2002). The relationship between service quality and customer
satisfaction: A factor specific approach. Journal of Service Marketing, 16(4), 363-379.
Taylor, S. A., & Baker, T. L. (1994). An Assessment of the relationship between service quality and
customer satisfaction in the formation of consumers’ purchase intentions. Journal of Retailing,
70(2), 163-178.
Wisniewski, M., & Donnelly, M. (1996). Measuring service quality in the public sector: The potential

www.scholink.org/ojs/index.php/jepf Journal of Economics and Public Finance Vol. 2, No. 1, 2016
85 Published by SCHOLINK INC.
for SERVQUAL. Total Quality Management and Business Excellence, 7(4), 357-366.
Zeithaml, V. A., Parasuraman, A., & Berry, L. L. (1990). Delivering quality service- Balancing
customer perceptions and expectations. New York, NY: The Free Press.
Zeithaml, V. A., Parasuraman, A., & Berry, L. L. (1991). Refinement and reassessment of the
SERVQUAL scale. Journal of Retailing, 67(4), 420.
Zeithaml, V. A., Parasuraman, A., & Berry, L. L. (1993). The nature and determinants of consumer
expectations of service. Journal of the Academy of Marketing Science, 21(1).
Zeithaml, V. A., Parasuraman, A., & Berry, L. L. (2004). Service quality. USA: Marketing Science
Institute.