
PERFORMANCE MEASUREMENT AND JOB SATISFACTION ...
88
PERFORMANCE MEASUREMENT AND JOB SATISFACTION IN CALL CENTRES
-
Upload
khangminh22 -
Category
Documents
-
view
0 -
download
0
Transcript of PERFORMANCE MEASUREMENT AND JOB SATISFACTION ...

PERFORMANCE MEASUREMENT AND
JOB SATISFACTION IN CALL
CENTRES

MASTERS DISSERTATION
Excessive performance measurement in call centres decreases
job satisfaction
Dissertation submitted in partial fulfilment of the requirement for the degree of
Masters in Business Administration at Dublin Business School & Liverpool
John Moores University.
Submitted by: Agnieszka Kisiel
Student No.: 1391354
Supervisor: Michael Kealy
Word Count: 21278
August 2013

1
TABLE OF CONTENTS
Declaration ……………………………………………………………….. 4
Acknowledgment ………………………………………………………… 5
Abstract …………………………………………………………………… 6
Chapter 1 INTRODUCTION ……………………………………………………. 7
1.1 Background …………………………………………………………... 7
1.2 Why I am interested in this topic ……………………………………. 8
1.3 Approach to this dissertation ………………………………………… 8
1.4 Organisation of the dissertation ……………………………………… 9
1.5 Scope and limitations of the study…………………………………… 9
1.6 Major contributions to the study …………………………………….. 10
Chapter 2 LITERATURE REVIEW …………………………………………….. 11
2.1 Call centres …………………………………………………………… 11
2.1.1 Call centres in Ireland ……………………………………… 12
2.1.2 Call centre representative ………………………………….. 14
2.2 Performance Measurement …………………………………………... 15
2.2.1 Performance measurement system (PMS) ………………… 16
2.2.2 Performance measurement in call centres ………………… 19
2.2.3 Key performance indicators (KPI’s) ………………………. 20
2.2.4 Average handling time (AHT) ……………………………. 20
2.2.5 Reduce the demand ……………………………………….. 21
2.3 Job Satisfaction ……………………………………………………… 21
2.3.1 Job satisfaction in call centre ……………………………… 22
2.3.2 Employee satisfaction ……………………………………... 22
2.4 Monitoring …………………………………………………………… 23
2.5 Empowerment ……………………………………………………….. 24
2.6 Stress ………………………………………………………………… 26

2
2.7 Turnover ………………………………………………………………. 28
2.8 Training ……………………………………………………………….. 30
2.9 Quality vs. productivity ………………………………………………. 31
2.10 Customer service ……………………………………………………. 34
2.11 Customer satisfaction ……………………………………………….. 37
Chapter 3 RESEARCH METHODOLOGY …………………………………….. 39
3.1 Introduction ………………………………………………………….. 39
3.2 Research philosophy ………………………………………………… 40
3.3 Research approach …………………………………………………… 41
3.4 Research design ………………………………………………………. 43
3.5 Research question …………………………………………………….. 44
3.6 Research objectives …………………………………………………… 45
3.7 Research hypothesis …………………………………………………… 45
3.8 Research purpose ……………………………………………………… 46
3.9 Research strategy ……………………………………………………… 46
3.10 Time Horizon ………………………………………………………… 47
3.11 Credibility of the research findings ………………………………….. 47
3.12 Population and sampling / sampling design …………………………. 48
3.13 Data collection method ………………………………………………. 49
3.14 Framework of the questionnaire …………………………………….. 50
3.15 Pilot test ……………………………………………………………… 50
3.16 Data collection ……………………………………………………….. 51
3.17 Ethics ………………………………………………………………….51
Chapter 4 DATA ANALYSIS ……………………………………………………. 52
4.1 Results …………………………………………………………………. 52
Chapter 5 CONCLUSIONS ………………………………………………………. 65
Chapter 6 REFLECTIONS ………………………………………………………... 68

3
6.1 Learning styles ………………………………………………………… 68
6.2 Development of skills …………………………………………………. 70
6.2.1 Group work …………………………………………………. 70
6.2.2 Data collection and literature review ………………………. 71
6.2.3 Time management ………………………………………….. 72
6.2.4 Critical thinking ……………………………………………. 72
6.3 Conclusions …………………………………………………………… 73
Chapter 7 BIBLIOGRAPHY ……………………………………………………… 74
Chapter 8 APPENDICES …………………………………………………………. 80
CONTENT OF FIGURES
Figure 2.1 Age of typical call centre …………………………………………….. 13
Figure 2.2 Percentage of the workforce that is female ………………………….. 14
Figure 3.1 Research onion ………………………………………………………. 39
Figure 4.1 Question 1 – employees ……………………………………………… 54
Figure 4.2 Question 1 – managers ………………………………………………. 54
Figure 4.3 Question 4 – employees ……………………………………………… 55
Figure 4.4 Question 4 – managers ……………………………………………….. 56
Figure 4.5 One sample T test – job satisfaction …………………………………. 62
Figure 4.6 One sample T test – training ………………………………………… 63
Figure 4.7 One sample T test – performance targets …………………………… 63
Figure 4.8 One sample T test – excellent service ……………………………… 64
Figure 4.9 One sample T test – call monitoring ………………………………... 64
Figure 6.1 Kolb’s learning style model ………………………………………… 69

4
Declaration
This dissertation is in partial fulfilment of a Masters of Business Administration (MBA)
course at Dublin Business School which was submitted in August 2013.
I hereby certify that this material is entirely my own work. All sources cited have been
properly referenced and acknowledged accordingly.
Signed ……………………………. Date ……………………………..

5
Acknowledgment
Firstly, I would like to thank my supervisor Michael Kealy for challenging the stream of
thought, pushing towards better results and all priceless advice on thesis and business world
beyond the thesis.
I would like to thank all the teachers I had pleasure to meet during the MBA course, whose
classes inspired my business thinking and whose constructive criticism taught me to self-
reflect, improve and never give up.
I would also like to thank my husband for his great support and extreme patience during the
past few months.
Finally, I would like to thank my Mum for absolutely everything!

6
Abstract
Objectives: The purpose of this paper is to examine the influence of performance
measurement in call centres on employees’ job satisfaction. The objectives are to identify
those measurements, and if they are in excess, establish their impact on job satisfaction.
Furthermore, the objective is to compare the view of employees with the view of managers
on the performance measurement in the call centre.
Approach: The approach implemented in this study was a quantitative research. This was
conducted via self designed questionnaire, based on critical analysis of the literature available
on performance measurement and call centres. The questionnaire has been distributed on
paper across one of Ireland’s major call centres.
Results: The findings suggest that performance measurement if in excess does have a
negative impact on employees’ job satisfaction. However, the perception of those measures
and their impact is perceived oppositely by employees and management.
Value: Although there have been many works presented on call centres over the years and the
sector has matured, the business still seems to struggle with similar problems. In the wake of
social media and other communication channels, call centres might have to go through
changes. In order to progress managers must understand the value of their employee and their
impact on the customer. The findings of this paper may contribute to employee or a manager
working in the call centre environment who is interested in transforming their centres into
customer contact centres, and improving circumstances for employees and customers. The
research may also contribute the already existing literature.

7
1. INTRODUCTION
1.1 Background
Nothing has changed in the call centre industry over the past ten years. Employees still suffer
from over pressurised environment, constant monitoring, and lack of empowerment, high
stress, low job satisfaction, lack of motivation and a need to leave the job; but difficulties in
doing so. Where are the call centres going wrong? Is there no vision on how to make them
better? Make them better not only for employees but also for customers. It is also a struggle
for customers to constantly fight with automated voice systems, or undertrained agents that
would rather transfer the call because if the try to find an answer to a customer’s problem
their daily performance and so any related bonus will be negatively affected.
Call centres industry continues to grow and expand with recent changes in communication
channels, customers can contact via emails, SMS or even social media. Customers’
expectations have also elaborated, as they are looking for better, faster and cheaper service.
Managers are working on ideas how to cope with this demand, yet sometimes seems they
may be ‘overdoing’ it. At the expense of employees, managers implement more and more
changes and ideas into the centres yet not always it is a though and reflected upon process.
Sometimes, although the changes have happened in the outside world business struggle to
catch up, they forget to update their processes inside, yet again putting strain on employees.
Although performance measurement may be an inseparable part of a call centre, it is how
organisation measure, what they measure and what they do with the results that matters.
It transpires that a communication must be set up not only between members of the
organisation but especially within the organisation, that is between the management and the
employee. The worker is the first and often only point of contact between the firm and the
customer, therefore the relationship must be kept at the higher standard and quality. In order
to achieve this employees will have to be appreciated by the employer. Yet so often we see
reports from call centres, where agents have to rush the call and follow ups to meet their

8
performance targets. The idea the a percentage indicating service level is to management an
indicator of how well the centre is performing.
Hence, if the performance measurement, that is the measuring of various statistics and
concentrating on results in numbers is in excess, and the pressure the reach those targets is
placed on employees the job satisfaction in such a call centre will be low. This in turn leads
to many negative outcomes.
1.2 Why I am interested in this topic
The idea for the dissertation arose from recent changes in the researcher’s work place. The
researcher has been employed in an outsourced Irish call centre for past few years. In the last
two years the outsourcing organisation has changed and the new vendor implemented drastic
changes to the way they run the business. The changes at workplace coincided with the
researcher’s commencement of the masters programme. Through learning in class, the
researcher kept on observing the changes at work and became more and more drawn into
understanding the business dynamics and the reasoning behind them. Especially with the
exploration of available literature to which researcher gained access via DBS online
resources, the pool of knowledge on the subject at hand continued to expand.
1.3 Approach to this dissertation
Approach to the dissertation was to firstly gather the data and perform full literature review to
provide full understanding of the researched subject. By implementing quantitative methods
utilising a questionnaire the researcher will be able to perform primary research and gather
required data to test hypotheses. By analysing the data researcher will be able to test the
hypotheses and draw further conclusions.

9
1.4 Organisation of the dissertation
The dissertation is organised according to the following structure:
Chapter One: is an introduction to the subject and explanation of the research matter.
Chapter Two: presents a review of available literature and its critical analysis.
Chapter Three: is a presentation of research methodology used in conducting the dissertation.
It discusses the research strategy, design, methods and techniques.
Chapter Four: presents quantitative results of the administered questionnaire.
Chapter Five: is concerned with the analysis of the collected data and conclusions.
Chapter Six is devoted to self-reflection and own learning based on the MBA programme and
the dissertation.
Chapter Seven includes Bibliography of all sources referenced in this study.
Chapter Eight presents Appendices including questionnaires
.
1.5 Scope and limitations of the study
The aim of this study is to investigate performance measurement in call centres. The variety
of measures implemented in call centres has been analysed and further on the impact of those
measures has been related to call centre employees job satisfaction. The research presents the
view on the performance measurement from employees’ and managers’ side.
The limitations to this study were time constraints and also where the research was
conducted, that is only one call centre and specifically only the customer service departments.
As the preferred research method was quantitative study, the results allow researcher to

10
generalise however if a qualitative study was implemented more in depth outcomes would
have been achieved.
1.6 Major contribution to the study
The current literature suggests there is a gap in the call centre industry, the pressure seems to
be placed on productivity and cost saving by excessive performance measurement and higher
expectations from employees. This research shows that impact should not be placed on
measurement, as this leads to strain and low job satisfaction therefore lower customer service
level. Call centres should concentrate on customers and their needs, which should channelled
via employees to management.

11
2. LITERATURE REVIEW
Call centres have been in our life for long time and many people at some point had to make a
call to resolve a problem, order a service or get an answer to a billing query, yet rarely we
wonder what a call centre is like from inside. Many questions come to mind in regards to the
working conditions, stress or maybe to the contrary fun, pleasant work place where agents
make fun of customers. The reality however, is somewhere in between and definitely depends
on the management and the operational and strategic goals of the organisation. If the focus is
on cost we can only imagine strict monitoring of calls, excessive measurement and stressful
environment; and if the goal is long term quality service and customer satisfaction we are
looking at a completely different call centre that aims at agents development, empowerment
and satisfaction. The purpose of this thesis is to investigate the call centre environment from
the employees’ perspective and negative influence of excessive performance measurement in
on job satisfaction.
2.1 CALL CENTRES
The Call Center Association (1999) defines call centres as a physical or virtual operation
within an organization in which a managed group of people spend most of their time doing
business by telephone, usually working in a computer – automated environment (Gilmore,
2001). Call centres also create relationship between the customer and the brand and are there
to assist the customer 24 hours a day, 7 days a week and 365 days a year. Furthermore,
Richardson and Gillespie (2003) divided the call centres into three distinct characteristics:
firstly, employees engaged in specialist operations that combine telecommunications and
information systems technologies; secondly, working in a controlled environment with
monitoring of performance and finally employees are in direct telephone contact with the
customer via inbound outbound calls. The author also added that in recent years call centre
work has expanded from not only making and receiving calls but also responding to emails.

12
In regards to the size call centres are estimated between 50 and 75 seats with one person for
each seat (Jobs et al., 2007) and can range from a small 10 people handling business-to-
business (B2B) calls to ‘mega centers’ with over 2,000 workers taking customer service calls.
The role of call centres has changed, it is no longer just a cost centre but more of a ‘strategic
revenue producer’ (Jack et al., 2006). Previous studies have shown that a successful
implementation of a call centre ‘improves company’s customer relationship management
(Alferoff and Knights, 2008) it also improves both service delivery and customer retention
(Labach, 2000) ‘helps gather customer knowledge’ (Xu and Walton 2005) and ‘integrates
knowledge across the organization’ (Andreu and Sieber, 2005). Therefore, it is strategically
imperative to manage knowledge in call centres. Haas and Hansen (2005) also state that ‘a
firm’s ability to apply its knowledge resources to improve performance is a critical source of
competitive advantage in many industries. Furthermore, theorists state that since the
‘emergence of knowledge economy’ there has been a new way of competition based on
unique ‘deployment of resources’ and directed towards a specific segment or market
(Birkinshaw, 2005; Liu et al., 2005) According to Marr (2004) there is an upcoming shift
from call centres to customer contact centres, where, any interaction with a customer is
handled via integration of ‘traditional channels of telephone and fax’ with newer technologies
such as email, SMS, and internet. Marr argues that for a call centre to be successful ‘complex
operation’ it has be a ‘combination of technology, process, and human talent’. Nowadays,
customers ringing call centres expect better service, better treatment and faster response
(Marr 2004). However, if agents are overloaded with measurement, monitoring and
concentrated on following scripts will certainly have problem reaching these demands.
2.1.2 Call Centres in Ireland
According to research carried out by Contact Centre Management Association and Industrial
Development Agency Ireland (IDA) there are 33,000 people employed in call centre sector in
Ireland (2013). Furthermore, IDA are interested in combination of call centres and shared
services into a single group rather than low value call centre operations, they attribute this
desire to current success of the integrated strategy resulting in significant cost reduction,
increased service level and facilitated better business decisions ‘resulting in more competitive
financial operations and enhanced shareholder value’ (Jobs et al. 2007). As noted by Holman
(2007) Ireland is considered a liberal market economy, same as Canada, UK or USA, with

13
more relaxed labour market regulations and less influential market institutions, where liberal
markets have lover levels of skills and training, higher rates of wage inequality.
Figure 2.1 Source Holman (2007)
A typical call centre in Ireland is about 10 years old (Figure 2.1), 80% of call centres in
Ireland are in house and there is nearly a balance between those that serve the mass and
general market and those that cover business markets. 90% of call centres cover inbound calls
versus 10% for outbound calls. According to the report workers typically receive 15 days of
training, however the time it takes to become proficient is much longer, where on average it
takes 11.5 weeks, in Ireland it is 25 weeks. When compared between economies, it takes 8 in
coordinated (with strong labour market regulations), 12 weeks in industrialised (recently
industrialised and transitional economies) and 16 weeks in liberal economies. Employees in
Irish call centres according to the report (CPL Group, 2013) can earn from €19,000, while
high end could earn up to €28,000.
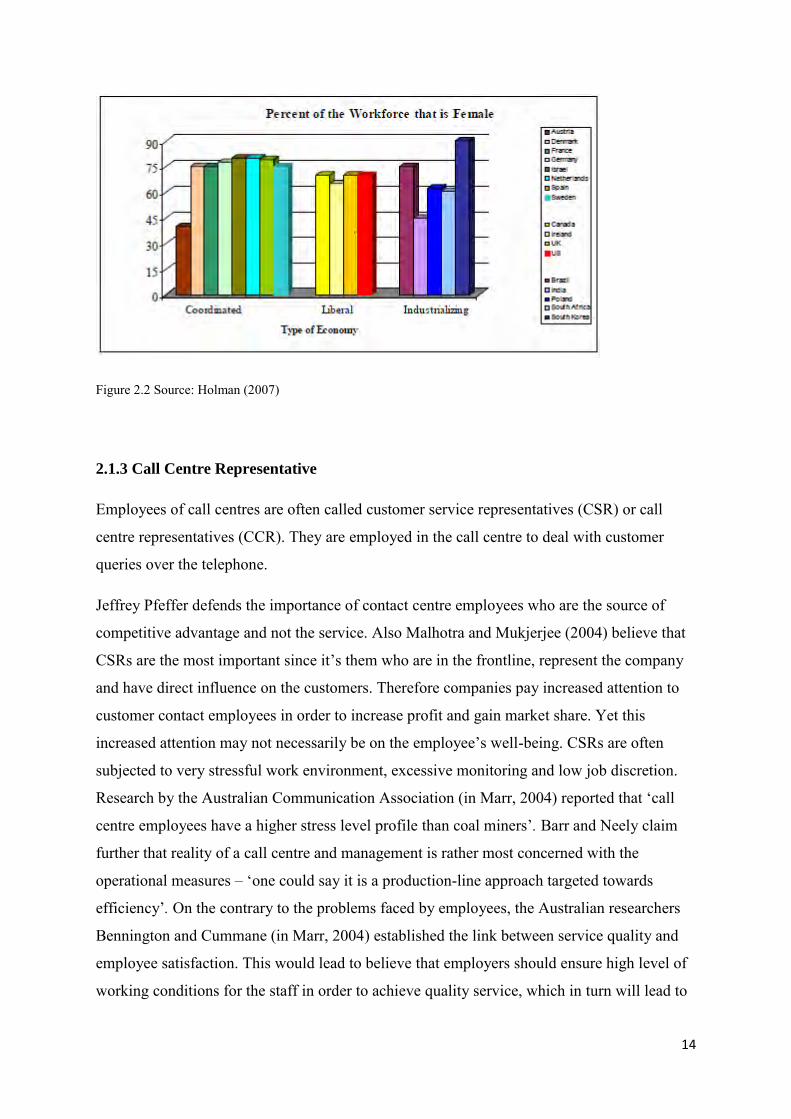
According to Breathnach (2002) Irish call centre sector is dominated by female employees,
accounting for 70% of all jobs. However this group may be most negatively impacted by the
evolution of call centres, where job was moved up the value chain and more skilled male
technicians have replace the female workers. Another aspect threating this female domination
is the higher rates of immigrants that speak more than one to few languages, however Irish
women have much higher rates of foreign languages proficiency than Irish men (Breathnach,
2002) although this worked well for them in 1990s it might not be this strong at present. Also
Holman’s report confirms that not only Irish but the general call centre segment is
predominantly female however 10 % less than previous reports at 60% (Figure 2.2).
14
Figure 2.2 Source: Holman (2007)
2.1.3 Call Centre Representative
Employees of call centres are often called customer service representatives (CSR) or call
centre representatives (CCR). They are employed in the call centre to deal with customer
queries over the telephone.
Jeffrey Pfeffer defends the importance of contact centre employees who are the source of
competitive advantage and not the service. Also Malhotra and Mukjerjee (2004) believe that
CSRs are the most important since it’s them who are in the frontline, represent the company
and have direct influence on the customers. Therefore companies pay increased attention to
customer contact employees in order to increase profit and gain market share. Yet this
increased attention may not necessarily be on the employee’s well-being. CSRs are often
subjected to very stressful work environment, excessive monitoring and low job discretion.
Research by the Australian Communication Association (in Marr, 2004) reported that ‘call
centre employees have a higher stress level profile than coal miners’. Barr and Neely claim
further that reality of a call centre and management is rather most concerned with the
operational measures – ‘one could say it is a production-line approach targeted towards
efficiency’. On the contrary to the problems faced by employees, the Australian researchers
Bennington and Cummane (in Marr, 2004) established the link between service quality and
employee satisfaction. This would lead to believe that employers should ensure high level of
working conditions for the staff in order to achieve quality service, which in turn will lead to

15
customer satisfaction and loyalty and increased revenues. The reality might not be this
logical.
It is often debated that the call centre job might not be for everyone, therefore leaving the job
to successful HR strategies in hiring appropriate candidates. It has been debated that the
successful employee should be first selected based on the personality type. According to
Barnes (2001) ‘high turnover that is endemic in the call centre industry has been exacerbated
by the recruitment of staff of the wrong personality type’. Therefore, by identifying specific
personalities managers can select successful candidates for call centre jobs and contribute to
the success of operations and also reduce the costs related with staffing, training and
turnover. As we understand that the call centre is a stressful job environment due to high
volume of calls and nature of these calls, which many are complaints, therefore agents have
to be patient and calm when dealing with irate customers. Sawyerr (2008) points out that the
literature on personality and employee performance has been controversial with both
enthusiasts and sceptics of this relationship. The author states that ‘personality factors are
indeed valid predictors of job performance’. The outcome of his research confirmed that the
most important factor is emotional stability, rather than friendliness, openness or being
introverted or extroverted. He also states that ‘emotionally stable individuals appear to
function well in a call center environment because they are able to cope with the high levels
of emotional exhaustion as indicated particularly lover turnover intentions’.
2.2. PERFORMANCE MEASUREMENT
Measuring performance is compulsory to track progress and identify how the business is
performing. In call centres companies seem to delight themselves in measurement to a fault.
Strict monitoring of not only how many calls agents take or what has been said on the call,
but also measuring break and personal time has been widely popular.
According to Neely (1995) performance measurement is the process of quantifying the
efficiency and effectiveness of action; Performance measure is the metric used to quantify the
efficiency or effectiveness of an action and finally performance measurement system that is a
set of metrics used to quantify both the efficiency and effectiveness of action. The author
maintains that performance measurement and management system is a balanced and dynamic
system that facilitates support of decision-making process by congregating, elaborating and

16
analysing relevant information (Neely et al. 2002); it needs to be aligned with organizational
missions, policies and objectives (Kaplan and Norton 2004, Pongatichat and Johnson 2008).
It’s worth noting that standards or benchmarks are typically set through performance
measurement (Talluri and Sarkis 2002). Finally, the information visibility and persistent
communication throughout an organization helps allow management to contribute where
appropriate (Vokurka, 2004).
If performance measurement simply means the retrospective collection of historical results it
is likely that little useful purpose will be serviced from the point of view of performance
management if measurement is to be useful in performance management it has to be forward
looking and concerned with performance improvement (Williams, 2002).
2.2.1 Performance Measurement Systems (PMS)
When implementing a performance measurement system organizations face challenges even
before the measuring begins. The root of the problem may hide in the firm’s internal culture.
De Waal (2008) claims that if the organisational culture is not ready for an implementation of
PMS the only next step is to abandon the implementation. The author goes on further to state
that if employees and managers are not focused on ‘achieving results and continuous
improvement’ the PMS will not be used long enough to bring any results or indicate the
measurements correctly. This has already been suggested by Neely (2004) that, in order to
continue with performance measurement the cultural shift is required. Furthermore, the
cultural lack presented by Tatichi (2010) suggests that ‘operators’ may perceive the system as
‘intrusive’, in a call centre environment in which agents have worked for years it would be
difficult for them to suddenly adjust to increased monitoring, receiving a list of statistics of
performance or adjusting to new script.
Taticchi (2010) has also discussed another roadblock to the successful implementation of a
PM system that is the effectiveness of the PM models. The theorists debate that another
‘fundamental objective consists of identifying the way data and information can be
transformed in value-making activities’ which would require ‘providing enterprises with IT
tools needed to extract, collect and elaborate data characterising the business’. This in turn
would enable the organization to deal with the so called ‘knowing-doing’ gap, which may
present the gap between the information achieved from the measurement of processes and its

17
decoding into effective tasks. These gaps are ever so present in the call centre operations and
are a true core, if filled correctly, to a successful operation on a centre. The daily key
performance indicators (KPI’s) in a call centre are not the basis of failure but their analysis
and the ‘cause-effect relationship between what they mean and how they are utilized’. ‘The
desirable condition for a correct and successful utilization of PMM models have to be created
with companies, it mainly means providing organizations with proper information technology
(IT) tools needed to extract, gather and elaborate data characterizing their business’ he goes
to suggest that enterprise resource planning and business intelligence software ‘can
significantly contribute to support PMM initiatives.’
It is imperative for the KPI’s and the PM to measure aspects that are important to the
organization. Therefore measuring everything means firms are in fact measuring nothing. If
the organisational goals and strategy are unclear and not well defined, whatever the results
are presented they will not suit the needs of the organizations’ units (De Waal 2008). A
success map is suggested by Bourne (2008) to resolve problems related to organizations
strategy match to its PMS, he claims that by designing or redesigning a success map, this can
be improved. That is especially when this project is executed by managers whom by direct
involvement have to reflect upon the relation to the objectives. Yet, it may become a problem
if the alignment has been designed by the managers and there is little of it seen by the low
end of call centre employees.
It transpires that an extensive data collection in the performance measurement section leads
to further challenges of the process. The more data is collected the more analysis it required,
the more time is spent analysing and converting the data the more human resource and time is
spent. MacBryde (2011) suggested that also duplications are created when transferring data
from one system to another, which also increases costs as well as data analysis dashboard
management, error correction and the administration.
Also Bourne (2008) suggests that a performance measurement system requires constant
updates and maintenance in order to provide relevant and reliable effects and results/ this in
turn generates costs. If the ‘measures are not kept up to date and aligned with the
organisations strategy; the purpose of the system is defeated’.
What we seem to observe in a call centre environment is most commonly a set list of
measures which does not change for years. Regardless the changes in the centre, economy
demand, the same KPI’s seem to indicate something ‘meaningful’ to the management. It

18
would require a further investigation into the difference between cost saving of implementing
adjusted KPIs and using the same KPIs for a long period of time.
In the research of performance measurement and change MacBryde (2011) debated on the
quality of performance measures. The author has discovered that there has been a possible
‘mismatch between strategic objectives and measures’ there were two reasons for this: firstly
some measures were no longer necessary as the change initiatives that they were originally
set up to track had been resolved, but the measures had never been discarded, and second
some measures were no longer directly related to current top level objectives. This ‘measure
drift’ has been noted before in literature. Neely (2011) states that there are thousands of
measures which you could choose, but the question is which are the measures organisations
should choose that are crucial to their organisation strategy. According to Spitzer (2007) in
Fukushima (2011) ‘performance indicators tend to be inconsistent within the organization
due to ‘’measuring the wrong things’’ he concluded that by creating a ‘complete hierarchy of
objectives including performance indicators’ and ‘examining the effects of indicators on
upper objectives, organizations can find consistent indicators. (See Appendix 2) Applying
this in a call centre, would probably remove measuring the length of calls and time in
between calls, and concentrate on more important ones, which in turn would lead to improved
working conditions for call centre employees.
In his ‘Performance measurement: learning from the past and projecting the future’ already in
2008, Bourne was suggesting that a possible end of performance measurement might be near.
The performance measurement does have at present main place in large organisations and
such drawbacks as cost of design implementation and review of pm for SME’s might just be
too much. If the current trends of new technology, cloud computing and networking will
mean that ‘outsourcing will become increasingly less expensive especially with the
development of web based communications’ and also the large organisations will transform
into networks there may arise a trend to ‘eliminate the need for performance measurement’.
On a positive note this has not happened yet and we still have to manage the performance
measurement and look for improvements and ways to reduce its costs and increase
effectiveness. What would happen if organisations were to actually remove performance
measurement from call centres? Will this create an utter chaos or on the contrary introduce a
logical flow of work, improved working conditions and a revolutionized call centre
environment?

19
2.2.2 Performance Measurement in Call Centres
There are various ways to measure efficiency and effectiveness of call centre operations,
either for the whole centre or individual reports (Reynolds 2010). The purpose of these
measures is goal achievement and allowing staff to ‘reach their potential’. The author
distinguishes three key performance indicators – service, quality and efficiency measures.
From the agents perspective the managements primary priority was productivity delivered
through ‘low cost high volume calls’ (Robinson and Morley 2006) They suggested that as
long as 80% of calls are being answered within 30 seconds other more meaningful measures
become less important. In contrast to this view of superficial efficiency, was also Wallace
(2000) who claims that in order to achieve a long term profitability managers should
concentrate on high level of customer service rather than high level of efficiency. Also
Robinson and Morley (2006) noted that saving cost dominates over improving customer
service. Going more in depth they confirmed that the way the centres are run and what is
expected of them forces managers to concentrate ‘on the call itself rather than the outcome’’.
Additionally, Hill-Willson (2013) suggested that for a successful centre there should be a
closer link between pay and compliance and managers should move away from excel spread
sheets and introduce modern speech recognition systems which in turn will analyse, mark and
monitor calls while the managers can concentrate on helping agents and have more time for
coaching.
Following Feinberg’s statement ‘’we make important what we can measure’ managers in call
centres seem to concentrate on indicators that are easily measured like ASA- average speed
of answer, queue time, adherence, average talk time or service levels (Marr and Parry 2004)
This idea was also supported by Silvermean and Smyth (1995) who state that ‘ease of
measurement leads to automatic reporting’’ which can deceive the managers into thinking
that reported measures are important and motivating ( Marr and parry 2004). Marr and Neely
advised when the measurement is concentrated on efficiency, people will easily confuse
‘targets with purpose’. They go on further to say that ‘functional performance measures
prohibit from delivering the best service.
20
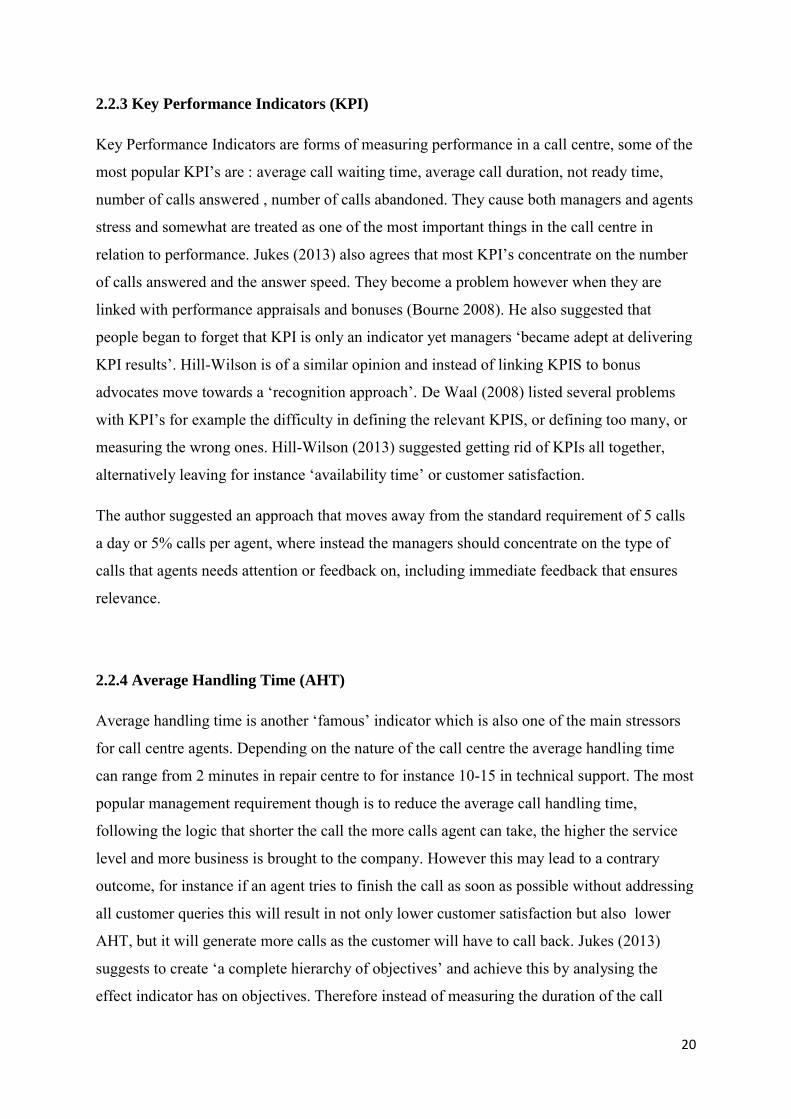
2.2.3 Key Performance Indicators (KPI)
Key Performance Indicators are forms of measuring performance in a call centre, some of the
most popular KPI’s are : average call waiting time, average call duration, not ready time,
number of calls answered , number of calls abandoned. They cause both managers and agents
stress and somewhat are treated as one of the most important things in the call centre in
relation to performance. Jukes (2013) also agrees that most KPI’s concentrate on the number
of calls answered and the answer speed. They become a problem however when they are
linked with performance appraisals and bonuses (Bourne 2008). He also suggested that
people began to forget that KPI is only an indicator yet managers ‘became adept at delivering
KPI results’. Hill-Wilson is of a similar opinion and instead of linking KPIS to bonus
advocates move towards a ‘recognition approach’. De Waal (2008) listed several problems
with KPI’s for example the difficulty in defining the relevant KPIS, or defining too many, or
measuring the wrong ones. Hill-Wilson (2013) suggested getting rid of KPIs all together,
alternatively leaving for instance ‘availability time’ or customer satisfaction.
The author suggested an approach that moves away from the standard requirement of 5 calls
a day or 5% calls per agent, where instead the managers should concentrate on the type of
calls that agents needs attention or feedback on, including immediate feedback that ensures
relevance.
2.2.4 Average Handling Time (AHT)
Average handling time is another ‘famous’ indicator which is also one of the main stressors
for call centre agents. Depending on the nature of the call centre the average handling time
can range from 2 minutes in repair centre to for instance 10-15 in technical support. The most
popular management requirement though is to reduce the average call handling time,
following the logic that shorter the call the more calls agent can take, the higher the service
level and more business is brought to the company. However this may lead to a contrary
outcome, for instance if an agent tries to finish the call as soon as possible without addressing
all customer queries this will result in not only lower customer satisfaction but also lower
AHT, but it will generate more calls as the customer will have to call back. Jukes (2013)
suggests to create ‘a complete hierarchy of objectives’ and achieve this by analysing the
effect indicator has on objectives. Therefore instead of measuring the duration of the call
21
measure the problem resolution. Jukes is also an advocate of extending the call in order to
form a relationship with the customer, which in turn will reduce the amount of calls coming
into the centre. Alternative ways of technology or process improvements and more training
could also lead to improved AHT, however if organizations cannot afford these, they more
often than not apply pressure to front line staff ( Jukes 2013) and once again we enter into the
vicious circle of stressed employee, lower customer service and lack of customer satisfaction.
MacAdams (2009) also suggested that forcing agents to reduce the call duration might cause
the agent to ‘sound impersonal and unsympathetic to the customer’.
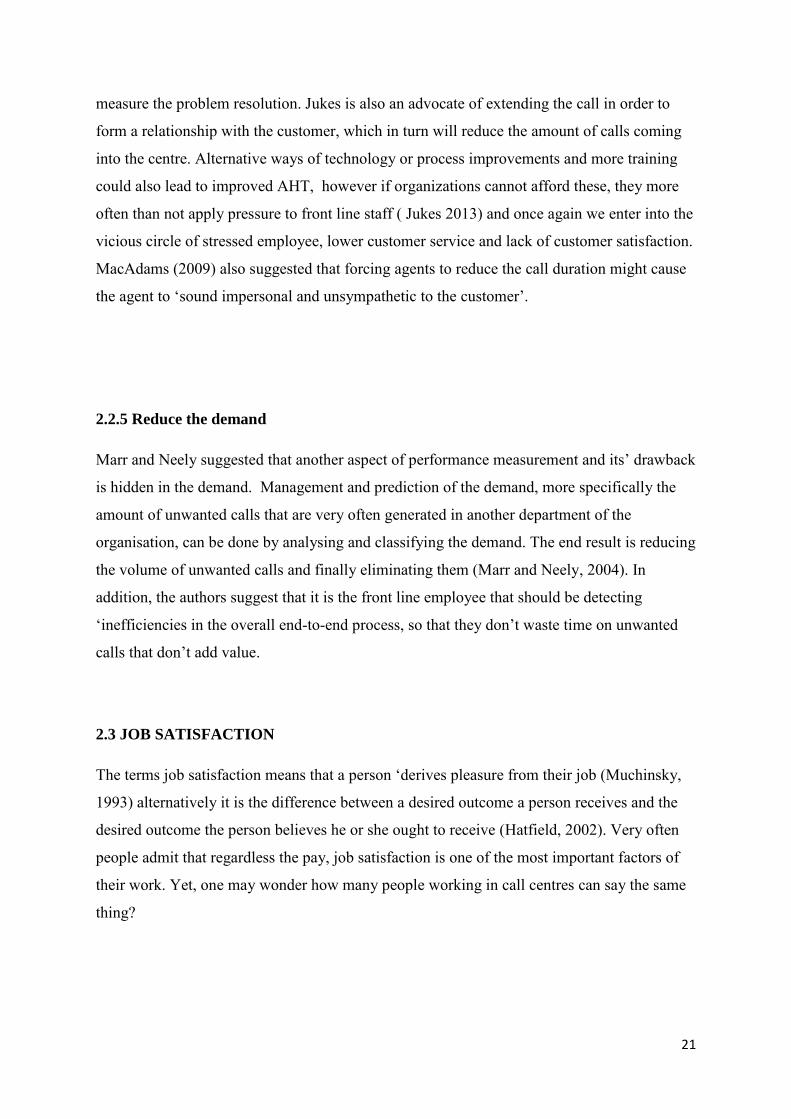
2.2.5 Reduce the demand
Marr and Neely suggested that another aspect of performance measurement and its’ drawback
is hidden in the demand. Management and prediction of the demand, more specifically the
amount of unwanted calls that are very often generated in another department of the
organisation, can be done by analysing and classifying the demand. The end result is reducing
the volume of unwanted calls and finally eliminating them (Marr and Neely, 2004). In
addition, the authors suggest that it is the front line employee that should be detecting
‘inefficiencies in the overall end-to-end process, so that they don’t waste time on unwanted
calls that don’t add value.
2.3 JOB SATISFACTION
The terms job satisfaction means that a person ‘derives pleasure from their job (Muchinsky,
1993) alternatively it is the difference between a desired outcome a person receives and the
desired outcome the person believes he or she ought to receive (Hatfield, 2002). Very often
people admit that regardless the pay, job satisfaction is one of the most important factors of
their work. Yet, one may wonder how many people working in call centres can say the same
thing?

22
2.3.1 Job satisfaction in call centre
According to Holmans report (2007) there is a difference in job satisfaction in call centres
based on the type of economy in a given country. The author differentiates three major
economies that is: coordinated or a ‘social economy’ with strong labour market regulations
and relatively influential labour market institutions (Austria, Denmark, France, Germany,
Israel, Netherlands, Spain and Sweden); Liberal market economies with more relaxed labour
market regulations and less influential labour market institutions (Canada, Ireland, UK and
USA) and finally transitional and recently industrialized economies (Brazil, India, Poland,
South Africa and South Korea). Within those three economies, it was discovered that job
quality in call centres is higher in coordinated economies, with lower turnover and lower
wage differences than those reported in liberal or industrialized economies. Author also states
that based on his research and when understanding job quality as ‘the extent to which a job
promotes employee well-being’’ and also high quality job will ‘combine high discretion with
low performance monitoring’. Across economies the difference is quite clear whereby in
coordinated economies 41% of jobs have high quality and 24% low quality, in liberal and
industrialized economies the percentage is higher for low quality jobs (48% and 50%) than
high quality jobs (25% and 21%).
2.3.2 Employee Satisfaction
Following simple logic that by performing the job well and providing high quality service to
satisfied customers, even the agents will be satisfied with themselves and at the same time
their job. However according to Marr and Parry (2004) most call centres tend to miss the link
‘between employee satisfaction, service quality, customer satisfaction and profitability’. For
both the business and the employee to prosper the agents have to be constantly challenged
and involved, so they feel valuable to the company and believe that their skills and expertise
are of high importance. Audrey Gilmore also admits that call centre employees have this
‘intrinsic drive’ to deliver quality service and when they do, it gives them satisfaction. The
author states that agents become frustrated when certain efficiency measures work against
‘satisfying customers’ and ‘delivering good service quality’.
Marr and Neely stressed that managing the front line employees should be the core of call
centre performance management. However other authors suggest a completely opposite

23
approach and instead, lead agents to a state of burn out when they can be easily and quickly
replaced. This trade-off between efficiency and service is called ‘sacrificial HR strategy’,
which delivers both efficiency and service together by getting the employee to ‘absorb the
emotional cost’. This can be achieved by employing people that are intrinsically motivated to
serve customers, and such agents will be less concerned with measurement requirements as
long as the customer has been taken care of.
2.4 MONITORING
Measuring how well frontline staffs meet qualitative standards is done through quality
monitoring (Reynolds 2010). The purpose of it is to check if employees mentioned for
instance the company name, customers name in an appropriate way, advised of correct
product prices and details. Call monitoring can be conducted in several ways, one of which is
side-by-side, whereby the supervisor listens to the call live as it happens. This form provides
an assurance that the call is not picked behind the agents back and also gives the agent
opportunity to perform well, as they are aware of quality control being in place. On the other
side some agents find it extremely stressful and the awareness of monitoring and marking ads
to their anxiety and make them feel uncomfortable. Another form of monitoring is call
recording, which can be used to either record a bulk of calls and listen in when possible or
record and listen in live. The advantages of call recording is that it can be done without the
agent’s knowledge which will give a better result of actual performance quality, and at the
same time reduce agents stress because they are not aware the call is being listened to.
It has been reported that any setting in which ‘electronic monitoring takes place is a major
factor for job stress’ (Aiello and Kolb 1995 in Ruyter 2001). However, the mere nature of the
call centre in a way requires some sort of monitoring and preferably recording. Customers
often calling in to centres agree to purchase a service or a product are advised of terms and
conditions or contracts durations, call recording serves as a proof of what was said on a call.
However, it is how the call monitoring is conducted that makes the difference for the agent,
especially what is done after the call was recorded and marked. Doellgast (2012) reports that
it is the ‘monitoring intensity, how frequently employees are monitored across different
metrics and how often performance data is fed back to employees’ and also ‘ how monitoring
is conducted and used, including the clarity of rating criteria and feedback, as well as the
extent to which performance data is used to develop or to discipline employees’.

24
Furthermore, Chylaykoff and Kochlan (1989) showed that clear rating criteria and
constructive performance feedback resulting from the monitoring system increased both
satisfaction with the system and job satisfaction in call centre. On the opposite side however,
frequent call monitoring signals the employees that the management does not trust them to do
their job well. Lack of privacy and constant exposure to management observation increases
stress at work (Holman 2007). Also Gilmore (2001) stated that employees became frustrated
with quality problems, because the work environment did not allow them to answer customer
queries effectively and efficiently. These negative feelings and experiences can only lead to
strain which is often associated with telephone surveillance and caused by ‘loss of perceived
control’ (Varca, 2006).
A solution to the excessive performance monitoring has been suggested by Doelgast (2013)
who claims that in order to avoid stress, organisation should ‘adopt more developmental
approach to monitoring’, meaning that the information gained from performance monitoring
systems should be used to help identify areas for development and improve employees skills
rather than as a punishment tool or worst case scenario a sort of backup plan for employee
dismissal.
2.5 Empowerment
Call centre employees have to adhere to a list of performance requirements, which are very
often too many, too confusing and contradictory. The amount of aspects that are excessively
measured has a negative impact on their performance; it makes the agents feel restricted by
those requirements. According to Holman (2007) Job discretion is the ‘amount of choice’ an
agent is given to perform work tasks. In his ‘Global Call Centre Report’ he concentrated on
the amount of discretion agents are given in regards to: ‘pace of work, work methods and
procedures, the timing of breaks and lunches, how agents complete task, and how they
respond to customers’. The findings of the report deliver that both managers and employees
agree on low employee job discretion. Across various markets its been confirmed that in
liberal countries low job discretion is highest at 51%, while it is the lowest at 30% in
coordinated economies (Austria, Denmark, Germany, Spain and Sweden). Although UK and
Canada are already defined as liberal markets these two have a reported 55% of jobs with low

25
discretion, however the highest of all is India with three quarters of jobs offer very little
independent job opportunities.
Once again this would confirm that call centre jobs have extremely high performance
measurement system which closely monitors employee’s every move and word. This
limitation of freedom can possibly only hinder employee’s performance. Doellegast (2013)
reports that heavy monitoring and scripts not only reduce employees control over their work
but also the ability to use and develop their skills, furthermore it obstructs their ability to deal
with emotional work which is naturally required in a call centre environment to interact with
customers, this in turn ‘lowers their capacity to cope with high demands they face in their
job’. Such practices not only create cost for employees but also for the employer by
increasing quit rates and absenteeism and also by reducing quality of customer service.
McGuire also noted that not only skills are affected by use of scripts and information
technology which has restructured the organization of work and has reduced workers ability
to think. One may wonder upon the need for staff in call centres, if agents are turned into
thoughtless robots that read off scripts we may as well remove all human work force and rely
only on automated systems and computer which would evidently save cost.
As long as the agents are forced into these situations their work is affected, which causes
them stress and therefore the customer service is affected as well (Dean 2008). The author
has suggested that managers instead of being so preoccupied with KPIs and in order to
increase customer service and satisfaction by providing their employees with more control
over their work. It has been agreed that the sustainability and effectiveness of performance
measurement depends on top executives and their perception of staff, also on how much the
staff should be trusted and empowered to make their own decisions, identify problems and
initiate improvements, it is imperative for staff to share their expertise and skills so that they
feel personal involvement and ownership when solving problems (Phusvat 2009)
Furthermore it has been claimed that if management involves employees in work systems for
instance setting targets, it will result in closer employee connection to the organization
(McGuire 2008). According to Ruyters (2001) customer service representatives who feel they
have the autonomy to perform their jobs have lower role stress, which leads to greater job
satisfaction, higher performance and lower intention to leave the organization. Adding to this
Holdsowrth (2003) claims that empowerment has a positive effect on sickness absence and
turnover. Job control not only reduces strain but also helps employee better cope with job

26
demands such a problem solving, managing workload, methods and procedures, and also
what is said to a customer.
The whole notion of empowerment or rather lack of it could in fact be resolved again from
the very start by the human resources management policies. For instance, as suggested by
Doellgast (2013) introducing policies such as ‘promotion of opportunities’ can help reduce
work related strain. The author claims that an alternative call centre management model that
‘increases employee control over their work and ability to use and develop skills holds the
greatest promise for maximizing employee well-being and performance’. Employees should
be given more control over their schedules and break times, and use of scripts should be
reduced, by doing so employers will reduce workers stress and strain and help better deal
with job demands. Finally by promoting autonomy in a call centre managers will succeed in
changing the organizational culture from a ‘call centre’ to a ‘solution centre’ (Ashill 2008).
Furthermore, organisation should implement a shift in business reasoning and instead of
using performance monitoring to punish and stress employees, use it to develop them and
help them improve their performance as well as well-being at work. Holdsworth (2003) has
actually compared call centre employees to traditional office workers and discovered that
customer service agents feel that their work is conflicting with their value system and they
have less freedom and autonomy, which is clearly making them feel that they have no impact
on making any difference in the organisation. However, it is only logical for employees to
want to feel as a part of the organisation, and know that the hard work they put in every day
counts and can be appreciated and valued.
2.6 STRESS
When thinking of call centre jobs, people may not usually think of it as a hard physical work,
yet research by Australian Communications Authority reported that call centre employees
have a higher stress profile than coal miners (Marr 2004).
Job stress happens when the employee realises that there is negative feeling resulting from
what is happening at work, which causes psychological and physiological reaction to these

27
uncomfortable and undesirable conditions and also is a form of threat to their immediate
workplace environment (Montgomery et al. 1996, in Chen 2008). Job stress is a different
reaction to a general stress and is very individual. According to Houtman (2007 in Sharma
2011) job stress is a ‘pattern of reactions’ and occurs when employees can’t cope with the
amount of work and its’ mismatch to their skills, knowledge and abilities.
The overall job stress is also caused by smaller events called stressors which can be described
as ‘situations, circumstances or any stimulus that is perceived to be a threat (Seawrd in
Sharma 2011). They promote stress and can be internal, external or both. In the call centre
environment stressors could be for instance poor office ergonomics, verbal abuse, working
environment, low job security, voice health, less future prospects and anything that affected
negatively employee’s daily routine from mouse, light to keyboard. One of the most often
quoted stressors in the call centre environment is call monitoring. Ironically, Hignst (2006)
compared conditions in a highly monitored and structured call centre to ‘prison environment
or ford production lines’. In addition, if the ‘employee fails to meet their targets they are
often threatened with dismissal or pay cuts’ (Doellgast, 2013). This leads to conclusion that
although it seems to be a comfortable office job on the phone, in regards to the stress levels it
is far from comfortable.
In general it has been found that ‘role stress has a negative impact on job satisfaction’ (Ruyter
2001). Therefore if we link job satisfaction to empowerment we can get to the conclusion that
the greater the empowerment the less the role stress (Ruyter 2001).
Another call centre stressor is caused by conflicting requirements. Expectations of the
organization or supervisor are to answer as many calls as possible, to adhere to the given
script and policies, while customers on the other hand expect resolution and satisfaction
(Ruyter 2001). Also Robinson and Morley reported that conflicting requirements cause stress
and pressure for employees to maintain balance between quality service and meeting
quantitative goals. The authors also suggest that it causes stress for the managers whereby the
focus on productivity is in direct conflict with managing the staff. According to Ashil (2008)
employees engage in highly demanding scripted interactions with customers and are
continuously assessed by managers and such conditions cause stress as a result of conflicting
demands of the organization, supervisor and the customer.
From the other side it is also the customers that often cause stress for the employees, when
they scream, shout and verbally abuse employees and the workers obviously cannot shout

28
back and have to squash the negative emotions inside which naturally causes stress (Wegge,
2009). According to reports work related stress cost the uk economy £6.5 billion each year
(Shearer, 2013).
As long as agents as constantly exposed to such conditions, and suffer from job stress they
will continue on a road to burn out. Job burnout is a psychological syndrome that occurs in
response to chronic interpersonal stressors on the job and mainly found among call centre
employees (Sharma 2011). Some of the stress consequences are chronic fatigue, insomnia, or
absenteeism.
2.7 TURNOVER
It has been demonstrated that management practices decreasing employee control over their
work such as ‘work standardization, use of script and intensive monitoring are associated
with increased quit rates’ (Doellegast 2008; Holman 2009). Some organisations measure
employee satisfaction so that they can control staff turnover (Marr 2006). Turnover in call
centres is one of the highest among all industries. In Ireland for instance total turnover is 32%
(Holman 2007), while India is the record holder for the highest turnover rate at 40% which
can be compared to the countries with low churn rate like Austria with only 4 % (Holman
2007). This discrepancy is humongous and although such are the differences between the
countries, where for instance India is the ‘home’ of call centres with a vast population ready
to easily start, quit and change jobs as often as possible. The difference must also be
noticeable to management, as high turnover means high cost. According to Sylvester (2010)
the cost of staff turnover in the UK call centre industry is a £2 billion a year. And although
turnover issue has managed to result in an increase of wages for call centre jobs and also
researchers seem to support the thought that in order to reduce turnover there has to be an
investment made in the employee through increased morale, motivation plans, personal
development plans, improved pay and working conditions. What research shows so far is,
that call centre employees are continuously underpaid, undertrained and highly stressed.
Moreover, it transpires that a loss of a single employee means employers will have to spend
money on recruitment, screening and training of new employees (Holman 2007 report). The
author states the amount of time it takes for a new employee to become proficient is an
estimated three months.

29
According to Visser and Rothman (2008) burnout has ‘direct effect on turnover intentions’.
Some employers attempt to resolve the problem of turnover form the very moment of
recruitment by employing a specific type of agents, whereby they hire people who seem to be
polite and naturally interested in helping others. Also emotional stability appears to be an
important predictor of turnover (LeBreton, 2004). Workers with low emotional stability are
more likely to be affected by stressful nature of the job and therefore more likely to quit.
According to Kaisen (www.systemsthinking.co.uk/6-8.asp accessed 21/06/2013) a problem
with staff retention begins at the recruitment level when too many people are recruited on the
basis of characteristic associated with good sales performance – ‘young energetic and
extroverted’. Some employers avoid open, outgoing and extroverted people as they get easily
bored with a monotonous and restricted, scripted type of work, also might have many friends
who will help them find jobs somewhere else (Sawyerr 2008). Callaghan and Thomson also
found that from the emotional perspective some employee’s way of coping with stress was
through quitting as a form of ‘externalising dissatisfaction’.
Strangely enough some organisations implement strategies that result in high turnover on
purpose. Through a ‘provision of target centred, task focused, sales oriented environment
organisations achieve a high turnover, thus ensuring a free flow of fresh talent and
enthusiasm through the organisation on the call centre floor’ such methods are called
‘sacrificial HR’ (Wallace 2000 in Hingst 2006). Therefore all the reports and data gained
from turnover statistics might not be entirely relevant to pure employee dissatisfaction or fact
that a call centre job might be stressful or low paid. A high turn might be result of a deliberate
management tactic. Although sacrificial HR methods might work well where simple tasks
and easy to follow script is provided, however moving this concept into a more business and
customer service oriented environment might cause problems where agents with more
product or solution knowledge are required. Additionally to succeed in implementing
sacrificial HR strategies call centre must have an efficient recruitment process to ‘ensure they
can keep up with high turnover’, be skilled selecting intrinsically motivated staff, be adept in
designing the work task so little knowledge is required and excel in performance monitoring.
Wallace concluded that these four attributes combined with a large number of potential
employees, sacrificial HR will become sustainable and result in high level of service and
efficiency (in Robinson and Morley 2006) On the opposite side we have the high
commitment management strategy (Kinnie et al 2000) involving recruitment practices aimed
at ‘attracting and selecting highly committed and flexible staff ‘, job security and promotional

30
prospects are offered to these staff. However a possible drawback of this strategy is lack of
cost effectiveness in a highly monitored, low empowered environment.
2.8 TRAINING
If call centres are performing such harsh and intense performance measurement, are they
providing the agents with enough knowledge, skills and training to pass all the requirements?
According to Holman’s research (2007) newly hired workers typically receive 15 days of
initial training and it takes them an average 11.5 week to become proficient. The results of
proficiency are quite dispersed between various countries and for instance in Austria it only
takes 4 weeks compared to Ireland where it reaches 25 weeks. Therefore if it takes an average
6 months for a call centre workers in Ireland to become proficient, it must be very stressful
for them to be under the scrutiny of monitoring where they don’t feel fluent enough in their
daily tasks, this as well will affect customers perception of the service they receive. Garavan
(2008) points out that there is an impact put on initial training but not on any follow up or
later stage training. Also the main focus of training is on call centre agents and not team
leaders, supervisors or managers. The author also states that for call centres that are focused
on training and development show ‘maturity’ and also are concerned with adjusting their
training and its outcome to organizational strategy. Beyond the initial training, Holman
(2007) reports that the agents need on-going training to ‘remain proficient and fully
productive at work, sometimes it may also be needed to update agents’ knowledge of
products and services. The report states experienced agents receive an average of 6 days of
additional training per year, with the highest rate of 15 days per year in Brazil.
As call centres involve a repetitive work with little variety, whereby employees have to
answer calls all day and answer the same queries all day long, which naturally leads to strain.
Research shows that this strain can be reduced by increasing ‘work complexity’ and ‘variety’
by offering employees development and access to broader range of skills. The notion of cross
training is enabling employees to handle all customer queries including for instance billing,
sales and customer service (Doellgast, 2013) This is not only beneficial for the agent who
will feel more comfortable answering the calls, but also for the customer who will not have to
be transferred all over different departments and as well for the organization whereby
depending on the demand they can route calls across different locations. However, a question

31
may arise of when too much training is not good, or if agents can be not necessarily over
trained but fed with too much knowledge, as each additional block of services or process also
requires getting used to the systems and creates many more questions and loopholes which
were not covered in training. If on top of this agents are working in a very strictly monitored,
highly measured call centre and it is not easy for them to source the answers and managers
are busy it will yet again add to their current stress levels, before it helps them to assist the
customers. On the other side once they pass the initial stage of learning and progress to the
proficiency stage, this should be beneficial and will provide long term solution to the
customer service of the company.
2.9 QUALITY VS PRODUCTIVITY
When call centres agents are put under pressure and are required to adhere to a long list of
measurement requirements it is easy to guess that the organisations goal is performance.
However the current trends in call centres are going towards the customer relationship centres
and quality customer service, which is what makes customers loyal and willing to stay with a
brand and spend on a brand. This would seem however contradictory to what is currently
required from employees in call centres. Deery (2002) stated that employees reported higher
levels of emotional exhaustion when management required them to follow the script, focus on
the amount of answered calls over their quality, and minimize wrap up time. It has also been
confirmed that agents are thorn between ‘the need to deliver quality service and maintaining
productivity’. (Curry and Lyon 2008 in McAdams 2009, Robinson and Morley (2006)
Therefore is it an ‘either or’ question? Are the organisations only able to provide either
quality or productivity? Such circumstances lead to extreme examples where for instance
agents in a banking call centre had to sacrifice customer service in order to manage the stress
associated with work intensity (Knights and McCabe 1998). And if we presume that ‘service
quality is a determinant of customer’s satisfaction’ (Marr 2004) then we would also have to
presume that employees who are forced to forfeit customer service due to stress are neither
producing quality nor productivity.
There is a huge connection between service quality and satisfaction, where satisfaction is
what the customer thinks of the service when compared with their previous expectations of

32
service (Marr 2004) and it usually refers to a specific situation or experience. The service
quality on the other hand is an ‘enduring construct’ and it creates the ‘overall impression’ of
the perception of the organisation and its service. Customer satisfaction is however a very
delicate issue and may be easily affected, the outcome of the research from Purdue University
showed that even one negative customer experience with a call centre can influence the
customer to stop using company’s product or service (Marr 2004). Furthermore if employees
become so heavily stressed and negatively affected at work they become disengaged which
leads to being ’less responsive to or engaged with the customer’ (Doellegast, 2013). Also
Wallace (in Marr 2004) stated that customer’s perception of the organization is often
delivered by the front line staff and their attitudes and behaviours. As well Bennington and
Cummane (in Marr 2004) stated that 40% of variance in customer satisfaction with service
was related to their expectation of service quality, how helpful and accurate the staff were,
what was end result of the call, customers age and their perception of whether the staff were
satisfied in their job. According to statistics the results are actually worrying, as the level of
service quality is declining, and each year decreasing by significant amount and similar trend
was noticed previously in the manufacturing sector (Zeitham 1990).
Mixed results were reported in research on the impact of practices on employee performance,
whereby on one side work standardization and intensive monitoring can offer reduction in
short-term cost and improvement in production and sales, however on the other side both
standardization and excessive monitoring have been found to hinder long term production
and service quality (Doellegast, 2013) Hence the question is what is the organisation’s
ultimate goal: a short lived success or a long term vision of excellency? Research by Wood
(2006 in Doellegast) suggested that practices that increase employee discretion have mixed or
no effect on productivity. Contrastingly, other studies found that call centres which promote
high employee skills, employee participation and control, and less intense monitoring to
produce higher sales numbers and lower levels of customer satisfaction where dismissal rates
were high (Batt and Colvin 2011, in Doellegast). It could then be debated that other factors
might have had an effect on the research results were mixed or no productivity increase was
reported, or the management practices were not implemented fully or properly, or on the
contrary there is a possibility that not always employees discretion leads to higher
performance.

33
Marr (2004) has noted that call centres fail to measure service quality that leads to customer
satisfaction, yet again organisations measure for measuring sake, and presume ‘what
customer thinks service quality is by measuring service level, abandon rates, call monitoring’
which for customer might have no relation to their satisfaction whatsoever. Jaiswal (2008)
states that managers too often depend on operational measures for efficiency in order to asses
service quality, instead of systematic and ‘comprehensive measurement of service quality’
which would in turn lead to exceptional call centre experience for the customers. Which
clearly means that yet again measurement in the call centre has to be a well thought process
with not only the organisational strategic goal in mind but also the recipients, hence by
providing measurement metrics to aim at increasing customer satisfaction will also result in
improvement in employees satisfaction with their job. To support this Holdsworh (2003)
stated that the quantitative statistics which are so often used in call centres to assess
employees are in direct conflict with the employees desire to deliver quality calls. The author
also claims that the outcomes of empowerment are: increased job satisfaction, health,
increased productivity and reduction in cost.
Interestingly measuring performance in the standard way is well known and understood but
how do we measure the quality of service? Upal (2008) stated that service quality is difficult
to measure because it is ‘elusive, abstract, intangible, inseparable’. Furthermore some
scholars state that customers rate the quality of the service received in call centres higher than
that received in person (2004). Therefore it would be of highest importance to stress the
quality of the service in call centres right from the start, from HR practices that stress
‘employee training, discretion and rewards’ (Batt and Mynihan 2006). The authors claim that
where such practices are in place the revenue and service quality per call are higher. The
benefits for the organisation are also improved ability to retains customers and attract new
ones.
The question now is how companies achieve higher quality and productivity, is one more
important than the other or is there a way to balance them out. According to Dean (2007) a
better balance between productivity and service quality is possible when organisations
involve their employees in ‘establishing and implementing strategies for dealing with the
pressures of the call centre environment’. If KPI’s are a cause of stress to employees, and
34
stressed employee means lower service quality which leads to lower productivity and less
satisfied customers. This creates a simple chain of reaction resulting from measurement that
can be easily avoided or amended.
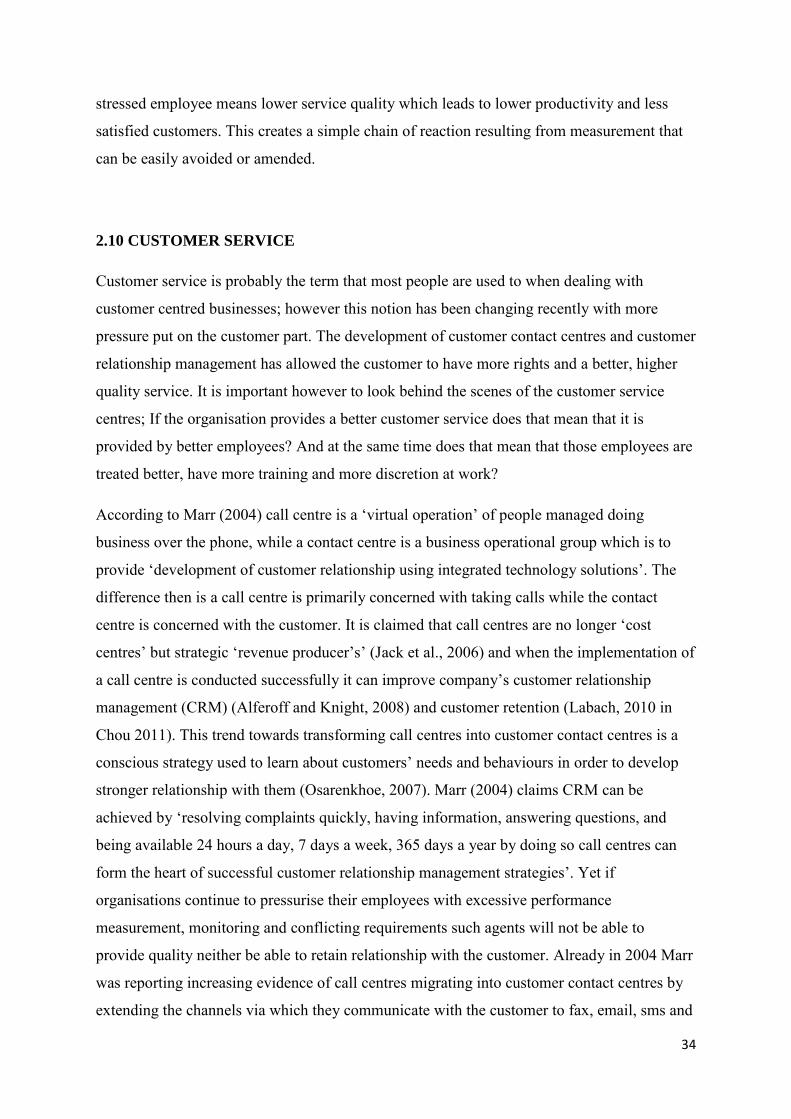
2.10 CUSTOMER SERVICE
Customer service is probably the term that most people are used to when dealing with
customer centred businesses; however this notion has been changing recently with more
pressure put on the customer part. The development of customer contact centres and customer
relationship management has allowed the customer to have more rights and a better, higher
quality service. It is important however to look behind the scenes of the customer service
centres; If the organisation provides a better customer service does that mean that it is
provided by better employees? And at the same time does that mean that those employees are
treated better, have more training and more discretion at work?
According to Marr (2004) call centre is a ‘virtual operation’ of people managed doing
business over the phone, while a contact centre is a business operational group which is to
provide ‘development of customer relationship using integrated technology solutions’. The
difference then is a call centre is primarily concerned with taking calls while the contact
centre is concerned with the customer. It is claimed that call centres are no longer ‘cost
centres’ but strategic ‘revenue producer’s’ (Jack et al., 2006) and when the implementation of
a call centre is conducted successfully it can improve company’s customer relationship
management (CRM) (Alferoff and Knight, 2008) and customer retention (Labach, 2010 in
Chou 2011). This trend towards transforming call centres into customer contact centres is a
conscious strategy used to learn about customers’ needs and behaviours in order to develop
stronger relationship with them (Osarenkhoe, 2007). Marr (2004) claims CRM can be
achieved by ‘resolving complaints quickly, having information, answering questions, and
being available 24 hours a day, 7 days a week, 365 days a year by doing so call centres can
form the heart of successful customer relationship management strategies’. Yet if
organisations continue to pressurise their employees with excessive performance
measurement, monitoring and conflicting requirements such agents will not be able to
provide quality neither be able to retain relationship with the customer. Already in 2004 Marr
was reporting increasing evidence of call centres migrating into customer contact centres by
extending the channels via which they communicate with the customer to fax, email, sms and

35
internet. Currently this would also extend to social media such as facebook or twitter. The
moral of this is that companies need to follow their customers and their lifestyle and adjust to
the way customer wants the business to be done with them. And if the customers are moving
further away from telephones does that mean the end of call centres?
It is argued that today’s call centres are complex operations that require a combination of
technology, process and human talent in order to succeed, however Marr (2004) argues that
the human aspect has been ignored in call centres, and although there has been a development
in the general business and an evolution from machine age to information age and now a
complex global economy, this has somehow not always and not everywhere affected call
centres. Therefore it becomes clear that for some reason the call centre industry is slow to
change. And if we take as a variable that the ‘degree of success of CRM is directly related to
the level of involvement of the employees during the early and subsequent stages in the
change process’ (Osarenkhoe 2007) then it yet again transpires that organisations must invest
in the employee. The author further advocates that there must be a customer-centric culture in
the company for the CRM to work. Also Jukes (2013) states that the customer experience
should be ‘centred around particular individual customer in that space and time, and the need
for empathy during customer contact has never been greater’. The author claims that only this
way organisation can achieve long term benefits in managing customer relationship.
Organisations should shift towards measuring the impact of the centres performance on the
customer (Hill-Willson, 2013).
Further departure from the classic telephone based call centre is related to the age
demographics, whereby the younger generation is not really keen on ringing a call centre,
they will more likely contact via social media, web chat or email. Although media such as
web chat or even facebook or twietter, have some potential drawbacks for instance
responding to all tweets does not makes sense and contact centres have to be vigilant and
picky in what they respond to. As well everything happens in the open therefore it is no
longer one on one conversation, as the on the phone, but its public and other customers can
also get involved.
If call centres tend to monitor and calculate and measure everything, a shift to a multi-
channel contact centre may also be a benefit just looking at the numbers, we only have to
shift managements thinking. For instance if an average call is supposed to be kept within 3

36
and a half minute boundaries, this makes two calls last 7 minutes. If we were to implement
CRM strategy and attempt to resolve all queries on one call this would save a lot of time, as
many calls have inbuilt phrases that agents are forced to use each time. Jukes (2013) stated
that by improving the ‘quality of interactions will have real benefit of reducing AHT’,
because customers are also more concerned with how they are treated on the phone and
whether their query is resolved rather than the fact that their call got answered within 5
seconds.
CRM is becoming an increasingly popular approach which not only offers higher quality
service but also helps increase a loyal base of customers, which according to Holman (2007)
are believed to buy more and buy more often. This is maybe why some companies would go
an extra special mile for their customers. For instance Zappos American shoe company would
go to such lengths as even entering a competitors store just to get the size for their own
customer; other perks include free deliveries and returns. The reasoning behind such
strategies stated by the company is that they intend to create a brand the customers will like
and trust and above all have ‘an emotional connection with’.
The level of quality of customer service also depends on the level of the customer. Even in
call centres there have been various departments which specialize in higher customer service,
but usually it is because they serve high end business customers. Such agents usually called
account managers might have a fixed base of customer with whom they get involved on
regular basis and are customer’s direct point of contact in the company. In the mass market
however, customers rarely get to speak to the same person, and this is how you normally
create a relationship (Holman 2007). Yet if companies allow their employees more freedom
in dealing with the customer and encourage longer calls like Zappos whose current longest
call record is at 8 minutes, they might be capable of an excellent level of quality customer
service, changing the cost centres to strategic revenue producer with front line employees
deeply involved in providing this excellent service.
2.11 CUSTOMER SATISFACTION
Customer satisfaction is possibly, beside the revenue, the main goal of all call centres. Yet, it
transpires that it is not necessarily what organisations focus on most. Whatever performance

37
measures are applied in call centres are not directly aimed at improving customers’
satisfaction. Some scholars define customer satisfaction as en evaluation of product or service
in terms weather it has met their needs or expectations. Others define it as the result of
customer’s assessment of service based on comparison of their perception of service delivery
with their prior expectations. However the research results are alarming stating that the
customer satisfaction rates are at an all-time low (Fornell 2008, in Piercy 2008)
Marr (2004) has recognized that there are four main reasons why customers contact call
centres: in order to get an answer to a query; to get help to do something e.g.: change address,
send a manual; customer has a problem with a product and needs assistance; customer is
emotionally upset with a product and wants immediate resolution. Furthermore, the
requirements of today’s customers have also gone higher; they want better service, better
treatment, easier access and timely responses (Marr 2004). The author further suggested that
what the customer expects from the call centre employee on the basic level is that the agent
will have enough information to advise correctly, to adapt to the customers particular
situation, to empathize, to communicate with the customer in a specific way and also the
quality of the work they are doing. These would seem to be just the standard requirements
any person calling into a call centre would expect, but what is it like from the employee’s
point of view? Is this as simple as it sounds? Are the agents trained enough to answer all
queries or in case when they don’t know are they allowed to walk away from their desk to ask
a manager or a colleague? Or is it that the strict call ‘quality’ measures require them to
manage the call on their own? The same problem may occur in regards to the empathy, if the
agents are trained on for instance price plans or services however have never been advised on
how to deal with angry or upset customers. According to Wade training on effective conflict
management including effective conflict handling styles should be part of the training for
new hire call representatives which will result in higher customer satisfaction.
One of the popular complaints from customers about the agents is that they don’t listen. This
actually not only refers to listening to customers on the call, but it may be taken to a broader
spectrum of the organisation as a whole. The customer dialogue is important and call centres
are in fact listening to and speaking to the customer all the time. According to Marr
measuring customer satisfaction ‘should start with understanding customers’. That means the
organisation and not just the agent needs to proactively go out and find out from the
customers what it really is that they expect from a call centre, what is the most frustrating and
what is totally missing. By listening to customers companies can adjust their processes and

38
strategies to match to customers’ expectations and deliver quality service. Furthermore any
analysis of customers’ expectations and satisfaction should be done on an on-going basis for
instance in a form of a customer satisfaction survey also according to Reynolds (2010) it is
used to understand weather a contact centre is developing in the right direction and measure
customer satisfaction as well as loyalty.
The benefits of increased customer satisfaction will not only be the personal win for the agent
that delivered the service but also the financial gain for the organisation according to Wade
(2007) ‘increase in customer satisfaction through effective problem resolution could result in
3 to 6 % rise in annual revenue and that is a lot.
Another idea is to appreciate and value customers that have been loyal to a firm for years. In
order to increase satisfaction of lifetime customers organisations offer tailored services, the
more adjusted to their needs the better (Reynolds 2010). However in the way to this tailored
offer is standardization that helps firms decrease spend on varieties. What actually happens in
call centres is quite to the contrary, that is the new customers are offered super deals with
great discounts just to ‘lure’ them in or tie them in a contract while such offers are not
proposed to lifetime customers as this would hugely decrease the revenue.
Finally, first call resolution could also help improve customer satisfaction. However, in order
to resolve all customer queries on first call requires commitment, involvement, and full
devotion from the agent, it means they also possibly have to mention a lot of products and
services and entre data in many systems, this in turn increases the average handling time
which agents usually have to keep to the minimum. This clash in requirements is not easy on
employees and often leads to stress. It is up to the management to ‘drive customer satisfaction
and state a clear definition of first contact resolution and the opportunity that it is to the
agents to provide customers with better process in response to their needs’ (Reynolds 2010).

39
3. RESEARCH METHODOLOGY
3.1 INTRODUCTION
Research methodology is concerned with how a particular research should be carried out.
Both primary and secondary research was carried out in order to define and answer the
research question and hypotheses. From all available research methods, the best and most
suitable to the type of study conducted, were chosen and described further in this chapter.
Research itself may be simply explained as searching for knowledge and then re-searching
again and again in order to expand knowledge and find answers. Saunders et al. (2009)
defines research as something people undertake in order to establish more information, this is
done in a systematic way and therefore results in an increased knowledge.
In order to present chosen methodology and research method in a clear and organised way the
use of research onion has been implemented. Saunders et al. (2007) proposes and comparison
of the research process to an onion, comparing layered nature of the research approach.
Following Saunders research onion (Figure 3.1) the researcher is following each step in this
chapter.

40
3.2 RESEARCH PHILOSOPHY
We all have some basic beliefs and concepts about the world around us and often they vary
from person to person and might even generate groups of thought. The same way there are
ways to view the world of research. Research philosophies are basically different views and
assumptions about the way we view the world, the nature of the knowledge we have about
the world and its development. ‘The science or study of being’ and ‘claims about what exists,
what it looks like what units make it up and how these units interact with each other is what
Blaikie (1993) defines as ontology. Ontology describes our view on the nature of reality, and
provides a distinction between the reality from an objective and subjective perspective. It is
important to understand that research philosophies should not be view as better or worse, but
rather as an alternative or continuum to the research path. There have been three main
research philosophy methods suggested by Saunders et al. (2007): Positivism, Realism and
Interpretivism.
For the purpose of this research paper the author decided to adopt the Positivist approach.
According to Cacioppo, Semin and Bernston (2004) positivism is ‘a form of philosophical
realism adhering closely to the hypothetico-deductive method’ This method has been
suggested as the primary research method for an environment that observes the ‘social
reality’ and that generates ‘law-like generalisations’ and can be compared to outputs of
natural scientists (Remenyi et al., 1998:32 in Saunders 2009). The reality being observed will
generate only credible data and by using existing theories will develop hypotheses, which
will be tested and confirmed: fully, partially or will be declined. This in turn will lead to
formulating new theory which again may be tested (Saunders, Lewis and Thornhill 2009)
Positivism is also a preferred approach because it requires the researcher to be emotionally
separated from the results of the research and as defined by Saunders et al. ‘in a value free-
way’ (2009). The researcher is afraid however that a complete separation from the subject of
this paper might appear difficult, this has been supported by Saunders where the author goes
further to explain that ‘complete freedom from the inclusion of our own values as researchers
is impossible’ In agreement with positivism the research will be conducted in highly
quantifiable observations that are subject to statistical analysis.

41
3.3 RESEARCH APPROACH
It is clear that in order to conduct a research it will involve certain theories and it is
imperative to decide before conducting the research on which approach to take. According to
Saunders et al (2007) there are two research approaches that can be taken. The first one is the
‘inductive approach’ whereby data collection precedes formulation of theory. This approach
is structured and involves collection and study of qualitative data (Carson et al., 2001). To
further understand this approach Saunders outlines that it is about understanding the way
humans interpret their social world, the context in which events takes place. Furthermore, it
has more flexible structure to permit changes as the research progresses. The use of different
methods to collect data is often associated with inductive method which allows us to establish
different views of phenomena (Easterby-Smith et al. 2008). One may wonder why is it so
important to decide upon which approach to choose? Easterby-Smith explains that applying
the correct approach enables the researcher to take ‘more informed decision about your
research design’ and also it is the ‘overall configuration’ of research that answers questions
‘about what kind of evidence is gathered and from where, and how such evidence is
interpreted in order to provide good answers to your initial research question’.
The second approach discussed by Saunders et al. (2007) is the deductive approach in which
you develop the theory and design the research strategy to test your hypothesis. According to
(Mark, Philip, Adrian, 2009) deductive research is strongly based on theory and quantitative
research. Following Robson’s (2002) five stages: the researcher will deduce the hypothesis
based on theory, express the hypothesis operationally, testing the hypothesis, examining the
outcomes, and if required adapting the theory to the outcomes. Therefore the hypothesis is
tested in relation to the research question that the performance measurement has a negative
impact on employee satisfaction.
Deductive methods are based on existing theories as guidance for the investigations. The
theory is represented by variables which are more suitable for hypothetico-deductive
research.
Deductive approach also starts from the need to test the theory and it has been carefully
analysed to match it to a particular type of study. Ali (1998) suggested that it may create a
dilemma for the research when approaching research questions whereby theory is present

42
however the deductive approach may not be appropriate in particular circumstances.
According to Henwood and Pidgeon (1993 in Ali and Brierly 1998) the hypothetico-
deductive approach concentrates on ‘universal laws of cause and effect on an explanatory
framework which assumes a realist ontology’, and whereby the reality consists of
‘objectively defined facts. This means that in the deductive approach researcher begins with
basic abstracts and relationships between variables, and moves on further towards ‘concrete
empirical evidence’ (Neuman 1997 in Ali I guess). Therefore the role of existing theory is
well established and it informs of the development of the hypotheses, the present variables
and the measures used. The researcher then uses all these ingredients in order to measure the
prior theory. Also the basis for the hypothesis may lay in previous works
The value of this approach is the use of previous research works, however its’ limitation is
that we can only test it and accept it or reject it. It is limited in discovering other factors that
could be involved or other variables. The structure of the deductive approach also limits the
respondents to a particular line of response, while in a more qualitative environment the
respondents can add more depth to the research.
For the purpose of this paper the researcher has applied the deductive method, by which will
conduct the quantitative research on a group of 100 call centre employees. The purpose of
this approach is to answer the hypothesis and research questions, to do so researcher will
implement survey method. This method is best suited in the current situation and will allow
for easier data collection of a wide researched audience. It will also allow to ask specific
questions and get specific answers.
3.4 RESEARCH DESIGN
Research design represents the elements that build the research and according to Saunders
(2007) it is the three layers of the research onion i.e.: research strategies, research choices and
time horizons. These three layers focus on the process of research design in turn transforming
the research question into a research project (Robson 2002). Furthermore the research design
is in a way the ‘general plan’ of how the researcher will go about answering research
questions.
As stated by Marchington and Wilkinson (2005) it is very important to have a clear purpose
of the project and be conscious of how possible the research is in reality and that it adds to

43
existing knowledge. Reily et al (2000) claim that the issue at hand is when choosing the
subject research has to consider whether the subject can ‘sustain interest over a period of
time’. Possible dangers of research could be loss of interest and motivation if the research
subject is not well thought.
In order to define the research topic, the researcher used Saunders’ (2003) checklist of
attributes for good research to confirm the following:
• The topic meets the specifications and standards set by Dublin Business School.
• The topic is something in which the researcher is really interested.
• The topic presents issues that have links to theory, such as diversity, culture and competitive
advantage.
• The researcher has the time, resources and skills to undertake the research topic.
• The researcher is able to gain access to the data required for this research.
• The questions and objectives clearly defined.
• The proposed research of this dissertation will provide insights into the topic area.
• The researcher topic matches the researcher’s career goals.
The research area selected by the researcher is performance measurement in call centres. The
researcher believes that this research can contribute to general knowledge by better
illustrating the underlying theory found in the literature dealing with this area. Measurement
in call centres can prove automatic and stressful but inappropriate and excessive
measurement can cause even worse damages. As many organisations still heavily rely on
performance measurement and do not use it as performance indicators but as a final
performance results. Although due to changes in technologies and means of communications,
consumers are moving towards social media and call centres may slowly be pushed aside.
Yet still, many people call in to centres to speak to people to resolve their problems, and
consumer expectations are also changing, as they require better, faster and more reliable
service. This places focus on the quality of provided service and such may be difficult to
obtain if agents are pressurised, highly monitored and swarmed with all sorts of results that
may have little or no reference to actual service they provided for the customer. Although
there has been many debates going on for years about call centres and performance, it has
been only recently that particular articles surfaced suggesting call centres are transforming
into contact centres, where companies allow agents to spend hours on the phone while their
main priority is to provide high level quality customer service instead focusing on the amount

44
of calls answered. The current research focuses on the excess of performance measures in a
call centre and its effect on employees satisfaction.
3.5 RESEARCH QUESTION
Clearly stating the research questions before commencing the research process according to
Saunders (2007) are key criteria to success of the research and it will allow to draw clear
conclusions from the data collected. For the purpose of this research the research question is:
‘Does excessive performance measurement in call centres decrease job satisfaction?’
The research question will be answered by conducting a questionnaire in a call centre which
implements a variety of performance measures and the impact of those measures will be
analysed in relation to employees’ job satisfaction.
3.6 RESEARCH OBJECTIVES
Research objectives are to the research community an evidence of researches ‘clear sense of
purpose and direction’ (Saunders et al. 2007). They have to be clear and specific statements
that identify what the researcher wishes to accomplish as a result of doing the research
(Saunders, 2009).
With this guide in mind the following research objectives have been created:
- To get better understanding of the factors that influence job satisfaction in call centres
- To determine whether there is a relationship between job satisfaction and performance
measurement in call centres
- To investigate how excessive performance measurement impacts job satisfaction
- To identify perceived disadvantages of excessive performance measurement

45
3.7 RESEARCH HYPOTHESIS
Research hypotheses are predictions made about variables in a study and they are usually
based on a background from literature review which has created the need to test the particular
hypotheses (Price, 2000). Kumar (1999) claims that they bring clarity, specificity and focus
to a research problem, however Brannick and Roche (1997) state that hypothesis is designed
to develop, extend and refute an already established body of knowledge.
The hypotheses created for this research are:
H1 Employee empowerment has a positive impact on employees satisfaction
H2 Training has a positive impact on employee satisfaction
H3 Performance measuring has a negative impact on employee job satisfaction
H4 performance monitoring has a negative impact on employee satisfaction
According to Kumar (1999) hypothesis should be: simple, specific and conceptually clear.
The researcher should be able to verify hypotheses and should be operational.
3.8 RESEARCH PURPOSE
The classification of the research purpose is threefold: exploratory, descriptive and
explanatory. This research project adopts the descriptive approach in order to describe the
research population and outcome. According to Robson (2002, p.59) the object of descriptive
research is to ‘portray an accurate profile of persons, events or situations. Furthermore, the
researcher has a clear idea on which data collection method will be applied to best answer the
research question and the research objectives.
Furthermore the application of descriptive study will allow the research to develop the skills
of data analysis and evaluation.

46
3.9 RESEARCH STRATEGY
As mentioned before each strategy can be used for exploratory, descriptive and explanatory
research (Saunders 2007) and some these may be more suited for a deductive approach while
other to inductive approach, and also may fall somewhere in between. The author advocates
that ‘no research strategy is inherently superior or inferior to any other’. Therefore the
priority when choosing a strategy should be placed on the aim of the research and the ability
to answer the research questions and objectives. There are numerous research strategies e.g.:
experiment, survey, case study, action research, grounded theory, ethnography or archival
research.
The method chosen for this research is a survey. According to Saunders (2007) survey
method is usually associated with the deductive approach and this statement supports my
decision. The survey method is also used to answer ‘who’, ‘what’, ‘where’, ‘how much’ and
‘how many’ questions. It also allows to collect a large amount of data from an extensive
population. Saunders (2007) states that survey allows you to ‘collect quantitative data, which
can be quantitatively analysed using descriptive and inferential statistics’. The author further
states that using the survey method can be implemented in order to suggest possible reasons
for ‘a particular relationship between variables and to produce models of these relationships
should give more control over the research process’. Additionally, by conducting a survey the
sample can be collected from the representative of the whole population at a lower cost rather
than collecting the data from the whole population. For the purpose of this research adopted
strategy is research, by distributing questionnaires to the test population to measure the
impact of performance measurement in call centres on employee job satisfaction.
3.10 TIME HORIZON
Saunders et al. (2007) suggest an important question to be asked in planning the research it is
whether the research should to be a snapshot taken at a particular time or does the research
want to be similar to a diary and be representative of events over a given period. Should the
research be closer to a snapshot, the research would therefore be cross sectional. According to
Saunders et al. (2007) cross sectional research is the study of a particular phenomenon at a
particular time. As most research projects undertaken at academic courses are time

47
constrained they most often follow the cross method. The cross sectional method also often
adopts the survey strategy.
3.11 CREDIBILITY OF THE RESEARCH FINDINGS
The credibility of research is the ability of a research process to generate findings that elicit
belief and trust (O’Leary 2007). Saunders states that reducing the possibility of getting the
answer wrong means attention has to be paid to two particular emphases on research design:
reliability and validity. Reliability refers to ‘the extent to which data collection techniques or
analysis procedures will yield consistent findings, similar observations would be made or
conclusions reached by other researchers or there is transparency in how sense was made
from the raw data’. More precisely Joppe (2000) defines reliability as ‘the extent to which
results are consistent over time and an accurate representation of the total population under
study is referred to as reliability and if the results of a study can be reproduced under a
similar methodology, then the research instrument is considered to be reliable. Validity on the
other hand determines whether research ‘truly measures’ what it was supposed to measure
and ‘how truthful the research results are’.
3.12 POPULATION AND SAMPLING / SAMPLING DESIGN
In regards to population and data collection methods Saunders (2007) proposes two methods,
first of which is census which is collecting data from every possible member of the
population. It is not entirely possible especially within time constraints give for this project
and access to the population. The second method is sampling, which enables to reduce the
amount of data that needs to be collected by reducing the population to a sample group.
In this research, the selected population are employees and managers of one of Irelands major
call centres. Access to the sample population is fairly easy for the researcher and collection of
data should not pose a problem. Additionally data collection should also be fairly time
economical. Furthermore Saunders (2003) recommends to choose one sampling technique
which will reduce amount of data to be collected.
Based on the defined research objectives, research questions, sampling frame and time
constraints the appropriate choice is the non probability sampling. Saunders (2007) states that

48
a non probability sampling provides ‘a range of alternative techniques to select samples based
on your subjective judgment’. The sampling technique used is convenience sampling, which
is based on the need to obtain the sample as quickly as possible, and where the researcher has
a little control over the contents. Generalisation will be possible in a statistical sense to a
population. Possible bias may arise from implementation of convenience sampling; however
this issue is less valid if there is a little variation in the population. This situation does apply
to the current research.
The target samples for this research are employees and managers of one of Ireland’s major
call centres. The sample population comprises of employees working in an inbound customer
service call centre, therefore similar management and performance measurement methods are
in place. This will also ensure lower possibility of sample bias.
By implementing convenience sampling technique, researcher will distribute the surveys to 2
departments in the call centre. The total number of respondents included in the research is
125, out of which 100 are employees and 25 are managers. Based on the duality of
respondents there are two questionnaires, both with exact same questions, directed however
at either employees or managers. The anticipated population sample is perceived to be a
representative and therefore viable for study within the time constraints.
3.13 DATA COLLECTION METHOD
Saunders et al (2007) states that quantitative data collection method is predominantly used as
a synonym for any technique or data analysis procedure that generates or uses numerical data,
while qualitative analysis is used for non numerical.
In this study data collection method is quantitative and questionnaires are used as data
collection tool. Questionnaires are defined by Hair (2003 et al) as predetermined set of
questions designed to capture data from respondents. Wisker (2001) adds that they are to
gather info directly from people by asking the questions and then using their responses as
data for analysis. Possible obstacles encountered with questionnaires are that respondents
may not feel like filling out the survey, may not feel like reading the questions carefully
therefore providing inaccurate answers.

49
The questionnaire used in this research will be self administered (respondents answer by
themselves (Bryman, 2001). Such technique is proven to be time and money efficient, allows
for respondents to fill out the survey at their own time, however this may prove problematic
if employees need help in answering questions.
In order to correctly edit and collect the questionnaires, the use of Cooper and Schindler’s
(1998) coding method will be applied. That is by assigning numbers to each answer the
researcher will be able to group the responses and easily analyse them statistically.
For the statistical analysis the researcher will implement SPSS software, which will allow to
run frequency tests, calculating mean, mode and median results. Furthermore use of T test
and percentage statistics will be presented in diagrams and tables.
3.14 FRAMEWORK OF THE QUESTIONNAIRE
The design of the questionnaires has been based upon the literature review and the
hypotheses created for this research. All questions relate to performance measurement in a
call centre and its influence on employees job satisfaction. The same set of questions will
apply to employees and managers. The questionnaire comprises of set of 10 questions, all of
which can be answered by choosing from multiple options. The questionnaire has the same
questions, only addressed to either employees or managers. Question 1,2 and 3 are based
around basic information on duration of service and general statistics. Question 4 has 5 sub
questions and a scale answering system, all questions are concerned with the control agents
have over particular tasks. Question 5 is also built with sub questions and answers are scale
based. Both agents are managers are surveyed on the results and achievement of performance
targets. Question 6,7,8 and 9 concentrate on the role of a supervisor. Finally the last question
number 10 has 16 sub questions and a scale answer frame from strongly agree to strongly
disagree. All questions in this part test employees perception of performance measurement
and its’ relation to job satisfaction.

50
3.15 PILOT TEST
In order to test the validity of the survey questions a pilot test has been prepared. The term
pilot study can be used in two different ways; it can refer to feasibility of the questionnaire, a
sort of ‘small scale version[s], or trial run[s], done in preparation for the major study’ (Polit et
al., 2001: 467). The second application can refer to the pre-testing or 'trying out' of a
particular research instrument (Baker 1994: 182-3). The main advantage of the pilot test is
that it may provide advanced warning of where possible problems and errors may occur, also
will alert if applied methods are inappropriate.
Therefore, for the above mentioned reasons a pilot study has been conducted in this research.
It has been applied on a small group of work colleagues who will be later on part of the main
research. The pilot testing proved to be of assistance as the researcher was able to observe
respondents filling out the survey and any possible questions were noted and corrections
applied to the final survey.
3.16 DATA COLLECTION
Collection of data is the core of any research and can be divided into two categories: primary
and secondary data (Saunders et al 2007). For the purpose of this research both primary and
secondary data have been collected
Primary Data is information that is collected directly from first-hand sources by means of
surveys, focus groups, emails etc. While secondary data are interpretations of primary data
(Cooper and Scindler 2008). For the purpose of this research the author has consulted
secondary data such as books, journals, newspapers and websites.
The main advantage of the secondary data is that it allows the researcher to gain an insight
into a particular subject and have an idea of what direction their study could head towards.
However the amount of available sources may prove overwhelming and a sources should be
chosen critically. On the other hand there may be data available on various subjects but not
entirely specific to what a particular thesis is about.

51
3.17 ETHICS
Due to a sensitive nature of a research study involving participation of organisations and their
employees, ethical approach has to be applied throughout. The behaviour of the researcher
has to be appropriate in relation to ‘the rights of those who become the subject of your work
or are affected by it’ (Saunders 2007). According to Saunders (2007) there are two
philosophical views on ethics: deontology and teleology. The deontology stands against any
use of deception in order to gain access or obtain research data. On the contrary, the teleology
is a doctrine of final cause, meaning that for the purpose and richness of the final result acting
unethically might be justified.

52
4. DATA ANALYSIS
The survey has been distributed in two departments in one of the major Irish call centres.
With the help of HR officer there has been 100 surveys distributed to staff and 25 to
managers. For confidentiality purposes the survey has not been explained in any way to
advise the audience of the purpose of the study. This turned out to be a benefit as agents
suspected this survey is part of HR procedures and the returned amount of employee surveys
was 88 and managers 21. Two employee surveys were completed incorrectly and rejected.
The total sample is 86 employee surveys and 21 manager surveys.
4.1 RESULTS
Section 1 of the questionnaire consists of three questions, related to amount of calls taken a
day, whether they were routed correctly to appropriate department and finally the length of
employment.
Question 1. What is the average amount of calls taken a day?
Most frequent responses from agents were 3 (50 calls) and 4 ( 60 calls) which were
represented by 52.3% and 36% respectively. Majority of managers 66.7% chose answer 4 (60
calls).
Question 2. Do you take many calls that should have been routed to a different department?
1% 10%
52%
36%
1%
Employees
30 40 50 60 70+
0% 0%
14%
67%
19%
Managers
30 40 50 60 70+

53
Majority of total respondents opted for answer yes. However employees chose answer yes at
91.9% versus managers who answered yes at 71.4%.
Question 3. How long have you been working in your current job?
Amongst agents it is visible that there is a group of 8 employees who are possibly new hire
and they employment duration is between 0 to 2 years. There are 4 agents working in the
company between 3 to 5 years. Most agents have been working in the company for 5 to 7
years, with 43 respondents and a large group of 30 employees are there for past 8 to 10 years.
Majority of managers have been employed in the organisation for past 8 to 10 years and the
group consists of 18 respondents. While only 1 manager has answered 5 to 7 years and 2
managers chose answer 11 years plus.
`
92%
8%
Employees
yes
no71%
29%
Managers
yes
no
9% 5%
50%
35%
1%
Employees
0 - 2 3 - 5 5 - 7 8 - 10 11+
0% 0% 5%
86%
9%
Managers
0 - 2 3 - 5 5 - 7 8 - 10 11+

54
Having had analysed data statistically there is not much discrepancy observed between the
agents and the managers. The mean result for question 1 is 3.2674 (Employees) and 4.0476
(Managers), which presents agreement on amount of calls take to be between 50 and 60.
Mode result for question 2 is 1 and only 13 respondents out of total 107 states that calls are
routed correctly.(Figure 4.1 and 4.2).
Figure 4.1
Employees
Amount of calls Call routing Length of service
N Valid 86 86 86
Missing 0 0 0
Mean 3.2674 1.0814 3.1395
Median 3.0000 1.0000 3.0000
Mode 3.00 1.00 3.00
Std. Deviation .69323 .27505 .89657
Figure 4.2
Managers
amount of calls Call routing Length of service
N Valid 21 21 21
Missing 0 0 0
Mean 4.0476 1.2857 4.0476
Median 4.0000 1.0000 4.0000
Mode 4.00 1.00 4.00
Std. Deviation .58959 .46291 .38421

55
Question 4 To what extent do you usually have control over:
The next part comprises of a set of sub questions regarding control which agents have over
particular tasks. Respondents are required to answer to which degree they believe they have
Control over tasks from ‘not at all’ to a great deal’. For spss coding purposes 1 has been
assigned to answer ‘a great deal’ and accordingly 5 assigned to answer ‘not at all’. The mode
results for employees has been 4 to most questions, except question relating to control over
lunch breaks for which mode result is 5. Therefore agents believe they have no control at all
to little control over tasks. Managers’ answers were much more varied ranging from mode 2
in question regarding speed of work to 5 in regards to breaks. When comparing employees
and managers question 1 in which we measure control over daily tasks both employees and
managers mode result is 4 (a little control). In regards to the question about speed of work
managers mode result is 2 (a lot) contrary to employees result mode 4 (a little). Next question
performs a check of control over what is said on the call to the customer. This time managers
answers mode result is 3 (moderate level) and employees mode 4 (a little). Question on
control over lunch breaks the answers present mutual agreement whereby both employees
and managers mode result is 5 ( not at all). Finally, in regards to control over settling
customers complaint without having to consult a supervisor employees mode result is 4 (a
little) while managers is 3 (moderate level). For all results please see Figure 4.3 and 4.4
Employees 4.3
Daily tasks Speed of work what you say lunch break complaints
N Valid 86 86 86 86 86
Missing 0 0 0 0 0
Mean 3.5233 3.1860 3.2791 4.5930 3.3140
Median 4.0000 3.0000 3.0000 5.0000 3.5000
Mode 4.00 4.00 4.00 5.00 4.00

56
Managers 4.4
Question 5. How well do you manage to achieve the following targets?
This question is aimed at measuring perceived employee results in areas like average
handling time (AHT), amount of calls per day, adherence, not ready time and sales targets.
Respondents could pick an answer ranging from 1 – great results to 5 – weak results. First
sub question relates to how well agents achieve their AHT most often the answer chosen by
both employees and managers was 2. However mean result differed from 2.79 for employees
and 2.1429 for managers. Second sub question relates to achieving the numbers of calls
required per day. Majority of both employees and managers chose answers 1 (great results)
and 2 (good). Following is a question about adhering to break times, in which both parties
mode result is 2. However mean results of 2.27 for employees and 1.85 for managers
indicates employees tendency to choose option 3 (average results). Next question regarding
not ready time has mode result of 4 for employees and a result of 2 and 3 for managers. Mean
result for employees is 3.32 while for managers it is 2,71. Final question relates to sales
targets and there is a great discrepancy observed in analysed results between employees and
managers, whereby employees perceive their results as not great with a mode result of 4,
while managers mode result is 1 representing great results. Mean result for employees is 3.27
while for managers is 1.42.
Daily tasks Speed of work What you say Lunch break complaints
N Valid 21 21 21 21 21
Missing 0 0 0 0 0
Mean 3.0952 2.5714 2.6667 4.0952 2.7143
Std. Error of Mean .19401 .16288 .17366 .34437 .21977
Median 3.0000 3.0000 3.0000 5.0000 3.0000
Mode 4.00 2.00a 3.00 5.00 3.00
Std. Deviation .88909 .74642 .79582 1.57812 1.00712

57
The next set of questions that is question 6, 7, 8 and 9 are related to supervisor’s role in
employees’ performance. Question 6 is concerned with managers’ availability to help the
agents and employees perception of this is generally positive, with 58% of respondents
agreed that their manager always has time to help, and 28% saying the manager doesn’t have
time. The answer from managers is identical for all respondents at a 100% saying they always
have time to help. In regards to question 7 surveying if the manager is always busy analysing
performance stats both employees and managers we divided in their opinion where
employees we exactly 50% on 50% and 10 managers answered yes (47.6%) and 11 answered
yes (52.4%). Following question (8) measures the ease of finding an answer to a customer’s
query. While employees’ answer is divided, 45 respondents answered ‘no’ which is 52.3%
and 41 answered ‘yes’ at 47.7%; the managers were definitely more agreeable and 20 chose
‘yes’ (95.2%) while only one stated ‘no’ (4.8%). The last question number 9, asks whether
managers help improve agents’ performance. 73 employees answered ‘no’ (84.9%) while
only 13 answered ‘yes’ (15.1%). All managers answered ‘yes’ which is a clear 100%.
AHT No Calls Adherance Not ready Sales
Employee 2.79 1.89 2.27 3.32 3.27
Manager 2.14 1.33 1.85 2.71 1.42
00.5
11.5
22.5
33.5
me
an
Question 5

58
Section 10 of the questionnaire comprises of 16 questions with an answer range from strongly
agree to strongly disagree. The first question in this set states that agents learn a lot from call
quality sessions, 60.5% of agents disagree versus 61.9% of managers who agree with the
statement.
my manager hastime to help me
my manager isalways busy
analysing stats
it is easy for me tofind help
my manager helpsimprove myperformance
No 32.60% 50% 52.30% 84.90%
Yes 67.40% 50% 47.70% 15.10%
0.00%
20.00%
40.00%
60.00%
80.00%
100.00%
120.00%
Employees
I always have time tohelp agents
I am always busyanalysing
performance stats
It is easy for agentsto find help
I help my agentsimprove theirperformance
No 0.00% 52% 4.80% 0.00%
Yes 100.00% 48% 95.20% 100.00%
0.00%
20.00%
40.00%
60.00%
80.00%
100.00%
120.00%
Managers

59
Second question is suggesting that call monitoring is too intensive has a response of 65.1%
agents that agree and only 47.6% of managers that agree. Question 3 in this section states that
agents feel worried because they have to mention too many things on the call and 74.4% of
agents strongly agree and agree, while managers are actually 76.2% that strongly agree and
agree. The following question claims that agents could help customers better if they could
stay longer on the call. The results are suggesting that 86.1% of employees are in an
agreement with this statement, while percentage of managers that agree is 52.4%. In regards
to feeling motivated by good performance results 87.2% of employees agree while all
managers agree (100%). Sub question number 6 states that angry customers have a negative
impact on agents well-being 68.8% of agents agree while managers also agree however the
result is higher at 76.2%. Another question relates to satisfaction agents get when they can
help their customers, nearly majority of employees 94.2% strongly agree and agree, while
managers also agree at 95.2%. When asked if agents’ performance targets limit the quality of
service they provide agents strongly agree and agree at 75.5%, however 81% of managers
disagree with this statement.
Strongly agree Agree Strongly disagree Disagree
Employees 2.30% 15.10% 60.50% 22.10%
Managers 28.60% 61.90% 9.50% 0%
0.00%10.00%20.00%30.00%40.00%50.00%60.00%70.00%
Agents learn a lot from call quality sessions
Strongly agree Agree Strongly disagree Disagree
Employees 8.10% 67.40% 22.10% 2.30%
Managers 14.30% 4.80% 81.00% 0%
0.00%
20.00%
40.00%
60.00%
80.00%
100.00%
Performance targets limit quality of service

60
Sub question number 9 states that agents provide excellent service at the expense of their
stats with which 90.7% of agents strongly agree and agree, and only 28.6% of managers
agree, while majority of managers disagree (61.9%). Next question states that managers in
the organisation have a very good understanding of what the customer wants 90.7% of
employees strongly disagree and disagree while 47.6% of managers agree and 52.4% strongly
agree.
Next question is related to stress and states that agents would provide better customer service
if they had less work stress to which 87.2% of employees strongly agree and agree while
61.9% of managers also agree however 38.1% of them disagree. Sub question number 12
states that agents have too little time to do follow ups, with which 82 agents strongly agree
and agree (94.2%) and only 28.6% of managers agree while majority disagree (57.1%).
Strongly agree Agree Strongly disagree Disagree
Employees 2.30% 7.00% 39.50% 51.20%
Managers 52.40% 47.60% 0.00% 0%
0.00%10.00%20.00%30.00%40.00%50.00%60.00%
Management has a very good understanding of what the
customer wants
Strongly agree Agree Strongly disagree Disagree
Employees 77.90% 16.30% 4.70% 1.20%
Managers 9.50% 28.60% 57.10% 5%
0.00%
20.00%
40.00%
60.00%
80.00%
100.00%
Agent have too little time for follow ups

61
Next question states that agents feel overwhelmed with information required to do the job and
here although 41 agents agree (47.7%) at the same time 32 disagree (37.2%). On the
managers side opinions are also divided both 9 managers agree and 9 disagree (42.9%) and
only 3 managers strongly agree (14.3%). Question number 14 states that getting trained for
different business areas helps career agents’ development with which majority of agents
disagree (41.9%) and strongly disagree (25.6%), and on the contrary majority of managers
agree (42.9%) and strongly agree (52.4%).
The following sub question number 15 states that agents are rewarded for the quality of their
efforts and the employees disagree with the statement (51.2%) and strongly disagree (29.1%),
and managers are of the opposite opinion where 38.1% agree and 57.1% strongly agree. The
final question states that overall agents are satisfied with their job, with 36 agents strongly
agree and agree (41.8%) and 50 agents strongly disagree and disagree (58.2%). Managers
believe agents are over satisfied with their job with 18 managers strongly agreeing and
agreeing (85.7%) and only 3 managers disagree (14.3%).
Strongly agree Agree Strongly disagree Disagree
Employees 4.70% 27.90% 41.90% 25.60%
Managers 52.40% 42.90% 4.80% 0%
0.00%10.00%20.00%30.00%40.00%50.00%60.00%
Getting trained for different business areas helps agents'
career development
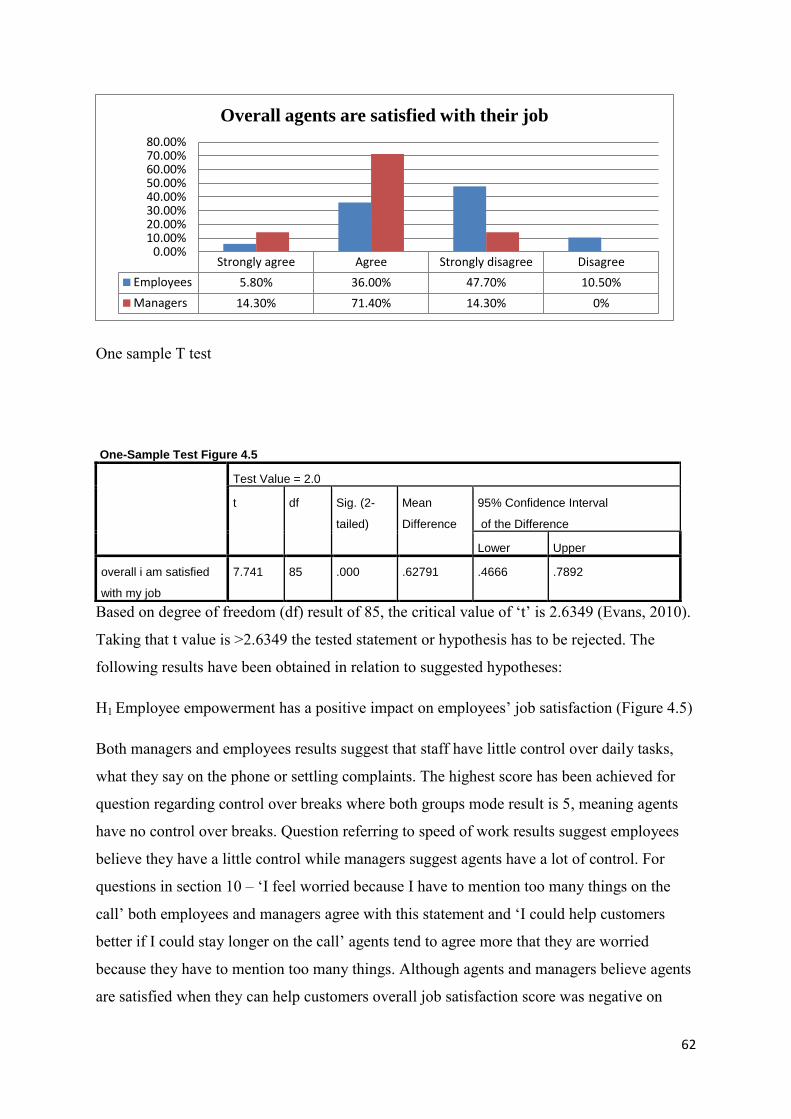
62
One sample T test
Based on degree of freedom (df) result of 85, the critical value of ‘t’ is 2.6349 (Evans, 2010).
Taking that t value is >2.6349 the tested statement or hypothesis has to be rejected. The
following results have been obtained in relation to suggested hypotheses:
H1 Employee empowerment has a positive impact on employees’ job satisfaction (Figure 4.5)
Both managers and employees results suggest that staff have little control over daily tasks,
what they say on the phone or settling complaints. The highest score has been achieved for
question regarding control over breaks where both groups mode result is 5, meaning agents
have no control over breaks. Question referring to speed of work results suggest employees
believe they have a little control while managers suggest agents have a lot of control. For
questions in section 10 – ‘I feel worried because I have to mention too many things on the
call’ both employees and managers agree with this statement and ‘I could help customers
better if I could stay longer on the call’ agents tend to agree more that they are worried
because they have to mention too many things. Although agents and managers believe agents
are satisfied when they can help customers overall job satisfaction score was negative on
Strongly agree Agree Strongly disagree Disagree
Employees 5.80% 36.00% 47.70% 10.50%
Managers 14.30% 71.40% 14.30% 0%
0.00%10.00%20.00%30.00%40.00%50.00%60.00%70.00%80.00%
Overall agents are satisfied with their job
One-Sample Test Figure 4.5
Test Value = 2.0
t df Sig. (2-
tailed)
Mean
Difference
95% Confidence Interval
of the Difference
Lower Upper
overall i am satisfied
with my job
7.741 85 .000 .62791 .4666 .7892

63
agents’ side (58.2%) while managers believe agents are satisfied (85.7%). Based on t test
result it suggests the statement has to be rejected, therefore agents overall are not satisfied
with their job, which is supported by percentage realisation of the answer at 58.2%.
H2 Training has a positive impact on employees’ job satisfaction.
Questions related to training measured if agents are overwhelmed with information required
to do the job and if training for different areas helps their career. (Figure 4.6)
One-Sample Test Figure 4.6
Test Value = 1.52
t df Sig. (2-
tailed)
Mean
Difference
95% Confidence Interval
of the Difference
Lower Upper
getting trained for
different bus areas
helps my career
14.949 85 .000 1.36372 1.1823 1.5451
The t value is >2.6349 therefore the statement is rejected. Agents don’t believe training is
aiding their career, which will be related to negative result for job satisfaction. The
hypothesis has to be rejected. Additionally information supplied to agents in the call centre is
overwhelming mean results are 2.32 for employees and 2.28 for managers, which would
contribute to negative impact of training on job satisfaction.
H3 Performance measurement has a negative impact on job satisfaction (Figure 4.7)
One-Sample Test
Test Value = 2.66
t df Sig. (2-
tailed)
Mean
Difference
95% Confidence Interval of
the Difference
Lower Upper
performance targets
limits quality
-7.275 85 .000 -.47395 -.6035 -.3444
(Figure 4.8)

64
One-Sample Test
Test Value = 2.52
t df Sig. (2-
tailed)
Mean
Difference
95% Confidence Interval of
the Difference
Lower Upper
excellent cust serv at
expense of my stats
-11.284 85 .000 -.81070 -.9535 -.6678
Both t test results above (Figure 4.7 and 4.8) indicate that the statements have to be accepted.
Therefore both performance targets limit employees quality of service and excellent customer
service is provided at the expense of agents’ stats results. This will prove the hypothesis that
performance measurement has a negative impact on employee job satisfaction.
H4 Performance monitoring has a negative impact on job satisfaction. (Figure 4.9)
One-Sample Test
Test Value = 2.23
t df Sig. (2-
tailed)
Mean
Difference
95% Confidence Interval of
the Difference
Lower Upper
call monitoring too
intensive
.366 85 .715 .02581 -.1144 .1661
Based on the result of the t test above (Figure 4.9) the t value is <2.6349, therefore the
statement is rejected. This would lead to also reject the hypothesis that performance
monitoring has a negative impact on job satisfaction. Although agents are not greatly satisfied
with their job, they don’t believe call monitoring is too intensive.

65
5. CONCLUSIONS
This chapter is an analysis of the results in chapter 4 and its reference to literature review in
chapter 2. The research objective was to analyse various performance measurement aspects
that influence call centre employees’ job satisfaction.
Agents in the call centre take an average of 60 calls day, many of which should have been
routed to another department. This issue has been recognized by both employees and
managers. As noted previously in literature review by Marr and Neely (2004) inefficiencies
are caused in the process by different departments generating demand for another one.
Authors suggested that these inefficiencies should be detected by agents, however if reported
and not acted upon management will continue to cause illusion that the centre is busy and
productive.
The researched unit employs majority of agents for the past 5 to 10 years, and only 14% are
new hire. This may prove difficult in centre management as noted by Tatichi (2010) culture
within the company may obstruct changes or ease of adjustment to requirements for longer
employed staff.
The research clearly indicates that control over daily tasks, breaks, what is said to the
customer or even speed of work is very limited for the agents. This has confirmed what has
been stated in the literature that low discretion increases levels of stress and therefore reduces
job satisfaction. Interestingly, not only employees but also managers are aware of the low
control levels in the tested unit.
The survey aimed to study employees own perception of their performance results,
interesting gap has been captured between the results of employees and managers, whereby
managers believe the results are much better than what the employees think. This could have
resulted from each managers personal view of their own team or subconscious desire to
portrait their agents as successful high achievers.
In the researched centre managers are more often than not available to help their employees,
and maybe only half the time busy with calculating performance results. However, when
asked if managers help agents improve their performance majority of employees answered
no. This poses a question whether the role of a manager is utilized to the optimum.
Furthermore, an assumption may be made that yet again performance measurement is
66
performed in excess and possibly is provided in a form of ‘automatic reporting’. Providing
agents with just plain results and being able to build constructive support for the agents
development would suggest the measurement missed its’ goal.
Further performance measures like call duration not only negatively influence the agents but
also customer service. Majority of agents agreed that if they could stay on the call longer they
would be able to provide better service. Perhaps, they could address all customers issues or
address a particular issue there and then instead of having to refer them to someone else. The
limitation caused by performance targets although it is experienced by agents it is denied by
management. Moreover, agents strongly believe that management doesn’t have a full
understanding of the customers’ needs, which does sound alarming. If the managers are not
fully cooperating with the demand and the requirements from their customers, they wont be
interested in listening to their employees either.
Another strong view point from employees is that they are suffering from lack of time spent
on follow ups. The call centre which has been the base of the research is involved in slightly
more advanced procedures which many require follow ups and have specific lead times. Not
all calls can be closed within 3 minutes without a call back or further actions. For quality
purposes and the fact that all actions have to be documented in systems agents require more
‘not ready’ time to complete their work. This standpoint is not recognised by management
who believe that the time given is enough.
In regards to training, as stated in literature review more training could lead to improved
average handling time, Holman (2007) also reported that call centre employees require on-
going training. The specific environment of a call centre dictates constant changes of
packages, prices or information, this have to be fed to employees. Also, in order to develop
and grow within the company agents have to be trained via various channels. In turn, agents
who believe the company is interested in investing in their skills will give back to the
organisation and be willing to work harder. The survey however revealed that employees
believe training offered to them doesn’t help in their career development. This is contrasted
by managers who stated to the contrary.
Finally, the point to which the whole performance measurement relates to – job satisfaction.
There are two sides to satisfaction of every job, either you like the job or you like where you
work. With call centres it is very similar, as the job might not be complex or highly aspiring
but maybe for some better than for instance retails. Even if someone is not particularly keen

67
on call centre, it might still be a pleasant experience if the atmosphere in the job is right, if
the employees are treated correctly and if their efforts are rewarded. However, when
management keeps on pressurising agents with excessive performance measurement,
monitoring, lack of control it all leads to stress, unhappiness and lack of satisfaction. When
asked about satisfaction employees answered that they are not entirely satisfied. The
managers, on the other hand, believe that agents are satisfied. We have reached yet another
clash of answers, and interesting question may be asked: ‘Are the managers aware that agents
are not satisfied’? Maybe the management is not entirely interested in agents’ job satisfaction,
hence all pressure, monitoring and measurement has been applied on purpose. Maybe yet
again in a ‘communications’ company there is lack of communication? Simple dialogue
started between two parties may reveal how vast the gap between their perceptions of the
same workplace is.
Not forgetting the most important variable in this scenario the customer, agents in the tested
sample are definitely interested in helping the customers. They can do so to the extent of
forfeiting their own results, which more than likely are linked to their bonuses, in order to
provide better customer service. It is clear that agents are willing to go the extra mile, maybe
they should be given a chance, more leniency, and more opportunities to use their time
productively. This would be an interesting study to test the same call centre with the totally
opposite performance measurement techniques and management style and to make the
difference clear a financial analysis should be prepared.
68
6. REFLECTIONS
"The essence of knowledge is, having it, to apply it; not having it, to confess your ignorance."
Confucius
The purpose of this chapter is to analyse the learning process during the MBA course, and
reflect upon the skills developed throughout the course and the dissertation.
6.1 LEARNING STYLES
Learning styles could be defined as ‘characteristic cognitive, affective and psychological
behaviour that indicate how learners perceive, interact with, and respond to learning
environment’ (Fatt and Joo 2001). It has been observed that people tend to adapt to a
particular strategy in learning. Furthermore, depending on the situation individuals tend to
use different type of learning styles depending on the situation. In 1970 a theory has been
developed by David Kolb states that individuals differ in how they learn. The author depicted
learning as a circular process which follows four different stages. Kolb’s Learning Style
Model (1984) (see Figure 6.1) presents the four stages which follow one another: Concrete
Experience, Reflective Observation, Abstract conceptualization and Active Experimentation.

69
Figure 6.1 Kolb's Learning Style Model 1
Based on Kolb’s model, Honey and Mumford (1986) identified four learning styles: activist,
reflector, pragmatist and theorist. Each of these styles relates to a stage in Kolb’s learning
cycle (1984). The reflector is a person that prefers to observe and think about what happened.
They prefer to view things from different perspectives, collecting data and planning towards
the conclusion. Activist is a person who learns by doing, has an open-minded approach to
learning, and enjoys being fully involved in new experiences. Theorist is someone who
investigates the theory behind the actions. Such a person requires models, concepts and facts
before they can engage in learning. They enjoy analysing and synthesising in order to
formulate data into a logical theory. Finally, a pragmatist is someone who needs to be able to
see the connection between learning and the reality. Any theory or abstract are ‘empty’ if it
cannot be tested or put into action. As a part the MBA course, during the International
Management module the researcher was required to fill out the Honey and Mumford’s
learning style questionnaire. The results of this experiment suggest that the researcher is
predominantly a pragmatist, which suggests that learning is most effective when linked to
real life situation. The results suggest that not as strongly but equally the researcher is also a

70
reflector and a theorist, which is someone that views things from various perspectives, likes
to plan ahead and benefits from theories and models within a logical and structured
environment.
The pragmatist has definitely a dominant style for the researcher, which has been noticed
throughout the course of the masters programme, and also via various group assignments and
even within work environment. The idea that supports researchers belief that there is no point
in gathering knowledge if that knowledge cannot be put to test or to practice. And although
researcher’s preferred learning styles are also reflector and theorist, having to implement
reflection within the study it has become clear that although the activist style may not be
preferred however it may be something worth evaluating and developing in future. Managing
is a complex process and sometimes requires dealing with various issues, people,
personalities and scenarios, not always we can adjust the learning style we prefer and
sometimes we have to learn the hard way, that is for the reasercher to be more of an activist,
someone who dares entre new business challenges and enjoys working with others.
6.2 DEVELOPMENT OF SKILLS
Having completed a bachelor degree in Poland, in an area unrelated to business, the
researcher was reserved and unsure of whether the current skillset will be sufficient to
commence the MBA programme. The researcher also feared the differences in the
educational system and especially marking scheme between Ireland and Poland, which
although not at first but in the later part of the course have proven be a slight issue. However
upon in depth reflection the researcher was able to analyse what the differences are and how
to overcome them. The results were high increases in module grade and exam results, which
proved to be very satisfactory and motivational.
6.2.1 Group work
From the very beginning of the masters programme all students were assigned into groups
and given a subject to work on. Although in a way the researcher has been working in groups
at work, in previous schools it is not the most comfortable format. As person who would

71
rather watch from outside or work on their own, it was slightly challenging. The group format
itself however was not as challenging as what happened next. The group dynamics proved to
be tense and stressful, yet at the same time highly educational. The same way there has been
friction between group members, there is always friction between co-workers and managers
in any business, to be able to observe this clash and analyse its’ impact on the project result
has given the researcher possible insight into how to deal with groups in future, so that the
personalities and group management has a positive impact on the final result. Additionally,
meeting new people is not entirely a stress free experience for the researcher, and as a
business course students were often required or ‘forced’ into forming groups during classes
especially on Operations Management class. In each week, every person attending the class
had to form a new group with people they were never in a group before. The stress level was
definitely rising for the researcher however it possibly proved highly beneficial as this was an
opportunity to meet new people who later on became friends and who knows one day may be
helpful in the business world.
6.2.2 Data collection and literature review.
Although the experience of receiving a negative feedback might not be a pleasant one, it is
what we learn from it that matters. As part of an assignment for International Business and
Trade (IBT) class the researcher was required to submit a group project which was later on
reviewed in an interview type of assessment. During the assessment one of the teachers kept
on insisting on lack of support for the formulation of statements in the assignment. This has
been an interesting remark, which the researcher kept in their mind for a while, and could not
abandon the thought. Upon the second year of the course, with this remark in mind the
researcher applied a different approach to assignments and decided to access all available
sources to learn the correct way of supporting ideas and referencing. Although the memory of
the IBT interview was not a pleasant one, it was priceless! The results of researchers further
work have been much better than before and it has given the researcher much needed
motivation to aim at even better results and prepared for the commencement of the
dissertation. Final test before the thesis was a literature review project required for the
Performance Management class. Having applied all knowledge and the lesson learnt from
IBT, once again the researcher has proven to be successful.

72
6.2.3 Time Management
In order to prepare quality material for any project, time management is of essence and has to
be adhered to. Although the researcher does not have problem with submitting any work on
time, the issue lies in the even distribution of the time available. It is the researcher’s
weakness to leave a portion of work for later, and even though this does not have impact on
the quality of work, unless a study can be conducted to actually measure this. There is a
sensation of pressure and stress that mounts upon the researcher when the due date becomes
nearer, however at the same time this pressure becomes utmost motivating and productive.
Baring in mind that the dissertation project is stretched across a longer yet still limited time,
the researcher decided to prepare as much as possible as early as possible. This resulted in
most of the work done on literature review completed early enough. The next part of the
dissertation unexpectedly created panic. As a part of the quantitative research it is required to
prepare questionnaires, which have to be distributed among employees of the call centre. The
distribution and collection of the surveys was smooth and time efficient, however what
unexpectedly proven time consuming were negotiations and meetings with the management
in regards to the content and distribution of the survey. Conducting of the research has been
delayed by about three weeks by the aforementioned negotiations. Although it has created
panic and stress, instead of being angry or disappointed the researcher decided to learn from
this experience. Therefore in future the researcher will be aware when involving any other
parties into a project, the pressure on time constraints has to be placed on those parties and
caution has to be taken in order to prevent project failure.
6.2.4 Critical thinking
As mentioned before the researcher having had completed the undergraduate degree in
Poland has been accustomed to an entirely different method of studying and grading system.
What has been the greatest shock to the researcher when going through various exams and
assignments throughout the masters course was the constant impact placed on the critical
thinking. Nearly every single class assignment, written project or exam’s task instruction
included words like ‘critical thinking’ or ‘critically analyse’. As much as the written
assignments were directly indicating demand for critical analysis, the exams were not this
straightforward. Yet again, the lesson has been learnt thanks to IBT. It was also the first
exam of the whole course, therefore the researcher approached it the best way known to

73
themselves: ‘learn as much as possible by heart’ and so poured all this remembered
information on the paper and walked out of the exam room satisfied with the answers. Much
to researchers surprise the result was not great. This has caused for reflection. Questions kept
coming to researchers mind: ‘What went wrong?’, ‘where did I make a mistake?’. As more
exams were approaching it began to become clear when teachers were indicating specific
subject for revision, that the previously applied approach has been completely incorrect. The
researcher understood the weight of critical thinking, the importance of connecting notions
and theories with events and business examples, rather than remembering by heart raw tables,
structure, formulas, dates or names. The results were also confirming suspected approach,
and thanks to all the experiences the researcher was able to apply this knowledge in the
dissertation.
6.3 CONCLUSIONS
The researcher has arrived in Ireland in 2005 with the purpose to undertake a masters
programme and due to various life situations this plan has been delayed. First attempt to enrol
into a course has been made in 2009, however the course has been cancelled due to lack of
applicants. It was not until 2011 when the researcher applied for the course and finally after
many years sat again in a classroom. There have been many questions and doubts whether I
can make it, without business background, in a foreign country. Yet, here I am conducting
research, completing my dissertation, thinking critically, making first steps into the business
world. Although, it is a scary, power hungry, money making world, this is the world I have
been prepared to entre. I believe by completing the MBA programme I have been given the
best tools which I can use all around the world, in whatever business I venture into. I am
grateful for this opportunity and I hope I will make the best of it.

74
7. BIBLIOGRAPHY
Alferoff, C. and Knights, D. (2008), ‘Customer relationship management in call centers, the
uneasy process of re(form)ing the subject through the people-by-numbers’ approach’
Information and Organization 18(1), pp. 29-50
Andreu, R. and Sieber, S. (2005), ‘Knowledge integration across organizations how different
types of knowledge suggest different integration trajectories’ Knowledge and Process
Management 12(3), p. 153-160
Ashill, N. Rod, M. Thirkell, P. and Carruthers, J. (2008) ‘Job resourcefulness, symptoms of burnout and service recovery performance: an examination of call centre frontline employees’ Journal of Services Marketing 23(5), pp. 338-350
Blaikie, N. (1993). Designing Social Research, Cambridge, UK. Polity Press
Birkinshaw, J. (2005), ‘Knowledge moves’ Business Strategy Review 16(4), pp. 587-597
Breathnach, P. (2002), ‘Information technology, gender segmentation and the relocation of
back office employment’ Information, Communication & Society 5(3), pp. 320-335
Bourne, M. (2008) ‘Performance measurement: learning from the past and projecting the future’, Measuring Business Excellence 12(4), pp. 67-72.
Chou, T (2011), ‘Exploring call center-enabled organizational mechanisms associated with combinative capabilities’ Management Decision 49(6), pp. 841-859
Chalykoff, J. and Kochan, T.A. (1989), ‘Computer-aided monitoring: its influence on employee job satisfaction and turnover’ Personal Psychology 42(4), pp. 807-834
Chen, J. and Silverthorne, C. (2008) ‘The impact of locus of control on job stress, job performance and job satisfaction in Taiwan’ Leadership and Organization Development Journal 29(7), pp. 572-582
Doellegast, V. and Sezer, L. (2012) ‘Making the right call redesigning call centres from the bottom up’
De Waal, A. and Counet, H. (2008) ‘Lessons learned from performance management systems implementations’ International Journal of Productivity and Performance Management 58(4), pp. 367-390.
Easterby-Smith, M. (2002), ‘Management research: introduction’ Business Economics

75
Evans, J.R. (2010), Statistics, data analysis, and decision modelling. New Jersey: Peason.
Fukushima, A. and Pierce, J. (2011), ‘A hybrid performance measurement framework for optimal decisions’ Measuring Business Excellence 15(2), p. 32-43
Gilmore, A. (2001) ‘Call centre management: is service quality a priority?’ Managing Service
Quality, 11(3), pp. 153-159
Gilmore, A. (2001), ‘Call centre management: is service quality a priority? Managing service Quality 11(3), pp. 3-11
Garavan, N.T., Wilson, J.P., Cross, C. and Carbery, R. (2008), ‘Mapping the context and practice of training, development and HRD in European call centres’ Journal of European Industrial Training 32(8/9), pp. 612-728
Hingst, R. (2006) ‘Perceptions of working life in call centres’ Journal of Management Practice 7(1), pp. 1-9
Haas, M.R. and Hansen, M.T. (2005), ‘When using knowledge can hurt performance: the
value of organizational capabilities in management consulting company’ Strategic
Management Journal 26(1), pp. 1-24
Holman, D., Batt, R. and Holtgrewe, U. (2007), ‘Global call centre report: international
perspectives on management and employment’
Holdswoth, L. and Cartwright, S. (2002) ‘Empowerment, stress and satisfaction: an exploratory study of a call centre’ Leadership and Organizational Development Journal 24(3), pp. 131-140
Jaiswal, K (2008) ‘Customer satisfaction and service quality measurement in Indian call centres Managing Service Quality 18(4), pp. 405-416
Jobs, C., Burris, D. and Butler, D. (2007), ‘The social and economic impact of the call center
industry in Ireland’ International Journal of Social Economics 34(4), pp. 276-289
Jack, E.P., Bedic, T.A. and McCary, C.E. (2006), ‘Operational Challenges in the call cener
industry: a case study and resource-based framework’ Managing Service Quality 16(5), pp.
477-500
Kinnie, N., Hutchison, S. and Purcell, J. (2000), ‘’Fun and surveillance’: the paradox of high commitment management in call centres’ International Journal of Human Resource Management 11(6), pp. 967-985
76
Knights, D., & McCabe, D. (1998). ‘What happens when the phone goes wild? Staff, stress and spaces for escape in a BPR telephone banking call regime’ Journal of Management Studies 35, pp. 163–194
Kaplan, R. and Norton, D. (1996), The Balanced Scorecard: Translating Strategy into Action Harvard Business School Press, Boston, MA.
Kaplan, R. and Norton, D. (2004), The Strategy Maps Harvard Business School Press, Boston, MA
Labach, E. (2010), ‘Improving customer retention through service quality at call centres’
International Journal of Management and Information System 14(3), pp. 71-76
Liu, X., Ruan, D. and Xu, Y. (2005), ‘A study of enterprise human resource competence
appraisement’ Journal of Enterprise Information Management 18(3), pp. 289-315
Marr, B. and Neely, A. (2004), ‘Managing and measuring for value: the case of call centre
performance’ Research Report for Cranfield School of Management
Malhotra, N. and Mukherjee, A. (2004), ‘The relative influence of organisational
commitment and job satisfaction on service quality of customer contact employees in banking
call centre’ Journal of Service Marketing 18(3), pp. 162-174
MacBryde, J. Paton, S. Grant, N. and Bayliss, M. (2011) ‘Performance measurement driving change: a case from the defence sector’ International Journal of Productivity and Performance Management 61(5), pp. 462-482
Marr, B. and Parry, S. (2004), ‘Performance management in call centres: lessons, pitfalls and achievements in Fujitsu Services’ Measuring Business Excellence 8(4), pp. 55-62
Muchinsky, P. (1993), ‘Psychology applied to work: An introduction to industrial/ organizational psychology’ L.A: Brooks/Cole
Neely, A. Gregory, M. and Platts, K. (1995) ‘Performance measurement system design: a literature review and research agenda’, International Journal of Operations & Production Management 15(4), pp.80-116.
Neely, A. in conversation with Powell, S. (2004) ‘The challenges of performance measurement’, Management Decision 42(8), pp. 1017-1023.
Osarenkhoe, A. and Bennani, A. (2007), ‘An exploratory study of implementation of customer relationship management strategy’ Business Process Management 13(1), pp. 139-164

77
Pongatichat, P. and Johnston, R. (2008), “Exploring strategy-misaligned performance measurement”, International Journal of Productivity and Performance Management 57(3), pp. 207-22.
Piercy, N. and Rich, N. (2008) ‘Lean transformation in the pure service environment: the case of the call service centre’ International Journal of Operative Production Management 29(1), pp. 54-7
Richardson, R. and Gillespie, A. (2003), ‘The call of the wild: call centres and economic
development in rural areas’ Growth and Change, 34(1), pp. 87-108
Robinson, G Morley, C (2006), ‘Call centre management: responsibilities and performance International Journal of Service Industry Management 17(3), pp. 284-300
Reynolds, P. (2010) ‘Call center metrics: best practices in performance measurement and management to maximize quitline efficiency and quality’ for North American Quitline Consortium
Ruyter, K. Wetzels, M. and Frinberg, R. (2001) ‘Role stress in call centers: it’s effects on employee performance and satisfaction’ Journal of Interactive Marketing 15(2), pp. 23-35
Sawyerr, O.O., Srinivas, S. and Wang, S. (2008), ‘Call centre employee personality factors
and service performance’ Journal of Service Marketing 23(5), pp. 301-317
Sharma, M. and Rina, R.L. (2011), ‘Job stress of call centre employees’ International Conference on Technology and Business Management
Saunders, M., Lewis, P. and Thornhill, A. (2007), Research Methods for Business Students, 4th Edition, Essex, FT Prentice Hall.
Taticchi, P. Balanchandran, K. and Tonelli, F. (2012) ‘Performance measurement and management systems: state of the art, guidelines for design and challenges’ Measuring Business Excellence 16(2), pp. 41-54.
Taticchi, P. Tonelli, F. and Cagnazzo, L. (2010) ‘Performance measurement and management: a literature review and a research agenda’ Measuring Business Excellence 14(1), pp. 4-18.
Talluri, S. and Sarkis, J. (2002), “A model for performance monitoring suppliers”, International Journal of Production Research 40(16), pp. 4257-69
Upal, M. (2008) ‘Telecommunication Service Gap: Call Center Service Quality Perception and Satisfaction’ Communications of IBIMA 3(1), pp. 18-27

78
Vokurka, R. (2004), “Operationalizing the balanced scorecard using the Malcolm Baldrige criteria for performance excellence (MBCPE)”, International Journal of Management and Enterprise Development 1(3), pp. 208-17.
Varca, P.E. (2006), ‘Telephone surveillance in call centers: prescription for reducing straing’ Managing Service Quality 16(3), pp. 290
Visser, W. A. and Rothmann, S. (2008). Exploring antecedents and consequences of burnout in a call centre’ South African Journal of Industrial Psychology 34(2), pp. 79-87
Williams R. (2002), ‘Managing Employee Performance: Design and implementation in Organisations’ London: Thomson Learning
Wegge, J. Dick, R. and Bernstorff, C. (2009) ‘Emotional dissonance in call centre work’ Journal of Managerial Psychology 26(6), pp. 596-619
Xu, M. and Walton, J. (2005), ‘Gaining customer knowledge through analytical CRM’
Industrial Management and Data Systems 105(7), pp. 955-971
The Internet Hill-Willson, M. (2013) ‘What should a future performance management system look like? http://www.callcentrehelper.com/what-should-a-future-performance-management-system-look-like-37317.htm
Jukes, M. (2013) ‘Why reducing call duration may be missing the point! http://www.callcentrehelper.com/why-reducing-call-duration-is-missing-the-point-38510.htm
Curry and Lyon 2008 in McAdam (2009) http://www.nice.com/first-contact-resolution
http://www.socialresearchmethods.net/kb/intval.php
Shearer, N. (2013) ‘Work related stress’ Available at: http://www.huffingtonpost.co.uk/natasha-shearer/work-related-stress-business_b_3545476.html
Sylvester, J. (2010) ‘High rates of staff turnover could cost call centres £2 billion in next year’ Available at:
http://www.callcentrehelper.com/high-rates-of-staff-turnover-could-cost-call-centres-2-billion-in-the-next-year-14074.htm
79
‘Call centres could become ‘hotbeds of dissent’ www.systemsthinking.co.uk/6-8.asp Accessed 21/06/2013
Haider, A. and Bierly, S. (1998) ‘Integrating deductive and inductive approaches in a study of new ventures and customer perceived risk’ Available at: https://dspace.lib.cranfield.ac.uk/retrieve/629/swp3990.pdf
Price, I. (2000) Available at:
http://www.une.edu.au/WebStat/unit_materials/c1_behavioural_science_research/research_hypoth_predict.html
O’Leary, Z. (2007), Available at:
http://srmo.sagepub.com/view/the-social-science-jargon-buster/n114.xml)
Golafshani, N. (2003), Available at:
http://www.nova.edu/ssss/QR/QR8-4/golafshani.pdf
Joppe, M. (2000). The Research Process.Retrieved February 25, 1998, from http://www.ryerson.ca/~mjoppe/rp.htm
Teijlingen, E. (2001) Available at:
http://sru.soc.surrey.ac.uk/SRU35.html
Honey and Mumford learning test Available at:
http://www.science.ulster.ac.uk/nursing/mentorship/docs/nursing/oct11/Learning%20Styles%20Questionnaire%20%20short%20version%20Aug10.pdf
http://www.irishexaminer.com/business/features/my-job-when-contact-centres-come-calling-222011.html Irish workforce call centre employee numbers
http://www.cpl.ie/Content/uploads/salary-survey/ Irish call centre salary (2013)

80
8. APPENDICES
1.) Employee’s survey
EMPLOYEE SURVEY
1.) What is the average amount of calls you take a day?
◌30 ◌40 ◌50 ◌60 ◌70+
2.) Do you take many calls that should have been routed to a different department?
◌ Yes ◌ No
3.) How long have you been working in your current job?
◌ 0-2 years ◌ 3-5 ◌5-7 ◌8-10 ◌ 11+
4.) To what extent do you usually have control over:
Task
Not at all A little Moderate Level
A lot A great deal
Your daily work tasks ◌ ◌ ◌ ◌ ◌ The speed at which you work ◌ ◌ ◌ ◌ ◌ What you say to the customer ◌ ◌ ◌ ◌ ◌ Setting your daily lunch break ◌ ◌ ◌ ◌ ◌ Settling customers complaint without having to consult a supervisor
◌
◌
◌
◌
◌
5.) How well do you manage to achieve the following performance targets?
1 means you achieve great results and 5 means you are struggling to achieve your targets
Task 1 Great Results
2 3 4 5 Weak Results
AHT average handling time ◌ ◌ ◌ ◌ ◌ Number of calls per day ◌ ◌ ◌ ◌ ◌ Adhering to break times ◌ ◌ ◌ ◌ ◌ Not ready time ◌ ◌ ◌ ◌ ◌ Sales targets ◌ ◌ ◌ ◌ ◌
6.) My supervisor has always time to help me Yes / No

81
7.) My supervisor is always busy analysing my performance stats Yes / No
8.) I can always easily find help if need an answer to a customer query Yes / No
9.) My supervisor helps me improve my performance Yes / No
10.) To what extent do you agree or disagree with the following statements?
I learn a lot from my call quality sessions
I find call monitoring is too intensive
I often feel like a robot because I have to mention too many things on the call I am willing to have a high AHT (average call handling time)
if it means I can better help the customer
When I get good performance results I feel motivated
to work harder
Angry customers have a negative impact on my well-being
I feel satisfied when I can help customers
I often find my performance targets limit the
quality of service I provide
I often provide excellent customer service
at the expense of my stats
Management in my organisation has a very good
understanding of what the customer wants
I could help my customers better if I could stay longer
on the call
I have too little time to do follow ups
I feel overwhelmed with information I need to do my job
Getting trained for different business areas
helps my career development
Strongly disagree
Disagree Agree Strongly Agree

82
I am rewarded for the quality of my efforts
Overall I am satisfied with my job
THANK YOU
2.) Manager’s survey
MANAGERS’ SURVEY
1.) What is the average amount of calls your agents take a day?
◌30 ◌40 ◌50 ◌60 ◌70+
2.) Do they take many calls that should have been routed to a different department?
◌ Yes ◌ No
3.) How long have you been working in your current job?
◌ 0-2 years ◌ 3-5 ◌5-7 ◌8-10 ◌ 11+
4.) To what extent do your agents usually have control over:
Task
Not at all A little Moderate Level
A lot A great deal
Daily work tasks ◌ ◌ ◌ ◌ ◌ The speed at which they work ◌ ◌ ◌ ◌ ◌ What they say to the customer ◌ ◌ ◌ ◌ ◌ Setting their daily lunch break ◌ ◌ ◌ ◌ ◌ Settling customers complaint without having to consult a supervisor
◌
◌
◌
◌
◌
5.) How well do your agents manage to achieve the following performance targets?
1 means achieving great results and 5 means they are struggling to achieve targets
Task 1 Great Results
2 3 4 5 Weak Results
AHT average handling time ◌ ◌ ◌ ◌ ◌ Number of calls per day ◌ ◌ ◌ ◌ ◌ Adhering to break times ◌ ◌ ◌ ◌ ◌

83
Not ready time ◌ ◌ ◌ ◌ ◌ Sales targets ◌ ◌ ◌ ◌ ◌
6.) I always have time to help agents Yes / No
7.) I am always busy analysing agents’ performance stats Yes / No
8.) It is easy for the agents to find help if they need an answer to a customer query Yes / No
9.) I help my agents improve their performance Yes / No
10.) To what extent do you disagree or agree with the following statements?
Agents learn a lot from call quality sessions
Agents may find call monitoring too intensive
Agents often feel worried because they have to mention too many things on the call Agents could help customers better if they could stay longer
on the call
When agents get good performance results they feel
motivated to work harder
Angry customers have a negative impact on agents’
well-being
Agents feel satisfied when they can help customers
Agents often find their performance targets limit the
quality of service they provide
Agents often provide excellent customer service
at the expense of their stats
Management in my organisation has a very good
understanding of what the customer wants
Agents could provide better customer service if they had
Strongly disagree
Disagree Agree Strongly Agree

84
less work stress
Agents have too little time to do follow ups
Agents feel overwhelmed with information they need to do
their job
Getting trained for different business areas
helps agents’ career development
Agents are rewarded for the quality of their efforts
Overall agents are satisfied with their job
-THANK YOU
3.) Pilot survey
1. Which performance measures do you find most stressful? (pick one)
◌ average handling time ◌ not ready time ◌ hold time ◌ keeping break times
2. Do you think that having to adhere to these measures stops you from providing the best customer service? ◌ yes ◌no
3. What is the average amount of calls you take a day?
◌30 ◌40 ◌50 ◌60 ◌60+
4. Do you take many calls that should have been routed to another department?
◌ yes ◌no
5. From the list below mark each task on how important it is to you, where 1 is NOT important and 5 is VERY important.
Task 1 2 3 4 5
Take as many calls as possible ◌ ◌ ◌ ◌ ◌ Keep the calls short ◌ ◌ ◌ ◌ ◌ Resolve all customer queries on the first call ◌ ◌ ◌ ◌ ◌ Mention offers and promotions ◌ ◌ ◌ ◌ ◌ Sell extra products and services ◌ ◌ ◌ ◌ ◌
6. Which of the following tasks do you think is the most important to management? (Pick one) ◌ Take as many calls as possible ◌ Keep the calls short ◌ Resolve all customer queries on the first call ◌ Mention offers and promotions

85
◌ Sell extra products and services 7. Do managers listen to your calls to monitor quality? ◌ yes ◌no
8. Does call monitoring cause you stress? ◌ yes ◌no
9. How often are your calls being listened to?
◌ few times a week ◌ once a week ◌ every 2 weeks ◌ once a month
10. Do you think the quality criteria are clear to understand? ◌ yes ◌no
11. Do you receive feedback on your call quality? ◌ yes ◌no
12. Do you think call monitoring helps you provide better service? ◌ yes ◌no
13. Do you receive call quality results together with other agents’ results? ◌ yes ◌no
14. Do you find receiving it with other agents’ results stressful? ◌ yes ◌no
15. What happens when you fail to meet your targets? (pick one)
◌ nothing ◌ warning ◌ disciplinary meeting ◌ dismissal ◌ pay cut
16. Do you have to mention certain things on the call? ◌ yes ◌no
17. Do you feel that these requirements limit your control over the call? ◌ yes ◌no
18. Do you think you have a high level of control over what you can say on the call?
◌ yes ◌no
19. Do you think you would enjoy your work more if you had influence on setting your own targets? ◌ yes ◌no
20. Do you have to go on breaks at specific times? ◌ yes ◌no
21. Do you experience negative emotions at work? ◌ yes ◌no
22. From the list below please circle the aspects that increase your stress at work.
◌lighting ◌chair ◌keypad ◌noise ◌angry customers ◌call monitoring ◌call quality
23. Do you think that the amount of stress you experience at work has an effect on your job satisfaction? ◌ yes ◌no
24. Which of the following is most likely to make you quit your current job?
◌ stress ◌ emotional exhaustions ◌ low pay ◌ lack of opportunity
◌ intense monitoring ◌ lack of control over your work
86
25. How often do you have to deal with an angry customer?
◌ Few times a day ◌ few times a week ◌ once a week ◌ rarely
26. Do you find angry customers stressful? ◌ yes ◌no
27. How long have you been working in the current job?
◌ 0-2 years ◌3-5 ◌6-9 ◌10+
28. Do you think your initial training prepared you well for the job? ◌ yes ◌no
29. Do you receive on-going training? ◌ yes ◌no
30. Do you get trained for different areas of the business? ◌ yes ◌no
31. Do you think that cross training:
◌ is helpful ◌ is too much information ◌ helps your career development ◌makes work more interesting ◌ is not helpful
32. What do you think is the most important to the customers?
◌ calls to be answered quickly ◌ issues to be resolved correctly
◌ all issues resolved on the first call ◌ to be advised of all offers and promotions
◌ to speak to a nice person that can help
33. Do you feel personal satisfaction when you can deliver quality service? Y / N
34. Do you think your work stress has negative impact on the quality of your calls? Y / N
35. If you could spend more time on the call would you provide better service? Y / N
36. If you had less work stress would you provide better customer service? Y / N
37. If you could increase customer’s satisfaction would you be happier at work? Y / N
38. Do you think management in your company has a good understanding of what the customer wants? Y / N
THANK YOU