
“COMPARATIVE ANALYSIS OF CUSTOMER SATISFACTION ...
62
“COMPARATIVE ANALYSIS OF CUSTOMER SATISFACTION OF RELIANCE JIO AND AIRTEL” PROJECT REPORT submitted to UNIVERSITY OF CALICUT In partial fulfilment of the requirement for the award of the degree of BACHELOR OF COMMERCE Submitted by NAVEEN VISWANATH (CCASBCM076) Under the supervision of Ms. ALAGRA ANTONY DEPARTMENT OF COMMERCE CHRIST COLLEGE (AUTONOMOUS), IRINJALAKUDA MARCH 2021
-
Upload
khangminh22 -
Category
Documents
-
view
2 -
download
0
Transcript of “COMPARATIVE ANALYSIS OF CUSTOMER SATISFACTION ...
“COMPARATIVE ANALYSIS OF CUSTOMER SATISFACTION OF
RELIANCE JIO AND AIRTEL”
PROJECT REPORT
submitted to
UNIVERSITY OF CALICUT
In partial fulfilment of the requirement for the award of the degree of
BACHELOR OF COMMERCE
Submitted by
NAVEEN VISWANATH
(CCASBCM076)
Under the supervision of
Ms. ALAGRA ANTONY
DEPARTMENT OF COMMERCE
CHRIST COLLEGE (AUTONOMOUS), IRINJALAKUDA
MARCH 2021

CHRIST COLLEGE (AUTONOMOUS), IRINJALAKUDA
UNIVERSITY OF CALICUT
DEPARTMENT OF COMMERCE
CERTIFICATE
This is to certify that the project report entitled “COMPARATIVE
ANALYSIS OF CUSTOMER SATISFACTION OF RELIANCE JIO
AND AIRTEL” is a bonafide record of project done by NAVEEN
VISWANATH, Reg. No CCASBCM076 under my guidance and supervision
in partial fulfilment of the requirement for the award of the degree of
BACHELOR OF COMMERCE and it has not previously formed the basis
for any Degree, Diploma and Associateship or Fellowship.
PROF. K. J. JOSEPH Ms. ALAGRA ANTONY
Co-ordinator Project Guide

DECLARATION
I, NAVEEN VISWANATH, hereby declare that the project work
entitled “COMPARATIVE ANALYSIS OF CUSTOMER
SATISFACTION OF RELIANCE JIO AND AIRTEL” is a record of
independent and bonafide project work carried out by me under the
supervision and guidance of Ms. ALAGRA ANTONY, Assistant Professor,
Department of Commerce, Christ College, Irinjalakuda.
The information and data given in the report is authentic to the best of
my knowledge. The report has not been previously submitted for the award of
any Degree, Diploma, Associateship or other similar title of any other
university or institute.
Place: Irinjalakuda NAVEEN VISWANATH
Date: CCASBCM076

ACKNOWLEDGEMENT
I would like to take the opportunity to express my sincere gratitude to all
people who have helped me with sound advice and able guidance.
Above all, I express my eternal gratitude to the Lord Almighty under whose
divine guidance; I have been able to complete this work successfully.
I would like to express my sincere gratitude to Rev. Dr. Jolly Andrews,
Principal-in-Charge, Christ college Irinjalakuda for providing various
facilities.
I am thankful to Prof. K J JOSEPH, Co-ordinator of B.Com (Finance), for
providing proper help and encouragement in the preparation of this report.
I am thankful to Ms. PRASSY VISWAMBHARAN, Class teacher for her
cordial support, valuable information and guidance, which helped me in
completing this task through various stages.
I express my sincere gratitude to Ms. ALAGRA ANTONY, Assistant
Professor, whose guidance and support throughout the training period helped
me to complete this work successfully.
I would like to express my gratitude to all the faculties of the Department for
their interest and cooperation in this regard.
I extend my hearty gratitude to the librarian and other library staffs of my
college for their wholehearted cooperation.
I express my sincere thanks to my friends and family for their support in
completing this report successfully.

TABLE OF CONTENTS
CHAPTER
NO.
CONTENTS PAGE
NO:
LIST OF TABLES
LIST OF FIGURES
CHAPTER 1 INTRODUCTION 1 – 4
CHAPTER 2 REVIEW OF LITERATURE 5 – 11
CHAPTER 3 INDUSTRY AND COMPANY
PROFILE
12 – 22
CHAPTER 4 DATA ANALYSIS AND
INTERPRETATION
23 – 37
CHAPTER 5 FINDINGS, SUGGESTIONS AND
CONCLUSION
38 – 39
BIBLIOGRAPHY
ANNEXURE
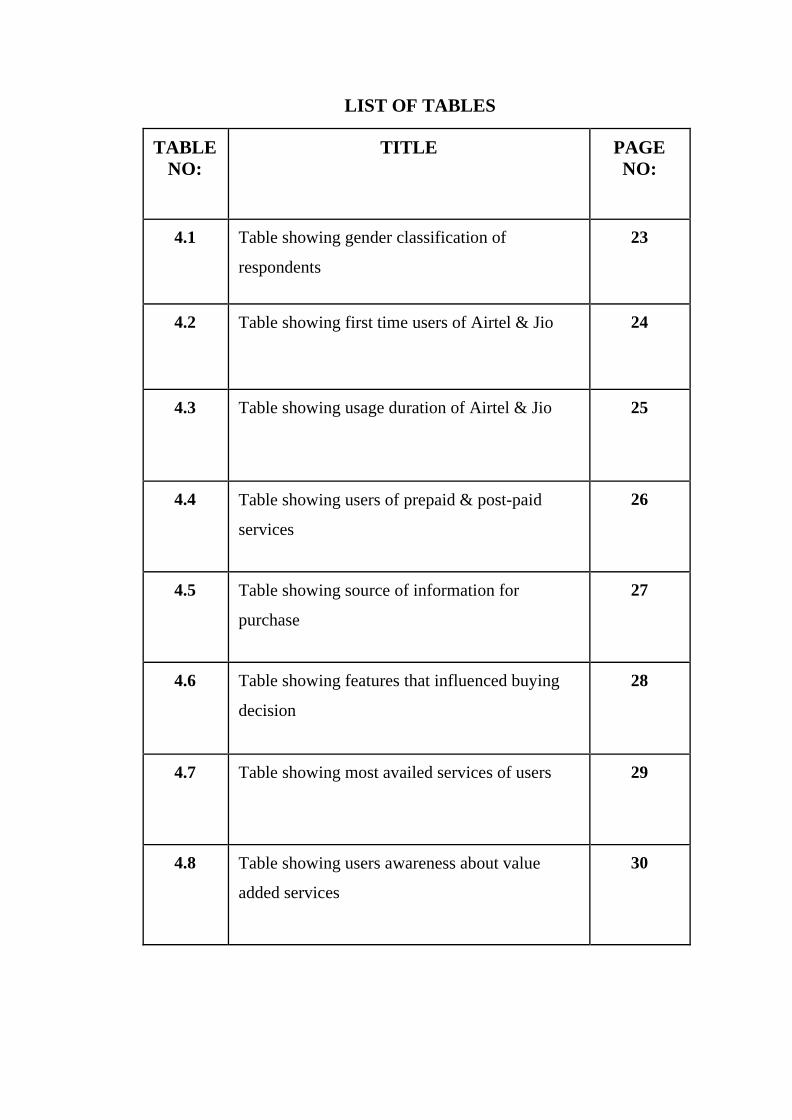
LIST OF TABLES
TABLE
NO:
TITLE PAGE
NO:
4.1 Table showing gender classification of
respondents
23
4.2 Table showing first time users of Airtel & Jio 24
4.3 Table showing usage duration of Airtel & Jio 25
4.4 Table showing users of prepaid & post-paid
services
26
4.5 Table showing source of information for
purchase
27
4.6 Table showing features that influenced buying
decision
28
4.7 Table showing most availed services of users 29
4.8 Table showing users awareness about value
added services
30

4.9 Table showing average monthly recharge
expenditure of users
31
4.10 Table showing distribution of users availing
customer care services
32
4.11 Table showing reasons for availing customer
care services
33
4.12 Table showing problems faced by customers 34
4.13 Table showing levels of satisfaction of
customers
35
4.14 Table showing overall level of satisfaction of
customers
36
4.15 Table showing chance of suggestion of Airtel/Jio
to friends
37

LIST OF CHARTS
FIGURE
NO:
TITLE PAGE
NO:
4.1 Chart showing gender classification of
respondents
23
4.2 Chart showing first time users of Airtel & Jio 24
4.3 Chart showing usage duration of Airtel & Jio 25
4.4 Chart showing users of prepaid & post-paid
services
26
4.5 Chart showing source of information for
purchase
27
4.6 Chart showing features that influenced
buying decision
28
4.7 Chart showing most availed services of users 29
4.8 Chart showing users awareness about value
added services
30

4.9 Chart showing average monthly recharge
expenditure of users
31
4.10 Chart showing distribution of users availing
customer care services
32
4.11 Chart showing reasons for availing customer
care services
33
4.12
Chart showing problems faced by customers 34
4.13 Chart showing levels of satisfaction of
customers
35
4.14 Chart showing overall level of satisfaction of
customers
36
4.15 Chart showing chance of suggestion of
Airtel/Jio to friends
37

CHAPTER 1
INTRODUCTION
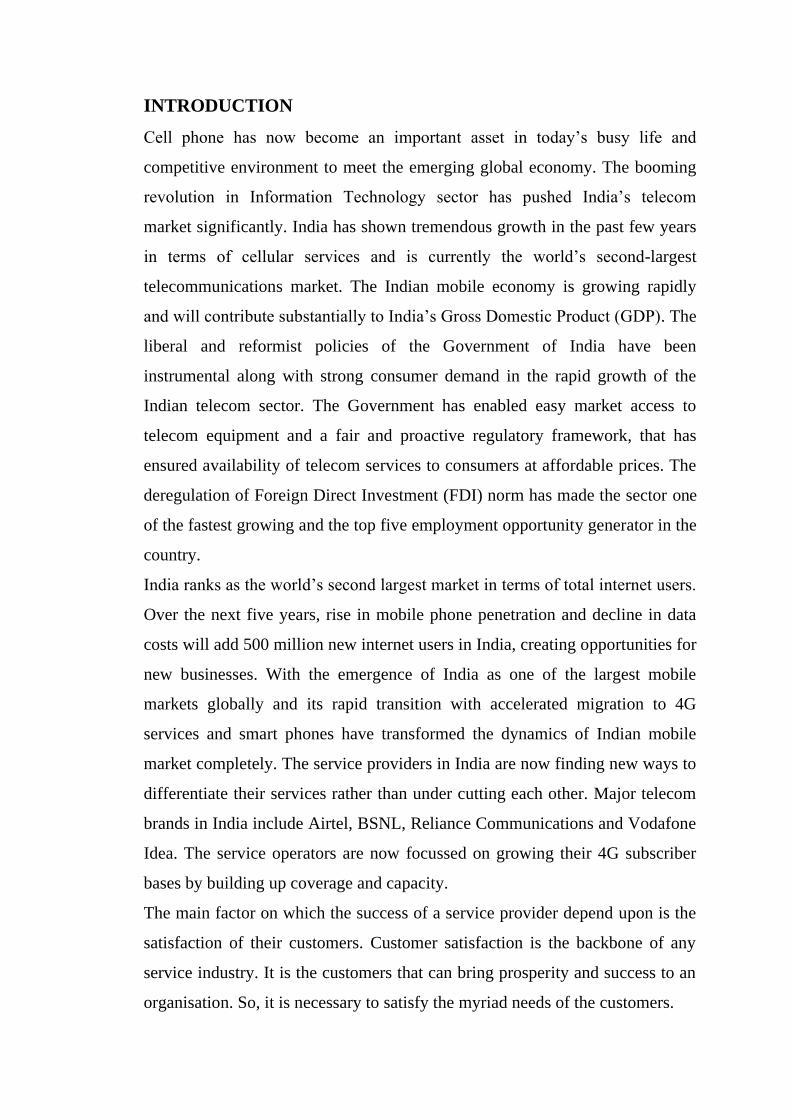
INTRODUCTION
Cell phone has now become an important asset in today’s busy life and
competitive environment to meet the emerging global economy. The booming
revolution in Information Technology sector has pushed India’s telecom
market significantly. India has shown tremendous growth in the past few years
in terms of cellular services and is currently the world’s second-largest
telecommunications market. The Indian mobile economy is growing rapidly
and will contribute substantially to India’s Gross Domestic Product (GDP). The
liberal and reformist policies of the Government of India have been
instrumental along with strong consumer demand in the rapid growth of the
Indian telecom sector. The Government has enabled easy market access to
telecom equipment and a fair and proactive regulatory framework, that has
ensured availability of telecom services to consumers at affordable prices. The
deregulation of Foreign Direct Investment (FDI) norm has made the sector one
of the fastest growing and the top five employment opportunity generator in the
country.
India ranks as the world’s second largest market in terms of total internet users.
Over the next five years, rise in mobile phone penetration and decline in data
costs will add 500 million new internet users in India, creating opportunities for
new businesses. With the emergence of India as one of the largest mobile
markets globally and its rapid transition with accelerated migration to 4G
services and smart phones have transformed the dynamics of Indian mobile
market completely. The service providers in India are now finding new ways to
differentiate their services rather than under cutting each other. Major telecom
brands in India include Airtel, BSNL, Reliance Communications and Vodafone
Idea. The service operators are now focussed on growing their 4G subscriber
bases by building up coverage and capacity.
The main factor on which the success of a service provider depend upon is the
satisfaction of their customers. Customer satisfaction is the backbone of any
service industry. It is the customers that can bring prosperity and success to an
organisation. So, it is necessary to satisfy the myriad needs of the customers.

Customer satisfaction is a metric used to quantify the degree of satisfaction of a
customer towards the goods and services provided by a company. Paul Farris in
his book Marketing Metrics, defined customer satisfaction as “the number of
customers, or the percentage of total customers, whose reported experience
with a firm, its products or services exceeds the specified satisfaction goals.”
Customer satisfaction survey is a process to discover if the clients of a
company are satisfied or not with the products and services received from the
company. It can be done face-to-face, by phone/online or by using handwritten
forms. The answers of the clients to the questions are used to analyse if
changes are necessary in the commercial operations to improve the general
satisfaction of clients. In a competitive marketplace where companies compete
for clients, customer satisfaction is seen as a key differentiator and performance
indicator. It has become a key element of business strategy and is used for
managing and monitoring of businesses.
STATEMENT OF THE PROBLEM
Among the telecommunication networks, Airtel and Jio are the leading service
providers in the current market scenario. Airtel is one of the largest and leading
units providing comprehensive range of telecom services in India. It was the
first Indian telecom company to offer 4G services on mobile phones. Jio is the
fastest ramp-up by any mobile operator anywhere in the world. Jio crossed 50
million subscriber marks in 83 days since its launch. After the launch of Jio in
India many of the Airtel users shifted to the new service provider. Airtel has
been recently introducing exciting offers to attract new customers. In this
context, a study is undertaken to measure the preference of customers of Airtel
and Jio and its effect on the level of customer satisfaction.
SIGNIFICANCE OF THE STUDY
Customer satisfaction surveys can become imperative tools for improving your
business and ensuring your customers are happy and loyal. It gives firms
specific information about positive and negative perceptions, which could
improve marketing or sales efforts. It is also valuable to let your customers
know you are endeavouring to make improvements and to thank them for their

help. It also reveals data that can be used to gauge estimated customer
satisfaction rates of competitors. The study here is a comparative analysis of
the customer satisfaction of two leading mobile service providers in India,
Reliance Jio and Airtel. It aims at identifying the most preferred Telecom
service among the two. From a business viewpoint, the study is crucial as it
will outline the strategies which can be incorporated by companies to gain
competitive advantage and dominate the entire market.
OBJECTIVES OF THE STUDY
1. To analyse the perception of customers of Reliance Jio and Airtel
mobile services.
2. To compare the level of customer satisfaction towards the usage of
Airtel and Jio mobile services.
3. To study the impact of factors including marketing strategies, pricing
strategies and value-added services on customer satisfaction of Jio and Airtel
users.
4. To find out the most preferred Telecom service among Reliance and Jio.
RESEARCH DESIGN
A research is a valid when a conclusion is accurate or true and research design
is the conceptual blueprint with in which research is conducted. A scholar for
his research, prepare an action plan and it constitute the outline of collection,
measurement and analysis of data.
Nature of study
The nature of study states as descriptive.
Nature of data
The study is based on both secondary and primary data.
Source of data
Primary data is collected using a structured questionnaire. Secondary data is
collected from public research papers on Telecom sector, Annual reports of
Telecom service providers, Journals on Telecom sector and through the website
of TRAI, Ministry of Communications, Telecom service providers etc.
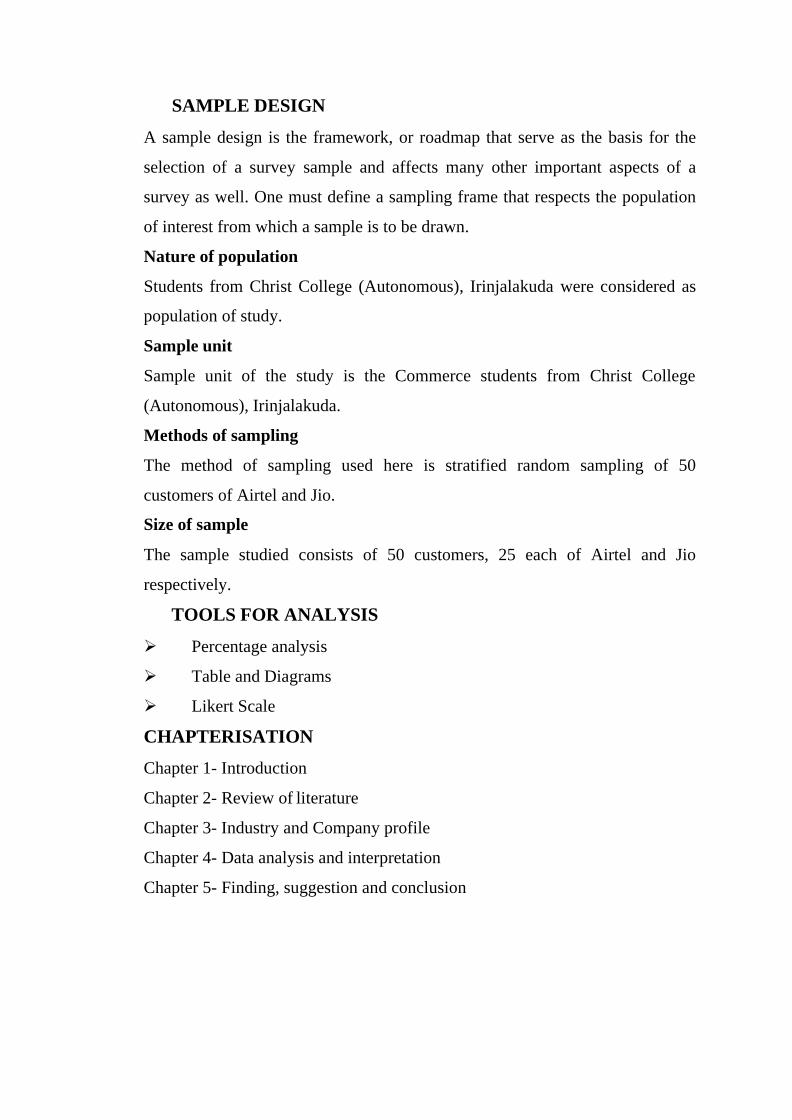
SAMPLE DESIGN
A sample design is the framework, or roadmap that serve as the basis for the
selection of a survey sample and affects many other important aspects of a
survey as well. One must define a sampling frame that respects the population
of interest from which a sample is to be drawn.
Nature of population
Students from Christ College (Autonomous), Irinjalakuda were considered as
population of study.
Sample unit
Sample unit of the study is the Commerce students from Christ College
(Autonomous), Irinjalakuda.
Methods of sampling
The method of sampling used here is stratified random sampling of 50
customers of Airtel and Jio.
Size of sample
The sample studied consists of 50 customers, 25 each of Airtel and Jio
respectively.
TOOLS FOR ANALYSIS
➢ Percentage analysis
➢ Table and Diagrams
➢ Likert Scale
CHAPTERISATION
Chapter 1- Introduction
Chapter 2- Review of literature
Chapter 3- Industry and Company profile
Chapter 4- Data analysis and interpretation
Chapter 5- Finding, suggestion and conclusion

CHAPTER 2
REVIEW OF LITERATURE

REVIEW OF LITERATURE
INTRODUCTION
This chapter deals with review of literature. Review of literature is divided into
two sections: Conceptual review and Empirical literature. A conceptual review
is an analytical tool with several variations and context. A thorough conceptual
review requires the author to identify all potentially relevant and significant
papers (both empirical and conceptual) that are relevant to the domain being
reviewed. It illustrates what you except to find through your research.
Empirical literature is based on observed and measured phenomenon and
derives knowledge from actual experience rather than theory or belief. It is
reported in such a manner that other investigators understand precisely what
was done and what was found in a particular research study to an extend that
they could replicate the study to determine whether the findings are reproduced
when repeated.
CONCEPTUAL REVIEW
Meaning of customer satisfaction
Customer satisfaction is an ambiguous, abstract and confusing concept.
Customer satisfaction refers to the extent to which customers are happy and
delighted with the products and services provided by a business. Satisfaction is
thus the combination of relative level of expectations and perceived
performance. A customer might experience various degrees of satisfaction,
based on performance. If the products or services actual performance is short of
expectations, the customer is dissatisfied. If performance of products or
services matches the expectations, the customer is satisfied. The level of
satisfaction can also vary depending on other options the customer may have
and other substitutes available against which the customer can compare the
products.
Definition of customer satisfaction
Researchers are yet to develop a universally accepted definition of customer
satisfaction. As a result, the literature is replete with different conceptual and

operational definitions of customer satisfaction. Below are a few conceptual
definitions of customer satisfaction.
Oliver (1997): It is a judgement that a product or service feature, or the product
or service itself, provided a pleasurable level of consumption related fulfilment,
including levels of under or over fulfilment.
Mano and Oliver (1993): It is an attitude like post consumption evaluative
judgement varying along hedonic continuum.
Components of customer satisfaction
When examined as a whole, customer satisfaction can be identified as a
response that occurs at a particular time and as a result of series of comparison
of product and service performance with expectations.
1. One can identify four general components from this definition.
2. Consumer satisfaction is either emotional or cognitive response.
3. The response occurs at a particular time (after consumption of product
and service based on accumulated experience)
4. The response occurs after a series of comparison and evaluation.
5. The response is related with a particular central aspect.
Factors affecting customer satisfaction
The factors that affect customer satisfaction may be cultural, social, personal or
psychological. The three major factors that affect customer satisfaction in a
telecommunication industry are as follows:
Loyalty:
It is a universally accepted fact that customer satisfaction and loyalty is
intrinsically coupled to the wellbeing and growth of any company. The
literature pertaining to relationships among customer satisfaction, customer
loyalty and profitability has two dimensions. The first literature proposes that
customer satisfaction influences customer loyalty, which in turn affects
profitability. The second relevant literature is found in the marketing domain
and suggests that customer loyalty can be defined in two distinct ways: the first
literature defines loyalty as an attitude and second definition of loyalty is
behavioural. Customer satisfaction has a significantly positive direct impact on

customer loyalty. As customer satisfaction increases, customer complaint
decreases and customer loyalty increases.
Service quality:
Quality is an ambiguous and indistinct construct. Service quality is the result of
an evaluation process of a circumstance in which customer compares their
perceptions of service delivery and its outcome against what they expect. In the
case of telecommunication there is very less interaction between customer and
service provider. There is no face- to- face human interaction and service
adjustments based on verbal and non-verbal cues. Hence, the design of the
telecom services is crucial in delivering service and satisfying customers.
Delivering quality to customer to a competitive market place like the telecom
industry dictates the need to continually enhance customers expectation and
satisfaction.
Price fairness:
Price fairness refers to consumers assessments of whether a seller’s price is fair
or justifiable. It is an important issue that leads to customer satisfaction. It was
found that customer satisfaction is directly influenced by priced perceptions of
customer while indirectly through perception of price fairness.
EMPIRICAL LITERATURE
Szymanski D.M, Henard D.H (2001): The growing number of academic
studies on customer satisfaction and the mixed findings they report complicate
efforts to identify the precursor to and outcomes of businesses having more-
versus less-satisfied customers. The authors conducted a meta-analysis of the
reported findings on customer satisfaction. They documented that equity and
disconfirmation are most strongly related to customer satisfaction on average.
They also found that measurement and method factors that characterize the
research often moderate relationship strength between satisfaction and its
precursor and outcomes. The authors also discussed the implications
surrounding these effects and offer several directions for future research.
Rahman M.H (2014): This empirical study was initiated to find out what
particular factors were responsible for customer satisfaction in the mobile
telecommunication industry in Bangladesh. 282 samples were collected
through structured questionnaire; study revealed that service innovativeness,
service reliability, service competitiveness and service consistency have
significant influence on making customer satisfied and the operator’s
network/signal coverage, pricing, offering, fulfilment of customer demand,
value added service, brand value and operators contribution for society have
insignificant influences on making customer satisfied at five percent level of
significant at multiple regression analysis. On the basis of these findings; study
concludes that in promoting customer satisfaction, mobile service providers
should be concerned about factors that have significant influence on promoting
customer satisfaction in telecommunication industry in Bangladesh.
Diaw B, Asare G (2018): The study examines on the effect of innovation on
customer satisfaction in the telecommunication service industry which is highly
competitive in Ghana. Product and service innovation is believed to be the key
in satisfying and retaining customers. Data were collected using questionnaire
to 150 customers. Data analysis tools were employed to assess the relationship
between variables (dependent and independent). A significant positive
relationship was found between innovation, customer satisfaction and retention.
The study also found that marketing innovations introduced in recent years has
been a major determinant in customer satisfaction and retention. The study
recommends that telecommunication companies should invest in providing
innovative services by researching current trends in order to forecast products
and services.
Nurysh N, Naghavi N, Fah B.C.Y(2019): This study was an
acknowledgement to the request by previous researchers on the need to
examine the important factors such as perceived value and service quality that
can directly affect the customer satisfaction in Malaysian mobile phone
operators. The moderating effect of attractiveness of alternatives has been also
tested between variables. Therefore, the empirical findings, which are based on
quantitative research and further multiple regression analysis, shows that both
perceived value and service quality has positive relationship towards customer

satisfaction. But it was found that the interaction of both variables with
attractiveness of alternatives has no effect to improve or enhance the
satisfaction.
Hoa T.K, Ngoc L.T.B (2020): This study was aimed at investigating three
factors (service quality, brand image and price perception) and assessed the
degree of the impact of each factor on customer satisfaction, especially the
relationship between customer satisfaction and customer loyalty in Vietnamese
mobile telecom sector where there have been the existence of the fierce
competition, mature market and internationally integrated economy, ultimately
struggling for market share and survival. The results indicated that each factor
(service quality, brand image, price perception) has a positive impact on
customer satisfaction at the different level as well as a significantly positive
relationship between customer satisfaction and customer loyalty in mobile
telecommunication industry in Vietnam. The results of this study are consistent
with the findings and evidence in the extant literature. The study provides the
important feedback from customers to mobile telecom suppliers. Research
findings are expected to be marketing insights for Vietnamese mobile telecom
managers so that they can develop sound marketing strategies in today’s
competitive and costly market.
Goyal K, Kar A.K(2020): For this study 4 lakh tweets were collected from
Twitter by using popular hashtags and @ mention for telecommunication
companies in India. The result indicates that there is a positive relationship
between independent variables (network quality, service interaction quality,
and customer support) and dependent variables (customer satisfaction). Topic
modelling and sentiment mining were done on these 4 lakhs tweets. The
statistical analysis indicated that network quality, service interaction quality
and customer support play a momentous factor in the satisfaction of customers
in the telecommunication industry.
Poulose J, Sharma V, Joseph S (2018): This study was to check a model of
various factors such as loyalty, satisfaction and switching barriers (customer
relationship management, alternative attractiveness and switching cost)

influencing consumer retention strategies in Indian telecom service industry. A
structured and undisguised questionnaire and a convenient sampling method
was used to collect the data from respondents from three most populous cities
(Indore, Bhopal, and Ujjain) of Central India. Around 450 questionnaires were
distributed, out of which 318 usable responses were received for final analysis.
The instrument was checked for validity and reliability and the hypotheses
were tested through Structure Equation Modelling (SEM) for direct effect, and
Multiple Moderating Regression Analysis (MMRA) for moderating effect. The
results suggested that loyalty, satisfaction, switching barriers and customer
relationship management are positively related and have a direct influence on
consumer retention, but the relationship with alternative attractiveness has been
found weak. Switching cost, as moderating variable, was found to be very
effective and showed significant deviation in the relationship between
independent and dependent variables.
AnithaRajathiD.V.M, MS (2018): This study helped to improve the
SERVQUAL model as the foremost framework for investigating service
quality and the relationships among customer satisfaction and service quality
variables. The results exposed that all the service quality items were decent
forecasters of customer satisfaction. For managers, this finding has significant
implications with concern to brand building strategies.
Rengarajan V, Amudha R, Nalini R (2017): The main objective of this study
was to determine the repurchase intention of the buyers towards Airtel. The
study was based on primary data collected by way of administering the
questionnaire. The data was collected from 200 customers of Airtel situated in
Cuddalore district through simple random sampling method and were analysed
by using percentage analysis and ANOVA single factor with the help of SPSS
package. Gender influences the satisfaction level based on prompt service and
network modernization. Respondents are of the opinion that continuation of
purchase, having more than one connection, overall pride and trust in using
Airtel, price sensitivity, differentiation in service and multi-usage could not be
continued because of their level of dissatisfaction. 57% of the respondents
prefer Airtel and the rest prefer other brands. This means that 43% of the Airtel
customers are likely to shift to other competitors.
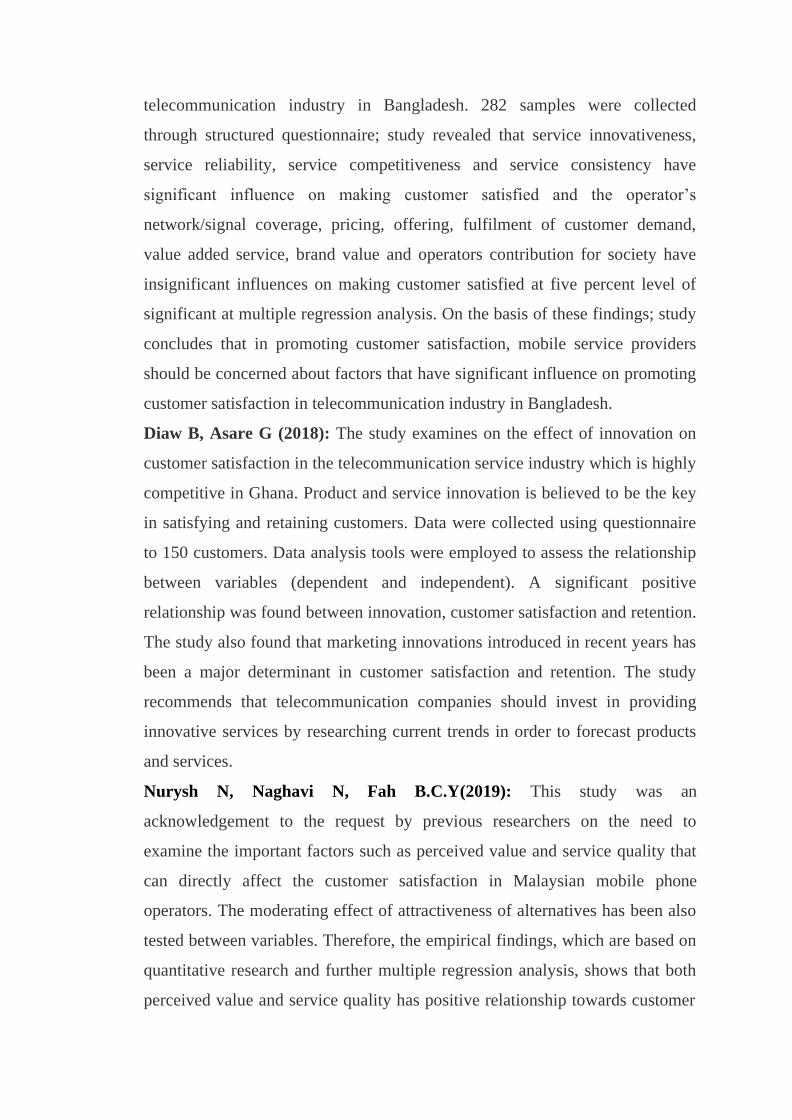
Yadav R.K, Dabhade N (2019): This research study was an effort to ascertain
some implicit factors that influenced customer satisfaction in the Indian mobile
service industry. Various satisfaction measures like communication services,
network issues, technology, price, brand image, and customer care services
were analysed. With the introduction of Reliance Jio in December 2015, the
Indian telecom market got distracted and stimulated in Madhya Pradesh as Jio
offered various free communication services, lower data packs and free voice
calls without roaming. This step of Reliance Jio created a cold war among the
mobile service providers and put immense pressure on competitors to offer
similar services at comparatively lower prices. This research study was
exploratory in nature. Primary data were collected through a questionnaire
from 500 mobile service users. Factor analysis was employed to analyse the
data through SPSS 21.0 software, which was randomly collected from Bhopal,
India. Ten factors were identified out of 32 items of seven variables. The
findings showed that diversity of plans and quality of network signals were two
important foretellers of customer satisfaction in the mobile service industry.

CHAPTER 3
INDUSTRY AND COMPANY
PROFILE

INDUSTRY PROFILE
Introduction:
An industry is an area of economic production which involves large amounts of
upfront capital investment before any profit can be realized. In economics and
urban planning, industry is an intensive type of land use with economic activity
involved with manufacturing and production.
About telecommunication:
The process of transmitting or receiving information over a distance by any
electric or electromagnetic medium can be called as telecommunication.
Information may take the form of voice, video, or data. Over the last 2,000
years we have learned to communicate over land, sea and space.
Telecommunications was the cutting-edge business of the 19th century and the
industry with foremost growth in the past 100 years.
Brief history of Indian telecom:
The history of Indian Telecom Sector began in 1851, when The British
Government laid down the first operational landlines in Kolkata. In 1881, a
separate telephone service was introduced by opening telegraph facilities to the
public. The telephone services were merged with the postal system in the year
1883. In the beginning, Rajdhani of East India Company was situated at
Kolkata; but in the year 1911, the capital got shifted to Delhi and continued to
be capital of India. At that time, Public Works Department (PWD) was running
the functions of telecom operations with head office at New Delhi. Gradually
the control of telecom operations transferred to Director General Postal and
Telegraph (DGP&T) from PWD, from DGP&T to Department of
Telecommunication (DoT), from DoT to Department of Telecom Service
(DTS), and finally landed in Bharat Sanchar Nigam Limited (BSNL). All these
years, New Delhi continued to be the head office of Telecom Sector. In the
year 1923, Indian Radio Telegraph Company (IRT) was formed. In the year
1947, just after the independence, all the foreign telecommunication companies
were nationalized to form Telephone, Telegraph and Post (PTT), which was
run by the Government of India, under Ministry of Communications in a

monopoly manner. To get better performance, Government decided to bring the
Indian Telecom Sector under the roof of state’s control. In 1980, private sector
was allowed in manufacturing telecom equipment’s, which initiated reforming
the telecommunication sector.
Twelve years later, in 1997 Telecom Regulatory Authority of India (TRAI)
came into existence. Telecommunications is one of the prime support services
needed for the rapid growth and modernization of various sectors the economy.
It has become especially important in recent years because of enormous growth
of Information technology (IT) and its significant impact on the rest of the
economy. India is perceived to have a special comparative advantage that
depends critically on high quality telecommunication infrastructure.
Players in Indian telecom industry:
Bharti Airtel
Vodafone Idea
Reliance Jio
BSNL
COMPANY PROFILE
BHARTI AIRTEL LIMITED:
Business description:
Bharti Airtel Limited is a leading global telecommunications company with
operations in 18 countries across Asia and Africa. Headquartered in New
Delhi, India, the company ranks amongst the top 3 mobile service providers
globally in terms of subscribers. In India, the company's product offerings
include 2G, 3G and 4G wireless services, mobile commerce, fixed line
services, high speed home broadband, DTH, enterprise services including
national & international long-distance services. In the rest of the geographies, it
offers 2G, 3G, 4G wireless services and mobile commerce. Bharti Airtel had
over 423 million customers across its operations at the end of March 2020.
Established:
July 07, 1995, as a Public Limited Company

ISIN:
INE397D01024
Revenue:
Rs.875,390 million (Full Year ended March 31, 2020) including impact of
IndAS
116 Rs.807,802 million (Full Year ended March 31, 2019)
EBITDA:
Rs.371,053 million (Full Year ended March 31, 2020) including impact of
IndAS
116 Rs.262,937 million (Full Year ended March 31, 2019)
Shares in issue:
5,455.55 million shares as on March 31, 2020
Listings:
Bombay Stock Exchange Limited (BSE)& National Stock Exchange of India
Limited (NSE)
Stock exchange symbol:
NSE-BHARTIARTL BSE-532454
Customer base:
India: 283.7 million Mobile Services; 2.4 million Homes and 16.6 million
Digital TV Services; Africa: 110.6 million Mobile Services; South Asia: 2.9
million Mobile Services customers (status as on March 31, 2020)
Registered office:
Bharti Airtel Limited (A Bharti Enterprise) Bharti Crescent, 1 Nelson Mandela
Road, Vasant Kunj, Phase II, New Delhi - 110 070 Tel. No.: +91 11 4666 6100
Fax No.: +91 11 4666 6411
Strategy:
To consistently fine tune the strategies and strengthen the innovative core to
anticipate and lead change in the global digital landscape.
Vision:
To enrich lives of customers and to win new customers for life through an
exceptional experience.

Objectives:
To grow market share, grow revenue and to drive down cost.
Values:
Alive, inclusive and respectful
Organisation structure (India & South Asia):
CHAIRMAN – Sunil Bharti Mittal
MD & CEO (India and South Asia) – Gopal Vittal
CHIEF OPERATING OFFICER (India and South Asia) – AjaiPuri
GLOBAL CHIEF IINFORMATION OFFICER – Harmeen Mehta
CHIEF PRODUCT& EXPERIENCE OFFICER – Adarsh Sreekumar Nair
DIRECTOR& CEO (Airtel Business) – Ajay Chitkara
CHIEF REGULATORY OFFICER – Rahul Vatts
DIRECTOR (Supply Chain)– Pankaj Miglani
CHIEF FINANCIAL OFFICER – Badal Bagri
DIRECTOR (Network and Chief Technical Officer) – RandeepSekhon
CEO (DTH) – Sunil Taldar
CHIEF MARKETING OFFICER – Shashwat Sharma
DIRECTOR (Legal) – Vidyut Gulati
CHIEF HUMAN RESOURCES OFFICER – Samit Deb
Business decisions:
India- Airtel follows a segmented approach for operations in India with clear
focus on retail and corporate customers. It includes both B2B and B2C
services.
B2C Services:
1. Mobile Services (India): Airtel offer post-paid, pre-paid, roaming,
internet and other value-added services. Their distribution channel is spread
across 1million outlets covering approximately 95.4% of the country’s
population. The 3G and 4G services offer high-speed internet access and a host
of innovative services like Mobile TV, video calls, live-streaming videos,
gaming and buffer-less HD video streaming.

2. Homes Services: The Company provides fixed-line telephone and
broadband services for homes in 111 cities pan-India. It offers high-speed
broadband on copper and fiber and voice connectivity up to the speeds of 100
mbps for the home segment.
3. Digital TV Services: The Direct-To-Home (DTH) platform offers both
standard and high definition (HD) digital TV services with 3D capabilities and
Dolby surround sound. Airtel currently offers a total of 645 channels including
85 HD channels, 7 international channels and 4 interactive services.
B2B Services:
1. Airtel Business: For small and medium business, Airtel is a trusted
solution provider for fixed-line voice (PRIs), data and other connectivity
solutions like MPLS, VoIP, SIP trunking. The Company offers solutions to
businesses Audio, Video and Web Conferencing and global services in both
voice and data including value-added services like International Toll-Free
Services and SMS hubbing. Airtel’s strategically located submarine cables and
satellite network enable customers to connect across the world including hard-
to-reach areas with global network that run across 250,000 Rkms, covering 50
countries and 5 continents.
2. Tower Infrastructure Services: Bharti Infratel Ltd (Infratel), is India’s
leading provider of tower and related infrastructure and it deploys, owns &
manages telecom towers and communication structures, for various mobile
operators. It holds 42% equity interest in Indus towers, a joint venture with
Vodafone India and Aditya Birla Telecom. The Company’s consolidated
portfolio of95,372 telecom towers, makes it one of the largest tower
infrastructure providers in the country with presence in all 22 telecom circles.
The Company has been the industry pioneer in adopting green energy
initiatives for its operations. Infratel is listed on Indian Stock exchanges, NSE
and BSE.
South Asia - South Asia represents operations in Sri Lanka that spreads across
25 administrative districts with distribution network of over 47000 retailers

across the country. The 3.5G services are present across major towns in Sri
Lanka.
Africa - Airtel’s subsidiary, Airtel Africa plc is present in 14 countries across
Africa. They offer post-paid, pre-paid, roaming, internet services, content,
media & entertainment and corporate solutions. Airtel Africa plc is listed on
London Stock Exchange (LSE) and Nigeria Stock Exchange (NSE).
Partners:
SingTel, Airtel’s strategic equity partner, has made one of their largest
investments outside Singapore with Airtel. This partnership has enabled Airtel
to expand and further enhance the quality of services to customers. They also
pioneered the outsourcing business model with long term strategic partnership.
Airtel partnered with global leaders who share the drive for co-creating
innovative and tailor-made solutions which include ZTE, Ericsson, Nokia
Siemens Networks (NSN), Huawei, Cisco, IBM, Avaya, etc.
Awards and recognition:
2018-2019:
1. Airtel ranked amongst the top 10 companies in the Indian Corporate
Governance Scorecard, an independent report jointly developed by BSE,
International Finance Corporation and Institutional Investor Advisory Services
(IIAS) with support from the Government of Japan. Bharti Airtel is the only
telecom company to make it to the top 10.
2. Bharti Airtel was ranked first within the information technology and
telecommunication (ICT) category at the 15th Annual national awards for
excellence in Cost Management
3. Airtel Business was chosen as the winner in two prestigious categories -
Best Wholesale Carrier (Global) and Best Wholesale Business Transformation
at the Carriers World Awards 2018.
4. Airtel Tanzania won an Appreciation Award for the contributions and
continued support in improvement of school environment in Tanzania by
Tanga City Council and was also recognized for Mobile Health Support by
Ministry of Health.

5. Airtel Nigeria has been awarded with Smart recharge campaign of the
year by Advertiser association of Nigeria.
6. Airtel Uganda has been recognized by Digital Impact Awards, Africa as
the Best Technology Brand on Social Media, Best Digital Customer
Experience by Technology Brand, Best Saving and Lending Product (Digital
driven), Best Professional, Legal and Regulatory brand.
2019-2020:
1. Airtel bagged top honours at the Frost and Sullivan ICT Awards, the
“Enterprise Data Service Provider of the Year” and the “Enterprise Telecom
Service Provider of the Year” in the large enterprise segment.
2. Airtel Business won the “Best Partnership” award at Telecoms World
Middle East Awards 2019 for partnering with Telecom Egypt.
3. Airtel Business bagged five prestigious awards at the CIO Choice
Awards 2020.
RELIANCE JIO
Business description:
Reliance Jio Infocom Limited, Jio, is an Indian telecommunications company
and a subsidiary of Jio Platforms, headquartered in Mumbai, Maharashtra,
India. It operates a national LTE network with coverage across all 22 telecom
circles. It does not offer 2G or 3G service, and instead uses only voice over
LTE to provide voice service on its 4G network. Jio soft launched on 27
December 2015 with a beta for partners and employees, and became publicly
available on 5 September 2016. As of 31 December 2019, it became the largest
mobile network operator in India and the world. In September 2019, Jio
launched a fiber to the home service, offering home broadband, television, and
telephone services. Since April 2020, Reliance Industries has raised Rs.152,056
crores by selling 32.97% equity stake in Jio Platforms.
Established:
February 15, 2007
ISIN:
INE110L07039

Revenue:
Rs. 21,708 crores with operating income of Rs. 3631 crore and net income of
Rs. 1148 crore.
EBITDA:
At the end of fiscal year 2019, the EBITDA of Reliance Jio Infocom Limited
was around146 billion Indian rupees.
Listings:
It has a direct overseas listing without no simultaneous listing in Indian market.
Customer base:
It has the largest subscriber base in India with around 40.56 crore customers.
Registered office:
Maker Chambers lV, 222 Nirman Point, Mumbai, Maharashtra India
Strategy:
Jio has invested wisely in LTE infrastructure that is easily scalable to future
generation and they don’t carry the burden of legacy systems. Jio’s strategy is
to get as many consumers on board as possible and to retain these consumers.
Jio continue customer acquisition aggressively and their prime services are
allowing differentiating Jio from their competitors.
Vision:
Jio’s vision is to transform India with the power of digital revolution-to connect
everyone and everything, everywhere-always at the highest quality and most
affordable price.
Objectives:
Jio will play a key role in the digital development of India – with applications
for everything from education to healthcare, security to financial services,
technology to entertainment. Shri. Mukesh Ambani, Chairman, Reliance
Industries Ltd. says, "Jio is about bringing people together, safely and securely.
Values:
Customer Value, Ownership Mindset, Respect, Integrity, One Team &
Excellence

Organisation structure:
CHAIRMAN– Mukesh Ambani
CEO – Pravir Kumar
MANAGING DIRECTOR– Sanjay Mashruwala
CHIEF FINANCIAL OFFICER– Rajneesh Jain
CHIEF DIGITAL OFFICER – Vishal Sampat
PRESIDENT OF NETWORKGLOBAL STRATEGY AND SERVICE
DEVELOPMENT & DIRECTOR – Mathew Oommen
PRESIDENT OF DEVICES BUSINESS– Sunil Dutt
DIRECTOR– Akash M Ambani
DIRECTOR– Isha M Ambani
Reliance services:
1. Jio Phone: Jio presented first reasonable 4G telephone named as Jio
Phone on 21st July 2017. The security deposit of the telephone is Rs.1500
which can be return back by returning the Jio Phone at Jio store after three
years. This telephone was discharged for beta users on 15th August 2017 and
pre reserving for standard users began on 24th August 2017.
2. LYF [Life] smart phones: In June 2015 Jio entered into an agreement
with Intex to supply 4G handsets which are equipped for voice over LTE. On
25th January 2016 Jio launched its smart phone series starting from Life Water
1, Life Water 2, Life Earth 1, Life Earth 2 and Life Flame 1 etc.
3. 4G Broadband: On September 2016 Jio launched its 4G broadband
services all through India. It was started to release in December 2015 after
receiving final permit from the Government. Jio offer 4G data and voice
benefits along with services like texting, steaming films and music. Jio is
having multi benefit operator permit to provide as a TV station distributor and
will offer Television on interest on its system.
4. Jio net Wi-Fi: Jio has started begun giving free Wi-Fi hotspot benefits in
India. In March 2016 Jio has started free Wi-Fi internet to consumers at six
stadiums facilitating the 2016 ICC world 20-20 matches.

5. Jio Fi: On 24th December 2015 Bollywood Actor Shah Rukh Khan was
appointed as Jio’s brand ambassador. Jio has launched Wi-Fi routers by the
name Jio Fi. By July 2016 125.5 million Jio subscribers had selected on Jio
prime.
6. Jio Apps: In May 2016 Jio introduced multimedia applications on
Google store for coming 4G services. The Apps are accessible for everyone
who have Jio sim card to utilize it like My Jio, Jio TV, Jio Cinema, Jio
Messenger, Jio Music, Jio Join, Jio Money, Jio Switch, Jio Net and so on.
7. Jio TV: Jio TV is an app-based service enabling Jio customers to view
TV channels & programmes on their preferred digital devices.
8. Jio TV+: Jio TV+ is a service which provides customers access to
various OTT services from all over world in one app.
Partners:
Jio shares spectrum with Reliance Communications. The sharing deal is for 800
MHz band across seven circles other than the 10 circles which Jio already
owns. In September 2016, Jio signed a pact with BSNL for intra-circle roaming
which would enable users of the operators to use each other's 4G and 2G
spectrum in national roaming mode. In February 2017, Jio announced a
partnership with Samsung to work on LTE - Advanced Pro and 5G.
Awards and recognition:
2018-2019:
1. Reliance Jio Infocom Ltd. (Jio) was conferred the Market Leadership
Award for connecting over 300 million Indians on the world’s largest mobile
data network.
2. Jio won the 'Best Mobile Operator Service for Consumers' award and Jio
TV app won the 'Best Mobile Video Content' at the Global Mobile GLOMO
Awards 2018
3. Jio was awarded the ‘Most Innovative Company’ award by Economic
Times
4. Jio earned the 17th spot on the global list in American business magazine
Fast Company’s 50 Most Innovative Companies list 2018

5. Jio was awarded 'India’s Most Influential Brands’ by IPSOS
6. Jio Interact won awards for 'Brand Campaign–Category Creation' and
'Innovative Use of Technology Sector' at Indian Marketing Award 2018
7. Jio Interact won the 'Marketing Excellence in Telecom, Energy &
Utility Sector' award and Jio Cricket Play Along won the 'Marketing
Excellence in Sports Marketing' award at Global Marketing Excellence
2019-2020:
1. Reliance Jio won ‘Best Data service innovation – Emerging Market at
Global Carrier Awards’
2. Reliance Jio won Gold Award for Excellence in Innovation in
Technology Industry at Asia Pacific Stevie
3. Jio phone was adjudged as ‘Mobile Device Innovation’ at Global
Telecom Awards
4. Jio was recognized as ‘Best LTE Service Provider’ and Jio-Phone as the
‘Handset Innovation of the Year’ at Asia’s Telecom Excellence Award.

CHAPTER 4
DATA INTERPRETATION AND
ANALYSIS

16
14
12
10
8
6
4
2
0
MALES
FEMALES
AIRTEL JIO
DATA ANALYSIS AND INTERPRETATION
Table 4.1 showing gender classification
GENDER
NO. OF
RESPONDENTS
PERCENTAGE OF
RESPONDENTS
AIRTEL JIO AIRTEL JIO
Male 11 15 44% 60%
Female 14 10 56% 40%
Total 25 25 100% 100%
(source: survey data)
The above table shows that among 25 Airtel respondents, 44% are male and
56% are female and among 25 Jio respondents, 60% are male and 40% are
female.
Fig 4.1 showing gender classification
(source: survey data)

20 18
18 16
16
14
12
10 9
8 7
6
4
2
0
YES
NO
AIRTEL JIO
Table 4.2 showing first time users of Airtel & Jio
FIRST SERVICE
PROVIDER
NO. OF
RESPONDENTS
PERCENTAGE OF
RESPONDENTS
AIRTEL JIO AIRTEL JIO
Yes 9 7 36% 28%
No 16 18 64% 72%
Total 25 25 100% 100%
(source: survey data)
The above table shows that of 25 Airtel respondents, 36% are first time users
while 64% are not and among 25 Jio respondents 28% are first time users while
72% are not.
Fig 4.2 showing first time users of Airtel & Jio
(source: survey data)

18
16
14
12
10
8
6
4
2
0
<1 MONTH
1-6 MONTHS
>6 MONTHS
>1 YEAR
AIRTEL JIO
Table 4.3 showing usage duration of Airtel & Jio
USAGE
NO. OF
RESPONDENTS
PERCENTAGE OF
RESPONDENTS
AIRTEL JIO AIRTEL JIO
<1 Month 1 2 4% 8%
1-6 Months 3 3 12% 12%
>6 Months 5 6 20% 24%
>1 Year 16 14 64% 56%
Total 25 25 100% 100%
(source: survey data)
The above table shows that among 25 Airtel respondents, 4% have been recent
buyers, 12% have been using for about 6 months, 20% have been using for
more than 6 months and 64% have been users more than a year. Among 25 Jio
respondents, 8% are recent buyers, 12% have been using for about a month,
24% have been using for more than 6 months and 56% have been users more
than a year.
Fig 4.3 showing usage duration of Airtel & Jio
(source: survey data)
25 23
20 20
15
10
5 5
2
0
PREPAID
POST-PAID
AIRTEL JIO
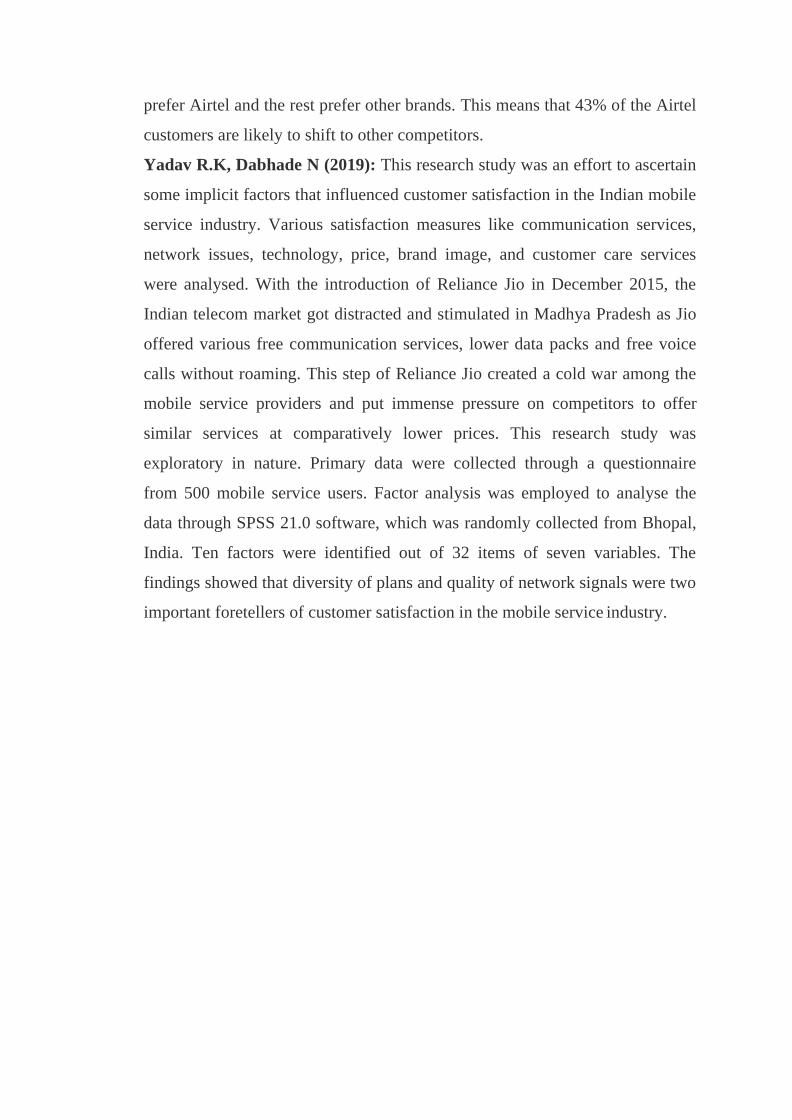
Table 4.4 showing users of prepaid & post-paid services
TYPE OF SERVICE
SCHEME
NO. OF
RESPONDENTS
PERCENTAGE OF
RESPONDENTS
AIRTEL JIO AIRTEL JIO
Prepaid 20 23 80% 92%
Post-paid 5 2 20% 8%
Total 25 25 100% 100%
(source: survey data)
The above table shows that among 25 Airtel respondents, 80% are prepaid
users while 20% are post-paid users. Among 25 Jio respondents, 92% are
prepaid users while 8% are post-paid users.
Fig 4.4 showing users of prepaid and post-paid services
(source: survey data)
16
14
12
10
8
6
4
2
0
NEWSPAPER
ADVERTISEMENT
FRIENDS & FAMILY
AIRTEL JIO
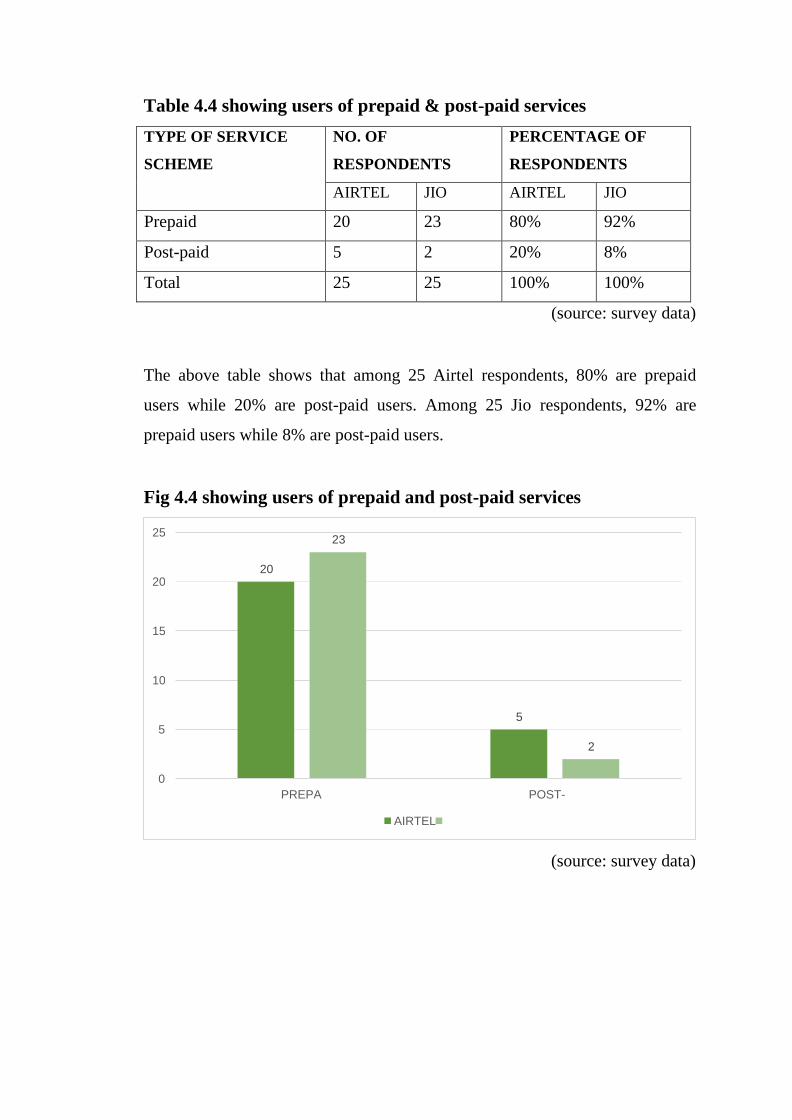
Table 4.5 showing source of information for purchase
BUYING DECISION
NO. OF
RESPONDENTS
PERCENTAGE OF
RESPONDENTS
AIRTEL JIO AIRTEL JIO
Newspaper 1 1 4% 4%
Advertisement 9 14 36% 56%
Friends & family 15 10 60% 40%
Total 25 25 100% 100%
(source: survey data)
The above table shows the source of information for buying the service
provider. Among 25 Airtel respondents, 4% got information through
newspaper, 36% from advertisement and 60% through friends and family.
Among 25 Jio respondents, 4% got information through newspaper, 56% from
advertisement and 40% through friends and family.
Fig 4.5 showing source of information for purchase
(source: survey data)

14
12
10
8
6
4
2
0
CONNECTIVITY
ADVERTISEMENT
ATTRACTIVE SCHEMES
AIRTEL JIO
Table 4.6 showing features that influenced buying decision
FEATURE THAT
INFLUENCED BUYING
DECISION
NO. OF
RESPONDENTS
PERCENTAGE OF
RESPONDENTS
AIRTEL JIO AIRTEL JIO
Connectivity 12 12 48% 48%
Advertisement 3 4 12% 16%
Attractive schemes 10 9 40% 36%
Total 25 25 100% 100%
(source: survey data)
The above table shows that among 25 Airtel respondents, 48% were influenced
by the connectivity feature, 12% by advertisement and 40% by attractive
schemes. Among 25 Jio respondents, 48% were influenced by connectivity
feature, 16% by advertisement and 36% by attractive schemes.
Fig 4.6 showing features that influenced buying decision
(source: survey data)

16
14 14
12 12
10 9
8
6 5 5
4 3
2 1 1
0
UNLIMITED CALLS
UNLIMITED DATA
UNLIMITED SMS ALL AVAILABLE SERVICES
AIRTEL JIO
Table 4.7 showing most availed services of users
MOST AVAILED
SERVICE
NO. OF
RESPONDENTS
PERCENTAGE OF
RESPONDENTS
AIRTEL JIO AIRTEL JIO
Unlimited calls 5 3 20% 12%
Unlimited data 5 9 20% 36%
Unlimited SMS 1 1 4% 4%
All available services 14 12 56% 48%
Total 25 25 100% 100%
(source: survey data)
The above table shows that among 25 Airtel respondents, 20% avail the service
for unlimited calls, 20% for unlimited data, 4% for unlimited SMS and 56% for
all available services. Among 25 Jio respondents, 12% avail the service for
unlimited calls, 36% for unlimited data, 4% for unlimited SMS and 48% for all
available services.
Fig 4.7 showing most availed services of users
(source: survey data)

16 15
14 13
12 12
10 10
8
6
4
2
0
AWARE
NOT AWARE
AIRTEL JIO
Table 4.8 showing users awareness about value added services
AWARENESS
ABOUT VALUE
ADDED SERVICES
NO. OF
RESPONDENTS
PERCENTAGE OF
RESPONDENTS
AIRTEL JIO AIRTEL JIO
Aware 12 15 48% 60%
Not aware 13 10 52% 40%
Total 25 25 100% 100%
(source: survey data)
The above table shows that among 25 Airtel respondents, 48% are aware about
value added services while others are not and among 25 Jio respondents, 60%
are aware about value added services while others are not.
Fig 4.8 showing users awareness about value added services
(source: survey data)

14
12
10
8
6
4
2
0
Rs.100-200
Rs.200-300
Rs.300-400
Above Rs.500
AIRTEL JIO
Table 4.9 showing average monthly recharge expenditure of users
AVERAGE
MONTHLY
RECHARGE
EXPENDITURE
NO. OF
RESPONDENTS
PERCENTAGE OF
RESPONDENTS
AIRTEL
JIO
AIRTEL
JIO
Rs.100-Rs.200 4 7 16% 28%
Rs.200-Rs.300 13 11 52% 44%
Rs.300-Rs.400 7 6 28% 24%
Above Rs.500 1 1 4% 4%
Total 25 25 100% 100%
(source: survey data)
The above table shows that among 25 respondents of Airtel, 16% recharge for
Rs.100-200, 52% forRs.200-300, 28% for Rs.300-400 and 4% above Rs.500.
Among 25 respondents of Jio, 28% recharge for Rs.100-200, 44% recharge for
Rs.200-300, 24% for Rs.300-400 and 4% above Rs.500.
Fig 4.9 showing average monthly recharge expenditure of users
(source: survey data)

Table 4.10 showing distribution of users availing customer care
services
USAGE OF
CUSTOMER CARE
SERVICE
NO. OF
RESPONDENTS
PERCENTAGE OF
RESPONDENTS
AIRTEL JIO AIRTEL JIO
Yes 19 17 76% 68%
No 6 8 24% 32%
Total 25 25 100% 100%
(source: survey data)
The above table shows that among 25 Airtel respondents, 76% have used the
customer care service while 24% have not and among 25 Jio respondents, 68%
have used customer care service while 32% have not.
Fig 4.10 showing distribution of users availing customers care
services
(source: survey data)
20
18
16
14
12
10
8
6
4
2
0
YES
NO
AIRTEL JIO

9
8
7
6
5
4
3
2
1
0
COMPLAINT
QUERY
VALUE ADDED SERVICES INFORMATION ON NEW
SCHEMES
AIRTEL JIO
Table 4.11 showing reasons for availing customer care services
CUSTOMER CARE
SERVICE AVAILED
FOR
NO. OF
RESPONDENTS
PERCENTAGE OF
RESPONDENTS
AIRTEL JIO AIRTEL JIO
Complaint 8 4 42% 24%
Query 3 6 16% 35%
Value added service 2 3 10% 17%
Information on new
schemes
6 4 32% 24%
Total 19 17 100% 100%
(source: survey data)
The above table shows that among 19 Airtel respondents who availed customer
care service, 42% called for registering complaints, 16% for queries, 10% for
information on value added plan and 32% for information on new schemes.
Among 17 Jio respondents who availed customer care service, 24% called for
registering complaints, 35% for queries, 17% for information on value added
plan and 24% for information on new schemes.
Fig 4.11 showing reasons for availing customer care service
(source: survey data)

20 AIRTEL YES AIRTEL NO JIO YES JIO NO
18
16
14
12
10
8
6
4
2
0
CONNECTIVITY
UNWANTED ALERT CALLS &
MESSAGES
CONVENIENCE OF SERVICE OUTLET
Table 4.12 showing problems faced by customers
PROBLEMS
FACED BY
CUSTOMERS
NO. OF RESPONDENTS PERCENTAGE OF
RESPONDENTS
YES NO YES NO
AIR JIO AIR JIO AIR JIO AIR JIO
Connectivity 9 6 16 19 36% 24% 64% 76%
Unwanted alert
calls & messages
16 19 9 6 64% 76% 36% 24%
Convenience of
service outlets
14 18 11 7 56% 72% 44% 28%
(source: survey data)
The above table shows that among 25 respondents of Airtel, 36% have
problems with connectivity, 64% have problems with unwanted alert messages
and calls and 56% have problems with service outlet. Among 25 respondents of
Jio, 64% have problems with connectivity, 36% have problems with unwanted
alert calls and messages and 44% have problems with service outlets.
Fig 4.12 showing problems faced by customers
(source: survey data)

Table 4.13 showing levels of satisfaction of customers
LEVEL OF
SATISFACTION
NO. OF
RESPONDENTS
PERCENTAGE OF
RESPONDENTS
Satisfied Not
satisfied
Satisfied Not satisfied
AIR JIO AIR JIO AIR JIO AIR JIO
Pricing strategy 17 20 8 5 68% 80% 32% 20%
Customer care 24 17 1 8 96% 68% 4% 32%
Brand image 17 19 8 6 68% 76% 32% 24%
(source: survey data)
The table above shows that among 25 Airtel respondents, 68% are satisfied
with pricing strategy, 96% are satisfied with customer care and 68% are
satisfied with brand image. Among 25 Jio respondents, 80% are satisfied with
pricing strategy, 68% are satisfied with customer care and 76% are satisfied
with brand image.
Fig 4.13 showing levels of satisfaction of customers
(source: survey data)
AIRTEL SATISFIED AIRTEL NOT SATISFIED
JIO SATISFIED
JIO NOT SATISFIED
P R I C I N G S T R A T E G Y
C U S T O M E R C A R E
B R A N D I M A G E
17
8
20
5
24
1
17
8
17
8
19
6

18 16
16
14 13
12
10
8 8 7
6
4 3
2 1 1
0
HIGHLY SATISFIED
SATISFIED
AVERAGE
NOT SATISFIED
AIRTEL
JIO
Table 4.14 showing overall level of satisfaction of customers
OVERALL
SATISFACTION
NO. OF
RESPONDENTS
PERCENTAGE OF
RESPONDENTS
AIRTEL JIO AIRTEL JIO
Highly satisfied 3 1 12% 4%
Satisfied 13 16 52% 64%
Average 8 7 32% 28%
Not satisfied 1 1 4% 4%
Total 25 25 100% 100%
(source: survey data)
The above table shows that among 25 Airtel respondents, 12% are highly
satisfied and 52% are satisfied while 32% feel it is average and 4% are not
satisfied with the overall performance. Among 25 respondents of Jio, 4% are
highly satisfied and 64 % are satisfied while 28% feel it is average and 4% are
not satisfied with overall performance.
Fig 4.14 showing overall satisfaction levels of customers
(source: survey data)
14
12
12 11
10
8
6
6 5 5
4 3 3 3
2 1 1
0
ALWAYS
MOST LIKELY
LIKELY
RARELY
NEVER
AIRTEL
JIO
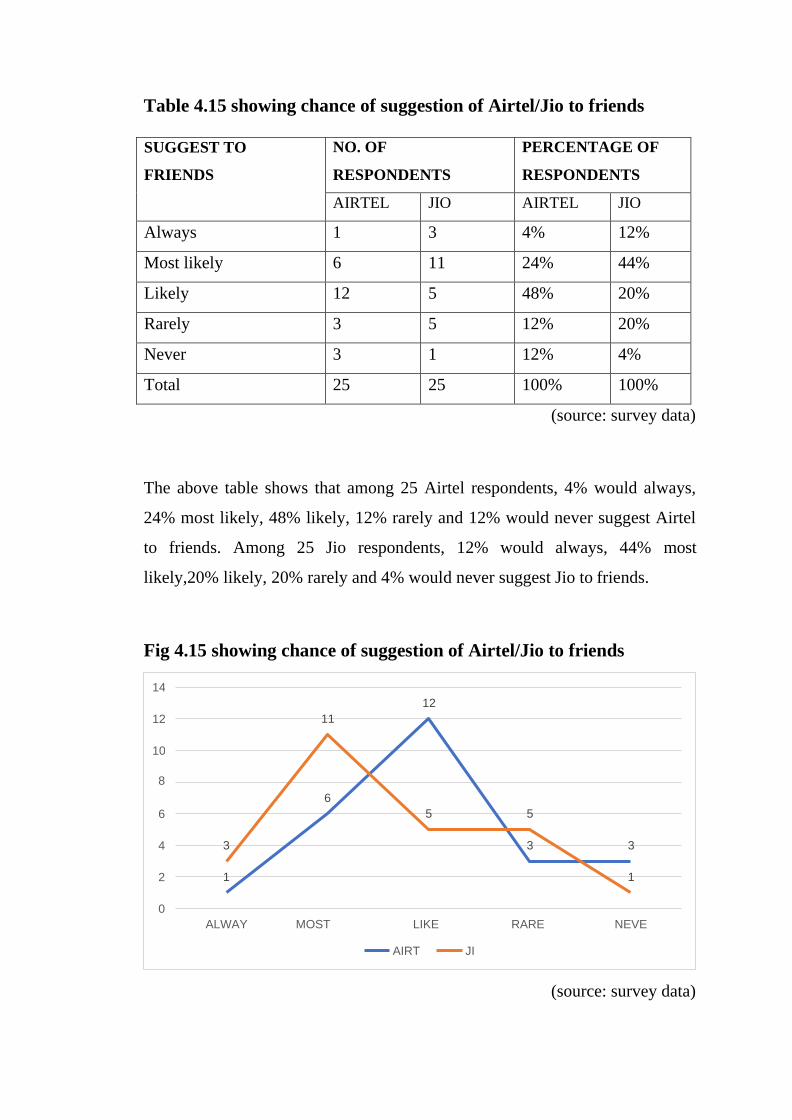
Table 4.15 showing chance of suggestion of Airtel/Jio to friends
SUGGEST TO
FRIENDS
NO. OF
RESPONDENTS
PERCENTAGE OF
RESPONDENTS
AIRTEL JIO AIRTEL JIO
Always 1 3 4% 12%
Most likely 6 11 24% 44%
Likely 12 5 48% 20%
Rarely 3 5 12% 20%
Never 3 1 12% 4%
Total 25 25 100% 100%
(source: survey data)
The above table shows that among 25 Airtel respondents, 4% would always,
24% most likely, 48% likely, 12% rarely and 12% would never suggest Airtel
to friends. Among 25 Jio respondents, 12% would always, 44% most
likely,20% likely, 20% rarely and 4% would never suggest Jio to friends.
Fig 4.15 showing chance of suggestion of Airtel/Jio to friends
(source: survey data)

CHAPTER 5
FINDINGS, SUGGESTIONS AND
CONCLUSION

FINDINGS, SUGGESTIONS AND CONCLUSION
FINDINGS
1. The data from the survey shows that majority of the respondents from Airtel
were females and majority of respondents from Jio were males.
2. The data shows that Airtel has a majority of first-time users than Jio.
3. The survey suggests that Jio has a majority in new customers whereas, Airtel
has more loyal customers.
4. Majority of the respondents of both Airtel and Jio use prepaid service scheme.
5. Major source of information that influenced buying decision for Airtel users
were advertisement, which means it has better marketing strategy and for Jio
users it was friends and family, which means it has better word of mouth
promotion.
6. The data shows that connectivity and attractive schemes are the major factors
that influence the buying decision of a service provider.
7. It shows that majority of the respondents of Jio were interested in the unlimited
data plans.
8. It shows that majority of the Jio users were not aware of the value-added
services available to them compared to Airtel users.
9. It shows that the preferred monthly recharge expenditure of both Airtel and Jio
users were Rs.200-300.
10. Majority of the respondents that contacted the customer care service were from
Airtel
11. Data shows that majority of the Airtel users that contacted customer care
service were for registering complaints.
12. Data shows that Jio has better connectivity and convenience of service outlets
compared to Airtel.
13. It shows that Jio users are more satisfied with the pricing strategy and brand
image of the company compared to Airtel.
14. Data shows Jio users have slightly higher satisfaction rates compared to Airtel
based on overall performance.

15. Data shows that a Jio user is more likely to suggest and promote their service
provider to others compared to an Airtel user.
SUGGESTIONS
1. Airtel and Jio should give emphasis on improving the network coverage,
particularly in rural areas so that more customers can be gained and retained.
2. Airtel and Jio should take necessary steps to improve connectivity as more
people now depend on them for their work and studies.
3. Airtel and Jio should try and eliminate the problem of call drop and call
congestion.
4. Airtel and Jio should introduce better service plans at affordable prices.
CONCLUSION
Today, there are a number of mobile service providers in the market that offer
various service plans targeting every section of the society and each and every
walk of human life. But the preference of customers towards certain aspects
makes a company successful compared to its competitive counterparts. The
Indian market scenario is a price sensitive scenario with an attitude of ‘more
for less’. The same is the strategy used by the Indian telecom companies to
attract new customers and also to compete with one another. Both Airtel and
Jio are leading Indian companies that provides the very need of their customers
by introducing innovative plans and better offers. The study conducted reveals
that Jio has a slightly better performance and preference rate compared to
Airtel. The competition between both Airtel and Jio have led to a benchmark
standard performance of both companies. Not only does these companies
compliment and compete with each other in a healthy way but also implement
better technologies and customer service that ensures well-being of both
company and the customer paving way for a brighter future.

BIBLIOGRAPHY

REFERENCE:
Rahman M H (2014): A case study on factors affecting customer satisfaction in
mobile industry in Bangladesh; Journal of Business, Management and
Education
Diaw B, Asare G (2018): European Journal of Research and Reflection in
Management Sciences
Nurysh N, Naghavi N, Fah B C Y (2019): International Journal of Recent
Technology and Engineering
Hoa T K, Ngog L T B (2020): Journal of Economics and Business
Administration-HCMCOUJS
Dr.V.M AnithaRajathi, Siva M (2018): A case study on service quality and
customer satisfaction in Bharti Airtel at Tirichirappalli region; International
Journal of Trend in Scientific Research and Development, Volume 2-Issue 3
Yadav R K, Dabhade N (2019): Indian Journal of Marketing
Rengarajan V, Amudha R, Nalini R (2017): International Journal of Economic
Research
Goyal K, Kar A K (2020): Journal of Lecture Notes in Electrical Engineering
Poulose J, Sharma V, Joseph S (2018): Journal of Problems and Perspectives in
Management
Szymanski D M, Henard D H (2001): Journal of Academy of Marketing
Science
The Telecom Regulatory Authority of India website; www.trai.gov.in
Official Airtel website; www.airtel.in
Official Jio website; www.jio.com

ANNUXURE

QUESTIONNAIRE
NAME:
GENDER:
EMAIL ADDRESS:
1. Which is your current cellular service provider?
A] Airtel B] BSNL
C] Reliance Jio D] Vodafone Idea
2. Is it your first service provider?
A] Yes
B] No
If no, how many service providers have you used in the past?
A] 1 B] 2
C] 3 D] More than 3
Why did you change your past service provider?
A] Excessive billing B] Poor network coverage
C] Poor customer service D] Limited services
3. Which service scheme are you currently using?
A] Prepaid B] Post paid
4. From which source did you come to know about your current service
provider?
A] Newspaper B] Advertisement
C] Friends and family D] Hoardings
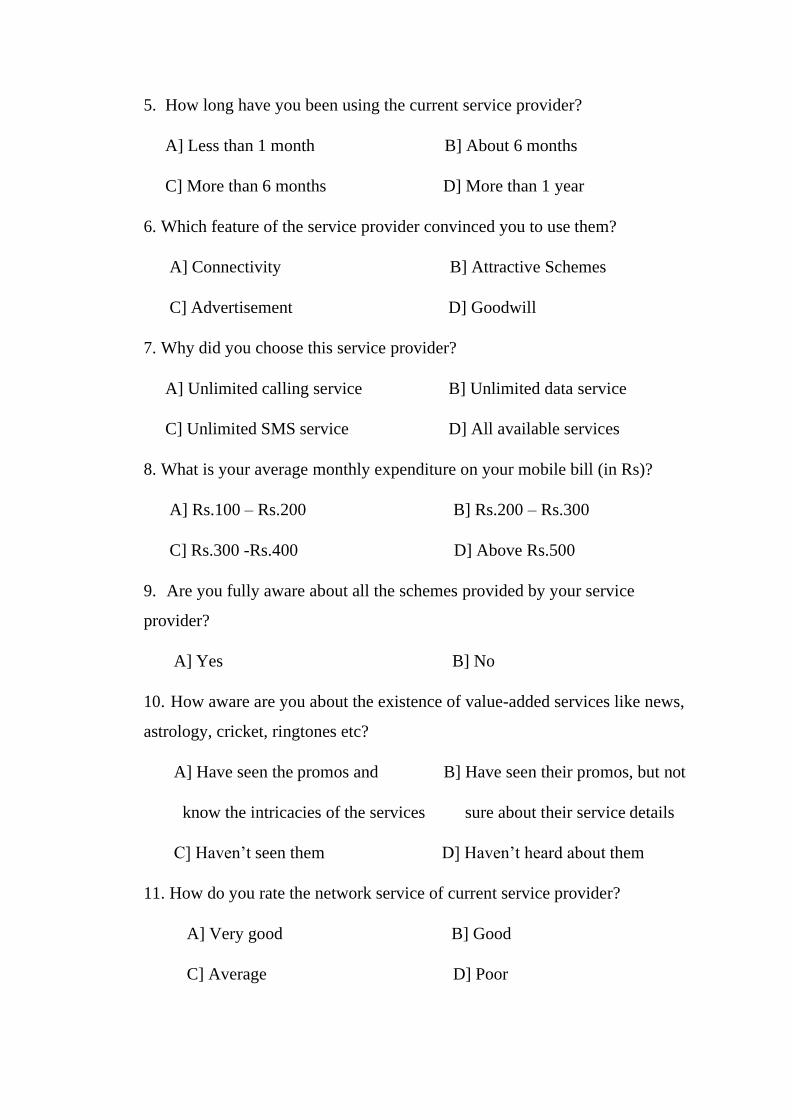
5. How long have you been using the current service provider?
A] Less than 1 month B] About 6 months
C] More than 6 months D] More than 1 year
6. Which feature of the service provider convinced you to use them?
A] Connectivity B] Attractive Schemes
C] Advertisement D] Goodwill
7. Why did you choose this service provider?
A] Unlimited calling service B] Unlimited data service
C] Unlimited SMS service D] All available services
8. What is your average monthly expenditure on your mobile bill (in Rs)?
A] Rs.100 – Rs.200 B] Rs.200 – Rs.300
C] Rs.300 -Rs.400 D] Above Rs.500
9. Are you fully aware about all the schemes provided by your service
provider?
A] Yes B] No
10. How aware are you about the existence of value-added services like news,
astrology, cricket, ringtones etc?
A] Have seen the promos and B] Have seen their promos, but not
know the intricacies of the services sure about their service details
C] Haven’t seen them D] Haven’t heard about them
11. How do you rate the network service of current service provider?
A] Very good B] Good
C] Average D] Poor

12. What connectivity problem have you faced with this service provider?
A] Network busy B] Range problem
C] Disconnected frequently D] Voice problem
13. Do you face network connection problem while
A] Being inside a specific area B] Being outside your area
C] Travelling D] None
14. Do you face connectivity problems during specific hours of the day?
A] 12am – 6am B] 6am – 12pm
C] 12pm -6pm D]6pm – 12am
15. Have you called at the customer service of the present service provider?
A] Yes B] No
If yes, for what reasons have you called?
A] Value added services B] Information about new plans
C] Complaints D] Queries
Are you happy with services provided by the customer service?
A] Yes B] No
16. Do you receive unwanted messages and calls from your service provider?
A] Yes B] No
If yes, how often do you receive them?
A] Rarely (1-3) B] Occasionally (4-6)
C] Frequently (more than 7) D] Never
17. Do you think miss call alerts should be provided at free of cost?

A] Yes B] No
18. Do you think the brand image of your service provider is better than others?
A] Yes B] No
19. What comes to your mind when you hear the brand name of your service
provider?
A] Music B] Punch line
C] Brand ambassador D] Theme of advertising
20. Do you face the problem of call drop?
A] Yes B] No
Do you face the call problem as
A] Complete call drop B] Partial call drop
C] Both D] None
21. How do you rate the various plans offered by your service provide?
A] Excellent B] Very good
C] Good D] Poor
22. Are you satisfied with the present pricing strategy of your service provider?
A] Yes B] No
23. Are the service outlets provided by your service provider convenient?
A] Highly convenient B] Convenient
C] Average D] In convenient
24. How do you prefer to learn about the services available to you?
A] Online B] In-store

25. Rank the following in terms of importance when choosing a service
provider (1 being of the highest importance and 5 being of least importance)
A] Price
B] Product
C] Location
D] Accessibility
E] Customer service
26. How satisfied would you say you are based on the following? (extremely,
quite, moderately, slightly, not satisfied)
A] Availability of connection C] Average download
speed
B] Reliability of connection D] Average upload speed
E] Price relative to cost
27. Are you satisfied with the overall service provided by your service
provider?
A] Highly satisfied B] Satisfied
C] Average D] Not satisfied
28. Would you like to change your current service provider in future?
A] Yes B] No
29. Do you have any suggestions for your service provider? (please specify
below)
30. How likely are you to recommend your mobile service provider to others?
A] Always
B] Most likely
C] Likely

D] Rarely
E] Never