CUSTOMER RELATIONSHIP MANAGEMENT AND CUSTOMER SATISFACTION (2)
Upload
khangminh22Category
view
0download
0
“A STUDY ON CUSTOMER SATISFACTION ON ZOMATO
WITH SPECIAL REFERENCE TO STUDENTS OF CHRIST
COLLEGE IRINJALAKUDA”
Project Report submitted to
UNIVERSITY OF CALICUT
In partial fulfillment of the requirement for the award of the degree of
BACHELOR OF COMMERCE (PROFESSIONAL)
Submitted by
ASWATHY
(CCASBCP007)
Under the supervision of
Mr. ASLAM P. S
DEPARTMENT OF COMMERCE
CHRIST COLLEGE (AUTONOMOUS), IRINJALAKUDA
MARCH 2021

CHRIST COLLEGE (AUTONOMOUS), IRINJALAKUDA
UNIVERSITY OF CALICUT
DEPARTMENT OF COMMERCE
CERTIFICATE
This is to certify that the project report entitled “A STUDY ON CUSTOMER
SATISFACTION ON ZOMATO WITH SPECIAL REFERENCE TO
STUDENTS OF CHRIST COLLEGE IRINJALAKUDA” is a bonafide
record of project done by ASWATHY, Reg. No. CCASBCP007, under my
guidance and supervision in partial fulfillment of the requirement for the award
of the degree of BACHELOR OF COMMERCE (PROFESSIONAL) and it has
not previously formed the basis for any Degree, Diploma and Associateship or
FELLOWSHIP.
PROF. K.O.FRANCIS Mr. ASLAM. P. S
Co-ordinator Project Guide

DECLARATION
I, ASWATHY, hereby declare that the project work entitled “A STUDY
ON CUSTOMER SATISFACTION OF ZOMATO WITH SPECIAL
REFERENCE TO STUDENTS OF CHRIST COLLEGE IRINJALAKUDA” is
a record of independent and bonafide project work carried out by me under the
supervision and guidance of Mr. Aslam .P.S, Assistant Professor, Department
of Commerce and management studies , Christ College, Irinjalakuda.
The information and data given in the report is authentic to the best of my
knowledge. The report has not been previously submitted for the award of any
Degree, Diploma, Associateship or other similar title of any other university or
institute.
Place: Irinjalakuda ASWATHY
Date: CCASBCP007

ACKNOWLEDGEMENT
I would like to take the opportunity to express my sincere gratitude to all
people who have helped me with sound advice and able guidance.
Above all, I express my eternal gratitude to the Lord Almighty under whose
divine guidance; I have been able to complete this work successfully.
I would like to express my sincere gratitude to Rev.Dr. Jolly Andrews,
Principal-in-Charge, Christ college Irinjalakuda for providing various facilities.
I am thankful to Prof. K.O.Francis, Co-ordinator of B.Com (Professional), for
providing proper help and encouragement in the preparation of this report.
I am thankful to Ms. Teena Thomas, Class teacher for her cordial support,
valuable information and guidance, which helped me in completing this task
through various stages.
I express my sincere gratitude to Mr. Aslam. P.S , Assistant Professor, whose
guidance and support throughout the training period helped me to complete this
work successfully.
I would like to express my gratitude to all the faculties of the Department for
their interest and cooperation in this regard.
I extend my hearty gratitude to the librarian and other library staffs of my
college for their wholehearted cooperation.
I express my sincere thanks to my friends and family for their support in
completing this report successfully.

TABLES OF CONTENTS
CHAPTER NO. CONTENTS PAGE NO:
LIST OF TABLES
LIST OF FIGURES
CHAPTER 1 INTRODUCTION 1 – 5
CHAPTER 2 REVIEW OF LITERATURE 6 – 14
CHAPTER 3 INDUSTRY AND COMPANY
PROFILE 15 – 19
CHAPTER 4 DATA ANALYSIS AND
INTERPRETATION 20 – 37
CHAPTER 5 FINDINGS, SUGGESTIONS
& CONCLUSION 38 – 40
BIBLIOGRAPHY
ANNEXURE

LIST OF TABLES
TABLE
NO:
TITLE PAGE NO:
4.1 Table showing the age of the respondents. 20
4.2 Table showing the gender of the respondents 21
4.3 Table showing the education qualifications of
respondents
22
4.4 Table showing how often the respondents order
food online.
23
4.5 Table showing from where did the respondents got
to know about Zomato
24
4.6 Table showing how long the respondents have
been using Zomato’s services.
25
4.7 Table showing reasons for choosing zomato 26
4.8 Table showing comparison of Zomato with other
food delivery companies
27
4.9 Table showing how easy is to navigate the website
www. Zomato.com .
28
4.10 Table showing the expectation and satisfaction of
the respondents towards price ranges of Zomato
29
4.11 Table showing expectation and satisfaction of
respondents towards application of Zomato.
30
4.12 Table showing expectation and satisfaction of
customers towards food quality of Zomato.
31

4.13 Table showing the expectation and satisfaction of
respondents towards packaging of food.
32
4.14 Table showing the expectation and satisfaction of
respondents towards responsiveness of Zomato.
33
4.15 Table showing the expectation and satisfaction of
respondents towards delivery speed of Zomato.
34
4.16 Table showing the overall satisfaction of
respondents
35
4.17 Table showing whether respondents have felt any
trouble in dealing with Zomato
36
4.18 showing whether the respondents will recommend
Zomato’s services to others.
37

LIST OF CHARTS
FIGURE
NO: TITLE PAGE NO:
4.1 Chart showing age wise classification of the
respondents 20
4.2 Chart showing the gender of the respondents 21
4.3 Chart showing education qualifications of
respondents. 22
4.4 Chart showing how often the respondents order food
online. 23
4.5 Chart showing information source about Zomato 24
4.6 Chart showing how long the respondents have been
using Zomato’s services. 25
4.7 Chart showing reasons for choosing zomato. 26
4.8 Chart showing how would the respondents compare
the services offered by Zomato with other companies 27
4.9 Chart how easy is to navigate the website
Zomato.com. 28
4.10 Chart showing expectation and satisfaction on price 29
4.11 Chart showing expectation and satisfaction towards
application 30
4.12 Chart showing expectation and satisfaction towards
food quality 31

4.13 Chart showing expectation and satisfaction towards
packaging of food 32
4.14 Chart showing expectation and satisfaction towards
responsiveness 33
4.15 Chart showing Expectation and satisfaction towards
delivery speed 34
4.16 Chart showing overall satisfaction of respondents 35
4.17 Chart showing whether respondents have felt any
trouble in dealing with Zomato. 36
4.18 Chart showing whether the respondents will
recommend Zomato’s services to others 37

CHAPTER – 1
INTRODUCTION

1
1.1 Introduction
Customer satisfaction is a term frequently used in marketing. It is a measure of
how products and services supplied by a company meet or surpass customer
expectation. Customer satisfaction is defined as ‘the number of customers, or
percentage of total customers, whose reported experience with a firm, its products,
its services exceeds specified satisfaction goals. In researching satisfaction, firms
generally ask customer whether their product or service has met or exceeded
expectations. Thus expectations are a key factor behind satisfaction. When
customers have high expectations and the reality falls short they will be
disappointed and will likely rate their experience as less than satisfying.
The online ordering system can be defined as a simple and convenient way
for customers to purchase food online, without having to go to the restaurant. The
system is enabled by the internet that connects the restaurants or the food company
on one hand, and the customer on other hand. Therefore as per this system the
customer visits the restaurant’s app or website, browses through the various food
items, combos and cuisines available there and those ahead and selects and
purchases the items he or she needs. These items will be then be delivered to the
customer at his or her doorstep at the time they choose by a delivery person.
Payments for such online orders can be made through debit cards, credit cards,
cash or card on delivery or even through digital wallets.
Zomato is an Indian restaurant aggregator and food delivery start up
founded by Deepinder goyal and pankaj chaddah in 2008. Zomato was founded as
foodiebay in 2008, and was renamed Zomato in 2010. In 2011 Zomato expanded
across india to Delhi, Mumbai, Bangalore, Chennai, Pune and Kolkata. In 2012
the company expanded operations internationally in several countries, including
the United Arab Emerates, Srilanka, Qatar, the United Kingdom, Philippines and
South Africa. Zomato provides information, menus and user-reviews of

2
restaurants as well as food delivery options from partner restaurants in select
cities. Zomato also began grocery delivery amid the COVID-19 outbreak. As of
2019, the service is available in 24 countries and in more than 10,000 cities.
Zomato online ordering had been a great addition to our delivery channels. Its
smooth integration and online payment ability has allowed them to tap new
customer segments as well as give an enhanced service to their existing customers
too, it has allowed to avoid the issues related to credit card payment of delivery.
1.2 Statement of problem
In this growing world of technology, online food delivery has become an
important element of people’s life. The concept of dine out system has changed
and made people to order food at any time conveniently just by few clicks. This
system is revolutionizing the present restaurant industry. Consumer preference is
the main stimulating factor for business owners to indulge in online delivery
services. With intensive urbanization large volumes of food move through the
systems . With the changes in India’s population, more industry in different cities
for the purpose of studies and employment, the busy schedules of both husband
and wife in the family eats the demand for online food ordering developing and
growing up steadily. It is a growing trend especially in urban areas and on college
campuses that allows people to order from restaurants. The purpose of this study is
to measure the expectation & satisfaction of customers regarding Zomato food
delivery application among college students. This study also analyses the factors
that attract consumers towards Zomato.
1.3 Scope of Study
Scope of the study is limited towards commerce students who have
experienced such online food delivery services through Zomato app. The study is
basically conducted to know how consumers perceive the online food delivery
services. The expectation and satisfaction of consumers may vary under different

3
circumstances. From this study, we can have a better understanding of the Online
Food Delivery Service Market. Therefore, these findings may help the service
providers to work upon on these variables to fill up the gaps in the mindset of
consumers. The survey was conducted in commerce students of Christ College,
Irinjalakuda.
1.4 Objectives of Study
To know about the expectation and satisfaction level of respondents
towards Zomato.
To identify the factors influenced for choosing Zomato.
1.5 Research design
1.5.1 Nature of study
The study on customer satisfaction of Zomato among college students is
descriptive cum analytical in nature
1.5.2 Nature of data
The study is based on both primary and secondary data
1.5.3 Sources of data
Primary data : To study the customer satisfaction on Zomato a questionnaire was
prepared and the data was collected from the commerce students who are using
Zomato application.
Secondary data : The secondary data was collected with the help of internet
search, and online articles .

4
1.6 Sample design
The research was carried out in various phases that constituted an approach of
working from whole to part. It included several phases which tried to deeper into
users likings and develop a thorough understanding of what the consumer looks
forward while ordering food online. For the study a sample of 50 respondents were
chosen from commerce students of Christ College, irinjalakuda.
1.6.1 Nature of population
The population selected for the study is the commerce students of Christ college
Irinjalakuda and the nature of population is finite i.e. 900
1.6.2 Sample unit
Sample unit is the commerce students of Christ College, Irinjalakuda.
1.6.3 Method of sampling
Simple random sampling method is adopted for the study with a sample size of 50
respondents among commerce students.
1.6.4 Size of the sample
The sample size for the customer survey is 50 and they will be considered
adequate to represent the characteristics of the entire population.
1.7 Tools for analysis
Statistical tools used for the analysis are mean average, percentage, table &graph.
1.8 Limitations of the study
The research was limited to commerce students of Christ college, Irinjalakuda.
Hence the outcome cannot be explorated to other areas.

5
Sample size limited to 50.
1.9 Chapter scheme
Chapter 1. Introduction.
This chapter covers the introduction, statement of the problem, scope of the study,
significance of the study, objective of the study, research design, sample design.
Chapter 2. Review of literature.
This chapter contains the review of literature of the study which reviews a few
study that have been conducted for similar topics.
Chapter 3. Industry profile and company profile
It includes the profile of online food ordering system and profile of Zomato.
Chapter 4. Data analysis and interpretation
It includes the data used for the research and the analysis and interpretation of
data.
Chapter 5 Findings, suggestions and conclusion
It includes the findings made out of the data and the suggestions made out of the
analysis and conclusion.

CHAPTER-2
REVIEW OF LITERATURE

6
2.1 Conceptual review
Customer
Customer is the recipient of a service, or a product, or an idea, obtained
from a seller, vendor or supplier via a financial transaction or exchange for money
or for some other valuable consideration.
Customer satisfaction – Meaning
Customer satisfaction often abbreviated as C Sat, it is a term frequently
used in marketing. It is a measure of how products and services supplied by a
company meet or surpass customer expectation. Customer satisfaction is defined
as the “the number of customers on % of total customer whose reported
experience with a firm , its products or services exceeds specified satisfaction
goals. Customer Satisfaction is a key indicator of performance and is often part of
a balanced scoreboard . In a competitive world, market place where business
compete for customers, customer satisfaction is seen as a key differentiator and
increasingly has become a key element in business strategy.
Many companies are aiming for high satisfaction because customers who
are just satisfied still find it easy to switch when a better offer comes along. Those
who are highly satisfied are much less ready to switch. High satisfaction creates an
emotional affinity with the brand, not just a rational preference. The result is high
customer loyalty.
Customer satisfaction is the most common form of market research in
business to business (B2B) markets and is often connected to quality and
production measurement, rather than as straight marketing based research.
Customer satisfaction provides a leading indicator of customer purchase intentions
and customer loyalty. Although sales or market share can indicate how well a firm

7
is performing currently, satisfaction is perhaps the best indicator of how likely it
is, that the firm’s customers will make further purchases in the future.
Definition
Customer satisfaction is whether the buyer is satisfied after purchase depends on
the offer’s performance in relation to the buyer’s expectations. In general
satisfaction is a person’s feeling of pleasure or disappointment resulting from
comparing a product’s perceived performance (outcome) in relation to his or her
expectations. Satisfaction is a function of perceived performance and expectations.
If the performances fall short of expectations, the customer is disappointed. If the
performance matches the expectations, the customer is satisfied. If the
performance exceeds expectations the customer is highly satisfied or delighted.
(Philip Kotler. 2000).
Importance of customer satisfaction
Customer satisfaction is important because it provide marketers and business
owners with a metric that they can use to manage and improve their businesses.
Here are the top reasons why customer satisfaction is so important:
It acts as leading indicator of customer repurchase intention and loyalty:
Customer satisfaction is the best indicator of how likely a customer will make a
purchase in the future. Asking customers to rate their satisfaction on a scale is a
good way to see if they will become repeat customers.

8
It is a point of differentiation:
In a competitive market place where businesses compete for customers, customer
satisfaction is seen as a key differentiator. Business who succeed in these cut
throat environment are the ones that make customer satisfaction a key element of
their business strategy. Companies who offer amazing customer experiences create
environments where satisfaction is high and customer advocates are plenty. This is
an example of where customer satisfaction goes full circle. Not only can customer
satisfaction help you keep a finger on the pulse of your existing customers, it can
also act as a point of differentiation for new customers.
It reduces customer churn:
An Accenture global customer satisfaction report (2008) found that price is not the
main reasons for customer churn, it is actually due to the overall poor quality of
customer service. Customer satisfaction is the metric you can use to reduce
customer churn. By measuring and tracking customer satisfaction you can put new
processes in place to increase the overall quality of your customer service.
It is cheaper to retain customers than acquire new ones:
This is probably the most publicized customer satisfaction statistic out there. It
costs six to seven times more to acquire new customers than it does to retain
existing customer. Customers costs a lot of money to acquire.

9
Factors effecting customer satisfaction
Quality of product or service:
Customers give prior importance to quality of the product or service. It is the first
and foremost thing that the customers consider. No amount of aggressive
marketing can save a product or service which is a poor quality.
E -business:
The age of the internet has made finding products and services a snap. What used
to take minutes of flipping through a phone book now takes seconds on the web.
E-mailing and searching for products and services on the internet has become such
a central reference point, companies have invested millions in making sure access
is extremely easy. Customers are satisfied when there are two barriers, or at the
very least, limited barriers to access a service.
Timely service:
When the product or services are not delivered or availed in time, the customer
gets dissatisfied. Excuses don’t fly when customers are counting on a service.
One example is the dreaded time window. In a society that demands instant results
for everything from food to foreign policy, a good business has to keep the wait
time to a minimum.
Separation from identical products:
In a market, there is usually more than one of the products, perhaps dozens. Word
of mouth certainly plays into customer satisfaction. If a product is a best one
among several identical products, then it is necessary to separate it from the rest,
through marketing, customer service and good- old fashioned product quality.

10
Creation of sense of good value:
When a product or service costs more, but it is worth it, its value becomes
acceptable to the customer. When a consumer buys high priced products of big
brands, the positive features of the products or service should overweigh the cost,
creating a strong sense of good value. Good customer service also plays a vital
role.
Responsibility:
A company has a commitment to tell the truth. Hiding facts, figures and excessive
print doesn’t go far when it comes to a customer satisfaction. If a company doesn’t
stand by its product, or hassles the customer when a refund or exchange is in
order that will stick. When something goes wrong with a product or service, if the
supplier goes above and beyond the call of duty in taking responsibility, the end
result is often that the customer is so impressed with the supplier response, it
neglects the original problem.
A nice atmosphere:
Given the same product or service, the customer would rather shop at that place
that offers a clean, safe and well -organized environment. When you need a
product that’s the same brand and the same price, the store that’s psychologically
more inviting will win out every time.
Purpose of customer satisfaction.
A business ideally is continuously seeking feedback to improve customer
satisfaction.
Basic steps in customer satisfaction :-
Ask customer if they like the product or service
Fix it, improve and make changes

11
Sell the improved products
Assess the progress
Customer satisfaction provides a leading indication of consumer purchase
intention and loyalty. Customer satisfaction data are among the most frequently
collected indicators of market perception .Their principle is two fold:-
1. Within organization, the collection, analysis and dissemination of these data
send a message about the importance of tending to customer and ensuring that
they have a positive experience with the company’s goods and services.
2. Although sales or market share can indicate how well a firm is performing,
currently satisfaction are perhaps the best indicators of how likely it is that the
firm’s customer will make further purchase in the future . Much research has
focused on the relationship between customer satisfaction and retention studies
indicates that the reunification of satisfactions are most strongly realized at the
extremes.
Customer satisfaction, is measured at the individual level, but it is almost always
reported at an aggregate level. It can be and often is measured along various
dimension. A hotel, for example might ask customers to rate their experience with
front desk and check in service with the room, with the amenities in the room with
restaurants and so on. Additionally in a holistic serve, the hotel might ask about
overall satisfaction with your stay.
2.2. Review of literature
1.Bhavya saini (2016) , “Consumer preference and attitude regarding online food
products” the study emphasized that using the internet in seeking food service
information was a common practice among people living in india and online
interpersonal influence took a fundamental apart. A high percentage of consumers
were unconcerned about accurate evidence regarding food safety in selecting food

12
products on the internet. The conclusion of our findings produces practical pieces
of advice to consumers buying online food, to food retailers selling food over the
internet and to the government of india to implement appropriate legislation
regarding online food product information. Among all these factors customers
usually expect three website merits to assist their online encounters that are system
quality, information quality, and service quality.
2.Hong Lan (2016), “Online food delivery market is immature yet, there are some
obvious problems that can be seen from consumers” negative comments. In order
to solve these problems, we can neither rely merely on the self discipline of online
food delivery restaurants nor the supervision and management of online food
delivery platforms. Only by taking laws as the criterion, with the joined efforts of
the online food delivery platforms and restaurants, the government departments
concerned, consumers and all parties in the society, can these problems be solved
and good online take away environment can be created .
3.Sumathy (2017), “A study on prospective concernment towards food adjure
app” the online food adjure app system will be helpful for the hotels and
restaurants to increase the scope of the business by helping users to give order
through online. This study was to find the awareness level and satisfaction derived
by the consumer and also to find which factor influence customers to buy food
through online from food adjure app. Most of the respondents disagree to the fact
that online website charges high delivery fees. Almost all users feel safe paying
online. The service rendered by the food adjure app is the major factor behind its
success
4.Sheryl E. Kimes (2011), His study found that perceived control and perceived
convenience associated with the online food ordering services were important for
both users and non-users. Non-users need more personal interaction and also had
higher technology anxiety to use the service.

13
5. Varsha Chavan, et al, (2015), The use of smart device based interface for
customers to view, order and navigate has helped the restaurants in managing
orders from customers immediately. The capabilities of wireless communication
and smart phone technology in fulfilling and improving business management and
service delivery. Their analysis states that this system is convenient, effective and
easy to use, which is expected to improve the overall restaurant business in
coming times.
6. Leong Wai Hong (2016), the technological advancements in many industries
have changed the business model to grow. Efficient system can help improve the
productivity and profitability of a restaurant . The use of online food delivery
system is believed that it can lead the restaurant’s business grow from time to time
and will help the restaurants to facilitate major business online.
7. Serhat Murat Alagoz & Haluk Hekimoglu (2012). E commerce is rapidly
growing worldwide, the food industry is also showing a steady growth. In this
research paper they have used the Technology Acceptance Model (TAM) as a
ground to study the acceptance of online food ordering system. Their data analysis
revealed that the attitude towards online food ordering vary according to ease and
usefulness of online food ordering process and also vary according to their
innovativeness against information technology, their trust in e-retailers and various
external influences.
8. Ramesh Kumar Bagla, Jasmine Khan. The purpose of this study was to
investigate the factors that are responsible for the growing popularity of online
booking and ordering of food in india, expectations of the users, and their
satisfaction levels with the popular apps such as food panda, Zomato, Swiggy.
Descriptive research was undertaken on the basis of primary data collected from
the respondents residing in National Capital Region of Delhi chosen through non-
probability convenience sampling using structured questionnaire. Findings was the

14
factors contributing to the popularity of online food ordering were found to be :
lack of time to prepare food, availability of variety, rewards and cashbacks. There
is a scope of improving the user’s satisfaction levels by understanding their
expectations more precisely and offering more attractive options while ordering
food online.
9. Kumaran. M. (2017), has conducted a study on “perception towards online
shopping an empirical study with respect to Indian buyers ” . This research deals
with E- marketing researches concerning the factors which affects consumer
perception towards online purchasing experiences, this research dealt with the
perceived risks, website role, domain specific innovativeness, subjective norms,
attitude perceived usefulness, perceived ease of use, attitude, online shopping
intention and online shopping behavior. There are many reasons for people
preferring online shopping but the major reason for a consumer backing out from
online shopping is the security issues but the industry has given little concern to
this issue.
10. Jyotishman Das (2018), the doorstep delivery is the most highly ranked factor
of influencing the consumers to use the food ordering applications. The consumers
are also often influenced by discounts and cashbacks they enjoy. On comparing
the factors the most preferred service provider came out to be Zomato followed by
Swiggy.

CHAPTER-3
INDUSTRY PROFILE
AND
COMPANY PROFILE

15
3.1 Company profile
Zomato is an Indian restaurant aggregator and food delivery start-up founded by
Deepinder Singh Goyal and Pankaj Chaddah in 2008. Zomato is a fastest growing
restaurant discovery website. Initially it was named as foodie bay but in 2010, it
was renamed as Zomato . It provides not only information related to nearby
restaurants but also provides facilities such as online ordering, table reservations
and management. Zomato currently serves in 10000 cities across 24 countries
having 1.2 million popular restaurants with 80 million foodies every month. It is
available in 10 different languages and has 10 million reviews with 18 million
bookmarks. It gives a platform to the restaurants owners to serve a large number
of users a good quality of food.
Head quarters: Gurgaon, Haryana, India
Key people: Founder and chief executive officer- Deepinder Goyal , Chief
operating officer- Surobhi Das , Chief technology officer- Gunjan Patidar.
Logo: The logo of Zomato represents simply the name of the company and
indicates the love for the good food . As its mission is to ensure that “ Nobody has
a bad meal”
Number of employees : 5000 employees
Achievements: The CEO has honored with NDTV Indian of the year
Zomato generated its 95% of revenues, from the commercial advertisement in
the financial year 2013.
Zomato is in the 77th
position in Top 100 start up in India

16
3.2 Industry profile.
Ordering food online with the swipe of a finger has become nothing less than a
cakewalk for most of us. There are a number of applications that are essentially
designed to ease people’s lives, especially when most of the people live away
from home trying to make a living on their own. And no matter how healthy
cooking own meals would be, it is not always possible to do so, given the hectic
lives.
The First Pizza Delivery Was Way Back In 1889:
King Umberto 1 of Italy once asked a renowned chef from Naples to
make him and his wife, Queen Margherita of Savoy three different pizzas. The
chef delivered the pizzas to them, being little aware of the fact that this would later
turn into a billion-dollar industry. There was a time when the online food delivery
system would be considered an underdog. However, it has seen monumental
growth over the last few years, and its popularity has gone over the roof. The
industry has penetrated through every layer of society and has spread its roots all
across the globe. It is difficult to think of a country which does not have this
highly functional chain of online food delivery system. And as more and more
millennials join the phenomenon of ordering food online, the marketplace for
online food delivery grows by the minute. With individuals becoming increasingly
busy, the service provided by online food delivery Apps allowing them to place
their order and receive delivery within a matter of minutes, is a great advantage. In
addition to this, the online environment offers an avenue for customers to satisfy
their impulsive food cravings. Customers can have easy access to competitive
service providers at competitive prices and at the same time they can also receive
input from their peers through social media, which helps influence their ultimate
purchase decision. With a population of over 1.2billion, India is undeniably one

17
of the biggest consumer markets in the world today.50% of this population fall
under the age of 25, making India one of the countries with the youngest
population in the world. Furthermore, it has been predicted that by the year 2025
the number of middle-class Indians will touch 550 million. Moreover, e-commerce
has been expected to grow from US $2.9 billion in 2013 to a mammoth US $100
billion by 2020, thereby making it the fastest growing e-commerce market in the
world.
With this backdrop it should be noted that a growing trend has been
observed showing that a majority of the fast food demand occurs within the age
group of 10 – 40 years. The recent rise in the number of productively employed
young Indians in sectors such as IT services has resulted in an increase in the
spending capacity of the individuals. According to statistics provided by the World
Bank, there has been a 50% increase in the per capita income from 2006 till date.
This growing appetite and increased spending capability of young Indians has
made the food industry an attractive and lucrative area in which to start a business.
With this significant growth in the online food and restaurant service industry, it
has been estimated that the Gross Merchandise Value of online food and restaurant
industries would reach an estimated $2.7 billion by the end of 2019, which is a
significant leap from the $300 million in 2016.
In addition to young Indians fueling the growing demand for the
services of online food delivery, the increase in dual income families in urban
areas of India, where both parents work, is dramatically changing the way people
live in subtle yet significant ways. The changes in routines, lifestyle and food
habits have resulted in an increase in demand for easily accessible and good
quality food. It has been estimated that almost 92% of nuclear families who seek
out fast food or take out, as against preparing a meal at home, do so in order to
save the time and energy. Also, the increase in the number of working women and
the increase in the amount of disposable income has proved to be a key demand

18
driver. Online food ordering is the process of ordering food from a website or
other application. The product can be either ready to eat food or food that has not
been specially prepared for direction consumption. Many of these allow customers
to keep accounts with them in order to make a frequent ordering convenient. A
customer will search for a favorite restaurant, usually filtered via type of cuisine
and choose from available items and choose delivery or pickup. Payment can be
amongst others either by credit card or cash, with the restaurant returning a
percentage to the online food company. Online ordering system is a technique that
allow customer to order their favorite food online via the internet using a web
browser that installed in their respective computer or smart phone. Implementing
this system can help fast food industry to solve the problem that they face while
using the traditional food ordering process. The system greatly simplifies the food
ordering process for both customer and restaurant compare to the past. The
customer can place an order everywhere and anywhere whenever the internet
connection is available for them. Customers access to the website and choose the
food that they prefer from the online menu displayed. Online food ordering
software designed specifically for food to go retailers, restaurants and takeaway
online sustenance requesting is quickly expanding as clients take pleasure in the
comfort of requesting online.
Benefits of using online food ordering or restaurant ordering application
is reduced labour costs, reduces walk away and long queues. This online ordering
system for restaurants is designed for multisite food to go chains and independents
like restaurants, cafes, and coffee shops, fast food, take away, other catering
services.
Some of the popular applications for food delivery in India-

19
1. Swiggy
Swiggy is one of the top rated food ordering mobile applications in India. It was
aroused by the prospect of giving entire sustenance requesting and conveyance
arrangements from the best nearby hotels to the customers. Swiggy is the best food
delivery apps for Bangalore and other top clients in India. The service which
provides customers offering from any restaurant with no minimum order method
and receives an amount from all nearby hotels collaborates with.
2. Uber Eats.
Uber eats is a popular online food ordering app in India which operates in all
major cities including Mumbai, Chennai, Bangalore, Hyderabad, Delhi and more.
The mobile app is available for both android and iOS devices. This is a venture of
Uber Technologies, Inc. Who is also its own popular taxi service across the globe.
Uber eats operating in over 1000+ many major cities around the world in various
countries. The app allows users to pick favorite food from nearby restaurants and
delivers to the spot in a quick span of time.
3. Food Panda
Food panda is a mobile food delivery marketplace owned by Berlin- based
company delivery Hero SE and operates in about 50 countries. Food panda is one
of the pioneers of the online food delivery industry. The application has all your
favorite cuisines. Food panda is user- friendly and quick to order app. The steps to
complete your order are convenient and super fast.

CHAPTER – 4
DATA ANALYSIS
AND
INTERPRETATION

20
Table 4.1 showing the age of the respondents.
Age Frequency Percentage
17-18 1 2
19-20 2 4
21-22 5 10
23-24 27 54
25-26 15 30
Total 50 100
(Source: primary data)
Figure 4.1 showing age wise classification of the respondents
Interpretation : The table 4.1 shows age wise classification of respondents it,
reveals that 2% of the total respondents is aged between 17-18 , 4% is aged
between 19-20, 10% of the respondents aged between 21-22, 54% belongs to the
age group 23-24 , and 30% belongs to the age group 25-26
0
5
10
15
20
25
30
17-18 18-19 19-20 20-21 21-22

21
Table 4.2 showing the gender of the respondents
Gender Frequency Percentage
Male 25 50
Female 25 50
Total 50 100
(Source: Primary data)
Figure 4.2 showing gender wise classification of the respondents
Interpretation: Table 4.2 shows gender wise classification of respondents. It
reveals that 50% of the respondents are male and the other 50% of the respondents
are female.
0
10
20
30
40
50
60
Male Female

22
Table 4.3 showing the education qualifications of respondents.
(Source: Primary data)
Figure 4.3 showing education qualifications of respondents.
Interpretation: Table 4.3 shows education qualification wise classification, it
reveals that 86% of the respondents are degree students and the remaining 14% of
the respondents are P.G students.
0
10
20
30
40
50
60
70
80
90
100
Degree P.G
Qualification Frequency Percentage
Degree 43 86
P.G 7 14
Total 50 100

23
Table 4.4 showing how often the respondents order food online.
Particulars Frequency Percentage
Daily 4 8
Weekly 9 18
Monthly 37 74
Total 50 100
(Source: Primary data)
Figure 4.4 showing how often the respondents order food online.
Interpretation: From the above figure 4.4 we can understand that 74% of the
whole respondents order food online in monthly basis, 18% of the respondents
make orders in weekly basis and 8% order food online on daily basis.
0
10
20
30
40
50
60
70
80
Daily Weekly Monthly

24
Table 4.5 showing from where did the respondents got to know about
Zomato.
Source Frequency Percentage
Television 2 4
Friends 10 20
Online advertisements 36 72
Newspaper
advertisements
0 0
Family 2 4
Total 50 100
(Source: Primary data)
Figure 4.5 showing information source about Zomato.
Interpretation: From the above figure it is found that 72% of the respondents
came to know about Zomato through online advertisements, 20% respondents
through friends, 4% respondents through family, 4% of respondents through
television and there are no respondents who got to know about Zomato from
newspaper advertisements.
0
10
20
30
40
50
60
70
80
Television Friends Online advertisements
Newspaper advertisements
Family

25
Table 4.6 showing how long the respondents have been using Zomato’s
services.
Duration Frequency Percentage
Less than 1 year 20 40
1-2 years 14 28
2-3 years 12 24
More than 3 years 4 8
Total 50 100
(Source: Primary data)
Figure 4.6 showing how long the respondents have been using Zomato’s
services.
Interpretation: From the above figure it is found that 40% of respondents started
using Zomato in less than a year, 28% respondents started using it for 1-2 year,
24% respondents started using it for 2-3 years and 8% respondents have been
using it for more than 3 years.
0
5
10
15
20
25
30
35
40
45
Less than 1 year 1-2 years 2-3 years More than 3 years

26
Table 4.7 showing reasons for choosing Zomato.
Particulars Frequency Percentage
Price 1 2
Quality 3 6
Special offers 25 50
Quantity 0 0
Delivery speed 10 20
Variety of foods 11 22
Total 50 100
(Source: Primary data)
Figure 4.7 showing reasons for choosing Zomato.
Interpretation: From the above figure it is found that 2% respondents chose
Zomato due to it’s product price, 6% respondents due to it’s quality, 50% due to
special offers, 20% due to it’s delivery speed, 22% due to variety of foods that
they are providing and no respondents considering quantity for choosing Zomato.
0
10
20
30
40
50
60
Price Quality Special offers Quantity Delivery speed Variety of foods

27
Table 4.8 showing comparison of Zomato with other food delivery
companies
Particulars Frequency Percentage
Much better 11 22
Somewhat better 17 34
About the same 17 34
Somewhat worse 4 8
Much worse 1 2
Total 50 100
(Source: Primary data)
Figure 4.8 showing how would the respondents compare the services
offered by Zomato with other companies
Interpretation: From the above figure we can analyse that 22% respondents
found Zomato much better than other food delivery applications, 34% of the
respondents found it somewhat better than other food delivery applications, 34%
respondents about the same opinion compared to other applications, 8%
respondents feels that Zomato somewhat worser than other applications and 2% of
people found Zomato much worser than other food delivery applications.
0
5
10
15
20
25
30
35
40
Much better Somewhat better About the same Somewhat worse Much worse

28
Table 4.9 showing how easy is to navigate the website www.
Zomato.com.
Particulars Frequency Percentage
Extremely easy 17 34
Somewhat easy 31 62
Not so easy 2 4
Not easy at all 0 0
(Source: Primary data)
Figure 4.9 showing how easy is to navigate the website Zomato.com.
Interpretation: From the above figure it is found that 34% respondents are of the
view that it is extremely easy to navigate the website www.Zomato.com, 62%
respondents find it somewhat easy , 4% says that it is not so easy and no
respondents find it not easy at all to navigate through www.Zomato.com.
0
10
20
30
40
50
60
70
Extremely easy Somewhat easy Not so easy Not easy at all

29
Table 4.10 showing the expectation and satisfaction of the respondents
towards price ranges of Zomato
Expectation Frequency Weight Total Satisfaction Frequency Weight Total
Excellent 2 5 10 Strongly
satisfied
2 5 10
Very good 2 4 8 Satisfied 33 4 132
Good 20 3 60 Neutral 13 3 39
Fair 24 2 48 Dissatisfied 1 2 2
Poor 2 1 2 Strongly
dissatisfied
1 1 1
Total 50 15 128 Total 50 15 184
Average expectation is 128/50 = 2.56 Average satisfaction is 184/50 = 3.68
(Source: Primary data)
Figure 4.10. Expectation and satisfaction on price
Interpretation: Table 4.10 shows the expectation and satisfaction of Zomato
customers on product price. From the table it is clear that the average expectation
is 2.56 and average satisfaction is 3.68. Therefore satisfaction on price is higher
that expectation on price.
0
0.5
1
1.5
2
2.5
3
3.5
4
Average of expectation Average of satisfaction

30
Table 4.11 showing expectation and satisfaction of respondents towards
application of Zomato.
Average on expectation = 140/50 = 2.8 Average on satisfaction= 191/50 = 3.82
(Source: Primary data)
Figure 4.11. Expectation and satisfaction towards application
Interpretation: Table 4.11 shows the expectation and satisfaction of Zomato
application . From the table it is clear that the average of expectation is 2.8 and
average of satisfaction is 3.82. Therefore the satisfaction on application is higher
than the expectation on application.
0
0.5
1
1.5
2
2.5
3
3.5
4
4.5
Average on expectation Average on satisfaction
Expectation Frequency Weight Total Satisfaction Frequency Weight Total
Excellent 4 5 20 Strongly
satisfied
9 5 45
Very good 6 4 24 Satisfied 26 4 104
Good 23 3 69 Neutral 13 3 39
Fair 13 2 26 Dissatisfied 1 2 2
Poor 1 1 1 Strongly
dissatisfied
1 1 1
Total 50 15 140 Total 50 15 191

31
Table 4.12 showing expectation and satisfaction of customers towards
food quality of Zomato.
Average on expectation= 146/50 = 2.92 Average on satisfaction=188/50 = 3.76
(Source: Primary data)
Figure 4.12. Expectation and satisfaction towards food quality
Interpretation: Table 4.12 shows the expectation and satisfaction of food quality
provided by Zomato. From the above table it is clear that the average expectation
on food quality is 2.92 and the average satisfaction on food quality is 3.76. The
satisfaction on food quality is higher than expectation on food quality.
0
0.5
1
1.5
2
2.5
3
3.5
4
Average on expectation Average on satisfaction
Expectation Frequency Weight Total Satisfaction Frequency Weight Total
Excellent 5 5 25 Strongly
satisfied
5 5 25
Very good 4 4 16 Satisfied 31 4 124
Good 25 3 75 Neutral 12 3 36
Fair 14 2 28 Dissatisfied 1 2 2
Poor 2 1 2 Strongly
dissatisfied
1 1 1
Total 50 15 146 Total 50 15 188

32
Table 4.13. showing the expectation and satisfaction of respondents
towards packaging of food.
Expectation Frequency Weight Total Satisfaction Frequency Weight Total
Excellent 4 5 20 Strongly
satisfied
10 5 50
Very good 9 4 36 Satisfied 25 4 100
Good 24 3 72 Neutral 11 3 33
Fair 10 2 20 Dissatisfied 3 2 6
Poor 3 1 3 Strongly
dissatisfied
1 1 1
Total 50 15 151 Total 50 15 190
Average on expectation= 151/50= 3.02 Average on satisfaction=190/50 = 3.8
(Source: Primary data)
Figure 4.13. Expectation and satisfaction towards packaging of food
Interpretation: Table 4.13 shows the expectation and satisfaction of food
packaging . From the table it is clear that the average expectation on packaging is
3.02 and average satisfaction is 3.8. Therefore satisfaction on packaging of food is
higher than expectation of the respondents.
0
0.5
1
1.5
2
2.5
3
3.5
4
Average on expectation Average on satisfaction
33
Table 4.14. showing the expectation and satisfaction of respondents
towards responsiveness of Zomato.
Expectation Frequency Weight Total Satisfaction Frequency Weight Total
Excellent 3 5 15 Strongly
satisfied
5 5 25
Very good 5 4 20 Satisfied 27 4 108
Good 19 3 57 Neutral 13 3 39
Fair 21 2 42 Dissatisfied 2 2 4
Poor 2 1 2 Strongly
dissatisfied
3 1 3
Total 50 15 136 Total 50 15 179
Average on expectation=136/50 = 2.72 Average on satisfaction=179/50 = 3.58
(Source: Primary data)
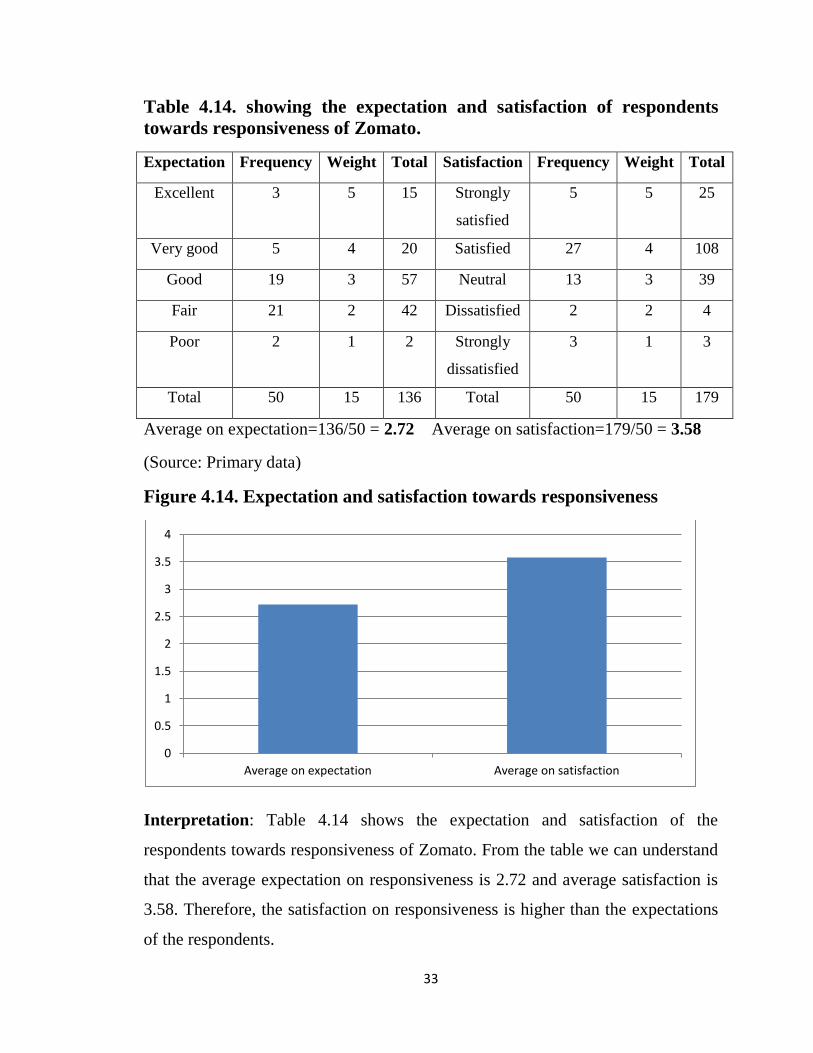
Figure 4.14. Expectation and satisfaction towards responsiveness
Interpretation: Table 4.14 shows the expectation and satisfaction of the
respondents towards responsiveness of Zomato. From the table we can understand
that the average expectation on responsiveness is 2.72 and average satisfaction is
3.58. Therefore, the satisfaction on responsiveness is higher than the expectations
of the respondents.
0
0.5
1
1.5
2
2.5
3
3.5
4
Average on expectation Average on satisfaction

34
Table 4.15. showing the expectation and satisfaction of respondents
towards delivery speed of Zomato.
Expectation Frequency Weight Total Satisfaction Frequency Weight Total
Excellent 1 5 5 Strongly
satisfied
13 5 65
Very good 10 4 40 Satisfied 27 4 108
Good 20 3 60 Neutral 5 3 15
Fair 17 2 34 Dissatisfied 2 2 4
Poor 2 1 2 Strongly
dissatisfied
3 1 3
Total 50 15 141 Total 50 15 195
Average on expectation=141/50 = 2.82 Average on satisfaction=195/50 = 3.9
(Source: Primary data)
Figure 4.15. Expectation and satisfaction towards delivery speed
Interpretation: Table 4.15 shows the expectation and satisfaction of the
respondents towards delivery speed of Zomato. From the table it is clear that the
average expectation on delivery speed is 2.82 and average satisfaction is 3.9. So
the satisfaction on delivery speed is more than the expectations of the respondents
on the delivery speed.
0
0.5
1
1.5
2
2.5
3
3.5
4
4.5
Average on expectation Average on satisfaction

35
Table 4.16. showing the overall satisfaction of the respondents
Particulars Satisfaction (Sum) Average
Price 184 3.68
Application 191 3.82
Food quality 188 3.76
Packaging 190 3.8
Responsiveness 179 3.58
Delivery speed 195 3.9
(Source: Primary data)
Figure 4.16. Overall satisfaction of respondents
Interpretation: Table 4.16 shows the satisfaction comparison of various factors of
Zomato. From the table it is clear that average of satisfaction on delivery speed is
3.9, it is higher than all the other factors. Therefore, respondents are having more
satisfaction on the delivery speed of Zomato.
3.4
3.5
3.6
3.7
3.8
3.9
4

36
Table 4.17 showing whether respondents have felt any trouble in
dealing with Zomato
Particulars Frequency Percentage
Yes 21 42
No 29 58
Total 50 100
(Source: Primary data)
Figure 4.17. showing whether respondents have felt any trouble in
dealing with Zomato.
Interpretation: From the above figure it is found that 42% of the total
respondents have felt problems in dealing with Zomato , 58% respondents is of the
view that they have not felt any trouble in dealing with Zomato.
0
10
20
30
40
50
60
70
Yes No

37
Table 4.18 showing whether the respondents will recommend Zomato’s
services to others.
Particulars Frequency Percentage
Yes 40 80
No 10 20
Total 50 100
(Source: Primary data)
Figure4.18 showing whether the respondents will recommend Zomato’s
services to others
Interpretation: From the above figure it is found that 80% of the respondents said
that they will recommend Zomato to others and 20% respondents will not
recommend it to others.
Yes
No

CHAPTER – 5
FINDINGS , SUGGESTIONS
AND CONCLUSIONS

38
5.1. Findings
Following are the findings that we obtained from the study
54% of respondents are aged between 21-22.
50% of the respondents are male and 50% of them are female.
86% of respondents are degree students.
Majority of the respondents i.e. 74% order food online on monthly basis.
72% respondents got to know about Zomato from online advertisements.
40% of respondents have been using Zomato for a period of less than 1
year.
50% of the respondents use Zomato considering its special offer.
When compared with services offered by other companies 34% of
respondents feel that Zomato is better than other applications.
More than half of the respondents i.e. 62% says that it is easy to navigate
through website.
Average expectation on price is 2.56 and average satisfaction on price is
3.68, respondents are satisfied with the price of product.
Satisfaction level of respondents towards application i.e. 3.82 of Zomato is
more than their expectations on application i.e. 2.8 before using it.
The average expectation on food quality is 2.92 and average satisfaction is
3.76 therefore the satisfaction of respondents on food quality is higher than
their expectation.
The satisfaction level of respondents on packaging of food i.e. 3.8 provided
by Zomato is higher than the expectation i.e. 3.02 they had before using it.
Average expectation on responsiveness of Zomato is 2.72 and average
satisfaction is 3.58, the satisfaction on responsiveness is more than
expectations.

39
The respondents are satisfied on delivery speed of Zomato. Average
expectation of respondents about delivery speed of Zomato is 2.82 and
average satisfaction is 3.9, the satisfaction is higher than expectations.
While considering the overall satisfaction of respondents, average
satisfaction on delivery speed of Zomato is higher which is 3.9.
It is found that 42% of respondents have faced trouble in dealing with
Zomato and 58% of respondents have not faced any problem.
Most of the respondents i.e. 80% will recommend Zomato’s services to
others.
5.2. Suggestions
Company should try to reach to people of other age groups.
Company should take necessary steps to stimulate customers in
repurchasing on a frequent basis.
Zomato should focus more on other promotional activities such as
television advertisements.
The company should focus on giving better quality product as most
customers were very brand loyal and were generally satisfied with
the product.
The company should try to be competitive than other companies and
try to establish a strong position in the market.

40
5.3. Conclusions
Applications for the food supply have now become a major sensation in
India. Numerous food delivery applications in India can be downloaded from the
ease of homes on smart phones to order food on the go. The study helped in
identifying the factors which influenced the customers for choosing Zomato. On
analyzing the customer satisfaction on Zomato, it can be concluded that the
company has to focus on building positive image regarding the product on
customer’s mind. Customer’s expectation about Zomato was surpassed and most
of the customers are satisfied in every means. The customers who had several
expectations before using Zomato had more satisfaction after making purchases.
Comparing with other variables customers are more satisfied on the delivery speed
of Zomato. The company should focus on providing food items in considerable
quality and quantity , it should also focus in undertaking more promotional
activities through more mediums finally, we can conclude than customers among
the commerce students of Christ College Irinjalakuda are satisfied with Zomato.

Bibliography
Journals
Sheryl E. Kimes Ph.D. (2011), “Customer Perceptions of Electronic Food
Ordering” , Cornell Hospitality Report, 11(10), pp. 6-15.
Varsha Chavan, Priya Jadhav , Snehal Korade and Priyanka Teli (2015),
“Implementing Customizable Online Food Ordering System using web
based application @ , International Journal of [6] “Pizza Hut Tells Twitter
It Made The First Online Sale In 1994” – Huffingtonpost.com
Serhat Murat Alagoz, Haluk Hekimoglu, A study on Tam: Analysis of
Customer Attitudes in Online Food Ordering System, Procedia – Social
and Behavioral Sciences, Volume 62, 2012, Pages 1138-1143, IISN 1877-
0428
Leong Wai Hong (2016), “Food Ordering System Using Mobile Phone”, A
report submitted to BIS (Hons) Information Systems Engineering. Faculty
of Information and Communication Technology (Perak Campus), UTAR.
Jyotishman Das (2018), Consumer Perception Towards „Online Food
Ordering and Delivery Services‟: An Empirical Study, Journal of
Management, 5(5), 2018, pp. 155–163.
N. Sumathy and S. Josephin, “A Study On Prospect Concernment Towards
Food Adjure App”, International Journal of Advance Research and
Innovative Ideas in Education, Vol. 3, No. 2, pp. 4905-4910, 2017
Hong Lan, Li Yanan and Wang Shuhua, “Improvement of Online Food
Delivery Service Based on Consumers Negative Comments”, Canadian
Social Science, Vol. 12, No. 5, pp. 84-88, 2016.

Bagla, Ramesh & Khan, Jasmine. (2017). Customers' Expectations and
Satisfaction with Online Food Ordering Portals. Prabandhan: Indian
Journal of Management. 10. 31. 10.17010/pijom/2017/v10i11/119401.
Kumaran .M. “Perception towards online shopping an Empirical study with
respect to Indian buyers.”www.abhinavjournal.com Vol 1 Issue no:9.
Websites
https://www.zomato.com
https://en.wikipedia.org/wiki/customer
https://asq.org>quality-resources
https://www.hubspot.com

Annexure
Questionnaire
1. Age
o 17-18
o 19-20
o 21-22
o 23-24
o 25-26
2. Gender
o Male
o Female
3. Education
o Degree
o P.G
4. How often you order food online?
o Daily
o Weekly
o Monthly
5. From where you got to know about Zomato?
o Television
o Friends
o Online Advertisements
o News paper Advertisements
o Family
6. How long have you been using Zomato?
o Less than one year
o 1-2 years
o 2-3 years
o More than 3 years

7. What are the reasons for choosing Zomato?
o Price
o Quality
o Special offers
o Quantity
o Delivery speed
o Variety of foods
8. How would you compare the services offered by Zomato with other companies?
o Much better
o Somewhat better
o About the same
o Somewhat worse
o Much worse
9. How easy is to navigate the website www. Zomato.com ?
o Extremely easy
o Somewhat easy
o Not so easy
o Not easy at all
10. Expectations about Zomato before using it
Excellent Very good Good Fair Poor
Price
Application
Food Quality
Packaging
Responsiveness
r
o
j
e
c
t
q
u
r
o
j
e
c
t
q
u
r
o
j
e
c
t
q
u
r
o
j
e
c
t
q
u
r
o
j
e
c
t
q
r
o
j
e
c
t
q
r
o
j
e
c
t
q
r
o
j
e
c
t
q
r
r
o
j
e
c
t
q
r
o
j
e
c
t
r
o
j
e
c
t
r
o
j
e
c
t
r
r
r
r
r

Delivery speed
11 . Satisfaction on Zomato after using it.
Strongly Satisfied Neutral Dissatisfied Very
Satisfied dissatisfied
Price
Application
Food quality
Packaging
Responsiveness
Delivery speed
12 . Have you faced any problem in dealing with Zomato ?
o Yes
o No

13 . Will you recommend Zomato’s services to others?
o Yes
o No
Copyright © 2022 FDOKUMEN