A study on Customer Satisfaction regarding sales & services ...
75
“A PROJECT REPORT ON CUSTOMER SATISFACTION REGARDING SLAES AND SERVICE OF YAMAHA MOTORS WITH REFERENCE TO AMK MOTORS” SUBMITTED IN PARTIAL FULFILLMENT OF THE DEGREE OF MASTER OF BUSINESS ADMINISTRATION By SHARUN GEORGE ABRAHAM Reg. no :( 1NZ14MBA56) Under the guidance of INTERNAL GUIDE EXTERNAL GUIDE Mr. RAMESH KUMAR N Mr. AJAY K Asst. Professor Director (marketing) New Horizon College of Engineering AMK Motors Pvt. Ltd. Outer Ring Road, Marathahalli, P.S Tower Bangalore-560 103 M.C Road, Enathu Ph.no: +91-9946431620 NEW HORIZON COLLEGE OF ENGINEERING MARATHAHALLI BANGALORE -560103 BATCH: 2014-16
-
Upload
khangminh22 -
Category
Documents
-
view
3 -
download
0
Transcript of A study on Customer Satisfaction regarding sales & services ...

“A PROJECT REPORT ON CUSTOMER SATISFACTION REGARDING SLAES
AND SERVICE OF YAMAHA MOTORS WITH REFERENCE TO AMK MOTORS”
SUBMITTED IN PARTIAL FULFILLMENT OF
THE DEGREE OF
MASTER OF BUSINESS ADMINISTRATION
By
SHARUN GEORGE ABRAHAM
Reg. no :( 1NZ14MBA56)
Under the guidance of
INTERNAL GUIDE EXTERNAL GUIDE
Mr. RAMESH KUMAR N Mr. AJAY K
Asst. Professor Director (marketing)
New Horizon College of Engineering AMK Motors Pvt. Ltd.
Outer Ring Road, Marathahalli, P.S Tower
Bangalore-560 103 M.C Road, Enathu
Ph.no: +91-9946431620
NEW HORIZON COLLEGE OF ENGINEERING
MARATHAHALLI BANGALORE -560103
BATCH: 2014-16


ACKNOWLEDGEMENT
The writing of this dissertation has been one of the most significant
academic challenges, I have ever had to face. Without the support, patience and
guidance of the following people, this study would not have been completed. It
is to them I owe my deepest gratitude.
First I would like to thank god for his grace and wisdom, which kept me
going, and help me to complete this project successfully.
Secondly I thank the management of New Horizon College of
Engineering, Visvesvaraya Technological University, Belgaum for the
continuous support.
I am grateful to our Principal Dr. Manjunatha for his constant support,
inspiration and suggestion throughout the study. I deem it a great pleasure to
express my esteem gratitude with all respect to Dr. Sheelan Mishra, Head of the
Department, for her interest and kind help in making necessary arrangement to
undertake this study.
Thirdly I would like to express my deep sense of gratitude towards my
guide Mr. Ramesh (Dept. of Management Studies).
I am greatly indebted to Mr. Ajay K (MANAGER), AMK Motors Pvt.
Ltd. who guided me despite his hectic job commitment. His wisdom,
knowledge, and commitment inspired and motivated me to accomplish this
study. Without his initial consideration for me, this project would have been a
failure.
Finally I thank my parents and sister for their continuous encouragement
and valuable support which helped me to accomplish this project.
Sharun George Abraham

TABLE OF CONTENTS
CHAPTER TITLE PAGE NO
1
INTRODUCTION 1
TOPIC CHOSEN FOR STUDY 2
STATEMENT OF PROBLEM 2
NEED FOR THE STUDY 3
OBJECTIVES OF THE STUDY 3
SCOPE OF THE STUDY 3
RESEARCH METHODOLOGY 4
LITERATURE REVIEW 5
LIMITATIONS OF THE STUDY 7
2
INDUSTRY PROFILE 8
COMPANY PROFILE 11
VISION & MISION 13
PRODUCT PROFILE 16
COMPETATOR’S INFORMATION 28
SWOT ANALYSIS 28
3 THEORETICAL BACKGROUND OF THE STUDY 30
4 ANALYSIS AND INTERPRETATION OF DATA 35
5
FINDINGS 53
SUGGESTIONS 55
CONCLUSION 56

LIST OF TABLES
TABLE NO TITLE PAGE NO
4.1 KIND OF TWO-WHEELERS 35
4.2 DUE DATE NOTIFICATION 36
4.3 TIME TAKEN BY STAFF FOR ATTENDING 37
4.4 CLEANLINESS & COMFORT OF RECEPTION 38
4.5 STAFF’S ABILITY TO UNDERSTAND ISSUE 39
4.6 EXPECTATION OF SERVICE BETTERMENT 41
4.7 CONVINENCE IN ALLOTED VEHICLE
DELIVERY TIME 42
4.8 WORKING OF SERVICE STATION ON
SUNDAY 43
4.9 SERVICE/REPAIR CHARGES 44
4.10 AVAILABILITY OF SPARE PARTS 45
4.11 COOPERATIVENESS & POLITENESS OF
STAFF 46
4.12 OVERALL EXPERIENCE 47
4.13 RANK ACCORDING TO SATISFACTION 48
4.14 FEELING ABOUT SERVICE DEPARTMENT 50
4.15 FUTURE VISIT TO SERVICE DEPARTMENT 51
4.16 RECOMENTATION ABOUT SERVICE CENTRE
TO OTHERS 52

LIST OF CHARTS
TABLE NO TITLE PAGE NO
4.1 KIND OF TWO-WHEELERS 35
4.2 DUE DATE NOTIFICATION 36
4.3 TIME TAKEN BY STAFF FOR ATTENDING 37
4.4 CLEANLINESS & COMFORT OF RECEPTION 38
4.5 STAFF’S ABILITY TO UNDERSTAND ISSUE 40
4.6 EXPECTATION OF SERVICE BETTERMENT 41
4.7 CONVINENCE IN ALLOTED VEHICLE
DELIVERY TIME 42
4.8 WORKING OF SERVICE STATION ON
SUNDAY 43
4.9 SERVICE/REPAIR CHARGES 44
4.10 AVAILABILITY OF SPARE PARTS 45
4.11 COOPERATIVENESS & POLITENESS OF
STAFF 46
4.12 OVERALL EXPERIENCE 47
4.13 RANK ACCORDING TO SATISFACTION 49
4.14 FEELING ABOUT SERVICE DEPARTMENT 50
4.15 FUTURE VISIT TO SERVICE DEPARTMENT 51
4.16 RECOMENTATION ABOUT SERVICE
CENTRE TO OTHERS 52

EXECUTIVE SUMMARY
This project work done at AKM Yamaha Motors in order to fulfil the requirement of MBA
from Vishweshariya Technical University. The main objective of the study is to find out the
customer satisfaction regarding sales and services in AMK Motors.
Creating a good relationship with the customers is the big deal of any organisation. The
Yamaha motor is a well known organisation in the two-wheeler manufacturing industry, so
that it is necessary to know about the customer satisfaction about their services and quality of
the product. By considering this aspect, I decided to do my study on this topic. This study
helps the company to obtain relevant data to identify their weaker areas in satisfying the
customers as well as the areas of their strengths and opportunities.
This report contains 5 chapters, 1st chapter as introduction, which includes the need,
objectives and limitations of the study. 2nd
chapter includes the industry and company
profiles, 3rd
chapter contains the theoretical background of the study, 4th includes the analysis
and interpretations and 5th
chapter contains the findings, suggestions and conclusions about
the study.
Area sampling method (probability sampling) is adopted in this study. A required number of
100 respondents were selected as sample size to find out the data. Questionnaire including 18
questions were distributed among them for collection of data. Graphs and tables were used
for analyse and interpretation of collected data.

CHAPTER 1
INTRODUCTION

1
CHAPTER 1
1.1 Introduction Customer satisfaction means a measure of how a product or service provided by a company
meet the expectation level of a customer. Customer is the main person surrounded by which
all the business evolved. The services provided by the provider after the sales of a product
or service are as much important as the sales. Customers give same importance to after sales
service of the products also. A good service after the sales will keep the customer more
loyal towards the company.
This report is a small summary of my 10 week internship conducted as a compulsory part of
the MBA programme. The internship was done within the Yamaha showroom owned by
AMK motors. Since I am interested in automobile industry and especially of bikes, the work
was concentrated on the bikes and the scooters developed by Yamaha in India. This project
includes how Yamaha motors consider its customers and utilize its resources to satisfy and
attract their needs profitably and competitively.
At the initial stage of the internship I formulated a number of goals, which helps to achieve
the objectives:
To analyse whether customers are satisfied with their services.
To understand the overall satisfaction level of the customers.
To identify the customer’s perception about the after sales services.
To understand the main problems faced by the AMK Motors.

2
1.2 Topic Chosen for Study:
To study about the “customer satisfaction regarding sales and services of Yamaha bikes.”
1.3 Statement of Problem:
AMK Motors is one of the upcoming Yamaha two wheeler outlets in Pathanamthitta district.
It was started in the year 2013. They are mainly focused to the customers in and around
Pathanamthitta and neighbour districts. It is a newly start up business and thus it has many
limitations in satisfying the customers, mainly in the section of after sales services of the
bikes.
AMK Motors is a newly started outlet and because that there is less customers for the
company.
So management understood the need to carry out a detailed study about usefulness of after
sales services and how it affects the total performance of sales in organisation. So the
company decided to conduct an effective analysis through the management interns. I was
thankful to get this opportunity as part of MBA program and from the organisation
perspective.
“Customer satisfaction regarding sales and services” is the crucial problem statement
throughout in the project.

3
1.4 Need For The Study:
Consumer is the person whose needs and wants are satisfied for any payment made by them
for that purpose. The payment could be of cash, goodwill, or time however there's some sort
of payment. A person’s level of feeling that they gets when he/she use or consume a
product or service is satisfaction.
In the words of Peter F. Ducker, the intention of business is to build and then maintain a
satisfied consumer. While accepting an offering of a particular organisation, as a result, the
customer will get a positive or a negative feeling about the value of a product that was
accepted, is the customer satisfaction. If the dissatisfied its customers, then not only these
customers stop consuming the products or services, but society will disapprove the business
and sometimes lead it to the level of its loss.
1.5 Objectives of The Study:
To analyse whether customers are satisfied with their services.
To understand the overall satisfaction level of the customers.
To identify the customer’s perception about the after sales services.
To understand the main problems faced by the AMK Motors.
1.6 Scope of The Study:
The study helps us to recognize customer choices and expected needs from the AMK
Motors.
The study helps me to assist AMK Motors to improve their service standards and also as
a student.
The study was limited only to the customers of Yamaha motor vehicle buyers.

4
1.7 Methodology Adopted:
1.7.1 Data collection:
The information or facts is called a data. It includes both numerical figures as well as
descriptive facts. The data collection method consists of two types such as primary type of
data collection and secondary type of data collection.
Primary Data Collection Method
Primary data were directly collected from executives of business and customers. The data
collected from executives was through individual and face to face conversation, and an
ordered questionnaire was prepared to match the objective of the study, including data
relating to sales and services of its products.
The data collected by the researcher for the first is called as primary data. It is collected with
a definite set of objectives to analyse the present level of any study. Primary data is validated
only for a particular period of time.
Methods of primary data collection
Questionnaire method has been used in this study.
Secondary Data Collection Method:
The main purpose of secondary data is to support the primary data. It was collected from
vouchers, annual reports, magazines, books, literature from the organisation and previous
reports, significant etc.
1.7.2 Data collection tool:
Questionnaire:
It is a method by which the pre planned lists of questions were arranged in a series and
printed by the researcher for collecting data.
The questionnaire is considered as the base of the survey. It is distributed among the
respondents and requested to fill it up.

5
1.7.3 Sampling
Sampling design:
A sample design refers to the method or the procedure by which the researcher would
adopted in choosing the items for sampling. It is a plan for getting a sample from a particular
population. Sample design should be selected before the data collection procedure.
Sampling procedure:
The process by which the respondents are chosen is called sampling. Basically, there are 2
types of sampling method are there. They are:
Probability sampling methods.
Non-probability sampling methods.
Area sampling method (probability sampling) is adopted for this study. The numbers of
customers were selected according to the required number of samples and not according to
the area sampling method. A sample size of 100 respondents was selected for this study.
1.8 Literature review:
Customer Satisfaction:
Customer satisfaction is a confusing and conceptual idea and the real sign of the condition of
satisfaction will change from person to person and service/ product and product/ service.
The satisfaction level depends on a number of both physical and psychological factors that
inter-relate with behaviour of satisfaction such as recommended rate and benefits. The other
options that the customers have and the competitive products, which the customers can make
comparison with the organization’s product, will also vary the satisfaction level of the
customer.
Care should take in the attempt of quantitative measurement because satisfaction is basically
a psychological statement. The 10 domains of satisfaction includes: Timeliness, value,
quality, efficiency, value, commitment to the customers, inter-departmental teamwork, and
ease of access, frontline service behaviour, innovation and environment.

6
Mr. Vikas Singhal, Mr. BA Abdul Karim, M Edwin Gnanadhas, M Abdul Haneef,
(2006): In his study of automobile Industry sector he has mentioned that the two-wheeler
segment has recorded significant change in the past 4-5 years. The market for motorcycles is
growing and its sale rose by 27 percent annually during the last four years. He pointed out
that while the market for motorcycles is growing that for mopeds and geared scooters is
shrinking. This change in the taste of the consumers is possibly due to the technological
change. Also most of the manufacturers like Hero Honda, Bajaj and TVS had reduced the
prices of their entry level motorcycles in order to capture a bigger share of the market.
SR Mohnot (2002), Mr. Subhadip Roy (2006): In his study of two and three wheelers he
out from the standpoint of means of personal transportation. The two-wheeler has become an
expression of the owners' personality. The (customer in making his choice does evaluate the
product in terms of utility, fuel economy, reliability, maintenance, affordability, performance,
good after-sales service at reasonable cost, availability of spare parts at :economical prices,
looks, safety and comfort and ease of riding for driving. Total sales of two- 'wheeler in first
eight months of 200 1-02 had increased to 2.70 million units from 1.33 million units in the
corresponding period of the preceding year.
S. Mukherjee and Siddhartha (2002): The Study reveals that the two-wheelers in India are
used for variety of work such as carrying loads, visiting people outdoor jobs like buying and
selling. In village areas it helps people to go more commonly to nearby towns for their daily
needs. The two-wheeler has turn out to be a important support for rising production and in
turn the profit, besides helping as a personal mode of transportation.
AS Yasso and Rajmani Singh (2001): He also pointed out that a main part of growth in the
two-wheeler industry has emerged from motor cycles, which are considered as reliable, fuel
efficient and its suitability on bumpy roads. As per his study, TVS-Suzuki, Hero: Honda,
Bajaj dominates the two wheeler scene. The study also says that due to stiff competition from
automobile major Bajaj which is a largest producer of scooters the LML is facing
considerably stiff competition. Lutz (1981): In this study a perspective into consumer
behaviour is motivated by a desire to understand the relationship between attitude and
behaviour
(* M. Sathish ** A. Pughazhendi Volume: 1 | Issue: 3 | December 2011)
7
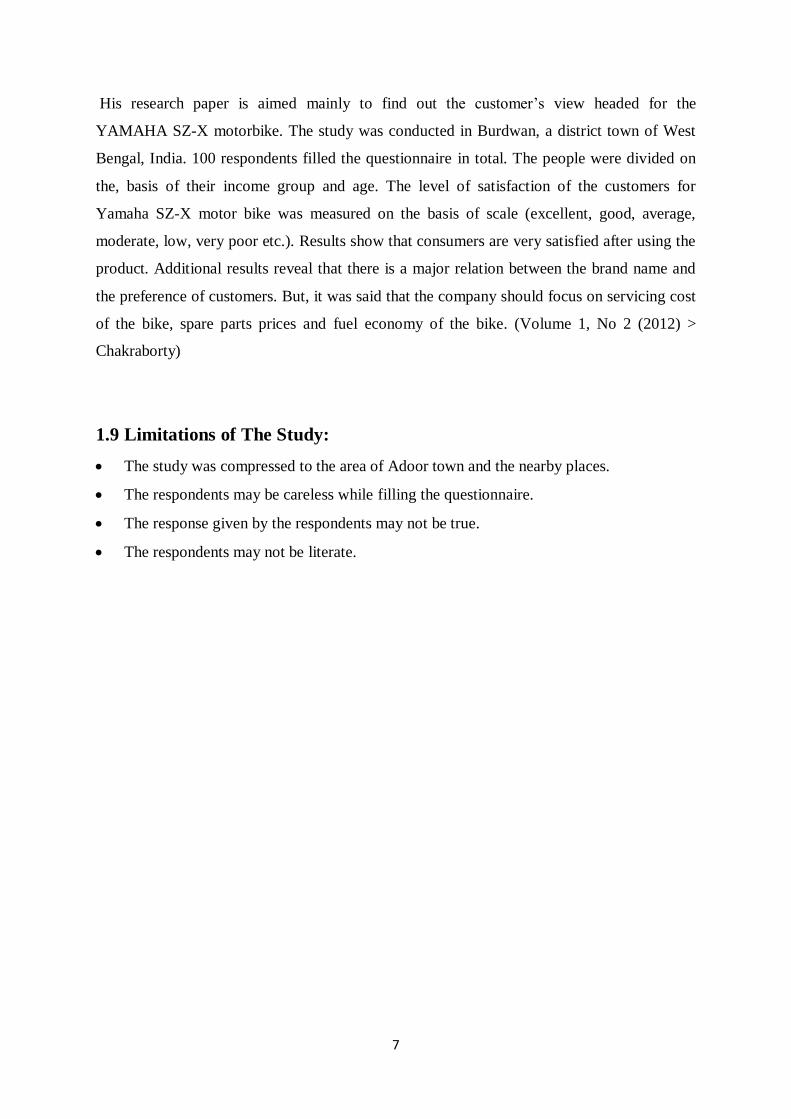
His research paper is aimed mainly to find out the customer’s view headed for the
YAMAHA SZ-X motorbike. The study was conducted in Burdwan, a district town of West
Bengal, India. 100 respondents filled the questionnaire in total. The people were divided on
the, basis of their income group and age. The level of satisfaction of the customers for
Yamaha SZ-X motor bike was measured on the basis of scale (excellent, good, average,
moderate, low, very poor etc.). Results show that consumers are very satisfied after using the
product. Additional results reveal that there is a major relation between the brand name and
the preference of customers. But, it was said that the company should focus on servicing cost
of the bike, spare parts prices and fuel economy of the bike. (Volume 1, No 2 (2012) >
Chakraborty)
1.9 Limitations of The Study:
The study was compressed to the area of Adoor town and the nearby places.
The respondents may be careless while filling the questionnaire.
The response given by the respondents may not be true.
The respondents may not be literate.

CHAPTER 2
INDUSTRY PROFILE
&
COMPANY PROFILE

8
CHAPTER 2
2.1 Industry Profile
2.1.1 History of two-wheeler:
The vehicle industry is one of the leading industries in the world. Since, it is a major profits
and employment generating segment, it grown up to some of the superpower sector in the
world. The automobile sector in India has matured by leap and grows since the beginning of
the era of liberalization. The automobile industry, especially the two-wheeler segment has
grown in a faster rate.
The liberalization has stopped ancient and high-priced practices of licensing and controlled
foreign investment have been done in country. As a result the foreign players entered into the
Indian market. At 50’s, the Enfield and Automobile products in India (API) were largely
dominated the two-wheeler segment. Afterword, from the end of the 50’s Bajaj Auto started
importing Vespa scooters from Piaggio, an Italian company. Since that year the automobile
sector were largely conquered by scooters of API and later on Bajaj conquered the market.
Only few choices of products were available in motorcycle sectors also. So that the
companies like Enfield and Rajdoot placed their domination in the motorcycle sector in
Indian market.
At the beginning of 80’s, Japan companies entered into the market of India. It leads to the tie
up of Indian brands with the Japan companies. Companies like TVS, Suzuki and Hero Honda
are some companies formed in this period of market alteration. But then also the scooter
segment like Bajaj and LML were the leaders in Indian market produces their products at an
instance. Scooters were preferred more because it was considered more as utility friendly and
family vehicle than motorcycles.
The Japan companies combined with Indian companies to manufacture the already existing
products and also they introduced latest technologies. They produced 100cc bikes which were
extremely fuel efficient and with 4 stroke engine for introducing in Indian market. This
comes to a great success in the market because it was affordable for the common people who
do not have sufficient money to buy a car. These bikes are comparatively low in price also.
This segment of bikes wins to conquer the mind of the middle class people and thus it starts
to increase the sales in Indian market. Hero Honda is the company which got the most
9
advantage and it leads them to conquer the two-wheeler market and becoming the largest
producer of two wheelers in the world. The 90’s was the era of liberalization and reduction of
restrictive measures. The government came to support the production and all the foreign
direct investment regulations and licensing was abolished. 100% FDI was allowed in the
automobile industry and the excise obligation was also significantly reduced to its current
level of 12% on two wheelers. All these factors pooled with the increasing fuel prices, the
rising dispensable income of households, easy access to finance, etc. have led two wheeler
industries becoming the backbone of the automobile industry in India.
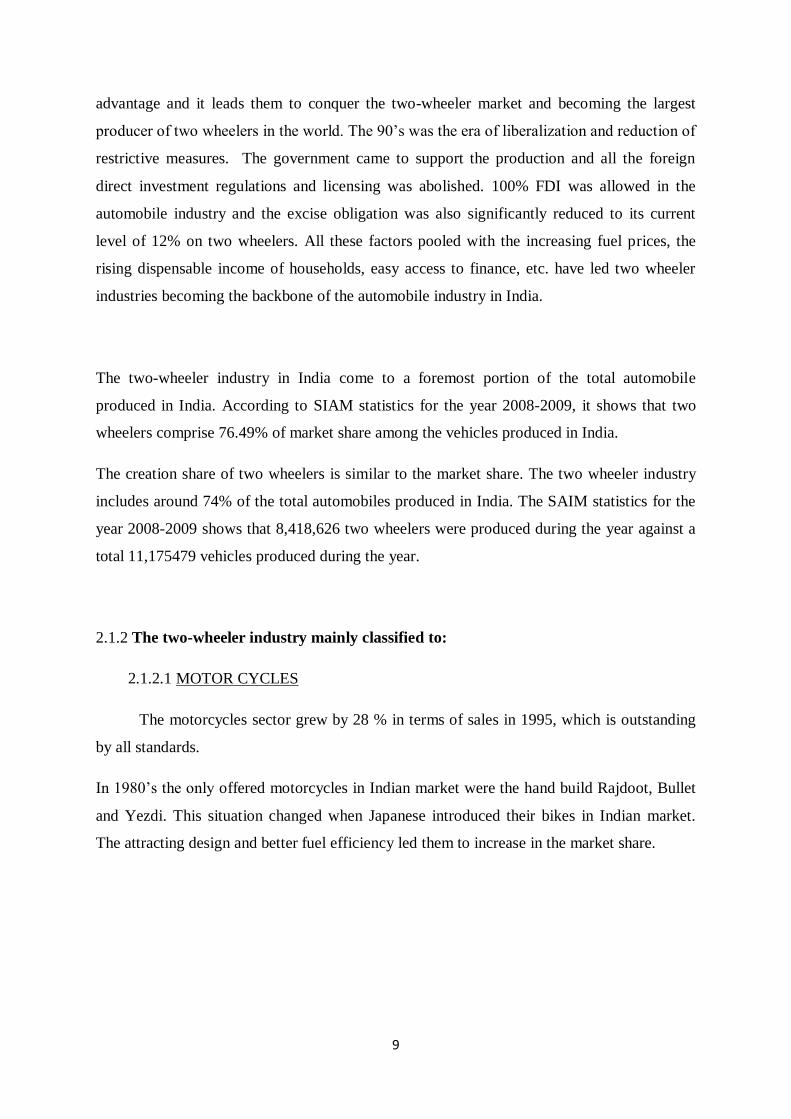
The two-wheeler industry in India come to a foremost portion of the total automobile
produced in India. According to SIAM statistics for the year 2008-2009, it shows that two
wheelers comprise 76.49% of market share among the vehicles produced in India.
The creation share of two wheelers is similar to the market share. The two wheeler industry
includes around 74% of the total automobiles produced in India. The SAIM statistics for the
year 2008-2009 shows that 8,418,626 two wheelers were produced during the year against a
total 11,175479 vehicles produced during the year.
2.1.2 The two-wheeler industry mainly classified to:
2.1.2.1 MOTOR CYCLES
The motorcycles sector grew by 28 % in terms of sales in 1995, which is outstanding
by all standards.
In 1980’s the only offered motorcycles in Indian market were the hand build Rajdoot, Bullet
and Yezdi. This situation changed when Japanese introduced their bikes in Indian market.
The attracting design and better fuel efficiency led them to increase in the market share.

10
2.1.2.2 SCOOTERS
In 1994-95 the scooter section grown up for 46-80 percent of two-wheeler industries
crossed the 1 million score. As such the scooter segment has grown by 34-37 percent, which
is one of the section successes of industry.
The most important contribution to the scooter segment is Bajaj Auto with production of
12.72 lakh scooters per annum. The other companies which included in producing scooter are
LML, with a production of 20,000 scooters per annum and Kinetic Honda.
2.1.2.3 MOPEDS
In a new model of two-wheeler was introduced into the Indian market, which is popularly
known as Mopeds. The sector was conquered by Luna, which become nearly a common
name for mopeds and come up to be targeted for lower middle class people of the country
because it was the cheapest existing two-wheeler with highest fuel efficiency offered.
Mopeds are for this smallest portion in the business.
However, with compared to motorcycles and scooters, it is a less grown up segment. Mopeds
are quiet popular in first half of the 1980’s. After that the scooters showed a extraordinary
growth of 65 percent during 1980-85. During 1994 mopeds shows a growth of just 13
percent. Kinetic engineering is one of the leading products of mopeds in India.
A major part of growth on the two wheeler industry has come from Motorcycles, mainly the
Indo-Japanese 100 cc motorcycles which are considered as fuel efficient, appropriate and
effective for rough roads. Scooters are also increasing at a fast stage and are being
increasingly considered as a better choice providing convenience and new style, by urban
customers. In this category, TVS scooty holds a dominant market share. TVS sooty launched
in 1994, with its stylish looks and has definitely spurred the growth of this segment. The two-
wheeler industry has come a long way from a diffident production of 150 units in 1950 to
three million units per year in 1998.
11
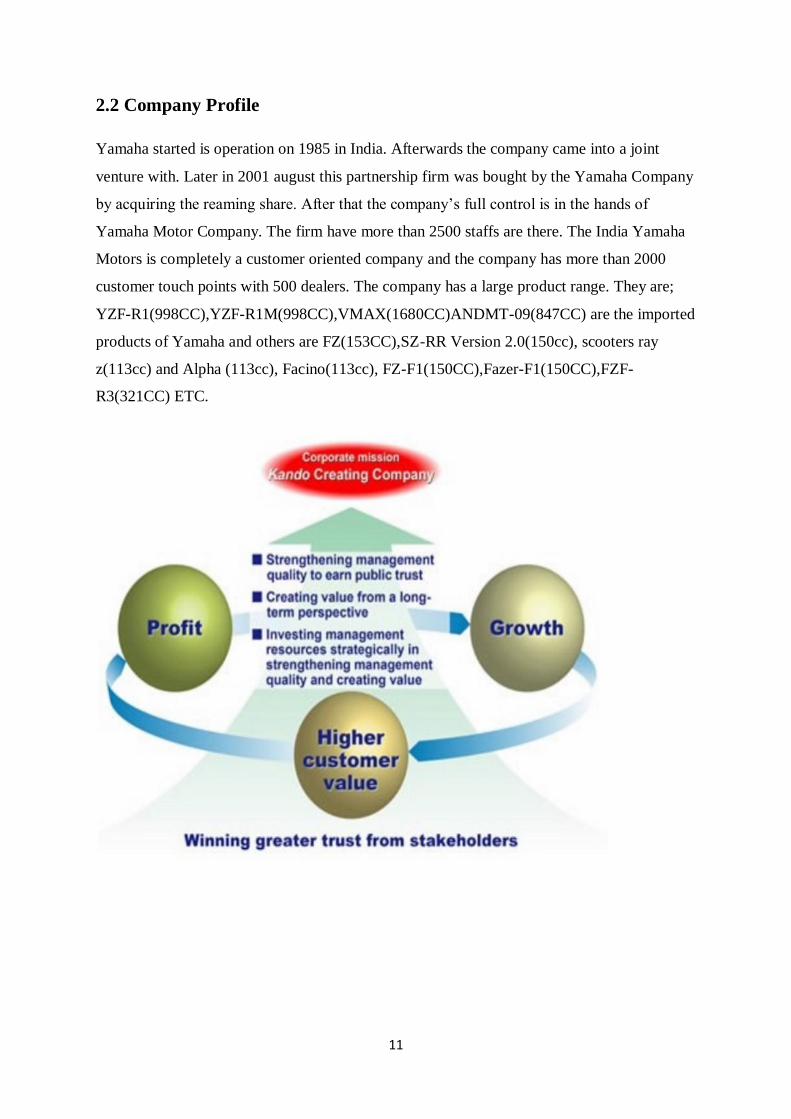
2.2 Company Profile
Yamaha started is operation on 1985 in India. Afterwards the company came into a joint
venture with. Later in 2001 august this partnership firm was bought by the Yamaha Company
by acquiring the reaming share. After that the company’s full control is in the hands of
Yamaha Motor Company. The firm have more than 2500 staffs are there. The India Yamaha
Motors is completely a customer oriented company and the company has more than 2000
customer touch points with 500 dealers. The company has a large product range. They are;
YZF-R1(998CC),YZF-R1M(998CC),VMAX(1680CC)ANDMT-09(847CC) are the imported
products of Yamaha and others are FZ(153CC),SZ-RR Version 2.0(150cc), scooters ray
z(113cc) and Alpha (113cc), Facino(113cc), FZ-F1(150CC),Fazer-F1(150CC),FZF-
R3(321CC) ETC.

12
There are many other Yamaha Motor Group are there in India. They include;
1 Yamaha Motor India Pvt. Ltd. [ YMI ]
YMI Pvt. Ltd is a one of the main subsidiary of Yamaha Motor Company. YMI is working as
a corporate control body of India and regional head office for YMC. YMI is accountable for
quality and compliance Guarantee, business planning and corporate planning of Indian
Yamaha business.
2 Yamaha Motor India Sale Pvt. Ltd. [ YMIS]
YMIS Company is 100% supplementary business for the Yamaha Motor Company. This is
established by YMC. YMIS is organized by YMC for the sales and marketing services to
IYM. IYM is headquartered in Chennai. IYM is supported by YMIS to sell and market the
motor cycle and scooters in India and also outside India.
3 Yamaha Motor Research & Development India Pvt. Ltd. [ YMRI ]
YMRI is also started by YMC. It is a fully contributory of YMC. YMC started YMRI to get
good R&D method and product development service to IYM. YMRI is headquartered in UP.
YMRI is the one of the very important way to reach in developing new products for Indian
Yamaha Motors. It helps in improving the sales in India and Export markets.
IMPORTANCE OF YAMAHA COMPANY
Yamaha is a well-known for the quality, trustworthy and exclusive Brand. They are
completely focusing to the customers interest based on this the company is manufacturing the
Yamaha products. They have good relationship between the customers by giving pioneering
technology, well performance and practical design. Competition level is high in this sector
but Yamaha Company is one of the major competitors for all other two wheelers company.
Another important feature of Yamaha Company is that, they are treating their employees as
one of the big asset. Because of this the company have a brilliant team to get success of the
company. The company is trying to make their employees in international level. To make
them international they are giving good training and education to the employees. Yamaha
company playing an important role to reduce the environment hazards and also they are
following valuable ethics and also they have a major role in protecting environment.

13
The Yamaha company development is only because of the customer interest because of the
company’s innovative ideas and the quality to understand what actually the customer need.
Based on the customer need they developed their products. Company is maintaining good
relation with their owners and towards partners.
2.4 Vision & Mission
VISION
The company want to satisfy the customer need and wants without fail. They should always
want to maintain a close relation with the customer. They also want to maintain good brand
image. Yamaha Company should always be a good competitor to the other bikes
manufacturing companies. The sales delivery persons always be a passion to the customers.
MISSION
Yamaha is dedicated to:
Be the elite and reliable brand known for its engineering, manufacturing and marketing of it
product. The Yamaha is not only concentrated on selling it product but it’s also aiming to
create an everlasting relationship with their clients. This is done through increasing
performance, excellence, practical policy and pioneering expertise. They provide their
customer with value addition vehicles and services. They are very keen in satisfying changing
need of their customers.
Form the Winning Group through competences for achieving success. They say that their
staffs vital and the supreme asset of their organisation. So they have provided the chance of
development in their career and providing them with training and development skills with
international standards and professionalism. Yamaha code of conduct take care of both social
and ethical factors related to the business. They also very responsible about the environment
they are working.
Their motto is to growing through innovation and providing value added service to their
customers and earning loyalty of the stakeholders.

14
CORE COMPETENCIES
Customer 1st
Their first preference is customer for whatever they do. Their decision making is done
keeping customers attention.
Challenging Spirit
They make every effort for providing best quality in everything they produce do and in the
value of goods & services they provide. They work stiff to attain whatever they promise
&accomplish results faster than that of other rivals in the market and they never give-up the
hope.
Frank & Fair Organization
They are sincere, authentic, open minded, crystal clear & impartial in their businesses. They
enthusiastically pay attention to others and contribute in healthy & straightforward
consultations to achieve the organization's objectives.
Team-work
They have good coordination between their employees who have from different culture. They
work together with mutual respect and team sprite. Each and every employee are working
with the aim to attain the organisational objective.
MANUFACTURING PROCESS
Indian Yamaha Motor’s production is done in two states; they are Surajpur (Uttar Pradesh)
and Faridabad (Haryana).
Both the plants have the ability to manufacture motorcycles, scooters and the spare parts. The
manufacture products are also exported to other country’s from India. they have internal
capability machining, Joining processes as well as concluding processes of Plating and
Painting till all the parts are get tethered and assembled.
They have strict quality checking guidelines that their all the motorcycle and scooters hast to
clear in order to attain the international standards.

15
They also care for the environment in which they are working. They have adopted eco-
friendly technologies that won’t harm the environment. The Company also Rain water -
Collecting mechanism, effluent handling plant etc. the company has got ISO-14001
certification early this year. . All their endeavours give them motive to trust that sustainable
enhancement for Yamaha. They consider in taking attention of not only the consumer’s
Motoring requirements but also the desires of upcoming generations to arise.
Corporate philosophy
Their business mission of creating Kando
Yamaha motors always work with the motto to build their distinct by the conceptions of
“superior quality and greater-performance” and “light weight and solidity”. It is clear in their
corporate history that the “people” are the basic element and product development and other
actives are done to achieve the customer hearts. Their objective is to deliver product to
empower all the customers by proposing high speed, better movement and superior potential.
What is Kando?
Kando is a Japanese name for the instantaneous feeling of deep fulfilment and strong pleasure
that people experience when they bump into something of incomparable level.

16
2.4 Product Profile:
MOTORCYCLES
Yamaha r15 version 2.0:
Yamaha R15 version 2.0 is the most stylish bike opts by the youngsters.
Specifications:
Cylinder is single
Cubic capacity is 150
It’s a Power stroke vehicle
Its max power is 18ps in 8500 rpm
Maximum generated torque is 14n.m in 7000 rpm
Have 12.5 litres capacity of fuel tank
Outstanding lubrication power
Front and back disk breaks
6-speed return type transmission
Liquid-cooled, SOHC, ,3 –valve
4 – stroke engine

17
R15s:
It is the initial type of bike that introduced in R15 series.
Specifications:
Liquid – cooled, SOHC, 4 – stroke engine
148 cubic capacity of displacement
Max power of 12.2kw at 8499 rpm
Max torque of 15n.m at 7500 rpm
12.5 litres of fuel tank capacity
Fuel injection fuel supply system
6-speed constant mesh transmission type
Wet sump lubrication type
Electric start starting method

18
Fazer-Fi:
Fazer-Fi is the most stylish bike introduced by Yamaha Motors and it has got a wide acceptance from the
customers from all age groups. The sporty look of this bike is the main attraction to the youngsters and
the affordable price of a sports bike is the other attraction to remaining age groups.
Specifications:
SOHC, 2 –valve, air cooled engine type
148.5 cc displacement
Max output of 9.8 kw at 8000 rpm
Max torque of 12.7 n.m at 6000 rpm
Electric starting method
Wet sump, force-feed lubrication type
Fuel injection type of fuel supply
Wet, multi – disc clutch type
Constant mesh 5-speed transmission
Single cylinder layout

19
FZS-Fi:
The naked version of fazer also covered mind blowing attraction from customers especially people aged
below than 30 and the main speciality of this series is the fuel injection (FI) engine. The company’s sales
report shows that a huge sales has done on the black-green version of this bike.
Specifications:
SOHC, 2 –valve, air cooled engine type
148.5 cc displacement
Max power of 9.8kW at 7500 rpm
Max torque of 12.7 N.m at 6500 rpm
Electric starting method
Wet sump, force-feed lubrication type
Fuel injection type of fuel supply
Wet, multi – disc clutch type
Constant mesh 5-speed transmission
Single cylinder layout

20
FZ-Fi:
It is another variant of the FZ series. It also contains a fuel injection (FI) engine technology. The new
technologies like sensor to calculate mileage and delivering of fuel to the engine is a unique feature of this
bike. The reduced weight of this bike helps to produce a smooth passing acceleration.
Specifications:
SOHC, 2 –valve, air cooled engine type
148.5 cc displacement
Max power of 9.8kW at 7500 rpm
Max torque of 12.7 N.m at 6500 rpm
Electric starting method
Wet sump, force-feed lubrication type
Fuel injection type of fuel supply
Wet, multi – disc clutch type
Constant mesh 5-speed transmission
Single cylinder layout

21
FZ:
FZ is the first model in FZ series which is introduced in Indian market. The detailed lines and design in its
body helps it to make huge sales in the Indian market.
Specifications:
SOHC, 2 –valve, air cooled engine type
153.2 cc displacement
Max power of 14PS at 7500 rpm
Max torque of 13.7 N.m at 6000 rpm
Electric and kick starting method
Wet sump lubrication type
Carburettor type of fuel supply
Wet, multi – disc clutch type
Constant mesh 5-speed transmission
Forward-inclined Single cylinder layout

22
SZ-RR Version 2.0:
The new Yamaha SZ RR version 2.0 brings a new dimension to the concept of 'Powerful and Stylish
Commuter'. Powered by Yamaha's unique 'Blue Core' technology ideal, it offers outstanding performance
and 11% more mileage. New colours and graphics add a refreshing dash of style to the city roads. Turn
your everyday commute into an exhilarating experience.
SZ-RR Version 2.0 has been manufactured newly with Yamaha's New Generation Engine Development
Ideal – 'Blue Core' that takes riding enjoyment, fuel efficiency and environmental performance to all-new
levels. Its key features include A new engine that maintains the feeling of power delivery from the original
SZ Series models while greatly improving fuel efficiency (11% improvement vs. 2013 model), Newly
designed tubeless tires, Newly designed instrument panel, an array of other features that make it worthy of
a 149cc class model, like a handlebar holder with the "SZ" logo and shroud fitted to add a more sporty
character.
Specifications:
SOHC, 2 –valve, air cooled engine type
150 cc displacement
Max power of 12.2PS at 7500 rpm
Max torque of 12.9 N.m at 6000 rpm
Electric and kick starting method
Wet sump lubrication type
Carburettor type of fuel supply
Wet, multi – disc clutch type
Constant mesh 5-speed transmission
Single cylinder layout

23
SALUTO Disk Brake:
The saluto were designed as a necessary needed vehicle in the 125cc segment bikes. Its main
focus is for the fuel efficiency and the affordable pricing. Its main target is the customers who
wants a more cc bikes than 100cc bikes with a beautiful styling and who wants a different
model from the existing models in the market.
Specifications:
SOHC, 2 –valve, air cooled engine type
124 cc displacement
Max power of 6.2kW at 7000 rpm
Max torque of 10.1 N.m at 4500 rpm
Electric and kick starting method
Wet sump lubrication type
Carburettor type of fuel supply
Wet, multi – disc clutch type
Constant mesh 4-speed transmission
Forward-inclined Single cylinder layout
24
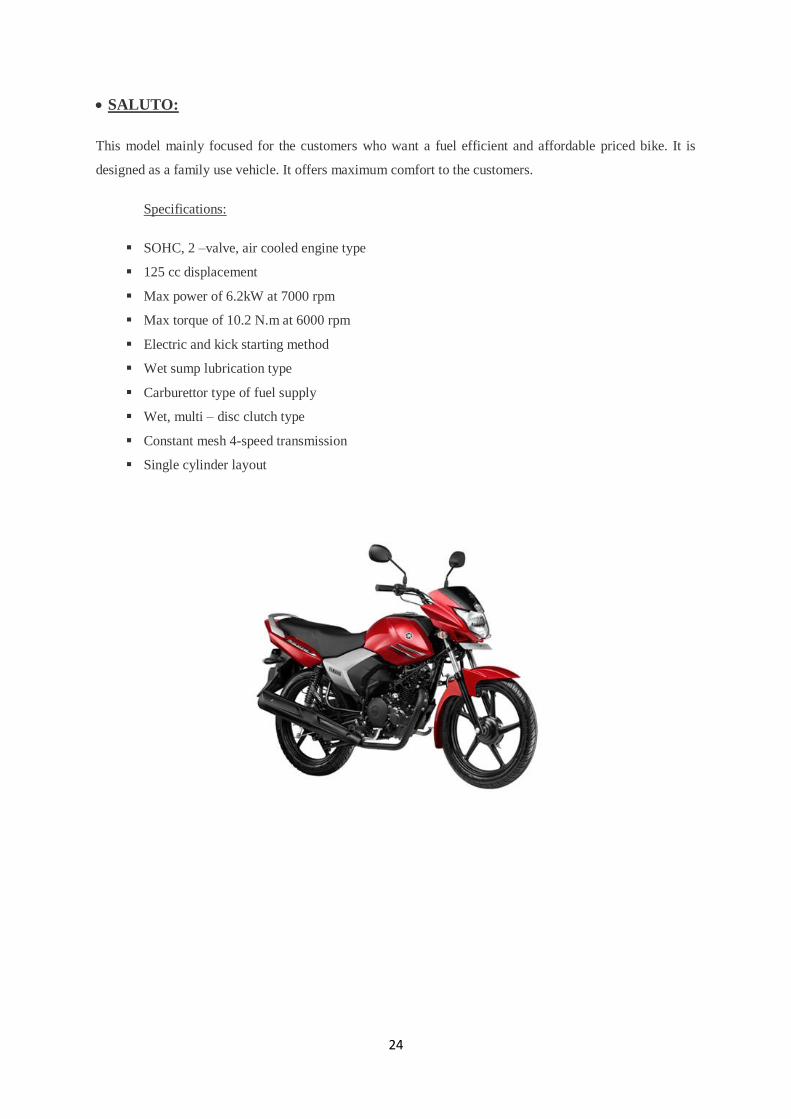
SALUTO:
This model mainly focused for the customers who want a fuel efficient and affordable priced bike. It is
designed as a family use vehicle. It offers maximum comfort to the customers.
Specifications:
SOHC, 2 –valve, air cooled engine type
125 cc displacement
Max power of 6.2kW at 7000 rpm
Max torque of 10.2 N.m at 6000 rpm
Electric and kick starting method
Wet sump lubrication type
Carburettor type of fuel supply
Wet, multi – disc clutch type
Constant mesh 4-speed transmission
Single cylinder layout

25
SCOOTERS
FASCINO:
Fascino is the most preferred scooter by ladies audience. The charming look of his scooter is
the main attraction element noticed by the women. It is very comfortable to move through
heavy traffic and sufficient weight for medium healthy women. Light blue colour is the most
delivered scooter i the previous year.
Specifications:
SOHC, 2 –valve, air cooled engine type
113.2 cc displacement
Max power of 7.1PS at 7500 rpm
Max torque of 8.2 N.m at 5000 rpm
Electric and kick starting method
Wet sump, force-feed lubrication type
Carburettor type of fuel supply
Dry, centrifugal clutch type
Single cylinder layout

26
ALPHA:
Yamaha Alpha is mainly created for the Indian roads. Thie 4-stroke enginr maintain the smoothness of this
vehicle and the reliability of milage upto 55-60 is the other main attraction element of this scooter. Other
features include refined and modern styuling, good storage space, excellent comfort, light weight and
excellent engine performance.
Specifications:
SOHC, 2 –valve, air cooled engine type
113.1 cc displacement
Max power of 5.2kW at 7500 rpm
Max torque of 8.1 N.m at 5000 rpm
Electric and kick starting method
Wet sump, force-feed lubrication type
Carburettor type of fuel supply
Dry, centrifugal clutch type
Single cylinder layout
5.2L fuel tank capacity

27
RAY-Z:
Yamaha RAY-Z is the sportiest looking scooter from Yamaha Motors. They build it aiming mainly for the
youngsters. Its aggressive looks and high performance engine attracts youth to buy this scooter hugely in
the previous year.
Specifications:
SOHC, 2 –valve, air cooled engine type
113.2 cc displacement
Max power of 7.1PS at 7500 rpm
Max torque of 8.2 N.m at 5000 rpm
Electric and kick starting method
Wet sump, force-feed lubrication type
Carburettor type of fuel supply
Dry, centrifugal clutch type
Single cylinder layout
5L fuel tank capacity
V-belt automatic transmission type

28
2.5 COMPETITOR’S INFORMATION:
The main competing brands of Yamaha Motors are as follows:
Bajaj Auto Ltd.
Hero Moto Corp
TVS Motor
Honda Motor Co. Ltd.
Suzuki
Mahindra
KTM
Royal Enfield Motors Ltd.
2.6 SWOT ANALYSIS OF YAMAHA MOTORS:
Strength
Committed and dedicated staff.
Established market channel.
Power, speed and Acceleration.
Size and scale of parent company.
Higher importance on Research and development.
Effective advertising capability.
High market experience.
The brand is already established.
Weaknesses
Weak product diversity.
Not so much importance on forceful marketing.
Small showroom.

29
Opportunities
1st mover advantage.
Increasing dispensable income.
Expansion of target market.
Global expansion into the Caribbean and Central America.
Growing premium segment.
Threats
Raising raw materials costs.
Cut throat competition.
Increasing rates of interest on financing.
Increasing number of players in the market.

CHAPTER 3
THEORITICAL BACKGROUND
OF THE STUDY

30
CHAPTER 3
3.1 Customer:
One who purchases goods and services manufactured by an organisation is known as a
customer. As customer is the one paying for supply and makes demand for the product,
customers are the end goal of an organisation. In order to attract large number of customer
organisation will advertise their products.
3.2 Customer Satisfaction:
Reilly and Westbrook define Customer satisfaction, as emotional reply in accordance with
the experience or associated with a particular goods or services bought from retail outlets.
Hunt in 1977 said customer satisfaction is the method of examination offered that the
experience of using the product was nice.
Wilton and Tse in 1988 expounded definition of Hunt. They said ‘customer satisfaction is a
process of evaluating the response of consumers and the supposed difference between past
anticipations and the real act of the merchandise as supposed after using it’.
Fulfilment response of the customer is called Satisfaction. It is the judgemental of the
customers on the feature or the product itself that it gives a good level of fulfilment.
Importance of customer satisfaction
Customer oriented and implementation is the modern trading theory so it is important to
analyse the customer satisfaction. The baseline for standardise and excellence working of
organisation is the customer satisfaction. Potential market opportunities are also easily
identifiable with its help, said Evangelos and Yannis in 2010.
In 2000 Zairi said ‘Business depend upon the customers more and the purpose of what the
business do anything is for customers. Businesses should not wish that the customers should
go away, they are not the problems, and if we wish like that it will bring a threat.’
The customer satisfaction is not a new. In early 1980’s some analysts said that that customer
satisfaction is the door into loyalty. Direct association with company profitability, share

31
market price and ROI is another theory that has been found. Oliver said that a customer who
has been satisfied will think many times when shifting to another product. As they have
emotionally attracted towards the product.
Measuring customer satisfaction
Measuring customer satisfaction is the important problem faced by organisation these days.
In 19th
century Lord Kelvin said about this as ‘you cannot understand it if you are not able to
measure’. Now days, organisation consider measuring customer satisfaction is crucial for the
business and thus it is increasing in the recent years.
Hill and Wild said, when customer satisfaction is measured employees of the company feels a
sense of accomplishment and achievement thus it motivates them and increase the
productivity.
Yannis and Evangelos said measuring 7 advantages like
1. Current position of the company against competitors can be identified by measuring
customer satisfaction and future plans can be made accordingly.
2. Potential markets can be identified after measuring customer satisfaction.
3. Measuring customer satisfaction helps to know the behaviour of customers and helps
in evaluating the needs, expectations and wants of the customers.
4. Improves the communication
5. Measuring customer satisfaction helps in evaluating the impact of new changes made
in the business.
6. Customer satisfaction evaluation helps to know the weakness and strength of the
organisation against the rivalry companies.
Determinates of customer satisfaction
Consumer loyalty is a standout amongst the most vital issues regarding business associations
of numerous kinds. Business associations attempt to give good support of the client
furthermore search for the reason that can expand the fulfilment level. As per Hokinson these
elements incorporate agreeable representatives, educated workers, and Helpful
representatives, precision of charging, charging auspiciousness, focused estimating,
administration quality, great worth, charging clarity and brisk administration.
Some of the determinants of the customer satisfaction as mentioned by Zeithaml are

32
Product and service features
Consumer loyalty is essentially impacted by the client's assessment of item or administration
highlights. Accordingly, firms likewise think about regarding fulfilment what components
and traits of their administrations client evaluate most and that organization measures the
view of those elements and general administration fulfilment. In such manner, analysis has
found that typically clients make exchange offs of administration such as, value versus
support quality or kind disposition of work force versus customization.
Consumer emotions
Purchaser feelings assumed a noteworthy part with the item or administrations fulfilment. At
the point when a client in an upbeat snippet of life or positive outlook that affected the
administration experience and feel great. On the other hand when clients going through
terrible state of mind or negative sentiments they may over respond or react adversely
towards the administration. It is regularly seen that helpful feelings had a more grounded
impact than bad one. Particular feelings might likewise be impacted by the utilization
experience itself, affecting devours' fulfilment with the administration.
Customer loyalty and retention
Client reliability and maintenance Customer unwaveringness implies staying with a supplier
who treats him well and provides him great quality in the long haul regardless of the
possibility that the provider does not give the good cost in a specific exchange.
Wirtz and Lovelock said client steadfastness is significantly more than rehash buys. They
won’t purchase items regularly, but rather they improve business top line development.
Steadfast client's proposal to their companion, family and associates demonstrate that
business give the best financial estimation of the item or administration. Additionally,
steadfast client in a roundabout way expand the quantity of new client - at no charge to the
company which then again, build company's' development.
Baker-Prewitt and Sivadas said, 'a definitive target of the consumer loyalty estimation ought
to be client devotion. Really fulfilment cultivates unwaveringness to the degree that is
essential for keeping up a great relative state of mind and for prescribing and repeatedly
purchasing from the provider'.

33
'Just consumer loyalty is insufficient in today's trade point of view rather there must be to a
great degree fulfilled client, since it prompts client reliability. Some creator likewise specifies
that crating client steadfastness is not a decision for organisation, but rather it is the main
method for creating manageable upper hand. Despite the fact that there is no positive
standard to make client reliability yet consider demonstrated these taking after angles may
construct that, first focus on key clients, besides creating abnormal state of consumer loyalty
with each 21 cooperation proactively, thirdly-comprehend client needs and request, then react
to them before the opposition does, fourthly-grow closer ties with clients and last create a
quality observation'. Bonsal and Gupta
Price influence on customer satisfaction
Cost is an extremely well known strategy for customer fulfilment. Client will demonstrate
larger amounts of fulfilment when they show sign of improvement arrangement with respect
to a correlation other than they will when they pay more for relative more awful arrangement.
They thought they paid not exactly the distributed cost for that thing if the client is fulfilled.
As indicated by Zeithaml the clients' utilization of cost as a sign to quality relies on upon a
few variables, they are availability of administrations signals to quality, brand names that
offer confirmation of a company's, level of promoting and the dangers connected with the
administration buy.
Generally when the cost is high, client expects higher quality and better administrations.
Then again, when the cost is too low, client might question about the nature of
administrations. Subsequently, when organization utilize any value advancement strategy, for
example, volume rebates, refunds, favoured client markdown, occasion deals or different
endless promoting offers they ought to be extremely watchful about their item picture and
how client react to their item and administrations.

34
3.3 Steps in Assessing Customer Satisfaction:
Categorise your customers. Like, outside consumers, internal consumers
Suppliers-generally you are a client for them however by considering them a client, and
of the data and access they have to meet their agreements with you, you will pick up
profits in your own particular administrations.
Products should be categorised
Should decide on what kind on need will be fulfilled by the product.
Should decide on what makes you different from others?
Create a consumer co-ordination to comprise:
Encouragement should be given to customers to tell the problems faced by them. From
the beginning itself consumers should be able to understand their rights. They should
know how they can take benefit on any such rights.
They should feel control.
They should know that whom they should contact.
Carefully examine how the clients contact and what boundaries they experience: How
does your phone framework work? What is normal hold up times? How often is a guest
allowed before discovering somebody ready to answer the inquiry? Where are you
workplaces found? Is it accurate to say that they are advantageous for clients to discover?
Is stopping accessible?
Languages of customers, how does the area of reception looks like? How long must
people wait?
Are you using technology properly and how well to improve customer experience?
Is there a web site?
Do you distinguish the traffic of the site?
Does it have fax, address, e-mail information and telephone?
Is there search feature?
Does your site language and customer’s match

CHAPTER 4
ANALYSIS
&
INTERPRETATION

35
CHAPTER 4
TABLE NO 4.1: The table showing the kind of two-wheeler respondent has.
Response No: of customers Percentage
Bike 32 32
Scooter 68 68
Moped 0 0
TOTAL 100 100
Source: Primary Data
Analysis: From the above table, out of 100 respondents, 32 people are using bike, 68 people
are using scooter and none of them are using moped.
GRAPH NO 4.1: The graph showing the kind of two-wheeler respondent has.
Interpretation: Among the 100 respondents 68% of the majority are using scooters and 0%
is using mopeds.
bike scooter moped
Respondents 43 57 0
43
57
0
10
20
30
40
50
60

36
TABLE NO 4.2: The table showing the response of service due date notifications.
Response No: of customers Percentage
Yes 73 73
No 27 27
TOTAL 100 100
Source: Primary Data
Analysis: The table shows that 73 people from 100 respondents are getting notification about
the service due date and 27 people are not getting any notification about the service due date.
GRAPH NO 4.2: Graph showing the response of service due date notifications.
Interpretation: According to the survey, 73% of the people are getting notifications or
intimation from AMK Motors. And 27% of the people are not getting any notifications from
AMK Motors about service due date to get their vehicle serviced.
Yes No
Respondents 73 27
73
27
0
10
20
30
40
50
60
70
80

37
TABLE NO 4.3: Table showing the time taken by the staff for attending.
Response No: of customers Percentage
Excellent (less than 2mins) 10 10
Good (2-5mins) 45 47
Average (5-7mins) 19 19
Bad (above 7-10mins) 22 22
Very Bad (Above10mins) 2 2
TOTAL 100 100
Source: Primary Data
Analysis: The above table shows that 10 respondents were get attended within 2 minutes by
the staff, 45 people were attended in between 2-5 minutes, 19 respondents were attended in
between 5-7 minutes and 22 respondents were attended in between 7-10 minutes and 2
respondents were attended above 10 minutes.
GRAPH NO 4.3: Graph showing the time taken by the staff for attending.
Interpretation: From the survey, it shows that 47% of respondents said that 2-5 minutes are
taken by the staff to attend them and 2% of the respondents said that they were attended by
more than 10 minutes.
Excellent (less than 2mins)
Good (2-5mins)
Average (5-7mins)
Bad (7-10mins)
Very Bad
Respondents 10% 47% 19% 22% 2%
10%
47%
19% 22%
2% 0%
5%
10%
15%
20%
25%
30%
35%
40%
45%
50%

38
TABLE NO 4.4: Table showing response about cleanliness and comfort of
reception.
Response No: of customers Percentage
Excellent 37 37
Good 24 24
Average 24 24
Bad 14 14
Very Bad 1 1
TOTAL 100 100
Source: Primary Data
Analysis: The table shows that 37 respondents think the cleanliness and comfort of reception
and waiting area is excellent, 24 them think that the cleanliness and comfort is good, 24 them
think that comfort and cleanliness is average,14 respondents think that the cleanliness and
comfort is Bad and 1 respondent think that the comfort and cleanliness is very bad.
GRAPH NO 4.4: Graph showing response about cleanliness and comfort of
reception.
Interpretation: From the survey, the graph shows that 37% of the respondents said that the
cleanliness and comport of reception and waiting area is excellent and 1% of them said that
the cleanliness and comfort is very bad.
Excellent Good Average Bad Very Bad
Respondents 37 24 24 14 1
37
24 24
14
1 0
5
10
15
20
25
30
35
40

39
TABLE NO 4.5: Table showing the opinion about staff’s ability to understand
vehicle issues.
Response No: of customers Percentage
Excellent 36 36
Good 38 38
Average 13 13
Bad 10 10
Very Bad 3 3
TORAL 100 100
Sources: Primary Data
Analysis: With reference to the above table it shows that 36 customers responded that the
staff’s ability to understand vehicle issues and answering to the queries excellently, 38 said
that the staff’s ability is good, 13 said Average, 10 said bad and 3 respondents said that the
staff’s ability to understand vehicle issues and answering to the queries is very bad.

40
GRAPH NO 4.5: Graph showing the opinion about staff’s ability to understand
vehicle issues.
Interpretation: From the survey, it shows that 38% of respondents said that good
understanding of the vehicle issue and answers all queries appropriately and 3% of the
respondents said that the understanding of the vehicle’s issue and answers to all queries by
the attended person is very bad.
Excellent Good Average Bad Very Bad
Respondents 36 38 13 10 3
36 38
13 10
3 0
5
10
15
20
25
30
35
40

41
TABLE NO 4.6: Table showing the expectation of service betterment.
Response No: of customers Percentage
Improvement in service 46 46
Improvement in settlements
& claim
34 34
Improvement in returns 16 16
Others 4 4
TOTAL 100 100
Source: Primary Data
Analysis: From the above table it shows that 46 respondents want better service from AMK
Motors, 34 of them want betterment in settlements and claims, 16 of them wants better return
and 4 of the respondents want betterment in other features.
GRAPH NO 4.6: Graph showing the expectation of service betterment.
Interpretation: From the survey, the graph shows that 46% of respondents expect
better service from AMK Motors and 4% of people expect other features from AMK
Motors in the future.
Better Services Better settlements
& claim Better Returns Others
Respondents 46 34 16 4
46
34
16
4 0
5
10
15
20
25
30
35
40
45
50

42
TABLE NO 4.7: Table showing the response about convenience in allotted vehicle
delivery time.
Response No: of customers Percentage
Very Satisfied 22 22
Satisfied 54 54
Average 11 11
Dissatisfied 11 11
Highly Dissatisfied 2 2
TOTAL 100 100
Source: Primary Data
Analysis: From the above table it shows that 54 respondents said satisfied about the time
allotted for their vehicle delivery, 22 respondents are very satisfied about the delivery time,
11 respondents said average, 11 respondents said dissatisfied and 2 respondents are highly
dissatisfied about the delivery time allotted for them.
GRAPH NO 4.7: Graph showing the response about convenience in allotted vehicle
delivery time.
Interpretation: From the survey it shows that out of 100 respondents, 54% of the people are
very convenient at the time of vehicle delivered as per the allotted time in AMK Motors and
2% of the people are very dissatisfied about the time of vehicle delivered as per the allotted
time in AMK Motors.
Very Satisfied Satisfied Average Dissatisfied Highly
Dissatisfied
Respondents 22 54 11 11 2
22
54
11 11 2 0
10
20
30
40
50
60

43
TABLE NO 4.8: Table showing the opinion about the working of service station
on Sundays.
Response No: of customers Percentage
Yes 85 85
No 15 15
TOTAL 100 100
Sources: Primary Data
Analysis: The table shows that 85 respondents wants the service centre to be opened for
Sunday also and 15 respondents don’t want the service centre to be opened for Sunday.
GRAPH NO 4.8: Graph showing the opinion about the working of service station
on Sundays.
Interpretation: From the survey of 100 respondents, 85% of the people said that it is helpful
if the service station is kept open on Sundays and 15% of people said no need for working of
service centre on Sundays.
Yes No
Respondents 85 15
85
15 0
10
20
30
40
50
60
70
80
90

44
TABLE NO 4.9: Table showing the response about the service/repair charges.
Response No: of customers Percentage
Very Satisfied 19 19
Satisfied 29 29
Average 41 41
Dissatisfied 10 10
Very Dissatisfied 1 1
TOTAL 100 100
Source: Primary Data
Analysis: The above table shows that 41 respondents out of 100 said that the service/ repair
charges in AMK Motors is average, 29 respondents said satisfied with the charges, 19
respondents said very satisfied, 10 respondents said dissatisfied and 1 respondent said that the
service/repair charges in AMK Motors is very dissatisfied.
GRAPH NO 4.9: Graph showing the response about the service/repair charges.
Interpretation: From the survey, the graph shows that 41% of the respondents said that the
service/repair charges are fair in AMK Motors and 1% of respondents said that the charges is
very dissatisfied in AMK Motors.
Very Satisfied Satisfied Average Dissatisfied Very
Dissatisfied
Respondents 19 29 41 10 1
19
29
41
10
1 0
5
10
15
20
25
30
35
40
45

45
TABLE NO 4.10: Table showing the experience about the availability of spare
parts.
Response No: of customers Percentage
Excellent 20 20
Good 18 18
Average 27 27
Bad 35 35
Very Bad 0 0
TOTAL 100 100
Source: Primary Data
Analysis: With reference to the above table we can say that 35 respondents out of 100 said
bad experience with the availability of spare parts, 27 respondents have an average
experience, 20 respondents said excellent in availability of spare parts and 18 respondents
given good with the availability of the spare parts.
GRAPH NO 4.10: Graph showing the experience about the availability of spare
parts.
Interpretation: the above graph shows that 35% of the respondents are not satisfied with the
availability of spare parts and 18% of respondents said they are satisfied with the availability
of spare parts in AMK Motors.
Excellent Good Average Bad Very Bad
Respondents 20 18 27 35 0
20 18
27 35
0 0
5
10
15
20
25
30
35
40

46
TABLE NO 4.11: Table showing the opinion about cooperativeness,
courteousness, and politeness staff.
Response No: of customers Percentage
Excellent 16 16
Good 46 46
Average 29 29
Bad 9 9
Very Bad 0 0
TOTAL 100 100
Source: Primary Data
Analysis: The above table shows that 46 respondents out of 100 are give good with the
cooperativeness, courteousness, and politeness of the staffs, 29 respondents said average, 16
respondents said excellent and 9 respondents are not satisfied with the staff’s behaviour.
GRAPH NO 4.11: Graph showing the opinion about cooperativeness,
courteousness, and politeness staff.
Interpretation: The graph shows that 46% of the respondents are satisfied and 9% of the
respondents are not satisfied with the cooperativeness, courteousness, and politeness of staffs.
Excellent Good Average Bad Very Bad
Respondents 16 46 29 9 0
16
46
29
9
0 0
5
10
15
20
25
30
35
40
45
50

47
TABLE NO 4.12: Table showing the response about overall experience.
Response No: of customers Percentage
Excellent 23 23
Good 46 46
Average 20 20
Bad 9 9
Very Bad 2 2
TOTAL 100 100
Source: Primary Data
Analysis: With respect to the above table, it shows that 46 out of 100 respondents said
“good” about the overall experience, 23 respondents said excellent, 20 said average, 9 said
poor and 2 said Very bad about the overall experience at AMK Motors.
GRAPH NO 4.12: Graph showing the response about overall experience.
Interpretation: Based on the survey, the above graph shows that 46% of the people feel
good about the overall experience and 2 % of people feel very Bad about overall service
experience at AMK Motors.
Excellent Good Average Bad Very Bad
Respondents 23 46 20 9 2
23
46
20
9
2 0
5
10
15
20
25
30
35
40
45
50

48
TABLE NO 4.13: Table showing the respondents rank according to their
satisfaction.
Response
No: of customers
Rank 1
Rank 2
Rank3
Rank 4
Rank 5
Total
Information in time
11 33 26 23 7 100
Quick issue of re-
imbursement
30 27 29 10 4 100
Claim & settlement
procedure
14 34 30 13 9 100
Good relationship with
customers
19 32 27 12 10 100
Sources: Primary Data
Analysis: From the above table it shows that 11 out of 100 respondents gave rank 1 to
satisfaction at “information in time”, 30 respondents gave rank 1 to satisfact ion at :quick
issue of re-imbursement”, 14 respondents gave rank 1 to “claim & settlement procedure” and
19 respondents gave rank 1 to “good relationship with customers”.

49
GRAPH NO 4.13: Graph showing the respondents rank according to their
satisfaction.
Interpretation: The above graph shows that 33% of the respondents gave rank 1 to
satisfaction in “information in time, 30% of people gave rank 1 to satisfaction in “quick issue
of re-imbursement”, 34% of people ranked 1 to satisfaction in “claim & settlement
procedure” and 32% of the people gave rank 1 to satisfaction in “good relationship with
customers”.
Information in Time Quick issue of re-
imbursement Claim & Settlement
procedure Good relationship
with customers
Rank 1 11 30 14 19
Rank 2 33 27 34 32
Rank 3 26 29 30 27
Rank 4 7 4 9 10
11
30
14
19
33
27
34 32
26
29 30
27
7
4
9 10
0
5
10
15
20
25
30
35
40

50
TABLE NO 4.14: Table showing the feelings of respondents about the service
department of AMK Motors.
Response No: of customers Percentage
Very Satisfied 13 13
Satisfied 38 38
Average 36 36
Dissatisfied 12 12
Highly Dissatisfied 1 1
TOTAL 100 100
Source: Primary Data
Analysis: The above table shows that 38 respondents out of 100 feels satisfied with the
service department of AMK Motors, 36 are average satisfied with the service department, 14
respondents are highly satisfied with the service department and 12 of the respondents are not
satisfied with the service department of AMK Motors.
GRAPH NO 4.14: Graph showing the feelings of respondents about the service
department of AMK Motors.
Interpretation: From the survey, the graph shows that 38% of the respondents are satisfied
with the service department of AMK Motors and 1% of the respondents are highly
dissatisfied with the service department of AMK Motors.
Very Satisfied Satisfied Average Dissatisfied Very
Dissatisfied
Respondents 13 38 36 12 1
13
38 36
12
1 0
5
10
15
20
25
30
35
40

51
TABLE NO 4.15: Table showing the opinion of respondents about the future
visit to the service department.
Response No: of customers Percentage
Yes 92 92
No 8 8
TOTAL 100 100
Source: Primary Data
Analysis: The above table shows that 92 out of 100 respondents said that they will visit to the
service centre in the future and 8 respondents said that they are not interested in visit the
service centre in the future.
GRAPH NO 4.15: Graph showing the opinion of respondents about the future
visit to the service department.
Interpretation: The above graph shows that 92% of the respondents said they will visit the
service department of AMK Motors in the future and 8% of the respondents said that they
will not visit again the service department in the future.
Yes No
Respondents 92 8
92
8 0
10
20
30
40
50
60
70
80
90
100

52
TABLE NO 4.16: Table showing the opinion about the recommendation of
service centre to others.
Response No: of customers Percentage
Yes 87 87
No 13 13
TOTAL 100 100
Source: Primary Data
Analysis: with reference to the above table it shows that 87 respondents said that they will
recommend about this service centre to others and 13 respondents said that they will not
recommend about the service centre of AMK Motors to others.
GRAPH NO 4.16: Graph showing the opinion about the recommendation of
service centre to others.
Interpretation: According to the graph it shows that 87% of the respondents will
recommend this service centre to others and 13% will not recommend this service centre to
others.
Yes No
Respondents 87 13
87
13 0
10
20
30
40
50
60
70
80
90
100

CHAPTER 5
FINDINGS,
SUGGESTIONS
&
CONCLUSION
53
CHAPTER 5
5.1 FINDINGS:
From the study at “AMK Motors” on the customer satisfaction regarding sales and
services, following is the list of findings:
Among the 100 respondents 57% of the majority are using scooters and 0% is
using mopeds.
73% of the people are getting notifications or intimation from AMK Motors.
And 27% of the people are not getting any notifications from AMK Motors about
service due date to get their vehicle serviced.
45% of respondents said that 2-5 minutes are taken by the staff to attend them
and 2% of the respondents said that they were attended after 10 minutes.
37% of the respondents said that the cleanliness and comport of reception and
waiting area is excellent and 1% of them said that the cleanliness and comfort is very
bad.
40% of respondents said that excellent understanding of the vehicle issue and
answers all queries appropriately and 3% of the respondents said that the
understanding of the vehicle’s issue and answers to all queries by the attended person
is very bad.
46% of respondents expect better service from AMK Motors and 4% of people
expect other features from AMK Motors in the future.
54% of the people are very satisfied at the time of vehicle delivered as per the
allotted time in AMK Motors and 2% of the people are highly dissatisfied about the
time of vehicle delivered as per the allotted time in AMK Motors.
85% of the people said that it is helpful if the service station is kept open on
Sundays and 15% of people said no need for working of service centre on Sundays.
41% of the respondents said that the service/repair charges are average in
AMK Motors and 1% of respondents said that the charges are very dissatisfied in
AMK Motors.
35% of the respondents are not satisfied with the availability of spare parts and
18% of respondents said they are satisfied with the availability of spare parts in AMK
Motors.

54
46% of the respondents are satisfied and 9% of the respondents are not
satisfied with the cooperativeness, courteousness, and politeness of staffs.
46% of the people feel good about the overall experience and 2 % of people
feel very bad about overall service experience at AMK Motors.
33% of the respondents gave rank 1 to satisfaction in “information in time,
30% of people gave rank 1 to satisfaction in “quick issue of re-imbursement”, 34% of
people ranked 1 to satisfaction in “claim & settlement procedure” and 32% of the
people gave rank 1 to satisfaction in “good relationship with customers”.
38% of the respondents are satisfied with the service department of AMK
Motors and 1% of the respondents are very dissatisfied with the service department of
AMK Motors.
92% of the respondents said they will visit the service department of AMK
Motors in the future and 8% of the respondents said that they will not visit again the
service department in the future.
87% of the respondents will recommend this service centre to others and 13%
will not recommend this service centre to others.

55
5.2 SUGGESTIONS:
From the overall findings, the following are the suggestions:
Management have to be strict on confirming that the customers are attended
on time.
To make sure that all its customers are satisfied, management has to interface
regularly.
The questions and problems of all the customers should be considered
seriously and has to answer them accurately.
Since, this is the only dealer of Yamaha in the town, the roles and
responsibilities are on AMK Motors to maintain the brand.
Equal importance must be given to both sales and services.
In order to meet customer expectation on time, management has to make sure
that they recruited enough employees in their service department.
Through providing proper services to the customer the business can able to
acquire more customers.

56
5.3 CONCLUSION:
From the study on the topic “customer satisfaction regarding sales and services” in AMK
Motors, I came to the conclusion that AMK Motors has the prime position in Adoor city so
they got a chance for betterment in satisfying their customers.
I believe that management also has a prime role in here by ensuring that all the customers are
treated without any partiality in providing sales and services.
If AMK Motors are successful in implementing the above things, it is sure that they can
achieve the maximum satisfaction from customer and it makes the maximum results.

BIBLIOGRAPHY
1. Anderson, E.E., Fornell, C. and Lehmann, D.R. (1994) Customer Satisfaction, Market
Share and Profitability: Findings from Sweden, Journal of Marketing, 58(3), 53–66.
2. Abdul-Muhmin, A. G. (2005) Instrumental and Interpersonal determinants of relationship
3. Satisfaction and Commitment in Industrial Markets, Journal of Business Research, 58,
619 – 628.
4. Anderson, Eugene W., and Claes Fornell. (1993). "A Customer Satisfaction Research
Prospectus.” In Richard Oliver and Roland Rust (eds.), Frontiers in Services Marketing.
Newbury Park, CA: Sage.
5. Berry, L. L., and Lampo, S. S. (2004). Branding labor-intensive services. Business
Strategy Review, 15(1), 18-25.
WEBLIOGRAPHY
1. www.slideshare.net
2. www.yamaha-motors-india.com
3. www.academia.edu
4. www.business.mapsofindia.com

ANNEXURE
Name of the respondent: ......................................................................................................
Age of the respondent: .........................................................................................................
Sex: Male female
1. What kind of two-wheeler do you have?
Bike Scooter Moped
2. Did you receive any notification through calls or SMS for the service due
date?
Yes No
3. How much time it take by someone from the staff to attend while you entered?
Excellent (2mins) Good (2-5mins)
Average (5-7mins) Bad (above 7-10mins)
Very Bad (above 10mins)
4. How do you rate comfort and cleanliness of customer waiting area and
reception?
Excellent Good
Average Bad
Very Bad
5. How do you rate the person who attended for the service with his
understanding and answering of your queries?
Excellent Good
Average Bad
Very Bad

6. What type of service improvement do you expected from AMK Motors in
future?
Improvement in Service
Improvement in Settlements & Claims
Improvement in Return
Others (specify) .............................................
7. How satisfied are you with the service delivery time allotted by the
showroom?
Very Satisfied Satisfied
Average Dissatisfied
Highly Dissatisfied
8. Are you convenient if service station is working on Sundays?
Yes No
9. Are you satisfied with the repair charges/service charges of AMK Motors?
Very Satisfied Satisfied
Average Dissatisfied
Highly Dissatisfied
10. How do you rate the availability of spare parts in AMK Motors?
Excellent Good
Average Bad
Very Bad

11. What is your opinion about the courteous, politeness and co-operative of the
staffs?
Excellent Good
Average Bad
Very Bad
12. How do you rate your overall experience in services of AMK Motors?
Excellent Good
Average Bad
Very Bad
13. With references to your satisfaction how do you rank the services given
below?
Information in time
Quick issue of re-imbursement
Claim & settlement procedure
Good relationship with customers
14. How do you rate the service department of AMK Motors?
Very Satisfied Satisfied
Average Dissatisfied
Highly Dissatisfied
15. Will you visit this service centre again based on your overall experience?
Yes No
16. Would you recommend about this service centre to your friends and relatives?
Yes No

17. Give your valuable suggestions if any.
_____________________________________________________________________
_____________________________________________________________________