The Effect of service quality on customer satisfaction among ...
97
Strathmore University SU+ @ Strathmore University Library Electronic Theses and Dissertations 2020 The Effect of service quality on customer satisfaction among hotels in Nairobi County, Kenya Joy M. Mutinda Strathmore Business School (SBS) Strathmore University Follow this and additional works at https://su-plus.strathmore.edu/handle/11071/10183 Recommended Citation Mutinda, J. M. (2020). The Effect of service quality on customer satisfaction among hotels in Nairobi County, Kenya [Thesis, Strathmore University]. https://su- plus.strathmore.edu/handle/11071/10183 This Thesis - Open Access is brought to you for free and open access by DSpace @Strathmore University. It has been accepted for inclusion in Electronic Theses and Dissertations by an authorized administrator of DSpace @Strathmore University. For more information, please contact [email protected]
-
Upload
khangminh22 -
Category
Documents
-
view
1 -
download
0
Transcript of The Effect of service quality on customer satisfaction among ...
Strathmore University
SU+ @ Strathmore University Library
Electronic Theses and Dissertations
2020
The Effect of service quality on customer
satisfaction among hotels in Nairobi County, Kenya
Joy M. Mutinda Strathmore Business School (SBS) Strathmore University
Follow this and additional works at https://su-plus.strathmore.edu/handle/11071/10183 Recommended Citation
Mutinda, J. M. (2020). The Effect of service quality on customer satisfaction among hotels in
Nairobi County, Kenya [Thesis, Strathmore University]. https://su-
plus.strathmore.edu/handle/11071/10183
This Thesis - Open Access is brought to you for free and open access by DSpace @Strathmore University. It has been accepted for
inclusion in Electronic Theses and Dissertations by an authorized administrator of DSpace @Strathmore University. For more
information, please contact [email protected]

THE EFFECT OF SERVICE QUALITY ON CUSTOMER SATISFACTION
AMONG HOTELS IN NAIROBI COUNTY, KENYA
JOY MUSYOKA MUTINDA
MBA/55372/2017
A RESEARCH DISSERTATION SUBMITTED IN PARTIAL FULFILMENT
OF THE REQUIREMENTS FOR THE AWARD OF THE DEGREE OF
MASTER OF BUSINESS ADMINISTRATION AT
STRATHMORE UNIVERSITY
JULY, 2020

i
DECLARATION
Student declaration
This research dissertation is my original work and has not been submitted for
examination in any other institution
NAME OF STUDENT: JOY NGINA MUSYOKA MUTINDA
DATE:
SIGNATURE:
Supervisor’s approval
This research dissertation has been approved for examination by the following as
university supervisor.
NAME: DR. STELLA NYONGESA
LECTURER, STRATHMORE BUSINESS SCHOOL
DATE:
SIGNATURE:

ii
ABSTRACT
Customers’ expectations are ever growing and ever changing hence service providers
have to find ways of inventing, developing and providing new and better service offers,
better service delivery mechanisms. In the current highly competitive hospitality
industry environment, it is not only essential to know the significance of service quality
but to also identify suitable operational strategies that ought to be implemented to
achieve desired service quality goals. The general objective of the study was to establish
the influence of service quality on customer satisfaction among four star and five-star
hotels in Nairobi County. The anchoring theory of this study is Expectation
Disconfirmation Theory (EDP). This study used a descriptive research design
specifically cross-sectional survey with the sample size of 385 customers of the four
star and five-star hotels in Nairobi County. The non-probability sampling technique
specifically convenience sampling was adopted in the selection of the study sample.
The study collected primary data using semi structured questionnaires. Quantitative
data collected was analysed by use of descriptive statistics, Pearson R correlation was
used to measure strength and the direction of the linear relationships between variables.
Multiple regression models at 5% level of significance was used to establish the
relationship between service quality dimensions and customer satisfaction. The study
found that tangibility positively and significantly influences customer satisfaction
among hotels in Nairobi County; reliability has a positive significant influence on
customer satisfaction; responsiveness has positive significant influence on customer
satisfaction in Nairobi County; assurance has a positive significant influence on
customer satisfaction among hotels in Nairobi County; and empathy has a positive
significant influence on customer satisfaction among hotels in Nairobi County. The
study recommends the hotels to ensure that their facilities are visually appealing to its
customers and this includes ensuring its employees are neat. Improved tangibility of
services will enhance customer satisfaction and therefore their loyalty. It is also the
responsibility of the management of the hotel to ensure that its employees are well
conversant with the hotel and services provided so that they can help guests and respond
to their requests/queries.The study findings can be used by policy makers to encourage
hotel managers to enhance the service quality dimensions due to their positive impact
on customer satisfaction. The study results can be used by individuals conducting other
researchers and scholars to add their body of work by using similar variables with a
different methodology. It provides a foundation to those who want to conduct research
in a similar field. The study results can be used by hotel owners to elevate their customer
satisfaction scores by enhancing their processes and practices. The study was limited
by respondents’ reluctance to participate in the study due to identify and confidentiality
fears. However, the researcher assured them that the information they provide was
solely for academic reasons and therefore was to be kept confidential. The information
was stored in the university database so that only authorised individuals can access it.

iii
ACKNOWLEDGMENTS
I thank God for the gift of life. Am also grateful to my supervisor Dr. Stella Nyongesa
for the guidance provided. I also thank my family and friends for their support. God
bless you all.

iv
DEDICATION
I dedicate this work to my family for being supportive in the period I was pursuing this
course.

v
TABLE OF CONTENTS
DECLARATION........................................................................................................... i
ABSTRACT .................................................................................................................. ii
ACKNOWLEDGMENTS .......................................................................................... iii
DEDICATION............................................................................................................. iv
LIST OF FIGURES ................................................................................................... vii
LIST OF TABLES .................................................................................................... viii
CHAPTER ONE .......................................................................................................... 1
INTRODUCTION........................................................................................................ 1
1.1 Background of the Study ...................................................................................... 1
1.2 Statement of the Problem ..................................................................................... 8
1.3 Objective of the Study ........................................................................................ 10
1.4 Research Questions ............................................................................................ 11
1.5 Significance of the Study ................................................................................... 11
1.6 Scope of Study ................................................................................................... 12
CHAPTER TWO ....................................................................................................... 13
LITERATURE REVIEW ......................................................................................... 13
2.1. Introduction ....................................................................................................... 13
2.2. Theoretical Foundation ..................................................................................... 13
2.3. Empirical Review .............................................................................................. 15
2.4. Summary of Knowledge Gaps .......................................................................... 24
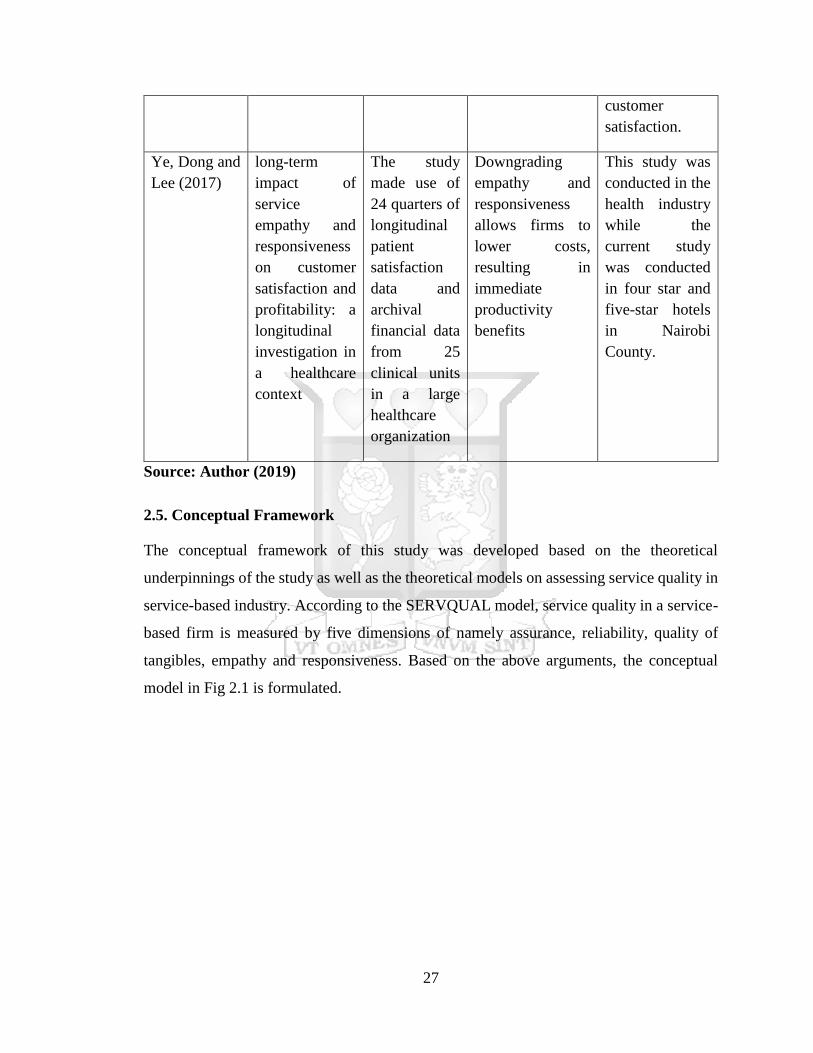
2.5. Conceptual Framework ..................................................................................... 27
2.6. Operationalization of study variables ................................................................ 28
2.7. Chapter Summary .............................................................................................. 30
CHAPTER THREE ................................................................................................... 32
RESEARCH METHODOLOGY ............................................................................. 32
3.1 Introduction ........................................................................................................ 32
3.2 Research Design ................................................................................................. 32
3.3 Population of Study ............................................................................................ 33
3.4 Sample Size and Sampling Technique ............................................................... 33
3.5 Data Collection Methods and Instruments ......................................................... 34
3.6 Research Quality ................................................................................................ 35
3.7 Data Analysis ..................................................................................................... 36
3.8. Ethical Considerations ....................................................................................... 38

vi
CHAPTER 4 ............................................................................................................... 39
DATA ANALYSIS, PRESENTATION AND INTERPRETATION .................... 39
4.1 Introduction ........................................................................................................ 39
4.2 Response Rate .................................................................................................... 39
4.3 Reliability Analysis ............................................................................................ 39
4.4 Demographic Information .................................................................................. 40
4.5 Descriptive Statistics .......................................................................................... 44
4.6 Inferential Statistics ............................................................................................ 52
CHAPTER FIVE ....................................................................................................... 58
SUMMARY, CONCLUSION AND RECOMMENDATIONS ............................. 58
5.1 Introduction ........................................................................................................ 58
5.2 Summary of the Findings ................................................................................... 58
5.3 Conclusions ........................................................................................................ 61
5.4 Recommendations .............................................................................................. 62
5.5 Suggestions for Further Studies ......................................................................... 64
5.6 Limitations of the Study ..................................................................................... 64
REFERENCES ........................................................................................................... 65
APPENDICES ............................................................................................................ 75
Appendix I: Letter of Introduction ........................................................................... 75
Appendix II: Questionnaire ...................................................................................... 76
Appendix III: List of Four and Five Star Hotels ...................................................... 84
vii
LIST OF FIGURES
Figure 2.1: Conceptual Framework ......................................................................... 28

viii
LIST OF TABLES
Table 2.1: Knowledge Gaps ........................................................................................ 25
Table 2.2: Operationalization of study variables ........................................................ 28
Table 4.1: Response Rate ............................................................................................ 39
Table 4.2: Reliability Analysis.................................................................................... 40
Table 4.3: Gender of Respondents .............................................................................. 41
Table 4.4: Age of the Respondents ............................................................................. 41
Table 4.5: Respondents Highest Level of education................................................... 42
Table 4.6: Respondents Marital Status ....................................................................... 43
Table 4.7: Respondents Frequency Visiting the Hotel ............................................... 43
Table 4.8: Respondents Reasons for Visiting the Hotel ............................................. 44
Table 4.9: Tangibility of Services ............................................................................... 45
Table 4.10: Reliability of Service ............................................................................... 46
Table 4.11: Responsiveness of Services ..................................................................... 47
Table 4.12: Assurance of Service ............................................................................... 48
Table 4.13: Empathy of Services ................................................................................ 50
Table 4.14: Customer Satisfaction .............................................................................. 51
Table 4.15: Correlation Analysis ................................................................................ 53
Table 4.16: Model Summary ...................................................................................... 54
Table 4.17: ANOVA ................................................................................................... 55
Table 4.18: Coefficients .............................................................................................. 56

ix
ABBREVIATIONS
ACSI American Customer Satisfaction Index
ATM Automatic Teller Machine
CL Customer Loyalty
CS Customer Satisfaction
CSAT Customer Satisfaction Score
EDP Expectancy-Disconfirmation Paradigm
EE Employee Empathy
EFA Exploratory Factor Analysis
NPS Net Promoter Score
RSQS Retail Service Quality Scale
SERVQUAL Service Quality
US United States


1
CHAPTER ONE
INTRODUCTION
1.1 Background of the Study
Organizations over the years have regarded service quality as a strategic tool for
positioning as well as means of achieving operational efficiency and improving business
performance (Tan, Oriande & Fallon, 2014). Service quality dimensions have been seen as
critical for the success of organizations because of their close link with customer
satisfaction (Tan, Oriande & Fallo, 2014) and more so in the service industry. Several
empirical studies (Nimako, Gyamfi, Mumuni & Wandaogou 2013; Uddin & Bilkis; 2012;
Agbor, 2011) indicate that perceived service quality is the antecedent of customer
satisfaction, gives direct and indirect effects on behavioral intentions and positively
influences customer satisfaction. Subsequently, companies are increasingly striving to
deliver high service quality to gain competitive advantage.
According to Mathews (2008), the main difficulty facing most industries is the ability to
continue satisfying their customers while at the same time making huge profits. In the past
decade, the global hotel industry has experienced significant changes in terms of growth,
competition, technology and consumer needs. Competition puts pressure on many hotel
services providers to provide quality services (Mathews, 2008). Hotels make it their
priority to meet the dynamic customer preferences and needs and most importantly, to
increase sales and cultivate a repeat purchase behavior. In such a market, characterized by
intense competition and dynamic consumer needs, it is important for hotels to continuously
assess customer perceptions of service quality against expectations in order to meet and
satisfy their needs.
Customers’ expectation and preferences are increasing from time to time (Ayele, 2012).
Service quality and customer satisfaction have increasingly been identified as key factors
in the battle for competitive differentiation to gain customer retention and customer loyalty
(Hersh, 2010; Kadampully & Suhartanto, 2000; Su, 2004). Along these lines, it is important
for hotels to come up with their own unique ways to meet the needs of their customers
while at the same time making profits.

2
Different theories have been advanced to explain the service quality – customer satisfaction
relationship and arrive at specific factors for measuring customer satisfaction. These
include; assimilation theory, attribution theory, equity theory, the perceived performance
theory and the expectation theory. The theory that best explains customer satisfaction
however is disconfirmation- expectancy paradigm theory (Oliver, 1997). Disconfirmation
theory indicates that customers compare a new service experience with a standard they
have developed. Their belief about the service is determined by how well it measures up
to this standard. The theory presumes that customers make purchases based on their
expectations, attitudes, and intentions (Oliver 1980).
Another theory that explains customer satisfaction is the Contrast theory first introduced
by Hovland, Harvey & Sherif (1987). Dawes, Singer, and Lemons (1972) defines contrast
theory as the tendency to magnify the discrepancy between one’s own attitudes and the
attitudes represented by opinion statements. Any discrepancy of experience from
expectations will be exaggerated in the direction of discrepancy.
Service quality has significant effect on customers’ perception toward brand image, due to
the statistics that show that a strong brand image is needed to distinguish an organization’s
brand and products from competitors’ brands or products (Boltan & Drew, 1991).
Schiffman and Kanuk (1991) also stated that customer will perceive brands that match and
suit their images. As a result, service quality adds value to customers by helping them
differentiate the brand from competing brands. This means that customers’ perception of
service quality is associated with brand image and customers are more likely to purchase
the brand that provides the superior service quality.
1.1.1 Service Quality Dimensions
The term service quality has been defined in several ways by a variety of scholars. Jiang
and Wang (2006) define service quality as the consumer’s evaluation of the service
performance received and how it compared with their expectation. The authors argue that
evaluations depend on customer’s memory or feeling rather than on service attributes.
Parasuraman, Zeithaml and Berry (1990) on their part define it as the degree and direction
of discrepancy between consumers’ perceptions and service quality expectations. Zeithaml
3
(1988) instead define service quality as an assessment of customers from the overall
excellence of services.
According to Turel and Serenko (2014) perceived quality is the actual experience of a
customer about service. Despite the variety of definitions of service quality most of the
authors agree that service quality is a multidimensional construct due to its elusive nature.
For the purpose of this study service quality will be based on the definition by Parasuraman,
Zeithaml and Berry (1990) who define service quality as the result of comparison that
customers make between their expectations about a service and their perception of the way
the service was performed.
When it comes to how service quality is measured various authors have used different
dimensions to measure it. Parasuraman et al. (1990) developed the SERVQUAL model
which measures service quality using five dimensions namely; reliability, assurance,
tangibles, empathy and responsiveness. They measured especially functional service
quality through empirical studies in banking, credit card, repair and maintenance, and long-
distance telephone services. Dabholkar, Thorp & Rentz, (1996) also measured service
quality in their empirically validated multilevel model called Retail Service Quality Scale
(RSQS) using 5 dimensions namely physical aspects, reliability, personal interaction,
problem solving, and policy. The scale was viewed as a general model to measure service
quality of retailers such as department and specialty stores. Philip and Hazlett (1997)
instead proposed a hierarchical structure model called P-C-P for measuring service quality
in service organizations. The authors adopted the scale of Webster and Hung (1994) one-
to-five point scale from -2 to 2 and associated P-C-P model with SERVQUAL. The model
was based on pivotal, core, and peripheral attributes.
Grönroos (1984) based his first service quality model on three service quality dimensions
namely technical quality, functional quality, and corporate image Technical quality is about
customer evaluations about the service and is interested in what was delivered. Functional
quality refers how consumers take the service and is interested in how the service was
delivered. Corporate image looks at the a positive impact on customer perceptions about
the organization. Berry et al.,(1994) used The Service Quality Ring which showed ten
lessons that improve the service quality (Berry et al., 1994). These lessons are listening,
4
reliability, basic service, service design, recovery, surprising customers, fair play,
teamwork, employee research, and servant leadership. They claimed that these factors
should be developed by service organizations to improve the service quality
For the purposes of this study, the SERVQUAL model by Parasuraman et al. (1990) was
adopted. Service quality was measured on five dimensions; that is reliability, tangibles,
responsiveness, assurance and empathy. Since the study focuses on the service industry,
SERVQUAL model was more suitable because it provides the different dimensions of
service quality. Tangibles refer to the appearance of the physical facilities of an
organization such as equipment, personnel and communication materials Parasuraman et
al. (1990). The authors further define reliability as the ability to perform the promises
service dependably and accurately; responsiveness as the willingness to help customers;
assurance as the knowledge and courtesy of employees and their ability to convey trust and
confidence; and empathy as the provision of caring, individualized attention to customers,
ease of access to employees and understanding customer needs.
Dabholkar et al. (1996) view SERVQUAL as more appropriate for “pure” service settings
and not as applicable to the retail setting which they believe requires additional dimensions.
Mehta et al. (2010) found the RSQS to be better suited to businesses in which there is a
higher ratio of goods to service (i.e., a supermarket), whereas the SERVQUAL scale is
better suited to businesses with the opposite ratio in which service is more important.
Hotels being a purely service industry SERVQUAL is more relevant here.
1.1.2 Customer Satisfaction
Customer satisfaction has attracted the attention of several authors who have defined it in
different ways. According to Philip & Hazlett (2017) customer satisfaction is when the
customer's perception that his or her expectations have been met or surpassed. If the
product or service performance falls short of expectation, the customer is dissatisfied. If
performance matches expectations, the customer is satisfied. If the performance exceeds
expectations, the customer is highly satisfied or delighted (Philip & Hazlett, 2017).
However, Ekinci, Sirakaya-Turk and Preciado (2013) argue that customer satisfaction
comes from the evaluation of service quality. Solomon (1994) defined customer

5
satisfaction as an overall feeling, or attitude, a person has about a product after it has been
purchased. Customer satisfaction is typically defined as a post consumption evaluative
judgment concerning a specific product or service (Gundersen, Heide & Olsson, 1996).
Further, Kotler (2006) defines customer satisfaction as a 'person's feeling of pleasure or
disappointment which resulted from comparing a product's perceived performance or
outcome against his/her expectations. Like service quality, there are many definitions of
customer satisfaction by different authors.
Customer satisfaction is often measured using two main scores namely Customer
Satisfaction Score (CSAT) and Net Promoter Score (NPS).CSAT measures how products
and services supplied by a company meet or surpass customer expectations. In the tool, a
respondent expresses his/her satisfaction on a number of statement in terms of their
perception and expectations on a score on a linear scale from either 1-3 or from 1-5 (Elegba
& Adah, 2015). The Net Promoter Score (NPS) was also introduced by Reichheld, (2003)
and it focuses on measuring long-term happiness for instance repeat purchase or customer
loyalty. It does so by asking a respondent to score how likely they are to recommend the
organization/product/service in question on a scale which ranges from 0-10.
CSAT is often used to measure short-term or immediate happiness of clients, NPS on the
other hand focuses on measuring customers’ long-term happiness thus customer loyalty.
According to Aulia, Sukati & Sulaiman (2016), NPS is especially used and claimed to be
a better predictor of customer behavior and strongly correlated with measures of company
growth. However, the CSAT can be used to measure more than just one aspect of customer
satisfaction. It can measure transaction specific satisfaction/immediate satisfaction, overall
satisfaction(transaction cumulative)/ satisfaction using the product over time, attribute
satisfaction, customer loyalty as well as repurchase intention (Elegba & Adah, 2015).
This study used CSAT to measure customer satisfaction in hotels because its components
helps in its conceptualization, understanding and assessment across different domains
and organizations (Elegba & Adah, 2015). It measures customers satisfaction quality of
purchase or service experienced real time with a service provider. It's an easy way to close
the loop on a customer interaction and determine whether or not it was effective in

6
producing customer happiness. CSAT also helps to tie customer satisfaction surveys to key
moments in a customer's experience (Aulia, Sukati & Sulaiman, 2016).
For the purposes of this study therefore, customer satisfaction measurement reflected on
transaction specific satisfaction, attribute satisfaction, customer loyalty as well as
repurchase intention factors that are important to the hotel industry CSAT. Anderson and
Fornell (2001) assert that there is no consensus among authors on how to measure customer
satisfaction. Measurement of customer satisfaction should be a continuous process that
translates what customers want (their needs and expectations) into strategic information
that can be used by management in decision making (Lamb et al., 2012).
1.1.3 Four Star and Five Star Hotels in Nairobi County
The hotel industry highly contributes to the growth of Kenya’s economy. The Restaurant
and Hotel Act Cap 494 is in charge of licensing of Kenyan hotels and restaurants and also
regulates the way hotels are operated in the country. The Act defines a hotel as a premise
other than those specified in the third schedule on which accommodation is supplied or
available for supply with or without food services in exchange for money.
The hotels are classified as per the Hotel and restaurant act using star ratings. No
standardized way for rating hotels, but the most common system uses stars, ranging from
one to five-star hotels. Star ratings are a way of classifying hotels based on standards upheld
and amenities they contain. Higher star ratings of the Hotel indicates higher luxury. Hotels
in Kenya are classified in star-rating system that includes 5-star the higher luxury, 4 –star
Hotels, 3-star Hotels, 2-star Hotels and 1-star Hotels. The entity in charge of determining
the conditions by which Hotels will be accountable and which will determine whether they
receive one or five stars is the World Organization of Tourism (Johanna, 2010).
The current study focused on 4 and 5-stars hotels because these hotels offer a high degree
of personal service, the hotel lobbies are luxurious and the rooms complete with stylish
furnishing. They feature up to three restaurants all with exquisite menus. The hotels
generally invest highly to ensure customer satisfaction. Customers pay a premium price so
expectations are high but they still have a high number of complaints or low ratings even
with the high investment. In the holiday seasons the hotels tend to have full booking,

7
however, in normal seasons the bookings may be low. As per the Kenyan Gazette Notice
No. 3976 (Vol. CV- No. 62) there are currently thirty-eight four and five-star hotels in the
country and fourteen of these are situated in Nairobi. The hotels have a bed capacity
ranging from forty-six beds to seven hundred beds.
The hotel industry can be said to be highly service focused because through the experiences
customers have in the hotel, they form opinions on the service provided against their
expectations thus when a hotel offers high service quality standards this may result in high
customer satisfaction ratings. Internationally, consumers are becoming much more
discriminating and demanding and there is also increased competitive pressure in the hotel
industry due to effects of globalization and due to the increased hotel services supply from
emerging and mature tourist destinations (Kinyingi, 2018). According to Euromonitor
international (2016), the Kenyan hotel industry will continue to witness exponential growth
due to the steady growth in the local hotels and increasing penetration of international
hotels.
Terrorist attacks have affected the Kenyan tourism industry negatively with the
international market going down as they opt for safer destinations. In order to survive,
hotels have had to rely on domestic clients or risk huge losses or closure. Therefore,
maintaining high customer satisfaction has been the focus of many Kenyan hotels in order
to remain relevant to both their international and domestic customers. (Kinyingi, 2018)
Service quality, customer satisfaction and loyalty in the hotel business are thus key
components for establishing a long-term organizational relationship. Service quality and
customer satisfaction have increasingly been identified as key factors in the battle for
competitive differentiation to gain customer retention and customer loyalty (Hersh, 2010;
Kadampully & Suhartanto, 2000; Su, 2004). Although this is important in all areas of the
tourism and lodging industry, the fulfillment of customers’ expectations for upscale luxury
hotel services are essential to keep the customers satisfied and returning (Mohsin &
Lockyer, 2010).
The hotel industry makes a significant contribution to the economic development of the
Country. Motivated by increasing competitive pressures and challenging economic times,
the Kenyan hotel industry has since 2000 embarked on a course of innovation in response

8
to the changing competitive landscape. Many hotels have been grasping surprising
opportunities, responding to threats and outmaneuver their rivals to endure and succeed
(Thompson, 2016). This study sought to establish the influence of service quality
dimensions on customer satisfaction among four and five-star hotels in Nairobi County.
1.2 Statement of the Problem
Hospitality industries are facing increasing competition day in day out (Gursoy & Swanger,
2016). Consequently, hotels are becoming more and more aware of the need to customize
services and improve general service performance to match the requirements of the
modern-day sophisticated customers. As customers’ expectations are ever growing and
ever changing, hotel service providers must find ways of inventing, developing and
providing new and better service offers, better service delivery mechanisms. In the current
highly competitive hospitality industry environment, it is not only essential to know the
significance of service quality but to also identify suitable operational strategies that ought
to be implemented to achieve desired service quality goals, (Kim & Mauborgne, 2016).
Hotels continually seek new ways to acquire, retain and increase business, because the cost
of losing customers is rising. Assessing service quality is thus an important practice in
order to retain customers; the role of service quality is more important than ever and is
expected to become even more critical with time (Chu & Choi, 2011). Hotels that have the
ability to attract, satisfy and thus retain customers are more likely to survive than hotels
that do not do so. Successful customer satisfaction allows the hotel to build relationships
with its customers. Bojanic and Rosen (2014) posit that competing firms often provide
similar services and as their customers become aware of the dimensions of service quality,
they increasingly become sensitive to prices and perceived value. Thus, hotels must
continuously assess customers’ perceptions of service quality to identify the dimensions
that require emphasis and improvement.
Studies establishing the link between service quality and customer satisfaction however
reveal inconsistencies. Previous researchers (Omar, 2015 ; Lee, Lee & Dewald, 2016;
Pandey & Devasagayam, 2010; Rachman, 2017; Bahadur, Aziz & Zulfiqar, 2018) have
used different constructs to measure service quality and customer satisfaction implying
there is no consensus yet on this issue. Empirical studies on different industries

9
investigating the link between service quality and customer satisfaction have employed
different service quality measurement scales; Rahhal (2015) in a study to evaluate the
effects of service quality on customer satisfaction in Syrian Mobile Telecommunication
Services, found a direct significant impact of service quality on customer satisfaction.
While this study was in the telecommunication sector, the current study was conducted in
four star and five-star hotels in Nairobi County. Kumar and Sikdar (2014) using RSQS in
India found that RSQS model in original form is invalid in the Indian retail store
environment. A four factor RSQS model excluding the ‘Policy ‘dimension revealed
reliable and valid results in Indian context. The current study however instead used
SERVQUAL model in four star and five-star hotels in Nairobi County to investigate a
similar relationship. Also these studies were done in developed markets whose social,
economic and cultural contexts differ from Kenya’s environment where the current study
was focused.
Other global studies are by Farooqi and Banerji (2013), Mistri and Bhatt (2014) and Nhat
and Hau (2017). Farooqi and Banerji (2013) who in the evaluation of RSQS in Big Bazaar
Hypermarkets in city of Delhi (India) found that retail service quality is associated with
future consumption behavior. The current study used SERVQUAL model in four star and
five-star hotels in Nairobi County. Mistri and Bhatt (2014) found that physical aspects and
personal interactions of the Retail Service Quality Scale (RSQS) model had a positive
influence on customers’ perceptions of the quality of service in Indian retail stores. Nhat
and Hau (2017) using the RSQS scale concluded that service personnel has the highest
impact on customer perception on retail service quality in Vietnam, whereas physical
aspects has the lowest impact. While these studies used RSQS the current study used
SERVQUAL model in four star and five-star hotels in Nairobi County. The RSQS is
applicable in retail kind of businesses therefore not suitable for the hotel industry.
Locally, studies linking service quality and customer satisfaction are available through
differ in terms of context and measurement. Kimani, Kagina, Kendi and Wawire (2011) in
a study to determine shoppers’ perceptions of supermarkets versus small convenience
shops using SERVQUAL model in Kenya, found that tangibles, responsiveness and
reliability had high influence on customer service in small shops whereas reliability,

10
responsiveness and empathy had high influence on satisfaction of customers of
supermarkets in that order. This study focused on supermarkets and small convenience
shops while the current study was conducted in four star and five-star hotels in Nairobi
County. Also, Mutua (2013) on a study to determine the factors that influence customer
satisfaction in supermarkets in Nakuru town using SERVQUAL model, concluded that
customers are generally dissatisfied with the supermarket’s responsiveness. Given that the
two studies were conducted in the same country as the current one, the focused on the
supermarket/ retail industry whereas the current one was conducted in four star and five-
star hotels in Nairobi County.
A review of previous empirical studies on SERVQUAL shows that extensive research on
service quality and customer satisfaction has been carried out using SERVQUAL model in
service industries such as telecommunication, banking, health care and restaurants,
whereas, limited studies have focused on Hospitality industry using SERVQUAL. This
study therefore bridged this gap by complementing existing research on service quality
dimensions and customer satisfaction in the hotel industry context using SERVQUAL
model. This study therefore sought to establish the influence of service quality dimensions
on customer satisfaction among four star and five-star hotels in Nairobi County
1.3 Objective of the Study
1.3.1 General Objective
The general objective of the study was to establish the influence of service quality on
customer satisfaction among hotels in Nairobi County
1.3.2 Specific Objectives;
The study was guided by the following specific objectives:
i. To determine the effects of tangibility on customer satisfaction among hotels in
Nairobi County.
ii. To assess the effects of reliability on customer satisfaction among hotels in Nairobi
County

11
iii. To determine the effects of responsiveness on customer satisfaction among in
Nairobi County
iv. To determine the effects of assurance on customer satisfaction among hotels in
Nairobi County
v. To establish the effects of empathy on customer satisfaction among hotels in
Nairobi County
1.4 Research Questions
The study sought to answer the following research questions
i. What is the effect of tangibility on customer satisfaction among hotels in Nairobi
County?
ii. What is the effect of reliability on customer satisfaction among hotels in Nairobi
County?
iii. What is the effect of responsiveness on customer satisfaction among hotels in
Nairobi County?
iv. What is the effect of assuarnce on customer satisfaction among in Nairobi County?
v. What is the effect of empathy on customer satisfaction among hotels in Nairobi
County?
1.5 Significance of the Study
This study aimed to make contributions to policy, practice and research
To policy makers, the study provided information in designing policies that helped hotels
in enhancing customer satisfaction through increased service quality. The policies guide
hotel managers to adopt quality service dimensions to serve their customers better.
The study findings provide current perspectives on issues related to customer perceptions
of services quality dimensions offered in hotels and on what customers currently deem as
important in achieving high customer satisfaction. In terms of the practical value, the
findings of this study assists hotels operations managers to formulate strategies for
improved quality management to facilitate customer satisfaction through adoption of best

12
operational management practices which results in better performance of hotels and
increased customer loyalty through customer satisfaction.
The findings of this study shed more light on the existing literature in the emerging field
of hotels franchising focusing on service quality dimensions. Furthermore, the study is
valuable to researchers in marketing, operations management and other related fields as it
supports and adds on current issues on service quality and customer satisfaction to the
existing body of knowledge. It also provides a basis upon which other related studies can
be founded and even replicated. It also strengthens the empirical evidence that supports the
tenants of the theories underpinning the study through the contributions made by the
research findings.
1.6 Scope of Study
The study was limited to investigating service quality and customer satisfaction using the
five quality dimensions tangibility, reliability, responsiveness, assurance and empathy in
four star and five-star hotels in Nairobi County. Nairobi County was specifically used in
this research because of the high concentration of four and five star hotels as well as ease
of access by the researcher. The target population of the study was the customers of 14 four
star and five-star hotels in Nairobi County (Kenya Association of Hotel Keepers and
Caterers, 2018). Questionnaires were the main instrument for data collection hence the
study was quantitative in nature and the study was conducted between May 2019 and
September 2019.
13
CHAPTER TWO
LITERATURE REVIEW
2.1. Introduction
This chapter portrays a review of the theoretical and empirical literature on effects of
service quality and customer satisfaction. It is divided into five major sections namely,
theoretical formulization, empirical review, knowledge gaps, conceptual framework and
operationalization of variables
2.2. Theoretical Foundation
Theories are formulated to explain, predict, and understand phenomena and, in many cases,
to challenge and extend existing knowledge within the limits of critical bounding
assumptions. The study was based on Expectation Disconfirmation Theory (EDP) and
Contrast Theory. However, the main theory supporting the study is Expectation
Disconfirmation Theory (EDP)
2.2.1. Expectation Disconfirmation Theory (EDP)
Oliver (1977; 1980) proposed the Expectancy-Disconfirmation Theory (EDP) as the most
promising theoretical framework for the assessment of customer satisfaction. The
framework employed in the assessment of customer satisfaction with hospitality and
tourism services. The model implies that consumers purchase goods and services with pre-
purchase expectations about the anticipated performance. The expectation level then
becomes a standard against which the product is judged. That is, once the product or service
has been used, outcomes are compared against expectations. If the outcome matches the
expectation confirmation occurs (Yi 1990). Disconfirmation occurs where there is a
difference between expectations and outcomes. A customer is either satisfied or dissatisfied
as a result of positive or negative difference between expectations and perceptions. Thus,
when service performance is better than what the customer had initially expected, there is
a positive disconfirmation between expectations and performance which results in
satisfaction, while when service performance is as expected, there is a confirmation
between expectations and perceptions which results in satisfaction (Kopalle & Lehmann,

14
2001). In contrast, when service performance is not as good as what the customer expected,
there is a negative disconfirmation between expectations and perceptions which causes
dissatisfaction (Boulding et al., 1993).
This type of discrepancy theory has a long history in the satisfaction literature dating back
at least to Howard’s & Sheth’s (1967) definition of satisfaction which states that it is a
function of the degree of congruency between aspirations and perceived reality of
experiences. Porter (1961) can be credited with early empirical applications of this
comparative model of customer satisfaction in the field of job satisfaction (cf. Oliver,
1997). In his study, Porter (1961), for instance, compared the worker’s perception of how
much of a job facet (for example, pay) there should be to the worker’s perception of how
much is the facet.
Thus, in this theory, the customer’s perception of overall satisfaction results from a
comparison between expectation and outcome performance. Therefore, expectation and
outcome performance are two important variables which can influence the judgment of
satisfaction measure because customers’ satisfaction is one of the curial factor to predict
the customer purchase tendency. To investigate satisfaction toward the products is also a
main topic in customer behavior research. Based on expectation disconfirmation theory,
firm can increase satisfaction by increasing perceived product performance or decreasing
expectation.
This theory is useful to the current study as it informs how service quality expectations
from a customer’s point of view affect’s customer satisfaction with the service. This theory
explains customer behavior as they use the expectations they come in with to judge the
quality of the service experienced which forms their perception This can therefore help
guide the 4 and 5 star hotels better understand the importance in the delivery of their
services in order maximize customer satisfaction.
2.2.2. Contrast Theory
Contrast theory was first introduced by Hovland, Harvey and Sherif (1987). Dawes et al.
(1972) defines contrast theory as the tendency to magnify the discrepancy between one’s
own attitudes and the attitudes represented by opinion statements. According to the theory,

15
when actual product performance falls short of consumer’s expectations about the product,
the contrast between the expectation and outcome will cause the consumer to exaggerate
the disparity (Yi, 1990). The Contrast theory maintains that a customer who receives a
product less valuable than expected, will magnify the difference between the products
received and the product expected (Cardozzo, 1965). This theory predicts that product
performance below expectations will be rated poorer than it is in reality (Oliver & DeSarbo,
1988). In other words, the Contrast Theory would assume that "outcomes deviating from
expectations will cause the subject to favorably or unfavorably react to the disconfirmation
experience in that a negative disconfirmation is believed to result in a poor product
evaluation, whereas positive disconfirmation should cause the product to be highly
appraised.
While the theory of assimilation asserts that the consumers will try to minimize the
expectation-performance discrepancy, the theory of contrast insists on a surprise effect that
can lead to exaggerating the discrepancy. From the theory, any discrepancy of experience
from expectations will be exaggerated in the direction of discrepancy. If the firm raises
expectations in his advertising, and then a customer’s experience is only slightly less than
that promised, the product/service would be rejected as totally un-satisfactory. Conversely,
under-promising in advertising and over-delivering will cause positive disconfirmation
also to be exaggerated.
This theory is useful to the current study as it helps to explain the resulting customer
satisfaction with a service whereby customers provide a rating on the level of their
satisfaction from highly satisfied to highly dissatisfied. This therefore helped the 4- and 5-
star hotels understand any major disparity in the customer satisfaction reviews given by
clients who experienced their products and services.
2.3. Empirical Review
This section reviews studies carried out by other researchers on service quality and
customer satisfaction. The review was center on studies that authors have conducted on the
relationship between a few or all service quality dimensions and customer satisfaction.

16
2.3.1 Service Quality and Customer Satisfaction
In 1988, Parasuraman, Zeithaml, and Berry had conducted an empirical study to measure
the service quality towards the customers’ perceptions by using the ten dimensions as a
basic structure. The results indicated that some variables in these ten dimensions were
overlapped with each other. In the ten elements of service quality, tangibility, reliability
and responsiveness remain constant while the remaining seven determinants were
categorized into the last two dimensions which are assurance and empathy (Parasuraman
et al., 1988).
As a result, there are five service quality dimensions in the modified version of
SERVQUAL model that affect customers’ satisfaction and thus brand image: Tangibility
is related to the physical environment, facilities and the employees’ appearance. Reliability
is the ability to carry out the services consistently and accurately. Responsiveness is the
willingness of the employees in helping the customer to solve the problem. Assurance is
the adequate knowledge that the employees possess and the ability of the employees in
entrusting the confidence. Empathy is associated with the organization provide the caring
and individualized attention to their customers. Buttle (1996) mentioned that SERVQUAL
model is been used widely in measuring customers’ perceptions towards various types of
services.
Al-Azzam (2015) studied the impact of service quality on customer satisfaction: a field
study of Arab Bank in Irbid City, Jordan. The study used the model of service quality with
five dimensions to evaluate its effect on the customer satisfaction. The results indicated
that the higher the service quality, the more the costumer’s satisfaction. The findings also
indicated that the five factors of service quality positively affected the customer
satisfaction. This study was conducted in the banking industry whose customers differ in
the social, economic and cultural elements from the customers that the current study that
was conducted on in the four star and five-star hotels in Nairobi County.
Rahhal (2015) evaluated the effects of service quality on customer satisfaction: an
empirical investigation in Syrian Mobile Telecommunication Services. Convenience
sampling was used to select 600 mobile phone service users and was distributed among the

17
Damascus and Aleppo. Confirmatory factor analysis was used in the analysis. The findings
of the study showed the direct significant impact of service quality on customer
satisfaction. This study was conducted in the Syria, while the current study was conducted
in Kenya, specifically Nairobi County, that has economic, social, political and cultural
differences to Kenya.
Olatokun and Ojo (2014) did a study on the influence of service quality on consumers’
satisfaction with mobile telecommunication services in Nigeria. Using survey design, the
study assessed customer satisfaction with mobile telecommunication services in Ibadan, a
Nigerian municipality. A structured questionnaire, consisting of SERVQUAL dimensions
of reliability, responsiveness, assurance, empathy and tangibility, was used to collect data.
Convenience sampling technique was used to select 431 mobile telecommunication users
to measure their satisfaction level. Findings revealed Responsiveness, Assurance and
Empathy to be significant in explaining customer satisfaction. The findings may further
strengthen the position of the regulatory authorities in developing policies that will address
customers’ satisfaction based on defined priorities. This study was conducted in mobile
telecommunication services while the current study was conducted in four star and five-
star hotels.
Aliata (2016) carried out a study on the relationship between service quality and customer
satisfaction of commercial bank customers, Nairobi Kenya. A sample of 384 was drawn
using proportionate stratified random sampling technique to constitute 242 Retail, 81
Business and 61 corporate customers. The results revealed that service quality significantly
contributed to customer satisfaction at (β=.488, p less than .05). This study failed to
establish the effects of service quality on customer satisfaction in four star and five-star
hotels in Nairobi, Kenya which is the focus of the current study. Although this study was
conducted among commercial bank customers in Nairobi Kenya, the current study was
conducted among four star and five-star hotels in Nairobi County.

18
2.3.2 Tangibles and Customer Satisfaction
This section looks at the relationship between tangibles and their effect on customer
satisfaction across different conceptual and contextual research works explored by other
authors across different geographical regions and industrial sectors.
Tamwatin, Trimetsoontorn and Fongsuwan (2015) studied the effect of tangible and
intangible service quality on customer satisfaction and customer loyalty in Siam Kempinski
Hotel in Bangkok, Thailand. A self-selection sampling technique was used to select the
sample by sending the questionnaires to the guests who stayed at the hotel, out of which
425 guests returned the completed questionnaires. Structural equation modelling (SEM)
was used to analyze the collected data. Findings confirmed that tangibles and intangible
services influence customer satisfaction significantly and all these jointly influence
customer loyalty. This study though similar in the industry focused on, was conducted in
Thailand whereas the current one was conducted in a different country that is, in four star
and five-star hotels in Nairobi, Kenya.
Lee, Lee & Dewald (2016) carried out a study on measuring the customers’ perception of
tangible service quality in the restaurant industry. The purpose of the study was to
investigate the relative importance of tangible service attributes toward diners’ satisfaction
within the upscale dining segment. A total of 29 tangible service attributes were identified.
Through the exploratory factor analysis (EFA), five underlying dimensions of tangible
service attributes were first delineated: presentation value, table aesthetics, sensory
perceptions, hygiene purity, and vehicle convenience. The results indicated a statistically
significant causal relationship between tangible service factors and the diners’ satisfaction
exists within the upscale dining segment. This study only focused on tangible service
quality, the current study focused on tangibles, reliability, responsiveness, assurance and
service empathy SERVQUAL dimensions.
Santos (2002) studied the intangibility to tangibility on service quality perceptions: a
comparison study between consumers and service providers in four service industries. The
study investigated the importance of tangibles and intangibles in perceptions of service
quality as assessed by both customers and service providers. The study was conducted in

19
four service industries to reflect a range from high to low levels of tangible components
and degree of intangibility in both service process and output. Results showed that the level
of tangible components has a positive impact on the perceived importance of the tangible
dimension in service quality. This study focused on consumers and providers across four
service industries while the current study focused only on consumers in four star and five-
star hotels in Nairobi, Kenya.
Alsaqre (2011) carried out a study on the effects of tangible and intangible factors on
customers’ perceived service quality and loyalty in Hotel Industry in Al-Ladhiqiyah, Syria.
The study investigated the effects of both tangible and intangible aspects of service quality
at hotels on both customers’ overall perception of service quality and loyalty. Data were
collected from 209 respondents who were guests at some hotels at Al-Ladhiqiyah, a Syrian
coastal city. The instrument used for data collection was a questionnaire. This study
showed that design of the hotels, the equipment at hotels and the ambient conditions at
hotels had their effects on customers’ overall perceptions of service quality. The results
also showed that only intangible factors of empathy and assurance had their significant
influence on customers’ overall perception of service quality. In addition, the results
indicated that empathy, assurance and reliability had a high significant influence on
customers’ loyalty. This study was conducted in Syria while the current study was
conducted in four star and five-star hotel in Kenya.
Sureshbabu (2014) undertook a study on customer satisfaction on tangibility of banking
services in Thanjavur City. Filled questionnaires were received from 116 sample of
banking customers and statistical results of the study revealed that level of satisfaction
varies with the respect to type of bank, frequency of visit and years of dealing for few
factors of tangibility aspects of banking only. This study focused on banking customers in
Thanjavur City, while the current one focused on hotel customers in four star and five-star
hotels in Nairobi, Kenya.

20
2.3.2. Reliability and Customer Satisfaction
This section looks at the relationship between reliability and its effect on customer
satisfaction across different conceptual and contextual research works explored by other
authors across different geographical regions and industrial sectors
Omar (2015) carried out a study on determining the influence of the reliability of service
quality on customer satisfaction: the case of Libyan E-Commerce customers. The primarily
purpose of the study was to determine the influence of reliability dimension of E-commerce
on Libyan customers satisfaction. Required data was collected through customers’ survey.
The findings show that there is a very strong relationship between quality of service
(Reliability) and customer satisfaction. Based on the conclusion made, Reliability E-
commerce business was representing the ability of the web site to fulfill orders correctly,
deliver promptly, and keep personal information secure. This study focused on Libyan E-
Commerce customers while the current one focused on hotel customers in four star and
five-star hotels in Nairobi, Kenya.
Gagnon and Roh (2008) evaluated the impact of customization and reliability on customer
satisfaction in the U.S. Lodging Industry. The study examined the relationship between
customers' perceptions of reliability, customization, overall quality, and customer
satisfaction in the US lodging market. The American Customer Satisfaction Index (ACSI)
provided the secondary data for the research. The results provided evidence that US hotel
guests were satisfied with the overall quality of their hotel experiences and that overall
quality, customization, and reliability all have significant, positive impacts on customer
satisfaction. This study was conducted in the United States of America which is a
developed economy compared to the current study that focused in Nairobi, Kenya which
is a developing country.
Galetzka, Verhoeven and Pruyn (2006) did a study on service validity and service
reliability of search, experience and credence services, a scenario study. Service validity
and service reliability were manipulated in scenarios describing service encounters with
different types of services. Customer satisfaction was measured using questionnaires. It
was established that Service validity and service reliability independently affect customer

21
satisfaction with search services. For experience services, service validity and service
reliability are necessary conditions for customer satisfaction. For credence services, no
effects of service validity were found but the effects of service reliability on customers’
satisfaction were profound. This study focused on credence services while the current one
focused on four star and five-star hotels in Nairobi, Kenya.
Pisnik and Snoj (2010) carried out a study on the development, validity and reliability of
perceived service quality in retail banking and its relationship with perceived value and
customer satisfaction. The purpose of the study was first to validate the perceived retail
banking service scale in the case of a small transitional economy of Europe, and second to
re-search service quality-customer satisfaction relationship and the role of perceived value
within it. The study established that the perceived value variable has a potential to be
mediating variable between perceived quality and customer satisfaction relationship in
retail banking settings. This study was conducted in the banking industry while the current
study was conducted in four star and five-star hotels in Nairobi County.
2.3.3 Responsiveness and Customer Satisfaction
This section looks at the relationship between responsiveness and its effect on customer
satisfaction across different conceptual and contextual research works explored by other
authors across different geographical regions and industrial sectors
Pandey and Devasagayam (2010) undertook a study on responsiveness as antecedent of
satisfaction and referrals in financial services marketing. It was a detailed study of a
multinational bank operating in the emergent economy of India with a random national
sample of over 9000 of their customers. The study provided empirical evidence suggesting
that responsiveness to customer enquiries and complaints might be a strong driver of
customer satisfaction, irrespective of the outcome of the resolution process. The study
found that responsiveness supersedes a positive outcome in service provider-customer
conflict resolution. This study was conducted in India whose political, social, economic
and cultural aspects differ from the current study that was focused in Nairobi, Kenya.
Iberahim (2016) did a study on customer satisfaction on reliability and responsiveness of
self-service technology for retail banking services. The purpose of this study was to

22
examine the current level of ATMs service quality at one of the main ATM service points
of a Malaysian bank. The objective of the study was to investigate the relationship between
the reliability and responsiveness of ATM services with customer satisfaction and verify
the determinants for service enhancement. Data was collected through questionnaire survey
of 271 respondents and observations at the service point. Data was analyzed using SPSS.
Result of survey suggests the relationships of three out of four elements of service quality
dimensions (consistency, dependability and timeliness) are important to maximizing
customer satisfaction. This study mainly focused on customer satisfaction while the current
study focused on service quality and customer satisfaction.
2.3.4. Assurance and Customer Satisfaction
This section looks at the relationship between assurance and its effect on customer
satisfaction across different conceptual and contextual research works explored by other
authors across different geographical regions and industrial sectors
Rachman (2017) undertook a study an analyzing the of effect of physical evidence and
service assurance on customer satisfaction and customer loyalty in using car rental service
(PT Pusaka Prima Transport Cases). The method used in this research was descriptive
analysis method, using multiple regression, and tools questionnaire given to 107 consumers
PT Pusaka Prima Transport. The results showed that the four variables had a significant
influence in the amount of 42.99% for physical evidence to customer satisfaction, 18.40%
for the guarantee of service to customer satisfaction, and 64.8% for customer satisfaction
to customer loyalty. This study was conducted in the transport sector while the current
study was conducted in four star and five-star hotels in Nairobi County.
Park, Bhatnaga & Rao (2014) carried out a study on assurance seals, on-line customer
satisfaction and repurchase intention. The study explored how third-party assurance seals,
a privacy service provided by vendors to mitigate customers’ fears, have an impact on on-
line customer satisfaction and repeat-purchase intention. The study showed, first, that seals
provide a frame such that a consumer's overall satisfaction and repeat-purchase intention
would be higher when vendors provide assurance seals than when they do not. Second,
applying the concept of diminishing sensitivity, it showed that consumers would be

23
subjectively less sensitive to service performance of vendors who provide seals than
vendors who do not provide seals. This study focused on how the different ways customer
fears are mitigated impact customer satisfaction while the current study focused on how
service quality dimensions influence customer satisfaction.
2.3.5. Empathy and Customer Satisfaction
This section looks at the relationship between empathy and its effect on customer
satisfaction across different conceptual and contextual research works explored by other
authors across different geographical regions and industrial sectors
Ye, Dong and Lee (2017) conducted a study on long-term impact of service empathy and
responsiveness on customer satisfaction and profitability: a longitudinal investigation in a
healthcare context. Using 24 quarters of longitudinal patient satisfaction data and archival
financial data from 25 clinical units in a large healthcare organization, the study examined
how empathy and responsiveness influence profitability over time. The findings showed
that downgrading empathy and responsiveness allows firms to lower costs, resulting in
immediate productivity benefits; however, this strategy had an enduring negative effect on
customer satisfaction and ultimately hurts profitability in the long run. This study was
conducted in the health industry while the current study was conducted in four star and
five-star hotels in Nairobi County.
Bahadur, Aziz and Zulfiqar (2018) studied the effect of employee empathy on customer
satisfaction and loyalty during employee–customer interactions: The mediating role of
customer affective commitment and perceived service quality. The study investigated the
indirect effect of employee empathy (EE) on customer loyalty (CL) and loyalty outcomes
through intervening variables, i.e. customer affective commitment, perceived service
quality, and customer satisfaction (CS). Associations between the constructs of the
proposed model were examined in the context of employee–customer interactions. Data
were collected through the online survey from 360 useable responses collected from active
users of telecommunication services from the province of Anhui, China. To test the model,
structural equation modeling was applied by using AMOS 21. The findings confirmed the
positive and indirect effect of EE on CL and loyalty outcomes (i.e. positive word-of-mouth

24
and repurchase intentions). This study was conducted in China which is a developed
economy compared to the current study that focused on Nairobi, Kenya which is a
developing country.
2.4. Summary of Knowledge Gaps
From the above empirical literature review the study identifies conceptual, empirical and
contextual knowledge gaps. Conceptually, prior studies have mainly used one or two
service quality dimensions and studied their relationship with customer satisfaction (Omar,
2015 ; Lee, Lee & Dewald, 2016; Pandey & Devasagayam, 2010; Rachman, 2017;
Bahadur, Aziz & Zulfiqar, 2018). Empirically prior studies also yield different results.
Some authors found that 3 out of the five dimensions had a the most influence on customer
satisfaction while other authors who only focused on one dimensions found a positive
relationship e.g Olakutan and Ojo (2016) and Omar (2015) . This implies that this
relationship still presents mixed findings warranting further research. The current study
instead employed all five service quality dimensions to establish their relationship with
customer satisfaction.
Contextually, prior studies (e.g Gagnon and Roh, 2008; Alsaqre, 2011) were conducted in
different environments/ countries that have both social, economic and cultural differences
from where the current study will take place since market dynamics in developing markets
like Kenya differ significantly, that is, how customers perceive quality of a service in
Kenya may differ from how it is perceived in developed markets.
Additionally majority of prior studies were conducted in sectors such as e-commerce
(Omar ,2015), banking (Aliata, 2016), restaurant (Lee, Lee and Dewald, 2016),
telecommunication (Rahhal, 2015), transport (Rachman,2017) and healthcare (Ye, Dong
and Lee, 2017) suggesting that hotel industry requires more research to be done. This is
because the service offering and the customer profiles for the hotel industry differ from the
industries mentioned.
Arising from these conceptual, empirical and contextual knowledge gaps, this study sought
to address them by investigating the influence of service quality dimensions on customer
satisfaction among four star and five-star hotels in Nairobi County.

25
Table 2.1: Knowledge Gaps
Author Focus of the
study
Methodology Findings Research gap
Al-Azzam
(2015)
Impact of
service quality
on customer
satisfaction: a
field study of
Arab Bank in
Irbid City,
Jordan
The study
used the
model of
service
quality with
five
dimensions to
evaluate its
effect on the
customer
satisfaction.
The results
indicated that the
higher the service
quality, the more
the costumer’s
satisfaction.
This study was
conducted in the
banking
industry whose
customers differ
in the social,
economic and
cultural
elements from
the customers
that the current
study that was
conducted on in
the four star and
five-star hotels
in Nairobi
County
Santos (2002) Evaluation on
intangibility to
tangibility on
service quality
perceptions: a
comparison
study between
consumers and
service
providers in
four service
industries.
The study
was
conducted in
four service
industries to
reflect a range
from high to
low levels of
tangible
components
and degree of
intangibility
in both
service
process and
output.
Results showed
that the level of
tangible
components has a
positive impact on
the perceived
importance of the
tangible
dimension in
service quality.
This study
focused on
consumers and
providers across
four service
industries while
the current study
focused only on
consumers in
four star and
five-star hotels
in Nairobi,
Kenya.
Omar (2015) Determining
the influence of
Required data
was collected
The findings
show that there is
This study
focused on

26
the reliability of
service quality
on customer
satisfaction: the
case of Libyan
E-Commerce
customers.
through
customers’
survey.
a very strong
relationship
between quality
of service
(Reliability) and
customer
satisfaction.
Libyan E-
Commerce
customers while
the current one
focused on hotel
customers in
four star and
five-star hotels
in Nairobi,
Kenya.
Pandey and
Devasagayam
(2010)
Responsiveness
as antecedent of
satisfaction and
referrals in
financial
services
marketing.
It was a
detailed study
of a
multinational
bank
operating in
the emergent
economy of
India with a
random
national
sample of
over 9000 of
their
customers.
The study found
that
responsiveness
supersedes a
positive outcome
in service
provider-
customer conflict
resolution.
This study was
conducted in
India whose
political, social,
economic and
cultural aspects
differ from the
current study
that was focused
in Nairobi,
Kenya.
Park,
Bhatnaga &
Rao (2014)
Assurance
seals, on-line
customer
satisfaction and
repurchase
intention.
The study
adopted a
survey
research
method
Seals provide a
frame such that a
consumer's
overall
satisfaction and
repeat-purchase
intention would
be higher when
vendors provide
assurance seals
than when they do
not.
This study
focused on how
the different
ways customer
fears are
mitigated
impact customer
satisfaction
while the
current study
focused on how
service quality
dimensions
influence
27
customer
satisfaction.
Ye, Dong and
Lee (2017)
long-term
impact of
service
empathy and
responsiveness
on customer
satisfaction and
profitability: a
longitudinal
investigation in
a healthcare
context
The study
made use of
24 quarters of
longitudinal
patient
satisfaction
data and
archival
financial data
from 25
clinical units
in a large
healthcare
organization
Downgrading
empathy and
responsiveness
allows firms to
lower costs,
resulting in
immediate
productivity
benefits
This study was
conducted in the
health industry
while the
current study
was conducted
in four star and
five-star hotels
in Nairobi
County.
Source: Author (2019)
2.5. Conceptual Framework
The conceptual framework of this study was developed based on the theoretical
underpinnings of the study as well as the theoretical models on assessing service quality in
service-based industry. According to the SERVQUAL model, service quality in a service-
based firm is measured by five dimensions of namely assurance, reliability, quality of
tangibles, empathy and responsiveness. Based on the above arguments, the conceptual
model in Fig 2.1 is formulated.
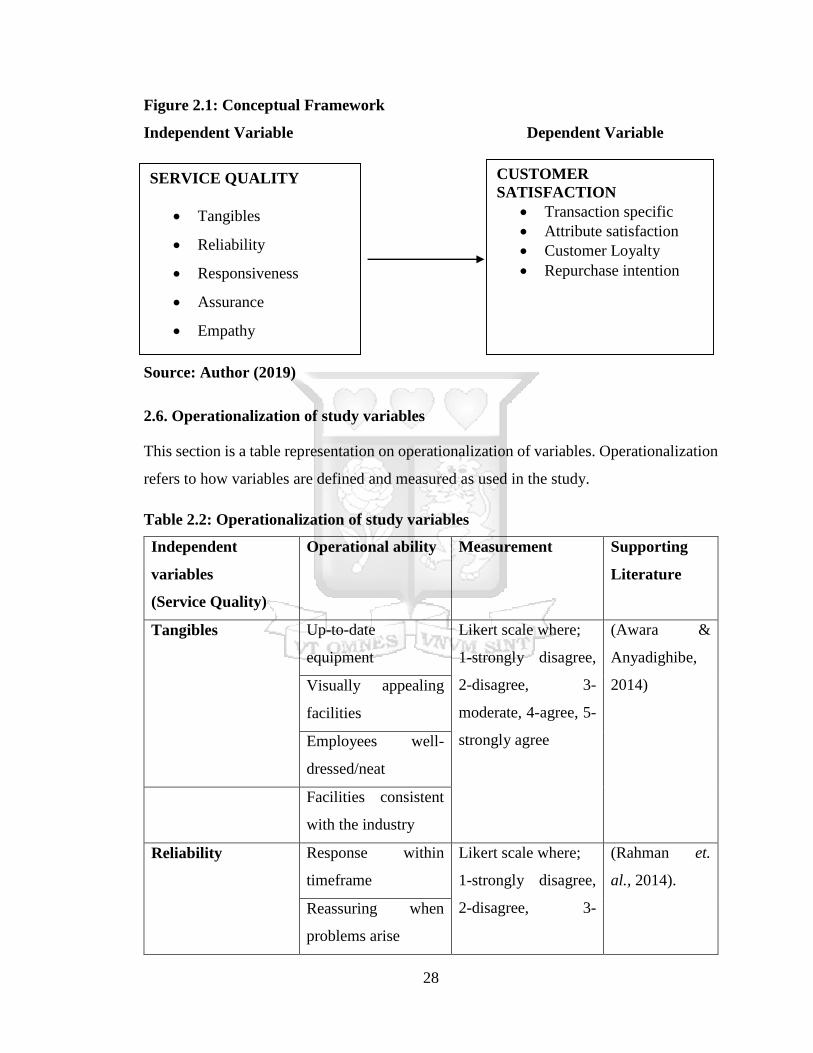
28
Figure 2.1: Conceptual Framework
Independent Variable Dependent Variable
Source: Author (2019)
2.6. Operationalization of study variables
This section is a table representation on operationalization of variables. Operationalization
refers to how variables are defined and measured as used in the study.
Table 2.2: Operationalization of study variables
Independent
variables
(Service Quality)
Operational ability Measurement Supporting
Literature
Tangibles Up-to-date
equipment
Likert scale where;
1-strongly disagree,
2-disagree, 3-
moderate, 4-agree, 5-
strongly agree
(Awara &
Anyadighibe,
2014) Visually appealing
facilities
Employees well-
dressed/neat
Facilities consistent
with the industry
Reliability Response within
timeframe
Likert scale where;
1-strongly disagree,
2-disagree, 3-
(Rahman et.
al., 2014).
Reassuring when
problems arise
SERVICE QUALITY
Tangibles
Reliability
Responsiveness
Assurance
Empathy
CUSTOMER
SATISFACTION
Transaction specific
Attribute satisfaction
Customer Loyalty
Repurchase intention

29
Dependable moderate, 4-agree, 5-
strongly agree Service delivered at
times promised
Accurate records
Responsiveness Employees were
helpful in informing
customer when
service will occur
Likert scale where;
1-strongly disagree,
2-disagree, 3-
moderate, 4-agree, 5-
strongly agree
(Rauch et.al.,
2015)
Employees were
willing to help
Employees respond
to requests
Prompt service
delivery by staff
Assurance Trustworthy
employees
Likert scale where;
1-strongly disagree,
2-disagree, 3-
moderate, 4-agree, 5-
strongly agree
(Awara &
Anyadighibe,
2014) Customers safety
Politeness of
employees
Employees have
support to do their
job well
Empathy Individualized
attention by hotel
Likert scale where;
1-strongly disagree,
2-disagree, 3-
moderate, 4-agree, 5-
strongly agree
(Rauch et.al.,
2015)
Individualized
attention by
employees
Employees
understand customer
needs

30
Best interest of
customer in mind by
employees
Convenient operation
hours
Dependent Variable
(Customer
Satisfaction)
Operational ability Measurement Supporting
Literature
Transaction specific How satisfied were
you with the service
offered?
Likert scale where;
1-strongly disagree,
2-disagree, 3-
moderate, 4-agree, 5-
strongly agree
(Elegba &
Adah, 2015)
Customer Loyalty
(Affective,
Behavioral)
Would you
recommend the hotel
to your family and
friends?
Attribute Satisfaction
Measurement
(Affective and
Cognitive)
Did the hotel meet
you perceived
expectations?
Repurchase
(Behavioral
Measures)
Do you intend to
return to the hotel the
next time you travel?
Source: Author (2019)
2.7. Chapter Summary
This section has reviewed the theories adopted in explaining service quality and customer
satisfaction. These include; the contrast theory and the Expectancy-Disconfirmation
Theory. The empirical literature in line with study objectives tangibles, reliability,
responsiveness, assurance, and empathy and customer satisfaction has also been discussed
while identifying the research gaps. Then the conceptual framework which shows the
31
relationship between the study variables has also been review and finally the
operationalization of the study variables.

32
CHAPTER THREE
RESEARCH METHODOLOGY
3.1 Introduction
This chapter presents the methodology of research. The chapter covers the research design,
target population, the sample frame, sample and sampling techniques. In addition, the
chapter also identified the data collection instruments utilized for data collection, the data
collection procedure, pilot testing, validity and reliability of the research instrument, data
analysis and presentation.
3.2 Research Design
The research design facilitates the framework of the various research operations, thereby
making research as efficient as possible hence yielding maximum information with
minimal expenditure of effort, time and money (Mugenda, 2008). This study used a
descriptive research design specifically cross-sectional survey. This type of research design
focuses on explaining the aspects of the study in a detailed manner. A researcher starts with
a general idea and uses this research as a medium to identify issues, that can be the focus
for future research. The purpose of explanatory research is to increase the understanding
on a certain subject. It also explains why events occur to build, elaborate, extend or test
theory (Creswell, 2013).
Explanatory research is interested in understanding, explaining, predicting and controlling
relationships between variables than in detecting causes. Explanatory studies go beyond
description and attempts to explain the reasons for the phenomenon that the descriptive
study only observed (Yin, 2013). The study sought to be explanatory in nature because it
increases understanding between common people, or other researchers among the topic
that is investigated. Zikmund, Babin, Carr and Griffin (2012) recommended explanatory
research design because it is associated with greater levels of internal validity due to
systematic selection of subjects.

33
3.3 Population of Study
Target population is the entire set of units for which the study data are to be used to make
inferences; the target population thus defines those units for which the findings of the study
are meant to generalize (Sarason, 2013). A population includes all elements that meet
certain criteria for inclusion in a research study. It is the entire set of individuals or objects
sharing some common characteristics as defined by the sampling criteria established for
the study (Burns & Grove, 2013). McLeod (2014) note that a research population is
generally a large collection of individuals or objects that is the focus of a scientific query.
It is for the benefit of the population that researches are done. The unit of observation was
the four star and five-star hotels while the unit of analysis was the customers at the four
star and five-star hotels. There were 14 four star and five-star hotels in Nairobi County as
at Dec 2018 (Kenya Association of Hotel Keepers and Caterers, 2018). All 14 hotels were
selected to participate in the study. According to Kenya Association of Hotel Keepers and
Caterers, (2018), these hotels in 2018 were estimated to have 10,000 customers and a
sample of these was selected.
3.4 Sample Size and Sampling Technique
Yin (2013) explains that sampling is the procedure of selecting a representative of the total
population as much as possible in order to produce a miniature (small) cross section.
Kothari (2010) defines a sample as a small proportion of a target population selected for
analysis. The study used the Krejcie and Morgan (1970) formula to arrive at the sample
size.
n = N
1+(N-1)e2
Where n= the required sample size
N = is the Target Population (172)
e = accuracy level required. Standard error = 5%
n = 10,000 / 1 + (10,000-1)0.052; n = 385 respondents.

34
The study therefore targeted a total of 385 respondents distributed equally between 4- and
5-star hotels as 193 and 193 respondents, respectively. This is because there is an equal
distribution of 7 hotels each between the four- and five-star hotels.
Convenience sampling method was adopted in the selection of the respondents. According
to Kothari (2010) convenience sampling is a non-probability sampling technique where
subjects are selected because of their convenient accessibility and proximity to the
researcher. In convenience sampling, the first available primary data source is used for the
research without additional requirements. This sampling method involves getting
participants wherever the researcher can find them and typically wherever is convenient.
In convenience sampling no inclusion criteria identified prior to the selection of
subjects. All subjects are invited to participate (Saunders, Lewis & Thornhill, 2012). This
method enables the study to achieve the sample size it targets in a relatively fast and
inexpensive way. This method was adopted to select the customers.
The researcher presented the letter from Strathmore Business School indicating the
ongoing research and get approval from the hotel management staff first before politely
approaching their clients to participate in the questionnaire. The researcher approached the
clients checking out or the ones relaxing at the reception lounge area. The researcher
explained to the hotels clients what the study’s aims to do, how confidentiality was to be
maintained and then sought consent before giving them the questionnaire to fill.
3.5 Data Collection Methods and Instruments
Primary data was collected from respondents using a semi structured questionnaire in
which most questions were closed; however, there were a few open-ended questions to
generate further insights on the quality of service offered by the hotel. The questionnaires
given were self-administered using a fill and wait approach for the respondents who were
customers at the hotel premises at the time of data collection. For example, as they
customers check out when the researcher is at the premises. Research assistants were
trained for the purpose of data collection. The questionnaire was divided into six sections
each following the 5 service quality dimensions yielding the 22 SERVQUAL statements.
The researcher also employed a five-point likert scale on each of the 22 SERQUAL

35
statements (Parasuraman, Zeithaml & Berry, 1990). The sections also included the CSAT
questions to directly measure the effect of each service quality dimension on customer
satisfaction using a five-point likert scale as well.
Some of the advantages of using questionnaires for data collection are that the researcher
had the opportunity to personally introduce the study to the respondents and explain to
them the intentions of the study, and also to clarified to the respondents any issues that
arose during the study.
According to Sekaran (2003) data collection instrument is the means by which information
is obtained from the selected subject under investigation. The study collected primary data
using questionnaires. According to Babbie (2009), questionnaires are used for data
collection because of their simplicity in the administration and scoring of items as well as
data analysis. The questionnaire had seven sections. These include demographic
information, questions on tangibles, reliability, responsiveness, empathy and customer
satisfaction.
3.6 Research Quality
3.6.1 Validity Test
Validity is the degree to which an instrument measures the construct under investigation.
For a data collection instrument to be considered valid, the content selected and included
must be relevant to the need or gap established (Liaw & Goh, 2002) stated that a pilot study
is not compulsory in research design, but is a normal practice before an actual study. There
are different method of measuring validity. Face validity is the degree to which a test seems
to measure what it reports to measure. Construct validity defines how well a test or
experiment measures up to its claims. It refers to the degree to which an assessment
instrument is relevant to, and representative of the targeted construct it is designed to
measure (Liaw & Goh, 2002) stated that a pilot study is not compulsory in research design,
but it is a normal practice before an actual study. In this study content validity was used to
determine the validity of the research instrument. Before the actual study, the instrument
was discussed with lecturers in the field under study. The feedback from the lecturers and
the experts assisted in modifying the instrument prior to data collection.
36
3.6.2 Reliability Test
According to Mugenda a (2008) reliability is a measure of the degree to which research
instruments yields consistent results or data after repeated Trials. The test-retest method
was adopted in the study. Reliability of the questionnaire was evaluated using Cronbach’s
Alpha which measures the internal consistency. The value of the alpha coefficient ranges
from 0-1 and may be used to describe the reliability of factors extracted from dichotomous
and or multi-point formatted questionnaires or scales. A higher value shows a more reliable
generated scale. Cooper and Schindler (2008) have indicated 0.7 to be an acceptable
reliability coefficient therefore the study used 0.7 as the cutoff point. The reliability results
are presented in chapter four, section 4.3.
3.7 Data Analysis
Once all the questionnaires were received from the field, the researcher embarked on data
editing, coding and analysis.
When it comes to data editing, the researcher checked for completeness, accuracy,
consistency of data by arranging the data in a systematic manner. The filled questionnaires
were checked for completeness at two levels where the data collectors verified that
questionnaires were complete before they are taken to the researcher to do the final
verification. This was done to ensure that any anomalies detected were corrected
immediately before the questionnaires were collected from the respondent. Spelling and
grammatical mistakes were also corrected. With editing the data, the researcher made sure
that all responses were very clear to understand. Bringing clarity is important otherwise the
researcher can draw wrong inferences from the data.
Data coding refers to the process of transforming collected information or observations to
a set of meaningful, cohesive categories. It is a process of summarizing and re-presenting
data in order to provide a systematic account of the recorded or observed phenomenon. The
questionnaire had both closed and open questions. The responses from the closed questions
were assigned numerical numbers which were entered into the SPSS software in
preparation for analysis. The researcher generated themes for the responses from the open-
ended questions and grouped the responses that are similar.

37
Data was entered numerically into an SPSS software data matrix and this process was
automated in a computer-assisted system. The researcher imported an ASCII file and
named the variables/column headings or, creates variables/column headings and then data
in each case was entered.
3.7.1 Data Analysis and Presentation
Data analysis was guided by the research objectives presented. The data collected from the
field was analyzed using statistical package for social sciences (SPSS) 23 program. All
questionnaires received were referenced and items in the questionnaire coded to facilitate
data entry. Quantitative data collected were analysed using descriptive and inferential
statistics using SPSS (version 23). Descriptive statistical analysis was performed by
computing percentages of variations in response as well as describing and interpreting the
data in line with the study objectives and assumptions to communicate research findings.
Descriptive statistics were presented through percentages, means, standard deviations and
frequencies. The information was displayed by use of bar charts, graphs and pie charts.
Inferential statistics included performing correlation and regression analysis to examine
the effect of service quality on customer satisfaction among hotels in Nairobi County.
Pearson R correlation was used to measure strength and the direction of linear relationship
between variables. Correlation value of 0 showed that there is no relationship between the
dependent and the independent variables. On the other hand, a correlation of ±1.0 means
that there is a perfect positive or negative relationship (Hair et al., 2010). The values were
interpreted between 0 (no relationship) and 1.0 (perfect relationship). The relationship was
considered weak when r = ±0.1 to ±0.29, while the relationship was considered moderate
when r = ±0.3 to ±0.49, and when r= ±0.5 and above, the relationship was considered strong.
The study adopted multiple regression models at 5% level of significance to examine direct
and indirect relationship between the study variables. The regression model was;
Y = β0+ β1X1+ β2X2+ β3X3+ β4X4 + ε,
Where; Y= Customer satisfaction, β0= constant (coefficient of intercept), X1= Tangibles;
X2= Reliability; X3= Responsiveness; X4= Empathy; ε = error term;
38
This study used regression analysis. The data was however checked for violations of
assumptions of normality and linearity, multicollinearity, heteroscedasticity and
independence.
3.8. Ethical Considerations
The researcher sought for and was granted ethical approval for the study by the Strathmore
Ethics Review Board. A research permit was also obtained from National Commission for
Science Technology and Innovation (NACOSTI) and this granted permission to collect
data. An introduction letter was obtained from Strathmore University that helped in
introducing the study to the respondents. The respondents who were willing to participate
in the study were provided with a consent form to sign that clearly stated that participation
in the study is purely voluntary and no one was coerced to take part. To ensure anonymity
the name of the respondents did not appear anywhere in the research instrument. The
respondents were also informed that the study is purely academic and that their information
was to be kept confidential. The researcher encouraged the respondents to respond to the
questionnaire truthfully, honestly and in an unbiased fashion without any fear that their
responses would put them in any physical or psychological harm.
3.9. Chapter Summary
This chapter looked at the methodology of research that the researcher undertook. The
researcher used an explanatory research design with the 10,000clients from the fourteen 4
and 5 star hotels in Nairobi for which a sample size of 385 clients was obtained using the
Krejcie and Morgan (1970) formula. Convenience sampling was employed by the
researcher to select the respondents. Primary data was collected from the respondents using
a semi structured questionnaire using a fill and wait approach. The data collected from the
field was analyzed using statistical package for social sciences (SPSS) 23 program.

39
CHAPTER 4
DATA ANALYSIS, PRESENTATION AND INTERPRETATION
4.1 Introduction
Data analysis, presentation, interpretation, and discussion of findings obtained from data
collection are discussed in this chapter. This chapter also presents background information
of the respondents and findings of the analysis based on study objectives. To discuss the
study findings descriptive and inferential statistics were applied.
4.2 Response Rate
The study selected a sample of 385 respondents from 4- and 5-star hotels. All respondents
selected for the study were issued with questionnaires, but the researcher was able to
receive back 320 questionnaires having been dully filled. Returned questionnaires
translated to a response rate of 83.12%. According to Mugenda and Mugenda (2003), a
response rate of 50% and above is adequate and can be used for analysis and reporting, that
of 60% and above is good while that of 70% and above is excellent. Therefore, this study
had an excellent response and was therefore was used for analysis and reporting.
Table 4.1: Response Rate
Questionnaires Frequency Percent
Returned 320 83.12
Un-returned 65 16.88
Total 385 100.00
Source: Primary Data (2019)
4.3 Reliability Analysis
The study evaluated reliability of the questionnaire using Cronbach’s Alpha which
measures the internal consistency. A higher value showed a more reliable generated scale.
Reliability of each variable was evaluated, and the results obtained were as presented in
Table 4.2.

40
Table 4.2: Reliability Analysis
Scale Cronbach's Alpha Number of Items
Tangibility of Services 0.793 9
Reliability of Service 0.764 6
Responsiveness of Services 0.759 8
Assurance of Service 0.783 8
Empathy of Services 0.725 7
Customer Satisfaction 0.774 7
Source: Primary Data (2019)
From the findings presented in table 4.2, all variables had Cronbach alpha value of 0.7 and
above. Specifically, tangibility of services had alpha value of 0.793, reliability of service
had Cronbach alpha of 0.764, responsiveness of services had alpha of 0.759, assurance of
service had alpha value of 0.783, empathy of services alpha value of 0.725, and the
dependent variable (customer satisfaction) had Cronbach alpha value of 0.774. Cooper and
Schindler (2008) indicated 0.7 to be an acceptable reliability coefficient therefore the study
used 0.7 as the cutoff point. Based on the study findings, it is evident that all variables were
reliable since they all met the set threshold value of 0.7 and above and therefore, all items
were used for analysis and reporting.
4.4 Demographic Information
In this section, the study presents the general information of respondents. The study sought
to determine the gender, age, level of education, marital status, length of time visiting the
hotel and their reasons for visiting the hotel. This guided the researcher in determining the
nature of customers visiting the 4- and 5-star hotels in Nairobi County. The results obtained
were as presented in subsections below.
4.4.1 Gender of Respondents
The study sought to determine the gender distribution of respondents used in the study.
Determining the gender of respondents helped the researcher to determine the nature of
respondents visiting the selected hotels based on their gender. It also informed on whether

41
the study was biased when selecting respondents for the study. Table 4.3 presents the
results obtained.
Table 4.3: Gender of Respondents
Gender Frequency Percent
Male 191 59.10
Female 129 40.90
Total 320 100.0
Source: Primary Data (2019)
Results presented show that 59.1% of the respondents were male while 40.9% were female.
Based on these findings, the study was not gender biased since respondents of both genders
were used in the study. It is also an indication that 4- and 5-star hotels in Nairobi County
receive customers of both genders.
4.4.2 Age of the Respondents
The study sought to determine the age distribution of respondents selected for the study.
The results provided were analysed and the results obtained were as presented in Table 4.4
Table 4.4: Age of the Respondents
Category Frequency Percent
Below 25 years 45 14.0
26-40 years 108 33.7
41-50 years 84 26.2
51-60 years 56 17.4
Above 61 years 27 8.7
Total 320 100.0
Source: Primary Data (2019)
From the findings, 33.7% of the respondents indicated that they were aged 26 to 40 years,
26.2% were aged 41 to 50 years, 17.4% were of ages 51 to 60, 14% were aged below 25
years, and 8.7% were aged above 61 years. These findings show that customers of 4- and
5-star hotels in Nairobi County are of varied ages and that the study was not biased based

42
on age since respondents used in the study were of varied ages. The results also show that
most (33.7%) of the customers in four- and five-star hotels in Nairobi County are aged
between 26 and 40 years. This implies that most of the customers in four- and five-star
hotels are adults.
4.4.3 Respondents Highest Level of Education
Respondents were asked to indicate their highest level of education. This guided the
researcher in determining how learned customers visiting the four- and five-star hotels in
Nairobi County were. Responses provided were analysed and the findings were as
presented in Table 4.5.
Table 4.5: Respondents Highest Level of education
Category Frequency Percent
Certificate 5 1.7
Diploma 13 4.0
Undergraduate 178 55.7
Postgraduate 124 38.6
Total 320 100.0
Source: Primary Data (2019)
From the findings presented, 55.7% of the respondents indicated undergraduate as their
highest level of education, 38.6% indicated post graduate, 4% indicated diploma while
1.7% had certificate. Based on these results, it is evident that majority of customers of four-
and five-star hotels in Nairobi County, Kenya have high levels of education. From the
results obtained, it is only 1.7% and 4% that had certificates and diploma, respectively.
This implies that most respondents were undergraduates.
4.4.4 Respondents Marital Status
Respondents were asked to indicate their marital status. The results obtained were as
presented in Table 4.6

43
Table 4.6: Respondents Marital Status
Category Frequency Percent
Single 51 16.0
Married 175 54.7
Divorced 36 11.1
Separated 58 18.2
Total 320 100.0
Source: Primary Data (2019)
The findings presented in Figure 4.4 and Table 4.6 show that 54.7% of the respondents
were married, 18.2% were separated, 16% were single, and 11.1% were divorced. Based
on these findings it is evident that the four- and five-star hotels in Nairobi County receive
customers of varied marital status. Majority (54.7%) of customers are married. This implies
most of the customers attending four- and five-star hotels are married.
4.4.5 Respondents Frequency Visiting the Hotel
Respondents were asked to indicate how frequently they usually visit the hotel. Their
results were analysed and the findings were as presented in Table 4.7.
Table 4.7: Respondents Frequency Visiting the Hotel
Category Frequency Percent
Once a year 39 12.2
Once every six months 100 31.1
Once every four months 117 36.5
once every month 64 20.3
Total 320 100.0
Source: Primary Data (2019)
From the findings, 36.5% of the respondents indicated that they visited the hotel once every
four months, 31.1% visited once every six months, 20.3% visited once a month and 12.2%
visited once a year. Based on these findings, the frequency in which respondents visited
the hotel varied. Most (36.5%) of the customers that participated in the study visited the

44
hotel twice a year that is once every six months. This implies that most customers visit
five-star hotels twice a year.
4.4.6 Respondents Reasons for Visiting the Hotel
Respondents were asked to indicate the reasons why they visited the hotel. The results
obtained were as presented in Table 4.8.
Table 4.8: Respondents Reasons for Visiting the Hotel
Reason Frequency Percent
Visually appealing facilities and up to date equipment 295 92.2
Great service delivery by staff 280 87.5
Great location 247 77.2
Individualized attention by staff 260 81.3
Hotel is clean 301 94.1
Source: Primary Data (2019)
From the findings, 301(94.1%) of the respondents indicated that they visit the hotel because
it is clean, 295(92.2%) indicated it is because it has visually appealing facilities and up to
date equipment, 280(87.5%) indicated it is because it has great service delivery by staff,
260(81.3%) indicated it is because of its individualized attention by staff while 247(77.2%)
indicated it is because of the great location. Based on these findings, it is evident that
cleanliness is the main concern of customers followed by how appealing and up to date the
hotel equipment are, service delivery by staff and staffs individualized attention.
4.5 Descriptive Statistics
Respondents were asked to indicate the level to which they agreed or disagreed with some
statements relating with study variables. They used a 5-poing Likert scale where 1-
Strongly disagree, 2- Disagree, 3- Neutral, 4- Agree, and 5- Strongly agree. The results
were interpreted using means and standard deviations where a mean (M) value of 0.5-1.4
was interpreted as strongly disagree, 1.5-2.4 as disagree, 2.5-3.4 as moderate, 3.5-4.4 as
agree and 4.5-5 as strongly agree. On the other hand, the standard deviation (SD) values
showed the amount of variation in respondents’ responses. A standard deviation value
greater than two means that the respondents had differing opinions while a value less than
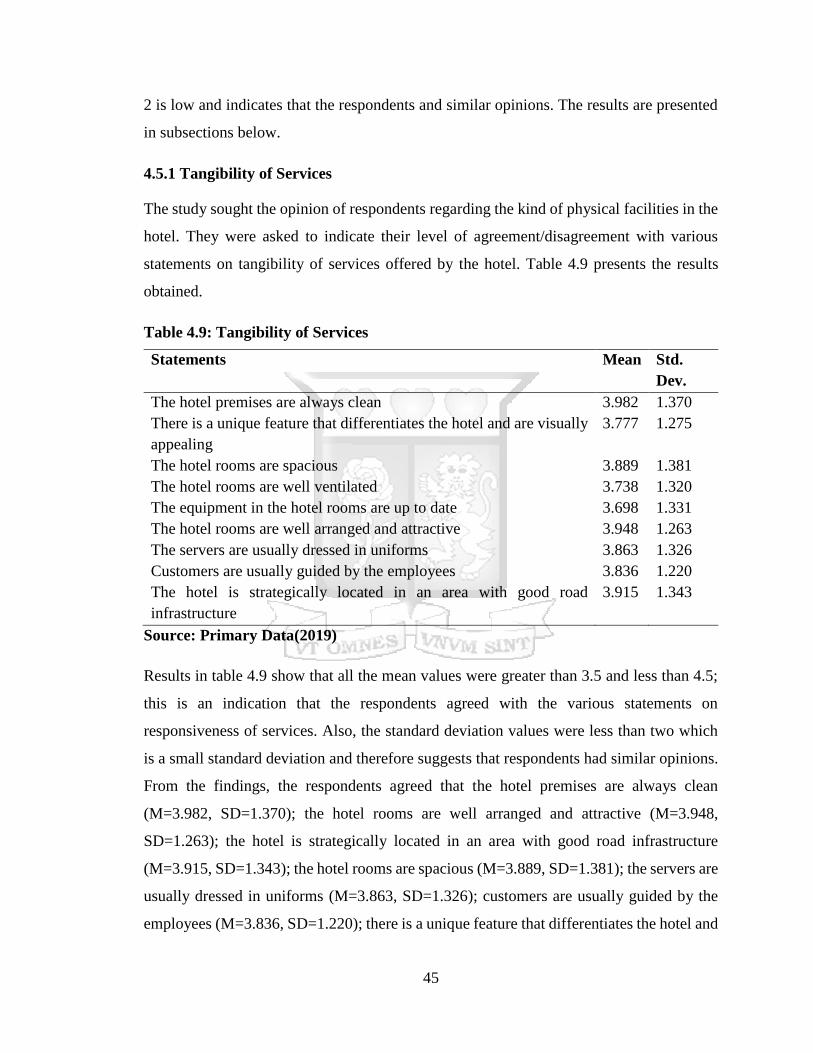
45
2 is low and indicates that the respondents and similar opinions. The results are presented
in subsections below.
4.5.1 Tangibility of Services
The study sought the opinion of respondents regarding the kind of physical facilities in the
hotel. They were asked to indicate their level of agreement/disagreement with various
statements on tangibility of services offered by the hotel. Table 4.9 presents the results
obtained.
Table 4.9: Tangibility of Services
Statements Mean Std.
Dev.
The hotel premises are always clean 3.982 1.370
There is a unique feature that differentiates the hotel and are visually
appealing
3.777 1.275
The hotel rooms are spacious 3.889 1.381
The hotel rooms are well ventilated 3.738 1.320
The equipment in the hotel rooms are up to date 3.698 1.331
The hotel rooms are well arranged and attractive 3.948 1.263
The servers are usually dressed in uniforms 3.863 1.326
Customers are usually guided by the employees 3.836 1.220
The hotel is strategically located in an area with good road
infrastructure
3.915 1.343
Source: Primary Data(2019)
Results in table 4.9 show that all the mean values were greater than 3.5 and less than 4.5;
this is an indication that the respondents agreed with the various statements on
responsiveness of services. Also, the standard deviation values were less than two which
is a small standard deviation and therefore suggests that respondents had similar opinions.
From the findings, the respondents agreed that the hotel premises are always clean
(M=3.982, SD=1.370); the hotel rooms are well arranged and attractive (M=3.948,
SD=1.263); the hotel is strategically located in an area with good road infrastructure
(M=3.915, SD=1.343); the hotel rooms are spacious (M=3.889, SD=1.381); the servers are
usually dressed in uniforms (M=3.863, SD=1.326); customers are usually guided by the
employees (M=3.836, SD=1.220); there is a unique feature that differentiates the hotel and

46
are visually appealing (M=3.777, SD=1.275); the hotel rooms are well ventilated
(M=3.738, SD=1.320); and the equipment in the hotel rooms are up to date (M=3.698,
SD=1.331). Based on these findings, it is evident that the four and five star hotels in Nairobi
County are always clean, and have unique feature that differentiates the hotel and are
visually appealing. Aside from that, the hotels have specious rooms which are well
ventilated and are equipped with up to date equipment. The findings also showed that the
arrangement of the hotels is attractive and the servers/workers in the hotels are dressed in
uniforms. Employees also offer customers of the hotel with help and this includes guiding
them. The study also found that the hotels are located in areas with good road infrastructure.
4.5.2 Reliability of Service
In this section, respondents were asked their opinion on how reliable the services offered
by the hotel are. Respondents indicated their level of agreement on various statement about
reliability of services offered by the hotel. The results obtained were analyzed and Table
4.10 presents the findings.
Table 4.10: Reliability of Service
Statements Mean Std.
Dev.
Customers complaints and requests are handled fast 3.961 1.476
Pricing is similar to all customers 3.856 1.525
The hotel personnel were concerned, reassuring and helpful when an
issue was brought to their attention
3.994 1.476
Services of the hotel delivered within the promised time frame/at the
right time
3.955 1.546
The prices of the extra services at the hotel are reasonable 3.836 1.426
The hotel had an accurate record and costing of the services requested
for
3.994 1.343
Source: Primary Data (2019)
Results in table 4.10 show that all the mean values were greater than 3.5 and less than 4.5;
this is an indication that the respondents agreed with the various statements on
responsiveness of services. Also, the standard deviation values were less than two which
is a small standard deviation and therefore suggests that respondents had similar opinions.
Specifically, the respondents were in agreement that the hotel personnel were concerned,

47
reassuring and helpful when an issue was brought to their attention (M=3.994, SD=1.476);
the hotel had an accurate record and costing of the services requested for (M=3.994,
SD=1.343); customers complaints and requests are handled fast (M=3.961, SD=1.476),
services of the hotel are delivered within the promised time frame/at the right time
(M=3.955, SD=1.546); pricing is similar to all customers (M=3.856, SD=1.525); and the
prices of the extra services at the hotel are reasonable (M=3.836, SD=1.426). These
findings suggest that customers get good services since their complaints and requests get
to be attended to fast. There is no discrimination or favors in pricing and the prices of the
extra services at the hotel are reasonable. Also the personnel are concerned, reassuring and
helpful and therefore contribute to the services of the hotel being delivered within the
promised time frame/at the right time. In addition, there are accurate record and costing of
the services.
4.5.3 Responsiveness of Services
Respondents were asked to indicate their opinion regarding how responsive the hotel and
hotel staff were to their needs, requests and issues. Respondents gave their level of
agreement/disagreement with various statements about responsiveness and the results
obtained were as presented in Table 4.11.
Table 4.11: Responsiveness of Services
Statements Mean Std.
Dev.
Employees were helpful in informing customer when service will
occur
3.830 1.441
Customers problems are solved immediately 3.988 1.475
Customers order are delivered on time 3.961 1.674
Customers get help when needed 4.007 1.251
The employees are friendly 3.817 1.142
Important information is shared to the customers 3.902 1.235
In case of inconveniences apologies are made 3.764 1.168
Employees assist guests and provide prompt service. 3.975 1.169
Source: Primary Data (2019)
Results in table 4.11 show that all the mean values were greater than 3.5 and less than 4.5;
this is an indication that the respondents agreed with the various statements on

48
responsiveness of services. Also, the standard deviation values were less than two which
is a small standard deviation and therefore suggests that respondents had similar opinions.
From the findings, the respondents agreed that customers get help when needed (M=4.00,
SD=1.251); customers problems are solved immediately (M=3.988; SD=1.475);
employees assist guests and provide prompt service (M=3.975; SD=1.169); customers
order are delivered on time (M=3.961; SD=1.674); important information is shared to the
customers (M=3.902; SD=1.235); employees were helpful in informing customer when
service will occur (M=3.830; SD=1.441); the employees are friendly (M=3.817;
SD=1.142); and that in case of inconveniences apologies are made (M=3.764; SD=1.168).
Based on these findings it is evident that there is responsiveness of service among the four
and five star hotels in Nairobi County. This is because, the study found that employees
were friendly, and helpful in informing customer when service will occur, and assist guests
and provide prompt service. Also, customers problems are solved immediately, their orders
are delivered on time and in case of inconveniences apologies are made.
4.5.4 Assurance of Service
Respondents were requested to give their opinion on regarding how assured they are of the
services offered by the hotel and hotel staff. Respondents indicated their level of
agreement/disagreement with statement about the assurance of service by the hotel and
hotel employees and the results obtained were as presented in Table 4.12.
Table 4.12: Assurance of Service
Statements Mean Std.
Dev.
Customers information is kept confidential 3.902 1.235
Employees are well trained on customer service 3.830 1.300
Customers security is paramount 3.836 1.207
Hotels employees have the customer's best interest at heart 3.902 1.345
The customer care employees are welcoming and polite 3.955 1.199
Hotels employees deal with guests in a caring fashion 3.961 1.149
Employees are polite when answering my questions 3.836 1.234
Employees have essential resources and support to execute customer
requests well
3.803 1.248
Source: Primary Data(2019)

49
Results in table 4.12 show that all the mean values were greater than 3.5 and less than 4.5;
this is an indication that the respondents agreed with the various statements on
responsiveness of services. Also, the standard deviation values were less than two which
is a small standard deviation and therefore suggests that respondents had similar opinions.
Specifically, the respondents agreed that hotels employees deal with guests in a caring
fashion (M=3.961, SD=1.149); the customer care employees are welcoming and polite
(M=3.955, SD=1.199); customers information is kept confidential (M=3.902, SD=1.235);
hotels employees have the customer's best interest at heart (M=3.902, SD=1.345);
customers security is paramount (M=3.836, SD=1.207); employees are polite when
answering their questions (M=3.836, SD=1.234); employees are well trained on customer
service (M=3.830, SD=1.300); and that employees have essential resources and support to
execute customer requests well (M=3.803; SD=1.248). These findings show that there are
high levels of service assurance in four and five star hotels in Nairobi County. This is
because confidentiality of customer information is observed, employees of the hotel are
trained on customer care and the hotels prioritize on the security of its customers. Also
hotel employees have the customer's best interest at heart which allows them to be
welcoming and polite, and their dealing with customers is in a caring fashion. This is
evident from the way employees answer questions from their customers; it is in a polite
manner. To ensure that the requests of customers are executed well, the hotels have
provided their employees with the essential resources.
4.5.5 Empathy of Services
Respondents were asked to give their opinion regarding the empathy expressed by the hotel
and hotel staff towards their needs, requests and issues. Respondents gave their level of
agreement/disagreement with various statements about empathy expressed by the hotel’s
employees. The results obtained were as presented in Table 4.13.

50
Table 4.13: Empathy of Services
Statements Mean Std.
Dev.
Staff listens to customers’ issues and/or requests carefully 3.836 1.313
The staff is interested in what the guest has to say 3.896 1.210
Employees’ give individualized attention to customer is addressing
them
4.021 1.265
Customer feels that employees adequately listened to their issues and
requests
3.810 1.142
Guests are allowed to get through what they are saying without
interrupting and changing the subject
3.902 1.235
Employees act towards the benefit of the customers 3.738 1.168
Opening times of the company are suitable 3.988 1.182
Source: Primary Data (2019)
Results in table 4.13 show that all the mean values ranged between 3.5 and 4.5 this is an
indication that the respondents agreed with the various statements on responsiveness of
services. Also, the standard deviation values were less than two which is a small standard
deviation and therefore suggests that respondents had similar opinions. The study
specifically established that employees’ give individualized attention to customer is
addressing them (M=4.021, SD=1.265); opening times of the company are suitable
(M=3.988, SD=1.182); guests are allowed to get through what they are saying without
interrupting and changing the subject (M=3.902, SD=1.235); the staff is interested in what
the guest has to say (M=3.896, SD=1.210); staff listens to customers’ issues and/or requests
carefully (M=3.836, SD=1.313); customer feels that employees adequately listened to their
issues and requests (M=3.810, SD=1.142); and employees act towards the benefit of the
customers (M=3.738, SD=1.168).
Results show that there is empathy of service among the four- and five-star hotels in
Nairobi County. This is because the study found that staff listens to customers’ issues
and/or requests carefully and this shows that they are interested in what the guest has to
say. This is the form of individualized attention the customers of these hotels get from
employees and therefore, the customers feels that employees adequately listened to their
issues and requests. When guests are expressing themselves, employees have been trained

51
to listen to them without interrupting. All the actions of employees are towards benefiting
the customer. Other indication of empathy of service is suitable opening hours.
4.5.6 Customer Satisfaction
Respondents were asked to indicate their opinion on how satisfied they were by the hotel
and the services offered by the hotel. Respondents indicated their level of
agreement/disagreement regarding how satisfied they are with the services offered by the
hotel. Table 4.14 presents the findings.
Table 4.14: Customer Satisfaction
Statements Mean Std.
Dev.
I will recommend the hotel to your family and friends 3.902 1.235
The hotel met my expectations 3.836 1.313
I intend to return to the hotel the next time I travel 3.850 1.220
The hotel’s advertised image and brand was similar to what I
experienced
3.909 1.359
I would like to receive information on the hotel’s new service or
services’ discounts
3.863 1.326
The hotel made me feel valued as a customer 3.836 1.220
I am highly satisfied with the services offered by the hotel 3.836 1.426
Source: Primary Data (2019)
Results in table 4.14 show that all the mean values ranged between 3.5 and 4.5 this is an
indication that the respondents agreed with the various statements on responsiveness of
services. Also, the standard deviation values were less than two which is a small standard
deviation and therefore suggests that respondents had similar opinions. The findings
specifically showed that the respondents agreed that the hotel’s advertised image and brand
was similar to what they experienced (M=3.909, SD=1.359); they will recommend the
hotel to their family and friends (M=3.902, SD=1.235); they would like to receive
information on the hotel’s new service or services’ discounts (M=3.863, SD=1.326); they
intend to return to the hotel the next time they travel (M=3.850, SD=1.220); the hotel met
their expectations (M=3.836, SD=1.313); the hotel made them feel valued as a customer
(M=3.836, SD=1.220); and that they are highly satisfied with the services offered by the
hotel (M=3.836, SD=1.426).
52
These findings show that customers of four- and five-star hotels in Nairobi County were
satisfied with the services they received. This is because they indicated that they would
recommend the hotel to their family and friends, and that the next time they visit they will
return to the hotel. Also, the hotel’s advertised image and brand was similar to what they
experienced and therefore, customers found that the hotel met their expectations.
Customers also felt satisfied with the services they received from the hotel and felt valued
as customers. Because of this customers would like to receive information on the hotel’s
new service or services’ discounts.
4.6 Inferential Statistics
Inferential statistics included performing correlation and regression analysis to examine
the effect of service quality on customer satisfaction among hotels in Nairobi County.
4.6.1 Correlation Analysis
Pearson R correlation was used to measure strength and the direction of linear relationship
between variables. The relationship was considered weak when r = ±0.1 to ±0.29, while the
relationship was considered moderate when r = ±0.3 to ±0.49, and when r= ±0.5 and above,
the relationship was considered strong. Table 4.15 presents the results obtained.

53
Table 4.15: Correlation Analysis
Cu
stom
er
Sati
sfact
ion
Tan
gib
ilit
y
Rel
iab
ilit
y
Res
pon
siven
ess
Ass
ura
nce
Em
path
y
Customer Satisfaction Pearson Correlation 1
Sig. (2-tailed)
N 320
Tangibility Pearson Correlation .653** 1
Sig. (2-tailed) .003
N 320 320
Reliability Pearson Correlation 724** .453* 1
Sig. (2-tailed) .000 .040
N 320 320 320
Responsiveness Pearson Correlation .539** .339** .051 1
Sig. (2-tailed) .001 .000 .524
N 320 320 320 320
Assurance Pearson Correlation .619** .374** .119 .565** 1
Sig. (2-tailed) .004 .000 .134 .000
N 320 320 320 320 320
Empathy Pearson Correlation .568** .339** .068 .640** .286** 1
Sig. (2-tailed) .004 .000 .394 .000 .000
N 320 320 320 320 320 320
**. Correlation is significant at the 0.01 level (2-tailed).
Source: Primary Data (2019)
From the findings, it is evident that the relationship between the dependent and the
independent variables are strong. The findings show that tangibility has a strong positive
correlation with customer satisfaction (r=0.653, p-value=0.003); reliability and customer
satisfaction are seen to be strongly and positively correlated (r=0.724, p-value=0.000);
responsiveness had a strong positive relationship with customer satisfaction (r=0.539, p-
value=0.001); assurance and customer satisfaction were seen to be positively and
significantly related (r=0.619, p-value=0.004); and lastly, empathy had a strong positive
correlation with customer satisfaction (r=0.568, p-value=0.004). These findings suggest
that tangibility, reliability, responsiveness, assurance, and empathy all have direct
relationship with customer satisfaction among hotels in Nairobi County.

54
4.6.2 Multiple Regression Analysis
The study adopted multiple regression models at 5% level of significance to examine direct
and indirect relationship between the study variables. The findings were presented in three
tables discussed in subsections below.
4.6.2.1 Model Summary
Model summary is used to show the mount of variation in dependent variable that can be
explained by changes in the independent variables. In this study, model summary was used
to show the amount of variation in customer satisfaction as a result of changes in tangibility,
reliability, responsiveness, assurance, and empathy. Table 4.16 presents the results.
Table 4.16: Model Summary
Model R R Square Adjusted R Square Std. Error of the Estimate
1 .805a 0.648 0.637 .46503
a. Predictors: (Constant), tangibility, reliability, responsiveness, assurance, empathy
Source: Primary Data (2019)
From the findings, the value of R square was 0.648 which suggests that 64.8% variation in
customer satisfaction can be explained by tangibility, reliability, responsiveness,
assurance, and empathy. The remaining 35.2% suggest that there are other factors that can
explain variation in customer satisfaction among hotels in Kenya. The findings further
show that the variables under investigation are strongly and positively related as indicated
by correlation coefficient (R) value of 0.805.
4.6.2.2 Analysis of Variance
Analysis of variance is used to determine how fit the model developed is to the data. It tests
the significance of the model. In this study the significance of the model was tested at 5%
level of significance.

55
Table 4.17: ANOVA
Model Sum of Squares df Mean Square F Sig.
1
Regression 604.029 5 120.806 6.060 .000b
Residual 3070.214 154 19.936
Total 3674.244 159
a. Dependent Variable: Customer Satisfaction
b. Predictors: (Constant), tangibility, reliability, responsiveness, assurance, empathy
Source: Primary Data (2019)
The findings from ANOVA analysis showed that the population parameters had a p-value
of 0.000; an indication that the model was significant. This suggests that the data was
suitable for making conclusion on the population under investigation because the p-value
was less than 0.05. The F critical, obtained from the f-distribution table (2.273) was less
than F calculated (6.060). This shows that tangibility, reliability, responsiveness,
assurance, and empathy significantly influence customer satisfaction among hotels in
Kenya.
4.6.2.3 Beta Coefficients of the Study Variables
The regression model was;
Y = β0+ β1X1+ β2X2+ β3X3+ β4X4 + ε,
Where; Y= Customer satisfaction, β0= constant (coefficient of intercept), X1= Tangibles;
X2= Reliability; X3= Responsiveness; X4= Assurance; X5= Empathy; ε = error term;

56
Table 4.18: Coefficients
Model Unstandardized
Coefficients
Standardized
Coefficients
T Sig.
B Std. Error Beta
1
(Constant) 1.730 0.197 8.782 0.000
Tangibility 0.153 0.038 0.176 4.026 0.028
Reliability 0.291 0.036 0.377 8.083 0.004
Responsiveness 0.140 0.029 0.107 4.828 0.030
Assurance 0.340 0.038 0.255 8.947 0.021
Empathy 0.520 0.055 0.492 9.455 0.002
a. Dependent Variable: Customer Satisfaction
Source: Primary Data (2019)
From the findings, the following regression model was fitted;
Y = 1.730 + 0.153X1+ 0.291X2+ 0.140X3+ 0.340X4 + 0.520X5 + ε,
From the above equation, it is evident that when the variables; tangibility, reliability,
responsiveness, assurance, and empathy are held to a constant zero, customer satisfaction
will be at a constant value of 1.730.
The study also found that tangibility has a positive influence on customer satisfaction
(β=0.153). The study also found that tangibility had p-value (0.028) less than selected level
of significance (0.05) an indication that the influence of tangibility on customer satisfaction
is significant. Therefore, tangibility can be said to have a positive significant influence on
customer satisfaction.
The first research question was; What is the effect of tangibility on customer satisfaction
among hotels in Nairobi County? Based on the research findings, tangibility positively and
significantly influences customer satisfaction among hotels in Nairobi County.
The second research question was; What is the effect of reliability on customer satisfaction
among hotels in Nairobi County? From the results presented in table 4.13, reliability had a
positive influence on customer satisfaction (β=0.291). The findings further showed that the
influence of reliability on customer satisfaction was significant since the p-value obtained

57
(0.004) was less than the selected level of significance (0.05). Therefore, reliability can be
said to have a positive significant influence on customer satisfaction.
The third research question was; what is the effect of responsiveness on customer
satisfaction among hotels in Nairobi County? From the findings, responsiveness was found
to have positive influence on customer satisfaction (β=0.140). Further, the influence of
responsiveness on customer satisfaction was found to be significant (p=0.030<0.05). Based
on these findings, responsiveness can be said to have positive significant influence on
customer satisfaction in Nairobi County.
The fourth research question was; what is the effect of assurance on customer satisfaction
among in Nairobi County? From the findings, the study established that assurance has a
positive influence on customer satisfaction among hotels in Kenya (β=0.340). The study
also found that the influence of assurance on customer satisfaction was significant since
the p-value obtained (0.021) was less than the selected level of significance (0.05).
Therefore, based on the findings, it can be deduced that assurance has a positive significant
influence on customer satisfaction among hotels in Nairobi County.
Lastly, the study sought to answer; what is the effect of empathy on customer satisfaction
among hotels in Nairobi County? From the findings, empathy is seen to have positive
influence on customer satisfaction (β=0.520). Further, the influence of empathy on
customer satisfaction is seen to be significant since the p-value obtained (0.002) was less
than the selected level of significance (0.05). Therefore, from these study findings, it is
seen that empathy has a positive significant influence on customer satisfaction among
hotels in Nairobi County.
4.7. Chapter Summary
This chapter analyzed, presented, interpreted the data collected from the respondents by
the researcher. Findings obtained from data collections were discussed in this chapter based
on study objectives. Descriptive and inferential statistics were applied by the researcher to
discuss the study findings

58
CHAPTER FIVE
SUMMARY, CONCLUSION AND RECOMMENDATIONS
5.1 Introduction
Summary of the findings, conclusions and recommendations made there-to are presented
in this chapter. Conclusions and recommendations made, addressed the research
objectives.
5.2 Summary of the Findings
In this section, the study presents summary of findings for each study objective. The
summary is presented based on the specific objectives of the study which were: to
determine the effects of tangibility on customer satisfaction among hotels in Nairobi
County; to assess the effects of reliability on customer satisfaction among hotels in Nairobi
County; to determine the effects of responsiveness on customer satisfaction among in
Nairobi County; to determine the effects of assurance on customer satisfaction among
hotels in Nairobi County; and to establish the effects of empathy on customer satisfaction
among hotels in Nairobi County.
5.2.1 Tangibility of Services
The study found that the four- and five-star hotels in Nairobi County are always clean and
have unique feature that differentiates the hotel and are visually appealing. Aside from that,
the hotels have specious rooms which are well ventilated and are equipped with up to date
equipment. The findings also showed that the arrangement of the hotels is attractive and
the servers/workers in the hotels are dressed in uniforms. Employees also offer customers
of the hotel with help and this includes guiding them. The study also found that the hotels
are located in areas with good road infrastructure. The study findings agree with the
findings of Lee, Lee and Dewald (2016) who carried a study on measuring the customers’
perception of tangible service quality in the restaurant industry using five dimensions of
tangible service attributes: presentation value, table aesthetics, sensory perceptions,
hygiene purity, and vehicle convenience and found a statistically significant causal
relationship between tangible service factors and the diners’ satisfaction exists within the

59
upscale dining segment. The study disagrees with the findings of Alsaqre (2011) who noted
that only intangible factors of empathy and assurance had their significant influence on
customers’ overall perception of service quality.
5.2.2 Reliability of Service
The study found that customers get good services since their complaints and requests get
to be attended to fast. There is no discrimination or favors in pricing and the prices of the
extra services at the hotel are reasonable. Also, the personnel are concerned, reassuring and
helpful and therefore contribute to the services of the hotel being delivered within the
promised time frame/at the right time. In addition, there are accurate record and costing of
the services. The study findings agree with the findings of Omar (2015) that there is a very
strong relationship between quality of service (Reliability) and customer satisfaction; on
the basis of the conclusion made, Reliability of business was representing the ability of the
web site to fulfill orders correctly, deliver promptly, and keep personal information secure.
The study disagrees with the findings of Alsaqre (2011) who noted that only intangible
factors of empathy and assurance had their significant influence on customers’ overall
perception of service quality.
5.2.3 Responsiveness of Services
The study found that there is responsiveness of service among the four- and five-star hotels
in Nairobi County. This is because, the study found that employees were friendly, and
helpful in informing customer when service will occur, and assist guests and provide
prompt service. Also, customers problems are solved immediately, their orders are
delivered on time and in case of inconveniences apologies are made. These study findings
agree with Pandey and Devasagayam (2010) who provided empirical evidence suggesting
that responsiveness to customer enquiries and complaints might be a strong driver of
customer satisfaction, irrespective of the outcome of the resolution process. Their study
also found that responsiveness supersedes a positive outcome in service provider-customer
conflict resolution which concurs with the findings of current study. The study disagrees
with the findings of Alsaqre (2011) who noted that only intangible factors of empathy and
assurance had their significant influence on customers’ overall perception of service
quality.

60
5.2.4 Assurance of Service
The study found that there are high levels of service assurance in four- and five-star hotels
in Nairobi County. This is because confidentiality of customer information is observed,
employees of the hotel are trained on customer care and the hotels prioritize on the security
of its customers. Also, hotel employees have the customer's best interest at heart which
allows them to be welcoming and polite, and their dealing with customers is in a caring
fashion. This is evident from the way employees answer questions from their customers; it
is in a polite manner. To ensure that the requests of customers are executed well, the hotels
have provided their employees with the essential resources. The study findings agree with
the findings of Rachman (2017) who did an analysis of effect of physical evidence and
service assurance on customer satisfaction and the results showed that guarantee of service
had a significant influence on customer satisfaction. The study findings disagrees with Ye,
Dong and Lee (2017) that assurance strategy had an enduring negative effect on customer
satisfaction and ultimately hurts profitability in the long run.
5.2.5 Empathy of Services
The study established that there is empathy of service among the four- and five-star hotels
in Nairobi County. This is because staff listens to customers’ issues and/or requests
carefully and this shows that they are interested in what the guest has to say. This is the
form of individualized attention the customers of these hotels get from employees and
therefore, the customers feels that employees adequately listened to their issues and
requests. When guests are expressing themselves, employees have been trained to listen to
them without interrupting. All the actions of employees are towards benefiting the
customer. Other indication of empathy of service is suitable opening hours. The study
findings disagrees with Ye, Dong and Lee (2017) that downgrading empathy and
responsiveness allows firms to lower costs, resulting in immediate productivity benefits;
however, this strategy had an enduring negative effect on customer satisfaction and
ultimately hurts profitability in the long run. The findings agree with Bahadur, Aziz and
Zulfiqar (2018) who confirmed a positive and indirect effect of EE on CL and loyalty
outcomes.

61
5.3 Conclusions
The first objective of the study was to determine the effects of tangibility on customer
satisfaction among hotels in Nairobi County. The study found that tangibility has a positive
influence on customer satisfaction. The study also found that the influence of tangibility
on customer satisfaction is significant. Based on the research findings, the study concludes
that tangibility positively and significantly influences customer satisfaction among hotels
in Nairobi County. Therefore, increasing level of service tangibiity among hotels in kenya
will resukt t an increase in customer satisfaction.
The second objective of the study was to assess the effects of reliability on customer
satisfaction among hotels in Nairobi County. The study found that reliability had a positive
influence on customer satisfaction. The findings further showed that the influence of
reliability on customer satisfaction was significant. Therefore, the study concludes that
reliability has a positive significant influence on customer satisfaction. This means that an
increase in service reliability n the hotels will result to an increase in level of customer
satisfaction.
The third research objective was to determine the effects of responsiveness on customer
satisfaction among in Nairobi County. Responsiveness was found to have positive
influence on customer satisfaction. Further, the influence of responsiveness on customer
satisfaction was found to be significant. Based on the research findings, the study concludes
that responsiveness has positive significant influence on customer satisfaction in Nairobi
County. Therefore, a unit increase in service responsiveness in hotels will result to an
increase in customer satisfaction.
The fourth objective of the study was to determine the effects of assurance on customer
satisfaction among hotels in Nairobi County. The study established that assurance has a
positive influence on customer satisfaction among hotels in Kenya. The study also found
that the influence of assurance on customer satisfaction was significant. Therefore, based
on the findings, the study concludes that assurance has a positive significant influence on
customer satisfaction among hotels in Nairobi County. This suggests that an increase in

62
service assurance among hotels in Kenya will result to an increase in its customer
satisfaction.
The final objective of the study was to establish the effects of empathy on customer
satisfaction among hotels in Nairobi County. The study found that empathy has positive
influence on customer satisfaction. Further, the influence of empathy on customer
satisfaction was found to be significant. Therefore, from the study findings, the study
concludes that empathy has a positive significant influence on customer satisfaction among
hotels in Nairobi County. This suggests that increasing the level of empathy of service
among hotels in Kenya will result to an increase in level of customer satisfaction.
5.4 Recommendations
The study found that service tangibility positively influences customer satisfaction. The
study therefore recommends management of hotels in Kenya to embrace new technology
and the use of up-to-date equipment’s. The study also recommends the hotels to ensure that
their facilities are visually appealing to its customers and this includes ensuring its
employees are neat. Improved tangibility of services will enhance customer satisfaction
and therefore their loyalty.
Reliability was found to positively influence customer satisfaction; the study therefore
recommends management of hotels in Kenya to ensure that they are reliable in providing
services to its customers; this will enhance their satisfaction and therefore loyalty.
Reliability can be enhanced by ensuring response is provided within the time frames, and
reassuring customers whenever challenges arise. Management of hotels in Kenya should
also ensure that their records are accurate and are dependable.
The study recommends hotels to hire employees with customer service skills. The study
also recommends employees to be provided with regular trainings on service delivery this
will enhance their promptness in service delivery. It is also the responsibility of the
management of the hotel to ensure that its employees are well conversant with the hotel
and services provided so that they can help guests and respond to their requests/queries.

63
Assurance was also found to be a significant determinant of customer satisfaction. The
study recommends hotels in Kenya to hire trustworthy employees who can ensure
customers safety. Human Resource department in Hotels in Kenya should ensure that hired
individuals are polite and can interact with customers. It is also the responsibility of the
hotel to provide its employees with the support they need to do their job well.
Increase in empathy level results to an increase in customer satisfaction. The study
therefore recommends hotels in Kenya to ensure hired employees are emphatic to facilitate
provision of caring, individualized attention to customers, and understanding of customer
needs.
Contribution to Policy
The study findings can be used by policy makers to encourage hotel managers to enhance
the service quality dimensions (tangibility, reliability, responsiveness, assurance and
empathy) due to their positive impact on customer satisfaction. The managers can also be
encouraged to consistently use service quality dimensions, this would ensure that they
maintain long-term relationships with their customers.
Contribution to practice
To enhance customer satisfaction in the hotels, managers should consider applying the
service quality measures and this should be well implemented to ensure customer
satisfaction. The managers should emphasize the service quality dimensions in order of
importance. This would help in improving customer satisfaction
Contribution to theory
The study results can be used by individuals conducting other researchers and scholars; it
provides a foundation to those who want to conduct research in a similar field.
Academicians can make use of the research findings as foundation of discussing service
quality and customer satisfaction in organizations. The research would also be an addition
to the body of knowledge. It can make contributions to improve the practice and the
existing knowledge on service quality and customer satisfaction.

64
5.5 Suggestions for Further Studies
The main objective of this study was to establish the influence of service quality on
customer satisfaction among hotels in Nairobi County. The study was conducted among
four- and five-star hotels in Nairobi County. The study therefore recommends replication
of the research study in other four- and five-star hotels in the country to facilitate
comparison and generalization of the research findings.
The study also recommends a study to be conducted among other hotels other than 4 and
5 stars to provide a wider perspective on influence of service quality on customer
satisfaction. The study further recommends a study to be conducted on the influence of
service quality on customer satisfaction in other service providing organizations such as
hospitals. The study recommends a study to be conducted using a different study design
other the descriptive research design. This will improve the data collection and analysis as
well as validity of the study results.
5.6 Limitations of the Study
Some respondents were unwilling to take part in the study. The researcher explained the
purpose of this research study to the respondents and assured them that filling of the
questionnaire will take a little time. The respondents feared that their identity would be
leaked to the public and the management of the hotel. The researcher assured them that the
information they provide was solely for academic reasons and therefore was to be kept
confidential. The information was stored in the university database so that only authorised
individuals can access it.
5.7 Chapter Summary
The researcher in this chapter presented the summary of findings for each study objective.
All independent variables in the study, that is, tangibility, reliability, responsiveness,
assurance and empathy were found to have a positive influence on the dependent variable,
customer satisfaction. The researcher also highlighted recommendations such as embracing
new technology and the use of up-to-date equipment’s given these findings.
65
REFERENCES
Agbor, J.M. (2011). The relationship between Customer Satisfaction and Service Quality.
A Study of three service sectors in Umea. published thesis; Umea School of
Business, Umea University; www. Usbe.umu.se
Al-Azzam , A..F.M. (2015). The Impact of Service Quality Dimensions on Customer
Satisfaction: A Field Study of Arab Bank in Irbid City, Jordan. European Journal
of Business and Management, 7(15), 45.
Aliata, V.L. (2016) Relationship between Service Quality and Customer Satisfaction of
Commercial Bank Customers, Nairobi Kenya. International Journal of
Management & Corporate Affairs, 2(5), 27-47
Alsaqre, O.Z.E. (2011). Investigating the Effects of Tangible and Intangible Factors on
Customers’ Perceived Service Quality and Loyalty in Hotel Industry in Al-
Ladhiqiyah, Syria. Unpublished Thesis.
Ananth, A., Ramesh, R. & Prabaharan, B. (2011) Service Quality GAP Analysis in Private
Sector Banks A Customer Perspective, Internationally Indexed Journal, 2(1), 245-
252.
Anderson, E. W. &Fornell, C. (2001). The Customer Satisfaction Index as a leading
indicator, in Handbook of Services Marketing and Management, Thousand Oaks:
Sage.
Auka, D.O., Bosire, J.N., & Matern, V. (2013). Perceived service quality and customer
loyalty in retail banking in Kenya”, British Journal of Marketing Studies, 1(3), 32-
61.
Aulia, S.A., Sukati, I., & Sulaiman, Z., (2016). A Review: Customer Perceived Value and
its Dimension. Asian Journal of Social Sciences and Management Studies, 3(2),
150-162
Awara, N.. &Anyadighibe, J.A. (2014).The Relationship Between Customer Satisfaction
and Loyalty: A Study of selected eateries in Calabar, Cross Interdisciplinary
Journal of Contemporary Research In Business, 5, 110-125.
Ayele, G. A. (2012). Positioning strategies adopted by five star hotels in Nairobi, Kenya.
Unpublished Thesis, University of Nairobi.
Babbie, E. (2009). The Practice of Social Research. 13th edn. Belmont, CA: Wadsworth.
66
Bahadur, W., Aziz, S. & Zulfiqar, S. (2018) Effect of employee empathy on customer
satisfaction and loyalty during employee–customer interactions: The mediating role
of customer affective commitment and perceived service quality, Cogent Business
& Management, 5(1).
Berry, L., Parasuraman, A. & Zeithaml, V., (1994). Improving service quality in America:
lessons learned. Academy of Management Executive, 8, 32–45
Bitner, M.J., & Hubert, A.R. (2014). Encounter satisfaction versus overall satisfaction
versus quality in Rust, R.T. and Oliver, R.L. (Eds), Service Quality: New Directions
in Theory and Practice, Sage, Thousand Oaks,
Bojanic, D. & Rosen, P. (2014). Quality measurement in professional service firms,
Journal of Professional Services Marketing, 7, 27-30.
Bolton, R. N. & J. H. Drew.(1991). A Multistage Model of Customers Assessment of
Service Quality and Value. Journal of Consumer Research, 54, 69-82.
Boulding, W; Karla, A; Staelin, R., & Zeithaml, V.A. (1993) A Dynamic Process Model
of service quality, From Expectations to Behavioural Intentions. Journal of
Marketing Research 30, 7-27
Burns, N., & Grove, S. (2013). Understanding Nursing Research: Building an Evidence-
Based Practice –Philippine Edition by Teresita I. Barcelo, Singapore: Elsevier Inc.
Buttle, F. (1996). SERVQUAL; review, critique, research agenda, European Journal of
Marketing, 30(1), 8-32.
Cardozo, R. (1965). An experimental study of consumer effort, expectations and
satisfaction, Journal of Marketing Research, 2, 244-9.
Chu, S. & Choi, S. (2011). Electronic word-of-mouth in social networking sites. Journal
of Global Marketing, 24, 263-81.
Cooper, D., & Schindler, P. (2008). Business research methods (10th ed.). New York,
McGraw-Hill/Irwin.
Creswell, J.W. (2013). Research Design Qualitative, Quantitative, and Mixed Methods
Approaches. 4th Edition, SAGE Publications, Inc., London.
Dabholkar, P, A., Thorpe, D. I. & Rentz, J. O. (1996). A Measure of Service Quality for
Retail Stores: Scale Development and Validation, Journal of the Academy of
Marketing Science, 24(1), 3-16
67
Dawes, R., Singer, D. & Lemons, P. (1972). An experimental Analysis of the Contrast
Effect and its Implications for Intergroup Communication and Indirect Assessment
of Attitude. Journal of Personality and Social Psychology, 21(3), 281-295.
Ekinci, Y., Sirakaya-Turk, E. & Preciado, S. (2013). Symbolic consumption of tourism
destination brands, Journal of Business Research, 66, 711-718.
Elegba, E.O. & Adah, P.D. (2015). Satisfaction. Unpublished Thesis, The Federal
Polytechnic, Idah, Kogi State.
Euromonitor International (2016). Research report on Grocery Retailer in Kenya.
Retrieved from http://www.euromonitor.com/grocery-retailers-in-kenya/report, on
11th August 2017.
Farooqi R. & Banerji R. (2013). Evaluation of Retail Service Quality by using RSQS
model: A Case Study on Big Bazaar Hypermarkets in Delhi NCR (India). ICRM,
3(4)..
Forbes travel guide (2014). The global authority on luxury hospitality. Retrieved from
www.forbestravelguide.com.
Gagnon, G. & Roh, Y.S. (2008) The Impact of Customization and Reliability on Customer
Satisfaction in the U.S. Lodging Industry, Journal of Quality Assurance in
Hospitality & Tourism, 8:3, 60-78,
Galetzka, M., Verhoeven, J.W.M. and Pruyn, A.T. (2006). Service validity and service
reliability of search, experience and credence services, A scenario study.
University of Twente, Enschede, the Netherlands.
Gronroos, C. (1984). A service Quality model and its marketing implications. European
Journal of Marketing, 18(4), 36-44
Gundersen, M.G., Heide, M., & Olsson, U.H. (1996). Hotel guest satisfaction among
business travelers: What are the important factors? Cornell Hotel and Restaurant.
Administration Quarterly, 37(2), 72–81
Gursoy, D., & Swanger, N. (2016). Performance-enhancing internal strategic factors and
competencies: impacts on financial success. International Journal of Hospitality
Management, 3(12)48-63
Hackl, P. & Westlund, A.H. (2000). On structural equation modeling for customer
satisfaction measurement, Total Quality Management, 11(4/5/6), S820-825.

68
Hair J.F., Black W.C., Babin B.J., & Anderson R.E. (2010). Multivariate data analysis,
7th edn. Prentice Hall, Upper Saddle River
Hersh, A. M. (2010). Evaluate the impact of Tourism Services Quality on customer's
satisfaction. Interdisciplinary Journal of Contemporary Research in Business,
2 (6), 1-29
Hovland, C. L, Harvey, O. J. & Sherif, M. (1987). Assimilation and Contrast Effects in
Reactions to Communication and Attitude Change. Journal of Abnormal and
Social Psychology, 55: 244-52
Howard, A. J. & Sheth, N. J. (1967). The theory of buyer behaviour, Wiley, New York:
147
Iberahim, H. (2016). Customer Satisfaction on Reliability and Responsiveness of Self
Service Technology for Retail Banking Services. Procedia Economics and
Finance, 37, 13-20
Imbuga, D. (2005). Determinants of customer satisfaction in supermarkets in Nairobi”,
Unpublished MBA research project, University of Nairobi.
Ismail, I.M. (2013). “Effects of the increase of supermarkets on vegetable supply system
of small-scale farmers in Kenya, Unpublished Masters research project, Jomo
Kenyatta University of Agriculture and Technology.
Jiang, Y., & Wang, C.L. (2006). Perceived service quality and satisfaction: the moderation
of service contexts. Journal of Services Marketing, 20(4), 211–218.
Johanna, H. (2010). The meaning of Hotel star- rating systems, Retrieved
fromhttp://www.globalexpresstours.com
Johanna, H. (2010). The meaning of Hotel star-rating systems,
Retrievedfromhttp://www.globalexpresstours.com
Kadampully, J. & Suhartanto, D. (2000). Customer Loyalty in the Hotel Industry: The
Role of Customer Satisfaction and Image. International Journal of Contemporary
Hospitality Management, 12 (6), 346-351
Kenya Association of Hotel Keepers and Caterers (2018). Hotel Industry in Kenya.
Kenyan Gazette Notice No. 3976. Classification of Hotels and Restaurants. Regulations.
CV (62). Nairobi: RoK.

69
Kim, W.C. & Mauborgne, R. (2016). Blue Ocean Strategy: Blue Ocean Strategy Tools.
Retrieved from https://www.blueoceanstrategy.com/
Kimani, S.W., Kagira, E.K., Kendi L., & Wawire C.M. (2011).Shoppers Perception of
Retail Service Quality: Supermarkets versus Small Convenience Shops (Dukas) In
Kenya, Journal of Management and Strategy, 3(1), 57-60.
Kinyingi, M.M. (2018). Factors Influencing Customer Satisfaction in Hotel Industry in
Kenya. Retrieved fromhttp://erepo.usiu.ac.ke/11732/4483
Kopalle , K. P. & Lehmann, R. D. (2001) Strategic Management of Expectations: The Role
of Disconfirmation Sensitivity and Perfectionism. Journal of Marketing Research,
38(3), 386-394.
Kothari C.R., (2010). Research Methodology: Methods and. Technique, New Delhi: New
Age International Publishers.
Kotler, P. (2006). Marketing management (12thed.), Pearson Education Inc., New Jersey
Krejcie, R.V., & Morgan, D.W., (1970). Determining Sample Size for Research Activities.
Educational and Psychological Measurement.
Kumar, A. & Sikdar, P. (2014). Retail service quality assessment -A Scale validation study
in Indian perspective. AIMA. Journal of Management & Research, 8(4).
Lamb, C.W., Hair, J.F., McDaniel, C., Boshoff, C., Terblanche, N.S., Elliot, R. &Klopper,
H.B. (2012). Marketing, 4thedn. Cape Town, CT, Oxford University Press.
Lee, L., Lee, M.J. & Dewald, B. (2016). Measuring the customers’ perception of tangible
service quality in the restaurant industry: An emphasis on the upscale dining
segment, Journal of Foodservice Business Research, 19(1), 21-38.
Liaw, H., & Goh, K.-L. (2002). Biases in student evaluation of teaching: the case of
Faculty of Economics & Administration University of Malaya. . Malaysia
Mathews, J. (2008). Hotel management. Jaipur, Raj., India: Pointer Publishers.
McLeod, S. A. (2014). Sampling Methods. Retrieved from:
www.simplypsychology.org/sampling.html
Mehta, S.C., Lalwani, A. & Soon, L.H. (2010). Service quality in retailing: relative
efficiency of alternative measurement scales for different product-service
environments. International Journal of Retail and Distribution Management,
28(2), 62–72.

70
Mistri, V.M., & Bhatt, N.H. (2014). Retail store and service quality: A study of
hypermarkets in Ahmedabad city, Pacific Business Review International, 6(4), 59-
65.
Mohsin, A., & Lockyer, T. (2010). Customer perceptions of service quality in luxury hotels
in New Delhi, India: An exploratory study. International Journal of Contemporary
Hospitality Management, 22(2), 160-173.
Mugenda, A.G. (2008). Social Science Research Theory and Principles. Acts Press,
Nairobi.
Mutua, S.W. (2013). A survey into factors that influence customer satisfaction in
supermarkets within Nakuru town, Kenya, Unpublished MBA research project,
University of Nairobi.
Nhat, N.D.D., & Hau, L.N. (2017). Determinants of retail service quality; a study of
supermarkets in Vietnam, Science and Technology Development, 10(8), 15-23.
Nimako, S. G., Gyamfi, N. K., Mumuni A., & Wandaogou, M. (2013). Customer
satisfaction with internet banking service quality in the Ghanaian banking industry.
International Journal of Scientific & Technology Research, 2(7), 80-96
Ojo, O. (2016). “The relationship between service quality and customer satisfaction in the
telecommunication industry: Evidence from Nigeria”, Broad Research in
Accounting, Negotiation and Distribution, 1(1), 88-100.
Olatokun, W. M., & Ojo, F. O. (2016). Influence of service quality on consumers’
satisfaction with mobile telecommunication services in Nigeria. Information
Development, 32(3), 398–408.
Olatokun, W.M. and Ojo, F.O. (2014). Influence of service quality on consumers’
satisfaction with mobile telecommunication services in Nigeria. Information
Development, 32(3), 398–408.
Oliver R. L. & DeSarbo, W. S. (1988). Response Determinants in Satisfaction Judgment,
Journal of Consumer Research, 14, 495- 507
Oliver, R. L. (1980). A cognitive model of the antecedents and consequences of satisfaction
decisions. Journal of Marketing Research, 17, 460-9.
Oliver, R. L. (1997) Satisfaction: A Behavioral Perspective on the Consumer. New York:
McGraw-Hill.

71
Omar, H.F.H. (2015). Determining the Influence of the Reliability of Service Quality on
Customer Satisfaction: The Case of Libyan E-Commerce Customers. International
Journal of Learning & Development, 5(1).
Owuor, V.A., & Waiganjo, E. (2014). Factors affecting customer satisfaction in retail
chains in Kenya: A case study of Nairobi Defense Forces canteen, international
Journal of Business and Law Research,2(4), 73-87.
Pandey, S.K. & Devasagayam, R. (2010). Responsiveness As Antecedent Of Satisfaction
And Referrals In Financial Services Marketing: Empirical Evidence From An
Emergent Economy. The Journal of Applied Business Research, 28(1), 115-131.
Parasuraman, A., Zeithaml, V. & Berry, L. (1985). A conceptual model of service quality
and its implications for future research, Journal of Marketing, 49(4), 41-50.
Parasuraman, A., Zeithaml, V. A., & Berry, L. L. (1990). SERVQUAL: A multiple-item
scale for measuring consumer perceptions of service quality, Journal of Retailing,
64(1), 12-40.
Park, I., Bhatnagar, A. & Rao, H.R. (2010). Assurance Seals, On-Line Customer
Satisfaction, and Repurchase Intention, International Journal of Electronic
Commerce, 14(3), 11-34,
Philip, B.J., & Hazlett, J. H. (2017). Welcome to the experience economy. Harvard
business review,76, 97-105.
Pisnik, A. and Snoj, K.B. (2010). Development, Validity and Reliability of Perceived
Service Quality in Retail Banking and its Relationship with Perceived Value and
Customer Satisfaction. Managing Global Transitions, 8(2):187–205
Porter, L. W. (1961). A study of perceived need satisfaction in bottom and middle
management jobs. Journal of Appged Psychology, 45, 1-10.
Rachman, A (2017). Analysis of Effect of Physical Evidence and Service Assurance on
Customer Satisfaction and Customer Loyalty in using Car Rental Service (PT
Pusaka Prima Transport Cases). IOP Conf. Series: Materials Science and
Engineering180
Rahhal, W. (2015). The Effects of Service Quality Dimensions on Customer Satisfaction:
An Empirical Investigation in Syrian Mobile Telecommunication Services.
International Journal of Business and Management Invention, 4, 81-89.

72
Rahman, S.M., Khan, H.A. & Haque, M.M. (2014). A conceptual study on the relationship
between service quality towards customer satisfaction: Servqual and Gronroos’s
service quality model perspective. Canadian Centre of Science and Education, 08,
201–210.
Rauch, D. A., Collins, M. D., Nale, R. D., & Barr, P. B. (2015).Measuring service quality
in mid-scale hotels. International Journal of Contemporary Hospitality
Management, 27(1), 87–106.
Reichheld, F. (2016), The One Number You Need to Grow, Harvard Business Review,
December 2013.
Santos, J., (2002). From intangibility to tangibility on service quality perceptions: a
comparison study between consumers and service providers in four service
industries, Managing Service Quality: An International Journal, 12(5), 292-302
Sarason, Y. (2013). Embedded Corporate Social Responsibility: Can’t We Do Better than
GE, Intel and IBM? How about a Benefit Corporation?. Industrial and
Organizational Psychology: Perspectives on Science and Practice. Hoboken, NJ:
Wiley-Blackwell Press., 6 (4), 354-358.
Saravanan, R. & Rao, K. S. P. (2007). Measurement of service quality from the customer’s
perspective – An empirical study, Total Quality Management, 18(4), 435-449.
Saunders, M., Lewis, P. & Thornhill, A. (2012). Research Methods for Business Students.
Pearson Education Ltd., Harlow.
Scheuing, E.E. (2015). Creating Customers of Life. Productivity Press, Portland, OR.
Schiffman, L. G. & Kanuk, L. L. (1991). Consumer Behavior(7thed.). Wisconsin: Prentice
Hall.
Sekaran, U. (2003). Research methods for business. Hoboken
Shemwell, D.J., Yavas, U. & Bilgin, Z. (2018). Customer -service Provider Relationships:
An Empirical Test of a Model of Service Quality, Satisfaction and Relationship-
oriented Outcomes, International Journal of Service, 9(2), 155-168.
Solomon, M.R. (1994). Consumer Behavior, 2nd ed. Ally and Bacon, Boston, MA.
Spreng, R. A., & Mackoy, R. D. (1996). An Empirical Examination of a Model of
Perceived Service Quality and Satisfaction. Journal of Retailing, 72(2), 201–214.
73
Su, A. Y.-E. . (2004). Customer Satisfaction Measurement Practice in Tai- wan Hotels.
International Journal of Hospitality Management (23), 397-408.
Sureshbabu, B. (2014). Customer Satisfaction on Tangibility of Banking Services in
Thanjavur City. Abhinav National Monthly Refereed Journal of Research in
Commerce and Management, 3(9).
Suuroja, M. (2013), “Service Quality - Main Conceptualizations and Critique”,
Unpublished research project, University of Tartu.
Tamwatin, U., Trimetsoontorn, J., & Fongsuwan, W. (2015). The effect of tangible and
intangible service quality on customer satisfaction and customer loyalty: A SEM
approach towards a five-star hotel in Thailand. J. for Global Business
Advancement, 8(4), 399
Tan, Q., Oriande, A., & Fallon, P. (2014). “Service quality and customer satisfaction in
Chinese fast food sector”, An International Journal of Akdemiz University Tourism
Faculty, 2(1), 30-53.
Thompson, E. R. (2016). National competitiveness: A question of cost conditions or
institutional circumstances? British Journal of Management, 15(3), 197–218.
Turel, O., & Serenko, A. (2014). “User Satisfaction with Mobile Services in Canada”,
Proceedings of the Third International Conference on Mobile Business, M-
Business.
Uddin, B.M. & Akhter, B. (2012). Customer satisfaction in Mobile phone Service in
Bangladesh: A survey Research: Management and Marketing Journal, 10(1), 21-
36.
Webster, C. & Hung, L. (1994). Measuring service quality and promoting decentering, The
TQM Magazine, 6 (5),50 -55.
Ye, J., Dong, B. and Lee, j-y (2017). The long-term impact of service empathy and
responsiveness on customer satisfaction and profitability: a longitudinal
investigation in a healthcare context, Marketing Letters, 28(4), 551–564
Yi. Y. (1990). A Critical Review of Consumer Satisfaction, in V. A. Zeithaml (Ed.), Review
of Marketing, Chicago: American Marketing Association, 68-123.
Yin, R.K. (2014). Case Study Research Design and Methods (5th ed.). Thousand Oaks,
CA: Sage. 282 pages.

74
Zeithaml, A., Parasuraman, A., & Berry, L. (2010.) Delivering Quality Service, The Free
Press, New York, N.Y.
Zeithaml, V.A. (1988). Consumer Perceptions of Price, Quality, and Value: A Means-End
Model and Synthesis of Evidence. Journal of Marketing, 52, 2-22.
Zikmund, W.G., Babin, J., Carr, J. & Griffin, M. (2012). Business Research Methods: with
Qualtrics Printed Access Card. Cengage Learning.

75
APPENDICES
Appendix I: Letter of Introduction
I am the undersigned, currently undertaking a Master’s degree in Business administration
at Strathmore Business School. I am conducting a study that involves collecting data for
writing and compiling the final thesis as a partial requirement for the award of the degree.
The research entails a study on The Effect of Service Quality on Customer Satisfaction
among Hotels in Nairobi County, Kenya. The information collected will be used solely
for academic purposes and will be handled with utmost confidentiality.
Please direct any enquiries to: Joy Ngina Musyoka Mutinda
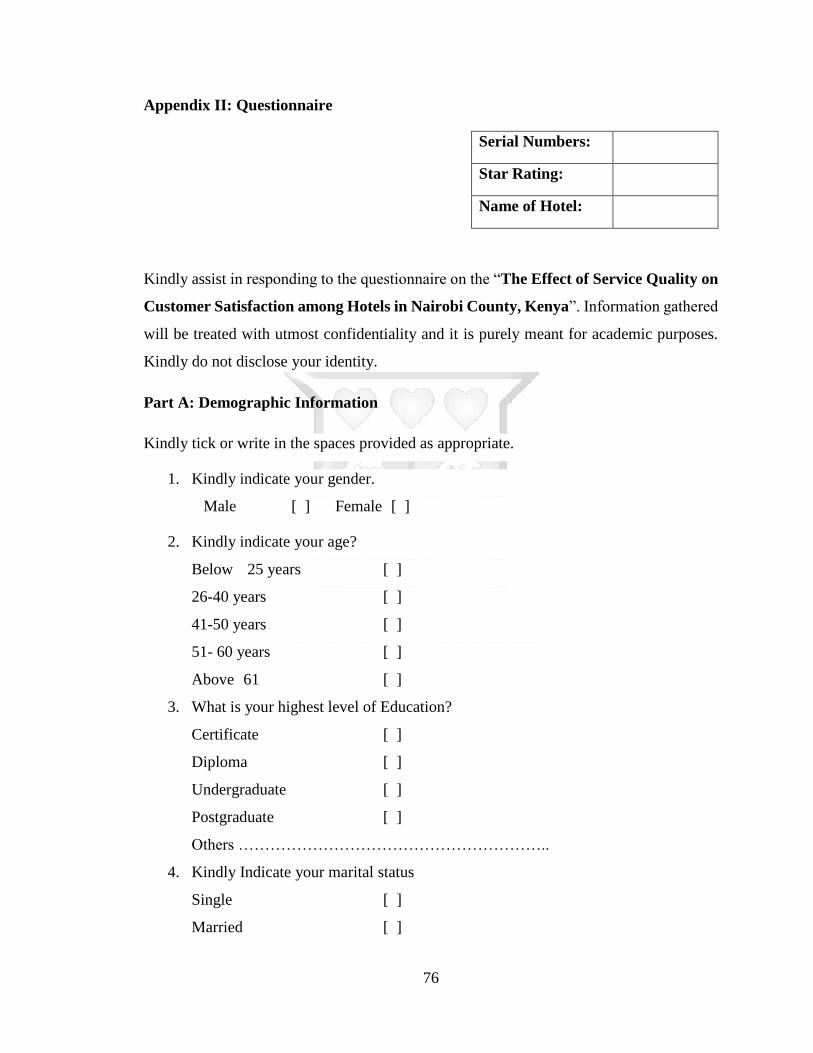
76
Appendix II: Questionnaire
Serial Numbers:
Star Rating:
Name of Hotel:
Kindly assist in responding to the questionnaire on the “The Effect of Service Quality on
Customer Satisfaction among Hotels in Nairobi County, Kenya”. Information gathered
will be treated with utmost confidentiality and it is purely meant for academic purposes.
Kindly do not disclose your identity.
Part A: Demographic Information
Kindly tick or write in the spaces provided as appropriate.
1. Kindly indicate your gender.
Male [ ] Female [ ]
2. Kindly indicate your age?
Below 25 years [ ]
26-40 years [ ]
41-50 years [ ]
51- 60 years [ ]
Above 61 [ ]
3. What is your highest level of Education?
Certificate [ ]
Diploma [ ]
Undergraduate [ ]
Postgraduate [ ]
Others …………………………………………………..
4. Kindly Indicate your marital status
Single [ ]
Married [ ]

77
Divorced [ ]
Separated [ ]
5. What is your occupation? ……………………………………….
6. How frequently do you visit this hotel?
Once a year [ ]
Once every six months [ ]
Once every four months [ ]
Once every month [ ]
Other [ ] Specify: ……………………………………….
7. Reason(s) why you visit the hotel: (tick three that apply to you)
Visually appealing facilities and up to date equipment [ ]
Great service delivery by staff [ ]
Great location [ ]
Individualized attention by staff [ ]
Hotel is clean [ ]
Part B: Tangibility of Services
8. This section seeks your opinion regarding the kind of physical facilities in the hotel.
Indicate your level of agreement on the following statement about the tangibility of
services offered by this hotel where 1 –Strongly disagree, 2-disgaree, 3-moderate,
4-agree, 5- strongly agree
Strongly
Disagree
Disagree Neutral Agree Strongly
Agree
Statements 1 2 3 4 5
The hotel premises are always clean
There is a unique feature that
differentiates the hotel and are visually
appealing
The hotel rooms are spacious
The hotel rooms are well ventilated

78
The equipment in the hotel rooms are up
to date
The hotel rooms are well arranged and
attractive
The servers are usually dressed in
uniforms
Customers are usually guided by the
employees
The hotel is strategically located in an area
with good road infrastructure
9. Indicate and briefly talk about the physical aspects of the hotels that were or were
not mentioned above that greatly affected your stay at the hotel positively or
negatively.
………………………………………………………………………………………………
………………………………………………………………………………………………
………………………………………………………………………………………………
……………………………………………………………………………..
Part C: Reliability of Service
10. This section seeks your opinion regarding how reliable the services offered by the
hotel are. Indicate your level of agreement on the following statement about
reliability of services offered by this hotel where 1 –Strongly disagree, 2-disgaree,
3-moderate, 4-agree, 5- strongly agree
Strongly
Disagree
Disagree Neutral Agree Strongly
Agree
Statements 1 2 3 4 5
Customers complaints and requests are
handled fast
Pricing is similar to all customers

79
The hotel personnel were concerned,
reassuring and helpful when an issue was
brought to their attention
Services of the hotel delivered within the
promised time frame/at the right time
The prices of the extra services at the hotel
are reasonable
The hotel had an accurate record and costing
of the services requested for
11. Indicate and briefly explain about any issues or experiences encountered at the hotel
that were or were not mentioned above that greatly affected how you view the hotel
from a more or less reliable point of view.
………………………………………………………………………………………………
………………………………………………………………………………………………
………………………………………………………………………………………………
………………………………………………………………………………………………
………
Part D: Responsiveness of Services
12. This section seeks your opinion regarding how responsive the hotel and hotel staff
were to your needs, requests and issues. Indicate your level of agreement on the
following statement about the responsiveness of employees of the hotel where 1 –
Strongly disagree, 2-disgaree, 3-moderate, 4-agree, 5- strongly agree
Strongly
Disagree
Disagree Neutral Agree Strongly
Agree
Statements 1 2 3 4 5
Employees were helpful in informing
customer when service will occur
Customers problems are solved
immediately

80
Customers order are delivered on time
Customers get help when needed
The employees are friendly
Important information is shared to the
customers
In case of inconveniences apologies are
made
Employees assist guests and provide
prompt service.
13. Indicate or briefly explain about any other aspect mentioned above or not that you
experienced at the hotel in regards to how responsive employee were to you that
may have affected your view of the hotel in a more or less positive point of view.
………………………………………………………………………………………
………………………………………………………………………………………
………………………………………………………………………………………
……
Part E: Assurance of Service
14. This section seeks your opinion regarding how assured you are of the services
offered by the hotel and hotel staff. Indicate your level of agreement on the
following statement about the assurance of service by the hotel and hotel employees
where 1 –Strongly disagree, 2-disgaree, 3-moderate, 4-agree, 5- strongly agree
Strongly
Disagree
Disagree Neutral Agree Strongly
Agree
Statements 1 2 3 4 5
Customers information is kept confidential
Employees are well trained on customer
service
Customers security is paramount

81
Hotels employees have the customer's best
interest at heart
The customer care employees are welcoming
and polite
Hotels employees deal with guests in a caring
fashion
Employees are polite when answering my
questions
Employees have essential resources and
support to execute customer requests well
15. Indicate or briefly explain about any other aspects mentioned above or not that
affected you negatively or positively in how assured you were by the hotel and its
staff about their service delivery
………………………………………………………………………………………………
………………………………………………………………………………………………
………………………………………………………………………………………………
……
Part F: Empathy of Services
16. This section seeks your opinion regarding the empathy expressed by the hotel and
hotel staff towards your needs, requests and issues. Indicate your level of agreement
on the following statement about empathy expressed by the hotel’s employees
where 1 –Strongly disagree, 2-disgaree, 3-moderate, 4-agree, 5- strongly agree
Strongly
Disagree
Disagree Neutral Agree Strongly
Agree
Statements 1 2 3 4 5
Staff listens to customers’ issues and/or
requests carefully
The staff is interested in what the guest has
to say

82
Employees’ give individualized attention
to customer is addressing them
Customer feels that employees adequately
listened to their issues and requests
Guests are allowed to get through what
they are saying without interrupting and
changing the subject
Employees act towards the benefit of the
customers
Opening times of the company are suitable
17. Indicate or briefly explain about any other aspect or experience mentioned above
or not that may have made you feel that the hotel and hotel employees did or didn’t
care about your wellbeing while at the hotel.
………………………………………………………………………………………
………………………………………………………………………………………
………………………………………………………………………………………
………………………………………………………………………………………
…..
Part G: Customer Satisfaction
18. This section seeks your opinion regarding how satisfied you were by the hotel and
the services offered by the hotel. Indicate your level of agreement on the following
statement about how satisfied you are with the services offered by the hotel where
1 –Strongly disagree, 2-disgaree, 3-moderate, 4-agree, 5- strongly agree
Strongly
Disagree
Disagree Neutral Agree Strongly
Agree
Statements 1 2 3 4 5
I will recommend the hotel to your
family and friends
The hotel met my expectations
I intend to return to the hotel the
next time I travel
83
The hotel’s advertised image and
brand was similar to what I
experienced
I would like to receive information
on the hotel’s new service or
services’ discounts
The hotel made me feel valued as a
customer
I am highly satisfied with the
services offered by the hotel
THANK YOU FOR YOUR TIME

84
Appendix III: List of Four and Five Star Hotels
Five Star Hotels
1. Hotel Intercontinental
2. Laico Regency Hotel
3. Hilton Hotel
4. The Norfolk Hotel
5. Nairobi Serena
6. The Stanley
7. Safari Park
Four-star Hotels
1. The Boma Hotel
2. Fair View Hotel
3. Eka Hotel
4. Landmark Hotel
5. Holiday Inn
6. Windsor Golf Country club
7. Nairobi Safari Club

24