Bending Properties of Fiber-Reinforced Composites Retainers ...
Upload
independentCategory
view
1download
0
An Experimental Study of Self-diagnosis of InterlaminarDamage in Carbon-fiber Composites
Y. NGABONZIZA,1 H. ERGUN,2 R. KUZNETSOVA,1 J. LI,1,* B. M. LIAW,1 F. DELALE1AND J. H. CHUNG
3
1Mechanical Engineering Department, The City College of New York, CUNY Convent Avenue and 138th Street,New York, NY 10031, USA
2Civil Engineering Faculty, Mechanics Division, Istanbul Technical University, 34469, Maslak, Istanbul, Turkey
3Global Contour Ltd., 104 W. Kaufman, Ste. 103, Rockwall, TX 75087-3032, USA
ABSTRACT: An experimental study was conducted to sense interlaminar delamination incarbon-fiber composites utilizing inherent material piezoresistivity. Mode I and II interlami-nar fracture tests were carried out on double cantilever beam and end-notched-flexure speci-mens following ASTM standards. The traditional DC-sourcing two-point probe techniquewas employed to measure the through-thickness electrical resistance change. For comparison,optical marker method and acoustic emission technique were also applied to detect inter-laminar crack growth. The investigation demonstrates the application potential of theself-sensing capabilities of carbon-fiber composites for structural health monitoring.
Key Words: self-diagnosis, structural health monitoring, electrical properties, interlaminardamage, carbon-fiber composites.
INTRODUCTION
OWING to their desirable features of lightweight,high strength, and flexibility for processing,
carbon-fiber composites have been widely used in aero-space industry. In the mean time, the reliability issue ofthe composites during service has prompted muchresearch on detecting damage due to various causes.Contrary to conventional time-based maintenance(TBM), new condition-based maintenance (CBM) hasprompted in situ, real-time damage detection for struc-tural health monitoring (SHM). Several techniques havebeen proposed for SHM during the past decade (e.g.,Liang and Culshaw, 1993; Kuang et al., 2001;Balageas et al., 2006). It should be noted that practicallyall these proposed techniques require the use of third-party embedded sensors, such as MEMS, PZTs, fiberoptic sensors, etc., which tend to compromise the struc-tural integrity of the host component.On the other hand, due to their inherent piezoresistiv-
ity and electrical conductivity (for instance, the nominalconductivity of typical carbon fibers: r¼ 5� 104
(Xm)�1), carbon-fiber composites are ideal candidatesfor strain and damage self-sensing (e.g., Chung andWang, 2003; Todoroki et al., 2005; Shen et al., 2007;
Sevkat et al., 2008). The self-sensing capability impliesthat the material itself functions as a real-time strainsensor/damage detector; thereby, eliminating the needfor using surface mounting or embedding third-partydevices, which may present technical and economic bar-riers. Thus, the self-sensing/self-diagnostic capability of acarbon-fiber composite structure enables us to assessstrains and detect damage by utilizing the inherent elec-trical resistivity of carbon (graphite) in the carbon-fibercomposites for SHM applications. The use of change inelectrical resistance for monitoring fracture process canbe dated back to decades ago (e.g., Kobayashi et al. 1983;Fisher and Arendis, 1993; Wang and Chung, 1997a,b;Chung, 1998). This technique has been applied bymany researchers for the study of carbon-based compo-sites. Among the others, Chung and her associates haveconducted extensive research in the area of damage self-sensing/self-monitoring/self-diagnosing of carbon-fiberpolymer composites (e.g., Wang and Chung, 1997a,b,1998a,b, 1999, 2001, 2002, 2005, 2006, 2007; Chungand Wang, 2003). Other notable studies in this areainclude the works of Todoroki et al. (1995, 2005), Abryet al. (1999, 2001), Todoroki et al. (2001), Park et al.(2002, 2004), etc. In particular, transverse conductivityappears in a carbon-fiber composite due to contactbetween neighboring fibers and plies since carbonfibers are not perfectly aligned in the composite(Abry et al., 1999). Hence, conductivity variations canbe used for the detection of transverse and longitudinal
*Author to whom correspondence should be addressed.E-mail: [email protected] 1�16 appear in color online: http://jim.sagepub.com
JOURNAL OF INTELLIGENT MATERIAL SYSTEMS AND STRUCTURES, Vol. 21—February 2010 233
1045-389X/10/03 0233�10 $10.00/0 DOI: 10.1177/1045389X09347019� The Author(s), 2010. Reprints and permissions:http://www.sagepub.co.uk/journalsPermissions.nav
intraply matrix cracking and delamination (Ceyssonet al., 1996; Todoroki, 2001; Todoroki et al., 2005;Wang et al., 2001). However, for transverse orthrough-thickness resistance measurement, the sensitiv-ity remains an issue. Prior works on self-sensing based onthe through-thickness resistance measurement can befound in Chung (2001, 2007), Chung and Wang (2003),Wang et al. (2005a,b), Wang and Chung (2006, 2007),and Shen et al. (2007). For more detailed literaturereview on self-sensing using resistance measurements,interested readers may refer to Chung’s review article(2007).The objective of this work is to apply electrical resis-
tance measurement technique to monitoring the crackpropagation under mode I and mode II interlaminarfracture tests and study the sensitivity of self-sensingcompared to other sensing techniques such as acousticemission (A/E). Similar self-sensing tests have beencarried out previously by others, such as Fisher andArendts (1993), and Todoroki et al. (1995). In theirworks, the primary focus was on the feasibility studyof self-sensing itself. No other sensing methods werecompared and studied except the standard opticalmethod used for crack propagation measurement.The self-sensing/diagnostic resistance measurement
method can be classified into two types. The first,called the two-point probe technique, is an electricalpotential method, which is made of two single-terminalelectrodes attached to the surface of the carbon-fibercomposite structure. A DC or AC source current isthen applied through the two electrodes and the result-ing voltage across the same electrodes is measured. Theelectrical resistance between these two electrodes is thencalculated based on the Ohm’s law. The second, calledthe four-point probe technique (also known as Kelvin’stechnique), is an electrical impedance method, whichuses separate pairs of electrodes for current-sourcingand voltage-sensing. That is, the outer and inner term-inals of the electrodes are used as current and voltagecontacts, respectively. The key advantage of the four-point probe technique over the traditional two-pointprobe technique is that by separating current-sourcingand voltage-sensing terminals, the four-point probetechnique eliminates the impedance contributions ofthe wiring and contact resistances.While the four-probe method is suggested in general
for practical application in self-sensing, the two-probemethod may still be useful under certain circumstancedue to its simplicity. For instance, when space is limited,such as the 1D strip specimens commonly used in labo-ratory tests, the two-point probe technique can beapplied more conveniently than the four-point probetechnique. In this work, we measured the through-thick-ness resistance change of carbon-fiber composite speci-mens under mode I and mode II interlaminar fracturetests, which appeared in the forms of double cantilever
beam (DCB) for mode I and end-notched-flexure (ENF)for mode II tests, respectively (Pipes et al., 1990; Adamset al., 2003). Both two-point and four-point probe meth-ods were used for resistance measurement and the resultswere compared between them and with the ones obtainedfrom A/E. Since the results from two-probe method havesimilar trend with the ones from four-probe method,while one of the four-probe measurements did not suc-ceed during the tests (the reason of the failure of the four-probe method needs to be investigated carefully), here itis worth to report the two-probe results alone. The four-probe measurements will be reported separately. To fur-ther prove the damage self-sensing capability, the ASTMStandard optical marker method and A/E techniquewere also used to detect interlaminar crack growth inthe carbon-fiber composite and compared with theresults from the resistance measurements.
EXPERIMENTS
Specimens
Four carbon-fiber composite laminated specimens forinterlaminar fracture testing were supplied by SikorskyAircraft and used for the experiments. The specimensare made of 12 plies of unidirectional tapes (approxi-mately 0.3mm or 0.01200/ply) of aerospace-gradeuntoughened epoxy reinforced with graphite fibers(Hexcel IM7-G/8552). Each ply was attached by ascrim cloth, which contains a light sheet of fiber-rein-forced fabric during fabrication process to increase theimpact resistance, tensile strength and fatigue resistanceof the composite systems. These specimens are:
. Two pieces of 152.4mm(L)� 25.4mm(W) (or600(L)� 100(W)) unidirectional [0]12 carbon-fiber com-posite laminated strips with a 76.2mm (or 300) Teflonpre-crack defect at midplane for use in DCB test set-up for Mode I interlaminar fracture. The thickness ofthe Teflon is 0.3175mm.
. Two pieces of 152.4mm(L)� 25.4mm(W) (or600(L)� 100(W)) unidirectional [0]12 carbon-fiber com-posite laminated strips with a 50.8mm (or 200) longand 0.3175mm thick Teflon pre-crack defect at mid-plane for use in end-notched-flexure (ENF) testset-up for Mode II interlaminar fracture.
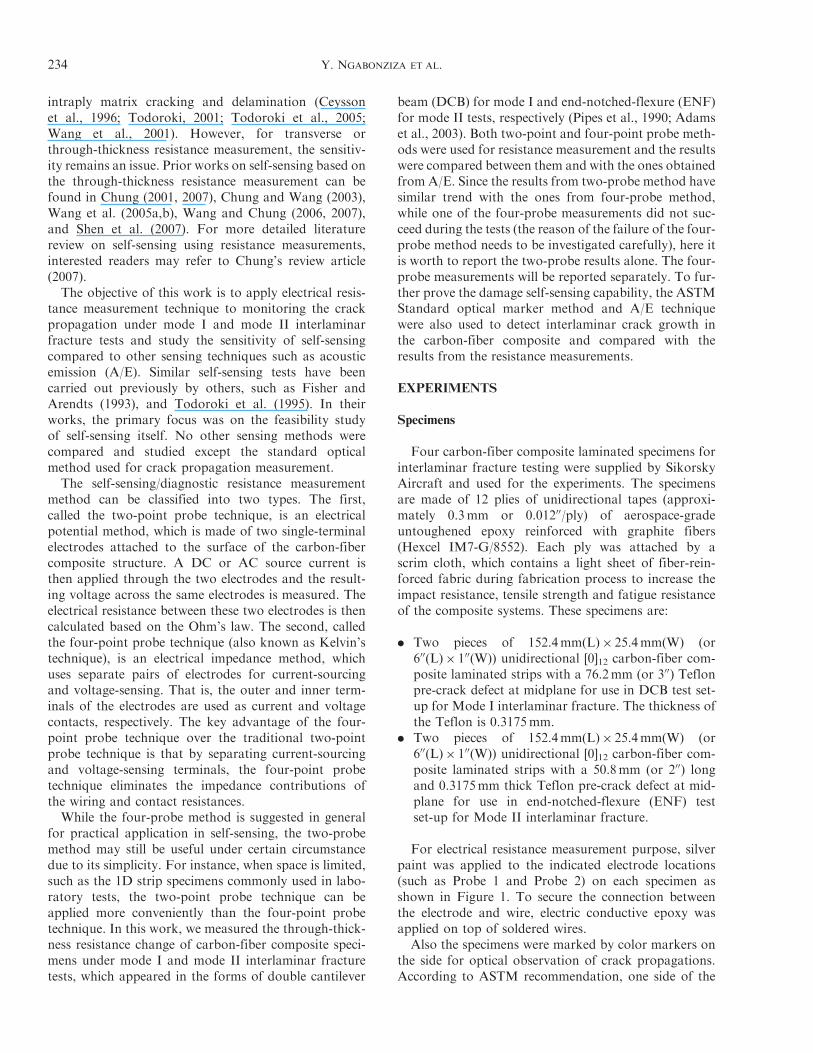
For electrical resistance measurement purpose, silverpaint was applied to the indicated electrode locations(such as Probe 1 and Probe 2) on each specimen asshown in Figure 1. To secure the connection betweenthe electrode and wire, electric conductive epoxy wasapplied on top of soldered wires.
Also the specimens were marked by color markers onthe side for optical observation of crack propagations.According to ASTM recommendation, one side of the
234 Y. NGABONZIZA ET AL.
specimen facing the camera was painted with white cor-rection fluid first, then different color lines for bettervisualization were marked using 0.2mm markers foreach millimeter interval from the crack tip for the first10mm, followed by black color lines with 5mm spacingalong the rest of the edge of the specimen.
Mode I DCB Tests
The two DCB composite specimens, called DCB-1and DCB-2, were tested for Mode I interlaminar frac-ture following ASTM D5528-01 and D-790 Standards(Pipes et al., 1990; Fisher and Arendts, 1993; Todorokiet al., 1995; Adams et al., 2003). Figure 1 show a DCBspecimen mounted in an MTS 810 22-kips universal test-ing system through a fixture made of a pair of high-strength steel piano hinges. As seen in the photo, threetechniques were used for Mode I delamination detectionfor the specimen: (1) ASTM recommended opticalobservation (a series of thin-line markers was attachedto the specimen along the edge; (2) A/E detection (twoA/E sensors at the double cantilever end were attachedusing silicone gel and tape); and (3) self-sensing tech-nique (two-point probe electrodes for piezoresistivity-based self-sensing resistance measurement were installedas shown in Figure 1). For its simplicity, DC source wasused for the tests. Nevertheless, it is worthwhile to notethat in real-life practice AC source in 1 kHz is commonlyused to avoid inaccuracy caused by polarization.Mechanical load was then applied from the MTS
810 testing machine through the steel piano hinges to
the DCB specimen. Per ASTM D5528-01 Standard, aloading rate of 0.5mm/min (or 0.02 in/min) for thecross-head speed of the MTS machine was used.Whenever crack advancement due to delamination wasdetected, the machine was unloaded with a cross-headspeed of �0.5mm/min (or �0.02 in./min) for the firstthree unloading steps and �2.5mm/min (or �0.1 in./min) for the last 12 unloading steps. These unloadingsteps are necessary for evaluating Mode I interlaminarfracture toughness GI.
Mode II ENF Tests
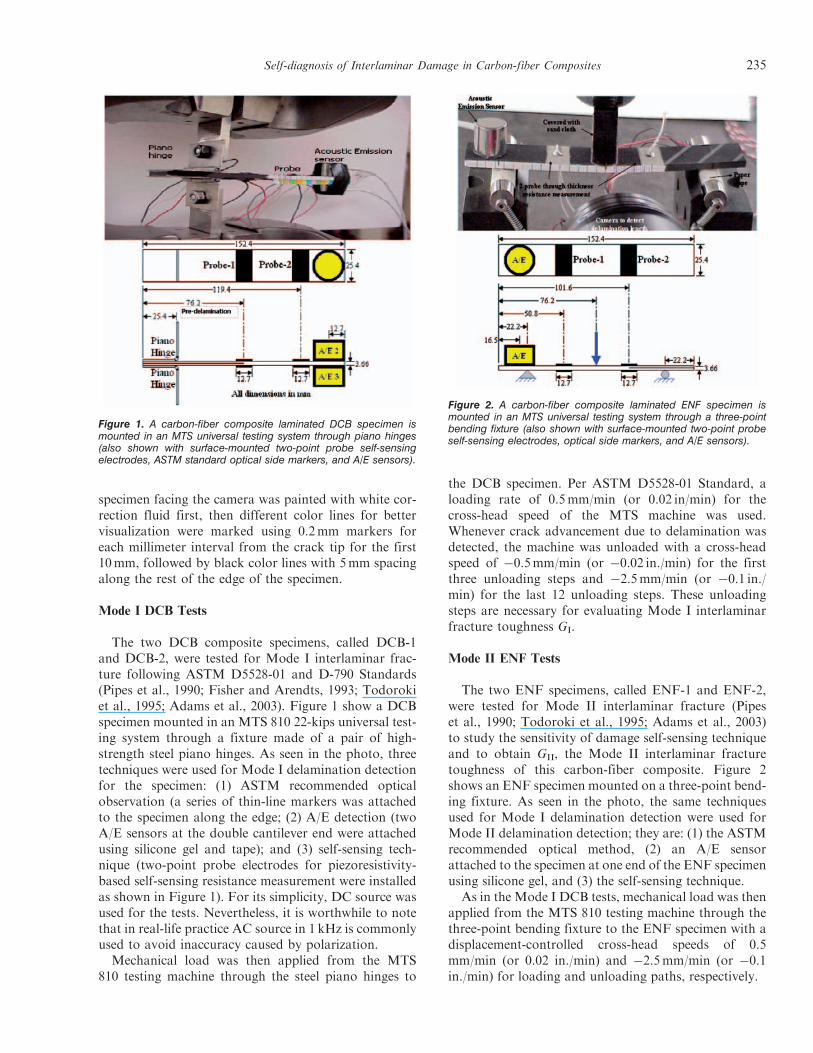
The two ENF specimens, called ENF-1 and ENF-2,were tested for Mode II interlaminar fracture (Pipeset al., 1990; Todoroki et al., 1995; Adams et al., 2003)to study the sensitivity of damage self-sensing techniqueand to obtain GII, the Mode II interlaminar fracturetoughness of this carbon-fiber composite. Figure 2shows an ENF specimen mounted on a three-point bend-ing fixture. As seen in the photo, the same techniquesused for Mode I delamination detection were used forMode II delamination detection; they are: (1) the ASTMrecommended optical method, (2) an A/E sensorattached to the specimen at one end of the ENF specimenusing silicone gel, and (3) the self-sensing technique.
As in the Mode I DCB tests, mechanical load was thenapplied from the MTS 810 testing machine through thethree-point bending fixture to the ENF specimen with adisplacement-controlled cross-head speeds of 0.5mm/min (or 0.02 in./min) and �2.5mm/min (or �0.1in./min) for loading and unloading paths, respectively.
Figure 1. A carbon-fiber composite laminated DCB specimen ismounted in an MTS universal testing system through piano hinges(also shown with surface-mounted two-point probe self-sensingelectrodes, ASTM standard optical side markers, and A/E sensors).
Figure 2. A carbon-fiber composite laminated ENF specimen ismounted in an MTS universal testing system through a three-pointbending fixture (also shown with surface-mounted two-point probeself-sensing electrodes, optical side markers, and A/E sensors).
Self-diagnosis of Interlaminar Damage in Carbon-fiber Composites 235
FRACTURE TOUGHNESS
In addition to the self-sensing technique, the per-formed tests were used to assess the Mode I and IIinterlaminar fracture toughnesses GI and GII. Linearelastic material behavior is assumed in the calculationsof GI and GII. This assumption is valid when the zone ofdamage or non-linear deformation at the delaminationfront is small relative to the smallest specimen dimen-sion, which is typically the specimen thickness.The Mode I interlaminar strain energy release rate
(or fracture toughness) GI of a perfectly clamped DCBcan be calculated based on the Bernoulli�Euler beamtheory (Pipes et al., 1990; Adams et al., 2003):
GI ¼3P�
2ba, ð1Þ
where P is the force at delamination length of a (which isthe distance between the loading point and the cracktip), � the mid point deflection, and b the width of thespecimen. In practice, this expression will overestimateGI because the beam is not perfectly built-in (that is,rotation may occur at the clamped end). One way ofcorrecting for this rotation is to treat the DCB as if itcontained a slightly longer delamination (aþ�), wherethe correction factor of the delamination length, �, maybe determined experimentally by generating a least-square plot of the cube root of compliance, C1/3, as afunction of delamination length a. The compliance C isthe ratio of the load point displacement to the appliedload, �/P. The values used to generate this plot should bethe load and displacements corresponding to the visuallyobserved delamination onset on the edge and all thepropagation values. The Mode I interlaminar fracturetoughness can then be calculated as (Pipes et al., 1990;Adams et al., 2003):
GI ¼3P�
2b aþ�ð Þ: ð2Þ
Other theories, including the modified beam theory(MBT), the compliance calibration (CC), and the mod-ified compliance calibration (MCC) methods, can alsobe used to calculate the Mode I interlaminar fracturetoughness (Pipes et al., 1990; Adams et al., 2003).In the DCB tests, as the delamination grows from a
precrack, which can be generated by several techniques(e.g., Teflon insert, EDM or water-jet machining, etc.),a resistance-type fracture behavior typically developswhere the calculated GI first increases monotonically,and then stabilizes with further delamination growth.In this test method, a resistance curve (i.e., the R curve)depicting GI as a function of delamination length willbe generated to characterize the initiation and propaga-tion of a delamination in a unidirectional specimen.
The principal reason for the observed resistance to dela-mination is the development of fiber bridging. This fiberbridging mechanism results from growing the delamina-tion between two laminated plies.
As far as the Mode II interlaminar fracture test forENF specimens is concerned, currently there is noASTM Standard available. Using Bernoulli�Eulerbeam theory, the compliance C and the Mode II inter-laminar strain energy release rate (or fracture toughness)GII of an ENF specimen can be expressed as (Pipes et al.,1990; Adams et al., 2003):
C ¼�
P¼
2L3 þ 3a3
8E11bh3, ð3Þ
GII ¼9P2a2
16E11b2h3: ð4Þ
Here, L is the half of the beam span, h half of the spec-imen thickness, a crack length (which is the distancebetween the crack-side pin-support and the crack tip),b specimen width, P the applied load, and E11 the elasticmodulus in the longitudinal direction of the specimen.
RESULTS AND DISCUSSIONS
DCB Mode I Interlaminar Fracture
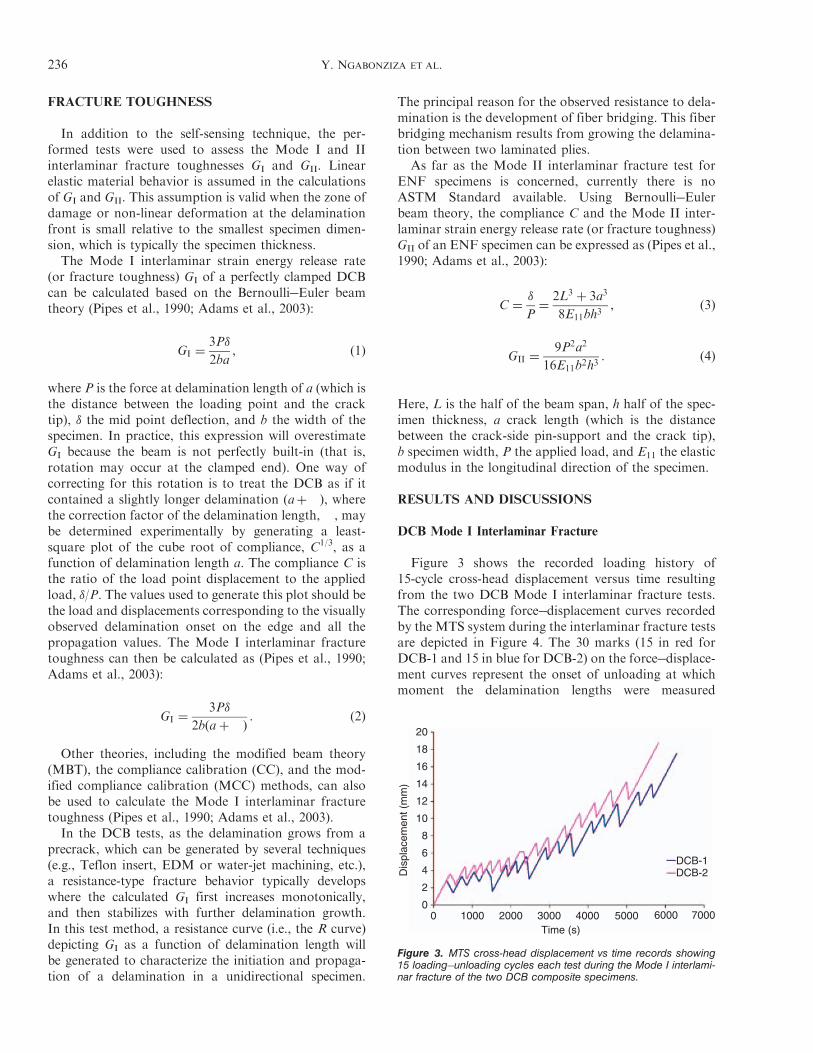
Figure 3 shows the recorded loading history of15-cycle cross-head displacement versus time resultingfrom the two DCB Mode I interlaminar fracture tests.The corresponding force�displacement curves recordedby the MTS system during the interlaminar fracture testsare depicted in Figure 4. The 30 marks (15 in red forDCB-1 and 15 in blue for DCB-2) on the force�displace-ment curves represent the onset of unloading at whichmoment the delamination lengths were measured
20
18
16
14
12
10
8
6
4
2
0
Dis
plac
emen
t (m
m)
1000 2000 3000 4000 5000 6000 70000Time (s)
DCB-1DCB-2
Figure 3. MTS cross-head displacement vs time records showing15 loading�unloading cycles each test during the Mode I interlami-nar fracture of the two DCB composite specimens.
236 Y. NGABONZIZA ET AL.
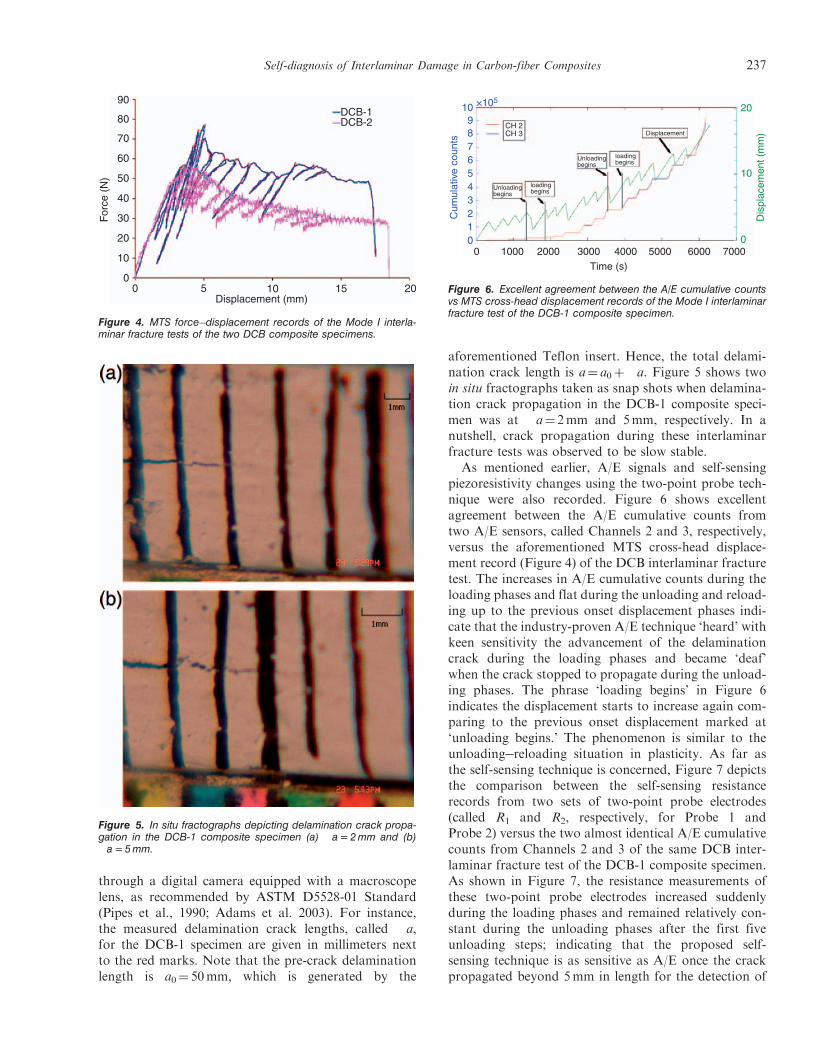
through a digital camera equipped with a macroscopelens, as recommended by ASTM D5528-01 Standard(Pipes et al., 1990; Adams et al. 2003). For instance,the measured delamination crack lengths, called �a,for the DCB-1 specimen are given in millimeters nextto the red marks. Note that the pre-crack delaminationlength is a0¼ 50mm, which is generated by the
aforementioned Teflon insert. Hence, the total delami-nation crack length is a¼ a0þ�a. Figure 5 shows twoin situ fractographs taken as snap shots when delamina-tion crack propagation in the DCB-1 composite speci-men was at �a¼ 2mm and 5mm, respectively. In anutshell, crack propagation during these interlaminarfracture tests was observed to be slow stable.
As mentioned earlier, A/E signals and self-sensingpiezoresistivity changes using the two-point probe tech-nique were also recorded. Figure 6 shows excellentagreement between the A/E cumulative counts fromtwo A/E sensors, called Channels 2 and 3, respectively,versus the aforementioned MTS cross-head displace-ment record (Figure 4) of the DCB interlaminar fracturetest. The increases in A/E cumulative counts during theloading phases and flat during the unloading and reload-ing up to the previous onset displacement phases indi-cate that the industry-proven A/E technique ‘heard’ withkeen sensitivity the advancement of the delaminationcrack during the loading phases and became ‘deaf’when the crack stopped to propagate during the unload-ing phases. The phrase ‘loading begins’ in Figure 6indicates the displacement starts to increase again com-paring to the previous onset displacement marked at‘unloading begins.’ The phenomenon is similar to theunloading�reloading situation in plasticity. As far asthe self-sensing technique is concerned, Figure 7 depictsthe comparison between the self-sensing resistancerecords from two sets of two-point probe electrodes(called R1 and R2, respectively, for Probe 1 andProbe 2) versus the two almost identical A/E cumulativecounts from Channels 2 and 3 of the same DCB inter-laminar fracture test of the DCB-1 composite specimen.As shown in Figure 7, the resistance measurements ofthese two-point probe electrodes increased suddenlyduring the loading phases and remained relatively con-stant during the unloading phases after the first fiveunloading steps; indicating that the proposed self-sensing technique is as sensitive as A/E once the crackpropagated beyond 5mm in length for the detection of
90
80
70
60
50
40
30
20
10
0
For
ce (
N)
Displacement (mm)0 5 10 15 20
DCB-1DCB-2
Figure 4. MTS force�displacement records of the Mode I interla-minar fracture tests of the two DCB composite specimens.
Figure 5. In situ fractographs depicting delamination crack propa-gation in the DCB-1 composite specimen (a) �a = 2 mm and (b)�a = 5 mm.
109876543210
Cum
ulat
ive
coun
ts
×105
CH 2CH 3
Unloadingbegins
Unloadingbegins
loadingbegins
loadingbegins
Displacement
Dis
plac
emen
t (m
m)
20
10
00 1000 2000 3000 4000 5000 6000 7000
Time (s)
Figure 6. Excellent agreement between the A/E cumulative countsvs MTS cross-head displacement records of the Mode I interlaminarfracture test of the DCB-1 composite specimen.
Self-diagnosis of Interlaminar Damage in Carbon-fiber Composites 237
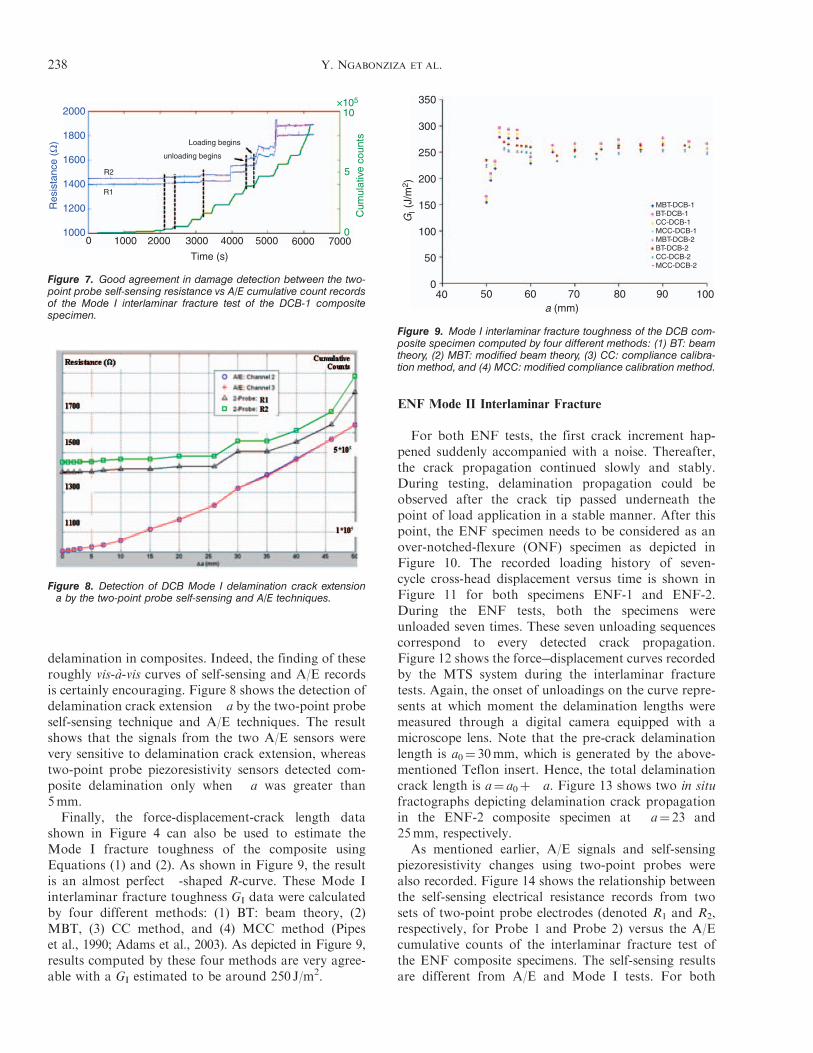
delamination in composites. Indeed, the finding of theseroughly vis-a-vis curves of self-sensing and A/E recordsis certainly encouraging. Figure 8 shows the detection ofdelamination crack extension �a by the two-point probeself-sensing technique and A/E techniques. The resultshows that the signals from the two A/E sensors werevery sensitive to delamination crack extension, whereastwo-point probe piezoresistivity sensors detected com-posite delamination only when �a was greater than5mm.Finally, the force-displacement-crack length data
shown in Figure 4 can also be used to estimate theMode I fracture toughness of the composite usingEquations (1) and (2). As shown in Figure 9, the resultis an almost perfect �-shaped R-curve. These Mode Iinterlaminar fracture toughness GI data were calculatedby four different methods: (1) BT: beam theory, (2)MBT, (3) CC method, and (4) MCC method (Pipeset al., 1990; Adams et al., 2003). As depicted in Figure 9,results computed by these four methods are very agree-able with a GI estimated to be around 250 J/m2.
ENF Mode II Interlaminar Fracture
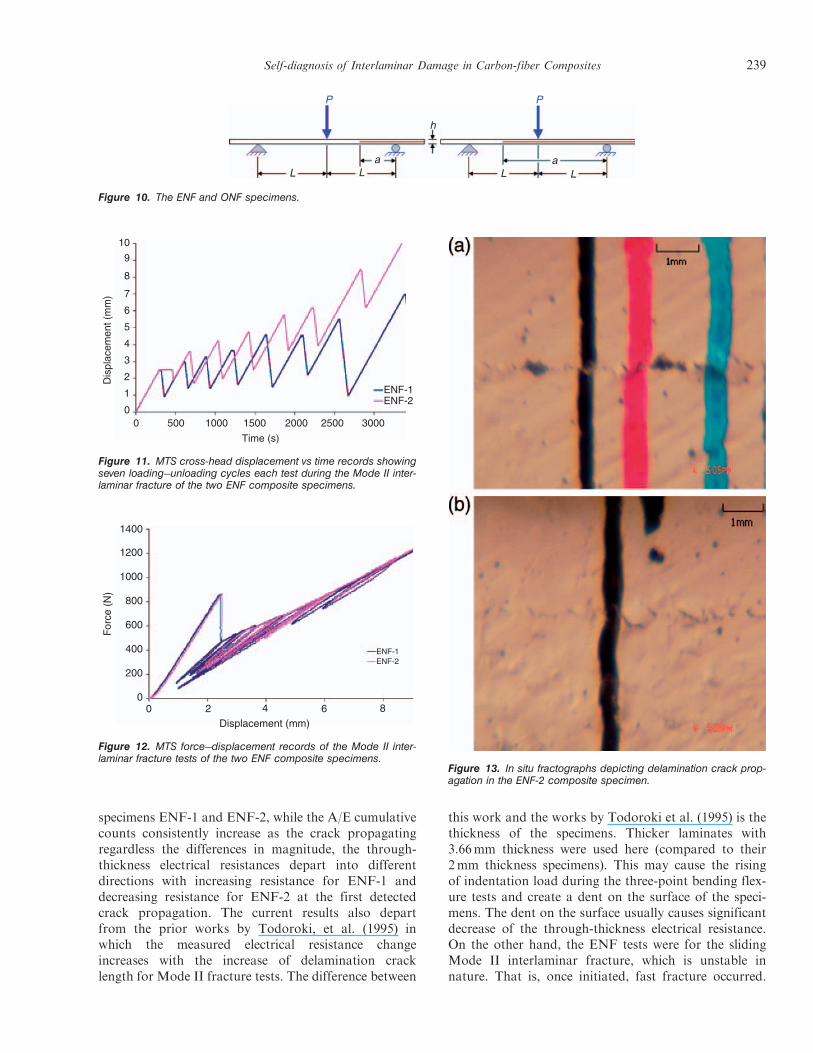
For both ENF tests, the first crack increment hap-pened suddenly accompanied with a noise. Thereafter,the crack propagation continued slowly and stably.During testing, delamination propagation could beobserved after the crack tip passed underneath thepoint of load application in a stable manner. After thispoint, the ENF specimen needs to be considered as anover-notched-flexure (ONF) specimen as depicted inFigure 10. The recorded loading history of seven-cycle cross-head displacement versus time is shown inFigure 11 for both specimens ENF-1 and ENF-2.During the ENF tests, both the specimens wereunloaded seven times. These seven unloading sequencescorrespond to every detected crack propagation.Figure 12 shows the force�displacement curves recordedby the MTS system during the interlaminar fracturetests. Again, the onset of unloadings on the curve repre-sents at which moment the delamination lengths weremeasured through a digital camera equipped with amicroscope lens. Note that the pre-crack delaminationlength is a0¼ 30mm, which is generated by the above-mentioned Teflon insert. Hence, the total delaminationcrack length is a¼ a0þ�a. Figure 13 shows two in situfractographs depicting delamination crack propagationin the ENF-2 composite specimen at �a¼ 23 and25mm, respectively.
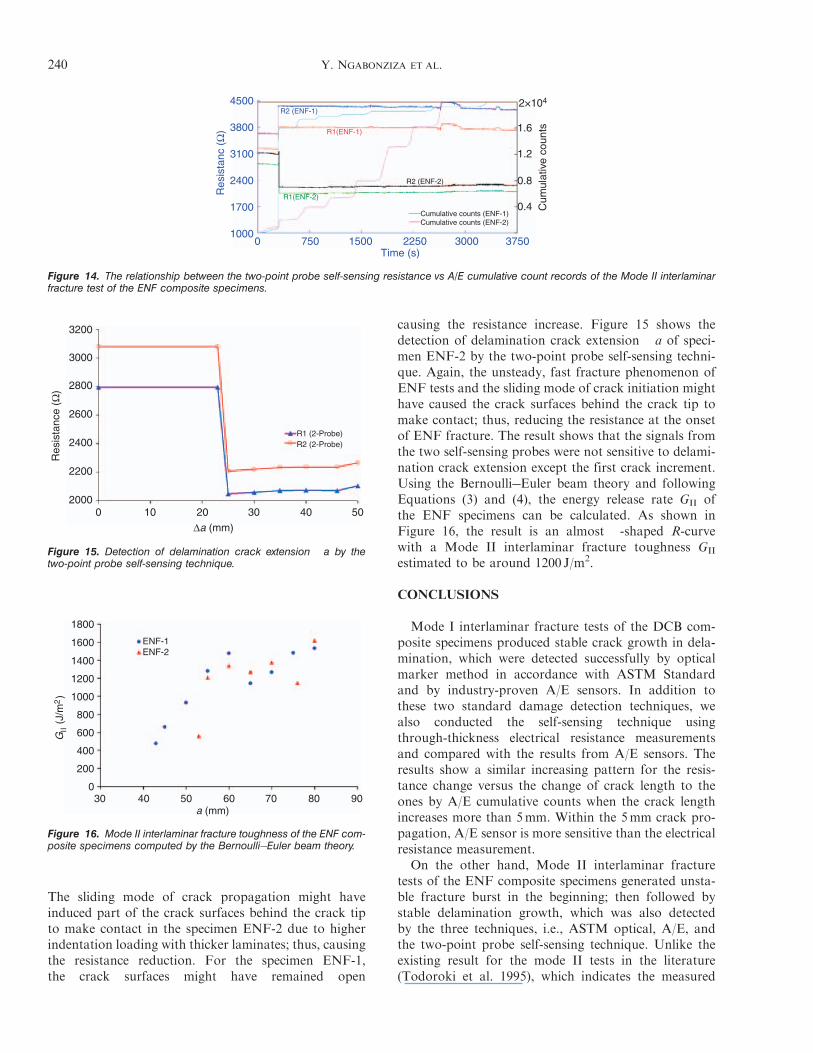
As mentioned earlier, A/E signals and self-sensingpiezoresistivity changes using two-point probes werealso recorded. Figure 14 shows the relationship betweenthe self-sensing electrical resistance records from twosets of two-point probe electrodes (denoted R1 and R2,respectively, for Probe 1 and Probe 2) versus the A/Ecumulative counts of the interlaminar fracture test ofthe ENF composite specimens. The self-sensing resultsare different from A/E and Mode I tests. For both
2000
1800
1600
1400
1200
1000
Res
ista
nce
(Ω)
0 1000 2000 3000 4000 5000 6000 7000
Time (s)
Cum
ulat
ive
coun
ts
5
10×105
R2
R1
Loading begins
unloading begins
0
Figure 7. Good agreement in damage detection between the two-point probe self-sensing resistance vs A/E cumulative count recordsof the Mode I interlaminar fracture test of the DCB-1 compositespecimen.
Figure 8. Detection of DCB Mode I delamination crack extension�a by the two-point probe self-sensing and A/E techniques.
350
300
250
200
150
100
50
0
Gl (
J/m
2 )
40 50 60 70 9080 100a (mm)
MBT-DCB-1BT-DCB-1CC-DCB-1MCC-DCB-1MBT-DCB-2BT-DCB-2CC-DCB-2MCC-DCB-2
Figure 9. Mode I interlaminar fracture toughness of the DCB com-posite specimen computed by four different methods: (1) BT: beamtheory, (2) MBT: modified beam theory, (3) CC: compliance calibra-tion method, and (4) MCC: modified compliance calibration method.
238 Y. NGABONZIZA ET AL.
specimens ENF-1 and ENF-2, while the A/E cumulativecounts consistently increase as the crack propagatingregardless the differences in magnitude, the through-thickness electrical resistances depart into differentdirections with increasing resistance for ENF-1 anddecreasing resistance for ENF-2 at the first detectedcrack propagation. The current results also departfrom the prior works by Todoroki, et al. (1995) inwhich the measured electrical resistance changeincreases with the increase of delamination cracklength for Mode II fracture tests. The difference between
this work and the works by Todoroki et al. (1995) is thethickness of the specimens. Thicker laminates with3.66mm thickness were used here (compared to their2mm thickness specimens). This may cause the risingof indentation load during the three-point bending flex-ure tests and create a dent on the surface of the speci-mens. The dent on the surface usually causes significantdecrease of the through-thickness electrical resistance.On the other hand, the ENF tests were for the slidingMode II interlaminar fracture, which is unstable innature. That is, once initiated, fast fracture occurred.
L LLLa a
P P
h
Figure 10. The ENF and ONF specimens.
10
9
8
7
6
5
4
3
2
1
0
Dis
plac
emen
t (m
m)
0 500 15001000 25002000 3000
Time (s)
ENF-1ENF-2
Figure 11. MTS cross-head displacement vs time records showingseven loading�unloading cycles each test during the Mode II inter-laminar fracture of the two ENF composite specimens.
1400
1200
1000
800
600
400
200
0
For
ce (
N)
0 2 4 6 8
Displacement (mm)
ENF-2ENF-1
Figure 12. MTS force�displacement records of the Mode II inter-laminar fracture tests of the two ENF composite specimens.
Figure 13. In situ fractographs depicting delamination crack prop-agation in the ENF-2 composite specimen.
Self-diagnosis of Interlaminar Damage in Carbon-fiber Composites 239
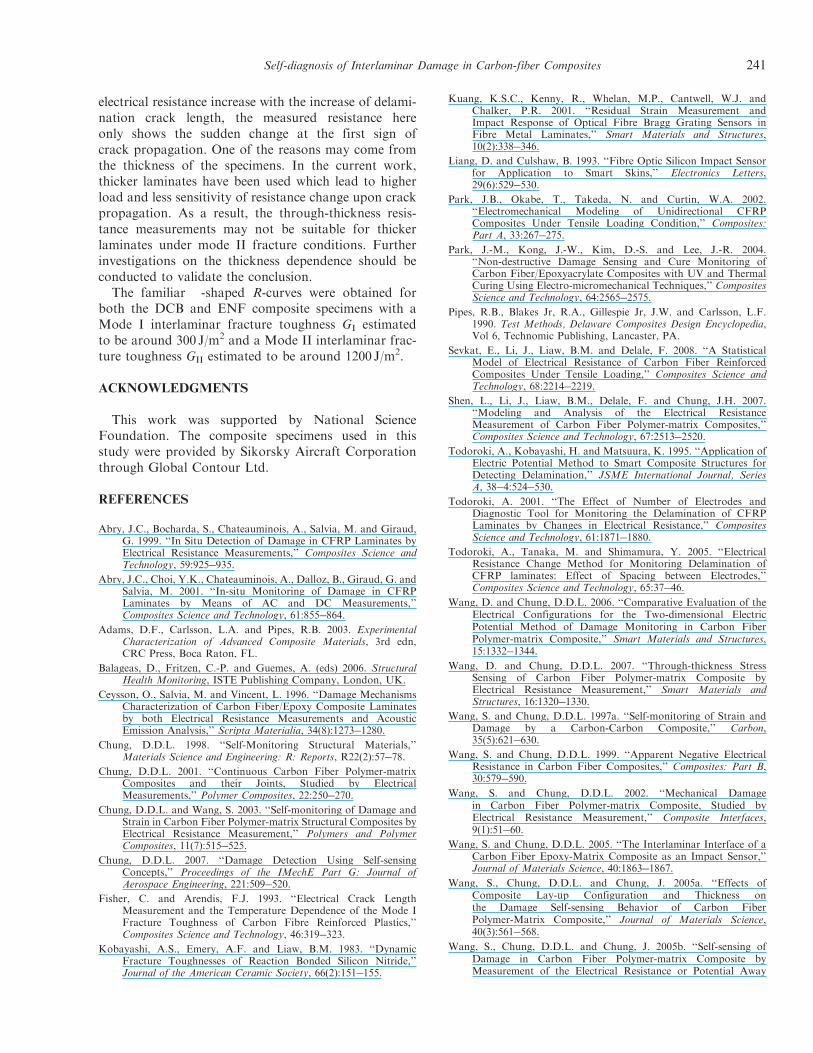
The sliding mode of crack propagation might haveinduced part of the crack surfaces behind the crack tipto make contact in the specimen ENF-2 due to higherindentation loading with thicker laminates; thus, causingthe resistance reduction. For the specimen ENF-1,the crack surfaces might have remained open
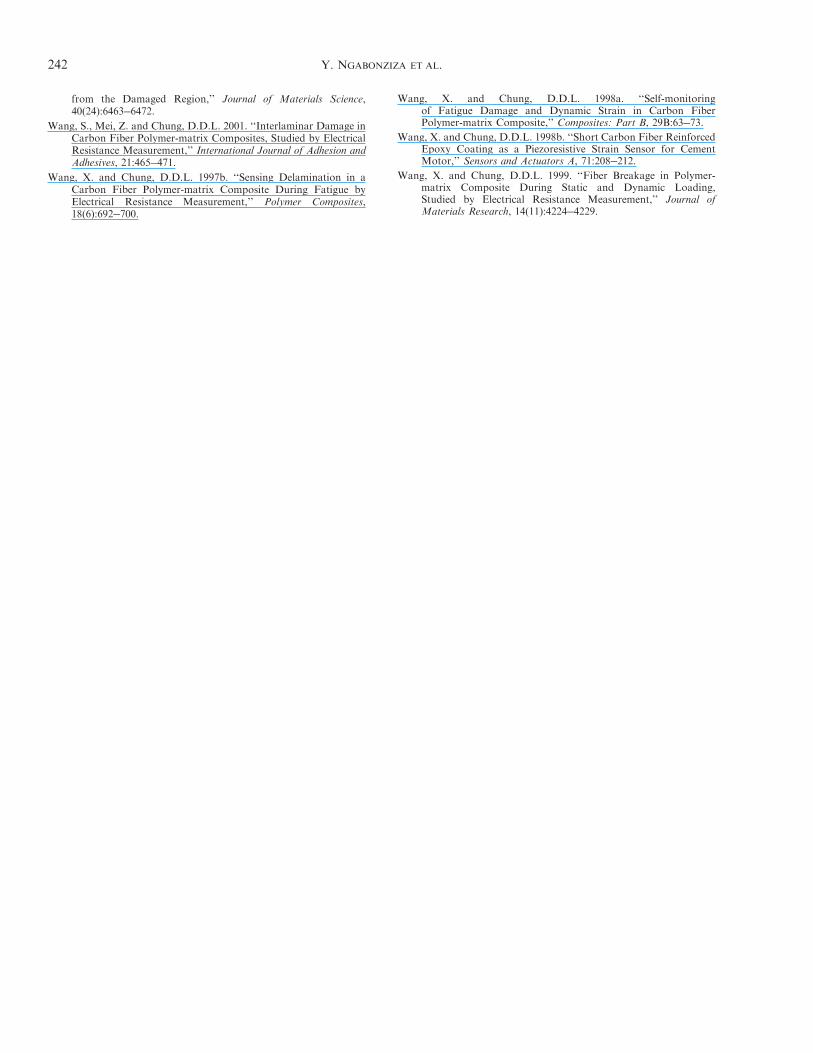
causing the resistance increase. Figure 15 shows thedetection of delamination crack extension �a of speci-men ENF-2 by the two-point probe self-sensing techni-que. Again, the unsteady, fast fracture phenomenon ofENF tests and the sliding mode of crack initiation mighthave caused the crack surfaces behind the crack tip tomake contact; thus, reducing the resistance at the onsetof ENF fracture. The result shows that the signals fromthe two self-sensing probes were not sensitive to delami-nation crack extension except the first crack increment.Using the Bernoulli�Euler beam theory and followingEquations (3) and (4), the energy release rate GII ofthe ENF specimens can be calculated. As shown inFigure 16, the result is an almost �-shaped R-curvewith a Mode II interlaminar fracture toughness GII
estimated to be around 1200 J/m2.
CONCLUSIONS
Mode I interlaminar fracture tests of the DCB com-posite specimens produced stable crack growth in dela-mination, which were detected successfully by opticalmarker method in accordance with ASTM Standardand by industry-proven A/E sensors. In addition tothese two standard damage detection techniques, wealso conducted the self-sensing technique usingthrough-thickness electrical resistance measurementsand compared with the results from A/E sensors. Theresults show a similar increasing pattern for the resis-tance change versus the change of crack length to theones by A/E cumulative counts when the crack lengthincreases more than 5mm. Within the 5mm crack pro-pagation, A/E sensor is more sensitive than the electricalresistance measurement.
On the other hand, Mode II interlaminar fracturetests of the ENF composite specimens generated unsta-ble fracture burst in the beginning; then followed bystable delamination growth, which was also detectedby the three techniques, i.e., ASTM optical, A/E, andthe two-point probe self-sensing technique. Unlike theexisting result for the mode II tests in the literature(Todoroki et al. 1995), which indicates the measured
4500
3800
3100
2400
1700
1000R
esis
tanc
(Ω
)
15007500 2250 3000 3750Time (s)
2×10⁴
1.2
0.8
0.4
1.6
Cum
ulat
ive
coun
ts
Cumulative counts (ENF-1)Cumulative counts (ENF-2)
R2 (ENF-2)
R2 (ENF-1)
R1(ENF-2)
R1(ENF-1)
Figure 14. The relationship between the two-point probe self-sensing resistance vs A/E cumulative count records of the Mode II interlaminarfracture test of the ENF composite specimens.
3200
3000
2800
2600
2400
2200
2000
Res
ista
nce
(Ω)
0 10 20 30 40 50
Δa (mm)
R1 (2-Probe)R2 (2-Probe)
Figure 15. Detection of delamination crack extension �a by thetwo-point probe self-sensing technique.
1800
1600
1400
1200
1000
800
600
400
200
0
Gll (
J/m
2)
30 40 50 60 70 80 90a (mm)
ENF-1ENF-2
Figure 16. Mode II interlaminar fracture toughness of the ENF com-posite specimens computed by the Bernoulli�Euler beam theory.
240 Y. NGABONZIZA ET AL.
electrical resistance increase with the increase of delami-nation crack length, the measured resistance hereonly shows the sudden change at the first sign ofcrack propagation. One of the reasons may come fromthe thickness of the specimens. In the current work,thicker laminates have been used which lead to higherload and less sensitivity of resistance change upon crackpropagation. As a result, the through-thickness resis-tance measurements may not be suitable for thickerlaminates under mode II fracture conditions. Furtherinvestigations on the thickness dependence should beconducted to validate the conclusion.The familiar �-shaped R-curves were obtained for
both the DCB and ENF composite specimens with aMode I interlaminar fracture toughness GI estimatedto be around 300 J/m2 and a Mode II interlaminar frac-ture toughness GII estimated to be around 1200 J/m2.
ACKNOWLEDGMENTS
This work was supported by National ScienceFoundation. The composite specimens used in thisstudy were provided by Sikorsky Aircraft Corporationthrough Global Contour Ltd.
REFERENCES
Abry, J.C., Bocharda, S., Chateauminois, A., Salvia, M. and Giraud,G. 1999. ‘‘In Situ Detection of Damage in CFRP Laminates byElectrical Resistance Measurements,’’ Composites Science andTechnology, 59:925�935.
Abry, J.C., Choi, Y.K., Chateauminois, A., Dalloz, B., Giraud, G. andSalvia, M. 2001. ‘‘In-situ Monitoring of Damage in CFRPLaminates by Means of AC and DC Measurements,’’Composites Science and Technology, 61:855�864.
Adams, D.F., Carlsson, L.A. and Pipes, R.B. 2003. ExperimentalCharacterization of Advanced Composite Materials, 3rd edn,CRC Press, Boca Raton, FL.
Balageas, D., Fritzen, C.-P. and Guemes, A. (eds) 2006. StructuralHealth Monitoring, ISTE Publishing Company, London, UK.
Ceysson, O., Salvia, M. and Vincent, L. 1996. ‘‘Damage MechanismsCharacterization of Carbon Fiber/Epoxy Composite Laminatesby both Electrical Resistance Measurements and AcousticEmission Analysis,’’ Scripta Materialia, 34(8):1273�1280.
Chung, D.D.L. 1998. ‘‘Self-Monitoring Structural Materials,’’Materials Science and Engineering: R: Reports, R22(2):57�78.
Chung, D.D.L. 2001. ‘‘Continuous Carbon Fiber Polymer-matrixComposites and their Joints, Studied by ElectricalMeasurements,’’ Polymer Composites, 22:250�270.
Chung, D.D.L. and Wang, S. 2003. ‘‘Self-monitoring of Damage andStrain in Carbon Fiber Polymer-matrix Structural Composites byElectrical Resistance Measurement,’’ Polymers and PolymerComposites, 11(7):515�525.
Chung, D.D.L. 2007. ‘‘Damage Detection Using Self-sensingConcepts,’’ Proceedings of the IMechE Part G: Journal ofAerospace Engineering, 221:509�520.
Fisher, C. and Arendis, F.J. 1993. ‘‘Electrical Crack LengthMeasurement and the Temperature Dependence of the Mode IFracture Toughness of Carbon Fibre Reinforced Plastics,’’Composites Science and Technology, 46:319�323.
Kobayashi, A.S., Emery, A.F. and Liaw, B.M. 1983. ‘‘DynamicFracture Toughnesses of Reaction Bonded Silicon Nitride,’’Journal of the American Ceramic Society, 66(2):151�155.
Kuang, K.S.C., Kenny, R., Whelan, M.P., Cantwell, W.J. andChalker, P.R. 2001. ‘‘Residual Strain Measurement andImpact Response of Optical Fibre Bragg Grating Sensors inFibre Metal Laminates,’’ Smart Materials and Structures,10(2):338�346.
Liang, D. and Culshaw, B. 1993. ‘‘Fibre Optic Silicon Impact Sensorfor Application to Smart Skins,’’ Electronics Letters,29(6):529�530.
Park, J.B., Okabe, T., Takeda, N. and Curtin, W.A. 2002.‘‘Electromechanical Modeling of Unidirectional CFRPComposites Under Tensile Loading Condition,’’ Composites:Part A, 33:267�275.
Park, J.-M., Kong, J.-W., Kim, D.-S. and Lee, J.-R. 2004.‘‘Non-destructive Damage Sensing and Cure Monitoring ofCarbon Fiber/Epoxyacrylate Composites with UV and ThermalCuring Using Electro-micromechanical Techniques,’’ CompositesScience and Technology, 64:2565�2575.
Pipes, R.B., Blakes Jr, R.A., Gillespie Jr, J.W. and Carlsson, L.F.1990. Test Methods, Delaware Composites Design Encyclopedia,Vol 6, Technomic Publishing, Lancaster, PA.
Sevkat, E., Li, J., Liaw, B.M. and Delale, F. 2008. ‘‘A StatisticalModel of Electrical Resistance of Carbon Fiber ReinforcedComposites Under Tensile Loading,’’ Composites Science andTechnology, 68:2214�2219.
Shen, L., Li, J., Liaw, B.M., Delale, F. and Chung, J.H. 2007.‘‘Modeling and Analysis of the Electrical ResistanceMeasurement of Carbon Fiber Polymer-matrix Composites,’’Composites Science and Technology, 67:2513�2520.
Todoroki, A., Kobayashi, H. and Matsuura, K. 1995. ‘‘Application ofElectric Potential Method to Smart Composite Structures forDetecting Delamination,’’ JSME International Journal, SeriesA, 38�4:524�530.
Todoroki, A. 2001. ‘‘The Effect of Number of Electrodes andDiagnostic Tool for Monitoring the Delamination of CFRPLaminates by Changes in Electrical Resistance,’’ CompositesScience and Technology, 61:1871�1880.
Todoroki, A., Tanaka, M. and Shimamura, Y. 2005. ‘‘ElectricalResistance Change Method for Monitoring Delamination ofCFRP laminates: Effect of Spacing between Electrodes,’’Composites Science and Technology, 65:37�46.
Wang, D. and Chung, D.D.L. 2006. ‘‘Comparative Evaluation of theElectrical Configurations for the Two-dimensional ElectricPotential Method of Damage Monitoring in Carbon FiberPolymer-matrix Composite,’’ Smart Materials and Structures,15:1332�1344.
Wang, D. and Chung, D.D.L. 2007. ‘‘Through-thickness StressSensing of Carbon Fiber Polymer-matrix Composite byElectrical Resistance Measurement,’’ Smart Materials andStructures, 16:1320�1330.
Wang, S. and Chung, D.D.L. 1997a. ‘‘Self-monitoring of Strain andDamage by a Carbon-Carbon Composite,’’ Carbon,35(5):621�630.
Wang, S. and Chung, D.D.L. 1999. ‘‘Apparent Negative ElectricalResistance in Carbon Fiber Composites,’’ Composites: Part B,30:579�590.
Wang, S. and Chung, D.D.L. 2002. ‘‘Mechanical Damagein Carbon Fiber Polymer-matrix Composite, Studied byElectrical Resistance Measurement,’’ Composite Interfaces,9(1):51�60.
Wang, S. and Chung, D.D.L. 2005. ‘‘The Interlaminar Interface of aCarbon Fiber Epoxy-Matrix Composite as an Impact Sensor,’’Journal of Materials Science, 40:1863�1867.
Wang, S., Chung, D.D.L. and Chung, J. 2005a. ‘‘Effects ofComposite Lay-up Configuration and Thickness onthe Damage Self-sensing Behavior of Carbon FiberPolymer-Matrix Composite,’’ Journal of Materials Science,40(3):561�568.
Wang, S., Chung, D.D.L. and Chung, J. 2005b. ‘‘Self-sensing ofDamage in Carbon Fiber Polymer-matrix Composite byMeasurement of the Electrical Resistance or Potential Away
Self-diagnosis of Interlaminar Damage in Carbon-fiber Composites 241
from the Damaged Region,’’ Journal of Materials Science,40(24):6463�6472.
Wang, S., Mei, Z. and Chung, D.D.L. 2001. ‘‘Interlaminar Damage inCarbon Fiber Polymer-matrix Composites, Studied by ElectricalResistance Measurement,’’ International Journal of Adhesion andAdhesives, 21:465�471.
Wang, X. and Chung, D.D.L. 1997b. ‘‘Sensing Delamination in aCarbon Fiber Polymer-matrix Composite During Fatigue byElectrical Resistance Measurement,’’ Polymer Composites,18(6):692�700.
Wang, X. and Chung, D.D.L. 1998a. ‘‘Self-monitoringof Fatigue Damage and Dynamic Strain in Carbon FiberPolymer-matrix Composite,’’ Composites: Part B, 29B:63�73.
Wang, X. and Chung, D.D.L. 1998b. ‘‘Short Carbon Fiber ReinforcedEpoxy Coating as a Piezoresistive Strain Sensor for CementMotor,’’ Sensors and Actuators A, 71:208�212.
Wang, X. and Chung, D.D.L. 1999. ‘‘Fiber Breakage in Polymer-matrix Composite During Static and Dynamic Loading,Studied by Electrical Resistance Measurement,’’ Journal ofMaterials Research, 14(11):4224�4229.
242 Y. NGABONZIZA ET AL.
Copyright © 2022 FDOKUMEN