
An Evaluation of Seismic Design Guidelines Proposed for Precast Jointed Wall Systems
159
Iowa State University Digital Repository @ Iowa State University Civil, Construction and Environmental Engineering Technical Reports Civil, Construction and Environmental Engineering 6-2004 An Evaluation of Seismic Design Guidelines Proposed for Precast Jointed Wall Systems Derek J. omas Iowa State University Sri Sritharan Iowa State University, [email protected] Follow this and additional works at: hp://lib.dr.iastate.edu/ccee_reports Part of the Civil Engineering Commons , and the Structural Engineering Commons is Report is brought to you for free and open access by the Civil, Construction and Environmental Engineering at Digital Repository @ Iowa State University. It has been accepted for inclusion in Civil, Construction and Environmental Engineering Technical Reports by an authorized administrator of Digital Repository @ Iowa State University. For more information, please contact [email protected]. Recommended Citation omas, Derek J. and Sritharan, Sri, "An Evaluation of Seismic Design Guidelines Proposed for Precast Jointed Wall Systems" (2004). Civil, Construction and Environmental Engineering Technical Reports. Paper 7. hp://lib.dr.iastate.edu/ccee_reports/7
Transcript of An Evaluation of Seismic Design Guidelines Proposed for Precast Jointed Wall Systems
Iowa State UniversityDigital Repository @ Iowa State UniversityCivil, Construction and Environmental EngineeringTechnical Reports Civil, Construction and Environmental Engineering
6-2004
An Evaluation of Seismic Design GuidelinesProposed for Precast Jointed Wall SystemsDerek J. ThomasIowa State University
Sri SritharanIowa State University, [email protected]
Follow this and additional works at: http://lib.dr.iastate.edu/ccee_reportsPart of the Civil Engineering Commons, and the Structural Engineering Commons
This Report is brought to you for free and open access by the Civil, Construction and Environmental Engineering at Digital Repository @ Iowa StateUniversity. It has been accepted for inclusion in Civil, Construction and Environmental Engineering Technical Reports by an authorized administratorof Digital Repository @ Iowa State University. For more information, please contact [email protected].
Recommended CitationThomas, Derek J. and Sritharan, Sri, "An Evaluation of Seismic Design Guidelines Proposed for Precast Jointed Wall Systems" (2004).Civil, Construction and Environmental Engineering Technical Reports. Paper 7.http://lib.dr.iastate.edu/ccee_reports/7

D. J. Thomas, S. Sritharan
An Evaluation of Seismic Design Guidelines Proposed for Precast Jointed Wall Systems
ISU-ERI-Ames Report ERI-04643 Submitted to the Precast/Prestressed Concrete
Manufacturers Association of California
JUNE 2004
Final
REPORT
IOWA STATE UNIVERSITY O F S C I E N C E A N D T E C H N O L O G Y
Department of Civil, Construction and Environmental Engineering

An Evaluation of Seismic Design Guidelines Proposed for Precast Jointed Wall Systems
by
Derek J. Thomas Graduate Research Assistant
Sri Sritharan
Assistant Professor
ISU-ERI-Ames Report ERI-04643
A Final Report to the Precast/Prestressed Concrete Manufacturers Association of California
Department of Civil, Construction and Environmental Engineering
Iowa State University Ames, IA 50011
June 2004

ii
ABSTRACT
Following the satisfactory response of the unbonded post-tensioned precast concrete jointed
wall system tested for seismic performance as part of the PREcast Seismic Structural
Systems (PRESSS) test building, a set of design guidelines was published. The primary
objective of the research presented in this report is to evaluate the adequacy of the design
guidelines and make appropriate recommendations so that the guidelines can be adopted for
design of jointed precast walls in seismic regions. The test data to date on such systems are
those collected during the wall direction testing of the PRESSS test building. Hence, this data
set has been employed in the validation process.
Furthermore, in order to validate the design guidelines over a range of lateral displacements,
an analytical procedure was first developed by reversing the suggested guidelines.
Additionally, because of the shortcomings associated with the use of the equivalent stress
block concept in design, an alternative analysis method was also considered, which was
based on the monolithic beam analogy (MBA) originally developed for jointed frame
systems. The analytical results from monotonic loading were compared to experimental
response of the jointed wall established from the PRESSS test data.
It was found that the analysis method based on the PRESSS guidelines underestimated the
lateral load resistance of the jointed wall in the PRESSS test building by up to 22% at large
lateral displacements and overestimated by greater percentages at small displacements. When
iii

the force transferred through the shear connectors was based on the measured force-
displacement response, the PRESSS guidelines and MBA underestimated the moment
response of the jointed wall by 12% and 5%, respectively, at the maximum measured lateral
displacement. However, utilizing the PRESSS guidelines with the measured force in the
shear connectors, it was found that the neutral axis depth was overestimated by over 100%
and the post-tensioning elongation was underestimated by 26%. It was also revealed that the
framing action contributed to the moment resistance in the wall direction of the PRESSS
building by as much as 25%. Several recommendations are provided for improving the
PRESSS design guidelines, which will simplify the design calculations while providing
efficient design details for the precast jointed wall systems. With improvements, the PRESSS
guidelines are shown to predict the observed performance of the jointed wall in the PRESSS
test building satisfactorily.
iv
ACKNOWLEDGEMENTS
The research described in this report was funded by the Precast/Prestressed Concrete
Manufacturers Association of California (PCMAC), which is greatly acknowledged.
Additionally, the authors would like to thank Professor John F. Stanton of the University of
Washington and Suzanne D. Nakaki of the Nakaki Bashaw Group, Inc. for their assistance
during this project.
Conclusions, opinions and recommendations expressed in this report are those of the authors
alone, and should not be construed as being endorsed by the financial sponsor.
v

vi
TABLE OF CONTENTS
Abstract iii
Acknowledgements v
List of Figures x
List of Tables xv
List of Symbols xvi
Chapter 1: Introduction 1
1.1 Overview 1
1.2 Past Performance of Shear Walls in Seismic Events 1
1.3 Benefits of Precast Walls 6
1.4 Limitations of Precast Concrete in Seismic Regions 7
1.5 Unbonded Precast Wall Systems 9
1.6 Scope of Research 18
1.7 Report Layout 19
1.8 Wall Definitions 19
Chapter 2: Literature Review 21
2.1 Precast Seismic Wall Systems 21
2.2 Precast Seismic Design Considerations 21
2.3 Precast Concrete Emulation 24
2.4 Unbonded Post-Tensioned Precast Wall Systems 27
2.4.1 Behavior and Analysis 27
2.4.2 Design 37
2.5 Precast Jointed Wall Systems 43
2.5.1 Behavior and Analysis 43
2.5.2 Design 50
vii
Chapter 3: Formulation of Validation Procedure 67
3.1 Introduction 67
3.2 Analysis Method Based on PRESSS Design Guidelines 68
3.3 Alternative Analysis Method 75
3.3.1 Application of Monolithic Beam Analogy 75
3.3.2 Step-by-Step Procedure 77
Chapter 4: Comparison of Experimental and Analytical Results 89
4.1 Introduction 89
4.2 Experimental Data 89
4.2.1 Test Setup 90
4.2.2 Selected Data Points 92
4.2.3 Determining Critical Parameters 93
4.2.4 Validity of Extracted Data 95
4.2.5 Best Fit Curves 99
4.2.6 Response Envelope 100
4.3 Validation of Analytical Methods 101
4.3.1 Base Moment Resistance 102
4.3.2 Post-tensioning Bar Elongation 103
4.3.3 Neutral Axis Depth 106
4.4 Contribution of Framing Action 107
4.4.1 2-D Frame Model 108
4.4.2 Total Response 113
4.5 Recommendations 115
4.5.1 Recommendations for the PRESSS Guidelines 115
4.5.2 Recommendations for MBA Method 119
Chapter 5: Conclusions and Recommendations 123
5.1 Overview 123
5.2 Conclusions 124
viii

5.3 Recommendations 125
5.4 Future Research 127
References 128
ix
LIST OF FIGURES
Figure 1.1 Performance of two adjacent buildings in the Caracas earthquake [2]. 3
Figure 1.2 Six-story Indian Hill Medical Center with shear walls [4]. 4
Figure 1.3 Damaged concrete frame building in the 1971 San Fernando
earthquake [4] 4
Figure 1.4 Floor plans of the PRESSS test building [12]. 12
Figure 1.5 Elevation view of the jointed wall system in the PRESSS test
building [12]. 13
Figure 1.6 The PRESSS building after erecting the wall system [15]. 14
Figure 1.7 Connection details of UFP connectors in the PRESSS building [12] 15
Figure 1.8 Forces acting on a jointed wall system, adopted from [18]. 17
Figure 1.9 Overall response of the PRESSS building in the wall direction. 18
Figure 2.1 A lapped splice connection suggested between precast wall panel
and precast floor slab [22]. 26
Figure 2.2 Wall behavior along horizontal joints: (a) gap opening, (b) shear
slip [13, 24]. 28
Figure 2.3 Lateral load behavior of a precast wall with unbonded post-tensioning
[13, 24]. 29
Figure 2.4 Force-displacement response of an unbonded prestressed precast wall
under cyclic loading [13, 24]. 30
Figure 2.5 Predicted base moment-rotation response of an unbonded precast wall
[13, 24]. 31
x
Figure 2.6 Comparison of roof drifts obtained from dynamic analysis of walls
[13, 24]. 32
Figure 2.7 Unbonded precast prestressed walls studied by Kurama et al.: (a) typical
wall, and (b) through (f) prototype walls chosen for the study [25]. 34
Figure 2.8 Unbonded post-tensioned precast wall system: (a) elevation, and (b) cross
section near base [13, 24]. 38
Figure 2.9 Details of the U-shaped Flexure Plate (UFP) connector investigated by
Schultz and Magana [28]. 44
Figure 2.10 Force-displacement response reported for a UFP connector by Schultz
and Magana [28]. 45
Figure 2.11 Overall response of the PRESSS building in the wall direction testing
[29]. 46
Figure 2.12 The RUAUMOKO model developed by Conley et al. to represent the
PRESSS building in the wall direction [30]. 48
Figure 2.13 The base moment-lateral displacement prediction made by Conley et al.
[25]. 49
Figure 2.14 Forces acting on a precast jointed multiple wall system (adopted from
[18]). 54
Figure 2.15 Locations of forces in an unbonded post-tensioned wall system [18]. 59
Figure 2.16 A flow chart representation of the PRESSS recommended design
procedure. 60
Figure 2.17 Forces acting on a UFP connector under inelastic conditions [18]. 62
Figure 2.18 Stress-strain relation of the UFP material [18]. 63
xi
Figure 3.1 Flowchart describing the analysis procedure for the jointed wall system
developed based on the PRESSS design guidelines. 70
Figure 3.2 Forces acting on a jointed wall system consisting of two walls. 72
Figure 3.3 Force transferred through a UFP connector as a function of relative vertical
displacement between the wall panels established from experimentation. 74
Figure 3.4 Flexural response and associated curvatures: (a) and (b) corresponds to a
precast wall, and (c) and (d) correspond to an equivalent monolithic wall. 76
Figure 3.5 Flowchart summarizing the main steps involved in the wall system analysis
using the MBA concept. 79
Figure 3.6 Stress profile at the base of the wall caused by: (a) the initial post-
tensioning and gravity loads including the self-weight of the wall,
(b) lateral force Fdecomp on the wall, and (c) by combination of loads
from (a) and (b). 81
Figure 3.7 Forces acting on the jointed wall system at base rotation θ: (a) full view,
and (b) enlarged view at the base of a wall. 83
Figure 3.8 Confined and unconfined concrete stress-strain relationship established
for the PRESSS walls using the Mander’s model and measured concrete
strengths. 87
Figure 3.9 Representation of the compression zone with several rectangular sections
to compute the resultant force and its location using the Simpson’s rule. 87
and (b) schematic 86
Figure 4.1 Test setup in the wall direction testing of the PRESSS building [16]. 90
Figure 4.2 Observed response of the PRESSS test building in the jointed wall
xii

direction with data points selected for isolating the response envelope of
the jointed wall. 91
Figure 4.3 Typical floor forces introduced during testing of the PRESSS building. 92
Figure 4.4 Plan view of instruments measuring vertical displacements at the base of
the wall system. 94
Figure 4.5 North profile view of instruments at base of wall panel W1. 94
Figure 4.6 Location of device W1VCS. 96
Figure 4.7 Vertical displacement history experienced by the UFP connectors during
the PRESSS building test in the wall direction. 96
Figure 4.8 A comparison of experimental strains due to elongation of the post-
tensioning tendons. 97
Figure 4.9 Wall base profile comparison. 98
Figure 4.10 Wall end uplift estimated from test data. 99
Figure 4.11 Post-tensioning elongation estimated from test data. 100
Figure 4.12 Neutral axis depths estimated from test data. 101
Figure 4.13 Base moment response envelope. 103
Figure 4.14 Post-tensioning elongation in leading wall. 105
Figure 4.15 Post-tensioning elongation in trailing wall. 105
Figure 4.16 Neutral axis depth in leading wall. 107
Figure 4.17 Neutral axis depth in trailing wall. 108
Figure 4.18 2-D RUAUMOKO frame model. 109
Figure 4.19 Column moment-rotation behavior for the model in Figure 4.18. 111
Figure 4.20 Floor to seismic frame connection details used at Floors 1, 2 and 3
xiii

of the PRESSS building. 113
Figure 4.21 Base-moment versus top floor displacement response comparison for the
jointed wall system in the PRESSS building. 114
Figure 4.22 Neutral axis depth predicted by improved PRESSS recommendations. 117
Figure 4.23 Post-tensioning elongation predicted by improved PRESSS
recommendations. 118
Figure 4.24 Moment response predicted by improved PRESSS recommendations. 118
Figure 4.25 Post-tensioning strain by improved MBA method. 120
Figure 4.26 Neutral axis depth predicted by the improved MBA method. 121
Figure 4.27 Post-tensioning elongation predicted by the improved MBA method. 121
Figure 4.28 Moment response predicted by the improved MBA method. 122
xiv

LIST OF TABLES
Table 4.1 Dimensions and properties of the walls in the PRESSS building. 93
Table 4.2 Properties of elements in the 2-D RUAUMOKO frame model. 109
xv

LIST OF SYMBOLS
A Area of wall base
Ap
Area of post-tensioning steel
B
Entire wall system length
b
Width of one wall panel
bsc
Width of UFP connector
c
Neutral axis depth
C
Compressive reaction on one wall panel
C0
Compressive reaction on one wall panel at zero drift
Cc
Compression capacity of one wall panel
Cconf
Compressive reaction obtained utilizing confinement model
Cdes
Compressive reaction on one wall panel at design limit state
Dsc
Bend diameter in UFP connector
Ec
Modulus of elasticity of concrete
Ep
Modulus of elasticity of post-tensioning steel
Esec
Secant modulus of confined concrete at peak stress
F
Vertical interface shear force
fc
Concrete stress
'cf
Concrete compressive strength
'ccf
Confined concrete compressive strength
Fdecomp Horizontal force on the wall that causes decompression at wall base
xvi
FH
Horizontal force imposed by actuator
'gf
Grout strength
'lxf
Effective lateral confining stress in the 'x' direction
'lyf
Effective lateral confining stress in the 'y' direction
fp
Total stress in the post-tensioning tendon
fp,des
Stress in post-tensioning tendon at design limit state
fp0
Initial stress in the post-tensioning tendon
fpi
Initial stress in the post-tensioning tendon
fpy
Yield strength of post-tensioning tendon
Fsc
Total force of all shear connectors along a vertical joint
fsc,des
Stress in UFP connector plate under plastic conditions
Fsc,left
Total force of all shear connectors in joint to left of panel
Fsc,net
Net vertical force on one panel from all shear connectors
Fsc,right
Total force of all shear connectors in joint to right of panel
Fsc0
Total force in one shear connector
Fu
Ultimate stress of UFP connector
FV
Vertical force induced by actuator
fye
Expected yield strength
fyh
Yield strength of transverse reinforcement
G
Shear modulus
heff
Height above foundation of lateral load resultant on wall
Hstory
Height per story
Ht Wall height
xvii

hu Unbonded length of post-tensioning tendon
hw
Wall height
I
Moment of inertia
Ieff
Effective moment of inertia
k1
Uniform stress in Whitney rectangular stress block divided by 'gf
Ke
Confinement effectiveness coefficient
Lp
Equivalent plastic hinge length
lw
Length of one wall panel
lw,tot
Total wall length
M
Moment resistance of wall
Mcap,panel
Moment capacity of one panel
Mcap,wall
Total moment capacity of wall system
Mdecomp
Base moment at decompression point
Mdes
Moment demand at design limit state
Mlo
Lift-off moment of wall
Mn
Nominal moment of wall
Mot
Overturning moment
Mr,net
Net righting moment of wall
Msc
Plastic moment strength of one UFP connector
Mu
Factored moment
n
Number of wall panels
N
Total tension force on one wall panel from gravity plus post-tensioning
xviii

N0
Total tension force on one wall panel from gravity plus post-tensioning at zero drift
Ndes Total tension force on one wall panel from gravity plus post-tensioning at design limit state
Ndes Total tension force on one wall panel from gravity plus post-tensioning at design limit state
nsc Number of shear connectors required per vertical joint
nstory
Number of stories
Nufp
Number of UFP connectors along a vertical joint
P
Total force in the post-tensioning tendon
P0
Initial Force in the post-tensioning tendon
Pdes
Force in the post-tensioning tendon at design limit state
Pp0
Wall panel post-tensioning force
Pu
Factored axial load
Qdes
Base shear demand for the design level ground motion
R
Response modification factor
R
Average radius of the UFP
S
Section modulus
t
Wall thickness
t
Plate thickness in UFP connector
tsc
Plate thickness in UFP connector
tw
Thickness of wall panel
tw,eff Thickness of wall panel effective in resisting compressive force
xix

V
Base shear
V Force in each UFP connector
V1
Force applied to 1st floor by the actuator
V2
Force applied to 2nd floor by the actuator
V3
Force applied to 3rd floor by the actuator
V4
Force applied to 4th floor by the actuator
V5
Force applied to 5th floor by the actuator
Vb
Base shear
Vcsc
Base shear capacity at the failure state
Vdec
Base shear capacity at decompression state
Vdes
Base shear demand under design level ground motion
Vdes
Design base shear
Vell
Base shear capacity at the softening state
Vi
Force applied to ith floor by the actuator
Vllp
Base shear capacity at the yielding state
Vmax
Expected maximum base shear demand under survival level ground motion
Vsc
Shear strength of one UFP shear connector
Vss
Shear slip capacity
vu
Factored shear stress
W
Self weight of wall panel
W
Total gravity load from all floors on one panel
Wpanel
Self-weight of one panel
xx

Wstory
Building weight per floor
α distance from the compression face of the member to the center of the compression force divided by the member depth
α0 distance from the compression face of the member to the center of the compression force divided by the member depth at zero drift
αdes distance from the compression face of the member to the center of the compression force divided by the member depth at design limit state
β Moment arm reduction coefficient
β1
Depth of equivalent stress block divided by the neutral axis depth
Δ
Roof drift
δall
Allowable story drift defined by NEHRP
Δcsc
Roof drift capacity at the failure state
Δctc Roof drift capacity corresponding to the crushing of the concrete inside the wire mesh
Δdec
Roof drift capacity at decompression state
δdes
Maximum story drift demand under design-level ground motion
Δdes
Expected maximum roof drft demand under design-level ground motion
Δe
Elastic displacement component of a monolithic wall
Δell
Roof drift capacity at softening state
Δenduplift
Wall end uplift
Δg
Maximum roof drift that can be sustained by gravity load system
Δfp
Increase in stress in post-tensioning tendon
xxi

Δfp∞ Increase in stress in post-tensioning tendon between zero and design drift when concrete and grout strength are infinite
Δj
Top floor displacement of jointed precast wall
Δllp Roof drift capacity at the yielding state
Δm
Top floor displacement of monolithic wall
Δp
Elongation of post-tensioning tendon
Δp
Plastic displacement component of a monolithic wall
Δsur
Expected maximum roof drift demand under survival-level ground motion
Δsur
Maximum roof drift demand under the survival-level ground motion
Δtop,decomp
Top floor displacement at decompression point
εc
Concrete strain
εc,ext
Extreme fiber concrete strain
εcc
Strain corresponding to '
ccf
εfracture
Minimum guaranteed fracture strain in a UFP connector
εmax
Maximum strain to which the UFP will be subjected
εsc,des
Strain in the UFP connector plate at the design limit state
εsc,max
Maximum permissible strain in UFP connector under cyclic loading
φe
Elastic curvature
*eφ
elastic curvature at the base of a precast jointed wall
φf
Reduction factor
φp
Plastic curvature
φs Capacity reduction factor
xxii

φu
Ultimate curvature
φy
Yield curvature
γc
Density of concrete
η distance from the compression face to the neutral axis depth divided by member depth
η0 distance from the compression face to the neutral axis depth divided by member depth at zero drift
ηdes distance from the compression face to the neutral axis depth divided by member depth at design limit state
κ0 Ratio of design strength of shear connectors in one vertical joint to the vertical load on one panel
θ
Base rotation
θdes
Base rotation at design limit state
ρfp0 stress ratio to ensure that post-tensioning tendon does not yield at maximum drift
ρMOM
demand/capacity ratio for overturning moment on panel
ρROC
Force ratio to ensure that the panel rocks rather than slides
ρUPL
Ratio of uplift force to hold down force on one panel
ρx
Transverse reinforcement ratio in 'x' direction
ρy
Transverse reinforcement ratio in 'y' direction
ρZRD
Parameter ratio controlling the residual drift
xxiii

σ0
Initial stress at the base of the wall
ζ
Damping of the system
ζfriction
Damping of the system using frictional inter-panel connectors
ζufp Damping of the system using UFPs as inter-panel connectors
xxiv
Chapter 1: Introduction
1.1 Overview
Concrete walls have many advantages, particularly in seismic prone regions, and with the
added benefits of prefabrication, precast concrete wall systems could be an excellent choice
for designing earthquake resistant buildings. However, the application of precast systems in
general is limited in seismic prone regions due to the lack of research information and
constraints imposed by current design codes. This chapter discusses the lead up to the
research of unbonded post-tensioned jointed precast concrete walls in seismic regions,
including past performance of shear walls, benefits and limitations of precast concrete, as
well as a brief overview of the PREcast Seismic Structural Systems (PRESSS) research
program.
1.2 Past Performance of Shear Walls in Seismic Events
Shear walls have long been known for their triple function to support gravity loads, provide
lateral resistance and function as a wall, along with their exceptional performance in seismic
events [1]. Fintel, author of Shearwalls–An Answer for Seismic Resistance?, has investigated
and reported on many earthquakes between 1960 and 1990 and reports being unaware of a
single concrete building containing shear walls that experienced earthquake collapse [2].
Although there were cases of cracking in various degrees, no lives are known to have been
lost in such buildings.
1

In the 1960 Chile earthquake, registering a 9.5 on the Richter scale [3], the report states,
“…the Chilean experience confirms the efficiency of concrete shear walls in controlling
structural and nonstructural damage in severe earthquakes. There were instances of cracking
of shear walls, but this did not affect the overall performance…the walls continued to
function after damage had occurred…” [2].
The epicenter of the 1963 earthquake in Skopje, Yugoslavia, was located directly under the
city with a magnitude of 6.3 on the Richter scale [3]. Following the event, unreinforced
concrete walls were found to have no damage due to interstory drifts imposed by the
earthquake; however, several frame buildings collapsed and many were damaged severely by
this earthquake [2]. For example, the 14-story Party Headquarters Building, which uses
structural wall-frame interaction for lateral resistance, swayed significantly pushing desks
from one end of the building to the other, but the building remained standing without any
structural or non-structural (i.e. broken windows) damage [3].
In the Caracas, Venezuela, earthquake of 1967, a Richter scale magnitude of 7.0 was
recorded, with the epicenter located off the coast in the Caribbean Sea [3]. A primary
example from this event is the Plaza One Building (see Figure 1.1), the only building
containing structural walls, which survived the event without any damage. Several frame
buildings surrounding it collapsed while others experienced excessive damage [2]. According
to Fintel, the most significant observation following this event was that buildings containing
shear walls outperformed the buildings made from flexible frames [3].
2

(a) 16-story Plaza One building with
structural walls that unscathed damage
(b) Pre-earthquake photo of a 10-story San
Jose frame building that collapsed
Figure 1.1 Performance of two adjacent buildings in the Caracas earthquake [2].
During the 1971 San Fernando California earthquake, having a magnitude of 6.8 on the
Richter Scale [3], a six-story building (Figure 1.2) with shear walls located in an area of
severe damage endured the event with minor cracks, while an eight-story neighboring
concrete frame structure (Figure 1.3) was damaged so severely that it was eventually
demolished [2]. The resulting conclusion by Fintel was that shear wall-type structures show a
superior response to earthquakes, compared with frame-type structures, by limiting the
interstory drifts [3].
3
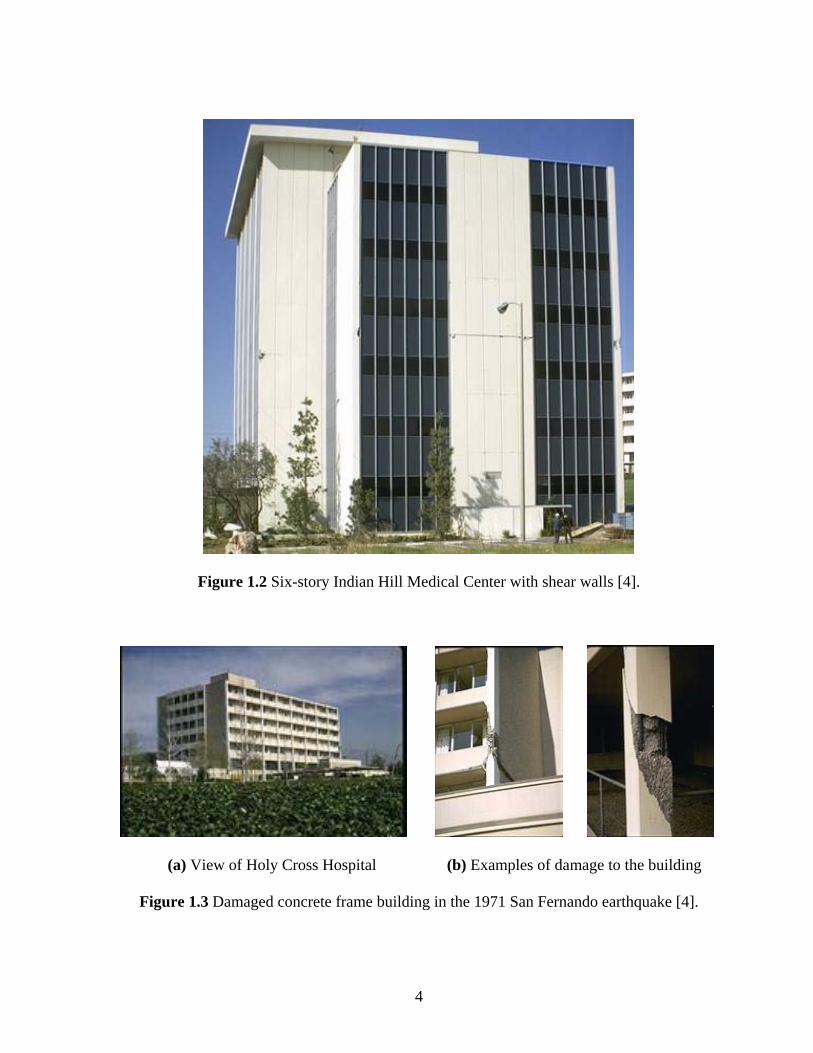
Figure 1.2 Six-story Indian Hill Medical Center with shear walls [4].
(a) View of Holy Cross Hospital (b) Examples of damage to the building
Figure 1.3 Damaged concrete frame building in the 1971 San Fernando earthquake [4].
4
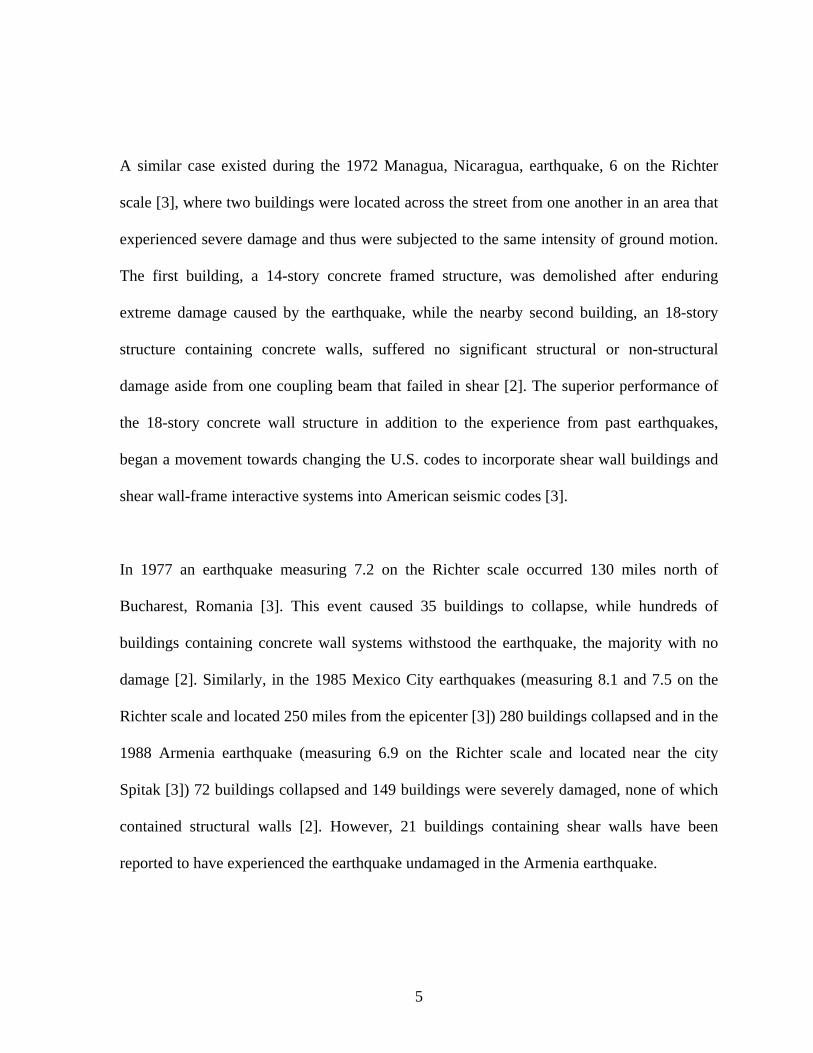
A similar case existed during the 1972 Managua, Nicaragua, earthquake, 6 on the Richter
scale [3], where two buildings were located across the street from one another in an area that
experienced severe damage and thus were subjected to the same intensity of ground motion.
The first building, a 14-story concrete framed structure, was demolished after enduring
extreme damage caused by the earthquake, while the nearby second building, an 18-story
structure containing concrete walls, suffered no significant structural or non-structural
damage aside from one coupling beam that failed in shear [2]. The superior performance of
the 18-story concrete wall structure in addition to the experience from past earthquakes,
began a movement towards changing the U.S. codes to incorporate shear wall buildings and
shear wall-frame interactive systems into American seismic codes [3].
In 1977 an earthquake measuring 7.2 on the Richter scale occurred 130 miles north of
Bucharest, Romania [3]. This event caused 35 buildings to collapse, while hundreds of
buildings containing concrete wall systems withstood the earthquake, the majority with no
damage [2]. Similarly, in the 1985 Mexico City earthquakes (measuring 8.1 and 7.5 on the
Richter scale and located 250 miles from the epicenter [3]) 280 buildings collapsed and in the
1988 Armenia earthquake (measuring 6.9 on the Richter scale and located near the city
Spitak [3]) 72 buildings collapsed and 149 buildings were severely damaged, none of which
contained structural walls [2]. However, 21 buildings containing shear walls have been
reported to have experienced the earthquake undamaged in the Armenia earthquake.
5
In the 1985 Chile earthquake very little damage was evidenced even though the magnitude of
the event was similar to that of the Mexico City earthquake. Fintel attributed the relatively
low damage to the common practice of using concrete shear walls to control lateral drift in
Chile, and suggested that the use of structural walls could minimize the damage to structures
during a seismic event [2].
The observations summarized above from several earthquakes demonstrate the exceptional
performance of buildings with shear walls in seismic regions. For this reason, Fintel
postulates that controlling damage to concrete buildings in severe earthquakes is difficult
without incorporating structural walls, and that it is the responsibility of the engineering
profession to ensure that at least residential buildings in seismic regions are constructed using
structural walls [2].
1.3 Benefits of Precast Walls
The use of precast concrete in the construction of structures is beneficial in many ways. Since
precast concrete is cast in a factory-like setting, the quality of construction is much higher
than cast-in-place construction in which the concrete is cast at the job site. This is primarily
attributed to the controlled setting in which the construction and quality control takes place.
The setting also increases the ability of the construction workers to accurately follow the
design specifications with a supervisor present, who is more readily available than an on-site
inspector may be, to assist with quality control. The manufacturing process used for precast
concrete also makes prestressing and placement of post-tensioning ducts more convenient.
The equipment necessary for prestressing in precast plants is already set up for this type of
6

operation to be performed easily and accurately while placement of the post-tensioning ducts
is further simplified by casting walls horizontally and due to the improved quality in the
construction of the reinforcement cages.
Another more obvious advantage of precast concrete is the reduction in site formwork and
site labor, caused by off-site pouring, which in turn increases the speed of on-site
construction. Also, the availability of cranes with increased capacity, new construction
techniques and off-site fabrication has made it easy for contractors to adapt to precast
construction [5]. There are also many less obvious advantages of precast construction such as
a decrease in traffic congestion, air pollution and noise pollution [6]. Traffic is reduced near
the job site due to the decrease in required concrete trucks and construction workers. This,
and reduced traffic congestion, reduce the air and noise pollution at the construction site.
Precast construction has also been described as the building process of the future [7]. This is
because (1) the materials are relatively inexpensive, (2) the method of construction, involving
factory manufacture of components and rapid construction, lends itself to innovation in
design and construction, and (3) advanced technology including robotics and use of computer
aided manufacturing can be easily adaptable to increase efficiency of the construction
practice and erection procedures, ultimately reducing building costs.
1.4 Limitations of Precast Concrete in Seismic Regions
There are several limitations that lead many designers to consider precast concrete as inferior
to cast-in-place concrete in seismic regions, and thus discard it as a possible design option.
7

The primary limitation originates from the poor performance of precast concrete structures in
past seismic events. This includes poor performance of many framed structures consisted of
precast components, which are primarily due to the use of deficient connection details,
ineffective load paths in building design, and poor construction practices [5,8,9]. For
example, several precast structures in the 1988 Armenian earthquake performed poorly. Most
of the poor performance of precast structures was attributed to substandard materials and
construction practices as well as the use of insufficient connection details [7,9]. However, it
is conceivable that the poor performance of these structures has generally contributed
towards decreasing designers’ confidence in the precast construction practice in seismic
regions.
There is also a lack of design procedures and engineers with seismic design experience in
precast concrete. For example, the ACI 318 standard, through its 1999 edition, does not
contain seismic design provisions for precast concrete, but permit the design of precast
structures that are equivalent to monolithic concrete structures [10]. Similarly, in the most
recent edition, ACI 318-02 [11], emulation is required by Sections 21.6 and 21.8 for precast
frames and precast walls, respectively, but special precast frame systems are permitted in
seismic regions with the penalty of requiring experimental verification.
The current precast design provision requiring engineers to use reinforced concrete emulation
does not fully utilize the advantages of the material strengths and unique properties of precast
construction [7,12]. Following past earthquakes, it has been observed that under large lateral
displacements, significant damage occurred in precast concrete structures that were designed
8

using cast-in-place concrete emulation [13]. These incidences could have been likely due to
use of poor connection details. However, they contribute towards designers developing
uncertainties about the seismic performance of precast concrete structures.
Therefore, a reliable design procedure for precast concrete must be developed in order for
this technology to be widely accepted in seismic regions. Economical and effective means
have been under investigation for joining precast concrete elements together to resist seismic
actions [7], along with establishing design and construction techniques, and promoting
confidence in the use of precast concrete as an option for seismic design around the world.
1.5 Unbonded Precast Wall Systems
In considering the exceptional performance of structural walls in past earthquakes (Section
1.2), the benefits of precast concrete (Section 1.3) and the limitations that must be overcome
(Section 1.4), the PREcast Seismic Structural Systems (PRESSS) research program was
initiated in the United States in the early 1990s. This program envisioned to fulfill two
primary objectives: (1) To develop comprehensive and rational design recommendations
based on fundamental and basic research data which will emphasize the viability of precast
construction in the various seismic zones, and (2) To develop new materials, concepts and
technologies for precast construction in the various seismic zones [7].
A concept development workshop was held in April 1991 to obtain input from precast
concrete producers, design engineers and contractors on the concept developments and
connection classification projects of PRESSS [14]. A 6-story hotel with a structural wall
9

system was one of the design concepts discussed at the workshop. The structural wall
concept was split into two designs: the reinforcing bar structural wall system and the post-
tensioned structural wall system. The reinforcing bar structural wall system consists of one-
story panels connected at each floor with welded or sleeved reinforcing bars which resist
overturning and panel-to-panel structural forces. The post-tensioned structural wall system,
the system selected for the PRESSS test building [12,14,15,16] and the focus of the research
presented herein, also consists of one-story panels stacked on top of one another, but uses
vertical unbonded post-tensioning through the panels.
Upon completion of the concept development workshop, and various testing and analytical
models in the first two phases, a 60% scale five-story precast concrete test building was
designed, built and tested for seismic resistance at the University of California at San Diego
(UCSD) in Phase III of the PRESSS program. Through tests of this large-scale building, the
goal of the PRESSS researchers envisioned to meet the following four objectives: (1)
validate a rational design procedure for precast seismic structural systems, (2) provide
acceptance of precast prestressed/post-tensioned seismic structural systems, (3) provide
experimental proof of overall building performance under seismic excitation, and (4)
establish a consistent set of design recommendations for precast seismic structural systems
[12].
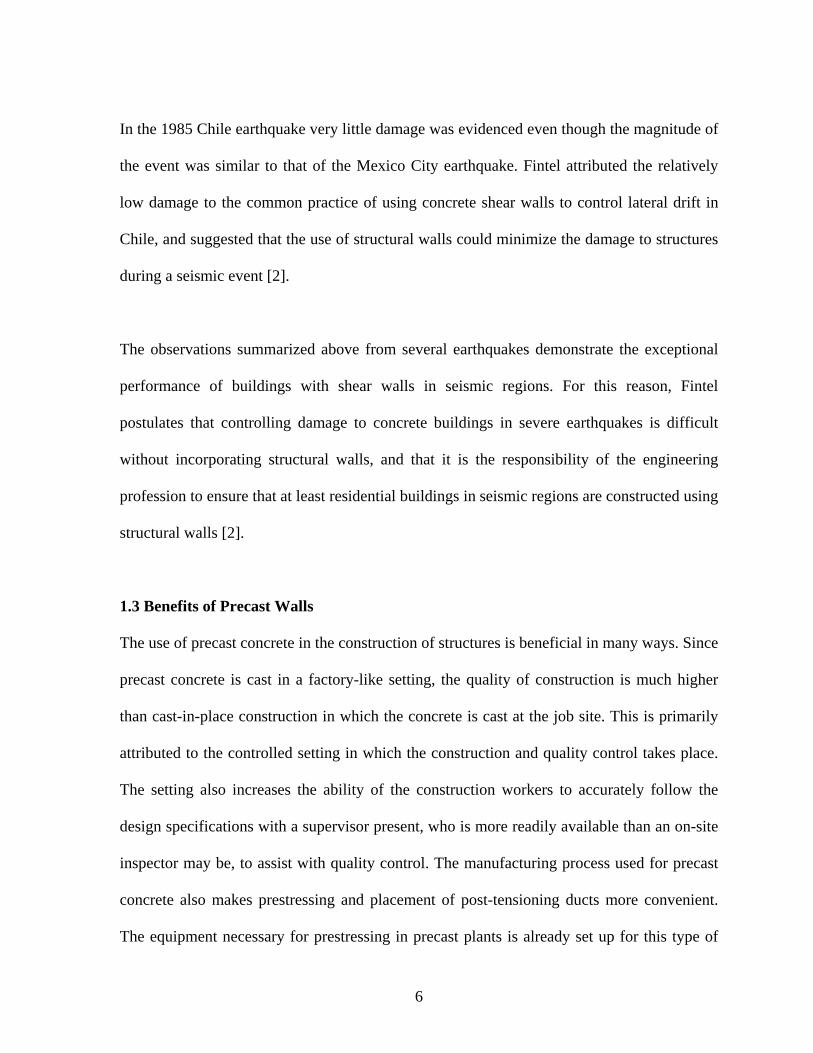
The test building consisted of two types of systems. In one direction, the frame direction, the
building consisted of two seismic frames based on four different frame connections, while a
jointed precast wall system was used in the perpendicular direction [12] (see Figure 1.4). The
10

jointed structural wall system selected included two walls and was based on the unbonded
post-tensioned structural wall concept. The walls were made from a total of four precast
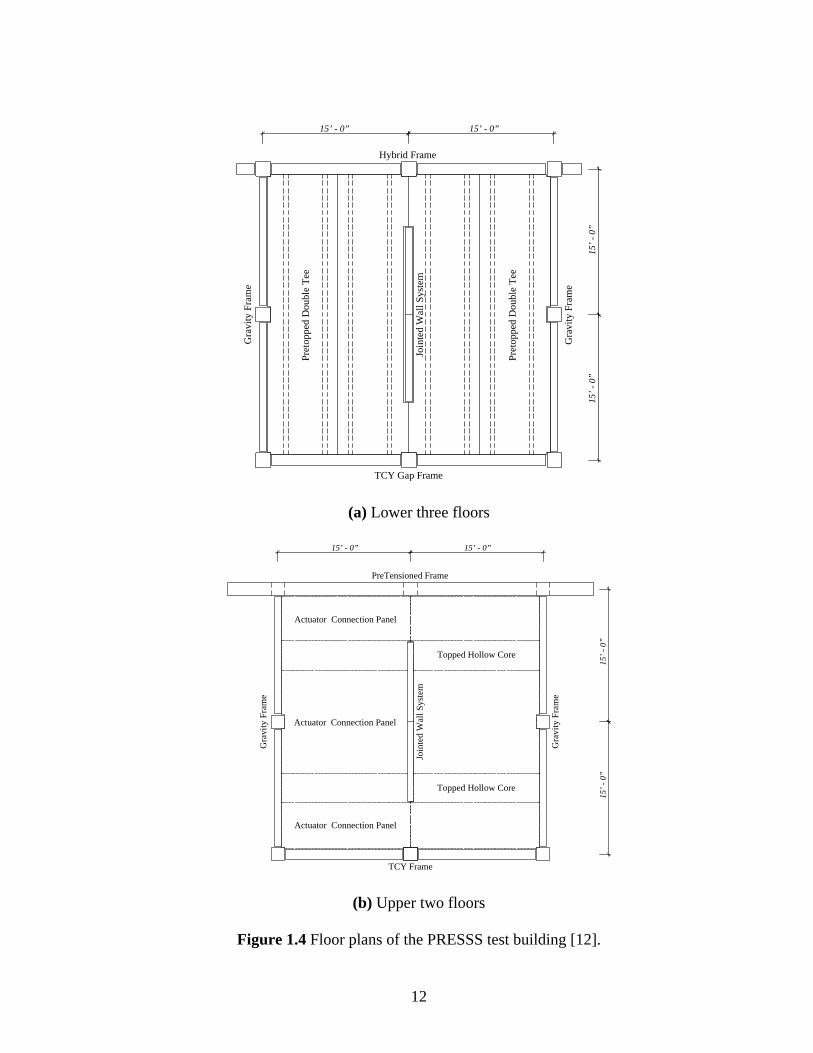
panels, each 2 ½ stories tall (18.75-ft) by 9-ft wide by 8-in thick (Figures 1.5 and 1.6).
The panels were joined vertically to form two walls separated by a small gap. Each wall was
secured to the foundation using four unbonded post-tensioning bars. They were then
connected horizontally by 20 U-shaped flexural plates (also referred to as UFP connectors,
see Figures 1.5 and 1.7) placed along the vertical joint between the walls.
The basic concept of the wall system was to allow the walls to rock individually at the base
for a ground excitation of significant magnitude and return to its vertical position after the
event has concluded. The vertical post-tensioning contributed to overturning moment
resistance and also enabled transfer of shear forces between the walls and the foundation
through a friction mechanism. The U-plates, which were selected for their ability to maintain
their force capacity through large displacements, were used as vertical joint connectors, as
well as damping devices for the wall system that was achieved by flexural yielding of the
plates [12].
11
15’ - 0” 15’ - 0”
Gra
vity
Fra
me
15’ -
0”
15’ -
0”
Join
ted
Wal
l Sys
tem
TCY Gap Frame
Hybrid Frame
Gra
vity
Fra
me
Pret
oppe
d D
oubl
e Te
e
Pret
oppe
d D
oubl
e Te
e
(a) Lower three floors
15’ - 0” 15’ - 0”
Gra
vity
Fra
me
15’ -
0”
15’ -
0”
Join
ted
Wal
l Sys
tem
TCY Frame
PreTensioned Frame
Gra
vity
Fra
me
Actuator Connection Panel
Topped Hollow Core
Actuator Connection Panel
Topped Hollow Core
Actuator Connection Panel
(b) Upper two floors
Figure 1.4 Floor plans of the PRESSS test building [12].
12

PrestressedFrame
TCY FrameUFP Connectors
Wall Panel 1 Wall Panel 2
Wall Panel 3 Wall Panel 4
Open Open
Open Open
Open Open
15’ - 0” 15’ - 0”
18’ -
9”
18’ -
9”
Figure 1.5 Elevation view of the jointed wall system in the PRESSS test building [12].
13
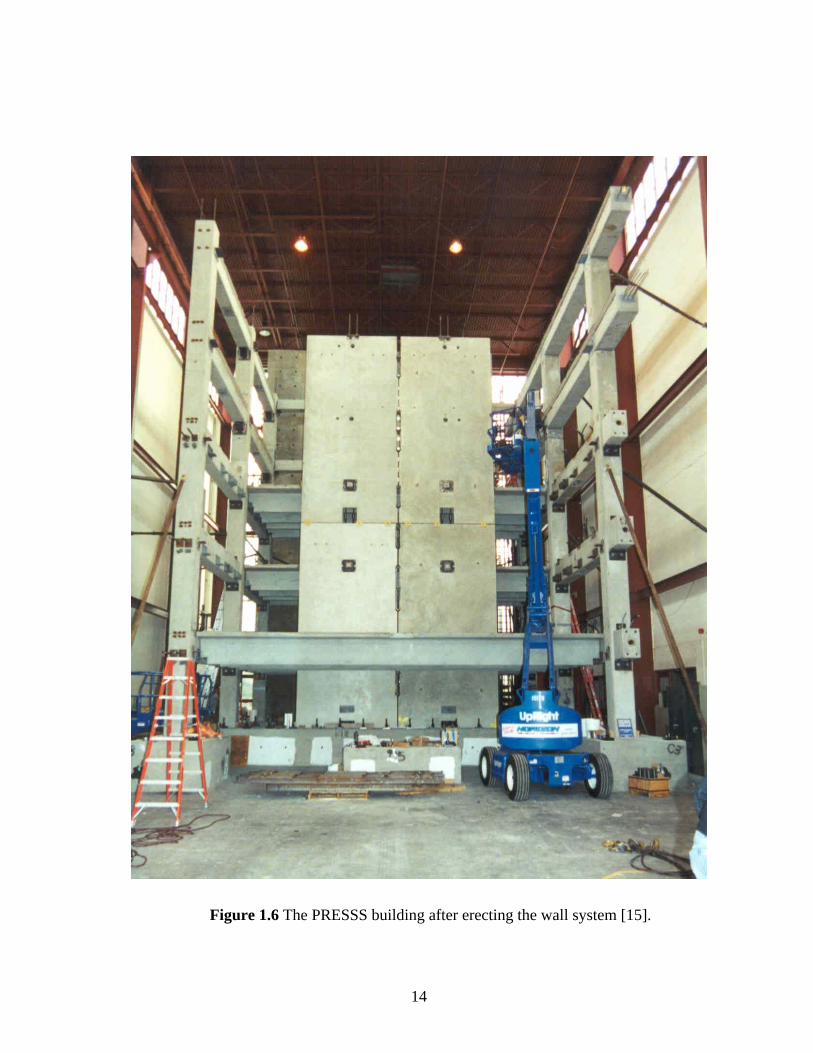
Figure 1.6 The PRESSS building after erecting the wall system [15].
14
4 1/4”
2’ -
0”2’
- 0”
Figure 1.7 Connection details of UFP connectors in the PRESSS building [12].
In order to test the building, lateral forces and displacements were applied by two actuators
connected to the floors at each level. With displacement control, this test setup enabled the
actuator loads at each level to be equally distributed to each bay of the building during the
wall direction testing. The PRESSS building was tested in the wall direction first followed by
the frame direction [16]. The primary test method of the building was pseudodynamic
testing, which used modified segments of recorded accelerograms. These segments were
chosen to match the target acceleration spectra corresponding to 5% damping, which
represented four limit states recommended for performance based design by the Structural
Engineers Association of California (SEAOC) [17]. The input motions at the four levels
15

correlated with 33% (EQ-I), 50% (EQ-II), 100% (EQ-III) and 150% (1.5EQ-III) of the
design-level earthquake. The other two types of tests conducted included the stiffness
measurement test and inverse triangular load test [16]. The inverse triangular load test, which
exercised the building through a displacement profile similar to that expected for the
fundamental mode response, was applied in the wall direction testing at the end of the
pseudodynamic tests to EQ-I, EQ-II and modified EQ-III input motions. They were referred
to as IT-I through IT-III tests.
As depicted for a generalized wall system with three walls in Figure 1.8, forces (V1 to V5)
applied to the floor levels by the actuators transmit inertia effects to the wall system, as
expected during a seismic event. The overturning moment caused by these forces (V1 to V5)
is resisted at the base of the walls by the tension force in the post-tensioning tendon plus the
self weight of the wall (Ndes), the compressive force in the concrete (Cdes) and the force
introduced to the wall by the UFP connectors (Fsc) (Figure 1.8). By design, the post-
tensioning tendons remain elastic, and the walls are expected to return to their initial position
upon removal of the lateral forces, resulting in minimal damage and little residual drift,
leaving the structure prepared for the next seismic event.
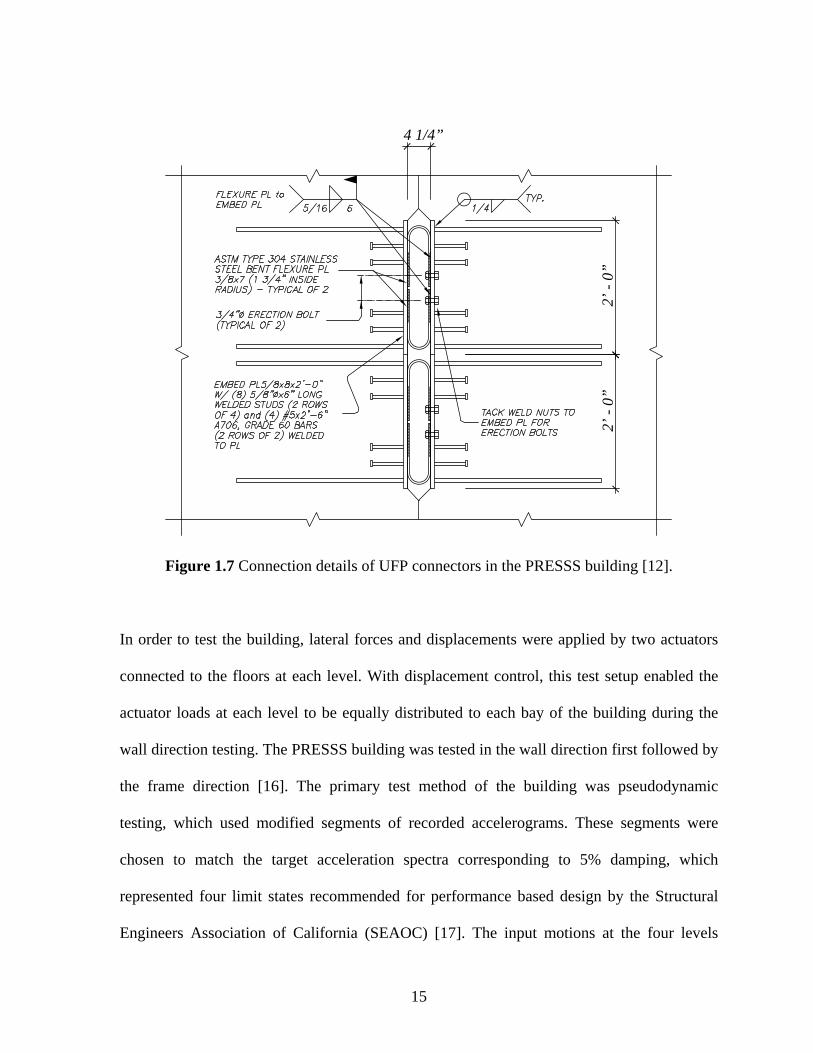
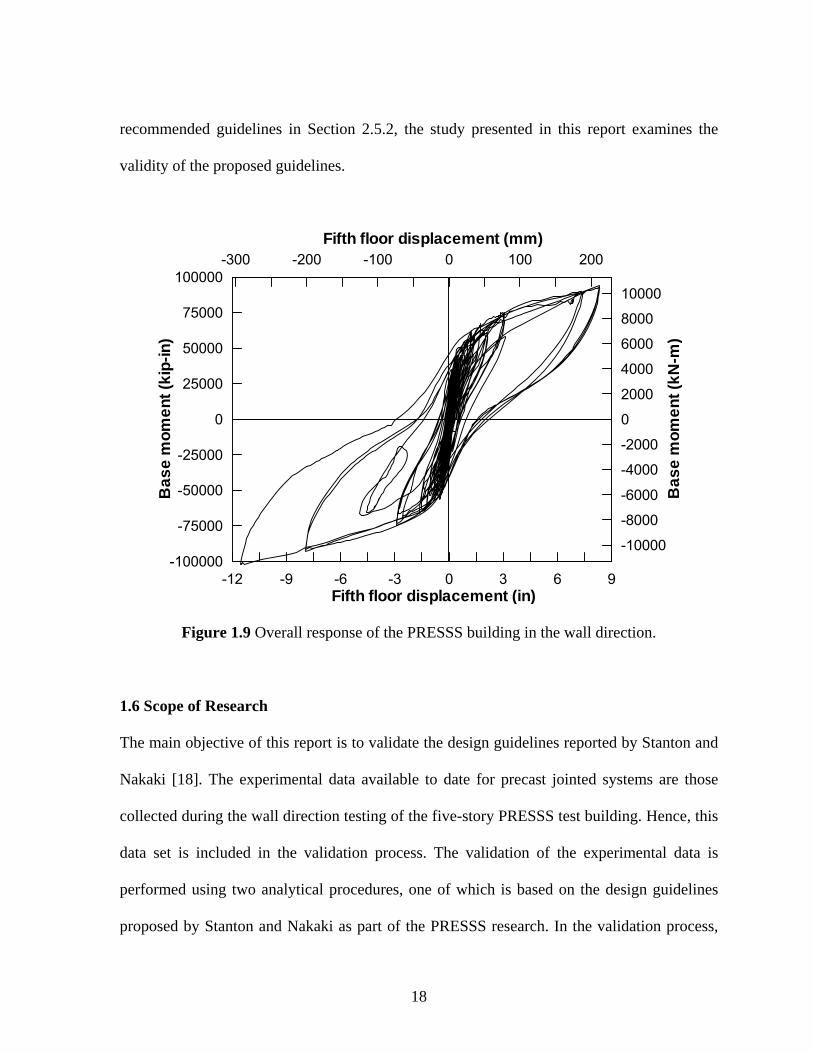
The observed base moment-top floor lateral displacement of the PRESSS building in the wall
direction is shown in Figure 1.9. The wall direction response was reported to have exceeded
the expectations under the design level or EQ-III earthquake [15]. The expected displacement
at the roof level was 9-in, while the recorded peak displacement was 8% lower at 8.3-in.
When subjected to 150% of the design-level event (i.e. 1.5EQ-III), the top floor experienced
16

a maximum displacement of 11.5-in with minimal damage to the wall, where spalling of
some cover concrete occurred at the wall toes, requiring minor repair. As a result of the
minor damage and low residual drift (0.06%), it was clear that at 150% of the design-level
earthquake, the building had responded within the serviceability level of performance [15].
Trailing Wall Intermediate Wall Leading Wall
Ndes Cdes=Ndes-Fsc Ndes Cdes=Ndes Ndes Cdes=Ndes+Fsc
Fsc Fsc
θ θ θ
V1
V2
V3
V4
V5
Vb=ΣVi
Figure 1.8 Forces acting on a jointed wall system, adopted from [18].
Upon the good response of the PRESSS building in the wall and frame directions, Stanton
and Nakaki published a set of design recommendations for the precast concrete frame and
wall systems incorporated in the PRESSS test building [18]. The recommendations proposed
for the wall system have not been evaluated using experimental results. With details of the
17
recommended guidelines in Section 2.5.2, the study presented in this report examines the
validity of the proposed guidelines.
-12 -9 -6 -3 0 3 6 9Fifth floor displacement (in)
-100000
-75000
-50000
-25000
0
25000
50000
75000
100000
Bas
e m
omen
t (ki
p-in
)
-10000
-8000
-6000
-4000
-2000
0
2000
4000
6000
8000
10000
Bas
e m
omen
t (kN
-m)
-300 -200 -100 0 100 200Fifth floor displacement (mm)
Figure 1.9 Overall response of the PRESSS building in the wall direction.
1.6 Scope of Research
The main objective of this report is to validate the design guidelines reported by Stanton and
Nakaki [18]. The experimental data available to date for precast jointed systems are those
collected during the wall direction testing of the five-story PRESSS test building. Hence, this
data set is included in the validation process. The validation of the experimental data is
performed using two analytical procedures, one of which is based on the design guidelines
proposed by Stanton and Nakaki as part of the PRESSS research. In the validation process,
18
overall moment response, post-tensioning steel elongation and neutral axis depth are
compared, and appropriate recommendations are suggested to improve the proposed PRESSS
guidelines for seismic design of jointed precast wall systems.
1.7 Report Layout
This report contains five chapters including the introduction presented in this chapter. The
following chapter contains a literature review, which includes a brief summary of previous
investigations on the analysis and design of precast seismic wall systems. This is followed by
a chapter entitled Formulation of Validation Procedure. An analytical procedure developed to
validate the PRESSS design guidelines and an alternative analysis procedure that may be
used to establish an alternative design method are presented in this chapter. Next, an
experimental verification chapter compares results from the analytical models with the
experimental data and concludes with recommendations to improve design guidelines
proposed for jointed precast wall systems by Stanton and Nakaki [18]. Finally, the report
closes with a final chapter, which contains an overview of the report, as well as conclusions
of the research results and recommendations for future research.
1.8 Wall Definitions
A ‘wall system’ in this report defines all of the components, including the walls and
connector elements as shown in Figure 1.8. In the direction of lateral loading, the first wall
that leads the wall system response is defined as the ‘leading wall’. Similarly, the last wall in
the loading direction is referred to as the ‘trailing wall’, and the ‘intermediate walls’ are those
located between the first and last walls. At the toes of the wall, the maximum and minimum
19

compressive forces are expected in the leading and trailing walls, respectively, as shown in
Figure 1.8. Each wall may consist of several ‘wall panels’ stacked vertically as shown in
Figures 1.5 and 1.6. In accordance with these definitions, the wall system of the PRESSS
building consisted of a leading and trailing wall with no intermediate walls. These definitions
will be used throughout this report.
20

Chapter 2: Literature Review
2.1 Precast Seismic Wall Systems
The benefits of employing shear walls as the main system for resisting lateral forces in
design of buildings have been long realized, but until recently the potential use of precast
wall systems to resist seismic forces has not been extensively researched. Many researchers
have recently advocated the advantages of precast concrete walls, noting additional benefits
when detailing them with unbonded post-tensioning. This includes improved performance of
the wall system under seismic loading by reducing damage and residual displacements. In
order to adopt these advantages, the design methods and suitable analysis techniques for
precast concrete wall systems must be established. In this chapter a literature review
pertaining to the analysis and design of precast seismic wall systems is summarized.
2.2 Precast Seismic Design Considerations
The use of precast concrete in seismic regions is primarily hindered by the lack of established
design concepts that can fully benefit the precast concrete technology and qualified precast
designers. Considerations to improve the use of precast concrete in seismic regions and
design issues at the conceptual level are addressed within this section.
Englekirk [19]
According to Englekirk the primary constraint facing the precast concrete industry is the
requirement that it must comply with a technology developed for cast-in-place concrete (i.e.
21

a precast concrete system is required to emulate behavior of a comparable cast-in-place
system as discussed further in Section 2.3). Therefore, the precast industry must develop a
seismic design technology that permits intelligent use of precast components with suitable
connections. Englekirk suggested that four questions must be considered to increase precast
concrete use in seismic regions. They are:
1. How must precast concrete buildings be erected if they are to be competitive?
2. What precast concrete products are most versatile and competitive?
3. What production techniques could be used to manufacture these precast concrete
products?
4. What connector concepts streamline production and erection?
These questions were addressed by the National Institute of Standards and Technology
(NIST [20]), who developed a program which defined the major processes necessary for
precast to be more successful in seismic regions. In response to the first question, it was
concluded that there is a need for high rise precast concrete buildings whose seismic
resistance should be provided entirely by ductile frames. Along with this, erection needs
must be developed to mimic those of a structural steel frame. Essential elements for this
procedure include: a two floor erection process, alignment capabilities and early integration
of the final bracing system. In terms of product versatility, the use of rectangular components
for beams and columns was strongly encouraged. In addition to this, prestressing was
recommended to improve handling, control member deflection and to reduce cost.
Addressing connector concept criteria, the following list was developed:
• Avoid extensive welding and the associated embedment hardware,
22

• Incorporate adequate tolerances,
• Avoid large formed wet joints, and
• Design joints that minimize crane time.
In addition to the items necessary for precast to excel in seismic regions, Englekirk
investigated code restrictions for precast concrete shear walls in the United States. Englekirk
discovered that due to the design criteria available in 1990, high rise construction of precast
walls in seismic regions was not possible. The principal obstacles, which were identified by
Englekirk, were:
• A boundary element requirement for walls when: 'c
uu f2.0S
MAP
≥+ , where Pu is the
factored axial load, Mu is the factored design moment, A is the cross sectional area of
the wall, S is the section modulus of the wall and is the concrete strength. 'cf
• A requirement of two curtains of steel in walls when: 'cu f2v ≥ ,
where, vu is the factored shear stress.
Through investigation of overseas practice, Englekirk found that seismic design of precast
concrete structures has been successfully completed particularly in Japan and New Zealand.
Precast concrete construction has not only been used but also promoted in Japan. Japanese
design criterion appears to accept a prescribed level of subassembly ductility as proof that
sufficient building ductility exists. Therefore, Japanese contractors typically test full-scale
subassemblies to a standard loading sequence to confirm that the component ductility is
greater than that required by the design criteria. Alternatively, New Zealand requires certain
23

precast concrete bracing systems to be designed to a higher yield level (1.5 times) than
comparable cast-in-place systems.
The design criteria restrictions in the United States, along with the successful methods used
in Japan and New Zealand, suggests that the United States precast concrete industry must
promote a performance type design philosophy if it is at all interested in the structural system
market in regions where seismicity is a consideration.
2.3 Precast Concrete Emulation
Current design codes generally require emulation when designing precast concrete structures
(e.g., UBC 1997 [21] and ACI 318-02 [11]). Emulation is defined as designing connections
between precast elements such that the seismic performance of the precast structure is
equivalent to that of a conventionally designed cast-in-place monolithic concrete structure.
As discussed in Chapter 1, this design concept does not take advantage of the strengths and
unique properties of precast construction. Despite not completely benefiting the technology,
the emulation concept has been adopted for design of precast systems in the United States
and more widely overseas. Therefore, this section briefly addresses the current emulation
methodology for precast concrete structures.
ACI Committee 550 [22]
ACI Committee 550 recently published a document describing various concepts of emulating
cast-in-place concrete systems using precast concrete. With options of using different
24
methods for connecting precast concrete elements, the emulation process requires three
general steps:
1. Select the desired structural system for resisting gravity and lateral loads. This can be
done by using either a moment-resisting frame or a combination of a gravity-load-
resisting frame with lateral-load-resisting shear walls.
2. Design and detail the structure to meet the requirements of a building constructed of
monolithic cast-in-place reinforced concrete, noting that the structural elements must
be suitable for plant fabrication, must be capable of being transported and must be
erected by cranes.
3. Arrange the structure using typical precast elements of appropriate sizes and shapes to
meet the above criteria. Then design the connections between elements to allow them
to emulate behavior of a comparable monolithic system.
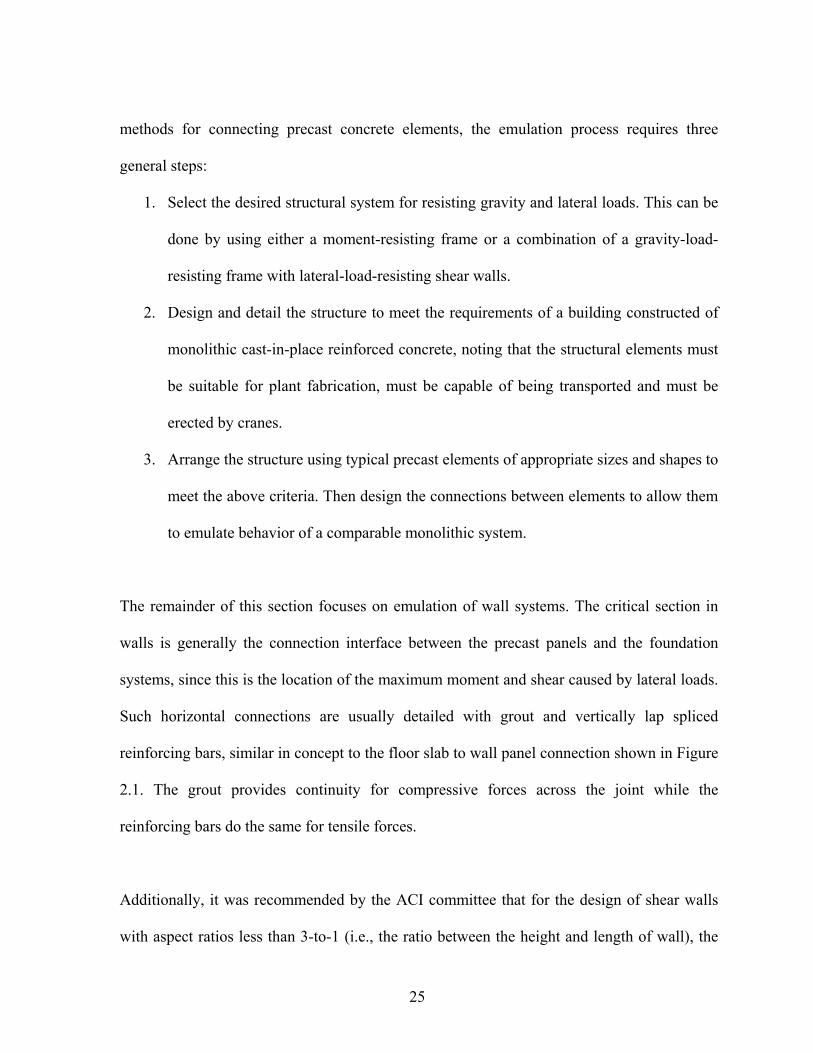
The remainder of this section focuses on emulation of wall systems. The critical section in
walls is generally the connection interface between the precast panels and the foundation
systems, since this is the location of the maximum moment and shear caused by lateral loads.
Such horizontal connections are usually detailed with grout and vertically lap spliced
reinforcing bars, similar in concept to the floor slab to wall panel connection shown in Figure
2.1. The grout provides continuity for compressive forces across the joint while the
reinforcing bars do the same for tensile forces.
Additionally, it was recommended by the ACI committee that for the design of shear walls
with aspect ratios less than 3-to-1 (i.e., the ratio between the height and length of wall), the
25

effects of shear deformations should be considered. An additional 5% eccentricity for
accidental torsion effects was suggested for design of buildings with precast walls in addition
to the eccentricity calculated using the distance from the center of mass to the center of
stiffness as well as any code requirements. It was also recommended that precast walls be
designed as cantilevers from the foundation, even when floors are connected to the walls at
intermediate locations.
Figure 2.1 A lapped splice connection suggested between precast wall panel and precast
floor slab [22].
26
2.4 Unbonded Post-Tensioned Precast Walls
In consideration of the potential benefits of a non-emulative precast wall alternative, a
concept for an unbonded post-tensioned precast concrete wall has been investigated. This
was based on the concept suggested by Priestley and Tao [23] for precast building frames
with the idea that the unbonded post-tensioning would provide an improved restoring force to
the lateral load resisting systems. Kurama et al. [13, 24, 25] have extensively studied
unbonded precast walls, which consist of separate panels stacked vertically. The behavioral
and analytical findings of their study as well as their design recommendations are discussed
in this section.
2.4.1 Behavior and Analysis
Kurama et al. [13, 24]
The performance of unbonded post-tensioned precast concrete walls under lateral loads is
controlled by the behavior along the horizontal joints, specifically, gap opening and shear
slip (Figure 2.2). In gap opening, the post-tensioning force and the axial force due to gravity
load provides a restoring force that tends to close the gaps between the panels upon
unloading of the lateral loads. In shear slip, there is no mechanism available to provide the
restoring force required for reversing the slip as in the gap opening case; therefore, shear slip
is difficult to control under a seismic event and thus the wall should be designed to prevent
such behavior. By ensuring adequate post-tensioning force, the precast walls can be designed
to respond in a manner illustrated in Figure 2.2a without experiencing shear slip as shown in
Figure 2.2.b.
27

(a) (b)
Figure 2.2 Wall behavior along horizontal joints: (a) gap opening, (b) shear slip [13, 24].
To describe the seismic performance, Kurama et. al. specified four states for the lateral force-
displacement response of the unbonded post-tensioned precast wall system, as detailed in
Figure 2.3. The first of these states is the Decompression State, which is the point where gap
opening is initiated at the horizontal joint between the base of the wall and the foundation.
The next state is the Softening State. This state is identified by the beginning of a significant
reduction in the lateral stiffness of the wall due to gap opening along the horizontal joints and
non-linear behavior of the concrete in compression. The third state is the Yielding State, the
point when the strain in the post-tensioning steel first reaches the limit of proportionality.
The final state is the Failure State, which occurs when the flexural failure of the wall occurs,
or in other words, when concrete crushing occurs to the confined concrete at the wall toes.
28

base shear V
decompressionstate
yieldingstate
failurestate
softeningstate
roof drift Δ(Vdec, Δdec)
(Vell, Δell)
(Vllp, Δllp)(Vcsc, Δcsc)
X
Figure 2.3 Lateral load behavior of a precast wall with unbonded post-tensioning [13, 24].
The behavior of precast walls using unbonded post-tensioning was noted for having the
following advantages under cyclic lateral loading:
1. Limiting inelastic response of the post-tensioning tendons introduces a self-centering
capability.
2. Degradation in the initial stiffness of the wall is small.
3. Inelastic straining of the post-tensioning steel can be limited. Thus, the reduction in
prestress expected during load cycles beyond the yielding state can be controlled.
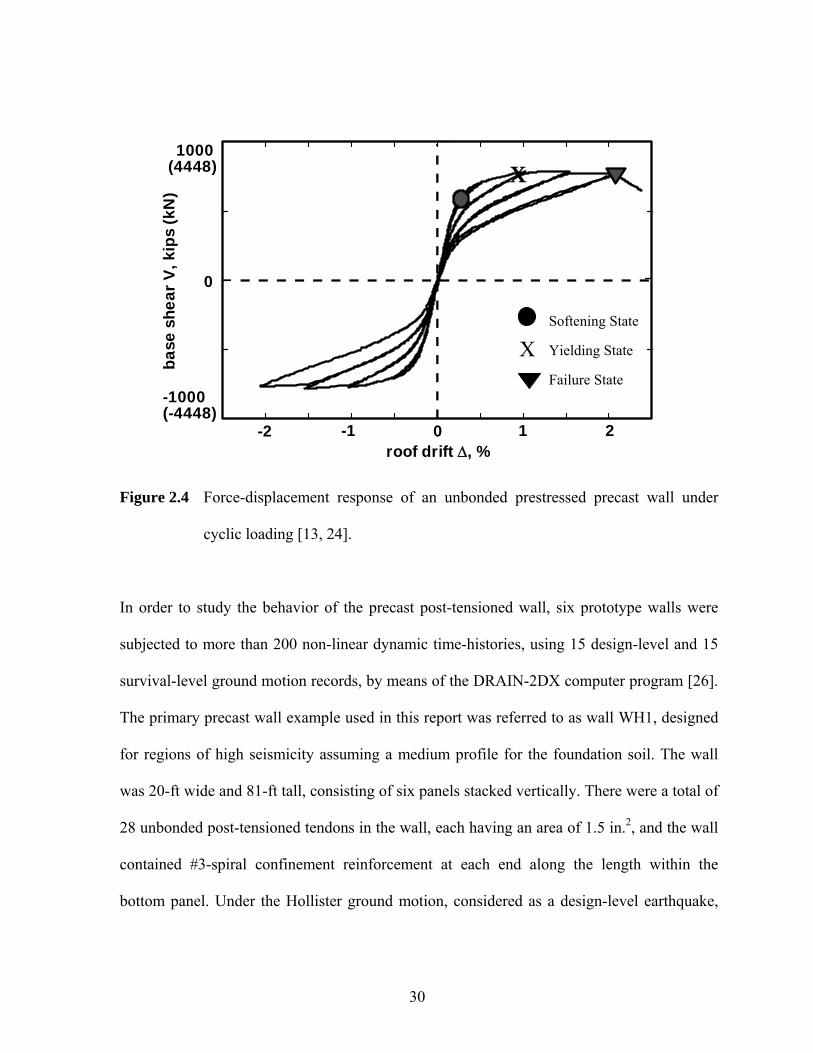
The major disadvantage of the unbonded post-tensioned precast walls is that their response is
characterized more towards non-linear elastic behavior producing very little inelastic energy
dissipation, as observed by the “slender” hysteresis loops shown in Figure 2.4.
29
1000(4448)
-1000(-4448)
0
-2 -1 0 1 2
base
she
ar V
, kip
s (k
N)
roof drift Δ, %
X
Softening State
Yielding State
Failure State
Χ
Figure 2.4 Force-displacement response of an unbonded prestressed precast wall under
cyclic loading [13, 24].
In order to study the behavior of the precast post-tensioned wall, six prototype walls were
subjected to more than 200 non-linear dynamic time-histories, using 15 design-level and 15
survival-level ground motion records, by means of the DRAIN-2DX computer program [26].
The primary precast wall example used in this report was referred to as wall WH1, designed
for regions of high seismicity assuming a medium profile for the foundation soil. The wall
was 20-ft wide and 81-ft tall, consisting of six panels stacked vertically. There were a total of
28 unbonded post-tensioned tendons in the wall, each having an area of 1.5 in.2, and the wall
contained #3-spiral confinement reinforcement at each end along the length within the
bottom panel. Under the Hollister ground motion, considered as a design-level earthquake,
30

wall WH1 was predicted to have a maximum base rotation of just over 3% and a maximum
base moment of just under 800,000 kip-in., as can be seen in Figure 2.5.
0
-0.04 0 0.04base rotation, radians
base
mom
ent,
kip.
in
(
kN.m
)
-800000(-90400)
800000(90400)
-0.02 0.02
HollisterPGA=1.0g
Figure 2.5 Predicted base moment-rotation response of an unbonded precast wall [13, 24].
A cast-in-place reinforced concrete wall with the same strength, initial stiffness, drift
capacity, initial fundamental period and viscous damping as Wall WH1 was also analyzed to
compare the two systems. One difference between the walls was their hysteretic behavior
expected under lateral cyclic loads. The inelastic energy dissipation of the cast-in-place wall
was approximately twice that of Wall WH1, however, the cast-in-place wall did not have
self-centering capabilities. At the completion of the ground motion the cast-in-place wall was
found to have approximately 3% residual drift while the post-tensioned wall had nearly zero
as shown in Figure 2.6.
31

-4
0
4
0 30
roof
drif
t Δ, %
time, seconds
HollisterPGA=1.0g
unbonded PT precast wallcast-in-place RC wall
15
Figure 2.6 Comparison of roof drifts obtained from dynamic analysis of walls [13, 24].
Other major observations made when comparing the responses of the unbonded post-
tensioned precast wall (WH1) and the cast-in-place reinforced concrete wall were:
1. The maximum roof drift of Wall WH1 was larger than that of the cast-in-place wall.
On average, Wall WH1 produced 38% and 14% larger roof drifts than those obtained
for the cast-in-place wall under design-level ground motions and survival-level
ground motions, respectively.
2. The seismic response of Wall WH1 decayed less rapidly resulting in a large number
of drift cycles.
3. Wall WH1 oscillated around the zero-drift position, whereas, the cast-in-place wall
accumulates a significant residual drift; an example is shown in Figure 2.6.
32

Another important aspect investigated was the reduction in the prestress force, a result of
post-tensioning steel yielding when the unbonded walls are subjected to large inelastic lateral
displacements. Two significant observations were reported in respect to this:
1. Reduction in prestress force changes the hysteretic behavior of the wall, and
2. Reduction in prestress force significantly reduces the shear slip resistance of the wall.
Therefore, the authors emphasized that it is extremely important to consider the reduction of
the prestress force in the design of walls at the survival-level ground motions.
Kurama et al. [25]
In addition to the behavior study on precast wall behavior, Kurama et al. carried out a
parametric study using five walls designed for a set of six-story office buildings, four of
which were designed for regions of high seismicity and one for regions of moderate
seismicity, denoted by ‘H’ and ‘M’ in the second letter of the wall designations used in
Figure 2.7. As shown in this figure, the walls are of different dimensions, different areas of
post-tensioning tendons, different locations of post-tensioning tendons as well as different
amounts of confinement spiral reinforcement. Additionally, walls WH1, WH2, WH3 and
WM2 were designed for a site with a soil profile of medium density, while wall WH4 was
designed for a site with a soft soil profile. The dynamic analyses of the systems were
conducted under seven natural and four generated ground motion records and were
conducted on wall models developed using the DRAIN-2DX program.
33

Figure 2.7 Unbonded precast prestressed walls studied by Kurama et al.: (a) typical wall,
and (b) through (f) prototype walls chosen for the study [25].
34

The analysis output was compared with design criteria established for a proposed design
approach (described later in Section 2.4.2). First, considering site characteristics, the
maximum drifts obtained from the analysis for walls WH1, WH4 and WM2 were found to
exceed the drifts selected for the design- and survival-level states. For the design-level
motion the walls exceeded the design-level drift predictions by 15% to 49% whereas for the
survival-level ground motion the selected design drifts were exceeded by 14% to 158%.
Therefore, it was concluded by Kurama et al. that improved methods for accommodating
target drifts in the design are needed and that the observed large drift demands may
necessitate the use of supplemental energy dissipation in the design of unbonded post-
tensioned walls. Overall, the difference between the analytical results and the design criteria
drift demands was found to be greater for:
1. Survival-level ground motions than for design-level ground motions.
2. Walls designed for sites with high seismicity than for sites with moderate seismicity.
3. Soft-soil sites than for medium-soil sites.
It was further noted that the design criteria suggested for the maximum story drift provided
slightly better match to the analytical results than the similar observation made for the
maximum roof drift demand. Additionally, the base shear demands obtained by analysis were
found to be below those estimated by the design procedure. Therefore, Kurama et al.
concluded that the base shear demand calculation developed for cast-in-place concrete walls
can be applied to unbonded post-tensioned precast walls. It was also concluded that there was
a reduction in the total post-tensioning force as the analysis proceeded beyond the yield
strength, but shear slip did not occur in the walls under the ground motions studied.
35
The dynamic analysis results were also compared to evaluate the effects due to the
differences in initial prestress and eccentricity of the post-tensioning steel using walls WH1,
WH2 and WH3. The first observation was that the initial prestress and eccentricity have little
effect on the maximum drift demands of the walls, which were characterized by 1.05, 1.14
and 1.07 percent maximum base rotations for the design-level and 2.72, 3.02 and 2.74
percent maximum base rotations for the survival-level earthquakes, representing WH1, WH2
and WH3, respectively.
The increase in the drift demand for wall WH2 was attributed to the smaller base shear
resistance of the wall resulting from the reduced initial prestress. The decrease in the drift for
WH3, as compared with WH2, was reported to be a result of larger post-tensing stiffness of
WH3. Wall WH1, with an initial prestress of 0.6 times the ultimate stress, had a maximum
base shear demand of 1631-kips. Walls WH2 and WH3, with an initial prestress of 0.3 times
the ultimate stress, had maximum base shear demands of 1410-kips and 1408-kips,
respectively.
The shear slip capacity of the walls was reduced with a decrease in initial prestress and an
increase in eccentricity. Wall WH1, with the largest initial prestress and smallest eccentricity,
had the greatest shear slip resistance of 1751-kips. Wall WH3, with the smallest initial
prestress and largest eccentricity, had the smallest shear slip resistance of 825-kips. Wall
WH2, which fell in the middle with the same eccentricity as wall WH1 and the same initial
prestress as wall WH3, had a resistance of 1345-kips. Kurama et al. also observed that walls
36

with larger initial prestressing resulted in smaller gap openings at the horizontal interfaces
between the precast panels.
2.4.2 Design
Kurama et al. [13, 24]
In evaluation of the results from the parametric study, discussed above, and the need for a
non-emulative design approach, a performance-based seismic design approach was proposed
in order to allow the designer to specify and predict the performance of a building consisted
of unbonded post-tensioned precast walls (see Figure 2.8) under a selected seismic force.
Consequently, this procedure requires the identification of seismic performance levels,
building limit states and capacities, seismic input levels, and structure demand, prior to
conducting the wall design.
Seismic Performance Levels
Three seismic performance levels were identified to ensure satisfactory behavior of walls
under seismic loading:
1. “Immediate Occupancy” — Post-earthquake damage state in which the building has
only limited structural and non-structural damage.
2. “Life Safety” — Post-earthquake damage state in which the building has significant
damage, but some margin against total or partial structural collapse remains.
3. “Collapse Prevention” — Post-earthquake damage state in which the building is on
the verge of partial or total collapse.
37
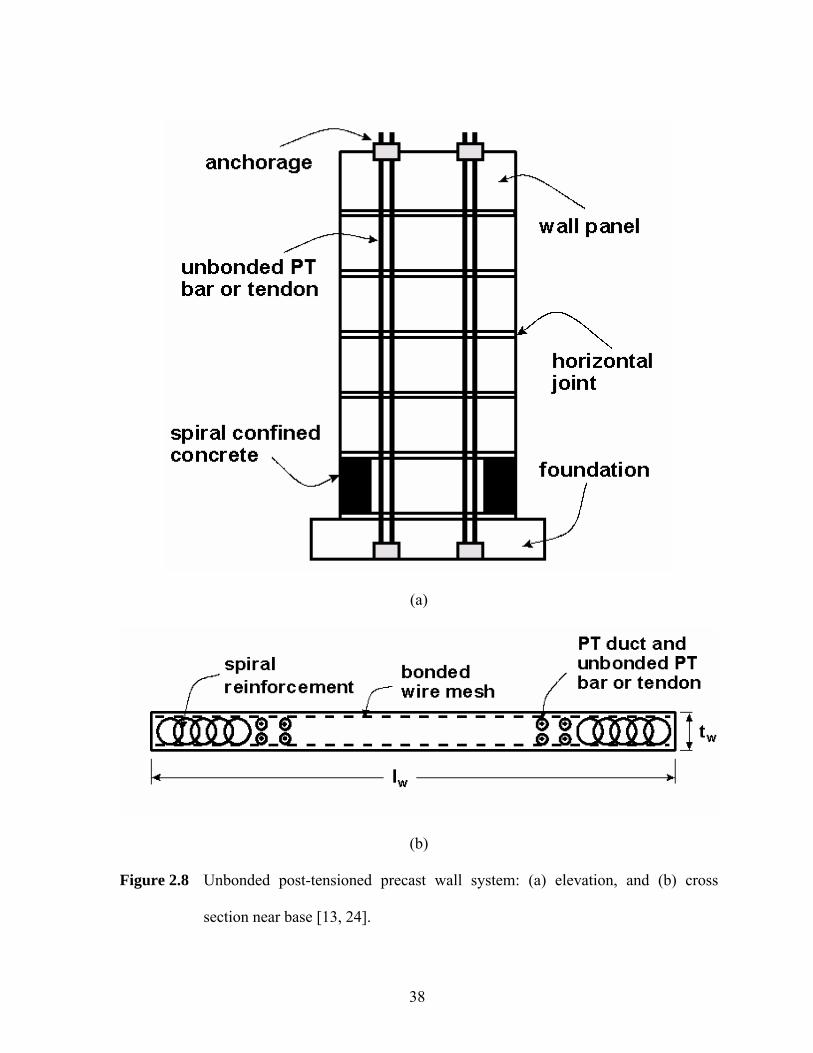
(a)
(b)
Figure 2.8 Unbonded post-tensioned precast wall system: (a) elevation, and (b) cross
section near base [13, 24].
38

Building Limit States and Design Capacities
The building limit states for the unbonded post-tensioned precast concrete walls were
identified as follows:
1. Decompression at the base, which denotes initial gap opening at this location.
2. Decrease in lateral stiffness due to gap opening at the base.
3. Spalling of cover concrete near the base.
4. Yielding of the post-tensioning steel.
5. Attainment of the base moment capacity.
6. Reduction in the prestress due to inelastic straining of the post-tensioning steel.
7. Crushing of the concrete confined by spirals.
8. Reduction in the lateral load resistance.
9. Reduction in the gravity load resistance.
10. Shear slip between precast panels along the horizontal joints.
11. Crushing of the concrete outside the spiral confinement region, but inside the region
reinforced with wire mesh.
The design capacities of the wall system associated with these limit states are determined by
a non-linear static push over analysis. The building limit states 1, 2, 4 and 7 listed above are
identified in the lateral load response of an unbonded post-tensioned wall shown in Figure
2.3.
Seismic Input Levels and Structural Demands
The design approach utilizes two seismic input levels along with associated structural
demands to adequately satisfy the various design limit states:
39

1. Design-level ground motion
a. design base shear demand, Vdes
b. maximum roof drift demand, Δdes
c. maximum story drift demand, δdes
2. Survival-level ground motion
a. maximum roof drift demand, Δsur
b. maximum base shear demand, Vmax
The design objectives proposed by Kurama et al. are based on achieving the immediate
occupancy performance level under the design-level ground motion and achieving the
collapse prevention performance level under the survival-level ground motion.
Wall Design Criteria
The recommended seismic design of the unbonded post-tensioned precast concrete wall
system also has several design criteria that compare estimated structure demands with
structure design capacities. They are as follows:
1. Criterion for the base shear capacity at the yielding state, Vllp
φf Vllp > Vdes = Qdes / R
where φf is the reduction factor as defined by a code standard (e.g., ACI 318-
02 [11]), Qdes is the base shear demand for the design-level ground motion,
and R is the response modification factor.
2. Criterion for the base shear capacity at the softening state, Vell
Vell > Vdes = Qdes / R
40

3. Criterion for the roof drift capacity at the yielding state, Δllp
Δllp > Δdes
where Δdes is the expected maximum roof drift demand under the design-level
ground motion.
4. Criterion for the maximum story drift under the design-level ground motion, δdes
δdes < δall
where δall is the allowable story drift as defined by NEHRP [27].
5. Criterion for the roof drift capacity at the failure state, Δcsc
Δcsc > Δsur
where Δsur is the expected maximum roof drift demand under the survival-
level ground motion
6. Criterion for the length and height of the spiral confined region near the base
Δctc > Δcsc
where Δctc is the roof drift capacity corresponding to the crushing of the
concrete inside the wire mesh, and Δcsc is the roof drift capacity at the failure
state.
7. Criterion for the shear slip capacity, Vss
φs Vss > Vmax
where φs is the shear capacity reduction factor as defined by a code standard
(e.g., ACI 318-02 [11]) and Vmax is the expected maximum base shear demand
under the survival-level ground motion.
8. Criterion for the maximum roof drift under the survival-level ground motion, Δsur
Δsur < Δg = 2.5%
41

where Δg is the maximum roof drift that can be sustained by gravity load
system.
Design Steps
Utilizing the above criteria, a parametric investigation was performed (discussed previously
in Section 2.4.1) to determine how the design capacities are affected by changes to several
critical parameters of the wall. From this investigation, the following design procedure was
finalized with an objective of meeting all of the wall design criteria listed above:
1. Select trial wall dimensions (wall height, length, width, etc.).
2. Set the initial stress in the post-tensioning (fpi) to a desired value, generally 55% to
65% of the ultimate strength of the post-tensioning steel.
3. Determine the area of post-tensioning (Ap) by satisfying design criterion 2, discussed
above.
4. Check design criterion 1 to ensure that the selected area of post-tensioning and length
of wall are sufficiently large.
5. Check design critera 4 and 8 to ensure that δdes < 1.5 percent and Δsur < 2.5 percent,
where both δdes and Δsur are functions of the length (lw) and thickness (tw) of the wall.
6. Check design criterion 3 to ensure that the initial post-tensioning stress and location
of post-tensioning steel are appropriate.
7. Check design criterion 7 to satisfy the shear slip condition.
8. Check design criteria 5 and 6 to ensure sufficient spiral reinforcement (Kurama et al.
recommended that the spiral reinforcement be provided at least one-fourth of the
wall length at each corner and to a height of at least one-story).
42
2.5 Precast Jointed Wall Systems
In addition to the single wall systems discussed in Section 2.4, researchers have investigated
the use of unbonded post-tensioned precast jointed wall systems in buildings as the primary
lateral load resisting elements. The basic setup and behavior of the jointed wall concept is the
same as the single wall concept with the exception that the jointed wall system contains two
or more walls which are connected horizontally (see Figures 1.6 and 1.8). The connection
between walls is performed along the height of the wall using appropriate connectors. The
connectors are supposed to significantly contribute to energy dissipation, and thus have
potential to reduce lateral drift and large amplitude dynamic cycles of the jointed wall
systems when compared to the single precast walls discussed in Section 2.4.
2.5.1 Behavior and Analysis
Schultz and Magana [28]
Schultz and Magana’s primary objective was to investigate the performance of horizontal and
vertical joint connectors suitable for use in precast jointed systems. Seven connectors
appropriate for vertical joints and four connectors suitable for horizontal joints were studied.
The investigation included establishing the performance and developing behavioral models
for the connectors. A U-shaped Flexure Plate (UFP) connector (see Figure 2.9), used as a
horizontal connector along the vertical joint of the precast wall system in the PRESSS test
building, was one of the connectors studied by the researchers.
43

Figure 2.9 Details of the U-shaped Flexure Plate (UFP) connector investigated by Schultz
and Magana [28].
The UFP connector was proposed as an energy-dissipating flexible connector in which the
bending action induced by rolling of the U-plate on a straight steel plate resists vertical shear
force. It was originally designed using Grade 36 structural steel, but the material was
changed to a more ductile 304 stainless steel when cracks formed across the curved region of
the steel U-plate during fabrication. The stainless steel UFP connector proved to be 2.5 times
as strong as was assumed and the friction capacity of the interface was exceeded. The
connector, which was predicted to develop only 40% of the specified design load, actually
attained the entire target design load. Overall, the UFP proved to be a very desirable
connector in the design of precast wall systems. Figure 2.10 shows hysteresis response of a
UFP Connector that was subjected to reversed displacement cycles to simulate seismic
actions in which the maximum displacement of 1.6-in was reported to be equivalent to a drift
ratio of 2 percent for the six-story building considered in that study.
44

Figure 2.10 Force-displacement response reported for a UFP connector by Schultz and
Magana [28].
PRESSS Test Building [12, 14 – 16]
As previously described in Section 1.5, the PRESSS test building, which included an
unbonded post-tensioned precast wall system consisting of two walls and several UFP
connectors along the vertical joint to resist lateral forces in one direction, performed very
well during seismic testing conducted in that direction. Under the design-level earthquake,
the wall experienced a peak recorded displacement of 8.3 in., just 8% below the target design
displacement of 9 in., and accrued a residual drift of only 0.06%. At an event 1.5 times the
design-level event, the wall produced a maximum lateral displacement of about 11.5 inches.
Corresponding to this maximum displacement, the base moment in the wall direction was
approximately 100,000 kip-in. as seen in Figure 2.11, with damage reported to be limited to
45
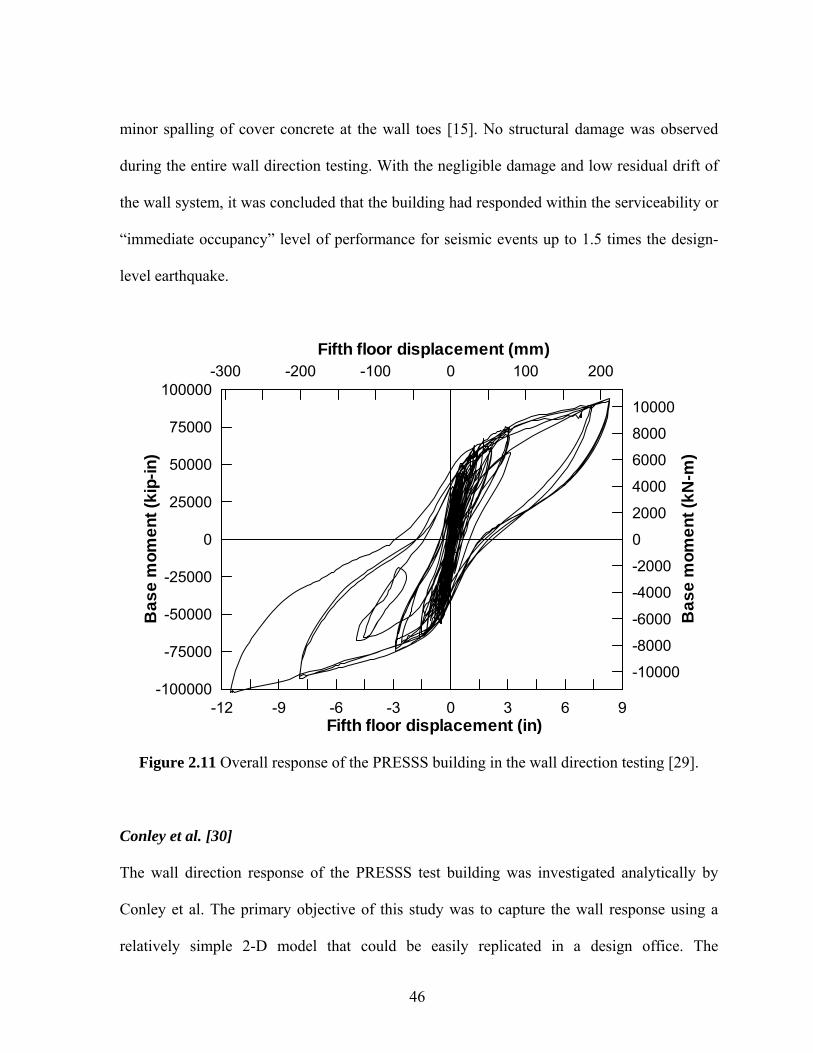
minor spalling of cover concrete at the wall toes [15]. No structural damage was observed
during the entire wall direction testing. With the negligible damage and low residual drift of
the wall system, it was concluded that the building had responded within the serviceability or
“immediate occupancy” level of performance for seismic events up to 1.5 times the design-
level earthquake.
-12 -9 -6 -3 0 3 6 9Fifth floor displacement (in)
-100000
-75000
-50000
-25000
0
25000
50000
75000
100000
Bas
e m
omen
t (ki
p-in
)
-10000
-8000
-6000
-4000
-2000
0
2000
4000
6000
8000
10000
Bas
e m
omen
t (kN
-m)
-300 -200 -100 0 100 200Fifth floor displacement (mm)
Figure 2.11 Overall response of the PRESSS building in the wall direction testing [29].
Conley et al. [30]
The wall direction response of the PRESSS test building was investigated analytically by
Conley et al. The primary objective of this study was to capture the wall response using a
relatively simple 2-D model that could be easily replicated in a design office. The
46

RUAUMOKO computer program [31] was selected to model the wall direction of the test
building. Initially, the wall system was only modeled, but after running the analysis it was
discovered that this only accounted for about 75% of the response at the maximum
displacement in the wall direction. The remaining moment resistance was suspected to be due
to the moment resistance at the base of the eight columns in the test building and thus was
added to the model.
First, to model the wall direction response of the PRESSS test building, the two walls from
the PRESSS test building were modeled as columns with lumped nodal masses at each floor
level as shown in Figure 2.12. The two walls were connected with rigid links using shear
springs located at the midpoint to model the behavior of the U-shaped Flexural Plate (UFP)
connectors, where each spring represented four UFPs in the test building. An additional
column was added to the right of the wall system as in Figure 2.12, with floor displacements
slaved to the adjacent wall element to account for the base moment resistance of six seismic
and two gravity columns in the test building. Additionally, the location of the compression
only springs were fixed at the base of the wall at locations estimated for the resultant
compression forces at a drift of 2% for the wall system while the columns were modeled to
rotate about their corners. Springs were also used to capture the increase in the elongation of
the unbonded post-tensioning tendons at the center of the walls and columns. The accuracy
of the model was determined to be adequately validated by comparing the analytical model
output with the experimental moment-displacement response from the test building (e.g., see
Figure 2.13).
47

Figure 2.12 The RUAUMOKO model developed by Conley et al. to represent the PRESSS
building in the wall direction [30].
Conley et al. concluded that the primary goal of producing a simple analytical model that can
be reproduced by a typical design firm was accomplished and that the displacement-based
design (DBD) procedure was further confirmed by the response of the analytical model.
In studying this report, it was observed that the post-tensioning force was overestimated by
the RUAUMOKO model which in turn increased the moment resistance of the walls. This is
suspected to be due to the location of the compression only springs at the base. First of all,
the compression forces were at a fixed location based on a calculation performed at 2% drift
for the walls. This overestimated the lever arm between the post-tensioning force and the
48
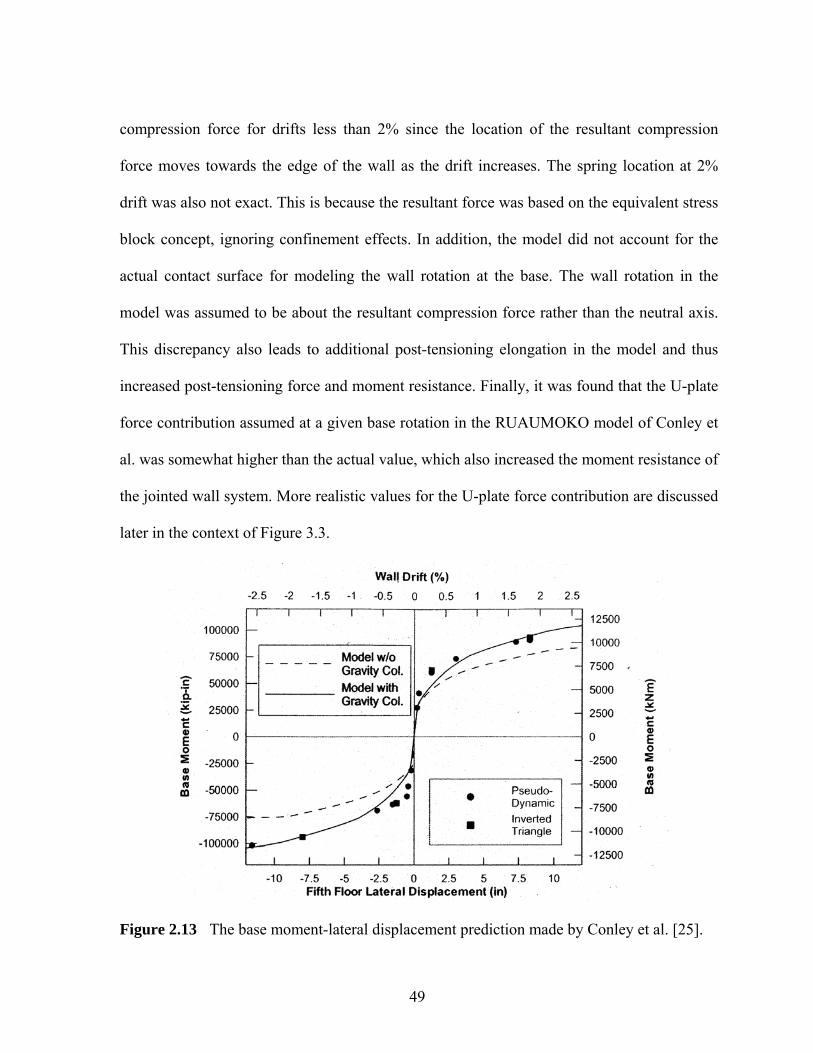
compression force for drifts less than 2% since the location of the resultant compression
force moves towards the edge of the wall as the drift increases. The spring location at 2%
drift was also not exact. This is because the resultant force was based on the equivalent stress
block concept, ignoring confinement effects. In addition, the model did not account for the
actual contact surface for modeling the wall rotation at the base. The wall rotation in the
model was assumed to be about the resultant compression force rather than the neutral axis.
This discrepancy also leads to additional post-tensioning elongation in the model and thus
increased post-tensioning force and moment resistance. Finally, it was found that the U-plate
force contribution assumed at a given base rotation in the RUAUMOKO model of Conley et
al. was somewhat higher than the actual value, which also increased the moment resistance of
the jointed wall system. More realistic values for the U-plate force contribution are discussed
later in the context of Figure 3.3.
Figure 2.13 The base moment-lateral displacement prediction made by Conley et al. [25].
49

2.5.2 Design
Galusha [32]
The jointed wall system in the PRESSS test building was designed by researchers from the
University of Washington in collaboration with a consulting engineer from the Nakaki
Bashaw Group, Inc. using the design procedure summarized by Galusha [32]. The final
design guidelines proposed for the wall system being validated herein used this procedure as
the basis, which is summarized in a step-by-step format below.
1. Select the wall system configuration: wall height (Ht), entire wall system length (B)
and number of panels (n).
2. Select a value for α, the recentering coefficient, within the suggested range of 1.0-1.2.
3. Establish material properties: i.e., modulus of elasticity of post-tensioning steel (Ep),
yield stress of post-tensioning steel (fpy), and concrete compressive strength ( ). 'cf
4. Calculate the width of each wall panel, b.
nBb = (2.1)
5. Specify the building data: number of stories (nstory), height per story (Hstory), building
weight per floor (Wstory), and design rotation (θdesign). A value for θdesign is required if
the displacement-based design (DBD) is preferred for the wall system as adopted in
the design of the PRESSS building.
6. Use DBD to calculate seismic loads and thus calculate the design base shear (Vb) and
design overturning moment (Mot).
7. Select an estimate for β, the moment arm reduction coefficient, within the suggested
range of 0.9-1.0. (This accounts for the fact that the wall does not rotate on its corner)
50

8. Calculate the initial post-tensioning stress:
t
pdesignpy0p H
E2
bff ⎟⎠⎞
⎜⎝⎛ θ
β−= (2.2)
9. Assume a wall thickness (t) in order to calculate the panel self weight (W).
10. Calculate the wall panel post-tensioning:
design
2
t0p
p
ot
0p
2b
HfnE
2)1(nb
2)1(nWbM
Pθ⎟
⎠⎞
⎜⎝⎛ β
+α
α+βα
α+β−
= (2.3)
11. Determine the area of post-tensioning steel:
0p
0pp f
PA = (2.4)
12. Calculate the interface shear force anticipated between the wall panels in the vertical
direction:
)2n2(nPF tot
−αβ
= (2.5)
13. Calculate the lift-off moment (Mlo), net righting moment (Mr,net) and the nominal
moment (Mn):
bF)1n(2
bnPM totlo −+
β= (2.6)
b)1n(2
bnPM totnet,r −−
β= (2.7)
otn MM = (2.8)
14. Calculate the damping of the system (ζ ) and compare with the estimate used in the
DBD.
51

If the inter-panel connectors are frictional devices:
n
net,rlo
ndesign
net,rlodesignfriction M
MMM4
)MM(22π−
=θ
−θ⎟⎠⎞
⎜⎝⎛
π=ζ (2.9)
If the inter-panel connectors are U-Shaped Flexure Plates
(2.10)
frictionufp 625.0 ζ=ζ
15. Check the wall thickness; iteration may be necessary with assumption made in step 9.
16. Check if β is equal to that assumed in step 7, and iterate if necessary.
A design procedure was also developed for the design of U-shaped Flexural Plates (UFP),
which was described earlier in this chapter:
1. Determine the interface shear force (F) that is resisted by the UFPs.
2. Select the number of UFPs (Nufp) located at each interface and determine the force in
each UFP (V).
ufpNFV = (2.11)
3. Determine the properties of the proposed material using the minimum guaranteed
fracture strain (εfracture) and ultimate stress (Fu).
4. Select the maximum strain (εmax) to which the UFP will be subjected. It is
recommended to select this value between 0.25εfracture and 0.5εfracture based on a 2-in
gage length.
5. Select a UFP width (b).
6. Calculate the UFP thickness.
52

maxubFV2tε
≥ (2.12)
7. Determine the average radius of the UFP.
max2tR
ε= (2.13)
Stanton and Nakaki [18]
Upon the completion of the experimental research performed on the PRESSS test building
(Sections 1.5 and 2.5.1), Stanton and Nakaki published a set of design recommendations
based on Galusha’s design procedure [32] for the design of unbonded post-tensioned precast
jointed walls in seismic regions. The design procedure is for wall systems composed of two
or more horizontal panels that are separated by vertical joints as shown in Figure 2.14.
Additionally, the wall panels are post-tensioned to the foundation and are connected across
their vertical joints by shear connectors that can dissipate energy during lateral load response.
To perform the design of the jointed wall system, the following assumptions are made:
1. The design forces and drift limits are known, usually selected to satisfy code criteria.
2. The total wall length (lw,tot), wall height (hw) and wall thickness (tw) are known,
generally from architectural drawings and preliminary calculations.
3. The wall panels are assumed to be the same size.
4. The shear connectors are treated as rigid-plastic.
5. The post-tensioning steel reaches the yield strain at the design drift.
53

Trailing Wall Intermediate Wall Leading Wall
Ndes Cdes=Ndes-Fsc Ndes Cdes=Ndes Ndes Cdes=Ndes+Fsc
Fsc Fsc
θ θ θ
V1
V2
V3
V4
V5
Vb=ΣVi
Figure 2.14 Forces acting on a precast jointed multiple wall system (adopted from [18]).
The design method proposed for unbonded post-tensioned jointed walls by Stanton and
Nakaki [18] consisted of 10 steps, which may be summarized as follows:
1. Establish the following material properties: the yield strength (fpy) and modulus of
elasticity (Ep) of the post-tensioning material, strength of shear connectors, strength
of concrete ( ), and strength of grout ( ) that will be placed between the panels and
foundation.
'cf '
gf
2. Using either the Displacement-Based Design (DBD) or the Force-Based Design
(FBD) methods, determine the design base shear (Vdes) and design drift (θdes).
54

3. Select the number of panels (n) using the following considerations: the wall panel
aspect ratio, the post-tensioning tendon elongation, the lateral strength, and the
damping.
4. Establish the following constants:
wall panel length (lw),
nl
l tot,ww = (2.14)
increase in prestressing tendon stress between zero drift and design drift (Δfp∞),
u
wdespp h
lE5.0f θ=Δ ∞ (2.15)
where is the unbonded length of the post-tensioning tendon. uh
design moment (Mdes),
effdesdes hVM = (2.16)
where is the design base shear and is the height above the foundation
that the lateral load resultant acts on the wall.
desV effh
panel weight (Wpanel),
cwwwpanel htlW γ= (2.17)
where is the density of concrete. cγ
total weight (W),
floorwpanel wlWW += (2.18)
where is the distributed vertical load on the wall at the base from all
floors.
floorw
55
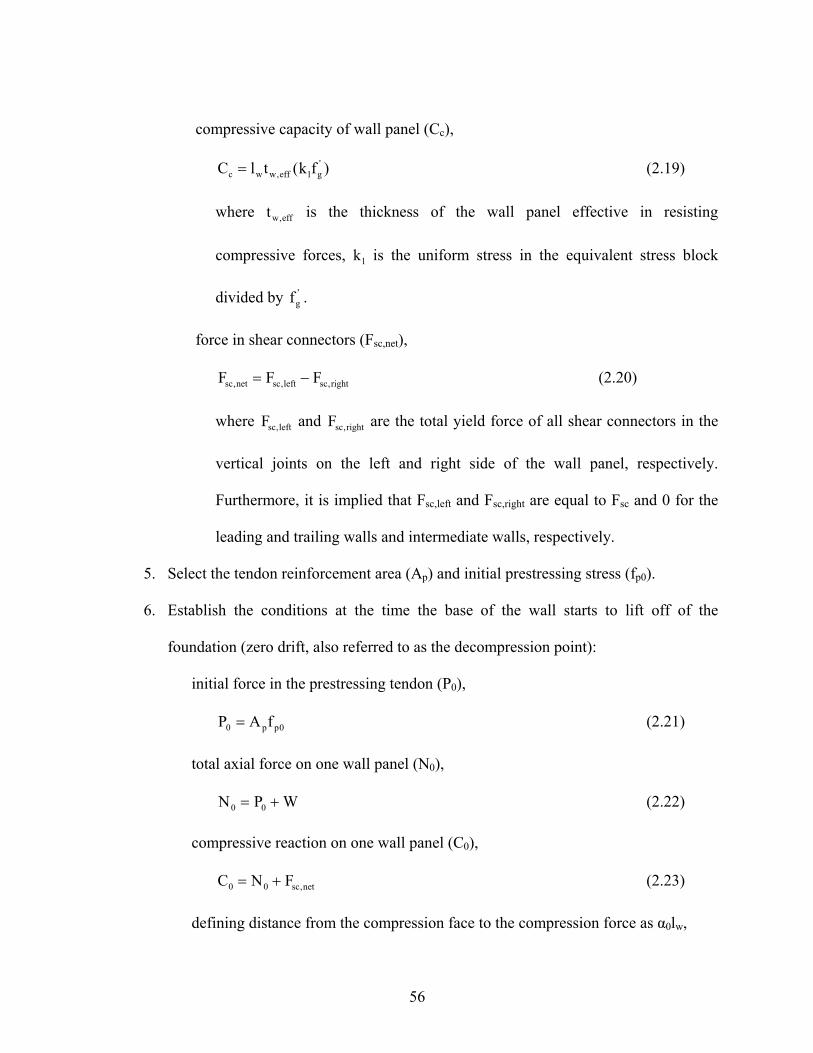
compressive capacity of wall panel (Cc),
)fk(tlC 'g1eff,wwc = (2.19)
where is the thickness of the wall panel effective in resisting
compressive forces, is the uniform stress in the equivalent stress block
divided by .
eff,wt
1k
'gf
force in shear connectors (Fsc,net),
right,scleft,scnet,sc FFF −= (2.20)
where and are the total yield force of all shear connectors in the
vertical joints on the left and right side of the wall panel, respectively.
Furthermore, it is implied that F
left,scF right,scF
sc,left and Fsc,right are equal to Fsc and 0 for the
leading and trailing walls and intermediate walls, respectively.
5. Select the tendon reinforcement area (Ap) and initial prestressing stress (fp0).
6. Establish the conditions at the time the base of the wall starts to lift off of the
foundation (zero drift, also referred to as the decompression point):
initial force in the prestressing tendon (P0),
0pp0 fAP = (2.21)
total axial force on one wall panel (N0),
WPN 00 += (2.22)
compressive reaction on one wall panel (C0),
net,sc00 FNC += (2.23)
defining distance from the compression face to the compression force as α0lw,
56

c
00 C
C5.0=α (2.24)
defining neutral axis depth as η0lw,
1
00 2
βα
=η (2.25)
where is the depth of the equivalent stress block divided by the neutral axis
depth.
1β
ratio of the design strength of the shear connectors to the vertical load (κ0),
0
sc0 N
F=κ (2.26)
where is the total yield force of all shear connectors in one vertical joint. scF
7. These conditions established in Step 6 can be determined at the design drift (θdes)
using an iterative method (see Figure 2.15 and Eqs. 2.27–2.30). Note that the
difference between equations 2.22 through 2.25 and equations 2.27 through 2.30 are
the drift endured by the system and is denoted by ‘0’ for zero drift and ‘des’ for the
design drift.
WPN desdes += (2.27)
where an assumed value for Pdes, force in the post-tensioning tendon at θdes,
should be used for the first step iteration process. The value from Eq. 2.34a
may be used in subsequent steps.
net,scdesdes FNC += (2.28)
c
desdes C
C5.0=α (2.29)
57
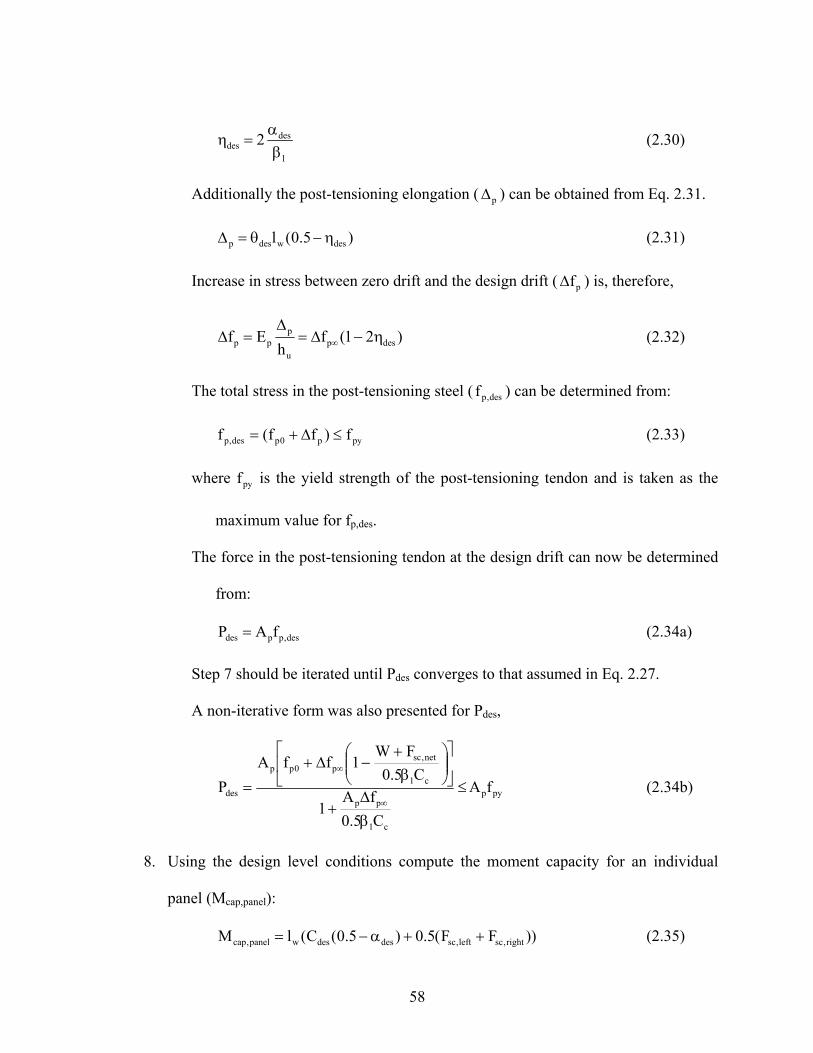
1
desdes 2
βα
=η (2.30)
Additionally the post-tensioning elongation ( pΔ ) can be obtained from Eq. 2.31.
)5.0(l deswdesp η−θ=Δ (2.31)
Increase in stress between zero drift and the design drift ( pfΔ ) is, therefore,
)21(fh
Ef despu
ppp η−Δ=
Δ=Δ ∞ (2.32)
The total stress in the post-tensioning steel ( ) can be determined from: des,pf
pyp0pdes,p f)ff(f ≤Δ+= (2.33)
where is the yield strength of the post-tensioning tendon and is taken as the
maximum value for f
pyf
p,des.
The force in the post-tensioning tendon at the design drift can now be determined
from:
des,ppdes fAP = (2.34a)
Step 7 should be iterated until Pdes converges to that assumed in Eq. 2.27.
A non-iterative form was also presented for Pdes,
pyp
c1
pp
c1
net,scp0pp
des fA
C5.0fA
1
C5.0FW
1ffAP ≤
βΔ
+
⎥⎦
⎤⎢⎣
⎡⎟⎟⎠
⎞⎜⎜⎝
⎛β
+−Δ+
=∞
∞
(2.34b)
8. Using the design level conditions compute the moment capacity for an individual
panel (Mcap,panel):
))FF(5.0)5.0(C(lM right,scleft,scdesdeswpanel,cap ++α−= (2.35)
58
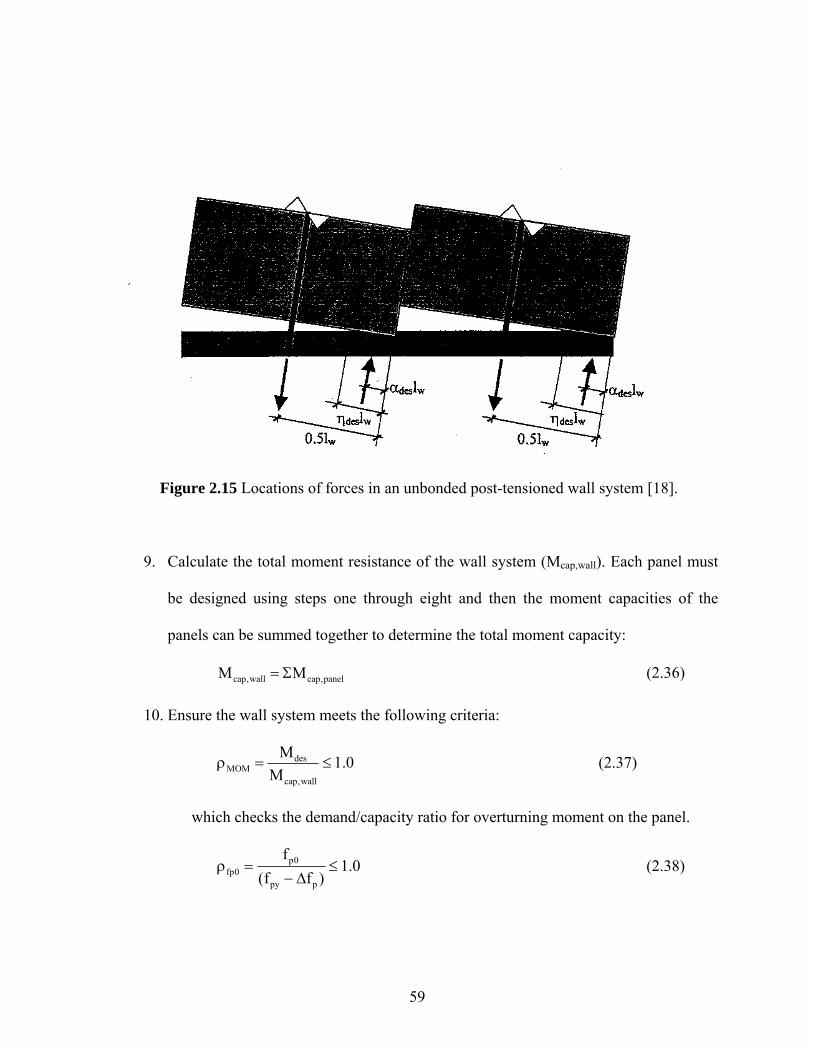
Figure 2.15 Locations of forces in an unbonded post-tensioned wall system [18].
9. Calculate the total moment resistance of the wall system (Mcap,wall). Each panel must
be designed using steps one through eight and then the moment capacities of the
panels can be summed together to determine the total moment capacity:
panel,capwall,cap MM Σ= (2.36)
10. Ensure the wall system meets the following criteria:
0.1M
M
wall,cap
desMOM ≤=ρ (2.37)
which checks the demand/capacity ratio for overturning moment on the panel.
0.1)ff(
f
ppy
0p0fp ≤
Δ−=ρ (2.38)
59
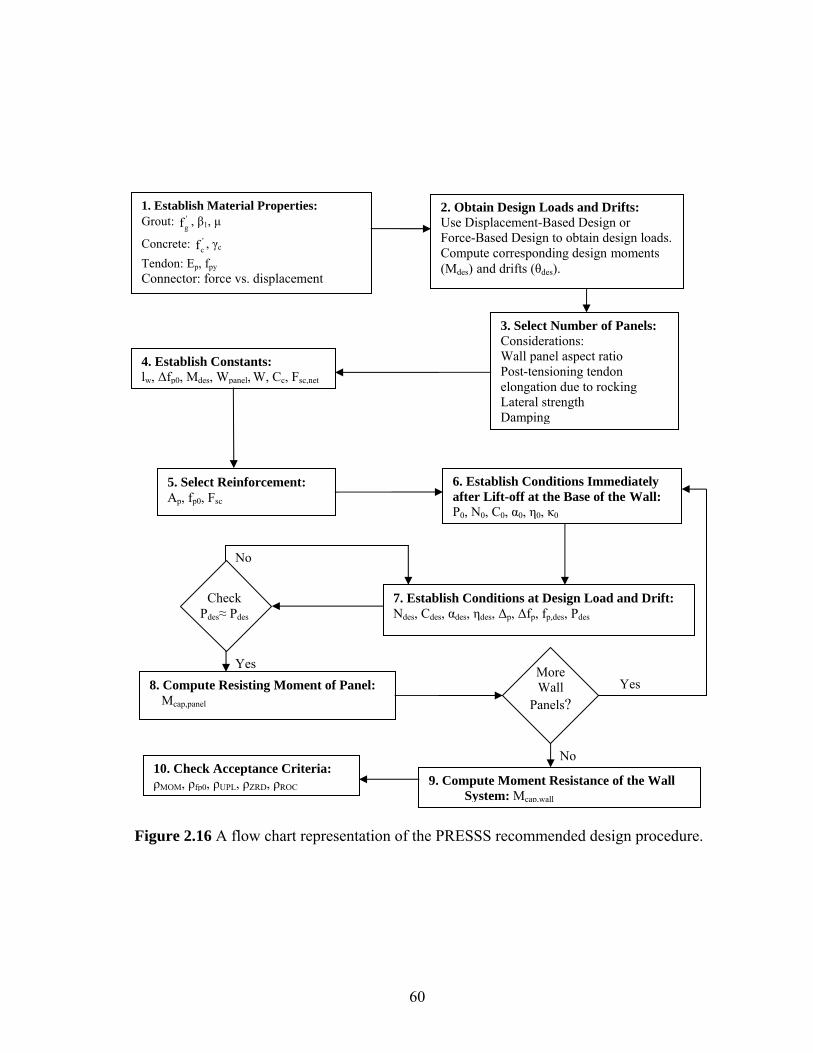
2. Obtain Design Loads and Drifts: Use Displacement-Based Design or Force-Based Design to obtain design loads. Compute corresponding design moments (Mdes) and drifts (θdes).
1. Establish Material Properties: Grout: , β'
gf 1, μ
Concrete: ' , γcf c
Tendon: Ep, fpy
Connector: force vs. displacement
4. Establish Constants: lw, Δfp0, Mdes, Wpanel, W, Cc, Fsc,net
3. Select Number of Panels: Considerations: Wall panel aspect ratio Post-tensioning tendon elongation due to rocking Lateral strength Damping
5. Select Reinforcement: Ap, fp0, Fsc
7. Establish Conditions at Design Load and Drift: Ndes, Cdes, αdes, ηdes, Δp, Δfp, fp,des, Pdes
8. Compute Resisting Moment of Panel: Mcap,panel
9. Compute Moment Resistance of the Wall System: Mcap,wall
10. Check Acceptance Criteria: ρMOM, ρfp0, ρUPL, ρZRD, ρROC
6. Establish Conditions Immediately after Lift-off at the Base of the Wall: P0, N0, C0, α0, η0, κ0
More Wall
Panels?
No
Yes
No
Yes
Check Pdes≈ Pdes
Figure 2.16 A flow chart representation of the PRESSS recommended design procedure.
60

which checks the stress ratio to ensure that the prestressing tendon does not yield
at maximum drift.
0.10UPL ≤κ=ρ (2.39)
which checks the ratio of uplift force to hold down force on one panel to ensure
the wall does not uplift.
0.1)5.0(n
)21n(
ave,0
0ave,00ZRD ≤
α−κα+−
κ=ρ (2.40)
which is a parameter ratio controlling the residual drift.
0.1n
)21n()5.0(
hl 0ave,0
ave,0eff
w0ROC ≤⎟
⎠
⎞⎜⎝
⎛ κα−−+α−
μκ
=ρ (2.41)
which is a force ratio to ensure that the panel rocks rather than slides.
The basic outline of the design approach of Stanton and Nakaki described above may be
summarized as shown in flowchart form in Figure 2.16.
The guidelines of Stanton and Nakaki also includes steps for the design of U-shaped Flexural
Plate (UFP) connector (Figure 2.17), which is one possible choice for the shear connector in
the wall system. Any ductile shear connector that has the required strength and deformation
capacity may be used to connect the precast wall panels.
Utilizing equilibrium of the shear connector and determining the plastic moment capacity of
the shear connector (Msc) by using the connector dimensions and the stress in the plate under
61
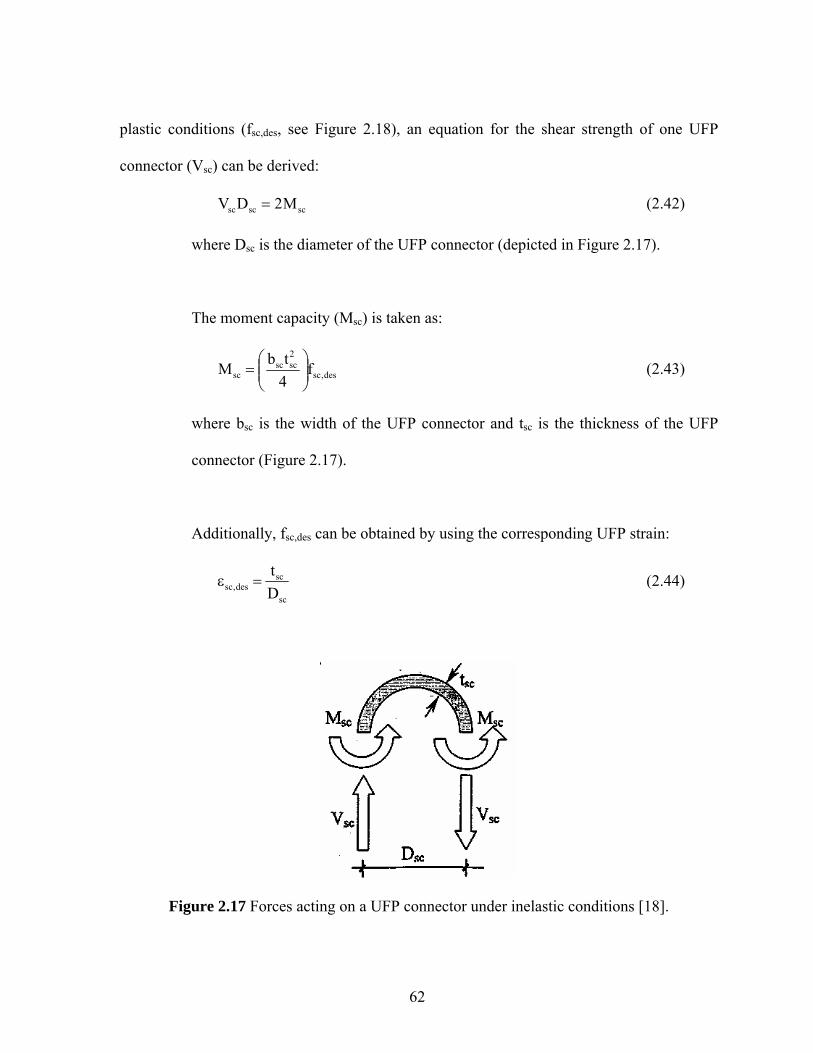
plastic conditions (fsc,des, see Figure 2.18), an equation for the shear strength of one UFP
connector (Vsc) can be derived:
scscsc M2DV = (2.42)
where Dsc is the diameter of the UFP connector (depicted in Figure 2.17).
The moment capacity (Msc) is taken as:
des,sc
2scsc
sc f4tbM ⎟⎟
⎠
⎞⎜⎜⎝
⎛= (2.43)
where bsc is the width of the UFP connector and tsc is the thickness of the UFP
connector (Figure 2.17).
Additionally, fsc,des can be obtained by using the corresponding UFP strain:
sc
scdes,sc D
t=ε (2.44)
Figure 2.17 Forces acting on a UFP connector under inelastic conditions [18].
62

Note that εsc,des is limited to a value of εsc,max (Figure 2.18), which is defined as:
3u,sc
max,sc
ε=ε (2.45)
From the required Fsc, the number of shear connectors (nsc) can be determined as:
sc
scsc V
Fn = (2.46)
Figure 2.18 Stress-strain relation of the UFP material [18].
In the above design procedure, εsc,des for the UFP connector is determined from geometry of
the connector without the influence of the design drift. Furthermore, the moment calculation
given in Eq. 2.43 implies that the stress-strain response of the UFP material in Figure 2.18 is
approximated for an elastic-perfectly plastic response using a yield value of fsc,des. These
approximations, along with the fact that hardening of stainless-steel, typically used as the
UFP material, depends on previous strain history, can lead to inaccurate estimation of the
UFP forces and the base moment resistance of the wall system.
63

Monolithic Beam Analogy
One of the primary issues in the design of the unbonded post-tensioned precast jointed wall
systems is the strain incompatibility between the concrete and steel at the section level. The
proposed design guidelines by Stanton and Nakaki [18] use an equivalent stress block based
on the unconfined concrete compressive strength to obtain the neutral axis depth. This
approach inaccurately estimates the neutral axis depth as well as the increase in the post-
tensioning force at a given drift. Furthermore, this approach results in an increase in the
neutral axis depth as the drift increases, which is expected to be just the opposite of the actual
behavior. The neutral axis depth should decrease or possibly remain constant as the wall
rotation at the foundation interface increases. This discrepancy was also found in the design
of precast hybrid frames [9, 33], but the impact is expected to be greater for the wall system
due to large length to thickness ratio of the wall panel. This is discussed in further detail in
Chapter 4.
As an alternative to using the equivalent stress block, Pampanin et al. [34] proposed the
monolithic beam analogy (MBA) to overcome the strain incompatibility issue and more
accurately model the jointed precast frame connections at the section level. The MBA
method basically equates the equivalent plastic hinge length of a monolithic system with that
of a jointed system unbonded post-tensioned jointed precast wall. Application of this concept
to an unbonded post-tensioned jointed precast wall was addressed by Sritharan and Thomas
[35] and is detailed in Section 3.3. This approach results in a simple equation to relate the
concrete strain in the extreme fiber at the base of each wall panel with the base rotation and
neutral axis depth as shown in Eq. 2.47.
64

ch08.0 e
wext,c ⎥
⎦
⎤⎢⎣
⎡φ+
θ=ε (2.47)
where is the concrete strain in the extreme fiber, ext,cε θ is the rotation at the
base, is the height of wall, wh eφ is the elastic curvature and c is the neutral axis
depth.
Thus, with a given rotation and neutral axis depth an approximate strain can be obtained and
section level compatibility can be met. A couple of issues should be noted with the approach
based on MBA. First of all, the actual equivalent plastic hinge length of the jointed wall is
most likely smaller due to the presence of unbonded post-tensioning and concentrated
deformation at the interface. Secondly, this method is not exact, it is only an approximation
used to overcome the incompatibility between the concrete and unbonded steel to more
accurately portray the behavior of the wall system.
65

PAGE INTENTIONALLY BLANK
66
Chapter 3: Formulation of Validation Procedure
3.1 Introduction
The main goal of this study is to validate the PRESSS design guidelines that have been
proposed for jointed precast wall systems by Stanton and Nakaki [18]. An effective
validation process should encompass a range of values for the wall drift. Also, incorporating
the test data available from the PRESSS test building, discussed in Section 2.5.1, in the
validation of design guidelines is essential. In consideration of these issues, an analysis
method is first formulated based on the PRESSS guidelines summarized in Section 2.5.2.
Furthermore, as previously discussed, the use of an equivalent stress block in the design
guidelines to overcome the strain incompatibility that exists at the section level causes
concerns with the abilities of the analysis method derived from the PRESSS guidelines to
accurately estimate the extensions of the post-tensioning bars and the vertical displacements
that the UFPs would be subjected to. Consequently, an alternative analysis method is also
established in this chapter, which was based on the monolithic beam analogy (MBA) concept
described in Section 2.5.2. The predicted response of the wall system based on the two
analysis methods are compared with the experimental results in Chapter 4 to validate the
PRESSS design guidelines proposed for the jointed wall systems.
The development and presentation of these analysis methods are limited to jointed wall
systems with two walls as the wall system included in the PRESSS building [12, 15, 16]. It is
noted that the analysis methods presented here may be easily extended to other systems
67

consisting of more than two walls. As presented in Chapter 1, the two walls in the system are
referred to as the “leading wall” and “trailing wall”. In both directions of loading, the first
wall that leads the lateral response of the wall system is referred to as the leading wall while
the other wall is identified as the trailing wall. According to this terminology, in wall systems
with more than two walls, the walls between the leading and trailing walls will be referred to
as the intermediate walls.
3.2 Analysis Method Based on PRESSS Design Guidelines
The PRESSS analysis procedure was developed essentially by reversing the design
guidelines suggested by Stanton and Nakaki [18], see Section 2.5.2. Consistent with the
guidelines, the walls in the jointed system are analyzed independently assuming that the
walls are subjected to identical drifts at all times. Preliminary investigation of the
displacement data obtained at the base of the PRESSS wall system supported this
assumption.
A flowchart shown in Figure 3.1 summarizes the analysis procedure while the steps involved
in the analysis are as follows:
1. Define wall dimensions and material properties.
This includes:
'gf = grout strength = concrete strength '
cf
γc = concrete density Ep = elastic modulus of post-tensioning steel
Ap = area of post-tensioning steel fpy = yield strength of post-tensioning steel
68
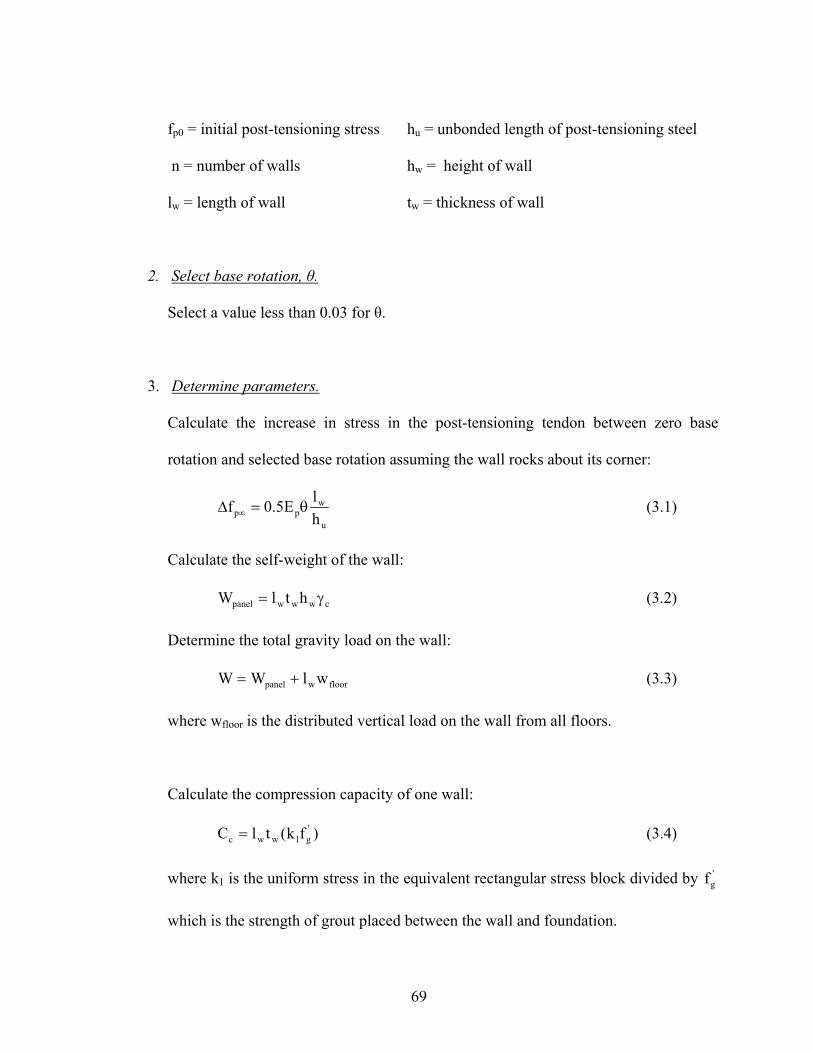
fp0 = initial post-tensioning stress hu = unbonded length of post-tensioning steel
n = number of walls hw = height of wall
lw = length of wall tw = thickness of wall
2. Select base rotation, θ.
Select a value less than 0.03 for θ.
3. Determine parameters.
Calculate the increase in stress in the post-tensioning tendon between zero base
rotation and selected base rotation assuming the wall rocks about its corner:
u
wpp h
lE5.0f θ=Δ ∞ (3.1)
Calculate the self-weight of the wall:
cwwwpanel htlW γ= (3.2)
Determine the total gravity load on the wall:
(3.3) floorwpanel wlWW +=
where wfloor is the distributed vertical load on the wall from all floors.
Calculate the compression capacity of one wall:
(3.4) )fk(tlC 'g1wwc =
where k1 is the uniform stress in the equivalent rectangular stress block divided by
which is the strength of grout placed between the wall and foundation.
'gf
69
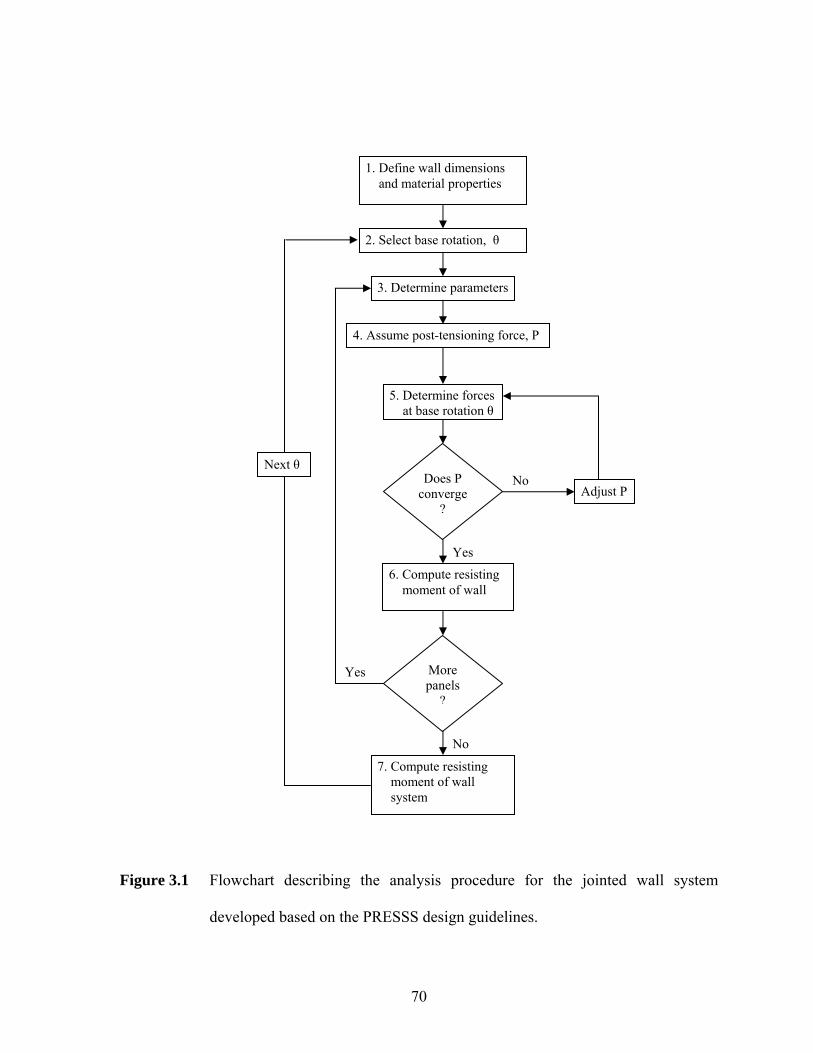
1. Define wall dimensions and material properties
2. Select base rotation, θ
3. Determine parameters
5. Determine forces at base rotation θ
Does P converge
?
No
Yes
More panels
?
No
Yes
4. Assume post-tensioning force, P
6. Compute resisting moment of wall
Adjust P
7. Compute resisting moment of wall system
Next θ
Figure 3.1 Flowchart describing the analysis procedure for the jointed wall system
developed based on the PRESSS design guidelines.
70
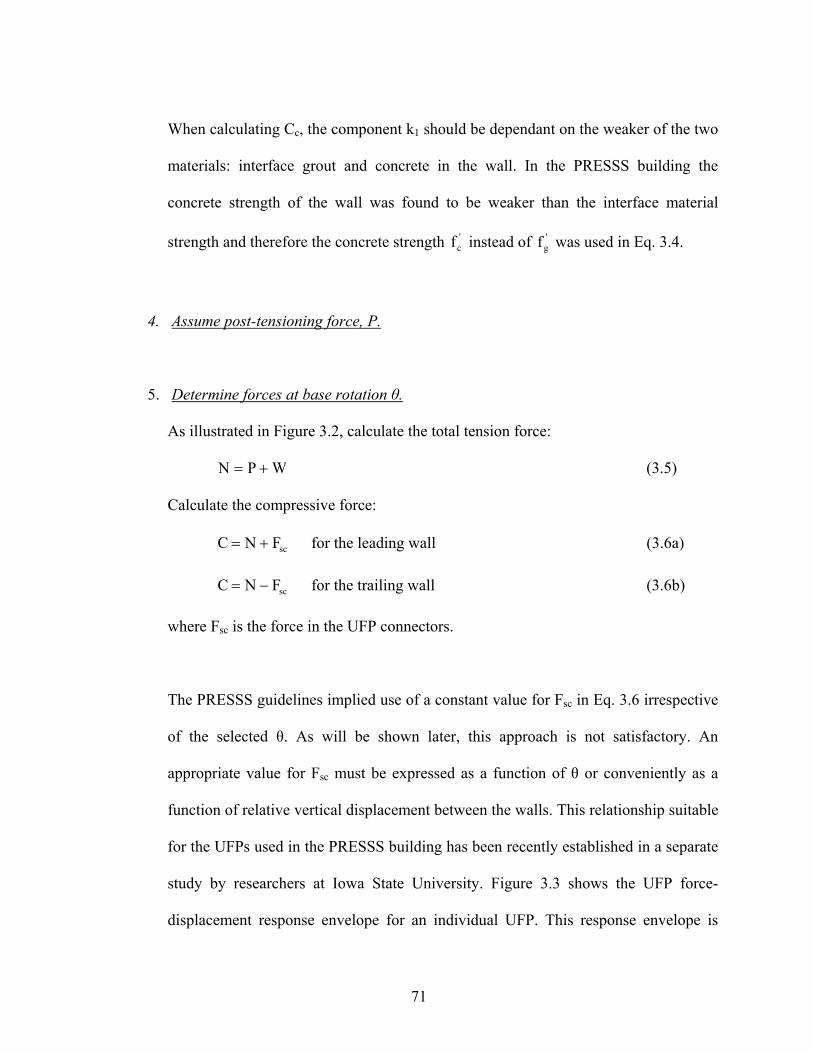
When calculating Cc, the component k1 should be dependant on the weaker of the two
materials: interface grout and concrete in the wall. In the PRESSS building the
concrete strength of the wall was found to be weaker than the interface material
strength and therefore the concrete strength instead of was used in Eq. 3.4. 'cf '
gf
4. Assume post-tensioning force, P.
5. Determine forces at base rotation θ.
As illustrated in Figure 3.2, calculate the total tension force:
WPN += (3.5)
Calculate the compressive force:
scFNC += for the leading wall (3.6a)
scFNC −= for the trailing wall (3.6b)
where Fsc is the force in the UFP connectors.
The PRESSS guidelines implied use of a constant value for Fsc in Eq. 3.6 irrespective
of the selected θ. As will be shown later, this approach is not satisfactory. An
appropriate value for Fsc must be expressed as a function of θ or conveniently as a
function of relative vertical displacement between the walls. This relationship suitable
for the UFPs used in the PRESSS building has been recently established in a separate
study by researchers at Iowa State University. Figure 3.3 shows the UFP force-
displacement response envelope for an individual UFP. This response envelope is
71
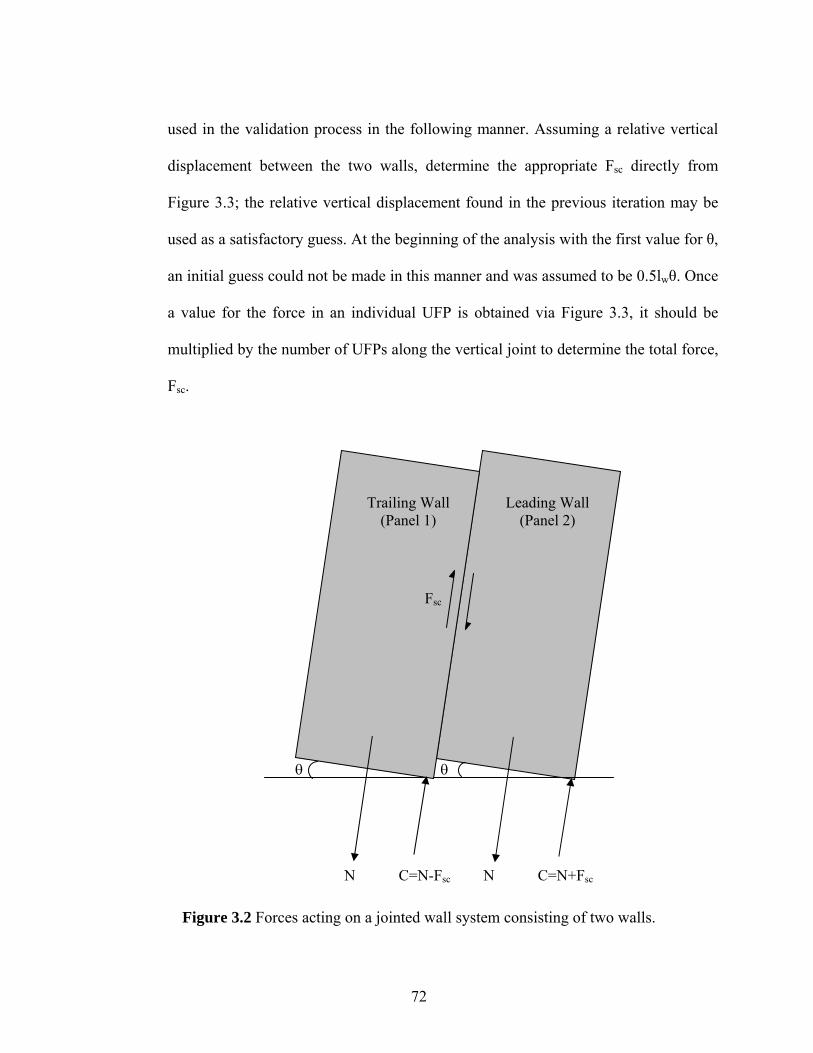
used in the validation process in the following manner. Assuming a relative vertical
displacement between the two walls, determine the appropriate Fsc directly from
Figure 3.3; the relative vertical displacement found in the previous iteration may be
used as a satisfactory guess. At the beginning of the analysis with the first value for θ,
an initial guess could not be made in this manner and was assumed to be 0.5lwθ. Once
a value for the force in an individual UFP is obtained via Figure 3.3, it should be
multiplied by the number of UFPs along the vertical joint to determine the total force,
Fsc.
Leading Wall (Panel 2)
Figure 3.2 Forces acting on a jointed wall system consisting of two walls.
N C=N+Fsc
θ
Trailing Wall (Panel 1)
sc
Fsc
θ
N C=N-F
72
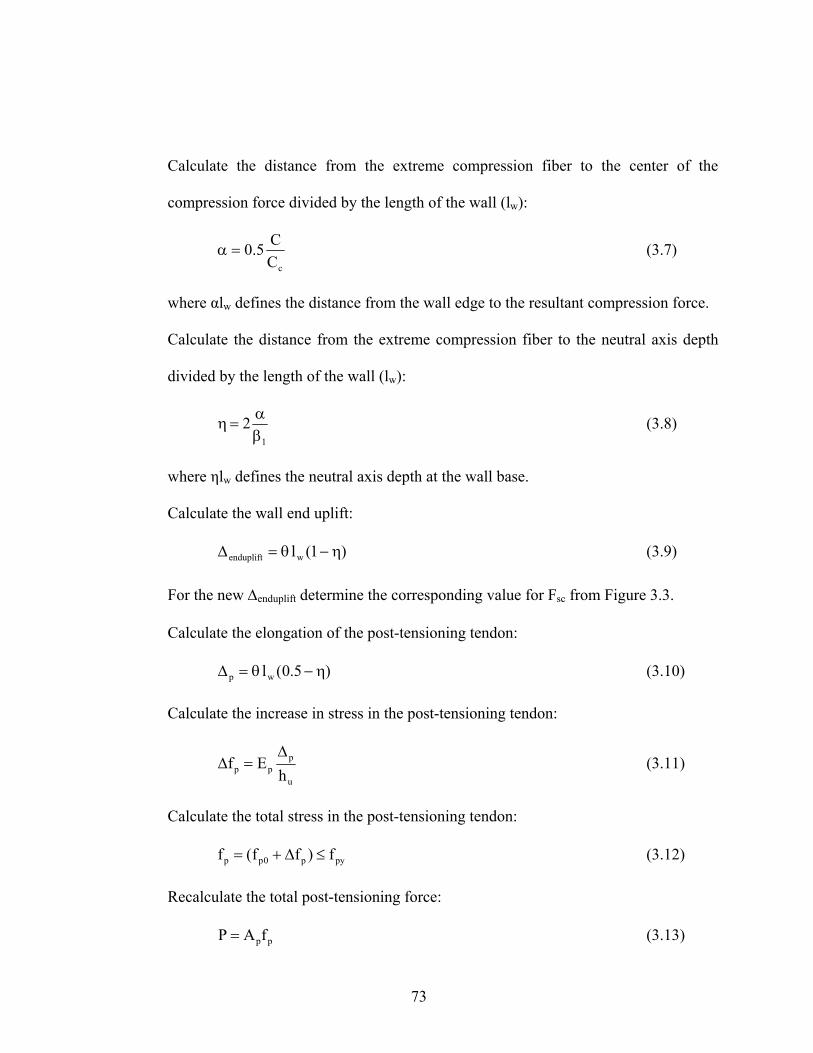
Calculate the distance from the extreme compression fiber to the center of the
compression force divided by the length of the wall (lw):
cCC5.0=α (3.7)
where αlw defines the distance from the wall edge to the resultant compression force.
Calculate the distance from the extreme compression fiber to the neutral axis depth
divided by the length of the wall (lw):
1
2βα
=η (3.8)
where ηlw defines the neutral axis depth at the wall base.
Calculate the wall end uplift:
(3.9) )1(lwenduplift η−θ=Δ
For the new Δenduplift determine the corresponding value for Fsc from Figure 3.3.
Calculate the elongation of the post-tensioning tendon:
)5.0(lwp η−θ=Δ (3.10)
Calculate the increase in stress in the post-tensioning tendon:
u
ppp h
EfΔ
=Δ (3.11)
Calculate the total stress in the post-tensioning tendon:
pyp0pp f)ff(f ≤Δ+= (3.12)
Recalculate the total post-tensioning force:
ppfAP = (3.13)
73

0 1 2 3Relative vertical displacement between wall panels (in)
0
2
4
6
8
10
12
14
Forc
e tr
ansm
itted
per
UFP
, Fsc
o (ki
ps)
0
10
20
30
40
50
60
Forc
e tr
ansm
itted
per
UFP
, Fsc
o(kN
)
0 25 50 75Relative vertical displacement between wall panels (mm)
0 1 2 3Relative vertical displacement between wall panels (in)
0
2
4
6
8
10
12
14
Forc
e tr
ansm
itted
per
UFP
, Fsc
o (ki
ps)
0
10
20
30
40
50
60
Forc
e tr
ansm
itted
per
UFP
, Fsc
o(kN
)
0 25 50 75Relative vertical displacement between wall panels (mm)
Figure 3.3 Force transferred through a UFP connector as a function of relative vertical
displacement between the wall panels established from experimentation.
Iterate Step 5 until P converges to the assumed value. Although a non-iterative
approach is presented in the guidelines, discussed previously in Section 2.5.2, the
iterative approach was used. This was necessary since the UFP force used in the
analysis method is not considered constant as in the design guidelines. Note that the
non-iterative procedure in the guidelines is expressed in terms of Fsc (see Eq. 2.34b).
6. Compute resisting moment of wall:
( )F(5.0)5.0(ClM scwpanel,cap +α−= ) (3.14)
Steps 3 through 6 should now be repeated for the trailing wall.
74

7. Compute resisting moment of wall system:
∑= panel,capwall,cap MM (3.15)
3.3 Alternative Analysis Method
The alternative analysis method is based on the monolithic beam analogy (MBA) concept
suggested by Pampanin et al. [34] as discussed in Section 2.5.2. Using this concept, a
procedure for performing section analysis of unbonded post-tensioned walls was established
[35]. A summary of this procedure and the analysis of the jointed wall using this procedure
are described below.
3.3.1 Application of Monolithic Beam Analogy
In order to overcome strain incompatibilities between the unbonded steel and concrete, MBA
approximates the total displacement of the jointed precast wall (Δj) to the total displacement
of an equivalent monolithic wall (Δm) as shown in Figure 3.4, and establishes a simplified
relationship for the extreme fiber concrete strain (εc,ext) as a function of the neutral axis depth
(c) and base rotation (θ). Accordingly, assume:
(3.16) mj Δ=Δ
At a base rotation of θ for the precast wall,
pe2w
*ew h
31h Δ+Δ=φ+θ (3.17)
where hw is the height of the wall, is the elastic curvature at the base of the precast wall
and Δ
*eφ
e and Δp are, respectively, the elastic and plastic displacement components of the
monolithic wall.
75

For the equivalent monolithic wall,
2wee h
31
φ=Δ (3.18)
where is the elastic curvature of the monolithic wall, and eφ
(3.19) wpeuwppp hL)(hL φ−φ=φ=Δ
where is the plastic curvature of the monolithic wall, Lpφ p is the equivalent plastic hinge
length and is the ultimate curvature of the monolithic wall. Assuming is approximately
equal to and substituting equations 3.18 and 3.19 into equation 3.17, results in:
uφ *eφ
eφ
peext,c
peu Lc
L)( ⎟⎠
⎞⎜⎝
⎛φ−
ε=φ−φ=θ (3.20)
where εc,ext is the extreme fiber concrete strain. Thus,
θ
Δm Δj
hw
Precast wall Equivalent monolithic
wall
φe*φp
*
Lp*
φp φe
Lp
(a) (b) (c) (d)
Figure 3.4 Flexural response and associated curvatures: (a) and (b) corresponds to a precast
wall, and (c) and (d) correspond to an equivalent monolithic wall.
76
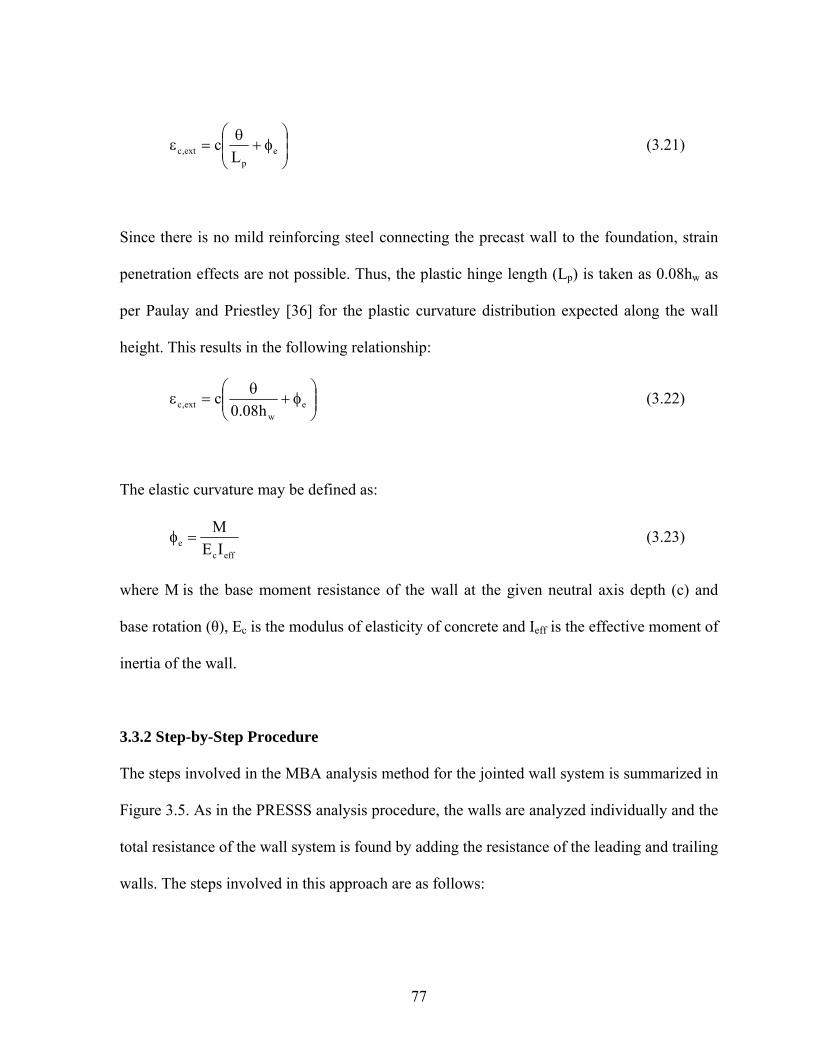
⎟⎟⎠
⎞⎜⎜⎝
⎛φ+
θ=ε e
pext,c L
c (3.21)
Since there is no mild reinforcing steel connecting the precast wall to the foundation, strain
penetration effects are not possible. Thus, the plastic hinge length (Lp) is taken as 0.08hw as
per Paulay and Priestley [36] for the plastic curvature distribution expected along the wall
height. This results in the following relationship:
⎟⎟⎠
⎞⎜⎜⎝
⎛φ+
θ=ε e
wext,c h08.0
c (3.22)
The elastic curvature may be defined as:
effc
e IEM
=φ (3.23)
where M is the base moment resistance of the wall at the given neutral axis depth (c) and
base rotation (θ), Ec is the modulus of elasticity of concrete and Ieff is the effective moment of
inertia of the wall.
3.3.2 Step-by-Step Procedure
The steps involved in the MBA analysis method for the jointed wall system is summarized in
Figure 3.5. As in the PRESSS analysis procedure, the walls are analyzed individually and the
total resistance of the wall system is found by adding the resistance of the leading and trailing
walls. The steps involved in this approach are as follows:
77

1. Define wall dimensions and material properties.
This includes:
'cf = concrete strength γc = concrete density
P0 = initial post-tensioning force Ep = post-tensioning modulus of elasticity
fpy = post-tensioning yield strength Ap = area of post-tensioning
n = number of walls hw = height of wall
lw = length of wall panel tw = thickness of wall
Note that is assumed to be greater than thus the neutral axis depth at the base of
the wall is determined by .
'gf '
cf
'cf
2. Calculate the decompression point.
The decompression point is the point at which axial compression stress introduced by
post-tensioning and self weight is overcome by the lateral forces on the wall, resulting
in a stress of zero at one end of the wall. This is illustrated in Figure 3.6, where
Figure 3.6a represents the stress profile at the base of the wall caused by the initial
post-tensioning and the gravity loads including the self-weight of the wall. The
corresponding stress can be calculated as:
ww
00 tl
WP +=σ (3.24)
78

1. Define wall dimensions and material properties
3. Select base rotation, θ
4. Assume a neutral axis depth
Does C converge
?
No
Yes
More walls
?
No
Yes
5. From the equilibrium condition calculate forces at base rotation θ with the assumed neutral axis depth
6. Using MBA determine extreme fiber concrete strain
7. Using a confined concrete model, calculate the compression force and its location
2. Calculate decompression point
8. Compute resisting moment of the wall
9. Compute resisting moment of wall system
Select a new value for the neutral axis depth
Next wall
Iterate once to ensure convergence
Next θ
Figure 3.5 Flowchart summarizing the main steps involved in the wall system analysis
using the MBA concept.
79
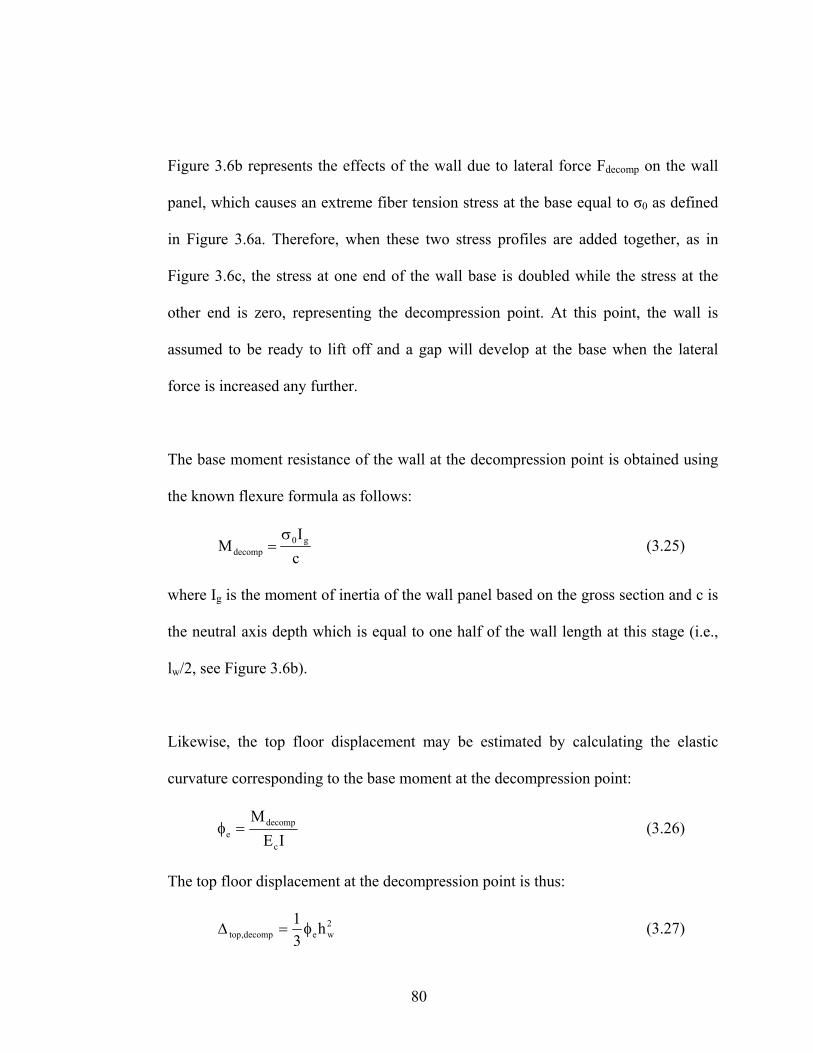
Figure 3.6b represents the effects of the wall due to lateral force Fdecomp on the wall
panel, which causes an extreme fiber tension stress at the base equal to σ0 as defined
in Figure 3.6a. Therefore, when these two stress profiles are added together, as in
Figure 3.6c, the stress at one end of the wall base is doubled while the stress at the
other end is zero, representing the decompression point. At this point, the wall is
assumed to be ready to lift off and a gap will develop at the base when the lateral
force is increased any further.
The base moment resistance of the wall at the decompression point is obtained using
the known flexure formula as follows:
cI
M g0decomp
σ= (3.25)
where Ig is the moment of inertia of the wall panel based on the gross section and c is
the neutral axis depth which is equal to one half of the wall length at this stage (i.e.,
lw/2, see Figure 3.6b).
Likewise, the top floor displacement may be estimated by calculating the elastic
curvature corresponding to the base moment at the decompression point:
IE
M
c
decompe =φ (3.26)
The top floor displacement at the decompression point is thus:
2wedecomp,top h
31
φ=Δ (3.27)
80

C C C
T
(a) (c) (b)
+ =σ0
Single Wall
Single Wall
Single Wall
P0+W P0+W Fdecomp Fdecomp
σ0
σ0
hw
lw lw/2 lw/2
2σ0
Figure 3.6 Stress profile at the base of the wall caused by: (a) the initial post-tensioning and
gravity loads including the self-weight of the wall, (b) lateral force Fdecomp on the
wall, and (c) by combination of loads from (a) and (b).
Note that the rotation at the interface between the wall and foundation is assumed to
be zero at the decompression point.
Assuming axial stresses due to gravity loads and post-tensioning force are the same
for leading and trailing walls, the decompression is expected simultaneously at both
wall bases. At this stage, the base moment and top floor displacement of the jointed
wall system are defined as:
81

cI2
M g0decomp
σ= (3.28)
2wedecomp,top h
31
φ=Δ (3.29)
3. Select base rotation, θ.
The first value of θ is taken as θdecomp + 0.0001 and the subsequent values are taken at
an increment of 0.0001 until a maximum value of 0.03 is reached, where θdecomp = 0.
4. Assume a neutral axis dept, c.
For the selected θ, assume an appropriate initial value for c so that the final value for
c may be established using an iterative procedure involving Steps 5 through 7. The
final c value corresponding to the previous step may be taken as the initial c value in
the current step.
5. From the equilibrium condition calculate forces at base rotation θ with the assumed
neutral axis depth.
Utilizing the wall geometry, illustrated in Figure 3.7, calculate the tendon elongation:
θ⎟⎠⎞
⎜⎝⎛ −=Δ c
2lw
p (3.30)
Calculate the increase in tendon stress:
w
ppp h
EfΔ
=Δ (3.31)
82

Calculate the total post-tensioning force (P) and the total tension force (N) under the
current base rotation and assumed neutral axis depth:
(3.32) 0pp PAfP +Δ=
WPN += (3.33)
The relative vertical displacement between the two adjacent walls is approximated to
the wall-end uplift (Figure 3.7b), which is estimated using the geometry of the wall
as:
(3.34) θ−=Δ )cl( wenduplift
(a) (b)
θ Δenduplift
Δp
c
lw
Leading Wall
N C=N+Fsc
θ
Trailing Wall
N C=N-Fsc
Fsc
θ
Figure 3.7 Forces acting on the jointed wall system at base rotation θ: (a) full view, and (b)
enlarged view at the base of a wall.
83

For a given value of Δenduplift from equation 3.34, the force transfer through a single
UFP (Fsco) is determined from Figure 3.3, which was presented in Section 3.2. Using
the total number of UFPs (nsc) located between the wall panels, the force transfer
along the vertical joint is calculated from Eq. 3.35.
(3.35) 0scscsc FnF =
Finally, the compressive force (C) can be determined from the equilibrium condition
of the wall panel in the vertical direction:
for the leading wall (3.36a)
for the trailing wall (3.36b)
scFNC +=
scFNC −=
6. Using MBA determine extreme fiber concrete strain.
As discussed previously in Section 3.3.1 (see Eqs. 3.22 and 3.23), the extreme fiber
compression strain may be approximated to:
⎟⎟⎠
⎞⎜⎜⎝
⎛+
θ=ε
effcwext,c IE
Mh08.0
c (3.37)
where Ec is the modulus of elasticity for concrete, Ieff is the effective moment of
inertia of the wall taken as 100% of Ig, where Ig is the moment of inertia of the gross
concrete section, and M is the base moment resistance of the wall panel at θ, which is
unknown and therefore the moment determined for θ in the previous step was used.
7. Using a confined concrete model calculate the compression force and its location.
The confined concrete model suggested by Mander et al. [37] was selected to
84
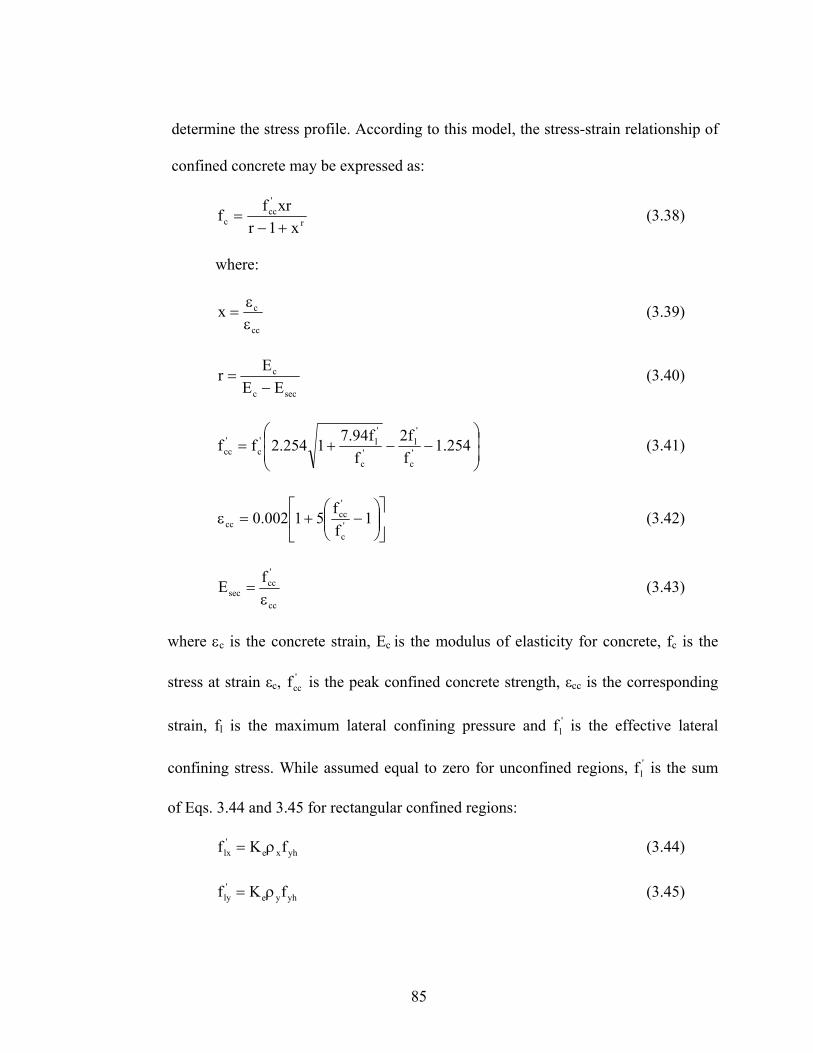
determine the stress profile. According to this model, the stress-strain relationship of
confined concrete may be expressed as:
r
'cc
c x1rxrff+−
= (3.38)
where:
cc
cxεε
= (3.39)
secc
c
EEEr−
= (3.40)
⎟⎟⎠
⎞⎜⎜⎝
⎛−−+= 254.1
ff2
ff94.71254.2ff '
c
'l
'c
'l'
c'cc (3.41)
⎥⎦
⎤⎢⎣
⎡⎟⎟⎠
⎞⎜⎜⎝
⎛−+=ε 1
ff51002.0 '
c
'cc
cc (3.42)
cc
'cc
secfEε
= (3.43)
where εc is the concrete strain, Ec is the modulus of elasticity for concrete, fc is the
stress at strain εc, is the peak confined concrete strength, ε'ccf cc is the corresponding
strain, fl is the maximum lateral confining pressure and is the effective lateral
confining stress. While assumed equal to zero for unconfined regions, is the sum
of Eqs. 3.44 and 3.45 for rectangular confined regions:
'lf
'lf
(3.44) yhxe'lx fKf ρ=
(3.45) yhye'ly fKf ρ=
85
where ρx and ρy are the transverse reinforcement area ratios in the principal
directions, fyh is the yield stress of the transverse reinforcement and Ke is the
confinement effectiveness coefficient recommended as 0.6 for rectangular wall
sections [36].
The stress-strain curve obtained for the walls in the PRESSS building from the above
model and measured average unconfined concrete strengths is shown in Figure 3.8.
Using these stress profiles to model the confined and unconfined concrete, the
resultant compressive force and its location can be obtained. In this study these
calculations were performed using the Simpson’s rule by dividing the profile into
several rectangular sections as illustrated for a compression region in Figure 3.9. The
resultant compressive force (Cconf) is found by summing the forces represented by the
rectangular areas. Similarly, the location of the resultant force is found by summing
up the individual rectangular areas multiplied by the distance to their individual
centroids from the neutral axis and then dividing this term by the summation of the
areas.
The resultant compressive force obtained from the confinement model is compared
with the compressive force obtained from the equilibrium condition in Eq. 3.36. If the
confined compressive force (Cconf) is not equal to the compressive force established
by equilibrium (C), then the neutral axis depth is increased and the process (Steps 5
through 7) is repeated until the two forces converge.
86

0.00 0.01 0.02 0.03 0.04Strain
0
2
4
6
8
10
12
Stre
ss (k
si)
0
10000
20000
30000
40000
50000
60000
70000
80000
Stre
ss (k
N/m
2 )
Unconfined Concrete
Confined Concrete
0.00 0.01 0.02 0.03 0.04Strain
0
2
4
6
8
10
12
Stre
ss (k
si)
0
10000
20000
30000
40000
50000
60000
70000
80000
Stre
ss (k
N/m
2 )
Unconfined Concrete
Confined Concrete
Figure 3.8 Confined and unconfined concrete stress-strain relationship established for the
PRESSS walls using the Mander’s model and measured concrete strengths.
Edge of Wall
Depth of Compression Zone
Actual Stress ProfileAssumedStress Profile
Edge of Wall
Depth of Compression Zone
Actual Stress ProfileAssumedStress Profile
Figure 3.9 Representation of the compression zone with several rectangular sections to
compute the resultant force and its location using the Simpson’s rule.
87

8. Compute the resisting moment of the wall:
⎟⎠⎞
⎜⎝⎛−−=
2lN)yl(CM w
w1panel,cap (3.46)
⎟⎠⎞
⎜⎝⎛+−=
2lN)y(CM w
2panel,cap (3.47)
where y is the distance from the edge of the wall to the resultant compression force
determined for the stress distribution in Figure 3.9. Steps 5 through 8 should be
iterated once more to ensure that the MBA (Step 6) utilizes an accurate moment in
computing the extreme fiber concrete strain (see Eq. 3.37).
9. Compute the resisting moment at the base of the wall system:
2panel,cap1panel,capwall,cap MMM += (3.48)
88
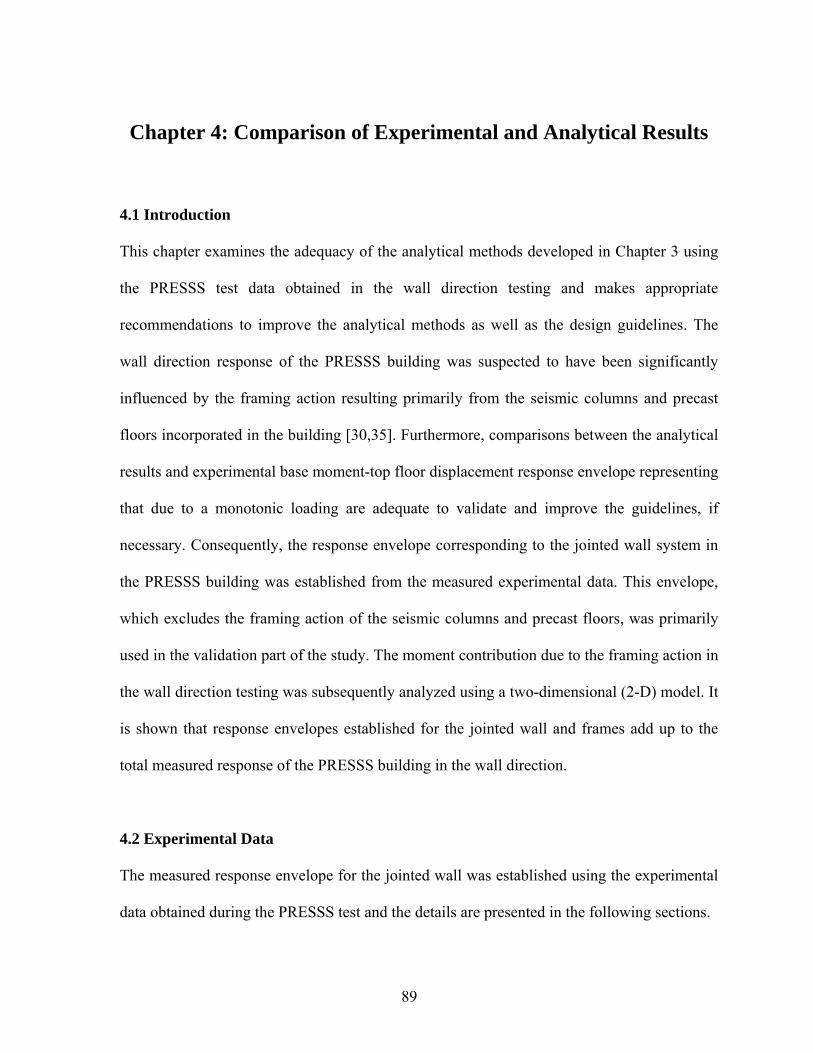
Chapter 4: Comparison of Experimental and Analytical Results
4.1 Introduction
This chapter examines the adequacy of the analytical methods developed in Chapter 3 using
the PRESSS test data obtained in the wall direction testing and makes appropriate
recommendations to improve the analytical methods as well as the design guidelines. The
wall direction response of the PRESSS building was suspected to have been significantly
influenced by the framing action resulting primarily from the seismic columns and precast
floors incorporated in the building [30,35]. Furthermore, comparisons between the analytical
results and experimental base moment-top floor displacement response envelope representing
that due to a monotonic loading are adequate to validate and improve the guidelines, if
necessary. Consequently, the response envelope corresponding to the jointed wall system in
the PRESSS building was established from the measured experimental data. This envelope,
which excludes the framing action of the seismic columns and precast floors, was primarily
used in the validation part of the study. The moment contribution due to the framing action in
the wall direction testing was subsequently analyzed using a two-dimensional (2-D) model. It
is shown that response envelopes established for the jointed wall and frames add up to the
total measured response of the PRESSS building in the wall direction.
4.2 Experimental Data
The measured response envelope for the jointed wall was established using the experimental
data obtained during the PRESSS test and the details are presented in the following sections.
89

4.2.1 Test Setup
The test setup adopted for the wall direction testing of the PRESSS building is shown in
Figure 4.1 and described in detail in Ref. [16]. Two servo-controlled hydraulic actuators per
floor were used for the seismic force simulation. The actuators were positioned eight feet
apart horizontally and 14 inches vertically from the top of the floors to the centerline of the
actuators. The actuator forces at each location were transmitted to the floor through two pin-
connected loading arms. As shown in Figure 4.2, the total base moment resistance of the
PRESSS building was obtained by summing the moments induced by the actuator force
times the vertical distance from the base of the building to the actuator location.
5'
10'-4"
2'-9" 4'-1134" 9'-11
4"
2'-9" 6'-6" 7'-812"
2'-9" 10'
11'-3
"7'
-6"
7'-6
"7'
-6"
7'-6
" 6 916"
4' -2 1/2"
8'-6"
9 1/2"
11"
Loading Tower
PRESSSBuilding
Loading Arm
Footing
StrongFloor
5'
10'-4"
2'-9" 4'-1134" 9'-11
4"
2'-9" 6'-6" 7'-812"
2'-9" 10'
11'-3
"7'
-6"
7'-6
"7'
-6"
7'-6
" 6 916"
4' -2 1/2"
8'-6"
9 1/2"
11"
Loading Tower
PRESSSBuilding
Loading Arm
Footing
StrongFloor
Figure 4.1 Test setup in the wall direction testing of the PRESSS building [16].
90

-12 -10 -8 -6 -4 -2 0 2 4 6 8Top Floor Displacement (in)
-100000
-75000
-50000
-25000
0
25000
50000
75000
100000
Bas
e M
omen
t (ki
p-in
)
-10000
-7500
-5000
-2500
0
2500
5000
7500
10000
Bas
e M
omen
t (kN
-m)
-300 -200 -100 0 100 200Top Floor Displacement (mm)
ExperimentalData Points
Figure 4.2 Observed response of the PRESSS test building in the jointed wall direction with
data points selected for isolating the response envelope of the jointed wall.
The actuator forces would have induced lateral and vertical forces at the floor levels as
illustrated in Figure 4.3. Based on the pin connection details adopted in the PRESSS
building, these forces would have been transferred to the walls in the upper two floors and
were included in the wall analysis. Since the jointed walls were connected to the lower three
floors through pins, which were free to move in the vertical direction, the vertical forces
induced by the actuators were not transmitted to the jointed wall and would have been
resisted by the frame comprised of the seismic columns and precast floors. This frame would
have also resisted a small portion of the lateral forces, leaving the rest of the lateral forces to
91

be resisted by the jointed wall. As a result, separating the jointed wall resistance from the
measured response is not straightforward. Therefore, the data acquired by instrumentation
attached to the wall system was used to isolate the wall system response envelope
independent of the framing action developed during testing of the PRESSS building.
(a) Lateral load application (b) Equivalent forces
FH0.5FH 0.5FH
FV FV
Figure 4.3 Typical floor forces introduced during testing of the PRESSS building.
4.2.2 Selected Data Points
The experimental base moment-displacement response of the wall system was formulated
using data points derived at selected measured displacements. As marked with solid circles in
Figure 4.2, data corresponding to eight first cycle peaks were utilized to establish the change
in the post-tensioning force, the amount of force transferred through the UFP connectors and
the neutral axis depth as a function of the top floor displacement. Using this information and
equilibrium conditions, the base moment resistance of the wall system was determined. In
this process, wall dimensions and properties as defined in Table 4.1 were used. The post-
tensioning force reported in this table was taken on 5% above the design level based on the
92
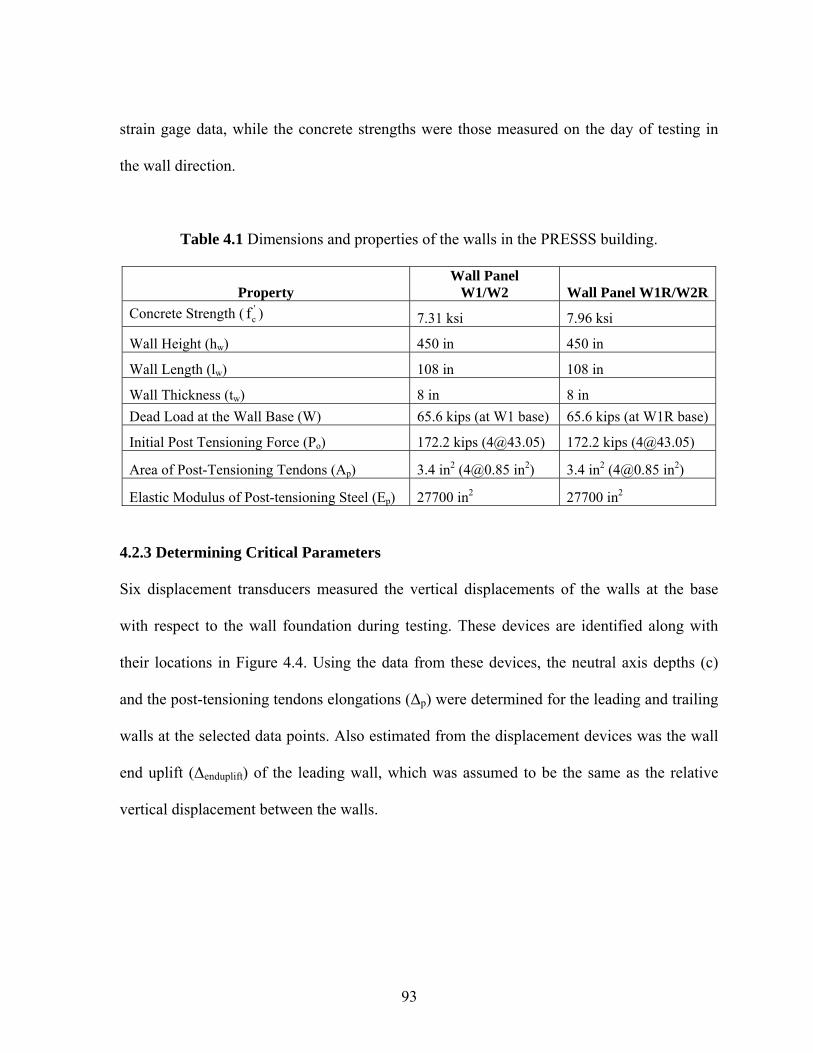
strain gage data, while the concrete strengths were those measured on the day of testing in
the wall direction.
Table 4.1 Dimensions and properties of the walls in the PRESSS building.
Property Wall Panel
W1/W2 Wall Panel W1R/W2RConcrete Strength ( ) '
cf 7.31 ksi 7.96 ksi
Wall Height (hw) 450 in 450 in
Wall Length (lw) 108 in 108 in
Wall Thickness (tw) 8 in 8 in Dead Load at the Wall Base (W) 65.6 kips (at W1 base) 65.6 kips (at W1R base)
Initial Post Tensioning Force (Po) 172.2 kips ([email protected]) 172.2 kips ([email protected])
Area of Post-Tensioning Tendons (Ap) 3.4 in2 ([email protected] in2) 3.4 in2 ([email protected] in2)
Elastic Modulus of Post-tensioning Steel (Ep) 27700 in2 27700 in2
4.2.3 Determining Critical Parameters
Six displacement transducers measured the vertical displacements of the walls at the base
with respect to the wall foundation during testing. These devices are identified along with
their locations in Figure 4.4. Using the data from these devices, the neutral axis depths (c)
and the post-tensioning tendons elongations (Δp) were determined for the leading and trailing
walls at the selected data points. Also estimated from the displacement devices was the wall
end uplift (Δenduplift) of the leading wall, which was assumed to be the same as the relative
vertical displacement between the walls.
93

W1 W1RW1VBE
W1VBS W1RVBS
W1VBN W1RVBN
W1RVBW
Figure 4.4 Plan view of instruments measuring vertical displacements at the base of the
wall system.
Assuming a linear profile at the bottom of the wall as shown in Figure 4.5, the neutral axis
depths or the lengths of the contact surface between the wall and the foundation were
determined at the selected lateral displacements by interpolating the displacements measured
at two locations (i.e., W1VBE and W1VBN as depicted in Figure 4.5). Additionally, this
process was used to determine the post-tensioning elongation, end uplift and base rotation.
W1VBE W1VBN
θΔ pΔ enduplift
c
Figure 4.5 North profile view of instruments at base of wall panel W1.
94

The assumption of a linear profile used above is considered satisfactory based on test results
reported by Rosenboom [38] from unbonded post-tensioned masonry walls, where the
researcher measured displacements between the wall and foundation at multiple locations.
4.2.4 Validity of Extracted Data
Additional data obtained during the PRESSS test were used to validate the data extraction as
presented in the above section. Of the four wall parameters determined in Section 4.2.3 at
selected displacements, independent data measurements were available to verify Δenduplift and
Δp. The extracted data are compared with the directly measured data below, which confirm
that data extraction presented in the previous section is satisfactory.
A displacement transducer, W1VCS, was located close to the wall foundation in the PRESSS
building, which measured the relative vertical displacement between the two walls along the
vertical joint (Figure 4.6). The measurements from this device included the wall end uplift of
the leading wall as well as the small deformation resulting from the trailing wall pushing into
the grout pad at the foundation interface. The data extracted from the base devices are
compared with the data recorded directly by W1VCS in Figure 4.7. The extracted data is
only about 4% less than the displacement recorded by W1VCS at the maximum top floor
lateral displacement of 11.5 inches.
95

W1 W1R W1VCS
Figure 4.6 Location of device W1VCS.
0 1 2 3 4 5 6 7 8 9 10 11 12Top Floor Displacement (in)
0.0
0.5
1.0
1.5
2.0
2.5
3.0
Rel
ativ
e V
ertic
al D
ispl
acem
ent (
in)
0
10
20
30
40
50
60
70
Rel
ativ
e V
ertic
al D
ispl
acem
ent (
mm
)
0 50 100 150 200 250 300Top Floor Displacement (mm)
Experimental (W1VCS)Experimental (Geometry)
Figure 4.7 Vertical displacement history experienced by the UFP connectors during the
PRESSS building test in the wall direction.
Strain gage measurements obtained from the post-tensioning bars facilitated examination of
the bar elongation estimated from the base devices. A direct comparison between the data
sets was not possible. In Figure 4.5, the effect of post-tensioning was modeled at the
96

centroidal location of the wall section at a distance of 0.5lw from the wall end. While in fact,
each wall in the PRESSS building was anchored with four 1-in. diameter Dywidag bars
located at a distance of 4.5-in. on either side of the centroidal axis. Adjusting the Δp
determined from the base devices to reflect effects of the exact location of the bars
containing the strain gages and dividing the adjusted Δp values by the unbonded length of the
post-tensioning to compute strains, Figure 4.8 compares the directly measured and computed
strains from Δp. At the maximum top floor displacement of 11.5-in, the data extracted from
the displacement devices at the base overestimated the strains by 5.8% and 1.1% in leading
and trailing walls, respectively.
0 1 2 3 4 5 6 7 8 9 10 11 1To
2p Floor Displacement (in)
0
500
1000
1500
2000
2500
3000
Mic
rost
rain
0 50 100 150 200 250 300Top Floor Displacement (mm)
Leading (strain gage)Trailing (strain gage)Leading (geometry)Trailing (geometry)
97
Figure 4.8 A comparison of experimental strains due to elongation of the post-tensioning
tendons.
The discrepancies between the directly measured data and those extracted from the
displacement measurements at the base of the walls were small and believed to have been
due to (a) neglecting the effects of the trailing wall pushing into the grout pad, and (b) the
linear profile assumed for the base rotation as in Figure 4.5. As illustrated in Figure 4.9, the
actual profile of the wall end is most likely not perfectly linear. These reasons are consistent
with the fact that the data extracted from the displacement measurements underestimated the
wall end uplift and overestimated the increase in the post-tensioning bar.
Profile indicated by data from strain gages and device
Assumed profile for geometric extrapolation
Figure 4.9 Wall base profile comparison.
The representation of a more realistic wall base profile as shown in Figure 4.9 indicates that
the actual neutral axis depth of the wall may be somewhat greater than those estimated by the
base devices. However, the expected difference in the neutral axis depths, which may be
98

quantified in future tests using displacement devices at multiple locations along the wall
base, had no significant effect on the moment resistance of the wall system.
4.2.5 Best Fit Curves
For the extracted data reported in Section 4.2.3, best fit curves were determined so that a
continuous curve representing the base moment-lateral load response could be developed for
the jointed wall system tested in the PRESSS building. Figures 4.10 and 4.11 show the
extracted data and best fit curves for the wall end uplift and elongations of the post-
tensioning tendons at the centroids of the wall sections. In both figures, variations of the
critical parameters as a function of top floor displacement are represented with straight lines.
0 1 2 3 4 5 6 7 8 9 10 11 12Top Floor Displacement (in)
0.0
0.5
1.0
1.5
2.0
2.5
3.0
Rel
ativ
e V
ertic
al D
ispl
acem
ent (
in)
0
10
20
30
40
50
60
70
Rel
ativ
e V
ertic
al D
ispl
acem
ent (
mm
)
0 50 100 150 200 250 300Top Floor Displacement (mm)
Best fitExperimental (Geometry)
Figure 4.10 Wall end uplift estimated from test data.
99
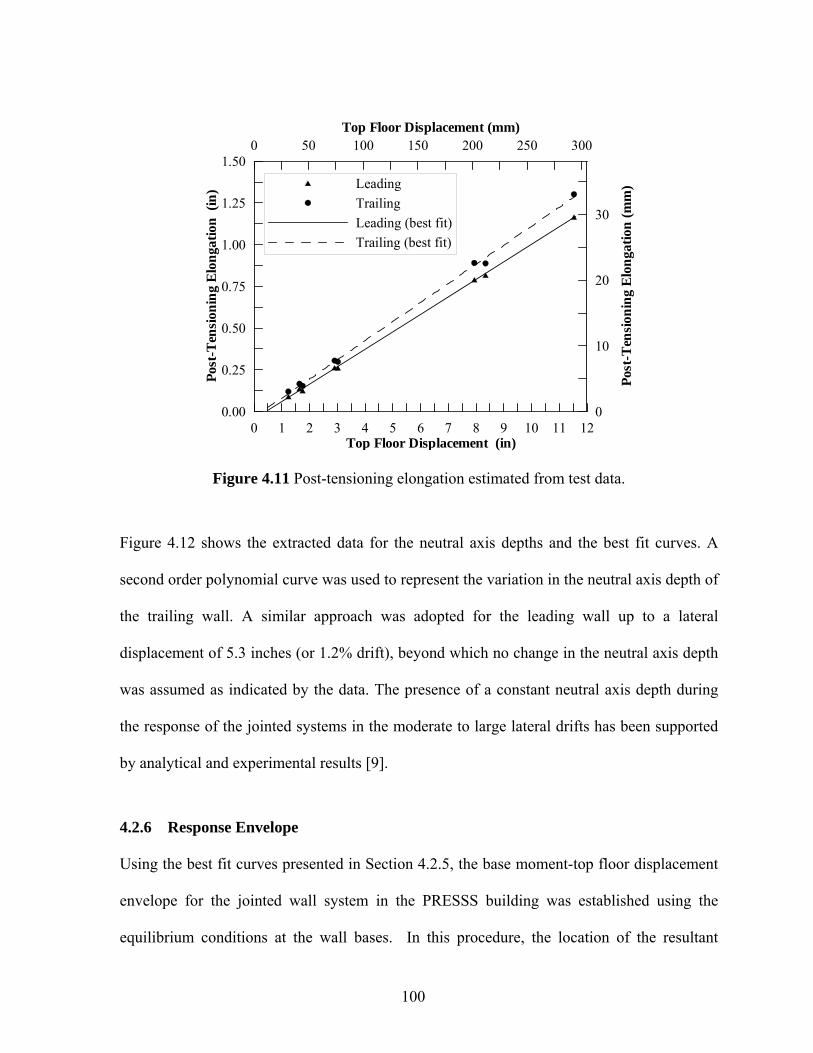
0 1 2 3 4 5 6 7 8 9 10 11 12Top Floor Displacement (in)
0.00
0.25
0.50
0.75
1.00
1.25
1.50
Post
-Ten
sion
ing
Elo
ngat
ion
(in)
0
10
20
30
Post
-Ten
sion
ing
Elo
ngat
ion
(mm
)
0 50 100 150 200 250 300Top Floor Displacement (mm)
LeadingTrailingLeading (best fit)Trailing (best fit)
Figure 4.11 Post-tensioning elongation estimated from test data.
Figure 4.12 shows the extracted data for the neutral axis depths and the best fit curves. A
second order polynomial curve was used to represent the variation in the neutral axis depth of
the trailing wall. A similar approach was adopted for the leading wall up to a lateral
displacement of 5.3 inches (or 1.2% drift), beyond which no change in the neutral axis depth
was assumed as indicated by the data. The presence of a constant neutral axis depth during
the response of the jointed systems in the moderate to large lateral drifts has been supported
by analytical and experimental results [9].
4.2.6 Response Envelope
Using the best fit curves presented in Section 4.2.5, the base moment-top floor displacement
envelope for the jointed wall system in the PRESSS building was established using the
equilibrium conditions at the wall bases. In this procedure, the location of the resultant
100
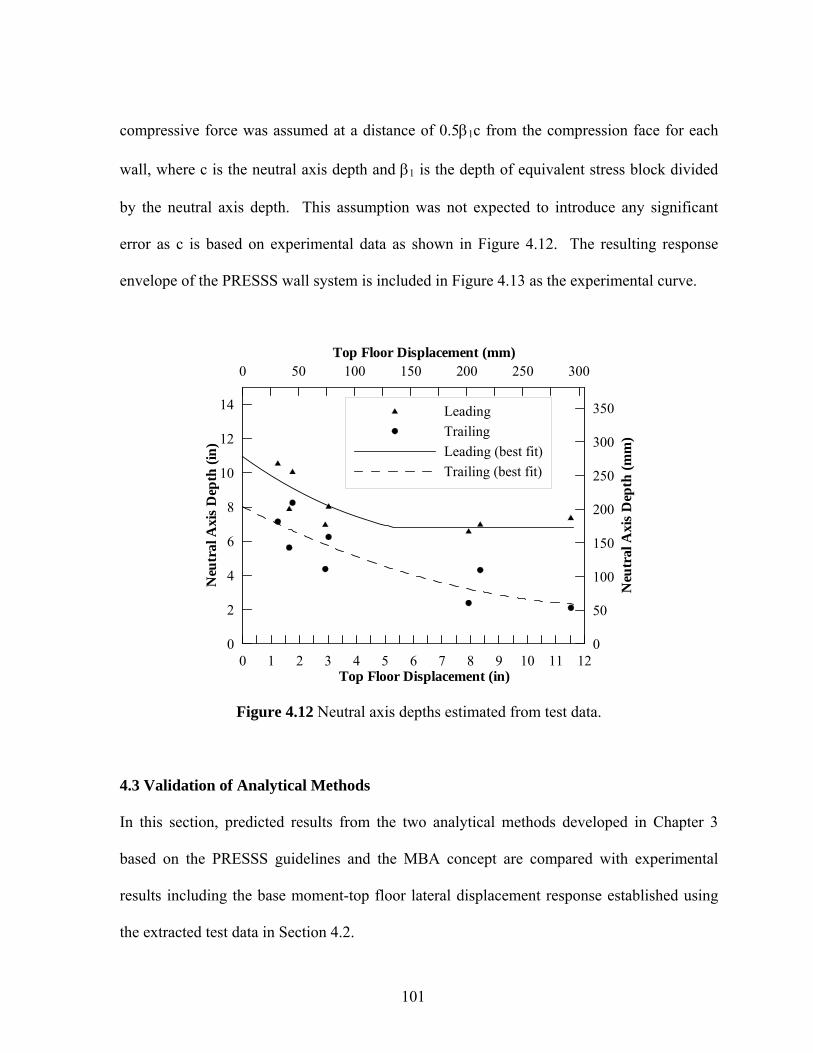
compressive force was assumed at a distance of 0.5β1c from the compression face for each
wall, where c is the neutral axis depth and β1 is the depth of equivalent stress block divided
by the neutral axis depth. This assumption was not expected to introduce any significant
error as c is based on experimental data as shown in Figure 4.12. The resulting response
envelope of the PRESSS wall system is included in Figure 4.13 as the experimental curve.
0 1 2 3 4 5 6 7 8 9 10 11 12Top Floor Displacement (in)
0
2
4
6
8
10
12
14
Neu
tral
Axi
s D
epth
(in)
0
50
100
150
200
250
300
350
Neu
tral
Axi
s D
epth
(mm
)
0 50 100 150 200 250 300Top Floor Displacement (mm)
LeadingTrailingLeading (best fit)Trailing (best fit)
Figure 4.12 Neutral axis depths estimated from test data.
4.3 Validation of Analytical Methods
In this section, predicted results from the two analytical methods developed in Chapter 3
based on the PRESSS guidelines and the MBA concept are compared with experimental
results including the base moment-top floor lateral displacement response established using
the extracted test data in Section 4.2.
101
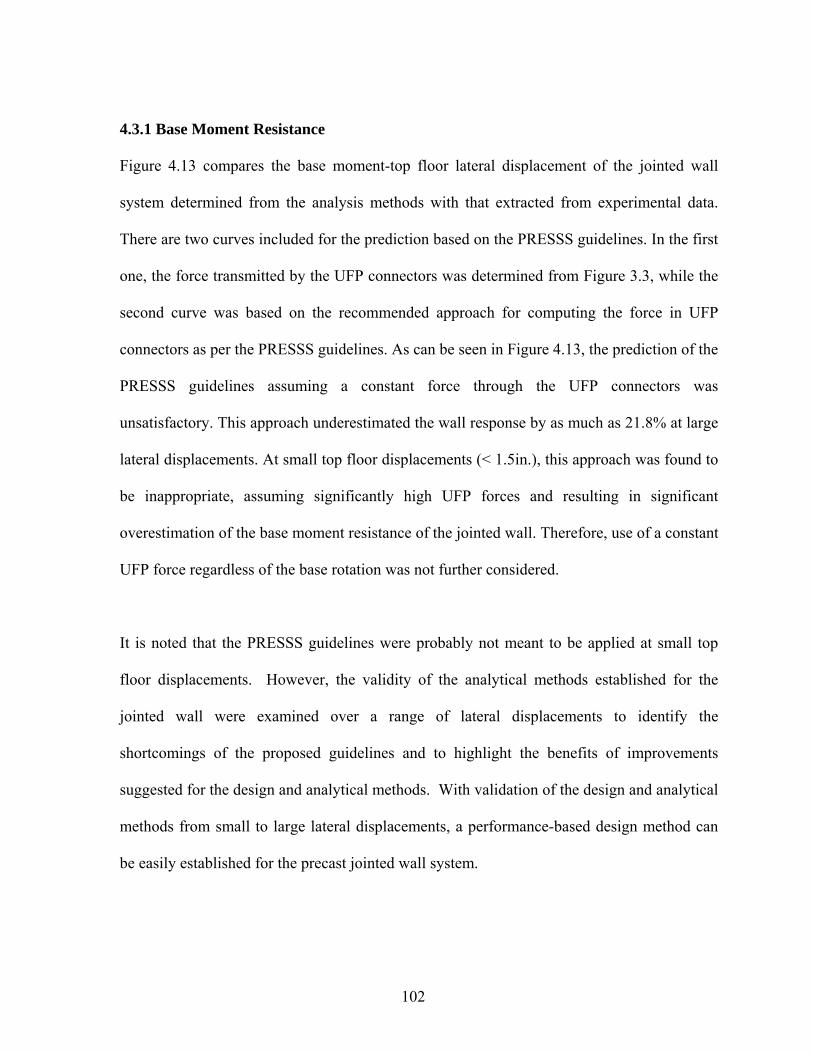
4.3.1 Base Moment Resistance
Figure 4.13 compares the base moment-top floor lateral displacement of the jointed wall
system determined from the analysis methods with that extracted from experimental data.
There are two curves included for the prediction based on the PRESSS guidelines. In the first
one, the force transmitted by the UFP connectors was determined from Figure 3.3, while the
second curve was based on the recommended approach for computing the force in UFP
connectors as per the PRESSS guidelines. As can be seen in Figure 4.13, the prediction of the
PRESSS guidelines assuming a constant force through the UFP connectors was
unsatisfactory. This approach underestimated the wall response by as much as 21.8% at large
lateral displacements. At small top floor displacements (< 1.5in.), this approach was found to
be inappropriate, assuming significantly high UFP forces and resulting in significant
overestimation of the base moment resistance of the jointed wall. Therefore, use of a constant
UFP force regardless of the base rotation was not further considered.
It is noted that the PRESSS guidelines were probably not meant to be applied at small top
floor displacements. However, the validity of the analytical methods established for the
jointed wall were examined over a range of lateral displacements to identify the
shortcomings of the proposed guidelines and to highlight the benefits of improvements
suggested for the design and analytical methods. With validation of the design and analytical
methods from small to large lateral displacements, a performance-based design method can
be easily established for the precast jointed wall system.
102
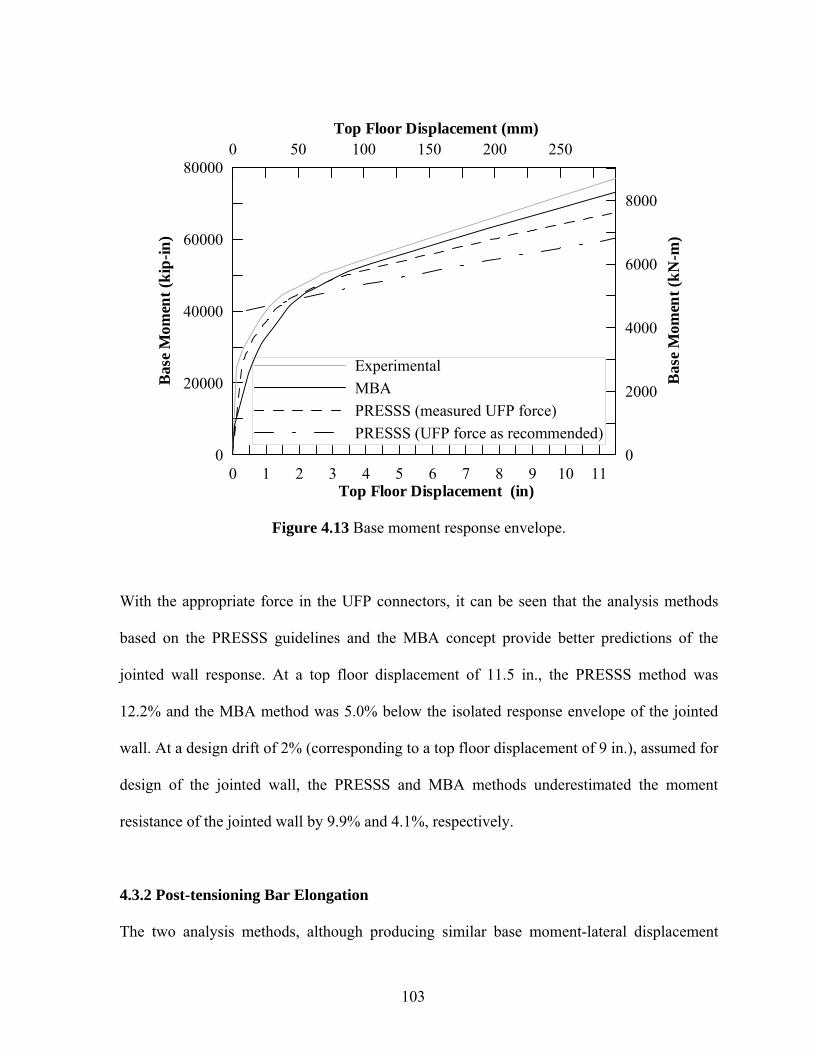
0 1 2 3 4 5 6 7 8 9 10 11Top Floor Displacement (in)
0
20000
40000
60000
80000B
ase
Mom
ent (
kip-
in)
0
2000
4000
6000
8000
Bas
e M
omen
t (kN
-m)
0 50 100 150 200 250Top Floor Displacement (mm)
ExperimentalMBAPRESSS (measured UFP force)PRESSS (UFP force as recommended)
Figure 4.13 Base moment response envelope.
With the appropriate force in the UFP connectors, it can be seen that the analysis methods
based on the PRESSS guidelines and the MBA concept provide better predictions of the
jointed wall response. At a top floor displacement of 11.5 in., the PRESSS method was
12.2% and the MBA method was 5.0% below the isolated response envelope of the jointed
wall. At a design drift of 2% (corresponding to a top floor displacement of 9 in.), assumed for
design of the jointed wall, the PRESSS and MBA methods underestimated the moment
resistance of the jointed wall by 9.9% and 4.1%, respectively.
4.3.2 Post-tensioning Bar Elongation
The two analysis methods, although producing similar base moment-lateral displacement
103

envelopes, differed noticeably when critical parameters used in design were compared at the
critical sections. Figures 4.14 and 4.15 show the calculated post-tensioning bar elongation for
both the leading and trailing walls along with the experimental data extracted previously. The
post-tensioning elongation was found to be underestimated by both analysis methods. The
elongation at the maximum top floor displacement of 11.5 in. (or 2.56% drift) in the leading
wall was underestimated by 26.0% using the PRESSS guidelines and by 15.3% using the
MBA method. Likewise, in the trailing wall the elongation was underestimated by 11.4% and
11.8% by the PRESSS guidelines and MBA, respectively. This underestimation, primarily of
the PRESSS leading wall, is of a concern since accurate prediction of the post-tensioning
force is essential for cost effectively designing an appropriate amount of post-tensioning steel
in the walls.
Another interesting observation from Figures 4.14 and 4.15 is that elongation of the post-
tensioning is typically higher in the trailing wall than in the leading wall. This observation is
supported by both experimental and analytical results. At the maximum lateral displacement
of 11.5 in., the elongation obtained for the trailing wall from experimental data was 10.5%
higher than that for the leading wall. Given the identical base rotations and different
compression forces at the wall toes, it is conceivable that the trailing wall is subjected to
reduced contact area, increasing the elongation of the post-tensioning steel more than that
experienced by the tendons in the leading wall. A design implication of this observation is
that the design of the post-tensioning steel area should account for both the required base
moment resistance of the leading wall and expected elongation in the trailing wall.
104

0 1 2 3 4 5 6 7 8 9 10 11 12Top Floor Displacement (in)
0.00
0.25
0.50
0.75
1.00
1.25
1.50
Post
-Ten
sion
ing
Elo
ngat
ion
(in)
0
5
10
15
20
25
30
35
Post
-Ten
sion
ing
Elo
ngat
ion
(mm
)
0 50 100 150 200 250 300Top Floor Displacement (mm)
Extracted dataMBAPRESSS
Figure 4.14 Post-tensioning elongation in leading wall.
0 1 2 3 4 5 6 7 8 9 10 11 12Top Floor Displacement (in)
0.00
0.25
0.50
0.75
1.00
1.25
1.50
Post
-Ten
sion
ing
Elo
ngat
ion
(in)
0
5
10
15
20
25
30
35Po
st-T
ensi
onin
g E
long
atio
n (m
m)
0 50 100 150 200 250 300Top Floor Displacement (mm)
Extracted dataMBAPRESSS
Figure 4.15 Post-tensioning elongation in trailing wall.
105

4.3.3 Neutral Axis Depth
The neutral axis depths calculated by the analytical methods are compared with experimental
data in Figures 4.16 and 4.17. Contrary to the expected trend, in which the neutral axis depth
at the base of the wall is expected to decrease at the beginning and then possibly remain
constant as the top floor displacement increases, PRESSS guidelines generally predicts an
increase in the neutral axis depth as the lateral displacement increases. At small
displacements, the PRESSS guidelines predict the expected trend for the neutral axis depth in
the trailing wall, but the values are significantly smaller than that predicted by the MBA
method. The reason for the PRESSS guidelines to show a contrasting trend when predicting
the neutral axis depth of the trailing wall at small lateral displacements is due to the
interaction of the force in the UFP connector, as shown in Figure 3.3.
The expected trend and the experimentally extracted neutral axis depths were more
satisfactorily predicted by the MBA method. Due to the approximate plastic hinge length
used in the derivation of the analysis methods based on MBA and the assumption of a linear
profile at the wall base used for extracting the data, the actual neutral axis depths in both
walls are expected between the MBA prediction and those portrayed by the extracted data. In
consideration of these issues, a more realistic prediction of the MBA method is discussed in
Section 4.5.2.
The difference between the analytical and extracted neutral axis depths were found to be the
cause for discrepancies observed between the predicted and experimental elongations of the
106

post-tensioning tendons in Figures 4.14 and 4.15. A more accurate estimation of the neutral
axis depth will more accurately estimate the elongations in the post-tensioning tendons.
0 1 2 3 4 5 6 7 8 9 10 11 12Top Floor Displacement (in)
02468
1012141618202224262830
Neu
tral
Axi
s D
epth
(in)
0
100
200
300
400
500
600
700
Neu
tral
Axi
s D
epth
(mm
)
0 50 100 150 200 250 300Top Floor Displacement (mm)
MBAPRESSSExtracted data
Figure 4.16 Neutral axis depth in leading wall.
4.4 Contribution of Framing Action
It was reported in Section 4.1 that framing action resulting from the seismic columns and
precast floors was suspected to have provided a significant amount of lateral load resistance
in the wall direction testing of the PRESSS building. A small contribution from the base
resistance of the two gravity columns was also expected. The moment resistance envelope,
which was established for the jointed wall system in Section 4.3.1 from experimental data
corresponded to about 80% of the total resistance. The unaccounted 20% base moment
resistance supported the hypothesis that framing action played a significant role in the wall
107

direction testing. Using a 2-D model developed using the computer program RUAUMOKO
[31], the contribution of the framing action is estimated in this section.
0 1 2 3 4 5 6 7 8 9 10 11 12Top Floor Displacement (in)
02468
1012141618202224262830
Neu
tral
Axi
s D
epth
(in)
0
100
200
300
400
500
600
700
Neu
tral
Axi
s D
epth
(mm
)
0 50 100 150 200 250 300Top Floor Displacement (mm)
MBAPRESSSExtracted data
Figure 4.17 Neutral axis depth in trailing wall.
4.4.1 2-D Frame Model
As shown in Figure 4.18, a 2-D model consisting of two columns and 5 beams was
developed to quantify the framing action. The three seismic columns in each of the seismic
frames, which were located on each side of the building perpendicular to the direction of the
wall testing (see Figure 1.4), were modeled as one column, while the beam elements modeled
the floor systems. The properties of the columns and floors established for the analysis are
presented in Table 4.2, in which Ec, G, A and Ieff are, respectively, the elastic modulus, shear
modulus, cross-sectional area and effective moment of inertia of the elements.
108

Rotational Spring (typ)
2F
F
5F
4F
3F
Pin Connection (typ)
Beam (typ)
Column (typ)
Figure 4.18 2-D RUAUMOKO frame model.
Table 4.2 Properties of elements in the 2-D RUAUMOKO frame model.
Member Ec (ksi) G (ksi) A (in2) Ieff (in4) Left Column from Base to Floor 1 5500 2300 972 18370.8Right Column from Base to Floor 1 5700 2400 972 18370.8Left Column from Floor 1 to 5 5500 2300 972 26244Right Column from Floor 1 to 5 5700 2400 972 26244Floor 1, 2 and 3 3300 1400 2545.5 146250.5Floor 4 and 5 3300 1400 2880 15360
109
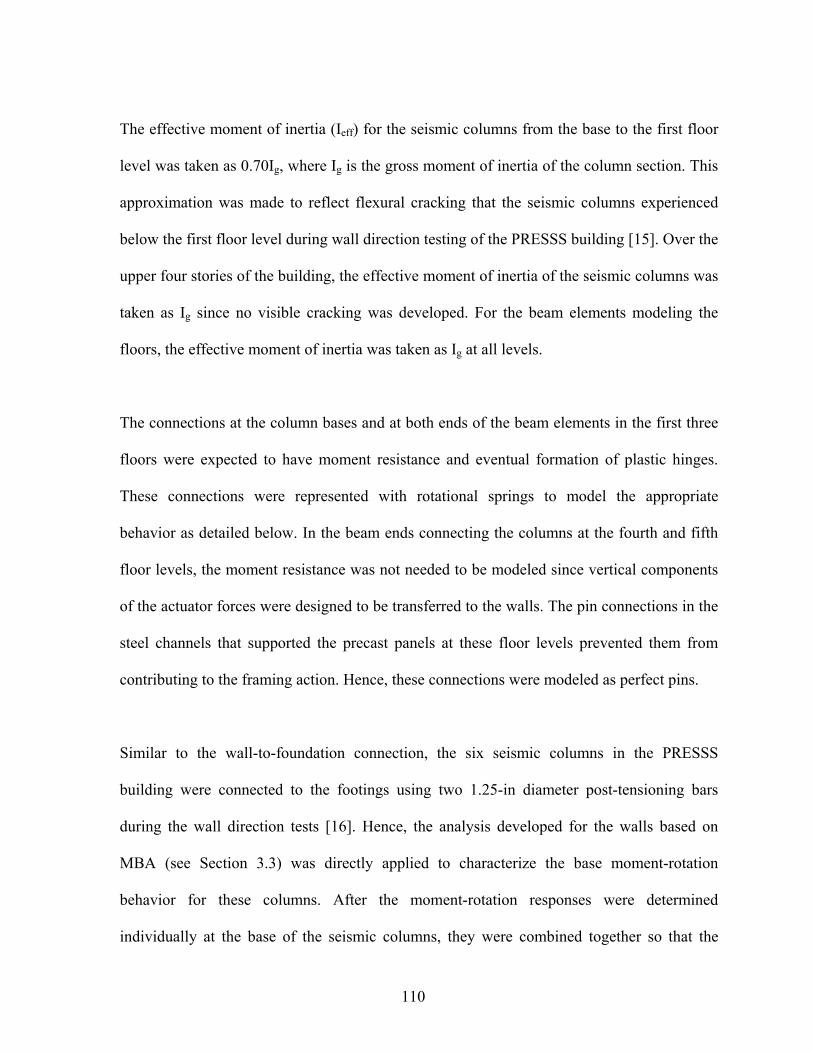
The effective moment of inertia (Ieff) for the seismic columns from the base to the first floor
level was taken as 0.70Ig, where Ig is the gross moment of inertia of the column section. This
approximation was made to reflect flexural cracking that the seismic columns experienced
below the first floor level during wall direction testing of the PRESSS building [15]. Over the
upper four stories of the building, the effective moment of inertia of the seismic columns was
taken as Ig since no visible cracking was developed. For the beam elements modeling the
floors, the effective moment of inertia was taken as Ig at all levels.
The connections at the column bases and at both ends of the beam elements in the first three
floors were expected to have moment resistance and eventual formation of plastic hinges.
These connections were represented with rotational springs to model the appropriate
behavior as detailed below. In the beam ends connecting the columns at the fourth and fifth
floor levels, the moment resistance was not needed to be modeled since vertical components
of the actuator forces were designed to be transferred to the walls. The pin connections in the
steel channels that supported the precast panels at these floor levels prevented them from
contributing to the framing action. Hence, these connections were modeled as perfect pins.
Similar to the wall-to-foundation connection, the six seismic columns in the PRESSS
building were connected to the footings using two 1.25-in diameter post-tensioning bars
during the wall direction tests [16]. Hence, the analysis developed for the walls based on
MBA (see Section 3.3) was directly applied to characterize the base moment-rotation
behavior for these columns. After the moment-rotation responses were determined
individually at the base of the seismic columns, they were combined together so that the
110
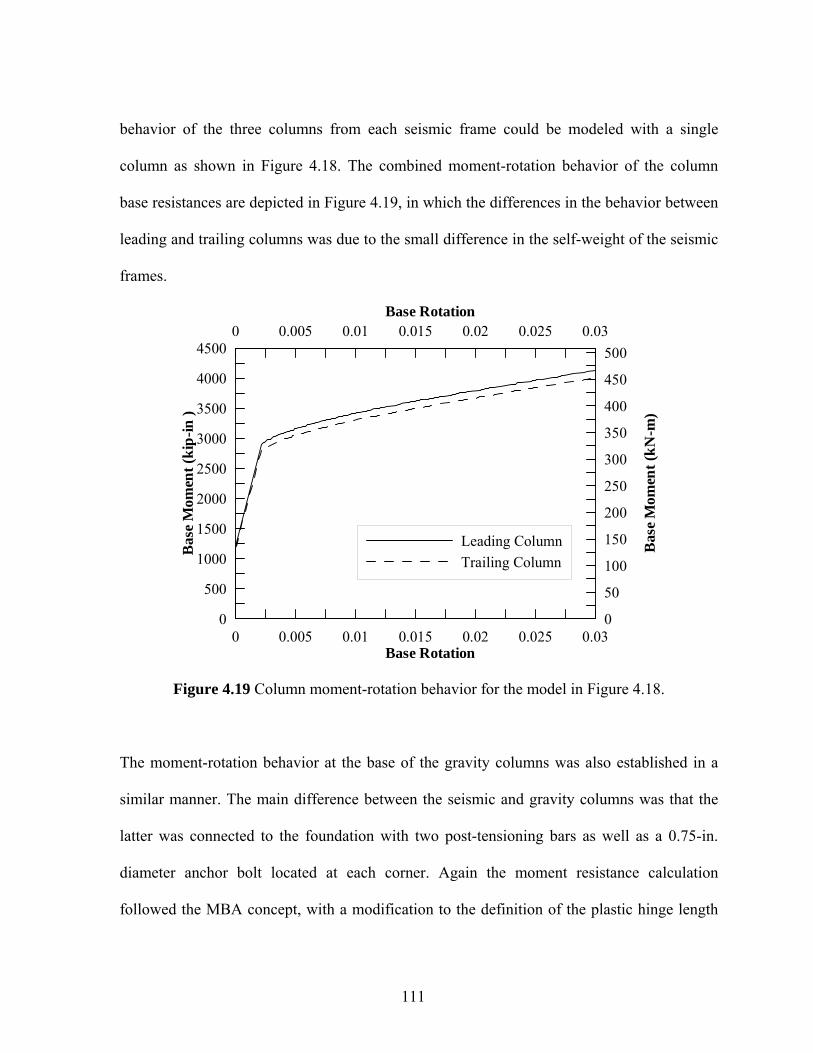
behavior of the three columns from each seismic frame could be modeled with a single
column as shown in Figure 4.18. The combined moment-rotation behavior of the column
base resistances are depicted in Figure 4.19, in which the differences in the behavior between
leading and trailing columns was due to the small difference in the self-weight of the seismic
frames.
0 0.005 0.01 0.015 0.02 0.025 0.03Base Rotation
0
500
1000
1500
2000
2500
3000
3500
4000
4500
Bas
e M
omen
t (ki
p-in
)
0
50
100
150
200
250
300
350
400
450
500
Bas
e M
omen
t (kN
-m)
0 0.005 0.01 0.015 0.02 0.025 0.03Base Rotation
Leading ColumnTrailing Column
Figure 4.19 Column moment-rotation behavior for the model in Figure 4.18.
The moment-rotation behavior at the base of the gravity columns was also established in a
similar manner. The main difference between the seismic and gravity columns was that the
latter was connected to the foundation with two post-tensioning bars as well as a 0.75-in.
diameter anchor bolt located at each corner. Again the moment resistance calculation
followed the MBA concept, with a modification to the definition of the plastic hinge length
111
defined in Section 3.3.1. Recognizing that strain penetration into the footing was possible
through anchorage of the anchor bolts, the new LP was taken as:
bycp df15.0h08.0L += (4.1)
where hc is the height of the column, fy and ds are, respectively, the yield strength and
diameter of the anchor bolt.
It is noted that the resistance of the gravity columns were not included in the 2-D frame
model shown earlier in Figure 4.18. However, the base moment-lateral displacement of the
columns was determined and is included in Figure 4.21, which shows the total contribution
of the two gravity columns designed in the PRESSS building. The contribution of the lateral
resistance of the gravity columns were added to the total moment response in Section 4.4.2.
The moment-rotation behavior of connections at Floors 1 through 3 (Figure 4.20) was
determined to be dependent on the bearing pad supporting the weight of the double tees. The
total weight of the double tees at each floor level was determined to be 80-kips, therefore 40-
kips on each side of the building. Since the connection details included a tie down rod, which
kept the double tees from lifting off of the pad, and the fact that no slippage was seen during
the testing, a coefficient of friction between the steel and bearing pad was estimated at 1.0.
Therefore, a yield moment of 800 kip-in. was established along with a yield rotation of 0.02
for the rotational springs at Floors 1 through 3 (see Figure 4.18).
112

Figure 4.20 Floor to seismic frame connection details used at Floors 1, 2 and 3 of the
PRESSS building.
4.4.2 Total Response
After the model was set up to capture the framing action, an inverse triangular push over
analysis was performed. This was done by proportionally increasing the load at each floor
level, where the force at the fifth floor is five times that of the first, the fourth is four times
that of the first, and so on as shown in Figure 4.18. The individual results for the frame
model and the gravity columns as well as the combined predicted response using the MBA
analysis results are compared with the experimental response in Figure 4.21.
The additional moment resistance included in the combined response is from two sources:
the moment resistance at the base of the seismic and gravity columns as well as the resistance
produced by the axial forces induced at the column bases in the model shown in Figure 4.18,
which created a moment couple. This moment couple, or framing action, accounted for over
8200 kip-in., which corresponded to an axial load of 22.9 kips in each column when they
113

reached a top floor displacement of 11.5 inches. With the combined response, the analytical
prediction in the wall direction fell only 0.7% below the experimental response at the
maximum top floor displacement of 11.5 inches. Although the analysis used a simple frame
model, it is satisfactory to confirm the accuracy of the MBA model for the wall system acting
independently.
-12 -10 -8 -6 -4 -2 0 2 4 6 8Top Floor Displacement (in)
-100000
-80000
-60000
-40000
-20000
0
20000
40000
60000
80000
100000
Bas
e M
omen
t (ki
p-in
)
-10000-8000-6000-4000-20000200040006000800010000
Bas
e M
omen
t (kN
-m)
-300 -250 -200 -150 -100 -50 0 50 100 150 200Top Floor Displacement (mm)
ExperimentalTotal PredictionWall (MBA)Seismic FrameGravity Columns
Figure 4.21 Base-moment versus top floor displacement response comparison for the jointed
wall system in the PRESSS building.
It should be noted that Conley et al. [30] satisfactorily predicted the behavior of the wall
direction response without accounting for the framing action. As discussed in Section 2.5.1,
it was suspected that the post-tensioning elongation and the force in the UFP connectors were
114

overestimated for the walls in their analytical model. Furthermore, the force-dispalcement
curve assumed for the UFP connectors was higher than that experimentally produced for the
PRESSS wall direction test. The analytical model used by Conley et al. may be improved by
incorporating the frame system and more accurately modeling the neutral axis depth and
contribution of the UFP connectors.
4.5 Recommendations
After completion of the analytical investigation, several aspects were examined to produce a
set of recommendations. The following two sections cover recommendations to improve the
PRESSS guidelines and the alternative method based on the MBA concept.
4.5.1 Recommendations for the PRESSS Guidelines
Several improvements are suggested for the use of the PRESSS design guidelines [18]. First
of all, the strength of the grout ( ) should be required to greater than the concrete strength of
wall panels ( ). This is important so that the strength of the concrete is used as the basis of
the design at the base/foundation interface. This is primarily because the confinement effects
on grout are unknown at this time and therefore the behavior of a weaker grout material
would be difficult to account for.
'gf
'cf
Experimental and analytical results confirmed that the uplifts of the leading and trailing walls
will be different at a given wall drift. Therefore, when using more than two walls in the
system, the intermediate wall(s) should account for the force in the UFP connectors along
115

both vertical joints on either side of the panel. These two forces should not be considered
equal and opposite and thus cancel out. The difference between the UFP forces acting on
either side of the intermediate wall(s) will modify to the resultant compression force at the
base and increase the overall moment resistance of the wall system.
When designing the post-tensioning tendons, the tendons should be designed for the forces in
the leading wall and checked for yielding in the trailing wall. This is primarily because, as
shown in Figures 4.14 and 4.15, the elongation in the trailing wall is greater than that in the
leading wall. Furthermore, appropriate equations should be developed to quantify the
moment contribution of the leading wall so that the post-tensioning steel can be efficiently
designed.
Additionally, to take into account the confinement effects of the concrete, it is recommended
to multiply the concrete strength ( ) by a factor of 1.6, along with a β'cf 1 value of 0.85.
Utilizing the increased concrete strength, determine the neutral axis depth using the PRESSS
recommendations at a 2% base rotation and use this neutral axis depth for base rotations from
0 to 3%, as illustrated in Figure 4.22. This approach, which will simply the design
calculations, has also been found to improve the design and response prediction of precast
hybrid frame connections [33]. As reported in this reference, the design and analysis
calculations should ideally assume two different concrete strengths for the confined and
unconfined concrete strengths. However, a single value of 1.6 is suggested for simplicity. 'cf
116

Along with this, it is recommended to use an experimentally determined force-displacement
interaction for the UFP connectors, as done in the analysis performed in this paper. Using
these improved PRESSS design recommendations improves the neutral axis depth prediction
and, as a result, improves the post-tensioning elongation (Figure 4.23) and moment response
predictions (Figure 4.24). The post-tensioning elongation in the leading wall improved from
26% difference to only 5.8% difference at a top floor displacement of 11.5-in and the
moment response improved from 12.2% to 3.5% difference at the same displacement.
0 1 2 3 4 5 6 7 8 9 10 11 12
Top Floor Displacement (in)
0
2
4
6
8
10
12
14
Neu
tral
Axi
s Dep
th (i
n)
0
50
100
150
200
250
300
350
Neu
tral
Axi
s Dep
th (m
m)
0 50 100 150 200 250 300Top Floor Displacement (mm)
Experimental LeadingExperimental TrailingImproved PRESSSLeading improved PRESSS trailing
Figure 4.22 Neutral axis depth predicted by improved PRESSS recommendations.
117

0 1 2 3 4 5 6 7 8 9 10 11 12
Top Floor Displacement (in)
0.00
0.25
0.50
0.75
1.00
1.25
1.50
Post
-Ten
sioni
ng E
long
atio
n (i
n)
0
10
20
30
Post
-Ten
sion
ing
Elo
ngat
ion
(mm
)
0 50 100 150 200 250 300Top Floor Displacement (mm)
Experimental LeadingExperimental TrailingImproved PRESSS LeadingImproved PRESSS Trailing
Figure 4.23 Post-tensioning elongation predicted by improved PRESSS recommendations.
0 1 2 3 4 5 6 7 8 9 10 11 12
Top Floor Displacement (in)
0
10000
20000
30000
40000
50000
60000
70000
80000
Bas
e M
omen
t (ki
p-in
)
0
1000
2000
3000
4000
5000
6000
7000
8000
9000
Bas
e M
omen
t (kN
-m)
0 50 100 150 200 250 300Top Floor Displacement (mm)
Improved PRESSSExperimentalPRESSS
Figure 4.24 Moment response predicted by improved PRESSS recommendations.
118

4.5.2
A method: (1) a reduction in the plastic hinge
order to test these improvements, an adjustment was made to the previously used data
Recommendations for MBA Method
Two improvements could be made to the MB
length (Lp), and (2) use of an improved confinement model for the high strength concrete.
The first improvement is suggested in recognition that a concentrated curvature distribution
is expected in the connection region of the jointed systems when compared to the equivalent
monolithic systems, which is expected to lead to smaller plastic hinge lengths for the jointed
systems than for the monolithic systems. The second improvement is suggested because it
was suspected that the confinement model by Mander et al. [37] may not capture the
confined behavior of high strength concrete.
In
points by adjusting the displacement readings from the compression side to ensure that the
neutral axis depth was not underestimated, as illustrated in Figure 4.9. Increasing the
displacement measured by the device at the compression end of the walls (i.e. device
W1VBN in Figure 4.5) by 1.5 times was found to be satisfactory as this more accurately
predicted the post-tensioning strains as illustrated in Figure 4.25 when compared with Figure
4.8, while the wall end uplift was virtually unaffected (Figure 4.7). Consequently, a reduction
in Lp from a value of 0.08hw, which is for use in monolithic walls, to a value of 0.06hw was
examined and found to predict the new neutral axis depth more accurately with the
assumption that the confinement model does not reduce once the peak stress has been
obtained (Figure 4.26). In other words, the confinement model behaves as described
previously until a value 'ccf is obtained and then maintains this stress until the maximum
strain predicted by the MBA method. This is done because at high strains the concrete stress
119
estimated by the confinement model of Mander et al. reduces, resulting in a reduction in
compressive capacity and therefore an increase in neutral axis depth, but as shown
experimentally the neutral axis depth decreases or remains unchanged with increased base
rotation.
The benefits of recommendation proposed for the MBA concepts can be further observed in
Figures 4.27 and 4.28, where the improved MBA model predicted the post-tensioning
elongation and wall moment more accurately. The post-tensioning elongation in the leading
wall improved from 15.3% difference to only 4.5% difference at a top floor displacement of
11.5 in. and the moment response improved from 5.0% to 4.4% difference at the same
displacement.
0 1 2 3 4 5 6 7 8 9 10 11 1To
2p Floor Displacement (in)
0
500
1000
1500
2000
2500
3000
3500
Post
-Ten
sion
ing
Stra
in (
in/in
x10-6
)
0 50 100 150 200 250 300Top Floor Displacement (mm)
New Leading (geometry)New Trailing (geometry)Leading (strain gage)Trailing (strain gage)
Figure 4.25 Post-tensioning strain by improved MBA method.
120

0 1 2 3 4 5 6 7 8 9 10 11 12Top Floor Displacement (in)
0
2
4
6
8
10
12
14
16
18
20
Neu
tral
Axi
s D
epth
(in)
0
50
100
150
200
250
300
350
400
450
500
Neu
tral
Axi
s D
epth
(mm
)
0 50 100 150 200 250 300Top Floor Displacement (mm)
New Experimental LeadingNew Experimental TrailingImproved MBA Leading Improved MBA Trailing
Figure 4.26 Neutral axis depth predicted by the improved MBA method.
0 1 2 3 4 5 6 7 8 9 10 11 12Top Floor Displacement (in)
0.00
0.25
0.50
0.75
1.00
1.25
1.50
Post
-Ten
sion
ing
Elo
ngat
ion
(in)
0
10
20
30Po
st-T
ensi
onin
g E
long
atio
n (m
m)
0 50 100 150 200 250 300Top Floor Displacement (mm)
New Experimental LeadingNew Experimental TrailingImproved MBA LeadingImproved MBA Trailing
Figure 4.27 Post-tensioning elongation predicted by the improved MBA m thod. e
121

0 1 2 3 4 5 6 7 8 9 10 11 12Top Floor Displacement (in)
0
10000
20000
30000
40000
50000
60000
70000
80000
Bas
e M
omen
t (ki
p-in
)
0
1000
2000
3000
4000
5000
6000
7000
8000
9000
Bas
e M
omen
t (kN
-m)
0 50 100 150 200 250 300Top Floor Displacement (mm)
Improved MBAExperimental
Figure 4.28 Moment response predicted by the improved MBA method.
122

Chapter 5: Conclusions and Recommendations
5.1 Overview
Structural walls have performed very well in past seismic events. With the added benefits of
precast concrete, unbonded post-tensioned precast jointed walls are an excellent system for
resisting lateral forces. The primary limitation in the United States is the code restriction of
designing precast concrete structures to emulate the behavior of monolithic cast-in-place
concrete structures. In consideration of these issues, PRESSS set out to improve the use and
design of precast concrete structures in seismic regions. As a part of the PRESSS research, a
five-story precast test building incorporating an unbonded post-tensioned precast concrete
wall system was constructed and tested at the University of California at San Diego. During
the testing it was found that the wall-direction moment response far surpassed all
expectations.
With ambitions of implementing this system in practice, a set of design guidelines was
established for unbonded post-tensioned jointed walls. Utilizing the PRESSS design
guidelines, an analysis method was established (Section 3.2) for the purpose of validation.
Additionally, due to concerns of inaccurate tendon elongation resulting from the use of the
equivalent stress block in the PRESSS guidelines, an alternative analysis method based on
the Monolithic Beam Analogy (MBA) concept (Section 3.3) was also developed to overcome
the strain incompatibility issue and accurately represents the concrete stress block a the wall
bases.
123

5.2 Conclusions
The following conclusions were drawn as a result of the analytical investigation based on
both the PRESSS design guidelines and the MBA concept:
• Use of an experimentally obtained U-shaped flexural plate (UFP) force-displacement
envelope more accurately predicts the moment response in the analysis of the jointed
wall system. The representation of the force transmitted through the UFP connectors
in the PRESSS guidelines is unsatisfactory and led to underestimation of the jointed
wall resistance measured in the PRESSS building by as much as 22%.
• The framing action of the seismic frames and precast floors and the moment
resistance of the gravity columns contributed to about 23% in the wall direction
response of the PRESSS building. When the framing action is not included and the
analysis prediction is based on the UFP force as recommended in the PRESSS
guidelines, the moment resistance of the wall was under predicted by 45%. Such a
significant discrepancy between the measured and analytical results would not assist
with the promotion of the precast jointed wall system nor the PRESSS design
guidelines.
• The base moment-top floor lateral displacement response envelope of the PRESSS
wall system was satisfactorily predicted by both analysis methods when the measured
force-displacement response was used for force in the UFP connectors. At a top floor
displacement of 11.5 in., the PRESSS method was found to underestimate the
moment response by 12.2% and the method based on MBA was found to be only
5.7% low.
124

• The PRESSS analysis method resulted in an unsatisfactory prediction of the neutral
axis depth by over 100% at a top floor displacement of 11.5 inches. As a result, the
elongation of the post-tensioning tendon in the walls was underestimated by up to
26%. This is of major concern since accurate estimation of the increase in post-
tensioning force is necessary for economically designing the area of the unbonded
prestressing steel.
• The MBA method was found to be satisfactory in predicting both the neutral axis
depth and post-tensioning elongation in the wall system.
5.3 Recommendations
Based on observations made throughout this study presented in this report, it is suggested
that the following changes be made to improve the PRESSS guidelines proposed for the
jointed wall systems:
• At the wall base-foundation interface, the grout strength should be required to be
greater than the concrete strength of the walls. This is primarily due to the unknown
stress-strain characteristics of the grout with confinement effects. Requiring the
concrete strength to be weaker than grout strength enables the former to govern
design at the interface.
• An experimentally obtained force-displacement response envelope for the shear
connector along the vertical joint between wall panels should be used to improve the
design of wall systems.
• The force contribution from the shear connectors on intermediate walls should not be
assumed as zero, since the corresponding force on either side of an intermediate wall
125
is not necessarily equal. Due to different wall end uplifts, the connector forces acting
on either side of an intermediate wall are most likely to be different.
• The post-tensioning steel should be designed for the moment demand of the leading
wall and then checked for potential yielding at the design drift using the elongation in
the trailing wall. In addition, design equations should be developed to proportion the
design moments between the walls.
• The equivalent stress block concept may be satisfactorily used in the design of the
wall systems. However, the concrete strength should be increased by a factor of 1.6 to
account for the confinement effects and to accurately estimate the neutral axis depths,
elongations in the post-tensioning tendons, and force in the shear connectors.
Furthermore, the neutral axis depth should be calculated at a base rotation of 2%, and
this neutral axis depth may be used for all base rotations up to 3% in the design
calculations as needed. As suggested by Celik and Sritharan [33], a tri-linear
idealization may be considered for the neutral axis depth variation to improve the
analytical prediction of the jointed wall system behavior.
• Once the PRESSS guidelines are updated based on the above recommendations, the
equations provided for controlling residual drift, avoiding sliding failure, preventing
uplift of wall panel etc. (see Eqs. 2.37 – 2.41) should be appropriately modified and
verified against experimental data.
The following recommendations are suggested for improving the analysis method based
on MBA:
• Additional improvements in the MBA method may be obtained by decreasing the
126

equivalent plastic hinge length to a value of 0.06 times the height of the wall (hw).
This reduction is suggested since the value of 0.08hw was established for monolithic
walls and due to the observed improvement in the prediction of the neutral axis depth,
post-tensioning elongation and overall moment response when the plastic hinge
length was approximated to 0.06 hw.
• Use of a confinement model suitable for high strength concrete may further improve
the MBA method by restricting the neutral axis depth from increasing at higher
strains associated with increased base rotation.
5.4 Future Research
• An experimental investigation to verify the suggested plastic hinge length (Lp) for
unbonded post-tensioned precast systems should be performed to improve the MBA
analysis method.
• Testing of unbonded post-tensioned precast jointed wall systems with different aspect
ratios and multiple walls should be performed to further validate both the PRESSS
guidelines and the MBA method.
127

REFERENCES
[1] Fintel, M.: Ductile Structural Walls in Earthquake Resistant Multistory Buildings,
ACI Journal, June 1974.
[2] Fintel, M.: Searwalls: An Answer for Seismic Resistance?, Concrete
International, Vol. 13, No.7, July 1991.
[3] Fintel, M.: Performance of Buildings with Structural Walls in Earthquakes of the
Last Thirty Years, PCI Journal, May-June 1995.
[4] http://nisee.berkeley.edu/eqiis_earthquakes.html, accessed June 26, 2003.
[5] Park, R.: A Perspective on the Seismic Design of Precast Concrete Structures in
New Zealand, PCI Journal, Vol. 40, No. 3, May-June 1995.
[6] Yee, A. A.: Social and Environmental Benefits of Precast Concrete Technology,
PCI Journal, May-June 2001.
[7] Priestley, M. J. N.: Overview of PRESSS Research Program, PCI Journal, Vol.
36, No. 4, July-Aug 1991.
[8] Park, R.: The FIB State-of-the-Art Report on the Seismic Design of Precast
Concrete Building Structures, 2003 Pacific Conference on Earthquake
Engineering in Auckland, New Zealand, Paper Number 11, Feb 2003.
[9] Vernu, S., Sritharan, S.: Section, Member and System Level Analyses for Precast
Concrete Hybrid Frames, ISU-ERI-Ames Report ERI-04635, Department of
Civil, Construction and Environmental Engineering, Iowa State University, Ames,
Iowa, June 2004.
128

[10] Ghosh, S. K.: Seismic Design Provisions in U.S. Codes and Standards: A Look
Back and Ahead, PCI Journal, Jan-Feb 2002.
[11] ACI Committee 318: Building Code Requirements for Structural Concrete (ACI
318-83) and Commentary (ACI 318R-83), American Concrete Institute,
Farmington Hills, MI.
[12] Nakaki, S. D., Stanton, J. F., Sritharan, S.: An Overview of the PRESSS Five-
Story Precast Test Building, PCI Journal, March-April 1999.
[13] Kurama, Y., Pessiki, S., Sause, R., Lu, L.: Lateral Load Behavior and Seismic
Design of Unbonded Post-Tensioned Precast Concrete Walls, ACI Structural
Journal, July-Aug 1999.
[14] Nakaki, S. D., Englekirk, R. E.: PRESSS Industry Seismic Workshops: Concept
Development, PCI Journal, Vol. 36, No. 5, Sept-Oct 1991.
[15] Priestley, M. J. N., Sritharan, S., Conley, J., and Pampanin, S.: Preliminary
Results From the PRESSS Five-Story Precast Concrete Test Building, PCI
Journal, Nov-Dec 1999.
[16] Sritharan, S., Pampanin, S., Conley, J.: Design Verification, Instrumentation and
Test Procedures, PRESSS-3: The Five Story Precast Test Building, Vol. 3-3,
Department of Civil and Construction Engineering, Iowa State University, 2002.
[17] Seismology Committee of Structural Engineers Association of California:
Recommended Lateral Force Requirements and Commentary, Structural
Engineers Association of California, September 1999.
129

[18] Stanton, J. F., and Nakaki, S. D.: Design Guidelines for Precast Concrete Seismic
Structural Systems, PRESSS Report No. 01/03-09 (UW Report No. SM 02-02),
Department of Civil Engineering, University of Washington, February 2002.
[19] Englekirk, R. E.: Seismic Design Considerations for Precast Concrete Multistory
Buildings, PCI Journal, Vol. 35, No. 3, May-June 1990.
[20] Cheok, G. S., and Lew, H. S.: Performance of Precast Concrete Beam-to-Column
Connections Subject to Cyclic Loading, PCI Journal, Vol. 36, No. 3, May-June
1991.
[21] International Conference of Building Officials: Uniform Building Code, Whittier,
CA, 1997.
[22] ACI Committee 550: Emulating Cast-in-Place Detailing in Precast Concrete
Structures, ACI 50.1R-01, American Concrete Institute, September 2001.
[23] Priestley, M. J. N., Tao, J. R.: Seismic Response of Precast Prestressed Concrete
Frames with Partially Debonded Tendons, PCI Journal, Jan-Feb 1993.
[24] Kurama, Y., Pessiki, S., Sause, R., Lu, L.: Seismic Behavior and Design of
Unbonded Post-Tensioned Precast Concrete Walls, PCI Journal, Vol. 44, No. 3,
May-June 1999.
[25] Kurama, Y., Pessiki, S., Sause, R., Lu, L.: Seismic Response Evaluation of
Unbonded Post-Tensioned Precast Walls, ACI Structural Journal, Sept-Oct 2002.
[26] Prakash, V., Powell, G. H., Campbell, S.: DRAIN-2DX – Static and Dynamic
Analysis of Inelastic Plane Structures, Department of Civil Engineering,
University of California, Berkeley 1993.
130

[27] Building Seismic Safety Council: NEHRP Recommended Provisions for the
Development of Seismic Regulations for New Buildings, BSSC, Washington
D.C., 1997.
[28] Schultz, A. E., Magana, R. A.: Seismic Behavior of Connections in Precast
Concrete Walls, Mete A. Sozen Symposium, Paper No. SP 162-12, American
Concrete Institute, Farmington Hills, MI, 1996.
[29] Thomas, D. J.: Analysis and Validation of a Seismic Design Method Proposed for
Precast Jointed Wall System, M.S. Thesis, Department of Civil, Construction and
Environmental Engineering, Iowa State University, Ames, Iowa, 2003.
[30] Conley, J., Sritharan, S., Priestley, M. J. N.: Precast Seismic Structural Systems
PRESSS-3: The Five-Story Precast Test Building Vol. 3-1: Wall Direction
Response, Report No. SSRP-99/19, Department of Structural Engineering,
University of California at San Diego, California, July 2002.
[31] Carr, A. J.: RUAUMOKO, Computer Program Library, University of Canterbury,
Christchurch, New Zealand, 2000.
[32] Galusha, J.G. III: Precast, Post-Tensioned Concrete Walls Designed to Rock,
M.S. Thesis, Department of Civil Engineering, University of Washington, 1999.
[33] Celik, O., Sritharan, S.: An Evaluation of Seismic Design Guidelines Proposed for
Precast Concrete Hybrid Frame Systems, ISU-ERI-Ames Report ERI-04425,
Department of Civil, Construction and Environmental Engineering, Iowa State
University, Ames, Iowa, January 2004.
131

[34] Pampanin, S., Priestley, M. J. N., Sritharan, S.: Analytical Modeling of the
Seismic Behaviour of Precast Concrete Frames Designed with Ductile
Connections, Journal of Earthquake Engineering, Vol. 5, No. 3, 2001.
[35] Sritharan, S., Thomas, D. J.: Analysis of a Jointed Precast Wall System Subjected
to Seismic Actions, 2003 FIB-Symposium, Athens, Greece.
[36] Paulay, T., Priestley, M. J. N.: Seismic Design of Reinforced Concrete and
Masonry Buildings, John Wiley and Sons, Inc., New York, New York, 1992.
[37] Mander, J. B., Priestley, M. J. N., Park, R.: Theoretical Stress-Strain Model for
Confined Concrete, Journal of Structural Engineering, Vol. 114, No. 8, Aug 1988.
[38] Rosenboom, O. A.: Post-Tensioned Clay Brick Masonry Walls for Modular
Housing in Seismic Regions, M.S. thesis, Department of Civil Engineering, North
Carolina University, 2002.
132