An environmental pressure index proposal for urban development planning based on the analytic...
11
An environmental pressure index proposal for urban development planning based on the analytic network process Tomás Gómez-Navarro a, ⁎, Mónica García-Melón a , Silvia Acuña-Dutra b , Diego Díaz-Martín b a Departamento de Proyectos de Ingeniería, Universidad Politécnica de Valencia, Camino de Vera s/n. 46022, Valencia, Spain b Departamento de Estudios Ambientales, Universidad Metropolitana, Autopista Guarenas, Sector La Urbina, Distribuidor Metropolitano, Caracas, Venezuela abstract article info Article history: Received 12 September 2008 Received in revised form 28 October 2008 Accepted 31 October 2008 Available online 8 January 2009 Keywords: Environmental Pressure Index Urban planning Analytic Network Process Decision making This paper introduces a new approach to prioritize urban planning projects according to their environmental pressure in an efficient and reliable way. It is based on the combination of three procedures: (i) the use of environmental pressure indicators, (ii) the aggregation of the indicators in an Environmental Pressure Index by means of the Analytic Network Process method (ANP) and (iii) the interpretation of the information obtained from the experts during the decision-making process. The method has been applied to a proposal for urban development of La Carlota airport in Caracas (Venezuela). There are three options which are currently under evaluation. They include a Health Club, a Residential Area and a Theme Park. After a selection process the experts chose the following environmental pressure indicators as ANP criteria for the project life cycle: used land area, population density, energy consumption, water consumption and waste generation. By using goal-oriented questionnaires designed by the authors, the experts determined the importance of the criteria, the relationships among criteria, and the relationships between the criteria and the urban development alternatives. The resulting data showed that water consumption is the most important environmental pressure factor, and the Theme Park project is by far the urban development alternative which exerts the least environmental pressure on the area. The participating experts coincided in appreciating the technique proposed in this paper is useful and, for ranking ordering these alternatives, an improvement from traditional techniques such as environmental impact studies, life-cycle analysis, etc. © 2008 Elsevier Inc. All rights reserved. 1. Introduction La Carlota airport is located in the valley of the City of Caracas (Venezuela). It covers an approximate land area of 100 ha. It was inaugurated in 1946 for civil and military use and was shut down by the National Executive Department in 2005 with the intention of using the land for other purposes. Since then, different proposals for the recreational, urban and cultural use of the land have been formulated. Three different proposals of land use have currently been presented to the Government of Venezuela, but the proposals have not been evaluated nor selected yet. The proposals consist of three different projects of urban development: a residential area, a health club and a theme park. The residential complex was proposed by the City Council of the Municipality of Chacao, which is located next to the airport (Fig. 1). The project arose in August 2006 as a response to the need for more housing. Although the National Government is in favour of the construction of a residential area in the land of the airport, it presented an alternative project that considered a higher population density. None of the projects was positively welcomed by the local community, who considered that the construction of a residential area would increase traffic problems and worsen local public services. On the other hand, the recreational and Health Club was proposed by the architect Fruto Vivas in 2000 with the purpose of offering more recreational and leisure areas to the people of Caracas. The architect mentions that the city only counts with 0.2 m 2 of green areas per inhabitant. The development of this proposal was also demanded by the National Government, which has not made any decision on it yet. However, the local communities seem to agree with this land use of the airport, provided its implementation does not involve negative impacts on public services and the corresponding authorities commit themselves to environmentally preserve the area. As regards the Theme Park, it was proposed by the architect Ivan León in 2007 with the purpose of giving the Libertador Simón Bolívar a zone in which Bolivarism can be seen by Venezuelans as a respect to the activities and achievements of this leader throughout his life. This proposal has not been taken yet into consideration by the National Government or by the local communities. Environmental Impact Assessment Review 29 (2009) 319–329 ⁎ Corresponding author. Tel.: +34963879860; fax: +34963879869. E-mail addresses: [email protected] (T. Gómez-Navarro), [email protected] (M. García-Melón), [email protected] (S. Acuña-Dutra), [email protected] (D. Díaz-Martín). 0195-9255/$ – see front matter © 2008 Elsevier Inc. All rights reserved. doi:10.1016/j.eiar.2008.10.004 Contents lists available at ScienceDirect Environmental Impact Assessment Review journal homepage: www.elsevier.com/locate/eiar
Transcript of An environmental pressure index proposal for urban development planning based on the analytic...
Environmental Impact Assessment Review 29 (2009) 319–329
Contents lists available at ScienceDirect
Environmental Impact Assessment Review
j ourna l homepage: www.e lsev ie r.com/ locate /e ia r
An environmental pressure index proposal for urban development planning based onthe analytic network process
Tomás Gómez-Navarro a,⁎, Mónica García-Melón a, Silvia Acuña-Dutra b, Diego Díaz-Martín b
a Departamento de Proyectos de Ingeniería, Universidad Politécnica de Valencia, Camino de Vera s/n. 46022, Valencia, Spainb Departamento de Estudios Ambientales, Universidad Metropolitana, Autopista Guarenas, Sector La Urbina, Distribuidor Metropolitano, Caracas, Venezuela
⁎ Corresponding author. Tel.: +34963879860; fax: +E-mail addresses: [email protected] (T. Gómez-Nav
(M. García-Melón), [email protected] (S. Acuña-Du(D. Díaz-Martín).
0195-9255/$ – see front matter © 2008 Elsevier Inc. Aldoi:10.1016/j.eiar.2008.10.004
a b s t r a c t
a r t i c l e i n f oArticle history:
This paper introduces a new Received 12 September 2008Received in revised form 28 October 2008Accepted 31 October 2008Available online 8 January 2009Keywords:Environmental Pressure IndexUrban planningAnalytic Network ProcessDecision making
approach to prioritize urban planning projects according to their environmentalpressure in an efficient and reliable way. It is based on the combination of three procedures: (i) the use ofenvironmental pressure indicators, (ii) the aggregation of the indicators in an Environmental Pressure Indexby means of the Analytic Network Process method (ANP) and (iii) the interpretation of the informationobtained from the experts during the decision-making process.Themethod has been applied to a proposal for urban development of La Carlota airport in Caracas (Venezuela).There are three options which are currently under evaluation. They include a Health Club, a Residential Areaand a Theme Park. After a selection process the experts chose the following environmental pressure indicatorsas ANP criteria for the project life cycle: used land area, population density, energy consumption, waterconsumption and waste generation. By using goal-oriented questionnaires designed by the authors, theexperts determined the importance of the criteria, the relationships among criteria, and the relationshipsbetween the criteria and the urban development alternatives.The resulting data showed that water consumption is the most important environmental pressure factor, andthe Theme Park project is by far the urban development alternative which exerts the least environmentalpressure on the area. The participating experts coincided in appreciating the technique proposed in this paperis useful and, for ranking ordering these alternatives, an improvement from traditional techniques such asenvironmental impact studies, life-cycle analysis, etc.
© 2008 Elsevier Inc. All rights reserved.
1. Introduction
La Carlota airport is located in the valley of the City of Caracas(Venezuela). It covers an approximate land area of 100 ha. It wasinaugurated in 1946 for civil andmilitary use andwas shut downby theNational Executive Department in 2005with the intention of using theland for other purposes. Since then, different proposals for therecreational, urban and cultural use of the land have been formulated.
Three different proposals of land use have currently been presentedto the Government of Venezuela, but the proposals have not beenevaluated nor selected yet. The proposals consist of three differentprojects of urban development: a residential area, a health club and atheme park.
The residential complex was proposed by the City Council of theMunicipality of Chacao,which is located next to the airport (Fig.1). Theproject arose in August 2006 as a response to the need for more
34963879869.arro), [email protected]), [email protected]
l rights reserved.
housing. Although the National Government is in favour of theconstruction of a residential area in the land of the airport, it presentedan alternative project that considered a higher population density.None of the projects was positively welcomed by the local community,who considered that the construction of a residential area wouldincrease traffic problems and worsen local public services.
On the other hand, the recreational and Health Club was proposedby the architect Fruto Vivas in 2000 with the purpose of offering morerecreational and leisure areas to the people of Caracas. The architectmentions that the city only counts with 0.2 m2 of green areas perinhabitant. The development of this proposal was also demanded bythe National Government, which has not made any decision on it yet.However, the local communities seem to agree with this land use ofthe airport, provided its implementation does not involve negativeimpacts on public services and the corresponding authorities committhemselves to environmentally preserve the area.
As regards the Theme Park, it was proposed by the architect IvanLeón in 2007with the purpose of giving the Libertador Simón Bolívar azone in which Bolivarism can be seen by Venezuelans as a respect tothe activities and achievements of this leader throughout his life. Thisproposal has not been taken yet into consideration by the NationalGovernment or by the local communities.

Fig. 1. Location of La Carlota airport at Caracas, Venezuela (elaborated with figures extracted from Google Maps: http://maps.google.es).
320T.G
ómez-N
avarroet
al./Environm
entalIm
pactAssessm
entReview
29(2009)
319–329

321T. Gómez-Navarro et al. / Environmental Impact Assessment Review 29 (2009) 319–329
The three urban development proposals involve environmentalimpacts which have not been properly assessed yet. Actually, none ofthem has completed the Environmental Impact Assessment (EIA)analysis as stated in the Constitución de la República Bolivariana deVenezuela (1999).
The present work proposes a new method for the environmentalprioritization of these projects of urban development based on thetechnique known as Analytic Network Process (ANP) that allows theanalysis of different carefully selected variables with the aim ofmaking efficient and reliable decisions based on the opinion andjudgments of a group of experts.
2. The complexity of comparative environmental assessment forsustainable urban development
As a project becomes more and more complex, environmentalimpact assessment also becomes more complex (EIA refers to both theanalysis and the assessment of environmental impact). This has ledseveral authors to discuss the reliability and accuracy of EIA and LCAas a decision-making tool for ranking different alternatives when theyshow complex interactions with the environment along their lifecycle. This is even more so if the main environmental impacts occur inthe long term during the phases of “Exploitation” and “End of Life” ofthe product/facility (Cloquell-Ballester et al., 2006).
Urban planning projects can be included in this category.According to Hasse and Lathrop (2003), Chace and Walsh (2004),Brilly et al. (2006) and Zhang et al. (2006a,b), they are projects withsignificant and complex environmental impacts that greatly affectenvironmental sustainability. On the other hand, they are projectswith long life cycles in which the biggest impacts mainly occurduring the exploitation phase. The exploitation phase may lastseveral decades which makes it difficult to assess its environmentalreal values. Thus, EIA techniques are necessarily based on estimatesand assumptions for the determination of the most relevant impacts.It can be affirmed that the sophisticated and accurate analysis toolsare of little use when the information available is inaccurate anduncertain.
EIA presents another drawback when making decisions ondifferent urban planning projects as the results obtained from theassessment process for each project are not comparable. Actually,each assessment team may take into consideration differentenvironmental impacts (Brown, 2003). But even if they select thesame impacts for all the alternatives, a second problem is how tocompare alternatives that stand out in the analysis of differentenvironmental impacts. For example, one project causes greatereffects on the climate change, another project on a higher consump-tion of non-renewable resources, and a third one on toxicity. Whichenvironmental impacts are to be considered more important?
There is extensive literature on alternatives to EnvironmentalImpact Assessment of Urban Development (Discoli, 2005). Thesealternatives try to solve the problems of EIA for ranking ordering thealternatives, i.e. lack of rigor, lack of accuracy and non-comparableresults. Additionally, on certain occasions or for some decision-makers, EIA and LCA procedures can be too cumbersome or slow forthe degree of reliability and accuracy obtained (Brown, 2003; Discoli,2005; Rojas, 1998).
To solve such problems the most widely used approaches arethose that combine a simpler procedure of data collection andenvironmental impact assessment, and the clustering of the resultsinto indices (Hermann et al., 2007). These indices receive differentnames: Environmental Quality Index (Brown, 2003; Sólnes, 2003),Sustainability Index (Lundin and Morrison, 2002), EnvironmentalSustainability Index (Köne and Büke, 2007), Environmental ImpactIndex (Hermann et al., 2007), etc. The differences among theseindices can be grouped into two index design strategies, compatibleand often complementary (Beinat, 1997):
a) How to estimate the relationship between the activity and theenvironment
b) How to cluster the results of the estimates into one single value, i.e.the index
The first strategy for index design is related to howwe can simplifythe search for measurable environmental factors and their conversioninto environmental impacts. And all this with a sufficient degree ofreliability and accuracy. There are several approaches:
a) To consider only indicators of environmental pressure (Bosch et al.,1999; Pinter et al., 1999) assuming that the lower the environ-mental pressure the smaller the environmental impact
b) To use Environmental Performance Indicators (Hermann et al.,2007). It is a simplification of the first approach in which, on onehand the search is restricted to the most significant environmentalpressures, and on the other hand usually to the “life cycle” phase ofthe project considered as the phase with the highest environmentalimpact
c) To take into consideration the opinion of experts (Sólnes, 2003;Leskinen, 2007; García-Melón et al., 2008a). In this case, there are noestimates, and the information used comes from the opinion on theproject by experts of renowned experience and knowledge of thecase.
The second strategy for index design consists of clustering theassessment results into an index that allows for the comparison of thealternatives. Within this approach we can find the followingmethods:
a) To use transfer or utility–ratio functions (Wolfslehner et al., 2005).Utility–ratio functions are used in order to convert the differentenvironment aspects' values to the same scale and the results,either weighted or not, are clustered into an end value
b) To use transfer or utility–interval functions (Bojórquez-Tapia et al.,2005; Cloquell-Ballester et al., 2007). The standard procedureconsists of using value intervals between a maximum and aminimumvalue to which the different variables of the problem arecompared. The results of the comparisons, either weighted or not,are then clustered into an end value.
Finally, when the information available is biased and uncertain, asin urban development planning environmental impact assessments, itis necessary to make estimates. In such cases, experience andknowledge of the problem are more important than the assessmenttechnique itself. Therefore, it is preferable to focus the efforts onfinding a renowned group of experts and get them involved in theprocess. Additionally, Saaty (1996) reports that for problems withbiased or non-quantifiable data, the utility–ratio functions are moreefficient for prioritization purposes.
In the present work an approach based on a combination of theexperts' judgments on the problem and the utility–ratio functions isproposed. The experts help to classify the different alternativesaccording to the environmental pressure that the alternatives willexert along their life cycle if they are implemented. Hermann et al.(2007) prove that this data is enough to select the best projects evenfrom the viewpoint of environmental impact. The experts select theenvironmental pressure indicators depending on the characteristics ofthe project and its life cycle, the conditions of the local and generalenvironment, and the estimated environmental impacts resultingfrom the environmental pressure of each alternative.
In order to cluster all judgments on the different environmentalpressures into a single “Environmental Pressure Index” that simplifiesthe ranking of urban planning alternatives, a new techniquebased on Multicriteria Decision Analysis (MCDA), namely the AnalyticNetwork Process, is proposed in the present work. This method,based on the use of utility–ratio functions, is particularly suitable forproblems with little and uncertain information, using qualitative
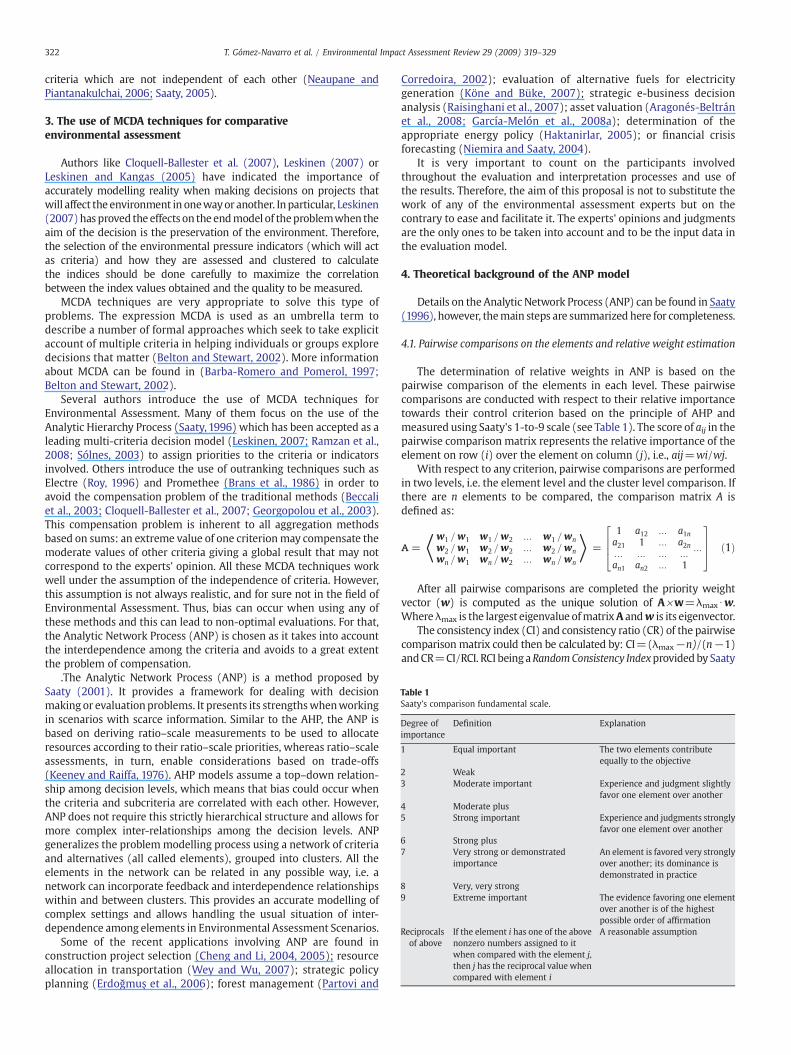
Table 1Saaty's comparison fundamental scale.
Degree ofimportance
Definition Explanation
1 Equal important The two elements contributeequally to the objective
2 Weak3 Moderate important Experience and judgment slightly
favor one element over another4 Moderate plus5 Strong important Experience and judgments strongly
favor one element over another6 Strong plus7 Very strong or demonstrated
importanceAn element is favored very stronglyover another; its dominance isdemonstrated in practice
8 Very, very strong9 Extreme important The evidence favoring one element
over another is of the highestpossible order of affirmation
Reciprocalsof above
If the element i has one of the abovenonzero numbers assigned to itwhen compared with the element j,then j has the reciprocal value whencompared with element i
A reasonable assumption
322 T. Gómez-Navarro et al. / Environmental Impact Assessment Review 29 (2009) 319–329
criteria which are not independent of each other (Neaupane andPiantanakulchai, 2006; Saaty, 2005).
3. The use of MCDA techniques for comparativeenvironmental assessment
Authors like Cloquell-Ballester et al. (2007), Leskinen (2007) orLeskinen and Kangas (2005) have indicated the importance ofaccurately modelling reality when making decisions on projects thatwill affect the environment in onewayor another. Inparticular, Leskinen(2007)hasproved the effects on the endmodel of theproblemwhen theaim of the decision is the preservation of the environment. Therefore,the selection of the environmental pressure indicators (which will actas criteria) and how they are assessed and clustered to calculatethe indices should be done carefully to maximize the correlationbetween the index values obtained and the quality to be measured.
MCDA techniques are very appropriate to solve this type ofproblems. The expression MCDA is used as an umbrella term todescribe a number of formal approaches which seek to take explicitaccount of multiple criteria in helping individuals or groups exploredecisions that matter (Belton and Stewart, 2002). More informationabout MCDA can be found in (Barba-Romero and Pomerol, 1997;Belton and Stewart, 2002).
Several authors introduce the use of MCDA techniques forEnvironmental Assessment. Many of them focus on the use of theAnalytic Hierarchy Process (Saaty, 1996) which has been accepted as aleading multi-criteria decision model (Leskinen, 2007; Ramzan et al.,2008; Sólnes, 2003) to assign priorities to the criteria or indicatorsinvolved. Others introduce the use of outranking techniques such asElectre (Roy, 1996) and Promethee (Brans et al., 1986) in order toavoid the compensation problem of the traditional methods (Beccaliet al., 2003; Cloquell-Ballester et al., 2007; Georgopolou et al., 2003).This compensation problem is inherent to all aggregation methodsbased on sums: an extreme value of one criterionmay compensate themoderate values of other criteria giving a global result that may notcorrespond to the experts' opinion. All these MCDA techniques workwell under the assumption of the independence of criteria. However,this assumption is not always realistic, and for sure not in the field ofEnvironmental Assessment. Thus, bias can occur when using any ofthese methods and this can lead to non-optimal evaluations. For that,the Analytic Network Process (ANP) is chosen as it takes into accountthe interdependence among the criteria and avoids to a great extentthe problem of compensation.
.The Analytic Network Process (ANP) is a method proposed bySaaty (2001). It provides a framework for dealing with decisionmaking or evaluationproblems. It presents its strengthswhenworkingin scenarios with scarce information. Similar to the AHP, the ANP isbased on deriving ratio–scale measurements to be used to allocateresources according to their ratio–scale priorities, whereas ratio–scaleassessments, in turn, enable considerations based on trade-offs(Keeney and Raiffa, 1976). AHP models assume a top–down relation-ship among decision levels, which means that bias could occur whenthe criteria and subcriteria are correlated with each other. However,ANP does not require this strictly hierarchical structure and allows formore complex inter-relationships among the decision levels. ANPgeneralizes the problemmodelling process using a network of criteriaand alternatives (all called elements), grouped into clusters. All theelements in the network can be related in any possible way, i.e. anetwork can incorporate feedback and interdependence relationshipswithin and between clusters. This provides an accurate modelling ofcomplex settings and allows handling the usual situation of inter-dependence among elements in Environmental Assessment Scenarios.
Some of the recent applications involving ANP are found inconstruction project selection (Cheng and Li, 2004, 2005); resourceallocation in transportation (Wey and Wu, 2007); strategic policyplanning (Erdoğmuş et al., 2006); forest management (Partovi and
Corredoira, 2002); evaluation of alternative fuels for electricitygeneration (Köne and Büke, 2007); strategic e-business decisionanalysis (Raisinghani et al., 2007); asset valuation (Aragonés-Beltránet al., 2008; García-Melón et al., 2008a); determination of theappropriate energy policy (Haktanirlar, 2005); or financial crisisforecasting (Niemira and Saaty, 2004).
It is very important to count on the participants involvedthroughout the evaluation and interpretation processes and use ofthe results. Therefore, the aim of this proposal is not to substitute thework of any of the environmental assessment experts but on thecontrary to ease and facilitate it. The experts' opinions and judgmentsare the only ones to be taken into account and to be the input data inthe evaluation model.
4. Theoretical background of the ANP model
Details on the Analytic Network Process (ANP) can be found in Saaty(1996), however, themain steps are summarized here for completeness.
4.1. Pairwise comparisons on the elements and relative weight estimation
The determination of relative weights in ANP is based on thepairwise comparison of the elements in each level. These pairwisecomparisons are conducted with respect to their relative importancetowards their control criterion based on the principle of AHP andmeasured using Saaty's 1-to-9 scale (see Table 1). The score of aij in thepairwise comparison matrix represents the relative importance of theelement on row (i) over the element on column (j), i.e., aij=wi/wj.
With respect to any criterion, pairwise comparisons are performedin two levels, i.e. the element level and the cluster level comparison. Ifthere are n elements to be compared, the comparison matrix A isdefined as:
A =hw1 =w1 w1 =w2 N w1 =wnw2 =w1 w2 =w2 N w2 =wnwn =w1 wn =w2 N wn =wn
i=
1 a12 N a1na21 1 N a2nN N N N
an1 an2 N 1
N
2664
3775 ð1Þ
After all pairwise comparisons are completed the priority weightvector (w) is computed as the unique solution of A×w=λmaxd w.Whereλmax is the largest eigenvalue ofmatrixA andw is its eigenvector.
The consistency index (CI) and consistency ratio (CR) of the pairwisecomparison matrix could then be calculated by: CI=(λmax−n)/(n−1)andCR=CI/RCI. RCI being aRandomConsistency Indexprovidedby Saaty

Fig. 2. General structure of the supermatrix.
323T. Gómez-Navarro et al. / Environmental Impact Assessment Review 29 (2009) 319–329
(1980). In general, if CI is less than0.1, the judgment can be considered asconsistent.
4.2. Construction of the original supermatrix (unweighted supermatrix)
The resulting relative importanceweights (eigenvectors) inpairwisecomparison matrices are placed within a supermatrix that representsthe interrelationships of all elements in the system. The generalstructure of the supermatrix is described in Fig. 2, where Ci denotesthe ith cluster, eji denotes the jth element of the ith cluster and Wik is ablockmatrix consisting of priority weight vectors of the influence of theelement in the ith cluster with respect to the kth cluster.
4.3. Constructing the weighted supermatrix
The following step consists of the weighting of the blocks of theunweighted supermatrix, by the corresponding priorities of the clusters,so that it can be column stochastic (weighted supermatrix). Aftera reflection on the clusters conducted by authors, the experts agreedthat the weights of the three different clusters had to be the same.
Fig. 3. Residential
4.4. Calculation of the global priority weights
Raising the weighted supermatrix to limiting powers until theweights converge and remain stable the limit supermatrix will beobtained. In this matrix, the elements of each column represent thefinal weights of the different elements considered. The priority of eachalternative is a non-dimensional value that will be considered theEnvironmental Pressure Index (EPRI).
In order to endow the results with a higher value, it is advisable tohave several experts involved in solving the problem of prioritization.In this case a group of five experts have been contacted: one memberof a public entity who is an expert in urban planning; an academiccoordinator of a Master in Urban Planning; a professional environ-mentalist; a contractor–builder of important projects and a universityteacher who is an expert in environmental management.
5. Case study on the choice of the best alternative for the futureexploitation of the La Carlota Airport in Caracas (Venezuela)
5.1. The alternatives
At this stage of the problem the required data for standard EIAanalysis are not known yet. However, to rank order the alternativesfrom the environmental point of view it is still necessary. This meansdealing with a problem with little information and thus suitable forthe use of ANP as this method is based not on data but on comparisonsmade by experts.
5.1.1. Alternative 1: Residential AreaThis alternative consists of developing a residential complex with
145000 m2 of sports areas, 11500 dwellings, and 30000 m2 of greenzones which will benefit 60000 people. It is estimated that theexecution of this plan can take 36 months and the generation of6000 jobs. The residential area is intended to use all the availableairport land, i.e. 99.6 Ha. The 11500 dwellings are distributed into80 m2 apartments (70%) and 66 m2
flats (30%). Within the145000 m2 of sports areas the project also includes the constructionof an Olympic stadium (30 000 m2) and a baseball stadium(30000 m2), a sports centre (54000 m2), five-a-side pitches(13000 m2) and a swimming centre (18000 m2). This recreationalarea will also include large green zones that will be connected to theParque del Este underground. The project also comprises theconstruction of squares, a cultural centre, a shopping centre and
area project.

Fig. 4. Health Club project.
324 T. Gómez-Navarro et al. / Environmental Impact Assessment Review 29 (2009) 319–329
15000 car park slots. It is a wide urban project with a total budget of727 million dollars (Fig. 3).
5.1.2. Alternative 2: Health ClubThis alternative uses all the airport land and creates a corridor
with the Parque del Este. The project plan includes school–farms,
Fig. 5. Theme P
water parks, aquariums and contact farms, a heliport for emergen-cies, sports areas and a large area of green zones for recreational use.The original plan considers taking the water from the ParqueNacional de Avila for water supply purposes. According to the datasupplied by the plan designer, 14.62% of the land is for public use and48.69% has restricted access.
ark project.

Fig. 6. General methodology for EPRI calculation.
325T. Gómez-Navarro et al. / Environmental Impact Assessment Review 29 (2009) 319–329
The Park preserves the runways of the airport for eventual emer-gencies and a change in the use of the Building of the ComandanciaGeneral de la Aviación as aHospital, a Big Lakewith artificialwaves thatcollects the water coming from the three water basins of El Avila, andthe construction of a large Health Club for economically disadvantagedpeople. The project also includes a Hospital of Civil Protection and anextensive farm land that would be the basis of the School ofHorticulture of Caracas in which people not only can learn to growplants but also buy fruits and vegetables (Fig. 4).
5.1.3. Alternative 3: Theme ParkThis alternative covers all the landof the airport and involves both the
private andpublic sectors. It is a comprehensiveplan,whichpayshomageto the Libertador Simón Bolivar, including the construction of aMausoleum. The Parque del Este extends to La Carlota forming a bigMetropolitan Park, and the runways disappear, although the plan alsoconsiders a high-tech heliport for emergencies. The Project includes aMonument to the Libertador consistingof a concrete tower,with a centralpart of lifts, a restaurant and a balcony that offers a panoramic view ofCaracas. It also includes aConventionHall andanAuxiliaryUnderground-Bus terminal connected to the Caracas underground system, a largemulti-purpose area, car parks, pedestrian crossings and roads. Thebuilding of the Comandancia General de la Aviación is transformed tohouse the Fundación Monumento Unico al Libertador, the InstitutoNacional de Parque, and theMuseo de Transporte; and the ComandanciaGeneral de la Aviación is moved to the site now occupied by theInstituto Nacional de Parques and the Museo Nacional de Transporte.
Caracas underground is connected to La Carlota through asuspended monorail system. The project includes the developmentof Rio Guaire Boulevard, fromCaricuao to La Carlota and from Petare toLa Carlota. This project does not include residential areas, shoppingcentres or sports centres. The multi-purpose area is an open area withfacilities capable of holding from 30 to 50 thousand visitors.
Taking profit of the project for cleaning the Guaire river bed, theidea is to divert the river to the Monumento Unico al Libertador to beused as water supply system for the different water units, like waterscreens, fountains, watering of the green zones, etc. This will alsoallow the development of a large Boulevard around the Monument(Fig. 5).
Following, the steps needed to rank order these urban plan alter-natives are stated.
5.2. The Environmental Pressure Index design methodology
The following figure shows a general description of the methodol-ogy for the calculation of an Environmental Pressure Index (EPRI) bymeans of the ANP and guided by a “facilitator” (Fig. 6).
In the particular case studied the first three steps were not guidedbecause the problem arose as a demand of the decision maker, whoalready was working with the experts in the three proposals understudy. Moreover, the following steps of the methodology correspondto the ANP procedure that has been already described in thetheoretical background of the ANP model (Section 4). Therefore, thefollowing subsections explain how the methodology was applied tothe case study.
5.3. Selection of the criteria
Criteria are variables that justify or explain the environmentalpressure of the urban development proposals (alternatives). They arechosen depending on the characteristics of the alternatives. It isnecessary to have enough information about the criteria chosen so asto allow for comparison among the alternatives.
For environmental pressure assessment the criteria used belong toa set of Environmental Pressure Indicators (EPRI), which was obtainedfollowing the experts' opinions. Then, the experts discussed thewholeset and agreed the Paretto EPRI, i.e. the EPRI that exert the greatestinfluence on the final decision and the least discrepancy amongexperts. Interestingly, there was little discussion and no other EPRIwas argued to have a comparable importance as the ones finallyselected. Thus, the EPRI selected as criteria for the ANP were:
– Land area: amount of available land used in the project– Population density: maximum expected population density within
the project area.– Energy consumption: estimated amount of energy consumed
during the project's life cycle– Water consumption: estimated amount of water consumed during
the project's life cycle– Waste generation: amount of waste generated during the project's
life cycle.
5.4. Representation of the evaluation problem as a network
The complex task of representing the evaluation problem as anetwork of interdependent elements distributed into clusters can bedecomposed into the following steps: (i) to identify the elements(alternatives and criteria), (ii) to group them into clusters and (iii) todetermine the influences on each other.
For the determination of the influences a zero-one interfactorialdominance matrix was used whose elements aij take the value 1 or 0depending on whether there is or there is not some influence ofelement i on element j. The rows and columns of the matrix areformed by all the elements of the network (Table 2).
A network with three clusters has been built (Fig. 7). The fivecriteria were grouped into two clusters, one cluster referring to thephysical aspects of the project (including the land area and populationdensity criteria), and another cluster about resource consumption(that includes the water consumption, solid waste generation andenergy consumption criteria). The third cluster consists of thealternatives, which include the three urban development proposalsfor the airport land under study.
The two-way arrows indicate mutual influence between clusters.On one hand, the influence of the criteria on the alternatives values, sothat the criteria have to be weighted in order to estimate their
Table 3Sample of questionnaire used for criteria comparison.
C1: Area vs C2: Population density
Which approach doyou consider more important?
C1 C2X
To what extent? 1 3 5 7 9X
Table 2Interfactorial matrix for the case study.
Alternatives Physical aspects Resources consumption
Health andWellness club
Residential area Theme park Area Populationdensity
Energyconsumption
Wastegeneration
Waterconsumption
Alternatives Health and Wellness club 0 0 0 1 1 1 1 1residential area 0 0 0 1 1 1 1 1Theme park 0 0 0 1 1 1 1 1
Physical aspects Area 1 1 1 0 1 1 0 1Population density 1 1 1 0 0 1 1 1
Resources consumption Energy consumption 1 1 1 0 1 0 0 1Waste generation 1 1 1 0 0 1 0 1Water consumption 1 1 1 1 1 1 0 0
326 T. Gómez-Navarro et al. / Environmental Impact Assessment Review 29 (2009) 319–329
contribution to the alternatives value. On the other hand, inverseinfluence means that the alternatives have to be weighted in order tomeasure their dominance with respect to each criterion. Feedbackmeans that there is influence among the internal elements of thecluster. For example, the amount of waste generation affects bothwater consumption and energy consumption.
5.5. Solution of the ANP environmental evaluation problem. Calculationof the EPRI indices
The aim of this step is to obtain an Index for each alternativewhichindicates the degree of environmental pressure according to all thecriteria considered. The higher the value of the index the worse theproposal is.
In the process of expert selection the expert's professional fieldsboth in the public and private sectors were taken into account. Asmentioned, the selection of the five experts was based on theirexpertise in the area of projects and their relationship withenvironmental issues applied to urban planning projects. The expertswere interviewed and they were informed on the ANP methodologyand its applications in alternatives' prioritisation. Subsequently, theywere informed on the characteristics of the alternatives to analyze.After solving any questions asked by the experts, a questionnaire wasdesigned using paired questions in order to allow for the comparisonanalysis. Table 3 shows a sample of the questionnaire used for criteriacomparison.
Fig. 7. Network model
In order to alleviate the mathematical burden the following calcula-tions were implemented through the software Superdecisions©. Uponcompletion of all pairwise comparison matrices, the unweighted super-matrix is built:
The corresponding priorities of the clusters have been obtained asexplained before and used to weight this matrix (Table 5):
Raising the weighted supermatrix to limiting powers until theweights converge and remain stable the limit supermatrix will beachieved (Table 6).
5.6. Results
Several results can be obtained by careful analysis of thesematrices. The priority of each alternative is a non-dimensional valuethat will be considered the Environmental Pressure Index. This globalpriority can be obtained from the values in any of the columns relativeto the alternatives (Table 7):
Which means:
EPRIHealth Club = 0.48EPRIResidential Area = 0.41EPRITheme Park = 0.11
The weights of the different criteria analyzed can also be obtained(Table 8).
The results show that the alternatives with the highest environ-mental pressure are the Health Club and the Residential Complex andthen by a far distance the Theme Park. Thus it can be concluded thatthere are two types of alternatives: the ones that imply a relativelyhigh EPRI and the one with a relatively low EPRI. However sinceHealth Club and Residential Complex obtain similar EPRI results, itwould be necessary to carry out a sensitivity analysis to furtherdifferentiate them. As stated above, to obtain a high EPRI will finallymean a higher environmental impact on the flora, the fauna, thelandscapes and, in general, the environmental quality of the city.
for the case study.
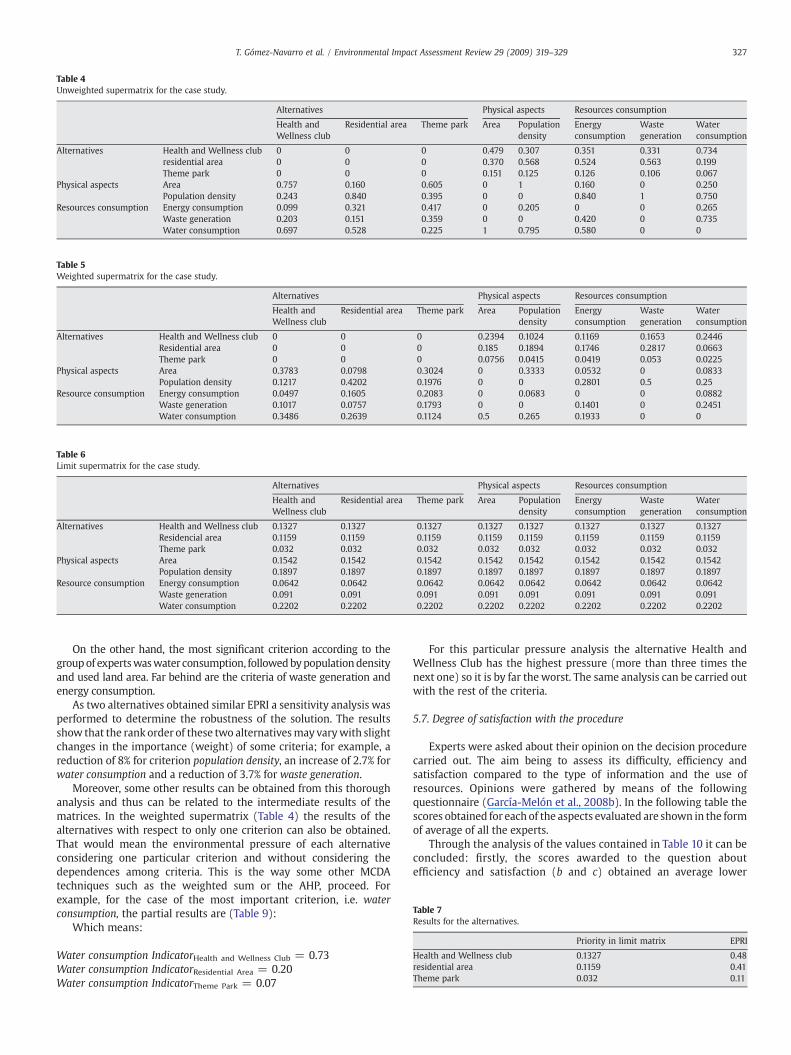
Table 6Limit supermatrix for the case study.
Alternatives Physical aspects Resources consumption
Health andWellness club
Residential area Theme park Area Populationdensity
Energyconsumption
Wastegeneration
Waterconsumption
Alternatives Health and Wellness club 0.1327 0.1327 0.1327 0.1327 0.1327 0.1327 0.1327 0.1327Residencial area 0.1159 0.1159 0.1159 0.1159 0.1159 0.1159 0.1159 0.1159Theme park 0.032 0.032 0.032 0.032 0.032 0.032 0.032 0.032
Physical aspects Area 0.1542 0.1542 0.1542 0.1542 0.1542 0.1542 0.1542 0.1542Population density 0.1897 0.1897 0.1897 0.1897 0.1897 0.1897 0.1897 0.1897
Resource consumption Energy consumption 0.0642 0.0642 0.0642 0.0642 0.0642 0.0642 0.0642 0.0642Waste generation 0.091 0.091 0.091 0.091 0.091 0.091 0.091 0.091Water consumption 0.2202 0.2202 0.2202 0.2202 0.2202 0.2202 0.2202 0.2202
Table 5Weighted supermatrix for the case study.
Alternatives Physical aspects Resources consumption
Health andWellness club
Residential area Theme park Area Populationdensity
Energyconsumption
Wastegeneration
Waterconsumption
Alternatives Health and Wellness club 0 0 0 0.2394 0.1024 0.1169 0.1653 0.2446Residential area 0 0 0 0.185 0.1894 0.1746 0.2817 0.0663Theme park 0 0 0 0.0756 0.0415 0.0419 0.053 0.0225
Physical aspects Area 0.3783 0.0798 0.3024 0 0.3333 0.0532 0 0.0833Population density 0.1217 0.4202 0.1976 0 0 0.2801 0.5 0.25
Resource consumption Energy consumption 0.0497 0.1605 0.2083 0 0.0683 0 0 0.0882Waste generation 0.1017 0.0757 0.1793 0 0 0.1401 0 0.2451Water consumption 0.3486 0.2639 0.1124 0.5 0.265 0.1933 0 0
Table 7Results for the alternatives.
Priority in limit matrix EPRI
Health and Wellness club 0.1327 0.48residential area 0.1159 0.41Theme park 0.032 0.11
Table 4Unweighted supermatrix for the case study.
Alternatives Physical aspects Resources consumption
Health andWellness club
Residential area Theme park Area Populationdensity
Energyconsumption
Wastegeneration
Waterconsumption
Alternatives Health and Wellness club 0 0 0 0.479 0.307 0.351 0.331 0.734residential area 0 0 0 0.370 0.568 0.524 0.563 0.199Theme park 0 0 0 0.151 0.125 0.126 0.106 0.067
Physical aspects Area 0.757 0.160 0.605 0 1 0.160 0 0.250Population density 0.243 0.840 0.395 0 0 0.840 1 0.750
Resources consumption Energy consumption 0.099 0.321 0.417 0 0.205 0 0 0.265Waste generation 0.203 0.151 0.359 0 0 0.420 0 0.735Water consumption 0.697 0.528 0.225 1 0.795 0.580 0 0
327T. Gómez-Navarro et al. / Environmental Impact Assessment Review 29 (2009) 319–329
On the other hand, the most significant criterion according to thegroupof expertswaswater consumption, followedbypopulationdensityand used land area. Far behind are the criteria of waste generation andenergy consumption.
As two alternatives obtained similar EPRI a sensitivity analysis wasperformed to determine the robustness of the solution. The resultsshow that the rank order of these two alternativesmay varywith slightchanges in the importance (weight) of some criteria; for example, areduction of 8% for criterion population density, an increase of 2.7% forwater consumption and a reduction of 3.7% for waste generation.
Moreover, some other results can be obtained from this thoroughanalysis and thus can be related to the intermediate results of thematrices. In the weighted supermatrix (Table 4) the results of thealternatives with respect to only one criterion can also be obtained.That would mean the environmental pressure of each alternativeconsidering one particular criterion and without considering thedependences among criteria. This is the way some other MCDAtechniques such as the weighted sum or the AHP, proceed. Forexample, for the case of the most important criterion, i.e. waterconsumption, the partial results are (Table 9):
Which means:
Water consumption IndicatorHealth and Wellness Club = 0.73Water consumption IndicatorResidential Area = 0.20Water consumption IndicatorTheme Park = 0.07
For this particular pressure analysis the alternative Health andWellness Club has the highest pressure (more than three times thenext one) so it is by far the worst. The same analysis can be carried outwith the rest of the criteria.
5.7. Degree of satisfaction with the procedure
Experts were asked about their opinion on the decision procedurecarried out. The aim being to assess its difficulty, efficiency andsatisfaction compared to the type of information and the use ofresources. Opinions were gathered by means of the followingquestionnaire (García-Melón et al., 2008b). In the following table thescores obtained for each of the aspects evaluated are shown in the formof average of all the experts.
Through the analysis of the values contained in Table 10 it can beconcluded: firstly, the scores awarded to the question aboutefficiency and satisfaction (b and c) obtained an average lower
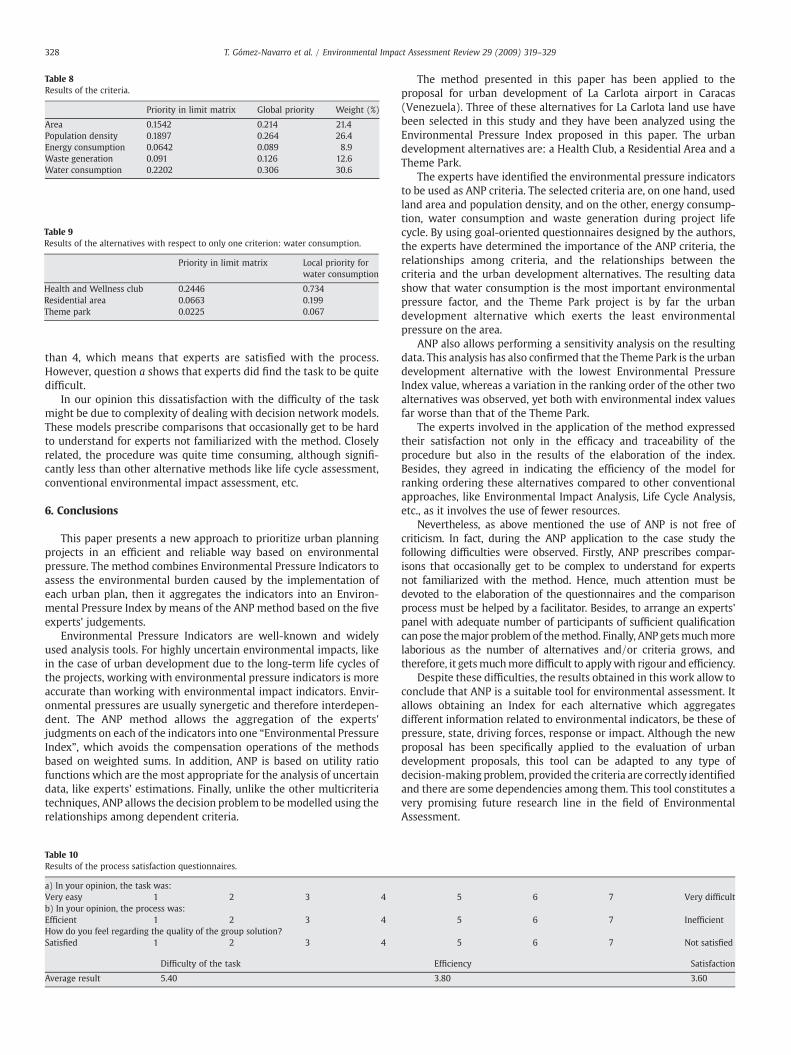
Table 9Results of the alternatives with respect to only one criterion: water consumption.
Priority in limit matrix Local priority forwater consumption
Health and Wellness club 0.2446 0.734Residential area 0.0663 0.199Theme park 0.0225 0.067
Table 8Results of the criteria.
Priority in limit matrix Global priority Weight (%)
Area 0.1542 0.214 21.4Population density 0.1897 0.264 26.4Energy consumption 0.0642 0.089 8.9Waste generation 0.091 0.126 12.6Water consumption 0.2202 0.306 30.6
328 T. Gómez-Navarro et al. / Environmental Impact Assessment Review 29 (2009) 319–329
than 4, which means that experts are satisfied with the process.However, question a shows that experts did find the task to be quitedifficult.
In our opinion this dissatisfaction with the difficulty of the taskmight be due to complexity of dealing with decision network models.These models prescribe comparisons that occasionally get to be hardto understand for experts not familiarized with the method. Closelyrelated, the procedure was quite time consuming, although signifi-cantly less than other alternative methods like life cycle assessment,conventional environmental impact assessment, etc.
6. Conclusions
This paper presents a new approach to prioritize urban planningprojects in an efficient and reliable way based on environmentalpressure. The method combines Environmental Pressure Indicators toassess the environmental burden caused by the implementation ofeach urban plan, then it aggregates the indicators into an Environ-mental Pressure Index by means of the ANP method based on the fiveexperts' judgements.
Environmental Pressure Indicators are well-known and widelyused analysis tools. For highly uncertain environmental impacts, likein the case of urban development due to the long-term life cycles ofthe projects, working with environmental pressure indicators is moreaccurate than working with environmental impact indicators. Envir-onmental pressures are usually synergetic and therefore interdepen-dent. The ANP method allows the aggregation of the experts'judgments on each of the indicators into one “Environmental PressureIndex”, which avoids the compensation operations of the methodsbased on weighted sums. In addition, ANP is based on utility ratiofunctions which are the most appropriate for the analysis of uncertaindata, like experts' estimations. Finally, unlike the other multicriteriatechniques, ANP allows the decision problem to bemodelled using therelationships among dependent criteria.
Table 10Results of the process satisfaction questionnaires.
a) In your opinion, the task was:Very easy 1 2 3 4b) In your opinion, the process was:Efficient 1 2 3 4How do you feel regarding the quality of the group solution?Satisfied 1 2 3 4
Difficulty of the task
Average result 5.40
The method presented in this paper has been applied to theproposal for urban development of La Carlota airport in Caracas(Venezuela). Three of these alternatives for La Carlota land use havebeen selected in this study and they have been analyzed using theEnvironmental Pressure Index proposed in this paper. The urbandevelopment alternatives are: a Health Club, a Residential Area and aTheme Park.
The experts have identified the environmental pressure indicatorsto be used as ANP criteria. The selected criteria are, on one hand, usedland area and population density, and on the other, energy consump-tion, water consumption and waste generation during project lifecycle. By using goal-oriented questionnaires designed by the authors,the experts have determined the importance of the ANP criteria, therelationships among criteria, and the relationships between thecriteria and the urban development alternatives. The resulting datashow that water consumption is the most important environmentalpressure factor, and the Theme Park project is by far the urbandevelopment alternative which exerts the least environmentalpressure on the area.
ANP also allows performing a sensitivity analysis on the resultingdata. This analysis has also confirmed that the Theme Park is the urbandevelopment alternative with the lowest Environmental PressureIndex value, whereas a variation in the ranking order of the other twoalternatives was observed, yet both with environmental index valuesfar worse than that of the Theme Park.
The experts involved in the application of the method expressedtheir satisfaction not only in the efficacy and traceability of theprocedure but also in the results of the elaboration of the index.Besides, they agreed in indicating the efficiency of the model forranking ordering these alternatives compared to other conventionalapproaches, like Environmental Impact Analysis, Life Cycle Analysis,etc., as it involves the use of fewer resources.
Nevertheless, as above mentioned the use of ANP is not free ofcriticism. In fact, during the ANP application to the case study thefollowing difficulties were observed. Firstly, ANP prescribes compar-isons that occasionally get to be complex to understand for expertsnot familiarized with the method. Hence, much attention must bedevoted to the elaboration of the questionnaires and the comparisonprocess must be helped by a facilitator. Besides, to arrange an experts'panel with adequate number of participants of sufficient qualificationcanpose themajor problemof themethod. Finally, ANP getsmuchmorelaborious as the number of alternatives and/or criteria grows, andtherefore, it getsmuchmore difficult to applywith rigour and efficiency.
Despite these difficulties, the results obtained in this work allow toconclude that ANP is a suitable tool for environmental assessment. Itallows obtaining an Index for each alternative which aggregatesdifferent information related to environmental indicators, be these ofpressure, state, driving forces, response or impact. Although the newproposal has been specifically applied to the evaluation of urbandevelopment proposals, this tool can be adapted to any type ofdecision-making problem, provided the criteria are correctly identifiedand there are some dependencies among them. This tool constitutes avery promising future research line in the field of EnvironmentalAssessment.
5 6 7 Very difficult
5 6 7 Inefficient
5 6 7 Not satisfied
Efficiency Satisfaction
3.80 3.60

329T. Gómez-Navarro et al. / Environmental Impact Assessment Review 29 (2009) 319–329
Acknowledgement
This work lies within the R&D project “Improvement of the assetvaluation models based on the Multicriteria Decision Analysis and theSpatial Regression. Application to the Real State Case. (SEJ2007-67937)”, approved by the Spanish Ministerio de Educación y Ciencia.
References
Aragonés-Beltrán P, Aznar J, Ferrís-Oñate J, García-Melón M. Valuation of urban industrialland: an Analytic Network Process approach. Eur J Oper Res 2008;185-1:322–39.
Barba-Romero S, Pomerol JCh. Decisiones multicriterio. Fundamentos teóricos yutilización práctica. Serv. Public. Universidad de Alcalá de Henares; 1997.
Beccali M, Cellura M, Mistretta M. Decision-making in energy planning. Application ofthe Electre method at regional level for the diffusion of renewable energytechnology. Renew Energy 2003;28:2063–87.
Beinat E. Value functions for environmental management. The Netherlands: Springer; 1997.Belton V, Stewart T. Multiple criteria decision analysis: an integrated approach. United
Kingdom: Kluwer Academic Publishers; 2002.Bojórquez-Tapia LA, Sánchez-Colon S, Florez A. Building consensus in environmental
impact assessment throughmulticriteria modeling and sensitivity analysis. EnvironManag 2005;36(3):469–81.
Bosch P, Büchele M, Gee D, Smeets E, Weterings R. Technical report No. 25.Environmental indicators: typology and overview. Copenhagen: European Envir-onment Agency. ©EEA; 1999.
Brans JP, Vincke P, Mareschal B. How to select and how to rank projects: thePROMETHEE method. Eur J Oper Res 1986;24:228–38.
Brilly M, Simon R, Vidmar A. Monitoring the impact of urbanisation on the Glinscicastream. Phys Chem Earth, Parts A/B/C 2006;31(17).
Brown AL. Increasing the utility of urban environmental quality information. LandscUrban Plan 2003;65:85–93.
Chace J, Walsh J, Effect on Native Avifauna: A Review. Villanova University andUniversity of Washington. United State. 2004.
Cheng EWL, Li H. Analytic network process applied to project selection. J Constr EngManag 2005;131:459–66.
Cheng EWL, Li H. Contractor selection using the analytic network process. Constr ManagEcon 2004;22:1021–32.
Cloquell-Ballester VA, Cloquell-Ballester VA, Monterde-Díaz R, Santamarina-SiuranaMC. Indicators validation for the improvement of environmental and social impactquantitative assessment. Environ Impact Asses Rev 2006;26:79-105.
Cloquell-Ballester VA, Monterde-Diaz R, Cloquell-Ballester VA, Santamarina-SiuranaMC. Systematic comparative and sensitivity analyses of additive and outrankingtechniques for supporting impact significance assessments. Environ Impact AssesRev 2007;27(1):62–83.
Discoli CA. Urban environmental impact matrices development: assessment indicesincorporation. Build Environ 2005;40:915–28.
Erdoğmuş Ş, Aras H, Koç E. Evaluation of alternative fuels for residential heating inTurkey using analytic network process (ANP) with group decision-making. RenewSustain Energy Rev 2006;10:269–79.
García-Melón M, Ferrís-Oñate J, Aznar J, Aragonés-Beltrán P, Poveda-Bautista R.Farmland appraisal: an Analytic Network Process (ANP) approach. J Glob Optim2008a;42:143–55.
García-Melón M, Aragonés-Beltrán P, González-Cruz M. An AHP based evaluationprocedure for innovative educational projects: a face-to-face vs. computer-mediated case study. Omega 2008b;36(5):754–65.
Georgopolou E, Sarafidis Y, Misragedis S, Zaimi S, Lalas DP. A multicriteria decision-aidapproach in defining national priorities for greenhouse emissions reduction inenergy sector. Eur J Oper Res 2003;146:199–215.
Haktanırlar B. Determination of the appropriate energy policy for Turkey. Energy2005;30:1146–61.
Hasse J, Lathrop R. Land resource impact indicators or urban sprawl. Rowan Universityand Collage Farm Road. United States; 2003.
Hermann BG, Kroeze C, Jawjit W. Assessing environmental performance by combininglife cycle assessment. Multi-criteria analysis and environmental performanceindicators. J Clean Prod 2007;15(18):1787–96.
Keeney RL, Raiffa H. Decisions withmultiple objectives: preferences and value tradeoffs.New York: Wiley; 1976.
Köne AÇ, Büke T. An Analytical Network Process (ANP) evaluation of alternative fuelsfor electricity generation in Turkey. Energy Policy 2007;35:5220–8.
Leskinen P. Comparison of alternative scoring techniques when assessing decisionmaker's multi-objective preferences in natural resource management. J EnvironManag 2007;85(2):363–70.
Leskinen P, Kangas J. Multi-criteria natural resource management with preferentiallydependent decision criteria. J Environ Manag 2005;77(3):244–51.
Lundin M, Morrison GM. A life cycle assessment based procedure for development ofenvironmental sustainability indicators for urban water systems. Urban Water2002;4(2):145–52.
Neaupane KM, Piantanakulchai M. Analytic network processmodel for landslide hazardzonation. Eng Geol 2006;85(3–4):281–94.
Niemira MP, Saaty TL. An Analytic Network Process model for financial-crisisforecasting. Int J Forecast 2004;20:573–87.
Partovi FY, Corredoira RA. Quality function deployment for the good of soccer. Eur J OperRes 2002;137:642–56.
Pinter L, Cressman DR, Zahedi K, Capacity Building for Integrated EnvironmentalAssessment and Reporting: Training Manual. United Nations EnvironmentProgramme (UNEP). International Institute for Sustainable Development (IISD) &Ecologistics International Ltd. 1999.
Raisinghani HS, Meade L, Schkade L. Strategic e-business decision analysis usingAnalytic Network Process. IEEE Trans Eng Manage 2007;54(4):673–86.
Ramzan N, Degenkolbe S, Werner W, Valuating and improving environmentalperformance of HC's recovery system. A case study of distillation unit. ChemicalEngineering Journal 2008;140:201–13.
Rojas RI. Modelos de evaluación de impacto ambiental en la planeación urbana. InfTecnol 1998;9(5):19–28.
Roy B. Multicriteria methodology for decision aiding. The Netherlands: KluwerAcademic; 1996.
Saaty TL. Fundamentals of decision making and priority theory. Pittsburgh: RWSPublications; 1980.
Saaty T. The analytic hierarchy process. Planning, priority setting, resource allocation.Pittsburgh: RWS Publcations; 1996.
Saaty T. Decision making with interdependence and feedback. The Analytic NetworkProcess. Pittsburgh: RWS Publications; 2001.
Saaty T. Theory and applications of the Analytic Network Process: decision making withbenefits, opportunities, cost and risks. Pittsburg: RWS Publications; 2005.
Sólnes J. Enviromental Quality Indexing of large industrial development alternativesusing AHP. Environ Impact Asses Rev 2003;23:283–303.
WeyWM,Wu KY. Using ANP priorities with goal programming in resource allocation intransportation. Math Comput Model 2007;46:985-1000.
WolfslehnerB,VacikH, LexerMJ. Applicationof the analytic networkprocess inmulti-criteriaanalysis of sustainable forest management. For Ecol Manag 2005;207(1–2):157–70.
Zhang Y, Zhifeng Y, Wei L. Analyses of urban ecosystem based on information entropy.Ecol Model 2006a;197(1–2).
Zhang Y, Zhifeng Y, Xiangyi Y. Measurement and evaluation of interactions in complexurban ecosystem. Ecol Model 2006b;196(1–2).
Tomás Gómez-Navarro Departamento de Proyectos de Ingeniería. Universidad Politécni-ca de Valencia. PhD Industrial Engineer. Lecturer of the U.P. Valencia and invited lecturer ofseveral universities in Spain and Latin America. He has participated in different projectsrelated to the environmental impact assessment of economical activities and to thereduction of their environmental burden. Also he has edited or participated in a number ofpublications on the topics: Life Cycle Assessment, Environmental Impact Assessment,Ecoefficiency and Corporate Social Responsibility, both academic and scientific. He ismember of the Design Society and the Spanish Society of Projects Engineering.
Mónica García-Melón Departamento de Proyectos de Ingeniería. Universidad Politécnicade Valencia. PhD Industrial Engineer. Lecturer of the U.P. Valencia, member of the SpanishMulticriteria Network Group, the Design Society and the Spanish Society of ProjectsEngineering. She has participated in different evaluation studies, R&D projects, projectsportfolio and asset appraisals, both for private companies and for public administrations.Her fields of expertise are Multicriteria Techniques and Group Decision Making. She haspublished several scientific papers mainly in operational research journals.
Silvia Acuña-Dutra Departamento de Estudios Ambientales. Universidad Metropoli-tana. Lecturer at the UNIMET she lectures and researches on Environmental ImpactAssessment and Climatic Change. She has acted as environmental adviser for PublicSector companies and collaborated in several projects related to the field ofenvironmental studies. She has also published and participated about environmentalimpact assessment and climatic change issues in congresses and publications aroundthe world.
Diego Díaz-Martín Departamento de Estudios Ambientales. Universidad Metropolita-na. MSc in Environmental Management. Lecturer at the UNIMET, Head of theEnvironmental Studies department at the UNIMET. His field of expertise is themanagement of natural resources. He ismember of theWorld Commission for ProtectedAreas in the International Union for Conservation of Nature and president of theVenezuelan Association for Water in the Global Water Partnership. He lectures in post-graduate studies of several National Universities. He is president of the NGO VITALIS.