
An energy-balanced analytic model for urban heat canyons: comparison with experimental data
15
This article was downloaded by: [79.52.186.254] On: 07 January 2014, At: 04:01 Publisher: Taylor & Francis Informa Ltd Registered in England and Wales Registered Number: 1072954 Registered office: Mortimer House, 37-41 Mortimer Street, London W1T 3JH, UK Advances in Building Energy Research Publication details, including instructions for authors and subscription information: http://www.tandfonline.com/loi/taer20 An energy-balanced analytic model for urban heat canyons: comparison with experimental data Emanuele Bonamente a , Federico Rossi a , Valentina Coccia a , Anna Laura Pisello a , Andrea Nicolini a , Beatrice Castellani b , Franco Cotana a , Mirko Filipponi a , Elena Morini a & Matheos Santamouris cd a CIRIAF – Interuniversity Research Center on Pollution and Environment “M. Felli”, University of Perugia, Via G. Duranti, 06125 Perugia, Italy b IPASS – Engineering for the Environment and the Sustainable Development, Via G. Guerra, 06127 Perugia, Italy c Physics Department, University of Athens, Panepistimioupolis, 15784 Athens, Greece d The Cyprus Institute, 20 Constantinou Kavafi Street, Nicosia 2121, Cyprus Published online: 20 Dec 2013. To cite this article: Emanuele Bonamente, Federico Rossi, Valentina Coccia, Anna Laura Pisello, Andrea Nicolini, Beatrice Castellani, Franco Cotana, Mirko Filipponi, Elena Morini & Matheos Santamouris (2013) An energy-balanced analytic model for urban heat canyons: comparison with experimental data, Advances in Building Energy Research, 7:2, 222-234, DOI: 10.1080/17512549.2013.865561 To link to this article: http://dx.doi.org/10.1080/17512549.2013.865561 PLEASE SCROLL DOWN FOR ARTICLE Taylor & Francis makes every effort to ensure the accuracy of all the information (the “Content”) contained in the publications on our platform. However, Taylor & Francis, our agents, and our licensors make no representations or warranties whatsoever as to the accuracy, completeness, or suitability for any purpose of the Content. Any opinions and views expressed in this publication are the opinions and views of the authors, and are not the views of or endorsed by Taylor & Francis. The accuracy of the Content should not be relied upon and should be independently verified with primary sources of information. Taylor and Francis shall not be liable for any losses, actions, claims, proceedings, demands, costs, expenses, damages, and other liabilities whatsoever or
-
Upload
independent -
Category
Documents
-
view
2 -
download
0
Transcript of An energy-balanced analytic model for urban heat canyons: comparison with experimental data
This article was downloaded by: [79.52.186.254]On: 07 January 2014, At: 04:01Publisher: Taylor & FrancisInforma Ltd Registered in England and Wales Registered Number: 1072954 Registeredoffice: Mortimer House, 37-41 Mortimer Street, London W1T 3JH, UK
Advances in Building Energy ResearchPublication details, including instructions for authors andsubscription information:http://www.tandfonline.com/loi/taer20
An energy-balanced analytic model forurban heat canyons: comparison withexperimental dataEmanuele Bonamentea, Federico Rossia, Valentina Cocciaa, AnnaLaura Piselloa, Andrea Nicolinia, Beatrice Castellanib, FrancoCotanaa, Mirko Filipponia, Elena Morinia & Matheos Santamouriscd
a CIRIAF – Interuniversity Research Center on Pollution andEnvironment “M. Felli”, University of Perugia, Via G. Duranti,06125 Perugia, Italyb IPASS – Engineering for the Environment and the SustainableDevelopment, Via G. Guerra, 06127 Perugia, Italyc Physics Department, University of Athens, Panepistimioupolis,15784 Athens, Greeced The Cyprus Institute, 20 Constantinou Kavafi Street, Nicosia2121, CyprusPublished online: 20 Dec 2013.
To cite this article: Emanuele Bonamente, Federico Rossi, Valentina Coccia, Anna LauraPisello, Andrea Nicolini, Beatrice Castellani, Franco Cotana, Mirko Filipponi, Elena Morini& Matheos Santamouris (2013) An energy-balanced analytic model for urban heat canyons:comparison with experimental data, Advances in Building Energy Research, 7:2, 222-234, DOI:10.1080/17512549.2013.865561
To link to this article: http://dx.doi.org/10.1080/17512549.2013.865561
PLEASE SCROLL DOWN FOR ARTICLE
Taylor & Francis makes every effort to ensure the accuracy of all the information (the“Content”) contained in the publications on our platform. However, Taylor & Francis,our agents, and our licensors make no representations or warranties whatsoever as tothe accuracy, completeness, or suitability for any purpose of the Content. Any opinionsand views expressed in this publication are the opinions and views of the authors,and are not the views of or endorsed by Taylor & Francis. The accuracy of the Contentshould not be relied upon and should be independently verified with primary sourcesof information. Taylor and Francis shall not be liable for any losses, actions, claims,proceedings, demands, costs, expenses, damages, and other liabilities whatsoever or

howsoever caused arising directly or indirectly in connection with, in relation to or arisingout of the use of the Content.
This article may be used for research, teaching, and private study purposes. Anysubstantial or systematic reproduction, redistribution, reselling, loan, sub-licensing,systematic supply, or distribution in any form to anyone is expressly forbidden. Terms &Conditions of access and use can be found at http://www.tandfonline.com/page/terms-and-conditions
Dow
nloa
ded
by [
79.5
2.18
6.25
4] a
t 04:
01 0
7 Ja
nuar
y 20
14
An energy-balanced analytic model for urban heat canyons: comparisonwith experimental data
Emanuele Bonamentea*, Federico Rossia, Valentina Cocciaa, Anna Laura Piselloa,Andrea Nicolinia, Beatrice Castellanib, Franco Cotanaa, Mirko Filipponia, Elena Morinia
and Matheos Santamourisc,d
aCIRIAF – Interuniversity Research Center on Pollution and Environment “M. Felli”, University of Perugia,Via G. Duranti, 06125 Perugia, Italy; bIPASS – Engineering for the Environment and the SustainableDevelopment, Via G. Guerra, 06127 Perugia, Italy; cPhysics Department, University of Athens,Panepistimioupolis, 15784 Athens, Greece; dThe Cyprus Institute, 20 Constantinou Kavafi Street, Nicosia2121, Cyprus
The climate of high-density urban areas is often affected by the air temperature increase withrespect to the neighbouring country-side. This phenomenon, known as the urban heat island(UHI) effect, is strongly influenced by the solar reflectance of building envelope and coatingmaterials, and it is enhanced in the presence of built patterns that trap the solar andanthropogenic energy, usually referred to as urban heat canyons. An original method toquantify the urban heat canyon effect as a function of meteorological conditions, geometry,and surface properties is proposed. The goal is to provide a reliable tool to estimate theeffect of the reflective properties of the canyon surfaces on the urban environment, in orderto guide the choice of effective solution towards the UHI mitigation. An energy-balancedanalytic model, specifically set-up to predict surface temperatures inside an urban canyon, isapplied to a scale test facility located at the University of Perugia, Italy. The test facility ismade of two twin arrays resembling urban canyons with different aspect ratios. Each canyoncan be equipped with reflective films to quantify the radiative exchange variation.Preliminary results from the experimental facility monitoring and the analytic modelvalidation are presented.
Keywords: urban heat island; urban canyon; building envelope; cool roofs; climate modelling
1. Introduction
The urban heat island (UHI) effect is a well-known urban phenomenon responsible for theincrease of the air temperature, especially during summer. The main consequences of the UHIare the increase on the building energy demand and the reduction of indoor comfort conditionShahidan, Jones, Gwilliam, and Salleh (2012). Manley (1958) first documented the temperaturedifferences between an urban area and a rural one; this phenomenon was successively namedUrban Heat Island by Taha (1997). Although in winter, UHI is not as well studied, interestingworks of Giridharan and Kolokotroni (2009) focused on the overall year-round that showed a9.0°C difference between urban–rural conditions during winter.
The most relevant parameters impacting the UHI are the urban surfaces albedo, theevapotranspiration and the anthropogenic heating (Howard, 1833). Many evidences show that
© 2013 Taylor & Francis
*Corresponding author. Email: [email protected]
Advances in Building Energy Research, 2013Vol. 7, No. 2, 222–234, http://dx.doi.org/10.1080/17512549.2013.865561
Dow
nloa
ded
by [
79.5
2.18
6.25
4] a
t 04:
01 0
7 Ja
nuar
y 20
14
an effective strategy to mitigate the UHI consists in the use of high-reflective envelopes (e.g. coolroofs, Pisello, Cotana, Nicolini, & Brinchi, 2013) instead of conventional darker coatings (San-tamouris, 2007).
Most of the research investigations on technologies to mitigate UHI were aimed to reduceenergy demand for cooling and green-house gas (GHG) emissions. On the other hand, at localscale, the UHI mitigation mainly improves the indoor thermal comfort of buildings (Synnefa,Saliari, & Santamouris, 2012). The thermal behaviour of a case study scholar building inAthens, modelled using dynamic simulations, shows a decrease in the annual cooling load of40% after the installation of cool roofs. The same fundamental results are experimentally docu-mented also by Pisello and Cotana (2014). Kolokotsa, Diakaki, Papantoniou, and Vlissidis (2012)clearly show that also the indoor thermal performance of non-conditioned buildings is influencedby the UHI: the monitoring of a university lab building located in Iraklion, Crete, demonstrated ayear-round energy saving of 19.8%, and 27% for the summer period, achieved by applying coolroofs. Additionally, together with the inter-building effect (Xu, Taylor, Pisello, & Culligan, 2012),the potentialities of high-reflective irradiated surfaces have important impacts also on the globalwarming reduction. Akbari and Matthews (2012) demonstrate that the increase in global averageair temperature in urban areas is directly linked to the reflectance capability of the coatingsexposed to the solar radiation. Promising future applications involve the use of retro-reflectivematerials (Rossi, Pisello, Nicolini, Filipponi, & Palombo, 2014).
A reliable tool to quantify and predict the UHI effect as a function of different coatingmaterials would be of great help for researchers, administrators, and decision-makers to betterdesign the urban environment.
In this paper, an original method to predict the temperature of facades, ground, and local airmass on urban areas is proposed. The approach bases on an analytic energy-balance model whichis calibrated and validated using data from an ad hoc test facility. Urban canyon models.
Numerical and analytical models can predict the spatial and temporal variation of the UHIeffect as a function of the geometry and the reflectance properties of the built environment.
Gobakis et al. (2011) applied neural-network techniques to the UHI modelling and found acorrelation between measured and predicted UHI parameters for several sites: the UHI intensitycan be predicted quite accurately for at least a 24-h time horizon using a limited set of data.Allegrini, Dorera, and Carmelieta (2012), applying dynamic simulation tools for stand-alonebuildings and buildings located in street canyons, showed the importance of including thelocal urban micro-climate when predicting the energy demands in urban areas.
Geometry (i.e. aspect ratio) of urban canyons is also a key factor regulating the radiative fluxexchange among different surfaces. With dynamic thermal simulations, Strømann-Andersen andSattrup (2011) found that geometry variation is capable to modify the overall energy consumptionup to +30% for offices and +19% for housing. Also, reflectivity features of the canyon surfacesplay an important role in the thermal behaviour of buildings. Doya, Bozonnet, and Allard (2012)showed the positive effect of cool roofs against the UHI, monitoring a micro-scale experimentalcase study, representing a typical urban canyon geometry. Finally, the canyon geometry plays animportant role also in terms of streets air quality. Chan, So, and Samad (2001) showed that thepollutant transport and diffusion are strongly influenced by the canyon aspect ratio.
The UHI can be influenced by the micro-climate conditions as well. In particular, with respectto the climate characterization, Krüger, Pearlmutter, and Rasia (2010) studied the impact ofcanopy geometry and building orientation on cooling loads. Also the average wind speed istaken into account in the calculations and it was found that the highest increase in coolingloads is related to the highest urban concentration geometry. For particular cases, the simulationshowed an increase in energy demand for cooling up to 250% and a decrease for winter heating upto 40%. An urban heat storage model has been proposed by Bonacquisti, Casale, Palmieri, and
Advances in Building Energy Research 223
Dow
nloa
ded
by [
79.5
2.18
6.25
4] a
t 04:
01 0
7 Ja
nuar
y 20
14
Siani (2006). The authors used this urban canopy layer model to study the thermal anomaliesbetween central Rome and its sub-urban surroundings. The validated results showed that thegreatest difference between urban and rural temperatures is about 2°C during winter and 5°Cduring summer. As expected, such differences are directly related to the urban geometry andthe optic-energy properties of materials. The influence of the urban texture on building energyconsumption was also studied by Ratti, Baker, and Steemers (2005) applying the digital elevationmodel (DEM). The surface-to-volume parameter was considered as representative to describe theurbanization rate of several cities such as London, Toulouse, and Berlin. The work showed thatthe DEMs analysis could be used to explore the effects of the urban texture on the energy perform-ance of buildings by taking into account the canyon geometry, the mutual shadowing, andwindow-to-wall ratios.
It is within this dynamic research context that the modelling of the urban canyon as a functionof its aspect ratio and the radiative properties of its surfaces takes place. This work is composed oftwo sections. The first one is dedicated to the presentation of an analytic model, the second to theanalysis of measured data from an ad hoc experimental installation. The analytic model is basedon an energy-balance approach, and it takes into account the incoming solar radiation, the reflec-tive properties of the canyon surfaces (both vertical walls and the ground surface), the convectiveheat transfer, and the characteristic height to distance ratio (H/D). As a result, the temperatures ofthe canyon surfaces can be estimated. The experimental installation is a scale model of an urbancanyon equipped with temperature, radiation, and wind speed sensors. Different shape factors andcoverings properties can be tested.
The goal of the test field is twofold. On one side, it is used to validate the analytic model repro-ducing a reduced-scale version of common urban canyon geometries. On the other side, it canprovide a direct comparison between different choices of facade coverings on the urbanclimate conditions.
Once validated, the analytic model can be directly applied to real-size scenarios to predict theeffectiveness of building choices towards the UHI mitigation.
2. The test field
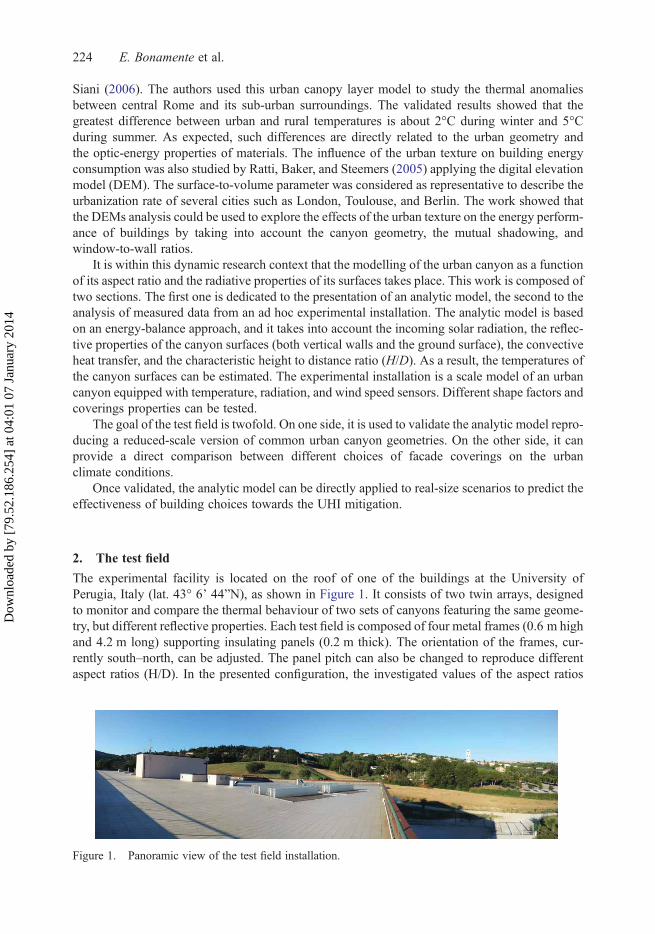
The experimental facility is located on the roof of one of the buildings at the University ofPerugia, Italy (lat. 43° 6’ 44”N), as shown in Figure 1. It consists of two twin arrays, designedto monitor and compare the thermal behaviour of two sets of canyons featuring the same geome-try, but different reflective properties. Each test field is composed of four metal frames (0.6 m highand 4.2 m long) supporting insulating panels (0.2 m thick). The orientation of the frames, cur-rently south–north, can be adjusted. The panel pitch can also be changed to reproduce differentaspect ratios (H/D). In the presented configuration, the investigated values of the aspect ratios
Figure 1. Panoramic view of the test field installation.
224 E. Bonamente et al.
Dow
nloa
ded
by [
79.5
2.18
6.25
4] a
t 04:
01 0
7 Ja
nuar
y 20
14
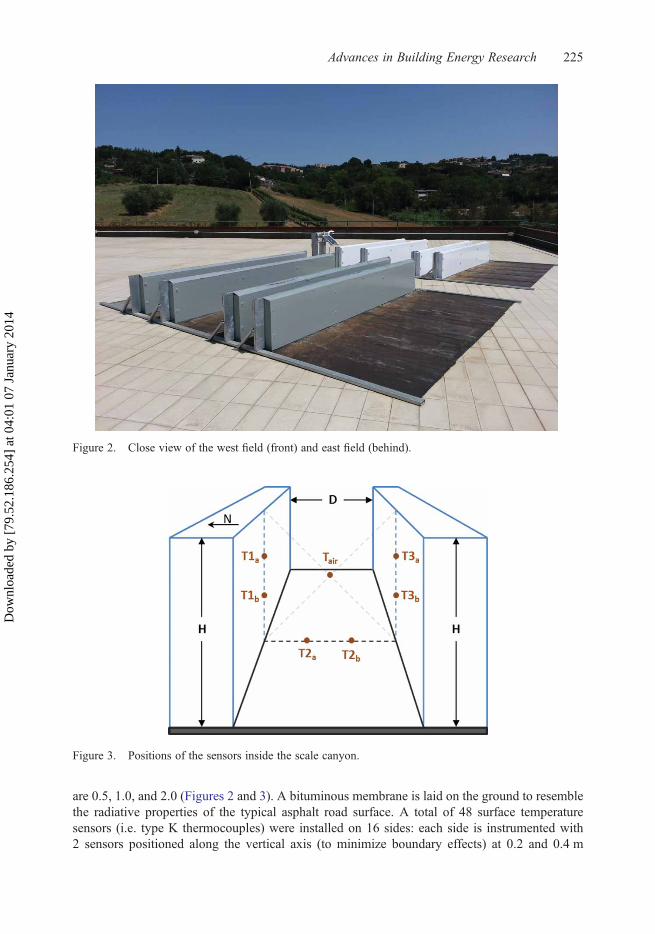
are 0.5, 1.0, and 2.0 (Figures 2 and 3). A bituminous membrane is laid on the ground to resemblethe radiative properties of the typical asphalt road surface. A total of 48 surface temperaturesensors (i.e. type K thermocouples) were installed on 16 sides: each side is instrumented with2 sensors positioned along the vertical axis (to minimize boundary effects) at 0.2 and 0.4 m
Figure 2. Close view of the west field (front) and east field (behind).
Figure 3. Positions of the sensors inside the scale canyon.
Advances in Building Energy Research 225
Dow
nloa
ded
by [
79.5
2.18
6.25
4] a
t 04:
01 0
7 Ja
nuar
y 20
14
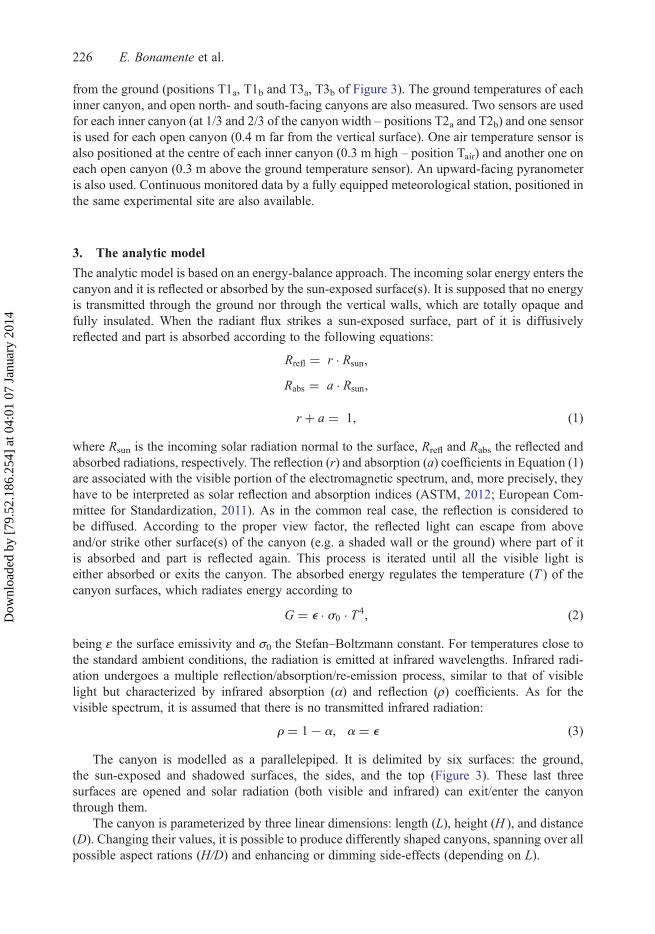
from the ground (positions T1a, T1b and T3a, T3b of Figure 3). The ground temperatures of eachinner canyon, and open north- and south-facing canyons are also measured. Two sensors are usedfor each inner canyon (at 1/3 and 2/3 of the canyon width – positions T2a and T2b) and one sensoris used for each open canyon (0.4 m far from the vertical surface). One air temperature sensor isalso positioned at the centre of each inner canyon (0.3 m high – position Tair) and another one oneach open canyon (0.3 m above the ground temperature sensor). An upward-facing pyranometeris also used. Continuous monitored data by a fully equipped meteorological station, positioned inthe same experimental site are also available.
3. The analytic model
The analytic model is based on an energy-balance approach. The incoming solar energy enters thecanyon and it is reflected or absorbed by the sun-exposed surface(s). It is supposed that no energyis transmitted through the ground nor through the vertical walls, which are totally opaque andfully insulated. When the radiant flux strikes a sun-exposed surface, part of it is diffusivelyreflected and part is absorbed according to the following equations:
Rrefl = r · Rsun,
Rabs = a · Rsun,
r + a = 1, (1)
where Rsun is the incoming solar radiation normal to the surface, Rrefl and Rabs the reflected andabsorbed radiations, respectively. The reflection (r) and absorption (a) coefficients in Equation (1)are associated with the visible portion of the electromagnetic spectrum, and, more precisely, theyhave to be interpreted as solar reflection and absorption indices (ASTM, 2012; European Com-mittee for Standardization, 2011). As in the common real case, the reflection is considered tobe diffused. According to the proper view factor, the reflected light can escape from aboveand/or strike other surface(s) of the canyon (e.g. a shaded wall or the ground) where part of itis absorbed and part is reflected again. This process is iterated until all the visible light iseither absorbed or exits the canyon. The absorbed energy regulates the temperature (T ) of thecanyon surfaces, which radiates energy according to
G = e · s0 · T 4, (2)
being ε the surface emissivity and σ0 the Stefan–Boltzmann constant. For temperatures close tothe standard ambient conditions, the radiation is emitted at infrared wavelengths. Infrared radi-ation undergoes a multiple reflection/absorption/re-emission process, similar to that of visiblelight but characterized by infrared absorption (α) and reflection (ρ) coefficients. As for thevisible spectrum, it is assumed that there is no transmitted infrared radiation:
r = 1− a, a = e (3)
The canyon is modelled as a parallelepiped. It is delimited by six surfaces: the ground,the sun-exposed and shadowed surfaces, the sides, and the top (Figure 3). These last threesurfaces are opened and solar radiation (both visible and infrared) can exit/enter the canyonthrough them.
The canyon is parameterized by three linear dimensions: length (L), height (H ), and distance(D). Changing their values, it is possible to produce differently shaped canyons, spanning over allpossible aspect rations (H/D) and enhancing or dimming side-effects (depending on L).
226 E. Bonamente et al.
Dow
nloa
ded
by [
79.5
2.18
6.25
4] a
t 04:
01 0
7 Ja
nuar
y 20
14
For a given geometry, an energy balance is run considering the total energy reaching andleaving each surface. Three sets of equations are used: one for the visible radiation, one for theinfrared radiation, and one for the overall energy balance, including convection.
The visible radiosity (R) is defined as the radiant visible flux (W/m2) leaving a surface. It isgiven by
Ri·Si = ri ·(∑
j=iRj · Sj · Fj�i + Rsun,i · Si
), (4)
where Si(j) is the extension of surface i( j), ri the visible reflection coefficient, and Fj�i the viewfactor from surface j to surface i. Rsun,i is the normal component of the solar flux on the surface i.
Rsun,i = Rsun · cos(u), (5)
where θ, the angle between the normal to the surface and the sun beam, is a function of the solaraltitude (β) and azimuth (w) angles, and the orientation and inclination of the surface itself. In caseof shaded surfaces, the diffuse visible radiation is used for Rsun,i.
The infrared radiosity (G), defined similarly to R, includes the thermal flux radiated from thesurface:
Gi·Si = ai · s0 · T4i · Si + ri ·
[( ∑j=i
Gj · Sj · Fj�i
)+
(∑oGsky · So · Fo�i
)]. (6)
In this case, the sky infrared radiant emittance (Gsky) is considered to enter the canyon fromthe three open surfaces (So).
The global energy balance on each surface is defined by the following equation:
Rsun,i · Si +∑oGsky · So · Fo�i+
∑j=i
(Rj + Gj) · Sj · F j�i
= (Ri + Gi) · Si + hci · (Ti − Tin) · Si, (7)
where hci is the heat transfer coefficient of surface i and Tin is the air temperature inside the canyon.The convection coefficient hci depends on the surface properties, the air temperature and speed,and the system geometry.
A final equation defines the energy balance for the entire canyon:
∑i
(Rsun,i · Si +
∑oGsky · So · Fo�i
)= ∑
iSi ·
[(Ri + Gi) · Fi�o + hci · (Ti − Tin
)], (8)
where the pedices i and o mark the canyon surfaces and the open surfaces, respectively.The analytic is defined by a total of 3 × n + 1 equations, where n is the number of the canyon
surfaces: n for visible radiosities (Equation (4)), n for infrared radiosities (Equation (6)), n for thetotal energy on the canyon surfaces (Equation (7)), and 1 for energy balance in the whole canyon(Equation (8)). The system is fully determined, having a total of 3 × n + 1 unknown variables:{Ri}n, {Gi}n, {Ti}n, and Gsky.
3.1. Convective heat transfer
The convective heat transfer plays a fundamental role in the system results. It is beyond the goal ofthis work to provide a detailed description of the convection occurring inside an urban canyon as a
Advances in Building Energy Research 227
Dow
nloa
ded
by [
79.5
2.18
6.25
4] a
t 04:
01 0
7 Ja
nuar
y 20
14
function of all the sensible parameters (geometry, wind, and air properties). Nevertheless, the properconvection coefficients should be identified for a correct application of the analytic model.
Even if common real-scale scenarios are usually characterized by dominant forced convection(depending on the surface dimensions and the wind speed), in other cases (e.g. the scale model)the natural convection may be not negligible. If the boundary conditions do not allow an uncon-troversial choice of hi, the convection coefficients might be estimated using the same analyticapproach described in Section 3. In the case detailed, data are available for the site (e.g.surface temperatures, solar radiation, and wind speed), the model can be used to properly para-meterize the convection coefficients: the system above (Equations (4), (6)–(8)) can be fed withthe measured surface temperatures and return the convection coefficients (hi). In the generalcase, hi can be defined as the sum of two contributions, one for the forced convection (hFi ),and one for the natural convection (hNi ):
hi = hFi + hNi . (9)
The two terms of Equation (9) have the usual dependence upon the dimensionless parametersfor the flat-plate case:
hFi = cF · RemFi · PrnFi ,
hNi = cN · RamNi , (10)
where Re, Pr, and Ra are the Reynolds, Prandtl, and Rayleigh numbers, respectively, and nF isequal to 1/3 for our applications. It has to be noted that the system has a maximum of fourunknown variables (cF, mF, cN, and mN) and a number of equations equal to 2 × n. Since thecanyon is at least defined by three surfaces, the system is over-constrained, and the convectionparameters need to be found using a regression analysis.
4. Validation and application of the analytic model
The analytic model needs to be experimentally verified in order to be reliably applied for theurban canyon effect assessment. This procedure requires validating the outputs of the modelagainst measured data within an acceptable confidence level. Since there a number of parametersis involved in the calculations, the validation procedure is performed via the calibration of thoseparameters to fulfil the observations.
Considering fixed boundary conditions (i.e. aspect ratio, insolation, orientation, and meteor-ological conditions), the canyon is essentially modelled by two sets of parameters, namely thesurface properties (ri and ρi) and the size (H and D), which affect different aspects of theproblem. On one hand, the surface properties involve the radiative exchange, on the otherhand, the size affects the convection. In other words, two canyons with the same aspect ratio(H/D) but different absolute sizes will be described by the same radiative exchange, but notnecessary the same convective transfer. This consideration allows a 2-step validation of themodel using the test field described in Section 2:
(1) validation of the radiative exchange and(2) validation of the convective transfer.
Being the radiative exchange size-independent, if the analytic model is validated using thetest field (i.e. response to a change of ri and ρi), the same radiative exchange can be used forreal-size scenarios. Differently, the same convective transfer is guaranteed only if analogyapplies.
228 E. Bonamente et al.
Dow
nloa
ded
by [
79.5
2.18
6.25
4] a
t 04:
01 0
7 Ja
nuar
y 20
14
4.1. Analogy conditions
For natural convection, the analogy condition for two scenarios (a and b) is given by the conser-vation of the Rayleigh number:
Raa = Rab, (11)
from which
ua · d3a = ub · d3b, (12)
where θ is the temperature difference between the air and the surface and δ is the characteristicsurface length. For forced convection, the analogy condition requires the conservation of the Rey-nolds number:
Rea = Reb, (13)
ua · da = ub · db, (14)
where u is the wind speed. For example, in the case of dominant forced convection, if a scalemodel a has a dimension of 1/10th the real-size canyon b (δb= 10 · δa), the analogy is guaranteedonly if the wind speed in the scale model is 10 times that of the real size (ua= 10 · ub).
As a result, the validation of the convective heat transfer for sizes different to those of the testfield requires the checking of the model response to an increment of the wind speed (ua) in thecase of dominant forced convection, or to an increment of the temperature difference (θa) inthe case of dominant natural convection.
4.2. Urban canyon assessment
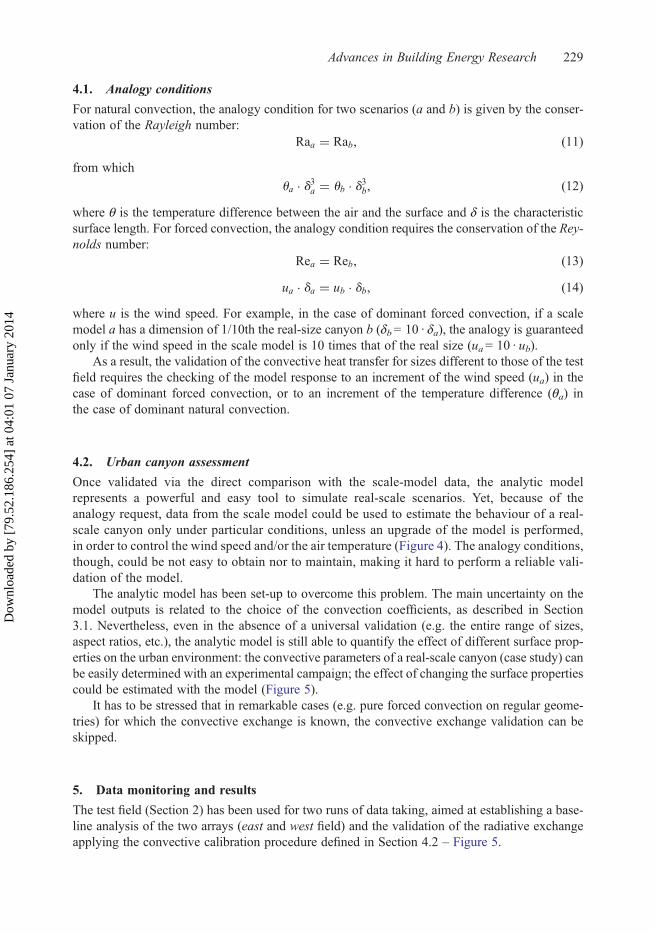
Once validated via the direct comparison with the scale-model data, the analytic modelrepresents a powerful and easy tool to simulate real-scale scenarios. Yet, because of theanalogy request, data from the scale model could be used to estimate the behaviour of a real-scale canyon only under particular conditions, unless an upgrade of the model is performed,in order to control the wind speed and/or the air temperature (Figure 4). The analogy conditions,though, could be not easy to obtain nor to maintain, making it hard to perform a reliable vali-dation of the model.
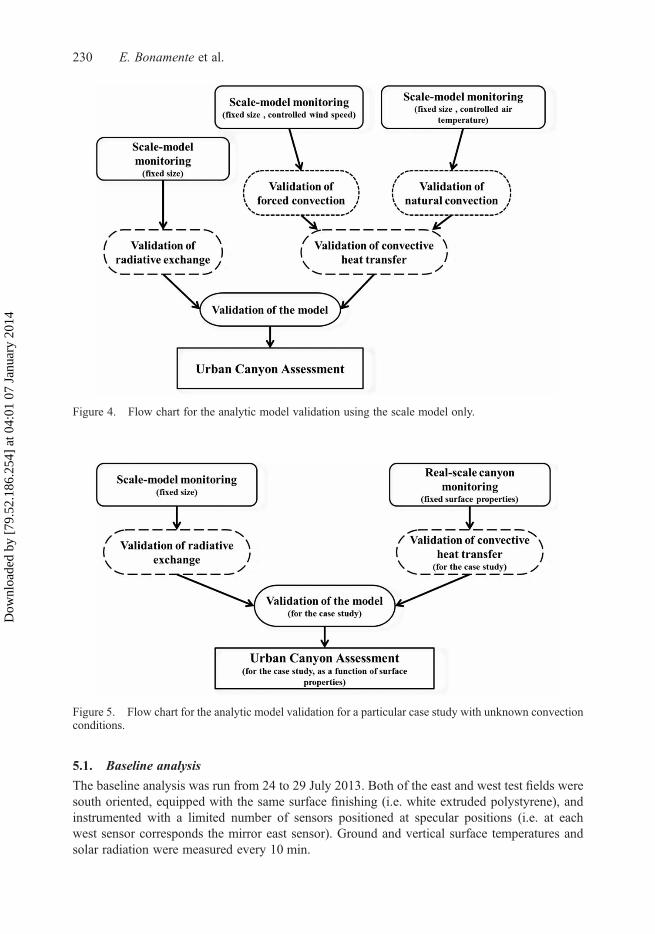
The analytic model has been set-up to overcome this problem. The main uncertainty on themodel outputs is related to the choice of the convection coefficients, as described in Section3.1. Nevertheless, even in the absence of a universal validation (e.g. the entire range of sizes,aspect ratios, etc.), the analytic model is still able to quantify the effect of different surface prop-erties on the urban environment: the convective parameters of a real-scale canyon (case study) canbe easily determined with an experimental campaign; the effect of changing the surface propertiescould be estimated with the model (Figure 5).
It has to be stressed that in remarkable cases (e.g. pure forced convection on regular geome-tries) for which the convective exchange is known, the convective exchange validation can beskipped.
5. Data monitoring and results
The test field (Section 2) has been used for two runs of data taking, aimed at establishing a base-line analysis of the two arrays (east and west field) and the validation of the radiative exchangeapplying the convective calibration procedure defined in Section 4.2 – Figure 5.
Advances in Building Energy Research 229
Dow
nloa
ded
by [
79.5
2.18
6.25
4] a
t 04:
01 0
7 Ja
nuar
y 20
14
5.1. Baseline analysis
The baseline analysis was run from 24 to 29 July 2013. Both of the east and west test fields weresouth oriented, equipped with the same surface finishing (i.e. white extruded polystyrene), andinstrumented with a limited number of sensors positioned at specular positions (i.e. at eachwest sensor corresponds the mirror east sensor). Ground and vertical surface temperatures andsolar radiation were measured every 10 min.
Figure 4. Flow chart for the analytic model validation using the scale model only.
Figure 5. Flow chart for the analytic model validation for a particular case study with unknown convectionconditions.
230 E. Bonamente et al.
Dow
nloa
ded
by [
79.5
2.18
6.25
4] a
t 04:
01 0
7 Ja
nuar
y 20
14
The result of the baseline shows that the average difference between mirror sensors is 0.45°Cfor the entire data set and 0.05°C considering night-time data only. The slightly larger daylightdifference suggests that the difference is attributable either to reflectivity or geometric differencesbetween the two test fields. The average standard deviation is 0.77°C. This value represents theestimation of the sensitivity of the test field to a change of the reflective properties of the surfaces.This value of standard deviation is well below the temperature measurement uncertainty (1.5°C).It is also more than one order of magnitude smaller than the temperature difference produced bydifferent-reflectance films applied on the two fields during the second period of data taking(Section 5.2).
5.2. Validation of the analytic model
A preliminary validation of the analytic model was performed based on the summer monitoring,which took place from 5 August to 5 September 2013, considering the H/D = 1.0 canyon only.The east and west fields vertical walls were covered with white and grey reflective films, respect-ively (Figure 2). The surface properties of the canyon walls were measured using a ShimadzuSolidSpec 3700 UV–VIS–NIR spectrophotometer and a D&S AE1 emissometer, the technicalspecifications of which are reported in Pisello, Cotana, and Brinchi (2013). The measuredvalues are reported in Table 1. All temperatures, solar radiation, and wind speed were measuredevery 10 min.
The convection parameter calibration was performed using data from three days at the solarnoon (sun at maximum altitude). These days were characterized by clear sky conditions, windspeed ranging from 2.2 to 4.0 m/s with a predominant east–west direction, and horizontal hemi-spherical sun radiation ranging from 909 to 931 W/m2. A comparison between estimated andmeasured temperatures was performed. A fourth measurement in similar conditions was includedin the comparison to test the calibrated system on an independent measurement.
The analytic model was applied to a 4-surface canyon layout: (1) the sun-exposed wall, (2a)the sun-exposed ground, (2b) the shaded ground, and (3) the shaded wall. As a result, the systemis composed of 13 equations and 13 unknown variables: (R1, R2a, R2b, R3, G1, G2a, G2b, G3, Gsky,T1, T2a, T2b, and T3).
The first step of the procedure produced the best-fit convective coefficient parameters:
hi = hFi + hNi = 0.0284 · Re0.8i · Pr1/3i + 1.03 · Ra0.25i . (15)
The model was finally used to estimate surface temperatures. Table 2 shows the solar radi-ation, the wind speed, the air temperature, and the estimated and measured surface temperatures.Data from 12 to 17 August have been used in the model calibration, the 19 August data have beenused to check the model with an independent measurement. Characteristic temperatures of sun-exposed and shaded walls have been obtained averaging top and bottom sensor measurements,i.e. T1 = (T1a + T1b)/2 and T3 = (T3a + T3b)/2.
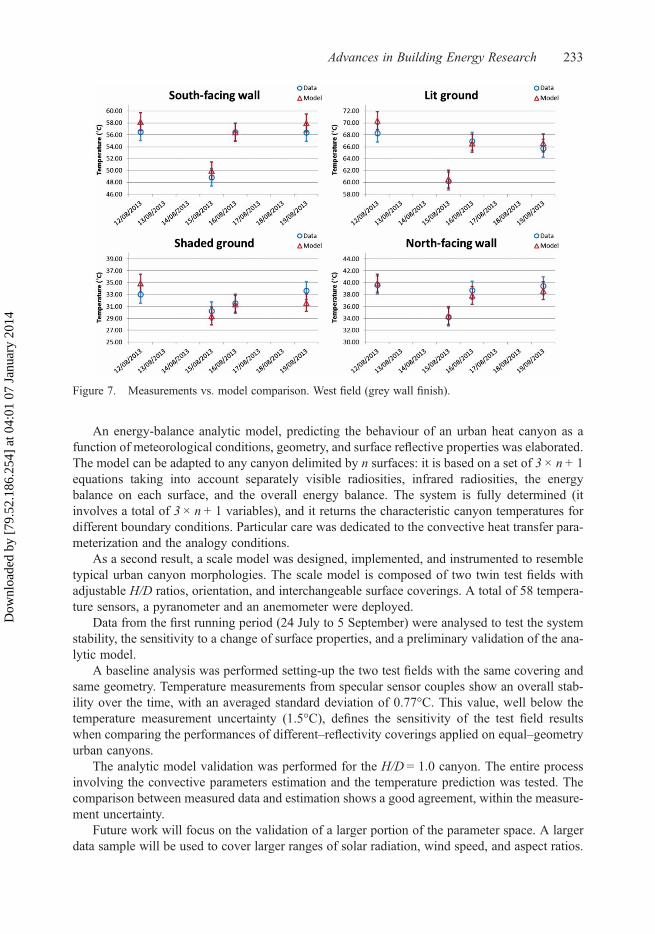
The calibrated analytic model reproduces the measured temperatures with good precision. Thestandard deviation of measured data points from model prediction is 0.9°C for the first three days
Table 1. Canyon surface properties.
Ground East field walls West field walls
Solar reflectance (r) 0.07 0.83 0.27Emissivity (ɛ) 0.78 0.25 0.25
Advances in Building Energy Research 231
Dow
nloa
ded
by [
79.5
2.18
6.25
4] a
t 04:
01 0
7 Ja
nuar
y 20
14
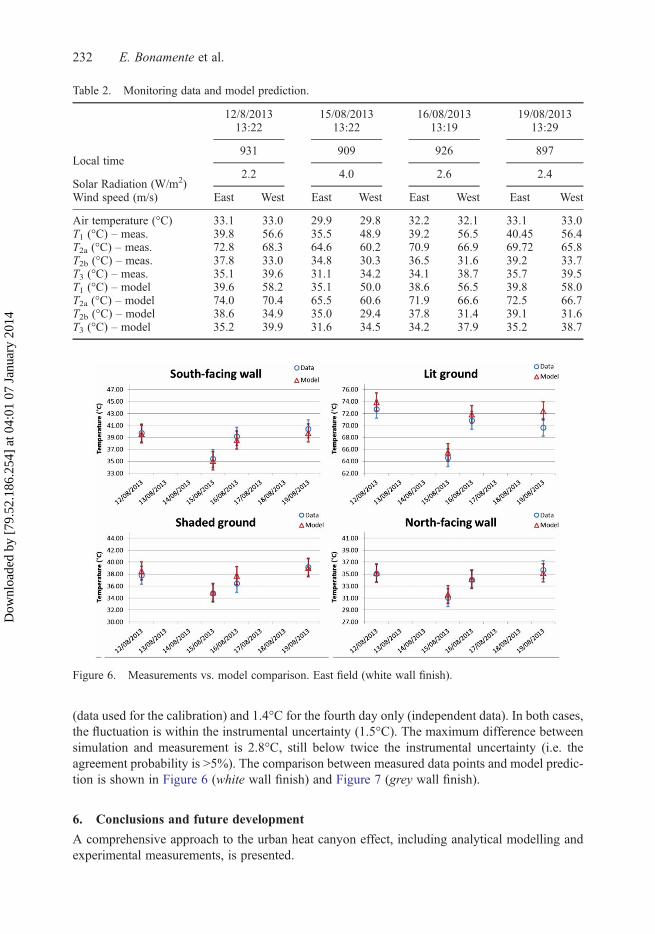
(data used for the calibration) and 1.4°C for the fourth day only (independent data). In both cases,the fluctuation is within the instrumental uncertainty (1.5°C). The maximum difference betweensimulation and measurement is 2.8°C, still below twice the instrumental uncertainty (i.e. theagreement probability is >5%). The comparison between measured data points and model predic-tion is shown in Figure 6 (white wall finish) and Figure 7 (grey wall finish).
6. Conclusions and future development
A comprehensive approach to the urban heat canyon effect, including analytical modelling andexperimental measurements, is presented.
Table 2. Monitoring data and model prediction.
12/8/201313:22
15/08/201313:22
16/08/201313:19
19/08/201313:29
Local time931 909 926 897
Solar Radiation (W/m2)2.2 4.0 2.6 2.4
Wind speed (m/s) East West East West East West East West
Air temperature (°C) 33.1 33.0 29.9 29.8 32.2 32.1 33.1 33.0T1 (°C) – meas. 39.8 56.6 35.5 48.9 39.2 56.5 40.45 56.4T2a (°C) – meas. 72.8 68.3 64.6 60.2 70.9 66.9 69.72 65.8T2b (°C) – meas. 37.8 33.0 34.8 30.3 36.5 31.6 39.2 33.7T3 (°C) – meas. 35.1 39.6 31.1 34.2 34.1 38.7 35.7 39.5T1 (°C) – model 39.6 58.2 35.1 50.0 38.6 56.5 39.8 58.0T2a (°C) – model 74.0 70.4 65.5 60.6 71.9 66.6 72.5 66.7T2b (°C) – model 38.6 34.9 35.0 29.4 37.8 31.4 39.1 31.6T3 (°C) – model 35.2 39.9 31.6 34.5 34.2 37.9 35.2 38.7
Figure 6. Measurements vs. model comparison. East field (white wall finish).
232 E. Bonamente et al.
Dow
nloa
ded
by [
79.5
2.18
6.25
4] a
t 04:
01 0
7 Ja
nuar
y 20
14
An energy-balance analytic model, predicting the behaviour of an urban heat canyon as afunction of meteorological conditions, geometry, and surface reflective properties was elaborated.The model can be adapted to any canyon delimited by n surfaces: it is based on a set of 3 × n + 1equations taking into account separately visible radiosities, infrared radiosities, the energybalance on each surface, and the overall energy balance. The system is fully determined (itinvolves a total of 3 × n + 1 variables), and it returns the characteristic canyon temperatures fordifferent boundary conditions. Particular care was dedicated to the convective heat transfer para-meterization and the analogy conditions.
As a second result, a scale model was designed, implemented, and instrumented to resembletypical urban canyon morphologies. The scale model is composed of two twin test fields withadjustable H/D ratios, orientation, and interchangeable surface coverings. A total of 58 tempera-ture sensors, a pyranometer and an anemometer were deployed.
Data from the first running period (24 July to 5 September) were analysed to test the systemstability, the sensitivity to a change of surface properties, and a preliminary validation of the ana-lytic model.
A baseline analysis was performed setting-up the two test fields with the same covering andsame geometry. Temperature measurements from specular sensor couples show an overall stab-ility over the time, with an averaged standard deviation of 0.77°C. This value, well below thetemperature measurement uncertainty (1.5°C), defines the sensitivity of the test field resultswhen comparing the performances of different–reflectivity coverings applied on equal–geometryurban canyons.
The analytic model validation was performed for the H/D = 1.0 canyon. The entire processinvolving the convective parameters estimation and the temperature prediction was tested. Thecomparison between measured data and estimation shows a good agreement, within the measure-ment uncertainty.
Future work will focus on the validation of a larger portion of the parameter space. A largerdata sample will be used to cover larger ranges of solar radiation, wind speed, and aspect ratios.
Figure 7. Measurements vs. model comparison. West field (grey wall finish).
Advances in Building Energy Research 233
Dow
nloa
ded
by [
79.5
2.18
6.25
4] a
t 04:
01 0
7 Ja
nuar
y 20
14
An upgrade of the system to include controlled wind speed is also in the design phase. Finally, aparticular effort will be dedicated to perform a validation of the model for real-size canyons.
ReferencesAkbari, H., & Matthews, D. H. (2012). Global cooling updates: Reflective roofs and pavements. Energy and
Buildings, 55, 2–6.Allegrini, J., Dorera, V., & Carmelieta, J. (2012). Influence of the urban microclimate in street canyons on the
energy demand for space cooling and heating of buildings. Energy and Buildings, 55, 823–832.ASTM International. (2012). Standard test method for solar absorptance, reflectance, and transmittance of
materials using integrating spheres (ASTM 903-12). doi:10.1520/E0903-12.Bonacquisti, V., Casale, G. R., Palmieri, S., & Siani, A. M. (2006). A canopy layer model and its application
to Rome. Science of the Total Environment, 364, 1–13.Chan, A. T., So, E. S. P., & Samad, S. C. (2001). Strategic guidelines for street canyon geometry to achieve
sustainable street air quality. Atmospheric Environment, 35, 4089–4098.Doya, M., Bozonnet, E., & Allard, F. (2012). Experimental measurement of cool facades’ performance in a
dense urban environment. Energy and Buildings, 55, 42–50.European Committee for Standardization. (2011). Glass in building – determination of luminous and solar
characteristics of glazing (UNI EN 410:2011).Giridharan, R., & Kolokotroni, M. (2009). Urban heat island characteristics in London during winter. Solar
Energy, 83, 1668–1682Gobakis, K., Kolokotsa, D., Synnefa, A., Saliari, M., Giannopoulou, K., & Santamouris, M. (2011).
Development of a model for urban heat island prediction using neural network techniques.Sustainable Cities and Society, 1, 104–115.
Howard, L. (1833).Climate of London deduced from meteorological observations (3rd ed.). London: Harveyand Darton
Kolokotsa, D., Diakaki, C., Papantoniou, S., & Vlissidis, A. (2012). Numerical and experimental analysisof cool roofs application on a laboratory building in Iraklion, Crete, Greece. Energy and Buildings,55, 85–93.
Krüger, E., Pearlmutter, D., & Rasia, F. (2010). Evaluating the impact of canyon geometry and orientation oncooling loads in a high-mass building in a hot dry environment. Applied Energy, 87, 2068–2078.
Manley, G. (1958). On the frequency of snowfall in metropolitan England. Quarterly Journal of the RoyalMeteorological Society, 84, 70–72.
Pisello, A. L., & Cotana, F. (2014). The thermal effect of an innovative cool roof on residential buildings inItaly: Results from two years of continuous monitoring. Energy and Buildings, 69, 154–164.
Pisello, A. L., Cotana, F., & Brinchi, L. (2013). Development of clay tile coatings for steep-sloped cool roofs.Energies, 6, 3637–3653.
Pisello, A. L., Cotana, F., Nicolini, A., & Brinchi, L. (2013). Development of clay tile coatings for steep-sloped cool roofs. Energies, 6, 3637–3653.
Ratti, C., Baker, N., & Steemers, K. (2005). Energy consumption and urban texture. Energy and Buildings,37, 762–776.
Rossi, F., Pisello, A. L., Nicolini, A., Filipponi, M., & Palombo, M. (2014). Analysis of retro-reflective sur-faces for urban heat island mitigation: A new analytical model. Applied Energy, 114, 621–631.
Santamouris, M. (2007). Heat island research in Europe—the state of the art. Advances Building EnergyResearch, 1(1), 123–150.
Shahidan, M. F., Jones, P. J., Gwilliam, J., & Salleh, E. (2012). An evaluation of outdoor and buildingenvironment cooling achieved through combination modification of trees with ground materials.Building and Environment, 58, 245–257.
Strømann-Andersen, J., & Sattrup, P. A. (2011). The urban canyon and building energy use: Urban densityversus daylight and passive solar gains. Energy and Buildings, 43, 2011–2020.
Synnefa, A., Saliari, M., & Santamouris, M. (2012). Experimental and numerical assessment of the impact ofincreased roof reflectance on a school building in Athens. Energy and Buildings, 55, 7–15.
Taha, H. (1997). Urban climates and heat islands: Albedo, evapotranspiration, and anthropogenic heat.Energy and Buildings, 25, 99–103.
Xu, X., Taylor, J. E., Pisello, A. L., & Culligan, P. (2012). The impact of place-based affiliation networks onenergy conservation: An holistic model that integrates the influence of buildings, residents and theneighborhood context. Energy and Buildings, 55, 637–646.
234 E. Bonamente et al.
Dow
nloa
ded
by [
79.5
2.18
6.25
4] a
t 04:
01 0
7 Ja
nuar
y 20
14