An empirical investigation of earnings restatements by Australian firms
22
Accounting and Finance 47 (2007) 1– 22 © The Authors Journal compilation © 2006 AFAANZ Blackwell Publishing, Ltd. Oxford, UK ACFI Accounting and Finance 0810-5391 © The Authors Journal compilation © AFAANZ 46 5 ORIGINAL ARTICLE K. Ahmed, J. Goodwin K. Ahmed, J. Goodwin An empirical investigation of earnings restatements by Australian firms Kamran Ahmed a , John Goodwin b a School of Business, La Trobe University, Bundoora, 3086, Australia b School of Accounting and Law, RMIT University, Melbourne, 3000, Australia Abstract From 1970 to 2003, we document earnings restatements for the top 500 Australian firms, examine the characteristics of restating firms, and test whether restatements are value relevant. Of the 195 earnings restatements, 49 per cent decrease prior- period earnings (negative restatements). Negative restatements are relatively larger than positive restatements. We identify three reasons for earnings restate- ments; namely, accounting policy changes, revision of estimates, and errors and unknown, and they comprise 49, 40 and 11 per cent of the sample, respectively. Restatement firms have higher growth opportunities and are smaller than non- restating firms from the same industry. Restatements are generally negatively associated with market and non-market value. Key words: Earnings restatements; Value relevance; Firm characteristics JEL classification: M40, M41 doi: 10.1111/j.1467-629x.2006.00196.x 1. Introduction In recent years, the frequency of US earnings restatements has increased, attracting considerable attention from academics. Much of that attention has been focused on the relation between earnings restatements and shareholders’ wealth. For example, studies have consistently found negative market reactions from earnings restatements because of accounting errors (see Kinney and McDaniel, 1989; Defond and Jiambalvo, 1991; Feroz et al., 1991; Dechow We appreciate the valuable comments from Max Aiken, Bruce Bennett, Craig Deegan, participants at the RMIT University 2005 seminar series, the 2005 AFAANZ conference and the two anonymous reviewers. Any errors remain our own. Received 3 August 2005; accepted 15 March 2006 by Gary Monroe (Deputy Editor).
Transcript of An empirical investigation of earnings restatements by Australian firms
Accounting and Finance 47 (2007) 1–22
©
The AuthorsJournal compilation
©
2006 AFAANZ
Blackwell Publishing, Ltd.Oxford, UKACFIAccounting and Finance0810-5391© The Authors Journal compilation © AFAANZ465
ORIGINAL ARTICLE
K. Ahmed, J. GoodwinK. Ahmed, J. Goodwin
An empirical investigation of earnings restatements by Australian firms
Kamran Ahmed
a
, John Goodwin
b
a
School of Business, La Trobe University, Bundoora, 3086, Australia
b
School of Accounting and Law, RMIT University, Melbourne, 3000, Australia
Abstract
From 1970 to 2003, we document earnings restatements for the top 500 Australianfirms, examine the characteristics of restating firms, and test whether restatementsare value relevant. Of the 195 earnings restatements, 49 per cent decrease prior-period earnings (negative restatements). Negative restatements are relativelylarger than positive restatements. We identify three reasons for earnings restate-ments; namely, accounting policy changes, revision of estimates, and errors andunknown, and they comprise 49, 40 and 11 per cent of the sample, respectively.Restatement firms have higher growth opportunities and are smaller than non-restating firms from the same industry. Restatements are generally negativelyassociated with market and non-market value.
Key words
: Earnings restatements; Value relevance; Firm characteristics
JEL classification
: M40, M41
doi:
10.1111/j.1467-629x.2006.00196.x
1. Introduction
In recent years, the frequency of US earnings restatements has increased,attracting considerable attention from academics. Much of that attention hasbeen focused on the relation between earnings restatements and shareholders’wealth. For example, studies have consistently found negative market reactionsfrom earnings restatements because of accounting errors (see Kinney andMcDaniel, 1989; Defond and Jiambalvo, 1991; Feroz
et al
., 1991; Dechow
We appreciate the valuable comments from Max Aiken, Bruce Bennett, Craig Deegan,participants at the RMIT University 2005 seminar series, the 2005 AFAANZ conferenceand the two anonymous reviewers. Any errors remain our own.
Received 3 August 2005;
accepted 15 March 2006 by Gary Monroe (Deputy Editor).
2 K. Ahmed, J. Goodwin/Accounting and Finance 47 (2007) 1–22
©
The AuthorsJournal compilation
©
2006 AFAANZ
et al
., 1996; Turner
et al
., 2001; Palmrose
et al
., 2004). There is very littleempirical evidence on the market’s valuation of earnings restatements becauseof other reasons, such as accounting policy changes, and the effect of restate-ments on financial performance measures other than market returns.
1
In thisstudy, we examine these two additional issues using a sample of 195 earningsrestatements by Australian firms from 1970 to 2003. We also examine whetherattributes of restating firms differ from those of non-restating firms in the sameindustry. Our inquiry is motivated by the lack of a study using Australian dataand the Australian Securities and Investments Commission’s (ASIC) recent con-cern over possible accounting abuses. For example, the then chairman of ASIC,David Knott, wrote to companies in July 2002 warning them of a new surveillanceproject ‘directed at American-style accounting abuses’ (Buffini, 2002).
Restatements because of accounting errors are a symptom of poor earningsquality (Levitt, 2000), and recent US studies document an increase in restatementfrequency because of errors (Wu, 2002). While giving evidence at the US Senatein January 2002, Paul Sarbanes commented that frequent restatements of earningsraises questions about the reliability of published financial statements becauseit threatens to undermine investors’ confidence in the securities markets (com-ments on the floor of the US Senate, 23 January 2002). It is not surprising thatin the case of accounting errors, restatements seem to cause investors to signi-ficantly downgrade assessments of firm value (see Richardson
et al
., 2002;Hirschey
et al
., 2003; Palmrose
et al
., 2004). ASIC used this recent trend in theUSA to increase corporate surveillance in 2002 (Buffini, 2002). The then chiefaccountant of the ASIC said ‘In the wake of the U.S. focus, some companieshave also asked questions about the aggressiveness of accounting policies’(Buffini, 2002). As there is no evidence on the value relevance of earningsrestatements in Australia, this paper fills some of that gap in our knowledge.
Australian Generally Accepted Accounting Principles (GAAP) permittedearnings restatements by changing comparatives before January 1974, and afterthis time until 2005, these types of restatements were not permitted by account-ing standards. Nevertheless, some of the top 500 listed firms restated earningsbetween 1974 and 2005 by changing their comparatives. We identify three mainreasons for earnings restatements; namely, accounting policy changes includingnew standards, revisions in prior-period estimates, and errors and unknown.These reasons are broadly consistent with those identified in
AustralianAccounting Standard, AASB 101
:
Presentation of Financial Statements
.In our study, restatements because of policy changes and revisions, respectively,
comprise 49 and 40 per cent of the 195 sample observations. Errors andunknown comprise approximately 11 per cent. Restating firms are smaller andhave a higher market-to-book ratio than the industry average and non-restating firmsfrom the same industry. Furthermore, restating firms have a higher profitability
1
The paper by Richardson
et al
. (2002) is an exception.
K. Ahmed, J. Goodwin/Accounting and Finance 47 (2007) 1–22 3
©
The AuthorsJournal compilation
©
2006 AFAANZ
and lower liquidity than the industry average in the post-1973 period, and theyhave a higher market-to-book ratio and are smaller than the industry averagewhen they restate for accounting policy and revisions reasons.
Using models from prior literature, we find evidence that earnings restatementsare value relevant. Two types of dependent variables (market and non-market)are used to improve confidence in the results (Aboody
et al
., 1999). Specifically,earnings restatements are generally found to be negatively associated with 12month raw returns measured to 4 months after balance date, and with nextperiod’s earnings changes excluding extraordinary items. Our strongest evidenceof value relevance is for restatements that occur before 1974, a period whenfirms could elect to restate their comparatives. We find a negative coefficientfor restatements for all three estimated regressions in this period, but only thecoefficient for errors and unknown sample is significant. This is consistent withprevious results in the USA (see Richardson
et al
., 2002; Palmrose
et al
., 2004).Furthermore, we find that the restatement amount is significantly associatedwith future earnings, suggesting that earnings restatement is value relevant inboth contemporaneous and intertemporal settings.
The remainder of this paper is structured as follows. The next section coversthe relevant literature and hypotheses development. Earnings restatement isdefined and accounting for restatements briefly covered in Section 3. Section 4describes the data and outlines the methodology. Findings from the empiricaltests are presented in Section 5 and Section 6 concludes the paper.
2. Review of literature
In this section we review the literature on the characteristics of restating firms,on the value relevance of restatements and develop hypotheses. Extant studiesusing US data mostly examine restatements due to accounting irregularities anddo not supplement market value tests with non-market value tests.
2.1. Firm characteristics
An early study by Kinney and McDaniel (1989) examines characteristics offirms filing corrections to quarterly earnings. They find that restating firms aresmaller, less profitable, slower growing, more highly levered and received morequalified audit opinions than their industry counterparts. DeFond and Jiambalvo(1991) also report that restating firms have lower earnings growth, that theyhave more diffuse ownership and fewer incidences of audit committees thantheir control counterparts. However, a more recent study by Richardson
et al
.(2002), who use a sample of firms that restated earnings during the period1971–2000, finds that restatement firms tend to be high growth firms that areunder pressure to inflate earnings to meet or beat analysts’ forecasts. They didnot find any difference between restatement firms and non-restatement firmswith regard to profitability and size.
4 K. Ahmed, J. Goodwin/Accounting and Finance 47 (2007) 1–22
©
The AuthorsJournal compilation
©
2006 AFAANZ
Most studies provide evidence consistent with restating firms being smallerand in poorer financial condition than their control counterparts. One mightconjecture that restatements because of reasons other than errors are primarilya function of inferior accounting systems and practices, and a similar relation isexpected for firms with these types of restatements. However, it can also beconjectured that firms use restatements to signal changed conditions, ratherthan mask poor performance and that this might be more prevalent in largerfirms. There is no previous evidence on temporal changes in the characteristicsof restating firms. Because we have no strong foundation for expecting a particu-lar relation with respect to differences because of restatement reasons or overtime, our first hypothesis, formally stated, is:
H
1
: There is no significant difference between the characteristics of restatingfirms and non-restating firms.
2.2. Value relevance
Kinney and McDaniel (1989) also assess the market reaction to restatementannouncements because of errors and find an overall negative share return, betweenthe issuance of the erroneous quarterly reports and their corrections. Wallace(2000) finds a negative share market reaction to restatements because of investiga-tions and fraud. More recent studies extend Kinney and McDaniel (1989) byexamining other types of restatement. Owers
et al
. (2002) examine nine cate-gories of restatement and find the most negative market reaction for restate-ments because of accounting issues (errors, irregularities and accounting methodchanges). Interestingly, they also find a positive market reaction to restatementsbecause of revisions in estimates of previously announced legal issues, suggestingthat the market initially overreacts to restatements. Palmrose
et al
. (2004)examine the determinants of the market reaction to earnings restatements. Theyfind a negative market reaction of approximately 9 per cent, and that more negativeabnormal returns are associated with more negative restatements, those thatinvolve fraud, that decrease earnings and where the restatement is not quantified. Ina more recent study, Palmrose and Scholz (2004) examine the association betweencertain earnings restatements and company characteristics with the likelihood oflitigation against company management and board of directors. They report anegative market reaction to restatement announcements. It is evident that a firm’searnings restatement generally has adverse market consequences for the firm.
2
Previous research treats all restatements as potentially bad signals for investorsand other financial statement users. Callen
et al
. (2002) argue that accountingerrors are of concern to the firm’s stakeholders and to regulators such as the
2
Additionally, Gonen (2003) finds that restatements adversely affect the market value offirms in the same industry.
K. Ahmed, J. Goodwin/Accounting and Finance 47 (2007) 1–22 5
©
The AuthorsJournal compilation
©
2006 AFAANZ
Securities and Exchange Commission in the USA. Changes in accountingpolicy that lead to restatement are less likely to be problematic for two reasons.First, many if not most changes in accounting policy arise out of a legitimateneed to disclose changing circumstances that might affect the firm’s performance.Second, even if changes in accounting policy are used to manage the firm’searnings, earnings management is not necessarily pernicious because it mightbe one means of providing capital markets with information about the firm’sfuture prospects (Schipper, 1989; Healy and Wahlen, 1999).
More generally, restatements might provide useful information about thehistorical earnings trend, thereby improving forecasting (Lev and Zarowin,1999) and about the direct effects on future earnings. For example, Lev andZarowin (1999) contend that restatement of accounting information is a partialsolution to improving declining earnings value relevance. They state that afirm’s accounts provide an historical context within which to evaluate its currentinformation.
3
As new information comes to hand, revision of prior-periodaccounting information improves this context and enables better decision-making by account users. The capitalization and amortization of previouslyexpensed in-process R&D and reversals of asset impairments are offered as twoexamples of their contention. Additionally, Lundholm (1999) argues for manda-tory reporting of the
ex-post
accuracy of firm’s estimates, including voluntarydisclosures. This, he claims, will not only inform about the historical context,but also provide an incentive for accurate reporting in the current period.According to him, firms are more likely to expand disclosure of higher qualityinformation under such a reporting requirement. Whether restatements causedby accounting policy changes and revisions in estimates reasons are also treatednegatively by the market is an untested empirical question that this studyaddresses. Based on the collective body of US evidence and conjectures madeby some, we examine the value relevance of earnings restatements via the fol-lowing formally stated hypotheses:
H
2a
: There is no significant relation between share returns and earningsrestatements for the full sample.
H
2b
: There is no significant relation between share returns and earningsrestatements caused by accounting policy changes.
H
2c
: There is no significant relation between share returns and earningsrestatements caused by revisions.
H
2d
: There is no significant relation between share returns and earningsrestatements caused by errors and unknown.
3
Several studies provide evidence supporting accounting information’s contextual role (seeLev
et al
., 1998; Barth
et al
., 1999; Finger
et al
., 1999; Petroni
et al
., 2000).
6 K. Ahmed, J. Goodwin/Accounting and Finance 47 (2007) 1–22
©
The AuthorsJournal compilation
©
2006 AFAANZ
H
3a
: There is no significant relation between future earnings and earningsrestatements for the full sample.
H
3b
: There is no significant relation between future earnings and earningsrestatements caused by accounting policy changes.
H
3c
: There is no significant relation between future earnings and earningsrestatements caused by revisions.
H
3d
: There is no significant relation between future earnings and earningsrestatements caused by errors and unknown.
3. Earnings restatement definition and GAAP
In the absence of an accepted definition in the academic literature, we take earningsrestatement to mean a net change to the prior-period’s earnings shown only in thecurrent-period comparatives, and we use this definition to identify restatements. Webelieve this type of accounting treatment is consistent with that proposed by Lev andZarowin (1999) and Lundholm (1999) in their calls to improve earnings quality.
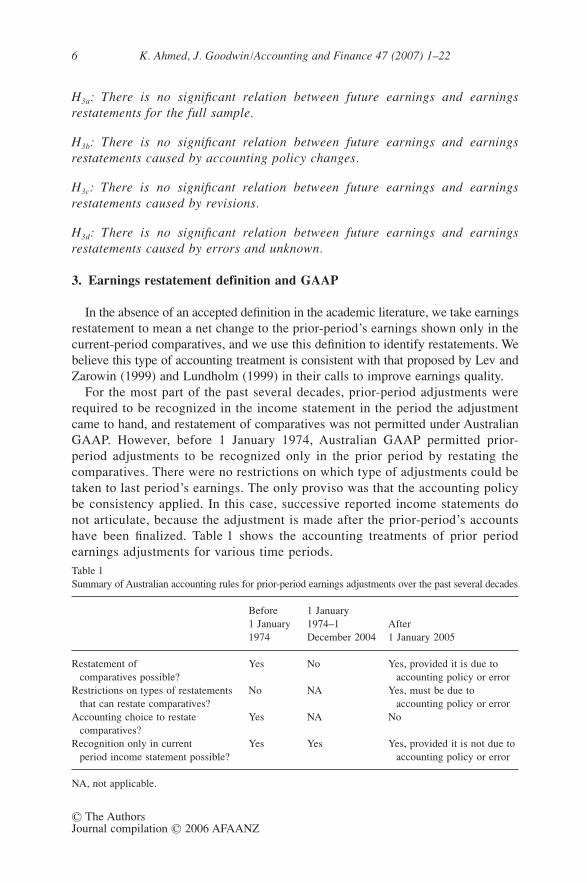
For the most part of the past several decades, prior-period adjustments wererequired to be recognized in the income statement in the period the adjustmentcame to hand, and restatement of comparatives was not permitted under AustralianGAAP. However, before 1 January 1974, Australian GAAP permitted prior-period adjustments to be recognized only in the prior period by restating thecomparatives. There were no restrictions on which type of adjustments could betaken to last period’s earnings. The only proviso was that the accounting policybe consistency applied. In this case, successive reported income statements donot articulate, because the adjustment is made after the prior-period’s accountshave been finalized. Table 1 shows the accounting treatments of prior periodearnings adjustments for various time periods.Table 1Summary of Australian accounting rules for prior-period earnings adjustments over the past several decades
Before 1 January 1974
1 January 1974–1 December 2004
After 1 January 2005
Restatement of comparatives possible?
Yes No Yes, provided it is due to accounting policy or error
Restrictions on types of restatements that can restate comparatives?
No NA Yes, must be due to accounting policy or error
Accounting choice to restate comparatives?
Yes NA No
Recognition only in current period income statement possible?
Yes Yes Yes, provided it is not due to accounting policy or error
NA, not applicable.
K. Ahmed, J. Goodwin/Accounting and Finance 47 (2007) 1–22 7
©
The AuthorsJournal compilation
©
2006 AFAANZ
From January 2005 Australian firms are required to restate comparativeinformation for accounting policy changes and errors but not for revisions,under AASB 101
Presentation of Financial Statements
. The present studyexamines whether these three types of accounting information are associatedwith information relevant to shareholders and the results provide evidenceabout the appropriateness of this new rule.
4. Research design
4.1. Data
The data were hand-collected from the Australian Graduate School ofManagement (AGSM) annual report file from 1970 to 1993 and the Connect 4database from 1993 to 2003. Two databases were used because the AGSMannual report file does not include firms after 1993. Nevertheless, both data-bases cover the top 500 Australian Stock Exchange (ASX) listed firms and,therefore, we examined a constant sample of the top 500 firms. Observationsare included when the current-period’s comparative earnings is different fromprior-period earnings reported in the prior period. In this case, last period’sclosing retained earnings disclosed in the last period is different from lastperiod’s closing retained earnings disclosed in the current period. That is, theaccounts do not articulate because the item is recognized in the prior-period’sledger after the accounts have been issued. In the second case, the item isrecognized in the current-period’s ledger. As mentioned above, we believe thatthe former is more consistent with the contentions of those proposing restate-ment of information as an accounting policy. The second case is consistent withGAAP since at least 1970. Hence, our sample number is a lower bound of thepopulation number of prior-period earnings adjustments. Additional accountingdata were obtained from the Findata database.
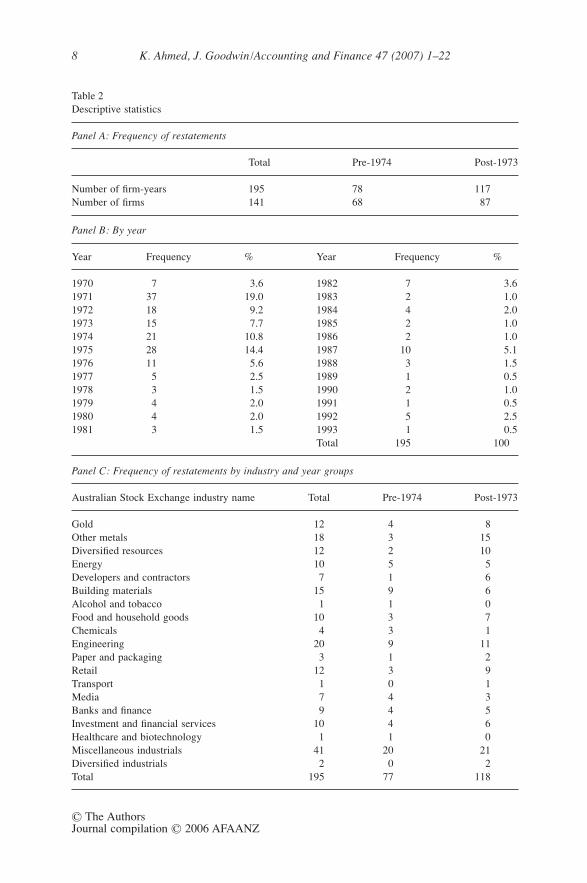
The final sample comprises 195 firm-years (141 firms) and these are shownin Table 2 (Panel A). The numbers of firms in the two time periods do not addto the total because some firms are represented in both periods. Table 2 alsoshows yearly frequencies in Panel B and the industry breakdown in Panel C.Approximately 40 per cent of our sample (78 observations) occurs before 1974;that is, the period when restatements were permitted. Approximately 20 per centof the observations are from 1975 and 1976, probably because accountingstandards had no legal backing at that time and firms could argue, until 1990, thatcompliance would not provide a true and fair view, thereby avoiding a standard.Hence, the frequency tapers off after 1990 and there are no observations after 1993.The 1987 and 1992 frequency jumps are because of, respectively, the ASIC’s
4
Release number 340 that prohibited equity accounting in the accounts, and initial
4
Formerly, the National Companies and Securities Commission.
8 K. Ahmed, J. Goodwin/Accounting and Finance 47 (2007) 1–22
©
The AuthorsJournal compilation
©
2006 AFAANZ
Table 2Descriptive statistics
Panel A: Frequency of restatements
Total Pre-1974 Post-1973
Number of firm-years 195 78 117Number of firms 141 68 87
Panel B: By year
Year Frequency % Year Frequency %
1970 7 3.6 1982 7 3.61971 37 19.0 1983 2 1.01972 18 9.2 1984 4 2.01973 15 7.7 1985 2 1.01974 21 10.8 1986 2 1.01975 28 14.4 1987 10 5.11976 11 5.6 1988 3 1.51977 5 2.5 1989 1 0.51978 3 1.5 1990 2 1.01979 4 2.0 1991 1 0.51980 4 2.0 1992 5 2.51981 3 1.5 1993
Total 1
1950.5
100
Panel C: Frequency of restatements by industry and year groups
Australian Stock Exchange industry name Total Pre-1974 Post-1973
Gold 12 4 8Other metals 18 3 15Diversified resources 12 2 10Energy 10 5 5Developers and contractors 7 1 6Building materials 15 9 6Alcohol and tobacco 1 1 0Food and household goods 10 3 7Chemicals 4 3 1Engineering 20 9 11Paper and packaging 3 1 2Retail 12 3 9Transport 1 0 1Media 7 4 3Banks and finance 9 4 5Investment and financial services 10 4 6Healthcare and biotechnology 1 1 0Miscellaneous industrials 41 20 21Diversified industrials 2 0 2Total 195 77 118
K. Ahmed, J. Goodwin/Accounting and Finance 47 (2007) 1–22 9
©
The AuthorsJournal compilation
©
2006 AFAANZ
application of the revised consolidation accounting standard. Both of theserestatement types are classified as accounting policy changes in this paper. Theindustry data reveal restatement occurs across 19 of the 24 industries and thereare 5 unrepresented industries (unreported). The resources industries, namely, gold,other metals, and diversified resources, comprise approximately 25 per cent oflisted firms in Australia, and the percentage in our sample is approximately 22.
Market data were obtained from the
AGSM’s Prices and Price RelativesDatabase
, the
Australian Stock Exchange (ASX) Journal
and the
Official Recordof the Melbourne Stock Exchange
. We calculate 12 month raw returns (includingdividends and capitalization adjustments) ending 4 months after the reportingdate that covers the required lodgement date for that financial year.
5
Becauseplotting the variables shows some extreme values, we winsorized the top andbottom two observations of each variable to reduce the effect of these outliers(Kothari
et al
., 2002). Winsorizing does not eliminate outliers, but limits theireffects. This represents approximately 3 per cent of the original sample.
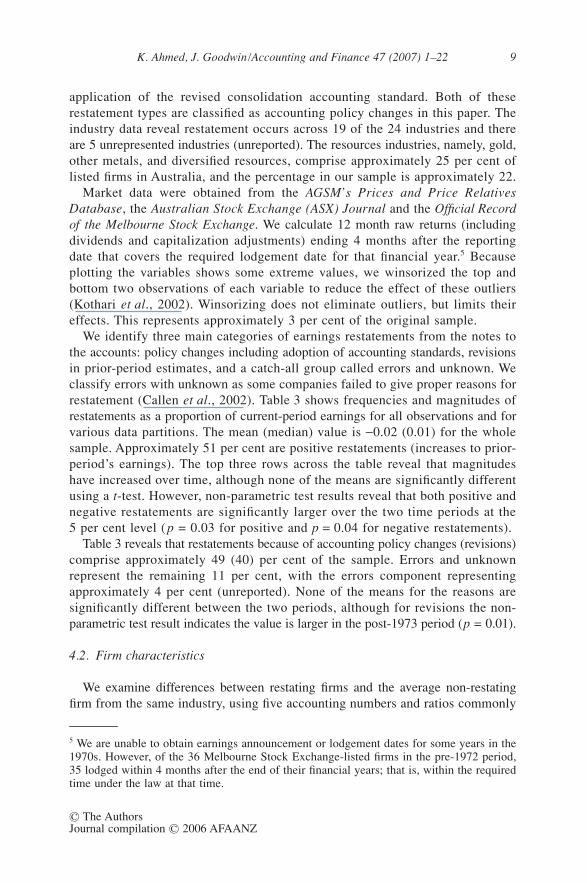
We identify three main categories of earnings restatements from the notes tothe accounts: policy changes including adoption of accounting standards, revisionsin prior-period estimates, and a catch-all group called errors and unknown. Weclassify errors with unknown as some companies failed to give proper reasons forrestatement (Callen
et al
., 2002). Table 3 shows frequencies and magnitudes ofrestatements as a proportion of current-period earnings for all observations and forvarious data partitions. The mean (median) value is
−
0.02 (0.01) for the wholesample. Approximately 51 per cent are positive restatements (increases to prior-period’s earnings). The top three rows across the table reveal that magnitudeshave increased over time, although none of the means are significantly differentusing a
t
-test. However, non-parametric test results reveal that both positive andnegative restatements are significantly larger over the two time periods at the5 per cent level (
p = 0.03 for positive and p = 0.04 for negative restatements).Table 3 reveals that restatements because of accounting policy changes (revisions)
comprise approximately 49 (40) per cent of the sample. Errors and unknownrepresent the remaining 11 per cent, with the errors component representingapproximately 4 per cent (unreported). None of the means for the reasons aresignificantly different between the two periods, although for revisions the non-parametric test result indicates the value is larger in the post-1973 period (p = 0.01).
4.2. Firm characteristics
We examine differences between restating firms and the average non-restatingfirm from the same industry, using five accounting numbers and ratios commonly
5 We are unable to obtain earnings announcement or lodgement dates for some years in the1970s. However, of the 36 Melbourne Stock Exchange-listed firms in the pre-1972 period,35 lodged within 4 months after the end of their financial years; that is, within the requiredtime under the law at that time.
10K
. Ahm
ed, J. Goodw
in/A
ccounting and Finance 47 (2007) 1–22
© T
he Authors
Journal compilation ©
2006 AFA
AN
Z
Table 3Descriptive statistics by sign and type and relative magnitudes
Panel A: All restatements and positive and negative restatements separated into pre-1974 and post-1973
Total Pre-1974 Post-1973p-values for difference between
pre-1974 and post-1973
Mean Median N Mean Median N Mean Median N t-test Wilcoxon
All −0.02 0.01 195 −0.02 −0.01 78 −0.03 0.01 117 0.41 0.12Positive 0.06 0.03 100 0.04 0.02 33 0.07 0.04 67 0.58 0.03Negative −0.11 −0.04 95 −0.06 −0.04 45 −0.15 −0.07 50 0.20 0.04
Panel B: Restatements by reason
Total Pre-1974 Post-1973 p-values for difference between
pre-1974 and post-1973
Mean Median N Mean Median N Mean Median N t-test Wilcoxon
Accounting policy −0.05 0.01 96 0.03 0.02 25 −0.08 0.01 71 0.16 0.46Revisions −0.01 −0.01 78 −0.03 −0.03 45 0.02 0.03 33 0.06 0.01Errors and unknown 0.04 0.01 21 −0.13 −0.01 8 0.14 0.01 13 0.21 0.28
Means (medians) are the means (medians) of the ratio of the amount of the earnings restatement divided by current period earnings.
K. Ahmed, J. Goodwin/Accounting and Finance 47 (2007) 1–22 11
© The AuthorsJournal compilation © 2006 AFAANZ
used in financial statement analysis. Previous US research has shown thatrestating firms are smaller, less profitable, more highly levered, slower growing,have fewer income increasing alternatives and lower market returns comparedwith their industry counterparts (Kinney and McDaniel, 1989; Defond andJiambalvo, 1991; Callen et al., 2002). However, evidence provided by Richardsonet al. (2002) contradicts the growth, profitability and size relations found in otherresearch. Following these studies, we identify a sample of firms from the sameindustry who have not restated earnings and compare these with restating firmswith respect to growth opportunity, liquidity, profitability, leverage, and firm size.
We measure a firm’s growth opportunity by the market-to-book ratio at theend of the year (MBit). For liquidity, we use the working capital ratio (WCit),which is the proportion of current assets to current liabilities at the end of theyear. For profitability, we use the return on assets ratio (ROAit), measured by netincome adjusted for extraordinary items divided by average total assets over theyear. We measure leverage (LEVit) as the ratio of total liabilities to total assetsfor firms at the end of the year, and firm size (SIZEit) is measured by the logarithmof the book value of total assets at year end.
We also estimate a binary logistic multivariate regression model (Model 1).Logit analysis is preferred because the relative impact of each independentvariable is provided. The model is represented as follows:
, (1)
where P(i) is the probability of an earnings restatement by firm i (we use anindicator variable where 1 represents a restating firm and zero otherwise); e isexponential function; X(i) is vector of independent variables for earningsrestatements such as MBit, WCit, ROAit, LEVit and SIZEit; and β is regressioncoefficient for X(i).
The explanatory power of the model is determined using Cox and Snell R2,likelihood ratio and prediction accuracy, and the significance level of thecoefficient on each independent variable is determined using p-values.
4.3. Value relevance
We use both market-dependent and non-market-dependent variables to assessvalue relevance. Model 2 (returns model) is estimated to assess whether restatementinformation is incrementally value relevant to earnings and earnings change inexplaining share returns. As previous research has shown that the sign of therestatement is important (Callen et al., 2002) and as the magnitudes of positiveand negative restatements are different, we include a dummy variable that allowsfor the effect on returns of positive and negative restatements. We includeanother dummy variable to test if restatements in our two different periods ofGAAP affect returns differently. We estimate separate regressions for each reasonto examine the differential market perception of the various restatement reasons.
P ie X i
( ) ( )( )
=+ −
1
1 β
12 K. Ahmed, J. Goodwin/Accounting and Finance 47 (2007) 1–22
© The AuthorsJournal compilation © 2006 AFAANZ
The model is:
Rit = α0 + β1Eit + β2∆Eit + β3RESit + β4SIGNit + β5PRE74it + eit, (2)
where Rit is 12 month raw return adjusted for dividends and capitalizationchanges for firm i for period t, measured to the end of the fourth month afterthe end of year t; Eit is reported earnings for firm i for year t scaled by marketvalue of equity at t – 1; ∆Eit is change in earnings for firm i for year t scaled bymarket value of equity at t – 1; RESit is earnings for firm i for year t – 1 dis-closed in year t comparatives less earnings for firm i for year t – 1 disclosed inyear t – 1 scaled by market value of equity at t – 1; SIGNit is dummy variablethat takes the value of 1 if the sign of the earnings restatement for firm i foryear t is positive and zero otherwise; PRE74it is a dummy variable that takes thevalue of 1 if the earnings restatement for firm i for year t occurs during thepre-1974 period and zero otherwise; and eit is the error term.
Following recent research, we also measure value relevance by the associationwith non-market values (see Finger, 1994; Aboody et al., 1999). Model 3 isestimated to assess whether restatement information is incrementally valuerelevant to control variables in explaining future earnings changes. We adaptthe model used by Aboody et al. (1999) in their study of asset revaluations:
∆Eit+n = α0 + β1RESit + β2∆Eit + β3MBit + β4SIZEit + β5SIGNit + β6PRE74it + eit, (3)
where ∆Eit+n is change in earnings adjusted for extraordinary items for firm i foryear t + n scaled by market value of equity at t – 1; MBit is market-to-book ratiofor firm i at the end of year t; SIZEit is logarithm of total assets for firm i at theend of year t, and other variables are as defined earlier.
5. Results
5.1. Firm characteristics
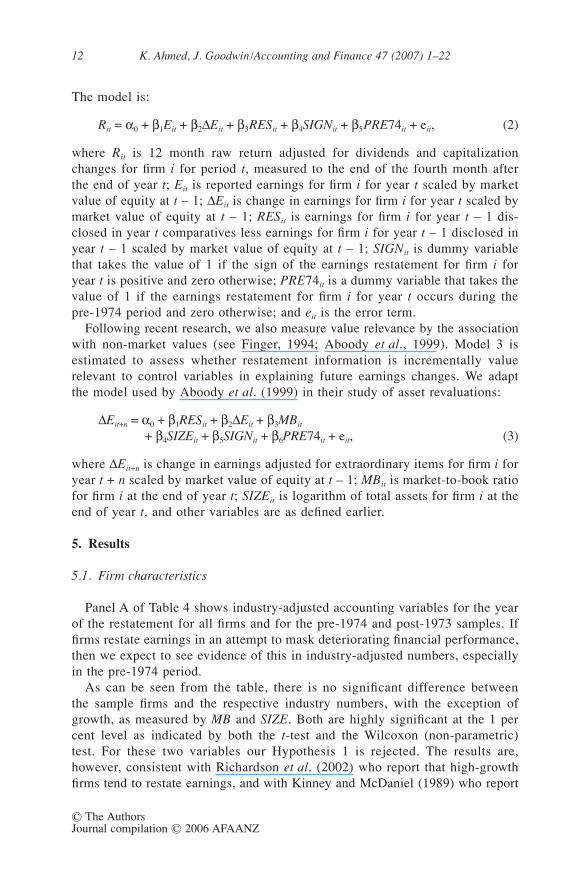
Panel A of Table 4 shows industry-adjusted accounting variables for the yearof the restatement for all firms and for the pre-1974 and post-1973 samples. Iffirms restate earnings in an attempt to mask deteriorating financial performance,then we expect to see evidence of this in industry-adjusted numbers, especiallyin the pre-1974 period.
As can be seen from the table, there is no significant difference betweenthe sample firms and the respective industry numbers, with the exception ofgrowth, as measured by MB and SIZE. Both are highly significant at the 1 percent level as indicated by both the t-test and the Wilcoxon (non-parametric)test. For these two variables our Hypothesis 1 is rejected. The results are,however, consistent with Richardson et al. (2002) who report that high-growthfirms tend to restate earnings, and with Kinney and McDaniel (1989) who report
K. Ahmed, J. Goodwin/Accounting and Finance 47 (2007) 1–22 13
© The AuthorsJournal compilation © 2006 AFAANZ
that small firms tend to restate earnings. We find mixed evidence for WC, withthe t-test indicating insignificance (p = 0.251) and the Wilcoxon test indicatingthat restating firms have a lower working capital ratio than the industry average(p = 0.001). This inconsistency is a result of 2 firms with large ratios, becausethe t-test is very sensitive to outliers. Deletion of these 2 observations gives ap-value of 0.040 for the t-test, and the same inference as for the Wilcoxon test.Growth firms and small firms also restated earnings during both periods (i.e.pre-1974 period when GAAP permitted greater managerial discretion and thepost-1973 period when managerial discretion was more restricted). After 1973,less liquid (WC) and more profitable (ROA) firms restated earnings.
Table 4Industry adjusted accounting variables for the restatement year
Panel A: For all firms and for pre-1974 and post-1973
Means difference
p-valuesMeans difference
p-valuesMeans difference
p-values
t-test Wilcoxon t-test Wilcoxon t-test Wilcoxon
Variable All (N = 195) Pre-1974 (N = 78)a Post-1973 (N = 117)a
MB 0.288 0.001 0.001 0.437 0.002 0.001 0.195 0.004 0.001WC −0.368 0.251 0.001 0.658 0.179 0.259 −1.063 0.011 0.001ROA 0.029 0.122 0.430 −0.017 0.180 0.125 0.061 0.048 0.027LEV −0.320 0.143 0.624 0.015 0.588 0.608 −0.540 0.135 0.363SIZE −0.504 0.001 0.001 −0.675 0.001 0.001 −0.389 0.001 0.001
Panel B: By reason for restatement
Means difference
p-valuesMeans difference
p-valuesMeans difference
p-values
t-test Wilcoxon t-test Wilcoxon t-test Wilcoxon
Variable Accounting policy (N = 96)a Revisions (N = 78)a Errors and unknown (N = 21)
MB 0.256 0.001 0.001 0.387 0.001 0.001 0.079 0.510 0.575WC −1.070 0.003 0.001 0.756 0.164 0.323 −1.386 0.321 0.765ROA 0.072 0.055 0.019 −0.009 0.324 0.587 −0.019 0.607 0.192LEV −0.414 0.269 0.483 −0.268 0.361 0.549 −0.078 0.353 0.391SIZE − 0.375 0.001 0.001 −0.654 0.001 0.001 −0.528 0.001 0.001
MB is the market value of equity divided by the book value of equity at the end of the financial year;WC is the ratio of current assets to current liabilities at the end of the financial year; ROA is earningsexcluding extraordinary items divided by average total assets for the financial year; LEV is the ratio oftotal liabilities to total assets at the end of the financial year; SIZE is the logarithm of the book valueof total assets at the end of the financial year. Means difference is the mean value for the accountingvariable at the end of the year less the mean value for that variable for that firm’s industry at the endof that year. aNumber might vary depending on the availability of data for each variable.
14 K. Ahmed, J. Goodwin/Accounting and Finance 47 (2007) 1–22
© The AuthorsJournal compilation © 2006 AFAANZ
Panel B of Table 4 presents a similar analysis as for Panel A except Panel Bpartitions by the reason for the restatement. The market-to-book ratio for firmsrestating for the accounting policy reason is higher than the industry average(p = 0.001). These firms have a lower working capital ratio (p = 0.003), aremore profitable (p = 0.055) and are smaller than their industry counterparts(p = 0.001). Firms that restate because of the revisions reason have a higher marketto book ratio (p = 0.001), reflecting higher growth opportunities than theirindustry peers. Richardson et al. (2002) also find US firms that restate becauseof accounting irregularities have higher growth. These firms are smaller thantheir industry counterparts (p = 0.001). There are no significant differences forfirms that restate for the errors and unknown reason, except for size, whererestating firms are smaller (p = 0.001). The Wilcoxon test gives consistent resultsfor each test for all three partitions.
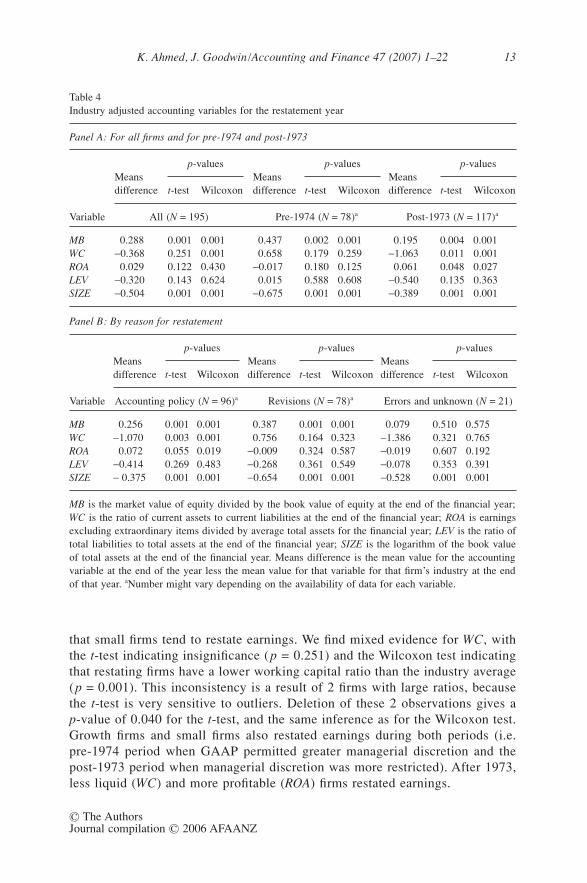
Our multivariate logit model results reported in Table 5 also show that thereis a significant probability (p = 0.001) that a high-growth firm will restate itsearnings after controlling for liquidity, profitability, leverage and firm size forall sample firms and in both the pre-1974 and post-1973 periods. However, themodel shows that smaller firms have a significantly higher probability to restateearnings for the full sample (p = 0.008) and for the post-1973 period only(p = 0.009). Other variables are insignificant for the full sample and the twosubperiods. This suggests that the effects captured by WC and ROA, which wereobserved to be significant in the univariate tests for the post-1973 period, aresubsumed by market to book and size. The market-to-book ratio and size might
Table 5Logit regression estimates for earnings restatements for all firms and for pre-1974 and post-1973 periods
Independent variable
All firms Pre-1974 Post-1973
Coefficient p-value Coefficient p-value Coefficient p-value
Constant 2.115 0.057 1.189 0.433 11.752 0.001MB 1.088 0.001 1.007 0.003 1.860 0.001WC −0.017 0.636 −0.096 0.122 0.048 0.398ROA 1.248 0.106 1.235 0.141 1.706 0.645LEV −0.171 0.396 −0.355 0.618 2.480 0.058SIZE −0.396 0.008 −0.207 0.308 −2.204 0.009Cox-Snell R2 8.7% 9.2% 22.9%−2 Log likelihood ratio 489.712 291.532 171.204Prediction accuracy 64.6% 62.4% 71.7%
Dependent variable = 1 if the firm restates its comparatives and zero otherwise; MB is the market valueof equity divided by the book value of equity at the end of the financial year; WC is the ratio of currentassets to current liabilities at the end of the financial year; ROA is earnings excluding extraordinaryitems divided by average total assets for the financial year; LEV is the ratio of total liabilities to totalassets at the end of the financial year; SIZE is the logarithm of the book value of total assets at the endof the financial year.
K. Ahmed, J. Goodwin/Accounting and Finance 47 (2007) 1–22 15
© The AuthorsJournal compilation © 2006 AFAANZ
be capturing firm-specific risk, as Fama and French (1992) state. The model issignificant for the full sample and in both periods; however, the R2 is quite modestat approximately 9 per cent for the full sample and for the pre-1974 period. Itis approximately 23 per cent for the post-1973 period. This suggests that other,omitted variables might explain the restatement decision, especially in thepre-1974 period. The prediction accuracy ranges from approximately 62 per centfor the pre-1974 period to approximately 72 per cent for the post-1973 period.
5.2. Value relevance
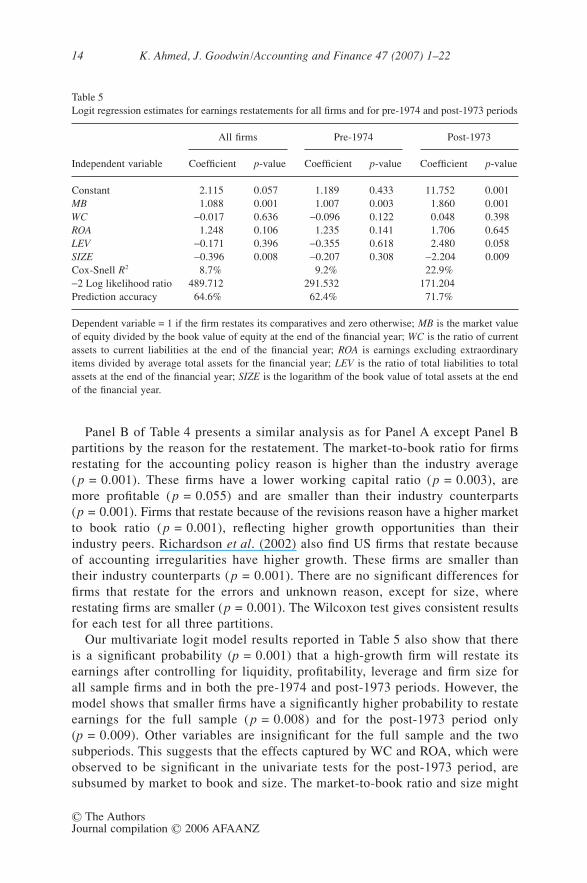
Table 6 presents descriptive statistics for the metric regression variablesfor each value relevance model. For Model 2 variables, the mean of the sharereturns is 15 per cent over the sample period with a standard deviation of 0.43.The mean of earnings is approximately 9 per cent of the market value of equityat the start of period and the average change in earnings approximately 8 per centof the market value of equity at that time. The average restatement amount isapproximately 1 per cent of the market value of equity, with a minimum of−45 per cent and a maximum of 35 per cent. It is evident that some restatementsare very large. For Model 3 variables, the change in 1 (2) year ahead earnings
Table 6Descriptive statistics for ordinary least squares regression variables
Mean Standard deviation Minimum Maximum N
Model 2Rit 0.15 0.43 −0.63 1.98 173Eit 0.09 0.22 −1.67 1.07 173∆Eit 0.08 0.86 −1.33 11.16 173RESit −0.01 0.05 −0.45 0.35 173
Model 3∆Eit+2 0.02 0.14 −1.05 0.37 173∆Eit+1 0.04 0.15 −0.70 0.91 173RESit −0.01 0.06 −0.45 0.35 173∆Eit 0.06 0.86 −1.43 11.16 173MBit 1.11 0.87 −0.83 7.06 173SIZEit 7.79 0.90 6.11 10.37 173
Model 2: Rit is the 12 month raw return adjusted for dividends and capitalization changes for firm i forperiod t, measured to the end of the fourth month after the end of year t; Eit is reported earningsfor firm i for year t scaled by market value of equity at t – 1; ∆Eit is the change in earnings for firm i foryear t scaled by market value of equity at t – 1; RESit is the earnings restatement for firm i for year tscaled by market value of equity at t – 1; SIGNit is a dummy variable that takes the value of 1 if thesign of the earnings restatement is positive and zero otherwise; PRE74it is a dummy variable that takesthe value of 1 if the earnings restatement occurs during the pre-1974 period and zero otherwise.Model 3: ∆Eit+n is the change in earnings adjusted for extraordinary items for firm i for year t + n scaledby market value of equity at the start of year t, MBit is the market-to-book ratio for firm i at the end ofyear t; SIZEit is the logarithm of total assets for firm i at the end of year t.
16 K. Ahmed, J. Goodwin/Accounting and Finance 47 (2007) 1–22
© The AuthorsJournal compilation © 2006 AFAANZ
is 4 (2) per cent of the market value of equity and MB is 1.11. The RES and ∆Evariables are not identical across the models because of different samples.
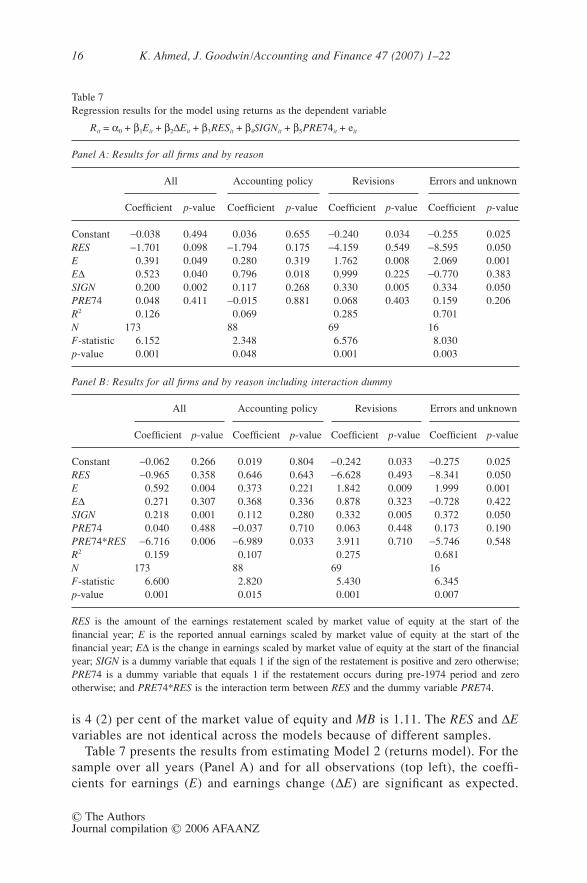
Table 7 presents the results from estimating Model 2 (returns model). For thesample over all years (Panel A) and for all observations (top left), the coeffi-cients for earnings (E) and earnings change (∆E) are significant as expected.
Table 7Regression results for the model using returns as the dependent variable
Rit = α0 + β1Eit + β2∆Eit + β3RESit + β4SIGNit + β5PRE74it + eit
Panel A: Results for all firms and by reason
All Accounting policy Revisions Errors and unknown
Coefficient p-value Coefficient p-value Coefficient p-value Coefficient p-value
Constant −0.038 0.494 0.036 0.655 −0.240 0.034 −0.255 0.025RES −1.701 0.098 −1.794 0.175 −4.159 0.549 −8.595 0.050E 0.391 0.049 0.280 0.319 1.762 0.008 2.069 0.001E∆ 0.523 0.040 0.796 0.018 0.999 0.225 −0.770 0.383SIGN 0.200 0.002 0.117 0.268 0.330 0.005 0.334 0.050PRE74 0.048 0.411 −0.015 0.881 0.068 0.403 0.159 0.206R2 0.126 0.069 0.285 0.701N 173 88 69 16F-statistic 6.152 2.348 6.576 8.030p-value 0.001 0.048 0.001 0.003
Panel B: Results for all firms and by reason including interaction dummy
All Accounting policy Revisions Errors and unknown
Coefficient p-value Coefficient p-value Coefficient p-value Coefficient p-value
Constant −0.062 0.266 0.019 0.804 −0.242 0.033 −0.275 0.025RES −0.965 0.358 0.646 0.643 −6.628 0.493 −8.341 0.050E 0.592 0.004 0.373 0.221 1.842 0.009 1.999 0.001E∆ 0.271 0.307 0.368 0.336 0.878 0.323 −0.728 0.422SIGN 0.218 0.001 0.112 0.280 0.332 0.005 0.372 0.050PRE74 0.040 0.488 −0.037 0.710 0.063 0.448 0.173 0.190PRE74*RES −6.716 0.006 −6.989 0.033 3.911 0.710 −5.746 0.548R2 0.159 0.107 0.275 0.681N 173 88 69 16F-statistic 6.600 2.820 5.430 6.345p-value 0.001 0.015 0.001 0.007
RES is the amount of the earnings restatement scaled by market value of equity at the start of thefinancial year; E is the reported annual earnings scaled by market value of equity at the start of thefinancial year; E∆ is the change in earnings scaled by market value of equity at the start of the financialyear; SIGN is a dummy variable that equals 1 if the sign of the restatement is positive and zero otherwise;PRE74 is a dummy variable that equals 1 if the restatement occurs during pre-1974 period and zerootherwise; and PRE74*RES is the interaction term between RES and the dummy variable PRE74.
K. Ahmed, J. Goodwin/Accounting and Finance 47 (2007) 1–22 17
© The AuthorsJournal compilation © 2006 AFAANZ
The RES coefficient is negative but is significant only at the 10 per cent level(coefficient = −1.701, p = 0.098). Therefore, we cannot reject Hypothesis 2a.The dummy variable (SIGN) representing the restatement sign has a significantand positive coefficient, indicating that the market treats positive restatements(good news) differently to negative restatements (bad news). The dummy vari-able (PRE74), representing the period before 1974 when managers had morediscretion on the accounting for earnings restatements, is not significant. Themodel explains approximately 13 per cent of the variation in returns.
Separating the sample into three groups by restatement reason reveals thatall coefficients on RES are negative but only the errors and unknown categoryis significant at the 5 per cent level (see Panel A). Therefore, we cannot rejectHypotheses 2b and 2c and we reject Hypothesis 2d. This result is consistentwith previous US studies that market participants treat restatements due to errorsand unknown negatively. The coefficients on the SIGN dummy variable aresignificant at the 1 per cent and 5 per cent levels, respectively, for the revisionsand the errors and unknown regressions. These results support the findings reportedfor the full sample that the market treats positive earnings restatements positively.Again, PRE74 is insignificant. Overall, there is evidence that restatements arevalue relevant for the errors and unknown sample.
The above analysis does not show whether there has been a systematic vari-ation in RES across the two periods (before 1974 and after 1973). To test this,we incorporate an interaction term (PRE74*RES). The results presented inPanel B of Table 7 indicate that the association between RES and returns isnegative and significantly affected by PRE74 (coefficient = −6.716, p = 0.006).This suggests that the market downgrades RES more during the pre-1974 periodwhen GAAP allowed the most managerial discretion. Separating the sample byreason shows that the PRE74*RES coefficient for the accounting policy sampleis negative and significant (coefficient = −6.989, p = 0.033). The coefficient forRES for the errors and unknown sample is significant irrespective of the period,because PRE74*RES is not significant for this sample as shown in Panel B(p = 0.548). Regarding the control variables, earnings level, earnings changeand the dummy variable SIGN, generally have positive signs as expected.However, our results for errors and unknown should be interpreted with cautionbecause of a small sample size. Including the interactive variable did not changeinferences for the revisions sample.
Because the histogram of independent variables showed that the data haveextreme values and we winsorized outliers, we repeated the foregoing ordinaryleast squares analyses using rank regression. Lang and Lundholm (1993) sug-gest the use of rank regression as a powerful alternative estimation model forcoping with datasets with skewed distribution and when there is potential fornonlinear and non-monotonic relations between the dependent and independentvariables. The results (unreported) reveal that RES is negative and significantat the 5 per cent level (coefficient = −0.268, p = 0.031) for all firm-year obser-vations and other control variables are generally consistent with our results
18 K. Ahmed, J. Goodwin/Accounting and Finance 47 (2007) 1–22
© The AuthorsJournal compilation © 2006 AFAANZ
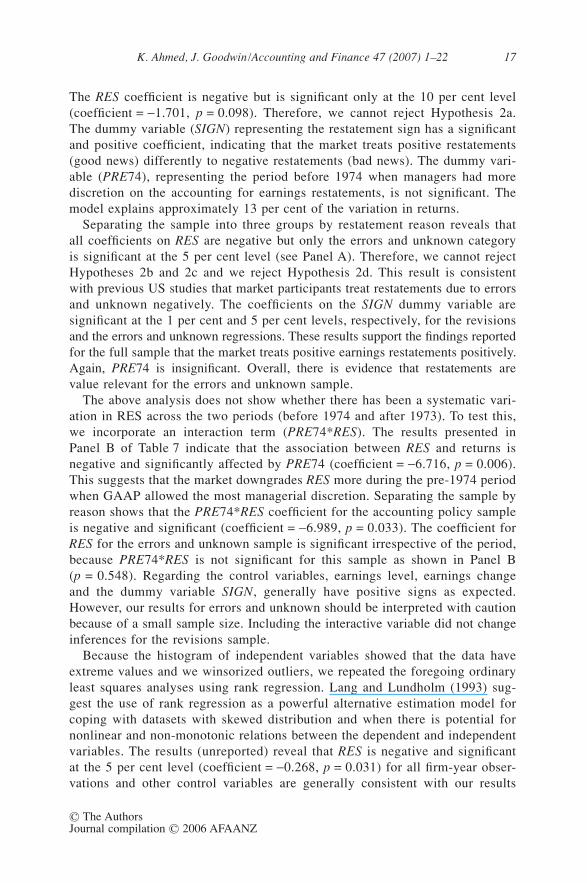
reported in Table 7. To add robustness to the results, Models 2 and 3 are alsoestimated using rank regression. For both models the results (unreported) arequalitatively similar to the ordinary least squares regressions results. Table 8reports results from estimating Model 3 using 1 year and 2 year ahead earnings
Table 8Regression results for the model using future earnings change as the dependent variable
∆Eit+n = α0 + β1RESit + β2∆Eit + β3MBit + β4SIZEit + β5SIGNit + β6PRE74it + eit
Panel B: Two year ahead earnings change
Panel A: One year ahead earnings change
All Accounting policy Revisions Errors and unknown
Coefficient p-value Coefficient p-value Coefficient p-value Coefficient p-value
Constant 0.174 0.127 −0.044 0.786 0.293 0.002 0.072 0.447RES −0.709 0.006 −1.012 0.001 −2.400 0.008 0.735 0.050E∆ 0.014 0.271 0.005 0.722 −0.119 0.235 0.346 0.001MB 0.031 0.050 −0.021 0.477 0.014 0.244 −0.086 0.476SIZE −0.024 0.247 0.008 0.700 −0.033 0.003 −0.004 0.989SIGN 0.031 0.204 0.038 0.310 0.011 0.621 0.071 0.326PRE74 −0.037 0.158 −0.001 0.980 0.044 0.038 −0.011 0.881R2 0.081 0.120 0.630 0.878N 173 88 69 16F-statistic 3.623 3.061 20.855 20.227p-value 0.002 0.009 0.001 0.001
All Accounting policy Revisions Errors and unknown
Coefficient p-value Coefficient p-value Coefficient p-value Coefficient p-value
Constant 0.019 0.255 0.144 0.269 0.268 0.044 −0.141 0.769RES −0.699 0.003 0.041 0.879 0.568 0.658 −1.775 0.001E∆ −0.052 0.001 −0.028 0.020 −0.117 0.420 −0.461 0.001MB −0.027 0.058 −0.020 0.371 −0.016 0.376 −0.016 0.507SIZE −0.007 0.614 −0.010 0.532 −0.022 0.173 0.026 0.663SIGN −0.019 0.400 −0.017 −0.579 −0.061 0.050 0.050 0.663PRE74 −0.014 0.554 −0.025 0.439 −0.055 0.075 −0.010 0.937R2 0.121 0.039 0.041 0.837N 173 88 69 16F-statistic 4.986 1.589 1.495 13.733p-value 0.001 0.161 0.194 0.001
RES is the amount of the earnings restatement scaled by market value of equity at the start of thefinancial year; E∆ is the change in earnings scaled by market value of equity at the start of the financialyear; MB is the market-to-book ratio at the end of the financial year; SIZE is the logarithm of totalassets at the end of the financial year; SIGN is a dummy variable that equals 1 if the sign of therestatement is positive and zero otherwise; and PRE74 is a dummy variable that takes the value of 1 ifthe restatement occurs during pre-1974 period, otherwise zero.
K. Ahmed, J. Goodwin/Accounting and Finance 47 (2007) 1–22 19
© The AuthorsJournal compilation © 2006 AFAANZ
change adjusted for extraordinary items as the dependent variable. Panel A showsresults for 1 year ahead earnings change. The restatement coefficients (RES) arenegative and significant at the 1 per cent level for the full sample and for thesamples by reason, except for the errors and unknown sample whose coefficientis positive and significant at the 5 per cent level. Therefore, Hypotheses 3a–dare rejected in these instances. As noted above, the small sample size mighthave affected the results for errors and unknown (n = 16). Results for the otherpartitions suggest that larger values for the restatement variable are associatedwith lower earnings changes.6 Furthermore, the PRE74 result suggests that thetime period does not significantly impact the negative relationship between futureperformance and restatement of earnings, with the exception of the revisionssample. The coefficient for the revisions sample is positive and significant at the5 per cent level. SIGN controls for positive versus negative restatements, whichis positive and insignificant in all instances. Because income increasing versusincome decreasing is an interesting issue in restatement research (Callen et al.,2002; Richardson et al., 2002), we examine the incremental effect of positiverestatements on future earnings by incorporating RES*SIGN in the regressionmodel and estimate the coefficient on this variable. We find (unreported) thatRES*SIGN is significantly positive (coefficient = 1.861, p = 0.001), and RES issignificantly negative (coefficient = −1.272, p = 0.001) for the full sample,which suggests that positive restatements have a significantly positive impacton the association between earnings restatement and future performance.7
Panel B of Table 8 shows results for 2 year ahead earnings change as thedependent variable. Consistent with the 1 year ahead results, the RES variable issignificantly negatively associated with future earnings for all firms. This relation isprimarily because of the errors and unknown sample. As for the 1 year ahead resultsHypotheses 3a and 3d are rejected. However, in this case, Hypotheses 3b and 3ccannot be rejected. In contrast to Panel A, E∆ is negatively associated with futureearnings and the coefficient signs have changed, in particular the coefficient forSIGN. We use RES*SIGN in the model and find that its coefficient is not significant,suggesting that the impact of positive restatements declined once we increasedthe time horizon from 1 year to 2 years ahead. Our rank regression models(unreported) have not changed the results as we find RES is negative; hence, weconclude that the results presented in Panels A and B are robust to model selection.
6. Conclusion
Using a unique dataset covering a period of 3 decades, this paper documentsearnings restatements and examines characteristics of restating firms and the
6 We also estimated the model replacing the dummy variable with yearly dummies for thetwo reasons other than errors and unknown and results are qualitatively similar.7 Detailed results are available from the authors.
20 K. Ahmed, J. Goodwin/Accounting and Finance 47 (2007) 1–22
© The AuthorsJournal compilation © 2006 AFAANZ
value relevance of earnings restatements. Previous US research uses data froma set of GAAP that permit restatements under specific conditions. We studyrestatements under GAAP that permit then prohibit restatements.
Results from univariate tests and a multivariate logit model show that restat-ing firms are smaller and have higher growth opportunities than their industrycounterparts, consistent with some US research. Our univariate test resultsshow that the working capital ratio and return on assets are lower (higher) thanthe industry average in the post-1973 period, a finding not supported by themultivariate test. This suggests that the information captured by the workingcapital and the return on assets ratios is subsumed by market to book and size.
We find evidence that earnings restatements are negatively associated withreturns and future earnings changes. This finding is consistent with previousUS research that examines earnings restatements only due to errors and GAAPviolations. Examining the sample by the extent of reporting discretion onrestatements (before 1974 and after 1973) reveals that restatements are morevalue relevant in the pre-1974 period across our two value relevance models;that is, in the period when restatements were permitted.
Our models test long-window associations with market value and future earningsand do not speak to the information content of restatements. Unfortunately, datalimitations preclude an event study design. As a result the tests might not besufficiently powerful to consistently detect the information contained in restate-ments. This could explain some of the inconsistencies we report. Nevertheless,most of the models show consistent results across the various partitions. Ouroverall conclusion is not inconsistent with previous US research and extendsresearch by considering restatements caused by accounting policy changes,adoption of standards and revisions in estimates.
We did not observe any earnings restatements after 1993, which is not con-sistent with the USA where restatements because of errors are increasing inrecent years. The lack of restatements after 1993 indicate that managers of top500 firms in Australia might have become more careful in releasing annualfinancial statements to retain investors’ confidence or they might have resortedto other less visible means of manipulation, such as accruals. Recent Australianresearch finds evidence of earnings management via discretionary accruals(Holland and Ramsay, 2003). Another possible reason is that we examine thetop 500 firms and US studies use broader datasets with some finding thatrestatements are more prevalent in small firms (Kinney and McDaniel, 1989).
There are a number of possibilities for future research. For instance, onemight examine restating firms from an agency theory perspective, perhapsarguing that the behaviour of restating firms is efficient. Another possibilityis to examine earnings management of restating firms in the pre-1974 period.The post-1973 period comprises breaches of GAAP by firms that did not receivequalified audit opinions and whose accounting perhaps went unnoticed by reg-ulatory authorities. The implication is that in recent times, accounting qualitymight have improved for the top 500 firms. Future research might examine this
K. Ahmed, J. Goodwin/Accounting and Finance 47 (2007) 1–22 21
© The AuthorsJournal compilation © 2006 AFAANZ
contention. Finally, the value relevance results support the earnings restatementinformation required for certain prior period adjustments under Australianequivalents to International Financial Reporting Standards (A-IFRS). Althoughthe new A-IFRS rule is mandatory and our dataset examines non-mandatoryinformation, the results can be viewed as early evidence supporting this rule inA-IFRS. Future research might examine restatements under A-IFRS.
References
Aboody, D., M. E. Barth, and R. Kasznik, 1999, Revaluations of fixed assets and futurefirm performance: evidence from the UK, Journal of Accounting and Economics 26,149–178.
Australian Accounting Standards Board, 2001, Australian Accounting Standard, AASB 101:Presentation of Financial Statements, July (Australian Accounting Standards Board,Melbourne, Vic.).
Barth, M. E., J. A. Elliott, and M. W. Finn, 1999, Market rewards associated with patternsof increasing earnings, Journal of Accounting Research 37, 387–413.
Buffini, F., 2002, Chairmen Heed ASIC’s Wake-up Call, Australian Financial Review, Sep-tember 25 (John Fairfax Group, Sydney).
Callen, J. L., J. Livnat, and D. Segal, 2002, Accounting Restatements: Are They Always BadNews? working paper (University of Toronto, Toronto, ON).
Dechow, P., R. Sloan, and A. Sweeney, 1996, Causes and consequences of earningsmanipulation, an analysis of firms subject to enforcement actions by the SEC, Contem-porary Accounting Research 13, 1–36.
Defond, M. L., and J. Jiambalvo, 1991, Incidence and circumstances of accounting errors,Accounting Review 66, 643–655.
Fama, E. F., and K. R. French, 1992, The cross-section of expected stock returns, Journalof Finance 47, 427–466.
Feroz, E. H., K. Park, and V. S. Pastena, 1991, The financial and market effects of theSEC’s accounting and auditing enforcement releases, Journal of Accounting Research 29,107–142.
Finger, C., 1994, The ability of earnings to predict future earnings and cash flow, Journalof Accounting Research 32, 210–223.
Finger, C., B. Lev, and A. K. Rose, 1999, The Contextual Role of Financial Reports,working paper (Portland State University, Portland, OR).
Gonen, I., 2003, Intra-Industry Effects of Corrective Disclosures: Is Mistrust Contagious?Working paper (New York University, New York).
Healy, P. M., and J. M. Wahlen, 1999, A review of the earnings management literature andits implications for standard setting, Accounting Horizons 13, 365–383.
Hirschey, M., Z.-V. Palmrose, and S. Scholz, 2003, Long-Term Market Underreaction toAccounting Restatements, working paper (University of Kansas, Lawrence, KS).
Holland, D., and A. Ramsay, 2003, Do Australian companies manage earnings to meetsimple earnings benchmarks? Accounting and Finance 43, 41–62.
Kinney, W. R. Jr., and L. S. McDaniel, 1989, Characteristics of firms correcting previouslyreported quarterly earnings, Journal of Accounting and Economics 11, 71–93.
Kothari, S. P., T. E. Laguerre, and A. J. Leone, 2002, Capitalization versus expensing:evidence on the uncertainty of future earnings from capital expenditure versus R&Doutlays, Review of Accounting Studies 7, 355–382.
Lang, M., and R. J. Lundholm, 1993, Cross-sectional determinants of analysts ratings ofcorporate disclosures, Journal of Accounting Research 31, 246–271.
22 K. Ahmed, J. Goodwin/Accounting and Finance 47 (2007) 1–22
© The AuthorsJournal compilation © 2006 AFAANZ
Lev, B., S. Radhakrishnan, and C. Seethamraju, 1998, FDA Drug Approvals and the Formationof Investors’ Beliefs, working paper (New York University, New York).
Lev, B., and P. Zarowin, 1999, The boundaries of financial reporting and how to extendthem, Journal of Accounting and Research 37, 353–385.
Levitt, A., 2000, Testimony Concerning Commission’s Auditor Independence ProposalBefore the Senate Sub-Committee on Securities Committee on Banking, Housing, andUrban Affairs, September 28 [online]. Available: http//sec.gov/news/testimony/ts152000.htm
Lundholm, R. J., 1999, Reporting on the past: a new approach to improving accountingtoday, Accounting Horizons 13, 315–322.
Owers, J. E., C.-M. Lin, and R. C. Rogers, 2002, The informational content and valuationramifications of earnings restatements, International Business and Economics ResearchJournal 1, 71–84.
Palmrose, Z.-V., V. J. Richardson, and S. Scholz, 2004, Determinants of market reactionsto restatement announcements, Journal of Accounting and Economics 37, 59–89.
Palmrose, Z.-V., and S. Scholz, 2004, The circumstances and legal consequences of non-GAAP reporting: evidence from restatements, Contemporary Accounting Research 21,139–180.
Petroni, K., S. J. Ryan, and J. M. Wahlen, 2000, Discretionary and non-discretionary revi-sions of loss reserves by property-casualty insurers: differential implications for futureprofitability, risk and market value, Review of Accounting Studies 5, 95–125.
Richardson, S., I. Tuna, and M. Wu, 2002, Predicting Earnings Management: The Case ofEarnings Restatements, working paper (University of Pennsylvania, Philadelphia, PA).
Schipper, K., 1989, Commentary on earnings management, Accounting Horizons 3, 91–102.
Turner, L., J. R. Dietrich, and A. D. Bailey, 2001, Accounting Restatements, working paper(University of Illinois, Chicago, IL).
Wallace, W., 2000, The value relevance of accounting: the rest of the story, EuropeanManagement Journal 18, 675–682.
Wu, M., 2002, Earnings Restatements: A Capital Market Perspective, working paper(New York University, New York).