An empirical analysis of the Capital structure of New Zealand Firms
18
An empirical analysis of the Capital structure of New Zealand Firms Ed Vos and Robert Ochoki Nyamori Department of Finance School of Management Studies University of Waikato Private Bag 3105 Hamilton, New Zealand Email [email protected] An Empirical Analysis of the Capital Structure of New Zealand Firms, E Vos and Robert Nyamori, Small Enterprise Research, Vol 5 No 2, 1997, pp29-38.
Transcript of An empirical analysis of the Capital structure of New Zealand Firms

An empirical analysis of the Capital structure of New Zealand
Firms
Ed Vos
and
Robert Ochoki Nyamori
Department of Finance
School of Management Studies
University of Waikato
Private Bag 3105
Hamilton, New Zealand
Email [email protected]
An Empirical Analysis of the Capital Structure of New Zealand Firms, E Vos and Robert Nyamori, Small Enterprise Research, Vol 5 No 2, 1997, pp29-38.

2
An empirical analysis of the Capital structure of New Zealand
Firms
ABSTRACT
While the existence of a difference in capital structure between small and large firms has become
acknowledged, a plethora of explanations have been advanced to explain this difference. We conducted
a mail survey in New Zealand in all sectors to examine these theories. Information on firm
characteristics, the sources of initial and additional finance, the sources of debt currently used and the
ones available and the reasons for accessing these sources was obtained. We find that it is difficult to
offer a single explanation for observed differences in capital structure in New Zealand. Instead, we find
that phenomena that would indicate a finance gap also implying a pecking order framework, control
theory and stages of growth theory, among others. We suggest that efforts towards examining the
financial decision making processes of the small firm may shed more light on this issue.
3
1. Background
Numerous studies have examined the differences in capital structure between small
and large firms (see for example Chittenden (1996); Chu (1996); Reid (1996);
Cowling and Sugden (1995); Chaganti (1995); Holmes and Kent (1990, 91); Ministry
of Commerce (1993, 96); Renfrew (1982)). What is apparent from these studies is that
there are differences in the capital structures of small and large firms. However, there
is little consensus as to the causes of these disparities for a number of explanations
have been advanced.
Some studies of capital structure of New Zealand firms seem to suggest a finance gap
explanation (Coopers and Lybrand (1993)) while more recent evidence points at the
lack of growth ambition (Austin, Fox and Hamilton (1996)). We present evidence
from New Zealand to try and examine some of these explanations. In particular we
have paid attention to how the results are supportive of various explanations of capital
structure of small firms. We suggest, just like Holmes and Kent (1990) that a study of
the financing decisions of the owner managers may provide an avenue for resolving
this impasse.
The paper reports the results of a New Zealand nation-wide survey of businesses from
all sectors. The aim of this research was to study the financial structure of business to
see whether there is a difference between large and small firms. Section two of this
paper provides a review of related literature and develops the questions to be
answered. Section three reports the method while section four provides an analysis of
the results.
2. A Review of Related Literature
The Capital structure of firms
The search for an optimal capital structure of the firm has engaged the minds of
finance academics for a long time. A landmark in this search is the Modigliani and
Miller (1958) study which holds that if taxes and the firms future investment plans are
4
held constant, the firm’s capital structure has no relevance to its value. Subsequent
attempts have relaxed the constraints of tax (Modigliani and Miller (1963)) and
bankruptcy costs (Warner (1977)) but as yet the determination of the optimal capital
structure is elusive (Myers (1984)). A more recent and forceful attempt has been made
by agency theorists who see the optimal capital structure as that point at which agency
costs are minimised and their benefit maximised (Jensen and Meckling (1976), Jensen
(1986)).
The capital structure of the small firm has presented another puzzle altogether. What
is apparent however is that there is a difference in capital structure between large and
small firms. A number of explanations have been advanced to explain these
differences. There are those who advance the view that firms are in a state of
progression from a seed-bed base to maturity. The implication on capital structure is
that each of these phases has different financial requirements and/or constraints.
Among these authors are Vos and Forlong (1997), Reid (1996), Chittenden et al.
(1996), Peterson and Shulman (1987) and Stanworth and Curran (1976).
Chu (1996) adds another dimension to this: the personal attributes of the managers.
They argue that because the needs of business vary over time, firms are not concerned
with an optimal capital structure per se (Chu (1996)). Instead, they are concerned with
a capital structure that meets their evolving financial needs and opportunities, what
they call a flexible capital structure. The capital decision is determined by manager’s
business judgement and risk profile and a concern for maximising the value of the
firm while minimising the cost of capital, given the multiplicity of sources of finance
available. A flexible capital structure takes care of uncertainty. (Also see Barton and
Mathews (1989).)
A popular explanation of the differences in capital structure is given by the finance
gap theory. The Bolton Report (1971), which popularised this view, argued that small
firms suffer from a finance gap. This gap results from the lack of access by small
businesses to appropriate sources of finance because they are more expensive for them
and also because they lack awareness of the various appropriate sources. Thus this gap
is seen as emanating from a cost gap and a knowledge gap. Put differently, the

5
financial structure of small businesses is constrained by their inability to access
appropriate sources of funds. They cannot therefore build an optimal capital structure
that fully exploits their potential and this in turn is bound to limit their contribution to
the overall economy.
It is apparent that there are some differences between the large and the small
businesses in terms of the cost of lending. What is not clear though is what causes this
differential. Some studies have argued that the costs of establishing and maintaining
smaller loans is higher than the larger ones (Johns, Dunlop and Sheehan, 1989,
Levenson 1962). Other studies attribute this to a premium on what is thought to be a
risky sector (Cowling and Sugden 1995, Binks and Ennew 1993, Keasy and Watson
1993). Holmes, Dunstan and Dweyer (1994) was an attempt to see whether this
difference indeed does exist and explain it. Theirs was a test of the hypothesis as to
whether small firms paid more on debt than the larger ones.
Cowling and Sugden (1995) argue that market power of banks is the cause of more
costly lending contracts to the smallest firms; that unlimited (or full) collateral reduces
the role of interest rates in the lending contract; and, that firm size is perceived by
banks to be a good proxy for riskiness. Put differently, the smaller the business the
riskier and therefore the higher the rate of interest charged. The basic argument is that
banks differentiate between firms on the basis of a number of observable
characteristics. It is these characteristics that determine the cost of lending and not
administrative costs as argued by Holmes, Dunstan and Dweyer (1994).
New Zealand Evidence
New Zealand has been characterised as a nation of small business because many of the
enterprises are small (Bollard (1988), and Devlin (1984). Small businesses are also
touted to make a significant contribution to capital accumulation and manufactured
exports (Devlin 1984) and act as a seedbed for innovation and technological
development. Thus the importance of small businesses in the economic development
of New Zealand need not be laboured.

6
Coopers and Lybrand (1993) found that the primary sources of financing for small
firms are founder and family with the banks constituting the dominant external
sources. They concluded that there was limited finance for prospective firms. A
significant weakness of the above study is its focus on the providers of finance to the
exclusion of those seeking the finance. Their conclusions on the sources of capital for
small firms are based on default. There is therefore need to investigate these findings
further by canvassing the views of those who seek finance, hence this study.
Austin, Fox and Hamilton (1996) extended the Coopers and Lybrand study by looking
at sources of capital available to small and medium firms. A major departure of this
study is that it surveyed 265 small businesses, the seekers of finance, unlike the
Coopers and Lybrand (19930 one. They were particularly concerned with three issues:
“to establish what factors are either inhibiting or contributing to the
availability of capital to prospective/start-up or existing small and
medium sized businesses for the purposes of growth and/or restructuring
to exploit opportunities in the market place; to determine whether the
financial markets are innovating at a rate consistent with optimally
meeting the financial needs of small and medium sized businesses. If not,
what factors are affecting the capability of the financial markets to
innovate; and finally, to determine the extent to which managerial
competencies within a firm affect the availability of capital” (p. 5).
Analysis of some of the evidence on finance for small firms in New Zealand suggests
that finance gap theory would explain most differences in the capital structures of
small and large businesses. However, Austin, Fox and Hamilton (1996) do not think
this is the cause. They think that it is the personal attributes of the owners: either
wanting to grow or not, that may explain differences in capital structure. We wish to
test some of the conclusions reached by Coopers and Lybrand (1993) and their
extensions in Austin, Fox and Hamilton (1996). We are encouraged to do so because
the conclusions reached in the earlier studies were not based on a survey of the
seekers but the providers of finance and advisory services.

7
5. Method of Study
An analysis of the above literature has suggested a number of testable propositions
based on a diverse range of theories that attempt to explain the capital structure of
small firms. Some of the propositions we wish to test are:
1. Large firms are more aware of the range of sources of funds available compared
to the small ones.
2. The primary sources of start-up funds for small firms is founder and family
funds. Where additional funds are required, they are obtained from the same
sources and retained earnings. The purpose of the additional funds is to purchase
operating assets for expansion.
3. The primary sources of external funds for the small firms are the banks (not
equity). Where small firms seek external funds, they go for short-term debt
because it least dilutes their control.
To test these hypotheses, we selected a sample of 400 firms from a list of 816 New
Zealand firms with over 100 employees. We obtained the questionnaire used in the
Holmes and Kent (1990, 1991) and, after some slight modifications, mailed it to the
selected sample. We canvassed information on firm characteristics as well as the
initial sources of start-up funds, sources of additional funds, reason for seeking
additional funds and the cost of additional funds. Of the 400 mailed 10 were dead
listings, 11 did not wish to participate in the study and 88 answered the questionnaire,
representing a response rate of about 23%. This was a reasonable response rate given
that prior studies have achieve rates of about 7 to10% (Holmes, Dunstan and Dweyer,
1994).
Of the respondents, 62.5% have been in operation for over 10 years, 9.09% for
between 6-10 years, 4.55% for between 3-5 years, slightly over one percent for 1-3
years and less 12 months. 20.24% did not answer the question. 3.41% of the
respondents had less 50 employees, 9.09% had 50-100, 64.77% had 100-500, 11.36%
had 500-1000, 10.23% had 1000-5000 and only 1.14% were over 5000. 14.77% were
in wholesale, 12.50% in retail, 19.32% in service, 45.45% in manufacturing and
17.05% in other sectors.

8
The initial sample consisted of firms with over 100 employees. However, 11
respondents had employees less 100. These were lumped with firms of employees less
500 because the number will not be representative of the proportion of firms in this
category. This was also to facilitate a more meaningful statistical analysis. The size of
the firms was divided into two categories based on the number of employees: those
with < 500 representing small firms and those with >500 representing the large ones.
This was found to represent a more “normal distribution” than classifications based on
turnover. Classifications on the basis of turnover were found to be highly skewed to
the right and therefore abandoned. Each size category was analysed against the
variables of source of start-up capital, source of additional funding, reason for
additional funding, the sources of debt currently being used and the sources of debt
currently available to the firm. A chi-square test of independence between the
variables was conducted to determine whether the differences between size and the
aforementioned variables was significant at the 95% and 99% confidence levels.
4. Analysis of Results
It is argued that because small firms have little knowledge as to the appropriate
sources of funds. Given that these funds are more expensive for small firms than the
larger ones, the initial source of start-up funds is owners equity, represented by
personal funds and those of friends and family. Coopers and Lybrand (1993) argue
this to be the case in New Zealand. To test this hypothesis, we canvassed answers as
to the sources of initial start-up funds. The results are presented in Table 1.
Personal funds of the owner constituted the source for most small businesses
(46.25%) followed by trading bank finance (35.29%) and other sources (19.12%).
However, there were no significant differences between the two groups in regard to
personal funds of the owner. This is contrary to the findings of Holmes and Kent
(1991), that personal funds constitute the primary source of funds for start-ups.
Perhaps, this may be explained by the stages of growth hypotheses that firms at
different stages access different sources of funds. In this respect then, the large firms
9
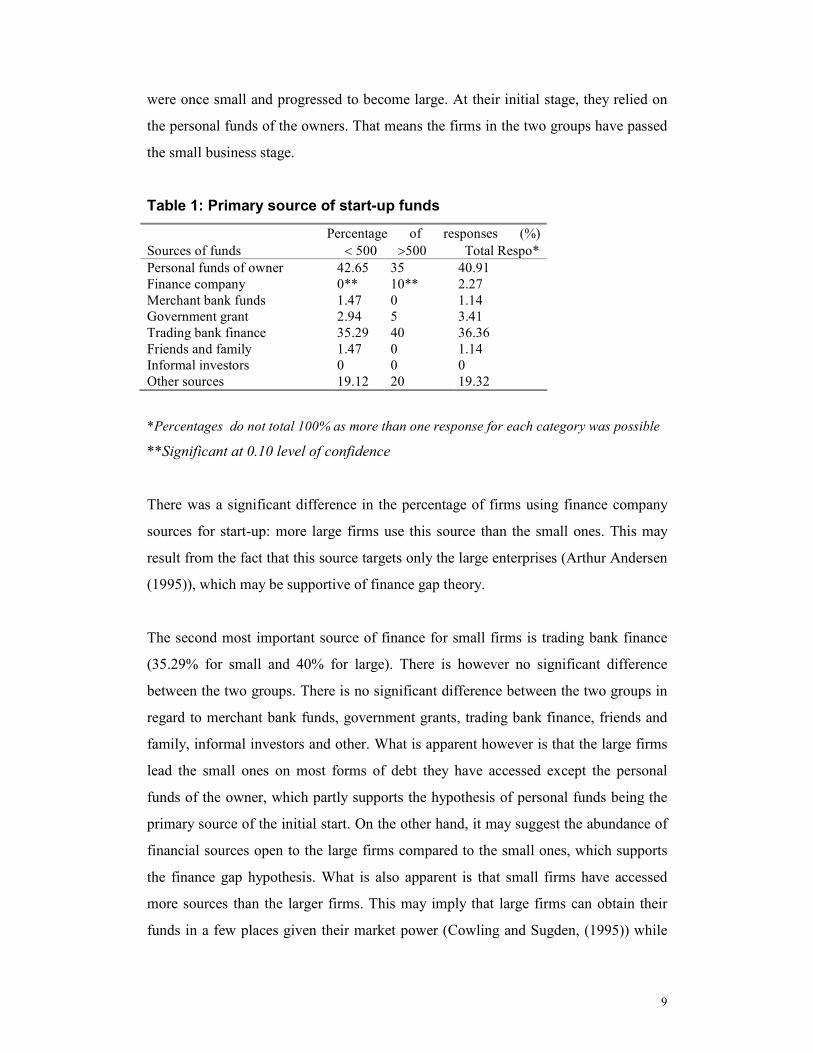
were once small and progressed to become large. At their initial stage, they relied on
the personal funds of the owners. That means the firms in the two groups have passed
the small business stage.
Table 1: Primary source of start-up funds
Percentage of responses (%)
Sources of funds < 500 >500 Total Respo*
Personal funds of owner 42.65 35 40.91
Finance company 0** 10** 2.27
Merchant bank funds 1.47 0 1.14
Government grant 2.94 5 3.41
Trading bank finance 35.29 40 36.36
Friends and family 1.47 0 1.14
Informal investors 0 0 0
Other sources 19.12 20 19.32
*Percentages do not total 100% as more than one response for each category was possible
**Significant at 0.10 level of confidence
There was a significant difference in the percentage of firms using finance company
sources for start-up: more large firms use this source than the small ones. This may
result from the fact that this source targets only the large enterprises (Arthur Andersen
(1995)), which may be supportive of finance gap theory.
The second most important source of finance for small firms is trading bank finance
(35.29% for small and 40% for large). There is however no significant difference
between the two groups. There is no significant difference between the two groups in
regard to merchant bank funds, government grants, trading bank finance, friends and
family, informal investors and other. What is apparent however is that the large firms
lead the small ones on most forms of debt they have accessed except the personal
funds of the owner, which partly supports the hypothesis of personal funds being the
primary source of the initial start. On the other hand, it may suggest the abundance of
financial sources open to the large firms compared to the small ones, which supports
the finance gap hypothesis. What is also apparent is that small firms have accessed
more sources than the larger firms. This may imply that large firms can obtain their
funds in a few places given their market power (Cowling and Sugden, (1995)) while

10
small firms have to struggle to get enough by approaching a multiplicity of sources
(Fraser 1995).
A key component of the finance gap is the knowledge gap, which means that small
firms do not have access to appropriate sources of funds because they lack knowledge
of them (McMahon et al. (1995)). Large firms are aware of the range of sources of
finance available compared to the small ones. We asked what the current sources of
debt were. Table 2 shows the results of analysis of the sources of debt for all the firms
in the sample.
The results show a significant difference between the large and the small in regard to
trading bank overdraft. Generally, 72% of the firms of the small firms and 45% of the
large ones currently use trading bank overdraft. The fact that the differences are
significant may be explained by control theory, that is, small firms generally use
family and friends sources, and when compelled to seek external funds, go for short-
term funds which do not compel them to share decision making with external
constituents. On the other hand, this may be due to the fact that smaller businesses
perceive debt to be the more appropriate source of finance than equity (Coopers and
Lybrand (1993)), a case of finance gap. This also partly answers the hypothesis that
small firms go for short-term debt, which does not dilute their control. However, for
supplier credit, the other short-term credit, there are no differences between the large
and the small, although again a greater percentage of small firms (26.47%) access this
source compared to the large (20%).
A look at Table 2 shows that the traditional forms of debt such as trade bank loans,
trade bank overdraft and trade credit are used more than the other sources such as
merchant banks and finance banks. This may be due to the undeveloped nature of
these facilities (Coopers and Lybrand (1993)). What is also apparent is that the
percentage of large firms using “other sources” is higher than for small firms. This
other sources could be the ones open to the larger firms and not the small ones such as
offshore borrowing and the capital market. There is a significant difference in usage
of finance company term loans and finance company lease, which vindicates the
hypothesis that the large firms are generally more aware of these facilities compared

11
to the small ones. On the other hand, this may show not awareness, but the fact that
these sources are not open to the small firms (Arthur Andersen (1995)). It may also
show lack of preference of these sources by management (Myers (1984)).
Table 2: Sources of debt currently used
Percentage of responses (%)
Sources < 500 >500 Total
Trading (Supplier credit) 26.47 20 25
Trading Bank overdraft 72.06*** 45*** 65.91
Trading bank term loan 41.18 40 40.91
Trading bank lease 4.41 0 3.41
Finance company term loan 1.47** 10** 3.41
Finance company lease 4.41** 15** 6.82
Finance company other 1.47 0 1.14
Merchant bank overdraft 0 0 0
Merchant bank term loan 5.88 5 5.68
Merchant bank Lease 0 0 0
Merchant bank other 2.94 0 2.27
Other source 23.53 30 25
*Percentages do not total to 100% as more than one response for each category was possible
**Significant χ2 statistic at .05 level of confidence
***Significant χ2 statistic at .01 level of confidence
There is no significant difference in debt in current use of trading bank term loan,
trading bank lease, finance company other, merchant bank overdraft, merchant bank
term loan, merchant bank lease and other source between the two groups.
To fully comprehend the extent of awareness of the opportunities open for borrowing,
we asked what types of debt are available to the firm if required. Table 3 shows the
results of this analysis. Generally, a majority of the firms listed the traditional forms of
debt such as trading bank overdraft, trading bank loan, and trading bank term lease in
that order. There is a fairly high level of awareness of other forms of financing such as
finance lease, finance term loan and merchant bank loan. Awareness of other forms of
debt is there but is low. Suffice it to say that the differences in awareness as measured
by the percentage of firms does not appear to be large. An explanation for this could
be that the financial market has become more sophisticated and has made conscious
efforts to increase their portfolio of small firms (Austin, Fox and Hamilton 1996) but
since this is a recent development, it has yet to permeate to all. There is a significant
difference in the level of merchant bank overdraft with small firms showing more

12
awareness than the large ones. This may also be supportive of the hypothesis that
small firms prefer short-term funding which does not dilute their control.
Table 3: Types of debt available to the business if required
Percentage of responses (%)
Source <500 >500 Total Respo*
Trading bank overdraft 85.29 85 85.23
Trading bank term lease 20.59 10 18.18
Finance company term lease 17.65 15 17.05
Merchant bank overdraft 14.71** 0** 11.36
Government grant 4.41 5 4.55
Trading bank term loan 71.64 55 67.82
Finance company term loan 19.12 15 18.18
Merchant bank loan 14.93 5 12.64
Merchant bank overdraft 7.35 5 6.82
Other source 16.18 15 15.91
*Percentages do not total to 100% as more than one response for each category was possible
**Significant χ2 statistic at .05 level of confidence
A key omission of the Holmes and Kent (1991) study was their failure to solicit the
reasons for the preference of the sources of funds currently used. We felt that this
would shed light on the motivations for using certain sources and not others. We
asked the respondents why they preferred the forms of debt they are currently using.
The results are reported in Table 4. Generally, only a few of the firms have made
decisions based on lack of awareness. Three of the respondents said they took this
form of debt because it was “available”. Given that other sources were also available,
this may show lack of awareness of the full range of funding available and lack of
interest in investigating. Information has a cost and funding preferences do not compel
them to investigate a case supportive of the pecking order hypothesis. These however
are in the minority. Majority of the firms chose their sources based on cost assessment
(32.35%) for small and 40 for large. The convenience and flexibility of the form of
debt was considered important, with (23.53%) of the small and 10% of the large
stating this.
Table 4: Reason for choosing the sources of debt currently in use
Percentage of respondents (%)
Reason <500 >500 Total Respo*
Lower cost 32.35 40 34.09

13
Relationship with the bank 7.35 10 7.95
Convenient and flexible 23.53 10 20.45
Corporate policy 10.29 0 7.95
Additional facilities 2.94 5 3.41
Only one willing to lend
amounts required
1.47 0 1.14
Diversify debt portfolio 2.94 0 2.27
Good terms 1.47 0 1.14
Available 4.41 0 3.41
Fits need requirements 11.76 0 9.09
*Percentages do not total to 100% as more than one response for each category was possible
Generally, small firms seem to have a plethora of reasons why they preferred their
chosen source, probably indicative of the importance of the finance decision for the
small firm given the difficulties of obtaining the finance. Generally, the implication
would be that firms made rational, conscious decisions in regard to source of debt
having considered the range available. This is consistent with pleas for a cost focus in
analysis of capital structure (Chittenden et al. (1996), Chu (1996), Hutchinson
(1995)). Minimising cost of borrowing is also consistent with refusing to cede control
of the firm (Hutchinson (1995)), and the pecking order hypothesis. However, there are
no significant differences between the large and the small in regard to the reasons for
their decisions.
It has been suggested that because small firms generally lack knowledge of
appropriate sources of finance, and that the sources they approach are generally more
expensive for them than for the larger firms, additional funding would come from
family and friends and retained earnings. We asked what the sources of additional
funding were and the results are reported in Table 4. The results are significant in
respect of “other sources”. Generally, large firms use “other sources” of funds which
may not be available to the small firms. Smaller firms may not raise money in the
stock exchange, a facility open to the large listed firms.
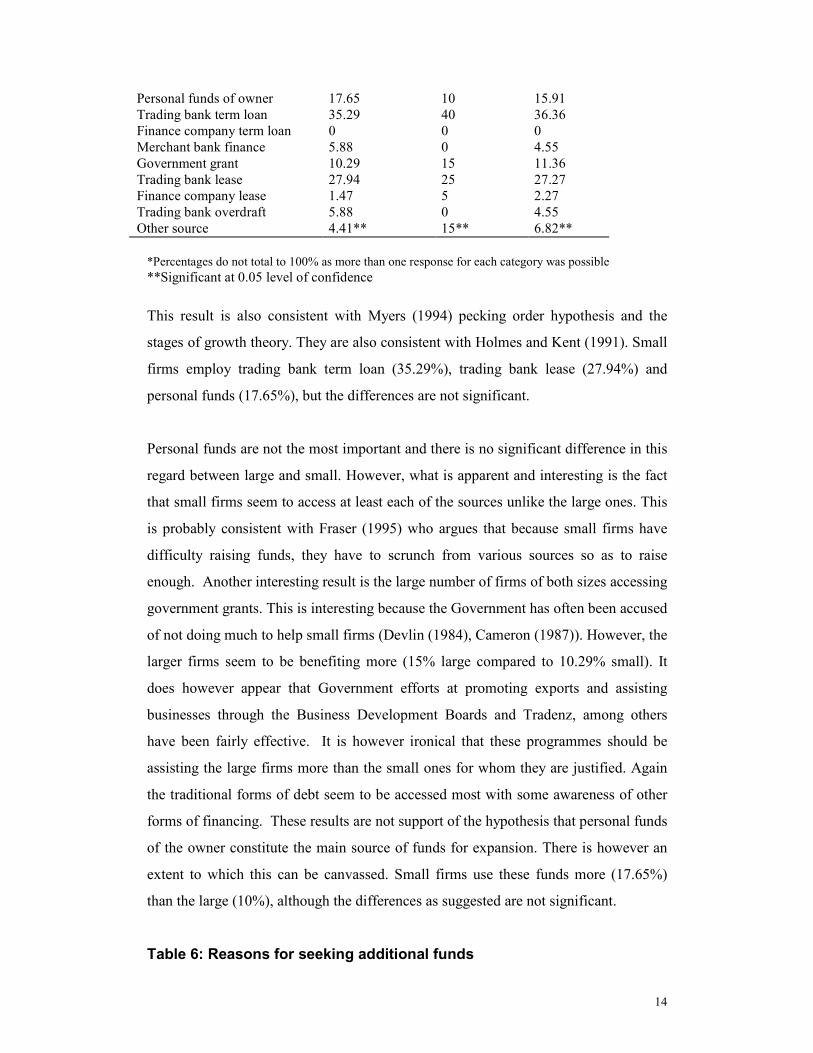
Table 5: Sources of additional funding
Percentage of responses (%)
Sources <500 >500 Total
Respo*
14
Personal funds of owner 17.65 10 15.91
Trading bank term loan 35.29 40 36.36
Finance company term loan 0 0 0
Merchant bank finance 5.88 0 4.55
Government grant 10.29 15 11.36
Trading bank lease 27.94 25 27.27
Finance company lease 1.47 5 2.27
Trading bank overdraft 5.88 0 4.55
Other source 4.41** 15** 6.82**
*Percentages do not total to 100% as more than one response for each category was possible
**Significant at 0.05 level of confidence
This result is also consistent with Myers (1994) pecking order hypothesis and the
stages of growth theory. They are also consistent with Holmes and Kent (1991). Small
firms employ trading bank term loan (35.29%), trading bank lease (27.94%) and
personal funds (17.65%), but the differences are not significant.
Personal funds are not the most important and there is no significant difference in this
regard between large and small. However, what is apparent and interesting is the fact
that small firms seem to access at least each of the sources unlike the large ones. This
is probably consistent with Fraser (1995) who argues that because small firms have
difficulty raising funds, they have to scrunch from various sources so as to raise
enough. Another interesting result is the large number of firms of both sizes accessing
government grants. This is interesting because the Government has often been accused
of not doing much to help small firms (Devlin (1984), Cameron (1987)). However, the
larger firms seem to be benefiting more (15% large compared to 10.29% small). It
does however appear that Government efforts at promoting exports and assisting
businesses through the Business Development Boards and Tradenz, among others
have been fairly effective. It is however ironical that these programmes should be
assisting the large firms more than the small ones for whom they are justified. Again
the traditional forms of debt seem to be accessed most with some awareness of other
forms of financing. These results are not support of the hypothesis that personal funds
of the owner constitute the main source of funds for expansion. There is however an
extent to which this can be canvassed. Small firms use these funds more (17.65%)
than the large (10%), although the differences as suggested are not significant.
Table 6: Reasons for seeking additional funds

15
Percentage of responses (%)
Reason < 500 >500 Total
Increase level of current assets 19.12 20 19.32
Prevent liquidity problem 8.82 5 7.95
Replace existing assets 16.18 20 17.05
Purchase fixed assets for
diversification
10.29 15 11.36
Purchase fixed assets for
expansion
33.82 50 37.50
0ther reasons 7.46*** 25*** 11.49
*Percentages do not total to 100% as more than one response for each category was possible
**Significant at 0.05 level of confidence
***Significant at the 0.01 confidence level
The literature on pecking order hypothesis (POH) suggests that firms operate under a
constrained pecking order resulting from external funds being more expensive than
internal ones and management therefore preferring internal equity. It further argues
that the main reason for additional funds is to purchase operating assets for expansion.
To test this hypothesis, we asked what the reasons were for seeking additional funds.
The results are reported in Table 6.
The difference between large firms and small ones regarding other reasons is
significant at 99% confidence level. This implies that large firms have other reasons
for seeking additional finance than the small ones and may be supportive of the POH.
On the other hand, there is no significant difference between small and large firms in
regard to the other reasons for seeking additional funds, which fails to support the
pecking order hypothesis. However, the results may be indicative of the relative
homogeneity of the sample in terms of the stage of growth. This implies that most of
the firms are at the same stage of growth and, therefore, the reason for seeking
additional funds are homogenous. If the stage of growth is to be measured by age, this
contention may be supported for majority of the firms (62.5%) are in the 10+ age
group while a meagre 16% occupy the remaining age groups with 21% not responding
(see Table 7).
Table 7: The age of the firms in the sample
Age Count Percent
Less 12 Months 1 1.14

16
1-3 Years 1 1.14
3-5 Years 4 4.55
6-10 Years 8 9.09
Over 10 Years 55 62.5
No answer 19 21.59
Total 88 100
5. Conclusion
We have examined New Zealand evidence in order to explain the different capital
structures between small and the large firms. What has emerged from this study is that
there are a number of differences in financing between small and large firms.
Obviously, this is bound to result to differences in capital structure. We found
significant differences between the large and the small firms in the sourcing of finance
company funds for start-up, implying greater awareness on the part of large than small
firms. There was a significant difference in sources of debt currently used in regard to
trading bank overdraft and finance company sources. We also found significant
differences in types of debt available to the firm for merchant bank overdraft. There
were significant differences in the source of additional funding in regard to “other
sources” and for “other reasons” for seeking this source. These results are generally
supportive of a finance gap theory. However, an interesting thing is that other
frameworks, such as the pecking order framework, stages of growth theory and
control theory could very well explain the results. Holmes and Kent (1991) had
suggested an investigation of the funding preferences of managers. We attempted to
do this by asking for the reasons for sourcing the additional funds. What emerges is
that small firms, just like the large, make conscious attempts at minimising costs,
consistent with, yet again both theories identified here. It does appear to us that this
line of research should be pursued, although this may entail the use of a methodology
that more closely pays attention to human intentionally in decision making. We mean
a field study probably based on case studies.

17
REFERENCES
Arthur Andersen (1994), Access to finance and business advice. Te Puni Kokiri,
Wellington.
Barton S. L. and Mathews C. H., (1989), “Small firm financing: Implications from a
strategic management perspective”. Journal of Small Business
Management. Vol 27(1): 1-7, Jan.
Bollard A., (1988), Small Business in New Zealand. Allen and Unwin: Port
NicholsonPress: Wellington.
Bolton J. E., (1971), Small firms: report of the committee of inquiry on small firms.
Cmnd. 4811. HMSO: London.
Chaganti R., et al. (1995), “Predictors of capital structure in small ventures”.
Entrepreneurship: Theory and Practice. 20(2): 7-18.
Chittenden F., et al. (1996), “Small firm growth, access to capital markets and
financial structure: Review of issues and empirical investigation”.
Small Business Economics, 8(1): 59-67.
Chu F. J., (1996), “Optimal capital structure revisisted”. Bankers Magazine (BZE),
179(5): 9-13.
Cowling M. and Sugden R., (1995), “Small firm lending contracts: Do banks
differentiate between firms?” Journal of Small Business Finance.
4(1): 87-98.
Devlin H. M., (1984), “Government assistance programmes for small businesses in
New Zealand”. Paper presented at the International Council for
Small Businesses. Chicago, USA. 10-12 June.
Devlin H. M., (1977), Needs and problems of small business: Some research findings.
Occassional Paper No. 15, Dept of Business, Massey University.
Dunstan K, Dwyer D. and Holmes S.,(1992), “The small business funding debate: An
empirical review”, Paper to the International Research
Symposium on Small firm Finance, Baylor University, Texas.
Fraser J. A., (1996), “Capital steps”. Inc. (INO), 18(2): 42-47.
Fox M.A. and Walker G. R., (1994), “Sources of funding for small and medium sound
companies in New Zealand”. New Zealand Law Journal. Nov:
421-425.
Holmes S. and Kent P., (1991) “An empirical analysis of the financial structure of
small and large Australian manufacturing enterprises”. The
Journal of Small Business Finance. 1(2): 141-54.
Holmes S and Kent P. (1990) “An empirical analysis of the financial structure of
small and large Australian manufacturing enterprises”. Paper
presented to the 5th National Small Business Research
Conference, Toowoomba, Queensland.
Holmes S., Dunstan K., and Dweyer D., (1994), “The cost of debt for small firms:
Evidence from Australia”. Journal of Small Busines Management.
32(1): 27-35.
Hutchinson R. W., (1995), “The capital structure and investment decisions of the
small owner-managed firm: Some exploratory issues”. Small
Business Economics, 7(3): 231-239. June.

18
Jensen M.C., and Meckling W. H., (1976), “Theory of the firm: Managerial
behaviour, agency costs and ownership structure”. Journal of
Financial Economics, 3(4): 305-360.
Levenson , A. (1962), “Interest rates and cost differentials in bank lending to small
and large businesses”. Review of Economics and Statistics. 4692:
190-198.
McMahon R. G. P., et al., (1993), Small enterprise financial management. Harcourt
Brace: Sydney.
Modigliani F.,and Miller M., (1958), “The cost of corporation finance and the theory
of investment”. American Economic Review. 486: 261-297.
Modigliani F.,and Miller M., (1963), “Corporate income taxes and the cost of capital:
A correction”. American Economic Review, 53: 433-443.
Myers S., (1984), “The capital structure puzzle”. Journal of Finance. July: 575-592.
Coopers and Lybrand, (1993), “Factors affecting the supply of capital for company
growth”. Ministry of Commerce, New Zealand Government,
Wellington.
Peterseon R. and Shulman J., (1987), “Capital structure of growing small firms: a 12
Country study on becoming bankeable”. International Small
Business Journal, 5(4): 10-22.
Reid G. C., (1996), “Financial structure and the growing small firm: Theortical
underpinning and current evidence”. Small Business Economics,
8(1): 1-7.
Renfrew K., (1982), “The adequacy of finance for small business in Australia”, in W.
Dunlop and w. Sheehan (eds.), Small Business Research Series
No.11, Institute of Industrial Economics, Newcastle, pp103-8.
Stanworth J and Curran H., (1976), “Growth and the small firm: An alternative view”.
Journal of Management Studies, 13(2): 95-110.
Warner S., (1977), “Bankruptcy costs: Some evidence”. Journal of Finance, 32: 337-
348.
Vos E. And Forlong C., (1997), “The agency advantage of debt over the lifecycle of
the firm.” Journal of Small Business Finance.