An Empirical Evaluation of The Effects of R&D Subsidies
38
BURCH CENTER WORKING PAPER SERIES University of California, Berkeley Department of Economics - #3880 Berkeley, CA 94720-3880 An Empirical Evaluation of the Effects of R&D Subsidies Isabel Busom Universitat Autònoma de Barcelona, Institut d’Analisi Econòmica, Barcelona May 1999 Burch Working Paper No. B99-05 This paper has been completed during a stay at the Department at the University of California, Berkeley as a visiting scholar. Financial support provided by the NATO Fellowships Program is gratefully acknowledged, as is additional support from the Ministerio de Educación of Spain, DGICYT PB93-0679 and CICYT SEC96-2300.
Transcript of An Empirical Evaluation of The Effects of R&D Subsidies
BURCH CENTER WORKING PAPER SERIES
University of California, BerkeleyDepartment of Economics - #3880Berkeley, CA 94720-3880
An Empirical Evaluation of the Effects ofR&D Subsidies
Isabel Busom
Universitat Autònoma de Barcelona,Institut d’Analisi Econòmica, Barcelona
May 1999Burch Working Paper No. B99-05
This paper has been completed during a stay at the Department at the University of California,Berkeley as a visiting scholar. Financial support provided by the NATO Fellowships Program isgratefully acknowledged, as is additional support from the Ministerio de Educación of Spain,DGICYT PB93-0679 and CICYT SEC96-2300.
Abstract
R&D subsidies are a common tool of technology policy, but little is known about theeffects they have on the behavior of firms. This paper presents evidence on the effects thatR&D subsidies have on the R&D effort of recipients, and on the probability that a firmwill participate in a program granting R&D subsidies. The empirical model consists of asystem of equations: the first a participation equation; and the second an R&D effortequation. Endogeneity of public funding is controlled for. Estimates are obtained with across-section sample of Spanish firms. The main findings are that: 1) small firms aremore likely to obtain a subsidy than large firms, probably reflecting one of the publicagency’s goals; 2) overall, public funding induces more private effort, but for some firms(30% of participants) full crowding out effects cannot be ruled out, and 3) firm sizeremains related to effort, whether or not a firm gets public funding.
KEYWORDS: Technology policy, R&D subsidies, policy evaluation.
JEL Classification: O31, H32, L52
Correspondance:Isabel BusomDepartament d'Economia AplicadaUniversitat Autònoma de Barcelona08193 Bellaterra, [email protected]
1. INTRODUCTION.
Promoting the generation and diffusion of innovations is becoming an important goal of
public intervention in most OECD countries, as technological change is acknowledged to
be one of the main determinants of economic growth. Within the European Union the
increasing budget allocated to successive Framework Programs, complementing national
level science and technology programs, illustrates this point. Yet, evidence on the effects
of technology policy tools on the behavior and productivity of firms is rather limited.1
This paper develops an empirical model to analyze an R&D subsidy program in Spain,
focusing on both the determinants of firms’participation in the program and on the effects
that participation has on the firms’R&D effort.2.
Three of the several issues that can be raised in evaluating this specific policy tool are
the following. The first issue concerns the analysis of who are the participants in a
program: What types of firms end up getting public subsidies? To what extent does the
observed result agree with the public agency's intended goals? The second issue refers to
how receiving a subsidy affects a firm's behavior with respect to R&D decisions: does
the firm increase its R&D effort or does public financing crowd out private financing,
partially or completely? Are there interaction effects between a firm’s participation in a
public R&D program and its R&D effort? Does the type of product market competition
matter equally, whether participating or not? Finally, the third question is in a way the
real test of the effectiveness of the policy: how does the productivity of firms receiving
1 There are a number of recent empirical studies, closely related to the endogenous growth literature,that focus on the effect of public and private R&D on growth at the aggregate level. Lichtenberg (1992)finds, using aggregate data for several countries, that government funded research has a much lowermarginal product than privately funded research. Park (1995) provides additional references to thisliterature. However, to understand how and why public and private R&D have an effect on growthrequires an analysis at the decision-maker level, that is, firms and public agencies. Kauko (1996),Mowery (1995) and Capron (1992) provide a review of studies at a disaggregate level.
R&D subsidies change (a direct effect) and what is the impact on the productivity of other
firms (the indirect or spillover effect) and on consumers ?
This paper addresses the first two, not having enough information in the data used here
to address the third. However, because they are related issues it is worthwhile to
comment briefly on the evidence available so far. The relationship between publicly
funded R&D and productivity at the firm or industry level has been addressed in studies
by Griliches (1986), Griliches and Lichtenberg (1984), Cuneo (1984), and Hall and
Mairesse (1995). These authors use production function models to estimate and test the
effects of publicly provided R&D funding on the productivity of firms receiving it. In
general, very small or non-significant effects were found. The alternative dual approach
is followed by Nadiri and Mamuneas (1994, 1995), who estimate cost and factor demand
functions that depend on publicly financed R&D capital and infrastructures. Using two-
digit industry-level data, they do find significant positive effects of public R&D capital
on the cost structure of industries but also find that these effects vary over time and across
industries. As pointed out in these and other studies, more attention has to be paid to the
composition of R&D, to the dynamic structure of effects, to measurement of spillovers,
and to the interaction between public and private R&D effort.
As a first step in evaluating public funding for R&D it may be of interest to investigate
the firms immediate response to subsidies. The question is whether public funding
induces or replaces private R&D spending. If it replaces private R&D spending, it must
be concluded that a subsidy policy may not be appropriate. The evidence here is again
controversial. Scott (1984), Levin and Reiss (1984) for U.S. firms, Holemans and
Sleuwaegen (1988) for Belgian firms, Antonelli (1989) for Italian firms, and Klette and
2 Work evaluating similar R&D policy tools is found in Hall (1993), on tax credits in the USA, orFolster (1992) on subsidies to encourage cooperative R&D in Sweden.
Moen (1997) for Norwegian firms, address this issue by estimating regression models
where private R&D expenditure is the dependent variable and publicly financed R&D is
one of the explanatory variables. Sample sizes and empirical methods vary,3 but in all of
these studies authors find evidence of a statistically significant and positive elasticity of
privately funded R&D with respect to the subsidy. Using a similar empirical framework
Lichtenberg (1984,1987,1988), however, finds evidence of crowding-out. Lichtenberg
(1984), controlling for the possible endogeneity of being a recipient of public funding
through firm fixed effects, finds that public funding may substitute for company funding.4
In Lichtenberg (1987), he finds further evidence of overestimation of the positive effects
of public funding of R&D, when sales are decomposed into sales-to-Government and
other sales. When controlling for the buyer, Lichtenberg finds that federally funded R&D
has no effects on private R&D investment. Finally Lichtenberg (1988) concludes that
government R&D contracts obtained through competition have a positive effect on
company funded R&D spending, but that non-competitive R&D contracts have a negative
effect.5
These simple regression models have two shortcomings. First, there is the problem of
the endogeneity of public funding, only implicitly addressed in Lichtenberg and Klette and
Moen, and not in the remaining studies. In order for a firm to receive public funding it
must apply for funding, and the public agency may or may not award it, given firm and
project characteristics. This makes public funding an endogenous variable, and its
3 Scott uses a sample of 3388 line of business observations corresponding to 437 U.S. firms; Holemansand Sleuwaegen a sample of 236 observations of Belgian firms and Antonelli a sample of 83 Italianfirms. Levin and Reiss use industry-level data (20 industries, 3 years). Klette and Moen use 816observations of line of business data for high tech sectors in Norway.4 Lichtenberg (1984) used NSF firm-level panel data with 991 observations. His 1987 and 1988 work isbased on a panel of 187 firms observed for 6 years (1979-1984).5 This suggests that the way public funding is provided (with firms competing or not competing for it)may matter a lot in changing firms incentives.
inclusion in a linear regression will cause inconsistent estimates if it happens to be
correlated with the error term. It is very likely that this correlation will be non zero,
because unobservable factors may determine both receiving public funding and private
R&D effort decisions. On the other hand, if the sample of firms used to evaluate the effect
of public funding includes only recipient firms, then there will be truncation or self
selection effects, and estimation methods must account for this in order to obtain
consistent estimates.
Second, the conclusion that should be drawn from finding a negative relationship
between public and private R&D expenditure in former studies is not clear, as the public
agency may choose precisely to finance more heavily R&D projects with higher spillover
potential (for instance, those involving basic research or higher appropriability
difficulties), where incentives for private funding may be small. In that case, there is no
reason to expect positive or higher private spending by the recipient firm, unless the
project triggers additional applied and development research generating private returns.
So higher public funding may be associated with very small private funding, producing a
non significant or even a negative coefficient in this type of regression, yet not implying
crowding-out effects. In addition, if the public subsidy is granted on the basis of some
matching condition, a positive relationship is likely to be found in the regression
equation, but the firm may have reduced its private effort relative to what it would have
done without the subsidy, implying partial crowding out. Therefore, to make inferences
about crowding out effects, what is needed is a consistent estimator of the firm’s
hypothetical effort in R&D in absence of a subsidy.
The study presented here intends to address these difficulties to some extent. First, it
investigates which factors are associated with receiving R&D subsidies, an issue not
addressed before. An attempt will be made to identify the decision of the firm to apply for
funding and the decision of the public agency to give it. Second, it estimates how much
R&D effort firms that received subsidies would have made had they not received the
subsidies, using the sub-sample of non-participants and controlling for selection. It can
only be concluded that public funding has had crowding out effects if the private spending
of a subsidy recipient is found to be smaller than the effort it would have made had it not
received a subsidy. The remainder of the paper is organized as follows. Section II
presents the econometric model, section III contains a description of the data, section IV
explains the behavioral hypothesis, and sections V and VI contain a discussion of the
results.
2. A STRUCTURAL MODEL OF PARTICIPATION IN A PUBLIC R&D
PROGRAM AND OF R&D PRIVATE EFFORT.
In most public R&D promotion programs a firm has to apply for a subsidy in order to get
one. Then the public agency has to decide whether to give it or not. There are two
decisions involved, one by the firm and one by the public agency. Together these
decisions give rise to the participation status of the firm: participant or non-participant in
the program. Conditional on obtaining or not obtaining public funding, a firm then decides
how much R&D effort to make, in terms of expenditure, personnel or type of project (i.e.,
process or product, basic research content). If this is the process generating the
observations, an empirical model to represent it will include four structural equations, the
first two being a sort of demand and supply equations for subsidies, and the third and
fourth being the R&D effort decision if participating and if not participating respectively.
These equations are:
A* = fa (Z, u) (1)
G* = fg(W, v) (2)
y 1* = h1(X 1, w 1) (3)
y 0* = h2(X 0, w 0) (4)
where Z, W, X1 and X0 are vectors of explanatory variables, and u,v, w 0 and w1 are error
terms that may contain unobservable characteristics of the firm. The covariance matrix
will be non-diagonal if common unobservable variables underlie u, v, w1 and w0.
A* in equation (1) represents the firm's expected profitability of applying for an R&D
subsidy relative to not applying. Equation (2) captures the decision rule of the public
agency granting the subsidies. The dependent variable, G*, is the value to the agency of
funding a particular project, and it is not observed. The agency's decision may be based
on a number of factors, some related to the social interest of the R&D project, and some
to the estimated ability of the firm to carry it out. Equations (3) and (4) capture the total
R&D effort made by a firm, usually measured by R&D expenditure or R&D personnel.
To the researcher, A* and G* are unobservable. y1* is observed only for participating
firms; y0* is observed only for non-participants.6 These two equations will allow for
differences in the coefficients associated to explanatory variables under each
participation regime. These differences may arise as a result of the policy. For instance,
firm size is often found to be positively related to R&D effort, but for firms receiving an
6 This framework is very similar to that used in evaluating the impact of training programs on wages; seefor example Heckman and Robb (1985).
R&D subsidy, size may not be a relevant factor to explain effort. These type of effects can
be tested within this framework.
Because of the unobservable nature of the profitability of a decision for each agent, the
model above is in fact a latent variable model, where only the qualitative outcome of the
decisions is observed. If we know whether a firm applies or not, we can define a binary
variable If that equals 1 if the firm applies. We may observe whether the agency awards
the subsidy or not, which can in turn be translated into a binary variable Ig. The
observation mechanism gives rise to a discrete choice model for participation in the R&D
program and to an effort model with endogenous switching. The complete structural
model includes in addition to equations (1)- (4), the following:
If = 1 if A* > 0 and I = 0 otherwise (5)
Ig = 1 if G* > 0 and I = 0 otherwise (6)
If we only observe who is a participant in the program (a case of limited observability)
and who is not, then(5) and (6) collapse into
I = If * Ig = g( Z, W, u, v) (7)
where I=1 implies that a firm has applied for and obtained a subsidy.
Equations (1) and (2), and their observable counterparts (5) and (6) or (7), are a
discrete choice model of participation or selection equation and may be estimated with
probit or logit multivariate models. Equations (3) and (4) may be estimated for each
subsample (of participants and non-participants) correcting for endogenous self-selection.
To sum up, this model allows for testing the public agency’s allocation rule, inferring
additional effects of the policy and estimating the hypothetical R&D expenditure of
participants, using non-participants as the comparison group after controlling for
selection.
3. THE DATA.
The data used consists of a sample of 154 Spanish firms that were conducting R&D
activities in 1988, 75 (45%) of which received public funding for their R&D projects
through the Centro para el Desarrollo Tecnológico e Industrial (CDTI), an agency of the
Spanish Ministry of Industry.7. That year, the CDTI granted subsidized loans to 213
projects of a total of 541 applications (a 39% approval rate). Some firms had more than
one project approved. According to CDTI’s annual report, on average public funding
amounted to 39 % of total R&D investment for approved projects (CDTI, 1988).
Firms in the sample were asked three sets of questions. First, standard questions related
to firm characteristics such as size, export volume, industry, firm's age, ownership.
Second, some questions concerning R&D activities such as R&D expenditure (total
expenditure, including the subsidy if received), R&D personnel, availability of public
funding, patents obtained in the previous 10 years, type of research, sources of ideas for
R&D projects. And finally, questions related to strategic attitudes or behavior of firms in
the product market or with respect to R&D. Most of the answers to the last type of
questions were finally coded as binary variables. Table 1 provides the definition of the
variables constructed from the survey.
7 For a description of data sources, see Appendix I.
Firms could apply for two possible sources of public funding: from national programs
or from European-level programs. Eighty three firms in the sample (about 54 %) declared
having applied for a national R&D subsidy, and 75 obtained it.8 As for European-level
programs, 47 firms applied for and 40 obtained funding. Only 15 % of firms declared
having both types of public funding. However, we do not have information for firms in
our sample about how many projects did a firm submit, nor of the magnitude of the
subsidy received.
Some information was obtained on how is R&D done. Main sources of ideas for their
projects and reaction to a rival's R&D activities were issues of particular interest, the
first as an indicator of possible knowledge spillovers, the second as one of strategic
behavior. A firm’s own patents were an important source of ideas for 56 % of firms, but
even more (63 %) considered rivals' patents or licenses or their rivals’ products to be an
important source of ideas. Almost all firms considered general sources of information
(Universities or research centers, scientific and technical publications) quite or very
important. The existence of knowledge spillovers in research ideas will be proxied by
binary variables constructed on the basis of these questions.9
In an attempt to obtain information on firms' strategic behavior in the product market,
firms were asked about their pricing strategy.10 Most firms (44%) declared to choose
prices and then adjust production to demand, and about 29 % declared to set production
plans first, and determine the price afterward. Some firms were regulated, and a specific
8 The rejection rate in the sample is very small relative to that in the population; CDTI reports rejectionrates of about 60 % of the submitted proposals for that year. It is possible that some firms that wererejected declared not having applied. This will have implications for estimation.9 These are knowledge spillovers a firm benefits from. We do not have a measure for extent ofappropriability of the firm’s own R&D.10 Firms were asked in particular whether they usually set prices and then production was adjusted todemand (price competition), or vice versa. Firms following the first rule may be interpreted to beBertrand competitors, while those following the second rule would be Cournot competitors.
binary variable was constructed for this case. As for R&D specific strategies, 58 % of
firms would accelerate their own R&D effort if they found out a rival firm was doing
similar R&D rather than cooperate or stop. Finally, all firms said R&D played a very
important role in the firm's strategy in the long run, but only half of them thought R&D was
important in the short run.
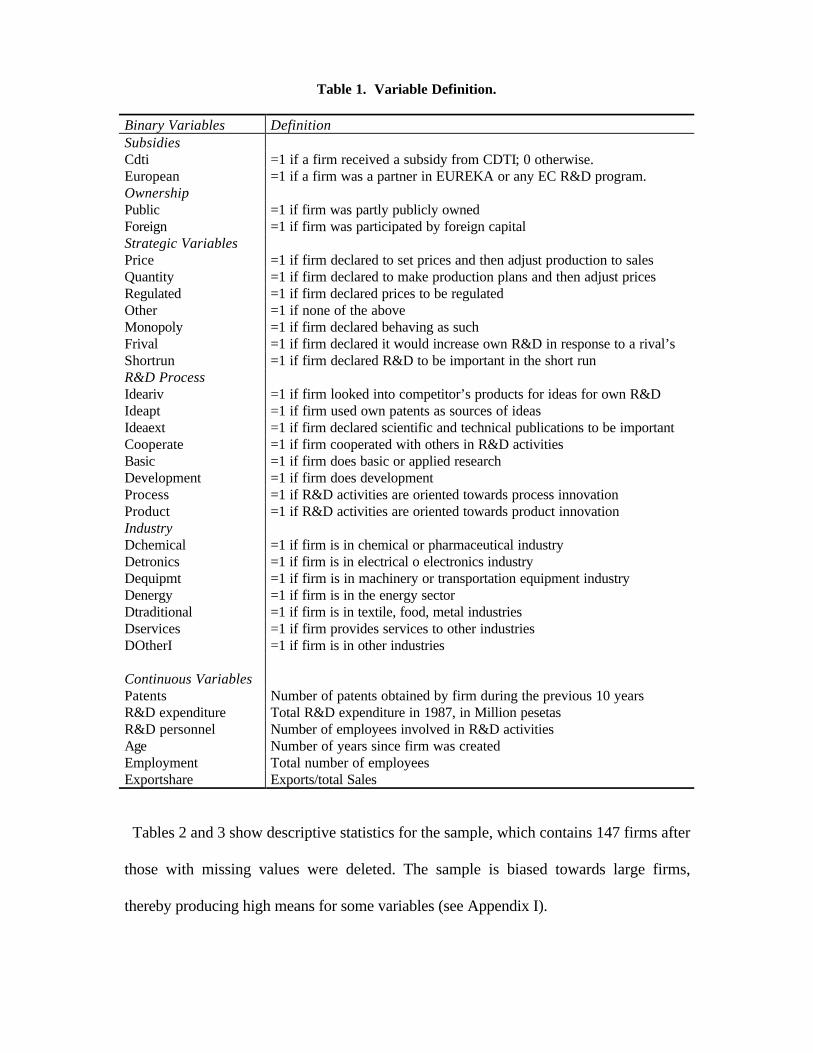
Table 1. Variable Definition.
Binary Variables DefinitionSubsidiesCdti =1 if a firm received a subsidy from CDTI; 0 otherwise.European =1 if a firm was a partner in EUREKA or any EC R&D program.OwnershipPublic =1 if firm was partly publicly ownedForeign =1 if firm was participated by foreign capitalStrategic VariablesPrice =1 if firm declared to set prices and then adjust production to salesQuantity =1 if firm declared to make production plans and then adjust pricesRegulated =1 if firm declared prices to be regulatedOther =1 if none of the aboveMonopoly =1 if firm declared behaving as suchFrival =1 if firm declared it would increase own R&D in response to a rival’sShortrun =1 if firm declared R&D to be important in the short runR&D ProcessIdeariv =1 if firm looked into competitor’s products for ideas for own R&DIdeapt =1 if firm used own patents as sources of ideasIdeaext =1 if firm declared scientific and technical publications to be importantCooperate =1 if firm cooperated with others in R&D activitiesBasic =1 if firm does basic or applied researchDevelopment =1 if firm does developmentProcess =1 if R&D activities are oriented towards process innovationProduct =1 if R&D activities are oriented towards product innovationIndustryDchemical =1 if firm is in chemical or pharmaceutical industryDetronics =1 if firm is in electrical o electronics industryDequipmt =1 if firm is in machinery or transportation equipment industryDenergy =1 if firm is in the energy sectorDtraditional =1 if firm is in textile, food, metal industriesDservices =1 if firm provides services to other industriesDOtherI =1 if firm is in other industries
Continuous VariablesPatents Number of patents obtained by firm during the previous 10 yearsR&D expenditure Total R&D expenditure in 1987, in Million pesetasR&D personnel Number of employees involved in R&D activitiesAge Number of years since firm was createdEmployment Total number of employeesExportshare Exports/total Sales
Tables 2 and 3 show descriptive statistics for the sample, which contains 147 firms after
those with missing values were deleted. The sample is biased towards large firms,
thereby producing high means for some variables (see Appendix I).
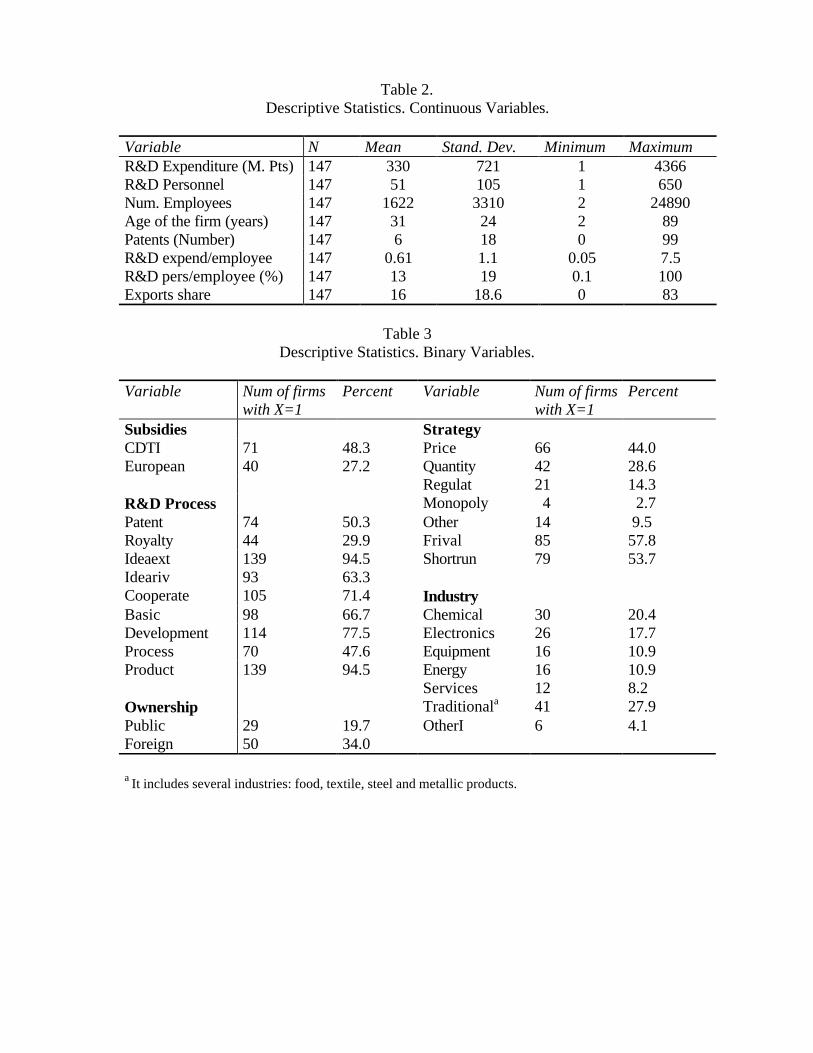
Table 2.Descriptive Statistics. Continuous Variables.
Variable N Mean Stand. Dev. Minimum MaximumR&D Expenditure (M. Pts) 147 330 721 1 4366R&D Personnel 147 51 105 1 650Num. Employees 147 1622 3310 2 24890Age of the firm (years) 147 31 24 2 89Patents (Number) 147 6 18 0 99R&D expend/employee 147 0.61 1.1 0.05 7.5R&D pers/employee (%) 147 13 19 0.1 100Exports share 147 16 18.6 0 83
Table 3Descriptive Statistics. Binary Variables.
Variable Num of firmswith X=1
Percent Variable Num of firmswith X=1
Percent
Subsidies StrategyCDTI 71 48.3 Price 66 44.0European 40 27.2 Quantity 42 28.6
Regulat 21 14.3R&D Process Monopoly 4 2.7Patent 74 50.3 Other 14 9.5Royalty 44 29.9 Frival 85 57.8Ideaext 139 94.5 Shortrun 79 53.7Ideariv 93 63.3Cooperate 105 71.4 IndustryBasic 98 66.7 Chemical 30 20.4Development 114 77.5 Electronics 26 17.7Process 70 47.6 Equipment 16 10.9Product 139 94.5 Energy 16 10.9
Services 12 8.2Ownership Traditionala 41 27.9Public 29 19.7 OtherI 6 4.1Foreign 50 34.0
a It includes several industries: food, textile, steel and metallic products.
4. SELECTION OF EXPLANATORY VARIABLES: BEHAVIORAL
HYPOTHESES.
The data described above may have been generated by the process outlined in section 2.
Given the available information and the model, the dependent variables will be the
following: application for an R&D subsidy (equation (5)), granting a subsidy (equation
(6)) and R&D effort (equations (3) and (4)). Some hypothesis may now be formulated as
to which variables enter the vectors of explanatory variables Z, W, and Xi.
Firms' decisions: R&D effort and subsidy application.
Both the theoretical and empirical literature point to a number of factors associated with
private R&D effort in general. Research has focused on the role that firm size and market
power or strategic behavior have on incentives to undertake R&D activities. Ease of
imitation or a low degree of appropriability of R&D results are also a crucial trait which
creates a wedge between private and social returns. The interaction with market structure
is complex, but theoretical models of patent races do predict it will affect R&D activity.
One example is found in Delbono and Denicolo (1990), who develop a model predicting
that firms competing in quantities in the product market will spend less in R&D than firms
competing in prices. Other factors that may affect R&D investment decisions are liquidity
constraints (Hall et al, 1998), type of ownership (Veugelers and Vanden-Houten (1990)
provide a model and empirical evidence that multinational firms may lead to reduced
domestic R&D), and the extent to which a firm sells its products in foreign markets.
Finally, differences in technological opportunity and in expected demand growth may
explain interindustry differences in R&D effort. Consequently, total employment, strategy
and ownership indicators, share of exports over total sales and industry dummies will be
included in the effort decision. In addition, the indicator of spillovers the firm receives
from others and the previous patents, measuring experience in R&D will be added. The
sign to be expected of the spillover indicator is ambiguous: on one hand, benefiting from
others’ ideas may lower the firm’s costs of innovating, but on the other it may trigger
more projects, and thus more effort.
Turning now to the application decision, it would seem that since all firms in the sample
conduct R&D activities, and the eligibility conditions set by the public agency do not
appear too restrictive ex ante in Spain, all firms would be expected to apply for a
subsidy, provided there are no fixed costs associated with applying.11 The benefits from
obtaining a subsidy need not be equal for all firms, however. If there are fixed costs
associated with research, small firms will presumably be less able to finance them and
more eager to participate in the subsidy program. Also firms that perceive R&D to be an
important strategic variable for competing with rivals even in the short run12 and firms
that compete in international markets (exporters) may also profit relatively more from
R&D subsidies than other firms. Finally, firms with fully domestic capital are more likely
to apply, because those with foreign capital participation may benefit from R&D
conducted in another location, and their R&D activities in Spain may be limited to
adapting products or technology. Included explanatory variables in the application
equation will be firm size (expecting a negative relationship), capital ownership,
11 This may be true for firms already conducting R&D, but firms not doing R&D may have to incurexpenses just to present a good proposal, and the expected subsidy may be too low for them to makeapplying worthwhile.12 Managers' perceptions about the importance of R&D in the short run may explain differentialbehavior across firms. These different perceptions may reflect to some extent differences in humancapital .
importance given to R&D in the short run, pricing strategy, share of exports in total sales
and industry dummies.13
The probability of applying may be explained by other factors which are not considered
here because there is not enough information in the data. One is the information the firm
has: some might be unaware of the existence of the program. Another possibility is that
some may find it not profitable to apply if their project would not generate a private
return, and the expected subsidy does not cover all the costs of the project (recall that the
public agency requires firms to finance at least 30 % of the project). Finally, some firms
may be interested in strictly development projects, while one of the public agency’s
conditions is that projects should have a genuine innovative content. Such firms may then
not apply.
The public agency.
The public agency is assumed to have a systematic selection criterion, therefore it does
not choose randomly which firms and projects to subsidize. In addition to selecting on the
basis of the quality and feasibility of the proposal, the agency may want to encourage
R&D in small firms (because of fixed costs involved in R&D and of capital market
imperfections), or in some research fields (i.e., defense, health) where a higher gap
between private and social returns is assumed to exist.14
13Some variables related to the type of research done (product or process, extent of basic content,duration of R&D projects, whether to apply for other sources of public R&D funding, such as ECFramework Program or Eureka) are available as well for this data set. They may be jointly determinedwith the decision to apply for a subsidy. An additional equation for each of them could be added to thesystem of equations above. However, because of the limited number of observations and of exogenousvariables a more complex model is not estimated here.14According to Navas (1984), the ability of the project to generate secondary technological effects wasalso considered. This suggest that spillovers may play a role in policy decisions.
In 1988 the CDTI financed projects in three broad areas: production technology
(information and communications technology, space, microelectronics, new materials,
robotics and automation), quality of life (toxicology, pharmaceuticals, immunology,
biotechnology), and natural resources and agriculture (including food technology). The
information and forms made available to applicants do not establish requirements for
application other than those related to the quality of the project (extent of innovative
content and technical, commercial, and economic feasibility) and to the ability of the firm
to carry it out (in terms of human capital) and to finance at least 30 % of the total cost of
the project.
Practically all firms seem eligible, given the breadth of the technological areas, and no
explicit reference is made to requirements affecting the size of the firm. Because the
quality and feasibility of a project is likely to be related to a firm's experience in R&D
(measured by patents obtained in the past) and general experience (proxied by the age of
the firm) both variables will be included in the selection rule. Firm size, presence of
public or foreign capital, and industry dummies will be included as well. The public
agency is assumed not to give any weight to the firm being an exporter, nor to be
concerned about competitive conditions in the product market, so dummies for strategic
variables will be excluded from the equation capturing the agency behavior, in principle
facilitating identification.
Whether an R&D project proposal has or does not have some basic research content
might be an indicator of potential research externalities, and thus a possible justification
for public support of R&D. Although a basic research variable can be constructed, it will
not be used as explanatory variable because in this cross-section data it is jointly
determined with the subsidy, and thus endogenous.
The error term will contain non-observed factors such as more accurate indicators of the
quality of the projects and of the human capital of the firm, which the public agency is
assumed to consider.
5. PARTICIPATION IN PUBLIC R&D PROGRAMS: ESTIMATION AND
RESULTS.
Equations (5) and (6) of the model outlined in section 2 determine the participation
status of each firm, with four possible outcomes. Since for a given firm Ig is not observed
unless If equals one, three outcomes are possible in theory. But the information contained
in this sample is even more limited, because too few firms declare applying and not
obtaining a subsidy. So in fact the reasonable equation to estimate is (7), the participation
status.15
I = If * Ig = g( Z, W, e) (7)
where I = 1 iff A* > 0 and G* > 0 (the firm has a public subsidy), and I = 0 otherwise.
There are two types of observations, participants and non-participants, and it will be
assumed that the probability of being a participant is given by the bivariate normal
density. The structural parameters associated to vectors Z, W could still be estimated
provided that identification conditions hold. However, the particular configuration of the
binary explanatory variables may generate identification problems16 as it turns out to
happen with this data set. Therefore, a simple univariate probit model is estimated. This
equation may then be interpreted as a reduced form, where coefficients of explanatory
variables capture the net effect of each variable on the final status, participation. What is
15This is one of the partial observability cases discussed in Poirier (1980).
lost is the ability to identify separately the different weight a particular variable may have
on the firm's application decision and on the agency's rule.
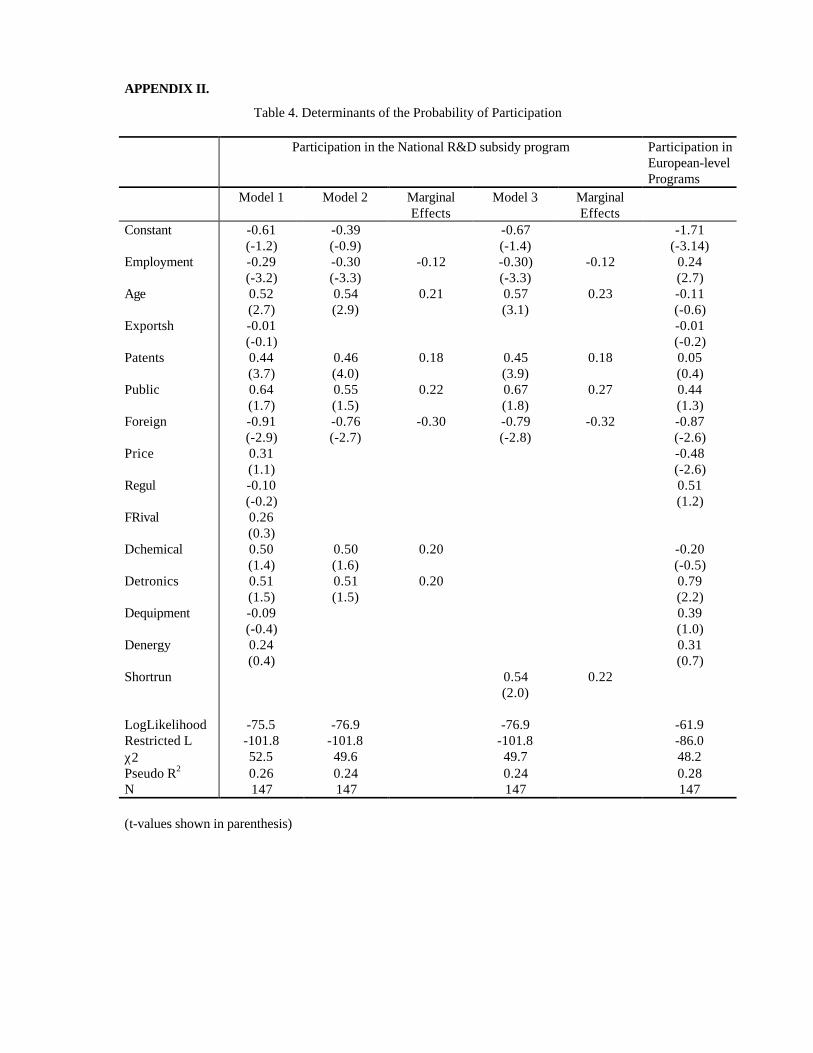
Estimation results are shown in Table 4, Appendix II. The first column of coefficients
shows the estimates obtained for a model with all explanatory variables, and the second
column shows the estimates of a restricted model where non-significant variables have
been dropped. The third column presents the marginal effect that each variable included
in the restricted model has on the probability of being a participant, that is, δ(Pr(I=1))/δxj
= b *f(x'b) where x is the vector of explanatory variables and f(·) the density function
evaluated at the mean of vector x. Columns 4 and 5 show the results obtained when the
variable SHORTRUN is included, but industry dummies are excluded.17 Models 2 and 3
correctly predict 80 % of non-participants and 70 % of participants. The predictive
performance of either of these two models is not negligible, given that a naive model
would have correctly predicted 52 % of non-participants and none of participants.
According to these results, six factors had a significant net effect on the probability of
having national public funding in Spain in the late 1980s. Public participation in the
ownership and being in the chemical or pharmaceutical sector are found to increase the
probability of participation significantly. A firm's overall experience (proxied by age)
and its experience in R&D (proxied by the number of previous patents) increase this
probability as well. These variables could well affect both decision makers in the same
direction, as more experienced firms are more aware of the value of innovation and may
present better proposals, becoming thus more likely to be selected by the agency. The fact
16Meng and Schmidt (1985) illustrate the implications that inclusion of binary explanatory variables hasfor identification and estimation in discrete choice models.17Considering R&D an important strategic variable in the short run might be correlated with unobservedvariables that also affect the participation status, such as managerial ability. Shortrun is thusinstrumented with exports, Electronics and Frival in order to obtain consistent estimates. The only
that experience related variables are significant suggests that subsidies might not be the
best policy to induce firms that did not have previous R&D activities to get them started.
Two factors reduce the probability of having a subsidy: large firm size and the presence
of foreign capital. In both cases the estimated net effect may again be the result of a
variable affecting both agents’ decisions in the same direction. Small firms may be more
credit constrained, and the public agency may be willing to favor small firms because of
this. The negative sign of size also suggests that application costs probably were not high.
Firms with foreign capital ownership are found less likely to participate. One possible
explanation is that core R&D activities may be located in another country, and those
carried out in Spain may be mostly focused toward development, with little innovative
content, and thus these firms don’t apply for a subsidy. Or if they do, the public agency
may reject their application and prefer to promote mostly domestic firms. Finally,
strategic variables are not found to have any significant net effect on participation.
A comment about participation in European-level R&D programs.
Model specification becomes more complex if firms have two sources of public funding,
and the decisions of the agencies are not independent. This could happen if a firm having
domestic funding is more likely to receive funding from European institutions, or vice
versa. Twenty seven percent of the firms in this sample did participate in European-level
programs (Eureka or Framework Programs), and 16 % participated in both. A bivariate
probit model to explain the joint probability of having domestic and European funding
was estimated. Because results suggest that the two types of participation were
independent at the time, consistent estimates for participation in each program can be
effect its inclusion has is that industry dummies become non significant, suggesting some degree ofmulticollinearity.
obtained by estimating a univariate probit model for each.18. Results obtained with the
univariate probit model to explain European-level participation are shown in the last
column of Table 4. They suggest that contrary to the domestic program, the probability of
participating was positively related to firm size and that experience related variables
were not relevant at the time. The negative role of foreign capital ownership is observed
also in this case. Interestingly firms that declared to compete in prices were less likely to
participate. However, the overall predictive capacity of the model is low, as more than
half of participants are missclassified by the model. Because the number of firms
participating in European R&D programs is small in our sample and because of the
novelty of these programs for Spanish firms (Spain had joined the EU only in 1986), it
may be difficult to find systematic patterns of behavior. Results obtained here must
therefore be interpreted with caution.
6. A COMPARISON OF R&D BEHAVIOR OF PARTICIPANTS AND NON-
PARTICIPANTS.
Next step involves estimating R&D effort for participants and for non-participants,
taking into account that group membership is not random. The purpose of estimation is to
provide evidence regarding two questions: 1) does participation induce a higher R&D
effort than would have been made otherwise? and 2) does participation make the firm’s
choice of R&D effort less conditioned by factors such as firm size?
Several equations will be estimated, because two measures for R&D effort are used,
R&D expenditures and R&D personnel. Each in turn is estimated in levels and intensity
18Independence may not hold in posterior years, though. As information about European-level programs
(R&D expenditure per employee and share of R&D personnel over employees,
respectively.19 One reason to use both expenditure and personnel is that expenditure may
capture differences in R&D equipment intensity or costs, while personnel may reflect a
more permanent, human capital component of R&D effort. R&D expenditures are total
spending by the firm, which in the case of participants includes the subsidy received. The
magnitude of the subsidy itself is not known. Explanatory variables will once again
capture the effect they have on private effort plus the effect they have on the magnitude of
the subsidy.
Because some firms received funding through participation in European level R&D
programs, an additional dummy variable (EUROPEAN) is introduced to control for this
fact, under the assumption that this variable and the error term are uncorrelated.
Each equation is estimated by four procedures. By ordinary least squares, using the
whole sample of firms, and including a participation binary variable (CDTI), as in
previous studies. This is the most restrictive specification, since it imposes equality of
coefficients for both groups of firms, as well as exogeneity of participation. The second
procedure consists of splitting the sample, not imposing equality of coefficients; but
estimating by OLS, thus imposing exogeneity of participation. The third consists of using
Heckman's two step procedure to correct for endogenous sample selection; this will
allow testing for exogeneity of participation.20 Finally both equations are estimated by
maximum likelihood, jointly with the participation equation.
improves over time, and as the national agency encourages firms to participate in them, firms withexperience in participating in the national program may be more likely to do so.19Sales were not used because they were obtained as intervals in the original survey.20The selection model is:y1 = b1’x + r1sσ1 λi+ e1
y0 = b0’x + r0s σ0 λi + e0
where ris is the correlation between the error term in each effort equation and the error term in theparticipation or selection equation, and λ i is the inverse Mill’s ratio.
Tables 5 through 8 in Appendix II show the results.21 Columns 1, 2 and 3 in each table
show that running OLS on the whole sample of firms with the participation dummy as
explanatory variable, will generate biased estimates because it imposes the restriction
that the coefficients of the explanatory variables are the same for both types of firms,
when this hypothesis should be rejected.22 This is so for all measures of R&D effort used.
Once different behavior is allowed for both types of firms, there are no sharp differences
between OLS estimates and Heckman's method estimates in the expenditure equations.
The coefficient for lambda in either of the sample selection equations is not significant,
suggesting that the hypothesis of no selection bias cannot be rejected. Maximum
likelihood estimates are very close to the sample selection model, but there are some
differences in estimated standard errors. The fit is in general better for R&D personnel
equations than for R&D expenditure (especially in case of the relative effort equation),
and better for participants than for non-participants.
Participants and non-participants differ in the way explanatory variables affect total
R&D effort. Because the hypothesis of selection bias based on unobservables has been
rejected, participants do not have an unobserved comparative advantage at doing R&D
(are not more likely to have higher R&D effort because of unobserved factors) relative to
non participants. Differences in coefficients may be partly attributed to the public
agency´s funding decision.
In absence of public funding, R&D expenditure is explained by firm size (with a
positive but smaller than one coefficient in the level equation, and a negative sign in the
relative effort equation) and by being either in the chemical/pharmaceutical industry or in
21 Four firms were excluded from the sample, as they behaved as outliers and results were sensitive totheir inclusion.22A Chow-test leads to rejection of the null hypothesis of equality of slopes in equations for participantsand non-participants.
the electrical/electronic industries. None of the remaining variables is found to have
significant effects (experience, capital ownership, or strategic and spillover variables).
These results are consistent through all estimation methods, except for the case of R&D
personnel for non participants, where industry variables are somewhat sensitive to
specification.
Participants show a different pattern. There are two main differences. The first is that
firms in the equipment and services to firms industries spend more relative to participants
from other industries. These firms are equally likely as firms in traditional industries to
be participants, but once they are, they may be getting higher subsidies. The second
difference is that having obtained patents in the past makes firms spend more on R&D, as
do firms mostly oriented to the domestic market.23 A possible interpretation is that the
public agency may prefer subsidizing this type of firms, which may make sense from the
perspective the welfare of domestic consumers.
There is some evidence that participants that declared to set production plans first and
then adjust prices spend less, in line with the prediction of the theoretical model by
Delbono and Denicolo, but this doesn’t hold across all estimations. The role of firm size
on R&D expenditure remains unchanged, the sign being negative in the relative effort
equations, but with a slightly smaller absolute value. Other strategic variables and
existence of spillovers weren’t found significant in any of the equations.24 As a final
remark, participating in a European-level R&D program does not seem to have led to
increased expenditure.
23The share of exports has a negative sign. This result is contrary to what was expected, but other studiesusing larger samples of Spanish firms (2400 observations) have obtained this result. See Labeaga andMartinez-Ros (1994).24In previous work with this same data set (Busom 1993) it was found that the measure of spilloversaffected negatively the probability of a firm doing basic research, and positively the probability of doingprocess innovations.
When effort is measured by R&D personnel, the same basic regularities appear. No
evidence of selection bias is found for participants, and relative effort decreases with an
increase in firm size or in export share, and increases with previous patenting activity.
Participating firms in the chemical and electronic industries increase their R&D
personnel, although not expenditure. Non-participants allocation of R&D personnel seems
to be mostly determined by firm size and industry.
7. DID PUBLIC SUBSIDIES CROWD OUT PRIVATE EFFORT?
Crowding out occurs when public funding drives private funding out partially or
completely. Complete crowding out takes place when a recipient firm would have
privately spent the same total amount for a given project. It indicates that firms would
have made the R&D effort anyway and that private returns were high enough. Partial
crowding out occurs when total effort increases, but the private contribution is smaller
than if the firm had been on its own.
Testing the presence of crowding out effects involves constructing a counterfactual for
recipient firms, which will be done using the estimation of effort of non-participants. If
data on privately financed R&D effort are available, then the extent of partial or complete
crowding-out effects could be estimated for each participant by computing an estimate of
its expected private effort as a participant, using the coefficients of the "Participants"
column (y1predicted = Ê{Y1 | I1 }) and comparing it to an estimate of its expected potential
effort, had the firm not been a participant (y0potential
= Ê{Y0 | I1 }), obtained with the
coefficients of the “Non-Participants”. If y1predicted ≥ y0
potential, then crowding out effects
(total or partial) can be ruled out.
In our case, however, only total R&D effort, which includes the subsidy received, is
known for participants. The amount of subsidy is unknown. So for each participant, the
expected hypothetical private effort had it not received a subsidy can be computed
(y0potential), but it has to be compared to total expected effort, which includes the subsidy.
With this information we can say that there are full crowding out effects if the effort a firm
makes after receiving the subsidy is not greater than the effort it would have made had it
not received the subsidy. The presence and extent of partial crowding out cannot be
estimated, however, because private spending is not known for participants.
To calculate an estimate of y1predicted = Ê {Y1| I=1 }, the coefficients of OLS estimates in
the participants' simplified regression are used.25 To calculate an estimate for
participants' potential effort had they not received the subsidy, y0potential = Ê{Y0 | I = 1 },
the coefficients of the non-participants regression are used. Because the goodness of fit of
the regression for non-participants suggests that relevant variables may be missing, the
following results must be taken with caution for policy assessment purposes. Measuring
effort with expenditure, it turns out that in aggregate (calculating Σy0potential), these 70
firms would have spent 15,368 MPta. instead of the estimated expected total of 27,798
MPta., just over one half. According to the public agency’s annual report, that year it
subsidized one third of the total cost of the projects, so this means that public funding
induced an additional 20 % of private expenditure, in the aggregate. However, inspection
of results for individual firms shows that in 29 cases, firms would have spent at least as
much on their own. It is possible that some of these firms had received such a small
subsidy that it did not change the scope of their R&D plans. But they also suggest that
25Non-significant variables, except for Quantity, were dropped. Quantity was kept because it becamesignificant, with a negative sign.
there were cases where firms reduced private funds after receiving the subsidy, even to
the extent of full crowding-out.
In the remaining 41 cases of subsidy recipients, firms did spend overall more than they
would have otherwise. But again, not knowing the size of the subsidy rules out the
possibility of inferring whether, for a particular firm, this induced more private effort or
not. All that can be said is that complete crowding-out can be ruled out in those cases.
Results are similar if R&D personnel is used as a measure of effort. On aggregate, and
on their own, these 70 firms would have allocated 2,547 people to R&D activities,
instead of 3,730 (an increase of 46 %). For 30 firms, predicted potential effort is not
smaller than the prediction with the subsidy, suggesting as before that these firms would
have carried out the R&D projects anyway. For 20 of these firms (almost 30% of
participants) this prediction is obtained using both expenditure and R&D personnel.
Further analysis should attempt to find an explanation for these cases. This could be
useful for the public agency, helping it improve the selection rule in order to encourage
R&D activities that would not have been undertaken otherwise.
Finally, the estimates for potential effort, y0potential
, are positive for all participants (for
expenditure and for personnel), implying that all participants would have incurred some
R&D expenditures even if they had not received a subsidy. This is not surprising, since
the sample only includes firms doing R&D. But it also suggests that a more complete
evaluation of the subsidy program could be made if the sample included firms that did not
do in R&D in the past, so the ability of the program to induce new comers to R&D
activities could be tested.
8. CONCLUSIONS.

Few studies have used econometric modeling to test the systematic effects that different
technology policy tools have on firms; yet ex-post evaluation of any policy at the
microeconomic level is a necessary step for checking its effectiveness and for detecting
unanticipated effects. Using a sample of Spanish firms, where half of them received
public subsidies for R&D, this paper provides evidence on some factors explaining
participation in a domestic R&D subsidy program, and on the effects that participation
has on R&D effort. Although the information available in this sample does not allow for
separate estimation of the application decision by a firm and the granting decision by the
public agency; a reduced form of the determinants of participation status can be
estimated.26 These confirm that smaller firms have a higher chance of being participants,
which, given that R&D doers tend to be large, means that smaller firms are more likely to
apply for and be granted a subsidy. This conclusion can also be inferred from annual
reports from CDTI or the Ministry of Industry. But results obtained here also show that
other variables have an important weight in the participation status, in particular foreign
capital participation. Whether this is mostly the result of the application process or of the
granting process deserves further attention, as over time, and as a result of economic
integration, more foreign capital participation in Spanish firms is to be expected. The
estimated weights that experience (age and past patents) and industry variables have for
participation could be used by the public agency to assess the performance of its selection
rule.
The analysis developed here also shows that firm size remained related to R&D
intensity, whether or not a firm received public funding, but that R&D intensity diminishes
somewhat more slowly with size for participants. This effect could not have been
26If the firm anticipated correctly the agency’s selection criterion, then the determinants of applicationwould be exactly the same as those of the granting decision, and there would be no identification

observed with the simple regression model pooling all firms and adding a participation
indicator.
Finally, in the aggregate, public funding induced more effort by firms in this sample, but
for a sizeable proportion (about 30%) of participants complete crowding out effects
cannot be ruled out. This result, if confirmed by further analysis, could be helpful in
improving the grant allocation rule.
There are several ways to improve the analysis carried out here if better data can be
obtained. An obvious way is by having observations on the same firm for several periods,
including before, during and after receiving a subsidy for participants. This should allow
a better control for unobserved firm specific effects. It would also be helpful to have
better variables, in special those related to the human capital of the firm, to a firm’s
strategy and markets, and to organizational characteristics. The analysis presented here is
just a step for a better understanding of the effects of R&D subsidies to private firms.
problem. The coefficients would capture entirely the agency’s selection rule.
APPENDIX I.
The data originated in a survey conducted in 1988 for a report on the participation of Spanish firms in
European research programs. Researchers at the Universitat Autonoma de Barcelona and the Institut
d'Analisi Economica (CSIC) designed the questionnaire. The sample was designed to contain firms
active in R&D and/or technology acquisition, including among them firms that had participated in some
public R&D program. The national public agency, CDTI, provided a list of applicants for subsidies, from
which a random sample was drawn. The rest of the sample was drawn from listings of firms doing R&D.
The sample is not meant to be representative of the whole population of Spanish firms, because all firms
in this sample conduct R&D, while at that time at most 20 % of all Spanish firms did so. It is thus not a
good sample to study why some firms do R&D and some do not, but this is not the purpose of this
research, which focuses on the sub-population of R&D doers. In the sample compiled by the Instituto
Nacional de Estadística in 1988, which consisted of 1232 firms doing R&D, about 19 % had more than
500 employees (large), 34 % between 100 and 499 (medium), and 47 % less than one hundred
employees (small). In the sample used here, almost 50 % of the firms are large, 20 % are medium and
30 % are small firms. Large firms are thus over represented in our sample.
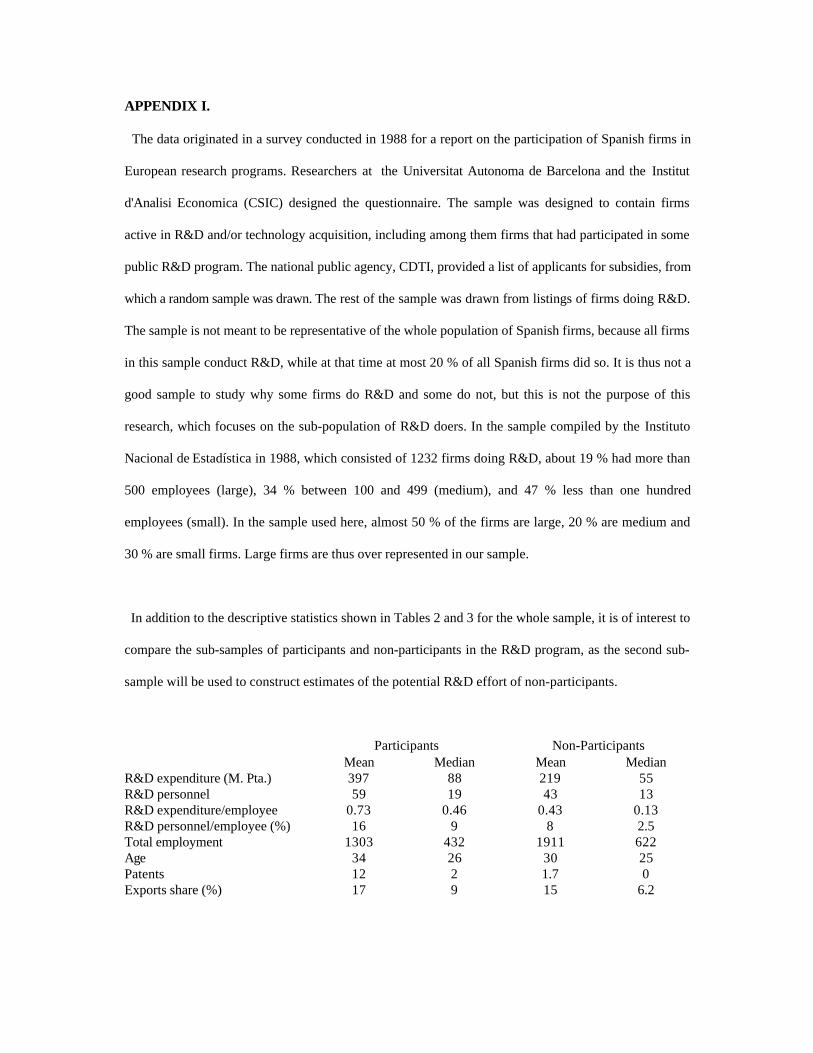
In addition to the descriptive statistics shown in Tables 2 and 3 for the whole sample, it is of interest to
compare the sub-samples of participants and non-participants in the R&D program, as the second sub-
sample will be used to construct estimates of the potential R&D effort of non-participants.
Participants Non-ParticipantsMean Median Mean Median
R&D expenditure (M. Pta.) 397 88 219 55R&D personnel 59 19 43 13R&D expenditure/employee 0.73 0.46 0.43 0.13R&D personnel/employee (%) 16 9 8 2.5Total employment 1303 432 1911 622Age 34 26 30 25Patents 12 2 1.7 0Exports share (%) 17 9 15 6.2
APPENDIX II.
Table 4. Determinants of the Probability of Participation
Participation in the National R&D subsidy program Participation inEuropean-levelPrograms
Model 1 Model 2 MarginalEffects
Model 3 MarginalEffects
Constant -0.61(-1.2)
-0.39(-0.9)
-0.67(-1.4)
-1.71(-3.14)
Employment -0.29(-3.2)
-0.30(-3.3)
-0.12 -0.30)(-3.3)
-0.12 0.24(2.7)
Age 0.52(2.7)
0.54(2.9)
0.21 0.57(3.1)
0.23 -0.11(-0.6)
Exportsh -0.01(-0.1)
-0.01(-0.2)
Patents 0.44(3.7)
0.46(4.0)
0.18 0.45(3.9)
0.18 0.05(0.4)
Public 0.64(1.7)
0.55(1.5)
0.22 0.67(1.8)
0.27 0.44(1.3)
Foreign -0.91(-2.9)
-0.76(-2.7)
-0.30 -0.79(-2.8)
-0.32 -0.87(-2.6)
Price 0.31(1.1)
-0.48(-2.6)
Regul -0.10(-0.2)
0.51(1.2)
FRival 0.26(0.3)
Dchemical 0.50(1.4)
0.50(1.6)
0.20 -0.20(-0.5)
Detronics 0.51(1.5)
0.51(1.5)
0.20 0.79(2.2)
Dequipment -0.09(-0.4)
0.39(1.0)
Denergy 0.24(0.4)
0.31(0.7)
Shortrun 0.54(2.0)
0.22
LogLikelihood -75.5 -76.9 -76.9 -61.9Restricted L -101.8 -101.8 -101.8 -86.0χ2 52.5 49.6 49.7 48.2Pseudo R2 0.26 0.24 0.24 0.28N 147 147 147 147
(t-values shown in parenthesis)
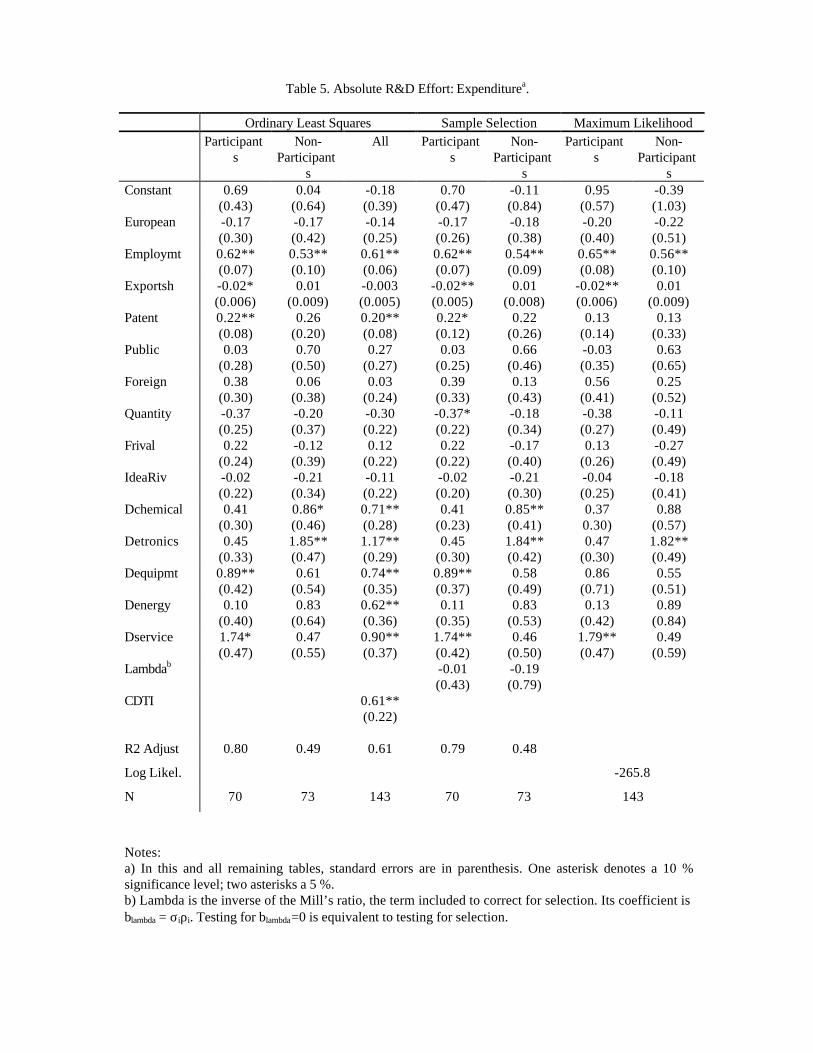
Table 5. Absolute R&D Effort: Expenditurea.
Ordinary Least Squares Sample Selection Maximum LikelihoodParticipant
sNon-
Participants
All Participants
Non-Participant
s
Participants
Non-Participant
sConstant 0.69
(0.43)0.04
(0.64)-0.18(0.39)
0.70(0.47)
-0.11(0.84)
0.95(0.57)
-0.39(1.03)
European -0.17(0.30)
-0.17(0.42)
-0.14(0.25)
-0.17(0.26)
-0.18(0.38)
-0.20(0.40)
-0.22(0.51)
Employmt 0.62**(0.07)
0.53**(0.10)
0.61**(0.06)
0.62**(0.07)
0.54**(0.09)
0.65**(0.08)
0.56**(0.10)
Exportsh -0.02*(0.006)
0.01(0.009)
-0.003(0.005)
-0.02**(0.005)
0.01(0.008)
-0.02**(0.006)
0.01(0.009)
Patent 0.22**(0.08)
0.26(0.20)
0.20**(0.08)
0.22*(0.12)
0.22(0.26)
0.13(0.14)
0.13(0.33)
Public 0.03(0.28)
0.70(0.50)
0.27(0.27)
0.03(0.25)
0.66(0.46)
-0.03(0.35)
0.63(0.65)
Foreign 0.38(0.30)
0.06(0.38)
0.03(0.24)
0.39(0.33)
0.13(0.43)
0.56(0.41)
0.25(0.52)
Quantity -0.37(0.25)
-0.20(0.37)
-0.30(0.22)
-0.37*(0.22)
-0.18(0.34)
-0.38(0.27)
-0.11(0.49)
Frival 0.22(0.24)
-0.12(0.39)
0.12(0.22)
0.22(0.22)
-0.17(0.40)
0.13(0.26)
-0.27(0.49)
IdeaRiv -0.02(0.22)
-0.21(0.34)
-0.11(0.22)
-0.02(0.20)
-0.21(0.30)
-0.04(0.25)
-0.18(0.41)
Dchemical 0.41(0.30)
0.86*(0.46)
0.71**(0.28)
0.41(0.23)
0.85**(0.41)
0.370.30)
0.88(0.57)
Detronics 0.45(0.33)
1.85**(0.47)
1.17**(0.29)
0.45(0.30)
1.84**(0.42)
0.47(0.30)
1.82**(0.49)
Dequipmt 0.89**(0.42)
0.61(0.54)
0.74**(0.35)
0.89**(0.37)
0.58(0.49)
0.86(0.71)
0.55(0.51)
Denergy 0.10(0.40)
0.83(0.64)
0.62**(0.36)
0.11(0.35)
0.83(0.53)
0.13(0.42)
0.89(0.84)
Dservice 1.74*(0.47)
0.47(0.55)
0.90**(0.37)
1.74**(0.42)
0.46(0.50)
1.79**(0.47)
0.49(0.59)
Lambdab -0.01(0.43)
-0.19(0.79)
CDTI 0.61**(0.22)
R2 Adjust 0.80 0.49 0.61 0.79 0.48
Log Likel. -265.8
N 70 73 143 70 73 143
Notes:a) In this and all remaining tables, standard errors are in parenthesis. One asterisk denotes a 10 %significance level; two asterisks a 5 %.b) Lambda is the inverse of the Mill’s ratio, the term included to correct for selection. Its coefficient isblambda = σiρi. Testing for blambda=0 is equivalent to testing for selection.
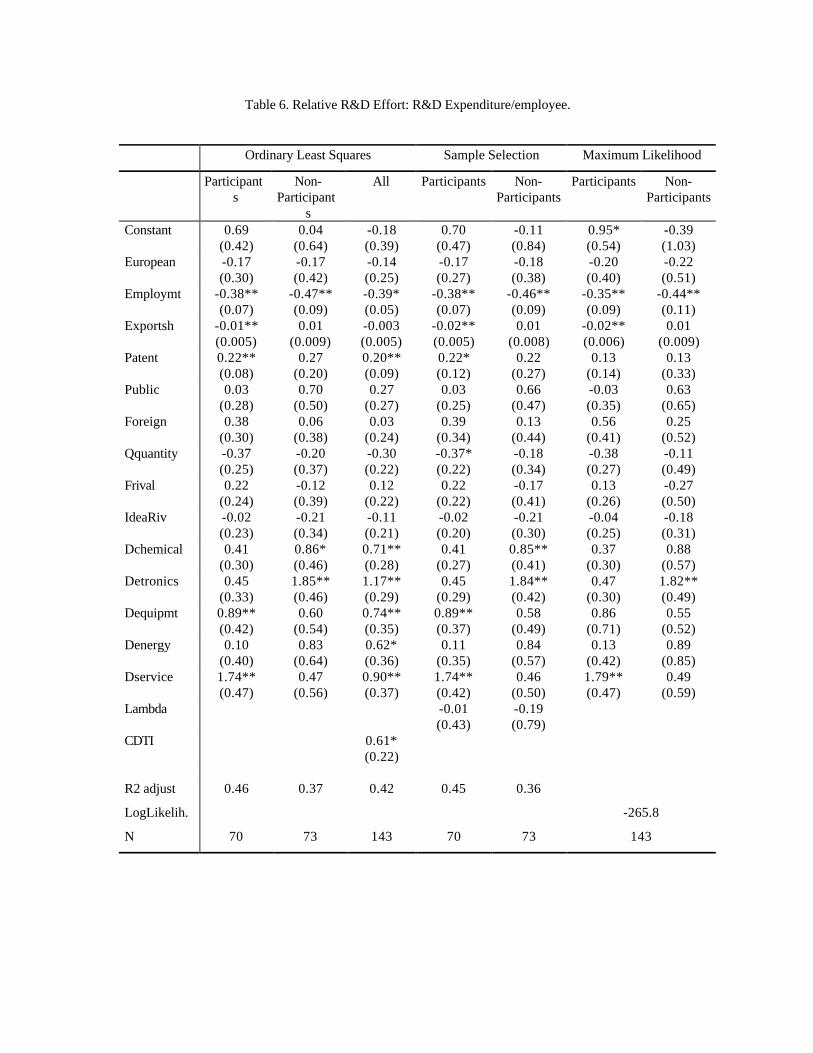
Table 6. Relative R&D Effort: R&D Expenditure/employee.
Ordinary Least Squares Sample Selection Maximum Likelihood
Participants
Non-Participant
s
All Participants Non-Participants
Participants Non-Participants
Constant 0.69(0.42)
0.04(0.64)
-0.18(0.39)
0.70(0.47)
-0.11(0.84)
0.95*(0.54)
-0.39(1.03)
European -0.17(0.30)
-0.17(0.42)
-0.14(0.25)
-0.17(0.27)
-0.18(0.38)
-0.20(0.40)
-0.22(0.51)
Employmt -0.38**(0.07)
-0.47**(0.09)
-0.39*(0.05)
-0.38**(0.07)
-0.46**(0.09)
-0.35**(0.09)
-0.44**(0.11)
Exportsh -0.01**(0.005)
0.01(0.009)
-0.003(0.005)
-0.02**(0.005)
0.01(0.008)
-0.02**(0.006)
0.01(0.009)
Patent 0.22**(0.08)
0.27(0.20)
0.20**(0.09)
0.22*(0.12)
0.22(0.27)
0.13(0.14)
0.13(0.33)
Public 0.03(0.28)
0.70(0.50)
0.27(0.27)
0.03(0.25)
0.66(0.47)
-0.03(0.35)
0.63(0.65)
Foreign 0.38(0.30)
0.06(0.38)
0.03(0.24)
0.39(0.34)
0.13(0.44)
0.56(0.41)
0.25(0.52)
Qquantity -0.37(0.25)
-0.20(0.37)
-0.30(0.22)
-0.37*(0.22)
-0.18(0.34)
-0.38(0.27)
-0.11(0.49)
Frival 0.22(0.24)
-0.12(0.39)
0.12(0.22)
0.22(0.22)
-0.17(0.41)
0.13(0.26)
-0.27(0.50)
IdeaRiv -0.02(0.23)
-0.21(0.34)
-0.11(0.21)
-0.02(0.20)
-0.21(0.30)
-0.04(0.25)
-0.18(0.31)
Dchemical 0.41(0.30)
0.86*(0.46)
0.71**(0.28)
0.41(0.27)
0.85**(0.41)
0.37(0.30)
0.88(0.57)
Detronics 0.45(0.33)
1.85**(0.46)
1.17**(0.29)
0.45(0.29)
1.84**(0.42)
0.47(0.30)
1.82**(0.49)
Dequipmt 0.89**(0.42)
0.60(0.54)
0.74**(0.35)
0.89**(0.37)
0.58(0.49)
0.86(0.71)
0.55(0.52)
Denergy 0.10(0.40)
0.83(0.64)
0.62*(0.36)
0.11(0.35)
0.84(0.57)
0.13(0.42)
0.89(0.85)
Dservice 1.74**(0.47)
0.47(0.56)
0.90**(0.37)
1.74**(0.42)
0.46(0.50)
1.79**(0.47)
0.49(0.59)
Lambda -0.01(0.43)
-0.19(0.79)
CDTI 0.61*(0.22)
R2 adjust 0.46 0.37 0.42 0.45 0.36
LogLikelih. -265.8
N 70 73 143 70 73 143
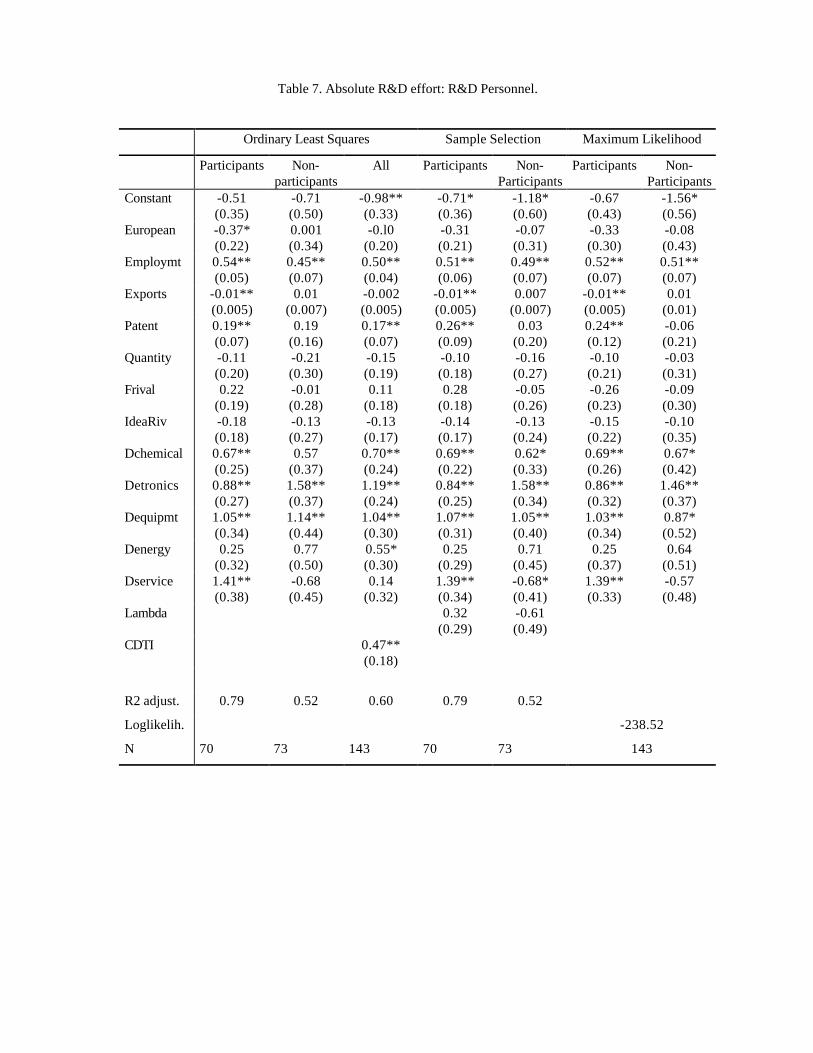
Table 7. Absolute R&D effort: R&D Personnel.
Ordinary Least Squares Sample Selection Maximum Likelihood
Participants Non-participants
All Participants Non-Participants
Participants Non-Participants
Constant -0.51(0.35)
-0.71(0.50)
-0.98**(0.33)
-0.71*(0.36)
-1.18*(0.60)
-0.67(0.43)
-1.56*(0.56)
European -0.37*(0.22)
0.001(0.34)
-0.l0(0.20)
-0.31(0.21)
-0.07(0.31)
-0.33(0.30)
-0.08(0.43)
Employmt 0.54**(0.05)
0.45**(0.07)
0.50**(0.04)
0.51**(0.06)
0.49**(0.07)
0.52**(0.07)
0.51**(0.07)
Exports -0.01**(0.005)
0.01(0.007)
-0.002(0.005)
-0.01**(0.005)
0.007(0.007)
-0.01**(0.005)
0.01(0.01)
Patent 0.19**(0.07)
0.19(0.16)
0.17**(0.07)
0.26**(0.09)
0.03(0.20)
0.24**(0.12)
-0.06(0.21)
Quantity -0.11(0.20)
-0.21(0.30)
-0.15(0.19)
-0.10(0.18)
-0.16(0.27)
-0.10(0.21)
-0.03(0.31)
Frival 0.22(0.19)
-0.01(0.28)
0.11(0.18)
0.28(0.18)
-0.05(0.26)
-0.26(0.23)
-0.09(0.30)
IdeaRiv -0.18(0.18)
-0.13(0.27)
-0.13(0.17)
-0.14(0.17)
-0.13(0.24)
-0.15(0.22)
-0.10(0.35)
Dchemical 0.67**(0.25)
0.57(0.37)
0.70**(0.24)
0.69**(0.22)
0.62*(0.33)
0.69**(0.26)
0.67*(0.42)
Detronics 0.88**(0.27)
1.58**(0.37)
1.19**(0.24)
0.84**(0.25)
1.58**(0.34)
0.86**(0.32)
1.46**(0.37)
Dequipmt 1.05**(0.34)
1.14**(0.44)
1.04**(0.30)
1.07**(0.31)
1.05**(0.40)
1.03**(0.34)
0.87*(0.52)
Denergy 0.25(0.32)
0.77(0.50)
0.55*(0.30)
0.25(0.29)
0.71(0.45)
0.25(0.37)
0.64(0.51)
Dservice 1.41**(0.38)
-0.68(0.45)
0.14(0.32)
1.39**(0.34)
-0.68*(0.41)
1.39**(0.33)
-0.57(0.48)
Lambda 0.32(0.29)
-0.61(0.49)
CDTI 0.47**(0.18)
R2 adjust. 0.79 0.52 0.60 0.79 0.52
Loglikelih. -238.52
N 70 73 143 70 73 143
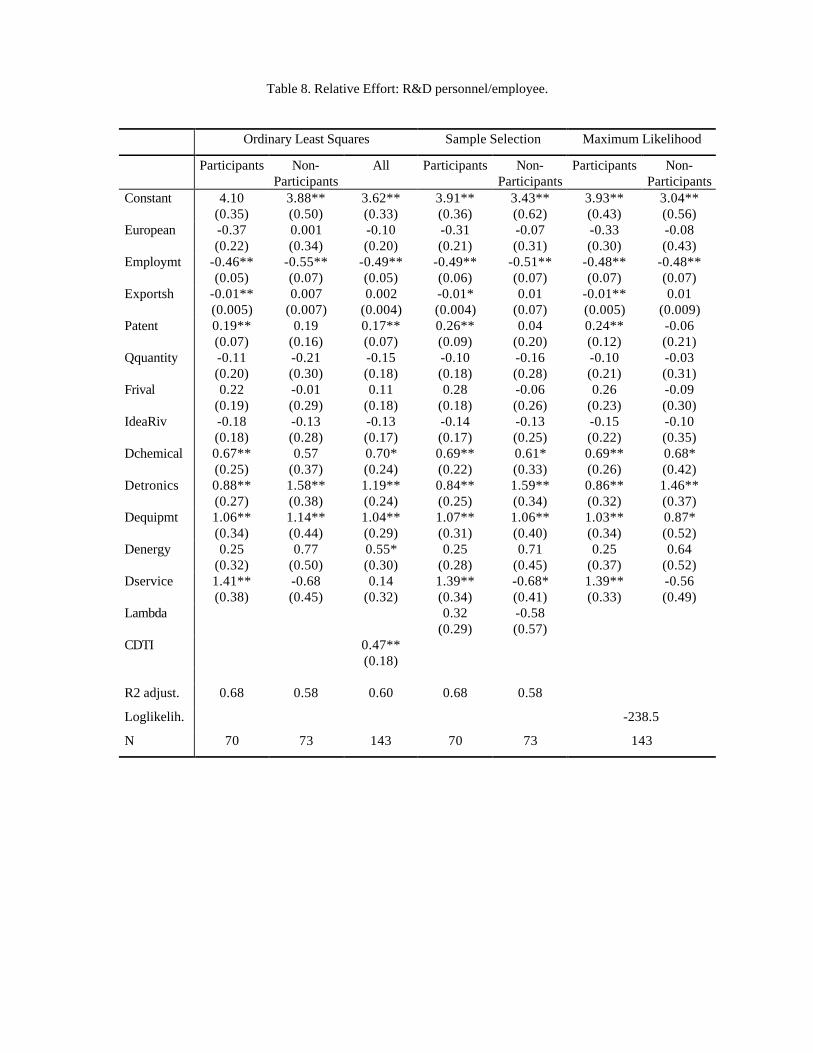
Table 8. Relative Effort: R&D personnel/employee.
Ordinary Least Squares Sample Selection Maximum Likelihood
Participants Non-Participants
All Participants Non-Participants
Participants Non-Participants
Constant 4.10(0.35)
3.88**(0.50)
3.62**(0.33)
3.91**(0.36)
3.43**(0.62)
3.93**(0.43)
3.04**(0.56)
European -0.37(0.22)
0.001(0.34)
-0.10(0.20)
-0.31(0.21)
-0.07(0.31)
-0.33(0.30)
-0.08(0.43)
Employmt -0.46**(0.05)
-0.55**(0.07)
-0.49**(0.05)
-0.49**(0.06)
-0.51**(0.07)
-0.48**(0.07)
-0.48**(0.07)
Exportsh -0.01**(0.005)
0.007(0.007)
0.002(0.004)
-0.01*(0.004)
0.01(0.07)
-0.01**(0.005)
0.01(0.009)
Patent 0.19**(0.07)
0.19(0.16)
0.17**(0.07)
0.26**(0.09)
0.04(0.20)
0.24**(0.12)
-0.06(0.21)
Qquantity -0.11(0.20)
-0.21(0.30)
-0.15(0.18)
-0.10(0.18)
-0.16(0.28)
-0.10(0.21)
-0.03(0.31)
Frival 0.22(0.19)
-0.01(0.29)
0.11(0.18)
0.28(0.18)
-0.06(0.26)
0.26(0.23)
-0.09(0.30)
IdeaRiv -0.18(0.18)
-0.13(0.28)
-0.13(0.17)
-0.14(0.17)
-0.13(0.25)
-0.15(0.22)
-0.10(0.35)
Dchemical 0.67**(0.25)
0.57(0.37)
0.70*(0.24)
0.69**(0.22)
0.61*(0.33)
0.69**(0.26)
0.68*(0.42)
Detronics 0.88**(0.27)
1.58**(0.38)
1.19**(0.24)
0.84**(0.25)
1.59**(0.34)
0.86**(0.32)
1.46**(0.37)
Dequipmt 1.06**(0.34)
1.14**(0.44)
1.04**(0.29)
1.07**(0.31)
1.06**(0.40)
1.03**(0.34)
0.87*(0.52)
Denergy 0.25(0.32)
0.77(0.50)
0.55*(0.30)
0.25(0.28)
0.71(0.45)
0.25(0.37)
0.64(0.52)
Dservice 1.41**(0.38)
-0.68(0.45)
0.14(0.32)
1.39**(0.34)
-0.68*(0.41)
1.39**(0.33)
-0.56(0.49)
Lambda 0.32(0.29)
-0.58(0.57)
CDTI 0.47**(0.18)
R2 adjust. 0.68 0.58 0.60 0.68 0.58
Loglikelih. -238.5
N 70 73 143 70 73 143
References.
Antonelli, Ch. (1989), “A failure inducement model of research and development expenditure:Italian evidence from early 1980s”, Journal of Economic Behavior and Organization, 12(2),159-80.
Busom, I. (1993), “Los proyectos de I+D de las empresas: Un análisis empírico de algunas de suscaracterísticas”, Revista Española de Economía, Monográfico Investigación y Desarrollo, 39-65.
Capron, H. (1992), Economic Quantitative Methods for the Evaluation of the Impact of R&DPrograms, Comission of the European Communities, Monitor/Spear, EUR 14864 EN.
CDTI (1988), Memoria 1988, Ministerio de Industria y Energia, Madrid, Spain.
Cunéo, P., (1984), “L'impact de la recherche et développement sur la productivité industrielle",Economie et Statistique, 164, 3-18.
Delbono, F. and V. Denicolo (1990), “R&D Investment in a symmetric and homogeneousoligopoly: Bertrand versus Cournot”, International Journal of Industrial Organization, 8(2), 297-313.
Folster, S. (1992), “Should Cooperative R&D be subsidized: an empirical analysis”, mimeo,presented at the EARIE 1992 Meetings, Stuttgart.
Griliches, Z. (1986), “Productivity, R&D and Basic Research at the Firm Level in the 1970’s”,American Economic Review, 76(1), 141-154.
Griliches, Z. and F. Lichtenberg (1984), “R&D and Productivity Growth at the Industry Level: Isthere still a Relationship?”, in Z. Griliches (de), R&D, Patents and Productivity, Chicago,Chicago University Press, 465-96.
Hall, B. (1993), “R&D Tax Policy During the Eighties: Success or Failure?”, in J. Poterba (ed),Tax Policy and the Economy 7, NBER and MIT Press, 1-35.
Hall, B.H. and J. Mairesse (1995), “ Exploring the relationship between R&D and productivity inFrench manufacturing firms”, Journal of Econometrics, 65, 263-293.
Hall, B.H., J. Mairesse, L. Branstetter and B. Crepon (1998), “Does Cash Flow CauseInvestment and R&D: An Exploration using panel data for French, Japanese and United StatesScientific Firms”, forthcoming in D. Audretsch and A. Thurik (eds), Innovation, IndustryEvolution and Employment, Cambridge University Press.
Heckman, J. and R. Robb (1985), “Alternative methods for evaluating the impact of interventions.An overview”, Journal of Econometrics, 30.
Holemans, B. and L. Sleuwaegen (1988), “Innovation expenditures and the role of government inBelgium”, Research Policy, 17, 375-379.
Kauko, K. (1996), “ Effectiveness of R&D subsidies -a skeptical note on the empirical literature”,Research Policy 25, 321-323.
Klette, J. And J. Moen (1997), “R&D investment responses to R&D subsidies: A theoreticalanalysis and a microeconometric study”, mimeo, presented at TSER workshop, CEMFI, Madrid.
Labeaga, J.M. and E. Martinez-Ros (1994), “Estimación de un modelo de ecuaciones simultáneascon variables dependientes limitadas: una aplicación con datos de la industria española",Investigaciones Económicas, XVIII (3), 465-489.
Levin, R. and P. Reiss (1984), “Tests of a Schumpeterian Model of R&D and market structure”,in Z. Griliches (ed) R&D, Patents and Productivity, University of Chicago Press, 175-204.
Lichtenberg, F. (1984), “The Relationship between Federal Contract R&D and Company R&D”,American Economic Review; 74(2), May 1984, 73-78.
Lichtenberg, F. (1987), “The Effect of Government Funding on Private Industrial Research andDevelopment: a Re-assessment”, The Journal of Industrial Economics, 36 (1), 97-104.
Lichtenberg, F. (1988), “The Private R&D Investment Response to Federal Design and TechnicalCompetitions”, American Economic Review, 78, 3, 550-59.
Lichtenberg, F. (1992), “R&D investment and international productivity differences", NBER,Working Paper No. 4161.
Mowery, D. (1995), “The Practice of Technology Policy”, in P. Stoneman (ed), Handbook of theEconomics of Innovation and Technological Change, Oxford: Basil Blackwell, 513-58
Meng, Chun-Lo and P. Schmidt (1985), “On the cost of partial observability in the BivariateProbit Model”, International Economic Review, 26(1), 71-85.
Nadiri, M.I. and T.P. Mamuneas (1994), “The Effects of Public infrastructure and R&D capitalon the cost structure and performance of US manufacturing industries”, Review of Economicsand Statistics, Vol. LXXVI (1), 22-37.
Mamuneas, Th. P. and M.I. Nadiri (1995), “Public R&D Policies and Cost Behavior of the USManufacturing Industries”, NBER Working Paper 5059.
Park, W.G. (1995), “International R&D Spillovers and OECD Economic Growth”, EconomicInquiry, XXXIII, 571-591.
Navas, J.E. (1984), “ a financiación pública de las actividades empresariales en investigación ydesarrollo”, Moneda y Crédito, 37-53.
Poirier, D. (1980), “Partial Observability in Bivariate Probit Models”, Journal of Econometrics,12, 209-17.
Scott, J.T. (1984), “Firm versus Industry Variability in R&D”, in Griliches, Z, R&D, Patents andProductivity, University of Chicago Press.
Veugelers, R. and P. Vanden-Houte (1990), “Domestic R&D in the presence of multinationalenterprises”, International Journal of Industrial Organization, 8, 1-15.