What drives patent performance of German biotech firms? The impact of R&D subsidies, knowledge...
35
http://econ.geo.uu.nl/peeg/peeg.html Papers in Evolutionary Economic Geography # 10.09 What drives patent performance of German biotech firms? The impact of R&D subsidies, knowledge networks and their location Dirk Fornahl and Tom Broekel and Ron Boschma
-
Upload
uni-bremen -
Category
Documents
-
view
2 -
download
0
Transcript of What drives patent performance of German biotech firms? The impact of R&D subsidies, knowledge...

http://econ.geo.uu.nl/peeg/peeg.html
Papers in Evolutionary Economic Geography
# 10.09 What drives patent performance of German biotech firms? The impact of R&D
subsidies, knowledge networks and their location
Dirk Fornahl and Tom Broekel and Ron Boschma

! "!
What drives patent performance of German biotech firms?
The impact of R&D subsidies, knowledge networks and their location
Dirk Fornahl# and Tom Broekel* and Ron Boschma*
# BAW Institut für regionale Wischaftsforschung GmbH, Bremen, Germany,
Tel. +49(0)421-206 99-30, Email: [email protected]
* Department of Economic Geography, Faculty of Geosciences, Utrecht University, The
Netherlands
Abstract This paper aims to explain whether firm-specific features, their engagement in collaboration
networks and their location influence patent activity of biotech firms in Germany in the period
1997-2004. First, we demonstrate that non-collaborative R&D subsidies do not increase patent
intensity of biotech firms. Second, the number of knowledge links biotech firms is also not
influencing their patent performance. However, strong and robust evidence is found that some
but not too much cognitive distance between actors involved in R&D collaborations increases
patent performance of firms. Third, being located in a biotech cluster does positively impact on
patent performance.
Keywords: relatedness, R&D subsidies, biotechnology, knowledge networks, proximity paradox
JEL codes: O33, O38, R58
! #!
1. Introduction Knowledge-based economies have to maintain their technological advantage in the global
competition. They need to keep in touch with the technological frontier and also invest in
technologies, which are important in the future. In this context, biotechnology is assumed to be
one of these promising technologies. Policy makers realized that the biotechnology sector
became a cornerstone of economic growth in knowledge-based economies. Accordingly in the
last decades many policy makers focused on biotechnology, when they tried to develop
innovation strategies. This also holds for policy support in Germany. Cooke (2001) argues that
Germany lags 20 years behind the USA in respect to the commercialization of the biotechnology
industry and 10 years behind the UK. Therefore, the federal government recognized that it had to
intensify its endeavours to wipe out the shortcoming of the German biotechnology sector, which
was caused by the late start of this emerging industry in Germany. One of the first steps in
supporting the German biotechnology industry started in 1995 when the German Federal
Ministry of Education and Research (BMBF) announced the so-called BioRegio competition to
strengthen industry. Moreover, the government aimed at stimulating the patent activities of
German researchers. The proclaimed goal was to promote Germany to become the leading player
in Europe in the biotechnology sector. Hence, it was a strategic aim to strengthen the global
economic competitiveness of German enterprises in the biotechnology sector and in other
biotechnology-influenced industrial sectors. After this initial program several others followed
(e.g. BioFuture, BioProfile, BioChance).
Given the increasing role of public policy, this raises the question whether such public
subsidies for private R&D projects1 positively affect the performance of bio-tech firms. Most
studies that analyze R&D subsidies concentrate on their effects at the firm level (see, e.g.,
Brouwer et al. 1993, Busom 1999, Czarnitzki et al. 2007). Previous research on the effect of
R&D subsidies on patenting activities mostly found a positive relationship (see, e.g., Czarnitzki
and Hussinger 20004, Czarnitzki et al. 2007). Less attention has been focused on the systemic
and collective character of learning processes and potential firm-spanning effects of the
evaluated policy programs. There is increasing awareness that the position of firms in knowledge
networks as well as their selection of partners is affecting their invention activities. In particular,
the degree of cognitive distance with other network partners may be crucial in that respect, as
some authors have suggested (Sorenson et al. 2006, Broekel and Boschma 2009, Boschma and
Frenken 2010). In addition, geographers have stressed that location may also matter (e.g. Powell
!!!!!!!!!!!!!!!!!!!!!!!!!!!!!!!!!!!!!!!!!!!!!!!!!!!!!!!!!!!!1 The policy support programs in the biotechnological field are not only focused on private R&D subsidies, but also on infrastructure or qualification, but a deliberate amount of the financial support is related to subsidies for R&D projects.

! $!
et al., 1996). Not only can the spatial concentration of R&D activities enhance geographically
localized knowledge spillovers, but it may also be beneficial to connected to other regions with
high R&D activities to provide access to extra-regional knowledge.
This paper has three objectives. The first objective is to assess the impact of R&D
subsidies on patent performance of biotech firms. Based on a unique database of R&D subsidies
in Germany, we will differentiate between subsidies granted to a single firm and those for joint
R&D projects. Compared to the analysis of R&D subsidies in general, there is little research
conducted on the question whether co-operative R&D activities have a specific effect on
innovativeness (Dekker and Kleinknecht 2008, Schwarz et al. 2010). This is of increasing
relevance since innovation policy tends to focus more and more on co-operative research
activities. An interesting outcome of our study is that R&D subsidies that focus on single firms
do not enhance the performance of biotech firms, while collaborative research subsidies (i.e.
subsidies that are granted to joint R&D projects with two or more partners) do so to some extent.
The second objective is to estimate the effect of the position of firms in knowledge
networks. The structure of these networks as well as the position of a single organization in these
networks affects the knowledge pool the organizations have access to (Fornahl and Tran 2010).
Previous research suggests that it is not only the structure of the network or a link to a partner in
a joint R&D project that influences firms’ innovative success but also the composition of the
knowledge base of the network partners: Boschma and Frenken (2009) claim that a positive
result concerning knowledge exchange and performance depends on the (optimal) level of
technological or cognitive proximity between partners in the network (see also, Nooteboom
2000, Broekel and Boschma 2009). Our study provides strong and robust evidence that, indeed,
some but not too much cognitive distance with other actors involved in the R&D collaboration
increases patent activity of firms.
The third objective is to investigate the effect of the geographic location on patent
performance of German biotech firms. Many have suggested that co-located firms may benefit
from local knowledge spillovers, especially when these concern firms active in the same
technology fields. Others have suggested that local knowledge ties need to be supplemented by
non-local knowledge ties, because access to extra-regional knowledge may be crucial (Bathelt et
al. 2004, Ponds 2008, Ter Wal 2009). Interestingly, our study only finds evidence for the
importance of being located in a biotech cluster while inter-regional linkages have no or even a
negative effect on firm performance.
The paper is structured as follows. In Section 2 we describe a number of drivers of patent
performance of firms, derived from the recent theoretical literature. Section 3 provides some
background information on the biotechnology industry in Germany, the description of the

! %!
employed databases, the construction of the variables, and the methodology used. In Section 4,
we will present and discuss the main findings. The last section concludes.
2. Theoretical background There is a huge literature focussing on firm-internal features to explain the success of firms in
learning and innovation. Many have suggested that R&D intensity of firms and the size of firms
has a positive effect (Becker and Dietz 2004), while the age of firms has a negative effect on
performance (Frenkel and Schefer 1998).
There also exists a rich literature on the effects of R&D subsidies. The main motivation
for R&D subsidies is that investments in R&D are perceived to be below a social optimum. Too
low R&D investments can be a result of uncertainty and high risks involved in research. For
instance, the effects and costs of long-running innovation projects are difficult to measure ex-
ante preventing solid investments plans (Cantwell 1999). Most of the studies investigate the
effects of subsidies on firms’ R&D efforts (see, e.g., Busom 1999, Goerg and Strobl 2007),
employment growth (see, e.g., Brouwer et al. 1993, Koski 2008), and collaboration and patenting
activities (see, e.g., Czarnitzki and Hussinger 2004, Czarnitzki et al. 2007). The effects are
generally found to be positive. A major concern in these studies is that public subsidies may
“crowd out” private R&D investments (see Peters 2000). The empirical picture is still mixed,
with more recent studies assigning a small relevance to crowding out (see, e.g., Czarnitzki et al.
2007).
In many knowledge-based industries, a firm must also have access to the most recent
scientific and technical knowledge in order to successfully develop and market a product. Two
aspects hinder the acquisition of external knowledge. Although many research results are
published in scientific papers, which are publicly available, knowledge is not only complex, but
also often tacit which both increase the difficulty and costs of knowledge transfer. The transfer
of complex knowledge – where the results depend on the steps involved in getting there – or tacit
knowledge typically requires that the sender helps the recipient to identify and correct mistakes
in transmission (Sorenson et al. 2006). Intensive face-to-face interaction between the recipient
and the possessor of the knowledge are necessary. Hence, knowledge, especially in fields like
biotechnology, is generated by close contact with other experts in the field largely based upon
collaborative research (Owen-Smith and Powell 2004; Stuart et al. 2007). The two most
important sources of biotechnological knowledge are first universities as well as research
organizations active in biotechnology and other closely related fields (Zucker and Darby 1996)
and second, other existing biotechnology and pharmaceutical companies (Haug 1995).
Another argument for the importance of collaborative research is the observation that

! &!
many firms lack the resources to conduct large research and development projects on their own
(Fritsch et al. 2005). These situations can be overcome by collaborating. However, free riding
can reduce the benefits of collaborative agreements (see Heijs 2003). In such cases public
subsidies may give firms the necessary pecuniary incentives to join their R&D efforts and
accomplish large-scale research projects together. In this respect, R&D subsidies have an
immediate resource effect by enlarging total R&D investments.
However, most of the existing studies evaluating R&D subsidies do not take into account
the systemic character of innovation processes and potential firm-spanning effects of policy
measures. In this respect they miss the effects of one firms’ behaviour on the activities of other
organizations it is connected to in one way or the other. In this paper, we examine the effect of
collaborative R&D in biotechnology. Most policy initiatives make R&D subsidies conditional on
firms and other organizations forming teams, which guarantee extensive knowledge sharing.
With this design policy aims at stimulating collective learning processes that increase overall
innovation performance (see, e.g., Camagni 1991). Hence, policy measures affect individual
firms and at the time their relationships with other organizations. This concerns primarily direct
interaction between organizations, which allows them to learn from each other.
Besides direct links to partners firms and other organizations are embedded in a broader
social context and systems of innovation (Boschma, 2005). Firms’ embeddedness in knowledge
networks has increasingly been recognized as an important determinant of their economic and
innovative performance (see, e.g., Powell et al. 1996, Walker et al. 1997). Ahuja (2000) analysed
the impact of direct and indirect network links on the innovative performance – measured by
patents – in the chemical industries in Western Europe, Japan and the USA. He found that direct
or indirect ties stimulate innovative output. However certain combinations of both types of
linkages yield negative effects. For example, direct ties seem to reduce the effect of indirect
ones.
In this paper, we concentrate on two types of social context, namely firms embeddedness
in knowledge networks as well as whether they are located within a biotechnology cluster.
However, concerning the first, we have to point out that although (informal) social networks play
an important role in accessing critical resources such as knowledge (Sorenson and Audia 2000),
we primarily focus on formal knowledge interactions represented by subsidized research
activities.
Cohen and Levinthal (1990) argue that the utilization of external knowledge depends on
the different absorptive capacity of the firms. This determines not only their likelihood to engage
in knowledge sharing but also the likelihood that obtained knowledge can be successfully used
and implemented. Beside this firm-specific capability, the utilization of knowledge also depends

! '!
on the characteristics of the knowledge network as well as on the knowledge base of partners in
this network. Cognitive proximity refers to the degree of overlap between those actors’
knowledge bases. Actors need to have a sufficient absorptive capacity to identify, interpret and
exploit knowledge of other actors. Cantner and Meder (2007) find that cognitive proximity is
relevant for cooperation activities. They demonstrate that the technological overlap between two
actors (cognitive proximity) positively influences the likelihood of these actors to engage in
cooperation.
Mowery et al. (1998) finds similar results and, moreover, suggests an inverted U-shape
relationship between the probability to cooperate and the technological (cognitive) similarity of
two actors. In a recent paper, Boschma and Frenken (2009) take up this idea and introduce what
they describe as the so-called proximity paradox. While proximity may be a crucial driver for
agents to connect and exchange knowledge, too much proximity between these agents might
harm their innovative performance. So, while a high degree of proximity may be considered a
prerequisite to make agents connected, proximity between agents does not necessarily increase
their innovative performance, and may possibly even harm it. If two actors’ knowledge bases are
too similar, the likelihood of an innovative recombination is lower than when dissimilar
knowledge bases are merged (see, e.g., McEvily and Zaheer 1999). According to Nooteboom
(2000), there exists a trade-off “…. between cognitive distance, for the sake of novelty, and
cognitive proximity, for the sake of efficient absorption” (p. 152). Following Nooteboom’s work
on optimal cognitive distance (Nooteboom 2000), Boschma and Frenken (2009) claim it depends
on the (optimal) level of proximity whether a connection between agents will lead to higher
innovative performance or not. In other words, both very proximate and very distant actors are
likely to gain little from cooperating in innovation activities. The optimal level of cognitive
proximity follows from the need to keep some cognitive distance (to stimulate new ideas through
recombination) and to secure some cognitive proximity (to enable effective communication and
knowledge transfer). Moreover, high cognitive proximity generally implies that two firms have
very similar competences, which means that when they engage in knowledge exchange, they run
a serious risk of weakening their competitive advantage with respect to the network partner. A
study by Boschma and Broekel (2009) based upon the aviation industry in the Netherlands
provides empirical evidence for the proximity paradox with respect to the similarity of the
knowledge bases of the network partners.
Consequently, it is not so much the quantity of contacts and intensity of knowledge
exchanges that matters for firms’ success, but rather the type of knowledge exchanged, and how
that matches the existing knowledge base of the firms. In this respect, cooperation is most
fruitful when network partners have technologically related, not similar knowledge bases.

! (!
Following the literature on knowledge networks (Giuliani and Bell 2005, Boschma and
Ter Wal 2007, Sammarra and Biggiero 2008), we focus on the exchange of technological
knowledge in R&D activities, which is regarded as most relevant for firms’ innovation activities
in this sector. Second, we examine whether cognitive proximity matter for firms’ innovation
performance. We also test whether there is a curvilinear relationship between the cognitive
dimensions and innovative performance. Doing so, we determine whether the proximity paradox
related to cognitive or technological proximity holds for the German biotechnology industry.
In addition to the effects of embeddedness in knowledge networks, it is also argued that
companies in localised industrial clusters experience higher innovation rates than those outside
clusters (Audretsch and Feldman 1996, Baptista and Swann 1998). The positive effect of clusters
on innovation activities mainly result from localised learning process (Malmberg and Maskell
2006). Such localised learning depends on two factors. The first describes local capabilities that
are “some forms of knowledge creation and exchange that are still very much rooted in the
cultural, institutional, and social structures of particular places” (ibid.: 3) or the access to local
resources. The second factor involves the influence of spatial proximity on interaction.
Knowledge exchange in spatial proximity can take place in several ways such as direct
interactions based on collaborations, monitoring of other firm’s activities, social contacts
between employees or through labour mobility. Such positive effects are identified in several
empirical approaches. Baptista (2000) shows that innovations are spread more quickly within
regional clusters than outside these clusters. Audretsch and Feldman (1996) compare the location
of innovative activity of 210 industries that are in different phases of the industry life cycle. They
find out that geographically concentrated companies do exhibit a disproportionately high
innovation rate during the growth phase of the industry. Conversely, companies outside clusters
are more innovative during later stages. They conclude that “the positive agglomeration effects
during the early stages of the industry life cycle are replaced by congestion effects during the
later stages of the industry life cycle” (Audretsch and Feldman 1996: 253). Since we examine the
German biotech industry in the 1990s; which can be considered as an industry in an early stage
of the life cycle, we expect a positive effect of being located inside an industrial cluster.
Besides this positive effect of local interactions and localisation externalities, in order to
sustain a regional competitive advantage, local interactions and outside linkages must be
balanced in order to generate synergies and to introduce new knowledge at the same time
(Albino et al. 1999; Bathelt et al. 2004). Such outside linkages bring new knowledge into the
cluster and prevent lock-ins. Furthermore, most biotechnology firms compete on a world market
and accordingly also have to access knowledge their competitors from regions or nations outside
their home region have access to. Hence, we expect those regions with a high degree of inter-

! )!
regional connections to generate more innovations than regions fewer external connections.
3. Empirical Background 3.1 The German Biotechnology Industry
Patent activities in emerging markets have always been dynamic. In this respect, the patent
activity in the German biotechnology sector is no exception, but the growth process took several
years to start and to show a significant increase. Figure 1 illustrates the general evolution of
German biotechnology patent applications in comparison to the development in the USA in the
period from 1986 to 2005. The number of patent applications grew very slowly in the 1980s and
the first half of the 1990s in Germany. The level as well as the dynamics of the activities in the
USA was higher during these years. This motivated the German government to introduce a
whole set of innovation policy programs in order to increase the number of firms as well as the
number of innovations. These policies targeted a wide variety of issues including for example,
the transfer of university knowledge to private firms, the stimulation of collaborative R&D
activities, and support for local clusters. From the development of the German patent
applications one can conclude that Germany did not lose ground to the USA, but was able to
catch-up. After the year 2000 (with around 1,500 patents) the number of patents decreased in
both countries. The decreasing number of patent applications likely refers to the burst of the New
Economy Bubble. This limited the availability of venture capital and hence the necessary
financial resources for further explorations. The very low figures – especially for the USA – in
2005 are affected by a right truncation of the data. But in general German biotechnology
organizations were better able to compensate the downturn after 2000.
Figure 1 about here
A closer look on the organizations in the top 10 lists for 1994-1995 and 2003-2005 reveals that a
high number of organizations left the top 10 ranking while others entered. In general the
patenting activities are dominated by multinational firms while public research organizations
only playing a minor role (concerning the direct activities). From these findings we can conclude
that the size of the firm (measured by employees or the patent stock) is likely impacting its
innovative activities. However, at the same time some size-independent volatility can be
observed in the activity levels of firms.
For the identification of the biotechnology firms in Germany we rely on the German
Biotechnology Year and Address Book (versions 2002 and 2004), which covers around 750
firms and many research organizations. The directory contains information on, for example, the

! *!
location, the number of employees, the existence of a research laboratory and the central
research fields the firms are active in. For 399 of these firms we can extract the necessary firm-
level data for our analysis.
Table 1 about here
3. 2. The subsidies database and the identification of collaboration In the present paper, we use data on R&D projects that were subsidized by the German federal
government. In a similar manner as most other advanced countries the German federal
government is actively supporting public and private research and development activities with
R&D subsidies programs (Czarnitzki et al. 2007). For example, in 2001 in total 7,227,838,000
Euro were spent on these measures. In 2008 this sum grew to 9,126,670,000 Euro (BMBF
2008a). While the Federal Ministry of Education and Research (BMBF) is the primary source of
this type of funding, the Federal Ministry of Economics and Technology (BMWi) and the
Federal Ministry for the Environment, Nature Conservation and Nuclear Safety (BMU)
contribute as well. In addition to the federal ministries also the ministries of the federal states
provide significant funding programs. Nevertheless, the federal level is still the more important
one (Hassink 2002) and hence we concentrate our analysis on those programs initiated by the
federal ministries.
The above-mentioned federal ministries publish comprehensive information on the
supported projects in the so-called “Förderkatalog” (subsidies catalogue), which is accessible via
the website www.foerderkatalog.de. It lists detailed information on more than 110,000 individual
grants that were supported between 1960 and 2009. Amongst this information are a grant’s
starting and ending date, a title including a very short description, the granting sum, the name
and location of the receiving organization, as well as a classification number. In the following
some of this information are explained in more detail.
The classification number (in German “Leistungsplansystematik”) is an internal
classification scheme developed by the German Federal Ministry of Education and Research
(BMBF) and consists of 16 main classes, which include biotechnology, energy research,
sustainable development, health and medicine. These main classes are split into a varying
number of sub-classes. These are considerably fine-grained as they allow for instance the
differentiation between photonics (class: I25020), optoelectronics (class: I25010), plant
genomics (K04210), and micro-organic genomics (K024220). While the classification scheme
takes into account technological differences it also covers non-technological activities, which is
why we refer to its classes in the following as activities. At the highest level of disaggregation
(six-digit level) more than 1,100 unique activity classes have been assigned to projects between

! "+!
1960-2009.2
Most importantly, the title of the project contains information on the collaborative or non-
collaborative nature of projects. More precise collaborative projects are labelled as “Verbund-
projekt” or “Verbundvorhaben”, which marks joined and collaborative projects, respectively.
Organizations that participate in such a project agree to a number of regulations among which
the following are the most important ones (self-translated extract of the information sheet
concerning the application of subsidies for joined projects (BMBF 2008b)):
1. Every partner is authorized to make unrestricted use of the project’s results.
2. Intensive collaboration is the basis for finding solutions.
3. Within the scope of the project, partners grant each other a positive and free-of-charge
covenant on their know-how, copy and intellectual property rights, which existed before a
project’s start.
Amongst the project’s results inventions have a special status. Extraordinary contributions to an
invention have to be acknowledged.
While the first three points allow for intensive knowledge exchange, the fourth point
provides incentives for innovation. Partners negotiate about how to deal with inventions and who
receives the exclusive right of use. However, the partner with the most significant contribution to
the invention is granted a strong position.
Accordingly, two organizations are connected if they participate in the same joint project
because this represents strong knowledge links with a significant potential for knowledge
sharing. We manually identify such joint projects on the basis of the title entry in the database. In
general, it is a first indication of a joint project if the title contains words like “Verbundprojekt”,
“Verbundvorhaben”, “Forschungsverbund”, and “Verbund”. In other cases projects have the
same title but no indication on if it is a joined project or not. This applies for example to certain
special cases as e.g. the collaborative network created for the analysis of genes
(“Genomforschungsnetz”). In this case an Internet search on the title was conducted to retrieve
additional information. If no definite indication for a joint project is found the project is treated
as non-collaborative. However, it turns out that some of these joint projects are really large scale
including more than 100 actors. It seems to be however unlikely that knowledge exchange takes
equally place among all of these actors. We therefore apply a more conservative approach. In
many cases, the title / description includes information on the structure of the project. More
precise, very frequently these joint projects are divided into work packages (“Teilvorhaben”,
“Teilprojekt”). In case a joint project is divided into at least two work packages and each work
!!!!!!!!!!!!!!!!!!!!!!!!!!!!!!!!!!!!!!!!!!!!!!!!!!!!!!!!!!!!2 The classification scheme as well as the assignment of projects to activity classes has been subject to some change over the years Czarnitzki et al. 2002. However, our data is affected only marginally.

! ""!
package includes at least two partners, we defined only those organizations to be linked that
participate in the same work package. In general about thirty percent of all projects in the
database are projects in which more than one actor participates.
3.3 Construction of variables
To approximate a firm’s innovation activities, we collected information on firms’ yearly patent
activities from 1997 to 2004. The patent data is derived from the EPO Worldwide Statistical
Patent Database version October 2007 (PATSTAT October 2007 database). We assumed that all
patents with economic importance respectively all patents for which the patent applicant
presumes that their invention will be important on the global market are filed at the EPO or go
through the filing process of the World Intellectual Property Organization (WIPO). Hence, we
just focus on patents filed at these two organizations. In the next step all patents belonging to the
biotechnology field are identified by means of the International Patent Classification (IPC) and
the OST2/INPI/ISI Concordance in the version of 2000 where the IPCs are classified in 30
technological fields. A biotechnology patent in our analysis therefore means that a patent has at
least one IPC code which falls into the category of the technological field ‘biotechnology’. For
the analysis of the origin of the patents we searched the names of the firms from the
Biotechnology Year and Address Book in the PATSTAT database. By merging the list of firms
with the patent list it was possible to identify all patents with at least one applicant listed in our
core firm directory. We weighted the number of patents for each applicant by the amount of
applicants on the patent. Hence, if there are, for example, two applicants on a patent both are
assigned 0.5 patents. This number is summed over all patents a firm (co-) applied for resulting in
our dependent variable (PAT), which can be interpreted as the number of patents weighted by
the number of co-applicants.
The first firm-level independent variable is straightforwardly created. Using the
information on a firm’s founding date their age in each considered year is estimated (AGE).
Secondly, we know their employment in the years 2002 and 2004. Our patent data ranges
however from 1997 to 2004. Employment information for the missing years is however not
available, which is why we have to approximate it. In case of 2003 this is easily defined as the
mean between employment in 2002 and 2004. For the other years we have to take a different
approach. From Müller (2003) we know the yearly employment growth rates in the
biotechnology industry from 1997 to 2002. The first employment set-up simply adapts all firms’
employment according to the yearly growth rates, which implies that they all have the same
growth rate. The resulting employment numbers are denoted as EMPLav. In the second set-up we
take into account each firm’s deviation from the average employment growth of the sample firms

! "#!
between 2002 and 2004. The industry’s growth rate is then adapted by this deviation yielding
firm individual growth rates for the years 1997 to 2002. The variable EMPLSF captures the
obtained employment numbers. In the analyses we primarily use the latter employment number
because we think they are the better approximation. EMPLAV is rather employed for robustness
checks.3
In order to account for localization economies we include a technological cluster
coefficient (CI) for each single year. This index is a modified version of the industrial cluster
coefficient suggested by Sternberg and Litzenberger (2004) but in contrast to them using the
number of employees, we consider the number of patents generated by organizations located in
the 97 German planning regions (“Raumordnungsregionen”) as the core variable. In addition this
index accounts for the number of inhabitants, the size of the region and the number of patenting
organizations to generate an index which is comparable between regions. The index is presented
in Figure 2. From the results we can conclude that there exist seven technological biotech
clusters in Germany with very high levels of patenting activities: Berlin, Göttingen, Hamburg,
Munich, Rhine-Main, the Rhineland and Rhine-Neckar. In the empirical approach we will test
whether single firms located in such clusters can benefit from the activities of neighbouring
firms.
Figure 2 about here
On the basis of the subsidies data previously presented, information is easily obtained on the
amount of subsidies each firm receives in a particular year. Hereby, the information on the
receiving organization is used to match the subsidies data to the firm characteristics data
previously presented. Given that the patent data covers the period 1997 to 2004 and the existence
of a time lag between patent data and received subsidies, we collect the subsidies data for the
period 1992 to 2004. More precise we consider all supported projects that started before
December 31st 2004 and ended after January 1st 1995. The database is furthermore limited to
projects concerning biotechnology. Accordingly, all projects are considered that fall into activity
class “K” in the “Förderkatalog”. About 3,329 projects belong into this category in the
considered time period. These projects correspond to 928 individual actors receiving subsidies.
170 of these are matched firms for which patent and employment numbers have been collected.
Hence, of the 399 firms about 42% received some sort of subsidies in this period.
The first subsidies variable created captures the amount of total subsidies a firm received
in a particular year (SUBS). For a more detailed analysis this variable is split into the amount of
subsidies attributed to non-collaborative projects (SUM) and the summed grants of collaborative !!!!!!!!!!!!!!!!!!!!!!!!!!!!!!!!!!!!!!!!!!!!!!!!!!!!!!!!!!!!3 Both AGE and EMPL are furthermore employed as proxies for firm internal R&D efforts (budget, personell). We expect that these two variables should capture at least some effects of internal R&D.

! "$!
projects (CSUM). As we have information on the exact starting and ending date of a project the
amount is estimated accurate to the day. Non-collaborative projects are defined as projects with
just one receiving actor. Collaborative projects are those that have more than one receiving actor.
For both variables we are also considering squared versions, whereby the mean is subtracted
beforehand to avoid multicollinearity. In case of collaborative projects we moreover estimate the
average amount per collaborative subsidies grant (PCSUM). This is motivated to separate
network effects (which depend on the number of collaborative projects) from the effects of large
grants received for a single project.
Next, we construct for each year from 1995 to 2004 the year specific collaboration
network in biotechnology on the basis of the subsidized projects. On average the so created
networks consist of 311 actors. Of these 35 to 97 actors match our firm characteristics data.
Figure 3 about here
Figure 3 displays the subsidised network for the year 2001. There is one large component being
composed of most of the organizations, several smaller subcomponents, and some isolated
actors. Some further network characteristics of the corresponding networks are presented in
Table 3 in the Appendix. On the basis of these networks for each actor we compute the degree
and the betweenness centrality (Freeman 1979, Wasserman and Faust 1994). Centrality describes
in general how central an actor is in a network. We use the most straightforward measure of
centrality: degree centrality. It represents an actor’s number of links.
whereby ni indicates a link. Similarly, betweenness centralization refers to the extent to which
actors’ shortest paths connections run through the same nodes. An actor receives the maximum
value if his surround network corresponds to a perfect star. It can be estimated by:
with gjk as the geodesic distance (shortest path) between actor j and k. The two variables are
denoted by DEGREE (for degree) and BETW (for betweenness).
To capture the geographic dimension of the network the variable DISTANCE is defined
as the mean geographic distance measured in kilometres between a firm and its collaboration
partners.
As the last firm-level variable, we define a technological similarity measure. We follow
the suggestions of Broekel and Boschma (2009), which rely on the approach by Breschi et al.
(2003) to measure technological relatedness. In order to define the similarity between two actors
! "%!
these authors compare the similarity of their technological profiles. While Broekel and Boschma
(2009), rely on self-collected NACE code information4 and Breschi et al. (2003) on patent
classes, we make once more use on the data in the subsidies database. More precisely, we use the
activity classification scheme of the “Förderkatalog”, i.e. the “Leistungsplansystematik”). As
pointed out above, each project has an activity class assigned corresponding to the content of the
project.
In a first step, all projects are identified an actor participated in each year from 1997 to
2004. This includes also non-biotechnology related projects. It shows however that on average
87% (standard deviation: 0.23) of the projects the firms in our sample engage in are classified as
biotechnology. On this basis a “Leistungsplansystematik” profile is created, which corresponds
to the vector of an actor’s six-digit activity classes.
For the second step, we need a measure of two activity classes’ similarity. For this, we
rely on the similarity matrix developed by Broekel (2010). He counts the number of activity
classes’ co-occurrences at the organization level for the complete database ranging from 1960 to
2009. The basic idea is that if an organization is frequently engaged in projects of activity A as
well as in projects of activity B both activities are assumed to be similar. Accordingly, the
frequency of co-occurrences gives an intuitive similarity indicator. In a similar manner as
Breschi et al. (2003) and Ejermo (2003) he also considers indirect relations between two
activities in addition to the direct described above. This means that if activity A is frequently
assigned to the same organizations as activity C, and the same is true for activities B and C, A
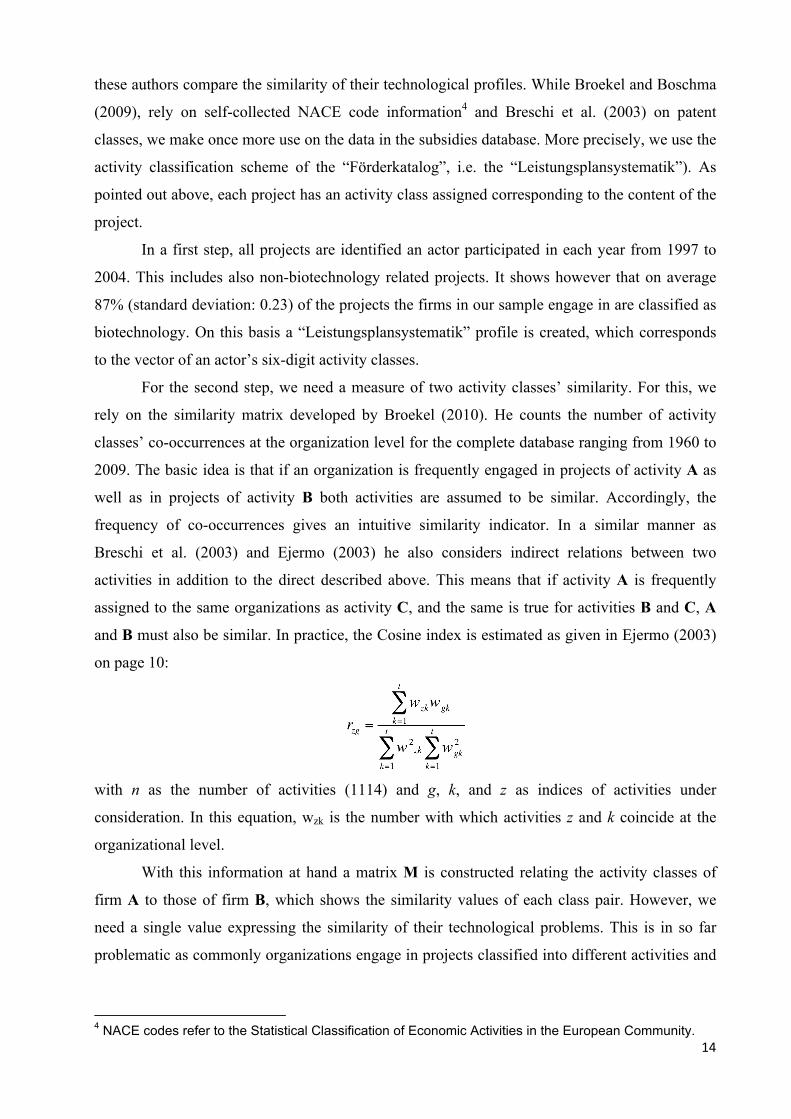
and B must also be similar. In practice, the Cosine index is estimated as given in Ejermo (2003)
on page 10:
with n as the number of activities (1114) and g, k, and z as indices of activities under
consideration. In this equation, wzk is the number with which activities z and k coincide at the
organizational level.
With this information at hand a matrix M is constructed relating the activity classes of
firm A to those of firm B, which shows the similarity values of each class pair. However, we
need a single value expressing the similarity of their technological problems. This is in so far
problematic as commonly organizations engage in projects classified into different activities and
!!!!!!!!!!!!!!!!!!!!!!!!!!!!!!!!!!!!!!!!!!!!!!!!!!!!!!!!!!!!4 NACE codes refer to the Statistical Classification of Economic Activities in the European Community.

! "&!
no information is available on the share of turnover or employees attributed to each activity.5 We
solve this problem by using two different measures. In the first, we search for the most similar
pair of activities in the two activities-profiles. More precisely, we compare two organizations’
(i,j) vectors of activities (Ti and Tj). In practice, we take the maximum value found in matrix M.
This value is taken as similarity index SIMmax. Because the values of the Cosine index rzg are
between 0 and 1, the similarity index ranges from 0 and 1 as well, with 1 indicating perfect
similarity. In extreme cases, all of organization i’s activities are compared to one class of
organization j. The rationale for this indicator is that if two organizations engage in at least one
similar activity a basis exists for efficient communication. The index can be interpreted as the
maximal overlap of two organizations’ knowledge bases.
In light of the proximity paradox discussion, we expect an inverted u-shape relationship
of this index with firms’ innovation performance. Therefore, a quadratic term of this indicator is
considered. Because this may introduce severe multicollinearity, the mean of the variable is
subtracted before being squaring. Hence SIM2 will be large for small and large values of
similarity.
While the first indicator puts a lot of weight on a single technology pair, a second
similarity indicator is constructed, which can be regarded as average similarity (SIMav). In this
case, it is assumed that all technologies assigned to an organization account for equal turnover
(employment) shares. Then a similarity indicator can be defined as the average similarity of two
organizations’ technology profiles by simply calculating the mean of matrix M. We believe the
first indicator to be more appropriate, which is why we primarily use the second one to test the
results’ robustness. In general, this second is a more conservative measure of similarity. In a
similar manner as for the first measure a squared version of this indicated is employed (SIMav2).
The following variables are defined at the regional level to test for additional regional
effects on firms’ innovation performance – besides the pure cluster index presented above. For
their construction we use the entire data set of subsidized biotechnology R&D projects between
1995 and 2004 included in the “Förderkatalog”. This applies to 3,265 entries and 920 unique
actors engaging in 2,028 projects. All actors have been assigned to the according planning region
allowing for an aggregation of their data at the regional level. On this basis ROR_SUM and
ROR_CSUM represent the summed non-collaborative and collaborative subsidies grants at the
level of the 97 German planning regions. ROR_DEGREE captures a region’s degree centrality in
the regional network of subsidized R&D collaboration and ROR_BETWEEN the corresponding
betweeness centrality.
!!!!!!!!!!!!!!!!!!!!!!!!!!!!!!!!!!!!!!!!!!!!!!!!!!!!!!!!!!!!5 In principle one could use the project’s grants to weight the importance of each class. This assumes that the size of a project (in terms of money) is a good approximation of an activity’s importance for a firm.

! "'!
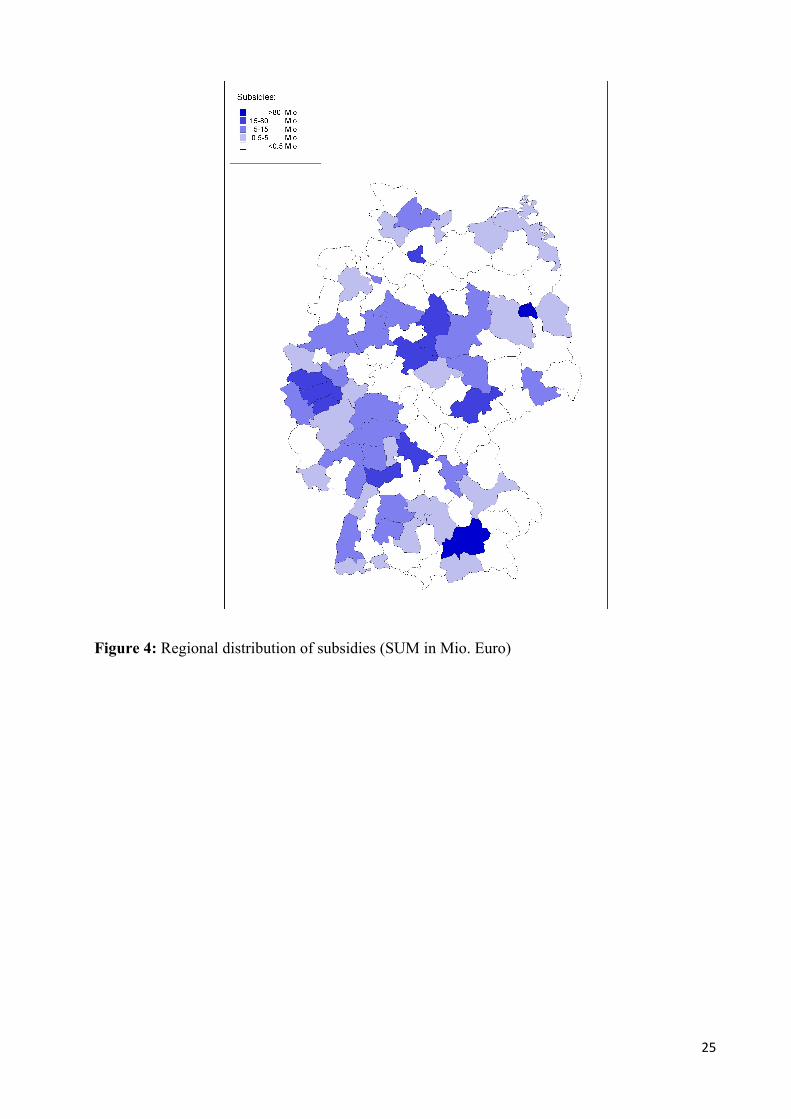
Figure 4 about here
Figure 4 shows the distribution of SUM for the year 2001 over the planning regions. This map at
least at first glance corresponds to the biotechnological cluster map (Figure 2) with especially
Munich, Berlin and Hamburg receiving over 80 Mio. Euros.
In Figure 5 the links between the planning regions for the year 2001 based upon joint
subsidised projects are represented. Peculiarly the Munich region in the south is well connected
to other German biotech regions while other clusters such as Hamburg or Göttingen are only
weakly connected. Hence, the clusters seem to have different levels of external connections.
Figure 5 about here
4. Explaining innovative success 4.1 Method
Some descriptives and the correlations of the above-described variables are shown in
Table 4 and in the Appendix.
We have to decide upon the correct lag structure between subsidies and patent data. It is
well known that at least one year passes before an invention is turned into a patent application.
The patent office usually needs a minimum of one year to proof and decide upon the application.
Accordingly, at least two years go by before an invention is finally patented. We know the
starting date of the funded R&D projects and in most instances the work starts at that very date.
However, the project does not deliver inventions right from the start but rather at least one,
maybe even two years, of work need to be invested. In light of this a reasonable time lag
between R&D subsidies and patents should be 3 to 4 years. Hence, we test both lags separately,
but in the following we mostly present the results of the 4th lag scenario since the results for the
4th and 3rd lag are overlapping to a large degree.6 Note that this time lag applies to all measures
based on subsidies data, which includes all network and similarity measures.
In general all variables based on the subsidies data are estimated for the years 1992-2004.
The patent data and most firm characteristics have been collected for the time period 1997-2004.
Some firms however started later than 1997. In fact in 1997 only 218 out of 399 firms exist, in
1998 this number increases to 269, in 1999 to 319, and by 2002 to sample is complete. For the
panel regression this means that we have to deal with an unbalanced panel. The Hausman test
moreover indicates that fixed-effects models (chisq = 78.35, df=9, p-value = 0.000) are
!!!!!!!!!!!!!!!!!!!!!!!!!!!!!!!!!!!!!!!!!!!!!!!!!!!!!!!!!!!!6 We also estimated the models for a two years lag to assess the robustness of the results. However, while the short lags structure makes the model less plausible the results change only little, which is why we don’t report these models. The results for the 2nd and 3rd lag scenarios can be obtained upon request from the authors.
! "(!
consistent and hence to be used. Our dependent variable is over-dispersed with zeros (2776 zero
to 466 non-zero values). Despite the splitting of patents by the number of co-applications, it
remains a type of count data.7 We therefore employ a negative binominal regression panel
approach. Its fixed effects specification however has one advantage: the value of an
observation’s dependent variable is required to change at least once. This reduces the number of
observations significantly (in the 3rd lag scenario down to 132 firms and 747 observations, in the
4th lag scenario even to 109 firms with 569 observations).8
The correlation structure of the variables (presented in Table 5 in the Appendix) reveals
that both similarity measures (SIMmax and SIMav) are highly correlated, which is why we stick to
SIMmax in the following. Moreover, the dummy for 1998 causes some multicolinearity problems
in the 4 lags scenario forcing us to drop it in the analyses. Some variables (e.g. EMPL, AGE, and
the amounts of subsidies) are strongly skewed. In the estimations we correct for this by taking
the log.
Table 2 about here
4.2 Results
Table 2 shows the results of the negative binominal panel regression for the 4th lag scenario. In
all models, we find the year dummies positive and significant. This indicates an increasing patent
intensity over the years during our period of investigation.
First, we report on the firm-specific features of our estimations. As shown in Table 2, size
has a strong and positive effect on patent intensity of bio-tech firms in Germany. This is in line
with other studies showing that large firms have advantages in patenting and innovating (Becker
and Dietz 2004). The insignificance of age however contradicts the literature that stresses that
younger firms in high-tech industries are more innovative (Frenkel and Schefer 1998). There
might be three explanations for this finding: a) the young firms really have just started their
business and were not yet able to patent, b) large firms might have co-operated with younger
firms to generate patents and c) as previous research has shown old incumbent firms are very
well able to generate innovations (Chandy and Tellis 2000). We also tested for the influence of
the total amounts of R&D subsidies at the firm level (SUBS). Here, we found a positive and
significant effect. Then, we split R&D subsidies into collaborative (CSUM) and non-
!!!!!!!!!!!!!!!!!!!!!!!!!!!!!!!!!!!!!!!!!!!!!!!!!!!!!!!!!!!!7 The data is transformed into integer values by multiplying with 100 and rounding up to the next full count. This transformation does not impact the results. 8 We also run some alternative models including a lagged dependent variable, which however does not impact the results. Considering this variable may however cause problems of serially correlated disturbance, which is why we don’t report the results. They can be obtained upon request from the authors.

! ")!
collaborative subsidies (SUM). The most interesting finding is the non-significance of non-
collaborative R&D subsidies in all specifications. In other words, we do not find any support for
a positive effect of non-collaborative subsidies. In the lag 4 specification, this is also true for
collaborative R&D subsidies. However, in the lag 3 specification, the coefficient of collaborative
subsidies turns into a positive and significant effect. Accordingly, large amounts of collaborative
subsidies seem to yield benefits with a 3 year lag at the firm level. In the case of collaborative
subsidies, we also estimated the effect of the average amount a firm received per collaborative
subsidy (PCSUM), but in all specifications, this variable is insignificant. Thus, overall, we found
very little evidence of R&D subsidies affecting the performance of biotech firms9.
Second, we present the results with respect to the network variables. We first tested the
effect of degree centrality (DEG), that is, the number of R&D links a firm has. In all model
specifications, this variable was insignificant, suggesting that patent performance is not affected
by the degree of connectivity in the collaboration network. Considering betweeness centrality
(BETW) instead of degree centrality did not yield any significant results at the firm level either.
However, we found evidence for a network effect when we account for the type of partners that
are involved. As shown in Table 2, the firm’s average cognitive similarity with its collaboration
partners (SIMMAX) has a positive effect on the patent activity of firms in all model specifications.
In other words, the higher the cognitive distance with network partners, the higher the patent
performance of the biotech firm. In line with Boschma (2005), we also tested whether too much
cognitive proximity (as too much cognitive distance with network partners) harms the patent
performance of firms. For that purpose, we added a quadratic term for this variable (SIMMAX2).
As expected, the coefficient of this variable is negative and significant, at least in the 4-lag
specification. In other words, for technological similarity, we found considerable evidence for an
inverted-U shape relationship between technological similarity with network partners and patent
performance of biotech firms. This finding is in line with the cognitive proximity paradox
(Boschma and Frenken, 2010) and highlights the importance of collaborating with the right
partners.
To shed more light on this latter relationship, we ran non-parametric bivariate regressions
with the patent numbers as dependent and SIMmax (in the 4th lag model). We use a cross-
validation method for smoothing the parameters as given in Bowman and Azzalini (1997).
Figure 6 shows the resulting scatter plot and the fitted curves as well as their bootstrapped error
bands. Note that we cut some very large observations of PAT for visual reasons. See Table 4 in
the Appendix for the maximum values of PAT. In case of SIMmax, the inverted u-shape is clearly
!!!!!!!!!!!!!!!!!!!!!!!!!!!!!!!!!!!!!!!!!!!!!!!!!!!!!!!!!!!!9 We also tested for non-linear effects in case of the subsidies variables but did not find any indication of such, which is why we don’t report these findings.

! "*!
visible and seems to be robust in the plot.
Figure 6 about here
Thus, overall, we found no evidence that intensive collaboration or a central position in R&D
collaboration networks is sufficient to increase patent performance. What matters is being
connected to partners that have access to similar but not too similar knowledge bases, i.e. to
partners that have complementary or related competences.
Third, we report the findings on the regional level. We found that the cluster index has
a positive and significant effect on patent performance in all model specifications. Apparently,
being located in a biotechnology cluster with high levels of patenting activities positively
impacts on the patent activities of single firms. Hence, the more active the local biotech cluster is
in generating innovation, the more single firms can profit from being located in such a cluster.
This finding supports the argument that localised learning and localisation economies push
innovative activities in regions. In contrast, subsidies play only a minor role with regard to
enforcing patent activities. The total sum of R&D subsidies at the regional level (ROR_SUBS)
does not enhance patent activity. When we distinguish between collaborative and non-
collaborative projects at the regional level (ROR_CSUM and ROR_SUM, respectively), we only
found some evidence for a positive effect of ROR_CSUM in some specifications of the 4th lag
approach, but not in the 3rd approach. This latter result might capture a tendency of local biotech
firms to collaborate more – especially if supported by subsidies, which leads to a positive
regional spillover effect on patent performance of firms. Subsidies directed to single firms do not
have a positive effect on innovative performance and in one model even a negative one can be
identified. Last, we tested whether biotech firms may benefit from being connected to other
biotech regions in Germany, through which inter-regional biotech knowledge may flow into the
region (ROR_DEGREE). As shown in Table 5, this latter variable has a negative effect in the 4th
lag specification10. Accordingly, being located in regions in which actors collaborate a lot with
actors from many different regions decreases firms’ patent performance. While surprising on a
first glimpse, the finding is in line with the results of Broekel and Meder (2008) that observed a
negative relationship between high levels of inter-regional collaboration and regional innovation
efficiency. We also tested the average distance to collaboration partners (DISTANCE), which
however does not seem to be related to firms’ innovation performance.
Thus, in sum, our findings suggest that co-located biotech firms do benefit from local
knowledge spillovers and collaborative subsidies in the region, but they do not gain from inter-!!!!!!!!!!!!!!!!!!!!!!!!!!!!!!!!!!!!!!!!!!!!!!!!!!!!!!!!!!!!10 ROR_BETWEEN is however not significant.

! #+!
regional knowledge network ties – a high number of ties even might have a negative effect.
5. Conclusion The aim of the paper was to analyze the impact of firm-specific features, network features and
location on firms’ patent activities in the German biotechnology industry. We made use of an
unique database that includes the granted amount of R&D subsidies a biotech firm received
between 1997 and 2004. The study contributes to the existing literature by considering the
embeddedness of firms’ R&D activities into knowledge networks as well as their participation in
collaborative R&D projects. In addition, it was explored how the similarity of a firm with its
collaboration partners impacts the success of its R&D activities.
We identified three core results. First, our study found in general very little evidence of
R&D subsidies affecting the patent performance of German biotech firms. While there is little
research on the effectiveness of collaborative R&D subsidies, our R&D subsidy database
allowed us to isolate the effect of subsidies focused on joint R&D projects. A key finding of our
study is that R&D subsidies that focus on single firms do not enhance the performance of biotech
firms, while collaborative research subsidies (i.e. subsidies that are granted to joint R&D projects
with two or more partners) do so to some extent.
Second, our study investigated whether the position of a firm in the knowledge network
influences firms’ R&D success, and whether the composition of the knowledge base of the
network partners had any effect on that. We showed that a high quantity of R&D connections to
other organizations has no effect on the patent activity of firms. Hence, the pure quantity of
knowledge links does not determine the success of R&D activities. Our analysis showed that the
network effect only becomes manifest when accounting for the type of network partners a firm is
linked to. Our analyses found strong evidence that some but not too much cognitive distance
with other actors involved in the R&D collaboration increased patent activity of firms. In other
words, there seems to exist an optimal cognitive distance between co-operation partners that
provides the possibility to understand each other, but which enables firms to learn something
really new at the same time.
Third, we found evidence that the location in a technological cluster mattered for the
patent performance of German biotech firms. Co-located biotech firms do benefit from local
knowledge spillovers, but did they do not benefit from inter-regional knowledge network ties.
Nor does the average geographical distance of network partners affect the patent activity of
biotech firms. This result is interesting, given the emphasis of much of the literature on the
positive effects of spatial clustering on knowledge spillovers (which is confirmed in our study),
and the importance of having access to extra-regional knowledge through non-local knowledge
! #"!
ties (which is not confirmed). However, the latter result is in line with very recent literature that
suggests that it is not access to knowledge networks (Boschma and Frenken 2009) per se which
affects innovativeness. What seems to matter for real learning is who are the network partners,
and especially whether partners bring complementary or related knowledge into the network.
Although we know from other research that in many cases being located in cluster is not
sufficient for learning and innovation processes (Giuliani and Bell, 2005; Boschma and Ter Wal,
2007) our cluster index variable seems to capture underlying structures or externalities which
positively impact firms’ innovation activities.
These results call for further research. To name but a few, we did not have information on
firms’ R&D activities (personnel, budget). This is only partly captured by including the age and
the number of employees as proxies. More detailed information on firms’ internal R&D
activities might yield different results. Furthermore, it might be interesting to disentangle the
positive effect of being located in a technological cluster by analysing more in detail the joint
knowledge production and diffusion inside the regions. And lastly some additional insights
might be gained to by adding measures of heterogeneity on the firm and regional level in
addition to the similarity measure on the network level to account for the positive or negative
effect of diversification on firm’s innovativeness.
These findings deliver some insights for policy makers as well firms active in R&D
activities. Policy makers should rethink their R&D subsidy strategies because we found little
evidence that R&D subsidies positively affect the success of R&D in terms of patenting. Our
results suggest that policy makers and firms have to take into account the structure of network
relations and the composition of partners, in order to increase the success of R&D. Firms should
concentrate on selected linkages concerning quantity as well as quality. With regard to quality
those partner having the optimal technological distance to the own knowledge base should be
selected, and policy makers should consider these findings in the set-up of policy initiatives as
well.

! ##!
Appendix
Figure 1: Patent applications in the biotechnology field by applicants (priority year, weighted-counts by applicants)

! #$!
Figure 2: Biotechnological clusters in Germany (based on Cluster Index, average values 1997-2004)

! #%!
Figure 3: Firm level subsidy network in 2001
! #&!
Figure 4: Regional distribution of subsidies (SUM in Mio. Euro)

! #'!
Figure 5: German biotechnology collaborations in 2001
Figure 6: SIMmax and weighted patents

! #(!
Table 1: Top ranking of organizations based on patent applications
1993-1995 2003-2005
Rang Organization #patents Organization #patents
1 ROCHE DIAGNOSTICS GMBH 72.0 BAYER HEALTHCARE AG 38.4
2 BAYER AKTIENGESELLSCHAFT 29.2 ROCHE DIAGNOSTICS GMBH 20.7
3 GSF-Forschungszentrum für Umwelt und Gesundheit GmbH 27.1 BASF AKTIENGESELLSCHAFT 14.1
4 BASF AKTIENGESELLSCHAFT 24.3 BASF PLANT SCIENCE GMBH 10.2
5 BOEHRINGER MANNHEIM GMBH 23.0 EPIGENOMICS AG 7.8
6 Dade Behring Marburg GmbH 19.8 Degussa GmbH 6.8
7 AVENTIS PHARMA DEUTSCHLAND GMBH 19.4
AVENTIS PHARMA DEUTSCHLAND GMBH 6.6
8 HOECHST AG 19.1 EPPENDORF AG 5.6
9 SCHERING AG 10.4 EVOTEC NEUROSCIENCES GMBH 5.2
10 SANOFI-AVENTIS DEUTSCHLAND GMBH 9.8
FHG ZUR FOERDERUNG DER ANGEWANDTEN FORSCHUNG E.V. 5.1
Note: the organisations displayed in bold are public research institutes
Notes: Coefficient values shown as zeros in the table are very small, but larger than zero. 63 groups (63 obs.) dropped because of only one obs. per group, 209 groups (990 obs.) dropped because of all zero outcomes
Number of obs. = 569, number of groups = 109

! "#!
Obs. per group: min = 2, avg. = 5.2, max = 6
Table 2: Regression results (Negative binominal regression with fixed-effects; independent variable: number of patents per firm and year) Model 1 Model 2 Model 3 Model 4 Model 5 Model 6 Model 7 Model 8 Coef. P>|z| Coef. P>|z| Coef. P>|z| Coef. P>|z| Coef. P>|z| Coef. P>|z| Coef. P>|z| Coef. P>|z|
CONS -6,088*** 0,000 -5,195*** 0,000 -5,060*** 0,000 -6,023*** 0,000 -4,760*** 0,000 -4,647*** 0,000 -5,754*** 0,003 -5,569*** 0,005 y1999 0,919*** 0,001 0,902*** 0,000 0,901*** 0,001 0,911*** 0,001 0,923*** 0,000 0,908*** 0,002 0,932*** 0,000 0,928*** 0,001 y2000 0,876*** 0,000 0,879*** 0,000 0,881*** 0,000 0,772*** 0,001 0,718*** 0,002 0,753*** 0,001 0,779*** 0,001 0,908*** 0,000 y2001 0,877*** 0,000 0,843*** 0,000 0,820*** 0,001 0,823*** 0,000 0,851*** 0,000 0,906*** 0,000 0,924*** 0,000 0,925*** 0,000 y2002 1,07*** 0,000 1,016*** 0,000 0,985*** 0,000 1,022*** 0,000 1,006*** 0,000 1,029*** 0,000 1,052*** 0,000 1,042*** 0,000 y2003 0,661*** 0,003 0,582*** 0,008 0,556** 0,012 0,565** 0,011 0,510** 0,020 0,520** 0,018 0,529** 0,016 0,567** 0,011 y2004 0,668*** 0,001 0,615*** 0,003 0,603*** 0,004 0,539** 0,011 0,523** 0,013 0,560*** 0,008 0,578*** 0,006 0,663*** 0,002 log(EMPL) 0,347*** 0,000 0,333*** 0,000 0,335*** 0,000 0,328*** 0,000 0,317*** 0,000 0,307*** 0,000 0,309*** 0,000 0,314*** 0,000 log(AGE) -0,021 0,849 0,019 0,865 0,024 0,831 0,022 0,844 0,008 0,944 -0,013 0,908 -0,015 0,892 -0,026 0,822 CI 0,013*** 0,004 0,013*** 0,004 0,014*** 0,002 0,013*** 0,003 0,012*** 0,007 0,012*** 0,009 0,011** 0,013 log(SUBS)t-4 0,079** 0,013 0,081** 0,011
log(ROR_SUBS)t-4 0,014 0,586 -0,029 0,332
log(SUM)t-4 0,077 0,153 0,069 0,208 0,059 0,274 0,059 0,276 0,065 0,236 0,070 0,198
log(CSUM)t-4 0,076 0,107
log(ROR_SUM)t-4 -0,131** 0,071 -0,107 0,156 -0,119 0,110 -0,099 0,186 -0,100 0,188 -0,102 0,188
log(ROR_CSUM)t-4 0,069 0,333 0,131 0,105 0,157* 0,057 0,155* 0,062 0,153* 0,064 0,114 0,140
log(PCSUM)t-4 0,107 0,120 -0,047 0,531 -0,079 0,287 0,007 0,959 0,009 0,950
DEGt-4 -0,021 0,638
ROR_DEGt-4 -0,022** 0,088 -0,025** 0,048 -0,025** 0,049 -0,025* 0,051
SIMmax t-4 0,885** 0,016 3,168*** 0,005 3,582*** 0,004 3,392*** 0,007
SIM2max t-4 -3,390** 0,037 -3,939** 0,028 -3,730** 0,038
log(DISTANCE)t-4 -0,073 0,465 -0,070 0,515
BETWt-4 0,000 0,954
ROR_BETWt-4 -0,001 0,140
LR chi2 80,840 88,510 90,910 93,750 98,930 103,450 103,990 102,470 log Likelihood -1336,87 -1333,03 -1331,83 -1330,41 -1327,82 -1325,56 -1325,29 -1326,05 Prob > ch 0,000 0,000 0,000 0,000 0,000 0,000 0,000 0,000

! "#!
Table 3: Network characteristics
Year # actors # number of matched
actors centralization (degree) 1995 310 46 0.060 1996 303 44 0.086 1997 233 35 0.135 1998 276 49 0.118 1999 272 58 0.096 2000 303 71 0.096 2001 384 94 0.150 2002 385 97 0.158 2003 354 87 0.190 2004 292 69 0.192
Table 4 Descriptives Max Min Mean Std. Dev. Variance Skewness Kurtosis PAT 100.37 0 46.68 364.40 132,786 19.25 445.73 log(EMPLSF) 59297 0 320.56 2954.09 8,726,635 15.70 275.33 log(AGE) 178 1 13.88 25.89 670.14 3.97 19.49 CI 86.24 0 18.53 23.08 532.56 1.19 3.60 SUM 1469551 0 35,607.17 137,511.70 1.89E+10 5.21 33.78 CSUM 904,529.80 0 22,947.30 89,538.36 8.02E+09 5.40 36.55 PCSUM 814,917.20 0 17,713.34 72,017.84 5.19E+09 6.41 52.88 ROR_SUM 22,600,000 0 4,315,868.00 6,137,011.00 3.77E+13 1.60 4.35 ROR_CSUM 35,500,000 0 5,360,033.00 8,655,241.00 7.49E+13 2.15 6.95 DEG 30 0 0.58 2.08 4.34 5.33 43.92 BETW 3,435.42 0 5.95 91.54 8,379.77 27.04 908.28 ROR_DEG 49 0 19.41 13.40 179.46 0.60 2.56 ROR_BETW 491.06 0 99.47 143.28 20,527.72 1.48 3.85 SIMmax 1 0 0.10 0.24 0.06 2.16 6.16 DISTANCE 26.70 0 0.44 1.89 3.57 6.49 56.10

! "#!
Table 5: Correlation table
PAT log(EMPLSF) log(AGE) CI SUM CSUM PCSUM ROR_SUM
ROR_CSUM DEG BETW ROR_DEG
ROR_BETW SIMmax SIMav
PAT 1 log(EMPLSF) 0.08*** 1
log(AGE) 0.25*** 0.36*** 1 CI 0.06*** 0.06*** -0.03 1
SUM 0.16*** 0 0.15*** 0.04** 1
CSUM 0.15*** 0.03 0.18*** 0.07*** 0.22*** 1
PCSUM 0.09*** 0 0.08*** 0.08*** 0.12*** 0.84*** 1
ROR_ SUM -0.02 -0.01 -0.11***
0.61*** 0.07*** 0.05** 0.07*** 1
ROR_ CSUM -0.02 -0.02 -0.11***
0.54*** 0.05*** 0.04** 0.06*** 0.94*** 1
DEG 0.05*** 0.03* 0.24*** 0.06*** 0.17*** 0.62*** 0.45*** 0.08*** 0.07*** 1
BETW 0.03* 0.07*** 0.30*** -
0.01 0.13*** 0.32,*** 0.08*** -0.02 -0.02 0.52*** 1 ROR_ DEG 0 0.01 -0.10***
0.58** 0.05*** 0.04** 0.06*** 0.84*** 0.82*** 0.09*** 0 1
ROR_ BETW -0.04* -0.02 -0.11***
0.50*** 0.02 0.02 0.04** 0.87*** 0.84*** 0.07*** -0.02 0.89*** 1
SIMmax 0.13*** 0.18*** 0.20*** 0.10*** 0.16*** 0.58*** 0.61*** 0.07*** 0.07*** 0.64*** 0.19*** 0.09*** 0.06*** 1
SIMav 0.08*** 0.09*** 0.12*** 0.10*** 0.12*** 0.57*** 0.62*** 0.09*** 0.08*** 0.61*** 0.13*** 0.10*** 0.07*** 0.97*** 1
DISTANCE 0.08*** 0.04** 0.27*** 0.03 0.20*** 0.58*** 0.33*** 0.01 0.01 0.87*** 0.52*** 0.04** 0.01 0.50*** 0.46***

! "#!
References Ahuja, B. (2000): Collaboration networks, structural holes and innovation: a longitudinal study.
Administrative Science Quarterly, 45, 425-455. Albino, V., Garavelli, A. C. and Schiuma, G. (1999): Knowledge transfer and inter-firm
relationships in industrial districts: the role of the leader firm, Technovation, 19, 53-63. Audretsch, D.B. and Fedlman, M.P. (1996): Innovative clusters and the industry life cycle,
Review of Industrial Organization 11, 253-273. Baptista, R. (2000): Do innovations diffuse faster within geographical clusters?, International
Journal of Industrial Organization 18, 515-535. Baptista, R. and Swann, P. (1996): Do firms in clusters innovate more? Research Policy, 27(5),
525-540. Bathelt, H., Malmberg, A. and Maskell, P. (2004): Clusters and knowledge: local buzz, global
pipelines and the process of knowledge creation, Progress in Human Geography 28, 31-56. Becker, W., Dietz, J. (2004) R\&D Cooperation and Innovation Activities of Firms - Evidence
for the German Manufacturing Industry. Research Policy, 33, 209-223 BMBF (2008a): Förderbereichen / Förderschwerpunkten und Förderarten. Statistiken des
Bundesministeriums für Bildung und Forschung. BMBF (2008b): Merkblatt für Antragsteller/Zuwendungsempfänger zur Zusammenarbeit der
Partner von Verbundprojekten. Bundesministerium für Bildung und Forschung, BMBF-Vordruck 0110/10.08.
Boschma, R. A. (2005): Proximity and Innovation: A Critical Assessment. Regional Studies, 39(1), 61–74.
Boschma, R. A. and Broekel, Tom (2009): Knowledge networks in the Dutch aviation industry: the proximity paradox. Papers in Evolutionary Economic Geography# 09.15.
Boschma, R. A. and ter Wal, A. L. J. (2007): Knowledge Networks and Innovative Performance in an Industrial District: The Case of a Footwear District in the South of Italy. Industry and Innovation, 14(2), 177–199.
Boschma, R.A. and Frenken, K. (2009): The Spatial Evolution of Innovation Networks. A Proximity Perspective. In: Boschma, R.A., Martin, R. (Eds.), Handbook of Evolutionary Economic Geography, Cheltenham: Edward Elgar, chapter 5.
Bowman, A. W. and Azzalini, A. (1997): Applied Smoothing Techniques for Data Analysis - The Kernel Approach with S-Plus Illustrations). New York: Oxford University Press Inc.
Breschi, S., Lissoni, F. and Malerba, F. (2003): Knowledge-relatedness in Firm Technological Diversification. Research Policy, 32, 69-87.
Broekel, T. (2010): The role of proximities for R&D collaboration in Germany. unpublished. Broekel, T. and Meder, A. (2008): The Bright and Dark Side of Cooperation for Regional
Innovation Performance, Papers in Evolutionary Economic Geography (PEEG) 0811, Utrecht University, Section of Economic Geography, revised Jun 2008.
Brouwer, E., Kleinknecht, A. and Reijnen, J. (1993): Employment Growth and Innovation at the Firm-Level – An Empirical Study. Journal of Evolutionary Economics, 3(2): 153-159.
Busom, I. (1999): An Empirical Evaluation of the Effects of R&D Subsidies. Burch Center Working Paper No. B99/05.
Camagni, R. (1991): Local Milieu, Uncertainty and Innovation Networks: Towards a New Dynamic Theory of Economic Space. In R. Camagni, R. (Ed). Innovation Networks: Spatial

! "$!
Perspectives. Belhaven Stress, London and New York. Cantner, U. and Meder, A. (2007): Technological Proximity and the Choice of Cooperation
Partner. Journal of Economic Interaction and Coordination, 2(1), 45-65. Cantwell, J. (1999): Innovation as the Principal Source of Growth in the Global Economy. In
Archibugi, D. and Howells, J. (Eds). Innovation Policy in a Global Economy. Cambridge: University Press, pp. 225-241.
Chandy, R and Tellis, G.J. (2000): The Incumbent’s Curse? Incumbency, Size, and Radical Product Innovation, Journal of Marketing, 64, 1-17.
Cohen, W. and Levinthal, D. (1990): Absorptive capacity: a new perspective on learning and innovation. Administrative Science Quarterly, 35, 128-152.
Cooke, P. (2001): New economy innovation systems - Biotechnology in Europe and the USA, Industry and Innovation, 8, 267-289.
Czarnitzki, D. and Hussinger, K. (2004): The Link Between R&D Subsidies, R&D Spending and Technological Performance. ZEW Discussion Papers 04-56.
Czarnitzki, D., Ebersberger, B. and Fier, A. (2007): The Relationship between R&D collaboration, Subsidies and R&D Performance: Empirical Evidence from Finland and Germany. Journal of Applied Econometrics, 22(7), 1347-1366.
Dekker, R. and Kleinknecht, A. H. (2008): The EU Framework Programs: Are they worth doing? MPRA working papers, 8503
Ejermo, O. (2003): Patent Diversity as a Predictor of Regional Innovativeness in Sweden. CESPRI Working Paper, 140.
Fier, A. (2002): Staatliche Förderung industrieller Forschung in Deutschland. Eine empirische Wirkungsanalyse der direkten Projektförderung des Bundes. Baden-Baden: Nomos Verlagsgesellschaft.
Fornahl, D. and Tran, C.A. (2010): The Development of Local-global Linkages in Biotechnology Districts in Germany: between Local Embeddedness and International Knowledge Sourcing. In: Belussi, F. and Sammarra, A. (Eds.), Business Networks in Clusters and Industrial Districts: the Governance of the Global Value Chain, London and New York: Routledge, pp. 332-355.
Freeman, L. C. (1979): Centrality in social networks. Social Networks, 1, 215-239. Frenkel, A. and Schefer, D. (1998) Local Milieu and Innovations: Some Empirical Results. The
Annals of Regional Science, 32: 185-200 Fritsch, M., Wein, T. and Ewers, H. (2005): Marktversagen und Wirtschaftspolitik. München:
Vahlen. Giuliani, E. and Bell, M. (2005): The Micro-Determinants of Meso-level Learning and
Innovation: Evidence from a Chilean Wine Cluster. Research Policy, 34(1), 47-68. Gorg, H. and Strobl, E. (2007): The Effect of R\&D Subsidies on Private R\&D. Economica, 79,
215-234. Gourieroux, C., Holly, A. and Monfort, A. (1982): Likelihood ratio test, Wald test, and Kuhn-
Tucker test in linear models with inequality constraints on the regression parameters. Econometrica, 50, 63-80.
Hassink, R. (2002): Regional Innovation Support Systems: Recent Trends in Germany and East Asia. European Planning Studies A, 10, 153-164.
Haug, P. (1995): Formation of biotechnology firms in the greater Seattle region: An empirical investigation of entrepreneurial, financial and educational perspectives. Environment and

! ""!
Planning A, 27, 249-267. Heijs, J. (2003): Freerider Behavior and the Public Finance of R&D Activities in Enterprises:
The Case of the Spanish Low Interest Credits for R&D. Research Policy, 32(3), 445-461. Koski, H. (2008): Public R&D Subsidies and Employment Growth – Microeconomic Evidence
from Finnish Firms. Keskusteluaiheita – Discussion Paper, No. 1143. McEvily, B. and Zaheer, A. (1999): Bridging ties: a source of firm heterogeneity in competitive
capabilities. Strategic Management Journal, 20, 1133-1158. Mowery, D. C., Oxley, J. E. and Silverman, B. S. (1998): Technological Overlap and Interfirm
Cooperation: Implications for the Resource-based View of the Firm. Research Policy, 27(5), 507–523.
Müller, R. H. (2003): Biotechnology. UFZ Umweltforschungszentrum Leipzig-Halle, Department Umweltmikrobiologie.
Nooteboom, B. (2000): Learning and Innovation in Organizations and Economies. Oxford: Oxford University Press.
Owen-Smith, J. and Powell, W.W. (2004): Knowledge networks as channels and conduits: the effects of spillovers in the Boston biotechnology community. Organization Science, 15, 5-21.
Peters, H. (2000): Wirtschaftspolitik. 3. Auflage. München: Oldenbourg. Powell, W., Koput, K. and Smith-Doerr, L. (1996): Interorganizational collaboration and the
locus of innovation: networks of learning in biotechnology. Administrative Science Quarterly, 41, 116-145.
Sammarra, A. and Biggiero, L. (2008): Heterogeneity and Specificity of Inter-Firm Knowledge Flows in Innovation Networks. Journal of Management Studies, 45(4), 800-829.
Schwarz, M., Peglow, F., Fritsch, M. and Günther, J. (2010): What determines the innovative success of subsidized collaborative R&D projects? - Project-level evidence from Germany. IWH - Discussion Papers, 7
Sorenson, O. and Audia, P.G. (2000): The social structure of entrepreneurial activity: geographic concentration of footwear production in the United States, 1940-1989. American Journal of Sociology, 106, 424-462.
Sorenson, O., Rivkin, J. and Fleming, L. (2006): Complexity, networks and knowledge flow. Research Policy, 35, 994-1017.
Sternberg, R. and Litzenberger, T. (2004): Regional Clusters in Germany – their Geography and their Relevance for Entrepreneurial Activities. European Planning Studies, 12, 767-791.
Stuart, T.E. and Sorensen, O. (2003): The geography of opportunity: spatial heterogeneity in founding rates and the performance of biotechnology firms. Research Policy, 32, 229-253.
Stuart, T.E., Ozdemir, S.Z. and Ding W.W. (2007): Vertical alliance networks: the case of university-biotechnology-pharmaceutical alliance chains. Research Policy, 36, 477-498.
Uzzi, B. (1996): The Sources and Consequences of Embeddedness for the Economic Performance of Organizations: The Network Effect. American Sociological Review, 61, 674-698.
Walker, G., Kogut, B. and Shan, W. (1997): Social capital, structural holes and the formation of an industry network. Organization Science, 8, 109-125.
Wasserman, S. and Faust, K. (1994): Centrality in Social Network Analysis: Methods and Applications. Cambridge: Cambridge University Press.
Zucker, L. G. and Darby M. R. (1996): Star scientists and institutional transformation: patterns of invention and innovation in the formation of the biotechnology industry. Proceedings of the

! "%!
National Academy of Sciences, 93, 12709-12716.