An efficient diagnostic technique for distribution systems based on under fault voltages and...
10
Electric Power Systems Research 80 (2010) 1205–1214 Contents lists available at ScienceDirect Electric Power Systems Research journal homepage: www.elsevier.com/locate/epsr An efficient diagnostic technique for distribution systems based on under fault voltages and currents A. Campoccia a,1 , M.L. Di Silvestre a,2 , I. Incontrera a , E. Riva Sanseverino a,∗ , G. Spoto b,3 a Dipartimento di Ingegneria Elettrica elettronica e delle Telecomunicazioni, Università degli Studi di Palermo, viale delle Scienze, 90128 Palermo, Italy b Centro per la Ricerca Elettronica in Sicilia, Monreale, Via Regione Siciliana 49, 90046 Palermo, Italy article info Article history: Received 23 July 2008 Received in revised form 5 November 2009 Accepted 20 April 2010 Available online 31 May 2010 Keywords: Faults diagnosis Fault location and characterization Distribution systems management abstract Service continuity is one of the major aspects in the definition of the quality of the electrical energy, for this reason the research in the field of faults diagnostic for distribution systems is spreading ever more. Moreover the increasing interest around modern distribution systems automation for management purposes gives faults diagnostics more tools to detect outages precisely and in short times. In this paper, the applicability of an efficient fault location and characterization methodology within a centralized monitoring system is discussed. The methodology, appropriate for any kind of fault, is based on the use of the analytical model of the network lines and uses the fundamental components rms values taken from the transient measures of line currents and voltages at the MV/LV substations. The fault location and identification algorithm, proposed by the authors and suitably restated, has been implemented on a microprocessor-based device that can be installed at each MV/LV substation. The speed and precision of the algorithm have been tested against the errors deriving from the fundamental extraction within the prescribed fault clearing times and against the inherent precision of the electronic device used for computation. The tests have been carried out using Matlab Simulink for simulating the faulted system. © 2010 Elsevier B.V. All rights reserved. 1. Introduction Electric power distribution systems are changing a lot due to different factors. More recently, after the emergence of deregu- lation, the widespread of distributed generation, DG, is causing a significant review of operating practices for distribution systems that are now active parts of the grid. Implementing automation and telecommunication facilities into distribution systems is nowadays required for normal operation since MV/LV substations are becom- ing intelligent master units. In this frame, the faults location and characterization issue must be faced considering that any algorithm and protection strategy must take into account the opportunities offered by ICT technologies in distribution systems. Besides, distribution utilities are being required, whether directly through the regulator or indirectly through new rate struc- tures or consumer awareness, to improve areas of the network with ∗ Corresponding author. Tel.: +39 091 66 15 262; fax: +39 091 48 84 52. E-mail addresses: [email protected] (A. Campoccia), [email protected] (M.L. Di Silvestre), [email protected] (I. Incontrera), [email protected] (E. Riva Sanseverino), [email protected] (G. Spoto). URL: www.cres.it (G. Spoto). 1 Tel.: +39 091 66 15 261; fax: +39 091 48 84 52. 2 Tel.: +39 091 66 15 239; fax: +39 091 48 84 52. 3 Tel.: +39 091 6404501. substandard reliability. Suitable network control and automation plays a basic role in this process. It may allow the real-time identi- fication of the working state of the system, determining its optimal layout. In case of a fault, network control and automation can help in precisely identifying, locate and isolate the fault and, where pos- sible, restore customers supply. Service continuity is one of the big issues affecting power quality and it is strongly related to an efficient and prompt identification, location and clearing of faults. In the literature, the diagnostic problem has been dealt with by means of different approaches but mostly with reference to specific aspects (characterization, location or identification of the event). The literature on the subject can be classified based on the methodologies solving the diagnostic problem. Most approaches implement the linguistic knowledge of the human expert integrated with information coming from the protec- tion system. In particular, methods based on Artificial Intelligence, AI, have been implemented: Expert Systems, ESs [1–8], Genetic Algorithms, Gas [9,10], or Neural Networks, NNs [11,12]; knowl- edge engineering, probability theory: Petri nets [13] and others; Fuzzy Logic, FL [14–16] and hybrids [17]. All these methodologies make use of relays information and data collected all over the net- work; they thus rely on an efficient multi-point telecommunication system. Other methods take advantage of the traveling-wave approach and are based on wavelet analysis of the fault generated travel- ing waves [18–21]. In particular [18] and [19] show a single end 0378-7796/$ – see front matter © 2010 Elsevier B.V. All rights reserved. doi:10.1016/j.epsr.2010.04.007
Transcript of An efficient diagnostic technique for distribution systems based on under fault voltages and...
Electric Power Systems Research 80 (2010) 1205–1214
Contents lists available at ScienceDirect
Electric Power Systems Research
journa l homepage: www.e lsev ier .com/ locate /epsr
An efficient diagnostic technique for distribution systems based on under faultvoltages and currents
A. Campocciaa,1, M.L. Di Silvestrea,2, I. Incontreraa, E. Riva Sanseverinoa,∗, G. Spotob,3
a Dipartimento di Ingegneria Elettrica elettronica e delle Telecomunicazioni, Università degli Studi di Palermo, viale delle Scienze, 90128 Palermo, Italyb Centro per la Ricerca Elettronica in Sicilia, Monreale, Via Regione Siciliana 49, 90046 Palermo, Italy
a r t i c l e i n f o
Article history:Received 23 July 2008Received in revised form 5 November 2009Accepted 20 April 2010Available online 31 May 2010
Keywords:Faults diagnosisFault location and characterizationDistribution systems management
a b s t r a c t
Service continuity is one of the major aspects in the definition of the quality of the electrical energy,for this reason the research in the field of faults diagnostic for distribution systems is spreading evermore. Moreover the increasing interest around modern distribution systems automation for managementpurposes gives faults diagnostics more tools to detect outages precisely and in short times. In this paper,the applicability of an efficient fault location and characterization methodology within a centralizedmonitoring system is discussed. The methodology, appropriate for any kind of fault, is based on the useof the analytical model of the network lines and uses the fundamental components rms values takenfrom the transient measures of line currents and voltages at the MV/LV substations. The fault locationand identification algorithm, proposed by the authors and suitably restated, has been implemented on
a microprocessor-based device that can be installed at each MV/LV substation. The speed and precisionof the algorithm have been tested against the errors deriving from the fundamental extraction withinthe prescribed fault clearing times and against the inherent precision of the electronic device used forave b
1
dlsttricao
dt
m(s
0d
computation. The tests h
. Introduction
Electric power distribution systems are changing a lot due toifferent factors. More recently, after the emergence of deregu-
ation, the widespread of distributed generation, DG, is causing aignificant review of operating practices for distribution systemshat are now active parts of the grid. Implementing automation andelecommunication facilities into distribution systems is nowadaysequired for normal operation since MV/LV substations are becom-ng intelligent master units. In this frame, the faults location andharacterization issue must be faced considering that any algorithmnd protection strategy must take into account the opportunities
ffered by ICT technologies in distribution systems.Besides, distribution utilities are being required, whetherirectly through the regulator or indirectly through new rate struc-ures or consumer awareness, to improve areas of the network with
∗ Corresponding author. Tel.: +39 091 66 15 262; fax: +39 091 48 84 52.E-mail addresses: [email protected] (A. Campoccia),
[email protected] (M.L. Di Silvestre), [email protected]. Incontrera), [email protected] (E. Riva Sanseverino),[email protected] (G. Spoto).
URL: www.cres.it (G. Spoto).1 Tel.: +39 091 66 15 261; fax: +39 091 48 84 52.2 Tel.: +39 091 66 15 239; fax: +39 091 48 84 52.3 Tel.: +39 091 6404501.
378-7796/$ – see front matter © 2010 Elsevier B.V. All rights reserved.oi:10.1016/j.epsr.2010.04.007
een carried out using Matlab Simulink for simulating the faulted system.© 2010 Elsevier B.V. All rights reserved.
substandard reliability. Suitable network control and automationplays a basic role in this process. It may allow the real-time identi-fication of the working state of the system, determining its optimallayout. In case of a fault, network control and automation can helpin precisely identifying, locate and isolate the fault and, where pos-sible, restore customers supply. Service continuity is one of thebig issues affecting power quality and it is strongly related to anefficient and prompt identification, location and clearing of faults.
In the literature, the diagnostic problem has been dealt with bymeans of different approaches but mostly with reference to specificaspects (characterization, location or identification of the event).
The literature on the subject can be classified based on themethodologies solving the diagnostic problem.
Most approaches implement the linguistic knowledge of thehuman expert integrated with information coming from the protec-tion system. In particular, methods based on Artificial Intelligence,AI, have been implemented: Expert Systems, ESs [1–8], GeneticAlgorithms, Gas [9,10], or Neural Networks, NNs [11,12]; knowl-edge engineering, probability theory: Petri nets [13] and others;Fuzzy Logic, FL [14–16] and hybrids [17]. All these methodologiesmake use of relays information and data collected all over the net-
work; they thus rely on an efficient multi-point telecommunicationsystem.Other methods take advantage of the traveling-wave approachand are based on wavelet analysis of the fault generated travel-ing waves [18–21]. In particular [18] and [19] show a single end
1 Systems Research 80 (2010) 1205–1214
aatldttti
lootttwmmpuHsctatibis
odpTbanctool
dpdpwlseamiricsutuits
206 A. Campoccia et al. / Electric Power
pproach for location on radial systems, as well as [20], where theuthors propose an improved approach for single point fault loca-ion. In [21] a multi-point system for exact faults identification andocation is used. In a simulation environment, the fault currentsirection is derived from the sign of the wavelet coefficients andhe distance to the fault is given by the time interval between theraveling waves arriving from the fault. In this case, the use of a dis-ributed intelligence system allows the management of networksncluding DG units.
Another class of solution algorithms is based on the use of ana-ytical models of the system. These can be either based on the usef information taken from many measurement points or on the usef a single measurement point (typically located at the HV/MV sta-ion). The employment of accurate diagnostic techniques based onhe use of analytical models of the system and on multi-point realime measurement systems has found an increasing widespreadith the implementation of efficient communication, measure-ent and processing units [22–24]. More recently, some otherodel-based approaches have been proposed. Lee et al. [25] pro-
ose a diagnostic tool for identifying the actual fault location. Itses a two steps approach: the current pattern is recorded at theV/MV station and from a set of possible fault locations a smaller
ubset is identified; then from this subset a single location is thenhosen using the interrupted load information. The first step useshe information related to the current patterns that can be cre-ted by the protective devices in the system. In the second step,he approach estimates voltages and currents at each bus using anterative methodology. The presence of DG units as well as possi-le measurement errors are not considered, nor the possibility to
dentify the fault exact location. Moreover the approach works foringle phase to ground faults.
An interesting review of impedance based fault location meth-ds using single point measures available in the literature in radialistribution systems can be found in [26]. Ten methods are com-ared in terms of performance (estimation errors) and complexity.hey are suitable either for single-line to ground faults and for dou-le or three phase faults in distribution systems that do not showcomplex topology. The presence of dispersed generation units isot considered. All of them use the rms value of the fundamentalurrent and voltage at the substation, but no mention is made abouthe time at which such measures are carried out. The time constantf the transient strongly affects the precision of results and dependsn the system’s features (DG units, inductive character of lines, lowoaded transformers, . . .).
The methodology set up by the Authors is addressed to theiagnosis of the working conditions of distribution systems, witharticular reference to MV networks. In particular, the Authors haveeveloped [27,28] a new diagnostic algorithm that, using multi-oint measurements, is able to identify, characterize and locateith errors below one percent all the types of fault, including
ine interruptions without and with contact to ground [29]. Theystem is supposed to work promptly but off-line supporting thexisting protection system based on reclosing relays. In this paper,diagnostic-oriented monitoring system is presented. It imple-ents the diagnostic algorithm presented in [27], restated it for
ts implementation on a microprocessor. The algorithm has beene-written manipulating the matrices in order to make it more eas-ly implementable for all types of fault. The diagnostic algorithman be implemented in local intelligent units located at the MV/LVubstations and uses the rms fundamental values of the transientnder fault currents and voltages measurements. After elabora-
ion, the local units exchange information with a central masternit located at the HV/MV substation. The master unit gathersnformation from the network at regular intervals (i.e. polling oroken passing access) and sends opening/closing commands to localwitches.
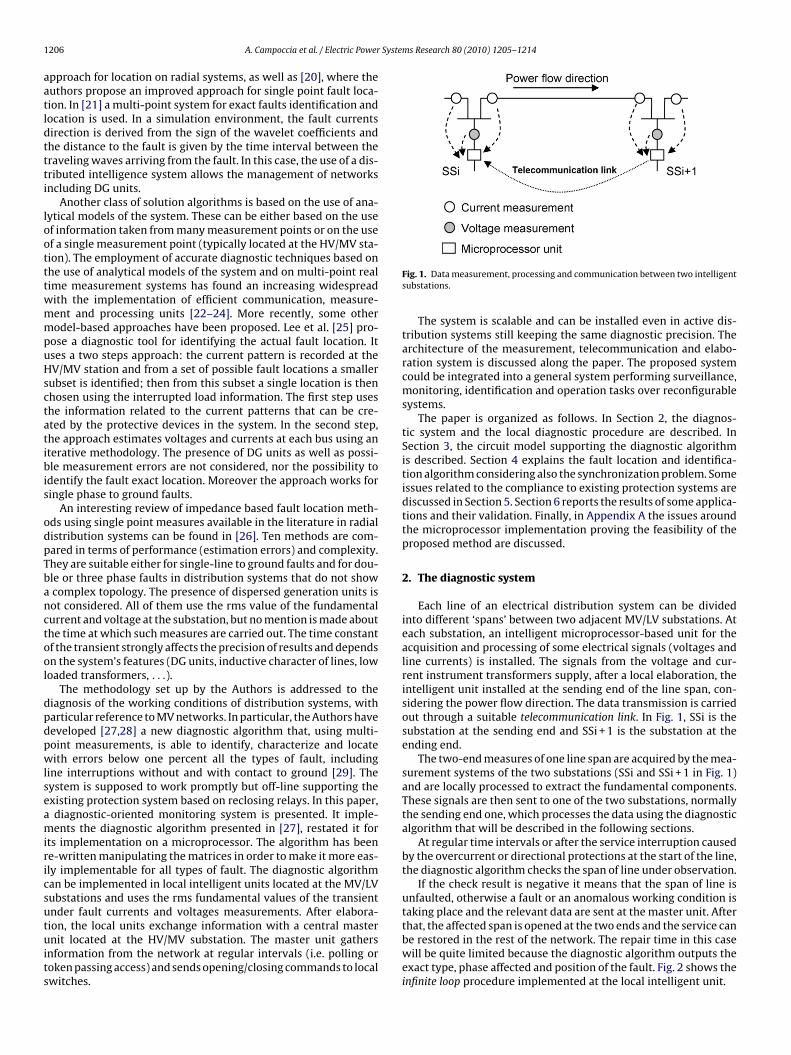
Fig. 1. Data measurement, processing and communication between two intelligentsubstations.
The system is scalable and can be installed even in active dis-tribution systems still keeping the same diagnostic precision. Thearchitecture of the measurement, telecommunication and elabo-ration system is discussed along the paper. The proposed systemcould be integrated into a general system performing surveillance,monitoring, identification and operation tasks over reconfigurablesystems.
The paper is organized as follows. In Section 2, the diagnos-tic system and the local diagnostic procedure are described. InSection 3, the circuit model supporting the diagnostic algorithmis described. Section 4 explains the fault location and identifica-tion algorithm considering also the synchronization problem. Someissues related to the compliance to existing protection systems arediscussed in Section 5. Section 6 reports the results of some applica-tions and their validation. Finally, in Appendix A the issues aroundthe microprocessor implementation proving the feasibility of theproposed method are discussed.
2. The diagnostic system
Each line of an electrical distribution system can be dividedinto different ‘spans’ between two adjacent MV/LV substations. Ateach substation, an intelligent microprocessor-based unit for theacquisition and processing of some electrical signals (voltages andline currents) is installed. The signals from the voltage and cur-rent instrument transformers supply, after a local elaboration, theintelligent unit installed at the sending end of the line span, con-sidering the power flow direction. The data transmission is carriedout through a suitable telecommunication link. In Fig. 1, SSi is thesubstation at the sending end and SSi + 1 is the substation at theending end.
The two-end measures of one line span are acquired by the mea-surement systems of the two substations (SSi and SSi + 1 in Fig. 1)and are locally processed to extract the fundamental components.These signals are then sent to one of the two substations, normallythe sending end one, which processes the data using the diagnosticalgorithm that will be described in the following sections.
At regular time intervals or after the service interruption causedby the overcurrent or directional protections at the start of the line,the diagnostic algorithm checks the span of line under observation.
If the check result is negative it means that the span of line isunfaulted, otherwise a fault or an anomalous working condition istaking place and the relevant data are sent at the master unit. Afterthat, the affected span is opened at the two ends and the service can
be restored in the rest of the network. The repair time in this casewill be quite limited because the diagnostic algorithm outputs theexact type, phase affected and position of the fault. Fig. 2 shows theinfinite loop procedure implemented at the local intelligent unit.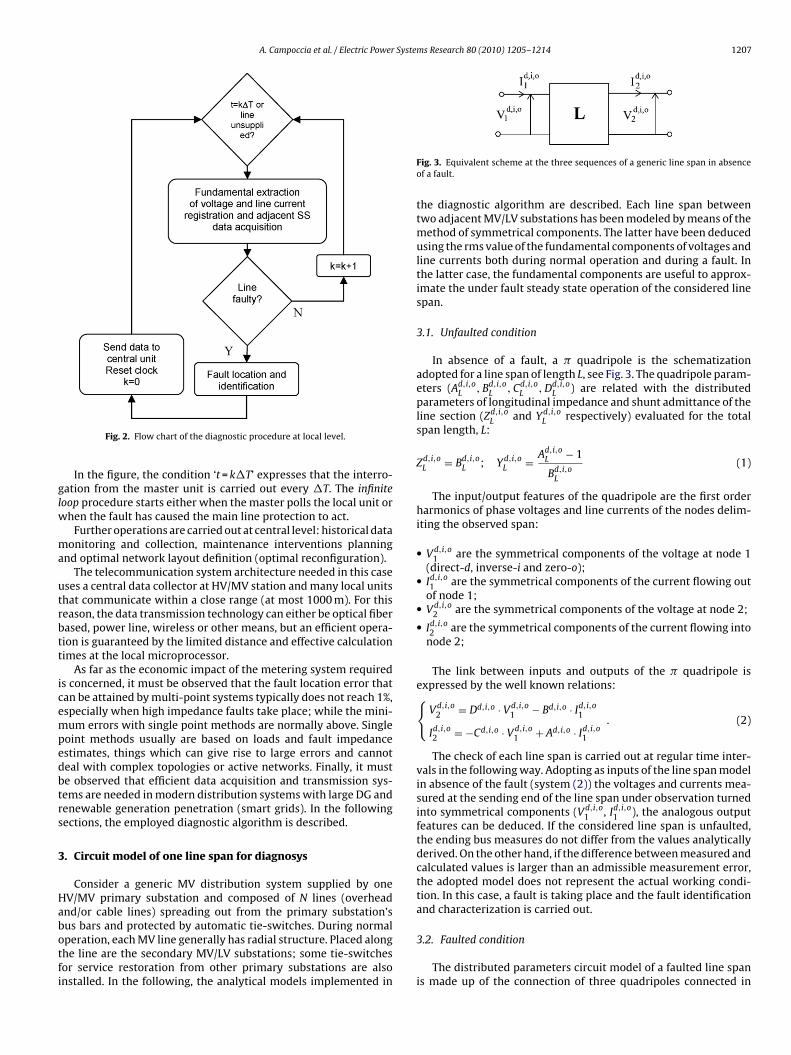
A. Campoccia et al. / Electric Power Systems Research 80 (2010) 1205–1214 1207
glw
ma
utrbtt
icempedbtrs
3
Habotfi
Fig. 2. Flow chart of the diagnostic procedure at local level.
In the figure, the condition ‘t = k�T’ expresses that the interro-ation from the master unit is carried out every �T. The infiniteoop procedure starts either when the master polls the local unit or
hen the fault has caused the main line protection to act.Further operations are carried out at central level: historical data
onitoring and collection, maintenance interventions planningnd optimal network layout definition (optimal reconfiguration).
The telecommunication system architecture needed in this caseses a central data collector at HV/MV station and many local unitshat communicate within a close range (at most 1000 m). For thiseason, the data transmission technology can either be optical fiberased, power line, wireless or other means, but an efficient opera-ion is guaranteed by the limited distance and effective calculationimes at the local microprocessor.
As far as the economic impact of the metering system requireds concerned, it must be observed that the fault location error thatan be attained by multi-point systems typically does not reach 1%,specially when high impedance faults take place; while the mini-um errors with single point methods are normally above. Single
oint methods usually are based on loads and fault impedancestimates, things which can give rise to large errors and cannoteal with complex topologies or active networks. Finally, it muste observed that efficient data acquisition and transmission sys-ems are needed in modern distribution systems with large DG andenewable generation penetration (smart grids). In the followingections, the employed diagnostic algorithm is described.
. Circuit model of one line span for diagnosys
Consider a generic MV distribution system supplied by oneV/MV primary substation and composed of N lines (overheadnd/or cable lines) spreading out from the primary substation’sus bars and protected by automatic tie-switches. During normal
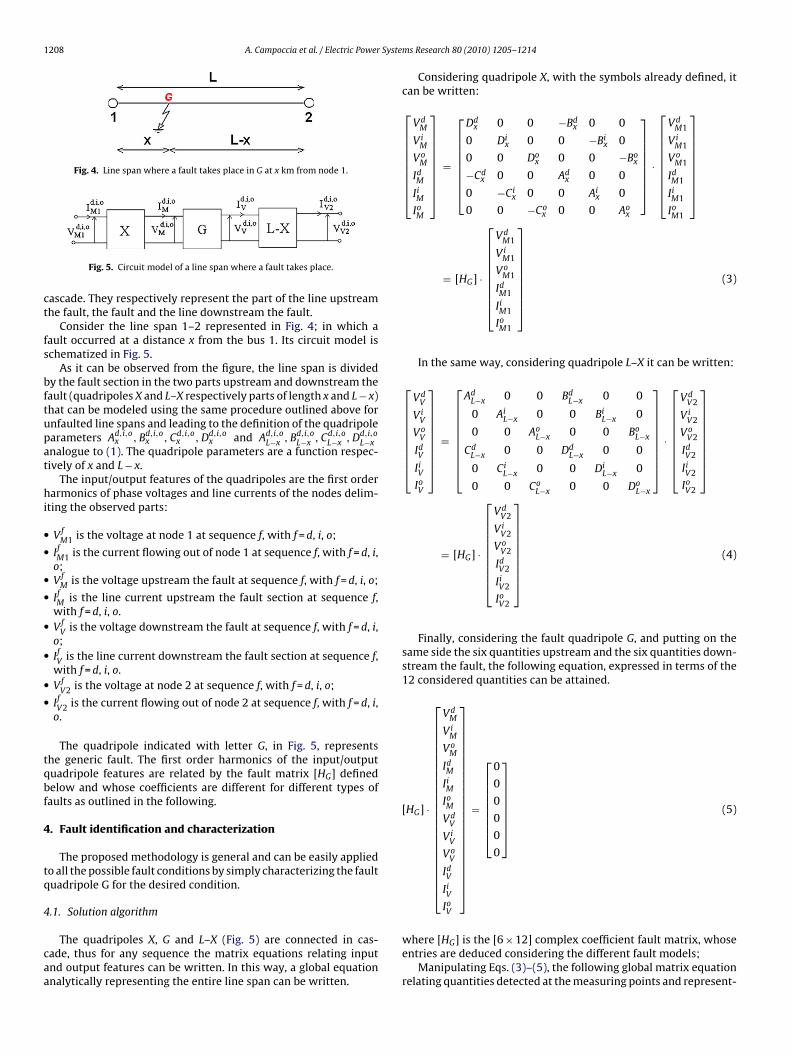
peration, each MV line generally has radial structure. Placed alonghe line are the secondary MV/LV substations; some tie-switchesor service restoration from other primary substations are alsonstalled. In the following, the analytical models implemented inFig. 3. Equivalent scheme at the three sequences of a generic line span in absenceof a fault.
the diagnostic algorithm are described. Each line span betweentwo adjacent MV/LV substations has been modeled by means of themethod of symmetrical components. The latter have been deducedusing the rms value of the fundamental components of voltages andline currents both during normal operation and during a fault. Inthe latter case, the fundamental components are useful to approx-imate the under fault steady state operation of the considered linespan.
3.1. Unfaulted condition
In absence of a fault, a � quadripole is the schematizationadopted for a line span of length L, see Fig. 3. The quadripole param-eters (Ad,i,o
L , Bd,i,oL , Cd,i,o
L , Dd,i,oL ) are related with the distributed
parameters of longitudinal impedance and shunt admittance of theline section (Zd,i,o
L and Yd,i,oL respectively) evaluated for the total
span length, L:
Zd,i,oL = Bd,i,o
L ; Yd,i,oL = Ad,i,o
L − 1
Bd,i,oL
(1)
The input/output features of the quadripole are the first orderharmonics of phase voltages and line currents of the nodes delim-iting the observed span:
• Vd,i,o1 are the symmetrical components of the voltage at node 1
(direct-d, inverse-i and zero-o);• Id,i,o
1 are the symmetrical components of the current flowing outof node 1;
• Vd,i,o2 are the symmetrical components of the voltage at node 2;
• Id,i,o2 are the symmetrical components of the current flowing into
node 2;
The link between inputs and outputs of the � quadripole isexpressed by the well known relations:{
Vd,i,o2 = Dd,i,o · Vd,i,o
1 − Bd,i,o · Id,i,o1
Id,i,o2 = −Cd,i,o · Vd,i,o
1 + Ad,i,o · Id,i,o1
. (2)
The check of each line span is carried out at regular time inter-vals in the following way. Adopting as inputs of the line span modelin absence of the fault (system (2)) the voltages and currents mea-sured at the sending end of the line span under observation turnedinto symmetrical components (Vd,i,o
1 , Id,i,o1 ), the analogous output
features can be deduced. If the considered line span is unfaulted,the ending bus measures do not differ from the values analyticallyderived. On the other hand, if the difference between measured andcalculated values is larger than an admissible measurement error,the adopted model does not represent the actual working condi-tion. In this case, a fault is taking place and the fault identificationand characterization is carried out.
3.2. Faulted condition
The distributed parameters circuit model of a faulted line spanis made up of the connection of three quadripoles connected in
1208 A. Campoccia et al. / Electric Power Syste
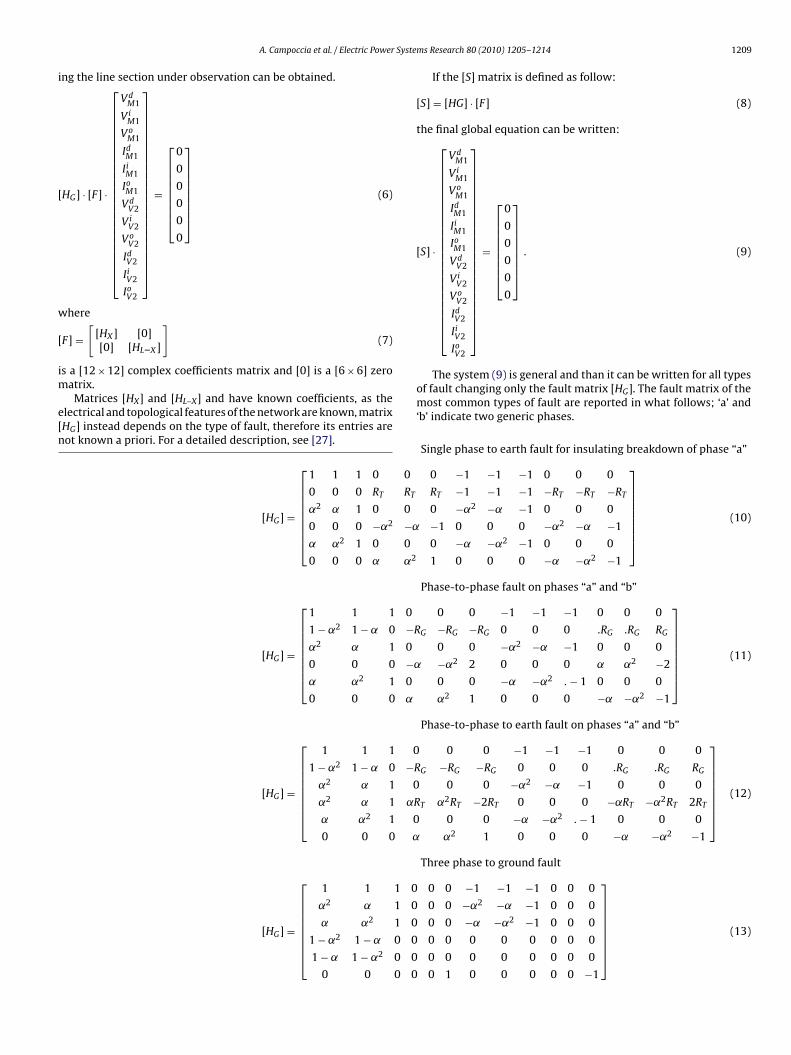
Fig. 4. Line span where a fault takes place in G at x km from node 1.
ct
fs
bftupat
hi
••
••
•
•
••
tqbf
4
tq
4
caa
Fig. 5. Circuit model of a line span where a fault takes place.
ascade. They respectively represent the part of the line upstreamhe fault, the fault and the line downstream the fault.
Consider the line span 1–2 represented in Fig. 4; in which aault occurred at a distance x from the bus 1. Its circuit model ischematized in Fig. 5.
As it can be observed from the figure, the line span is dividedy the fault section in the two parts upstream and downstream theault (quadripoles X and L–X respectively parts of length x and L − x)hat can be modeled using the same procedure outlined above fornfaulted line spans and leading to the definition of the quadripolearameters Ad,i,o
x , Bd,i,ox , Cd,i,o
x , Dd,i,ox and Ad,i,o
L−x , Bd,i,oL−x , Cd,i,o
L−x , Dd,i,oL−x
nalogue to (1). The quadripole parameters are a function respec-ively of x and L − x.
The input/output features of the quadripoles are the first orderarmonics of phase voltages and line currents of the nodes delim-
ting the observed parts:
VfM1 is the voltage at node 1 at sequence f, with f = d, i, o;
IfM1 is the current flowing out of node 1 at sequence f, with f = d, i,
o;Vf
M is the voltage upstream the fault at sequence f, with f = d, i, o;
IfM is the line current upstream the fault section at sequence f,
with f = d, i, o.Vf
V is the voltage downstream the fault at sequence f, with f = d, i,o;IfV is the line current downstream the fault section at sequence f,
with f = d, i, o.Vf
V2 is the voltage at node 2 at sequence f, with f = d, i, o;
IfV2 is the current flowing out of node 2 at sequence f, with f = d, i,
o.
The quadripole indicated with letter G, in Fig. 5, representshe generic fault. The first order harmonics of the input/outputuadripole features are related by the fault matrix [HG] definedelow and whose coefficients are different for different types ofaults as outlined in the following.
. Fault identification and characterization
The proposed methodology is general and can be easily appliedo all the possible fault conditions by simply characterizing the faultuadripole G for the desired condition.
.1. Solution algorithm
The quadripoles X, G and L–X (Fig. 5) are connected in cas-ade, thus for any sequence the matrix equations relating inputnd output features can be written. In this way, a global equationnalytically representing the entire line span can be written.
ms Research 80 (2010) 1205–1214
Considering quadripole X, with the symbols already defined, itcan be written:
⎡⎢⎢⎢⎢⎢⎢⎢⎣
VdM
ViM
VoM
IdM
IiM
IoM
⎤⎥⎥⎥⎥⎥⎥⎥⎦
=
⎡⎢⎢⎢⎢⎢⎢⎣
Ddx 0 0 −Bd
x 0 0
0 Dix 0 0 −Bi
x 0
0 0 Dox 0 0 −Bo
x
−Cdx 0 0 Ad
x 0 0
0 −Cix 0 0 Ai
x 0
0 0 −Cox 0 0 Ao
x
⎤⎥⎥⎥⎥⎥⎥⎦
·
⎡⎢⎢⎢⎢⎢⎢⎢⎣
VdM1
ViM1
VoM1
IdM1
IiM1
IoM1
⎤⎥⎥⎥⎥⎥⎥⎥⎦
= [HG] ·
⎡⎢⎢⎢⎢⎢⎢⎢⎣
VdM1
ViM1
VoM1
IdM1
IiM1
IoM1
⎤⎥⎥⎥⎥⎥⎥⎥⎦
(3)
In the same way, considering quadripole L–X it can be written:
⎡⎢⎢⎢⎢⎢⎢⎢⎣
VdV
ViV
VoV
IdV
IiV
IoV
⎤⎥⎥⎥⎥⎥⎥⎥⎦
=
⎡⎢⎢⎢⎢⎢⎢⎢⎣
AdL−x 0 0 Bd
L−x 0 0
0 AiL−x 0 0 Bi
L−x 0
0 0 AoL−x 0 0 Bo
L−x
CdL−x 0 0 Dd
L−x 0 0
0 CiL−x 0 0 Di
L−x 0
0 0 CoL−x 0 0 Do
L−x
⎤⎥⎥⎥⎥⎥⎥⎥⎦
·
⎡⎢⎢⎢⎢⎢⎢⎢⎣
VdV2
ViV2
VoV2
IdV2
IiV2
IoV2
⎤⎥⎥⎥⎥⎥⎥⎥⎦
= [HG] ·
⎡⎢⎢⎢⎢⎢⎢⎢⎣
VdV2
ViV2
VoV2
IdV2
IiV2
IoV2
⎤⎥⎥⎥⎥⎥⎥⎥⎦
(4)
Finally, considering the fault quadripole G, and putting on thesame side the six quantities upstream and the six quantities down-stream the fault, the following equation, expressed in terms of the12 considered quantities can be attained.
[HG] ·
⎡⎢⎢⎢⎢⎢⎢⎢⎢⎢⎢⎢⎢⎢⎢⎢⎢⎢⎢⎢⎢⎣
VdM
ViM
VoM
IdM
IiM
IoM
VdV
ViV
VoV
IdV
IiV
IoV
⎤⎥⎥⎥⎥⎥⎥⎥⎥⎥⎥⎥⎥⎥⎥⎥⎥⎥⎥⎥⎥⎦
=
⎡⎢⎢⎢⎢⎢⎢⎣
0
0
0
0
0
0
⎤⎥⎥⎥⎥⎥⎥⎦
(5)
where [HG] is the [6 × 12] complex coefficient fault matrix, whoseentries are deduced considering the different fault models;
Manipulating Eqs. (3)–(5), the following global matrix equationrelating quantities detected at the measuring points and represent-
Syste
i
[
w
[
im
e[n
A. Campoccia et al. / Electric Power
ng the line section under observation can be obtained.
HG] · [F] ·
⎡⎢⎢⎢⎢⎢⎢⎢⎢⎢⎢⎢⎢⎢⎢⎢⎢⎢⎢⎢⎢⎣
VdM1
ViM1
VoM1
IdM1
IiM1
IoM1
VdV2
ViV2
VoV2
IdV2
IiV2
IoV2
⎤⎥⎥⎥⎥⎥⎥⎥⎥⎥⎥⎥⎥⎥⎥⎥⎥⎥⎥⎥⎥⎦
=
⎡⎢⎢⎢⎢⎢⎢⎣
0
0
0
0
0
0
⎤⎥⎥⎥⎥⎥⎥⎦
(6)
here
F] =[
[HX ] [0][0] [HL–X ]
](7)
s a [12 × 12] complex coefficients matrix and [0] is a [6 × 6] zeroatrix.
Matrices [HX] and [HL–X] and have known coefficients, as thelectrical and topological features of the network are known, matrixHG] instead depends on the type of fault, therefore its entries areot known a priori. For a detailed description, see [27].
[HG] =
⎡⎢⎢⎢⎢⎢⎢⎣
1 1 1 0 0
0 0 0 RT RT
˛2 ˛ 1 0 0
0 0 0 −˛2 −˛
˛ ˛2 1 0 0
0 0 0 ˛ ˛2
[HG] =
⎡⎢⎢⎢⎢⎢⎢⎣
1 1 1 0
1 − ˛2 1 − ˛ 0 −R
˛2 ˛ 1 0
0 0 0 −˛
˛ ˛2 1 0
0 0 0 ˛
[HG] =
⎡⎢⎢⎢⎢⎢⎢⎣
1 1 1 0
1 − ˛2 1 − ˛ 0 −R
˛2 ˛ 1 0
˛2 ˛ 1 ˛R
˛ ˛2 1 0
0 0 0 ˛
[HG] =
⎡⎢⎢⎢⎢⎢⎢⎣
1 1 1 0
˛2 ˛ 1 0
˛ ˛2 1 0
1 − ˛2 1 − ˛ 0 0
1 − ˛ 1 − ˛2 0 0
0 0 0 0
ms Research 80 (2010) 1205–1214 1209
If the [S] matrix is defined as follow:
[S] = [HG] · [F] (8)
the final global equation can be written:
[S] ·
⎡⎢⎢⎢⎢⎢⎢⎢⎢⎢⎢⎢⎢⎢⎢⎢⎢⎢⎢⎢⎢⎣
VdM1
ViM1
VoM1
IdM1
IiM1
IoM1
VdV2
ViV2
VoV2
IdV2
IiV2
IoV2
⎤⎥⎥⎥⎥⎥⎥⎥⎥⎥⎥⎥⎥⎥⎥⎥⎥⎥⎥⎥⎥⎦
=
⎡⎢⎢⎢⎢⎢⎢⎣
0
0
0
0
0
0
⎤⎥⎥⎥⎥⎥⎥⎦
. (9)
The system (9) is general and than it can be written for all typesof fault changing only the fault matrix [HG]. The fault matrix of themost common types of fault are reported in what follows; ‘a’ and‘b’ indicate two generic phases.
Single phase to earth fault for insulating breakdown of phase “a”
0 −1 −1 −1 0 0 0
RT −1 −1 −1 −RT −RT −RT
0 −˛2 −˛ −1 0 0 0
−1 0 0 0 −˛2 −˛ −1
0 −˛ −˛2 −1 0 0 0
1 0 0 0 −˛ −˛2 −1
⎤⎥⎥⎥⎥⎥⎥⎦
(10)
Phase-to-phase fault on phases “a” and “b”
0 0 −1 −1 −1 0 0 0
G −RG −RG 0 0 0 .RG .RG RG
0 0 −˛2 −˛ −1 0 0 0
−˛2 2 0 0 0 ˛ ˛2 −2
0 0 −˛ −˛2 . − 1 0 0 0
˛2 1 0 0 0 −˛ −˛2 −1
⎤⎥⎥⎥⎥⎥⎥⎦
(11)
Phase-to-phase to earth fault on phases “a” and “b”
0 0 −1 −1 −1 0 0 0
G −RG −RG 0 0 0 .RG .RG RG
0 0 −˛2 −˛ −1 0 0 0
T ˛2RT −2RT 0 0 0 −˛RT −˛2RT 2RT
0 0 −˛ −˛2 . − 1 0 0 0
˛2 1 0 0 0 −˛ −˛2 −1
⎤⎥⎥⎥⎥⎥⎥⎦
(12)
Three phase to ground fault
0 0 −1 −1 −1 0 0 0
0 0 −˛2 −˛ −1 0 0 0
0 0 −˛ −˛2 −1 0 0 0
0 0 0 0 0 0 0 0
0 0 0 0 0 0 0 0
0 1 0 0 0 0 0 −1
⎤⎥⎥⎥⎥⎥⎥⎦
(13)
1 Systems Research 80 (2010) 1205–1214
gt
li
s
hetgfiR
dtc(tucsphteentcFa
4
ttectmiccetbvtt(
[
⎡0⎤
Fig. 6. Flow chart of the fault identification, characterization and location algorithm.
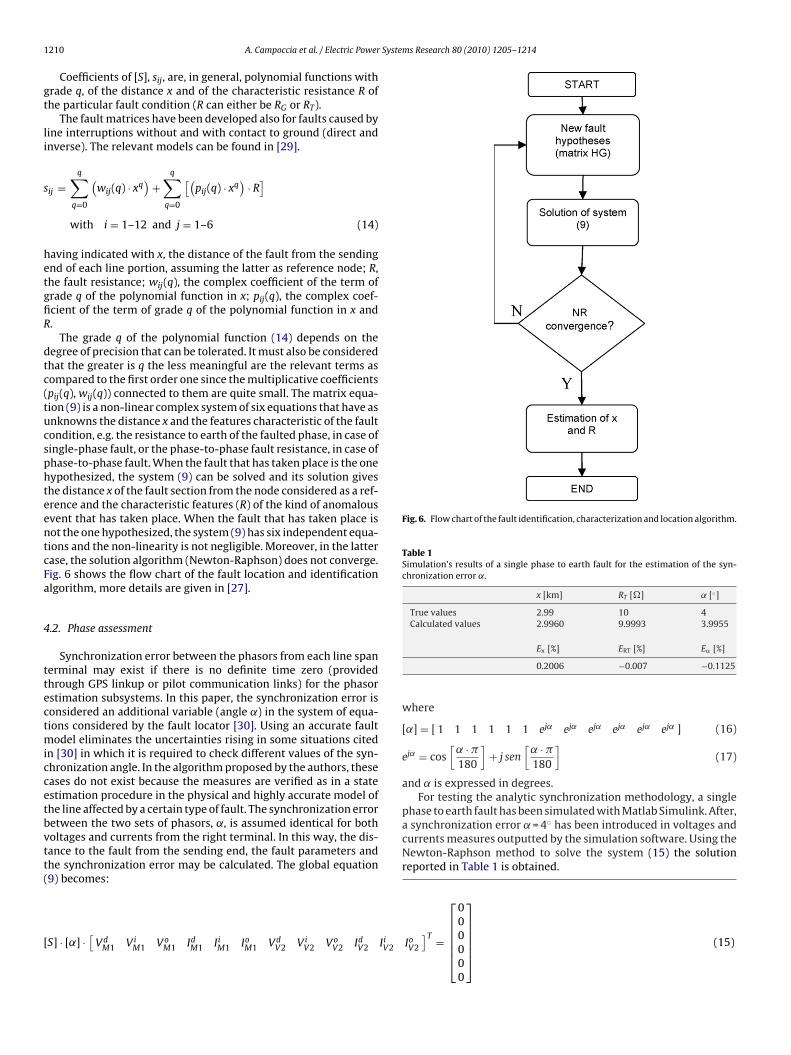
Table 1Simulation’s results of a single phase to earth fault for the estimation of the syn-chronization error ˛.
x [km] RT [�] ˛ [◦]
True values 2.99 10 4Calculated values 2.9960 9.9993 3.9955
a synchronization error ˛ = 4◦ has been introduced in voltages andcurrents measures outputted by the simulation software. Using theNewton-Raphson method to solve the system (15) the solutionreported in Table 1 is obtained.
210 A. Campoccia et al. / Electric Power
Coefficients of [S], sij, are, in general, polynomial functions withrade q, of the distance x and of the characteristic resistance R ofhe particular fault condition (R can either be RG or RT).
The fault matrices have been developed also for faults caused byine interruptions without and with contact to ground (direct andnverse). The relevant models can be found in [29].
ij =q∑
q=0
(wij(q) · xq
)+
q∑q=0
[(pij(q) · xq
)· R
]with i = 1–12 and j = 1–6 (14)
aving indicated with x, the distance of the fault from the sendingnd of each line portion, assuming the latter as reference node; R,he fault resistance; wij(q), the complex coefficient of the term ofrade q of the polynomial function in x; pij(q), the complex coef-cient of the term of grade q of the polynomial function in x and.
The grade q of the polynomial function (14) depends on theegree of precision that can be tolerated. It must also be consideredhat the greater is q the less meaningful are the relevant terms asompared to the first order one since the multiplicative coefficientspij(q), wij(q)) connected to them are quite small. The matrix equa-ion (9) is a non-linear complex system of six equations that have asnknowns the distance x and the features characteristic of the faultondition, e.g. the resistance to earth of the faulted phase, in case ofingle-phase fault, or the phase-to-phase fault resistance, in case ofhase-to-phase fault. When the fault that has taken place is the oneypothesized, the system (9) can be solved and its solution giveshe distance x of the fault section from the node considered as a ref-rence and the characteristic features (R) of the kind of anomalousvent that has taken place. When the fault that has taken place isot the one hypothesized, the system (9) has six independent equa-ions and the non-linearity is not negligible. Moreover, in the latterase, the solution algorithm (Newton-Raphson) does not converge.ig. 6 shows the flow chart of the fault location and identificationlgorithm, more details are given in [27].
.2. Phase assessment
Synchronization error between the phasors from each line spanerminal may exist if there is no definite time zero (providedhrough GPS linkup or pilot communication links) for the phasorstimation subsystems. In this paper, the synchronization error isonsidered an additional variable (angle ˛) in the system of equa-ions considered by the fault locator [30]. Using an accurate fault
odel eliminates the uncertainties rising in some situations citedn [30] in which it is required to check different values of the syn-hronization angle. In the algorithm proposed by the authors, theseases do not exist because the measures are verified as in a statestimation procedure in the physical and highly accurate model ofhe line affected by a certain type of fault. The synchronization erroretween the two sets of phasors, ˛, is assumed identical for botholtages and currents from the right terminal. In this way, the dis-ance to the fault from the sending end, the fault parameters andhe synchronization error may be calculated. The global equation9) becomes:
S] · [˛] ·[
VdM1 Vi
M1 VoM1 Id
M1 IiM1 Io
M1 VdV2 Vi
V2 VoV2 Id
V2 IiV2
Ex [%] ERT [%] E� [%]
0.2006 −0.007 −0.1125
where
[˛] = [ 1 1 1 1 1 1 ej˛ ej˛ ej˛ ej˛ ej˛ ej˛ ] (16)
ej˛ = cos[
˛ · �
180
]+ j sen
[˛ · �
180
](17)
and ˛ is expressed in degrees.For testing the analytic synchronization methodology, a single
phase to earth fault has been simulated with Matlab Simulink. After,
IoV2
]T =⎢⎢⎢⎢⎣
00000
⎥⎥⎥⎥⎦ (15)
A. Campoccia et al. / Electric Power Systems Research 80 (2010) 1205–1214 1211
5
atiTltatawot
ttpsh
ic
••
tb
cTce
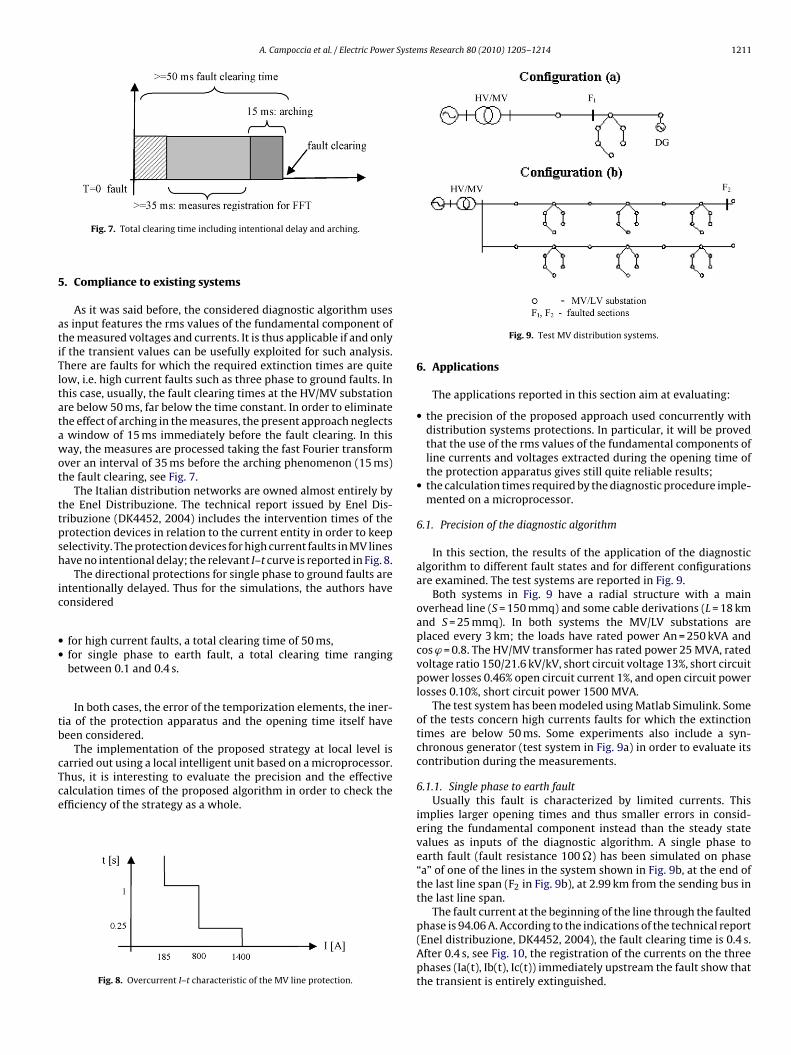
Fig. 7. Total clearing time including intentional delay and arching.
. Compliance to existing systems
As it was said before, the considered diagnostic algorithm usess input features the rms values of the fundamental component ofhe measured voltages and currents. It is thus applicable if and onlyf the transient values can be usefully exploited for such analysis.here are faults for which the required extinction times are quiteow, i.e. high current faults such as three phase to ground faults. Inhis case, usually, the fault clearing times at the HV/MV substationre below 50 ms, far below the time constant. In order to eliminatehe effect of arching in the measures, the present approach neglectswindow of 15 ms immediately before the fault clearing. In thisay, the measures are processed taking the fast Fourier transform
ver an interval of 35 ms before the arching phenomenon (15 ms)he fault clearing, see Fig. 7.
The Italian distribution networks are owned almost entirely byhe Enel Distribuzione. The technical report issued by Enel Dis-ribuzione (DK4452, 2004) includes the intervention times of therotection devices in relation to the current entity in order to keepelectivity. The protection devices for high current faults in MV linesave no intentional delay; the relevant I–t curve is reported in Fig. 8.
The directional protections for single phase to ground faults arententionally delayed. Thus for the simulations, the authors haveonsidered
for high current faults, a total clearing time of 50 ms,for single phase to earth fault, a total clearing time rangingbetween 0.1 and 0.4 s.
In both cases, the error of the temporization elements, the iner-ia of the protection apparatus and the opening time itself have
een considered.The implementation of the proposed strategy at local level isarried out using a local intelligent unit based on a microprocessor.hus, it is interesting to evaluate the precision and the effectivealculation times of the proposed algorithm in order to check thefficiency of the strategy as a whole.
Fig. 8. Overcurrent I–t characteristic of the MV line protection.
Fig. 9. Test MV distribution systems.
6. Applications
The applications reported in this section aim at evaluating:
• the precision of the proposed approach used concurrently withdistribution systems protections. In particular, it will be provedthat the use of the rms values of the fundamental components ofline currents and voltages extracted during the opening time ofthe protection apparatus gives still quite reliable results;
• the calculation times required by the diagnostic procedure imple-mented on a microprocessor.
6.1. Precision of the diagnostic algorithm
In this section, the results of the application of the diagnosticalgorithm to different fault states and for different configurationsare examined. The test systems are reported in Fig. 9.
Both systems in Fig. 9 have a radial structure with a mainoverhead line (S = 150 mmq) and some cable derivations (L = 18 kmand S = 25 mmq). In both systems the MV/LV substations areplaced every 3 km; the loads have rated power An = 250 kVA andcos ϕ = 0.8. The HV/MV transformer has rated power 25 MVA, ratedvoltage ratio 150/21.6 kV/kV, short circuit voltage 13%, short circuitpower losses 0.46% open circuit current 1%, and open circuit powerlosses 0.10%, short circuit power 1500 MVA.
The test system has been modeled using Matlab Simulink. Someof the tests concern high currents faults for which the extinctiontimes are below 50 ms. Some experiments also include a syn-chronous generator (test system in Fig. 9a) in order to evaluate itscontribution during the measurements.
6.1.1. Single phase to earth faultUsually this fault is characterized by limited currents. This
implies larger opening times and thus smaller errors in consid-ering the fundamental component instead than the steady statevalues as inputs of the diagnostic algorithm. A single phase toearth fault (fault resistance 100 �) has been simulated on phase“a” of one of the lines in the system shown in Fig. 9b, at the end ofthe last line span (F2 in Fig. 9b), at 2.99 km from the sending bus inthe last line span.
The fault current at the beginning of the line through the faulted
phase is 94.06 A. According to the indications of the technical report(Enel distribuzione, DK4452, 2004), the fault clearing time is 0.4 s.After 0.4 s, see Fig. 10, the registration of the currents on the threephases (Ia(t), Ib(t), Ic(t)) immediately upstream the fault show thatthe transient is entirely extinguished.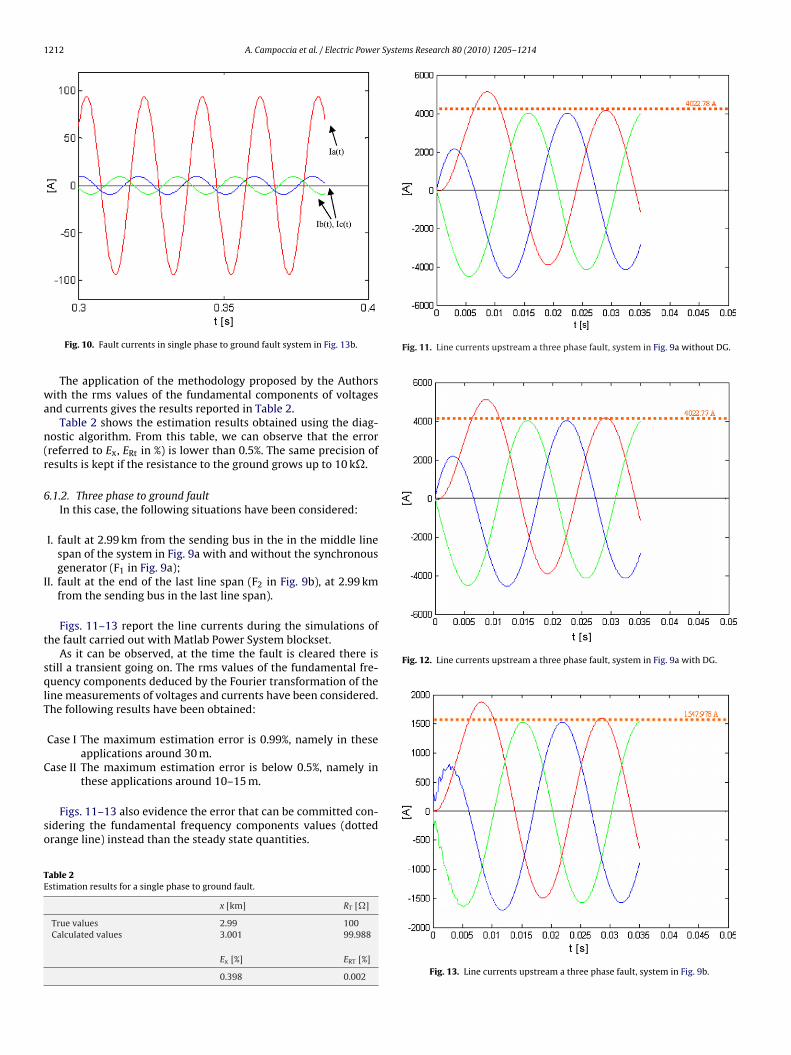
1212 A. Campoccia et al. / Electric Power Systems Research 80 (2010) 1205–1214
wa
n(r
6
I
t
sqlT
C
so
TE
Fig. 11. Line currents upstream a three phase fault, system in Fig. 9a without DG.
Fig. 12. Line currents upstream a three phase fault, system in Fig. 9a with DG.
Fig. 10. Fault currents in single phase to ground fault system in Fig. 13b.
The application of the methodology proposed by the Authorsith the rms values of the fundamental components of voltages
nd currents gives the results reported in Table 2.Table 2 shows the estimation results obtained using the diag-
ostic algorithm. From this table, we can observe that the errorreferred to Ex, ERt in %) is lower than 0.5%. The same precision ofesults is kept if the resistance to the ground grows up to 10 k�.
.1.2. Three phase to ground faultIn this case, the following situations have been considered:
I. fault at 2.99 km from the sending bus in the in the middle linespan of the system in Fig. 9a with and without the synchronousgenerator (F1 in Fig. 9a);
I. fault at the end of the last line span (F2 in Fig. 9b), at 2.99 kmfrom the sending bus in the last line span).
Figs. 11–13 report the line currents during the simulations ofhe fault carried out with Matlab Power System blockset.
As it can be observed, at the time the fault is cleared there istill a transient going on. The rms values of the fundamental fre-uency components deduced by the Fourier transformation of the
ine measurements of voltages and currents have been considered.he following results have been obtained:
Case I The maximum estimation error is 0.99%, namely in theseapplications around 30 m.
ase II The maximum estimation error is below 0.5%, namely inthese applications around 10–15 m.
Figs. 11–13 also evidence the error that can be committed con-idering the fundamental frequency components values (dottedrange line) instead than the steady state quantities.
able 2stimation results for a single phase to ground fault.
x [km] RT [�]
True values 2.99 100Calculated values 3.001 99.988
Ex [%] ERT [%]
0.398 0.002 Fig. 13. Line currents upstream a three phase fault, system in Fig. 9b.
A. Campoccia et al. / Electric Power Syste
Fr
6
trtltpt(eNw(anR
fm1cipd
(ststrci
7
bldtktrf
t
ig. 14. Timing generated from the core board during the Newton-Raphson Algo-ithm execution.
.2. Calculation times
In order to automatically solve, through a microprocessor unit,he analytic non-linear equations related to the diagnostic algo-ithm (system (9)), two iterative methods have been considered:he Gauss-Seidel method and the Newton-Raphson method. Theast method, apparently more complex, has proved to be fasterhan the first one. The Newton-Raphson method uses an iterativerocess to approach one root of a function; the specific root thathe process locates depends on the initial, arbitrarily chosen valuex0); from x0, the Newton-Raphson method produces an improvedstimate initial value x1 and as the process evolves, from xn−1, theewton-Raphson method produces an improved estimate xn. Weill assume that the process has worked accurately when delta-x
xn − xn−1) becomes less than a predefined constant value. Throughdigital oscilloscope we have estimated the time the core boardeeds to elaborate the diagnostic algorithm, with the Newton-aphson method.
The following image (Fig. 14) represents a timing generatedrom our core board during the execution of the Newton-Raphson
ethod (applied to our diagnostic algorithm); the trace number(up in the screenshot) represents the time needed to exe-
ute the entire algorithm, instead the trace number 2 (bottomn the screenshot) represents the time needed to execute thereliminary procedures (mainly for acquiring and formatting theata).
The difference between the two previous time intervals1.36 ms) represents the time needed to execute a single iterativetep of the Newton-Raphson method, with our proprietary diagnos-ic algorithm and with our proprietary core board. One iteration isufficient to get a quite accurate result. Thus it can be concludedhat the computational time needed to perform the proposed algo-ithm is really limited, in this way the necessary subsequent actionsan be taken in less than a second. In the appendix some othernformation about the implementation aspects is given.
. Conclusions
The paper presents the feasibility study of a diagnostic systemased on a master unit located at the HV/MV station and many
ocal intelligent units, located at the MV/LV substations, running aiagnostic algorithm. The latter has been suitably restated in ordero make it applicable to a microprocessor implementation for anyind of fault including lines interruption without and with contacto ground. In this way, the matrices have been manipulated and
e-organized in order to create a set of fault matrices in which theault parameters are evidenced as unknowns.The algorithm implementation has been thus been tested inerms of precision and calculation times. The above issues have
ms Research 80 (2010) 1205–1214 1213
been dealt with using Matlab Simulink simulations of a faultedsystem and verifying that the actual input quantities extractedfrom transient registrations were giving accurate results and alsothrough a microprocessor implementation. For these studies, theactual protection systems existing in the distribution systemshave been considered. The applications show that although thesystem may include dispersed generation systems, the diagnos-tic algorithm is still able to recognize and precisely locate thefault. The proposed system could be integrated into a generalsystem performing surveillance, monitoring, identification andoperation tasks over reconfigurable systems. Further research willbe addressed towards the identification of a suitable architecturefor the data exchange. Also the study of other situations that cantake place in distribution systems and that can affect the results ofthe elaborations will be considered. Finally the definition of simplemethods for the extraction of the fundamental frequency compo-nents is also required.
Appendix A. Microprocessor implementation
In order to apply the described diagnostic methodology to a realMV/LV substation, three problems must be faced:
1. analog electrical parameters acquisition and conversion to digi-tal values;
2. collection of the digital values acquired from the local and theadjacent MV/LV substations, see Fig. 1;
3. digital values elaboration through a microprocessor board ableto implement the diagnostic algorithm.
The first problem has been solved using a high accuracypolyphase electrical energy measurement Integrated Circuit (IC),developed by the Analog Device Inc. The IC has six analog inputs,divisible into two channels (current and voltage); both channelsconsist of three pairs of fully differential inputs and a PGA (Pro-grammable Gain Amplifier). The IC is integrated in a proprietaryelectronic board (“acquisition board”) managed through an 8 bitmicrocontroller produced by Microchip Technology Inc.; each sub-station is equipped with an acquisition board.
As it was described in Section 2, at the sending end substationanother proprietary electronic board (“link board”, also managedby an 8 bit microcontroller) collects the data from two acquisitionboards, one installed locally and the other installed in the adja-cent substation. The local acquisition board is directly connectedto the ‘link board’ while the remote acquisition board (installedin the adjacent substation) is connected through a fiber opticalcommunication link.
This communication link (that solves the second problem) isimplemented through a transceiver developed by Avago Technolo-gies and it is designed to provide cost effective, high performancefiber optic communication links for industrial applications with linkdistances up to 3 km.
Finally, the third proprietary electronic board (“core board”) col-lects the acquired data and implements the diagnostic algorithmthanks to an 8 bit microprocessor (developed by Rabbit Semicon-ductor).
References
[1] M.E. Vazquez, M.O.L. Chacon, F.J. Altuve, An on-line expert system for fault sec-tion diagnosis in power systems, IEEE Trans. Power Syst. 12 (1) (1997) 357–362.
[2] Y.M. Park, G.W. Kim, J.M. Sohn, A logic based expert system (LBES) for fault sec-tion diagnosis in power system, IEEE Trans. Power Syst. 12 (1) (1997) 362–369.
[3] H.J. Cho, J.K. Park, An expert system for fault section diagnosis of power systemsusing fuzzy relations, IEEE Trans. Power Syst. 12 (1) (1997) 616.
[4] Y.C. Huang, H.T. Yang, C.L.H. Yang, An new intelligent hierarchical fault diagno-sis system for power networks, IEEE Trans. Power Syst. 12 (1) (1997) 349–356.
1 Syste
[
[
[
[
[
[
[
[
[
[
[
[
[
[
[
[
[
[
[
[
[
214 A. Campoccia et al. / Electric Power
[5] Y.Y. Hsu, F.C. Lu, Y. Chien, J.P. Liu, J.T. Lin, P.H.S. Yu, R.R.T. Kuo, An expert systemfor locating distribution system faults, IEEE Trans. Power Deliv. 6 (1) (1991)366–372.
[6] C.Y. Teo, A comprehensive fault diagnostic system using artificial intelligencefor sub-transmission and urban distribution networks, IEEE Trans. Power Syst.12 (4) (1997) 1487–1493.
[7] C.Y. Teo, H.B. Gooi, Artificial intelligence in diagnosis and supply restoration fora distribution network, IEE Proc. Generation, Transm. Distrib. 145 (4) (1998)444–450.
[8] M.R. Montakhab, R.N. Adams, Intelligent system for fault diagnosis on lowvoltage distribution networks, IEEE Proc. Generation, Transm. Distrib. 145(September (5)) (1998) 592–596.
[9] F.S. Wen, C.S. Chanh, Probabilistic approach for fault-section estimation inpower systems based on a refined genetic algorithm, IEE Proc. Generation,Transm. Distrib. 144 (March (2)) (1997) 160–168.
10] B. Park, H. Kargupta, E. Johnson, E. Riva Sanseverino, D. Hershberger, M.L. Di Sil-vestre, Distributed, collaborative data analysis from heterogeneous sites usinga scalable evolutionary technique, J. Appl. Intell. 16 (1) (2001) 19–42.
11] T.S. Bi, Y.X. Ni, C.M. Shen, F.F. Wu, A Novel ANN fault diagnosis system for powersystems using dual GA loops in ANN training, in: IEEE Summer Meeting PowerEngineering Society, vol. 1, 16–20 July, 2000, pp. 425–430.
12] J.A. Momoh, L.G. Dias, D.N. Laird, An implementation of a hybrid intelligent toolfor distribution system fault diagnosis, IEEE Trans. Power Deliv. 12 (2) (1997)1035–1040.
13] K.L. Lo, H.S. Ng, J. Trecat, Power systems fault diagnosis using Petri nets, IEEProc. Generation, Transm. Distrib. 144 (3) (1997) 231–236.
14] R. Isermann, On fuzzy logic applications for automatic control, supervision, andfault diagnosis, IEEE Trans. Syst. Man Cybern., Part A 28 (2) (1998) 221–235.
15] M.H. Touati, F. Mohamed, M. Marzouki, System fault diagnosis based on a fuzzyqualitative approach, in: European Design and Test Conference, ED&TC96, 1996,p. 616.
16] M.Y. Park, M. Lefley, B. Ramsay, I. Moyes, An abductive fuzzy knowledge basedsystem for fault diagnosis in a power system, in: Proceedings of the Interna-tional Conference on Power System Technology, vol. 1., 4–7 December, 2000,pp. 345–350.
17] K. Stergiopoulas, A.G. Pipe, H. Nouri, Intelligent control architectures for faultdiagnosis in electrical power distribution networks, IEEE Int. Symp. Intell. Con-trol (2003) 569–573.
18] C.Y. Evrenosoglu, A. Abur, Fault Location in Distribution Systems with dis-tributed generation, in: PSCC, 22–26 August Liege, Belgium, 2005.
19] F.H. Magnago, A. Abur, A new fault location technique for radial distributionsystems based on high frequency signals, in: Proc. IEEE.Power Eng. Soc. SummerMeeting, vol. 1, July 18–22, 1999, pp. 426–431.
20] A. Borghetti, M. Bosetti, M. Di Silvestro, C.A. Nucci, M. Paolone, Continuous-wavelet transform for fault location in distribution power networks: definitionof mother wavelets inferred from fault originated transients, IEEE Trans. PowerSyst. 23 (2) (2008) 380–388.
21] N. Perera, A.D. Rajapakse, A.M. Gole, Wavelet-based relay agent for isolatingfaulty sections in distribution grids with distributed generators, in: 8th IEEInternational Conference on AC and DC Power Transmission, 28–31 March,2006, pp. 162–166.
22] J. Zhu, D.L. Lubkeman, A.A. Girgis, Automated fault location and diagnosis onelectric power distribution feeders, IEEE Trans. Power Deliv. 12 (2) (1997)801–809.
23] M. Togami, N. Abe, T. Kitahashi, H. Ogawa, On the application of a machinelearning technique to fault diagnosis of power distribution lines, IEEE Trans.Power Deliv. 10 (4) (1995) 1927–1936.
24] M. Togami, N. Abe, T. Kitahashi, H. Ogawa, Probabilistic approach of a deci-sion tree to fault diagnosis on power distribution lines, in: IEEE PowerTech, 29August–2 September, Budapest, 1999.
25] S.-J. Lee, M.-S. Choi, S.-H. Kang, B.-G. Jin, D.-S. Lee, B.-S. Ahn, N.-S. Yoon, H.-Y.
Kim, S.-B. Wee, An intelligent and efficient fault location and diagnosis schemefor radial distribution systems, IEEE Trans. Power Deliv. 19 (April (2)) (2004)524–532.26] J. Moras-Florez, J. Melèndez, G. Carrillo-Caicedo, Comparison of impedancebased fault location methods for power distribution systems, Electric PowerSyst. Res. 78 (2008) 657–666.
ms Research 80 (2010) 1205–1214
27] A. Campoccia, M.L. Di Silvestre, I. Incontrera, E. Riva Sanseverino, A newmethodology for distribution systems faults identification, location and char-acterization, COMPEL 24 (4) (2005) 1328–1350.
28] A. Campoccia, I. Incontrera, E. Riva Sanseverino, An optimized diagnosticarchitecture for real-time monitoring of MV networks, in: Proc. IEE. Power Engi-neering Society General Meeting, Montreal, Quebec, Canada. June 18–22, 2005,pp. 0–6.
29] I. Incontrera, La gestione dei sistemi elettrici alla luce delle nuove normativeAEEG: una nuova metodologia diagnostica per il miglioramento della qualitàdel servizio, PhD thesis, Faculty of Engineering, University of Palermo, Italy,2007.
30] M.M. Saha, J. Izykowski, E. Rosolowski, R. Molag, ATP-EMTP investigation of anew algorithm for locating faults on power transmission lines with use of two-end unsynchronized measurements, in: International Conference on PowerSystems Transients (IPST’07), June 4–7 Lyon, France, 2007.
Angelo Campoccia was born in Ciminna (Palermo), Italy, on September 15, 1943.He obtained a doctorate in Electrical Engineering from the University of Palermo,Italy, in 1969. From 1969 until 1970 he was a C.N.R. researcher at the Universityof Palermo. From 1971 until 1973 he had a grant from the Department of ElectricalEngineering. From 1973 to 1985 he taught MV and LV Electrical Power Systems. He isnow full professor of Power Systems at the University of Palermo. His main researchinterest is in the field of Electrical Security, Electromagnetic Compatibility, Earth-ing Systems, Diagnostic, Planning and Dimensioning Power Systems, Reliability ofPower Systems, and Power Network Analysis in Fault conditions.
Maria Luisa Di Silvestre was born in Torino (Italy) on December 31, 1965. In 1993 shereceived the Master degree in Electrical Engineering at the University of Palermo,Italy. In 1998 she successfully finished her Ph.D. in Electrical Engineering (ElectricPower Systems) at the same University. From 1999 to 2000 she joined the Depart-ment of Electrical Engineering of the University of Palermo as a grant holder. Since2000 she is with the same Department as a university researcher. Her main researchinterests are in the fields of analysis and modeling of complex grounding systems,diagnostic methodologies elaboration for the evolutionary analysis of the electricalsystem, power system electromagnetic compatibility, electromagnetic numericalmethods.
Iolanda Incontrera was born in 1977 in Palermo, Italy. She graduated from the Uni-versity of Palermo in Electrical Engineering in April 2003 and received the Ph.D. inMarch 2007 in Electrical Engineering at the same University. Her final Ph.D. thesis iscentred on Diagnostics in Electrical Power System and automation of the distribu-tion network. Since April 2007 she is been working with the power systems researchgroup at the Department of Electrical Engineering at the University of Palermo. FromMarch 2004 to May 2006 she had been working at the Italian Transmission SystemOperator (GRTN until October 2005 and TERNA form November 2005 till today), asa member of Settlement Team in the field of Generation of Electrical Energy in themarket. Since June 2006, she has been a middle manager for the main Italian mar-ket operator, Enel Produzione, in the field of prevision in the medium term of theplants’ productions in the day-ahead energy market (MGP) and in the ancillary ser-vice market (MSD), first margin MGP + MA and total margin MSD of Enel Produzioneand fuel stocks.
Eleonora Riva Sanseverino was born in 1971 in Palermo, Italy. She graduated fromthe University of Palermo in Electrical Engineering in 1995 and received the Ph.D.in February 2000 in Electrical Engineering at the same University. From Decem-ber 2001 to October 2002 she had been working at the National Council ofResearch, CNR, as a full-time researcher in the field of Computer Science. SinceOctober 2002, she has been an associate professor in Power Systems. Her mainresearch interest is in the field of optimisation methods on electrical distribu-tion system’s design, operation and planning; distribution systems fault diagnosisand service restoration strategies; theory and applications of soft-computingtechniques.
Guido Spoto received a degree in Electronic Engineering from the Palermo University,Italy, in 2002. Presently he his researcher at CRES (Centro per la ricerca Elettronicain Sicilia), a Centre of Applied Research. He is involved in research in the microelec-tronic field and co-operates with the University of Palermo in the development ofgraduation and Ph.D. thesis of industrial interest.