
AN APPROACH TO INVENTORY MANAGEMENT IN MASS ...
198
University of Windsor University of Windsor Scholarship at UWindsor Scholarship at UWindsor Electronic Theses and Dissertations Theses, Dissertations, and Major Papers 10-19-2015 AN APPROACH TO INVENTORY MANAGEMENT IN MASS AN APPROACH TO INVENTORY MANAGEMENT IN MASS CUSTOMIZED PRINTING PRODUCTION ENVIRONMENT CUSTOMIZED PRINTING PRODUCTION ENVIRONMENT Ashwath Raj Sridharan University of Windsor Follow this and additional works at: https://scholar.uwindsor.ca/etd Recommended Citation Recommended Citation Sridharan, Ashwath Raj, "AN APPROACH TO INVENTORY MANAGEMENT IN MASS CUSTOMIZED PRINTING PRODUCTION ENVIRONMENT" (2015). Electronic Theses and Dissertations. 5445. https://scholar.uwindsor.ca/etd/5445 This online database contains the full-text of PhD dissertations and Masters’ theses of University of Windsor students from 1954 forward. These documents are made available for personal study and research purposes only, in accordance with the Canadian Copyright Act and the Creative Commons license—CC BY-NC-ND (Attribution, Non-Commercial, No Derivative Works). Under this license, works must always be attributed to the copyright holder (original author), cannot be used for any commercial purposes, and may not be altered. Any other use would require the permission of the copyright holder. Students may inquire about withdrawing their dissertation and/or thesis from this database. For additional inquiries, please contact the repository administrator via email ([email protected]) or by telephone at 519-253-3000ext. 3208.
-
Upload
khangminh22 -
Category
Documents
-
view
1 -
download
0
Transcript of AN APPROACH TO INVENTORY MANAGEMENT IN MASS ...

University of Windsor University of Windsor
Scholarship at UWindsor Scholarship at UWindsor
Electronic Theses and Dissertations Theses, Dissertations, and Major Papers
10-19-2015
AN APPROACH TO INVENTORY MANAGEMENT IN MASS AN APPROACH TO INVENTORY MANAGEMENT IN MASS
CUSTOMIZED PRINTING PRODUCTION ENVIRONMENT CUSTOMIZED PRINTING PRODUCTION ENVIRONMENT
Ashwath Raj Sridharan University of Windsor
Follow this and additional works at: https://scholar.uwindsor.ca/etd
Recommended Citation Recommended Citation Sridharan, Ashwath Raj, "AN APPROACH TO INVENTORY MANAGEMENT IN MASS CUSTOMIZED PRINTING PRODUCTION ENVIRONMENT" (2015). Electronic Theses and Dissertations. 5445. https://scholar.uwindsor.ca/etd/5445
This online database contains the full-text of PhD dissertations and Masters’ theses of University of Windsor students from 1954 forward. These documents are made available for personal study and research purposes only, in accordance with the Canadian Copyright Act and the Creative Commons license—CC BY-NC-ND (Attribution, Non-Commercial, No Derivative Works). Under this license, works must always be attributed to the copyright holder (original author), cannot be used for any commercial purposes, and may not be altered. Any other use would require the permission of the copyright holder. Students may inquire about withdrawing their dissertation and/or thesis from this database. For additional inquiries, please contact the repository administrator via email ([email protected]) or by telephone at 519-253-3000ext. 3208.

AN APPROACH TO INVENTORY MANAGEMENT IN MASS CUSTOMIZED
PRINTING PRODUCTION ENVIRONMENT
BY
ASHWATH RAJ SRIDHARAN
A Thesis
Submitted to the Faculty of Graduate Studies
Through the Department of Industrial and Manufacturing Systems Engineering
In Partial Fulfillment of the Requirements for
The Degree of
Master of Applied Science
At The University of Windsor
Windsor, Ontario, Canada
2015
© 2015 Ashwath Raj Sridharan

AN APPROACH TO INVENTORY MANAGEMENT IN MASS CUSTOMIZED
PRINTING PRODUCTION ENVIRONMENT
BY
ASHWATH RAJ SRIDHARAN
APPROVED BY:
Dr. L. Oriet
___________________________________________
Mechanical, Automotive and Materials Engineering
Dr. A. Djuric
______________________________________________
Industrial and Manufacturing Systems Engineering
Dr. Z. Pasek. Advisor
______________________________________________
Industrial and Manufacturing Systems Engineering
11th September 2015

iii
DECLARATION OF ORIGINALITY
I hereby certify that I am the sole author of this thesis and that no part of this thesis has
been published or submitted for publication.
I certify that, to the best of my knowledge, my thesis does not infringe upon anyone’s
copyright nor violate any proprietary rights and that any ideas, techniques, quotations, or
any other material from the work of other people included in my thesis, published or
otherwise, are fully acknowledged in accordance with the standard referencing practices.
Furthermore, to the extent that I have included copyrighted material that surpasses the
bounds of fair dealing within the meaning of the Canada Copyright Act, I certify that I have
obtained a written permission from the copyright owner(s) to include such material(s) in
my thesis and have included copies of such copyright clearances to my appendix.
I declare that this is a true copy of my thesis, including any final revisions, as approved by
my thesis committee and the Graduate Studies office, and that this thesis has not been
submitted for a higher degree to any other University or Institution.

iv
ABSTRACT:
In the competitive industrial setting of present times, it is hard for the manufacturing sector
of developed economies to compete with those of developing countries because of the
considerably high costs associated with Labor, Material and Transportation in addition to
strict Environmental Sanctions, fierce competition from Sinking industries and the ever-
shifting global economic patterns. For a manufacturing industry to survive in such
conditions, it must be willing to change, should be technologically superior, access multiple
markets, be responsive and adapt quickly.
New manufacturing concepts and Business strategies are proposed and introduced
frequently. One such business/manufacturing strategy that has proved to be successful is
Mass Customization. The advantage of MC companies over traditional manufacturing
comes with its fair share of challenges. This thesis identifies some important challenges
faced by the printing industry, which has adapted MC, and solves one of these challenging
problems.

v
DEDICATION
I would like to dedicate my work to my parents who made this possible, putting up with
me through tough times, encouraging me, supporting me throughout and for their wise
words “We will support your studies no matter what…study as much as you want…it is
and will be your only asset”

vi
AKNOWLEDGEMENTS
I sincerely thank my advisor, Dr. Zbigniew Pasek, for his continual moral support, counsel
and most of all for his kindness without none of this would have been possible.
I would also like to extend my sincerest thanks to the management at Cimpress (Vistaprint),
especially Mr. Jonathan Styles and Mr. Alex El-Ghusein for giving me the opportunity to
work with them and educating me sharing their immense knowledge and experience. I
would also like to thank Mrs. Natalie (Sr. Industrial Engineer – CIMPRESS) for guiding
me with the work.

vii
TABLE OF CONTENTS
DECLARATION OF ORGINALITY iii
ABSTRACT iv
DEDICATION v
ACKNOWLEDGEMENTS vi
LIST OF FIGURES ix
LIST OF TABLES x
LIST OF ACRONYMS xi
I.INTRODUCTION 1
1.1. History of Printing 1
1.1.1. Wood Block Printing 1
1.1.2. Stencils 1
1.2. Printing Technology 2
1.2.1. Movable Type 2
1.2.2. The Printing Press 2
1.2.3. Rotary Printing Press 2
1.3. Conventional Printing Technology 3
1.3.1. Letter Press 4
1.3.2. Offset Printing 4
1.3.3. Gravure Printing 4
1.3.4. Flexography 4
1.3.5. Dye – Transfer Process 5
1.3.6. Inkjet printing 5
1.3.7. Laser Printing 5
1.3.8. Screen Printing 5
1.4. Timeline – Evolution of Printing 6
II. PRINTING INDUSTRY 10
2.1. Mass customization 11
2.2. Emergence of Mass Customized Printing 12
2.3. About the company – Vistaprint 16
2.4. Market – Competition in Mass Customized Printing Industry 19

viii
2.5. Challenges faced by mass customizing Industries 23
2.6. Production System and the Related Supply Chain – Vistaprint 25
2.7. Problem Statement 29
III. APPROACH 30
IV. LITERATURE REVIEW 35
4.1. Idea Map 36
4.2. Mass Customization 38
4.3. Operations Research 42
4.4. Simulation Based Verification 44
V. DMAIC FRAMEWORK, IDENTIFICATION AND ANALYSIS OF MODEL 46
5.1. Define Phase 47
5.2. Measure Phase 51
5.3. Analyse & Improve phases 56
5.3.1. News Vendor Model Formula and Notations 61
5.4. Control phase 75
VI. VALIDATION BY SIMULATION 77
6.1. Building the Model 77
6.2. Assumptions & limitations 78
6.3. Validation 79
6.4. Simulation – Hourly maximum capacity based output 84
6.5. Limitations 86
VII. CONCLUSIONS 86
VIII. FUTURE WORK 87
APPENDICES 89
Appendix A: History of Printing 89
Appendix B: Demand Distribution Histograms & Demand vs Inventory Setting 95
Appendix C: Demand vs Inventory 167
REFERENCES 181
VITA AUCTORIS 185

ix
LIST OF FIGURES
Fig 1: Shift in Manufacturing Paradigm and Associated Printing Technologies
Fig 2: Vistaprint’s printing market share – 2014
Fig 3: Revenue – Vistaprint – 2002 to 2010
Fig 4: Customer 80/20 chart
Fig 5: Traditional Printing Process – Process Flow
Fig 6: Time Series – Hourly output
Fig 7: Frequency Distribution of hourly output of Small Black T-Shirt– January 2014
Fig 8: Frequency Distribution of hourly output of Small Black T-Shirt– February 2014
Fig 9: Mass Production to Mass Customization
Fig 10: Textile Floor Layout
Fig 11: Hourly demand of Small Black T – Shirt – Jan 2014
Fig 12: Hourly demand distribution
Fig 13: Output comparison – demand histogram & demand VS inventory comparison
Fig 14: Output Comparison – Demand Vs Inventory
Fig 15: Initial Simulation layout
Fig 16: Revised simulation layout

x
LIST OF TABLES
Table 1: key – figure 1
Table 2: Product/Services offered by Vistaprint
Table 3: Cost comparison from 2007 to 2014
Table 4: Total On-Floor Inventory on Textile Floor Layout
Table 5: On – Floor Inventory Space Coverage – Textile Layout
Table 6: Machine Cycle Times – Printing Layout
Table 7: News Vendor Model – Month to Month, Bi Monthly and Weekly – Comparison with
Simple Moving Average
Table 8: December – Weekly Textile Inventory Level Setting – News Vendor
Table 9: Maximum hourly output – Printing Machines
Table 10: Maximum output from running simulation
Table 11: Maximum Hourly Output – Jan 2014 to Jan 2015
Table 12: Hourly Output from Dryers
Table 13: Hourly Simulation Output

xi
LIST OF ACRONYMS
B2B Business to Business
B2C Business to Consumer
CAPP Computer Aided Process Planning
CI Continuous Improvement
CIJ Continuous Ink Jet
CT Cycle Time
DOD Drop on Demand
DOE Design of Experiment
GT Group Technology
HVP High Volume Production
KP Knapsack Problem
LSS Lean Six Sigma
MC Mass Customization
MDKP Multi-Dimensional knapsack Problem
OEE Overall Equipment Efficiency
OR Operational Research
R&D Research and Development
SME Small and Medium Size enterprises

xii
SOP Standard Operating Procedure
TPS Toyota Production System
USPTO Unites States Patent and Trademark
Office
W2P Web to Print
WIP Work in Progress

1
I. INTRODUCTION
1.1. HISTORY OF PRINTING:
The history of printing can be traced back to 3000 B.C., to the Mesopotamian civilization
when seals were used to print on clay tablets. The printed artifacts are the most ancient
surviving printed material in all of history.
Different civilizations around the world historically specialized in different forms of
printing and were printing on different materials. China and Egypt used stamps as seals
before printing on large blocks. China, India and Europe specialized in printing on clothing
before printing on papyrus (paper).
1.1.1. WOOD BLOCK PRINTING:
It was a type of printing text, images and patterns, widely used in East Asia. It was used to
print on textiles and later on paper. The earliest use of dates back to about 220. Block books
were produced during the 15th century.
Buddhism was hugely responsible for the use and propagation of printed texts.
1.1.2. STENCILS:
Stencils might have been used to colour clothes for a long time. The technique probably
reached the peak of finesse during the Katazome and Edo periods in Japan. In Europe, at
around 1450, stencils were used to colour black and white prints on old master prints.

2
1.2. PRINTING TECHNOLOGY:
1.2.1. MOVABLE TYPE:
Movable type is a system that dates back to around 1900. It used movable plates/ pieces of
metals on which matrices struck by letterheads were mounted. The world’s first movable
time system was made in China by Bi Sheng using porcelain. Wang Zhen started using
more durable wooden block by 1298 C.E. Wang also developed a complex system of
revolving tables and numbers in Chinese making a wood based movable system more
efficient. Wood block printing continued to still be predominantly used.
1.2.2. THE PRINTING PRESS
Gutenberg collaborated with Dritzehen, who was a gem cutter and the owner of a paper
mill making the movable type printing more efficient and durable compared to Woodblock
printing. The printed material were cheaper to make and the low price of Gutenberg’s bible
(1455) established that the movable printing press was superior and apt for printing western
languages.
Gutenberg’s innovation to the movable printing press is considered the most important
innovation of the second millennium and the printing technology that initiated the paradigm
change from mass manufacturing to mass customization technology.
1.2.3. ROTARY PRITING PRESS
Invented by Richard March Hoe in 1843, rotary printing press uses a cylinder with
impressions, which are inked and rolled continuously on consecutive papers to print.
William Bullock improved on the rotary printing press later.

3
1.3. CONVENTIONAL PRINTING TECHNOLOGY
In printing, there are two areas that dictate the output:
Image/Letters – Printing area
Non-Printing areas
There are four types of processes in conventional printing:
Planographics – In this type, the printing and non – printing areas are in the same
plane and the separation is maintained by chemical or physical properties. Examples
of Planographics based printing include offset lithography, collotype and screen
less printing.
Relief – In relief type printing, the printing and non-printing areas are on different
planes. The printing areas are on a plane face and the non – printing areas are on a
lower plane. Flexography and Letterpresses use relief type process to print.
Intaglio – In a plane, the printing areas are engraved below the plane while the non
– printing area is on the plane. Steel die engraving and gravure printing use this
technique.
Porous – The printing area is covered by a mesh that ink can penetrate and the non
– printing areas are covered with stencil to repel and block ink spill. Screen printing
and Stencil duplicator use this technique.

4
1.3.1. LETTER PRESS
It is a type of relief printing. It uses a movable type plate that is placed inside the press,
which is then inked and pressed against paper.
It was widely used from mid 15th century to the end of the 20th century, until the inventorion
of offset printing.
1.3.2. OFFSET PRINTING
In offset printing the image is transferred from the plate to the rubber blanket which is then
used to perform the printing. A flat (planographic) image carrier is used when the system
is coupled with a lithographic process (which uses a process of oil and water repulsion).
Lithography and offset printing are the most commonly used printing techniques used to
print books and newspapers.
1.3.3. GRAVURE PRINTING
It is a type of intaglio printing. The image to be printed is engraved on a surface at a level
below the surface of the plate. The engraving depressions are filled with ink and the spill
is scraped off the surface using a blade. A cylinder made of copper plated with steel and
wrapped with rubber, which is then rolled over the plate.
1.3.4. FLEXOGRAPHY
Flexography is a type of relief printing. It is called the modern version of letterpress.

5
1.3.5. DYE – TRANSFER PROCESS
It is continuous – tone colour photographic printing process. It was used to make film based
movies.
1.3.6. INKJET PRINTING
It is used to print on paper, plastic and other substrates. Inkjet as the name suggests, print
images and letters by spraying ink droplets.
Two technologies are used in Inkjet printing – CIJ (Continuous Ink Jet) and DOD (Drop
on Demand).
1.3.7. LASER PRINTING
Laser printing is an electrostatic digital printing process. It produces high quality prints,
both text and images. Laser printer uses a negatively charged cylindrical drum which
attracts electronically charged powder ink selectively, based on the print image/letter, and
the image is transferred to paper and the paper and the paper is heated to dry the ink.
1.3.8. SCREEN PRINTING
Screen printing uses porous printing technique. It is widely used to print on T-Shirts and
on slippery surfaces including tiles, plastics, stickers, vinyl, wood etc.
A mesh coating is coated with ink as required for the image by moving a squeeze right
across the mesh while the reverse stroke touches the ink to the surface of the material to be
printed on.

6
Other types of printing include:
Pad Printing
Thermal Printing
1.4. TIMELINE – EVOLUTION OF PRINTING
Fig 1: Shift in Manufacturing Paradigms and Associated Printing Technologies (Yoram
Korean, 2010)

7
Table 1: Key – Figure 1
Printing Technology Year Key
Woodblock printing 200 A
Movable type 1040 B
Printing Press 1440 C
Etching 1515 D
Mezzotint 1642 E
Aquatint 1772 F
Rotary press 1843 G
Offset Printing 1875 H
Xerography 1938 I
Inkjet printing 1951 J
Dye-Sublimation 1957 K
Dot Matrix printing 1968 L
Laser printing 1969 M
Thermal printing 1972 N
3D printing 1984 O
Digital printing 1993 P

8
In the early ages of the printing technology’s evolution, technologies were trying to
reciprocate copying methods. Most of the technologies were created to reproduce art. The
very first printing technologies can be traced back to Chinese civilizations and the Chinese
letters were complicated to reproduce and were similar to art. Thus, the main focus of the
printing technologies were reliable reproduction and not on printing scale. Thus, the first
generation for printing technology including Woodblock printing and Movable Printing
technology were considered as craft production technologies.
As the technology reached Europe and the first bible was reproduced using printing
technology, Gutenberg realized the potential to improve on the printing technology to mass
produce and invented the Gutenberg’s printing press in 1440, changing the way printing
technology was viewed. Gutenberg’s printing press led to the paradigm shift from craft
production to mass production for the printing industry. Gutenberg’s printing press was
followed by several other innovations to the printing technology including Etching,
Mezzotint, Aquatint and Rotary press. Each printing technology progressively increased in
reliability and number of prints that they could produce, thereby decreasing unit costs with
the innovation of each technology.
The concept of mass customization came into printing around the 1990’s, however several
technologies that were developed before that were enablers of MC. The mass customization
enabling printing technology started being innovated around the 1870’s. The first printing
technology that enabled mass customization was Offset Printing technology. Offset
printing helped with printing multiple orders simultaneously at mass production
efficiencies. Offset Printing technology was followed by Xerography, Inkjet, Dye –
Sublimation, Dot Matrix, Laser, Thermal and digital printing. Although, till the beginning

9
of 1990’s these printing technologies were used to mass produce, the potential for these
printing technologies to be used to mass customize signifies that offset printing shifted the
printing industry’s paradigm from mass manufacturing to mass customization.
3D printing technology was first developed in in 1984. The first few generations of 3D
printing were unreliable and it was not considered a reliable technology to produce sellable
quantities. However, after mass customization being around for two decades now in the
printing industry, 3D printing is being viewed as the enabler of the next paradigm shift in
the printing industry, from mass customization to complete personalization.
These paradigms shifts with the associated technologies and timelines are shown in fig 1.
Note: In Fig 1, the timeline is split into three main manufacturing paradigms (Craft
Production, Mass Production and Mass Customization). The keys “A to P” represent the
printing technologies mentioned above and are placed corresponding to the manufacturing
paradigms they enable.
Mass Customizing W2P companies are coming up with creative ways to use old
technology, pairing the old mass production and craft production technologies with custom
interfaces to produce mass customized products.
For Example: Screen printing, which was considered a craft production technology, can
traditionally print only one T-Shirt or cloth based substrates at a time. However, using
multiple screen printing machines and using different designs for printing, the end product
line output can be customized product in a mass scale.
10
II. PRINTING INDUSTRY
The Printing industry has a long and strong background. Since Gutenberg invented the
movable type printing press (around 1450’s), printing has been considered the technology
that started the modern civilization. Printing gave people the ability to document history
efficiently and also distribute information reliably which was previously thought
impossible. The Printing industry has come a long way since its inception.
Printing accessibility to the masses started after the Second World War, after which there
were some significant advancements made to printing technology. Frenchman Rene
Higonnet and Loius Moyround applied for the patent for a phototypesetter called the
“Lumitype”. Rene and Loius used the patent to produce the Photon 100 and consecutively
the Photon 200, which were considered a significant advancement in mass printing
technology. In parallel, traditional printing machines started seeing technological
transformations from using hot metal composition to photo-matrices. This was the second
generation of the mass printing technology. The third generation featured photographic
storage. The fourth generation was the laser-output technology through Raster Image
Processor (Kipphan, 2001).
Further developments in associated technologies, including the development of the
computer and the word document helped expand the spectrum and opened the printing
industry to new efficiencies, which were previously thought to be impossible to achieve.
Successful creation of the printing business as a huge industry of its own is attributed to the
Germans.

11
2.1. MASS CUSTOMIZATION
The goal of Mass Customization is to provide enough variety so that the wants of the
customers are satisfied, whereas the goal of mass production is to produce at sufficiently
low costs so that everyone could have one (Michael T. Fralix, 2001). The practice of Mass
Customization did not start in the automotive industry but rather in the apparel industry.
There are several papers that support this fact including the one by Michael T. Fralix, a
professor from MC State University who points out the shift in the expectations of the
customers and how developed countries (especially the US) is losing to the developing
countries when it comes to producing customizable products in a large scale. Most of the
developing countries, which were making customizable products, were actually doing so
without realizing that they were starting and using the next phase in manufacturing that is
mass customization (Fralix, 2001).
High labour costs was and is the main reason for the industries in the developed countries
to stick to the more convenient and cost effective mass production, while the world around
them was changing. This along with several other factors lead to the slump in the
manufacturing industry, the slump that still exists in almost every sector, be it
manufacturing, service or hospitality. It is important to mention that industries in some
countries like Germany did find a way to customize and mass-produce at the same time by
investing heavily on Research and coming up with technology and supply chain sturdity to
counterbalance the cost of work force.
Mass Customization is approached differently by each industry that uses MC as a
competitive advantage. In automotive industry, it is customizing the looks (both interior

12
and exterior), offering different engine/power varieties, customizable paints, alloys etc., to
meet the customer wants. In the apparel industry, it might be manufacturing clothes that
meet the size of the majority of the population within certain age groups, or letting the
customers choose colours, fabric and styling of their clothes.
Most of the industries adapt and use mass customization as a tool to attract customers and
satisfy their preferences while keeping the available product variety under control. It is a
choice and companies either adapt or do not. But one industry has evolved completely
banking on this concept – the printing industry. There used to be a time when there existed
small printing shops that specialized in only one kind of printing. Some shops printed just
business cards while others printed posters and others textile. However, the present
situation is entirely different. This will be discussed in the following section.
2.2. EMERGENCE OF MASS CUSTOMIZED PRINTING
Over the past decade or so, the way the printing business functions has changed
tremendously. Earlier, before the dot com revolution, all the commercial printing was
essentially by piece production. i.e., individual orders were taken, processed, orders for raw
materials were placed, procured, printed on and then delivered. Traditional Printing process
took almost a month to complete and lead times for raw material procurement added the
most time to the overall process. As orders at traditional print shops were fluctuating and
seasonal, raw material inventory was not held (to eliminate holding costs). However, after
the dot com revolution, things changed. E-commerce became a predominant force in order
procurement. Orders were consolidated and the concept of Mass customization came into
the printing industry.

13
W2P companies dominate the printing business whose market share is growing
tremendously mainly by the cannibalization of regular Printing Businesses. The reason for
such success is the ever decreasing cost of production achieved by consolidation of orders,
standardization of processes to decrease make ready and the enquiry, design and order
processing being done by the customers, thereby reducing the cost of small orders
dramatically.
Fig 2: Vistaprint’s printing market share – 2014
Vistaprint prints 81.37% of the total product printing done in the whole of the United States.
This represents the total domination of the printing industry in the U.S. by Vistaprint (a
Mass Customizing W2P company). [11] In each country mentioned, other MC W2P
companies show a similar domination.

14
Examples of companies that mass customized and have been successful include: VistaPrint,
Saxoprint, Laserline etc. It is necessary to evaluate and study their value added chain and
production techniques to understand what makes them successful. The market is highly
competitive due to the high cost of entry. The only way to penetrate the printing market is
the original strategy that successful companies like Vistaprint followed, i.e. to find and
exploit another market gap like Vistaprint and Saxoprint initially did (identifying the
potential to step into the printing industry by catering to the printing needs of small
businesses). The difference between the W2P mass customized printing industry and the
traditional industry, from a customer’s point of view, is that MC W2P companies are easy
to order from, the delivery is quick and reliable, the quality is good with respect to the order
size and of course, the choice to order small volume at mass production costs.
Infact, the W2P printing industry is so successful that even regular printing companies have
moved on to provide just marketing advice and design inputs and outsource the printing to
MC W2P companies. Traditional Printing companies now provide just customer end
services like design and marketing assistance. This has led W2P companies to expand from
just serving B2C to B2B as well.
The expansion of MC W2P printing company’s market from just individual customers and
small businesses to the B2B market was an unexpected twist that the CEO’s of these
business themselves did not expect. Mass Customizing W2P company’s main aim was to
serve small businesses at low costs but provide good quality product in low volumes. Most
of the founders and CEO’s of MC W2P companies began as ‘Movers’, acting as brokers
bringing together printers and customers before realizing the market gap they could exploit.
These men realized the presence of small businesses that needed printing services but could

15
not afford the very high consulting costs and individual printing cost that traditional
printing companies commended, because of the small business’s low budgets.
Robert Keane, the President and CEO of Vistaprint, the No. 1 Web-to-Print industry was
the very first ‘Mover’ who talked about the existence of the market that could potentially
serve small businesses as his business plan during his MBA in France. Vistaprint has a
turnover of about 1.3 Billion USD and has been growing at an average of 14% since 2002.
Robert developed his marketing catalogue and went into business in 1995, starting in Paris.
A similar example was the story of Thorsten Fischer, the founder of Flyeralarm, a German
W2P printing company (No. 3 in all W2P companies). Fischer started as a mover in
Wurzburg, Germany. He realized the market gap mentioned earlier when he started
designing and printing advertisements for small local entrepreneurs and subsequently after
publishing his own marketing magazine in the city, realized the time and the cost difference
between traditional printing and his venture. He quit and started Flyeralarm in 2002.
Both Vistaprint and Flyeralarm started small like Amazon did (Amazon started by selling
rare books) and all three companies started before the dot com revolution and therefore did
not use the internet to support their products nor market it. Vistaprint, Flyeralarm nor
Amazon had even realized the potential for growth that would come with the inclusion of
internet in their business’s promotion and interfacing.
E-Commerce was the innovation that the printing industry was waiting for. DRUPA (2000)
was the initiative that made it all happen. DRUPA used the dot come revolution to interface
customers with printing companies using the internet as the interface. The DRUPA
initiative brought together 20 start-up companies into a single hall, developing an E-
16
Procurement interface that brought together customers and printing companies. The
DRUPA companies worked on a commission basis, collecting and consolidating customer
orders based on volume, style and time requirements. The business idea eventually failed,
but the first set of tools for internet based procurement and online configuration was already
in the market.
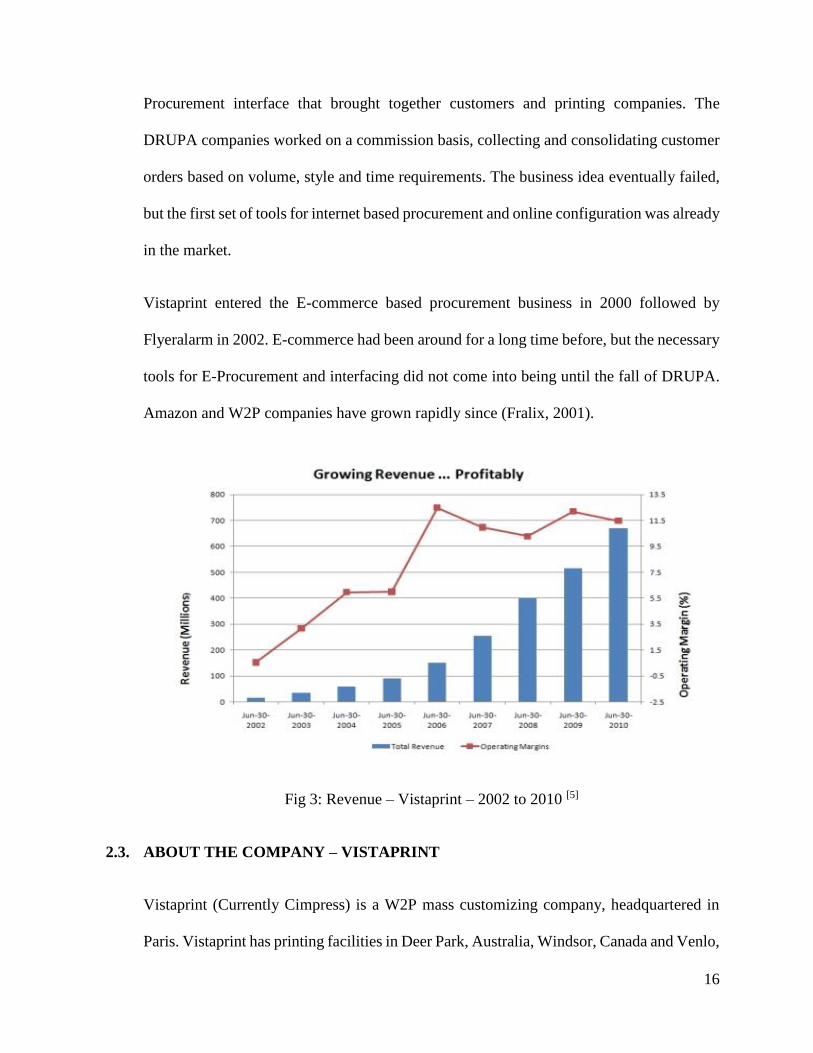
Vistaprint entered the E-commerce based procurement business in 2000 followed by
Flyeralarm in 2002. E-commerce had been around for a long time before, but the necessary
tools for E-Procurement and interfacing did not come into being until the fall of DRUPA.
Amazon and W2P companies have grown rapidly since (Fralix, 2001).
Fig 3: Revenue – Vistaprint – 2002 to 2010 [5]
2.3. ABOUT THE COMPANY – VISTAPRINT
Vistaprint (Currently Cimpress) is a W2P mass customizing company, headquartered in
Paris. Vistaprint has printing facilities in Deer Park, Australia, Windsor, Canada and Venlo,

17
Netherlands. As of 2007, Vistaprint was the 4th fastest growing printing company in North
America. [8]
Started by its president and CEO Robert Keane in 1995, its first product was business cards.
It has expanded to print on other material. The product list of Vistaprint includes: [9]
Table 2: Product/Services offered by Vistaprint
CATEGORY EXAMPLE PRODUCTS/SERVICES
BUSINESS CARDS Standard Business Cards, Signature Business Cards,
Brilliant Finish Business Cards, Raised Print Business
Cards and Spot Gloss Business Cards
BUSINESS SERVICES Logo Design, Mailing Lists, Toll Free 800 Number,
Credit Card Processing, Incorporate Today, Partner
Marketplace and Postage Meters
CALENDARS Wall Calendars, Desk Calendars, Magnetic Calendars,
Pocket Calendars and Poster Calendars
CHECKS Checks, Credit Card Processing and Gift Certificates
CORPORATE GIFTS Promotional Products, Personalized Mugs, Pens, Bottle
Openers and USB Flash Drives
CUSTOM CLOTHING Men's T-Shirts, Women's T-Shirts, Kids T-Shirts, Polo
Shirts, Men's Polo Shirts, Women's Polo Shirts, Hats,
Hoodies, Tote Bags, Promotional Products and Design
Services

18
DIGITAL MARKETING Websites, Website Design Services, Domain Names,
Social Media Marketing and Email Marketing
HOLIDAY PRODUCTS Holiday Cards, Christmas Address Labels and Gift Tags
INVITATIONS &
ANNOUNCEMENTS
Wedding Invitations, Save the Dates, Birthday
Invitations, Birth Announcements and Baby Shower
Invitations
LABELS & STICKERS Address Labels, Return Address Labels, Mailing Labels,
Stickers & Decals and Custom Stickers
MAGNETS Car Door Magnets, Magnetic Business Cards, Postcard
Magnets, Magnetic Calendars and Photo Magnets
MARKETING
MATERIALS
Postcards, Flyers, Postcard Mailing Services, Brochures
and Rack Cards
PHONE CASES Samsung Galaxy Cases and iPhone Cases
PHOTO GIFTS Personalized Mugs, Phone Cases, Canvas Prints, Wall
Calendars and Desk Calendars
SIGNS & POSTERS Banners, Lawn Signs, Lawn Signs, Political Signs and
Construction Signs
STAMPS & INK Self-Inking Stamps, Pre-Inked Stamps, Signature
Stamps, Date Stamps and Pocket Stamps
STATIONERY Address Labels, Return Address Labels, Mailing Labels,
Pens and Letterhead
After Vistaprint reached the saturation of its market growth in terms of customized printed
product, it went on to takeover other established and upcoming printing and digital

19
companies all over Europe and the United States and changed the parent company’s name
from Vistaprint to Cimpress, while its north American brand retained its name as Vistaprint.
Through the use of patented technology which range from business strategies, printing
technology and order aggregation to web interfaces, Vistaprint is able to aggregate large
number of customized orders based on product grouping – product grouping is done on the
basis of raw material type, size, ink substrate, capacity, delivery time constraints etc. A
preliminary search for patents by Vistaprint on the US patent office website turns up 125
patents registered under the company’s name [13].
Vistaprint uses Computer Integrated automated manufacturing techniques to minimize
human intervention and improve overall efficiency. Orders that were traditionally produced
at 60 labour minutes are done at around 60 seconds through the use of a combination of
aggregation of orders and automated processes. Vistaprint has been able to utilize the
principles of mass production to print short-run commercial printing at mass production
efficiencies.
2.4. MARKET – COMPETITION IN MASS CUSTOMIZED PRINTING INDUSTRY
Every market can be segregated using the 80/20 rule. Robert Keane, the president and CEO
of vistaprint identified a market gap that existed during his time. Traditional printing shops
could not satisfy the tail end of the 80/20 customer base.

20
Fig 4: Customer 80/20 chart (Konig, 2013)
The 20 % of the customers that generated 80 % of the profit in the whole of the printing
industry were the ones that the traditional printing shops were competing over. Their
business model was based around their technology restrictions and cost effectiveness
requirements. The traditional printing process followed by traditional printing shops were
quite simple (Fig 5). The customers come in and consult with the printing shop’s designers
about the type of product they wanted to print. The designers designed the layout of the
product based on the customers wants, with the details about the type of substrate to be
used, quality of substrate, size layout etc. and an expert in the shop’s available technology
would analyze the design and fix a minimum order number that had to be placed. Then the
customer was consulted and prices were decided.

21
Fig 5: Traditional Printing Process – Process Flow (Konig, 2013)
As traditional printing shops took care of one customer at a time, their minimum number
print requirements were huge. After the order was placed, the shops contacted their supplier
and ordered the ink, plates in some cases and paper type according to requirements. The
suppliers would then send the raw materials which would arrive at the print shop at different
times and as the order sizes were considerably small and scattered, these print shops had to
pay premium costs to acquire them. The materials arrived, printing presses were run,
printing was done and delivered. This process took a lot of time and money. Thus, the
required minimum volume of production was justifiably big and so were the costs. As a
result, only big businesses could afford to market their products through printed material.
Small businesses could not afford to print their marketing material and relied on word of
mouth and local newsletters to promote their businesses.
MC W2P companies have to invest heavily on technology to counterbalance and achieve
low unit cost requirements. Vistaprint invests about 10% of its revenues on its technology
alone, to stay competitive. Vistaprint invested $176 Million in 2014 alone to improve its
technology. Since Vistaprint’s inception, investments on technology, development and
capital is estimated to be around $1.3 Billion. [12].
After making heavy investments in technology and development of sound business
strategies MC W2P companies started taking in orders from customers that required just

22
small volumes of marketing material, consolidated and printed them keeping the overall
cots the same as other printing shops, but making the individual costs considerably low.
During the early years of production, MC W2P companies realized the potential to decrease
costs even further. They started using a base set of product variety offerings using product
variety management techniques. For example: The business cards that Vistaprint prints are
offered on a controlled number of base substrate paper material types like gloss, premium
gloss and Smooth Matte. The raw material paper stock is maintained in their warehouse
and the customers can choose only from these paper types but can customize the text, style
and design on the card they print. Because of controlling the base substrate type offered,
Vistaprint could decrease delivery time, decrease raw material costs as they were ordered
and stocked up on (low unit cost because of placing bulk orders with the suppliers) and
consolidate orders as they come in, the individual costs decreased even further.
Eventually MC W2P companies started streamlining their processes and decreasing the
production costs. And the individual unit costs were decreased even further by cutting out
the design and selection support out of their process and making the customers design and
make the choices themselves. Because of MC W2P company’s low aggregate costs, they
started thinking about other product lines they could expand into. MC W2P companies like
Vistprint then moved into printing postcards, letterheads, posters, flexes, signboards,
envelopes, mugs, bottles, pens, invitation cards, greetings, textiles etc. Their market share
increased with their product lines. MC W2P companies eventually started cannibalizing the
local print shops and after the revolution in global logistics and through successful
collaboration with global logistics companies, they started expanding into markets all over
the world from their base country. As their businesses grew, W2P companies started

23
expanding their manufacturing facilities into countries with high local and geographic
demand. Most successful W2P companies have facilities all over Europe, North America
and certain key countries in Asia. The growth has been drastic and the market saturated a
decade ago. Companies started moving from just B2C to B2B. Printing businesses that
were pushed out of business and other retail shops started outsourcing their printing to W2P
companies.
Successful MC W2P companies like Vistaprint have expanded into other businesses outside
just printing on products. Vistaprint now does advertising consultation and prints
promotional material custom-made to the client’s requirements, extending from
manufacturing into business services. The printing market has saturated and in order to
expand their businesses, there is a need for W2P companies to step into other streams of
printing related businesses and acquisitions like Vistaprint has successfully done.
2.5. CHALLENGES FACED BY MASS CUSTOMIZING INDUSTRIES
Mass customization is offering customers the ability to customize their product while
achieving mass production efficiencies in their manufacturing. Achieving such efficiency
is not an easy task and companies have tried and failed. The failure roots from the inability
of the manufacturing setting to cope with the challenges of mass customization.
The problems faced by MC W2P company’s industrial setting is similar to the problems
faced by traditional mass manufacturing companies, i.e. the seven wastes identified by TPS
– Transportation, Inventory, Motion, Waiting, Over – Processing, Over Production and
Defects. However, the constraints that surround the problems are more complicated than in
mass manufacturing.

24
Some of the common problems faced by mass customized industrial settings include:
(Amit, Rahul, 2007)[7]
Elicitation costs – Requirement of heavy investment on Information Technology
Higher capital investments on Flexible Manufacturing Systems
High Inventory storage costs to feed the flexible systems
Increased setup costs and need to update equipment on a regular basis
Unpredictable Economy of scale might drive costs up
Requirement to cross train workers and hire specialists adds cost
Customer relation and marketing centres are important – adding more cost burden
Work force performance tracking is difficult as the required work might vary
drastically
Unpredictable/ Unforeseeable production challenges
Increased downtimes compared to traditional settings
Reduced efficiencies because of small batch sizes (each unit might be different)
Sequencing challenges
Unpredictable demand
High sourcing complexity as demand cannot be forecasted properly
Requirement to be responsive to market trends as they tend to change frequently
and abruptly – might be seasonal but unpredictable
Logistics infrastructure might cost more than manufacturing
Risk of failure is high, as each new product added does not usually have a proven
track record to draw from
The need to learn as you go

25
A preliminary review of the challenges sheds light on the fact that the most common and
important challenge faced by MC W2P companies is excessive inventory. It is extremely
difficult to calculate inventory to be maintained (both warehouse and on-floor) because of
the extremely fluctuating demand patterns which are difficult to forecast accurately. The
difference between Forecasted demands and actual demands may vary significantly. These
constraints form the base of the problem studied in this thesis.
To understand the severity of the inventory control problem, it is important to understand
the production system and the related supply chain in W2P companies. A case study was
done using Vistaprint’s manufacturing facility in Windosr, Canada to understand the
inventory control challenge in detail. After a preliminary study was done on the entire
production facility’s inventory control, a detailed study was done on the Windsor facility’s
textile printing section.
2.6. PRODUCTION SYSTEM AND THE RELATED SUPPLY CHAIN - VISTAPRINT
Vistaprint collects orders through their web interface. The design collection and
documentation process is completely automated and helps reduce costs because of the
elimination of administrative staff and design staff.
Vistaprint’s document model architecture and technology uses web-based data architecture.
The model defines, processes and stores designs. Compared to bitmap and pdf, Vistaprint’s
model provides significant advantage in terms of storing and modifying designs. The
interface allows products to be customized while staying within the boundary of
Vistaprint’s manufacturing ability.

26
Based on keywords typed in by the customer, Vistaprint’s auto-matching software
generates algorithms to pull up previous design outlines and templates that can be
customized according to the customer’s requirement.
Vistaprint’s Vista Studio software is a downloadable software that a customer can
download and use to design the product according to their requirement. Vistaprint has an
internet-based, remote application that customers can use to contact Vistaprint’s customer
support through, over the web voice assistance.
Once the order is received over the net, DrawDocs software of Vistparint automatically
converts the image into high-resolution image, converting pre-press files from the customer
document into high definition print-ready images that can be printed.
Cost effectiveness, which is the advantage mass customizing W2P companies have over
traditional print shops is achieved by a variety of strategies. One of the factors which
contribute to cost effectiveness, and arguably the most important contributing factor, is the
ability of W2P companies to aggregate orders. Vistaprint’s VistaBridge technology helps
Vistaprint aggregate orders based on a set of constraints – combination to achieve the
lowest production cost, similarity of print parameters, multiple order aggregation (when the
same customer order more than one product), delivery times etc. VistBridge’s main
parameter is to achieve the lowest overall cost for the whole process by using a set of
complex algorithms, developed by Vistaprint’s R&D department based in Switzerland.
VistaBridge automates aggregated workflow to Vistaprint’s high volume production
printers – offset or digital, achieving the lowest possible overall cost. Other parameters
under consideration include material quality, type, shipping location, colour vs black &

27
white and Single or double sided printing. VistaBridge aggregates orders from different
customers, continuously calculating and adjusting print jobs during the shift, i.e. the
operators nor the personal know what the next print job would be. [11]
Example for aggregation by VistBridge for Business Cards: VistaBridge aggregates a
maximum of 143 business cards onto a single sheet of paper substrate. The substrate stack
size is typically 250, 500 or 1000 units (plus the ones for quality checks). If there are a
considerable amount of customers who ordered 250 business cards, VistaBridge aggregates
the orders and prints say 143*250 business cards in a single job. If there are several
customers that order 1000 units, then a stack of 100 units plus the ones for quality checks
are printed in a single job. However, if there are more orders of 250 business card units and
just a few 1000 unit orders, VistaBridge aggregates the order in such a way that 4 of the
images on the sheet are the same, thereby achieving an overall print of 1000 units even
when only 250 sheets are printed.
The orders, after being acquired, run through Vistaprint’s Viper software, which distributes
orders to the production facilities based on shipping locations, production
capabilities/capacity and inventory levels. Viper’s output is the input for VistaBridge.
Both Viper and VistaBridge update their output continuously, recalculating order schedules
and order aggregation even during the shift. Herein lies the basic problem. Because of
VistaBridge and Viper’s continuous updating and demand fluctuations, inventory levels are
hard to calculate.

28
Fig 6: Time Series – Hourly output
The production facility runs 7 day, three 8 hour shifts. It is a continuous and HVP setting.
The on floor inventory is placed on racks right next to the printing machines and at the
boundaries of the textile section.
At the beginning of each shift, the supervisor receives a count of the total number of dark
shirts, light shirt, tote bags and hats to be printed in the shift to calculate the workforce
requirement for the shift. The personal (supervisor, workers and material handlers) do not
get the count of individual product outputs required (i.e. type, colour and size are unknown)
and the orders might be updated during the course of the shift as well. Because of these
constraints, it is almost impossible to maintain a controlled amount of on floor inventory.
In addition, the fluctuations in demand add even more strain to the inventory level
calculations. The result of such a situation is the stacking of excessive inventory, whose
levels have not been properly documented and without any proper replenishment cycles.
0
10
20
30
40
50
60
70
0 2 4 6 8 10 12 14 16 18 20 22 21 23 0 2 4 6 8 10 12 14 16 18 20 22
Day 1 Shift 1 Day 1 Shift 2 Day 1 Shift 3 Day 2Shift 3
Day 3 Shift 1 Day 3 Shift 2 Day 3 Shift 3
Large Black TShirt Total Ouput

29
The textile layout alone holds 24,152 units of raw material inventory.
This data reflects the huge on-floor inventory levels in MC W2P settings. Because of the
fluctuating and unpredictable demand, companies prefer maintaining excessive inventory
as opposed to maintain less than required. However, because of the inexistence of effective
inventory calculation methods tailored to MC settings, it is almost impossible to compute
exactly how much excess on floor inventory is present.
2.7. PROBLEM STATEMENT
As explained in the previous section the demand fluctuations in MC W2P companies are
erratic. The cycle times are as low as 15 seconds and the production is High Volume. The
production planning continuously updates orders till the very last possible moment and the
personal on the floor do not know the shifts nor the hourly individual raw material unit
requirements. This uncertainty is counterbalanced by maintaining excessive inventory in
the warehouse with high safety stock and reorder points. A similar mentality and approach
is employed in setting on floor inventory levels as well. Most MC W2P companies stock
their production floor with excessive inventory for fear of running out of raw material
before the replenishment cycle occurs. Most Inventory control models deal with calculating
and optimizing warehouse inventory, considering the costs associated with them (ordering
cost, transport cost, space cost etc.). However, it is important to note that the same costs
apply for maintaining on floor inventory as well. The associated costs with holding on floor
inventory is actually higher than that of maintaining warehouse inventory. Inventory
associated costs like space costs are actually higher on floor. Warehouses are typically
constructed to house maximum inventory and their design facilitates optimized inventory

30
storage. However, when it comes to on floor inventory, the inventory cannot be stored as
they are in warehouses, i.e., they have to be accessible, placed strategically etc., thereby
occupying more space on floor than they did in the warehouses. Similarly, the other
inventory associated costs like the potential for alternative investments (higher potential to
invest in production machines rather than on the warehouse) is higher in the case of On
Floor Inventory.
The problem of On Floor inventory calculation and subsequent optimization is an area that
has been rarely researched in depth, especially for highly varying demand setting such as
in MC W2P companies. This thesis works on bridging that gap by analyzing the
effectiveness of current on-floor inventory calculation/optimization methods for MP
settings on MC settings using data obtained from the case study conducted at Vistaprint
and if required, modify the existing inventory control methods in accordance with the
constraints of MC W2P’s production settings.
The calculated inventory levels are validated using the simulation software – Flexsim.
III. APPROACH
The problem at hand is approached in the following way:
Data is collected from Vistaprint’s Textile layout
A literature review and background research has been done to analyze and
document the present available methods of Inventory Control for MC environments
and other production settings with fluctuating demands

31
The available data is analyzed using available operational research methods for
inventory control and inventory levels are calculated
The calculated inventory levels is compared to previous year’s output data from
Vistaprint and Vistaprint’s textile forecast for 2015
The model used is adjusted or modified based on outliers
The calculated inventory levels are verified using the simulation software – Flexsim
Space is expensive especially in developed countries.
A total of 1031 square feet is covered by the local inventory at the textile printing section
alone. This is in addition to the huge warehouse space that is stocked at high safety levels.
There are several traditional inventory control methods that are used in the industry to
calculate optimum inventory levels. The problem is however, the fact that the assumptions
made for these calculations do not enclose the constraints surrounding those in mass
customizing W2P companies. A list of the traditional inventory calculation methods and
their incompetence to meet the needs to solve this particular problem is mentioned below:
SIMPLE EOQ (Economic Order Quantity) MODEL
Assumptions made:
Demand is fixed units per unit time – This is not the case for MC W2P companies. The
demand fluctuations are extremely hard to forecast, especially to the hourly rates to
calculate on floor inventory requirements based on forecasts.
Because of the basic difference in the assumption for EOQ, other variants of EOQ including

32
Finite Production rate
EOQ with backorders (apart from demand uncertainty, EOQ with backorders
assumes that shortage can be met after replenishments, which is not the case at MC W2P
companies as even small stoppages result in huge revenue losses)
Quantity Discount Models
Cannot be used to solve this problem.
NEWSVENDOR MODEL
Assumptions made:
Demand is not known. However, the demand characteristics like mean, standard deviation
and the demand distribution is known. The demand distribution is attempted to be traced.
The hourly output of small black T Shirt (sorted demand frequency) for the month of
January of 2014:
Fig 7: Frequency Distribution of hourly output of Small Black T-Shirt– January 2014
75.00%
80.00%
85.00%
90.00%
95.00%
100.00%
105.00%
0
100
200
300
400
500
600
Fre
qu
en
cy
Demand
Histogram
Frequency
Cumulative %

33
For the February of 2014 the hourly output traces the following pattern:
Fig 8: Frequency Distribution of hourly output of Small Black T-Shirt– February 2014
The demand pattern varies considerably from one month to the next and the frequency
pattern does not fall under neither normal nor uniform distribution, which are the basic
requirements to use the news vendor model. Calculations can be done considering the
pattern to be normally distributed with highly positive skewness. However, the resulting
calculations will be inaccurate.
In addition to these inaccuracy problems, Newsboy models are basically used for
calculating required inventory for products with short lifetime.
LOT SIZE REORDER POINTS is an extension of EOQ and therefore cannot be
considered to solve the problem at hand.
Similarly, other traditional inventory calculation models are not effective because of the
conflicting assumptions made by each model.
0.00%
20.00%
40.00%
60.00%
80.00%
100.00%
120.00%
0
50
100
150
200
250
300
350
400
450
500
10 20 30 40 50 60 70 More
Fre
qu
en
cy
Demand
Histogram
Frequency
Cumulative %

34
(Song & Zipkin, 1991) proposed an inventory model which takes into account the
variations in demand due to external factors including product life cycle, economic
conditions etc.
JUST-IN-TIME
Traditional Lean approaches try to get rid of inventory completely. An ideal Lean setting
has zero inventory, both raw material and WIP inventory. It is challenging to employ JIT
in traditional manufacturing settings itself. It is even more difficult to employ JIT in MC
W2P production environment. MC W2P production settings are high volume production
settings with individual product manufacturing/cycles as low as 20 seconds and product
variety is high. It is extremely difficult to employ just JIT in such settings. However a
mixture of minimal local inventory and JIT might be a possible solution.
Demand forecast is inaccurate, but can be used as a base for managing expected inventory.
The forecast data is based on seasonal demand histories.
It is clear that none of the inventory control models can be used to calculate On Floor
inventory levels for MC W2P companies accurately. However, this is expected because of
the unforeseeable demand fluctuations. One of these inventory control methods have to be
considered and explored to set base inventory, which although might not be the optimal
solution, can form the base to find strategic combinations (like traditional inventory models
+ JIT).

35
IV. LITERATURE REVIEW
The literature review is divided into three segments based on the topics covered in this
thesis.
Mass Customization
Operational Research and
Simulation based verification
36
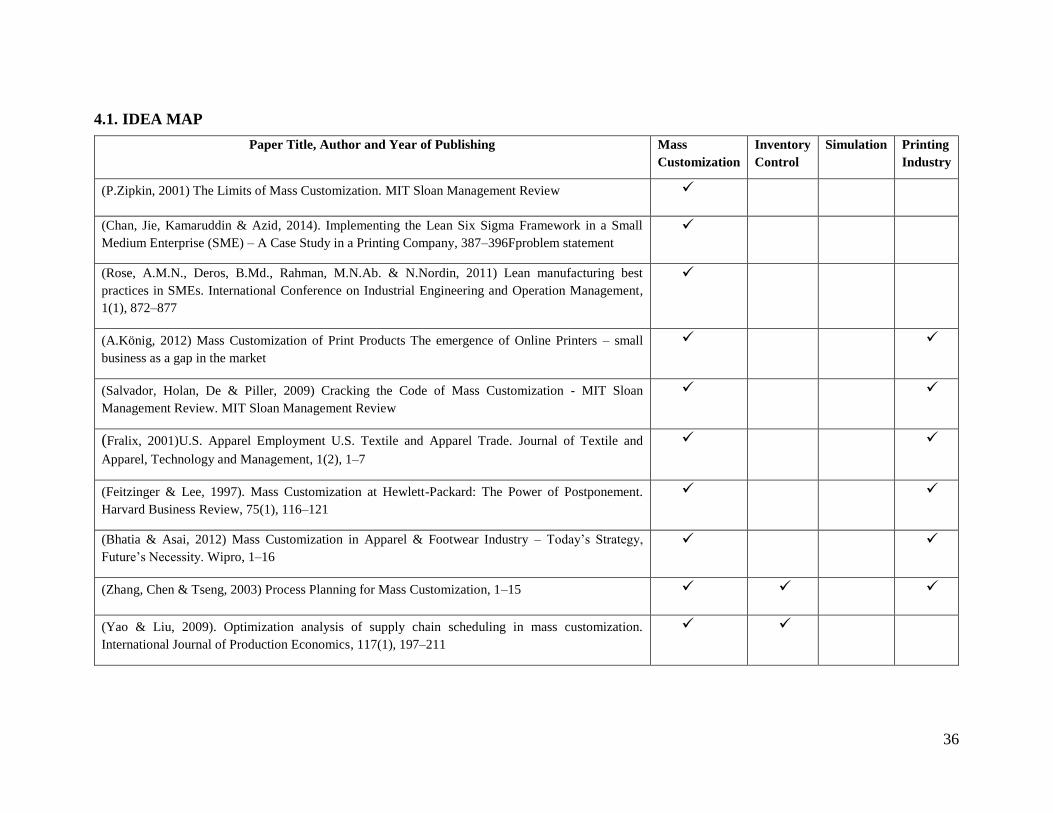
4.1. IDEA MAP
Paper Title, Author and Year of Publishing Mass
Customization
Inventory
Control
Simulation Printing
Industry
(P.Zipkin, 2001) The Limits of Mass Customization. MIT Sloan Management Review
(Chan, Jie, Kamaruddin & Azid, 2014). Implementing the Lean Six Sigma Framework in a Small
Medium Enterprise (SME) – A Case Study in a Printing Company, 387–396Fproblem statement
(Rose, A.M.N., Deros, B.Md., Rahman, M.N.Ab. & N.Nordin, 2011) Lean manufacturing best
practices in SMEs. International Conference on Industrial Engineering and Operation Management,
1(1), 872–877
(A.König, 2012) Mass Customization of Print Products The emergence of Online Printers – small
business as a gap in the market
(Salvador, Holan, De & Piller, 2009) Cracking the Code of Mass Customization - MIT Sloan
Management Review. MIT Sloan Management Review
(Fralix, 2001)U.S. Apparel Employment U.S. Textile and Apparel Trade. Journal of Textile and
Apparel, Technology and Management, 1(2), 1–7
(Feitzinger & Lee, 1997). Mass Customization at Hewlett-Packard: The Power of Postponement.
Harvard Business Review, 75(1), 116–121
(Bhatia & Asai, 2012) Mass Customization in Apparel & Footwear Industry – Today’s Strategy,
Future’s Necessity. Wipro, 1–16
(Zhang, Chen & Tseng, 2003) Process Planning for Mass Customization, 1–15
(Yao & Liu, 2009). Optimization analysis of supply chain scheduling in mass customization.
International Journal of Production Economics, 117(1), 197–211

37
Aigbedo, H. (2007). An assessment of the effect of mass customization on suppliers’ inventory levels
in a JIT supply chain. European Journal of Operational Research, 181(2), 704–715
(Yang, Teng & Chern, 2001). Deterministic inventory lot-size models under inflation with shortages
and deterioration for fluctuating demand. Naval Research Logistics, 48(2), 144–158
(Song & Zipkin, 1993). Inventory Control in a Fluctuating Demand Environment. Operations Research
(Khurma, Bacioiu & Pasek, 2008). Simulation-based verification of lean improvement for emergency
room process. In Proceedings - Winter Simulation Conference, 1490–1499
(Yao & Zhu, 2010). Visual simulation framework of iron and steel production scheduling based on
Flexsim. Bio-Inspired Computing: Theories and Applications
(Kleijnen, 1995) Verification and validation of simulation models. European Journal of Operational
Research, 82(1), 145–162
(Fujimoto, 1989). Parallel discrete event simulation. Proceedings of the 21st Conference on Winter
Simulation, 19–28
(Carson, 2002). Model Verification and Validation. Proceedings of the 2002 Winter Simulation
Conference, 52–58

38
Part 1: Mass customization – gives a brief outline of the literature on mass customization
as a business strategy in the printing industry
Part 2: Operational Research – Gives a brief review of the research done on inventory
control in Mass customizing industries
Part 3: Cites publications that use simulation software as validations for improvements in
both manufacturing and service industries.
4.2. MASS CUSTOMIZATION:
(Fralix, 2001) talks about how there has been a tangible change in the way manufacturing
is done all over the world and how the United States has been lagging behind. Fralix’s
paper title “From Mass Production to Mass Customization” talks about the apparel industry
being the first to adopt Mass Customization as a competitive strategy well before any other
industry. The paper sites examples of the employment numbers of the apparel industry over
the last 20 years. The apparel industry employed around 1.4 Million workers during its
peak to 800,000 after its decline. Fralix talks about the competitive nature of the industry,
the developing countries having an upper hand in terms of their ability to manufacture high
volumes and low costs and that the developing countries should look to other ways to
compete. Fralix says that Mass Customization is the solution for balancing this competition
out. Michael’s paper goes on to talk about how body scanning and digital printing can
support mass customization in the apparel industry.
(Salvador, Holan & Piller, 2009) publication on MIT’s Sloan Management review, looks
at Mass Customization from the view of a business strategy than a manufacturing strategy.

39
The paper “Cracking the code of Mass Customization” explains the current mind set of the
industry management, which could mass customize. Because of the failures companies of
Levi Strauss Co’s (Custom Jeans), the executives of think of Mass Customization as the
ideal solution that is impossible to practice nor achieve. Mass Customization is not an ideal
strategy that the industry must strive to reach but a strategic mechanism that companies
can use to align their organization with needs of the customers. This paper goes on to
describe three fundamental capabilities that an organization has to develop in order to align
itself with the needs of the customers and evolve – Solution Space Development, Robust
Design Process and Choice Navigation. Developing these capabilities will help an existing
organization move from a Mass Manufacturing Paradigm to a Mass Customizing
Paradigm.
Fig 9: Mass Production to Mass Customization (Zipkin, 2001)
(Konig, 2013) paper titled “Mass Customization of Print Products” gives a detailed insight
into the evolution of the printing industry, from small print shops that catered to a certain
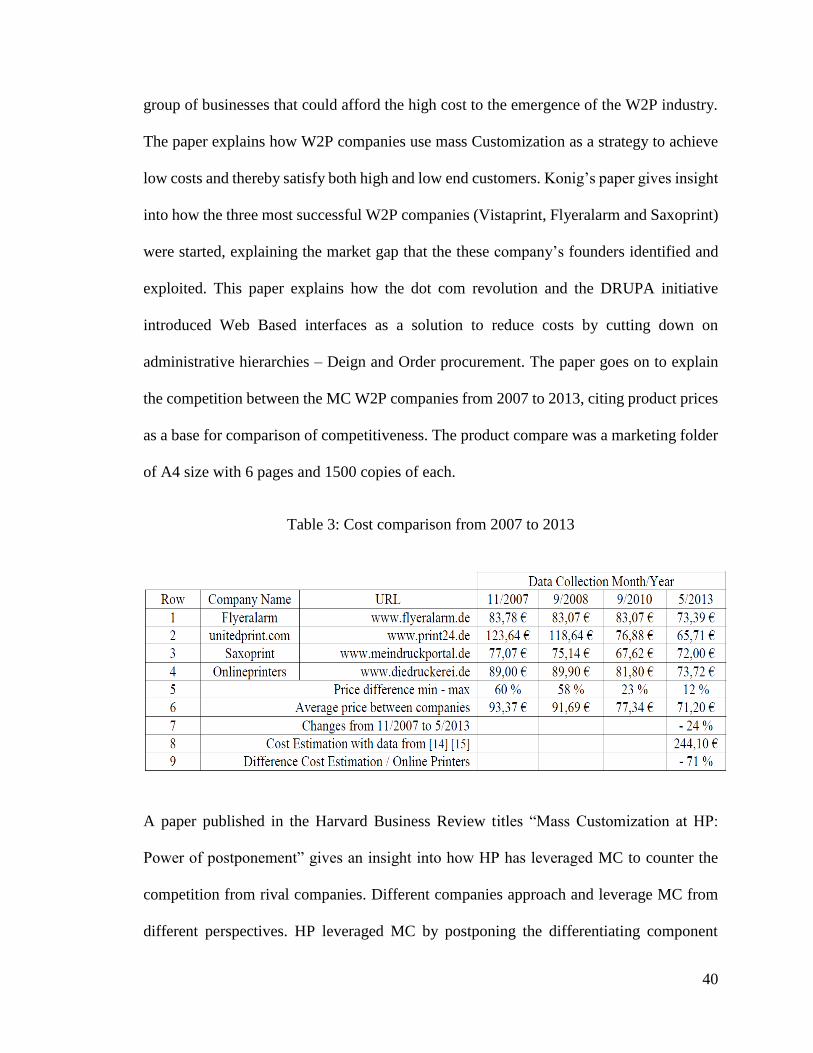
40
group of businesses that could afford the high cost to the emergence of the W2P industry.
The paper explains how W2P companies use mass Customization as a strategy to achieve
low costs and thereby satisfy both high and low end customers. Konig’s paper gives insight
into how the three most successful W2P companies (Vistaprint, Flyeralarm and Saxoprint)
were started, explaining the market gap that the these company’s founders identified and
exploited. This paper explains how the dot com revolution and the DRUPA initiative
introduced Web Based interfaces as a solution to reduce costs by cutting down on
administrative hierarchies – Deign and Order procurement. The paper goes on to explain
the competition between the MC W2P companies from 2007 to 2013, citing product prices
as a base for comparison of competitiveness. The product compare was a marketing folder
of A4 size with 6 pages and 1500 copies of each.
Table 3: Cost comparison from 2007 to 2013
A paper published in the Harvard Business Review titles “Mass Customization at HP:
Power of postponement” gives an insight into how HP has leveraged MC to counter the
competition from rival companies. Different companies approach and leverage MC from
different perspectives. HP leveraged MC by postponing the differentiating component

41
assembly till the very last possible moment. Postponement is achieved by using Modular
Product Design, Modular Process Design and Agile Supply networks. Other strategies to
postpone the customizing components till the very last moment include the use of local
warehouses to assemble the customizing components decreasing the overall cost.
(Feitzinger & Lee, 1997).
The transition to MC is complicated. The paper title “The Limits of Mass Customization”
elaborates on this topic and compares Mass Customization with traditional mass
manufacturing setting (Zipkin, 2001). This paper talks about the three main elements of
Mass Customization as being Elicitation (mechanism for interacting with the customer to
obtain product specifications), Process Flexibility and flexible and responsive logistics
setup. The limitations for MC include
People are not ready to get every single configuration customized – decisions on which
characteristics of a product is to be customized is a difficult and the trends change
frequently
Requires highly flexible production technology
Requires to develop an effective way to elicit customer requirements – high development
costs
Requires highly responsive and strong direct to customer logistics system and

42
4.3. OPERATIONS RESEARCH
Most of the research done on OR related to MC has been on process planning and variety
management. There exists a serious gap with respect to inventory control in MC settings.
(Zhang, Chen & Tseng, 2003) explains in depth the complications of process planning in
MC industries. Process planning connects product designs to the production floor. Process
planning is usually done for individual products. When it comes to MC settings, the
combinations of customizable products is high, thereby making process planning for
individual products extremely difficult. Most MC industries face process planning
complications. The paper titled “Process Planning for Mass Customization” outlines the
cause for process planning complication in MC settings and provides solutions for keeping
the process planning and the process as a whole under control. Product variety management
is the proposed solution for controlling the diversity the available products thereby making
process planning less complicated.
The paper explains in detail a case study conducted for the product variety management
and subsequent process planning for a customizable high power washer. There are five
ways to approach process planning:
The traditional Approach – Done from memory and codebooks
Workbook Approach – Done by deriving from a workbook of previously stored process
plans
Variant Approach – Based on Group Technology (GT)
Generic Approach – Similar to Workbook approach, but is done in a systematic manner
Generic and

43
Semi Generic Approach
The paper goes on to talk about creating BOM’s for the high – pressure washer, grouping
similar parts and creating diverging modules for customizable parts based on product
family and comes up with a master process plan for making customizable high pressure
washer manufactural without having huge economic impacts that MC industries face.
(Yao & Liu, 2009) explains how to deal with scale production effect and customized
demand in MC setting. Responsive supply chain and operation characteristics are required
to provide ideal conditions to solve the supply chain complications in MC setting. This
paper talks about the complications in operations scheduling in MC settings. The paper
derives from previous work, proposing a dynamic and multi – objective model and the
appropriate solving algorithm to compensate these contradicting problems.
(Wang, Fan, Li & Xiaoxia, 2007) talks about Mass Customization being the front-runner
for competitive edge in this century. The paper analyses the characteristics of the supply
chain of mass customized settings and gives insight into ways to harmonize and optimize
he supply chain of mass customizing industry.
(Yang, Teng, Chern & Sheng, 2001) explains the shortfalls of EOQ for certain products
whose value decreases with time. EOQ traditionally assumes a constant demand and a fixed
unit cost. The literature modifies the classical EOQ model that includes fluctuating demand
function and reducing purchase costs as constraints. The paper also proposes an algorithm
to calculate optimal replenishment cycles and schedules. The literature claims that the
proposed model decreases inventory costs by 32.4%.

44
(Aigbebo, 2003) assess the effect of MC on supplier’s inventory when the automotive OEM
the suppliers supply to uses MC as a competitive advantage whilst adopting JIT. The
literature discusses the effect of MC on JIT adopted supply chain. When an automotive
OEM adopts MC after adopting JIT, stress is applied on the supply chain, which is directly
transferred to the supplier’s inventory levels to prevent stockouts at the OEM the supplier
supplies to. The literature proposes the use of min – sum and min – max formulations
proposed by Kubiak et al. (1997).
(Song & Zipkin, 1993) proposes an inventory model that considers demand rate
fluctuations. The variables that affect demand include economic fluctuations, stages in a
products life cycle etc. Optimal policies are derived and algorithms have been developed
to compute them.
4.4. SIMULATION BASED VERIFICATION
(Khurma, Bacioiu & Pasek, 2008) outlines the key challenges faced by Emergency
Departments in Canadian Hospitals, their adverse effects on patients. The wastes that
causes these challenges are identified using lean tools and improved. The emergency
departments are high stress, highly sensitive environment and as a result the proposed
improvement cannot be validated by performing experiments in the hospital and simulation
is used to verify the proposed improvements. This paper validates simulation as a viable
tool for verification in service settings. Because the production settings in MC W2P
companies are high volume and highly sensitive, verification of inventory levels can be
done using simulation tools.
45
(Yao & Zhu, 2010) explains the process scheduling done for steel making. Flexsim is used
to validate the scheduling. Actual data obtained from analyzing already available data is
entered in the simulation software and the output is compared to the proposed output, thus
proving the effectiveness of FlexSim as a simulation validation tool.
(Kleijnen, 1995) analyzes the effectiveness of simulation models for the verification of
operational research discussing
Effective programming techniques
Statistical Analysis of simulation outputs
Validation is done through
Comparing outputs with real world data
Comparing outputs against real data using graphical, Schruben and t tests
Correlation between simulation outputs and real response means
Sensitivity analysis using DOE and regression analysis
White vs black box simulation models
(Fujimoto, 1989) published a paper under the topic “Parallel Discrete Event Simulation”.
The literature gives a brief look at the literature available in the discrete event simulation.
The paper discusses asynchronous simulation (a limited number of events occur at a single
point in the simulated time) in detail, highlighting the requirement to run multiple
simulations concurrently to observe and analyze events. The literature discusses the
challenges of concurrent simulation and discusses the strategies proposed to approach
complex concurrent simulation problems.

46
(Carson, 2002) outlines the guidelines and techniques that can be used to validate
simulation models. The paper explains why it is important to validate and verify the
simulated models closeness to the real world setting being simulated. The goal of a
simulation is to predict the behaviour of a system under different situations. It is necessary
for the simulation to be close/similar to real world system to help predict the behaviour of
the real world system based on the simulated model. This paper emphasized on the
validation of the accuracy of a simulated model, providing examples of situations where
inaccurate assumptions can be made and offers a detailed guideline for the verification and
validation of simulated models.
The problem at hand is one that is common to most of the mass customizing W2P
companies. To find a structured solution for the problem, the approach to finding the right
solution is enclosed in the DMAIC framework.
V. DMAIC FRAMEWORK, IDENTIFICATION AND ANALYSIS OF MODEL
DMAIC stands for Define, Measure, Analyse, Improve and Control. DMAIC forms the
core of Six Sigma. Six Sigma is usually performed to control process variation. However,
the DMAIC framework is a tool that can be used to solve any problem in a structured
approach.
In MC W2P companies, the strategies (both business and manufacturing) are ever changing
and evolve rapidly. New products are launched and taken out of production constantly.
This rapid change gives relatively short time windows to understand and optimize
production processes. Typically, MC W2P companies try just to achieve continuous
production runs and do not analyze individual process in detail. This leads to an

47
unstandardized work setting (except for the production process). In such settings, the noise
is high and it is easy to deviate from the core problem.
To avoid deviating from the problem, a structured approach like the DMAIC framework
comes in handy. In the following section, the thesis addresses the on-floor inventory control
problem and finds a solution by following the DMAIC framework. In the course of
following the DMAIC framework, we define the problem in detail, measure the
characteristics and constraints surrounding the on floor inventory control problem (Current
Inventory Levels, Space covered, Cycle Times etc.), Analyse the possible Inventory control
solution and check its compatibility and Apply the inventory control solution thereby
improving the excess inventory scenario and proposing control measures to sustain the
solution.
5.1. DEFINE PHASE:
MC W2P companies rely on one key strategy that gives them an edge over other traditional
printing companies i.e., MC W2P companies rely on postponement and consecutive
aggregation of orders to achieve printing at low unit costs. In terms of final product costs,
postponement and aggregation has been able to reduce the unit price of individual products
to very low prices compared to traditional printing. The order aggregation is completely
automated and performed by the W2P companies production planning software. The orders
are planned and aggregated at the printing facilities continuously, i.e. orders are updated as
the customers place orders through the MC W2P company’s web interfaces. This leads to
effective cost reduction.

48
For example: When an order for business cards are placed by a person to a mass
customizing W2P company (like Vistaprint) from a location in the U.S, the company’s
order procurement software updates the central server as soon as the payment is received.
The received order of business cards is then analyzed using a set of predefined algorithms
and transferred to one of the print facilities, say to the one in Windsor, Ontario, Canada.
The local production planning software receives the order and processes the request. If the
order is for, say 1000 units of business cards on substrate type smooth matte, the local
production planning software continuously weighs the trade-off between shipping costs
and manufacturing costs of individual orders. If the customer had asked for regular
shipping (three-day shipping), the production planning software waits till the production
can be initiated after aggregation of orders. If at the end of the first day (3 shifts), there are
not enough orders that can be printed on smooth matte, the production planning software
holds the printing off the production floor till the next day, while weighing the cost of
shipping to the cost of production. The next day, say if there are enough orders to run a
gang of 250 sheet stacks of smooth matte, then the production planning software prints the
same business card in four different locations on the sheet. Thus, the end product is 1000
business cards that the customer ordered which is then expedited to the customer. The
production of products is achieved at the lowest possible unit cost.
The postponement and aggregation of orders leads to shocks in the supply chain. The
personnel on the floor and the logistics division do not know the orders they are to print
during the shift. The short cycle times, frequent inventory turns and demand fluctuations
add further stress to the already stressed supply chain.

49
This unpredictable demand and material requirement cannot be forecasted beyond a certain
range of accuracy. The logistics division of MC W2P companies, which is responsible for
raw material procurement and in house distribution, copes with this unpredictability by
maintaining excessive inventory in their warehouses with high reorder points and safety
stock. The warehouse sizes and scale is increased frequently to cope with demand
fluctuations. The cost of floor space is an extremely high investment, which is the reason
that most automotive companies tend to keep their suppliers nearby and get the raw
materials delivered Just – In – Time. However, JIT alone is not an option for MC W2P
companies.
The mentality of MC W2P companies to maintain high inventory in their warehouses is
transferred to the floor as well. As demand is unpredictable and printing cycle times are as
low as 15 seconds, MC W2P companies stock their floors with excessive inventory. Most
MC W2P companies do not understand the direct and in direct cost of such a practice. The
fear of running out of inventory on – floor, prevents the MC W2P companies from
attempting to scale down the on – floor inventory. This thesis tries to find a solution to the
on – floor excessive inventory stocking problem and validates it using simulation.
The on – floor inventory control has been studied on the textile layout of Vistaprint.
5.2. MEASURE PHASE:
In a mass customized environment, the product variety is extremely high. This is because,
based on the degree of customization the number of possible combinations leads to
exponential increase in product variety. However, the number of base variations can be
controlled. In textile printing, the product variety available may be numerous, but the

50
number of sizes available typically forms the base of products and of course, the quality
and type of Shirt used.
In this study, the company prints on exactly 8 types of T-Shirts and each type of T – Shirt
has 5 sizes. That is a total combination of 40 types. Hats, Tote Bags and Mouse Pads are
printed on the textile section as well and will be a part of the textile section studied. This
adds another 5 types of products to the line, making the number of products that the textile
layout is responsible for a total of 45 types.
The digital layout was used to identify the areas where the inventory was placed on the
floor.

51
- Dryer - Packer - Racks
- Printers - Embroidery Line
Fig 10: Textile Floor Layout

52
There was inventory present in unspecified, unmarked locations as well. The inventory is
in boxes, and each box contains 72 units, except for Tote Bags which contain 120 units in
the small size’s box and 50 units in both Large Half Bleached and Two Tone Half Bleached
boxes.
So, in future, the reference to boxes of inventory means the corresponding number of
individual items inside the box.
Next, the total inventory on floor is carefully documented. The total amount of inventory
could not just be mentioned in number of boxes as there were units in loose present around
the work floor.
The results were tabulated.

53
Table 4: Total On-Floor Inventory on Textile Floor Layout

54
The number of T- Shirts, Tote Bags and Hats alone total to 24,152 units.
Next, the space covered by this Inventory is measured and tabulated as well.
The inventory is placed on multi – level racks, most being 4 levels high. It is possible to
add more inventory in the same space by adding more levels of racks, however, as most of
the workers in the Textile Printing section are woman, it might not be ergonomically
advisable because of height issues.
Some other interesting and noteworthy observations were made during this study, which
will be discussed later on.
Table 5: On – Floor Inventory Space Coverage – Textile Layout

55
The total space covered by on floor inventory is 1030.255 square feet. The inventory is
mounted on racks as mentioned and are mostly placed right next to the printing machines
to help with easy access and the skids with replenishment inventory are dropped off at the
marked location on the layout. There are no specific replenishment times and the supervisor
fills out the required inventory and the material handler picks up the list and replenishes
the required quantity of the required product.
The inventory on the skids dropped off for replenishment was not added to the inventory
documented. It adds another 108.604 square feet to the space covered, increasing the total
to 1138.86 square feet.
The machines/equipment involved in the process are printers, dryers and packers. The
textile to be printed on is removed from its package from the box, printed on the printing
machine, then dried using dryers and packed using packer machine. The machine cycle
times were documented as well.
Table 6: Machine Cycle Times – Printing Layout

56
The mouse pads had a local inventory of 16 boxes in total with the 3mm box having 1440
units in each of them and the 6mm mouse pad’s inventory had 90 units in each box.
The total was 2160 units in the boxes and the total number of units (Boxes plus individual
units) in the textile segment was 26,312 units.
5.3. ANALYSE & IMPROVE PHASES:
The MC W2P industry is ever changing. Unpredictability is the main reason for the
inventory problems in MC W2P companies. Traditional inventory models for calculating
inventory levels require predictable demand levels, at least with respect to the distribution
of demand data. However, in the case of MC W2P companies’ demand patterns do not
follow the traditional distribution patterns.
An example is the demand pattern of the small black t – shirt demand on the first week of
January 2014.
Fig 11: Hourly demand of Small Black T – Shirt – Jan 2014
0
5
10
15
20
25
0 50 100 150 200

57
Fig 12: Hourly demand distribution
The on – floor inventory control problem in MC W2P company is a complicated problem.
There is absolutely no way that the demand can be smoothed out. Traditional automotive
plants have changed from push to pull based system entirely because of their ability to
smooth out production. Lead times for cars to be delivered is long enough to help
automotive assembly plants to plan and assemble cars at a smooth pace. Takt time can be
calculated and achieved in traditional automotive assembly plants. However, in MC W2P
industry settings none of this is possible. Takt time varies tremendously and the products
variety is high adding further stress to the system.
MC W2P market is extremely competitive and cost cutting is a technique most MC W2P
companies use to push out competition. Along with this, new product lines, new packages
deals at low costs and increasing freedom for customers to customize their products are
strategies MC W2P companies use to gain their competitive edge. These changes are
frequent and hence the production/printing lines have to be flexible enough to adapt to
0.00%
20.00%
40.00%
60.00%
80.00%
100.00%
120.00%
0
5
10
15
20
25
30
35
40
10
20
30
40
50
60
70
80
90
10
0
11
0
12
0
13
0
14
0
15
0
Mo
re
De
man
d F
req
ue
ncy
Bin (Demand)
Histogram
Frequency
Cumulative %

58
these changes to compliment the business strategies. New equipment procurement is done
frequently, workers are trained to enable new product printing etc. and changes are
extremely frequent. MC W2P companies have to adjust to even slight changes in the market
and continuously change to fulfill the customer’s expectation to keep their business
competitive. In comparison, traditional automotive companies change existing car designs
and introduce new modes typically once every year. This low frequency of the requirement
to change in the automotive industry makes it relatively easy for automobile companies to
have standardized process flows and thereby optimize their inventory levels. But, MC W2P
companies have to change and adapt frequently and hence their inventory problem is
complicated.
Unlike traditional manufacturing industries, MC W2P companies cannot adopt JIT
completely to satisfy their production floor’s needs. An ideal setup would be a combination
of maintaining on-floor inventory and use JIT to reduce on floor inventory levels without
stopping the line due to inventory exhaustion.
Traditional Inventory control models are mainly dedicated to calculate warehouse
inventory and the costs considered relate to the same. Most inventory control models
consider costs like ordering costs, volume based discount rates, transportation costs, carry
over costs etc. However, these costs are not entirely applicable to on floor inventory
calculation. The costs related to holding on floor inventory, although being the same as that
of housing warehouse inventory, is higher that holding inventory warehouse. For eg:
Warehouses are specifically designed to hold inventory, with high ceilings, and inventory
being stacked up on top of each other and the layout planned to maximize storage
efficiency. However, when the same inventory is transferred on floor, the setup is not

59
designed to maximize inventory storage, therefore the space related costs is actually higher
while storing inventory on floor rather than in the warehouse. The main costs associated
with on floor inventory are space related costs, labor costs and potential for alternative
investment. Labor costs are the cost of hiring and paying material handlers. This can be
curbed in the long run, however it is important to maintain enough material handlers as
decreasing on floor inventory levels may increase the requirement to distribute inventory
frequently. Thus, labor costs cannot be considered and similarly, the potential cost for
alternative investment cannot be considered either. The inventory is still held in the
warehouse and so, the investment on inventory is still the same. Space cost is the cost that
has to be considered while calculating on floor inventory.
The ideal inventory control model should consider this cost and the system has to be a
periodic review model that has to be simple enough to use but already a proven practice. It
is already known that the any model that is considered will not be accurate because of the
unpredictable demand pattern, which does not have a predictable distribution pattern.
However, there needs to be a base set for calculating on floor inventory levels in MC W2P
companies.
After much consideration and because of the fact that MC W2P company’s industry setting
is highly competitive, News Vendor model was considered to calculate inventory levels.
Traditionally News Vendor model is used to calculate inventory levels for perishable
products. This has made the output from this model extremely stringent. The model can be
used to consider space coverage costs as well. The sensitivity of the model has been
analyzed for varying periods.

60
The NewsVendor Model can be used to find a tradeoff percentage between the revenue
from maintaining a certain amount of inventory to the associated costs with maintaining
that amount of inventory. The News Vendor model’s output gives that percentage of
inventory to be maintained so that, if the demand falls below the prefixed level of inventory
the profit from holding only the calculated amount of inventory would be the ideal amount
to overcome the cost lost due to unused inventory (in this case inventory level vs space
cost).
The industry average for space coverage costs is 3%.
The industry average is the cost for the space coverage in warehouses. Warehouses are
specialized to hold huge amounts of inventory, with high ceilings and specialized
multilevel racks that can be used to stack up inventory, one on top of the other. However,
when it comes to on floor inventory, the inventory has to be accessible and only a certain
amount of inventory can be held. Thus, the inventory holding costs for on floor inventory
is higher. However, for this problem we will consider the average warehouse inventory
cost as the average space coverage cost for on floor inventory as well.
A preliminary review of the demand characteristics shows that even though the demand
spikes are unpredictable, it is noticeable that there are signals that point to the increase in
demand consecutively.
For example: Just before Christmas, families start planning early for the holidays and start
ordering ‘thank you’ notes and custom Christmas cards before the holiday season starts.
The early spike is enabled by preseason advertisement campaigns as well. These increases
in demand early in the time line can be used to calculate the inventory levels required for

61
the consecutive term. Similar to the way Forecasting works, inventory models can be used
to setup inventory levels by analyzing demand trends from previous timeline to setup
inventory levels for the next time line. A logical scale of data that could yield dependable
results would be monthly demand, i.e., using one month’s demand to set the inventory level
for the next(on – floor) inventory. However, as MC W2P companies demand changes in
short notice, there is a necessity to consider smaller windows of demand, say bi monthly
and weekly. The effectiveness of the use of monthly, bi monthly and weekly demand to set
on floor inventory levels for the consecutive timeline has been analyzed in the first study.
For this study, a total of three variants of T Shirts namely Black half sleeve, Black long
sleeve and white half sleeve T Shirts were used were chosen and used. The choice was
based on their varying demand spectrum – Low, Medium and High. For both the black T
Shirt types mentioned, all five sizes were analyzed, i.e. small, medium, large, XL and XXL.
For the white T Shirt however, the small and medium sizes were analyzed. The types for
T Shirts considered for the study show varying levels of demand uncertainty. The News
Vendor model was used to analyze the demand pattern from the January of 2014 to the
January of 2015 and compared to a simple forecasting method (simple moving average),
to check their effectiveness in comparison to forecasting techniques.
5.3.1. NEWS VENDOR MODEL FORMULA AND NOTATIONS [14]:
D = Demand
Co = Overage Cost (Loss of Excess Supply)
Cu = Underage Cost (Loss of profits for under supply)

62
Q* = Order Quantity (Inventory Level)
Co = Purchase Price – Salvage Value
Cu = Selling Price – Purchase Price
Cf = Cu / (Co + Cu)
The average cost price of plain T Shirt is 3 Cad.
The average selling price of printed T Shirt is 15 Cad.
Thus, the space coverage cost of holding 1 piece of inventory on floor for 1 year is
approximately 10 cents. This can be added to the cost price of the T Shirt to include the
space coverage cost when finding the trade-off inventory level.
Calculation of Cf:
Cost = 3.10 Cad (3+.010 - space cost – modification)
Salvage Value = 0 Cad (can be carried over to next time period)
Selling Price = 15 Cad
Co = 3.1 Cad
Cu = 11.9 Cad
Cf = 79.3 %

63
What the value of Cf means is that while analyzing the demand characteristics, setting an
inventory level that satisfies 79.3 % of the demand would be the ideal level to minimize
space related costs while satisfying the un - forecastable demand.
The data analysis is done in two parts. As mentioned earlier, one part is to identify and
compare the effectiveness of month to month inventory setting with Bi monthly and week
to week inventory setting and comparing it with simple moving average to identify the
effectiveness of the chosen inventory control model to forecasting techniques.
After identifying which degree of inventory control based inventory setting is effective
(monthly, bi monthly or weekly) a recent demand data has been analyzed to set the
inventory for the consecutive time period.
The bin size considered is 5 units, because the average time taken for a material handler to
move from the local warehouse to the textile floor layout is approximately 1.5 minutes,
which is approximately equal to the cycle time to print on 5 units of textile.

64
Table 7: News Vendor Model – Month to Month, Bi Monthly and Weekly – Comparison with Simple Moving Average
S. No. T-Shirt Type
J F M A M J Ju Au S O N D J F M A M J Ju Au S O N D J F M A M J Ju Au S O N D
1 Small Black T Shirt Monthly 15 20 20 20 15 10 10 15 15 15 15 20 72 72 72 72 72 72 72 72 72 72 72 72 9 12 13 13 9 7 6 7 7 8 9 10
Bi Monthly 1st Half to 2nd Half 15 20 20 25 15 15 15 10 10 15 20 20 72 72 72 72 72 72 72 72 72 72 72 72 8 12 13 13 10 7 7 7 8 7 9 10
2nd Half to the 1st
Half on Next Month15 20 20 20 15 10 10 15 10 20 15 20 72 72 72 72 72 72 72 72 72 72 72 72 10 12 13 13 8 6 6 7 7 9 8 10
Weekly1st week to 2nd
week15 20 25 20 20 15 10 10 15 15 20 20 72 72 72 72 72 72 72 72 72 72 72 72 9 12 13 13 11 8 7 6 9 6 10 10
2nd week to 3rd
week15 20 20 25 15 10 10 15 15 15 15 20 72 72 72 72 72 72 72 72 72 72 72 72 8 13 13 13 8 6 7 7 7 8 8 11
3rd week to 4th
week15 20 20 20 15 10 10 15 10 15 15 20 72 72 72 72 72 72 72 72 72 72 72 72 10 12 13 13 8 6 6 7 7 9 8 10
4th week to 1st week
of next month20 20 20 25 20 10 10 15 15 20 15 20 72 72 72 72 72 72 72 72 72 72 72 72 12 13 12 14 7 6 6 7 7 11 7 11
2Medium Black T
ShirtMonthly 20 25 25 25 20 15 15 15 15 20 25 30 72 72 72 72 72 72 72 72 72 72 72 72 11 16 16 17 12 9 9 8 9 13 14 16
Bi Monthly 1st Half to 2nd Half 20 25 25 25 20 15 15 15 20 15 25 30 72 72 72 72 72 72 72 72 72 72 72 72 12 16 16 17 13 9 9 8 10 10 15 17
2nd Half to the 1st
Half on Next Month20 25 25 30 20 15 15 15 15 25 20 30 72 72 72 72 72 72 72 72 72 72 72 72 11 15 16 17 12 9 8 9 8 15 12 15
Weekly1st week to 2nd
week20 25 25 25 25 15 15 15 20 15 30 30 72 72 72 72 72 72 72 72 72 72 72 72 13 16 16 16 14 9 9 8 11 8 18 15
2nd week to 3rd
week20 25 25 30 20 15 15 15 15 20 20 30 72 72 72 72 72 72 72 72 72 72 72 72 11 16 17 17 12 9 9 9 10 13 13 18
3rd week to 4th
week15 25 25 25 25 15 15 15 15 20 20 25 72 72 72 72 72 72 72 72 72 72 72 72 11 15 16 17 12 9 8 9 8 15 12 15
4th week to 1st week
of next month25 25 25 30 15 15 15 15 15 30 30 30 72 72 72 72 72 72 72 72 72 72 72 72 13 16 16 17 9 9 8 9 9 18 12 17
3 Large Black T Shirt Monthly 25 35 35 40 30 20 20 20 25 30 25 30 72 72 72 72 72 72 72 72 72 72 72 72 15 23 23 25 17 12 12 11 13 15 15 17
Bi Monthly 1st Half to 2nd Half 25 35 35 40 35 20 20 20 25 25 30 35 72 72 72 72 72 72 72 72 72 72 72 72 15 23 23 25 19 13 12 11 15 12 17 17
2nd Half to the 1st
Half on Next Month25 35 35 40 25 20 20 20 20 30 25 30 72 72 72 72 72 72 72 72 72 72 72 72 15 23 23 25 15 12 11 11 12 18 12 17
Weekly1st week to 2nd
week25 35 40 35 35 20 20 20 25 20 30 30 72 72 72 72 72 72 72 72 72 72 72 72 17 23 24 24 22 14 12 11 15 10 19 15
2nd week to 3rd
week25 35 35 40 25 20 20 20 25 30 25 35 72 72 72 72 72 72 72 72 72 72 72 72 14 23 23 25 16 13 12 11 14 15 13 20
3rd week to 4th
week20 35 40 40 30 20 20 20 20 25 25 30 72 72 72 72 72 72 72 72 72 72 72 72 15 23 23 25 15 12 11 11 12 18 12 17
4th week to 1st week
of next month30 35 35 35 20 25 20 20 20 35 25 30 72 72 72 72 72 72 72 72 72 72 72 72 19 23 22 25 12 13 11 12 12 20 12 18
4 XL Black T Shirt Monthly 30 40 30 40 30 20 20 20 20 30 30 40 72 72 72 72 72 72 72 72 72 72 72 72 14 20 20 21 15 11 11 10 11 17 16 19
Bi Monthly 1st Half to 2nd Half 30 40 30 40 30 20 20 20 20 30 40 40 72 72 72 72 72 72 72 72 72 72 72 72 13 20 20 21 16 12 12 10 13 14 18 18
2nd Half to the 1st
Half on Next Month30 40 30 30 30 20 20 20 20 40 30 40 72 72 72 72 72 72 72 72 72 72 72 72 14 21 20 21 14 11 11 11 10 19 15 19
Weekly1st week to 2nd
week30 30 40 30 30 20 20 20 20 20 40 30 72 72 72 72 72 72 72 72 72 72 72 72 14 19 21 21 18 13 11 10 13 11 19 16
2nd week to 3rd
week30 40 30 40 30 20 20 20 20 40 30 40 72 72 72 72 72 72 72 72 72 72 72 72 13 21 20 21 15 11 12 10 12 17 16 20
3rd week to 4th
week20 40 30 40 30 20 20 20 20 30 30 40 72 72 72 72 72 72 72 72 72 72 72 72 14 21 20 21 14 11 10 11 10 19 15 19
4th week to 1st week
of next month30 30 30 30 20 20 20 20 20 40 30 40 72 72 72 72 72 72 72 72 72 72 72 72 16 21 21 21 11 11 10 11 11 22 14 19
Q* Min. Qty. Simple Moving Avg.

65
5 XXL Black T Shirt Monthly 20 25 25 25 20 15 15 15 15 20 20 25 72 72 72 72 72 72 72 72 72 72 72 72 10 14 14 15 11 9 8 8 8 11 11 13
Bi Monthly 1st Half to 2nd Half 20 20 25 25 20 15 15 15 15 15 20 25 72 72 72 72 72 72 72 72 72 72 72 72 10 14 14 14 12 9 9 8 9 10 11 12
2nd Half to the 1st
Half on Next Month20 25 25 25 15 15 15 15 15 20 15 20 72 72 72 72 72 72 72 72 72 72 72 72 10 14 15 16 10 8 8 7 8 12 10 13
Weekly1st week to 2nd
week20 25 25 20 25 15 15 15 15 15 25 20 72 72 72 72 72 72 72 72 72 72 72 72 11 13 14 14 13 9 9 9 9 8 12 11
2nd week to 3rd
week20 25 25 25 20 15 15 15 15 15 15 25 72 72 72 72 72 72 72 72 72 72 72 72 9 15 14 15 11 8 10 8 9 11 10 14
3rd week to 4th
week20 25 25 25 20 15 15 15 15 20 20 20 72 72 72 72 72 72 72 72 72 72 72 72 10 14 15 16 10 8 8 7 8 12 10 13
4th week to 1st week
of next month20 25 25 25 15 15 15 10 15 20 15 25 72 72 72 72 72 72 72 72 72 72 72 72 12 15 15 15 8 8 8 7 8 13 9 14
6Small Black Long
Sleeve T ShirtMonthly 10 10 10 5 5 5 5 5 10 10 10 5 72 72 72 72 72 72 72 72 72 72 72 72 4 5 4 3 2 2 2 3 4 4 4 3
Bi Monthly 1st Half to 2nd Half 10 10 10 5 5 5 5 5 10 10 10 5 72 72 72 72 72 72 72 72 72 72 72 72 4 5 4 3 2 2 2 3 4 3 4 3
2nd Half to the 1st
Half on Next Month10 10 10 5 5 5 5 5 5 10 5 5 72 72 72 72 72 72 72 72 72 72 72 72 4 5 3 2 3 2 2 3 3 4 3 3
Weekly1st week to 2nd
week10 10 15 5 5 5 5 5 10 5 10 5 72 72 72 72 72 72 72 72 72 72 72 72 5 5 5 3 2 2 2 2 4 3 5 3
2nd week to 3rd
week10 15 10 5 5 5 5 5 5 10 10 10 72 72 72 72 72 72 72 72 72 72 72 72 4 5 4 3 3 2 2 3 5 3 4 3
3rd week to 4th
week5 10 10 5 5 5 5 5 5 10 10 5 72 72 72 72 72 72 72 72 72 72 72 72 4 5 3 2 3 2 2 3 3 4 3 3
4th week to 1st week
of next month10 10 5 5 5 5 5 5 10 10 5 10 72 72 72 72 72 72 72 72 72 72 72 72 4 4 3 2 3 2 3 4 3 5 3 4
7Medium Black Long
Sleeve T ShirtMonthly 15 15 10 10 5 5 5 10 10 15 15 15 72 72 72 72 72 72 72 72 72 72 72 72 6 7 6 5 3 3 3 5 5 7 7 6
Bi Monthly 1st Half to 2nd Half 10 15 10 10 5 5 5 10 10 10 15 15 72 72 72 72 72 72 72 72 72 72 72 72 6 7 6 5 3 3 3 4 6 6 9 7
2nd Half to the 1st
Half on Next Month15 15 10 10 10 10 5 10 10 15 10 15 72 72 72 72 72 72 72 72 72 72 72 72 7 8 5 4 4 3 3 4 5 8 5 6
Weekly1st week to 2nd
week15 15 10 10 5 5 5 10 10 10 20 10 72 72 72 72 72 72 72 72 72 72 72 72 7 7 6 6 3 3 2 3 6 6 12 4
2nd week to 3rd
week10 15 10 10 5 5 10 10 10 10 15 15 72 72 72 72 72 72 72 72 72 72 72 72 5 6 6 5 3 4 3 5 6 6 7 9
3rd week to 4th
week10 15 10 10 5 5 5 10 10 15 15 15 72 72 72 72 72 72 72 72 72 72 72 72 7 8 5 4 4 3 3 5 5 8 5 6
4th week to 1st week
of next month15 15 10 5 10 10 5 10 10 15 10 10 72 72 72 72 72 72 72 72 72 72 72 72 7 8 5 4 4 4 3 4 5 9 4 6
8Large Black Long
Sleeve T ShirtMonthly 15 15 15 15 10 10 10 10 10 20 15 15 72 72 72 72 72 72 72 72 72 72 72 72 7 9 8 7 4 4 4 6 7 9 8 8
Bi Monthly 1st Half to 2nd Half 15 15 15 15 10 5 10 10 15 15 20 15 72 72 72 72 72 72 72 72 72 72 72 72 8 10 7 7 4 4 4 5 7 8 10 9
2nd Half to the 1st
Half on Next Month15 15 15 15 10 10 10 10 10 20 15 15 72 72 72 72 72 72 72 72 72 72 72 72 7 8 8 7 4 5 4 6 6 10 7 7
Weekly1st week to 2nd
week15 15 15 15 10 5 5 10 10 15 20 15 72 72 72 72 72 72 72 72 72 72 72 72 8 10 8 6 4 4 3 4 6 7 11 8
2nd week to 3rd
week15 15 15 15 10 5 10 15 15 20 20 20 72 72 72 72 72 72 72 72 72 72 72 72 7 10 7 7 4 3 4 6 8 9 8 9
3rd week to 4th
week15 15 15 15 10 5 5 10 15 15 15 15 72 72 72 72 72 72 72 72 72 72 72 72 7 8 8 7 4 5 4 6 6 10 6 7
4th week to 1st week
of next month15 15 15 10 10 10 10 15 10 20 10 15 72 72 72 72 72 72 72 72 72 72 72 72 9 8 8 6 4 6 4 6 6 11 5 6

66
9XL Black Long
Sleeve T ShirtMonthly 15 15 15 10 10 5 10 10 10 15 15 15 72 72 72 72 72 72 72 72 72 72 72 72 6 8 7 5 3 3 4 5 6 9 9 7
Bi Monthly 1st Half to 2nd Half 15 15 10 10 10 5 10 10 15 15 20 15 72 72 72 72 72 72 72 72 72 72 72 72 6 9 6 6 4 3 4 5 7 7 10 8
2nd Half to the 1st
Half on Next Month15 15 15 10 10 10 10 10 10 20 15 15 72 72 72 72 72 72 72 72 72 72 72 72 6 7 6 4 4 3 4 5 6 10 7 7
Weekly1st week to 2nd
week15 15 15 10 10 5 5 10 15 15 20 10 72 72 72 72 72 72 72 72 72 72 72 72 6 8 7 6 4 2 3 5 6 6 10 6
2nd week to 3rd
week20 15 10 10 10 5 10 10 15 20 15 15 72 72 72 72 72 72 72 72 72 72 72 72 7 9 6 6 3 3 4 5 7 9 9 19
3rd week to 4th
week10 10 15 10 10 5 10 10 10 15 15 15 72 72 72 72 72 72 72 72 72 72 72 72 6 7 6 4 4 3 4 5 6 10 7 7
4th week to 1st week
of next month15 15 15 10 5 10 10 10 10 20 10 10 72 72 72 72 72 72 72 72 72 72 72 72 7 8 6 5 3 4 4 5 6 12 5 6
10XXL Black Long
Sleeve T ShirtMonthly 10 10 10 10 5 5 5 10 10 15 10 10 72 72 72 72 72 72 72 72 72 72 72 72 5 6 5 4 2 2 2 4 5 7 5 5
Bi Monthly 1st Half to 2nd Half 10 15 10 10 5 5 5 10 10 10 15 15 72 72 72 72 72 72 72 72 72 72 72 72 4 7 5 4 2 3 2 4 5 6 6 6
2nd Half to the 1st
Half on Next Month10 10 10 5 5 5 5 10 10 15 5 10 72 72 72 72 72 72 72 72 72 72 72 72 6 5 5 4 3 2 3 4 5 8 4 5
Weekly1st week to 2nd
week10 15 10 10 5 5 5 55 55 10 15 10 72 72 72 72 72 72 72 72 72 72 72 72 4 7 5 5 3 2 2 3 4 5 7 6
2nd week to 3rd
week10 15 10 5 5 5 5 10 10 10 10 15 72 72 72 72 72 72 72 72 72 72 72 72 5 7 5 3 2 3 2 5 5 6 5 7
3rd week to 4th
week10 10 10 10 5 5 5 10 10 15 10 10 72 72 72 72 72 72 72 72 72 72 72 72 6 5 5 4 3 2 3 4 4 8 4 5
4th week to 1st week
of next month10 10 10 5 5 5 5 5 10 15 5 10 72 72 72 72 72 72 72 72 72 72 72 72 7 5 5 3 2 2 3 3 4 9 3 5
11 Small White T Shirt Monthly 45 75 75 90 75 90 75 75 60 45 45 45 72 144 144 144 144 144 144 144 72 72 72 72 27 41 43 46 41 44 38 37 34 25 23 24
Bi Monthly 1st Half to 2nd Half 45 75 75 75 75 90 90 75 75 45 45 60 72 144 144 144 144 144 144 144 144 72 72 72 27 40 44 46 42 46 44 41 39 26 25 28
2nd Half to the 1st
Half on Next Month45 75 75 90 75 90 60 60 60 45 45 45 72 144 144 144 144 144 72 72 72 72 72 72 27 40 42 46 41 43 33 33 29 25 22 22
Weekly1st week to 2nd
week60 75 75 75 75 75 90 75 75 60 60 45 72 144 144 144 144 144 144 144 144 72 72 72 28 37 43 43 45 42 47 42 38 24 28 25
2nd week to 3rd
week45 75 75 75 60 90 75 75 75 45 45 60 72 144 144 144 72 72 144 144 144 72 72 72 25 44 45 48 38 49 41 40 39 28 21 30
3rd week to 4th
week60 75 75 90 75 75 60 60 60 60 45 45 72 144 144 144 144 144 72 72 72 72 72 72 27 42 42 46 41 43 33 33 29 25 22 22
4th week to 1st week
of next month45 60 75 90 75 90 60 60 60 45 45 45 72 72 144 144 144 144 72 72 72 72 72 72 28 41 40 46 39 49 30 32 27 26 20 25
12Medium White T
shirtMonthly 75 100 100 125 100 100 100 100 75 75 75 75 144 144 144 144 100 144 144 144 144 144 144 144 35 55 58 66 61 62 57 52 46 40 37 37
Bi Monthly 1st Half to 2nd Half 75 100 100 125 100 100 125 100 ## 75 75 75 144 144 144 144 100 144 144 144 144 144 144 144 36 54 58 64 61 61 63 55 52 41 43 36
2nd Half to the 1st
Half on Next Month75 100 100 125 100 100 100 100 75 75 75 75 144 144 144 144 100 144 144 144 144 144 144 144 33 55 58 68 61 62 52 48 41 40 31 38
Weekly1st week to 2nd
week75 100 100 100 100 100 125 100 ## 75 75 75 144 144 144 144 100 144 144 144 144 144 144 144 36 51 61 55 60 57 66 54 58 40 45 33
2nd week to 3rd
week75 100 100 125 125 125 125 100 ## 75 75 75 144 144 144 144 125 144 144 144 144 144 144 144 36 58 56 74 63 65 59 56 47 41 42 39
3rd week to 4th
week75 100 100 125 100 100 100 100 75 75 75 75 144 144 144 144 100 144 144 144 144 144 144 144 33 55 58 68 61 62 52 48 41 40 31 38
4th week to 1st week
of next month75 100 100 125 100 125 100 75 75 75 75 75 144 144 144 144 100 144 144 144 144 144 144 144 35 53 53 69 61 69 49 44 42 48 28 42

67
Output Comparison: Key:
Small Black T Shirt
Jan to Feb
Figure Set 13
Figure Set 13 shows the comparison charts between Demand vs Set Inventory levels along with histograms of the demand distribution
(see Appendix B).

68
The comparison charts (Fig set 13, see Appendix B) show clearly the competence of the
selected model to be used to set on floor inventory levels. As expected the sensitivity of
the model increases as we move from month to month to bi-monthly to week to week i.e.,
the adaptiveness of the inventory control model’s output to the demand increases as the
period of review decreases. Weekly Demand analysis for setting inventory helps in tracking
shifts in demand more accurately and spikes in demand in immediate time periods can be
included in the analysis thereby making the inventory calculation more satisfying than
month to month and bi monthly demand analysis based inventory setting. Because of the
rapidly changing demand in MC W2P companies, the periodic review system with weekly
review period would be an ideal solution.
As expected when raw materials are considered in loose quantities there are outliers i.e.,
demand does lie outside the set levels of inventory. This is however impossible to avoid as
demand uncertainty is the major cause of the inventory problem in the first place. However,
an upwards of 80% of the demand is satisfied in most cases. On the other hand, MC W2P
companies prefer moving inventory in boxes (1 box = 72 units), from the warehouse to on
– floor, as it is easier to track and more economical to do so. When, inventory is considered
in boxes, the inventory quantities go in multiples of single box quantities, i.e., 72, 144, 216
etc. Unlike the automotive sector, individual item’s volume is small and the overall
tracking and transport of loose items are hard. Hence, MC W2P companies prefer moving
inventory in boxes rather than individual units. If inventory bin size is considered in terms
of boxes, there will be no necessity for maintaining safety inventory.

69
For the 2nd part of the data analysis, a more recent demand data set is considered to set the
inventory levels for Vistaprint and compare it with the period the inventory has been set
for. As already proven, because of the effectiveness of week to week inventory level
setting, weekly inventory calculation is experimented on the December demand. We
consider and analyze the demand for the month of December for all T Shirt Types and the
results are tabulated as follows:

70
Table 8: December – Weekly Textile Inventory Level Setting – News Vendor
D D
1st week to 2nd week 20 72
2nd week to 3rd week 20 72
3rd week to 4th week 20 72
4th week to 1st week of next month 20 72
1st week to 2nd week 30 72
2nd week to 3rd week 30 72
3rd week to 4th week 25 72
4th week to 1st week of next month 30 72
1st week to 2nd week 30 72
2nd week to 3rd week 35 72
3rd week to 4th week 30 72
4th week to 1st week of next month 30 72
1st week to 2nd week 30 72
2nd week to 3rd week 40 72
3rd week to 4th week 40 72
4th week to 1st week of next month 40 72
1st week to 2nd week 20 72
2nd week to 3rd week 25 72
3rd week to 4th week 20 72
4th week to 1st week of next month 25 72
1st week to 2nd week 5 72
2nd week to 3rd week 10 72
3rd week to 4th week 5 72
4th week to 1st week of next month 10 72
1st week to 2nd week 10 72
2nd week to 3rd week 15 72
3rd week to 4th week 15 72
4th week to 1st week of next month 10 72
1st week to 2nd week 15 72
2nd week to 3rd week 20 72
3rd week to 4th week 15 72
4th week to 1st week of next month 15 72
1st week to 2nd week 10 72
2nd week to 3rd week 15 72
3rd week to 4th week 15 72
4th week to 1st week of next month 10 72
1st week to 2nd week 10 72
2nd week to 3rd week 15 72
3rd week to 4th week 10 72
4th week to 1st week of next month 10 72
Min. Qty.
Small Black T Shirt1
Medium Black T
Shirt2
Large Black T Shirt3
Medium Black Long
Sleeve T Shirt7
XL Black T Shirt4
Q*
Small Black Long
Sleeve T Shirt6
Large Black Long
Sleeve T Shirt8
XL Black Long
Sleeve T Shirt9
XXL Black Long
Sleeve T Shirt10
XXL Black T Shirt5
Weekly
Weekly
Weekly
Weekly
Weekly
Weekly
Weekly
Weekly
Weekly
Weekly
S. No. T-Shirt Type Time Period

71
Table 8: Continued
1st week to 2nd week 45 72
2nd week to 3rd week 60 72
3rd week to 4th week 45 72
4th week to 1st week of next month 45 72
1st week to 2nd week 75 144
2nd week to 3rd week 75 144
3rd week to 4th week 75 144
4th week to 1st week of next month 75 144
1st week to 2nd week 55 72
2nd week to 3rd week 55 72
3rd week to 4th week 50 72
4th week to 1st week of next month 50 72
1st week to 2nd week 50 72
2nd week to 3rd week 50 72
3rd week to 4th week 55 72
4th week to 1st week of next month 55 72
1st week to 2nd week 40 72
2nd week to 3rd week 35 72
3rd week to 4th week 35 72
4th week to 1st week of next month 45 72
1st week to 2nd week 10 72
2nd week to 3rd week 15 72
3rd week to 4th week 10 72
4th week to 1st week of next month 15 72
1st week to 2nd week 20 72
2nd week to 3rd week 30 72
3rd week to 4th week 20 72
4th week to 1st week of next month 25 72
1st week to 2nd week 35 72
2nd week to 3rd week 40 72
3rd week to 4th week 35 72
4th week to 1st week of next month 45 72
1st week to 2nd week 30 72
2nd week to 3rd week 35 72
3rd week to 4th week 30 72
4th week to 1st week of next month 40 72
1st week to 2nd week 20 72
2nd week to 3rd week 20 72
3rd week to 4th week 20 72
4th week to 1st week of next month 25 72
Small White T Shirt11
Medium White T
shirt
Medium Ash T
Shirt17
Large Ash T Shirt18
XL Ash T Shirt19
Large White T Shirt13
XL White T Shirt14
XXL White T Shirt15
XXL Ash T Shirt20
Small Ash T Shirt16
12
Weekly
Weekly
Weekly
Weekly
Weekly
Weekly
Weekly
Weekly
Weekly
Weekly

72
Table 8: Continued
1st week to 2nd week 10 72
2nd week to 3rd week 15 72
3rd week to 4th week 10 72
4th week to 1st week of next month 15 72
1st week to 2nd week 20 72
2nd week to 3rd week 30 72
3rd week to 4th week 20 72
4th week to 1st week of next month 20 72
1st week to 2nd week 30 72
2nd week to 3rd week 30 72
3rd week to 4th week 30 72
4th week to 1st week of next month 35 72
1st week to 2nd week 25 72
2nd week to 3rd week 30 72
3rd week to 4th week 25 72
4th week to 1st week of next month 25 72
1st week to 2nd week 15 72
2nd week to 3rd week 20 72
3rd week to 4th week 10 72
4th week to 1st week of next month 15 72
1st week to 2nd week 30 72
2nd week to 3rd week 45 72
3rd week to 4th week 25 72
4th week to 1st week of next month 35 72
1st week to 2nd week 35 72
2nd week to 3rd week 45 72
3rd week to 4th week 30 72
4th week to 1st week of next month 40 72
1st week to 2nd week 35 72
2nd week to 3rd week 40 72
3rd week to 4th week 35 72
4th week to 1st week of next month 40 72
1st week to 2nd week 25 72
2nd week to 3rd week 30 72
3rd week to 4th week 20 72
4th week to 1st week of next month 30 72
1st week to 2nd week 15 72
2nd week to 3rd week 25 72
3rd week to 4th week 20 72
4th week to 1st week of next month 20 72
24
XXL White Long
Sleeve T Shirt25
Small White Long
Sleeve T Shirt21
Medium White
Long Sleeve T Shirt22
XL White Womens
T Shirt29
XXL White Womens
T Shirt30
Small White
Womens T Shirt26
Medium White
Womens T Shirt
27
Large White
Womens T Shirt28
Large White Long
Sleeve T Shirt23
XL White Long
Sleeve T Shirt
Weekly
Weekly
Weekly
Weekly
Weekly
Weekly
Weekly
Weekly
Weekly
Weekly

73
Table 8: Continued
1st week to 2nd week 10 72
2nd week to 3rd week 15 72
3rd week to 4th week 10 72
4th week to 1st week of next month 15 72
1st week to 2nd week 25 72
2nd week to 3rd week 35 72
3rd week to 4th week 35 72
4th week to 1st week of next month 30 72
1st week to 2nd week 35 72
2nd week to 3rd week 55 72
3rd week to 4th week 40 72
4th week to 1st week of next month 40 72
1st week to 2nd week 35 72
2nd week to 3rd week 45 72
3rd week to 4th week 35 72
4th week to 1st week of next month 40 72
1st week to 2nd week 20 72
2nd week to 3rd week 25 72
3rd week to 4th week 20 72
4th week to 1st week of next month 25 72
1st week to 2nd week 20 72
2nd week to 3rd week 25 72
3rd week to 4th week 20 72
4th week to 1st week of next month 25 72
1st week to 2nd week 25 72
2nd week to 3rd week 25 72
3rd week to 4th week 25 72
4th week to 1st week of next month 25 72
1st week to 2nd week 25 72
2nd week to 3rd week 30 72
3rd week to 4th week 25 72
4th week to 1st week of next month 30 72
1st week to 2nd week 25 72
2nd week to 3rd week 25 72
3rd week to 4th week 25 72
4th week to 1st week of next month 25 72
1st week to 2nd week 15 72
2nd week to 3rd week 20 72
3rd week to 4th week 15 72
4th week to 1st week of next month 15 72
Youth XL T Shirt40
XXL White
Premium T Shirt35
Youth XS T Shirt36
Youth Small T Shirt37
Medium White
Premium T Shirt32
Large White
Premium T Shirt33
XL White Premium
T Shirt34
Youth Medium T
Shirt38
Youth Large T Shirt39
Small White
Premium T Shirt31
Weekly
Weekly
Weekly
Weekly
Weekly
Weekly
Weekly
Weekly
Weekly
Weekly

74
Dec to Jan Key:
Small Black T Shirt
Fig Set 14:

75
(Fig Set 14) depicts demand vs inventory (see Appendix C). The charts are conclusive
evidence for the potential of the News Vendor model to be used to set inventory levels in
MC W2P companies. Periodic (weekly) demand can be analyzed to set the base inventory
for the consecutive week. However, the output of News Vendor model cannot be used
alone. A combination of News Vendor based inventory level setting and Kanban based JIT
is an ideal solution to satisfy demand in highly fluctuating Mass Customizing W2P
companies.
As mentioned earlier, MC W2P companies maintain and transfer inventory in boxes and
not loose products. As shown in the demand and inventory comparison, when boxes of
inventory is used as inventory setting, the demand is completely satisfied. The number of
hourly demand not being satisfied is rare and an emergency Kanban system can be put in
place to satisfy those outliers as well. To plan for inconsistencies in demand, as is common
in MC W2P Company’s production settings, a controlled level of safety stock can and
should be maintained. This is future work in the field that will not be touched upon in this
thesis.
5.4. CONTROL PHASE:
Mass Customizing W2P company’s production and inventory setting is more complicated
than Mass Production setting mainly because of the erratic demand fluctuations. The
typical solution that most settings follow is overstocking for the fear of stopping the line
because of running out of inventory stock. Even after implementing the proposed inventory
control method, there is a potential for the production setting to fall back to the original
practice of overstocking. In order to maintain the calculated levels of inventory and to keep

76
the production running smoothly, a Kanban based replenishment coupled with emergency
JIT system is an ideal solution.
As MC W2P settings are high volume production settings, the replenishment should be
smooth and instantaneous. As the warehouse is in house, the replenishment time is
relatively low. Considering the current inventory turn of one hour, it is necessary to
implement a scanning system that is linked to the central production control software’s
database. This system is already in place in most MC W2P companies to track shipments
after printing. A similar system can be used to scan and update the central database for
tracking on floor inventory levels. A separate in house database can be used to link the
production floor to the material handling department in the logistics section of the facility.
As each box of inventory is opened and each T Shirt is pulled from it to print, the database
can be updated by the workers on the floor. Most MC W2P production floors house state
of the art machinery with computer based interfaces, thus making the updating part simple.
As the box of inventory that is opened on floor is scanned, the material handler at the
warehouse can pull the replenishment from the warehouse and stack it on the material
handlers transport vehicle. As the materials are pulled on floor, the material handler can do
the same at the warehouse. When there is an unexpected spike in demand and a certain type
of raw material is running low even before the inventory turn, the material can be replaced
with ease as well. At the facility under study, a simple Kanban system is used in the
embroidery section of the Textile printing area. The embroidery section is comparatively
slowly paced when compared to other printing areas of the Textile Section and thus just
traditional card based Kanban system is sufficient. However, as the printing section of the
Textile layout is extremely fast paced with cycle times as low as 15 seconds, an electronic
77
Kanban system would be more ideal. It is important to resist the impulse to overstock when
certain inventory calculation does not suffice due to an unexpected surge in demand. When
such a situation arises, the inventory calculation can be updated by using a more recent
demand data over a small range of time.
Thus, a periodic review of inventory using News Vendor Model has been proved to be an
effective solution to calculating inventory levels in fluctuating demand in MC W2P
companies.
Before implementing the proposed inventory control based calculation on – floor, there is
a necessity to prove its competence to satisfy the proposed hourly inventory turn.
Performing experiments on floor is not possible as performing experiments on MC W2P
company’s production floors are a daunting task and might potentially lead to huge losses
because of the short cycle times. Simulation is an effective tool that comes in handy in such
situations. To validate the proposed inventory calculation simulation software FlexSim was
used. The aim of the simulation’s outcome is to prove that the proposed inventory level is
enough to satisfy the pre-set inventory turn of 1 hour.
VI. VALIDATION BY SIMULATION:
6.1. BUILDING THE MODEL:
The initial simulation model built was an exact replica of the production floor (fig. 10).
This was done using the layout shown in the measure phase. However, as the calculated
inventory levels are lower than the present levels of inventory, the number of racks were
reduced to hold only the calculated amount of inventory.

78
Human factors were not considered in this simulation. The whole process is almost
completely automated. Workers just pick and place the T Shirt onto the printing machine,
remove and place it on the dryer after printing and after the T Shirt’s print is dried, pick
and place them on the packing machine. Although this adds time to the overall process, the
comparative time is negligible and therefore were not considered to keep the simulation
model simple. The cycle times considered are mentioned in the measure phase as well. The
boxes in the simulation however, represent individual units to reduce the complexity of the
simulation model.
Note: The cycle times mentioned include human intervention to a certain degree increasing
the reliability of the simulation model.
6.2. ASSUMPTIONS & LIMITATIONS:
As the purpose of the simulation is to prove that the inventory levels are enough
to sustain the proposed inventory turn of 1 hour, the human factors and the
transportation times (in layout) were not considered to verify the inventory
level’s sustainability under optimal efficiency conditions (no human
intervention).
As it has already been proven that the proposed individual inventory levels are
enough to satisfy individual demand requirements (Fig set 1 and 2 – Minimum
Quantity – Boxes), except for a few hours, the simulation considers inventory in
3 sets – Dark T Shirts, Light T Shirts and Youth T Shirts and not the individual
products as such.

79
The simulation model cannot be used to study the effect of demand variation on
individual products as such, but on T shirt groups as a whole – Light, Dark and
Youth T shirts.
The queues are introduced in between printing and drying machines and in
between the drying machine and the packing machine to observe the
accumulation (if present) of un-finished raw materials insider the layout due to
bottle necks. The Queues are virtual and do not exist on the floor.
The model can be used in the future to study the potential of minimal inventory
and JIT combination after implementation of loose item inventory instead of
boxes.
As a single source is considered, demand fluctuation based responsiveness
cannot be studied using the model.
6.3.VALIDATION:
To test the authenticity of the model and to verify it, a basic simulation was run.
Fig 15: Initial Simulation layout

80
Fig 16: Revised simulation layout
The data for the maximum capacity of the individual printing machines is shown below.

81
Table 9: Maximum hourly output – Printing Machines

82
Running the simulation model for a periods of 1 hour show the following results with
respect to the output of the printing machines.
Table 10(a): Maximum output from running simulation
Table 10(b): Condensed Output
stats_contentmax stats_contentavg stats_input stats_output stats_staytimemin stats_staytimemax stats_staytimeavg state_current state_since
1 1 166 165 21.719999 21.719999 21.719999 2 3600.076
1 1 166 165 21.719999 21.719999 21.719999 2 3600.076
1 1 166 165 21.719999 21.719999 21.719999 2 3600.076
1 1 166 165 21.719999 21.719999 21.719999 2 3600.076
1 1 135 134 26.860001 26.860001 26.860001 2 3600.076
1 1 166 165 21.719999 21.719999 21.719999 2 3600.076
1 1 166 165 21.719999 21.719999 21.719999 2 3600.076
0 0 0 0 0 0 0 1 3600.076
1 1 135 134 26.860001 26.860001 26.860001 2 3600.076
1 1 166 165 21.719999 21.719999 21.719999 2 3600.076
1 1 166 165 21.719999 21.719999 21.719999 2 3600.076
1 1 128 127 28.200001 28.200001 28.200001 2 3600.076
1 1 128 127 28.200001 28.200001 28.200001 2 3600.076
1 1 128 127 28.200001 28.200001 28.200001 2 3600.076
1 1 128 127 28.200001 28.200001 28.200001 2 3600.076
0 0 0 0 0 0 0 1 3600.076
0 0 0 0 0 0 0 1 3600.076
0 0 0 0 0 0 0 1 3600.076
0 0 0 0 0 0 0 1 3600.076
0 0 0 0 0 0 0 1 3600.076
0 0 0 0 0 0 0 1 3600.076
0 0 0 0 0 0 0 1 3600.076
0 0 0 0 0 0 0 1 3600.076
0 0 0 0 0 0 0 1 3600.076
0 0 0 0 0 0 0 1 3600.076
0 0 0 0 0 0 0 1 3600.076
0 0 0 0 0 0 0 1 3600.076
0 0 0 0 0 0 0 1 3600.076
0 0 0 0 0 0 0 1 3600.076
0 0 0 0 0 0 0 1 3600.076
0 0 0 0 0 0 0 1 3600.076
0 0 0 0 0 0 0 1 3600.076
0 0 0 0 0 0 0 1 3600.076
0 0 0 0 0 0 0 1 3600.076
0 0 0 0 0 0 0 1 3600.076
0 0 0 0 0 0 0 1 3600.076
0 0 0 0 0 0 0 1 3600.076
0 0 0 0 0 0 0 1 3600.076
0 0 0 0 0 0 0 1 3600.076
0 0 0 0 0 0 0 1 3600.076
0 0 0 0 0 0 0 1 3600.076
0 0 0 0 0 0 0 1 3600.076
0 0 0 0 0 0 0 1 3600.076
0 0 0 0 0 0 0 1 3600.076
0 0 0 0 0 0 0 1 3600.076
0 0 0 0 0 0 0 1 3600.076
0 0 0 0 0 0 0 6 3600.076
0 0 0 0 0 0 0 6 3600.076
0 0 0 0 0 0 0 6 3600.076
0 0 0 0 0 0 0 6 3600.076
0 0 0 0 0 0 0 6 3600.076
0 0 0 0 0 0 0 6 3600.076
0 0 0 0 0 0 0 1 3600.076
1 1 0 2110 0 21.719999 1.705801 4 3600.076
1 0 2096 0 0 0 0 7 3600.076
0 0 0 0 0 0 0 1 3600.076
0 0 0 0 0 0 0 1 3600.076

83
The output of the simulation is comparable to the calculated maximum output, thereby
validating the comparability of the model to the production setting.
Next the maximum demand for Light T Shirts, Dark T Shirts and Youth T Shirts was
extracted from the available data.
Table 11: Maximum Hourly Output – Jan 2014 to Jan 2015
Here, the maximum demand is the end result of Printing and Drying. From the cycle time
data (Table 6), it is clear that the dryers are potential bottlenecks in the process.
Therefore, the maximum output from the line is expected to be lower than the maximum
potential output from the printing machine and the data reflects that assumption.
Next, the simulation model was run for an hour and the following data was collected as
the output from the dryers in the Textile Layout
Table 12(a): Hourly Output from Dryers
Max Outputs
Dark T
Shirt
Light T
Shirt
Youth T
Shirt
Units 276 933 141
In Boxes 3.83 12.96 1.96
Output -
Hourly
Dark T
Shirt
Light T
Shirt
Youth T
Shirt
Object Class
stats_
content
stats_
contentmin
stats_
contentmax
stats_
contentavg
stats_
input
stats_
output
stats_
staytimemin
stats_
staytimemax
stats_
staytimeavg
state_
current
state_
since
dryer 1_1 Processor 1 0 1 0.992304 150 149 23.690001 23.690001 23.690001 2 3557
dryer 1_2 Processor 1 0 1 0.992176 150 149 23.690001 23.690001 23.690001 2 3558
dryer 2_2 Processor 1 0 1 0.9109 649 648 5 5 5 2 3557
dryer 2_1 Processor 0 0 1 0.95651 153 153 22.24 22.24 22.24 1 3557
dryer 3_2 Processor 1 0 1 0.990925 142 141 25 25 25 2 3557
dryer 3_1 Processor 1 0 1 0.990602 142 141 25 25 25 2 3558

84
Table 12(b): Condensed Output
The percentage difference of the actual maximum output and the simulation output is
2.8%, 1.7% and 7.8% for Dark, Light and Youth T Shirts respectively. The higher
difference between the actual and simulation value of the Youth T Shirt is because of the
fact that at the layout, the youth T Shirt is run on both Dark and Light T Shirt dryers
(based on availability). However, in the simulation the Youth T Shirt is run on the Dark T
Shirt dryer. The dark T Shirt dryer’s cycle time is lower than that of the Light T Shirt
dryer. Thus, the simulated model produces lesser output of Youth T Shirts when
compared to the actual system, owing to the negative difference.
The average difference of 2% is owed to the in layout transportation time.
Thus, the simulation model has been validated.
6.4. SIMULATION – HOURLY MAXIMUM CAPACITY BASED OUTPUT
Now, the validated simulation model is run to check if the proposed level of inventory is
capable of satisfying the proposed inventory turn of 1 hour.
The inventory levels for the dark, light and youth T Shirt are set (rack capacity) and the
input from the source (drop off at the beginning of each inventory turn) is set and the
simulation is run.
Units 284 949 130
In Boxes 3.94 13.18 1.81
Percentage
Difference 2.90 1.71 -7.80

85
We obtain the following results of hourly output.
Table 13: Hourly Simulation Output
Object Class
stats_
content
stats_
content
min
stats_
content
max
stats_
content
avg
stats_
input
stats_
output
stats_
staytime
min
stats_
staytime
max
stats_
staytime
avg
state_
current
state_
since
Source2 Source 0 0 0 0 0 1 0 0 0 5 0
Light 1 Processor 1 0 1 1 166 165 21.72 21.72 21.72 2 3584
light 2 Processor 1 0 1 1 166 165 21.72 21.72 21.72 2 3584
light 3 Processor 1 0 1 1 166 165 21.72 21.72 21.72 2 3584
light 4 Processor 1 0 1 1 166 165 21.72 21.72 21.72 2 3584
dryer 1_1 Processor 1 0 1 0.994 152 151 23.69 23.69 23.69 2 3599
dryer 1_2 Processor 1 0 1 0.994 152 151 23.69 23.69 23.69 2 3599
youth_tote 2 Processor 1 0 1 1 134 133 26.86 26.86 26.86 2 3572
light 5 Processor 1 0 1 1 166 165 21.72 21.72 21.72 2 3584
light 6 Processor 1 0 1 1 166 165 21.72 21.72 21.72 2 3584
hats Processor 1 0 1 1 129 128 28.05 28.05 28.05 2 3590
youth_tote 1 Processor 1 0 1 1 134 133 26.86 26.86 26.86 2 3572
light 7 Processor 1 0 1 1 166 165 21.72 21.72 21.72 2 3584
light 8 Processor 1 0 1 1 166 165 21.72 21.72 21.72 2 3584
dryer 2_2 Processor 1 0 1 0.994 716 715 5 5 5 2 3597
dryer 2_1 Processor 1 0 1 0.9939 161 160 22.24 22.24 22.24 2 3580
dark 1 Processor 1 0 1 1 128 127 28.2 28.2 28.2 2 3581
dark 2 Processor 1 0 1 1 128 127 28.2 28.2 28.2 2 3581
dark 3 Processor 1 0 1 1 128 127 28.2 28.2 28.2 2 3581
dark 4 Processor 1 0 1 1 128 127 28.2 28.2 28.2 2 3581
dryer 3_2 Processor 1 0 1 0.9921 26 25 141.68 141.68 141.68 2 3570
dryer 3_1 Processor 1 0 1 0.9921 26 25 141.68 141.68 141.68 2 3570
Sink25 Sink 1 1 1 0 357 0 0 0 0 7 0
light rack 1 Rack 69 1 234 152 235 166 0 3583.8 1791.9 1 3584
light rack 3 Rack 69 1 234 152 235 166 0 3583.8 1791.9 1 3584
light rack 2 Rack 69 1 234 152 235 166 0 3583.8 1791.9 1 3584
light rack 4 Rack 69 1 234 152 235 166 0 3583.8 1791.9 1 3584
dark rack 4 Rack 53 1 180 117 181 128 0 3581.4 1790.7 1 3581
dark rack 3 Rack 53 1 180 117 181 128 0 3581.4 1790.7 1 3581
dark rack 1 Rack 53 1 180 117 181 128 0 3581.4 1790.7 1 3581
dark rack 2 Rack 53 1 180 117 181 128 0 3581.4 1790.7 1 3581
hats rack Rack 16 1 144 80.5 145 129 0 3590.4 1795.2 1 3590
youth_tote rack 1 Rack 47 1 180 114 181 134 0 3572.38 1786.19 1 3572
light rack 7 Rack 69 1 234 152 235 166 0 3583.8 1791.9 1 3584
light rack 8 Rack 69 1 234 152 235 166 0 3583.8 1791.9 1 3584
light rack 6 Rack 55 1 220 138 221 166 0 3583.8 1791.9 1 3584
light rack 5 Rack 69 1 234 152 235 166 0 3583.8 1791.9 1 3584
youth_tote rack 2 Rack 47 1 180 114 181 134 0 3572.38 1786.19 1 3572
Queue_ Distribution Queue 0 0 2347 0 3097 3097 0 0 0 6 0
Queue to packer Queue 869 0 869 429.84 1227 358 0 2529.72 1259.99 8 3599
packer 1 Processor 1 0 1 0.9926 358 357 10 10 10 2 3597
Queue to dryer 2 Queue 177 0 179 89.489 1054 877 0 610.26 305.679 8 3590
Queue to dryer 3 Queue 456 0 456 226.12 508 52 0 3203.6 1601.8 8 3581
Queue to dryer 1 Queue 356 0 358 178.31 660 304 0 1948.19 974.095 8 3584

86
In the table above, the racks house a considerable amount of inventory at the end of the
hourly inventory turn, thereby proving the effectiveness of the set inventory levels.
Furthermore, it is observed that the bottle necks downstream lead to the accumulation of
inventory in the layout, which have to be worked on next to make the entire process
streamlined, as half-finished raw material or WIP have storage costs as well.
6.5. LIMITATIONS
The simulation model does not take into account the in-layout transport time and
human factors (time).
The simulation considers uniform distribution of demand with mean as the
individual cycle times and no standard deviation.
The simulation is to validate the potential of the calculated inventory levels to
satisfy a hour’s demand and nothing else.
VII. CONCLUSIONS:
Thus, an approach to solving the on floor inventory control problem in Mass Customized
W2P company was developed and a case study was conducted in a local MC W2P company
to prove the ability of the proposed approach to satisfy the demand variations in their
production facility.
In the process, the following improvements were achieved in the local MC W2P company’s
textile production floor:
When loose items are considered, the potential improvement is 87.77% reduction
in inventory.

87
When minimum box quantities are considered, the potential improvement is
82.65% reduction in inventory.
These improvements lead to an overall improvement in the control of the production
setting.
The set inventory level’s potential to satisfy the proposed inventory turn of 1 hour was
validated using the simulation model.
VIII. FUTURE WORK:
The proposed use of the News Vendor Model to set On Floor Inventory Levels in MC W2P
companies is solely based on the demand data acquired from Vistaprint. The proposed
Inventory control method may or may not satisfy the demand fluctuations in another MC
W2P company. This work can be used to test the proposed approach’s potential to form a
global On Floor Inventory setting standard for MC W2P companies.
As an immediate extension of this work, and as individual units based inventory settings
require a combination of JIT, a potential approach to calculating safety stock for such
varying demand scenarios can be developed and tested on the available data and as an
extension of the inventory level output from the proposed model.
The main reason for the inventory control problem is the demand fluctuation and in MC
W2P companies, demand fluctuation is extremely erratic. Strategic approaches can be
developed to keep the demand fluctuation under check and study the proposed model’s
compatibility to the revised demand settings.

88
MC W2P companies inventory problem (both On floor and Warehouse) is a problem that
is relatively new and not much research work has been done in the field. This thesis is a
small step in this area and has the potential to form the base to further research into the
field.

89
APPENDIX A
History of Printing
Introduction
to printing
Geography
based history
The history of printing goes back to the duplication of images by means of stamps in
very early times. The use of round seals for rolling an impression into clay tablets goes
back to early Mesopotamian civilization before 3000 BCE, where they are the most
common works of art to survive, and feature complex and beautiful images. In both
China and Egypt, the use of small stamps for seals preceded the use of larger blocks.
In China, India and Europe, the printing of cloth certainly preceded the printing of
paper or papyrus. The process is essentially the same - in Europe special presentation
impressions of prints were often printed on silk until the seventeenth century. The
development of printing has made it possible for books, newspapers, magazines, and
other reading materials to be produced in great numbers, and it plays an important role
in promoting literacy among the masses.
Woodblock Printing
Block printing is a technique for printing text, images or patterns used widely
throughout East Asia both as a method of printing on textiles and later, under the
influence of Buddhism, on paper. As a method of printing on cloth, the earliest
surviving examples fromChina date to about 220.Ukiyo-e is the best known type
of Japanese woodblock art print. Most European uses of the technique on paper are
covered by the art term woodcut, except for theblock-books produced mainly in the
fifteenth century.
In China
The world's earliest printer printed fragments to survive are from China and are of silk
printed with flowers in three colours from the Han Dynasty (before AD 220 ). The
technology of printing on cloth in China was adapted to paper under the influence of
Buddhism which mandated the circulation of standard translations over a wide area, as
well as the production of multiple copies of key texts for religious reasons. It reached
Europe, via the Islamic world, and by around 1400 was being used on paper for old
master prints and playing cards. The oldest wood-block printed book is the Diamond
Sutra. It carries a date on 'the 13th day of the fourth moon of the ninth year of the
Xiantong era' (i.e. 11 May 868). A number printed dhāraṇī-s, however, predate
the Diamond Sūtra by about two hundred years
In India
In Buddhism, great merit is thought to accrue from copying and preserving texts. The
fourth-century master listed the copying of scripture as the first of ten essential
religious practices. The importance of perpetuating texts is set out with special force
in the longer Sukhāvatīvyūha Sūtra which not only urges the devout to hear, learn,
remember and study the text but to obtain a good copy and to preserve it. This ‘cult of
the book’ led to techniques for reproducing texts in great numbers, especially the short
prayers or charms known as dhāraṇī-s. Stamps were carved for printing these prayers
on clay tablets from at least the seventh century, the date of the oldest surviving
examples. Especially popular was the Pratītyasamutpāda Gāthā, a short verse text
summing up Nāgārjuna's philosophy of causal genesis or dependent origination.
Nagarjuna lived in the early centuries of the current era and the Buddhist Creed, as
the Gāthā is frequently called, was printed on clay tablets in huge numbers from the
sixth century. This tradition was transmitted to China and Tibet with Buddhism.

90
Printing text from woodblocks does not, however, seem to have been developed in
India.
In Europe
Block printing was practised in Christian Europe as a method for printing on cloth,
where it was common by 1300. Images printed on cloth for religious purposes could
be quite large and elaborate, and when paper became relatively easily available, around
1400, the medium transferred very quickly to small woodcut religious images
and playing cards printed on paper. These prints were produced in very large numbers
from about 1425 onwards.
Around the mid-century, block-books, woodcut books with both text and images,
usually carved in the same block, emerged as a cheaper alternative to manuscripts and
books printed with movable type. These were all short heavily illustrated works, the
bestsellers of the day, repeated in many different block-book versions:
the Arsmoriendi and the Biblia pauperum were the most common. There is still some
controversy among scholars as to whether their introduction preceded or, the majority
view, followed the introduction of movable type, with the range of estimated dates
being between about 1440–1460.
Stencil
printing
Stencils may have been used to color cloth for a very long time; the technique probably
reached its peak of sophistication inKatazome and other techniques used on silks for
clothes during the Edo period in Japan. In Europe, from about 1450 they were very
commonly used to colour old master prints printed in black and white,
usually woodcuts. This was especially the case with playing-cards, which continued to
be coloured by stencil long after most other subjects for prints were left in black and
white. Stenciling back in the 27th century BC was different. They used color from
plants and flowers such as indigo (which extracts blue). Stencils were used for mass
publications, as the type didn't have to be hand-written.
Movable
Type
Movable type is the system of printing and typography using movable pieces of metal
type, made by casting from matrices struck by letter punches.
Around 1040, the world's first known movable type system was created in China by Bi
Sheng out of porcelain. He also developed wooden movable type, but it was abandoned
in favour of clay movable types due to the presence of wood grains and the unevenness
of the wooden type after being soaked in ink. Neither movable type system was widely
used, one reason being the enormous Chinese character set. Metal movable type began
to be used in Korea during the Goryeo Dynasty (around 1230). Jikji was printed during
the Goryeo Dynasty in 1377, it is the world's oldest extant book printed with movable
metal type. This form of metal movable type was described by the French scholar
Henri-Jean Martin as "extremely similar to Gutenberg's". East metal movable type may
have spread to Europe between late 14th century and early 15th century.
It is traditionally summarized that Johannes Gutenberg, of the German city of Mainz,
developed European movable type printing technology with the printing press around
1439 and in just over a decade, the European age of printing began. However, the
details show a more complex evolutionary process spread over multiple
locations. Also, Johann Fust and Peter Schöffer experimented with Gutenberg in
Mainz.
Compared to woodblock printing, movable type page-setting was quicker and more
durable. The metal type pieces were more durable and the lettering was more uniform,
leading to typography and fonts. The high quality and relatively low price of the
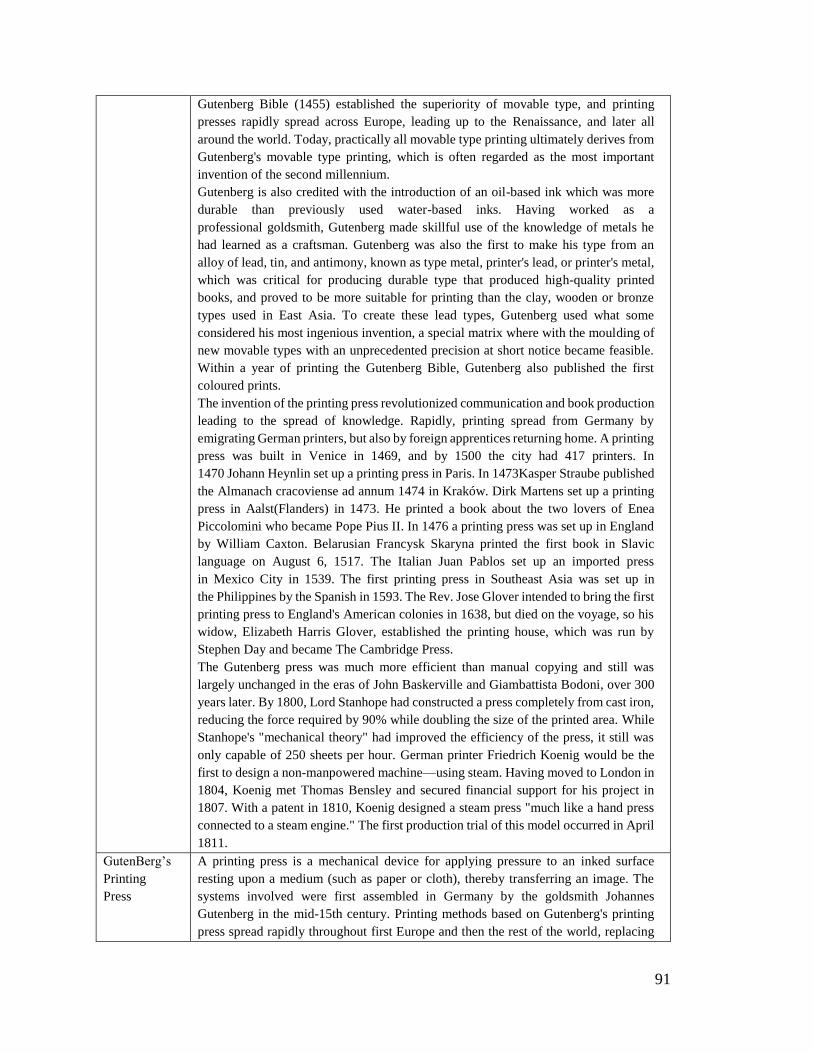
91
Gutenberg Bible (1455) established the superiority of movable type, and printing
presses rapidly spread across Europe, leading up to the Renaissance, and later all
around the world. Today, practically all movable type printing ultimately derives from
Gutenberg's movable type printing, which is often regarded as the most important
invention of the second millennium.
Gutenberg is also credited with the introduction of an oil-based ink which was more
durable than previously used water-based inks. Having worked as a
professional goldsmith, Gutenberg made skillful use of the knowledge of metals he
had learned as a craftsman. Gutenberg was also the first to make his type from an
alloy of lead, tin, and antimony, known as type metal, printer's lead, or printer's metal,
which was critical for producing durable type that produced high-quality printed
books, and proved to be more suitable for printing than the clay, wooden or bronze
types used in East Asia. To create these lead types, Gutenberg used what some
considered his most ingenious invention, a special matrix where with the moulding of
new movable types with an unprecedented precision at short notice became feasible.
Within a year of printing the Gutenberg Bible, Gutenberg also published the first
coloured prints.
The invention of the printing press revolutionized communication and book production
leading to the spread of knowledge. Rapidly, printing spread from Germany by
emigrating German printers, but also by foreign apprentices returning home. A printing
press was built in Venice in 1469, and by 1500 the city had 417 printers. In
1470 Johann Heynlin set up a printing press in Paris. In 1473Kasper Straube published
the Almanach cracoviense ad annum 1474 in Kraków. Dirk Martens set up a printing
press in Aalst(Flanders) in 1473. He printed a book about the two lovers of Enea
Piccolomini who became Pope Pius II. In 1476 a printing press was set up in England
by William Caxton. Belarusian Francysk Skaryna printed the first book in Slavic
language on August 6, 1517. The Italian Juan Pablos set up an imported press
in Mexico City in 1539. The first printing press in Southeast Asia was set up in
the Philippines by the Spanish in 1593. The Rev. Jose Glover intended to bring the first
printing press to England's American colonies in 1638, but died on the voyage, so his
widow, Elizabeth Harris Glover, established the printing house, which was run by
Stephen Day and became The Cambridge Press.
The Gutenberg press was much more efficient than manual copying and still was
largely unchanged in the eras of John Baskerville and Giambattista Bodoni, over 300
years later. By 1800, Lord Stanhope had constructed a press completely from cast iron,
reducing the force required by 90% while doubling the size of the printed area. While
Stanhope's "mechanical theory" had improved the efficiency of the press, it still was
only capable of 250 sheets per hour. German printer Friedrich Koenig would be the
first to design a non-manpowered machine—using steam. Having moved to London in
1804, Koenig met Thomas Bensley and secured financial support for his project in
1807. With a patent in 1810, Koenig designed a steam press "much like a hand press
connected to a steam engine." The first production trial of this model occurred in April
1811.
GutenBerg’s
Printing
Press
A printing press is a mechanical device for applying pressure to an inked surface
resting upon a medium (such as paper or cloth), thereby transferring an image. The
systems involved were first assembled in Germany by the goldsmith Johannes
Gutenberg in the mid-15th century. Printing methods based on Gutenberg's printing
press spread rapidly throughout first Europe and then the rest of the world, replacing
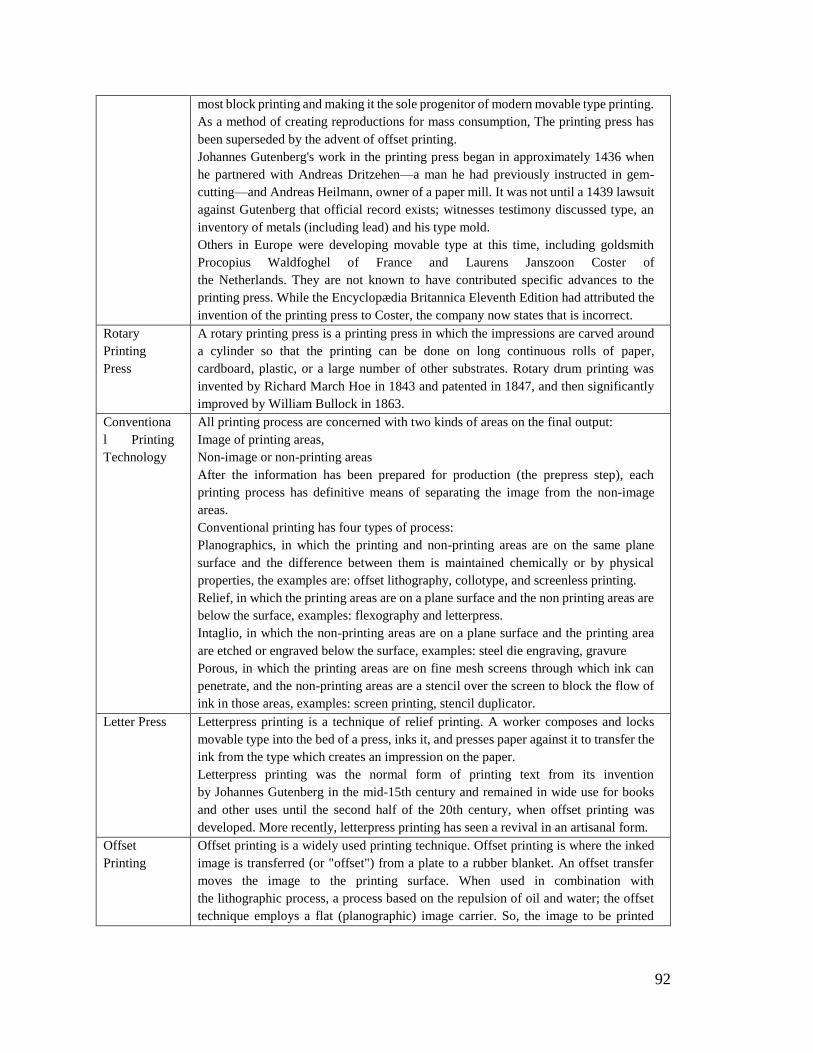
92
most block printing and making it the sole progenitor of modern movable type printing.
As a method of creating reproductions for mass consumption, The printing press has
been superseded by the advent of offset printing.
Johannes Gutenberg's work in the printing press began in approximately 1436 when
he partnered with Andreas Dritzehen—a man he had previously instructed in gem-
cutting—and Andreas Heilmann, owner of a paper mill. It was not until a 1439 lawsuit
against Gutenberg that official record exists; witnesses testimony discussed type, an
inventory of metals (including lead) and his type mold.
Others in Europe were developing movable type at this time, including goldsmith
Procopius Waldfoghel of France and Laurens Janszoon Coster of
the Netherlands. They are not known to have contributed specific advances to the
printing press. While the Encyclopædia Britannica Eleventh Edition had attributed the
invention of the printing press to Coster, the company now states that is incorrect.
Rotary
Printing
Press
A rotary printing press is a printing press in which the impressions are carved around
a cylinder so that the printing can be done on long continuous rolls of paper,
cardboard, plastic, or a large number of other substrates. Rotary drum printing was
invented by Richard March Hoe in 1843 and patented in 1847, and then significantly
improved by William Bullock in 1863.
Conventiona
l Printing
Technology
All printing process are concerned with two kinds of areas on the final output:
1. Image of printing areas,
2. Non-image or non-printing areas
After the information has been prepared for production (the prepress step), each
printing process has definitive means of separating the image from the non-image
areas.
Conventional printing has four types of process:
1. Planographics, in which the printing and non-printing areas are on the same plane
surface and the difference between them is maintained chemically or by physical
properties, the examples are: offset lithography, collotype, and screenless printing.
2. Relief, in which the printing areas are on a plane surface and the non printing areas are
below the surface, examples: flexography and letterpress.
3. Intaglio, in which the non-printing areas are on a plane surface and the printing area
are etched or engraved below the surface, examples: steel die engraving, gravure
4. Porous, in which the printing areas are on fine mesh screens through which ink can
penetrate, and the non-printing areas are a stencil over the screen to block the flow of
ink in those areas, examples: screen printing, stencil duplicator.
Letter Press Letterpress printing is a technique of relief printing. A worker composes and locks
movable type into the bed of a press, inks it, and presses paper against it to transfer the
ink from the type which creates an impression on the paper.
Letterpress printing was the normal form of printing text from its invention
by Johannes Gutenberg in the mid-15th century and remained in wide use for books
and other uses until the second half of the 20th century, when offset printing was
developed. More recently, letterpress printing has seen a revival in an artisanal form.
Offset
Printing
Offset printing is a widely used printing technique. Offset printing is where the inked
image is transferred (or "offset") from a plate to a rubber blanket. An offset transfer
moves the image to the printing surface. When used in combination with
the lithographic process, a process based on the repulsion of oil and water; the offset
technique employs a flat (planographic) image carrier. So, the image to be printed

93
obtains ink from ink rollers, while the non-printing area attracts a film of water,
keeping the non-printing areas ink-free.
Currently, most books and newspapers are printed using the technique of offset
lithography.
Gravure
Printing Gravure printing is an intaglio printing technique, where the image being printed is
made up of small depressions in the surface of the printing plate. The cells are filled
with ink, and the excess is scraped off the surface with a doctor blade. Then a rubber-
covered roller presses paper onto the surface of the plate and into contact with the ink
in the cells. The printing cylinders are usually made from copper plated steel, which is
subsequently chromed, and may be produced by diamond engraving; etching,
orlaser ablation.
Gravure printing is used for long, high-quality print runs such as magazines, mail-order
catalogues, packaging and printing onto fabric and wallpaper. It is also used for
printing postage stamps and decorative plastic laminates, such as kitchen worktops.
Flexography Flexography (often abbreviated to flexo) is a form of printing process which utilizes a
flexible relief plate. It is essentially a modern version of letterpress which can be used
for printing on almost any type of substrate, including plastic, metallic films,
cellophane, and paper. It is widely used for printing on the non-porous substrates
required for various types of food packaging (it is also well suited for printing large
areas of solid colour).
Dye Transfer
Printing
Dye transfer is a continuous-tone color photographic printing process.
Technicolor introduced dye transfer in its Process 3, introduced in the feature film The
Viking (1928), which was produced by the Technicolor Corporation and released
by Metro-Goldwyn-Mayer. Technicolor's two previous systems were an additive
color process and a poorly received subtractive color process, the latter requiring two
prints cemented together back-to-back. Process 3 used an imbibition process borrowed
from the earlier Handschiegl color process, originally created in 1916 for Cecil B.
DeMille's feature film Joan the Woman (1917). Technicolor further refined the
imbibition dye transfer process in its Process 4, introduced in 1932, which employed
three simultaneously filmed negatives.
In the 1940s, this process was popularized by Eastman Kodak for general-purpose
graphic arts work, but not for motion picture work, which remained exclusive to
Technicolor (and for which Eastman Kodak was manufacturing Technicolor's light-
sensitive camera and printing films, including the "blank receiver" film, on an
exclusive basis, but not Technicolor's dyes), and is sometimes referred to by such
generic names as "wash-off relief printing" and "dye imbibition" printing. The process
requires making three printing matrices (one for each subtractive primary color) which
absorb dye in proportion to the density of a gelatin relief image. Successive placement
of the dyed film matrices, one at a time, "transfers" each primary dye by physical
contact from the matrix to a mordanted, gelatin-coated paper.
Inkjet
Printing Inkjet printing is a type of computer printing that recreates a digital imageby
propelling droplets of ink onto paper, plastic, or other substrates. Inkjet printers are the
most commonly used type of printer, and range from small inexpensive consumer
models to expensive professional machines
The concept of inkjet printing originated in the 19th century, and the technology was
first extensively developed in the early 1950s. Starting in the late 1970s inkjet printers

94
that could reproduce digital images generated by computers were developed, mainly
by Epson,Hewlett-Packard (HP), and Canon. In the worldwide consumer market, four
manufacturers account for the majority of inkjet printer sales: Canon, HP, Epson, and
Lexmark, a 1991 spin-off fromI BM.
The emerging ink jet material deposition market also uses inkjet technologies, typically
print heads using piezoelectric crystals, to deposit materials directly on substrates.
There are two main technologies in use in contemporary inkjet printers: continuous
(CIJ) and Drop-on-demand (DOD). Another emerging printing technology is pyro
electro hydrodynamics by which liquids can be printed at nanoscale volumes.
Laser
Printing
Laser printing is an electrostatic digital printing process. It produces high-quality text
and graphics (and moderate-quality photographs) by repeatedly passing a laser
beam back and forth over a negatively charged cylindrical drum to define a
differentially-charged image. The drum then selectively collects electrically charged
powdered ink (toner), and transfers the image to paper, which is then heated in order
to permanently fuse the text and/or imagery. As with digital photocopiers and
multifunction/all-in-one inkjet printers, laser printers employ axerographic printing
process. However, laser printing differs from analog photocopiers in that the image is
produced by the direct scanning of the medium across the printer's photoreceptor. This
enables laser printing to copy images more quickly than most photocopiers.
Screen
Printing
Screen printing is a printing technique whereby a mesh is used to transfer ink onto a
substrate, except in areas made impermeable to the ink by a blocking stencil. A blade
or squeegee is moved across the screen to fill the open mesh apertures with ink, and a
reverse stroke then causes the screen to touch the substrate momentarily along a line
of contact. This causes the ink to wet the substrate and be pulled out of the mesh
apertures as the screen springs back after the blade has passed.
Basically, it is the process of using a mesh-based stencil to apply ink onto a substrate,
whether it be T-shirts, posters, stickers, vinyl, wood, or other material.
Screen printing is also a stencil method of print making in which a design is imposed
on a screen of polyester or other fine mesh, with blank areas coated with an
impermeable substance. Ink is forced into the mesh openings by the fill blade
or squeegee and by wetting the substrate, transferred onto the printing surface during
the squeegee stroke. As the screen rebounds away from the substrate the ink remains
on the substrate. It is also known as silk-screen, screen, serigraphy, and serigraph
printing. One color is printed at a time, so several screens can be used to produce a
multi coloured image or design.

95
APPENDIX B
Output Comparison: Key:
Small Black T Shirt
Jan to Feb
Feb to March

96
March to April
April to May

97
May to June
June to July

98
July to Aug
Aug to Sept

99
Sept to Oct
Oct to Nov

100
Nov to Dec
Dec to Jan 2015

101
Med Black T shirt
Jan to Feb
Feb to Mar

102
Mar to April
Apr to May

103
May to June
June to July

104
July to Aug
Aug to Sept
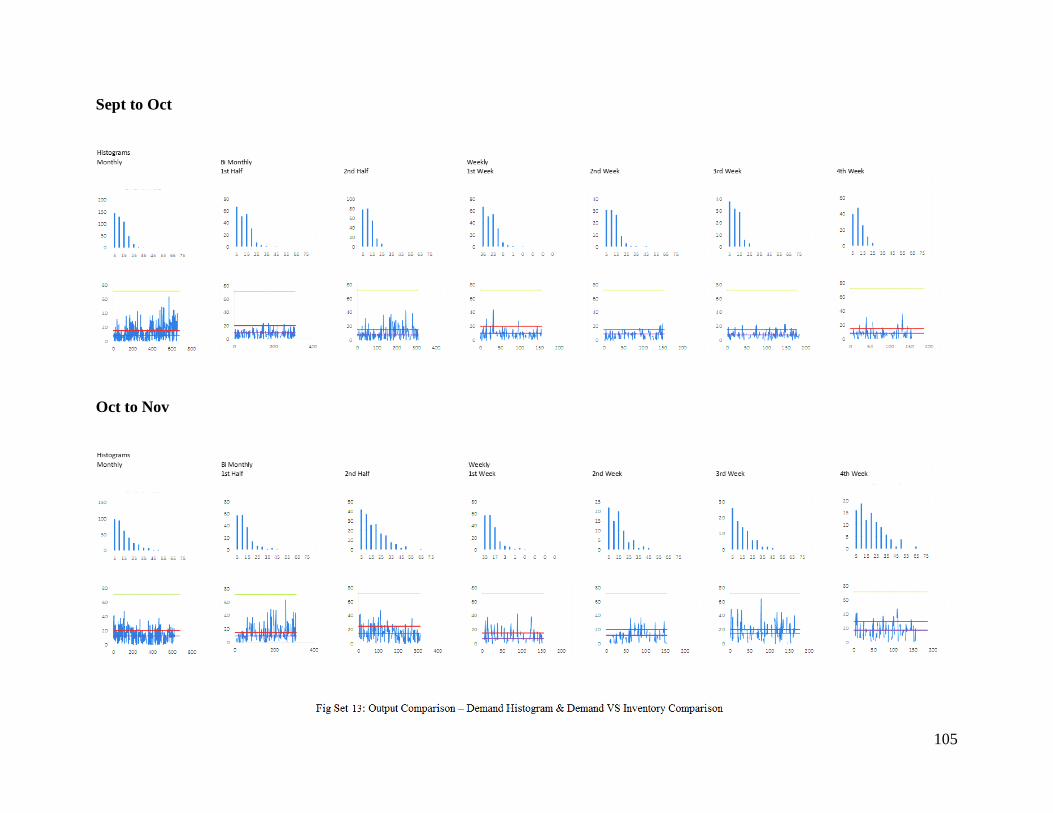
105
Sept to Oct
Oct to Nov

106
Nov to Dec
Dec to Jan

107
Large Black T Shirt
Jan to Feb
Feb to March

108
March to Apr
April to May

109
May to June
June to July

110
July to Aug
Aug to September

111
Sept to Oct
Oct to Nov

112
Nov to Dec
Dec to Jan

113
XL Black T Shirt
Jan to Feb
Feb to March

114
March to April
April to May

115
May to June
June to July

116
July to Aug
Aug to September

117
Sept to Oct
Oct to Nov

118
Nov to Dec
Dec to Jan

119
XXL Black T Shirt
Jan to Feb
Feb to March

120
March to April
April to May

121
May to June
June to July

122
July to Aug
Aug to Sept

123
Sept to Oct
Oct to Nov

124
Nov to Dec
Dec to Jan

125
Small Black Long Sleeve T Shirt
Jan to Feb
Feb to March

126
March to April
April to May

127
May to June
June to July

128
July to Aug
Aug to Sept

129
Sept to Oct
Oct to Nov

130
Nov to Dec
Dec to Jan

131
Medium Black Long Sleeve T shirt
Jan to Feb
Feb to March

132
March to April
April to May

133
May to June
June to July
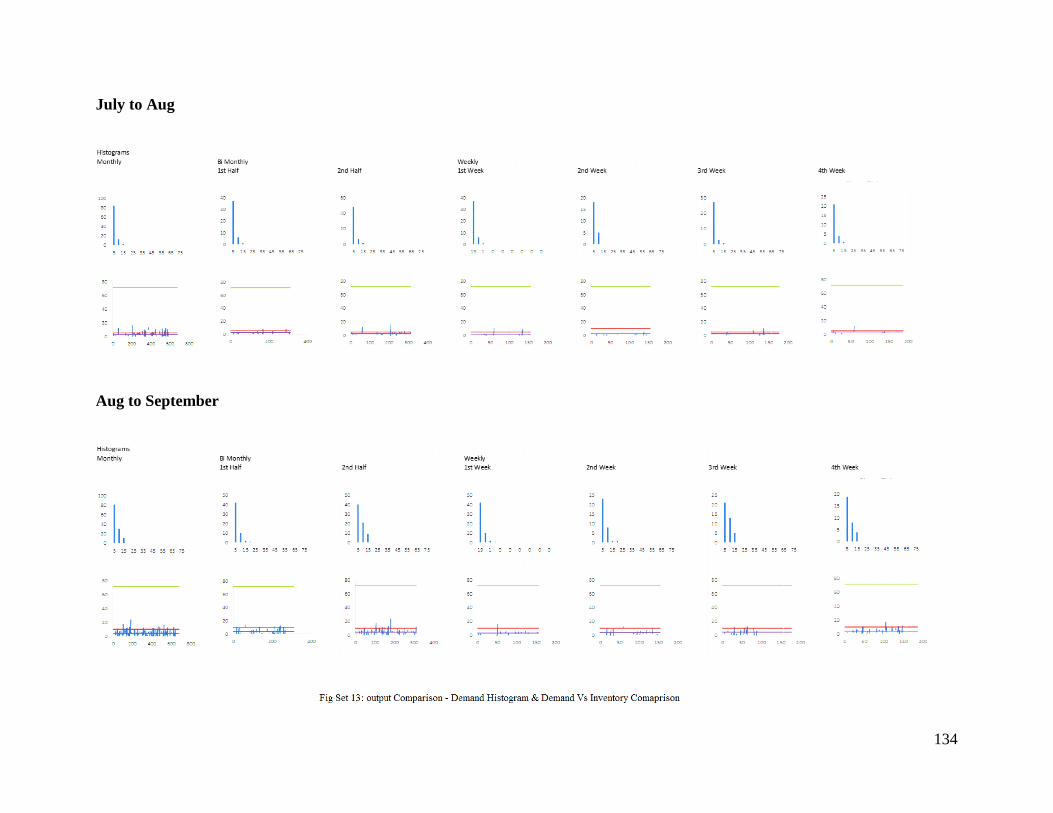
134
July to Aug
Aug to September

135
Sept to Oct
Oct to Nov

136
Nov to Dec
Dec to Jan

137
Large Black Long Sleeve T Shirt
Jan to Feb
Feb to March
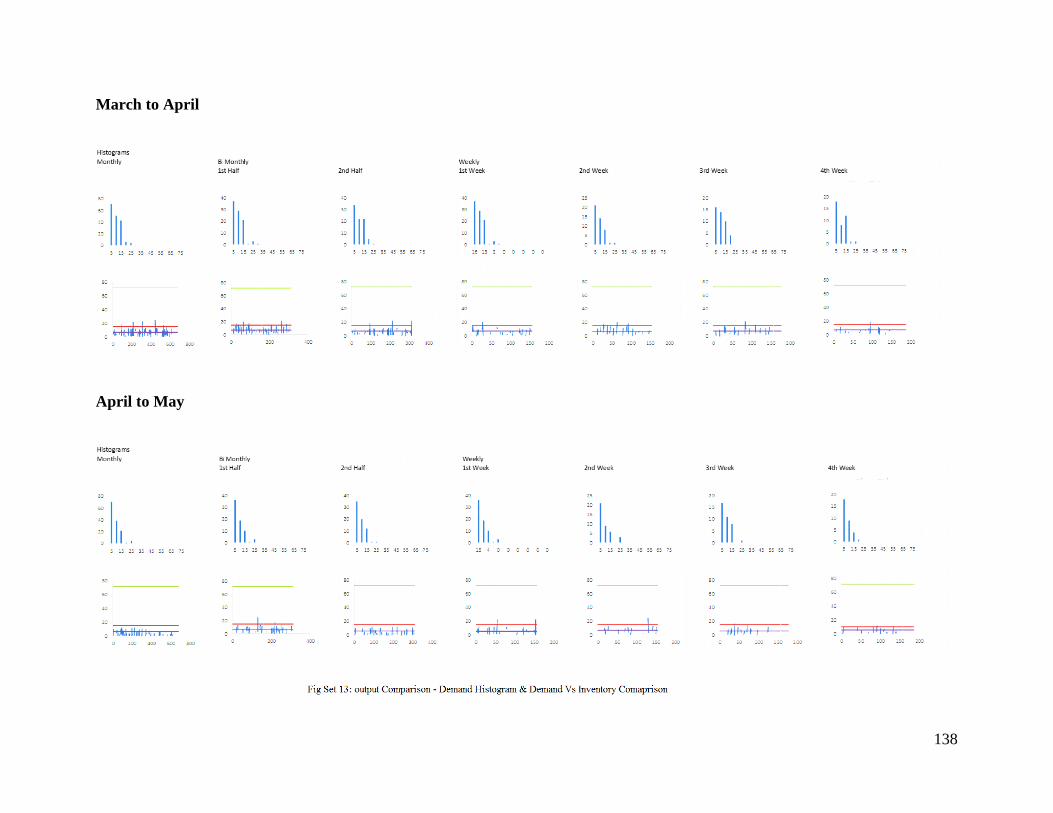
138
March to April
April to May

139
May to June
June to July

140
July to Aug
Aug to September

141
Sept to Oct
Oct to Nov

142
Nov to Dec
Dec to Jan

143
XL Long Sleeve T Shirt Black
Jan to Feb
Feb to March

144
March to April
April to May

145
May to June
June to July

146
July to Aug
Aug to September

147
Sept to Oct
Oct to Nov

148
Nov to Dec
Dec to Jan

149
XXL Long Sleeve t-shirt black
Jan to Feb
Feb to March

150
March to April
April to May

151
May to June
June to July

152
July to Aug
Aug to Sept

153
Sept to Oct
Oct to Nov

154
Nov to Dec
Dec to Jan

155
Small White T Shirt Total
Jan to Feb
Feb to March

156
March to April
April to May
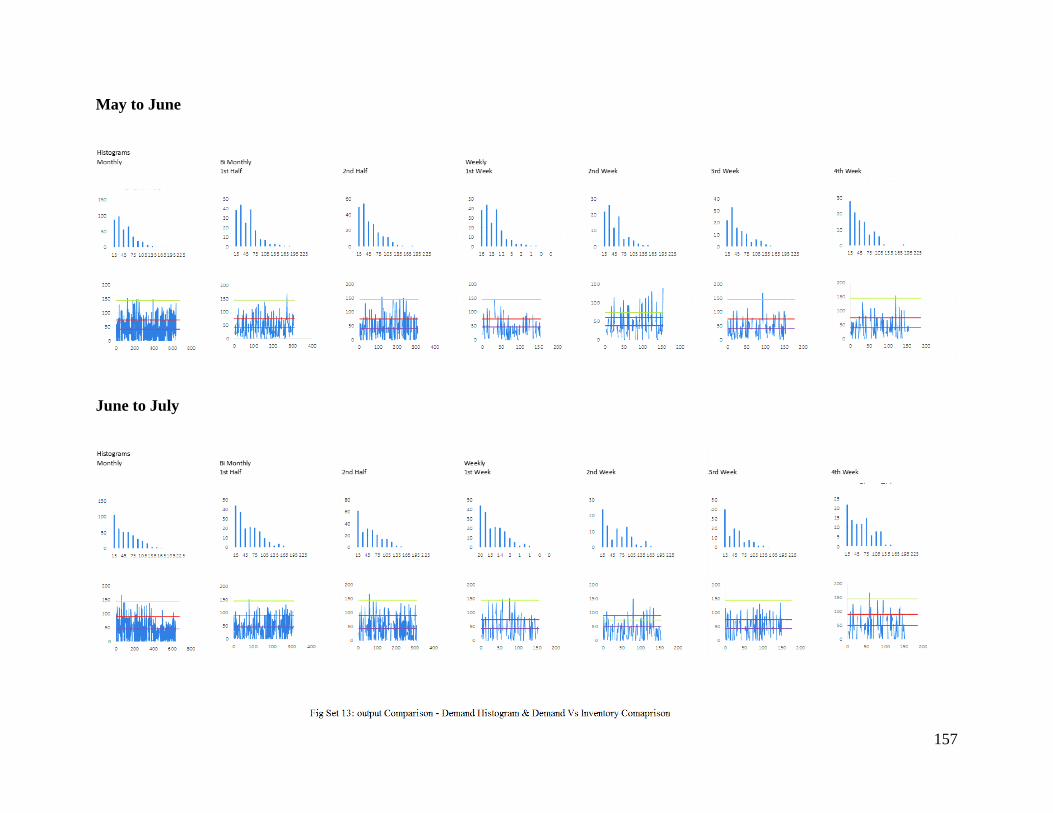
157
May to June
June to July

158
July to Aug
Aug to September

159
Sept to Oct
Oct to Nov

160
Nov to Dec
Dec to Jan

161
Medium White T Shirt
Jan to Feb
Feb to March
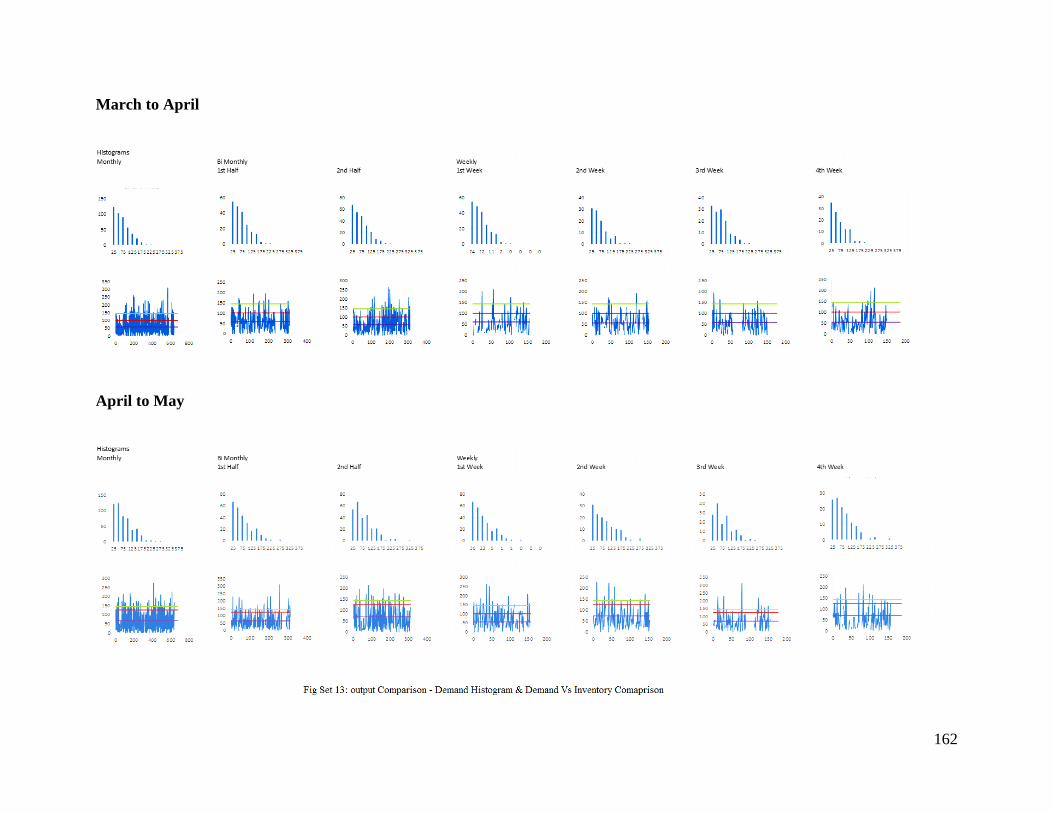
162
March to April
April to May

163
May to June
June to July

164
July to August
August to September

165
Sept to Oct
Oct to Nov

166
Nov to Dec
Dec to Jan

167
APPENDIX C
Dec to Jan Key:
Small Black T Shirt
Medium Black T Shirt
Large Black T Shirt

168
XL Black T Shirt
XXL Black T Shirt
Small Black long Sleeve T Shirt

169
Medium Black Long Sleeve T Shirt
Large Black Long Sleeve T Shirt
XL Black Long Sleeve T Shirt

170
XXL Black Long Sleeve T Shirt
Small White T Shirt
Medium White T Shirt

171
Large White T Shirt
XL White T Shirt
XXL White T Shirt

172
Small Ash T Shirt
Medium Ash T Shirt
Large White T Shirt

173
XL White T Shirt
XXL White T Shirt
Small White Long Sleeve T Shirt

174
Medium White Long Sleeve T Shirt
Large White Long Sleeve T Shirt
XL White Long Sleeve T Shirt

175
XXL White Long Sleeve T Shirt
Small White Women’s T Shirt
Medium White Women’s T Shirt

176
Large White Women’s T Shirt
XL White Women’s T Shirt
XXL White Women’s T Shirt

177
Small White Premium T Shirt
Medium White Premium T Shirt
Large White Premium T Shirt

178
XL White Premium T Shirt
XXL White Premium T Shirt
XS Youth T Shirt

179
Small Youth T Shirt
Medium Youth T Shirt
Large Youth T Shirt

180
XL Youth T Shirt

181
REFERENCES:
Zipkin, P. (2001). The Limits of Mass Customization. MIT Sloan Management Review;,
42(3), pp 1–7
Anne König (2012). Mass Customization of Print Products The emergence of Online Printers
– small business as a gap in the market
Rose, A.M.N., Deros, B.Md., Rahman, M.N.Ab. & Nordin, N. (2011). Lean manufacturing
best practices in SMEs. International Conference on Industrial Engineering and Operation
Management, pp. 872–877
Salvador, F., De Holan, P. M., & Piller, F. (2009). Cracking the Code of Mass
Customization. MIT Sloan Management Review, 50(3), 71–78.
Fralix, M. T. (2001). U.S. Apparel Employment U.S. Textile and Apparel Trade. Journal of
Textile and Apparel, Technology and Management, pp. 1–7
Chan, J., Jie, R., Kamaruddin, S., & Azid, I. A. (2014). Implementing the Lean Six Sigma
Framework in a Small Medium Enterprise (SME) – A Case Study in a Printing Company, pp.
387–396.
Feitzinger, E., & Lee, H. L. (1997). Mass Customization at Hewlett-Packard: The Power of
Postponement. Harvard Business Review, 75(1), pp. 116–121
Zhang, M., Chen, Y., & Tseng, M. M. (n.d.). Process Planning for Mass Customization, pp.1–
15

182
Bhatia, A., & Asai, R. G. (2012). Mass Customization in Apparel & Footwear Industry –
Today’s Strategy , Future’s Necessity. Wipro, pp. 1–16
Yao, J., & Liu, L. (2009). Optimization analysis of supply chain scheduling in mass
customization. International Journal of Production Economics, pp. 197–211.
Aigbedo, H. (2007). An assessment of the effect of mass customization on suppliers’ inventory
levels in a JIT supply chain. European Journal of Operational Research, pp. 704–715
Yang, H. L., Teng, J. T., & Chern, M. S. (2001). Deterministic inventory lot-size models under
inflation with shortages and deterioration for fluctuating demand. Naval Research Logistics,
pp. 144–158
Song, J.-S., & Zipkin, P. (1993). Inventory Control in a Fluctuating Demand Environment.
Operations Research
Khurma, N., Bacioiu, G. M., & Pasek, Z. J. (2008). Simulation-based verification of lean
improvement for emergency room process. In Proceedings - Winter Simulation Conference,
pp. 1490–1499
Yao, L. Y. L., & Zhu, W. Z. W. (2010). Visual simulation framework of iron and steel
production scheduling based on Flexsim. IEEE Fifth International Conference on Bio-Inspired
Computing: Theories and Applications (BIC-TA)
Kleijnen, J. P. C. (1995). Verification and validation of simulation models. European Journal
of Operational Research, 82(1), pp. 145–162

183
Fujimoto, R. (1989). Parallel discrete event simulation. Proceedings of the 21st Conference
on Winter Simulation, pp. 19–28
Carson, J. S. (2002). Model Verification and Validation. Proceedings of the 2002 Winter
Simulation Conference, pp. 52–5
Helmut Kipphan (2001) Handbook of Print Media: Technologies and Production Methods
(Yoram Korean, 2010) The Global Manufacturing Revolution
(Averill M. Law, 2007) Simulation Modelling & Analysis - 4th Edition
[1]http://www.strategosinc.com/toyota_crises.htm
[2]http://www.road-reality.com/wp-content/uploads/2010/06/Sales-2010-YTD-05.jpg
[3]https://en.wikipedia.org/wiki/Aftermarket_(automotive)
[4]http://tagmyride.mobi/wpcontent/uploads/2014/01/%E2%80%A2_U_S__automotive_aut
omotive_parts_aftermarket_2007-2015___Forecast.jpg
[5]http://www.fool.com/investing/high-growth/2010/08/06/todays-buy-opportunity-
vistaprint.aspx
[6]http://www.innovationmanagement.se/2012/04/09/part-1-competing-in-the-age-of-mass-
customization/
[7]http://www.ukessays.com/essays/marketing/history-and-overview-of-mass-
customization-marketing-essay.php

184
[8] https://en.wikipedia.org/wiki/Vistaprint
[9]http://www.vistaprint.com/consumer-product-list.aspx?couponAutoload
=1&GP=7%2f4%2f2015+2%3a20%3a38+PM&GPS=3552696823&GNF=0
[10]https://en.wikipedia.org/wiki/Printing
[11]http://www.wikinvest.com/stock/VistaPrint_(VPRT)/Technology
[12]http://www.businesswire.com/news/home/20141117005236/en/Corporate-Parent-
Vistaprint-Renames-Cimpress-Plans-Significant#.Va4VxPlViko
[13]http://patft.uspto.gov/netacgi/nphParser?Sect1=PTO2&Sect2=HITOFF&p=1&u=%2Fne
tahtml%2FPTO%2Fsearch-bool.html&r=0&f=S&l=50&TERM1=Vistaprint&
FIELD1=&co1=AND&TERM2=&FIELD2=&d=PALL
[14] Production and Operations Analysis sixth edition by Steven Nahmias

185
VIVA AUCTORIS
NAME: ASHWATH RAJ SRIDHARAN
YEAR OF BIRTH: 1992
EDUCATION: B.Eng Mechanical, 2013
MASc. Industrial, 2015
RESEARCH INTRESTS: Lean Manufacturing, Six Sigma,
Inventory Control & Design
Methodology