CtIP-dependent DNA resection is required for DNA damage checkpoint maintenance but not initiation
Upload
khangminh22Category
view
4download
0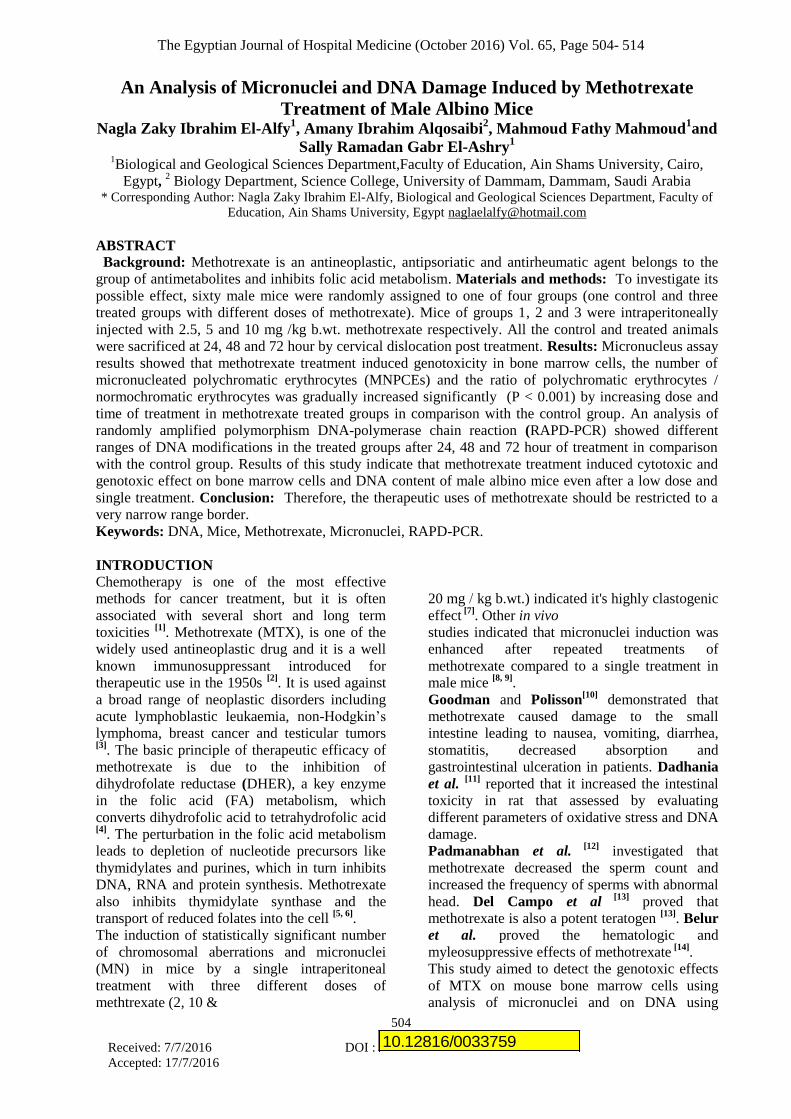
The Egyptian Journal of Hospital Medicine (October 2016) Vol. 65, Page 504- 514
504
Received: 7/7/2016 DOI :
Accepted: 17/7/2016
10.12816/0033759
An Analysis of Micronuclei and DNA Damage Induced by Methotrexate
Treatment of Male Albino Mice Nagla Zaky Ibrahim El-Alfy
1, Amany Ibrahim Alqosaibi
2, Mahmoud Fathy Mahmoud
1and
Sally Ramadan Gabr El-Ashry1
1Biological and Geological Sciences Department,Faculty of Education, Ain Shams University, Cairo,
Egypt, 2 Biology Department, Science College, University of Dammam, Dammam, Saudi Arabia
* Corresponding Author: Nagla Zaky Ibrahim El-Alfy, Biological and Geological Sciences Department, Faculty of
Education, Ain Shams University, Egypt [email protected]
ABSTRACT Background: Methotrexate is an antineoplastic, antipsoriatic and antirheumatic agent belongs to the
group of antimetabolites and inhibits folic acid metabolism. Materials and methods: To investigate its
possible effect, sixty male mice were randomly assigned to one of four groups (one control and three
treated groups with different doses of methotrexate). Mice of groups 1, 2 and 3 were intraperitoneally
injected with 2.5, 5 and 10 mg /kg b.wt. methotrexate respectively. All the control and treated animals
were sacrificed at 24, 48 and 72 hour by cervical dislocation post treatment. Results: Micronucleus assay
results showed that methotrexate treatment induced genotoxicity in bone marrow cells, the number of
micronucleated polychromatic erythrocytes (MNPCEs) and the ratio of polychromatic erythrocytes /
normochromatic erythrocytes was gradually increased significantly (P < 0.001) by increasing dose and
time of treatment in methotrexate treated groups in comparison with the control group. An analysis of
randomly amplified polymorphism DNA-polymerase chain reaction (RAPD-PCR) showed different
ranges of DNA modifications in the treated groups after 24, 48 and 72 hour of treatment in comparison
with the control group. Results of this study indicate that methotrexate treatment induced cytotoxic and
genotoxic effect on bone marrow cells and DNA content of male albino mice even after a low dose and
single treatment. Conclusion: Therefore, the therapeutic uses of methotrexate should be restricted to a
very narrow range border.
Keywords: DNA, Mice, Methotrexate, Micronuclei, RAPD-PCR.
INTRODUCTION Chemotherapy is one of the most effective
methods for cancer treatment, but it is often
associated with several short and long term
toxicities [1]
. Methotrexate (MTX), is one of the
widely used antineoplastic drug and it is a well
known immunosuppressant introduced for
therapeutic use in the 1950s [2]
. It is used against
a broad range of neoplastic disorders including
acute lymphoblastic leukaemia, non-Hodgkin’s
lymphoma, breast cancer and testicular tumors [3]
. The basic principle of therapeutic efficacy of
methotrexate is due to the inhibition of
dihydrofolate reductase (DHER), a key enzyme
in the folic acid (FA) metabolism, which
converts dihydrofolic acid to tetrahydrofolic acid [4]
. The perturbation in the folic acid metabolism
leads to depletion of nucleotide precursors like
thymidylates and purines, which in turn inhibits
DNA, RNA and protein synthesis. Methotrexate
also inhibits thymidylate synthase and the
transport of reduced folates into the cell [5, 6]
.
The induction of statistically significant number
of chromosomal aberrations and micronuclei
(MN) in mice by a single intraperitoneal
treatment with three different doses of
methtrexate (2, 10 &
20 mg / kg b.wt.) indicated it's highly clastogenic
effect [7]
. Other in vivo
studies indicated that micronuclei induction was
enhanced after repeated treatments of
methotrexate compared to a single treatment in
male mice [8, 9]
.
Goodman and Polisson[10]
demonstrated that
methotrexate caused damage to the small
intestine leading to nausea, vomiting, diarrhea,
stomatitis, decreased absorption and
gastrointestinal ulceration in patients. Dadhania
et al. [11]
reported that it increased the intestinal
toxicity in rat that assessed by evaluating
different parameters of oxidative stress and DNA
damage.
Padmanabhan et al. [12]
investigated that
methotrexate decreased the sperm count and
increased the frequency of sperms with abnormal
head. Del Campo et al [13]
proved that
methotrexate is also a potent teratogen [13]
. Belur
et al. proved the hematologic and
myleosuppressive effects of methotrexate [14]
.
This study aimed to detect the genotoxic effects
of MTX on mouse bone marrow cells using
analysis of micronuclei and on DNA using
Nagla El-Alfy et al
505
RAPD-PCR analysis to investigate the
clastogenic and genotoxic effect of methotrexate
in male albino mice even after a low dose and
single treatment.
MATERIALS AND METHODS
Animals- Sixty mature male mice (CD1) of
nearly the same age (16-18 weeks old) with an
average body weight 22-26 g (mean 24 ± 2 g)
were obtained from the closed colony of
Theodor Bilharz Research Institute, Cairo.
They were individually weighed and randomly
assigned to one of four groups. Each group was
consisted of fifteen mice. These animals were
categorized into four groups. One group served
as the control group (injected intraperitonealy
with 0.1 mL distilled water) and the other three
groups (group1, 2 and 3) served as the treated
groups. Mice of groups1, 2 and 3 were treated
intraperitoneally with three different doses of
methotrexate drug (2.5, 5 and 10 mg/kg b.wt.
respectively). The doses were converted from
human dose to mice dose by using multiplication
factors for dose conversion between different
species by Paget & Barnes [15]
. All the control
and treated animals were sacrificed by cervical
dislocation at 24, 48 and 72 hr after treatment
with methotrexate for collection of samples.
Chemicals- The drug used in the present
investigation is methotrexate. MTX produced by
Orion Pharma, Orion Corporation, Espoo,
Finland. Appropriate methtrexate solutions of
different concentrations were prepared by
dilution with distilled water, stored at or below
25°C and protected from light.
Micronucleus test- In the present study
Schmid’s [16]
standard procedure was followed
however with slight modification. Instead of fetal
calf serum, 5% bovine albumin from (National
Research Center, Giza, Egypt) was used as
suspending medium to collect the bone marrow [17]
. Polychromatic erythrocytes (PCEs),
normochromatic erythrocytes (NCEs) and
micronucleated polychromatic erythrocytes
(MNPCEs) were scored manually using a light
microscope with 40X objective and a hand held
counter.
RAPD Profiles and Data Analysis- Mice tail
samples of each group were collected after 24, 48
and 72 hour of methotrexate treatment and their
genomic DNA was extracted from muscle tissues
according to the salt chloroform method of
Lagoda et al. [18]
.
After checking the genomic DNA, each five
DNA samples were mixed in bulked sample [19]
. A set of 7 random primers (10 nucleotides
for each primer) synthesized by Operon
Biotechnologies, Inc. Germany were used in
this study as shown in Table 1. The PCR
mixture and amplification conditions were
prepared according to the method of
Williams et al. [20]
.
Only reproducible and clear amplification bands
were scored. The marked changes observed in
RAPD profiles as disappearance and/or
appearance of bands in comparison with the
untreated control treatments (+/- bands) were
evaluated.
Statistical analysis- The statistical software
package, SPSS for windows version 16.0 was
used for all the statistical analysis. Each treated
group was compared to the control group with
independent samples T- test. Histograms of
cytogenetic data were drawn using Excel 2007.
The result was considered to be significant when
P is less than 0.05 and highly significant when P
is less than 0.001.
RESULTS
Results of micronucleus test: In the present study, 2000 polychromatic
erythrocytes (PCEs) and corresponding
normochromatic erythrocytes (NCEs) were
scored per animal (3 animals for each group =
6000 PCEs) to show the effects of the three
doses of methotrexate drug at 24, 48 and 72 hr
after treatment. The PCEs were stained light blue
to gray and NCEs were stained light pink to light
yellow (Figs. 1-11).
Micronucleus study was conducted based on the
frequency of incidence of micronucleated
polychromatic erythrocytes (MNPCEs) out of the
total 2000 PCEs for each animal. Polychromic
erythrocytes with micronuclei (MNPCEs) had
small nucleus (dark blue in color) as a residual
hereditary material remained after erythropoiesis
process (Figs. 2-10).
The result of polychromic erythrocytes with
micronuclei (MNPCEs) was summarized in
Table 2 as mean ± SD of MNPCEs score for the
control and the three treated groups with 2.5, 5
and 10 mg / kg b.wt. of methotrexate and at 24,
48 and 72 hr post treatment.
Table 2 showed a highly significant increase (p
< 0.001) in the mean of MNPCEs in the three
methotrexate treated groups when compared to
the control group. Also, it showed that after 24 hr
of treatment with 2.5, 5 and 10 mg/kg b.wt.
methotrexate the mean ± SD of MNPCEs was
highly significant (p < 0.001) and increased by
53.5 %, 78.9 % and 84.2 % respectively; more
than that of the control group, then after 48 hr of
treatment with 2.5, 5 and 10 mg/kg b.wt.
methotrexate . MNPCEs mean was highly
An Analysis of Micronuclei and DNA Damage…
506
significant (p < 0.001) increased by 76.6 %,
92.7% and 96.3%, respectively more than that of
the control group. After 72 hr of treatment with
2.5, 5 and 10 mg/kg b.wt. methotrexate, mean ±
SD of MNPCEs was highly significant (p <
0.001) increased by 88.1%, 95.3% and 96.8%,
respectively more than that of the control group.
Cytotoxicity was assessed by measuring the ratio
of total polychromatic erythrocytes (PCEs) to
total normochromatic erythrocytes (PCE / NCE)
of the control and all the treated groups.
According to micronucleus assay protocol, two
thousand polychromatic erythrocytes (PCEs)
were screened manually per animal. The number
of PCEs was 6000 for each group. The number
of corresponding normochromatic erythrocytes
(NCEs) was screened to calculate the ratio of
PCE / NCE for each group. Table 2 showed that
the number of normochromatic erythrocytes
(NCEs) decreased by dose and time in all the
treated groups than the corresponding control
group. The present result of cytotoxicity was
summarized in Table 2 as mean ± SD of PCE /
NCE for the control and all the treated groups.
Table 2 showed a highly significant (p< 0.001)
dose and time dependant increase in cytotoxicity
of bone marrow cells (PCE / NCE ratio) in all the
methotrexate treated groups when compared to
the control group.
24 hr post treatment with 2.5, 5 and 10 mg / kg
b.wt. MTX, the mean of PCE / NCE was highly
significantly (p< 0.001) increased by 3.3 %,
29.09 % and 39.6 % respectively more than that
of the control group. 48 hr post treatment with
2.5, 5 and 10 mg/kg b.wt. methotrexate, the
mean of PCE/NCE ratio was highly significant
(p< 0.001) increased by 17.02 %, 29.5 % and
51.04 % respectively more than that of the
control group. 72 hr post treatment with 2.5, 5
and 10 mg / kg b.wt. methotrexate the mean of
PCE / NCE ratio was highly significant (p<
0.001) increased by 24.5 %, 38.09 % and 57.2 %
respectively more than that of the control group.
The current results indicated that the greater
increase in the bone marrow cytotoxicity (PCE /
NCE ratio) occurred after 72 hour of treatment
with 10 mg / kg b.wt. methotrexate.
Results of randomly amplified polymorphic
DNA (RAPD) analysis: Seven random 10-mer primers were tested to
perform the random amplified polymorphic
DNA-polymerase chain reaction (RAPD-PCR)
analysis to assess the level of DNA damage in
the control and treated mice with 2.5, 5 and 10
mg/kg b.wt. methotrexate. Different ranges of
DNA modifications were observed in the treated
groups in comparison with the control one.
Modifications of the RAPD patterns were due to
structural changes occurred as a result of DNA
damage which induced by methotrexate
treatment. The changes occurred in RAPD
profiles included variation in band density (Bd)
as well as gain of new bands (+) and/or loss of
normal bands (-) following methotrexate
treatment.
Only three primers (primer OPA-07, primer
OPA-10 and primer OPC-07) were most
informative and they produced the most
distinguishable banding profiles between the
amplified samples of each group after RAPD
assays was shown in figs. 11-13.
The maximum number of bands observed was
eight by primer OPA-07, ten by primer OPA-10
and eight by primer OPC-07. The molecular size
of PCR products generated by the three primers
(primer OPA-07, primer OPA-10 and primer
OPC-07) ranged from 187 to 997 bp, 186 to 1254
bp. and 175 to 1026 bp respectively.
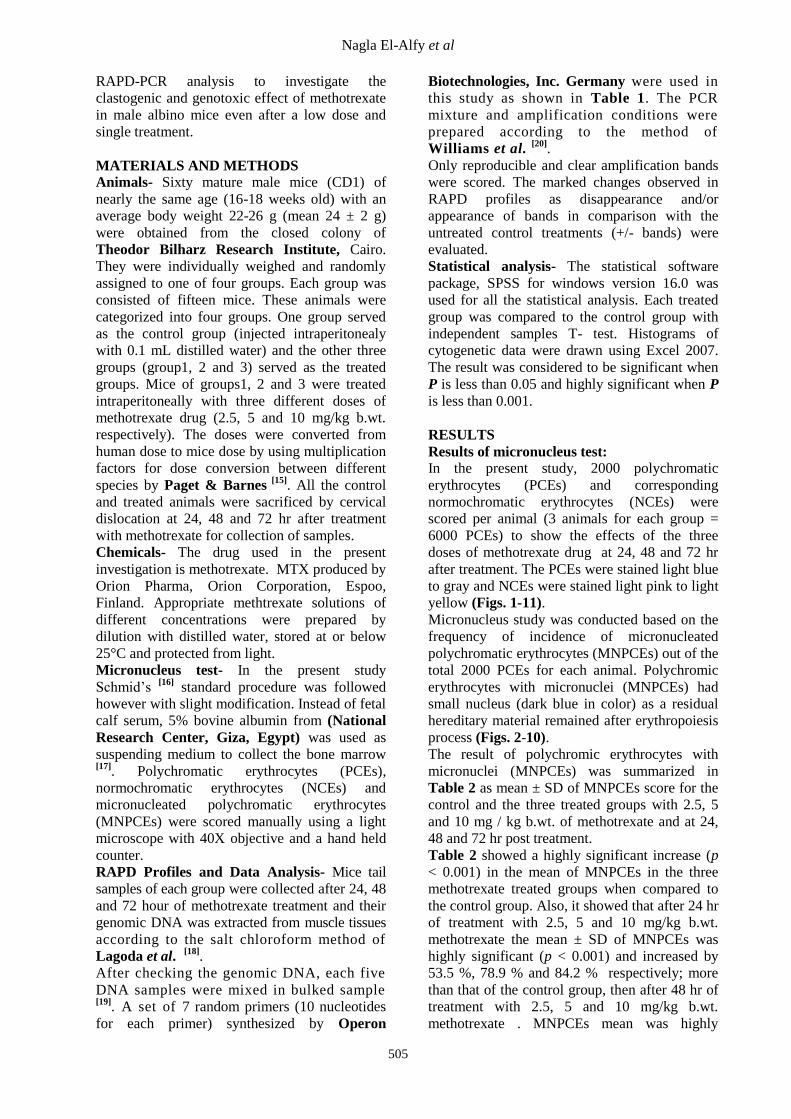
As shown in fig. 11 (primer OPA-07), there were
no common bands between the control and
treated samples of Mus musculus; while the
characteristic individual bands were that of
relative front (Rf) 0.856 with molecular size
(MS) 187 bp for the control group and that of R f
0.716 with MS 487 bp for the group 1 (after 24
hr of treatment with 2.5 mg/kg b.wt.
methotrexate). The number of bands differed
from the control to the treaded samples (3, 3, 4,
5, 3, 3, 3, 3, 3 and 5) for the control, group 1
after 24 hr of treatment, group 1 after 48 hr of
treatment, group 1 after 72 hr of treatment, group
2 after 24 hr of treatment, group2 after 48 hr of
treatment, group 2 after 72 hr of treatment, group
3 after 24 hr of treatment, group 3 after 48 hr of
treatment and group 3 after 72 hr of treatment
respectively.
As shown in fig. 12 (primer OPA-10), there was
one common band between the control and the
MTX-treated samples of Mus musculus with Rf
0.575 against MS of 397 bp; while the
characteristic individual bands were that of Rf
0.508 with MS 537 bp for the control, Rf 0.373
with MS 994 bp for the group 1 after 24 hr of
treatment, Rf 0.44 with MS 732 bp and Rf 0.746
with MS 186 bp for the group 3 after 48 hr of
treatment. The number of bands differed from
the control to the treaded samples (5, 4, 4, 3, 3, 2,
2, 3, 3 and 2) for the control group, group1 after
24 hr of treatment, group 1 after 48 hr of
treatment, group 1 after 72 hr of treatment ,group
2 after 24 hr of treatment, group 2 after 48 hr of
treatment, group 2 after 72 hr of treatment, group
3 after 24 hr of treatment, group 3 after 48 hr of
Nagla El-Alfy et al
507
treatment and group 3 after 72 hr of treatment
respectively.
As shown in fig. 13 (primer OPC-07), there was
no common band between the control and the
MTX-treated samples of Mus musculus; while
the characteristic individual bands were that of
Rf 0.621 with MS 1026 bp for group 2 after 48
hr of treatment, Rf 0.643 with MS 932 bp for the
group 3 after 48 hr of treatment, Rf 0.73 with MS
626 bp and Rf 0.776 with MS 499 bp for the
group 3 after 48 hr of treatment. The number of
bands differed from the control to the treated
samples (2, 3, 2, 2, 0, 2, 0, 0, 5 and 1) for the
control, group1 after 24 hr of treatment, group 1
after 48 hr of treatment, group 1 after 72 hr of
treatment, group 2 after 24 hr of treatment, group
2 after 48 hr of treatment, group 2 after 72 hr of
treatment, group 3 after 24 hr of treatment, group
3 after 48 hr of treatment and group 3 after 72 hr
of treatment respectively.
DISCUSSIONS
Results of the current study showed a highly
significant increase (p< 0.001) in the mean of
micronucleated polychromatic erythrocytes
(MNPCEs) in all the three treated groups with
methotrexate when compared to the control
group.
The present investigation was confirmed by
following data from literature. Methotrexate
produced a significant genetic damage which
was proved by the increased incidence of
chromosomal aberration and micronuclei
formation in human as well as in animal model [21]
. Significantly higher micronuclei frequencies
in patients with acute lymphoblastic leukemia
after the treatment with anti-leukemic agent
(vincristine, methotrexate, daunomycine,
prednisone and asparaginase) were reported by
Acar et al. [22]
. The previous result of Novakovic
et al. [23]
suggested that intratumoral application
of methotrexate therapy by using sub
endometrial injection into the myoma in patients
with myoma uteri significantly increased the
frequency of micronuclei in human peripheral
blood lymphocytes.
The present study indicated that even after a low
dose single treatment, methotrexate induced
statistically significant (P>0.001) increase in the
mean of micronucleated polychromatic
erythrocytes (MNPCE) in bone marrow of the
treated mice when compared to that of the
control group. This finding disagreed with the
results of Kasahara et al. [24]
who considered
methotrexate as a weak inducer of MN and
indicated that level of micronuclei and
chromosomal aberrations in mice bone marrow
cells was far higher after multiple treatments
than in single MTX treatments.
The current results of cytotoxicity test showed
also that there was a highly significant dose and
time dependant increase (p < 0.001) in the
erythropoietic cytotoxicity (PCE / NCE ratio) in
all the three treated groups with methotrexate
when compared to the control group. Suzuki et
al. [25]
reported that evaluation of erythropoietic
cytotoxicity was a key component of safety
assessment in new drug development and
polychromatic erythrocyte (PCE) counts in
peripheral blood were the most popular and
convenient method of monitoring erythropoiesis.
The occurrence of fewer immature erythrocytes
(PCE) relative mature or normochromatic
erythrocytes (NCE) was considered to be an
indicator of mutagen induced cytotoxicity.
The present result of bone marrow cytotoxicity
showed that at 72 hr post treatment with 2.5, 5
and 10 mg / kg b.wt. methotrexate, the mean of
PCE / NCE ratio (1.55, 1.89 and 2.74) was
highly significantly (p< 0.001) increased by 24.5
%, 38.09 % and 57.2 % respectively more than
that of the control group (1.17).
This finding is confirmed by Kojima et al. [26]
who observed a decrease in the haemoglobin
concentration, haematocrit and mature
erythrocyte count in both male and female rats
which received oral dose (0.45 mg / kg) of
methotrexate. Chan and Cronstein [27]
confirmed also that the anti-proliferative effects
of methotrexate were sufficient to explain many
side effects of MTX such as bone marrow cells
suppression, alopecia and stomatitis. Shimadaa
et al. [28]
reported that erythrocytes with
micronuclei were captured and destroyed by the
spleen quickly.
In the present study, different ranges of DNA
modifications were observed in the methotrexate
treated groups in comparison with the control
one by using RAPD technique. Swaileh et al. [29]
reported that randomly amplified polymorphic
DNA (RAPD) analysis was a rapid and sensitive
technique and applicable to any organism
without prior information of the nucleotide
sequence used for the genetic characterization of
populations, evolutionary studies and the
detection of genetic alterations and instability.
The present investigation clearly demonstrated
that methotrexate had a very lethal effect on
DNA content of cells of the treated mice. This
result is in accordance with that of Rawtani and
Agrawal [30]
who reported that methotrexate had
a direct or indirect effect on various molecular
targets which influenced DNA replication and
An Analysis of Micronuclei and DNA Damage…
508
cell proliferation by integrating between the
spaces between adjacent
Also, Lee et al. [31]
used reverse transcription
polymerase chain reaction (RT-PCR); the results
showed that GART, HPRT1, TYMS, and CTPS
genes (important purine and pyrimidine
biosynthesis-related genes) altered their
expression levels by methotrexate. Alteration of
these genes might lead to methotrexate-induced
teratogenicity, which caused by imbalance of
nucleotide biosynthesis.
The present result confirmed that of Aggarwal et
al. [32]
which indicated that methotrexate is a folic
acid analog with an amino group substituted for
the hydroxyl group at the C4 position on the
pyridine ring. The structural similarity of MTX
with folic acid helped it to compete with the
normal substrate folic acid for the binding site on
the dihydrofolate reductase (DHFR) which is the
key enzyme involved in the synthesis of essential
DNA precursors like thymidylates and purines,
then inhibition of DHFR led to an imbalance in
the nucleotide pools and thereby perturbed the
DNA synthesis.
The present investigation showed that the
changes occurred in RAPD patterns of the
control and the methotrexate treated groups as a
result of DNA damage followed methotrexate
treatment included variation in band density (Bd)
as well as gain of new bands (+) and / or loss of
normal bands (-).
These findings were explained by Liu et al. [33]
who suggested that lost bands were likely to be
due to one or a combination of the following
events: (1) changes in oligonucleotide priming
sites due mainly to genomic rearrangements and
less likely to point mutations; (2) DNA damage
in the primer binding sites; and (3) interactions
of DNA polymerase in the test organism with
damaged DNA. On the other hand, the
appearance of new DNA bands occurred because
some oligonucleotide priming sites could
become accessible to oligonucleotide primers
after structural changes or because some changes
in the DNA sequence have occurred due to
mutations, large deletions, and / or homologous
recombination [34]
.
In the present study, RAPD profiles showed
marked variations between the control and the
methotrexate treated mice with apparent changes
in the number and size of amplified DNA
fragments for different primers. The number of
bands generated by using the three primers
(OPA-07, OPA-20 and OPC-07) differed from
the control to the treaded samples.
The changes in the number of DNA bands in the
RAPD-PCR profiles were associated with
alterations of genetic material which caused by
methotrexate treatment which might be due to
different types of mutations including
rearrangements, additions or deletions that occur
in the DNA region of amplification in sequences
flanked by the priming sites or within the
priming site itself [35]
. Comet assay results of the
study of El-Alfy et al. [36]
showed a highly
significant increase (p < 0.001) in the mean ± SD
of DNA damage in all three treated groups at 72
hr of administration of methotrexate and also in
group 3 of mice treated with 10 mg/kg
methotrexate at 24 and 48 hr administration as
compared to controls. In conclusion, results of
the present study indicated that methotrexate is
highly clastogenic and cytotoxic as it induced
clear harmful damage on bone marrow cells and
DNA content of male albino mice even after a
low dose and single treatment. Therefore, the
therapeutic uses of methotrexate should be
restricted to the least possible number of patients.
The supplementation with folic acid in
methotrexate treated patients may help to
minimize its genotoxicity.
REFERENCES 1. Arnon J, Meirow D, Roness HL and Ornoy A
(2001): Genetic and teratogenic effects of cancer
treatments on gametes and embryos. Hum. Reprod.,
Update 7(4): 394–403.
2. Peters GJ, Van der Wilt CL, Van Moorsel CJ,
Kroep JR, Bergman AM and Ackland SP (2000):
Basis for effective combination cancer chemotherapy
with antimetabolites. Pharmacol. Ther., 87(2-3):227–
253.
3. Jensen SB, Mouridsen HT, Reibel J, Brunner
N and Nauntofte B (2008): Adjuvant chemotherapy
in breast cancer patients induces temporary salivary
gland hypofunction. Oral Oncol., 44(2):162–173.
4. Wong PT and Choi SK (2015): Mechanisms and
implications of dual-acting methotrexate in folate-
targeted nanotherapeutic delivery. Int. J. Mol. Sci.,
16(1): 1772-1790.
5. Novakovic T, Dordevic OM, Grujicic D,
Marinkovic D, Jankovic S and Arsenijevic S
(2003): Effect of intratumoral application of
methotrexate in vivo on frequency of micronuclei in
peripheral blood lymphocytes. Arch. Oncol., 11(1):1–
4.
6. Tian H and Cronstein BN (2007):
Understanding the mechanisms of action of
methotrexate: implications for the treatment of
rheumatoid arthritis. Bull. NYU Hosp. Jt. Dis. 65(3):
168-173.
7. Choudhury RC, Ghosh SK and Palo AK
(2000): Cytogenetic toxicity of methotrexate in
mouse bone marrow. Environ. Toxicol. Pharmacol.,
8(3): 191-96.
8. Yamamoto KI and Kikuchi Y (1981): Studies
on micronuclei time response and on the effects of
Nagla El-Alfy et al
509
multiple treatments of mutagens on induction of
micronuclei. Mutation Res., 90(2): 163–173.
9. Hayashi M, Sofuni T and Morita T (1991):
Simulation study of the effects of multiple treatments
in the mouse bone marrow micronucleus test. Mutat.
Res., 252(3): 281-287.
10. Goodman TA and Polisson RP (1994):
Methotrexate: adverse reactions and major toxicities.
Rheum. Dis. Clin. North Am., 20(2): 513-528.
11. Dadhania VP, Tripathi DN, Vikram A,
Ramarao P and Jena GB (2010): Intervention of α-
lipoic acid ameliorates methotrexate-induced
oxidative stress and genotoxicity: a study in rat
intestine. Chem. Biol. Interact., 183(1): 85-97.
12. Padmanabhan S, Tripathi DN, Vikram, A,
Ramarao P and Jena GB (2009): Methotrexate-
induced cytotoxicity and genotoxicity in germ cells of
mice:Intervention of folic and folinic acid. Mutat.
Res., 673(1):43–52.
13. Del Campo M, Kosaki K, Bennett FC and
Jones KL (1999): Developmental delay in fetal
aminopterin / methotrexate syndrome. Teratology,
60(1): 10–12.
14. Belur LR, James RI, May C, Diers MD,
Swanson D, Gunther R and McIvor RS (2005):
Methotrexate preconditioning allows sufficient
engraftment to confer drug resistance in mice
transplanted with marrow expressing drug-resistant
dihydrofolate reductase activity. J. Pharmacol. Exp.
Ther., 314(2): 668-674.
15. Paget GE and Barnes JM (1964): Interspecies
dosage conversion scheme in evaluation of results and
quantitative application in different species. In:
Evaluation of drug activities, pharmacometrics, Eds.,
Academic Press, London and New York, pp: 160-162.
16. Schmid W (1976): The micronucleus test for
cytogenetic analysis. In: Hallaender A (Ed).In:
Chemical Mutagens, Principles and Methods for their
Detection. Plenum Press: New York.pp: 4:31- 53.
17. Narayan K, D’Souza UJ and Rao KPS (2002):
The genotoxic and cytotoxic effects of ribavirin in rat
bone marrow. Mutat. Res., 521(1-2): 179-85.
18. Lagoda PJL, Seitz JT, Epplen AW and
Issinger OG (1989): Increased detectability of
somatic changes in the DNA from human tumors after
probing with “synthetic” and “genome-derived”
hypervariable multilocusprobes. Hum. Genet., 84(1):
35-38.
19. Lukyanov KA, Matz M, Bogdanova E,
Gurskaya NG and Lukyanov SA (1996): Molecule
by molecule PCR amplification of complex DNA
mixtures for direct sequencing: an approach to in vitro
cloning. Nucleic Acids Research, 24(11): 2194-2195.
20. Williams JG, Kubelik AR, Livak KJ, Rafalsky
JA and Tingey SV (1990): DNA polymorphisms
amplified by arbitrary primers are useful genetic
markers. Nucleic Acids Res., 18(22):6531-6535.
21. Shahin AA, Ismail MM, Saleh AM, Moustafa
HA, Aboul-Ella AA and Gabr HM (2001):
Protective effect of folinic acid on low-dose
methotrexate genotoxicity. Z. Rheumatol., 60(2): 63-
68.
22. Acar H, Caliskan U, Demirel S and
Largaespada DA (2001): Micronucleus incidence
and their chromosomal origin related to therapy in
acute lymphoblastic leukemia (ALL) patients:
detection by micronucleus and FISH techniques.
Teratog. Carcinog. Mutagen., 21(5):341-7.
23. Novakovic T, Dordevic OM, Grujicic D,
Marinkovic D, Jankovic S and Arsenijevic S
(2003): Effect of intratumoral application of
methotrexate in vivo on frequency of micronuclei in
peripheral blood lymphocytes. Arch. Oncol., 11(1):1–
4.
24. Kasahara Y, Nakai Y, Miura D, Yagi K,
Hirabayashi K and Makita T (1992): Mechanism of
induction of micronuclei and chromosome aberrations
in mouse bone marrow by multiple treatment of
methotrexate. Mutat. Res., 280(2): 117-128.
25. Suzuki Y, Nagae Y, Li J, Sakaba H, Mozawa
K, Takahashi A, Shimizu H (1989): The
micronucleus test and erythropoiesis: effects of
erythropoietin and a mutagen on the ratio of
polychromatic to normochromatic erythrocytes (P / N
ratio). Mutagenesis, 4(6):420-424.
26. Kojima S, Yoshida T, Sasaki J, Takahashi
N, Kuwahara M, Shutoh Y, Saka M, Nakashima
N, Kosaka T and Harada T (2012): Induction of
hyperchromic microcytic anaemia by repeated oral
administration of methotrexate in rats. J. Toxicol.
Sci., 37(5):957-68.
27. Chan ES and Cronstein BN (2013):
Mechanisms of action of methotrexate. Bull. Hosp. J.
Dis., 71:5-8.
28. Shimadaa K, Yamamotoa M, Takashimaa M,
Wakob Y, Kawasakob K, Aokia Y, Sekia J,
Miyamaea Y and Wakata A (2014): Repeated dose
liver micronucleus assay of mitomycin C in young
adult rats. Mutat. Res., Genetic Toxicology and
Environmental Mutagenesis, 780-781:85-89.
29. Swaileh KM, Barakat SO and Hussein RM
(2013): RAPD assessment of in vivo induced
genotoxicity of raw and treated waste water to Albino
rat. Bull. Environ. Contam. Toxicol., 90(5): 621-625.
30. Rawtani D and Agrawal YK (2014): Interaction
of methotrexate with DNA using gold nanoparticles
as a probe. Instrumentation Science and Technology,
42(3): 308-319.
31. Lee J Kim YJ and Ryu JC (2010): Study on
teratogenic effects of methotrexate; Alteration of gene
expression pattern in human placenta
choriocarcinoma (JEG-3) cells. Biochip J., 4(3): 189-
196.
32. Aggarwal P, Naik S, Mishra KP, Aggarwal A
and Misra R (2006): Correlation between
methotrexate efficacy&toxicity with C677T
polymorphism of themethylenetetrahydrofolate gene
in rheumatoid arthritis patients on folate
supplementation. Indian J. Med. Res., 124(5): 521–
526.
33. Liu W, Li P, Qi X, Zhou Q, Sun T and Yang Y
(2005): DNA changes in barley (Hordeum vulgare)
seedlings induced by cadmium pollution using RAPD
analysis. Chemosphere, 61(2):158–167.

An Analysis of Micronuclei and DNA Damage…
510
34. Atienzar FA, Cordi B and Evenden AJ (1999):
Qualitative assessment of genotoxicity using random
amplified polymorphic DNA: comparison of genomic
template stability with key fitness parameters in
Daphnia magna exposed to benzo[a] pyrene. Environ.
Toxicol. Chem., 18(10):2275–2282.
35. Williams JG, Kubelik AR, Livak KJ, Rafalsky
JA and Tingey SV (1990): DNA polymorphisms
amplified by arbitrary primers are useful genetic
markers. Nucleic Acids Res., 18(22):6531-6535.
36. El–Alfy NZ, Mahmoud MF, Alqosaibi AI and
El-Ashry SR (2016): Genotoxic Effect of
Methotrexate on Bone Marrow Chromosomes and
DNA of Male Albino Mice (Mus musculus). The
Egyptian Journal of Hospital Medicine, 64:350-363.
Table 1- List of primers code and sequences.
Table 2- The mean and standard deviation of polychromatic erythrocytes (PCEs), micronucleated
polychromatic erythrocytes (MNPCEs), normochromatic erythrocytes (NCEs) and cytotoxicity in bone
marrow of male albino mice Mus musculus of the control group and treated groups.
* Significant (P < 0.05)
** Highly significant (P < 0.001)
Primer code Primer sequence
OP-A07 GAAACGGGTG
OP-A10 GTGATCGCAG
OP-A14 TCTGTGCTGG
OP-B20 GGACCCTTAC
OP-C05 GATGACCGCC
OP-C07 GTCCCGACGA
OP-E07 AGATGCAGCC
Nagla El-Alfy et al
511
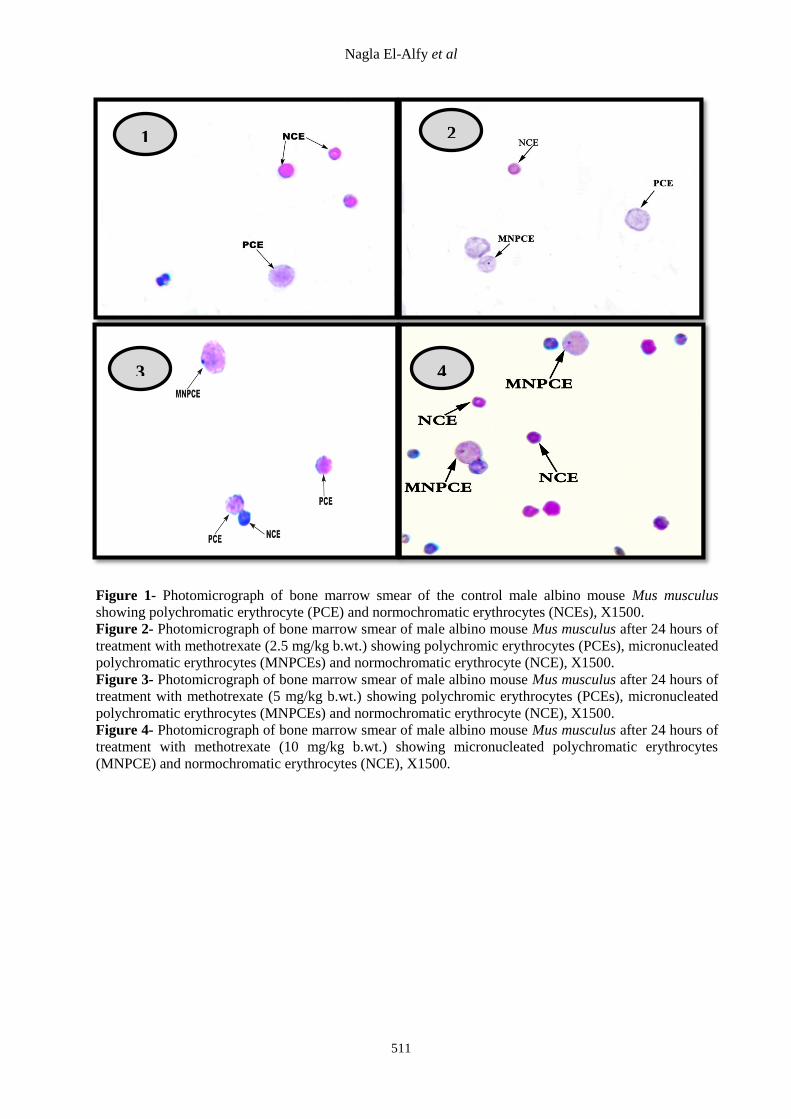
Figure 1- Photomicrograph of bone marrow smear of the control male albino mouse Mus musculus
showing polychromatic erythrocyte (PCE) and normochromatic erythrocytes (NCEs), X1500.
Figure 2- Photomicrograph of bone marrow smear of male albino mouse Mus musculus after 24 hours of
treatment with methotrexate (2.5 mg/kg b.wt.) showing polychromic erythrocytes (PCEs), micronucleated
polychromatic erythrocytes (MNPCEs) and normochromatic erythrocyte (NCE), X1500.
Figure 3- Photomicrograph of bone marrow smear of male albino mouse Mus musculus after 24 hours of
treatment with methotrexate (5 mg/kg b.wt.) showing polychromic erythrocytes (PCEs), micronucleated
polychromatic erythrocytes (MNPCEs) and normochromatic erythrocyte (NCE), X1500.
Figure 4- Photomicrograph of bone marrow smear of male albino mouse Mus musculus after 24 hours of
treatment with methotrexate (10 mg/kg b.wt.) showing micronucleated polychromatic erythrocytes
(MNPCE) and normochromatic erythrocytes (NCE), X1500.
2
3 4
1
1 2
An Analysis of Micronuclei and DNA Damage…
512
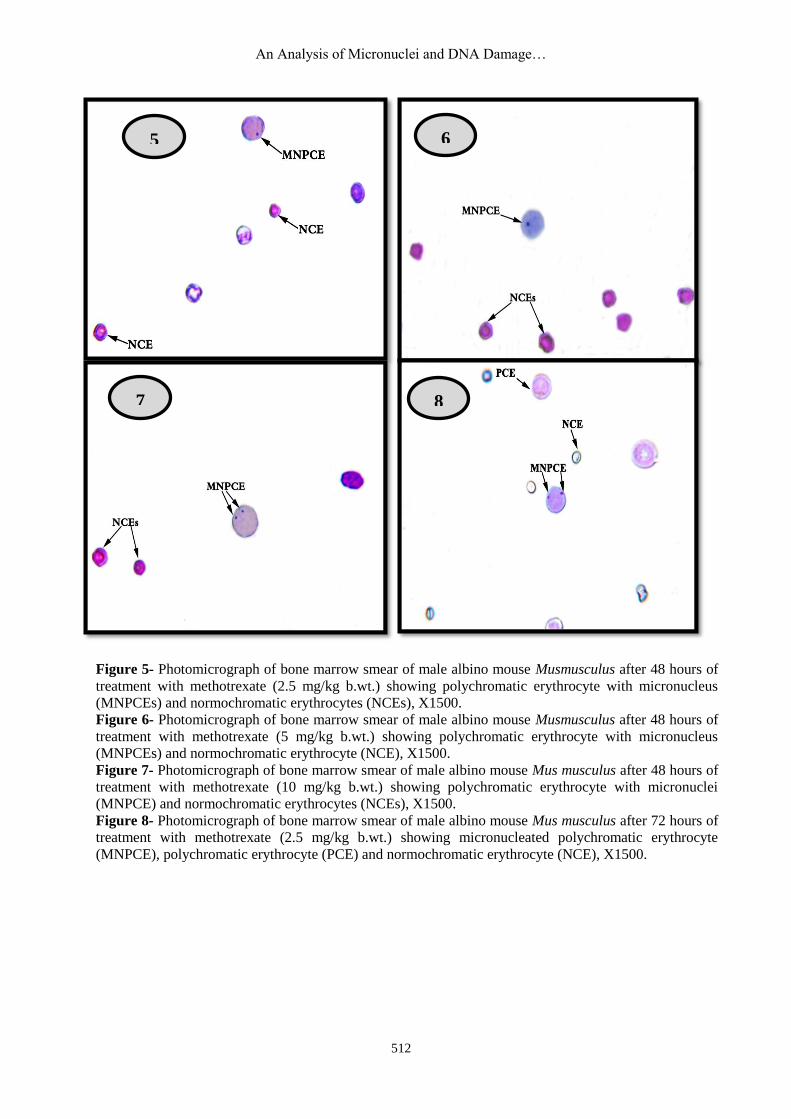
Figure 5- Photomicrograph of bone marrow smear of male albino mouse Musmusculus after 48 hours of
treatment with methotrexate (2.5 mg/kg b.wt.) showing polychromatic erythrocyte with micronucleus
(MNPCEs) and normochromatic erythrocytes (NCEs), X1500.
Figure 6- Photomicrograph of bone marrow smear of male albino mouse Musmusculus after 48 hours of
treatment with methotrexate (5 mg/kg b.wt.) showing polychromatic erythrocyte with micronucleus
(MNPCEs) and normochromatic erythrocyte (NCE), X1500.
Figure 7- Photomicrograph of bone marrow smear of male albino mouse Mus musculus after 48 hours of
treatment with methotrexate (10 mg/kg b.wt.) showing polychromatic erythrocyte with micronuclei
(MNPCE) and normochromatic erythrocytes (NCEs), X1500.
Figure 8- Photomicrograph of bone marrow smear of male albino mouse Mus musculus after 72 hours of
treatment with methotrexate (2.5 mg/kg b.wt.) showing micronucleated polychromatic erythrocyte
(MNPCE), polychromatic erythrocyte (PCE) and normochromatic erythrocyte (NCE), X1500.
6 5
8
5 6
7
Nagla El-Alfy et al
513
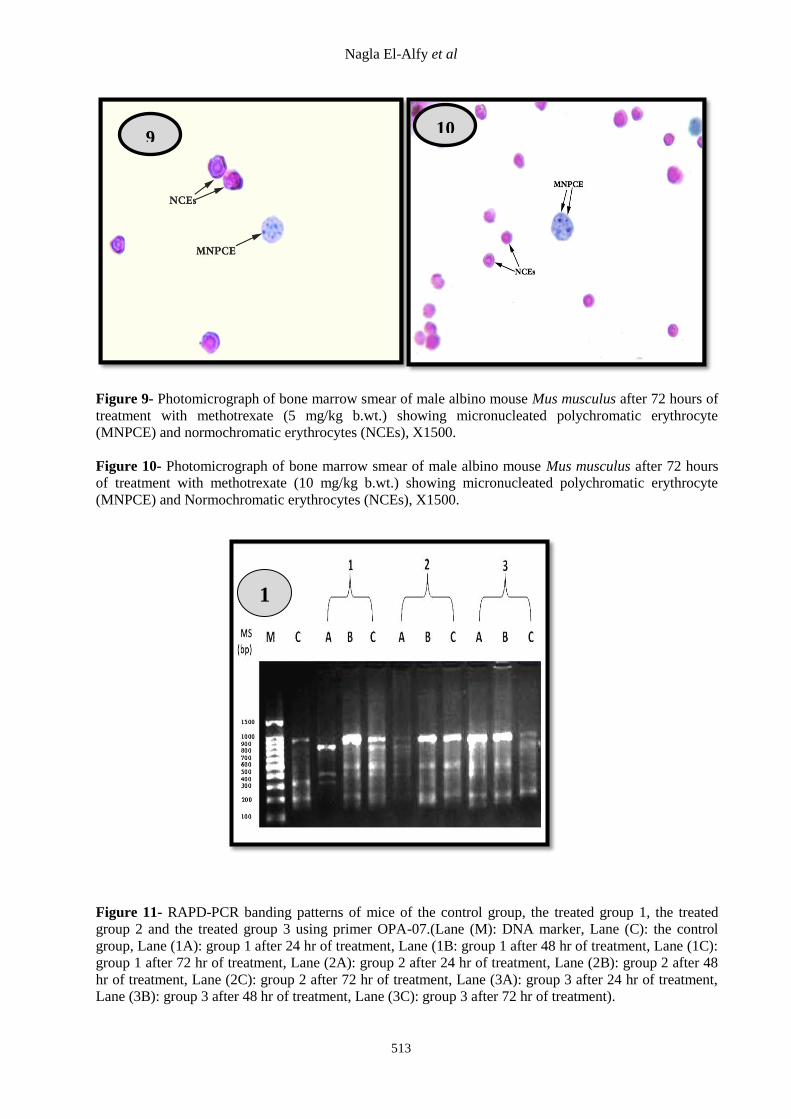
Figure 9- Photomicrograph of bone marrow smear of male albino mouse Mus musculus after 72 hours of
treatment with methotrexate (5 mg/kg b.wt.) showing micronucleated polychromatic erythrocyte
(MNPCE) and normochromatic erythrocytes (NCEs), X1500.
Figure 10- Photomicrograph of bone marrow smear of male albino mouse Mus musculus after 72 hours
of treatment with methotrexate (10 mg/kg b.wt.) showing micronucleated polychromatic erythrocyte
(MNPCE) and Normochromatic erythrocytes (NCEs), X1500.
Figure 11- RAPD-PCR banding patterns of mice of the control group, the treated group 1, the treated
group 2 and the treated group 3 using primer OPA-07.(Lane (M): DNA marker, Lane (C): the control
group, Lane (1A): group 1 after 24 hr of treatment, Lane (1B: group 1 after 48 hr of treatment, Lane (1C):
group 1 after 72 hr of treatment, Lane (2A): group 2 after 24 hr of treatment, Lane (2B): group 2 after 48
hr of treatment, Lane (2C): group 2 after 72 hr of treatment, Lane (3A): group 3 after 24 hr of treatment,
Lane (3B): group 3 after 48 hr of treatment, Lane (3C): group 3 after 72 hr of treatment).
10
1
1
9
An Analysis of Micronuclei and DNA Damage…
514
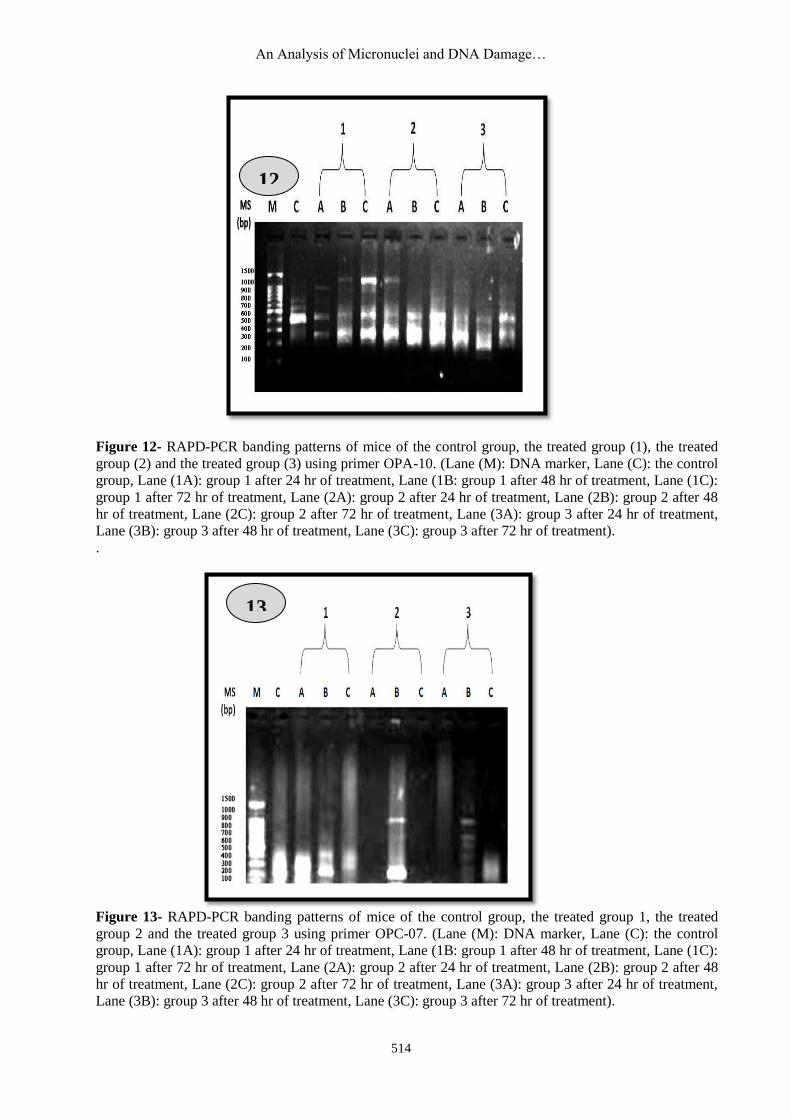
Figure 12- RAPD-PCR banding patterns of mice of the control group, the treated group (1), the treated
group (2) and the treated group (3) using primer OPA-10. (Lane (M): DNA marker, Lane (C): the control
group, Lane (1A): group 1 after 24 hr of treatment, Lane (1B: group 1 after 48 hr of treatment, Lane (1C):
group 1 after 72 hr of treatment, Lane (2A): group 2 after 24 hr of treatment, Lane (2B): group 2 after 48
hr of treatment, Lane (2C): group 2 after 72 hr of treatment, Lane (3A): group 3 after 24 hr of treatment,
Lane (3B): group 3 after 48 hr of treatment, Lane (3C): group 3 after 72 hr of treatment).
.
Figure 13- RAPD-PCR banding patterns of mice of the control group, the treated group 1, the treated
group 2 and the treated group 3 using primer OPC-07. (Lane (M): DNA marker, Lane (C): the control
group, Lane (1A): group 1 after 24 hr of treatment, Lane (1B: group 1 after 48 hr of treatment, Lane (1C):
group 1 after 72 hr of treatment, Lane (2A): group 2 after 24 hr of treatment, Lane (2B): group 2 after 48
hr of treatment, Lane (2C): group 2 after 72 hr of treatment, Lane (3A): group 3 after 24 hr of treatment,
Lane (3B): group 3 after 48 hr of treatment, Lane (3C): group 3 after 72 hr of treatment).
12
13
Copyright © 2022 FDOKUMEN