In-depth clinical and biological exploration of DNA Damage ...
45
In-depth clinical and biological exploration of DNA Damage Immune Response (DDIR) as a 1 biomarker for oxaliplatin use in colorectal cancer 2 3 Malla SB* 1 , Fisher DJ* 2 , Domingo E* 3 , Blake A* 3 , Hassanieh S 3 , Redmond KL 1 , Richman 4 SD 4 , Youdell M 3 , Walker SM 11 , Logan GE 11 , Chatzipli A 5 , Amirkhah R 1 , Humphries MP 1 , Craig 5 SG 1 , McDermott U 5,6 , Seymour M 7 , Morton D 8 , Quirke P 5 , West NP 5 , Salto-Tellez M 1 , 6 Kennedy R 1 , Johnston PG 1 , Tomlinson I 9 , Koelzer VH 10 , Campo L 3 , Kaplan R 2 , Longley D 1 , 7 Lawler M 1 , Maughan TS* 3 , Brown LC* 2 , Dunne PD* 1 and on behalf of the S:CORT 8 consortium. 9 10 Affiliations: 11 1. Patrick G Johnston Centre for Cancer Research, Queen’s University Belfast, UK 12 2. MRC Clinical Trials Unit at University College London, UK 13 3. MRC Oxford Institute for Radiation Oncology, University of Oxford, UK 14 4. Pathology and data analytics, School of Medicine, University of Leeds, UK 15 5. Cancer, Ageing and Somatic Mutation (CASM), Wellcome Sanger Institute, Cambridge, UK 16 6. AstraZeneca, UK 17 7. St James's University Hospital, Leeds, UK 18 8. University of Birmingham, UK 19 9. University of Edinburgh, UK 20 10. University of Zurich, Switzerland 21 11. Almac Diagnostic Services, Craigavon, UK 22 23 * Denotes equal contribution 24 25 26 Running title: DDIR signalling in colorectal cancer 27 28 Keywords: Colorectal cancer, DNA damage response, immune-oncology, bioinformatics, 29 molecular pathology 30 31 Financial support: Sample collection for FOxTROT was funded by Yorkshire Cancer Research. 32 S:CORT is funded by a UK Medical Research Council (MRC) Stratified Medicine Consortium 33 programme grant (MR/M016587/1). This work was supported by a Cancer Research UK 34 programme grant (Dunne, Longley, Johnston; C212/A13721). 35 36 Corresponding author details: Tim Maughan 37 38 Conflicts of interest: ML had received honoraria from Pfizer, EMD Serono and Roche for 39 presentations unrelated to this work. ML is supported by an unrestricted educational grant 40 from Pfizer for research unrelated to this work. PQ is in receipt of research funding from 41 Roche unrelated to this work and lecture fees or advisory boards from Roche, Bayer and 42 Amgen. TM had received Honoraria from Array Biopharma, for advice and research funding 43 from AstraZeneca, Merckgroup and Psioxus unrelated to this work. 44 45
-
Upload
khangminh22 -
Category
Documents
-
view
2 -
download
0
Transcript of In-depth clinical and biological exploration of DNA Damage ...

In-depth clinical and biological exploration of DNA Damage Immune Response (DDIR) as a 1 biomarker for oxaliplatin use in colorectal cancer 2 3 Malla SB*1, Fisher DJ*2, Domingo E*3, Blake A*3, Hassanieh S3, Redmond KL1, Richman 4 SD4, Youdell M3, Walker SM11, Logan GE11, Chatzipli A 5, Amirkhah R1, Humphries MP1, Craig 5 SG1, McDermott U5,6, Seymour M7, Morton D8, Quirke P5, West NP5, Salto-Tellez M1, 6 Kennedy R1, Johnston PG1, Tomlinson I9, Koelzer VH10, Campo L3, Kaplan R2, Longley D1, 7 Lawler M1, Maughan TS*3, Brown LC*2, Dunne PD*1 and on behalf of the S:CORT 8 consortium. 9 10
Affiliations: 11
1. Patrick G Johnston Centre for Cancer Research, Queen’s University Belfast, UK 12 2. MRC Clinical Trials Unit at University College London, UK 13 3. MRC Oxford Institute for Radiation Oncology, University of Oxford, UK 14 4. Pathology and data analytics, School of Medicine, University of Leeds, UK 15 5. Cancer, Ageing and Somatic Mutation (CASM), Wellcome Sanger Institute, Cambridge, UK 16 6. AstraZeneca, UK 17 7. St James's University Hospital, Leeds, UK 18 8. University of Birmingham, UK 19 9. University of Edinburgh, UK 20 10. University of Zurich, Switzerland 21 11. Almac Diagnostic Services, Craigavon, UK 22
23 * Denotes equal contribution 24 25 26 Running title: DDIR signalling in colorectal cancer 27 28 Keywords: Colorectal cancer, DNA damage response, immune-oncology, bioinformatics, 29 molecular pathology 30 31 Financial support: Sample collection for FOxTROT was funded by Yorkshire Cancer Research. 32 S:CORT is funded by a UK Medical Research Council (MRC) Stratified Medicine Consortium 33 programme grant (MR/M016587/1). This work was supported by a Cancer Research UK 34 programme grant (Dunne, Longley, Johnston; C212/A13721). 35 36 Corresponding author details: Tim Maughan 37 38 Conflicts of interest: ML had received honoraria from Pfizer, EMD Serono and Roche for 39 presentations unrelated to this work. ML is supported by an unrestricted educational grant 40 from Pfizer for research unrelated to this work. PQ is in receipt of research funding from 41 Roche unrelated to this work and lecture fees or advisory boards from Roche, Bayer and 42 Amgen. TM had received Honoraria from Array Biopharma, for advice and research funding 43 from AstraZeneca, Merckgroup and Psioxus unrelated to this work. 44 45

Abstract 46
Purpose: The DNA Damage Immune Response (DDIR) assay was developed in breast cancer 47
(BC) based on biology associated with deficiencies in homologous recombination and 48
Fanconi Anemia (HR/FA) pathways. A positive DDIR call identifies patients likely to respond 49
to platinum-based chemotherapies in breast and oesophageal cancers. In colorectal cancer 50
(CRC) there is currently no biomarker to predict response to oxaliplatin. We tested the 51
ability of the DDIR assay to predict response to oxaliplatin-based chemotherapy in CRC and 52
characterised the biology in DDIR-positive CRC. 53
Methods: Samples and clinical data were assessed according to DDIR status from patients 54
who received either 5FU or FOLFOX within the FOCUS trial (n=361, stage 4), or neo-adjuvant 55
FOLFOX in the FOxTROT trial (n=97, stage 2/3). Whole transcriptome, mutation and 56
immunohistochemistry data of these samples were used to interrogate the biology of DDIR 57
in CRC. 58
Results: Contrary to our hypothesis, DDIR negative patients displayed a trend towards 59
improved outcome for oxaliplatin-based chemotherapy compared to DDIR positive patients. 60
DDIR positivity was associated with Microsatellite Instability (MSI) and Colorectal Molecular 61
Subtype 1 (CMS1). Refinement of the DDIR signature, based on overlapping interferon-62
related chemokine signalling associated with DDIR positivity across CRC and BC cohorts, 63
further confirmed that the DDIR assay did not have predictive value for oxaliplatin-based 64
chemotherapy in CRC. 65
Conclusions: DDIR positivity does not predict improved response following oxaliplatin 66
treatment in CRC. However, data presented here suggests the potential of the DDIR assay in 67
identifying immune-rich tumours that may benefit from immune checkpoint blockade, 68
beyond current use of MSI status. 69

Introduction 70
71
Colorectal cancer (CRC) is the fourth most common cancer and the second most common 72
cause of cancer related death in the UK (1). CRC diagnostic classification relies on the WHO 73
classification and the tumour-node-metastasis (TNM) staging system. While histological 74
assessment provides valuable prognostic information, it cannot identify specific patient 75
subgroups within tumour type, grade or clinical stage that respond best to chemotherapy. 76
Despite advances in treatment regimens, 5-year overall survival (OS) rates in the 77
unresectable metastatic setting remain at 10% (2). In patients with stage III or histologically 78
high-risk stage II tumours, recurrence is seen in 45% and 16% of patients respectively, 79
following surgery and adjuvant 5-FU based chemotherapy (2). The addition of oxaliplatin to 80
5-FU based regimens has led to a 20% risk reduction in OS following surgery for patients 81
with stage III CRC (3–5). However chronic peripheral neuropathy occurs in ~50% of patients 82
exposed to oxaliplatin (6), and there is no clinically-validated test available to predict 83
oxaliplatin response. Therefore, a significant proportion of patients may endure distressing 84
side effects from this treatment with no clinical benefit (7). This highlights the need for the 85
development of improved predictive tools to guide treatment decision making and 86
ultimately improve patient outcomes (8). 87
88
Numerous models suggest that conventional chemotherapy elicits high levels of DNA 89
damage and DNA strand breaks in highly proliferative cancer cells that can either prime 90
them for cell death, or tip already primed cells into apoptosis (9). The efficacy of 91
chemotherapy in cancer cells is often compromised due to dysfunctional damage detection 92
or cell death mechanisms, allowing cell survival (9). Certain chemotherapeutic agents target 93

vulnerabilities inherent in tumours with defective DNA damage repair machinery, leading to 94
neoplastic cell death. In CRC, the most common defective DNA damage repair mechanism 95
occurs in tumours with microsatellite instability (MSI), characterised by defects in DNA 96
mismatch repair. MSI tumours account for ~15% of stage II/III CRC and ~4% of stage IV 97
patients, and are largely characterised by hypermutation, an increase in cancer-specific 98
neoantigen production, high immune infiltration, and a favourable prognosis in earlier 99
stages (10,11). Interestingly, in the recent FOxTROT neoadjuvant colon cancer 100
chemotherapy clinical trial, this immune-rich MSI subgroup, defined by loss of MMR, 101
specifically failed to gain a clear significant benefit from oxaliplatin-based neoadjuvant 102
therapy (7). The DNA damage immune response (DDIR) signature, which comprises a 44-103
gene transcriptional signature based on loss of the Fanconi anemia/BRCA (FA/BRCA) DNA 104
damage response pathway, was previously developed in breast cancer (BC), where it 105
demonstrated clinical utility for the identification of patients with a good response to 106
anthracycline and/or cyclophosphamide-based neoadjuvant chemotherapy (12,13). DDIR-107
positive tumours (exhibiting defective DNA damage repair) are characterised by an 108
inflammatory tumour microenvironment (TME), upregulation of interferon signalling genes 109
and high lymphocytic infiltration. Additional studies in BC indicated that DDIR-positive 110
tumours have increased levels of CXCL10 and enhanced signalling through the cGAS/STING 111
pathway (14). 112
113
Given these predictive findings, the Stratification in COloRecTal cancer (S:CORT) consortium 114
(15) hypothesised that the DDIR signature would be predictive of oxaliplatin benefit in CRC, 115
based on its ability to predict benefit from DNA-damaging therapy in BC. In this study we 116
tested the ability of the DDIR signature to identify patients that may respond to oxaliplatin-117

based chemotherapy in both metastatic and neoadjuvant CRC settings, employing 118
transcriptional profiling and bioinformatic analysis of subsets of samples from the FOCUS 119
(first-line metastatic, n=391) and FOxTROT (first-line neoadjuvant, n=97 randomised 120
controlled trials. We ascertained if DDIR-positivity was associated with improved outcomes 121
in metastatic CRC patients treated with FOLFOX compared to 5FUFA alone (bolus and 122
infusional 5-FU and folinic acid on the modified de Gramont schedule), and in patients with 123
localised disease treated with FOLFOX in the neo-adjuvant setting. We also performed a 124
series of analyses to comprehensively characterise the underlying biology of DDIR subtypes 125
in CRC compared to BC. 126
127
Word Count = 633 128
129
130
131

Materials and Methods 132
133
As part of the MRC Stratified Medicine in Colorectal Cancer Consortium (S:CORT) (15), 134
tumour biospecimens with associated clinical trial data were identified for exploration of 135
potential stratifiers for oxaliplatin treatment. The randomised MRC FOCUS trial was selected 136
for exploration in the metastatic setting and the FOxTROT trial was selected for exploration 137
of short course FOLFOX in the neoadjuvant setting. 138
139
FOCUS Trial 140
FOCUS was a large UK-based randomised controlled trial comparing different strategies of 141
sequential or combination therapies of 5FUFA (bolus and infusion 5-FU with folinic acid) 142
with or without oxaliplatin or irinotecan as first- or second-line therapies in patients with 143
newly-diagnosed advanced CRC (16). A total of 2135 patients were recruited between 2000-144
03 and randomised between three strategies of first- or second-line combination therapy. 145
Control strategy: First-line 5FUFA alone, followed by single-agent irinotecan; second 146
strategy: first-line 5FUFA alone, followed by second-line combination chemotherapy; third 147
strategy: combination chemotherapy in first line treatment. Within the two research 148
strategies, the combination regimen was an additional randomisation: either 5FUFA plus 149
oxaliplatin (FOLFOX), or 5FUFA plus irinotecan (FOLFIRI). For the DDIR analysis, samples 150
from patients with colonic primaries from a biobank of archival diagnostic tissue were 151
selected from consenting patients in the relevant arms where a randomised comparison 152
could be made between first-line 5FUFA alone or in combination with oxaliplatin (85mg/m2 153
two-weekly) (Supplementary Figure 1A). 385 samples were obtained from 371 primary 154
resections, 8 primary biopsies, 6 metastatic samples (3 liver, 2 nodal and 1 lung). The 155

primary outcome for FOCUS was overall survival (OS), but data were also available for 156
progression-free survival (PFS) and objective response rate (ORR). 157
158
FOxTROT Trial 159
FOxTROT was an international randomised trial (1052 patients) which has reported its main 160
finding (7). Patients were eligible if they had been diagnosed with locally advanced colon 161
cancer (CC) without evidence of distance metastasis and with surgical resection of the 162
primary tumour planned. Patients were randomised into one of three chemotherapy 163
groups: 164
Group A: Patients had 6-weeks pre-surgery chemotherapy (oxaliplatin with either 5FUFA or 165
capecitabine) and 18-weeks chemotherapy that commenced 4-8 weeks after surgical 166
resection of the tumour. 167
Group B: Patients had no pre-surgery chemotherapy but had 24-weeks chemotherapy 168
(OxMdG or OxCap) after their surgical resection. 169
Group C: For patients who were RAS wild-type on baseline biopsy and randomised to neo-170
adjuvant chemotherapy, the option of a secondary randomisation between panitumumab 171
or not, for the 6 weeks prior to surgery. 172
For patients randomised into Group A, FOxTROT provided an opportunity to measure DDIR 173
in the tissue biopsy in a subset at baseline and determine whether DDIR was predictive of 174
response to neo-adjuvant OxMdG therapy prior to resection surgery, excluding patients in 175
Group C and those with complete response (Supplementary Figure 1B). 176
177
Gene Expression Profiling 178

All the archival formalin-fixed paraffin-embedded (FFPE) tumour tissue samples were tested 179
at Almac’s Diagnostic CLIA Laboratories. Samples were reviewed and tumour material 180
identified on an adjacent H&E stained slide for microdissection. Total RNA was extracted 181
from two sequential 5µm sections using the Roche High Pure FFPE Extraction Kit (Roche Life 182
Sciences, Penzberg, Germany) and amplified using the NuGen Ovation FFPE Amplification 183
System v3 (NuGen San Carlos, California, USA). The amplified product was hybridised to the 184
Almac Diagnostics XCEL array (Almac, Craigavon, UK), a cDNA microarray-based technology 185
optimised for archival FFPE tissue, and analysed using the Affymetrix Genechip 3000 7G 186
scanner (Affymetrix, Santa Clara, California, USA) as previously described (12). Microarray 187
data were quality checked (see Supplementary methods) then pre-processed where raw CEL 188
files underwent the Robust Multiarray Average (RMA) normalisation for the Almac 189
Diagnostic XCEL array with the affy package (v1.56.0) (17). Gene expression profiles from a 190
total of 391 samples from FOCUS and 97 samples from FOxTROT were made available. 191
192
For the biological analysis, a subset of gene expression profiles from n=361 primary tumour 193
resection samples from FOCUS were used (exclusions detailed in supplementary Figure 1A) 194
and n=97 pre-treatment biopsy samples from FOxTROT (exclusions detailed in 195
supplementary Figure 1B). Probes were annotated using annotation file “Xcel Annotations, 196
CSV format, Release 36” available for download from 197
(http://www.affymetrix.com/support/technical/byproduct.affx?product=xcel), and then 198
collapsed to their corresponding genes using WGCNA package (version 1.68), based on the 199
probe with highest average value for each gene (18). For comparative analysis between BC 200
and CRC, TRASNBIG BC cohort (19) containing gene expression profiles for 198 fresh frozen 201
samples from patients with node-negative T1-T2 (≤5cm) breast performed on Affymetrix 202

Human Genome U133A array was downloaded from Gene Omnibus Expression (GEO; 203
www.ncbi.nlm.nih.gov/geo/) (accession number ‘GSE7390’). 204
205
DDIR Signature 206
A total of 484 clinical samples (391 from FOCUS and 97 from FOxTROT) had DDIR signature 207
scores calculated and predefined cut-points applied. The pre-defined threshold of 0.1094 208
was optimised in an independent technical study of 260 CRC samples whereby the optimal 209
threshold was detected at the score where the sensitivity and specificity meant a joint 210
maximum to accurately detect the DDIR-positive subgroup as defined in hierarchical 211
clustering (Personal communication Almac Diagnostics). The threshold was then applied 212
independently to the validation cohorts, dichotomising patients as DDIR-positive (>0.1094) 213
or DDIR-negative (≤0.1094). 214
TRANSBIG BC cohort (19) used in the original study had information available on 215
predetermined DDIR threshold of 0.37 along with DDIR continuous score (12), that was used 216
on our analysis. 217
218
Consensus Molecular Subtyping and CRC Intrinsic Subtyping 219
To obtain CMS calls, genes with multiple probesets were collapsed by mean and the 220
CMSclassifier package was used (20). Classification by random forest with the default 221
posterior probability of 0.5 showed a higher frequency of unclassified samples compared to 222
the original publication (20). To derive calls with comparable frequencies, single sample 223
predictor calls were computed after row-centring the expression data. Final CMS calls were 224
generated when there was a match between both methods without applying any cut-off. To 225
obtain CRIS calls, probesets with the highest average levels for each gene were selected and 226

the CRISclassifier package was used (21). Samples with a Benjamini-Hochberg-corrected 227
False Discovery Rate (BH.FDR) > 0.2 were left unclassified as originally reported (21). 228
229
Mutational Analysis 230
Mutation data was generated by DNA target capture (SureSelect, Agilent) spanning all 231
coding exons of 80 CRC driver genes (listed in Supplementary Methods) followed by next 232
generation sequencing (Illumina). Variant calling was performed with Caveman for point 233
mutations and Pindel for indel mutations. Driver mutations in KRAS, NRAS, PIK3CA and TP53 234
were considered for binary classification (e.g. depending on whether genes are 235
dominant/recessive, mutations reported as recurrent or an internal curated list) based on 236
frequency and relevance. BRAF was classified as mutated only with a V600E mutation. 237
Tumours showing more than two mutations in n=123 MSI markers within the panel were 238
classified as MSI, otherwise as MSS. The FOxTROT cohort showed a high failure rate (55/97 239
missing data, 57%) due to lack of enough tissue in small biopsies after RNA profiling. 240
Therefore, MSI classification form additional FOxTROT tumours were derived with a RNA 241
signature (22). Two borderline tumours were not classified. 242
243
Gene Set Enrichment Analysis (GSEA) 244
GSEA was performed in the three cohorts to investigate biological pathways associated with 245
DDIR (23,24), using Hallmarks gene set collection (h.all.v6.2.symbols.gmt [Hallmarks]) from 246
Molecular Signature Database (MSigDB) (25,26). GSEA version 19.0.26 was accessed from 247
the GenePattern cloud server web interface: https://cloud.genepattern.org. All default 248
parameters were utilised, with the exception of ‘collapse dataset’ which was set to ‘FALSE’, 249
as the probes were collapsed to their genes a priori, and the random seed was stated to be 250

‘40218336’. Normal enrichment score (NES) and false discovery rate (FDR) values were 251
noted for each gene set within the two phenotypic (DDIR) groups, where FDR q-value below 252
25% was justified to be a significant gene set. 253
254
Microenvironment Cell Population Analysis 255
The MCPcounter (version MCPcounter_1.1.0) R package was downloaded from GitHub 256
(https://github.com/ebecht/MCPcounter), and was used to generate MCP estimation scores 257
for ten stromal and immune cell infiltrates from the transcriptomic data of the three cohorts 258
(27). Estimates were compared between DDIR-positive and DDIR-negative to determine 259
their stromal/immune content, and the differences in cellular composition between the 260
cancer types. 261
262
Differential Gene Expression and Pathway Analysis 263
Partek Genomics Suite (PGS) version 6.6 was utilised to perform ANOVA analysis to identify 264
differentially expressed genes with FDR of < 0.05, and fold change (FC) adjusted to 1.5 for 265
FOCUS and FOxTROT cohorts; for TRANSBIG due to the large number of differentially 266
expressed genes, FC value was increased to 2.5. Differentially expressed genes were 267
assessed using Ingenuity Pathway Analysis (IPA - 49932394) to examine any significant 268
biological pathways associated with DDIR subtypes. All parameters were set to default. 269
270
Statistical Analysis 271
Statistical analyses were conducted according to pre-specified statistical analysis plans that 272
were agreed prior to inspection of any DDIR-stratified outcome data. All clinical-related 273
analyses for Objective response rate, progression-free-survival and overall survival were 274

performed using Stat version 15.0 (Stata Corporation, Texas City, USA) or R (version 3.4.1). 275
Further detailed statistical analysis on FOCUS and FOxTROT cohort is available in 276
Supplementary Methods. 277
278
All statistical analyses undertaken for further biological exploration, including Pearson’s 279
Correlation Coefficient, Fisher’s exact test, Student’s t-test, Wilcoxon rank sum test, Kruskal-280
Wallis rank sum test, and one-way ANOVA followed by Tukey’s Honest Significance 281
Difference test were performed to generate p-values for statistical significance using R stats 282
package in R (version 3.4.0) and RStudio (version 1.1383). In addition to base R packages, 283
ggplot2 R package (version 3.2.1) with other supporting packages, including cowplot 284
(version 0.9.4), ggpubr (version 0.2.3) and grid (version 3.4.0) were used for graphical 285
visualisation. 286
287
Data and Script Availability 288
FOCUS and FOxTROT gene expression dataset and clinicopathological information are 289
provided from S:CORT, with transcriptional data available on GEO under reference 290
GSExxxxxx (TBC). All scripts required to reproduce figures in this manuscript are available 291
from corresponding author on request or from www.dunne-lab.com. 292
293
294
295

Results 296
297
Case selection from FOCUS metastatic CRC clinical trial 298
A total of n=391 patients were available for DDIR analysis from the FOCUS trial. Following 299
exclusion of rectal cancer cases and prioritisation of resected tissue to ensure there was 300
sufficient tumour tissue for molecular analyses, n=310 from the 5FU alone group and n=81 301
in the 5FU+oxaliplatin group were used for outcome analyses (Supplementary Table S1). 302
Assessment of baseline characteristics of patients excluded from the DDIR analysis 303
compared to those included in the DDIR analysis revealed that there were no other obvious 304
selection biases between the groups (Supplementary Table S1, Supplementary figure S1). A 305
total of 76/391 patients were classified as DDIR positive (Supplementary Figure S2), 306
generating a prevalence of 19% [95% CI 16-24] overall, with a reasonable balance between 307
the randomised groups of 63 (20%) versus 13 (16%) in the 5FU and 5FU+oxaliplain groups 308
respectively, (Chi-squared p-value for difference=0.39; Supplementary Table S1). 309
The overall prevalence of DDIR was lower than anticipated when compared with data from 310
other cohorts of patients with CRC (28) and other disease indications (12,13,29) but was 311
similar to the technical study of 260 metastatic CRC used to set the threshold for DDIR 312
positivity (Personal communication Almacgroup). 313
314
Survival analyses according to DDIR status in the FOCUS trial 315
During the course of follow-up between 16th May 2000 and 18th October 2006, there were a 316
total of 383 PFS events (357 during the first 15 months) and 342 OS events. During the first 317
12-weeks of first-line chemotherapy, there were 157 (40%) complete or partial responders 318
and 234 (60%) stable or progressive disease non-responders. A comparison between 319
randomised groups, without stratification for DDIR, confirmed the anticipated treatment 320
effect of oxaliplatin; PFS adjusted HR (95% CI) = 0.63 (0.48, 0.82), p=0.001 and ORR adjusted 321
OR (95% CI) = 4.11 (2.37, 7.14), p<0.001 (data not shown). 322
323

In the FOCUS control arm, we identified no prognostic effect of DDIR status for patients with 324
metastatic colon cancer treated with first line 5FU alone, either on OS (Unadjusted HR (95% 325
CI) = 0.95 (0.71, 1.28), p = 0.73, Test of proportional hazards: χ2 = 1.42 on 1 d.f., p=0.20, 326
Supplementary Figure S2b), or on PFS (Adjusted HR = 1.11 (95% CI 0.79 – 1.54), p = 0.55). 327
This result remained non-significant when adjusted for clinical variables, CMS status and 328
other molecular variables. 329
330
Using fully adjusted models, we next explored the predictive effects of DDIR for all 331
outcomes, with PFS at 15 months as the primary outcome (Figure 1A). Contrary to the 332
expectation that DDIR-positive patients would derive the most benefit from oxaliplatin, 333
DDIR-negative patients appeared to respond more frequently to FOLFOX (ratio of odds 334
ratios for ORR = 0.15 (95% CI 0.04 – 0.65), test for interaction p = 0.011; Table 1, Figure 1B). 335
Although this inverted direction of effect was the same for the survival outcomes, the tests 336
for interaction were non-significant (Table 1). 337
338
Case selection and survival analyses according to DDIR in the FOxTROT neoadjuvant CRC 339
clinical trial 340
Following these analyses in the metastatic setting, we next assessed the clinical utility of the 341
DDIR in the CRC neoadjuvant setting. A total of 97 patients who received neoadjuvant 342
FOLFOX were selected from Group A of the FOxTROT dataset. Patients were excluded if they 343
withdrew from the trial, if they did not receive neo-adjuvant chemotherapy or if they 344
received OxCap prior to surgery. Additionally, no patients with complete pathological 345
response were forwarded to S:CORT for analysis. These selections led to a somewhat biased 346
subset compared to the main study with less responders, less MSI and more KRAS wildtype 347
tumours (Supplementary Table 2). Of these 97 patients, 4 had no associated response data, 348
leaving a total of 93 patients who were included in the final analysis. There were a total of 349
40 non-responders, 29 mild-responders, 17 moderate responders and 7 marked responders. 350
The DDIR threshold was set at the same value defined in the FOCUS cohort, resulting in 57% 351
DDIR positive patients, which was considerably higher than the 19% seen in the metastatic 352
FOCUS dataset (Supplementary Figure S2c). Using ordinal regression across the 4 response 353
groups, there were marginally better responses in the DDIR-negative group (Figure 1C), but 354
this was not statistically significant using unadjusted ordinal regression OR = 0.62 [95% CI 355
0.29 – 1.33], p=0.218 (Table 1). After adjustment for age, sex, pT-stage, pN-stage, primary 356
tumour location, MSI and RAS status, the coefficient reduced slightly to 0.55 [95% CI 0.21-357
1.39], p=0.205. Employing DDIR as a continuous variable, the unadjusted OR for response 358
was 0.19 [95% CI 0.02-1.79], p=0.148. When adjusted for age, sex, T-stage, N-stage, 359
left/right, MSI and RAS status the OR reduced to 0.11 [95% CI 0.01-1.66], p=0.110 360
(Supplementary Table S2). 361
362
Given these counter-intuitive findings, we next set out to investigate if there was a 363
biological explanation for this potentially inverted and inconsistent effect between previous 364
breast cohorts and our CRC trial cohorts. 365
366
Association between DDIR and colorectal cancer subtypes 367
Investigation into the biological relevance of DDIR signature led to the comparison against 368
CRC Consensus Molecular Subtypes (CMS) which is largely based on histological (stroma and 369
immune) features (20). In the FOCUS cohort, immune-rich CMS1 tumours are significantly 370
associated with increased DDIR scores when compared to all other CMS subtypes (Figure 371

2A; Kruskal-Wallis, p < 0.0001). Despite CMS1 tumours having a significantly higher 372
proportion of DDIR-positive tumours compared to the other subtypes (Supplementary 373
Figure 5A; Fisher’s exact test, p = 0.0002), given the low prevalence of DDIR-positivity across 374
the whole cohort, 68% of CMS1 subtypes are below the DDIR threshold (Figure 2A). Of note, 375
there are proportionally more CMS4 tumours within DDIR-negative classification in the 376
FOCUS cohort (Supplementary Figure 5A). In pre-treatment biopsies from the smaller 377
FOxTROT cohort, CMS1 tumours show a non-significant trend towards DDIR positivity 378
(Figure 2B; Kruskal-Wallis, p = 0.4695, and Supplementary Figure 5B; Fisher’s exact test, p = 379
0.4879). Additionally, we also examined DDIR on Colorectal Cancer Intrinsic Subtypes (CRIS) 380
that represents CRC tumour-intrinsic (epithelial) biology (21). Contrary to CMS, no 381
significant association between the CRIS subtypes and DDIR-positive or DDIR-negative 382
tumours in both the FOCUS and FOxTROT cohort was found (Supplementary Figures 5C-F). 383
These findings suggest that, in CRC, DDIR-positivity is primarily associated with (and 384
potentially influenced by) CMS-related tumour microenvironment (TME) factors, such as 385
differences in stromal/immune infiltrates, rather than epithelial-derived intrinsic factors. 386
387
Originally, DDIR signature was developed based on defective DNA damage response and 388
repair machinery of Homologous Recombination (HR) and Fanconi Anaemia (FA) in breast 389
cancer (12). However, there is limited evidence on their role in CRC tumorigenesis (30). 390
Thus, we explored the relationship between HR/FA and DDIR in CRC cohorts and made 391
comparison against TRANSBIG BC cohort which was used in the development of the DDIR 392
signature. Our investigation suggested that within CRC, these pathways do not show any 393
association with DDIR, contrary to that in BC (see Supplementary Results; Supplementary 394
Figure 3). Microsatellite instability (MSI), a result of defective DNA mismatch repair 395

mechanisms, defines a proportion of CRC patients associated with high tumour mutational 396
burden, leading to development of immune-responsive TME. Despite the limited number of 397
MSI tumours in the metastatic FOCUS CRC cohort (n=13), we observe that MSI tumours 398
contain a significantly higher proportion of DDIR-positives (Figure 2C; Fisher’s exact test, p = 399
0.0211). However, DDIR-positivity is not a biomarker of MSI status, as only 46% of MSI 400
tumours are DDIR-positive (6 out of 13) while the majority of DDIR-positive tumours overall 401
are MSS (Figure 2D; MSI/DDIR+ n=6, MSS/DDIR+ n=59). In the FOxTROT cohort, MSI trends 402
observed are in line with the larger FOCUS cohort (Figure 2E; Fisher’s exact test, p = 0.2522, 403
and Figure 2F; Student’s t-test, p = 0.0737), but this result cannot be used to confirm the 404
FOCUS findings due to small (n=3) MSI sample size (Figure 2F). Furthermore, while MSI 405
tumours collectively contain higher mutational burden than MSS as expected, mutational 406
burden is not associated with DDIR-positivity in either of the CRC cohorts (Supplementary 407
Figure 5G; Student’s t-test, p = 0.1279 and Supplementary Figure 5H; Student’s t-test, p = 408
0.4534). 409
410
Enhanced immune-related signalling pathways define DDIR-positive tumours 411
To further characterise the biological functions and pathways associated with DDIR, we 412
performed GSEA, using the “Hallmark” collection, to compare DDIR-positive and DDIR-413
negative tumours in FOCUS and FOxTROT CRC cohorts, compared to the same analyses in 414
the TRANSBIG BC cohort. GSEA between DDIR-positive and DDIR-negative tumours 415
generated different numbers of significant Hallmarks genesets in each cohorts 416
(Supplementary Figure 6). However, in general, between the three cohorts five common 417
significantly-enriched genesets in DDIR-positive CRC and BC tumours were identified, 418
namely allograft rejection, IL6/JAK/STAT3 signalling, inflammatory response, interferon-α 419

response and interferon-γ response (Figure 3A; FDR q-value < 0.25), suggesting that a 420
common immune and/or inflammatory-like signalling defines DDIR-positivity, regardless of 421
the cancer type. Interestingly, we also observe eight unique gene sets that are only 422
associated with DDIR in BC and not in CRC (Figure 3A). 423
424
Previous studies of DDIR signalling in BC have highlighted increased levels of the interferon 425
gamma-induced chemokine CXCL10 gene/protein expression in DDIR-positive tumour cells, 426
leading to lymphocytic trafficking into the tumour (14). Here, we showed that CXCL10 427
expression has a strong positive (>6) correlation with DDIR scores in both BC and CRC 428
cohorts (Figure 3B, 3C and 3D). Additionally, it was previously demonstrated that DDIR-429
positivity in BC was specifically associated with activation of cGAS/STING/TBK1 innate 430
immune response axis (14). This, however, was not found to be the case in CRC (see 431
Supplementary Results). 432
433
DDIR-defined tumour microenvironment reflects immune-rich colorectal subtype 434
We tested the association between immune/stromal composition, based on gene 435
expression profiles using microenvironment cell population (MCP) analysis, where we 436
identified consistent correlations between DDIR scores and T cell, B cell and monocytic 437
immune lineages, confirming an increase in lymphocytic infiltration in DDIR-positive BC 438
(Figure 4A; Pearson r; T cells = 0.7167, B Lineage = 0.5075, Monocytic Lineage = 0.7042). 439
While we also observe correlative trends in both CRC cohorts (Figure 4B; Pearson r; T cells = 440
0.3509, B Lineage = 0.2774, Monocytic Lineage = 0.2358 and Figure 4C; Pearson r; T cells = 441
0.4038 and Monocytic Lineage = 0.5152 and B Lineage, r = 0.3666), these correlations were 442
not as strong as those observed in BC. Moreover, cytotoxic lymphocytes scores also 443

demonstrate a positive correlation with DDIR using both a positive versus negative 444
categorical (Figure 4D; Student’s t-test, p < 0.0001) or DDIR continuous score (Figure 4D; 445
Pearson r = 0.6106) in the TRANSBIG BC cohort. Similar, albeit weaker, correlations were 446
observed in both FOCUS (Figure 4E: Student’s t-test, p < 0.0001; Pearson r = 0.436) and 447
FOxTROT (Figure 4F: Student’s t-test, p = 0.0004; Pearson r = 0.5251) CRC cohorts using the 448
MCP-derived cytotoxic lymphocyte scores. Incorporation of CMS in the CRC analyses 449
demonstrated the association between CMS1, lymphocytic infiltration and increased DDIR 450
score. Levels of cytotoxic CD8+ T-lymphocytic infiltration were further assessed in situ in the 451
FOCUS cohort by IHC (Figure 4G), where a significant association between CD8 IHC scores 452
and DDIR score was observed, in line with MCP assessments in these tumours (Figure 4H: 453
Student’s t-test, p < 0.0001; Pearson r = 0.4388). Conversely, fibroblast levels and CMS4 454
subtypes were negatively correlated with DDIR score in the FOCUS cohort (Supplementary 455
Figure 7A and 7B; t-test, p = 0.0109; Pearson r = -0.1597), while no association was noted in 456
FOxTROT cohort (Supplementary Figure 7C and 3D: t-test, p = 0.9984; Pearson r = 0.0291). 457
458
Overlapping interferon-responsive biology in DDIR-positive CRC and BC 459
Next, we set out to identify overlapping individual differentially expressed genes between 460
DDIR subtypes in both BC and CRC. Differential gene expression analysis comparing DDIR-461
positive and DDIR-negative tumours identified 66 and 60 differentially expressed genes in 462
FOCUS and FOxTROT cohorts respectively (FDR < 0.05, FC = 1.5; Figure 5A). We observed 463
975 differential genes between DDIR-positive and negative tumours in the BC cohort 464
compared to CRC; thus, in order to limit these analyses to a similar sized gene list for the 465
TRANSBIG cohort, we increased the FC for analysis, identifying 110 differentially expressed 466
genes (FDR < 0.05, FC = 2.5; Figure 5A). Comparison of gene lists from the three cohorts 467
identified nine genes that are consistently upregulated in DDIR-positive tumours in both 468
cancer types (Figure 5A). This list contained members of chemokines family, including two 469
genes (CXCL10 and IDO1) that are part of the 44-gene DDIR signature. Using these nine 470
differentially expressed genes common in all three cohorts, pathway analysis was 471
performed, which revealed 18 potential upstream regulators of conserved biology 472
contributing to DDIR-positivity across CRC and BC, including key regulators of inflammatory 473
and interferon-related signalling; such as IFN-alpha, IFN-gamma, STAT1 and the NFkB 474
complex (Figure 5B and Supplementary Figure 8A). 475
476
Using these nine consensus DDIR-related genes to generate an unweighted cumulative 477
score, we observed a strong positive correlation between this new overlapping ranked sum 478
score and the original DDIR score (Figure 5C; Pearson r = 0.6291, p < 0.0001). In line with 479
this overlap, we also observed similar correlative trends for both CMS and MSI 480
(Supplementary Figure 8B and 8C), with the nine gene score as observed with the original 481
DDIR score (Figure 2). Finally, a Cox regression model (for PFS) and a logistic regression 482
model (for response) were fitted with main effects for oxaliplatin and for each of three 483
quartiles of Almac DDIR or 9-gene score relative to Q1 (reference), and interactions 484
between oxaliplatin and the three quartiles (Figure 5D). As with the response and outcomes 485
analyses using the original DDIR score, this overlapping nine gene score fails to predict a 486
benefit for the addition of oxaliplatin to 5FU in the FOCUS trial. Importantly, however, this 487
new refined CRC DDIR signature removes the trend for increased response to oxaliplatin 488
observed in the DDIR-negative group in the original DDIR. 489
490
Word Count: 2255 491
Discussion 492
493
The original characterisation of the DDIR signature demonstrated its predictive value as a 494
biomarker for platinum-based chemotherapy treatment in BC, and subsequently 495
oesophageal adenocarcinoma (OAC) (12,29). In the initial BC study, the biology 496
underpinning DDIR was based on dysfunctional DNA damage response and repair machinery 497
regulated via the HR and FA/BRCA pathways, which is targeted by some chemotherapies as 498
a mode of action (31). The multi-disciplinary S:CORT consortium (15) was established to 499
identify and test new molecular stratification methods to predict CRC response to 500
treatments, through the discovery of new and/or validation of existing molecular 501
biomarker-based assays. In this study, we tested the clinical utility of the 44-gene DDIR 502
signature from archival FFPE tumour tissue profiled at Almac’s Diagnostic CLIA Laboratories 503
as previously described, to predict response to the addition of oxaliplatin to 5-FU-based 504
chemotherapy in both metastatic CRC (FOCUS cohort) and neoadjuvant CRC (FOxTROT) 505
clinical trial settings. Accompanying this clinical assessment, we utilised the molecular and 506
histological data generated to further interrogate the biological signalling associated with 507
CRC-specific DDIR positivity in contrast to BC. 508
509
DDIR-positivity was observed in 19% of primary tumours from stage IV FOCUS cohort and 510
57% of primary tumour biopsy material from stage II/III FOxTROT cohort. A previous study 511
of DDIR-positivity in CRC reported a 35% incidence in a predominantly (94%) non-metastatic 512
population (28). This was comparable to findings in BC (34%) (12) and OAC (24%) (29). 513
Differing DDIR rates in our study could be credited to the cancer stage or other (molecular) 514
criteria used for patient selection in the original trials. Patients with localised disease, as in 515

the neo-adjuvant FOxTROT study, have a higher proportion of tumours with immune 516
infiltration (32), a factor associated with DDIR-positivity in BC and OAC, and also with MSI 517
and CMS1 tumours in CRC. Similarly, the reduction in DDIR-positivity to ~20% in metastatic 518
disease is consistent with a lower relative proportion of patients with MSI in metastatic 519
disease, which falls from ~20% in localised CC in ~4% in mCRC, as in the FOCUS cohort. 520
521
MSI is the most notable feature in CRC displaying defective DNA damage response and 522
repair via mismatch repair (MMR) system (30). MSI and CMS1 are closely linked together 523
with high tumour mutation burden, overproduction of tumour-specific neoantigens, 524
increased immune infiltration and show favourable clinical outcome in early stage disease 525
(20). Given their high levels of immune infiltration and mutation burden, these tumours 526
have responded well to checkpoint blockade immune-oncology (IO) treatments (33). There 527
is a strong association of DDIR status with CMS1, MSI status (28) (Figure 2) in FOCUS cohort, 528
and a similar trend is observed in FOxTROT cohort, given its small sample size (Figure 2), 529
reflecting the observed clinical utility of immunotherapeutic interventions in this molecular 530
subtype (34,35). However, our findings do not validate the correlation between DDIR and 531
mutational burden in the FOCUS cohort observed in the CRC threshold development 532
abstract (28), likely due to the difference in disease stage (FOCUS as mCRC) and mutational 533
panel sequencing methods used with S:CORT. 534
535
Contrary to our primary hypothesis, it was noted that response to the addition of oxaliplatin 536
to 5FUFA was more likely to benefit DDIR-negative patients in both FOCUS and FOxTROT 537
cohorts rather than DDIR-positive patients. While this was only statistically significant in 538
terms of response in the metastatic FOCUS trial setting (ratio of odds ratios for ORR = 0.15, 539
test for interaction p = 0.011), the trend was consistent across all endpoints in both cohorts 540
examined. However, the refinement of DDIR gene signature to only 9-genes signature 541
through our analysis showed no additional benefit from oxaliplatin for either DDIR-positive 542
or DDIR-negative patients (Figure 5). The original and subsequent DDIR study in BC with the 543
South Western Oncology Group (13) demonstrated improved response to anthracycline 544
and/or cyclophosphoamide-based neoadjuvant and adjuvant chemotherapy in DDIR-545
positive patients. Similarly, in OAC, DDIR-positivity was predictive of improved response to 546
cisplatin-containing chemotherapy (29). Oxaliplatin is known to differ in its mechanism of 547
cytotoxicity compared to cisplatin and may have more complex mode of action in CRC (36). 548
549
Although we show no additional interaction between DDIR-positivity and oxaliplatin 550
treatment, biologically, our study highlights promising immunotherapeutic opportunities 551
among DDIR-positive CRC patients, beyond the use of general immune infiltration or MSI 552
status. DDIR-positivity may have value in identifying additional subsets of MSS CRC patients 553
who exhibit high tumour mutational burden and/or high TME activity, who have the 554
potential to respond to immune checkpoint blockade such as PD-L1 inhibition (35,42,43). 555
The search for biomarkers to distinguish immune “cold” tumours (that display limited 556
response to IO) from immune “hot” tumours (that respond to IO) has gained traction in 557
recent years. Our findings indicate that in CRC, although DDIR-positivity is associated with 558
increased levels of both innate and cytotoxic infiltration, likely to be driven by interferon-559
related signalling, the immune system is in an “exhausted” state and unable to efficiently 560
clear these tumours, due to the concurrent expression of checkpoints such as IDO1 and PD-561
L1 (CD274) (Figure 6E). These findings may also provide an explanation for the non-562
correlation of DDIR with oxaliplatin-based chemotherapy response, as induction of immune 563
tolerance is a common response pattern to inflammation in the gut and tumour-associated 564
inflammation (as seen in DDIR positive tumours) that leads to a predominantly immune 565
suppressive milieu, which is further reinforced by additional chemotherapy-related 566
inflammatory signalling. Indeed, MSI tumours are largely non-responsive to chemotherapy, 567
as has been demonstrated recently in the neoadjuvant FOxTROT trial (7), as are immune-568
rich/MSI tumours when assessed in other non-trial adjuvant cohorts (44). Very recent trial 569
data reported 100% response rate in early-stage MSI CC, including 60% pathological 570
complete response, to neoadjuvant IO treatment (combined CTLA-4 and PD1 blockade) (45). 571
Results from that study also indicate that only 27% of MSS tumours displayed any response. 572
Importantly, however, these data confirmed the predictive nature of CD8+ T cell infiltration 573
for IO response in MSS tumours; a phenotype associated with the biology underpinning 574
DDIR-positivity in MSS CRC presented in this study, supporting clinical testing of DDIR as a 575
predictive assay to select MSS patients in this setting. 576
577
The approach adopted in our study highlights the clinical utility and high success rates 578
associated with molecular profiling of FFPE material (Supplementary Table 1), even in tissue-579
limited pre-treatment diagnostic biopsy material used to guide treatment decisions in the 580
neoadjuvant setting, as in FOxTROT. The TRANSBIG data used in the original DDIR study 581
poses a potential limitation on our BC analysis due to the platform employed in the original 582
analysis (Affymetrix Human Genome U133A Array) not being identical to the one used for 583
the transcriptional profiling in the CRC cohorts, which was the Almac XCEL array. To ensure 584
cross-platform comparison for DDIR was not confounding our study, Almac have classified 585
DDIR according to their diagnostic assay on all cohorts tested. 586
587
In summary, our study shows that, in contrast to BC and OAC, DDIR does not predict 588
improved response or survival to oxaliplatin treatment. We have identified the underlying 589
biology of the signalling associated with DDIR in CRC that could effect the outcome. While 590
we identify significant overlap in DDIR signalling across BC and CRC, particularly immune-591
related TME signalling, we also highlight that signalling associated with both HR/BRCA and 592
STING pathways is not significantly associated with DDIR in CRC. Overall, our data supports 593
further testing of the utility of the DDIR signature in selecting patients who may respond to 594
IO-based therapy. 595
596
Word Count: 1226 597
598
Funding 599
The stratification in colorectal cancer consortium (S:CORT) is funded by a UK Medical 600
Research Council (MRC) Stratified Medicine Consortium programme grant (grant 601
refMR/M016587/1) and co-funded by Cancer Research-UK. Brown, Fisher and Kaplan are 602
partially funded by an MRC Core funding grant for the MRC Clinical Trials Unit at UCL (grant 603
code 12023/20). Sample collection for FOxTROT was funded by Yorkshire Cancer Research. 604
605
Acknowledgements 606
WE are grateful to all the patients and their families who participated in the FOCUS and 607
FOxTROT clinical trials and gae consent to further research on their samples. WE are also 608
grateful to the Trial Management Groups and Trial Steering Committees for FOCUS and 609
FOxTROT trials who allowed this work to proceed. This work was originally led by Professor 610

Paddy Johnston from Queen’s University Belfast. Sadly, soon after the project commenced 611
Paddy passed away and we would like to dedicate this work to him. 612
613
614
615
616
References 617 618 1. Bray F, Ferlay J, Soerjomataram I, Siegel RL, Torre LA, Jemal A. Global cancer statistics 619
2018: GLOBOCAN estimates of incidence and mortality worldwide for 36 cancers in 620 185 countries. CA Cancer J Clin. 2018; 621
2. Cancer Research UK. Bowel Cancer Statistics [Internet]. 2018 [cited 2019 May 28]. 622 Available from: https://www.cancerresearchuk.org/health-professional/cancer-623 statistics/statistics-by-cancer-type/bowel-cancer 624
3. André T, Boni C, Mounedji-Boudiaf L, Navarro M, Tabernero J, Hickish T, et al. 625 Oxaliplatin, fluorouracil, and leucovorin as adjuvant treatment for colon cancer. N 626 Engl J Med. 2004; 627
4. Kuebler JP, Wieand HS, O’Connell MJ, Smith RE, Colangelo LH, Yothers G, et al. 628 Oxaliplatin combined with weekly bolus fluorouracil and leucovorin as surgical 629 adjuvant chemotherapy for stage II and III colon cancer: Results from NSABP C-07. J 630 Clin Oncol. 2007; 631
5. Haller DG, Tabernero J, Maroun J, De Braud F, Price T, Van Cutsem E, et al. 632 Capecitabine plus oxaliplatin compared with fluorouracil and folinic acid as adjuvant 633 therapy for stage III colon cancer. J Clin Oncol. 2011; 634
6. Seretny M, Currie GL, Sena ES, Ramnarine S, Grant R, Macleod MR, et al. Incidence, 635 prevalence, and predictors of chemotherapy-induced peripheral neuropathy: A 636 systematic review and meta-analysis. Pain. 2014. 637
7. Seymour MT, Morton D. FOxTROT: an international randomised controlled trial in 638 1052 patients (pts) evaluating neoadjuvant chemotherapy (NAC) for colon cancer. J 639 Clin Oncol. 2019 May 20;37(15_suppl):3504–3504. 640
8. Lawler M, Alsina D, Adams RA, Anderson AS, Brown G, Fearnhead NS, et al. Critical 641 research gaps and recommendations to inform research prioritisation for more 642 effective prevention and improved outcomes in colorectal cancer. Gut. 2018 Jan 643 1;67(1):179 LP – 193. 644
9. Helleday T, Petermann E, Lundin C, Hodgson B, Sharma RA. DNA repair pathways as 645 targets for cancer therapy. Nat Rev Cancer. 2008;8(3):193–204. 646
10. Ward R, Meagher A, Tomlinson I, O’Connor T, Norrie M, Wu R, et al. Microsatellite 647 instability and the clinicopathological features of sporadic colorectal cancer. Gut. 648 2001;48(6):821–9. 649
11. Boland CR, Goel A. Microsatellite Instability in Colorectal Cancer. Gastroenterology. 650 2010 May;138(6):2073-2087.e3. 651
12. Mulligan JM, Hill LA, Deharo S, Irwin G, Boyle D, Keating KE, et al. Identification and 652 Validation of an Anthracycline/Cyclophosphamide–Based Chemotherapy Response 653 Assay in Breast Cancer. JNCI J Natl Cancer Inst. 2014 Jan;106(1):235–7. 654
13. Sharma P, Barlow WE, Godwin AK, Parkes EE, Knight LA, Walker SM, et al. Validation 655 of the DNA damage immune response signature in patients with triple-negative 656 breast cancer from the SWOG 9313c trial. J Clin Oncol. 2019; 657
14. Parkes EE, Walker SM, Taggart LE, McCabe N, Knight LA, Wilkinson R, et al. Activation 658 of STING-dependent innate immune signaling by s-phase-specific DNA damage in 659 breast cancer. J Natl Cancer Inst. 2017; 660
15. Lawler M, Kaplan R, Wilson RH, Maughan T. Changing the Paradigm—Multistage 661 Multiarm Randomized Trials and Stratified Cancer Medicine. Oncologist. 2015 Aug 662 12;20(8):849–51. 663
16. Seymour MT, Maughan TS, Ledermann JA, Topham C, James R, Gwyther SJ, et al. 664 Different strategies of sequential and combination chemotherapy for patients with 665 poor prognosis advanced colorectal cancer (MRC FOCUS): a randomised controlled 666 trial. Lancet. 2007 Jul;370(9582):143–52. 667
17. Gautier L, Cope L, Bolstad BM, Irizarry RA. Affy - Analysis of Affymetrix GeneChip data 668 at the probe level. Bioinformatics. 2004; 669
18. Langfelder P, Horvath S. WGCNA: An R package for weighted correlation network 670 analysis. BMC Bioinformatics. 2008;9. 671
19. Desmedt C, Piette F, Loi S, Wang Y, Lallemand F, Haibe-Kains B, et al. Strong Time 672 Dependence of the 76-Gene Prognostic Signature for Node-Negative Breast Cancer 673 Patients in the TRANSBIG Multicenter Independent Validation Series. Clin Cancer Res. 674 2007;13(11):3207–14. 675
20. Guinney J, Dienstmann R, Wang X, de Reyniès A, Schlicker A, Soneson C, et al. The 676 consensus molecular subtypes of colorectal cancer. Nat Med. 2015 Nov 677 12;21(11):1350–6. 678
21. Isella C, Brundu F, Bellomo SE, Galimi F, Zanella E, Porporato R, et al. Selective 679 analysis of cancer-cell intrinsic transcriptional traits defines novel clinically relevant 680 subtypes of colorectal cancer. Nat Commun. 2017;8(May):15107. 681
22. Tian S, Roepman P, Popovici V, Michaut M, Majewski I, Salazar R, et al. A robust 682 genomic signature for the detection of colorectal cancer patients with microsatellite 683 instability phenotype and high mutation frequency. J Pathol. 2012; 684
23. Mootha VK, Lindgren CM, Eriksson KF, Subramanian A, Sihag S, Lehar J, et al. PGC-1α-685 responsive genes involved in oxidative phosphorylation are coordinately 686 downregulated in human diabetes. Nat Genet. 2003; 687
24. Subramanian A, Subramanian A, Tamayo P, Tamayo P, Mootha VK, Mootha VK, et al. 688 Gene set enrichment analysis: a knowledge-based approach for interpreting genome-689 wide expression profiles. Proc Natl Acad Sci U S A. 2005;102(43):15545–50. 690
25. Liberzon A, Subramanian A, Pinchback R, Thorvaldsdóttir H, Tamayo P, Mesirov JP. 691 Molecular signatures database (MSigDB) 3.0. Bioinformatics. 2011;27(12):1739–40. 692
26. Liberzon A, Birger C, Thorvaldsdóttir H, Ghandi M, Mesirov JP, Tamayo P. The 693 Molecular Signatures Database Hallmark Gene Set Collection. Cell Syst. 2015; 694
27. Becht E, Giraldo NA, Lacroix L, Buttard B, Elarouci N, Petitprez F, et al. Estimating the 695 population abundance of tissue-infiltrating immune and stromal cell populations 696 using gene expression. Genome Biol. 2016 Dec 20;17(1):218. 697
28. Tsantoulis P, Hill LA, Walker SM, Wirapati P, Graham DM, Wilson RH, et al. 698 Association of a specific innate immune response to DNA damage with DNA repair 699 deficient colorectal cancers. J Clin Oncol. 2016 May 20;34(15_suppl):3035–3035. 700
29. Turkington RC, Knight LA, Blayney JK, Secrier M, Douglas R, Parkes EE, et al. Immune 701 activation by DNA damage predicts response to chemotherapy and survival in 702 oesophageal adenocarcinoma. Gut. 2019;1–10. 703
30. Muzny DM, Bainbridge MN, Chang K, Dinh HH, Drummond JA, Fowler G, et al. 704 Comprehensive molecular characterization of human colon and rectal cancer. Nature. 705 2012;487(7407):330–7. 706
31. Chartron E, Theillet C, Guiu S, Jacot W. Targeting homologous repair deficiency in 707 breast and ovarian cancers: Biological pathways, preclinical and clinical data. Crit Rev 708 Oncol Hematol. 2019;133(March 2018):58–73. 709
32. Galon J, Costes A, Sanchez-Cabo F, Kirilovsky A, Mlecnik B, Lagorce-Pagès C, et al. 710

Type, density, and location of immune cells within human colorectal tumors predict 711 clinical outcome. Science (80- ). 2006; 712
33. Le DT, Durham JN, Smith KN, Wang H, Bartlett BR, Aulakh LK, et al. Mismatch repair 713 deficiency predicts response of solid tumors to PD-1 blockade. Science (80- ). 2017 Jul 714 28;357(6349):409–13. 715
34. Gkekas I, Novotny JAN, Pecen L, Strigård K, Palmqvist R, Gunnarsson ULF. 716 Microsatellite Instability as a Prognostic Factor in Stage II Colon Cancer Patients , a 717 Meta-Analysis of Published Literature. 2017;6574:6563–74. 718
35. Chalmers ZR, Connelly CF, Fabrizio D, Gay L, Ali SM, Ennis R, et al. Analysis of 100,000 719 human cancer genomes reveals the landscape of tumor mutational burden. Genome 720 Med. 2017;9(1):1–14. 721
36. Bruno PM, Liu Y, Park GY, Murai J, Koch CE, Eisen TJ, et al. A subset of platinum-722 containing chemotherapeutic agents kills cells by inducing ribosome biogenesis 723 stress. Nat Med. 2017; 724
37. Koboldt DC, Fulton RS, McLellan MD, Schmidt H, Kalicki-Veizer J, McMichael JF, et al. 725 Comprehensive molecular portraits of human breast tumours. Nature. 726 2012;490(7418):61–70. 727
38. Knijnenburg TA, Wang L, Zimmermann MT, Chambwe N, Gao GF, Cherniack AD, et al. 728 Genomic and Molecular Landscape of DNA Damage Repair Deficiency across The 729 Cancer Genome Atlas. Cell Rep. 2018;23(1):239-254.e6. 730
39. Dietlein F, Thelen L, Reinhardt HC. Cancer-specific defects in DNA repair pathways as 731 targets for personalized therapeutic approaches. Trends Genet. 2014;30(8):326–39. 732
40. Esteban-Jurado C, Franch-Expósito S, Muñoz J, Ocaña T, Carballal S, López-Cerón M, 733 et al. The Fanconi anemia DNA damage repair pathway in the spotlight for germline 734 predisposition to colorectal cancer. Eur J Hum Genet. 2016;24(10):1501–5. 735
41. An X, Zhu Y, Zheng T, Wang G, Zhang M, Li J, et al. An Analysis of the Expression and 736 Association with Immune Cell Infiltration of the cGAS/STING Pathway in Pan-Cancer. 737 Mol Ther - Nucleic Acids. 2019 Mar;14(March):80–9. 738
42. Overman M, Repair M. Where We Stand With Immunotherapy in Colorectal Cancer : 739 Toxicity Management. ASCO Educ B. 2018;239–47. 740
43. Goodman AM, Sokol ES, Frampton GM, Lippman SM, Kurzrock R. Microsatellite-stable 741 tumors with high mutational burden benefit from immunotherapy. Cancer Immunol 742 Res. 2019;7(10):1570–3. 743
44. Dunne PD, Alderdice M, O’Reilly PG, Roddy AC, McCorry AMB, Richman S, et al. 744 Cancer-cell intrinsic gene expression signatures overcome intratumoural 745 heterogeneity bias in colorectal cancer patient classification. Nat Commun. 2017; 746
45. Chalabi M, Fanchi LF, Van den Berg JG, Beets GL, Lopez-Yurda M, Aalbers AG, et al. 747 Neoadjuvant ipilimumab plus nivolumab in early stage colon cancer | Elsevier 748 Enhanced Reader. Ann Oncol. 2018; 749
750 751

Figure 1
0
5
10
15
20
25
30
No Response Mild Response Moderate Response Marked Resonse
Pathological response assessment in FOxTROT trial by DDIR score
DDIR negative DDIR positive
C
Figure 1. Clinical outcomes in patients randomised to FUFA or to OxFU in FOCUS trial by DDIR score. A. Progression free survival (to 15 months) B. Overall response rate (ORR) C. Pathological response assessment in resected pripmary following 6 weeks oxaliplatin based chemotherapy in FOxTROT trial by DDIR score.
A
B
Log-rank test: P=0.0057
Log-rank test: P=0.76
χ2 = 35.4(1), p=0.0000000027 χ2 = 0.16(1), p=0.69

Table 1
DDIR negative (81%) DDIR positive (19%)
Outcome
(FOCUS)
HR or OR
for OxFU vs
5FU alone
(95% CI)
p-value
HR or OR
for OxFU vs
5FU alone
(95% CI)
p-value
Interaction
HR or OR
(95% CI)
p-value
PFS
(15 months)
0.59 (0.44, 0.80)
P=0.001
0.85 (0.45, 1.62)
P=0.63
1.43 (0.70, 2.92)
P=0.32
PFS
(Full)
0.58 (0.43, 0.76)
P<0.001
1.00 (0.54, 1.87)
P=0.99
1.73 (0.87, 3.43)
P=0.12
OS
(Full)
0.88 (0.65, 1.18)
P=0.38
1.26 (0.65, 2.46)
P=0.50
1.44 (0.69, 3.01)
P=0.34
ORR 5.64 (3.01, 10.56)
P<0.001
0.86 (0.23, 3.16)
P=0.82
0.15 (0.04, 0.65)
P=0.011
DDIR negative (41%) DDIR positive (59%)
Outcome
(FoxTrot)
ORR
N % N % Unadjusted
ordinal
regression
(95% CI)
p-value
excel 14 35% 26 49%
0.62
(0.29, 1.33)
P=0.128
Mild
Response
14 35% 15 28%
Moderate
Response
9 23% 8 15%
Marked
Response
3 7% 4 8%
Statistical outcomes to oxaliplatin based therapy by DDIR status in 1. FOCUS trial and 2. FoxTROT trial sample sets
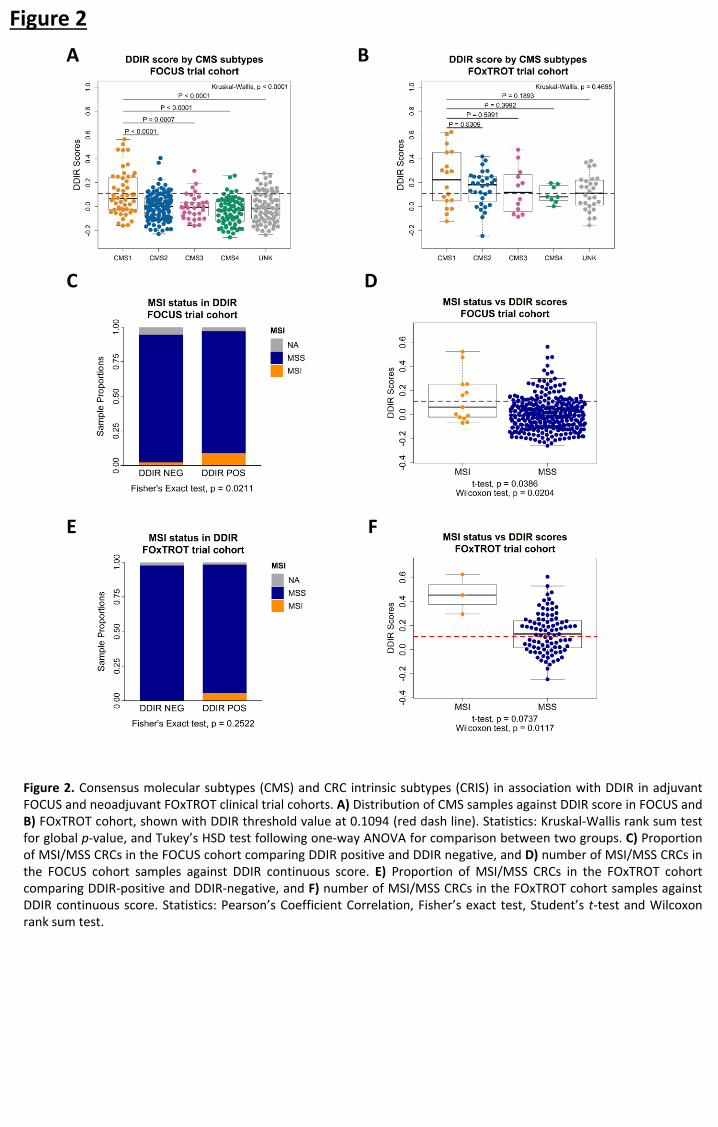
Figure 2
C
B
D
E F
A
Figure 2. Consensus molecular subtypes (CMS) and CRC intrinsic subtypes (CRIS) in association with DDIR in adjuvant FOCUS and neoadjuvant FOxTROT clinical trial cohorts. A) Distribution of CMS samples against DDIR score in FOCUS and B) FOxTROT cohort, shown with DDIR threshold value at 0.1094 (red dash line). Statistics: Kruskal-Wallis rank sum test for global p-value, and Tukey’s HSD test following one-way ANOVA for comparison between two groups. C) Proportion of MSI/MSS CRCs in the FOCUS cohort comparing DDIR positive and DDIR negative, and D) number of MSI/MSS CRCs in the FOCUS cohort samples against DDIR continuous score. E) Proportion of MSI/MSS CRCs in the FOxTROT cohort comparing DDIR-positive and DDIR-negative, and F) number of MSI/MSS CRCs in the FOxTROT cohort samples against DDIR continuous score. Statistics: Pearson’s Coefficient Correlation, Fisher’s exact test, Student’s t-test and Wilcoxon rank sum test.

Figure 3
B
A
C D
Figure 3. Inflammatory and immune response-related pathways are elevated in DDIR positive tumours. A) Gene set enrichment analysis on the two CRC cohorts (FOCUS and FOxTROT) and a BC cohort (TRANSBIG) identifies five common pathways associated with DDIR positive tumours in both cancer types; Benjamini-Hochberg False Discovery Rate (FDR) < 0.25 considered significant, Normalised Enrichment Score (NES) bar (DDIR POS > 0, DDIR NEG < 0). B) Expression of CXCL10 correlated with DDIR scores in TRANSBIG, C) FOCUS, and D) FOxTROT cohort, displayed with line of best fit (blue).

Figure 4
H
C A B
G
Figure 4. Increased immune infiltrates highly correlates with DDIR positivity. A) MCP scores of three immune infiltrates – T cells (red), B lineage (yellow) and monocytic lineage (blue) – correlated against DDIR scores with line of best fit for each immune infiltrates for TRANSBIG , B) FOCUS, and C) FOxTROT cohort.; shown DDIR threshold value at 0.37 for BC and 0.1094 for two CRC cohorts (red dash line). D) Cytotoxic lymphocytes MCP scores correlated with DDIR score in TRANSBIG, E) with overlay of CMS in FOCUS, and F) FOxTROT cohort; shown DDIR threshold value at 0.37 for BC and 0.1094 for two CRC cohorts (red dash line). G) Immunohistochemistry (IHC) images of DDIR negative and DDIR positive tumours stained with CD8+ marker in FOCUS cohort (x10; inset x40, 20µm bar). H) Comparison of average CD8+ log-transformed scores from IHC analysis between DDIR positive (red) and DDIR negative (blue) shown in boxplot above scatterplot examining correlation with DDIR continuous score; line of best fit (black) and DDIR threshold value at 0.1094 (red dash line). Statistics: Student’s t-test, Wilcoxon rank sum test and Pearson’s Coefficient Correlation.
F D E

Figure 5
A
C
D
B
E
Figure 5. Differential gene expression analysis identifies distinct and conserved DDIR biology across BC and CRC. A) Venn diagram of differentially expressed genes between DDIR positive and DDIR negative in three cohorts shows nine common genes, including chemokines such as CCL5 and CXCL10. B). Ingenuity Pathway Analysis (IPA) was used to identify potential elevated/activated upstream regulators of the conserved 9 genes identified in (A). C) Correlation and distribution of DDIR compared to a sum cumulative score generated from the 9 gene overlap in (A). D) 15-month PFS (top) and 12-week objective response rate (bottom) comparing the Almac DDIR score and the modified 9-gene score. Estimates adjusted for WHO PS, left vs right-sided, liver resection, number of mets, source and age of sample, CMS, KRAS, BRAF, PIK3CA, TP53, MSI, imputed (N=361). E) Diagram displaying DDIR-positive and DDIR-negative specific tumour microenvironment and upregulation of biological features such as CXCL10 expression in CRC. DDIR-positive CRCs are riddled with immune infiltrates responding to inflammatory/interferon signalling leading to ‘inflamed’ TME. On the contrary, DDIR-negative CRCs are immune ‘cold’ with low level of CXCL10, interferon signalling and overall low immune cells.
15-month PFS
12-week response

Supplementary Figure S1
S1A Consort diagram for FOCUS trial samples
S1B Consort diagram for FOxTROT trial samples

Figure S2a - Histogram of 391 patients with DDIR score in FOCUS trial (red line indicates 0.1094 threshold for positive DDIR classification)
Figure S2b - Prognostic effect of DDIR status in metastatic colon cancer from the control arm of FOCUS
Supplementary Figure S2
Figure S2c - Histogram of 93 patients with DDIR score in FOxTROT trial (red line indicates 0.1094 threshold for positive DDIR classification)

Baseline characteristic
FOCUS patients included in DDIR
analysis
N=391
Remaining
FOCUS
Patients
P-value vs
patients
included in
DDIR
analysis
5FU alone
N=310
5FU + oxaliplatin
N=81 N=1744
Mean (SD) age, years 64.0 (9.0) 61.8 (10.0) 62.3 (9.4) 0.019
N % N % N %
Sex
Male 196 63.2% 55 67.9% 1209 69.3% 0.049
Female 114 36.8% 26 32.1% 535 30.7%
WHO performance status
0 129 41.6% 34 42.0% 720 41.3% 0.27
1 164 52.9% 39 48.1% 869 49.8%
2 17 5.5% 8 9.9% 155 8.9%
Status of primary tumour at randomisation
Resected 282 91.0% 69 85.2% 1163 66.7% <0.001
Unresected/unresectable 18 5.8% 11 13.6% 505 29..0%
Local recurrence 10 3.2% 1 1.2% 76 4.4%
Site of primary tumour
Colon 306 98.7% 78 96.3% 1013 58.1% <0.001
Rectum * 0 0 0 0 711 40.1%
Recto-sigmoid junction 1 0.3% 1 1.2% 5 0.3%
Other 2 0.6% 2 2.5% 12 0.7%
Missing 1 0.3% 0 0.0% 3 0.2%
Location of metastases †
Any metastases 307 99.0% 81 100.0% 1701 97.5% 0.037
Liver metastases 241 77.7% 65 80.2% 1307 74.9% 0.17
Liver-only metastases 87 28.1% 24 29.6% 507 29.1% 0.79
Nodal metastases 131 42.3% 33 40.7% 615 35.3% 0.013
Lung metastases 103 33.2% 25 30.9% 622 35.7% 0.27
Peritoneal metastases 46 14.8% 13 16.0% 229 13.1% 0.31
Other metastases 32 10.3% 16 19.8% 247 14.2% 0.33
Number of metastases
0 3 1.0% 0 0.0% 43 2.5% 0.096
1 131 42.3% 30 37.0% 732 42.0%
>1 176 56.8% 51 63.0% 969 55.6%
Total 310 100% 81 100% 1744 100%
Table S1 - Baseline characteristics for FOCUS trial patients included in the DDIR analysis, broken down into 5FU alone versus 5FU+oxaliplatin groups, compared to the remaining FOCUS trial patients * Rectal primaries excluded from DDIR analysis † Patients may fall into multiple categories; totals may be >100%

Biological sample
N=93
Total pre and post
(n=698)
Mean age
SD
67.4
9.8
63.0
Range 27-83
Gender
Male 55 (59%) 447 (64.0%)
Female 38 (41%) 251 (36%)
Tumour location
Right sided 43 (46%) 340 (48.7%)
Left sided 46 (50%) 358 (51.3%)
pT stage1
pT0 0 4.1%
pT1/pT2 0 11.7%
pT3 (68) 73% 63.7%
pT4 (23) 25% 20.5%
pN stage1
N0 21 (22.6%) 59.4%
N1 44 (47%) 25.4%
N2 28 (30%) 15.2%
MSI status
MSI 3 (3%) 173 (25%)
MSS 88 (95%) 592 (85%)
RAS status
wildtype 73 (83%) 302 (63%) 2
mutant 15 (17%) 180 (37%) 2
Not tested 216 (30.9%)
Table S2 – Baseline characteristics of the biological sampled subset compared to all patients randomised to receive Pre and post operative FOLFOX in FOxTROT Trial
1 Pathological staging performed according to TNM version 5 2 as proportion of all samples tested

Supplementary Figure 3
E F
A B
C D
Figure S3. Association of DNA damage response and repair pathways with DDIR subtypes vary between breast (BC) and colorectal cancer (CRC). A) Correlation between DDIR continuous scores and single sample gene set enrichment analysis (ssGSEA) scores for TRANSBIG BC cohort on KEGG Homologous Recombination and B) REACTOME Fanconi Anemia pathway, with line of best of fit (blue) and DDIR threshold value indicated with red dash line at 0.37 for BC. C) Correlation of KEGG Homologous Recombination and D) REACTOME Fanconi Anemia pathway ssGSEA scores with DDIR scores in FOCUS CRC cohort, DDIR threshold indicated with red dash line at 0.1094 for CRC along with MSI status (MSI = red, MSS = black, NA = grey). E) Correlation of KEGG Homologous Recombination and F) REACTOME Fanconi Anemia pathway ssGSEA scores with DDIR scores in FOxTROT CRC cohort, DDIR threshold indicated with red dash line at 0.1094 for CRC along with MSI status (MSI = red, MSS = black, NA = grey).

Supplementary Figure 4
B
D
A
C
F E
Figure S4. Expression of cGAS and STING reveals lack of association between innate immune response and DDIR positivity in colorectal cancer. A) Immunohistochemistry images of DDIR positive and DDIR negative tumours stained with cGAS and B) STING, (x10; inset x20, 50µm bar). C) Percentage of total cells in tumour samples positively stained with cGAS comparing DDIR negative and DDIR positive tumours in boxplot, and D) Correlation between percentage of total cGAS-positive cells and DDIR scores, shown with line of best fit (blue) and DDIR threshold at 0.1094 (red dash line). E) Percentage of total cells in tumour samples positively stained with STING comparing DDIR negative and DDIR positive tumours in boxplot, and F) Correlation between percentage of total STING-positive cells and DDIR scores, shown with line of best fit (blue) and DDIR threshold at 0.1094 (red dash line). Statistics: Student’s t-test, Wilcoxon rank sum test and Pearson’s Coefficient Correlation.

Supplementary Figure 5
B
D
A
C
E F
Supplementary Figure S5. CMS1 samples show enrichment in DDIR-positive tumours, while displaying no association of CRIS with DDIR. A) Proportion of CMS samples in DDIR positive and DDIR negative shown for FOCUS and B) FOxTROT cohort. C) Proportion of CRIS samples in DDIR positive and DDIR negative shown for FOCUS and D) FOxTROT cohort. Statistics: Fisher’s exact test. . E) Distribution of CRIS samples against DDIR score in FOCUS and F) FOxTROT cohort, shown with DDIR threshold value at 0.1094 (red dash line). Statistics: Kruskal-Wallis rank sum test for global p-value. G) Boxplot depicting comparison of mutational burden in DDIR positive and DDIR negative tumours in FOCUS cohort, with overlay of MSI status. H) Comparison of mutational burden in DDIR positive and DDIR negative tumours in FOxTROT cohort. Statistics: Pearson’s Coefficient Correlation, Student’s t-test and Wilcoxon rank sum test.
G H

Supplementary Figure 6
D
B A
C
Supplementary Figure S6. Gene set enrichment analysis for FOCUS, FOxTROT and TRANSBIG cohorts. A) Dot plot of GSEA between DDIR negative (left panel) and DDIR positive (right panel) tumours with FDR significant (<25%) gene sets and size indicating number of genes in the gene set for FOCUS, B) FOxTROT and C) TRANSBIG cohort. D) Dot plot with significant gene sets identified in at least one or more cohorts (FOCUS, FOxTROT or TRANSBIG) indicated with dots and non-significant gene set as ‘ns’; the normalised enrichment score (NES) indicates the enrichment of gene set in DDIR positive (red) or DDIR negative (blue) tumours.

Supplementary Figure 7
Supplementary Figure S7. Contribution of stromal fibroblast infiltrates in DDIR negative tumours. A) Comparison of fibroblast MCP estimates between DDIR positive (red) and DDIR negative (blue) tumours shown in boxplot above scatterplot examining correlation between DDIR continuous score and fibroblast MCP score, with overlay of CMS samples in FOCUS and B) FOxTROT cohort.; line of best fit in black, DDIR threshold value at 0.1094 (red dash line). Statistics: Student’s t-test, Wilcoxon rank sum test and Pearson’s Coefficient Correlation.
A B

Supplementary Figure 8
B C
A Upstream Regulator Molecule Type Activation z-score Target Molecules in Dataset
IFNG cytokine 2.811 CCL5,CXCL10,CXCL9,IDO1,IFI44L,IFIT1,OAS2,UBD
IFNA2 cytokine 2.776 CCL5,CXCL10,CXCL9,IDO1,IFI44L,IFIT1,OAS2,UBD
TLR7 transmembrane receptor 2.63 CCL5,CXCL10,CXCL9,IDO1,IFI44L,IFIT1,OAS2
Interferon alpha group 2.603 CCL5,CXCL10,CXCL9,IDO1,IFI44L,IFIT1,OAS2,SLAMF7
IL1B cytokine 2.595 CCL5,CXCL10,CXCL9,IDO1,IFIT1,OAS2,UBD
IRF7 transcription regulator 2.568 CCL5,CXCL10,CXCL9,IDO1,IFI44L,IFIT1,OAS2
TNF cytokine 2.408 CCL5,CXCL10,CXCL9,IDO1,IFIT1,OAS2,UBD
STAT1 transcription regulator 2.403 CCL5,CXCL10,CXCL9,IDO1,IFI44L,IFIT1,OAS2,UBD
TLR9 transmembrane receptor 2.397 CCL5,CXCL10,CXCL9,IDO1,IFI44L,IFIT1,OAS2
IFN Beta group 2.234 CCL5,CXCL10,IDO1,IFIT1,OAS2
IFNB1 cytokine 2.23 CCL5,CXCL10,CXCL9,IDO1,IFIT1,OAS2
IFNL1 cytokine 2.229 CXCL10,CXCL9,IFI44L,IFIT1,OAS2
NFkB (complex) complex 2.187 CCL5,CXCL10,CXCL9,IDO1,UBD
RELA transcription regulator 2.187 CCL5,CXCL10,CXCL9,OAS2,UBD
PRL cytokine 2.176 CXCL10,CXCL9,IFI44L,IFIT1,OAS2
RNY3 other 2 CXCL10,IFI44L,IFIT1,OAS2
PAF1 other 2 CCL5,IDO1,IFI44L,OAS2
TGM2 enzyme 2 CXCL10,IFIT1,OAS2,SLAMF7
Supplementary Figure S8. Contribution of stromal fibroblast infiltrates in DDIR-negative tumours. A) Ingenuity pathway analysis (IPA) was used to identify potential elevated/activated upstream regulators of the conserved 9 genes B) Relationship of 9-gene score to CMS classification in the FOCUS cohort. C) Relationship of 9-gene score to MSI classification in the FOCUS cohort.