Automatic volumetric liver segmentation using texture based region growing
Upload
independentCategory
view
4download
0
Amygdala–hippocampal shape differences in schizophrenia: theapplication of 3D shape models to volumetric MR data
Martha E. Shentona,*, Guido Gerigb, Robert W. McCarleya, Gábor Székelyc, and RonKikinisd
aClinical Neuroscience Division, Laboratory of Neuroscience, Department of Psychiatry 116A, VABoston Healthcare System, Brockton Division, 940 Belmont Street, Harvard Medical School,Brockton, MA 02301, USA bDepartments of Computer Science and Psychiatry, University of NorthCarolina, Chapel Hill, NC, USA cCommunications Technology Laboratory, Swiss Federal Instituteof Technology, ETH, Zurich, Switzerland dSurgical Planning Laboratory, MRI Division, Departmentof Radiology, Brigham and Women’s Hospital, Harvard Medical School, Boston, MA, USA
AbstractEvidence suggests that some structural brain abnormalities in schizophrenia are neurodevelopmentalin origin. There is also growing evidence to suggest that shape deformations in brain structure mayreflect abnormalities in neurodevelopment. While many magnetic resonance (MR) imaging studieshave investigated brain area and volume measures in schizophrenia, fewer have focused on shapedeformations. In this MR study we used a 3D shape representation technique, based on sphericalharmonic functions, to analyze left and right amygdala-hippocampus shapes in each of 15 patientswith schizophrenia and 15 healthy controls matched for age, gender, handedness and parentalsocioeconomic status. Left/right asymmetry was also measured for both shape and volumedifferences. Additionally, shape and volume measurements were combined in a composite analysis.There were no differences between groups in overall volume or shape. Left/right amygdala–hippocampal asymmetry, however, was significantly larger in patients than controls for both relativevolume and shape. The local brain regions responsible for the left/right asymmetry differences inpatients with schizophrenia were in the tail of the hippocampus (including both the inferior aspectadjacent to parahippocampal gyrus and the superior aspect adjacent to the lateral geniculate nucleusand more anteriorly to the cerebral peduncles) and in portions of the amygdala body (including theanterior–superior aspect adjacent to the basal nucleus). Also, in patients, increased volumetricasymmetry tended to be correlated with increased left/right shape asymmetry. Furthermore, acombined analysis of volume and shape asymmetry resulted in improved differentiation betweengroups. Classification function analyses correctly classified 70% of cases using volume, 73.3% usingshape, and 87% using combined volume and shape measures. These findings suggest that shapeprovides important new information toward characterizing the pathophysiology of schizophrenia,and that combining volume and shape measures provides improved group discrimination in studiesinvestigating brain abnormalities in schizophrenia. An evaluation of shape deformations alsosuggests local abnormalities in the amygdala–hippocampal complex in schizophrenia.
© 2002 Elsevier Science Ireland Ltd. All rights reserved.*Corresponding author. Tel.: +1-508-583-4500x2479; fax: +1-508-580-0059. [email protected] (M.E. Shenton).
NIH Public AccessAuthor ManuscriptPsychiatry Res. Author manuscript; available in PMC 2010 February 18.
Published in final edited form as:Psychiatry Res. 2002 August 20; 115(1-2): 15–35.
NIH
-PA Author Manuscript
NIH
-PA Author Manuscript
NIH
-PA Author Manuscript

KeywordsSchizophrenia; Magnetic resonance imaging (MRI); Amygdala–hippocampal complex;Hippocampus; Neurodevelopmental abnormalities; Shape deformations; Shape analysis; Three-dimensional (3D) shape techniques; Shape descriptors
1. IntroductionMagnetic resonance (MR) imaging studies of schizophrenia, which began only in 1984 (Smithet al., 1984), have evolved from the use of 1-cm slices that did not cover the whole brain to1.5-mm slices of the entire brain (for a review, see Shenton et al., 1997, 2001; McCarley et al.,1999). This improvement in spatial resolution was needed to analyze small brain changesbetween normal controls and schizophrenic patients. The volume reductions observed inschizophrenia are, in fact, relatively small, on the order of 10–20% difference from controlsand, thus, improved measurement techniques were necessary before evidence could beaccumulated to suggest small volume reductions in the brains of schizophrenic patients.
Such evidence has now accumulated and there has been a proliferation of MR studiesdocumenting brain abnormalities in schizophrenia (e.g. Suddath et al., 1989, 1990; Barta et al.,1990; Bogerts et al., 1990; Dauphinais et al., 1990; DeLisi et al., 1991, 1994; Shenton et al.,1992; Andreasen et al., 1994; Marsh et al., 1994, 1997; Rossi et al., 1994a,b; Pearlson et al.,1997). In a recent review of the literature, the most robust MR findings in schizophrenia are:enlarged lateral ventricles (77% of studies); medial temporal lobe (amygdala–hippocampalcomplex and/or parahippocampal gyrus) volume reduction (77% of studies); and gray mattervolume reduction of superior temporal gyrus (100% of studies) (see Shenton et al., 1997,2001; McCarley et al., 1999).1 There is also growing evidence to suggest that at least somestructural brain abnormalities observed in schizophrenia are neurodevelopmental in origin. Thegeneral approach taken is to assume that if certain brain abnormalities could only have occurredduring neurodevelopment, then an abnormal finding at a later stage of development confirmsa neuro-developmental origin for that brain abnormality (e.g. Frangou and Murray, 1996;Bartley et al., 1997). For example, the sulco-gyral patterns in the brain are largely formedduring the third trimester (e.g. Chi et al., 1977; Sadler, 1981; Ono et al., 1990). Thus,abnormalities in the sulco-gyral pattern of the temporal lobe in schizophrenic patients, reportedin both post-mortem (e.g. Southard, 1910, 1915; Brown et al., 1986; Jakob and Beckmann,1986) and MR studies (e.g. Kikinis et al., 1994), suggest that such alterations are the result ofneurodevelopmental abnormalities. A further example of a neurodevelopmental abnormalityin schizophrenia is the cavum septum pellucidi (CSP). The CSP fuses in the latter part of neuraldevelopment, and therefore a space, or ‘cavum’, observed likely reflects deviations inneurodevelopment (e.g. Shaw and Alvord, 1969; Lewis and Mezey, 1985; Rossi et al., 1989;Sarwar, 1989; Nopoulos et al., 1996, 1997; Kwon et al., 1998). Of note, this fusion is thoughtto result from the rapid growth of the corpus callosum and the hippocampus, further suggesting
1Of particular note with respect to the current study, is our review of 46 MRI studies of the amygdala and hippocampus in schizophrenia(see Shenton et al., 2001), where we observed that of four studies that evaluated the amygdala alone, three showed reductions in theamygdala in patients with schizophrenia compared with control subjects. Furthermore, of 18 MRI studies that evaluated the hippocampusalone, 12 of 18 studies showed volume reduction in patients with schizophrenia compared to controls. Additionally, of seven MRI studiesthat evaluated the two structures separately in the same study, three out of seven showed both amygdala and hippocampal volume reductionin patients with schizophrenia compared with controls, while four out of seven studies showed no differences between patients withschizophrenia and controls for either structure. Finally, of 17 MRI studies that evaluated the amygdala-hippocampal complex, i.e. thetwo structures together, seven studies showed volume reduction in the amygdala-hippocampal complex in patients with schizophreniacompared with controls, while four did not; four out of 17 studies showed volume reductions in more posterior portions of the amygdala-hippocampal complex in patients with schizophrenia compared with controls; and three out of 17 showed volume reductions in moreanterior portions of the amygdala-hippocampal complex in patients with schizophrenia compared with controls. These findings wouldthus suggest that both the amygdala and the hippocampus appear to be abnormal in schizophrenia.
Shenton et al. Page 2
Psychiatry Res. Author manuscript; available in PMC 2010 February 18.
NIH
-PA Author Manuscript
NIH
-PA Author Manuscript
NIH
-PA Author Manuscript

that abnormalities in these two structures may be related, at least in part, to neurodevelopmentalabnormalities (e.g. Rakic and Yakovlev, 1968). Data from our laboratory confirm anassociation between CSP and hippocampus; large CSP was highly correlated with reducedhippocampal volume in chronic patients (Kwon et al., 1998). (Parenthetically, the hippocampuscan be affected by environmental events—see review and discussion in Gurvits et al., 1996;McEwen and Magarinos, 1997.) Additionally, planum temporale asymmetry, an importantbiological substrate of language, is established during neural development and it, too, has beenshown to be abnormal in schizophrenia, again suggesting the importance ofneurodevelopmental influences in the etiology of schizophrenia (e.g. DeLisi et al., 1994; Rossiet al., 1994a, Barta et al., 1995, 1997; Petty et al., 1995; Kwon et al., 1999).
Given the importance of neurodevelopmental influences in schizophrenia, it is of interest tonote that most studies in schizophrenia have investigated area, volume and asymmetry, butfewer (e.g. Csernansky et al., 1998) have evaluated shape, which may be importantly linkedto neurodevelopmental influences. For example, there is evidence to suggest that shapedeformations may be associated with the physical properties of morphogenetic mechanismsthat directly impact on the particular shape of brain regions during neurodevelopment (VanEssen, 1997; Van Essen and Drury, 1997; Van Essen et al., 1998). The physical tension ofbrain growth during neurodevelopment may lead to shape deformations that might be observedusing shape measures of brain structures.
Thus, midbrain structures, likely implicated in schizophrenia which, as noted above, includeboth the hippocampus and corpus callosum, are important brain regions to investigate inschizophrenia as they may show shape deformations that reflect neurodevelopmentalanomalies. A recent study by Thompson et al. (2000) further suggests the importance ofpatterns of brain growth and development, which takes place post-natally as well, and maylead to changes in volume, shape and asymmetry of brain structures in both normal andabnormal development.
In the current study, we investigated shape deformations in the amygdala–hippocampalcomplex in 15 male patients diagnosed with chronic schizophrenia, and 15 male controls, groupmatched for handedness, parental socioeconomic status and age.2 This brain region has figuredprominently in many MR volume findings in schizophrenia (see reviews in Shenton et al.,1997,2001;McCarley et al., 1999), and, as noted previously, the posterior portion of theamygdala–hippocampal complex has been associated with large CSP in patients diagnosedwith chronic schizophrenia (Kwon et al., 1998). This link further suggests an anomaly inneonatal development of midline brain structures. In the current study we focus on shapedifferences in the amygdala–hippocampal complex between groups.
Measures of shape are, nonetheless, complex. An entire field of computer science, in fact, hasfocused on quantitative descriptions of the shape of objects (e.g. Van Essen and Maunsell,1980; Caviness et al., 1988; Kass et al., 1988; Bajcsy and Kovacic, 1989; Bookstein, 1989,1997a,b,c; Evans et al., 1991; Cohen et al., 1992; Collins et al., 1992; Cootes and Taylor,
2Note: this data set was previously examined in our 1992 study (Shenton et al., 1992) where we reported a left anterior amygdala-hippocampal volume reduction in patients with schizophrenia compared with control subjects. In that study, we separated the amygdalaand hippocampus using the mammilary bodies. Results from our previous study showed no overall volume reduction in the combinedamygdala-hippocampal complex or in the hippocampus volume between groups. Volume reduction was, however, observed in patientswith schizophrenia compared with controls in the anterior portion of the amygdala-hippocampal complex, which corresponded primarilyto the amygdala. In the current study, we did not separate the amygdala and hippocampus because to do so we would have had to drawan arbitrary line between the two structures, which would have resulted in a flat region on both structures. As the shape of the amygdala-hippocampal complex is best appreciated as a continuous structure, we evaluated the shape of the entire amygdala-hippocampal complex,and not the amygdala and hippocampus separately. For this reason, our comparisons in this study are slightly different as they do notinvolve a separation of the amygdala and hippocampus, because we evaluated the amygdala-hippocampal complex (one structure) forboth the volume and shape measures.
Shenton et al. Page 3
Psychiatry Res. Author manuscript; available in PMC 2010 February 18.
NIH
-PA Author Manuscript
NIH
-PA Author Manuscript
NIH
-PA Author Manuscript
1992; Brechbühler et al., 1992; Hill and Taylor, 1992; Hill et al., 1992; Talbot and Vincent,1992; Cootes et al., 1993; Gee et al., 1993; Grenander, 1993; Christensen et al., 1994, 1996,1997; Attali and Montanvert, 1994; Brechbühler et al., 1995; Haller et al., 1996, 1997; Drury etal., 1996; Székely et al., 1996; Näf et al., 1996, 1997; Bookstein, 1997a,b,c; Joshi et al., 1997;Morse et al., 1998; Pizer et al., 1998; Angenent et al., 1999; Kelemen et al., 1999). Suchdescriptions have involved the use of a skeleton or medial axis to extract shape features (e.g.Blum, 1967, 1973; Bruce and Giblin, 1986; Talbot and Vincent, 1992; Ogniewicz, 1993; Attaliand Montanvert, 1994; Kimia et al., 1995; Näf et al., 1996, 1997; August et al., 1999; Gollandet al., 1999). Other approaches have included physically based shape representations such asthin-plate-splines and fiducials (e.g. Bookstein, 1989, 1997a,b,c; Pentland and Sclaroff,1991; DeQuardo et al., 1996), surface or contour based representations (e.g. Kass et al.,1988; Brechbühler et al., 1992; Cohen et al., 1992; Cootes and Taylor, 1992; Cootes et al.,1993a,b; Hill and Taylor, 1992; Brechbühler et al., 1995; Hill et al., 1992, 1993; Kelemen etal., 1997; Pizer et al., 1998; Angenent et al., 1999), including elastically deformable contourand surface models (e.g. Bajcsy and Kovacic, 1989; Evans et al., 1991; Collins et al., 1992;Gee et al., 1993; Christensen et al., 1994, 1996, 1997; Kelemen et al., 1999), and pattern-matching methods derived from the theory of patterns by Grenander (1993) (e.g. Haller et al.,1997; Csernansky et al., 1998). A clear trend in shape analysis is toward the movement fromsummary measures of whole structures or objects to measures of regional differences in shape,thus incorporating more information about the properties of shape than more simple volumetricmeasures. Shape descriptions that are represented as high-dimensional features (Haller et al.,1996, 1997; Csernansky et al., 1998; Hogan et al., 2000; Wang et al., 2001) or features derivedfrom a projection onto basis functions (Kelemen et al., 1999) are examples of this trend.
In this study we used an active, flexible deformable shape model to segment automatically theamygdala–hippocampal complex from MR image data. Models were trained from a set ofvolumes segmented manually by trained experts (derived from our previous study, Shenton etal., 1992). The surfaces of the training objects (amygdala–hippocampal complex) were thenconverted into parametric surface nets expanded into shape descriptions usingsphericalharmonic expansion (Brechbühler et al., 1995; Székely et al., 1996). The set of shapescharacterized by parameter vectors led to a statistical shape model describing the average objectshape and its major modes of variation. This statistical shape model was then used for thesegmentation of new datasets. Here, the average shape model was initialized based on a manualselection of three anatomical landmarks (anterior/posterior commissure and a point in theinterhemispheric fissure). This shape model was driven by the object boundaries of the newimage, although deformation was constrained by the statistics learned from the training sample,which significantly improves the robustness of the method (Kelemen et al., 1999). The resultingobjects were represented by a set of parameters, which were then used as input for subsequentclassical multivariate analyses to detect group differences in volume and in object surfacedescriptions (i.e. shape).
2. Methods and materials2.1. The sample
The patient sample consisted of 15 male, chronic schizophrenics who were selected fromamong patients at the Brockton Veterans Affairs Medical Center. This sample has been reportedin previous publications (e.g. Shenton et al., 1992). Briefly, 13 patients were hospitalized, andtwo were living in foster care homes. Their mean age was 37.6 years (±9.3), mean level ofeducation was 11.7 years, and parental socioeconomic status (PSES) was lower middle class(3.4±0.1, based on Hollingshead, 1965, classification). Mean age for onset of illness was 22.3±2.8 years, with mean duration of illness 15.7±8.8 years. Patients had spent 48% of their timein the hospital since first hospitalization (7.1±4.6 years). Criteria for patient selection were:
Shenton et al. Page 4
Psychiatry Res. Author manuscript; available in PMC 2010 February 18.
NIH
-PA Author Manuscript
NIH
-PA Author Manuscript
NIH
-PA Author Manuscript

(1) DSM-III-R (American Psychiatric Association, 1987) diagnosis of schizophrenia based oninformation obtained from chart reviews, and from the administration of the Schedule forAffective Disorders and Schizophrenia (SADS-Lifetime Version, Spitzer and Endicott,1978); (2) right handed; (3) between the ages 20 and 55 years old; (4) no history ofelectroconvulsive shock treatment; (5) no history of neurological illness; (6) no history of majoralcohol/drug dependence, and no history of alcohol/drug abuse in the previous 5 yearsdetermined by DSM-III-R diagnosis; (7) no medications known to affect MR of the brain, suchas steroids; and (8) verbal intelligence quotient (IQ) equal to or greater than 70, based on theWechsler Adult Intelligence Scale-Revised (WAIS-R) information subscale (Wechsler,1981).
The normal comparison group comprised 15 male subjects who were recruited from newspaperadvertisements. These subjects were screened for neurological and psychiatric histories, andwere matched to the patient sample on age, sex, handedness and PSES. Additional criteria forthe comparison subjects included no history of electroconvulsant shock treatment, neurologicalillness, or psychiatric illness in themselves or in their first degree relatives. Additionally, thecontrols met the criteria of evincing no lifetime history of drug/alcohol dependence or abusein the previous 5 years determined by DSM-III-R diagnosis.
All subjects signed informed consent prior to study participation. There were no differencesbetween the two groups on measures such as age, weight, head circumference, PSES, or theWAISR information subscale.
2.2. Clinical measuresThree instruments were used to assess type and severity of symptoms: the Scale for theAssessment of Positive Symptoms (SAPS, Andreasen, 1984), the Scale for the Assessment ofNegative Symptoms (SANS, Andreasen, 1981), and the Thought Disorder Index (TDI,Johnston and Holzman, 1979). Based on the Andreasen classification, 11 of the 15 patientsshowed predominantly positive symptoms, four showed mixed symptoms, and none showedmainly negative symptoms. The average score on the TDI was 60, median 40, where normalcontrols generally score below 5 (see Johnston and Holzman, 1979).
2.3. Image acquisition and processingMR scans were obtained of the entire brain using a 1.5-T General Electric SIGNA System (GEMedical Systems, Milwaukee, WI). Two acquisition protocols were used. The first acquisitionprotocol consisted of 108 contiguous double echo spin-echo 3-mm axial slices, which wereused to obtain total intracranial cavity contents. The imaging parameters were: Echo Time (TE)= 30 and 80 ms; Time to Repetition (TR) = 3000 ms; field of view = 24 cm; acquisition matrix= 256×256; and voxel dimensions = 0.9375×0.9375×3 (see Shenton et al., 1992 for details).The second acquisition protocol consisted of a 3-dimensional (3D) Fourier Transform SpoiledGradient-Recalled (3DFT SPGR) acquisition in a steady state, resulting in 124 contiguous 1.5-mm coronal slices, used to delineate the amygdala–hippocampal complex. The imagingparameters for this sequence were: TE = 35 ms, on repetition; nutation angle = 45°; field ofview = 24 cm; acquisition matrix = 256×256×124; voxel dimensions = 0.9375×0.9375×1.5.Automated segmentation techniques, as well as manual segmentation techniques, 3D sliceediting techniques that allow reformatting in three different planes, and 3D surface renderingtechniques (MRX tools developed in the Surgical Planning Laboratory, Brigham and Women’sHospital, in conjunction with General Electric), were applied to the MR datasets in order tocalculate the volumes of whole brain and tissue classes, as well as to delineate the amygdala–hippocampal complex.
Shenton et al. Page 5
Psychiatry Res. Author manuscript; available in PMC 2010 February 18.
NIH
-PA Author Manuscript
NIH
-PA Author Manuscript
NIH
-PA Author Manuscript
2.4. Building statistical 3D shape models and automatic segmentation2.4.1. Amygdala–hippocampal boundary definitions—In our previous volumetricstudies, we separated the amygdala and hippocampus by using an arbitrary but reliablelandmark for parcellating these two structures (see Shenton et al., 1992). We acknowledgedfrom the outset, however, that such measures were not perfect as they included both amygdalaand hippocampus in slices near the mamillary bodies, the boundary that we selected to dividethe two structures. For volume measures, however, we believed that because we were usingthe same landmarks for both patients and controls, any group differences we found would notbe the result of measurement error with respect to the two structures. The individual slices werethen summed to calculate the volume for the amygdala–hippocampal complex and these valueswere corrected for head size by using the ICC (region of interest/ICC × 100). In the currentstudy, we evaluated amygdala–hippocampal complex volumes from our previous study(Shenton et al., 1992; see also footnote 2), although we did not separate the volumes of theanterior portion of the amygdala–hippocampal complex (amygdala) from the posterior portionof the amygdala–hippocampal complex (hippocampus).
For measuring shape, the separation between the amygdala and hippocampus would havemeant cutting a straight line between the two structures. To place a straight line between thetwo structures would result in a change in the shape of the amygdala–hippocampal complex,with flat surfaces on both structures. For this reason, and because we were interested in boththe amygdala and the hippocampus, we chose not to separate the two structures. Accordingly,we measured the entire amygdala–hippocampal complex in both patients and controls for boththe volume and shape measures.
2.4.2. Statistical shape model—In this study we used an active, flexible deformable shapemodel for the automatic segmentation of the amygdala–hippocampal complex from MR imagedata. Here, volumetric binary segmentations of the amygdala–hippocampal complex of atraining set of controls and schizophrenics were processed using a surface parametrizationtechnique (Brechbühler et al., 1992, 1995). More specifically, object surfaces of the trainingobjects, in this case the manually segmented amygdala–hippocampal complex from ourprevious study (Shenton et al., 1992), were converted into parametric surface nets and expandedinto shape descriptions using spherical harmonic expansion (Brechbühler et al., 1995; Székelyet al., 1996).
This surface parametrization was then expanded into a series of spherical harmonic functions,where shapes are represented as weighted sums of basis functions with varying frequencies.This technique can be best explained by referring to the well-known Fourier transform thatrepresents signals in a frequency domain. The Fourier transform decomposes arbitrary signalsinto weighted sums of harmonic functions with a range of frequencies. Low frequenciesrepresent a coarse representation of the signal in terms of waves with large wave-length,whereas high frequencies add relevant information in regard to finely detailed spikes or sharpsignal changes, respectively. Similarly, in the shape description scheme presented here, loworder spherical harmonic functions represent coarse features of the three-dimensional structure,whereas adding higher order functions successfully adds details of object surfaces (see Fig. 1upper left to lower right). The weights, also called coefficients, determine the mixture of basisfunctions and form a compact representation to describe each object. As a result, each objectis described by a set of parameters and can be reconstructed with adjustable degrees ofapproximation.
We chose a maximum order of 10, resulting in 3*169 coefficients per object. All the objectswere aligned by translation to the surface centroid, and rotation to the three axes of the firstorder approximation, which is a 3D ellipsoid (Fig. 1 shows the objects reconstructed withdifferent degrees of approximation).
Shenton et al. Page 6
Psychiatry Res. Author manuscript; available in PMC 2010 February 18.
NIH
-PA Author Manuscript
NIH
-PA Author Manuscript
NIH
-PA Author Manuscript

We thus began our analyses by aligning MR datasets to a standard coordinate system and byusing manual segmentation from our previous study (Shenton et al., 1992). The surfaces of thesegmented objects were then converted into parametric surface nets and described by sphericalharmonic functions, resulting in a hierarchical 3D shape representation (Fig. 1).
The mean of the population of shapes can then be easily calculated as the mean of the vector-valued coefficients. The large set of parameters was then reduced by applying principalcomponent analysis (PCA). Based on the PCA, eigenvalues and eigenvectors were derived thatdescribe the variance and eigenmodes of shape deformation, sorted by decreasing importance/statistical significance (Cootes et al., 1994, 1995). This whole procedure results in a meanmodel of the amygdala–hippocampal complex and a description of its major modes ofdeformation. This representation can be described as a statistical object, which capturesvaluable information about normal and pathologic variability of organ shape.
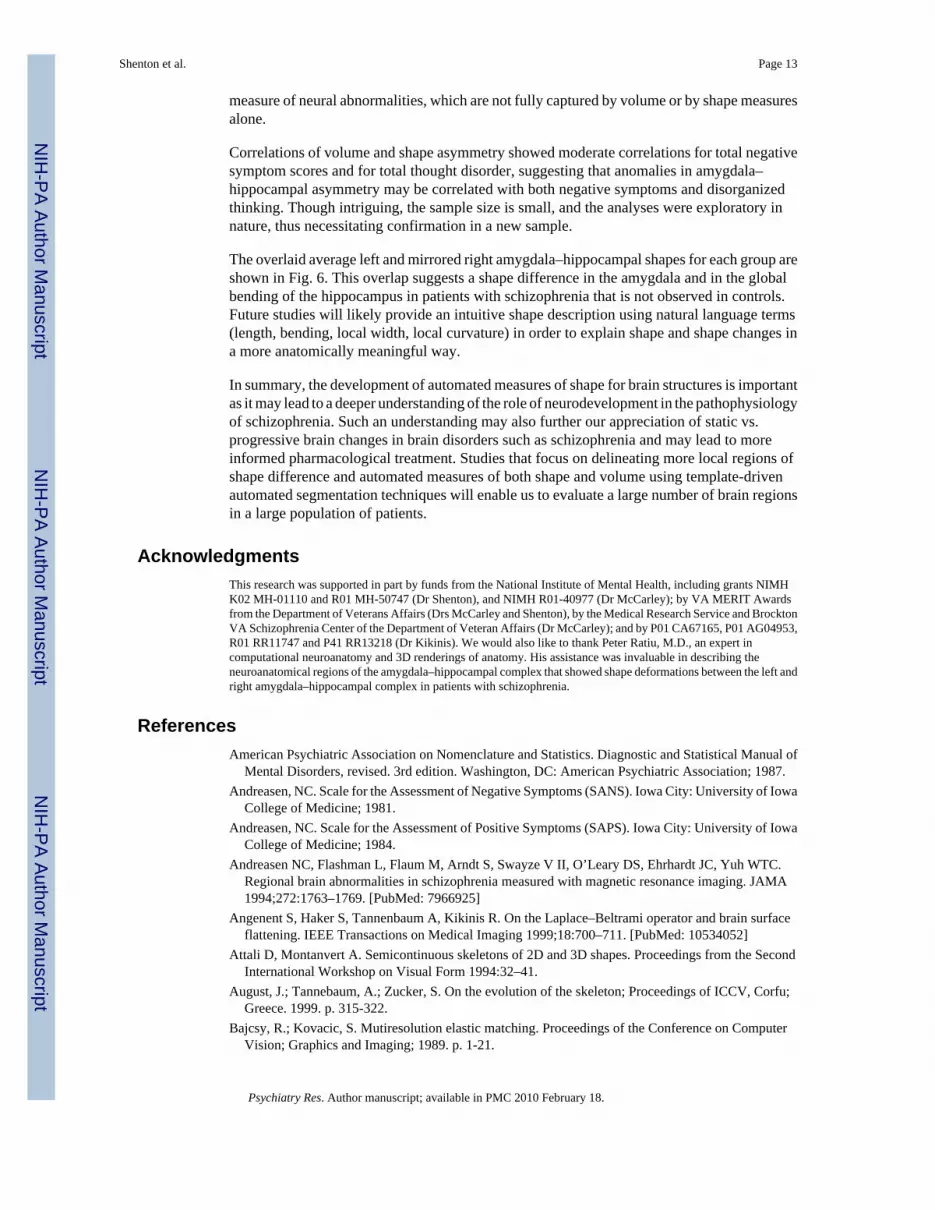
2.4.3. Segmentation by model deformation—The statistical shape model (above) wasthen used for automatic segmentation of the amygdala–hippocampal complex in MR imagesof the 15 controls and 15 patients. A detailed description of the methodology can be found in(Székely et al., 1996; Kelemen et al., 1997, 1999). The average amygdala–hippocampus modelwas initialized by manually defining three landmarks in each MRI, the anterior and posteriorcommissure, and a third point in the hemispheric fissure. An optimization process deforms themodel by attracting the model surface to the tissue boundary in the new image. Deformationof the model is, however, constrained by the shape statistics learned from the training shapes,which is a strong shape prior, and ensures a robust segmentation even in the presence of weakor non-existent boundary sections. Fig. 2 shows the initialization of the shape model (leftimages, blue contour and blue surface) and the resulting shapes after elastic deformation (rightimages, blue contour and blue surface). The result of the manual rater’s segmentation is overlaidfor comparison (green contour and red surface, respectively). The top row illustrates a regionof interest of a sagittal cut through the three-dimensional MR image with overlay of theboundaries. The bottom row shows three-dimensional surfaces of the objects before (left) andafter (right) elastic deformation (blue surfaces), with overlay of the manual expert’s (i.e. manualregions of interest from the Shenton et al., 1992 study) result (red surfaces).
The automatic segmentation takes approximately 20 minutes on a standard UNIX workstation,which is a significant improvement considering the 2–3 hours of manual segmentation by anexpert human rater. We tested the performance of the automatic segmentation by comparisonto manual segmentations obtained by highly reliable human experts (from our previous study).The human segmentation was our ‘gold standard’ (albeit imperfect), and we compared thiswith the surface parametrization methods by testing the resulting volumes and average shapesurface distance (see Fig. 3). Here, however, we faced the important question of training andtesting. Given the small sample set of 15 patients with schizophrenia and 15 control subjects,we could not apply the common strategy to split the dataset into half for training and half fortesting. Leave-one-out, on the other hand, had to be excluded due to computation timelimitations of repeated 3D shape modeling with varying sample collections and testing onexcluded subjects. As a simplified solution, we selected 21 shapes as a mixture of normalcontrols and patients in order to train the shape model. This model was then tested to segmentthe nine remaining shapes. Finally, it was used to segment all the 30 shapes using a fixed setof parameters to ensure consistency. We are aware of inherent limitations of the appliedscheme, and we plan to use larger datasets in future studies.
The correlation between manual segmentation (from our previous 1992 study) and machinesegmentation of the 21 left and right amygdala–hippocampal structures (n = 42) was r = 0.978,P < 0.001. Unbiased intra-class correlation was calculated as r = 0.977, P < 0.001 (Fig. 4illustrates the correlation between manual and automatic segmentation, and shows that the
Shenton et al. Page 7
Psychiatry Res. Author manuscript; available in PMC 2010 February 18.
NIH
-PA Author Manuscript
NIH
-PA Author Manuscript
NIH
-PA Author Manuscript

automatic segmentation comes very close to a human-expert segmentation, but has theadvantage of improved efficiency and optimal reproducibility). The result of segmentation bymodel deformation is not only a new object but at the same time a set of parameters representingthis object. This parametric description was then used as input for subsequent shape analysis.
2.5. Analysis of group differences2.5.1. Overall volume differences—We used analysis of variance measures to comparedifferences between groups for overall volume of the amygdala–hippocampal complex (total,and left and right). (Note: the shape measure is based on 3*369 parameters, and for this reasona simple t-test or ANOVA cannot be computed; see below.)
2.5.2. Volume asymmetry—The volume difference index |R−L|/(R+L) measures themagnitude of the right–left volume difference normalized by the sum. For a statistical analysiswe needed to consider that the magnitude and the ratio of the volume difference index createsnon-Gaussian distributions, which might violate basic assumptions for parametric Student t-tests. We, therefore, used statistical techniques to deal with this problem, first by applying amonotonic transformation to the measures to create Gaussian distributions, and second by usinga non-parametric method for testing the mean difference (Bradley and James, 1968).
We also used a measure more sensitive for discrimination than the P-values; classification rate,i.e. the percentage of correctly classified subjects after determining a discrimination function.A classification rate of 1 would indicate perfect classification, whereas 0.5 is only as good asa guess in a two-group classification. We calculated the maximum-likelihood ratio betweenthe two groups to calculate the classification rate. Furthermore, we applied a leave-one-outanalysis to determine the unbiased classification performance, which is a very important testfor robustness in view of the small sample size.
2.5.3. Shape analysis—The methodology applied in this article parameterizes the surfaceof single objects and provides a point-by-point correspondence between homologous surfacepoints. The shape representation by spherical harmonics is a hierarchical representation, i.e. acoarse to fine representation. We use this feature for a coarse alignment of objects prior tocalculation of shape difference. Brain shapes suitable for this method (and actually shapesalready studied) include: hippocampus; lateral ventricles; head of the caudate; thalamus;putamen; and globus pallidus, all simply shaped closed structures. Shapes are represented bya large set of parameters, in general several hundred, which differs from analyzing volumesrepresented by one scalar value. Therefore, any shape analysis requires a processing step forreducing dimensionality, e.g. principal component analysis (PCA) as used by Csernansky etal. (1998). Our method could be used similarly to reduce major shape effects to a fewcoefficients (major modes of shape variation) before studying group differences. This articlestudies asymmetry, i.e. the degree of structural difference between the left and right objects,in order to evaluate whether or not the disease process affects left and right structures to adifferent extent.
2.5.4. Shape asymmetry—After automatic segmentation, left and right shapes for eachsubject were not only segmented but also parameterized. More specifically, since thesegmentation is obtained by deformation of a parametric surface model, shape parameters wereautomatically derived for the newly segmented objects, and expressed as a weighted sum ofspherical harmonics, as explained previously.
For the shape asymmetry measures, rather than using the controls as a reference, each subjectserved as his own control, and deviations from overlapping the left and right amygdala–
Shenton et al. Page 8
Psychiatry Res. Author manuscript; available in PMC 2010 February 18.
NIH
-PA Author Manuscript
NIH
-PA Author Manuscript
NIH
-PA Author Manuscript

hippocampal surfaces were quantified for each subject in each group, and then the deviationsin millimeters between the left and right surface overlap were compared between groups.
To align shapes in a coordinate system for comparison purposes, we first took advantage ofthe mirrored symmetry of the amygdala–hippocampal complex by mirroring the right shapesat the mid-sagittal plane, determined by manual selection of the anterior and posteriorcommissure and a third landmark, the interhemispheric fissure. The process of shapecomparison further required a spatial alignment of objects by translation and rotation to acommon coordinate system. This is illustrated in Fig. 1, upper left, which shows that the firstorder shape representation of all the objects is an ellipsoid with major, middle and minor axescentered at the origin of the coordinate system. These axes are used to align all the shapes withthe centroid located at the origin, and the three axes of the first order ellipsoid aligned with thex, y and z axes. After alignment, objects can be superimposed to calculate pairwise shapedifferences. We chose the mean square difference (MSD) between corresponding surfacepoints of the left and mirrored right amygdala–hippocampal shapes as a shape differencemetric. Thus, the MSD provides information about the distance between overlaid left and rightamygdala–hippocampal shapes measured at corresponding points. The integrated measure,however, does not provide information about whether the left or right is anomalous, only thedegree to which the left and right are symmetrical.
An important question in shape analysis is not only the alignment of the object, as describedabove, but also the normalization of size, since objects of different size can still have similaror identical shape. The shape difference metric, described above, is sensitive to any sizechanges. For this reason, we scaled each object individually to normalize for size. Thus, wederived a metric that measures the residual shape difference after scaling all objects for unitsize.
Finally, similar to the volume analysis, above, we determined the unbiased classificationperformance based on the maximum-likelihood ratio.
2.5.5. Shape differences based on combined analysis of volume and shape—Inaddition to the statistical analysis of left/right volume and shape asymmetry, we also tested acomposite analysis of both measures. This combined analysis is motivated by the observationthat volume asymmetry and shape asymmetry (after normalization for volume differences)may show significant group differences. We used a technique that is common in multivariatedata analysis. Each subject is characterized by two measures, the left/right volume differenceand the left/right shape difference. The two measures are then plotted in a two-dimensionaljoint histogram to illustrate possible correlations. Standard statistical analysis calculates firstand second order statistics, here mean and covariance matrix, for each group (see quartileellipsoids in Fig. 5, in the bottom panel) and tests the mean difference by a multivariateclassification. This test assumes distributions to be approximated by parametricmultidimensional Gaussian distributions. We then calculate the log likelihood ratio for eachsubject, which is used for standard mean difference tests and for unbiased classificationperformance based on leave-one-out tests.
3. Results3.1. Volume analysis
Volumes were normalized by total intracranial volume (ICV) to control for individual headsize. An ANOVA showed no differences between groups on total amygdala–hippocampalcomplex (F = 1.74; d.f. = 1,56; P = 0.19), no differences in left or right amygdala–hippocampalcomplex (F = 0.74, d.f. = 1, 56, P = 0.39), and no group by side interaction (F = 0.001; d.f. =1,56; P = 0.072) (see also t-tests in Table 1). [Note: in our earlier study (Shenton et al.,
Shenton et al. Page 9
Psychiatry Res. Author manuscript; available in PMC 2010 February 18.
NIH
-PA Author Manuscript
NIH
-PA Author Manuscript
NIH
-PA Author Manuscript

1992), differences in volume were reported between groups for left amygdala, but this wasbased on a separation of the amygdala and hippocampus, and not based on the amygdala–hippocampus combined, as is the case in the current study. See also Fig. 2.]
When evaluating left/right asymmetry, however, differences were statistically significantbetween the two groups (F = 10.40; d.f. = 1,28; P < 0.0032) (see columns labeled as ‘relativevolume difference’ in Table 1 and plotted in Fig. 5, on the left). This finding demonstrates alarger difference between the left and right volumes in the patients compared to the controls.Finally, the unbiased classification performance was 70% (21 out of 30), which is better thanchance (50%) (see Table 2).
3.2. Summary of volume and shape asymmetryIn testing group asymmetry differences (see Table 1), we evaluated relative R/L volumedifference and R/L shape difference, where we clearly show that the patient group has increasedasymmetry in both measures (see also plot in Fig. 5, on the right). These measures demonstrateincreased asymmetry of schizophrenia compared to control subjects.
3.2.1. Shape analysis—We calculated shape differences between groups using the meansquare difference (MSD) between corresponding points of pairs of surfaces, after normalizingall shapes to unit volume. The choice of this measure was motivated by the speculation that apathological process might result in a deformation of a structure in addition to a size changein that structure.
In order to evaluate deformation of a structure, independent of volume, we normalized shapeby unit volume. Of note, results showed statistically significant group differences in the shapeindex (F = 5.00; d.f. = 1,28; P < 0.034). More specifically, the distance between left and rightshape surfaces, expressed in millimeters, was larger in the patient than in the control group(see Fig. 5, middle), suggesting that amygdala–hippocampal shapes are less similar inschizophrenics than in controls. This result is of particular interest since we first normalizedfor volume differences before measuring shape asymmetry, suggesting that the shapeasymmetry provides additional information to volume for studying group differences. Theunbiased classification performance was 73.3% (22 out of 30), which is slightly better than thevolume analysis (see Table 2).
An example of the difference between left and right amygdala–hippocampal average shapesfor both controls and patients with schizophrenia can be seen in Fig. 6. Here, a graphicalvisualization is presented for left/right asymmetry. Shapes were uniformly scaled fornormalized volumes, and the color figures display group averages of individual pairwise left/right difference calculations. These averages were obtained by mirroring the right shapes tothe left, and then overlaying the individual pairs of the amygdala–hippocampal surfaces. Thesigned local surface distances are mapped onto the reference shape as color, ranging from darkblue (maximum inside, the right object surface is inside the left) to red (maximum outside, theright object surface is outside the left). The green color signifies perfect overlap. A comparisonbetween the two groups shows that the major local regions responsible for the left/right shapedifferences in patients with schizophrenia are in the tail of the hippocampus and in portions ofthe amygdala body. More specifically, deformations of the hippocampus for the patients appearto be in the inferior aspect, adjacent to the parahippocampal gyrus, and in the superior aspect,adjacent to the lateral geniculate nucleus and more anteriorly to the cerebral peduncles.Furthermore, deformations in the shape of the amygdala for the patients appear to be in theanterior–superior aspect of the amygdala, adjacent to the basal nucleus region (Peter Ratiu,M.D., expert in computational neuroanatomy and 3D rendering of neuroanatomy reviewed thisfigure with us). These findings suggest a major shape difference in the amygdala and in theglobal bending of the hippocampus in patients with schizophrenia that is not observed in
Shenton et al. Page 10
Psychiatry Res. Author manuscript; available in PMC 2010 February 18.
NIH
-PA Author Manuscript
NIH
-PA Author Manuscript
NIH
-PA Author Manuscript
controls. This information thus provides preliminary insight into the nature and localization ofthe quantitative shape asymmetry as described elsewhere in this study.
3.2.2. Combination of volume and shape features—Our volumetric analysis and theanalysis of shape, normalized for individual volume, suggests that both measures should becombined for a group difference analysis. Fig. 5, on the right, shows the two-dimensionalfeature space with the volume index on the horizontal axis and the shape index on the verticalaxis. This figure suggests that a combination of the two measures will likely improve thediscrimination between patients and controls, and this is borne out using multivariate analyses,which highlight the optimal discrimination function.
More specifically, the ellipses overlaid on the data points express the quartiles of the two-dimensional Gaussian distributions fitting the data. We calculated a log likelihood ratio thatgives each data point a likelihood to be in either one of the two groups (F = 11.19; d.f. = 1,28;P < 0.0024). This finding demonstrates that a combination of both features (volume and shape)results in an improved discrimination between groups. The classification performance can bedetermined, similar to the single variable as described above, by calculating the maximum-likelihood ratio between the two distributions. However, in view of the small sample size, andthe difficulty in getting robust estimates of the two-dimensional distribution functions, wedecided to apply another classifier, called support vector machine (SVM, Vapnik 1995,1998). This classifier uses both features, the volume asymmetry index and the shape asymmetryindex, to calculate the best separating discrimination function in the two-dimensional featurespace as shown in Fig. 5, on the right. Again, leave-one-out was applied to get an unbiasedclassification performance. The unbiased classification performance, using support vectormachine classification, increased to 87% (26 out of 30), which is significantly better than theclassification rate obtained using either the volume or shape index alone (see above). Thisincrease in performance is clearly visible in the right plot in Fig. 5, where the quartile ellipsesgive a visual impression of group separation, which can also be seen in Table 2.
The plot in Fig. 5, on the right, suggests yet another finding. The horizontally aligned quartileellipsoids of the control group demonstrate that left/right volume differences are smaller incontrols compared to schizophrenics (F = 10.40; d.f. = 1,28; P < 0.0032). The left/right shapedifferences calculated from volume-normalized shapes, presented along the vertical axis,demonstrate smaller differences compared to schizophrenics (F = 5.00; d.f. = 1,28; P < 0.034).The quartile ellipses visually suggest smaller variability for controls than for patients withschizophrenia.
One possible explanation for this finding is that controls have a natural left/right volumedifference in the amygdala–hippocampal complex, but that their volume-normalized shapesare highly symmetric. On the other hand, patients with schizophrenia showed a much largerleft/right volume lateralization but also a much larger left/right shape difference, which showeda trend for increasing linearly with increasing volume difference (correlation r = 0.31; P <0.13).
3.3. Clinical correlates of volume and shapeWe were interested in whether or not negative symptoms measured using the SANS, positivesymptoms measured using the SAPS, and/or disorganized thinking measured using the TDIwould be correlated with our volume or shape measures. As these were exploratory analyses,we were conservative and used two-tailed t-tests. Volume asymmetry was correlated r = 0.42(n = 8, P = 0.14) with total negative symptoms, r = 0.37 (n = 8, P = 0.26) with total positivesymptoms, and r = 0.472 (n = 12, P = 0.058) with total thought disorder. Shape asymmetrywas correlated r = 0.601 with total negative symptoms (P = 0.051), r = 0.098 with total positivesymptoms (P = 0.41), and r = 0.348 (P = 0.13) and r−0.463 (P = 0.062) with total TDI and
Shenton et al. Page 11
Psychiatry Res. Author manuscript; available in PMC 2010 February 18.
NIH
-PA Author Manuscript
NIH
-PA Author Manuscript
NIH
-PA Author Manuscript
total TDIlog, respectively. A combined shape and volume measure correlated r = 0.366 (P =0.18) with total negative symptoms, r = 0.393 (P = 0.16) with total positive symptoms, and r= 0.476 (P = 0.060) with total TDI. As the sample sizes here are quite small, albeit withmoderate effect sizes for total negative symptoms and TDI (i.e., 0.4 or more), confirmation ofthese findings in a new sample is needed.
4. DiscussionWe evaluated volume and shape differences in the amygdala–hippocampal complex betweenpatients diagnosed with schizophrenia and normal comparison subjects. We found nodifferences in overall amygdala–hippocampal volume between groups, but we did report bothvolume and shape asymmetry differences, which were significantly larger in the patient thanin the control group. More specifically, we observed a closer correspondence between theshapes of the left and right amygdala–hippocampal complex in normal controls than weobserved in patients with schizophrenia. In the patient group, there was a greater mean squaredifference (MSD) between corresponding points of pairs of surfaces, after normalizing allshapes to unit volume, between the left and right amygdala–hippocampal shapes than wasobserved for the control group.
Findings of laterality differences in schizophrenia in the amygdala–hippocampal complex havebeen reported by other groups evaluating volume (see discussion and citations in Section 1 andsee also the footnotes), and thus our finding is consistent with what has been reported in theliterature. Our findings of shape differences in the amygdala–hippocampal complex inschizophrenic patients are also consistent with the findings reported for the hippocampus byCsernansky et al. (1998), although these investigators reported deformations in thehippocampal head on both the left and the right sides in schizophrenic patients. These findingsindicate that morphology reflects a pathological process. The measures presented in this article,however, do not fully explain the nature and the precise location and lateralization of this effect,although there is preliminary evidence to suggest that the tail of the hippocampus and portionsof the amygdala body are abnormal in schizophrenia.
The left/right asymmetry findings in this study can be compared to recent findings by Wanget al. (2001), with the difference being that we studied the amygdala–hippocampal complexrather than the hippocampus alone. In comparison to shape analysis by high-dimensionalwarping (Csernansky et al., 1998; Wang et al., 2001; Hogan et al., 2000; Joshi et al., 1997),we used a completely different methodology that extracts and parameterizes individual objects,determines spatial alignment and normalization, and then calculates a shape difference metric(mean square distance between corresponding surfaces) to express shape difference. A newcomponent is the individual normalization by volume before calculation of the shapedifference. We observed that most shape difference metrics can be sensitive to volume changes,which means that even identical shapes with different volumes would present a shapedifference. In the application described herein, left/right volume differences have been foundas one discriminating feature. As a logical consequence, we decided to calculate shapedifferences that were ‘orthogonal’ to volume.
The shape lateralization in our study shows more lateralization for schizophrenics thancontrols. The result is significant at less than the 5% level (F = 5.00; d.f. = 1,28; P < 0.034).This finding, in itself, suggests that the shape of this structure is altered in patients diagnosedwith schizophrenia. A significant improvement in the separation between groups wasdemonstrated by combining both volume and shape features, resulting in an increase of theclassification performance from 70 to 73 to 87%. This result corroborates the fact that shapeinformation in addition to volume analysis improves group discrimination and potentially helpsto explain pathology. The combined measure turns out to be a more sensitive and critical
Shenton et al. Page 12
Psychiatry Res. Author manuscript; available in PMC 2010 February 18.
NIH
-PA Author Manuscript
NIH
-PA Author Manuscript
NIH
-PA Author Manuscript
measure of neural abnormalities, which are not fully captured by volume or by shape measuresalone.
Correlations of volume and shape asymmetry showed moderate correlations for total negativesymptom scores and for total thought disorder, suggesting that anomalies in amygdala–hippocampal asymmetry may be correlated with both negative symptoms and disorganizedthinking. Though intriguing, the sample size is small, and the analyses were exploratory innature, thus necessitating confirmation in a new sample.
The overlaid average left and mirrored right amygdala–hippocampal shapes for each group areshown in Fig. 6. This overlap suggests a shape difference in the amygdala and in the globalbending of the hippocampus in patients with schizophrenia that is not observed in controls.Future studies will likely provide an intuitive shape description using natural language terms(length, bending, local width, local curvature) in order to explain shape and shape changes ina more anatomically meaningful way.
In summary, the development of automated measures of shape for brain structures is importantas it may lead to a deeper understanding of the role of neurodevelopment in the pathophysiologyof schizophrenia. Such an understanding may also further our appreciation of static vs.progressive brain changes in brain disorders such as schizophrenia and may lead to moreinformed pharmacological treatment. Studies that focus on delineating more local regions ofshape difference and automated measures of both shape and volume using template-drivenautomated segmentation techniques will enable us to evaluate a large number of brain regionsin a large population of patients.
AcknowledgmentsThis research was supported in part by funds from the National Institute of Mental Health, including grants NIMHK02 MH-01110 and R01 MH-50747 (Dr Shenton), and NIMH R01-40977 (Dr McCarley); by VA MERIT Awardsfrom the Department of Veterans Affairs (Drs McCarley and Shenton), by the Medical Research Service and BrocktonVA Schizophrenia Center of the Department of Veteran Affairs (Dr McCarley); and by P01 CA67165, P01 AG04953,R01 RR11747 and P41 RR13218 (Dr Kikinis). We would also like to thank Peter Ratiu, M.D., an expert incomputational neuroanatomy and 3D renderings of anatomy. His assistance was invaluable in describing theneuroanatomical regions of the amygdala–hippocampal complex that showed shape deformations between the left andright amygdala–hippocampal complex in patients with schizophrenia.
ReferencesAmerican Psychiatric Association on Nomenclature and Statistics. Diagnostic and Statistical Manual of
Mental Disorders, revised. 3rd edition. Washington, DC: American Psychiatric Association; 1987.Andreasen, NC. Scale for the Assessment of Negative Symptoms (SANS). Iowa City: University of Iowa
College of Medicine; 1981.Andreasen, NC. Scale for the Assessment of Positive Symptoms (SAPS). Iowa City: University of Iowa
College of Medicine; 1984.Andreasen NC, Flashman L, Flaum M, Arndt S, Swayze V II, O’Leary DS, Ehrhardt JC, Yuh WTC.
Regional brain abnormalities in schizophrenia measured with magnetic resonance imaging. JAMA1994;272:1763–1769. [PubMed: 7966925]
Angenent S, Haker S, Tannenbaum A, Kikinis R. On the Laplace–Beltrami operator and brain surfaceflattening. IEEE Transactions on Medical Imaging 1999;18:700–711. [PubMed: 10534052]
Attali D, Montanvert A. Semicontinuous skeletons of 2D and 3D shapes. Proceedings from the SecondInternational Workshop on Visual Form 1994:32–41.
August, J.; Tannebaum, A.; Zucker, S. On the evolution of the skeleton; Proceedings of ICCV, Corfu;Greece. 1999. p. 315-322.
Bajcsy, R.; Kovacic, S. Mutiresolution elastic matching. Proceedings of the Conference on ComputerVision; Graphics and Imaging; 1989. p. 1-21.
Shenton et al. Page 13
Psychiatry Res. Author manuscript; available in PMC 2010 February 18.
NIH
-PA Author Manuscript
NIH
-PA Author Manuscript
NIH
-PA Author Manuscript

Barta PE, Pearlson GD, Brill LB, Royall R, McGilchrist IK, Pulver AE, Powers RE, Casanova MF, TienAY, Frangou S, Petty PG. Planum temporale asymmetry reversal in schizophrenia: replication andrelationship to gray matter abnormalities. American Journal of Psychiatry 1997;154:661–667.[PubMed: 9137122]
Barta PE, Pearlson GD, Powers RE, Richards SS, Tune LE. Auditory hallucinations and smaller superiortemporal gyrus volume in schizophrenia. American Journal of Psychiatry 1990;147:1457–1462.[PubMed: 2221156]
Barta PE, Petty RG, McGilchrist I, Lewis RW, Jerram M, Casanova MF, Powers RE, Brill LB II, PearlsonGD. Asymmetry of the planum temporale: methodological considerations and clinical associations.Psychiatry Research: Neuroimaging 1995;61:137–150.
Bartley AJ, Jones DW, Weinberger DR. Genetic variability of human brain size and cortical gyralpatterns. Brain 1997;120:257–269. [PubMed: 9117373]
Blum, H. A transformation for extracting new descriptors of shape. In: Walthen-Dunn, W., editor. Modelsfor the Perception of Speech and Visual Form. Cambridge, MA: MIT Press; 1967.
Blum H. Biological shape and visual science. Journal of Theoretical Biology 1973;38:205–287. [PubMed:4689997]
Bogerts B, Ashtari M, Degreef G, Alvir JM, Bilder RM, Lieberman JA. Reduced temporal limbic structurevolumes on magnetic resonance images in first episode schizophrenia. Psychiatry Research:Neuroimaging 1990;35:1–13.
Bookstein FL. Principal warps: thin-plate splines and the decomposition of deformations. IEEE PAMI1989;11:567–585.
Bookstein FL. Shape and information in medical images: a decade of the morphometric synthesis.Computer Vision and Image Understanding 1997a;66:97–118.
Bookstein FL. Landmark methods for forms without landmarks: localizing group differences in outlineshape. Medical Image Analysis 1997b;1:225–243. [PubMed: 9873908]
Bookstein, FL. Quadratic variation of deformation. In: Duncan, J.; Gindi, G., editors. Proceedings IPMI.Vol. 1230. Springer LNCS; 1997c. p. 15-28.
Bradley, JV. Distribution Free Statistical Tests. Englewood Cliffs, NJ: Prentice Hall; 1968.Brechbühler C, Gerig G, Kübler O. Surface parametrization and shape description. Visualization in
Biomedical Computing 1992:80–89.Brechbühler C, Gerig G, Kübler O. Parametrization of closed surfaces for 3-D shape description. CVGIP:
Image Understanding 1995;61:154–170.Brown R, Colter N, Corsellis JAN, Crow TJ, Frith CD, Jagoe R, Johnstone EC, Marsh L. Postmortem
evidence of structural changes in schizophrenia: differences in brain weight, temporal horn area andparahippocampal gyrus compared with affective disorders. Archives of General Psychiatry1986;43:36–42. [PubMed: 2935114]
Bruce J, Giblin B. Growth, motion and one-parameter families of asymmetry sets. Proceedings of theRoyal Society of Edinburgh 1986;104A:179–204.
Caviness VS, Filipek PA, Kennedy DN. Magnetic resonance technology in human brain science:blueprint for a program based upon morphometry. Brain and Development 1988;11:1–13. [PubMed:2646959]
Chi JG, Dooling EC, Gilles FH. Gyral development of the brain. Annals of Neurology 1977;1:86–93.[PubMed: 560818]
Christensen, GE.; Miller, MI.; Vannier, M. Proceedings of an AAAI Workshop: Application of ComputerVision in Medical Image Processing. Stanford University: 1994. A 3D deformable magneticresonance textbook based on elasticity; p. 153-156.
Christensen GE, Rabbit RD, Miller MI. Deformable templates using large deformation kinematics. IEEETransactions on Image Processing 1996;5:1435–1447. [PubMed: 18290061]
Christensen GE, Joshi SC, Miller MI. Volumetric transformation of brain anatomy. IEEE Transactionson Medical Imaging 1997;16:864–877. [PubMed: 9533586]
Cohen I, Cohen LD, Ayache N. Using deformable surfaces to segment 3-D images and infer differentialstructures. CVGIP: Image Understanding 1992;56:242–263.
Shenton et al. Page 14
Psychiatry Res. Author manuscript; available in PMC 2010 February 18.
NIH
-PA Author Manuscript
NIH
-PA Author Manuscript
NIH
-PA Author Manuscript

Collins DL, Peters TM, Dai W, Evans AC. Model based segmentation of individual brain structures fromMRI data. SPIE Visualization in Biomedical Computing 1992;1801:10–23.
Cootes TF, Cooper D, Taylor CJ, Graham J. Active shape models—their training and application.Computer Vision and Image Understanding 1995;61:31–59.
Cootes T, Hill A, Taylor C, Haslam J. The use of active shape models for locating structures in medicalimages. IPMI, Flagstaff, AZ 1993a:3–47.
Cootes, TF.; Hill, A.; Taylor, CJ.; Haslam, J. The use of active shape models for locating structures inmedical images. Information Processing in Medical Imaging. In: Barrett, HH.; Gmitro, AF., editors.Lecture Notes in Computer Science. Vol. 687. Berlin: Springer-Verlag; 1993b. p. 33-47.
Cootes TF, Hill A, Taylor CJ, Haslam J. The use of active shape models for locating structures in medicalimages. Image and Vision Computing 1994;12:355–366.
Cootes, T.; Taylor, C. Active shape models—‘smart snakes’; British Mach Vision Conf; Berlin: Springer–Verlag; 1992. p. 266-275.
Csernansky JC, Joshi SC, Wang L, Gado M, Miller JP, Grenander U, Miller MI. Hippocampalmorphometry in schizophrenia by high dimensional brain mapping. Proceedings of the NationalAcademy of Sciences of the Unites States of America 1998;95:11406–11411.
Dauphinais DI, DeLisi LE, Crow TJ, Alexandropoulos K, Colter N, Tuma I, Gershon ES. Reduction intemporal lobe size in siblings with schizophrenia: a magnetic resonance imaging study. PsychiatryResearch: Neuroimaging 1990;35:137–147.
DeLisi LE, Hoff AL, Neale C, Kushner M. Asymmetries in the superior temporal lobe in male and femalefirst-episode schizophrenic patients: measures of planum temporale and superior temporal gyrus byMRI. Schizophrenia Research 1994;12:19–28. [PubMed: 8018582]
DeLisi LE, Hoff AL, Schwartz JE, Shields GW, Halthore SN, Gupta SM, Henn FA, Anand AK. Brainmorphology in first-episode schizophrenic-like psychotic patients: a quantitative magnetic resonanceimaging study. Biological Psychiatry 1991;29:159–175. [PubMed: 1995085]
DeQuardo JR, Tandon R, Brunberg JA, Green WD, Bookstein FL. Spatial relationships of neuroanatomiclandmarks in schizophrenia. Psychiatry Research: Neuroimaging 1996;67:81–95.
Drury HA, Van Essen DC, Anderson CH, Lee CW, Coogan TA, Lewis JW. Computerized mappings ofthe cerebral cortex. A multiresolution flattening method and a surface-based coordinate system.Journal of Cognitive Neuroscience 1996;8:1–28. [PubMed: 11539144]
Evans A, Dai W, Collins L, Neelin P, Marret S. Warping of a computerized 3D atlas to match brain imagevolumes for quantitative neuroanatomical and functional analysis. Image Processing 1991;1445:236–246.
Frangou S, Murray RM. Imaging as a tool in exploring the neurodevelopment and genetics ofschizophrenia. British Medical Bulletin 1996;52:587–596. [PubMed: 8949259]
Gee JC, Reivich M, Bajcsy R. Elastically deforming 3D atlas to match anatomical brain images. Journalof Computer Assisted Tomography 1993;17:225–236. [PubMed: 8454749]
Golland, P.; Grimson, WE.; Kikinis, R. Statistical shape analysis using fixed topology skeletons: corpuscallosum study. In: Kuba, A., editor. IPMI LNCS. Vol. 161. Berlin: Springer–Verlag; 1999. p.382-387.
Grenander, U. General Pattern Theory. London, England: Oxford University Press; 1993.Gurvits TV, Shenton ME, Hokama H, Ohta H, Lasko NB, Gilbertson MW, Orr SP, Kikinis R, Jolesz FA,
McCarley RW, Pitman RK. Magnetic resonance imaging study of hippocampal volume in chronic,combat related posttraumatic stress disorder. Biological Psychiatry 1996;40:1091–1099. [PubMed:8931911]
Haller JW, Banerjee A, Christensen GE, Gado M, Joshi S, Miller MI, Sheline YI, Vannier MW,Csernansky JG. 3D hippocampal morphometry by high dimensional transformation of aneuroanatomical atlas. Radiology 1997;202:504–510. [PubMed: 9015081]
Haller J, Christensen GE, Joshi SC, Newcomer JW, Miller MI, Csernansky JG, Vannier MW.Hippocampal MR imaging morphometry by means of general pattern matching. Radiology1996;199:787–791. [PubMed: 8638006]
Hill, A.; Cootes, TF.; Taylor, CJ. A generic system for image interpretation using flexible templates;Proc. British Mach. Vision Conf; Springer; 1992. p. 276-285.
Shenton et al. Page 15
Psychiatry Res. Author manuscript; available in PMC 2010 February 18.
NIH
-PA Author Manuscript
NIH
-PA Author Manuscript
NIH
-PA Author Manuscript

Hill A, Taylor CJ. Model-based image interpretation using genetic algorithms. Image and VisionComputing 1992;10:295–300.
Hill, A.; Thornham, A.; Taylor, CJ. Model-based interpretations of 3-D medical images; Proc. BritishMach. Vision Conf; BMVC Press; 1993. p. 239-348.
Hogan RE, Mark KE, Wang L, Joshi S, Miller MI, Bucholz RD. Mesial temporal sclerosis and temporallobe epilepsy: MR imaging deformation-based segmentation of the hippocampus in five patients.Radiology 2000;216:291–297. [PubMed: 10887264]
Hollingshead, AB. Two-Factor Index of Social Position. New Haven, CT: Yale University Press; 1965.Jakob H, Beckmann H. Prenatal developmental disturbances in the limbic allocortex in schizophrenics.
Journal of Neural Transmission 1986;65:303–326. [PubMed: 3711886]Johnston, MH.; Holzman, PS. Assessing Schizophrenic Thinking: A Clinical and Research Instrument
for Measuring Thought Disorder. San Francisco, CA: Jossey-Bass; 1979.Joshi S, Grenander U, Miller MI. On the geometry and shape of brain sub-manifolds. International Journal
of Pattern Recognition and Artificial Intelligence 1997;11:1317–1343.Kass M, Witkin A, Terzopoulos D. Snakes: active contour models. International Journal Computer Vision
1988;1:321–331.Kelemen, A.; Székely, G.; Gerig, G. MB3IA Workshop, ICCV98, Bombay, India. TR-178 Technical
Report. ETH, Zurich: Image Science Lab; 1997. Three-dimensional model-based segmentation.Kelemen A, Székely G, Gerig G. Elastic model-based segmentation of 3D neuroradiological data sets.
IEEE Transactions on Medical Imaging 1999;18:828–839. [PubMed: 10628943]Kikinis R, Shenton ME, Gerig G, Hokama H, Haimson J, O’Donnell BF, Wible CG, McCarley RW,
Jolesz FA. Temporal lobe sulco-gyral pattern anomalies in schizophrenia: an in vivo MR three-dimensional surface rendering study. Neuroscience Letters 1994;183:7–12. [PubMed: 7891892]
Kimia B, Tannebaum A, Zucker S. Shapes, shocks, and deformations: I: The components of shape andthe reaction-diffusion space. International Journal of Computer Vision 1995;15:189–224.
Kwon JS, McCarley RW, Anderson JE, Hirayasu Y, Fischer IA, Kikinis R, Jolesz FA, Shenton ME. Leftplanum temporale volume reduction in schizophrenia. Archives of General Psychiatry 1999;56:142–148. [PubMed: 10025438]
Kwon JS, Shenton ME, Hirayasu Y, Salisbury DF, Fischer IA, Dickey CC, Yurgelun-Todd D, Tohen M,Kikinis R, Jolesz FA, McCarley RW. MRI study of cavum septi pellucidi in schizophrenia, affectivedisorder and schizotypal personality disorder. American Journal of Psychiatry 1998;155:509–515.[PubMed: 9545997]
Lewis SW, Mezey GC. Clinical correlates of septum pellucidum cavities: an unusual association inpsychosis. Psychological Medicine 1985;15:43–54. [PubMed: 2581281]
Marsh L, Harris D, Lim KO, Beal M, Hoff AL, Minn K, Csernansky JG, DeMent S, Faustman WO,Sullivan EV, Pfefferbaum A. Structural magnetic resonance imaging abnormalities in men withsevere chronic schizophrenia and an early age at clinical onset. Archives of General Psychiatry1997;54:1104–1112. [PubMed: 9400346]
Marsh L, Suddath RL, Higgins N, Weinberger DR. Medial temporal lobe structures in schizophrenia:relationship of size to duration of illness. Schizophrenia Research 1994;11:225–238. [PubMed:8193061]
McCarley RW, Wible CG, Frumin M, Hirayasu Y, Levitt JJ, Fischer IA, Shenton ME. MRI anatomy ofschizophrenia. Biological Psychiatry 1999;45:1099–1119. [PubMed: 10331102]
McEwen BS, Magarinos AM. Stress effects on morphology and function of the hippocampus. Annals ofthe New York Academy of Sciences 1997;821:271–284. [PubMed: 9238211]
Morse BS, Pizer SM, Puff D, Gu C. Zoom-invariant vision of figural shape: effects on cores of imagedisturbances. Computer Vision and Image Understanding 1998;69:72–86.
Näf M, Kübler O, Kikinis R, Shenton ME, Székeley G. Characterization and recognition of 3D organshapes in medical image analysis using skeletonization. IEEE Mathematical Methods in BiomedicalImage Analysis 1996;1:139–150.
Näf M, Székeley G, Kikinis R, Shenton ME, Kübler O. 3D voronoi skeletons and their usage for thecharacterization and recognition of 3D organ shape. Computer Vision and Image Understanding1997;66:640–646.
Shenton et al. Page 16
Psychiatry Res. Author manuscript; available in PMC 2010 February 18.
NIH
-PA Author Manuscript
NIH
-PA Author Manuscript
NIH
-PA Author Manuscript

Nopoulos P, Swayze V, Andreasen NC. Pattern of brain morphology in patients with schizophrenia andlarge cavum septi pellucidi. Journal Neuropsychiatry and Clinical Neurosciences 1996;8:147–152.
Nopoulos P, Swayze V, Flaum M, Erhardt JC, Yuh WT, Andreasen NC. Cavum septi pellucidi andpatients with schizophrenia as detected by magnetic resonance imaging. Biological Psychiatry1997;41:1102–1108. [PubMed: 9146821]
Ogniewicz, RL. Discrete Voronoi Skeletons. Konstanz, Zurich: Hartung-Goree Verlag; 1993.Ono, M.; Kubik, S.; Abernathy, CD. Atlas of the Cerebral Sulci. New York: Thieme Medical Publishers;
1990.Pearlson GD, Barta PE, Powers RE, Menon RR, Richards SS, Aylward EH, Federman EB, Chase GA,
Petty RG, Tien AY. Medial and superior temporal gyrus volumes and cerebral asymmetry inschizophrenia versus bipolar disorder. Biological Psychiatry 1997;41:1–14. [PubMed: 8988790]
Pentland A, Sclaroff AP. Closed-form solutions for physically based shape modelling and recognition.IEEE PAMI 1991;13:715–729.
Petty RG, Barta PE, Pearlson GD, McGilchrist IK, Lewis RW, Tien AY, Pulver A, Vaughn DD, CasanovaMF, Powers RE. Reversal of asymmetry of the planum temporale in schizophrenia. American Journalof Psychiatry 1995;152:715–721. [PubMed: 7726311]
Pizer SM, Eberly D, Fritsch DS, Morse BS. Zoom-invariant vision of figural shape: the mathematics ofcores. Computer Vision and Image Understanding 1998;69:55–71.
Rakic P, Yakovlev PI. Development of corpus callosum and cavum septi in man. Journal of ComparativeNeurology 1968;132:355–362.
Rossi A, Stratta P, Gallucci M, Passariello R, Casacchia M. Quantification of corpus callosum andventricles in schizophrenia with nuclear magnetic resonance imaging: a pilot study. American Journalof Psychiatry 1989;146:99–101. [PubMed: 2912255]
Rossi A, Serio A, Stratta P, Petruzzi C, Schiazza G, Mancini F, Casacchia M. Planum temporaleasymmetry and thought disorder in schizophrenia. Schizophrenia Research 1994a;12:1–7. [PubMed:8018581]
Rossi A, Stratta P, Mancini F, Gallucci M, Mattei P, Core I, Di Michele V, Casacchia M. Magneticresonance imaging findings of amygdala-anterior hippocampus shrinkage in male patients withschizophrenia. Psychiatry Research: Neuroimaging 1994b;52:43–53.
Sadler, TW. Langman’s Medical Embryology. Baltimore: Williams & Wilkins; 1981.Sarwar M. The septum pellucidum: normal and abnormal. American Journal of Neuroradiology
1989;10:989–1005. [PubMed: 2505543]Shaw CM, Alvord CE. Cavum septi pellucidi et vergae: their normal and pathological state. Brain
1969;92:213–224. [PubMed: 5774029]Shenton ME, Dickey CC, Frumin M, McCarley RW. A review of MRI findings in schizophrenia.
Schizophrenia Research 2001;49:1–52. [PubMed: 11343862]Shenton, ME.; Wible, CG.; McCarley, RW. Brain Imaging in Clinical Psychiatry. New York: Marcel
Dekker; 1997. A review of magnetic resonance imaging studies of brain abnormalities inschizophrenia; p. 297-380.
Shenton ME, Kikinis R, Jolesz FA, Pollak SD, LeMay M, Wible CG, Hokama H, Martin J, Metcalf D,Coleman M, McCarley RW. Abnormalities of the left temporal lobe and thought disorder inschizophrenia: a quantitative magnetic resonance imaging study. New England Journal of Medicine1992;327:604–612. [PubMed: 1640954]
Smith RC, Calderon M, Ravichandran GK, Largen J, Vroulis G, Shvartsburd A, Gordon J, Schoolar JC.Nuclear magnetic resonance in schizophrenia: a preliminary study. Psychiatry Research1984;12:137–147. [PubMed: 6591219]
Southard EE. A study of the dementia praecox group in the light of certain cases showing anomalies orscleroses in particular brain regions. American Journal of Insanity 1910;67:119–176.
Southard EE. On the topographic distribution of cortex lesions and anomalies in dementia praecox withsome account of their functional significance. American Journal of Insanity 1915;71:603–671.
Spitzer, RL.; Endicott, J. Schedule for Affective Disorders and Schizophrenia—Lifetime Version. 3rdedition. New York: New York State Psychiatric Institute, Biometrics Research; 1978.
Shenton et al. Page 17
Psychiatry Res. Author manuscript; available in PMC 2010 February 18.
NIH
-PA Author Manuscript
NIH
-PA Author Manuscript
NIH
-PA Author Manuscript

Suddath RL, Casanova MF, Goldberg TE, Daniel DG, Kelsoe JR, Weinberger DR. Temporal lobepathology in schizophrenia: a quantitative magnetic resonance imaging study. American Journal ofPsychiatry 1989;146:464–472. [PubMed: 2929746]
Suddath RL, Christison GW, Torrey EF, Casanova MF, Weinberger DR. Anatomical abnormalities inthe brains of monozygotic twins discordant for schizophrenia. New England Journal of Medicine1990;332:789–794. [PubMed: 2308615]
Székely G, Kelemen A, Brechbühler C, Gerig G. Segmentation of 2-D and 3-D objects from MRI volumedata using constrained elastic deformations of flexible Fourier contour and surface models. MedicalImage Analysis 1996;1:19–34. [PubMed: 9873919]
Talbot, H.; Vincent, L. Euclidean skeletons and conditional bisectors; Proceedings SPIE Conf. MedicalImaging V: Image Processing; 1992. p. 862-876.
Thompson PM, Giedd JN, Woods RP, MacDonald D, Evans AC, Toga AW. Growth patterns in thedeveloping human brain detected using continuum-mechanical tensor mapping. Nature2000;404:190–193. [PubMed: 10724172]
Van Essen DC. A tension-based theory of morphogenesis and compact wiring in the central nervoussystem. Nature 1997;385:313–318. [PubMed: 9002514]
Van Essen DC, Drury HA. Structural and functional analyses of human cerebral cortex using a surface-based atlas. Journal of Neuroscience 1997;17:7079–7102. [PubMed: 9278543]
Van Essen DC, Drury HA, Joshi S, Miller MI. Functional and structural mapping of human cerebralcortex: solutions are in the surfaces. Proceedings of the National Academy of Sciences of the UnitedStates of America 1998;95:788–795. [PubMed: 9448242]
Van Essen DC, Maunsell JHR. Two-dimensional maps of the cerebral cortex. Journal of ComparativeNeurology 1980;191:255–281. [PubMed: 7410593]
Vapnik, VN. The Nature of Statistical Learning Theory. Springer Verlag; 1995.Vapnik, VN. Statistical Learning Theory. Springer Verlag; 1998.Wang L, Joshi SC, Miller MI, Csernansky JG. Statistical analysis of hippocampal asymmetry in
schizophrenia. Neuroimage 2001;14:531–545. [PubMed: 11506528]Wechsler, D. Wechsler Adult Intelligence Scale-Revised. New York: Harcourt–Brace–Jovanovich Inc;
1981.
Shenton et al. Page 18
Psychiatry Res. Author manuscript; available in PMC 2010 February 18.
NIH
-PA Author Manuscript
NIH
-PA Author Manuscript
NIH
-PA Author Manuscript

Fig. 1.Hierarchical Fourier surface representation of the amygdala–hippocampal complex. Thisfigure shows reconstructions up to order 1 (top left), 3 (bottom left), 7 (top right) and 12 (bottomright). Of note, more and more details are added with increasing order (i.e., from 1 to 12). Thefirst order representation is an ellipsoid and is used for a spatial alignment of shapes bytranslation and rotation.
Shenton et al. Page 19
Psychiatry Res. Author manuscript; available in PMC 2010 February 18.
NIH
-PA Author Manuscript
NIH
-PA Author Manuscript
NIH
-PA Author Manuscript
Fig. 2.Automatic segmentation of 3D amygdala–hippocampal complex using surface-based model-deformation (3D Fourier snake). Figures in the left panel show the 3D initialization based onTalairach coordinates (blue contour, blue surface), and a manual rater’s segmentation (greencontour, blue surface). Figures in the right panel show the resulting segmentation after 3Dmodel deformation.
Shenton et al. Page 20
Psychiatry Res. Author manuscript; available in PMC 2010 February 18.
NIH
-PA Author Manuscript
NIH
-PA Author Manuscript
NIH
-PA Author Manuscript

Fig. 3.Shape distance measures are displayed for the segmentations of the left amygdala–hippocampalcomplex for 21 individuals. The plot illustrates quantitative evaluation of the shape differencesfor the manual slice-by-slice segmentation and the automated segmentation. The horizontalaxis displays the 21 individual cases, and the vertical measurement displays the square root ofthe mean square distance in millimeters between the surfaces of the 3D object pairs. The lightgray bars represent the shape distance at model initialization, and the dark red bars representthe shape distance after model-based segmentation by elastic model deformation.
Shenton et al. Page 21
Psychiatry Res. Author manuscript; available in PMC 2010 February 18.
NIH
-PA Author Manuscript
NIH
-PA Author Manuscript
NIH
-PA Author Manuscript
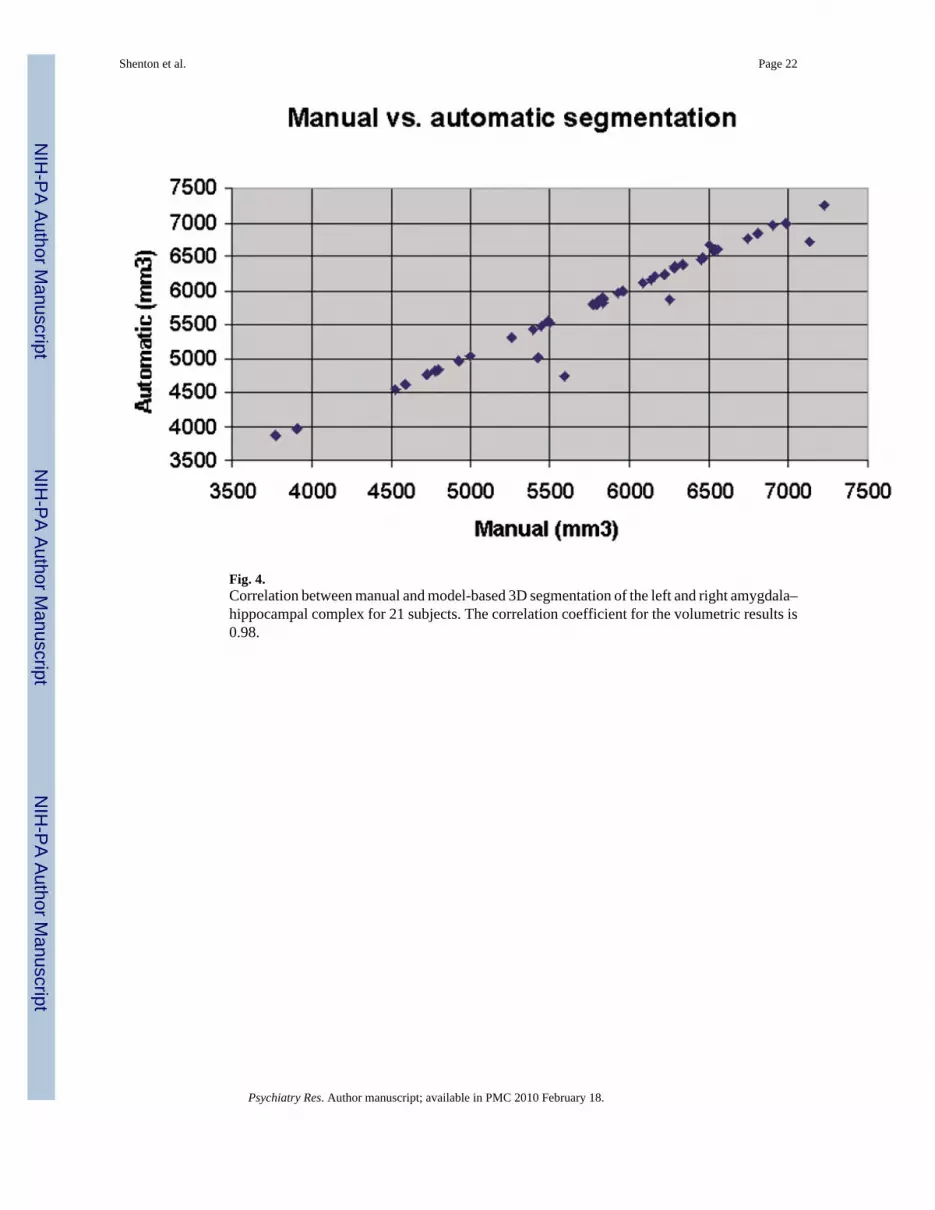
Fig. 4.Correlation between manual and model-based 3D segmentation of the left and right amygdala–hippocampal complex for 21 subjects. The correlation coefficient for the volumetric results is0.98.
Shenton et al. Page 22
Psychiatry Res. Author manuscript; available in PMC 2010 February 18.
NIH
-PA Author Manuscript
NIH
-PA Author Manuscript
NIH
-PA Author Manuscript

Fig. 5.Statistics of L/R volume index (upper left panel), L/R shape index (upper right panel), and acombined two-dimensional feature space (bottom panel) with volume index (horizontal axis )and shape index (vertical axis ). The ellipsoids represent the quantiles of the two-dimensionaldistributions for controls (black triangles) and for the schizophrenics (open squares). The two-dimensional plot demonstrates the improved group discrimination obtained by combining thetwo features.
Shenton et al. Page 23
Psychiatry Res. Author manuscript; available in PMC 2010 February 18.
NIH
-PA Author Manuscript
NIH
-PA Author Manuscript
NIH
-PA Author Manuscript

Fig. 6.A graphical visualization is presented for the left/right asymmetry of the amygdala–hippocampal complex for healthy controls (top row) and patients with schizophrenia (bottomrow). The left and right columns show sagittal and posterior–anterior viewing directions (i.e.,viewing from the tail of the hippocampus). The color figures display group averages ofindividual pairwise left/right difference calculations. These averages are obtained by mirroringthe right shapes to the left, and then overlaying the individual pairs of the amygdala–hippocampus surfaces. Shapes were uniformly scaled for normalized volumes as described inthe text. Signed local surface distances are mapped onto the reference shape as color, rangingfrom dark blue (maximum inside) to red (maximum outside). At dark blue locations, the rightobject surface is inside with respect to the left object, whereas at locations of red regions, theright object is outside. Green signifies perfect overlap. The color range is adjusted to plus/minus 1.4 mm for maximum inside and outside. A comparison between the healthy controlgroup (top row) and schizophrenic group (bottom row) illustrates that the major local regionsresponsible for the shape difference are the tail and portions of the amygdala body. Themaximum surface distances for healthy controls and for schizophrenics were 1.3 and 2.1 mm,respectively. Please note that the colors do not indicate significance by P-value but insteadthey indicate the magnitude of inside–outside distance between group means. The figures areintended to give preliminary insight into the nature and localization of the quantitative shapeasymmetry as described in this article.
Shenton et al. Page 24
Psychiatry Res. Author manuscript; available in PMC 2010 February 18.
NIH
-PA Author Manuscript
NIH
-PA Author Manuscript
NIH
-PA Author Manuscript

NIH
-PA Author Manuscript
NIH
-PA Author Manuscript
NIH
-PA Author Manuscript
Shenton et al. Page 25
Tabl
e 1
Vol
ume
and
shap
e fe
atur
es o
f am
ygda
la–h
ippo
cam
pal c
ompl
ex
Feat
ures
Lef
t vol
umes
Rig
ht v
olum
esT
otal
vol
ume
Vol
ume
diffe
renc
eR
elat
ive
volu
me
diffe
renc
eSh
ape
asym
met
ry
Gro
upFe
atur
eN
CL
Vol
mm
3
Lef
t
SZV
ol m
m3
Lef
t
NC
LV
ol m
m3
Rig
ht
SZV
ol m
m3
Rig
ht
NC
LV
ol m
m3
R+L
SZV
ol m
m3
R+L
NC
LV
ol d
iffR−L
SZV
ol d
iffR−L
NC
LR
el v
ol d
iff|R−L
|/(R
+L)
SZR
el v
ol d
iff|R−L
|/(R
+L)
NC
LSh
ape
asym
met
rySq
rt (M
SD)
(mm
)
SZSh
ape
asym
met
rySq
rt (M
SD)
(mm
)
6195
5466
6347
4750
1254
310
216
151
−716
0.01
20.
070
5.65
11.7
6
6588
4554
6998
5033
1358
695
8740
947
80.
030
0.05
06.
656.
39
5837
5868
6114
5083
1195
210
951
277
−785
0.02
30.
072
6.94
4.08
6321
6454
6230
6671
1255
113
126
−90
217
0.00
70.
017
5.55
6.08
6161
5537
6484
5864
1264
611
401
323
327
0.02
60.
029
6.68
8.63
5804
5001
5788
5998
1159
210
999
−16
997
0.00
10.
091
5.09
9.32
5829
4928
5883
4804
1171
297
3354
−123
0.00
50.
013
5.53
4.71
6719
3876
7257
5518
1397
693
9453
816
410.
038
0.17
55.
1013
.69
4832
5419
4767
6376
9600
1179
5−6
595
70.
007
0.08
16.
908.
74
6765
6415
6597
4807
1336
311
223
−167
−160
80.
013
0.14
36.
384.
89
5865
5529
6951
7050
1281
712
579
1085
1521
0.08
50.
121
6.44
8.09
4169
5288
3636
4430
7805
9719
−533
−858
0.06
80.
088
7.66
3.28
4499
5308
5072
5953
9572
1126
157
364
50.
060
0.05
73.
887.
35
4565
6835
5021
6568
9587
1340
445
6−2
670.
048
0.02
04.
608.
48
4968
3961
4817
4627
9786
8588
−151
666
0.01
50.
078
5.34
9.06
Ave
rage
5674
5363
5864
5569
1153
910
932
189
206
0.02
90.
074
5.89
7.64
S.D
.85
484
310
1384
618
3214
1139
592
80.
026
0.04
71.
022.
85
CV
(%)
1515
1715
1512
208
450
87.6
763
.38
17.3
137
.27
Stat
istic
sF
= 1.
01, P
<0.3
2F
= 0.
75, P
<0.3
7F
= 1.
03, P
<0.3
2F
= 0.
00, P
<0.9
5F
= 10
.40,
P<0
.003
2F
= 5.
00, P
<0.0
34
The
colu
mns
(lef
t to
right
) lis
t the
abs
olut
e vo
lum
es (l
eft t
o rig
ht) f
or N
CL
and
SZ, t
he to
tal v
olum
es, t
he si
gned
vol
ume
diff
eren
ce, t
he re
lativ
e vo
lum
e di
ffer
ence
and
fina
lly th
e sh
ape
asym
met
ry. T
he st
atis
tics
incl
ude
the
mea
n, st
anda
rd d
evia
tion
and
coef
ficie
nt o
f var
iatio
n. T
he fi
nal r
ow p
rese
nts t
he m
ean
diff
eren
ce st
atis
tics b
etw
een
the
norm
al c
ontro
ls a
nd sc
hizo
phre
nia
grou
ps. T
he g
roup
diff
eren
ce fo
r the
‘rel
ativ
e vo
lum
e di
ffer
ence
’ bet
wee
n gr
oups
was
sign
ifica
nt a
t the
1%
leve
l of s
igni
fican
ce (0
.003
2), w
here
as th
e gr
oup
diff
eren
ce fo
r the
‘sha
pe a
sym
met
ry d
iffer
ence
’ bet
wee
n gr
oups
was
sign
ifica
nt a
t the
5% le
vel (
0.03
35).
Psychiatry Res. Author manuscript; available in PMC 2010 February 18.

NIH
-PA Author Manuscript
NIH
-PA Author Manuscript
NIH
-PA Author Manuscript
Shenton et al. Page 26
Table 2
Statistics of left/right shape difference analysis of amygdala–hippocampal complex using the surfacerepresentation
Volume Shape Volume and shape
Rel. L−R diff MSD surfaces
Student t-test P F = 10.4, P<0.0032 F = 5.0, P<0.034 F = 11.19, P<0.0024
Classification 70% 73% 87% (SVM)
Classification is poor and not significantly better than a guess for volume and shape only, whereas the combined analysis shows a very goodclassification rate despite the small numbers of 15 controls and 15 schizophrenics. Classification of the two-dimensional features was carried out witha support-vector-machine technique and leave-one-out.
Psychiatry Res. Author manuscript; available in PMC 2010 February 18.
Copyright © 2022 FDOKUMEN