Amanda S. Kahn - ERA
167
Ecophysiology of glass sponge reefs by Amanda S. Kahn A thesis submitted in partial fulfillment of the requirements for the degree of Doctor of Philosophy in ECOLOGY Department of Biological Sciences University of Alberta © Amanda S. Kahn, 2016
-
Upload
khangminh22 -
Category
Documents
-
view
1 -
download
0
Transcript of Amanda S. Kahn - ERA

Ecophysiology of glass sponge reefs
by
Amanda S. Kahn
A thesis submitted in partial fulfillment of the requirements for the degree of
Doctor of Philosophy
in
ECOLOGY
Department of Biological Sciences University of Alberta
© Amanda S. Kahn, 2016

ii
Abstract
Suspension feeders are an important component of carbon exchange between the water
column and the seafloor, a process called pelagic-benthic coupling. Sponges (Phylum Porifera)
are filter feeders that consume especially small particles. They eat bacteria, which are
inaccessible to most other filter feeders but which make up 10-30% of primary productivity.
Feeding by sponges in shallow waters may have considerable effects on energy flow through
ecosystems, especially in food-poor environments. This dissertation focuses on the
ecophysiology of glass sponge (Porifera, Hexactinellida) reefs, one of the densest aggregations of
sponges known in deep water, to determine the flow of energy through reefs and its underlying
physiological mechanisms from the scale of the cell up to the ecosystem. Combined, the results
explore the ecosystem functions of an important habitat on the northeast Pacific continental
shelf and lend insight into the ecology of hexactinellids elsewhere in the world and in past
oceans including the ancient sponge reefs in the Tethys Sea.
Paired water samples collected in situ before and after passing through a sponge showed
that reef sponges remove bacterial carbon and release ammonium into the water column. Stable
carbon and nitrogen isotope signatures of reef sponges indicate that bacterioplankton came
from both terrestrial and oceanic sources to differing degrees at different reefs, and possibly
from bacteria associated with sediments. Microscopical investigation showed that reef sponges
also released fecal pellets – aggregates that were 100 to 1000 times larger than the particles they
consumed – thereby moving microbial food energy to the benthos as well. Glass sponge reefs
have the highest grazing rate of any benthic suspension feeding community measured to date
because of the high volumes of water they filter, their efficient removal of bacteria, and their
sheer density and size. 13C-labeled bacteria fed to the sponges remained in the tissue for at least
two weeks, suggesting that sponges retain and sequester carbon as biomass as well. Repeat
visits to the same reef sites and same individual sponges over three years showed that reef-
forming glass sponges have similar growth rates, recovery after damage, and recruitment rates

iii
to those of shallower water demosponge species. Study of cell and tissue production however
showed conservative processes for tissue maintenance. Pieces of the reef species Aphrocallistes
vastus were collected and newly forming nuclei labelled with the cell proliferation marker EdU.
Very little proliferation occurred in mature regions of the body; most labeling occurred in
growing (tip) regions of the sponge. Cell turnover rates were similar to those found in non-
growing, mature regions of three shallow temperate sponge species (Sycon coactum, Spongilla
lacustris, and Haliclona mollis). In general, sponges were found to vary rates of cell turnover
depending on season, taxon, and life history stage suggesting an ability to modify energetic
investment in tissue maintenance depending on environmental conditions. Most importantly,
for demosponges at least, mature choanocytes – the pumping and feeding cell of sponges – were
replaced not by direct replication as in colonial flagellates, but by immigration and
differentiation of stem cells as in other animals. Light and electron microscopy showed that
tissue and skeletal growth was localized to the growing regions at the tips of the glass sponge
Aphrocallistes vastus. Choanoblasts – founder cells for flagellated chambers – first divided to
form clusters, then produced enucleate collar bodies that expanded the flagellated chambers to
their full size.
Combined, the results presented here contribute to an understanding of the flow of
energy through glass sponge reefs and the energetic requirements of reef sponges. Glass sponge
reefs transfer from microbial food energy to the water column and the benthos through pelagic-
benthic coupling, with food sources that can sustain their intense feeding and can fuel
comparable growth rates to those of shallower species in food-rich habitats. Other glass sponge
communities throughout the deep sea may share similar roles of pelagic-benthic coupling and,
in their food-poor environment, act as localized oases of food energy. The tissue structure and
tissue maintenance of syncytial glass sponges reflects adaptations to a low-food environment,
and could also reflect the conditions in which sponges and other early animals evolved.

iv
Preface
Chapter 2 has been published as Kahn, A. S., G. Yahel, J. W. F. Chu, V. Tunnicliffe, and S. P.
Leys. 2015. Benthic grazing and carbon sequestration by deep-water glass sponge reefs.
Limnology and Oceanography 60:78-88. GY, VT, and SPL designed the experiment, collected,
and analyzed the raw data. Data from JWFC contributed unpublished data for analysis. GY, VT,
SPL, and I did data analysis and contributed to the writing of the manuscript.
Chapter 3 has been published as Kahn, A. S., L. J. Vehring, R. R. Brown, and S. P. Leys. 2015.
Dynamic change, recruitment, and resilience in reef-forming glass sponges. Journal of the
Marine Biological Association of the United Kingdom. 96(2):429-436. I led this paper’s
direction and analysis. LJV, RRB, and SPL contributed to data collection. SPL obtained ship
time and led the ROV dives to take time-series photos. SPL and I contributed to the writing of
the manuscript.
Chapter 4 will be submitted as a coauthored publication with Sally P. Leys (SPL; University of
Alberta). SPL and I designed the project’s direction and analysis. I developed protocols,
laboratory experiments, and statistical analyses. SPL and I contributed to the writing of the
manuscript.
Chapter 5 is collaborative work involving A.R. Bramucci, R. Case, J.W.F. Chu, and S.P. Leys
(University of Alberta). SPL and I designed the study. ARB, RC, JWFC, SPL, and I collected
sponges and isotope samples. JWFC, TR, and I processed samples for isotope analysis. I did all
statistical analyses. SPL and I contributed to the writing of the manuscript.
Chapter 6 has been submitted to the journal Invertebrate Biology as a coauthored publication
(short communication) with S.P. Leys (University of Alberta). SPL and I collected sponge
samples. I did all laboratory experiments and sampling processes. SPL and I interpreted the
morphology, and we both contributed to writing the manuscript.

v
Acknowledgments
A wise thesis committee member told me, “You can’t go it alone in science” and it is
extremely true. This research would not have developed to fruition without the support of
many. Especially, my supervisor Sally Leys dedicated so much of her expertise, knowledge,
insight, time, and personal care into my progress that I feel she is one of the few others who are
as proud of this final product as I am. Rolf Vinebrooke and Rebecca Case served as excellent
advisors as my thesis committee; I appreciate the depth that your diverse expertise brought to
my project. I also thoroughly enjoyed my candidacy exam, where Sally, Rolf, Rebecca, Warren
Gallin (who even agreed to come back for a thesis defense), and Marianne Douglas grilled me
about my knowledge and as a result helped me realize the bigger picture of my research. I also
appreciate my external examiner Marta Ribes for agreeing to evaluate my thesis in the midst of
moving and for being willing to teleconference all the way from Spain.
I also could not go it alone financially. I was primarily supported by the NSERC Vanier
Canada Graduate Student Scholarship but also received support from the Faculty of Graduate
Studies and Research, Department of Biological Sciences, Bamfield Marine Sciences Centre,
Donald M. Ross Scholarship, the BMO Graduate Student Scholarship, and awards from the
Society for Integrative and Comparative Biology and the World Sponge Conference. Sally also
supported me in the final months of my program – yet another example of her commitment to
my success.
I value the interactions I had with all of my labmates. Pam Windsor Reid stands out as a
valued, inspiring labmate and grounded friend. The others helped me get through the highs and
lows of graduate school: Nathan Farrar with his love for music from the 90’s and his dismal
attitude toward the future of science careers (which was so fun to argue!); Danielle Pendlebury’s
incredible work ethic and our naan-eating, row-boating adventures in Bamfield; Rachel Brown’s
snarky comments and foodie ways; Jasmine Mah’s empathy and her willingness to roll down
grassy hills. I also thank the newbies, Lauren Law and Curtis Dinn, for their entertainment and
support. Kristen Kruper helped in so many ways, with long days in Bamfield, long nights of
staining and sectioning, and always with a compassionate ear and encouraging words.
Research support and mentoring ranged from technical to emotional support. In
Bamfield, Eric Clelland hands-down made much of my field work possible. Arlene Oatway was a
constant source of knowledge and positive energy in the Microscopy Unit. George Braybrook,
De-ann Rollings, and Nathan Gerein in the EAS SEM lab made all of the beautiful SEM
micrographs in this thesis possible. Allan Harms at NRAL was indispensable for the isotope
analyses done in this work. Tom Hantos provided access to a lyophilizer.

vi
Several supportive friends also helped me in the field and in the lab. Nicole Webster
especially was a loyal friend and an adroit colleague. Suz Anthony, Kat Anderson, Anna
Bramucci, Paul Kirchberger, Leen Labeeuw, and all of my new friends from November Project
offered sanity breaks and oftentimes field help throughout the thesis process.
Thank you to the following mentees over the years: Kristen Kruper, Laura Vehring,
Matthew Weigel, Stephanie Yu, Afyqah Kamarul-Zaman, Laura Vehring, and Laura Hamonic. I
learned a lot from you and I hope you learned a bit from me as well.
Laughter, venting sessions, frustrations, and exaltations as well as unwavering support
came from my personal network of favorite people. Clark Pennelly hopped on an airplane for
the first time to move to a new country with me. He accepted the snow, the lifestyle, my
absences for an average of 1/4 of the year, with surprising ease. Suzanne Kahn rode the highs
and lows of the PhD program along with me. She has always supported me to carry on as the
non-accountant of the family and her wisdom is what has pushed me to keep asking myself and
others for bigger and better goals (what’s the worst that could happen?). I hope this makes
them both proud.

vii
Table of Contents
Abstract ........................................................................................................................................... ii
Preface............................................................................................................................................ iv
Acknowledgments ............................................................................................................................v
Table of Contents .......................................................................................................................... vii
List of Tables ................................................................................................................................. xii
List of Figures .............................................................................................................................. xiii
Chapter 1. Ecosystem ecology of glass sponge reefs ........................................................................ 1
1.1. Energetics as a driver of ecology and evolution ..................................................................... 1
1.1.1. The role of suspension feeders in pelagic-benthic coupling ........................................... 2
1.1.2. Sponges: ecologically significant suspension feeders .................................................... 2
1.2. Ecology of glass sponges ....................................................................................................... 5
1.3. Glass sponge reefs ..................................................................................................................7
1.4. Cell biology of glass sponges ................................................................................................ 12
1.4.1. Tissue structure ............................................................................................................. 12
1.4.2. Feeding and energetics ................................................................................................. 13
1.5. Thesis objectives .................................................................................................................. 15
Chapter 2. Benthic grazing and carbon sequestration by deep-water glass sponge reefs ............. 17
2.1. Introduction ......................................................................................................................... 17
2.2. Methods ............................................................................................................................... 19
2.2.1. Study site ....................................................................................................................... 19
2.2.2. Water sampling ............................................................................................................ 19
2.2.3. Sponge respiration ........................................................................................................ 21
2.2.4. Calculating grazing and excretion rates ....................................................................... 21
2.3. Results ................................................................................................................................ 22
2.3.1. Ambient conditions at Fraser Ridge ............................................................................ 22
2.3.2. Feeding and excretion ................................................................................................. 25

viii
2.3.3. Flux through the reef ................................................................................................... 25
2.3.4. Reef metabolism .......................................................................................................... 25
2.4. Discussion .......................................................................................................................... 28
2.4.1. Grazing rates and bacterial supply .............................................................................. 30
2.4.2. A carbon sink ............................................................................................................... 32
2.4.3. Ammonia excretion and ammonium........................................................................... 32
2.4.4. Conservation issues: Implications of water processing by glass sponges ................... 33
2.5. Acknowledgements ............................................................................................................ 34
Chapter 3. Dynamic change, recruitment, and resilience in reef-forming glass sponges ............ 35
3.1. Introduction ........................................................................................................................ 35
3.2. Materials and Methods ...................................................................................................... 36
3.2.1. Recruitment and growth .............................................................................................. 36
3.2.2. Sediment accumulation ............................................................................................... 36
3.2.3. Recovery after disturbance .......................................................................................... 37
3.3. Results ................................................................................................................................ 38
3.3.1. Recruitment of new sponges ........................................................................................ 38
3.3.2. Growth ......................................................................................................................... 38
3.3.3. Sediment accumulation ............................................................................................... 43
3.3.4. Recovery after disturbance .......................................................................................... 43
3.4. Discussion .......................................................................................................................... 43
3.4.1. Recruitment of new sponges ........................................................................................ 43
3.4.2. Growth ......................................................................................................................... 44
3.4.3. Recovery after disturbance .......................................................................................... 47
3.5. Conclusions ........................................................................................................................ 49
3.6. Acknowledgments .............................................................................................................. 49
3.7. Financial Support ............................................................................................................... 49
Chapter 4. Cell replacement in sponges sheds light on stem cell origins in Metazoa .................. 50

ix
4.1. Introduction ........................................................................................................................ 50
4.2. Methods .............................................................................................................................. 52
4.2.1. EdU incubations........................................................................................................... 53
4.2.2. Sample processing ....................................................................................................... 53
4.2.3. Calculating cell proliferation ....................................................................................... 54
4.2.4. Microscopy of choanocyte chambers........................................................................... 54
4.3. Results ................................................................................................................................ 56
4.3.1. Cell cycle lengths and proliferation rates ..................................................................... 56
4.3.2. Cell proliferation by cell type and region .................................................................... 60
4.3.3. Effect of season and feeding activity on cell proliferation........................................... 60
4.3.4. Video microscopy of choanocyte chambers ................................................................ 63
4.4. Discussion .......................................................................................................................... 63
4.4.1. Sources of choanocytes in mature choanocyte chambers ............................................ 63
4.4.2. Variability of cell turnover rates .................................................................................. 65
4.4.3. Choanocyte proliferation rates and feeding activity ................................................... 66
4.4.4. Ecological implications of variable cell turnover ........................................................ 66
4.5. Summary ............................................................................................................................ 68
4.6. Acknowledgements ............................................................................................................ 68
Chapter 5. Feeding and excretion by the glass sponge Aphrocallistes vastus ............................. 69
5.1. Introduction ........................................................................................................................ 69
5.2. Methods .............................................................................................................................. 70
5.2.1. Particle uptake and excretion....................................................................................... 70
5.2.2. Particle and carbon transport ....................................................................................... 71
5.2.3. Carbon sources for the reefs ........................................................................................ 72
5.3. Results ................................................................................................................................ 73
5.3.1. Particle uptake ............................................................................................................. 73
5.3.2. Particle and carbon transport ...................................................................................... 73

x
5.3.3. Waste excretion ........................................................................................................... 79
5.3.4. Food sources to the glass sponge reefs ........................................................................ 79
5.4. Discussion .......................................................................................................................... 82
5.4.1. Feeding and excretion .................................................................................................. 82
5.4.2. Carbon assimilation into sponge tissue ....................................................................... 83
5.4.3. Food sources to different reefs .................................................................................... 84
5.5. Acknowledgements ............................................................................................................. 85
Chapter 6. Spicule and flagellated chamber formation in a growth zone of Aphrocallistes vastus
....................................................................................................................................................... 87
6.1. Introduction ........................................................................................................................ 87
6.2. Methods .............................................................................................................................. 90
6.2.1. Specimen collection ..................................................................................................... 90
6.2.2. Spicule growth ............................................................................................................. 90
6.2.3. EdU labeling of cells ..................................................................................................... 91
6.2.4. Thick sections and electron microscopy ....................................................................... 91
6.3. Results ................................................................................................................................ 92
6.3.1. Spicule growth.............................................................................................................. 92
6.3.2. Growth of flagellated chambers................................................................................... 92
6.4. Discussion ......................................................................................................................... 101
6.4.1. Spicule growth ............................................................................................................ 101
6.4.2. Growth of flagellated chambers ................................................................................ 102
6.5. Acknowledgements ...........................................................................................................103
Chapter 7. General Discussion: Insights into the ecophysiology of glass sponge reefs .............. 104
7.1. Importance of marine technology in advancing deep-sea biology ................................... 104
7.2. Ecology of glass sponge reefs ............................................................................................ 105
7.2.1. Conditions needed to form reefs ................................................................................. 105
7.2.2. Pelagic-benthic coupling by glass sponge reefs .......................................................... 107
xi
7.2.3. Waste excretion as a mechanism behind the sponge loop ........................................ 109
7.2.4. Conservation considerations ..................................................................................... 109
7.3. Cell turnover: methodological considerations ................................................................... 111
7.3.1. Variable cell proliferation between and within species ............................................... 111
7.3.2. Methodological considerations ................................................................................... 112
7.3.3. Energetic costs of rapid cell shedding ........................................................................ 113
7.4. Fine control of turnover rates in sponges ......................................................................... 113
7.5. Economy in glass sponge tissue structure ......................................................................... 114
7.5.1. Archaeocytes in cellular and glass sponges ................................................................. 114
7.5.2. Flagellated chambers .................................................................................................. 115
7.6. General conclusions .......................................................................................................... 116
Bibliography ................................................................................................................................. 117
Appendix 1 .................................................................................................................................. 140
Appendix 2 ................................................................................................................................... 141
Appendix 3 ................................................................................................................................... 142
Appendix 4 ................................................................................................................................... 152
Appendix 5 ................................................................................................................................... 153

xii
List of Tables
Table 2.1. Concentrations of nutrients in the water column above Fraser Ridge Reef ............... 24
Table 2.2. Component fluxes mediated by the sponges on Fraser Ridge, Galiano Ridge, and
Howe Sound reefs ......................................................................................................................... 27
Table 2.3. Estimates of bacterial carbon consumption by glass sponge reefs ............................. 29
Table 2.4. Comparison of benthic grazing rate, water processing rate, and carbon consumed by
suspension feeding communities................................................................................................... 31
Table 4.1. Cell turnover rates and characteristics, determined assuming a steady state
population of cells .......................................................................................................................... 57
Table 5.1. δ13C and δ15N values (‰) measured from Fraser, Galiano, and Howe Reefs, and from
outside of the Strait of Georgia ..................................................................................................... 80

xiii
List of Figures
Figure 1.1. Sponges as a link between the microbial loop and the biological pump ...................... 4
Figure 1.2. The phylogenetic placement of sponges ...................................................................... 6
Figure 1.3. Glass sponges provide hard substrate in the deep sea, whether dead or alive. ........... 8
Figure 1.4. Glass sponge reefs ....................................................................................................... 11
Figure 1.5. Tissue structure of a glass sponge from Mackie and Singla (1983) ............................ 14
Figure 2.1. Glass sponges form dense reef habitats in the northeastern Pacific ......................... 20
Figure 2.2. Water characteristics above Fraser Ridge reef .......................................................... 23
Figure 2.3. Sponge pumping efficiencies and behavior ............................................................... 26
Figure 3.1. Recruitment in glass sponge reefs ............................................................................. 40
Figure 3.2. Growth and change in glass sponge reefs .................................................................. 42
Figure 3.3. Disturbances to the sponge reefs using an asymmetrical BACI design .................... 45
Figure 3.4. Recovery of reef sponges from small-scale damage .................................................. 46
Figure 3.5. Other animals in sponge reefs ................................................................................... 48
Figure 4.1. Theoretical model for labeling steady state cell populations ..................................... 55
Figure 4.2. Proportions of EdU-labeled choanocytes with calculations assuming a steady state
choanocyte population .................................................................................................................. 58
Figure 4.3. EdU uptake in nuclei of the syncytial choanoblasts of Aphrocallistes vastus .......... 59
Figure 4.4. EdU labeling in choanocyte chambers from all species of sponges studied ............. 62
Figure 4.5. Immigration and differentiation of mesohyl cells into mature choanocyte chambers
in Spongilla lacustris, imaged using in situ time-lapse microscopy ............................................ 64
Figure 4.6. Cell turnover rates (Tc) for cell types in unicells and metazoans .............................. 67
Figure 5.1. Experimental setup for observing particle feeding and excretion by Aphrocallistes
vastus ............................................................................................................................................ 74
Figure 5.2. A morphological study of particle uptake in the primary and secondary reticula of
Aphrocallistes vastus ..................................................................................................................... 75
Figure 5.3. Late stages of particle capture by Aphrocallistes vastus ............................................ 77
Figure 5.4. Changes in carbon-13 isotope signatures in tissue of Aphrocallistes vastus incubated
in water supplemented with 13C-labeled bacteria ......................................................................... 78
Figure 5.5. Carbon and nitrogen isotopic signatures from several glass sponge reefs over four
years ............................................................................................................................................... 81
Figure 5.6. Transmissivity, oxygen, and fluorescence overlying reef and non-reef regions at
Fraser Ridge, a sponge reef in the Strait of Georgia ..................................................................... 86
Figure 6.1. Structure of chambers of Aphrocallistes vastus ........................................................ 89

xiv
Figure 6.2. Spicule production in the growing edge of a glass sponge ........................................ 94
Figure 6.3. Proposed steps in formation of flagellated chambers ............................................... 96
Figure 6.4. Proposed stages of enlargement of flagellated chambers ......................................... 98
Figure 6.5. Proposed steps of formation of the reticula around the microvilli and flagella ...... 100
Figure 7.1. The biological pump, revisited ................................................................................. 108

1
Chapter 1. Ecosystem ecology of glass sponge reefs
1.1. Energetics as a driver of ecology and evolution
The amount of energy available to an ecosystem determines several of its properties
including number of trophic levels (Odum 1956), primary and secondary productivity (Odum
1968), and the constraints on the energy budgets of an ecosystem’s biota (Odum and Odum
1955). For a single organism, the energy available from the food it eats (C, consumed food) must
be partitioned into various processes, including production of new tissue and chemical storage
such as fats and lipids (P), maintenance processes and respiration (R), excretion of urine/waste
(U), and excretion as feces (F). As a result, an energy balance for an organism is
𝐶 = 𝑃 + 𝑅 + 𝑈 + 𝐹
The most important uses of energy for the organism are P and R. The most important uses of
energy for the ecosystem are U and F, and to an indirect extent P (e.g. through predation).
For the organism, production of new tissue or biomass (as either somatic growth or
reproduction) and respiration are important uses of the energy that it consumes. Given
unlimited energy, an organism could maximize fitness by growing continually, reproducing
frequently, and maintaining its tissue continually to minimize accumulation of oxidative stress
over time (Pellettieri and Alvarado 2007). However food energy is generally limited, so energy
budgets drive adaptations that prioritize different trade-offs, such as a species that grows
quickly and with high fecundity or one that grows slowly and with low fecundity but with more
investment in parental care. Selective pressure from food-poor conditions drives adaptive
radiation, niche partitioning, and other strategic ways to find novel food sources or maximize
efficiency (Hutchinson 1957, Bambach et al. 2002, Bambach et al. 2007). For example, in one
food-poor environment, the deep sea, some tunicates have traded filter feeding for carnivory,
annelids and anglerfish have extreme sexual dimorphism that has reduced male bodies to little
more than a neotenous sperm pouch, and annelids, molluscs, and sponges have developed
symbiotic relationships with chemoautotrophic bacteria (Pietsch 1976, Vacelet et al. 1996,
Okuyama et al. 2002, Rouse et al. 2004, Ogawa et al. 2005, Lösekann et al. 2008, Katz et al.
2011). Energetics can therefore drive the ecology and evolution (adaptations) of a species
(reviewed by Futuyma and Moreno 1988).
A highly productive ecosystem is one in which energy is abundant: autotrophs create
primary production from sunlight (photoautotrophs) or chemical sources (chemoautotrophs),
secondary and higher-level consumers transfer primary production into biomass, and nutrients
are either recycled from wastes or imported from other ecosystems. Just as an organism is

2
constrained by the energy available to it, an ecosystem with low productivity is also constrained:
either few trophic levels can be supported, few ecological niches are available, or the value of
energy recycling and import from other ecosystems, termed cross-system exchange (Polis and
Hurd 2011), increases. In the ocean, a major mechanism of cross-system exchange is the
transfer of food energy from the water column to benthic biomass and communities, termed
pelagic-benthic coupling.
1.1.1. The role of suspension feeders in pelagic-benthic coupling
Suspension feeders capture plankton and marine snow suspended in the water column
(Gili and Coma 1998). Filter feeders, which include bivalves, polychaetes, ascidians, sponges,
and even baleen whales, are a subset of suspension feeders that use meshes, pumps, and ciliated
appendages to concentrate particles too small to be detected individually (Gili and Coma 1998).
Through excretion, suspension feeders connect pelagically-derived food energy with benthic
biomass (Gili and Coma 1998, Riisgård and Larsen 2000). Suspension feeders are abundant
where productivity is high; their abundance may decrease in areas with lower quality or less
available food due to limited resources (Richardson and Mackay 1991).
Suspension feeders on the seafloor can affect their ecosystem by reducing plankton
concentrations in nearby water. Zebra mussels and oysters increase water clarity by depleting
or controlling phytoplankton concentrations (Ackerman et al. 2001, Coen et al. 2007).
Suspension feeding communities in coral reefs affect phytoplankton populations and nitrogen
cycling (Genin et al. 2009). Filter feeders can also enhance productivity by excreting nitrogen or
carbon compounds that stimulate phytoplankton growth (Arzul et al. 2001).
1.1.2. Sponges: ecologically significant suspension feeders
Sponges (Phylum Porifera) are filter feeders that ingest very small particles (0.5 to 20
µm) (Reiswig 1975b). They can therefore access the 10-30% of primary productivity contributed
by bacteria, which is inaccessible to most other filter feeders (Fenchel 1984). Together with
Daphnia, appendicularians, and others, they therefore bring microbial food energy into the
larger trophic web, linking pelagic-benthic coupling with the microbial carbon loop (Legendre
and Le Fèvre 1995). Sponges can filter up to one thousand times their body volume each day
(Leys et al. 2011) and extract food with up to 95% efficiency (Maldonado et al. 2012). Sponges
use flagellated cells called choanocytes to draw water through canals and into choanocyte
chambers, where water slows before it is drawn through a fine 45-nm glycocalyx mesh (Reiswig
1975a, Leys et al. 2011). The slowed water presumably gives choanocytes the opportunity to
grasp bacteria with pseudopodia and phagocytize them (Leys and Eerkes-Medrano 2006).

3
Bacteria are later digested and expelled as fecal pellets, dissolved nitrogen, and CO2 (Wolfrath
and Barthel 1989, Hadas et al. 2009).
The ecological effects of sponge feeding have been well studied in shallow habitats.
Filtration by freshwater sponges in Lake Baikal enhanced water clarity and depleted bacteria
from the water column (Pile et al. 1997), tropical and temperate marine species recycle nitrogen
into ammonia, nitrate, nitrite, or dissolved nitrogen (Jimenez Tejero 2011, Maldonado et al.
2012), and species with siliceous skeletons locally act as silica sinks (Maldonado et al. 2011).
Sponges have also been considered as a link between the biological pump and microbial
carbon from the microbial loop (Pile and Young 2006, Thurber 2007, De Goeij et al. 2013)
(Figure 1.1). The localized effects of sponge feeding may not be important sources of carbon or
nitrogen in ecosystems with high productivity, but feeding by sponges may have greater
significance in energy-limited habitats. For example, a recent study in a tropical coral reef was
able to trace dissolved organic carbon from the water column, through a sponge, and into the
tissue of higher-level consumers (De Goeij et al. 2013).
My thesis research focused on the capacity of, and mechanisms behind, benthic-pelagic
coupling of a primarily deep-water class of sponges, Hexactinellida.

4
Figure 1.1. Sponges as a link between the microbial loop and the biological pump.
Sponges in deep and shallow habitats alter the water they process by connecting the microbial
loop (colored in blue) to the biological pump (colored in green, brown, and red). The diagram
shows the biological pump for sponges in deep water but sponges serve the same roles in
shallow water. Abbreviations: DOC (dissolved organic carbon).

5
1.1.2.a. Sponge phylogeny
The monophyletic phylum Porifera contains four classes: Calcarea, Homoscleromorpha,
Demospongiae, and Hexactinellida (Figure 1.2). All classes have the sponge body plan: a
bacterivorous filter feeder powered by collared, flagellated units (typically choanocytes except in
Class Hexactinellida). The only exception is a clade of sponges in the Class Demospongiae,
which have secondarily become carnivorous and no longer filter feed (Vacelet and Boury-
Esnault 1995)The most abundant and well-studied class of sponges is Demospongiae, which
contains about 85% of known species (Van Soest et al. 2012). Class Hexactinellida is sister
group to the Demospongiae (Dohrmann et al. 2008). Hexactinellids have a strong fossil record
and were recognizable 545 Mya during the Neoproterozoic Era while Demospongiae and
Calcarea are not seen in the fossil record until the Lower Cambrian (Mehl et al. 1998, Antcliffe et
al. 2014). Due to their early appearance in the fossil record, glass sponges may be informative
for the origin of many characters of the sponge body plan.
1.2. Ecology of glass sponges
Glass sponges (Class Hexactinellida) are primarily found in the deep sea, where food
from the surface is eaten and recycled to overcome generally food-poor conditions (Smith 1987).
Studies of glass sponges show that they grow episodically, possibly in response to pulses of food
(Dayton 1979, Leys and Lauzon 1998, Kahn et al. 2012, Dayton et al. 2013, Fillinger et al. 2013).
Dense aggregations of glass sponges are found where food , as bacterial productivity, is
abundant (Leys et al. 2007). Sericolophus hawaiicus is thought to thrive on abundant food
from resident plankton communities and arriving by downwelling of surface waters along the
continental slope off the island of Hawaii (Pile and Young 2006) while dense stands of
Pheronema carpenteri coincide with areas where tidal energy imports resuspended or
undeposited organic matter on internal waves (Rice et al. 1990).
Hexactinellids are found in all oceans but are poorly studied compared to other sponge
groups because they are mostly confined to deep water. However, in four location they reach
shallower water the continental shelf in the Southern Ocean (Antarctica), many caves in the
Mediterranean, and fjords in New Zealand and western Canada (Barthel and Tendal 1994,
Vacelet et al. 1994, Leys et al. 2004, Reiswig and Kelly 2011). These shallow nearshore regions
have much greater densities of glass sponges than are found in deep water, with densities as
high as 100 individuals per square meter (Vacelet et al. 1994). This leads one to question why
dense sponge areas form where they do, and especially in shallower shelf regions. Shelf regions
have much more productivity and strong currents compared to the deep sea so food may not be
limiting there (Leys et al. 2007).

6
Figure 1.2. The phylogenetic placement of sponges is as one of the first groups
of early animals together with ctenophores (Phylum Ctenophora) and
placozoans (Phylum Placozoa). These early branching groups may shed light on traits
shared with the last common ancestor to animals (LCA). Within monophyletic Porifera,
Hexactinellida is sister group to Demospongiae. Within the Hexactinellida, reef-forming
species are found in the families Aphrocallistidae and Farreidae. Hexactinellid relationships
were reproduced from Dohrmann et al. (2008).

7
Dense populations of glass sponges have the potential to affect the surrounding
environment through their filter feeding activity. Indeed, dense aggregations of glass sponges
process large volumes of water – a square meter patch of Sericolophus hawaiicus could filter
3,208 L water d-1 (calculated using data from Pile and Young 2006). A mixed community of
sponges in the Southern Ocean that includes glass sponges consumes so many bacteria from a
sewage outfall that lipid tracers of sewage were measured in their tissue (Thurber 2007).
In addition to their role in filtration, live sponges, denuded stalks, and even spicule mats
of dead sponges serve ecological functions by providing hard substrate for other animals to
colonize in the deep sea (Bett and Rice 1992, Beaulieu 2001b, Beaulieu 2001a) (Figure 1.3).
Glass sponges can persist for a long time in the environment and form a substrate for other
animals to settle on. Radiocarbon dating the organic matrix sequestered in spicules from a
museum specimen of the Antarctic glass sponge Rossella racovitzae racovitzae suggests it was
approximately 440 years old (Fallon et al. 2010). Spicule mats cover about one third of the
seafloor in the Porcupine Seabight (Bett and Rice 1992) and parts of the seafloor in Antarctica
can have mats from a few cm to 2 meters thick (Dayton et al. 1974), providing hard substrate for
polychaetes and other animal groups even after a sponge dies.
1.3. Glass sponge reefs
In the straits and fjords of British Columbia, hexactinellids form meter-tall reefs in a
similar process as hermatypic corals, growing upon dead skeletons of past generations (Figure
1.4A) (Conway et al. 2001, Krautter et al. 2006). Several glass sponge species flourish in the
waters of British Columbia but three species in particular were able to grow upon the fused
skeletons of previous generations to form reefs. Farrea occa (Family Farreidae, Order
Hexasterophora) is found only in fjords and the reefs north and west of Vancouver Island (Leys
et al. 2004) while Heterochone calyx and Aphrocallistes vastus (Family Aphrocallistidae, Order
Hexasterophora) are found in shelf waters along the entire coastline of British Columbia
(Figure 1.4B-C). Some regions have dense, diverse glass sponge communities growing on hard
rock called sponge gardens. The three reef-forming species could cement a scaffolding of
spicules that persisted beyond the lifespan of a single generation, allowing juveniles to grow on
the skeletons of past generations and form reefs (Krautter et al. 2006).
Sponge reefs were prominent habitats during the Jurassic and Cretaceous periods
(Leinfelder et al. 1994). A belt of sponge reefs ~7,000 km long stretched across the Tethys Sea
during that time (Ghiold 1991). Upper Jurassic reefs were made of mixed assemblages of
hexactinellids (both with fused and unfused skeletons) and lithistid demosponges (Leinfelder et
al. 1996). Modern-day coral reefs are known to need food from sunlight, so presumably the

8
Figure 1.3. Glass sponges provide hard substrate in the deep sea, whether dead
or alive. A. Stalks of glass spicules (arrow), used to anchor sponges in soft sediments,
become colonized with anemones, echinoderms, and other taxa that need hard substrate
(image from the Monterey Bay Aquarium Research Institute). B. The spicule mats left
behind after sponges die (outlined) give heterogeneous surfaces and hard substrate
throughout the deep sea and an increase macrofaunal diversity (image from the Monterey
Bay Aquarium Research Institute). C. Live sponges and the fused skeletons of dead sponges
(outlined) in a glass sponge reefs harbor fish and echinoderms (arrowheads). Scale bars: A.
10 cm; B: 1 cm; C: 20 mm.

9
production of so much biomass required high levels of food and nutrients such as silica. Today’s
glass sponge reefs likely serve similar habitat-forming and ecosystem functions as Jurassic reefs,
but importantly are analogous systems. Only glass sponges with fused (dictyonine) skeletons
form modern-day reefs, although other glass sponge species without fused skeletons can live in
reefs.
Reef formation occurred following the last glacial maximum as hexactinellid species
grew on glacially carved ridges. Reefs grew as the fused spicule skeletons of reef forming sponge
species remained after death of the live sponges and eventually became cemented with
sediment, producing new hard substrate for recruits to settle and grow on (Krautter et al. 2006).
Glass sponge reefs in Hecate Strait have grown up 19 m in height above the glacial furrows and
ridges that were originally colonized by sponges 9,000 years before (Conway et al. 2001). Most
of that height is buried by sediments, with only 1-2 meters of the reef surface exposed and
containing live sponge (Conway et al. 2001). Today, 22 patches of reefs have been found
between southern Alaska and the Strait of Georgia in British Columbia with 13 reefs in the Strait
of Georgia alone (Conway et al. 2007), with marine protected areas being proposed to protect
reef sponges from trawling and other human activity (Figure 1.4E-F).
The straits and fjords where sponges are found are high in productivity. Seasonal
upwelling brings in productive water from the deep Pacific, surface waters produce strong
seasonal plankton blooms, and rivers act as sources of terrestrial productivity (Johannessen et
al. 2003, Whitney et al. 2005, Johannessen et al. 2008). Sediments in the reef are Holocene
muds rich with organic carbon (>3 weight percent, wt. %, in Queen Charlotte Sound reefs
compared to 0.8 wt. % measured from non-reef muds) (Conway et al. 2001) and support high
densities of polychaetes that are more diverse than polychaete communities found outside of the
reefs (Cook 2005).
Glass sponge reefs support high levels of biodiversity, including for commercially
important fish and shellfish species (Krautter et al. 2001, Marliave et al. 2009, Chu and Leys
2010b). Squat lobsters, hairy crabs, shrimp, and rockfish are found in and around oscula of
sponges (Chu and Leys 2010b). Octopus, sharks, and halibut are also frequent visitors or
residents (personal observation). Nudibranchs, and possibly fish and sea stars, prey upon reef
sponges (Chu and Leys 2012, personal observation), so reef-forming sponges are known to be
foundation species for their communities like other animals (Jones et al. 1994).
Glass sponge reefs can also locally affect nutrient cycling. So far, only their effect on
silica has been studied and it was found that they sequester silica into the seafloor (Chu et al.
2011). It is possible that reefs could play in important role in carbon cycling as well, like that

10
Figure 1.4. Glass sponge reefsGlass sponge reefs are found along the continental shelf of
British Columbia and southeastern Alaska. B. In situ experiments and surveys were carried out
using the remotely operated vehicle ROPOS. (Image from S.P. Leys.) C. and D. Three species
make up the reefs: Aphrocallistes vastus (C., Av) and Heterochone calyx (D., Hc) are found in
all waters while Farrea occa (D., Fo) is only found in fjords and northern reefs in Hecate and
Queen Charlotte Straits. Their hard fused skeletons provide hard substrate for larval recruits to
settle on. (Image D provided courtesy of Department of Fisheries and Oceans, Miriam O.) E.
Reefs can be damaged by human activity such as trawling or cable-laying activity. Here sidescan
sonar detects a sponge reef and tracks of trawls that ran through the reef. Modified from
Conway et al. (2001). F. The Department of Fisheries and Oceans is designing Marine
Protected Areas around three glass sponge reefs. Here, the boundaries of the core protection
zone (gray box) around one of the three reefs (orange).

11
Figure 1.4. Glass sponge reefs

12
observed for the same species of glass sponges in fjords (Yahel et al. 2007) and shallow
sponges (Pile et al. 1997, De Goeij et al. 2013). The study of nutrient cycling by reef sponges
along the continental shelf of western Canada would also give insight into the possible effects
of feeding by glass sponges in the food-poor deep sea.
1.4. Cell biology of glass sponges
In addition to understanding the ecological energetics of glass sponge reefs, knowledge
of the energy flow through glass sponges themselves is important for understanding what may
affect their ecology. As with all animals, food consumed by a glass sponge is used for excretion
as urine and feces, in the tissue as production (new biomass or reproduction), or for respiration.
Respiration includes the cost of filter feeding and other activity (Reiswig 1971a, Reiswig 1974,
1981, Reiswig 1990, Leys et al. 2011), while production encompasses growth, tissue maintenance
(Shore 1971, De Goeij et al. 2009), and repair (Bell 2002, Alexander et al. 2014). Little is known
about any of these processes in a glass sponge.
1.4.1. Tissue structure
Six-rayed glass spicules form a fused or unfused scaffolding upon which the tissue lies
(Reiswig and Mehl 1991). Spicules form as the acidic vacuoles in the syncytial tissue concentrate
silicic acid from the environment and deposit nanospheres of amorphous silica around a
collagen- and silicatein-rich matrix (Uriz et al. 2003, Leys et al. 2007, Ehrlich et al. 2010). Glass
sponge spicules can undergo various degrees of secondary fusion from spot soldering spicules
together at the tips (Reid 2003) to full cementation of several anchoring basal spicules for
reinforcement in Euplectella aspergillum (Weaver et al. 2007). Spicule fusion presumably
could be widespread throughout the Hexactinellida, but in E. aspergillum it was only to
reinforce clusters of spicules while most of the spicules in the sponge body remain unfused
(Weaver et al. 2007). Secondary fusion forms a rigid scaffolding in sponges of the Order
Hexactinosida, which includes the three species that form reefs (Leys et al. 2007).
Terminology for tissue structure follows that of Mackie and Singla (1983). Trabecular
tissues contain open cytoplasmic bridges and closed, perforated plugs that connect to ‘cells’
(mononucleated but still connected to the rest of the syncytium). Plugged cytoplasmic bridges
maintain cytoplasm continuity and allow propagation of electrical signals that coordinate
flagellar beating through the body (Mackie et al. 1983, Leys et al. 1999). The glass sponge body
as a whole has regions no different from cellular sponges: incurrent and excurrent canals for
water to pass through chambers powered by flagellated collar units, and regions that produce
spicules (Mackie and Singla 1983). As described by Leys (2003b) the trabecular syncytium

13
makes up 75% of the tissue; it includes the dermal and atrial surfaces (membranes) of the
sponge, makes up the primary and secondary reticula of flagellated chambers, interconnects
chambers with cord regions, and contains cytoplasmic streams that transport organelles,
vesicles, and phagocytized particles throughout the body (Figure 1.5) (Leys 1995, Wyeth 1999).
Choanoblasts are ‘cells’ (have a single nucleus) connected to the rest of the
multinucleated tissue by cytoplasmic bridges. From them extend collar-flagella units called
collar bodies, which beat flagella to draw water through the aquiferous system (Mackie and
Singla 1983, Leys 1999). Collar bodies are structurally similar to the choanocytes of cellular
sponges by bearing collars of microvilli around a flagellum, but they lack nuclei. They lie
embedded in a primary reticulum (part of the trabecular syncytium) with collars of microvilli
that project up through a secondary reticulum (also part of the trabecular syncytium) (Figure
1.5). Two types of nuclei are visible in the tissue: the many nuclei of the syncytia, which are
small and uniformly distributed throughout the tissue, and the nuclei found in choanoblasts and
archaeocytes.
1.4.2. Feeding and energetics
An understanding of how feeding occurs in a glass sponge could be useful since feeding is
what drives nutrient flow through sponges. The stages of feeding that have been observed in
glass sponges follow a similar pattern to that observed in cellular sponges. Water movement
through the glass sponge is caused by the beating of flagellated collar bodies, which pulls water
through incurrent canals. Water enters pores on the dermal surface and flows into large
vestibules in the subdermal space that lead to incurrent canals and eventually to flagellated
chambers. Water enters a chamber through holes in the primary reticulum called prosopyles.
The water slows before it is rapidly pulled through a glycocalyx mesh strung across the collars of
the collar bodies (Figure 1.5) (Leys et al. 2011). Bacteria appear to be captured from the water in
the space between the primary and secondary reticula, then are transported through the
cytoplasm in vacuoles (Perez 1996, Wyeth 1999), and wastes are digested and excreted out the
excurrent chimney of the sponge, the osculum. Excretion has only been observed from
demosponges, which release aggregates of particles in membrane-bound fecal pellets (Wolfrath
and Barthel 1989, Gobel 1993). It is not known how and where digestion takes place nor what
excreted material looks like in hexactinellids. If fecal matter is packaged into pellets as it is in
cellular sponges, then excreted material could provide food for deposit feeders in the
surrounding community.

14
Figure 1.5. Tissue structure of a glass sponge from Mackie and Singla
(1983)Water (red arrows) is drawn through the flagellated chamber by the action of
enucleate collar bodies (cb) that are connected to each other and to nucleated choanoblasts
(chb) by cytoplasmic bridges. Mononucleate choanoblasts (chb) produce branching
enucleate collar bodies (cb) connected by stolons (s) to the parent choanoblast.

15
Also unknown is whether collar bodies and other tissues are shed from the glass sponge
as part of tissue renewal. It was recently proposed that rapid rates of cell turnover and shedding
by the demosponge Halisarca caerulea released enough carbon into the environment to affect
other animals (De Goeij et al. 2013). It is impossible to determine from their data whether
Halisarca caerulea truly sheds its own cells rather than recycles them, but this idea presents an
untested additional hypothesis for how sponges can affect other communities: by fecal pellets as
described above, or through release of shed tissue. For the glass sponge, Mackie and Singla
(1983) suggested that collar bodies may detach and be shed from the body of Rhabdocalyptus
dawsoni but also cautioned to the possibility that their observations came from an artefact of
sample processing. Leys (1999) later found evidence of flagellated chambers being resorbed by
tissue outgrowths of the trabecular reticulum. The degree to which cell shedding actually occurs
in the glass sponge is not known, and is likely dependent on knowledge of the energy budget for
a glass sponge. Several questions arise regarding how tissues are maintained: what tissue is
produced and stays put, and what skeletal and organic matter is secreted? Only after these are
known can one ask whether enough energy remains for the sponge to be able to discard its
tissue, or whether its tissue is a precious, hard-won resource in the body.
1.5. Thesis objectives
Glass sponges are typically found in the deep sea below 1,000 meters, where food is the
most common limiting resource (McClain et al. 2012). Food may not be expected to be a
limitation for hexactinellids living on the continental shelf where productivity is high, but there
and elsewhere the sponges may play a role in pelagic-benthic coupling for other animals. This
thesis addresses five aspects of glass sponge ecophysiology that enhance our understanding of
the energy balance of the glass sponge reef ecosystem by studying energy flow into, within, and
out of the reefs at several scales.
In Chapter 2, I studied data collected by Sally Leys, Gitai Yahel, and Verena Tunnicliffe
during a 2005 cruise to the Fraser Ridge reef in the Strait of Georgia near Vancouver, British
Columbia. The goal was to estimate whole reef fluxes to understand the flow of carbon and
nitrogen into and out of the glass sponge reefs, both what they take in from the pelagic
picoplankton (From Equation 1, Consumption) and what they release to the water column and
benthos (From Equation 1, Urine). Paired ambient and exhaled water collected in situ from
individuals of Aphrocallistes vastus were analyzed, then scaled up to whole-reef fluxes of
carbon, nitrogen, dissolved nutrients, and oxygen using measurements of average osculum size,
live cover and density, and excurrent flow rates from the literature (Chu and Leys 2010b, Leys et
al. 2011). Appendix 1 contains a supporting table for Chapter 2.

16
In Chapter 3, recruitment and resilience of reef sponges were studied using repeat visits
to the same reef sites at Fraser Ridge and Galiano Reefs over three years using the remotely
operated vehicle ROPOS for precise navigation and field manipulations. An understanding of
reef dynamics is important because of the lasting effects that anthropogenic disturbances can
have on ecosystem functions if the reefs are slow to recover from damage. Surveys of juvenile
density and distribution and a search for reproductive adults were used to determine the
frequency of new recruitment. Recovery was studied from two scales of disturbance in the field:
small pieces broken off large sponges and complete removal of sponges in a large patch of reef to
simulate larger scale disturbance. Appendix 2 contains supplemental figures that accompany
Chapter 3.
In Chapter 4, the relative investment of energy into tissue maintenance (from Equation
1, part of Respiration) was compared between a primarily deep-sea hexactinellid species
(Aphrocallistes vastus), other species of sponges, and with other animals by comparing cell or
nucleus turnover rates. Chapter 4 also tested whether sponges in general, and reef sponges in
particular, may be able to change their investment in ‘tissue homeostasis’ according to the food
or conditions available to them. Appendix 3 contains supplemental tables and figures that
accompany Chapter 4.
Chapter 5 investigated the flow of food, as bacteria, through an individual sponge and
through the reefs. This chapter begins with a description of feeding by Aphrocallistes vastus
from uptake through excretion, especially focusing on where uptake and digestion occurred in
the syncytial organization of the sponge and the size and form of fecal pellets released by the
sponge (from Equation 1, Feces). Natural δ13C and δ15N stable isotope signatures were used to
trace the provenance of food to the reefs and a 13C feeding experiment was used to measure the
residence time of food in the tissue of reef sponges. Appendix 4 contains supplemental tables
that accompany Chapter 5.
Chapter 6 focuses on growth of the sponges, both how glass sponges built new spicules
and new tissue in flagellated chambers. Samples collected by SCUBA and remotely operated
vehicle were studied using light, fluorescence, and electron microscopies to assess how, and how
quickly, reef sponges grow. Appendix 5 contains a supplemental figure that accompanies
Chapter 6.
Finally, Chapter 7 concludes by discussing the role of glass sponge reefs in pelagic-
benthic coupling, and addresses the ecological and evolutionary contexts of these findings.

17
Chapter 2. Benthic grazing and carbon sequestration by deep-water glass sponge reefs1
2.1. Introduction
Feeding by large communities of benthic suspension feeders, known as benthic grazing,
can greatly affect water column properties and forms an important component of benthic-
pelagic coupling in lakes and oceans (Gili and Coma 1998). Benthic grazing rates quantify the
mass transfer from the water column to the benthos (Genin et al. 2009) and are used to
understand the effect of suspension feeders on the surrounding water. Grazing rates are well
quantified for near-shore, shallow-water communities, however the effect of grazing by dense
deep-water communities is less well studied. A better understanding of the energetics of
suspension-feeding communities is especially needed in light of growing evidence of the removal
of these communities by deep-water trawling in the ocean (Heifetz et al. 2009, Puig et al. 2012).
In many regions sponges (Phylum Porifera) dominate benthic communities and, because
sponges are particularly effective at removing suspended particulates, they are often implicated
in water quality control (Gili and Coma 1998). Where sponges dominate shallow benthic
communities their grazing can affect overlying water (Pile et al. 1997). Glass sponges (Class
Hexactinellida) are deep-sea animals that occur in large numbers on seamounts, in the Southern
Ocean, and on continental slopes and fjords in several oceans (Hogg et al. 2010). They draw
water through numerous small pores (ostia) on the dermal surface where it passes via canals to
chambers of flagellated collar cells, choanocytes. Particles are sieved by a mesh on the collar
and water and wastes are expelled via canals and out of an apical osculum. Glass sponges are
abundant on hard substrata throughout the north Pacific (Leys et al. 2004) but also form
unusual reefs that cover hectares of seafloor on the continental shelf of the northeast Pacific
(Conway et al. 2005b). Over the last two decades, we have built a body of knowledge about glass
sponge physiology (Leys and Mackie 1997, Tompkins-MacDonald and Leys 2008), feeding
(Yahel et al. 2007), distribution and densities (Chu and Leys 2010b, Du Preez and Tunnicliffe
2011), and their requirements for silica and water flow (Chu et al. 2011, Leys et al. 2011). We
now seek to calculate fluxes through entire reefs to understand the magnitude of their grazing
from and excretion into overlying water. Glass sponge reefs are built by three species,
Aphrocallistes vastus, Heterochone calyx, and Farrea occa, all of which form fused (dictyonine)
1 A version of this work has been published in Limnology and Oceanography: Kahn, A. S., G. Yahel, J. W. F. Chu, V. Tunnicliffe, and S. P. Leys. 2015. Benthic grazing and carbon sequestration by deep-water glass sponge reefs. Limnology and Oceanography 60:78-88.

18
skeletons of silica. Over the last 6,000-9,000 years they have constructed bioherms on glacially
carved ridges where water flow is high and sediment accumulation low (Conway et al. 2005b)
and, over time, the sponge skeletons become cemented together by sediment into a semi-solid
substratum. Young sponges settle and grow upon the skeletons of older generations to form the
reefs (Conway et al. 2005b).
Glass sponge reefs form one of the densest communities of deep-water suspension
feeders known, with up to 40 large oscula (each representing a pumping unit) in a square meter
and hundreds of thousands of oscula across a hectare of reef (Chu and Leys 2010b). Like coral
reefs, sponge reefs form a habitat for many animals (Du Preez and Tunnicliffe 2011) and,
because of their large filtration capacity, they may also have an important role in benthic-pelagic
coupling. But the deep habitat of the sponge reefs, well below the photic zone, is typically poor
in planktonic cells, and bacteria (105 mL-1) are the primary food of the sponges (Yahel et al.
2007). Although bacteria could be enriched in bottom waters by sediment resuspension or
internal waves (Clark et al. 2010), the source of sufficient bacteria to sustain the reported growth
rates of 1 to 7 cm yr-1 (Chapter 3, Leys and Lauzon 1998, Austin et al. 2007) and of such large
communities as the sponge reefs is not evident.
One glass sponge reef on Fraser Ridge near Vancouver, British Columbia is well-studied
and serves as a model for understanding other dense glass sponge communities, including
hundreds of km2 of known sponge reefs (Conway et al. 2005b) and dense sponge populations in
the Antarctic and on continental slopes and seamounts. Reefs in the Strait of Georgia, a
marginal sea near Vancouver British Columbia, are nearly monospecific, with the species
Aphrocallistes vastus (hereafter Aphrocallistes) forming approximately 86% of individuals in a
reef. Here we combine measurements of individual grazing and excretion rates of
Aphrocallistes with sponge size and density data to develop reef-wide estimates of the
community metabolism and the effect of these animals on overlying waters. Our results indicate
that glass sponge reefs have grazing rates and water processing capacity up to an order of
magnitude higher than other suspension feeding communities. Our results also provide insight
into the conditions needed to sustain such a dense community of suspension feeders. As
conservation of cold-water sponge and reef habitats is a pressing issue, we examine the
ecosystem functions of these large glass sponge communities in shelf ecosystems, both present
and past.

19
2.2. Methods
2.2.1. Study site
Samples and measurements were collected from Fraser Ridge reef in July 2005. The
Fraser Ridge is a relict glacial deposit of boulders and gravel with its base at about 200 m. The
ridge lies roughly perpendicular to the prevailing northerly currents in the central Strait of
Georgia (SoG), British Columbia (Conway et al. 2005b, Bedard 2011). The Fraser Ridge reef
covers about 170,000 m2 (Conway et al. 2005a) on the northern and western edges of the ridge
(49° 9’ 15.7” N, 123°23’ 3.7” W; Figure 2.1A). The reef ranges from 150 to 180 m depth beneath
the outflow of the Fraser River, which is the source of 73% of the freshwater and 64% of particles
entering the Strait (Johannessen et al. 2003). Strong southward riverine outflow from the
Fraser River creates stratification that limits downwelling of surface waters and induces a
northerly flow of water at the bottom (Masson 2002). Current speeds through Fraser Ridge reef
are very high, reaching up to 92 cm s-1 during flood tides (Leys et al. 2011), but follow a mixed
semi-diurnal tide schedule so currents vary throughout each tide cycle. Mean northward
currents amplify flood tides and dampen currents during ebb tides (Bedard 2011) so that the
flow over the ridge is almost always to the north.
2.2.2. Water sampling
The remotely operated vehicle (ROV) ROPOS carried out nine dives to gather samples. A
pumping conductivity, temperature, depth (CTD) instrument (SBE19plus, Seabird) mounted on
the ROV continuously recorded water conditions to produce a vertical profile of salinity, density,
temperature, transmissivity, and oxygen concentration (SBE43 dissolved oxygen sensor
attached to the CTD). Water samples were collected with precision positioning beside the
sponges (zero meters above bottom, mab) and from the sponge excurrent flow using custom
designed paired samplers (SIPs) that can be manipulated by the ROV and draw water in at a rate
lower than the excurrent velocity, as described by Yahel et al. (2007). Ambient water conditions
at and above the reef were determined from samples collected with Niskin bottles. During four
separate dives, one Niskin attached to the ROV was triggered at each of 5, 10, and 20 meters
above the reef and water from each Niskin was divided for analysis of dissolved nutrients
(ammonium, nitrate, dissolved silica, and phosphate), bacteria, and total organic carbon (TOC)
concentrations.
Previous work has shown that Aphrocallistes pumps continuously unless disturbed by
sediment (Tompkins-MacDonald and Leys 2008). To confirm that each sponge was actively
filtering prior to sampling with SIPs, fluorescein dye was released beside each sponge to
visualize filtration by dye uptake and release from the osculum (Figure 2.1D). We collected a

20
Figure 2.1. Glass sponges form dense reef habitats in the northeastern Pacific (A)
Locations of sponge reefs in the Strait of Georgia. Sampling was conducted at Fraser Ridge
reef and fluxes were compared with populations from Galiano Ridge and Howe Sound reefs.
All three reefs lie on the continental shelf between Vancouver Island and mainland Canada.
(B) A map showing the reef at Fraser Ridge and the extent of the surveys in 2005 and 2007
(gray gradients are interpolated reef live percent cover), with survey tracks set to overlap with
the area predicted to be reef from multibeam mapping (black outline). Survey points outside
(black dots) and inside (red dots) of the predicted reef area. (C, D) Sponge reefs are dense
associations of live sponges growing on the skeletons of previous dead generations. The large
openings are the excurrent oscula and are approximately 5 to 10 cm across in these photos.
(D) Green fluorescein dye was used to verify the sponges were pumping water.

21
total of 22 paired samples (ambient water [in] and water filtered by the sponge [ex]). When
sampling water from a sponge in situ, the sampling tube must be well inside the osculum and
must not touch the sponge to prevent contamination by ambient water or sponge tissue; we
checked video records of each sample collection to confirm SIP samplers did not touch the
sponge and were inserted sufficiently into the osculum. Our previous data showed the sponges
filter with up to 95% efficiency (Yahel et al. 2007), so samples with less than 25% filtration
efficiency (5 of 22 samples collected) were considered contaminated with ambient seawater due
to improper position of the sampler.
SIP water samples were processed for nutrient analysis (as above), TOC and total
nitrogen (TN), as well as for flow cytometry for bacteria removal following Yahel et al. (2007).
Pieces of each sponge from which water was sampled were collected to verify species
identification by spicule composition. Of 243 samples collected to date, 86% have been
Aphrocallistes; all sponges we sampled water from in this study were Aphrocallistes.
2.2.3. Sponge respiration
Dissolved oxygen in ambient and excurrent water from 24 individuals was measured
using a long tube connected to a pumping CTD with an attached oxygen sensor (SBE 43
dissolved oxygen sensor, Seabird). For each sponge, the tube was positioned inside the osculum
and, once the CTD record stabilized, a 2 min time series was recorded at 4 Hz. This procedure
was repeated adjacent to the sponge to measure the ambient oxygen concentrations. We took
the difference between the two measurements to be an estimate of sponge respiration in µmol
O2 per liter processed. Flow visualization with fluorescein dye was carried out before collecting
respiration samples to ensure the sponge was pumping.
2.2.4. Calculating grazing and excretion rates
We estimated whole-reef fluxes using previously published data for the average
excurrent velocity (2.8 ± 0.4 cm s-1, mean ± standard error SE, range 0-5.2 cm s-1; (Leys et al.
2011)) and sponge oscula diameter and density (Chu and Leys 2010b) for each of three reefs that
occur in the SoG region: Fraser Ridge, Galiano Ridge, and Howe Sound (Figure 2.1A). We
propagated error to calculate standard error and 95% confidence intervals using the exact
method of Goodman (1962) for grazing rates and excretion rates per m2. Relative error
approximations were used for scaling up calculations beyond 1-m2 by adding each SE—
normalized by its respective mean—for each variable in a product (Taylor 1997). Sponge reefs in
British Columbia have been identified by multibeam mapping, providing an outline of past
(buried) and present (living and dead) glass sponges (Conway et al. 2005a). In order to calculate
fluxes for only live (actively filtering) reef, we first calculated the fluxes through an average one

22
m2 of reef using published estimates of osculum density (Chu and Leys 2010a), and then applied
that number to the percent cover of live sponges in reefs. Previous work by Chu and Leys
(2010b) estimated live sponges to occupy 14% of the area surveyed at Fraser Ridge, but the
survey areas in that study extended beyond the boundaries of area predicted to be reef by
multibeam mapping (Conway et al. 2005a), therefore some areas surveyed had no reef, and in
two instances the reef extended beyond the predicted area. To account for patchiness of the
reefs and estimate the live sponge cover more accurately at the Fraser Ridge reef and other reefs
in the SoG, we used two data sets: the area predicted to be reef based on multibeam sonar
(177,486 m2, courtesy of K. Conway), and images by ROV that surveyed a grid of 593 1 m2-plots,
of which 98 m2 or 16.5% showed live reef structure (Figure 2.1B). We extended this approach to
determine the area predicted to be reefs by multibeam mapping in the SoG (1.8 x 10⁶ m2 live
cover from 1.1 x 10⁷ m2 predicted) and from Alaska to southern British Columbia (6.6 x 10⁷ m2
live cover from 4.0 x 10⁸ m2 predicted).
2.3. Results
2.3.1. Ambient conditions at Fraser Ridge
Full water column profiles reflected the strong influence of the Fraser River outflow on
temperature, salinity, density, and transmissivity at the surface (Figure 2.2A). Closer to the
seafloor, measurements made from water collected at 0, 5, 10, and 20 meters above the sponges
were variable because replicates were collected across different days, times, and stages of the
tide (Table 2.1). On average however, nutrient concentrations (nitrate, phosphate, and dissolved
silica) showed a peak 5 meters above the reef rather than among the sponges (Figure 2.2B).
Average ammonium concentration was lower among the sponges than at all depths above
(Figure 2.2B), and while bacteria concentrations were also reduced among the sponges
compared to all other depths, total organic carbon was greater among the sponges than above
the reef (Figure 2.2C); there was low variability in bacterial concentration across all Niskin
samples.
Ambient water among the sponges (zero mab) was moderately low in oxygen and highly
enriched with dissolved silica, nitrate, and phosphate (Table 2.1). Dissolved inorganic nitrogen
(particulate nitrogen, NH4+, NO3
-, and NO2-) formed nearly 89% (26.1 ± 0.74 µmol L-1, mean ±
SE) of the total nitrogen (TN). Dissolved organic carbon (DOC) made up 85% of total organic
carbon in the water. The concentration of particulate organic matter (POM) at the sponge reef
habitat was low (10.5 ± 4.2 µmol C L-1) and the POM was nitrogen-poor (C:N ratio 8.5 ± 1.9).
The POM component consisted partly of picoplankton of which bacteria dominated whereas

23
Figure 2.2. Water characteristics above Fraser Ridge reef. (A) Depth profiles of
temperature, salinity, density, and transmissivity from July 2005 during one ROV ascent from
the reef. Bottom depth was 160 m. (B) Nutrient profiles above the seafloor. Data are
presented as the difference from the average value measured among the sponges (n=17).
Three Niskin bottles were triggered during each ROV dive, at 5, 10, and 20 meters above the
sponges. Niskin samples and SIP samples from water surrounding the sponges were analyzed
to compare bottom water conditions. Error bars: SE. (C) Vertical profiles of bacteria and TOC
concentration above the reef presented as the average percent difference from their
concentration among the sponges. Error bars: SE.

24
Table 2.1. Concentrations of nutrients in the water column above Fraser Ridge
Reef. Ammonium, nitrate+nitrite (NOx), dissolved silica (dSi), phosphate (PO4), total organic
carbon (TOC), and bacterial concentrations were measured 0, 5, 10, and 20 meters above
Fraser Ridge Reef. Mean ± SE.
meters above bottom
Ammonium NOx dSi PO4 TOC Bacteria
(nmol L-1) (µmol L-1) (µmol L-1) (µmol L-1) (µmol L-1) (cells mL-1) 0 571 ± 110 25.8 ± 0.4 49 ± 1 2.24 ± 0.07 65 ± 3.3 6.7 x 10⁵ ± 3.5 x 10⁴ 5 625 ± 184 26.0 ± 0.6 49 ± 2 2.31 ± 0.09 69 ± 1.1 8.3 x 10⁵ ± 5.0 x 10⁴ 10 708 ± 170 25.1 ± 0.2 47 ± 2 2.22 ± 0.05 73 ± 8.2 8.7 x 10⁵ ± 4.5 x 10⁴ 20 993 ± 271 24.6 ± 0.3 45 ± 1 2.10 ± 0.12 75 ± 4.2 8.8 x 10⁵ ± 3.9 x 10⁴

25
picoeukaryotes were much less abundant than other picoplankton constituents (714 ± 213 cells
mL-1, n=17).
2.3.2. Feeding and excretion
Comparisons of water samples before and after filtration by Aphrocallistes show removal
of bacteria with up to 90% efficiency (78.6 ± 3.20% mean ± SE, paired t-test, t = 14.063, degrees
of freedom (df) =14, p < 0.001; Figure 2.3A). Sponges also removed small populations of non-
photosynthetic larger cells that we isolated through flow cytometry but could not identify
unambiguously. Numbers of bacteria removed by individual sponges increased linearly with
ambient bacteria concentrations (a Type I functional response) (r2=0.69, p<0.0005; Figure
2.3B). Ammonia was the major nitrogenous waste product with 0.17 ± 0.02 µmol ammonium
per liter of water filtered (paired t-test, t =-7.37, df = 14, p < 0.001; max 70% difference from
ambient). Oxygen removal was slight but significant, 0.56 ± 0.37 µmol L-1 (0.45%; ambient [O2]
126.39 ± 3.57 µmol L-1, n=24).
Aphrocallistes did not take up or excrete notable amounts of dissolved nutrients
(phosphate, silica), or total carbon (Figure 2.3A). It should be noted that the small sample size
(n=15 pairs), dictated by the logistics of deep-sea work, resulted in low statistical power (<0.5)
of the paired t-tests we used.
2.3.3. Flux through the reef
We calculated the volume processed by each osculum each day for one m2 of seafloor
using flow rate, osculum area, and density on Fraser reef reported in Table 2.2. Each osculum
processes 9,140 ± 1750 liters osculum-1 d-1, and one square meter processes 210 ± 35 m3 d-1 (95%
confidence interval: 132-288 m3 m-2 d-1). Although Howe Sound reef covers a larger area, the
sponge density is lower and therefore this reef filters the least water per unit area, 108 ± 19 m3
m-2 d-1 (95% CI: 65-150 m3 m-2 d-1). Galiano reef sponges, in contrast, are the most dense and
therefore process the most water at 252 ± 42 m3 m-2 d-1 (95% CI: 158-345 m3 m-2 d-1) (Table 2.2).
2.3.4. Reef metabolism
Grazing rates (α) reflect the efficiency of removal of particles or nutrients from a volume
of water, and can be compared across suspension feeding communities to determine
effectiveness of extraction. For Fraser Ridge reef, we calculated that the benthic grazing rate on
bacteria, the primary food item extracted by sponges, was 165 ± 29 m3 m-2 d-1 (95% CI: 102-228
m3 m-2 d-1) – that is, the volume from which 100% of bacteria are cleared. Since bacteria
concentrations in water near the sponges were 6.9 x 10⁶ ± 3.0 x 10⁴ cells mL-1, this equates to 1.2
x 1014 ± 2.36 x 10¹³ bacterial cells m-2 d-1 removed by 1 m2 reef sponges. We calculated the total

26
Figure 2.3. Sponge pumping efficiencies and behavior. (A) Percent differences of
bacteria, nutrients, total organic carbon, ammonia, and oxygen between ambient water (IN)
and the water emerging from the exhalent osculum (EX), calculated as (EX-IN)/IN; samples
collected by SIPs as described by Yahel et al. (2007). Boxes encompass 25th and 75th
percentiles and contain medians (solid lines) and means (dotted lines); whiskers encompass
10th and 90th percentiles. Outliers are shown as dots. Asterisks indicate statistically
significant p-values from paired t-tests of water sampled from ambient and excurrent water (*
for p<0.05, *** for p<0.0005). (B) Removal of bacteria by a sponge is plotted as a function of
bacteria availability in ambient water. ‘Ambient’ refers to water immediately adjacent to the
sponge.

27
Table 2.2. Component fluxes mediated by the sponges on Fraser Ridge, Galiano
Ridge, and Howe Sound reefs based on in situ measurements of osculum size and density
from Chu and Leys (2010a, b) and excurrent flow speeds from Leys et al. (2011). Mean ± SE.
Dashes indicate values that were not measured.
Reef Component Fraser Galiano Howe 1Osculum size (cm2) 38.2 ± 1.9 22.7 ± 0.8 14.6 ± 0.5 1Osculum density (m-2) 23.0 ± 1.7 46.3 ± 3.7 30.9 ± 3.0 2Excurrent flow speed (cm s-1) 2.8 ± 0.40 - - Volumetric pumping rate (m3 m-2 d-1) 210 ± 35 252 ± 42 108 ± 19 Benthic grazing rate (m3 m-2 d-1) 165 ± 29 198 ± 34 85 ± 15 Bacteria (cells m-2 d-1) 1.1x10¹⁴ ±
0.25x10¹⁴ 1.4x10¹⁴ ± 0.29x014
5.8x10¹³ ± 1.3x10¹³
3Bacterial carbon (g C m-2 d-1) 3.4 ± 1.4 4.1 ± 1.6 1.8 ± 0.7 3Bacterial nitrogen (g N m-2 d-1) 0.66 ± 0.31 0.79 ± 0.37 0.34 ± 0.16 Oxygen (µmol m-2 d-1) 32.8 ± 13.3 39.3 ± 15.6 16.8 ± 6.99 Ammonia (mmol m-2 d-1) 39 ± 17 47 ± 20 20 ± 9
1 Data from Chu and Leys (2010b) 2 Data from Leys et al. (2011). n = 9 sponges, 13 measurements. 3 Using bacterial carbon and nitrogen values of 30.2 and 5.8 fg cell-1, respectively. From Fukuda et al. (1998).

28
bacterial carbon and nitrogen removed by reef sponges based on the amount of bacteria
consumed. Assuming 30.2 ± 12.3 fg C cell-1 and 5.8 ± 1.5 fg N cell-1 for coastal bacteria (Fukuda
et al. 1998), each square meter of reef at Fraser Ridge consumes 3.4 ± 1.4 g C m-2 d-1 and 0.7 ±
0.3 g bacterial N m-2 d-1 (Table 2.2). The rate of excretion of nitrogenous waste was comparable
to the rate of uptake of bacterial nitrogen (0.04 ± 0.02 mol ammonium m-2 d-1, or 0.55 ± 0.23 g
N m-2 d-1).
Not all of the area mapped by remote sensing (multibeam mapping) has exposed reef
structure today – some is buried under mud – however, we were able to use the area surveyed
by ROV (Chu and Leys 2010a) to estimate how much of the area mapped by multibeam consists
of sponge cover today at Fraser Ridge reef. Of the area identified by multibeam mapping at
Fraser Ridge (177,486 m2, data courtesy of K. Conway), 16.5% has live sponge cover today,
giving a total filtering reef size of 29,242 m2. This area alone consumes 1.00 x 10⁵ ± 3.99 x 10⁴ g
C d-1 (Table 2.3). Parts of Galiano and Howe reefs have been mapped in detail as well, allowing
us to also calculate their grazing rate. The area of reef mapped by multibeam in Howe Sound
was larger than Fraser (898,541 m2, data courtesy of K. Conway) so, although ROV surveys
showed it had fewer, larger sponges (11.6% live reef cover, Chu and Leys 2010b), because of its
size it is calculated to consume more carbon, 1.83 x 10⁵ ± 7.46 x 10⁴ g C d-1 from 104,231 m2 of
live reef. Galiano reef extends north and south along a long ridge, and multibeam mapping
estimates suggest it is as large as Howe (862,799 m2). It also has greater reef cover (26% live
reef cover, Chu and Leys 2010b) and more dense oscula, so live cover is estimated to be greater
than Howe (224,328 m2) and to consume more carbon, 9.20 x 10⁵ ± 3.67 x 10⁴ kg C d-1.
Multibeam mapping has identified 10 additional reefs in the SoG (Conway et al. 2005a).
Although we have not yet surveyed these using ROV and video, by using the estimate of average
sponge cover calculated for Fraser Ridge reef (16.5%), we estimate that all live sponges at SoG
reefs (including Fraser, Galiano, and Howe) cover 1.84 x 10⁶ m2 and remove 6.3 x 10⁶ ± 2.5 x 10⁶
g C d-1 (Table 2.3).
2.4. Discussion
Glass sponges are effective ecosystem engineers by constructing a three-dimensional
habitat for other animals (Beaulieu 2001b, Du Preez and Tunnicliffe 2011). Our work now
highlights the important role glass sponges have in filtering enormous volumes of water each
day, removing bacteria and oxygen, and releasing ammonium. Our calculations show that the
sponge reefs have an unusually high grazing rate in comparison to all known benthic suspension
feeding communities due to their density, efficient capture of bacteria, and high water
processing rates making them a potential carbon sink in Canadian shelf waters.

29
Table 2.3. Estimates of bacterial carbon consumption by glass sponge reefs.
Mean ± SE.
Reef Live cover (m2) Bacterial C consumed (g C d-1)
Fraser Ridge Reef 2.9 x 10⁴ 1.0 x 10⁵ ± 0.40 x 10⁵
All SoG reefs 1.8 x 10⁶ 6.3 x 10⁶ ± 2.5 x 10⁶
Reefs known from Alaska to southern British Columbia
6.6 x 10⁷ 2.3 x 10⁸ ± 0.91 x 10⁸

30
2.4.1. Grazing rates and bacterial supply
Within the glass sponge reefs in British Columbia, sponge densities and size are much
higher than those seen in other glass sponge communities (Table S1.7.1). At Galiano Ridge reef
for example, oscula reach densities up to 46 m-2 in dense patches of reef (Chu and Leys 2010b),
over 18 times greater than those seen in other glass sponge communities. Because each sponge
removes on average >75% of the bacteria from the water as it passed through the aquiferous
system, the reef functions as a highly efficient filtration system, and have the highest grazing
rates of any other suspension feeding animal or community measured to date (Table 2.4). But
perhaps more important is what such a high grazing rate translates to in carbon consumption.
Filtration requires active beating of flagella to pull water through the fine passages in the
sponge. The oxygen consumed by the sponge mainly reflects this energy expenditure (Leys et al.
2011), so knowing the oxygen removal per liter of water filtered (0.013 ± 0.0017 mL L-1) and
assuming 0.46 mg C = 1 mL O2 (Hadas et al. 2009) we calculated that each sponge osculum
requires 0.0058 ± 0.0008 mg carbon per liter of water filtered. Considering the average bacteria
removal of 5.36 x 10⁵ cells mL-1 (0.016 ± 0.004 mg carbon L-1), there remains about 0.010 ±
0.005 mg carbon L-1 available for growth. This suggests that 36 ± 14% of food energy consumed
by actively pumping sponges is used toward metabolism, as estimated previously (Leys et al.
2011), and most of this must be used for pumping water through the body for feeding and
respiration. The remaining food energy is available for growth (and skeleton production),
reproduction, maintenance, or is excreted as fecal pellets and waste (Reiswig 1981).
Each day, a square meter of reef clears bacteria from the equivalent volume of 165 meters of
water above it. This high grazing rate implies that large sponge reefs need particular
hydrographic conditions to provide enough food for growth and to prevent the formation of a
depleted boundary layer above the reef (Genin et al. 2009). Just north of Fraser Ridge, carbon
delivery to the seafloor is 0.46 g C m-2 d-1 (Johannessen et al. 2003) whereas reef sponges extract
3.4 g C m-2 d-1, seven times more than total POC delivered by vertical flux. Therefore there is a
deficit which must be mitigated by lateral transport.
Organic matter comes from several sources in the highly productive SoG. Similar
amounts of organic input arrive from terrigenous and phytoplankton sources, with about 80% of
the carbon in dissolved form and so available to microbial production (Johannessen et al.
2008). The Fraser Ridge reef grows on the lee of a ridge. A topographically controlled bottom
‘jet’ forms over the ridge with velocities up to 70 cm s-1 during flood tides, thereby resuspending
sediments (Bedard 2011) and associated organic matter. The Fraser sponge reef is located where
a strong lee wave advances down-slope as the northward jet forms over the tidal cycle. As most

31
Table 2.4. Comparison of benthic grazing rate, water processing rate, and carbon consumed by suspension
feeding communities (numbers come directly from the references unless indicated otherwise by footnotes).
Habitat
Benthic grazing rate
α (m3 m-2 d-1)
Water processing
rate (m3 m-2 d-1)
Carbon consumed
(g C m-2 d-1) Material consumed Reference
Glass sponge reef 85-198 108-252 1.8-4.1 bacteria this study
Soft-bottom community, San Francisco Bay 40-60 10.3† 0.14-0.16 phytoplankton Jones et al. 2009
Tropical sponge community 16.5-40 - - bacteria Reiswig 1973; Reiswig 1974
Coral reef in Eilat, Red Sea 10-20 2.6‡ 0.22 phytoplankton Genin et al. 2009
Bivalve: Corbicula in tidal lakes, Sacramento-San Joaquin river delta
1-11 -* 0.04-0.32 phytoplankton Lucas et al. 2002
Tropical demosponge: Aplysina (Verongia) fistularis‡‡ 1.7 0.06 0.0070 POC Reiswig 1981
Lake Baikal sponges 1.4 1.98 1.12* prokaryotes, eukaryotes Pile et al. 1997; Savarese et al. 1997
†Pumping rates presented in Table 4 (Jones et al. 2009). ‡Calculated using the same scale-up approach as used here, but only for conspicuous pumping suspension feeders. *Water processing rates were not measured because grazing and carbon consumption were estimated using plankton biomass. ‡‡All values were presented for an individual sponge (Reiswig 1981). Densities were assumed as an average of density of Mycale lingua and Verongia gigantea (Reiswig 1973). Retention efficiency was only for bacteria (97%). POC consumption (16.7 µg POC L-1) accounted for 14% of metabolic needs while DOC made up 86%. **Includes carbon consumed or removed from the water and carbon released. Chloroplast-containing picoeukaryotes were found
expelled from one species (Baikalospongia intermedia).
32
POC in the Strait settles in the southern SoG and is redistributed northward by currents
(Johannessen et al. 2005), the reef placement is optimal to receive this material or more likely,
the bacteria that thrive on it. This lateral delivery of bacteria to the reef seems to be the principal
reason for the location of reefs on major topographic features that accelerate water flow such as
canyons, shelf walls, and fjord sills (Conway et al. 2005b).
2.4.2. A carbon sink
The amount of carbon consumed by reefs in the SoG (Table 2.3) is only 0.8 ± 0.3% of the
daily vertical flux of primary production to the seafloor in the SoG (7.80 x 10⁸ g C d-1;
Johannessen et al. (2003)), so there is not a great effect on the mass balance of carbon in the
SoG, which is a highly productive basin. Our calculations however, stem from just a fraction of
the area covered by known reefs and other dense stands of glass sponges in the northeast
Pacific. If all other reefs mapped by remote sensing – from Hecate Strait, Queen Charlotte
Strait, the Strait of Georgia, and south-eastern Alaska (Conway et al. 2005a, Stone et al. 2014) –
are included (Table 2.3), the amount of carbon consumed by sponge reefs may be considerably
larger. Assuming the same relationship between reef cover and area mapped by multibeam
sonar found at Fraser Ridge (16.5%) for all reefs identified by remote sensing (403 km2), glass
sponges cover a total of 66 km2, process 1.4 x 10¹⁰ ± 2.3 x 10⁹ m3 water d-1 and consume 2.27 x
108 ± 9.1 x 10⁷ g C d-1 (although it is not known how much carbon is released by reefs each day).
Manned submersible dives since the 1980s have documented that fjord walls and sills within
straits also have dense communities of glass sponges (up to 24 m-2; Leys et al. (2004)) and since
we do not include those sponges, our calculation of carbon consumption by glass sponges is an
underestimate.
Sponges in other classes, especially Demospongiae which can be conspicuous inhabitants
in tide pools to freshwater lakes, abyssal seafloors and coral reefs, also consume large amounts
of carbon, but still substantially less than glass sponge reefs (0.029 – 1.970 g C m-2 d-1)
(Maldonado et al. 2012). While we are confident in our estimates of overall fluxes for glass
sponges, generalizations beyond the Hexactinellida are difficult for two reasons. First, the
Demospongiae may contain symbionts that cause them to feed on and excrete different carbon
and nitrogen species (reviewed by Maldonado et al. 2012). Second, it is rare to get the full suite
of measurements needed to scale up estimates, although there have been some attempts
(reviewed by Maldonado et al. 2012).
2.4.3. Ammonia excretion and ammonium
The sponges not only efficiently remove bacteria from the water, but they excrete wastes
as ammonia. Water sampled above the reef had five times more ammonium than water
33
collected around solitary glass sponges growing in fjords in Barkley Sound (Yahel et al. 2007).
The difference could be regional, but the voluminous water processing by the reef likely has a
substantial effect. Vertical Niskin profiles show higher ammonium concentrations in water 5,
10, and 20 meters above the reef sponges compared to water among the sponges, however we do
not imagine excretion by glass sponge reefs has a large effect on total primary production in this
nutrient-rich basin. Reefs cover a small fraction of the total size of the SoG and their
contribution to the SoG nitrogen budget is small relative to the dominant source: oceanic water
brought in via the bounding Haro Strait (3.0 x 10⁴ Mmol year-1; Sutton et al. (2013)). This would
not be the case however, for more enclosed or less productive waters. Unlike the nitrate-rich
waters in the SoG, ammonium is the favored and dominant nitrogen source for phytoplankton
in other regions such as the Weddell Sea, where excretion by krill makes up nearly 80% of the
ammonium taken up by phytoplankton for primary production (Whitehouse et al. 2011).
Likewise, glass sponges perched on seamounts may contribute to primary production in the
photic zone through turbulent mixing and internal waves (Clark et al. 2010), transporting
ammonia up to where it can fuel further productivity.
2.4.4. Conservation issues: Implications of water processing by glass sponges
We measured nutrient and particle fluxes from sponges in a reef whose flow dynamics,
density, and other features are well studied, resulting in first-order estimates of reef-wide fluxes.
Multibeam mapping reveals reef structure, both past and present; therefore, if all areas
identified by multibeam mapping to have been reef at some time in the past are considered, the
potential total reef cover for all past reefs is 403 km2, which could have resulted in consumption
of 1.38 x 10⁹ ± 5.5 x 10⁸ g C d-1. These figures indicate that sponge reefs have been a carbon sink,
at least locally, for as long as they have been present.
Modern-day reefs occur from southern Alaska to British Columbia (Conway et al. 2005b,
Stone et al. 2014) but we do not know their extent before trawling. Bottom trawling has
damaged 21% of sponges in the Aleutian archipelago (Heifetz et al. 2009), with potential for
greater damage where densities are high. Bottom trawling is common in Canadian waters, with
glass sponges recorded in bycatch records since 1996. Trawl records from 1996 to 2001 find a
catch per unit effort for sponges between 0.086 and 6.041 kg min-1 during trawls through reefs
(Jamieson and Chew 2002). Each sponge damaged is one that is no longer sequestering
bacterial carbon into its skeleton or recycling nitrogen. Prior to anthropogenic effects in the
Northeast Pacific, dense assemblages of glass sponges may have had a substantial effect on
nutrient dynamics in bottom waters.

34
Glass sponges may have served a similar role in prehistoric oceans and the ammonium
they excreted may have been more important to the surrounding community; unlike the highly
productive waters that reefs are found in today, ancient reefs in the Tethys Sea lived in
oligotrophic waters (Leinfelder et al. 1996). Like modern-day oligotrophic habitats, recycled
nutrients were very important in driving productivity in Jurassic oceans. Ancient reefs in the
Jurassic were not monocultures (Leinfelder et al. 1996) and did not have fused skeletons, which
enhance reef structure, as modern reefs do, but assuming that their filtration was similar to
present-day reefs, prehistoric reefs were likely very important cyclers of carbon and nitrogen in
ancient waters.
Sponges were predicted to be on the ‘winners’ side of climate change’ after dramatic,
episodic growth was observed following breakage of ice shelves in the Southern Ocean (Dayton
et al. 2013, Fillinger et al. 2013). If this is true, then sponges may be one of many buffers against
climate change as carbon concentrations in the ocean rise and subsequently become sequestered
into sponge tissue.
2.5. Acknowledgements
We thank the captain and crew of the Canadian Coast Guard Ship Tully and Vector, the
crew of the remotely operated vehicle ROPOS, G. Tompkins-MacDonald, K. Pawluk, J. M. Rose,
A. Page, N. Lauzon, and D. Eerkes-Medrano for assistance in the field, and F. Whitney and K.
Conway for discussions on methodology. We also thank M. Maldonado and two anonymous
reviewers for valuable feedback on this manuscript. Carbon analyses were carried out by J.
Sharp (University of Delaware), and nutrient analysis was performed by F. Whitney & J.
Barwell-Clarke (Institute of Ocean Sciences, British Columbia). Instrument and facility access
were provided by F. Whitney (Institute of Ocean Sciences). Funding sources are gratefully
acknowledged: NSERC Vanier Canada Graduate Scholarship Canada (A. Kahn), Canada
Research Chair funds (V. Tunnicliffe and S. P. Leys), and NSERC Ship Time & Discovery grants
(VT, SPL).

35
Chapter 3. Dynamic change, recruitment, and resilience in reef-forming glass sponges1
3.1. Introduction
Glass sponges (Class Hexactinellida) are conspicuous members of the deep-sea fauna
and are thought to be adapted to the long-term constancy of deep water. Glass sponges are
estimated to live up to 400 years (Leys and Lauzon 1998, Fallon et al. 2010), yet yearly
monitoring has also revealed rapid responses to changing conditions and seasonal or annual
spurts of growth in both shallow and deep-water populations (Leys and Lauzon 1998, Kahn et al.
2012, Dayton et al. 2013, Fillinger et al. 2013).
Since their first discovery during seafloor mapping of the shelf waters in the late 1980s, it
is known that 4 large glass sponge reefs exist in Hecate Strait and Queen Charlotte Sound,
British Columbia and over 12 more are known in southern waters of the Strait of Georgia.
There, larvae settle and grow up to form the next generation (Krautter et al. 2006). In the Strait
of Georgia A. vastus and H. calyx settle and grow upon previous generations forming mounds
up to 21m high cemented together by sediment (Conway et al. 2005a).
Glass sponge reefs and sponge gardens are important nursery habitats for commercially
important species (Cook 2005, Marliave et al. 2009, Chu and Leys 2010b, Miller et al. 2012),
contribute to local silica cycling (Chu et al. 2011), and they are major grazers of plankton in deep
water (Chapter 2, Kahn et al. 2015). Glass sponges throughout the northeast Pacific are easily
damaged by trawl and other fishing activity (Freese et al. 1999, Heifetz et al. 2009). In western
Canadian waters glass sponges have been recorded as bycatch with between 0.086 kg-1 and
6.041 kg min-1 catch per unit effort in trawls through reefs (Jamieson and Chew 2002); there are
also many anecdotal records of damage to sponges by recreational prawn fisheries. What is not
known is how resilient glass sponges are to damage, nor generally how dynamic growth and
regeneration of individuals and populations are.
We used a remotely operated vehicle with highly accurate GPS navigation underwater to
monitor change over time at two sponge reefs in the Strait of Georgia. Our aim was to observe
and document reproduction and recruitment events, measure normal growth rates, and to
determine whether dense glass sponge communities are resilient to disturbance.
1 A version of this work has been published in the Journal of the Marine Biological Association of the United Kingdom: Kahn, A. S., L. J. Vehring, R. R. Brown, and S. P. Leys. 2015. Dynamic change, recruitment, and resilience in reef-forming glass sponges. Journal of the Marine Biological Association of the United Kingdom. 96(2):429-436.

36
3.2. Materials and Methods
Fraser and Galiano sponge Reefs were visited in 2005, 2007, 2009, 2011, 2013, and 2014
during cruises on the CCGS Vector and CCGS Tully (Fraser Reef: 49° 9’ 15.7” N, 123°23’ 3.7” W;
Galiano Reef: 48° 54’ 51.5” N, 123°19’27.7” W). Work was carried out using the remotely
operated vehicle (ROV) ROPOS (http://ropos.com) which uses an ultra-short baseline
navigation (USBL) Global Acoustic Positioning System (GAPS) with a LOKI Kalman filter that
allows positioning within 1 m.
3.2.1. Recruitment and growth
Both Fraser and Galiano sponge reefs were mapped extensively using grids of non-
overlapping photos taken 1 m above the seafloor in 2005 and 2007 (Galiano Reef: 214 photos
covering 594 m2; Fraser Reef: 109 photos covering 69 m2) (Chu and Leys 2010b). From the
same set of ROV photos juvenile sponges – those with maximum osculum width of <10 cm and
minimal branching – were counted and osculum diameters measured using ImageJ software.
No attempt was made to differentiate between the two species because Heterochone calyx and
Aphrocallistes vastus cannot be distinguished from photos alone. The density of juvenile
sponges was calculated from the total photo area for each survey grid point, plotted on maps of
the reefs using ArcGIS (ArcInfo version 10.2, ESRI), and compared to the distribution of adult
sponges documented by Chu and Leys (2010b) using Spearman rank correlation (SYSTAT 12).
To look for evidence of reproduction (whether as spermatocysts, eggs, or embryos in
tissue), pieces of Aphrocallistes vastus collected by SCUBA and by ROV were preserved in a
cocktail fixative of 1% OsO4, 2% glutaraldehyde, and 0.45 M sodium acetate buffer with 10%
sucrose (Harris and Shaw 1984). The fixative was replaced after 30 min and specimens were left
at 4C overnight. Specimens were dehydrated through a graded ethanol series to 70% ethanol,
and then desilicified in 4% HF in 70% ethanol. Following desilicification, samples were rinsed
twice in 70% ethanol, dehydrated to 100% ethanol and fractured in liquid nitrogen. Fractured
pieces were critical point dried (Bal-Tec CPD 030), mounted on aluminum stubs, sputter-coated
with gold (Xenosput XE200), and viewed in either a Hitachi S-3500N or a field emission
scanning electron microscope at 5 keV (JEOL 6301F).
To monitor growth (changes in size of branches) or death (loss of live tissue) over time,
the ROV was positioned at the exact same heading and same GPS position to match the camera’s
view to photos from previous years. Lasers 10 cm apart fixed to the camera provided a scale.
3.2.2. Sediment accumulation
To determine how much sediment accumulates at the reefs, sediment traps and erosion
markers were placed at Fraser and Galiano Reefs between 2007 and 2009. Sediment traps were

37
PVC tubes 0.5 m long with 45-cm2 opening attached to stakes that were pushed into the
sediment until the bottom of the tube was at the sediment surface. Each tube trap was pre-filled
with hypersaline water and capped with a lacrosse ball that was removed by an elastic cord after
the trap was positioned. Traps and makers were placed adjacent to and about 2-3 m away from
clumps of sponges in 2007. In 2009 sediment traps were re-sealed with lacrosse balls to
prevent loss of contents, recovered using the ROV, and frozen at -20°C for transport to the
University of Alberta. The sediment was pushed out of the traps while still frozen and the total
height of accumulated sediment measured. Sediments were dried in an oven at 60C until less
than 3% change in mass was achieved for two days in a row.
Erosion markers were PVC poles with 2.5-cm wide black and white markings. Not all
fourteen erosion poles were found each cruise but for those revisited the number of markings
above- and below-ground were counted for each pole.
3.2.3. Recovery after disturbance
Disturbance experiments were carried out in 2011, 2013, and 2014. First a clump of
sponges was selected for large-scale disturbance at Galiano Reef using an asymmetrical BACI
design, with one treatment patch and two control patches to minimize damage to the reef
(Underwood 1994). Two PVC markers, described above, were placed on either side of the
clump. Overlapping still images of the entire clump including the marker poles were taken 1
meter above the seafloor as the ROV moved around and across the clump. Then the ROV was
lowered onto the sponges to crush an approximately 1.5 x 2 m large area. A second image series
was captured after damaging the sponges. Two control sites were surveyed using the same
methods. All three sites were revisited in 2013 and 2014 and an identical image survey carried
out. Seventy photos were selected from each survey based on clarity, image quality, and
coverage of the site and adjusted for optimal contrast using Photoshop. Three-dimensional
structure-from-motion reconstructions of each BACI site were created using 123d Catch
(Autodesk, www.123dapp.com/catch) to visualize changes to the sites from all angles.
Second, in 2013 four sponges adjacent to PVC erosion markers were selected for small-
scale damage experiments at Galiano reef. Images were captured of ‘mitten’-like extensions and
then the ROV manipulator arm was used to remove 3-10 cm portions from the tips of the
sponges. The same sponges were revisited in 2014 using heading and GPS coordinates to match
the view from images from 2013. Images were captured of the same view.

38
3.3. Results
3.3.1. Recruitment of new sponges
The smallest sponges visible on the reef using HD video from the ROV were less than 5
cm in overall height and width with oscula as small as 2 cm in diameter. All juvenile sponges
observed were attached to dead skeleton, had centrally placed oscula, and had broad ridges
indicating the first growth of mitten-like projections.
The density of juvenile sponges (0.4 ± 0.9 juveniles m-2; mean ± standard deviation, SD)
was greater in areas where adult sponge density was highest (Figure 3.1A; Spearman rank
correlation, ρ=0.299, p<0.0001) and where dead sponge cover (skeletons) was highest
(Spearman rank correlation, ρ=0.272, p<0.0001). Live and dead sponge cover were strongly
correlated (Spearman rank correlation, ρ=0.666, p<0.00001). While density did not differ
between reefs (Mann-Whitney U-test, U=10,905, df=1, p=0.218), juveniles found at Fraser Reef
were significantly smaller (1.6 ± 0.8 cm maximum osculum width, mean ± SD) than juveniles at
Galiano (2.6 ± 1.7 cm; Mann-Whitney U-test, U=1,376.5, df=1, p=0.004) and had a narrower
size distribution (Figure 3.1B-D).
A total of 36 specimens were examined for evidence of spermatocysts, eggs, or embryos,
from July 2004, November 2004, July 2005, October 2007, June/July 2008, October 2009,
October/November 2011, December 2012, and February 2013. Adult tissues from one ROV
collection in November 2011 had spermatocysts by December of the same year, and tissue
collected by SCUBA in a nearby fjord (Saanich Inlet) in December 2012 and February 2013 also
contained spermatocysts (Figure 3.1E). Developing embryos were found in a single specimen of
Aphrocallistes vastus collected by scuba by one of us (Leys) in November 1995 (Figure S2.1).
3.3.2. Growth
Because Aphrocallistes vastus and Heterochone calyx grow in three dimensions and
extend mitten-like projections to increase surface area, it is difficult to find an accurate growth
parameter to measure. We compared images captured at the same angle (ROV heading) each
year to measure changes in shape and change in either height of an osculum or length of a
projection. Changes included one sponge found growing around a pole in 2013 that had been
absent in 2011, and was dying in 2014 (Figure 3.2A). Individual oscula grew in diameter in a
multicolored clump of sponges in 2011, 2013, and 2014 but a portion of that clump died back
between 2013 and 2014 (Figure 3.2B). A juvenile grew an estimated 3 cm yr-1 (Figure 3.2C).
Three large sponges grew between 1 and 3 cm yr-1 taller while projections from oscula grew
faster, between 7 and 9 cm yr-1 (Figure 3.2D).
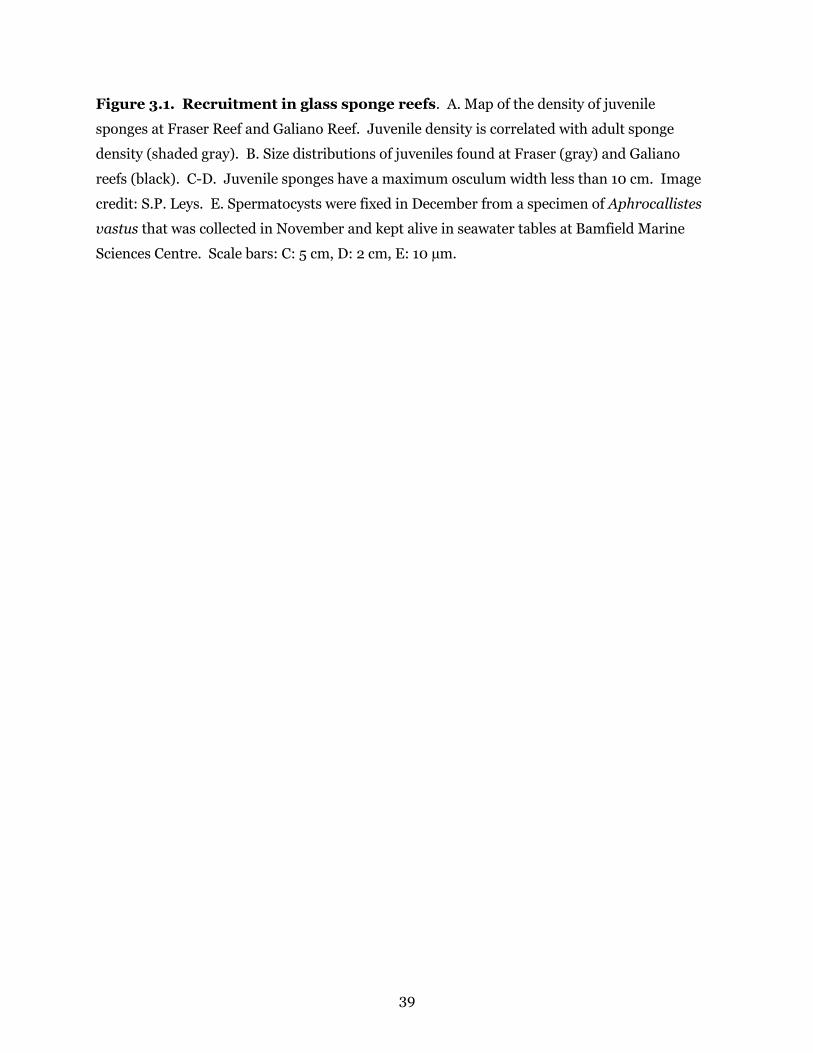
39
Figure 3.1. Recruitment in glass sponge reefs. A. Map of the density of juvenile
sponges at Fraser Reef and Galiano Reef. Juvenile density is correlated with adult sponge
density (shaded gray). B. Size distributions of juveniles found at Fraser (gray) and Galiano
reefs (black). C-D. Juvenile sponges have a maximum osculum width less than 10 cm. Image
credit: S.P. Leys. E. Spermatocysts were fixed in December from a specimen of Aphrocallistes
vastus that was collected in November and kept alive in seawater tables at Bamfield Marine
Sciences Centre. Scale bars: C: 5 cm, D: 2 cm, E: 10 µm.

40
Figure 3.1. Recruitment in glass sponge reefs

41
Figure 3.2. Growth and change in glass sponge reefs. A. A marker pole planted in
open sediments in 2011 (A) had a 20-cm tall sponge (arrow) surrounding it in 2013 (A’),
probably dislodged by the ROV. In 2014 (A”), the sponge had died but other sponges had
grown up nearby. The photo from 2011 was rotated to provide the same view as in 2013 and
2014. B. A clump of sponges (arrowhead) adjacent to a sediment marker persisted from 2011
(B) to 2013 (B’), but was dead in 2014 (B”). C. Growth of a small sponge (filled arrow) beside a
marker. The marker was moved after photographing in 2013, so it now is to the left of the
sponge and a juvenile appeared on the settlement plate in 2014 (C: 2011, C’:2013, C’’: 2014).
D. Several sponges (filled arrowheads) overgrew a discarded cable we encountered at Fraser
Reef. The projections on these sponges grew 7-9 cm yr-1 (D: 2011, D’: 2013, D’’: 2014). All
scale bars: 50 cm.

42
Figure 3.2. Growth and change in glass sponge reefs

43
3.3.3. Sediment accumulation
Sediment traps showed sedimentation accumulation of 97 mm y-1 at Galiano and 137 mm
y-1 at Fraser reef over 2 years (2007-2009); however, the PVC poles showed both accumulation
and erosion with no net overall change over the two years (Figure S2.2). On some poles at
Galiano reef the markings at sediment level were erased by scouring caused by high currents.
3.3.4. Recovery after disturbance
3.3.4.a. Large-scale damage
The site crushed by the ROV showed no recovery after 3 years (Figure 3.3, Supplemental
Material S2.3). Large clumps of sponges immediately adjacent to the damaged site survived
through 2014 but did not spread into the space vacated by the dead sponges, nor were new
juvenile sponges seen anywhere on the damaged skeletons (Figure 3.3). The two undisturbed
control sites showed both new growth and patches of sponges that had died. New growth
occurred as overgrowth of skeletons by both glass sponges and by the demosponge Desmacella
austini.
3.3.4.b. Small-scale damage
All four sponge projections that were damaged had repaired completely within one year.
In each instance, the sponge had regenerated a soft growing edge to close the damaged area. On
one sponge, the damaged projection had grown into what appeared to be an osculum while an
undamaged projection of the same sponge had grown 9 cm in length (Figure 3.4).
3.4. Discussion
We took advantage of repeat visits to the glass sponge reefs in the Strait of Georgia
British Columbia using a ROV to observe recruitment and changes to individual sponges over
time. We found that the changes were similar to those that occur to sponges in shallow-water
habitats including growth, death, and resilience to disturbance.
3.4.1. Recruitment of new sponges
The many juvenile sponges observed on the reefs with one distinct size class of osculum
diameter (1-3 cm) are indicative of one or more reproductive events per year. We have looked
for signs of reproduction in reef sponge tissues during every visit by SCUBA or ROV since the
late 1990s. Although putative embryos have only been found in one specimen collected in
November 1995 and not in tissues collected in July 2005, October 2007, 2009, 2011 or
November 2011, 2013, 2014, nevertheless we found spermatocysts in tissue collected in
December 2012 and February 2013. From these three observations of spermatocysts and
embryos we conclude that gametes develop asynchronously within a single individual of

44
Aphrocallistes vastus and that reproduction is asynchronous among individuals, with spawning
of sperm and development of embryos by brooding occurring over winter months.
Finding so many very small sponges gives new insight into reproduction and recruitment
at the reefs. Given a growth rate of 1-3 cm yr-1, juveniles (2-10 cm) seen on the reefs in
November 2013 and 2014 may have settled the previous year. Because larvae recruit to dead
sponge skeleton we wondered whether high sedimentation might impede settlement and
recruitment. Our two methods of measuring sediment accumulation suggest this is not the case.
First, the density of juveniles was independent of sedimentation rates: Fraser reef had double
the sediment fallout of Galiano reef, but density of juvenile sponges at both reefs did not differ.
Second, the erosion markers showed very little accumulation of sediment even over several
years, which explains why reef skeletons remain exposed as a good substrate for recruitment.
The fact that juveniles were found near both adult sponges and dead skeleton suggests
that either larvae settle close to their site of release as found by Uriz and colleagues for a
demosponge (Uriz et al. 1998), or that larvae settle gregariously based on chemical cues from
the material growing on dead skeletons (Ettinger-Epstein et al. 2008). A third possibility is that
those skeletons and live sponges provide both good substrate and good growing conditions for
sponges. These hypotheses cannot be tested with our data since the density of live sponges and
dead skeletons were strongly correlated. In all visits to the reefs, there was no evidence that reef
species reproduce asexually by forming tissue drips as suggested by Austin et al. (2007).
3.4.2. Growth
Because we could carry out repeated visits to the same sites on the reefs we could see
changes to individual sponges over time. Rates we calculate of 1-3 cm yr-1 for very young reef
sponges are slower than those estimated for overall growth for the hexactinellid
Rhabdocalyptus dawsoni, which can grow in length by up to 12% per year in small specimens
and by 6% per year in larger specimens (Leys and Lauzon 1998). Projections of reef sponges
grew more rapidly, at 7-9 cm yr-1, which is in agreement with rates measured by Austin and
colleagues (Austin et al. 2007). Generally it seems then that smaller sponges grow relatively
quickly or episodically (Leys and Lauzon 1998, Dayton et al. 2013, Fillinger et al. 2013).
Appearance and growth of new sponges, and death of patches of sponge, indicate that the
population is continually renewing and replacing across annual timescales as described for other
glass sponge populations (Kahn et al. 2012). In 2013 we re-visited an erosion pole planted in
2011. A large sponge now lay against it (Figure 3.2A), which suggests that this sponge was
dislodged from elsewhere and came to rest against the pole. If the sponge was dislodged in 2011

45
Figure 3.3. Disturbances to the sponge reefs using an asymmetrical BACI design.
A. Images of an ‘impacted’ site in 2011 before physical disturbance with paths for ROV surveys
shown by dashed lines. (B, B’, B”) Image surveys following our experiment in 2011 and
showing the state of the site in 2013 and 2014 show little recovery, though adjacent sponges
appeared unaffected. Control sites 1 (C: 2011, C’: 2013, C”: 2014) and 2 (D: 2011, D’: 2013, D”:
2014) showed overgrowth of sponge tissue, death of other tissue, and colonization by
Desmacella. Dotted circles indicate regions of growth or death between years. All scale bars:
50 cm.

46
Figure 3.4. Recovery of reef sponges from small-scale damage. All panels show regions with projections of sponges that
were damaged in 2013. A, B: 2013 Still images captured from HD video before damage occurred. A’, B’: 2013 Still images from HD
video taken after the projections had been damaged. A’’, B’’: 2014 Still images from HD video taken one year later. All scale bars:
10 cm.

47
and was still alive two years later then glass sponges can reattach following breakage. There is
little chance that this sponge settled and grew from a larva to some 30 cm in diameter in 2 years,
although that possibility should not be ruled out. This was a single observation however, and
further observations are needed to determine whether this sort of reattachment could happen
more often in sponge reefs due to disturbance by sharks or high currents.
3.4.3. Recovery after disturbance
Glass sponges are easily broken with trawls and prawn traps (Freese et al. 1999,
Wassenberg et al. 2002, Ardron and Jamieson 2006, Heifetz et al. 2009), but the ability of reefs
to recover from damage is unknown. We therefore took advantage of the ability to make repeat
visits to identical sites to determine the ability of reef forming sponges to regenerate.
Having expected that deep sponge communities change slowly, we were surprised to find
that small parts of sponges intentionally damaged by the ROV could recover completely in one
year. Similar regeneration rates were found previously in shallower populations of glass
sponges wounded experimentally (0.05cm2 d-1 or 18 cm2 yr-1; Leys and Lauzon (1998)).
Naturally broken fragments of sponges and damage to oscula and projections were frequently
seen on our ROV dives. This damage was thought to be caused by both fish bites and knocks by
fish tails (e.g. dogfish, ratfish) because in 2014 we watched as both the Pacific spiny dogfish
(Squalus acanthius) and the lingcod (Ophiodon elongatus) caused this sort of damage when
they caught crustacean prey from among the sponges (Figure 3.5A). Grazing by the nudibranch
Peltodoris lentiginosa also causes extensive damage to the uppermost projections of sponges
(Figure 3.5B).
We were even more surprised to learn that, in contrast to the quick repair of small parts
of the sponges, no new sponges grew into or colonized the ‘impacted’ BACI site even after three
years. Because sponges at the edge of the damaged site grew into the area but no new sponges
recruited, we suspect that it was the extensive damage to the skeletons, used as substrate by reef
sponges, that prevented new recruitment. Trawling has similar effects in removing rugosity and
creating flat terrain (Puig et al. 2012), so damage caused by trawling in regions with sponge reefs
and gardens is expected to be long lasting.
In addition to anthropogenic disturbance, reef sponges face predation as described above
and also by Chu and Leys (Chu and Leys 2012) as well as competition for space. The
demosponge Desmacella austini grows on the spicule skeletons of reef sponges and may
overtake live sponge tissue, although this remains to be verified (Lehnert et al. 2005). Three
different color morphs – possibly different species – of Desmacella were seen at both reefs.
Desmacella was most common on dead glass sponge skeleton (Figure 3.5C), but careful study of
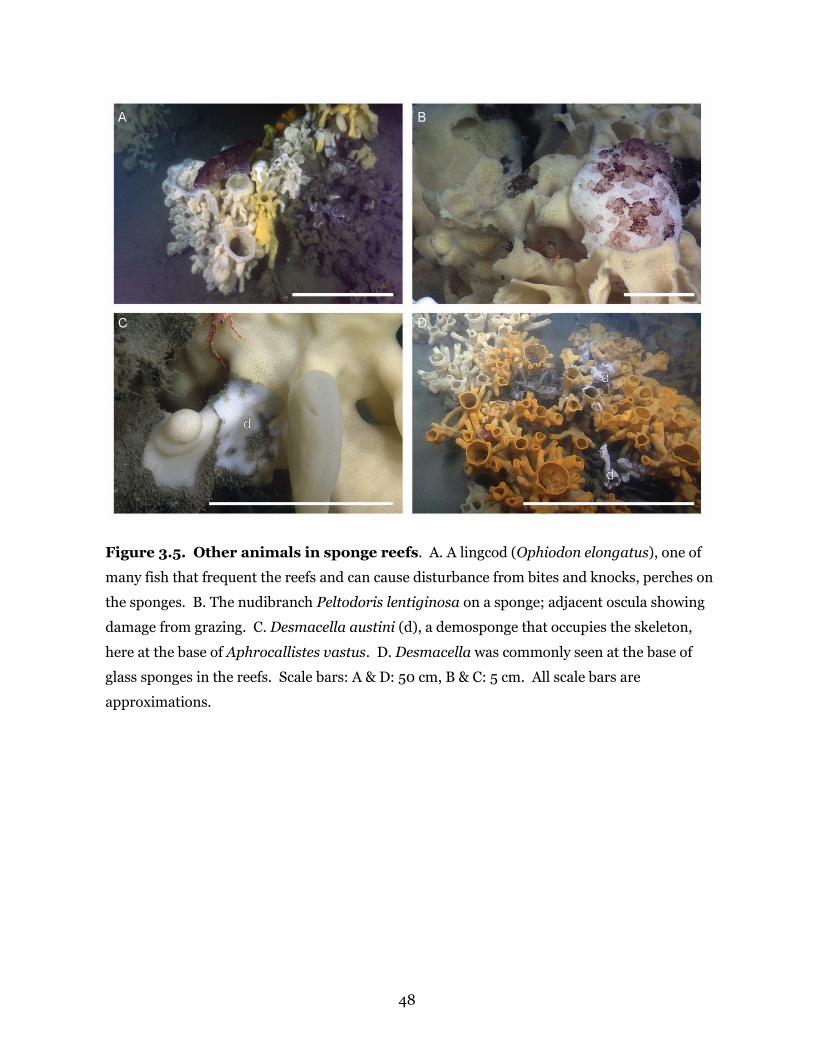
48
Figure 3.5. Other animals in sponge reefs. A. A lingcod (Ophiodon elongatus), one of
many fish that frequent the reefs and can cause disturbance from bites and knocks, perches on
the sponges. B. The nudibranch Peltodoris lentiginosa on a sponge; adjacent oscula showing
damage from grazing. C. Desmacella austini (d), a demosponge that occupies the skeleton,
here at the base of Aphrocallistes vastus. D. Desmacella was commonly seen at the base of
glass sponges in the reefs. Scale bars: A & D: 50 cm, B & C: 5 cm. All scale bars are
approximations.

49
the high definition video showed that Desmacella occupied the base of many individuals of glass
sponges (Figure 3.5D). Whether Desmacella colonizes live glass sponges or takes advantage of
areas of skeleton left exposed by regressing tissue as the sponges grow upward is unknown. Its
growth on dead skeletons however, may prevent larvae from settling.
3.5. Conclusions
Three years of observations of deep sponge reefs showed that many aspects of reef
ecology – recruitment, growth, and resilience to disturbance – were comparable to those of
shallower sponges. Recruitment occurs annually with growth rates for the smallest sponges of 1-
3 cm yr-1 and projections of the larger sponges at up to 7 cm yr-1. New sponges continually grow
and replace sponges that have died. Glass sponge reefs are resilient to minor natural
disturbance, but showed no signs of recovery from large-scale physical breakage within the
timescale of this study.
3.6. Acknowledgments
We thank the captain and crew of CCGS Vector and the staff and pilots of the Canadian
Scientific Submersible Facility ROPOS. D. Eerkes-Medrano, D. Ludeman, J. Chu, V. Tunnicliffe,
and G. Yahel helped with ship support and equipment deployment. We thank Pinnacle Divers of
Victoria, B.C. for diving support. Lab space was provided by the School of Earth and Ocean
Sciences (University of Victoria) and Bamfield Marine Sciences Centre. V. Marshall, J. Mah,
and especially C. Pennelly helped with data management and curation.
3.7. Financial Support
This work was supported by NSERC Ship Time and Discovery Grants (SPL), Canada
Research Chair (SPL), and the Vanier Canada Graduate Scholarship (ASK).

50
Chapter 4. Cell replacement in sponges sheds light on stem cell origins in Metazoa
4.1. Introduction
It has been proposed that rapid renewal of choanocytes – feeding and water pumping
cells – may be responsible for a large amount of the carbon released by sponges (De Goeij et al.
2009, De Goeij et al. 2013, Alexander et al. 2014) as part of their role in pelagic-benthic
coupling; however, it remains unclear how much this is due to choanocyte renewal rather than
excretion of detritus and mucus. Is tissue homeostasis really so rapid and so uniform across
taxa and over time for an individual sponge that gross estimates are possible? Cell turnover and
replacement are essential properties of animal tissues and organs, but how and whether the
earliest animals regulated cell turnover and achieved tissue homeostasis is unknown.
Tissue homeostasis in animals occurs at different rates for different cell types depending
on function, with metazoans and other multicellular organisms typically using stem cells to
replenish cell populations (e.g. Newmark and Sánchez Alvarado 2000). In sponges,
differentiated cells make up structures that must be maintained, including outer and inner
epithelia (pinacoderm) and pumping and feeding units (choanocyte chambers). As an early
branch of animals, sponges provide a model to determine whether the last common ancestor to
animals needed to regulate cell proliferation on its way to multicellularity.
In relation to other animals, sponges are significant because of their traditional
placement as the earliest branch of the metazoan tree (e.g. Philippe et al. 2009). The
morphology and activity of sponge choanocytes resembles that of choanoflagellates, the closest
protistan relatives to animals. Although the morphological similarity between sponges and
choanoflagellates may be convergent (Mah et al. 2014), sponges may provide hints at how the
last common ancestor (LCA) to animals transitioned from a unicellular, colonial,
choanoflagellate-like individual to a complex animal for whom multicellularity is compulsory.
The transition to multicellularity was accompanied by several other major transitions, many of
which originated in unicellular ancestors but all of which must be found in multicellular groups
(Grosberg and Strathmann 2007). These transitions include a division of labor among
differentiated cell types, cell-cell signaling, interdependence between cell types which would
lead to differentiation of tissues with organs (Grosberg and Strathmann 2007), and controls to
keep various cell populations from growing unchecked (cancer is the result when these controls
are disrupted in multicellular life; Pellettieri and Alvarado 2007).

51
Some recent phylogenomic analyses have introduced doubts about whether sponges or
ctenophores (Phylum Ctenophora) were the first group to branch off from the last common
ancestor to animals (Dunn et al. 2008, Pisani et al. 2015, Whelan et al. 2015). These analyses
have inspired new hypotheses of what the last common ancestor to animals must have been like
– ctenophores have complex neural and muscular systems that would have either had to evolve
twice independently or have been secondarily lost in sponges. However, despite their possible
position as sister group to the metazoans, the rapid radiation and what appears to be
independent evolution of the neural and muscular systems (Moroz 2015) makes ctenophores
morphologically very divergent from whatever the LCA was like. Sponges remain a more
appropriate phylum to study to understand how the LCA made the transition from a unicellular
individual to a multicellular animal.
In other animals cell proliferation is anything but constant: proliferation varies between
different cell types within the body (Pellettieri and Alvarado 2007), between different species
(Otto and Campbell 1977, David 1983, Holstein and David 1990), at different stages of
development and growth (Cheng and Leblond 1974, Alexiades and Cepko 1996), following
circadian, tidal, and seasonal rhythms (Chisholm et al. 1984, Leibson and Frolova 1994, Zaldibar
et al. 2004), and depending on starvation and food availability (Otto and Campbell 1977, Bosch
and David 1984). Longer cell lifespans are associated with larger body mass, cell size, and lower
temperatures (Gillooly et al. 2001, Gillooly et al. 2012). The proliferation rate of single-celled
organisms is also affected by nutrient and light levels (Olson and Chisholm 1986, Zachleder and
Van Den Ende 1992, Taroncher-Oldenburg et al. 1999).
Cell turnover rates (i.e. the cell cycle length) estimated for different demosponges range
from 5 to 20 h (Shore 1971, Efremova and Efremov 1977, Tanaka and Watanabe 1984, De Goeij
et al. 2009). In comparison cells from mouse gut epithelia and Hydra epithelial and stem cells
are replaced every 4 to 7 d (David 1983, Bosch and David 1984), although new cells can be
formed as quickly as every 8 h during development and growth (mouse neural progenitor cells;
Al-Kofahi et al. 2006). Choanoflagellates are the sister group to metazoans and considered to
feed in a similar way to sponge (Mah et al. 2014). In Monosiga brevicollis cells are replaced
every 6 h during log phase of growth in a fed culture (King et al. 2003), and in general all cells in
a cell culture will have similar cellular kinetics. In contrast, different cell types within an animal
are even replaced at different rates depending on their functions. For example, cell turnover in
mammary glands and the uterus is tied to cyclical needs for reproduction (reviewed by
Pellettieri and Alvarado 2007).

52
To determine the conditions that affect cell proliferation rates of sponges, choanocyte
proliferation rates in four temperate sponge species were measured and factors known to affect
cell proliferation in other animals were examined: life history stage, season, and food
availability. In situ time-lapse imaging was used to study the formation of choanocyte chambers
to understand the mechanics behind choanocyte turnover and replacement. Sponges must use
energy to maintain their filter-feeding system, replenish spent cells, grow, and reproduce. These
results illustrate the complexity of calculating the ecological effects of choanocyte proliferation
and demonstrate that sponges can modify the rate that stem cells replace spent cells at different
stages of their life history.
4.2. Methods
The four species we studied came from different taxonomic groups with a range of life
histories and habitats within British Columbia, Canada. Spongilla lacustris is a freshwater
demosponge (Class Demospongiae, Order Spongillida, Family Spongillidae) that grows from
overwintering gemmules each year, reproduces in late summer and regresses back to gemmules
each winter. Sycon coactum is a marine calcareous sponge (Class Calcarea, Order
Leucosolenida) that grows, reproduces, and dies within one year. Haliclona mollis is a subtidal
marine demosponge (Class Demospongiae, Order Haplosclerida, Family Chalinidae) that lives
year-round in Barkley Sound. Aphrocallistes vastus is a hexactinellid sponge (Class
Hexactinellida, Order Hexactinosida, Family Aphrocallistidae) that lives in deep water >1000
meters across the northern Pacific and at 40-200 meters on the continental shelf of western
Canada.
Unless otherwise noted, samples were collected in June and July to estimate choanocyte
proliferation rates. Spongilla lacustris was collected at 1 m depth in Rosseau Lake. Sycon
coactum was collected at 10 m from docks at the Bamfield Marine Sciences Centre (BMSC).
Haliclona mollis was collected by SCUBA at 10 m from Wizard Islet. Aphrocallistes vastus was
collected both by SCUBA at 40 m in Saanich Inlet in December 2012 and February 2013 and by
the remotely operated vehicle ROPOS (http://www.ROPOS.com) at 70 m from Galiano Ridge
Reef in November 2012 and 2013.
Freshwater sponges were kept in 18°C lake water, refreshed daily. Marine sponges were
maintained in flow-through seawater tables (9-10°C) at BMSC or, for the A. vastus collected by
SCUBA, fragments 1 cm2 were kept in 0.5 L containers of seawater at 9°C in an incubator at the
Marine Technology Centre, University of Victoria, in Sidney, B.C.

53
4.2.1. EdU incubations
Pieces (5 x 5 x 2 mm) were cut from the central region of each of 3 individuals
immediately after collection and allowed to heal overnight. Cuttings were mixed together and
randomly assigned to different incubations in EdU (5-ethynyl-2-deoxyuridine; Life
Technologies). Natural variability from individuals collected at the same time was found to be
negligible (for S. lacustris, t = 0.102, df = 4, p = 0.92). S. lacustris was incubated in 100 µM
EdU in 0.2 m filtered lake water at a typical lake temperature of 18°C. S. coactum, H. mollis,
and A. vastus were incubated in 100 µM EdU in 0.2 m filtered seawater at 9°C, although the
concentration could have been slightly lower because it became diluted as sponges were
transferred into the treatment water. Length of incubation in EdU varied for each sponge
depending on the time at which the ratio of labeled cells to total cells labeled by Hoechst 33342
no longer changed.
Proliferation rates in S. lacustris hatched from gemmules were compared to those of
adult sponges. Gemmules were collected from Rosseau Lake, B.C. by SPL in December 2011,
kept at 4°C in unfiltered lake water aerated monthly. Gemmules were hatched and cultured in
April 2012 as described by Elliott and Leys (Elliott and Leys 2007). Once a full aquiferous
system had developed 5 d post-hatching (dph), sponges were incubated in 50 µM EdU in M-
medium (Rasmont 1961) for between 4 and 72 h.
To compare choanocyte proliferation in winter with proliferation in summer, H. mollis
were collected in October 2013 and November 2014. Incubations were carried out as described
above. S. coactum was collected during senescence in August to compare with growing adults
sampled in June.
Water was filtered to prevent EdU uptake by bacteria and to avoid differences in
proliferation caused by variable food availability; however to test the effect of feeding activity on
choanocyte proliferation, pieces from one individual of H. mollis were incubated in EdU in
unfiltered (normal) seawater in November 2014 and June 2015. Duplicate water samples were
collected from the filtered and unfiltered treatments in June 2015, fixed with 0.15%
glutaraldehyde, and frozen at -80°C for quantification of bacteria with a FACSCalibur MACPro
flow cytometer at the University of Alberta. Cell proliferation of sponges was measured using
incubations of EdU as described above.
4.2.2. Sample processing
Sponges from all experiments were fixed in 4% paraformaldehyde and 0.03%
glutaraldehyde in phosphate-buffered saline (PBS) or Bouin’s fixative (S. coactum) overnight
and dehydrated to ethanol. Silica was removed with 4% hydrofluoric acid. Tissues were cleared

54
in toluene and embedded in paraffin wax (Paraplast). Sections 7-10 µm thick were rehydrated
in PBS, washed once in in PBS with 3% bovine serum albumin (wash buffer), permeabilized two
min in PBS with 0.1% Triton-X (PBTx), and rinsed three times in wash buffer. Sections were
incubated in 250 µl of reaction cocktail (Click-iT EdU AlexaFluor 594® Imaging Kit, Life
Technologies, Carlsbad, CA) in the dark for 30 min at room temperature, rinsed once with wash
buffer and once with PBS. AlexaFluor 488 was used for S. lacustris to avoid overlap with
autofluorescence from symbiotic algae. Nuclei were stained with 100 µM Hoechst 33342 for 30
min; slides were rinsed 3 times with PBS and mounted with Mowiol.
At least two slides were prepared from each embedded sponge; several sections from
each slide were viewed with a Zeiss Axioskop2 Plus microscope and images captured with a
QiCam (QImaging) and Northern Eclipse software (Empix Imaging Inc.). Nuclei labeled with
EdU (newly synthesized DNA) and nuclei labeled with Hoechst (all nuclei) were counted using
the Cell Counter plug-in for Fiji-ImageJ (Schindelin et al. 2012). Statistics were calculated using
SYSTAT 12 and R.
4.2.3. Calculating cell proliferation
Characteristics of choanocyte proliferation assumed to be proliferating at a steady state
were determined by plotting the average proportion of EdU-labeled cells at each time point,
termed the labeling index (LI; Nowakowski et al. 1989)) (Figure 4.1). The proliferation rate of
cells (percent cells hr-1) indicates the rate at which new cells enter S-phase in their progress
through the cell cycle, and is the slope of the linear regression of labeling indices. The y-
intercept indicates the proportion of cells in S-phase at any given moment (LI0). The length of S
phase (Ts) is the time interval from the x-intercept to the y-axis. As incubations increase in
length, more and more cells enter S-phase of the cell cycle until all cells that are replicating are
labeled, a proportion called the growing fraction (GF). The length of the cell cycle from S-phase
to the next round of S-phase (Tc), also called the turnover rate, was calculated as the time until
the GF is reached (Tc-Ts) plus the length of time spent in S-phase (Ts). As a result, estimates of
cell proliferation rates require at least three time points for a linear regression; cell proliferation
values at a single time point can vary greatly depending on the number of cells initially labeled
(cells in S-phase) and when no more cells label (Figure 4.1C).
4.2.4. Microscopy of choanocyte chambers
To understand the mechanism behind cell replacement in a chamber, choanocyte
production and replacement was studied in Spongilla lacustris grown on glass coverslips as
described by Elliott and Leys (Elliott and Leys 2007). Choanocyte chambers were located and
images captured using a 40x water immersion lens (Zeiss Achroplan on a Zeiss Axioskop2

55
Figure 4.1. Theoretical model for labeling steady state cell populations, after
Nowakowski 1989. A. The proportion of EdU-labeled nuclei increases with time as more
cells enter S-phase of the cell cycle, until all cells in a population have passed through S-phase.
B. EdU incubations of a steady state population for different lengths of time result in labeling
indices (LI) along a linear curve that eventually levels off when the growing fraction of cells
(GF) has all passed through a complete cell cycle. The y-intercept corresponds with the
proportion of cells in S-phase at a given moment and is back-calculated from the regression
line. The time from the x-intercept to the ordinate axis is the calculated length of S phase (Ts).
The time from the x-intercept to the asymptote is the length of the cell cycle (Tc). C. A single
time point (LI) cannot be used to compare cell cycle kinetics between species or treatments
because of the different cell cycle lengths and GF that result from different slopes (proliferation
rates).

56
microscope). Images from each recording were imported as an image stack into ImageJ
software and converted to time-lapse video at 25 frames sec-1 (Schindelin et al. 2012, Schneider
et al. 2012).
4.3. Results
4.3.1. Cell cycle lengths and proliferation rates
Choanocytes in Sycon coactum had the shortest cell turnover rate (30.7 h) and fastest
proliferation rate (Table 4.1, Figure 4.2). Choanocyte turnover and proliferation rates of
choanocytes in adult S. lacustris, H. mollis, and A. vastus were similar to each other, and greater
than 4 d (Table 4.1, Figure 4.2).
Cell proliferation also varied within a species depending on life history stage.
Proliferation rates were 10 times slower in mature S. lacustris than in individuals hatched from
gemmules, although the proportion of cells in S phase at any given time (t=0 h) was identical
(Table 4.1, Figure 4.2). All individuals of the calcareous sponge S. coactum collected were
reproductive by June, which presumably affected choanocyte chamber function (Eerkes-
Medrano and Leys 2006) and likely turnover rates, but was unavoidable. However, S. coactum
collected in August were beginning to senesce and consequently had many fewer proliferating
cells than those collected in June; 4.5 ± 1.4% of choanocytes in chambers from sponges collected
in August had taken up EdU after 30 h compared with 18 ± 4% after 36 h from samples collected
in June.
Glass sponges (Class Hexactinellida) differ from other sponge groups in having syncytial
tissues. Instead of choanocytes lining flagellated chambers, the collar-flagella units that draw
water through chambers are enucleate and are extensions of nucleated choanoblasts which
occur in small clusters beside the chambers (Reiswig and Mehl 1991, Leys 1999). Collar bodies
are thought to be discarded and renewed by the choanoblasts (Mackie and Singla 1983) but
because they are enucleate it is not possible to track their turnover. Instead we studied
proliferation of choanoblasts in A. vastus. Choanoblast nuclei seldom labeled in mature regions
of A. vastus and then only after 4 d of incubation in EdU so that there were too few nuclei
labeled to estimate rates of proliferation from. Nuclei in the trabecular syncytium never labeled
with EdU. A growing region found in the edge, or lip, of the osculum however, contained a band
of rosettes of EdU-labeled choanoblasts (Figure 4.3). Although this was a region of new growth,
the turnover rate was 170 h and the proliferation rate was equal to that of mature H. mollis and
S. lacustris (Table 4.1, Figure 4.3).

57
Table 4.1. Cell turnover rates and characteristics, determined assuming a steady state population of cells.
Proportions of cells in S phase at a given time, the rate of proliferation, asymptotic/maximum proportion of proliferating cells in a
population (growth fraction, GF), estimated length of S phase, and estimated length of cell turnover.
Sycon
coactum Spongilla lacustris
(gemmules)* Spongilla lacustris
(adult) Haliclona
mollis† Aphrocallistes
vastus Cells in S phase (%) 7.1±1.7 6.6±6.8 17±1.6 27±2.1 12±1.2 Proliferation rate (% cells h-1) 0.7±0.1 2.0±0.36 0.19±0.03 0.25±0.04 0.17±0.02 Max labeled (GF; %) 20±1.4 70±9.8 30±1.5 44±1.5 29±0.5 Length of S phase (Ts; h) 10.9 3.2 91 108 72 Cell turnover rate (Tc; h) 30.7 34.6 ≥159 176 170
*For full-size, central chambers in gemmules incubated 5 d post-hatching. Smaller peripheral chambers had 16.8±4.6% of cells in S phase, proliferation rate of 2.0±0.3% cells h-1, 73±5.2% of cells as the GF, 8.3-h Ts, and 36.2 h Tc. †For H. mollis in filtered seawater. H. mollis incubated in unfiltered seawater had 24.0±3.1% of cells in S phase, proliferation rate of 0.25±0.04% cells h-1, 48±2.3% of cells as the GF, 69.2-h Ts, and 138 h Tc.

58
Figure 4.2. Proportions of EdU-labeled choanocytes with calculations assuming a
steady state choanocyte population, after Nowakowski 1989. A. Sycon coactum; B.
Haliclona mollis in unfiltered water and in filtered water; C. Spongilla lacustris sampled from
adult tissue; D. Spongilla lacustris hatched from gemmules. Error bars indicate standard
error.

59
Figure 4.3. EdU uptake in nuclei of the syncytial choanoblasts of Aphrocallistes
vastus. A. Few nuclei labeled with EdU in the main body of the sponge but several
choanoblasts took up the EdU label in the unfused region of the osculum lip (arrows). B.
EdU-labeled choanoblasts were arranged in rosettes in the growing region of the sponge.
Nuclei labeled with Hoechst 33342 are blue and nuclei labeled with EdU are red. C.
Proportions of EdU-labeled choanoblasts with calculations assuming a steady state population.
Scale bars: A: 10 cm; B: 100 µm.

60
4.3.2. Cell proliferation by cell type and region
Cells labeled with EdU were in the choanosome, mesohyl, and pinacoderm of all
sponges, but some had higher turnover rates than others (Figure 4.4). For example,
choanocytes and mesohyl cells labeled with equal frequency in Haliclona mollis whereas 2-5
times more choanocytes than mesohyl cells labeled in Spongilla lacustris. Pinacocytes were
labeled in S. lacustris and H. mollis after 72 h but were never labeled in S. coactum.
For Spongilla lacustris more choanocytes labeled in small chambers near the periphery
than in full-sized chambers near the center of the sponge for each incubation interval, yet the
overall proliferation rate was identical (2 ± 0.31% h-1 for peripheral chambers, 2 ± 0.36% h-1 for
larger central chambers; slope ± SE of slope) (Table 4.1, Figure 4.2). Consequently, even though
the peripheral chambers were about half the diameter of central chambers and were still
growing, the cell turnover rate of choanocytes was very similar (36.2 h and 34.6 h, respectively).
4.3.3. Effect of season and feeding activity on cell proliferation
There were seasonal differences in choanocyte proliferation in Haliclona mollis, with
many choanocytes labeled in summer, and very few in the fall (October/November). Seasonal
differences were also noted in choanocyte proliferation as Sycon coactum senesced in August.
To determine whether feeding activity had an effect on choanocyte turnover,
proliferation rates and cell turnover were compared in sponges incubated in filtered and
unfiltered seawater. It proved impossible to remove all bacteria from the water suggesting that
the sponge carried with it through each water change a number of bacteria which reproduced.
Nevertheless, the filtered water produced very low bacterial concentrations (filtered water: 2.0 x
104 cells ml-1) compared to normal seawater (2.9 x 10⁵ cells ml-1). Interestingly, while
proliferation rates of choanocytes in Haliclona mollis (Table 4.1) were not significantly different
between the two treatments (proliferation rate: ANCOVA, F = 1.0367, p = 0.309; proportions of
labeled cells: ANOVA, F = 0.687, p = 0.407), sponges in water with more bacteria had a shorter
estimated cell turnover (138 h in normal seawater compared to 176 h in filtered seawater) (Table
4.1, Figure 4.2), suggesting that feeding activity may affect turnover rates. In contrast however,
choanocytes in sterile culture of gemmule-hatched S. lacustris, showed a much higher
proliferation rate than sponges grown in non-sterile lake water (Table 4.1). These contrasting
observations suggest turnover rate is more complex than simple exhaustion and replacement of
cells due to feeding activity.

61
Figure 4.4. EdU labeling in choanocyte chambers from all species of sponges
studied. Mesohyl cells labeled with EdU are visible in the images of Spongilla lacustris and
Haliclona mollis. A. Spongilla lacustris, a shallow freshwater demosponge (A’: Hoechst label;
A’’: EdU label; A’’’: Hoechst (blue) and EdU (red) overlaid onto a DIC image of a choanocyte
chamber; other columns follow this labeling scheme). B. Sycon coactum, a shallow marine
calcareous sponge. C. Haliclona mollis, a shallow marine demosponge that persists across
several years. D. Aphrocallistes vastus, a deep-water marine hexactinellid sponge. Scale bars:
all are 25 µm unless listed here. A: 1 cm; B: 1 cm; C: 1 cm; D: 10 cm. Images A and B credit:
S.P. Leys.

62
Figure 4.4. EdU labeling in choanocyte chambers from all species of sponges
studied

63
4.3.4. Video microscopy of choanocyte chambers
What remains unclear is how choanocytes proliferate and are replaced in a chamber.
Small and large choanocyte chambers were filmed in situ in the thin tissue of recently hatched
freshwater sponges. At least 4 types of amoeboid cells moved through the mesohyl, each of
unique size and activity. Remarkably, chambers moved freely through the mesohyl as a unit
until plumbed into a canal and in two separate instances a whole chamber was seen being
tugged by a mesohyl cell connected to it by two pseudopodia (Figure S3.1, Supplementary video
S3.1). Newly forming chambers (2-6 cells) had replicated by mitosis, but an unusual finding was
that larger chambers replaced choanocytes in a different way. Small amoeboid cells moving
through the mesohyl, approximately the size of a choanocyte, stopped near large choanocyte
chambers and integrated into the chambers, becoming choanocytes (Figure 4.5, Supplementary
video S3.2). These ‘immigrant’ choanocytes represent a previously unknown and yet seemingly
common way that choanocytes form and are replaced in mature chambers of cellular sponges.
4.4. Discussion
The discovery of immigrant choanocytes suggests that mesohyl cells are pluripotent stem
cells in sponges and that choanocytes in mature chambers are not replaced by mitosis. This
finding highlights the complexity of cell-cell interactions in sponge tissues and importantly
shows that replacement rates of metazoan tissues cannot be readily compared to the steady
states found in cell cultures. Choanocyte turnover rates were not uniform across sponge species
and varied from 31 h to over a week, which falls more within the range of cells of other
multicellular animals than of single celled protists or cell cultures (Figure 4.6, Table S3.1).
Furthermore, our results suggest that cell replacement rates vary among sponge species, with
life history stage, and seasonally, but are not immediately affected by feeding activity.
4.4.1. Sources of choanocytes in mature choanocyte chambers
There is surprisingly very little literature providing morphological evidence of whether
and how choanocytes divide. For newly forming chambers, choanocytes arise from several
divisions of a single archaeocyte (Brien 1976, Tanaka and Watanabe 1984) or from
transdifferentiation of larval ciliated epithelial cells into choanocytes, possibly with an
intermediate step as archaeocytes (Amano and Hori 1996, Leys and Degnan 2002). Clearly
early choanocytes form by mitosis, but there is no evidence that this happens in mature
chambers given their small sizes, limited ability to divide because of machinery tied into the
flagellum (King 2004), low nucleic acid content, and no visible evidence

64
Figure 4.5. Immigration and differentiation of mesohyl cells into mature
choanocyte chambers in Spongilla lacustris, imaged using in situ time-lapse
microscopy. A. An amoeboid cell moved through the mesohyl with pseudopodia
(pseudocolored yellow). B. The cell slowed and changed directions as it passed two small
choanocyte chambers (one pseudocolored orange). C. The cell moved against one of the
choanocyte chambers and stopped. D. The cell squeezed between the choanocytes integrating
itself into the choanocyte chamber and, as it did so, changed shape to resemble that of other
choanocytes in the chamber. This new ‘immigrant choanocyte’ remained as part of the
growing flagellated chamber. Scale bars: 25 cm.

65
of mitosis despite plenty of cells labeled by EdU. Choanocyte populations are therefore
maintained by a stem cell population of mesohyl cells that migrate into chambers to take the
place of spent cells. Pinacocytes also likely originated from cells in the mesohyl that migrated to
the pinacoderm and then differentiated into pinacocytes (Brien 1976, Simpson 1984). Rates of
replacement of choanocyte and pinacocyte populations are therefore at least partially driven by
the rate that stem cells from the mesohyl immigrate rather than by direct proliferation.
4.4.2. Variability of cell turnover rates
The variability of cell proliferation rates has significant implications for the extent of
ecological effects of sponges on their surroundings. More effort is allocated toward growth
during actively growing phases of a sponge’s life (Elvin 1976), which shows that cell proliferation
is a good indicator of energetic investment in growth and maintenance. Choanocytes were
replaced faster in young, growing tissue than in mature tissue, and slower in senescing sponges
or in winter months. Choanoblast proliferation in A. vastus was also much faster in a growing
edge than in mature regions.
Proliferative activity was seasonal in H. mollis and varied with life history for other
species. Sponges with short life histories (1 year for S. coactum, S. lacustris which hatches from
yearly overwintering gemmules, and Hymeniacidon sinapium (Shore 1971, Eerkes-Medrano
and Leys 2006, Cao et al. 2012) had comparable replacement rates of 20-40 h. The relatively
rapid cell turnover of choanocytes in these species with a short life history may contribute to
their success as seasonal or invasive species (Cao et al. 2012) and may optimize the active season
for freshwater sponges (Frost 1982). Temperature may also have an effect – the tropical marine
sponge Halisarca caerulea had a cell replacement rate of 5.4 h which is much faster than any of
the rates we measured for temperate species (De Goeij et al. 2009), although the faster rate may
also stem from differences in methodology such as the use of BrdU, which can be teratogenic,
mutagenic, and a trigger of cell death (reviewed by Taupin 2007), or by keeping the sponges in
food-rich aquaria for a week before beginning incubations.
The construction of glass sponges is very different from other sponges. Collar bodies
branching out from choanoblasts may be a way to reduce energetic costs because the collar
bodies contain no nuclei and few organelles (Mackie and Singla 1983, Leys 1999); and indeed,
very little choanoblast proliferation, a more costly process, was visible in mature tissue and even
in the actively growing region. While enucleate collar bodies can be shed, choanoblasts may not
need to divide as often in A. vastus as in other sponges, reducing the energetic need for DNA
synthesis to produce water pumping structures.

66
Calculating turnover rates from labeled cells assumes that cells in sponge flagellated
chambers are in a steady state of cell proliferation and cell death because chambers reach a
terminal size (Tanaka and Watanabe 1984). But this assumption could also easily be violated
during growth or repair (Simpson 1984). Growing chambers occur when a sponge is first
forming but also during rearrangements of the choanosome seasonally and during reproduction
(Harrison 1974, Simpson 1984, Gilis et al. 2011). For sponges, it is more appropriate to compare
proliferation rate rather than cell cycle length because proliferation rates are independent of any
assumptions of a steady state population (Nowakowski et al. 1989). Incubations using a pulse-
chase labelling approach could allow one to follow labelled cells over time and learn the relative
contribution of stem cell immigration and mitosis by choanocytes.
4.4.3. Choanocyte proliferation rates and feeding activity
Different concentrations of bacteria in the water did not affect the proliferation rate of
choanocytes, although the calculated cell turnover rate was slightly shorter in sponges grown in
high concentrations of bacteria. Sponges grown in water supplemented with 2x10⁶ cells ml-1
heat-killed bacteria produced a cloud of waste material around the osculum (Figure S3.2); but
showed no change in cell proliferation so waste material seen here is mostly fecal pellets
(Wolfrath and Barthel 1989), mucus, and detritus – not shed cells from rapid cell replacement.
The same may be the case in previous studies (De Goeij et al. 2009, Alexander et al. 2014),
which could affect estimates of the role of sponges in the ‘sponge loop’ that were based on those
values (De Goeij et al. 2013, Rix et al. 2016).
4.4.4. Ecological implications of variable cell turnover
Variability in cell proliferation between species and within an individual leads us to
question the effect sponges have on carbon transfer through cell shedding (De Goeij et al. 2013).
Using de Goeij’s estimates of cell turnover rate for Halisarca caerulea (Halisarca caerulea; De
Goeij et al. 2009) and Reiswig’s standardized dimensions of a choanocyte chamber (57 cells per
chamber; Reiswig 1975a), each choanocyte chamber would be completely replaced an
astonishing 3 times daily compared to every three days for rates matching Sycon, the fastest
from our study. EdU-labeled cells or cellular material were not visible in excurrent canals as has
been suggested for some species (Donadey 1978, De Goeij et al. 2009, Alexander et al. 2014,
Maldonado 2015) and even for those, shed cells do not make up 100% of the detritus. A more
likely scenario is that excretion of waste drives the connection sponges make between microbes
in the water column and benthic biomass (Wolfrath and Barthel 1989).

67
Figure 4.6. Cell turnover rates (Tc) for cell types in unicells and metazoans. Bars show the range reported in hours.
Mature animal tissue had a wide range of cell turnover rates but were typically several days longer than turnover rates in unicellular
eukaryotes and prokaryotes. A notable exception is embryonic and larval tissue, which has much shorter cell turnover rate.
(Reference values are provided in Appendix 3).

68
Changes in cell proliferation rates reflect a physiological plasticity to changing conditions
– a sponge may increase choanocyte proliferation rates during food-rich seasons. This
physiological plasticity is known in both single-celled protists (Olson and Chisholm 1986,
Zachleder and Van Den Ende 1992) and cells of other metazoans (e.g. Otto and Campbell 1977),
presumably to allow energy to be available for other processes of the body.
4.5. Summary
The cells of a sponge function as a cooperative unit to grow, feed, reproduce, and
senesce. Results presented here show that choanocytes are not actually stem cells in sponges;
instead, cells from the mesohyl immigrate into chambers, and importantly immigration drives
rates of replacement of choanocyte and pinacocyte populations. Short term feeding activity has
little effect on cell loss or replacement but season (growth and metabolic activity seasonally), life
history stage, and possibly water temperature (warm water versus temperate habitats) have the
greatest effects on cell replacement rates. Our results demonstrate the complexity of estimating
the ecological effects of choanocyte proliferation. If proliferation rates are not constant, nor as
highly prolific in some species compared to others, then the recent quantification of the ‘sponge
loop’ needs reconsideration. Variability in proliferation and evidence of stem cells for
choanocytes suggest that tissue homeostasis has been an important factor to multicellularity for
as long as animals were multicellular.
4.6. Acknowledgements
We thank the director and staff at the Bamfield Marine Sciences Centre, A. Oatway, and
G. Huang for assistance with microscopy and flow cytometry, and K. Juniper for access to the
MTC in Sidney BC. Pinnacle Divers of Victoria, the pilots of the ROV ROPOS, K. Anderson, S.
Anthony, K. Kruper, D. Ludeman, N. Trieu, and N. Webster provided field and lab assistance.
Funding for this research came from NSERC Discovery and Ship Time grants to SPL; NSERC
Vanier Canada Graduate Scholarship to ASK; Bank of Montreal Graduate Student Scholarship,
WCUMSS, and Donald M. Ross Scholarships to ASK.

69
Chapter 5. Feeding and excretion by the glass sponge Aphrocallistes vastus
5.1. Introduction
In Chapter 2 it was found that sponges contribute to nutrient cycling by bringing
microbial food energy from the microbial loop into the larger trophic web (Gili and Coma 1998).
Glass sponges in the deep water sponge reefs of western Canada have the highest benthic
grazing rate of any suspension feeding community measured to date, affecting bacteria
concentrations in the overlying water but also removing seven times more carbon than can be
provided by vertical flux alone (Chapter 2, Kahn et al. 2015). Trophic subsidies must provide
the remainder of the carbon needed but where these subsidies come from is not known. How,
and from where, do glass sponge reefs get enough bacteria to sustain such high densities? Some
demosponges supplement their diet with different food sources, using symbionts that take up
DOC (De Goeij et al. 2008b) or that photosynthesize (Frost and Williamson 1980), but reef
species do not.
Feeding by glass sponge reefs nevertheless can affect the overlying water column, with
sponges reducing bacteria concentrations up to 5 meters above the reef through their feeding
(Chapter 2, Kahn et al. 2015). Water currents accelerate over the reef (Bedard 2011), which may
enhance feeding through use of current-induced flow (Leys et al. 2011) and make trophic
subsidies from lateral currents possible. The intense grazing by glass sponge reefs may also
have downstream effects on local communities if their feeding activity packages bacterial carbon
into larger waste (Wolfrath and Barthel 1989). Food energy could also be incorporated into
skeletal and tissue biomass that can build reef and provide food for predators of sponges
(McClintock 1987, McClintock et al. 2005, Chu and Leys 2012).
Sponge reefs lie on the continental shelf so they may receive bacteria from various
sources including fallout from surface plankton blooms, tidally driven currents, or resuspension
of sediments. Tidal currents bring deep water known to fuel upwelling-driven phytoplankton
blooms from the Strait of Juan de Fuca (Yin et al. 1997, Masson 2002, Masson 2006). Local
phytoplankton blooms can be fueled by nutrients from the Fraser River, which provides 68% of
freshwater to the SoG and discharges terrestrially derived sediments and organic carbon
seasonally (Johannessen et al. 2003, 2005, 2008) and mixes with ocean water to produce
bacterioplankton blooms (Albright 1983). Considerable bacterial productivity also occurs in
sediments, which can have bacteria concentrations 100 or 1000 times greater than in the water

70
column (Kuwae and Hosokawa 1999) and which has been suspected to feed other dense deep-
water sponge communities (Rice et al. 1990).
We studied uptake and excretion of food by reef sponges (Aphrocallistes vastus) to
determine the source of food, where food is captured and processed by the sponge, and to
characterize material excreted from the sponge as a potential food source for other animals.
Understanding the feeding behavior and sources of food may help explain why reefs are found
where they are, and may lead to predictions of where other sponge beds may live globally and
why those are good sponge habitats.
5.2. Methods
5.2.1. Particle uptake and excretion
Pieces of sponge from individuals of Aphrocallistes vastus were collected during
research cruises on the Canadian Coast Guard Ship Vector in 2011, 2013, and 2014 using the
remotely operated vehicle ROPOS (http://www.ropos.com/). Sponges were transferred to
Bamfield Marine Sciences Centre without removal from seawater (at 9°C) and once there,
maintained in flow-through aquaria that were continually refreshed with water from 30 meters
depth.
To identify particle capture and feeding, 2 x 5 cm pieces of sponges were placed into a 2 L
container of seawater and either latex beads (0.1, 1.0, and 3.0-µm diameter; Fluoresbrite
microspheres in red, Polysciences, Inc.) or heat-killed Roseobacter bacteria were added to a
concentration of 2 x 10⁶ particles ml-1. Containers were kept in a 9°C incubator during feeding
incubations to maintain constant temperature. After 15 min, 1 h, 8 h, and 24 h, several small
pieces were preserved for electron microscopy.
To collect excreted material, we tried several methods. Initially, large branches of
sponges (approximately 10x10x2 cm and each with an osculum) were incubated in 2 x 10⁶ of a
mixture of 0.1- and 0.5-µm beads ml-1 overnight, then rinsed in filtered seawater and placed in 3-
L containers of filtered seawater for 24 h. The water in the containers was concentrated on a 0.2-
µm Durapore filter and examined under a fluorescent microscope. Although the sponge tissue
appeared the pink or yellow color of fluorescent beads used, very few beads were captured on
the filter. Because the sponges did not filter in still water of closed containers, we then placed
bead-fed sponges in flowing water oriented with oscula facing down into funnels lined with
filters. Because of their large size and asymmetrical shape these individuals often fell off of the
tubes or tissues abraded into the funnels. Finally, filters pinned across the osculum allowed
71
sponges to be oriented any direction in the flowing seawater but either had too large a pore size
to capture the fluorescent beads (Nitex mesh) or had such small pore sizes that too much pressure
was needed to push water through them (0.2-µm or 0.45-µm Durapore filters). Fine filters may
also have impeded pumping and flow by the sponges. The method which we report data from
followed that of Wolfrath and Barthel (1989) and used smaller fragments of sponge. Pieces of
sponge were immersed in a mixture of 0.1 and 0.5 µm Fluoresbrite fluorescent beads at a
concentration of 2 x 10⁶ beads ml-1 for 2 h. They were then rinsed in seawater and inverted over
50 ml tubes to collect excreted material. Pieces of sponge were left for 24 h suspended above the
tubes. The contents – material released by the sponge – were allowed to settle for 1 h. Water
was carefully siphoned off until 2 ml of seawater and any excreta it contained was fixed with 1%
osmium tetroxide. After 30 min, the fixative was changed to a cocktail of 1% osmium tetroxide
and 2% glutaraldehyde in 0.45 M sodium acetate (pH 6.4) buffered with 10% sucrose (Harris
and Shaw 1984).
Small pieces of tissue were preserved for electron microscopy in the cocktail fixative
described above. The fixative was refreshed after 30 min, then left overnight at 4°C. Tissue was
dehydrated to 70% ethanol, desilicified in 4% hydrofluoric acid overnight, and stored in 70%
ethanol until further processing. Tissue was dehydrated to 100% ethanol, freeze-fractured in
liquid nitrogen, and critical point dried using a Bal-Tec CPD 030 critical point dryer in the
Scanning Electron Microscope Laboratory at the University of Alberta. Fractured, dried tissue
fragments were mounted on metal stubs, sputter coated with gold (Nanotek SEMprep 2 sputter
coater), and viewed using a JEOL 6301F field emission scanning electron microscope. Excreted
material was processed following the same method except it was not desilicified or freeze
fractured.
5.2.2. Particle and carbon transport
To further track carbon uptake and transport, a sponge was immersed in seawater
supplemented with heat-killed bacteria that had been grown in 13C D-glucose as its food source
kindly provided by Rebecca J. Case (RJC) and Anna R. Bramucci (ARB). In brief,
Rhodobacteraceae bacteria Ruegeria sp. R11 were grown in a shaking incubator (30°C at 160
rpm) to early log phase in ½ marine broth (24 h) then re-cultured at a 1:10 inoculum into ½
marine broth supplemented with 13C-labeled D-glucose (1 g L-1) as a sugar source. Bacteria were
cleaned into sterile marine media, concentrated, and heat killed in a 55°C water bath for 1 h.
Dead cultures were verified by plating the cultures and incubating at 37°C overnight to ensure
that no colonies grew on the plates.

72
A large piece of sponge (10 x 20 cm) was incubated in 2 x 10⁶ cells ml-1 13C-labeled
bacteria heat-killed bacteria for 8 h. Three pieces from different regions of the sponge were also
rinsed in distilled water and frozen as pre-treatment controls. Triplicate pieces were collected at
1, 2, 3, 4, 5, 10, and 14 d post-labeling (dpl) and unfed control pieces were collected at the
conclusion of the experiment to identify any drift in the isotopic signature of the sponge. Each
of the samples was rinsed in distilled water, wrapped in foil, and frozen (-80°C).
All tissue pieces were lyophilized for 24 h in a Virtis Freezemobile FM25XL lyophilizer
and crushed to a homogeneous powder with an agate mortar and pestle. Each tissue powder
sample was weighed (6 ± 0.001 mg) into tinfoil discs and compacted. Samples were analyzed for
δ13C in the Stable Isotope Facility in the Natural Resources Analytical Laboratory at the
University of Alberta following internal protocols. In brief, samples were combusted under
oxygen, separated chromatographically, and then analyzed using a Continuous Flow Isotope
Ratio Mass Spectrometer (CF-IRMS, ThermoFinnigan Delta+ Advantage). Quality control
standards from NIST were run for each isotope (for 13C: NBS22, LSVEC, and NBS19; for 15N:
IAEA-N1, IAEA-N2, and IAEA-N3). δ13C and δ15N values (ppt, ‰) are presented as ratios of the
heavy to light isotope of the standard compared to the Pee-Dee Belemnite for δ13C and air for
δ15N (Equation 1).
𝛿𝑛𝑥 (‰) = (𝛿𝑛𝑥𝑠𝑎𝑚𝑝𝑙𝑒−𝛿𝑛𝑥𝑠𝑡𝑑)
𝛿𝑛𝑥𝑠𝑡𝑑× 1000 Equation 1
5.2.3. Carbon sources for the reefs
To trace carbon before and after it passed through reef sponges in the Strait of Georgia
(SoG), particulate organic matter (POM) from water, sponge tissue, and sediments were
collected between 2007 and 2014 during research cruises on the CCGS Vector using the
remotely operated vehicle ROPOS from glass sponge reefs (Figure 5.1). Values from 2007 and
2009 were obtained from the thesis of JWF Chu (Chu 2010). Samples were collected in
different locations and in different years (Table 5.1). Water was collected from within the reef
using a suction sampler and Niskin bottles mounted on the ROV. Sponge tissue was collected
using a suction sampler mounted on ROPOS. Sediments were collected from among the
sponges using push cores deployed by the ROV.
Four liters of each water sample were filtered through pre-weighed, pre-combusted
(500°C for 12 h) glass fiber filters (GF/F, nominal pore size: 0.7 µm). Filters were rinsed with
distilled water, folded into pre-combusted foil packets, and flash frozen in liquid nitrogen.
Sponge samples were rinsed three times with distilled water, packed in tinfoil, and flash frozen
in liquid nitrogen. Surface sediments from the top of each push core were scraped into two 2-ml

73
cryovials and flash frozen in liquid nitrogen. All samples were transported to the University of
Alberta on dry ice and stored in a -80°C freezer until further processing.
Tissue and filters were lyophilized for 24 h, sediments for 48 h in a Virtis Freezemobile
FM25XL lyophilizer. Once dried, all samples from 2007 and 2009 were processed as described
by Chu (2010). Samples collected in 2011 and 2014 were ground to a fine powder using an agate
mortar and pestle, then loaded into tin capsules (tissue: 6±0.001 mg, sediments: 40 mg) and
delivered to the Natural Resources Analytical Laboratory for isotope analysis as described
above.
5.3. Results
5.3.1. Particle uptake
Particle uptake by the sponges was visibly evident as the water changed from cloudy to
clear during the 1- and 8-h incubations (Figure 5.1A). Sponge tissue also turned a mottled pink
color during incubations in pink beads – some regions of the tissue were brilliantly colored
while others were still the original yellow color of the sponge. More chambers containing 0.1 µm
beads were found than chambers containing 1.0 µm beads. The largest size beads, 3.0 µm, were
not found in any SEM samples, though a few were visible in sponge tissue embedded in JB-4
plastic resin.
Beads and bacteria were found in various structures in and around the flagellated
chambers, beginning with canal spaces outside of the chambers and the entrances into the
chambers (prosopyles) in the shortest incubations (Figure 5.2A-B). Beads were found in
extensions of the primary reticulum (Figure 5.2C). Both bacteria and 0.1- and 1.0-µm beads
were found in both the primary and secondary reticula and in reticula that bridged the two
(Figure 5.2B-D).
5.3.2. Particle and carbon transport
Particles were found in the primary and secondary reticula of flagellated chambers
within 15 min of incubation. Phagocytic vesicles were still visible in the primary and secondary
reticula after 8 h (Figure 5.3A-B) but vesicles were also found more distant from chambers, in
the trabecular syncytium (Figure 5.3B-D). Bacteria were still whole and undigested in vesicles 8
h after incubations began (Figure 5.3C-D).
The sponge tissue fed 13C-enriched bacteria showed a similar pattern of transport. There
was a large spike in δ13C after the initial feeding (Figure 5.4). Different regions of tissue showed
high variability in δ13C for the first 5 d post feeding. After that, δ13C values had lower variability
after 10 and 14 d (Levene’s test, F=0.118, p=0.051) and were unchanged from the initial spike

74
Figure 5.1. Experimental setup for observing particle feeding and excretion by
Aphrocallistes vastus. A. Sponges were incubated in bacteria, 0.1-, 1.0-, and 3.0-µm latex
beads. Water was initially cloudy (left) but became less cloudy as beads were taken up into the
tissue (right). B. Bright pink sponges, colored from eating red fluorescent beads, were left
suspended over 50-ml tubes overnight to expel any waste material. A negative control is
visible for the tube in the lower right.

75
Figure 5.2. A morphological study of particle uptake in the primary and
secondary reticula of Aphrocallistes vastus. A. Bacteria (pseudocolored pink) were
visible outside of prosopyles (p) 10 min post-feeding and B. in the spaces between the primary
(1R) and secondary (2R) reticulum at all times post-feeding. Sponge fixed 8 h post-feeding. C.
Beads (pseudocolored orange) could be seen being enveloped by small extensions of tissue
(arrows) between the collar bodies (pseudocolored green) after 10 min. D. Occurrences of
phagocytic vesicles increased as incubations grew longer. Sponge fixed 8 h post-feeding. Also
shown: choanoblasts (chb), collar bodies (cb). All scale bars: 1 µm.

76
Figure 5.3. Late stages of particle capture by Aphrocallistes vastus. A., B. 0.1-µm
beads (pseudocolored orange) were found in phagocytic vesicles below the primary reticulum.
Sponges preserved 1 h post-feeding. C. Over time, phagocytic vesicles filled with undigested
bacteria (pseudocolored pink) were visible slightly away from the flagellated chambers behind
choanoblasts (chb) and far from the water pumping collar bodies (pseudocolored green).
Sponge preserved 8 h post-feeding. D. Eventually, packets of undigested bacteria were moved
through the trabecular syncytium (t). Sponge preserved 8 h post-feeding. E. and F. Mucus- or
membrane-bound clusters of beads gave evidence of fecal pellets from the sponge that were
100 to 1000 times greater volume than each bacterial particle consumed. Scale bars: for A, B,
C, D: 5 µm. For E, F: 1 µm.

77
Figure 5.3. Late stages of particle capture by Aphrocallistes vastus

78
Figure 5.4. Changes in carbon-13 isotope signatures in tissue of Aphrocallistes
vastus incubated in water supplemented with 13C-labeled bacteria. Sponges at zero
d post-incubation were control sponges that had not been fed 13C-labeled bacteria. Subsequent
days post-incubation followed sponge tissue that had been fed 13C-enriched bacteria. Black
points indicate the mean; gray shading indicate the minimum and maximum δ13C values
measured for that time point.

79
(F7,15=2.096, p=0.109). There was no decrease in δ13C over the 14-d experiment (linear
regression, slope=0.78±0.94), so the carbon that was assimilated from the bacteria was not
excreted or discarded during that time.
5.3.3. Waste excretion
Excreted material collected from sponge pieces suspended over tubes consisted of
membrane-bound or mucus-coated clusters of latex beads (Figure 5.3E-F); no similar material
was found in control tubes without sponge pieces. Mucus-coated waste packets were ellipsoid,
1031±1178 µm3 in volume (mean±95% confidence interval (CI); n=10) and were found in larger
mucous clusters containing shards of diatom frustules, radiolarian tests, and other
unidentifiable detritus. No discarded collar-flagella units or any other recognizable tissues from
the sponge were visible.
5.3.4. Food sources to the glass sponge reefs
Isotope signatures in sponge tissue differed between years and locations sampled (Table
5.1, Table S4.1). Only Fraser and Galiano reefs were compared across years for four separate
years; Howe reef was only sampled twice and the non-SoG sponges, once. There was no
consistent pattern in the changes between years between Fraser and Galiano reefs (Table S4.1).
Sponges from Fraser and Howe reefs had significantly lower δ13C and δ15N ratios than sponges
from Galiano reef and those collected outside of the SoG (Figure 5.5).
The variability seen between years and between reefs was less than the difference of the
three sample types: sponge tissue, sediments, and POM. Post hoc Bonferroni comparisons
indicated that the mean δ13C for sponge tissue (range: -21.31 to -19.25‰) was more similar to
sediment (range: -23.80 to -19.73‰; p=0.034) than it was to POM in the water filtered by the
sponges (range: -25.22 to -22.49‰; p<0.005). In contrast, δ15N rations in sponge tissue
(range: 14.35 to 17.52‰) were more different from those in sediment (range: 4.34 to 10.12‰;
p<0.0005) than POM (range: 5.33 to 11.97‰; p=0.042). Large variability meant there was no
statistically significant difference between δ15N values for POM and sediment, but there was a
difference in the δ13C values (p<0.0005).
The fractionation and trophic position of the sponges could not be calculated because
δ13C and δ15N ratios for the sponges did not fall between the ratios of sediments and POM (Post
2002). POM was the most depleted of 13C followed by sediment and then sponge tissue.

80
Table 5.1. δ13C and δ15N values (‰) measured from Fraser, Galiano, and Howe Reefs, and from outside of the
Strait of Georgia. Aphrocallistes vastus were sampled between 2007 and 2014 to assess spatial and temporal differences in
isotopic signatures. POM was collected as a potential food source for the reefs in 2009, and sediments were sampled in 2011 and
2014 to assess whether sponge-derived material (fecal pellets) were detectable.
δ13C (‰) δ15N (‰) Location Latitude Longitude Year Mean SD Mean SD n Sponge
Fraser 49°09.485’N 123°23.081’W 2007 -21.19 0.08 14.74 0.31 5 2009 -20.26 0.11 14.74 0.30 10 2011 -20.45 0.40 15.64 0.45 9 2014 -20.23 0.13 15.31 0.19 5
Galiano 48°54.477’N 123°19.168’W 2007 -19.80 0.22 14.96 0.30 5 2009 -19.55 0.14 17.01 0.33 10 2011 -19.86 0.15 16.43 0.53 11 2014 -19.32 0.06 16.11 0.25 5
Howe 49°19.901’N 123°17.647’W 2009 -20.28 0.19 15.21 0.50 10
Outside SoG* 2008 -19.68 0.13 16.22 0.44 6
POM Fraser 2009 -23.84 1.08 9.63 2.08 9 Galiano 2009 -23.09 0.69 8.46 0.97 9 Howe 2009 -23.51 0.70 10.23 0.96 10
Sediments
Fraser 2011 -21.42 0.58 7.29 1.80 5 2014 -21.69 1.18 4.80 0.32 5
Galiano 2011 -20.66 0.63 6.84 2.29 5 2014 -21.69 1.18 4.80 0.32 5
*Two locations were sampled outside of the Strait of Georgia: Barkley Sound (48°54.262’N, 123°02.637’W) and offshore of the
Washington Coast (48°22.676’N, 123°03.056’W).
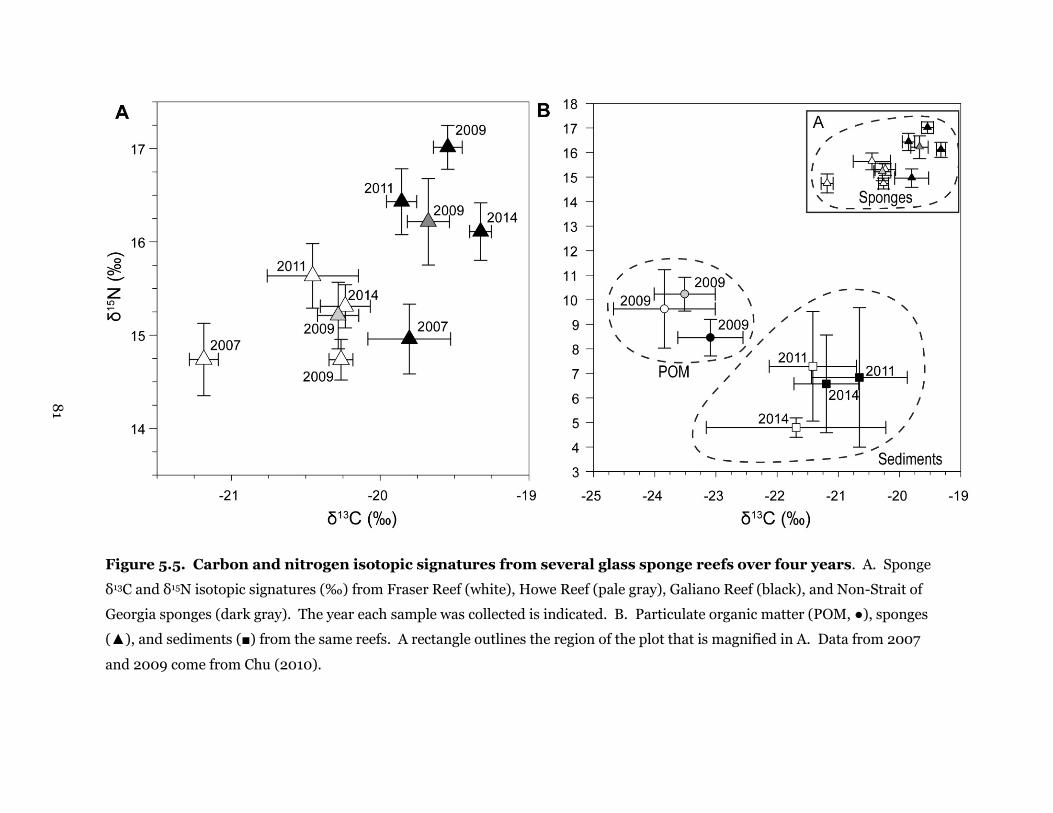
81
Figure 5.5. Carbon and nitrogen isotopic signatures from several glass sponge reefs over four years. A. Sponge
δ13C and δ15N isotopic signatures (‰) from Fraser Reef (white), Howe Reef (pale gray), Galiano Reef (black), and Non-Strait of
Georgia sponges (dark gray). The year each sample was collected is indicated. B. Particulate organic matter (POM, ●), sponges
(▲), and sediments (■) from the same reefs. A rectangle outlines the region of the plot that is magnified in A. Data from 2007
and 2009 come from Chu (2010).

82
5.4. Discussion
The process of feeding, from particle capture to excretion, in Aphrocallistes vastus was
studied to understand how food was captured and altered by sponge digestion. Stable isotopes
were also used to identify sources of food, which may help explain how glass sponges can form
dense reefs. Particle capture occurred on the primary and secondary reticula as has been
observed in other glass sponges (Perez 1996, Wyeth et al. 1996, Wyeth 1999) but two new
elements were observed: 1) food eaten by the glass sponge was transported elsewhere in the
tissue before being digested, and 2) the carbon assimilated from food was detectable in the
tissue up to two weeks later. Digested material was released as fecal pellets that were several
times larger than the particles consumed. Efficient particle capture and processing likely couple
with trophic subsidies to support high densities in the reefs. Stable isotope data suggest that the
food ingested by the sponges may come from both terrestrial and oceanic sources, with different
contributions of each to different reefs.
5.4.1. Feeding and excretion
The smallest structure that water must pass through in the aquiferous system is
consistent across many sponge taxa and is 20-70 nm glycocalyx mesh between the microvilli of
collars on choanocytes, the water pumping and feeding cells, (Spongilla lacustris, Fjerdingstad
1961, Aphrocallistes vastus, Leys et al. 2011). It is therefore not surprising that the smallest
particles fed to the sponges in this study, 0.1 µm diameter, were captured. Sponges from the
classes Calcarea and Demospongiae have also been known to capture particles of that size
(Gobel 1993, Leys and Eerkes-Medrano 2006). That they were not seen captured in the glass
sponge Oopsacas minuta is more likely a sign that they were missed rather than that the species
could not capture the particles (Perez 1996). Particles appeared to be taken up by extensions of
the syncytial tissue, similar to the way choanocytes were interpreted to engulf particles in Sycon
coactum (Leys and Eerkes-Medrano 2006)
In sponges incubated in beads or bacteria for 1 h or longer, particles were found in non-
feeding parts of the tissue, if transported they were likely moved there by cytoplasmic streaming
through the trabecular syncytium, which allows movement of cytoplasm, organelles, and
phagocytized particles through the tissue along microtubule tracts (Leys 1995). In cellular
demosponges of the genus Aplysina, similar transport was accomplished by migratory cells
moving through special strands in the tissue (Leys and Reiswig 1998). The static images suggest
that feeding by the glass sponge appears to be partitioned; particle capture (uptake) occurs in
the primary and secondary reticula while digestion involves transport of phagocytic vesicles to
other regions of the body.

83
Beads released by the sponge resembled fecal pellets found from demosponges (Wolfrath
and Barthel 1989, Gobel 1993); they were the same size as those of Halichondria panicea and
appeared to have a similar mucous or membrane-bound coating. Many attempts to capture
fecal pellets released by the sponge have led to the conclusion that it is not possible to quantify
for several reasons. Glass sponges would not pump, and so release fecal pellets, in chambers of
water left overnight. They required flowing seawater, which was impossible to filter and remove
other particulates from the water at such high volumes. Copepod fecal pellets, and likely excreta
from other animals, were recognizable in negative controls of the samples that were collected for
electron microscopy. The fecal pellets of other animals did not have beads in them because they
had not been incubated in beads like the sponges had, but nevertheless any attempt to quantify
carbon content in excreted material would capture that excreted material, along with whatever
else is released by the sponges (for example, mucus, spicules or tissue that had been abraded off
of the sponge).
The volume of an average-sized fecal pellet collected from A. vastus was 1031 ± 730 um3
(mean±95% CI). The same volume of 1-um3 bacteria from small coastal bacterial communities
with relatively low C content (30.2±12.3 fg C cell-1; (Fukuda et al. 1998)) could hold 31 µg of
carbon. Assuming that only 10% of carbon from those bacteria are released as waste, each fecal
pellet could have housed up to 3.1 µg of carbon derived from microbes. This calculation is an
underestimate because the bacteria would likely not be 1 um3 upon excretion, but it highlights
the potential for sponge excretion as a means of transporting carbon from the microbial loop
into the benthos. Fecal pellets are 100 to 1000 times the volume of the food they derive from,
with importance to pelagic-benthic coupling similar to that of zooplankton fecal pellets on the
biological pump (Turner 2015). Producing fecal pellets involves extruding particulates through
membrane-bound vacuoles, which requires production of cellular material (Willenz and van de
Vyver 1986) that might further increase the carbon output from sponge excretion and use
energy. Waste excretion, with its agglomerated food waste and extruded membranes of fecal
pellets, is therefore a possible way that sponges transfer carbon to benthic biota.
5.4.2. Carbon assimilation into sponge tissue
The sponge incubated in water supplemented with 13C-labeled bacteria showed a variable
but sustained increase in δ13C after feeding with no decrease of δ13C over the course of the 14-d
experiment. The high variability in δ13C values from the same time point indicate that not all
areas of the sponge were feeding at the same time or rate. This was also evident from the patchy
color changes caused by the pink beads for Aphrocallistes vastus and Rhabdocalyptus dawsoni,
and for pigmented algae in Oopsacas minuta (Perez 1996, Wyeth et al. 1996, Wyeth 1999). That

84
some chambers captured particles while others did not may mean that not all chambers were
feeding at the same time or that the solution was not well mixed. Over time, however, the
variability of δ13C values decreased, likely as new carbon was distributed throughout the tissue
by cytoplasmic streaming (Leys 1995).
Isotope ratios in tissue are affected by the turnover rate in that tissue. For example, red
blood cells reflect isotopic signatures from food eaten over several days while bones show the
signature of food ingested over a year or more (Gannes et al. 1997). Sponge tissue showed
retention of 13C from labeled bacteria for a full 14 d, despite the release of fecal pellets after 24 h
in other feeding incubations. It is possible that the nondigestible latex beads were expelled
more quickly as something akin to pseudofeces whereas the bacteria were assimilated into tissue
as usable carbon. Unchanged 13C values also mean that isotope values measured from glass
sponges in the field did not reflect their diet from the past few days, but instead reflected a
longer timescale of feeding.
5.4.3. Food sources to different reefs
Differences in carbon isotope signatures between reefs reflected the oceanography of the
region. Fraser and Howe reefs had similar δ13C values that were 13C-depleted relative to Galiano
Reef and the non-SoG locations. Depleted δ13C values suggest a more terrestrial food source at
Fraser and Howe than at Galiano and non-SoG locations and indeed, freshwater discharges
from cities and rivers flow directly over Fraser and Howe reefs (Johannessen et al. 2005) while
Galiano lies further from any terrestrial discharges, therefore receiving a greater proportion of
its carbon from oceanic plankton.
Nitrogen isotope signatures of sponges were 5-8 ‰ δ15N higher than those of POM from
the water, and higher still than δ15N isotope signatures of sediments. Hexactinellid sponges in
the Porcupine Abyssal Plain (PAP) also had a very high δ15N – the highest of many taxa
investigated (Iken et al. 2001). The copepod Metridia pacifica from the Strait of Georgia had a
similar 6 ‰ gap between themselves and POM, which was attributed to its omnivorous diet (El-
Sabaawi et al. 2010). The high trophic level of the sponges here and in the PAP could also be
partly reflective of their diet, which is preferentially selective on heterotrophic bacteria (Yahel et
al. 2006). If bacteria could have been separated from the rest of POM, it is possible that bacteria
may have filled the 5-8 ‰ gap between POM and the sponges, although other factors can also
raise δ15N values, such as nitrogen from agricultural runoff (McClelland et al. 1997), coprophagy
(Fenolio et al. 2006), and starvation (Hobson et al. 1993, Cherel et al. 2005).
The closest carbon isotope signature to sponge tissue was found in sediment. We had
originally thought that isotope signatures of sediments might reflect sponge excretion but the

85
δ15N could indicate the opposite: that sponges were a higher trophic level than the material in
the sediments. Alternatively, sediments could reflect POM deposition or other confounding
factors as well, so further investigation is needed. Still, could sponges feed on bacteria in
resuspended sediment? δ13C values between POM, sponges, and sediment support the
hypothesis that sediments may contribute to the diet of the sponges, turning the ‘sponge loop’
upside down and underground. If sponges do eat bacteria from the sediments, they may draw
carbon from the seafloor back up into the water column through resuspension. The reefs may
even facilitate sediment resuspension by disrupting laminar tidal flows and causing turbulent
mixing. Some sponge reefs in the Strait of Georgia, including Fraser Ridge Reef, are more
murky than their surroundings – so much so that decreased visibility was one indication used to
know the ROV was approaching the reefs during dives. A suite of instruments mounted to the
remotely operated vehicle ROPOS during a survey across Fraser Ridge Reef demonstrated this,
with lower transmittance and higher fluorescence in water overlying sponges than in an adjacent
sponge-free patch (Figure 5.6). Resuspension has been implicated as an important food source
for animals in other systems (Yahel et al. 2008) and even for dense glass sponge aggregations in
the northern Atlantic (Rice et al. 1990). Sediment-borne bacteria outnumber bacteria in the
water column by 100 to 1,000 times (Whitman et al. 1998) so it will be important to determine
the relative contributions of sediment-borne bacteria and pelagic bacteria in the future.
Results presented here suggest that glass sponges in the reefs receive plenty of food from
the microbial loop to sustain their high densities in coastal areas, where strong currents import
productive water from terrestrial and oceanic sources to the reefs, and possibly from
resuspension of sediment-borne bacteria as well. The mechanisms behind the nutrient cycling
observed in Chapter 2 were identified here: food is either sequestered into tissue and held there
for two weeks or longer, or it is released as fecal pellets that are larger than the food particles
eaten by the sponges.
5.5. Acknowledgements
We thank the captains, officers, and crew of the CCGS Vector, the Canadian Scientific
Submersible Facility, and the director and staff of the Bamfield Marine Sciences Centre. We
also thank A. Bramucci and R. Case for supplying bacteria, G. Braybrook and N. Gerein for SEM
support, A. Harms for isotope analyses, and A. Oatway for microscopy assistance. Fieldwork on
board was provided by many people since 2007. We acknowledge funding from NSERC
Discovery and Ship Time grants to SPL, and the Vanier Canada Graduate Scholarship, BMO
Graduate Student Scholarship, and the Donald M. Ross Scholarships to ASK.

86
Figure 5.6. Transmissivity, oxygen, and fluorescence overlying reef and non-reef
regions at Fraser Ridge, a sponge reef in the Strait of Georgia. A SeaBird CTD
mounted with a transmissometer, oxygen sensor, and fluorometer was mounted on the
remotely operated vehicle ROPOS during a gridded survey across Fraser Ridge Reef in 2005.
Survey data was integrated in 150-m sections and visualized using Ocean Data View software.
Sponge-filled regions are denoted in Section A and open sediments in Section B.

87
Chapter 6. Spicule and flagellated chamber formation in a growth zone of Aphrocallistes vastus
6.1. Introduction
Glass sponges colonized glacially carved ridges after the last glacial maximum and reefs
have grown almost 20 m vertically in the 9,000 years since. Despite this impressively long time
forming, only 1-2 meters of glass sponge skeleton - both living and dead - projects out of the
sediments (Krautter et al. 2001). Growing away from the sediments can be seen as a race
against burial by sediment; in addition, growing upwards might allow reef sponges to reach
stronger ambient currents and presumably would enhance feeding as is known to be important
for corals (Genin et al. 1986). The sponge consists of a single large tube, usually with several
side branches, each of which can function as an effective excurrent vent; the central tube is the
sponge osculum. New tissue forms at the tips of each of these extensions but how this occurs in
a syncytial animal, and how the tubes expand laterally as the sponge gets larger, are both
unknown. Glass sponges are syncytial, and so exactly how they form new tissue and the skeletal
scaffolding upon which it lies, with multinucleate tissues and a shared cytoplasm is puzzling.
The body organization of glass sponges has been well-described (Mackie and Singla
1983, Reiswig and Mehl 1991, Leys 1995, 1999, reviewed in Leys et al. 2007). It is almost
entirely formed by a continuous, multinucleate syncytium called the trabecular reticulum which
can be either fused together into a rigid framework or lie individually (Leys et al. 2007). The
trabecular reticulum includes the dermal and atrial surfaces and runs continuously through the
choanosome. At the flagellated chambers, branches of the trabecular reticulum called the
primary and secondary reticula support the collar-flagella pump units (Figure 6.1B-D) (Mackie
and Singla 1983, Reiswig and Mehl 1991, Leys 1999). There is a very thin collagenous mesohyl,
and no mobile cells. Instead transport of materials for feeding, growth and repair, occurs via
cytoplasmic streaming along microtubule tracts, through the trabecular reticulum (Leys 1995).
Dense transport strands have previously been called ‘cord syncytia’ (Reiswig and Mehl 1991).
The sponge is a mixture of these multinucleated tissues and regions that function as cells but are
tethered to the rest of the tissue by cytoplasmic bridges (Mackie 1981, Mackie and Singla 1983).
At the flagellated chambers groups of nucleated ‘cells’ called choanoblasts give rise via
cytoplasmic extensions to collar-flagella units – each unit has a beating flagellum surrounded by
a ring of microvilli, but these arise from an enucleate base (Mackie and Singla 1983, Leys 1999).

88
Figure 6.1. Structure of chambers of Aphrocallistes vastus. A. The fused spicule
skeleton of a dead sponge (brown) persists after the live tissue (yellow) has died. B. The
trabecular syncytium (ts) makes up most of the tissue of the sponge, including the atrial and
dermal (d) membranes. Dermal spicules project from the dermal membrane, part of the
trabecular syncytium, down through a large subdermal space (v). Beneath the subdermal
space lie flagellated chambers (c). White boxes outline regions that are magnified in C and D.
C. Chambers are lined with two branches of the trabecular reticulum: a primary reticulum
(1R) perforated with prosopyles (p) through which water enters the chamber, and a secondary
reticulum (2R). Collar bodies (cb) draw water through the flagellated chambers and canals.
Collar bodies lie embedded in the primary reticulum with collars of microvilli projecting
through holes in the secondary reticulum. D. Collar bodies (cb) are produced by
mononucleate choanoblasts (chb). Scale bars: A: 10 cm, B: 100 µm, C: 10 µm, D: 10 µm.

89
Figure 6.1. Structure of chambers of Aphrocallistes vastus.

90
Spicules are conspicuous and well-studied structured in sponges. In glass sponges
spicules are secreted intrasyncytially but not in the trabecular reticulum. It was at first believed
that distinctly separated ‘scleroblasts’ were needed because of the particular microenvironment
needed for silica deposition (Mackie and Singla 1983) but it is now known that spicule-secreting
regions are multinucleate, may be very large, but are as with all the sponges’ tissues connected
to all other tissues by cytoplasmic bridges (Leys 2003a). Studies of freshwater sponges have
suggested that siliceous spicules grow along their surface area (Elvin 1971) with silicic acid
deposited around an organic membrane – the silicalamella – that surrounds the entire spicule
(Simpson and Vaccaro 1974). In the glass sponges Caulophacus sp. and Euplectella
aspergillum, it was inferred that spicules form as amorphous silica is deposited around a
hydroxylated collagen substrate, and this later fuses into the spicule structure using a silica-
calcite composite (Ehrlich et al. 2010, Ehrlich et al. 2011).
To understand where spicules form in a growing sponge, and how new syncytial and
cellular regions of tissue are made we studied regions of new growth in the reef-forming,
dictyonine glass sponge Aphrocallistes vastus Schulze, 1886 (Order Hexactinosida; Family
Aphrocallistidae). We used a ratiometric dye that labels newly deposited silica as well as
fluorescence, scanning, and transmission electron microscopy to understand the morphology
and processes involved in growth of new tissue and skeleton.
6.2. Methods
6.2.1. Specimen collection
Pieces of Aphrocallistes vastus Schulze, 1886 (10 x 10 cm) were collected either by
SCUBA from Saanich Inlet, British Columbia (40 meters depth) or from the Galiano Ridge
sponge reef using the remotely operated vehicle ROPOS with the Canadian Coast Guard Ship
Vector. Sponges were maintained in an incubator at 9°C or in flow-through seawater tanks at
the Bamfield Marine Sciences Centre.
6.2.2. Spicule growth
Three 2 x 8 cm strips were cut from the main body up to the osculum lip and incubated
in 250 ml of 0.5 µM 2-(4-pyridyl)-5-((4-(2-
dimethylaminoethylaminocarbamoyl)methoxy)phenyl)oxazole (PDMPO; RatioWorks™) in
seawater for 2 d. Seawater was filtered (0.22 µm) to remove diatoms, which could take up the
PDMPO. Sponges were fixed in Bouin’s fixative overnight, rinsed twice briefly in seawater and
dehydrated to 70% ethanol for long-term storage. Thin strips of sponge tissues were mounted
and viewed under epifluorescence on a Zeiss Axioskop2 Plus using a long-pass DAPI filter.

91
6.2.3. EdU labeling of cells
Tissue pieces 3 x 5 mm were cut from the main body of the sponge (where the skeleton
was fused) and from the soft osculum lip region where the skeleton was not fused. Tissue pieces
were allowed to regenerate cut membranes in seawater for 24 h in an incubator (at 9°C), prior to
being immersed in 5 ml (1 tissue piece) or 20 ml (2 tissue pieces) of 100 µM 5-ethynyl-2’-
deoxyuridine (EdU) in 0.2-µm filtered seawater for 1 to 6 d. Seawater and EdU were refreshed
daily. Using a pulse-chase protocol, tissue pieces were incubated in EdU for 3 d, and transferred
to filtered seawater without EdU for 1, 2, or 3 d before fixation. Sponges were fixed in 8%
paraformaldehyde and 0.03% glutaraldehyde for up to 24 h. Following fixation, pieces were
rinsed twice in phosphate buffered saline, dehydrated to 70% ethanol, and desilicified in 4%
hydrofluoric acid in 70% ethanol for 1-2 d. Desilicified sponge tissue was dehydrated and
embedded in paraffin. Sections 7 µm thick were collected from at least 30 µm medial to the cut
face of the tissue to avoid regenerative or repairing tissue. To fluorescently tag the EdU, sections
were dewaxed and labeled with Alexa Fluor 594-azide using click chemistry following the
standard protocol for the Click-iT EdU whole animal imaging kit (Life Technologies). Nuclei in
the same sections were labeled with 100 µM Hoechst 33342 (Molecular Probes™) for 30 min,
then sections were rinsed three times with PBS and mounted in Mowiol.
6.2.4. Thick sections and electron microscopy
Sponge pieces (2 x 2 cm) were preserved for electron microscopy in a cocktail fixative
consisting of 1% OsO4, 1% glutaraldehyde, and 0.45 M sodium acetate buffer with 10% sucrose
(Leys 1995) except twice the concentration of osmium was used in the first 30 min to account for
any dilution of the first mixture by seawater in the sponge tissues. The fixative was replaced
after 30 min and samples were left overnight at 4°C. Specimens were rinsed once briefly in
freshwater to remove salts, dehydrated through a graded series to 70% ethanol, and desilicified
in 4% hydrofluoric acid in 70% ethanol for 1-2 d. Once desilicified, separate pieces were
prepared for scanning and transmission electron microscopy (SEM, TEM).
Samples prepared for SEM were dehydrated to 100% ethanol, fractured in liquid
nitrogen, and critical point dried (Bal-Tec CPD 030). Dried specimens were mounted onto
aluminum stubs, sputter-coated with gold (Xenosput XE200) and viewed in a JEOL 6301F field
emission scanning electron microscope. Samples prepared for TEM were dehydrated to 100%
ethanol and embedded in epoxy resin (TAAB 812, Electron Microscopy Sciences). Thick
sections (1 µm) were cut on a Leica Ultracut T and stained with Richardson’s stain (Richardson
et al. 1960). Thin sections (60 nm) were mounted onto copper grids, stained with lead citrate
and uranyl acetate, and viewed in a Philips/FEI (Morgagni) transmission electron microscope.

92
6.3. Results
6.3.1. Spicule growth
A survey of the tissue from all parts of the sponge showed newly forming spicules
throughout the body, but different spicule types formed in the fused and unfused regions
(Figure 6.2A-B). In all cases, when spicules were labeled with PDMPO the whole spicule was
fluorescent – not just a tip or segment (Figure 6.2C).
The only new spicules labeled in the lower regions of the sponge where spicules were
fused into a scaffold were microscleres. In contrast all spicule types (both microscleres and
megascleres) were labeled at the growing edge of the osculum (hereafter called the osculum lip)
(Figure 6.2D, D’). Furthermore, secondary silica deposition that locked the loose spicules into a
rigid framework was also seen between the fused and unfused parts of the skeleton (Figure 6.2E,
E’).
6.3.2. Growth of flagellated chambers
Nuclei found scattered throughout the trabecular syncytium never took up the EdU label.
Cells adjacent to flagellated chambers did take up EdU, but only after incubation for 4 d;
whether these were archaeocytes or choanoblasts could not be determined.
More activity was visible in the osculum lip region. There, choanoblasts took up EdU
after 24 h, initially labeling as tight clusters of typically 5 or more (Figure 6.3A), but later
becoming arranged in single-file rows of 4 or more (Figure 6.4A). Clumps of microvilli were
visible near the clusters of choanoblasts with collar bodies already produced but not inserted
into a larger chamber structure (Figure 6.3B-D). Images captured by all methods (SEM, thick
sections, and TEM) showed that once choanoblasts were arranged in single-file rows the collar
bodies had also moved apart to form a mature flagellated chamber with regularly spaced collar
bodies surrounded by the primary and secondary reticula (Figure 6.4E). Naturally from static
views it could not be determined when the chambers became functional. Chambers were also
found that were intermediate between the early ‘clustered choanoblast’ stage and the more
mature ‘single-file choanoblast’ stage (Figure 6.3E-F).
The transition from clusters of collar bodies to the regular spacing observed in mature
chambers could not be tracked with EdU but several observations from the thick sections and
scanning and transmission electron micrographs suggest different stages. Beginning with the
lowest degree of organization, microvilli and flagella of the collar bodies were sometimes found
surrounded by tissue that extended up into the chamber (Figure 6.5A-C). In other chambers
tissue surrounded each collar body but provided more space around each flagellum (Figure
6.5D). In yet other chambers, collar bodies were regularly spaced and embedded in a primary

93
Figure 6.2. Spicule production in the growing edge of a glass sponge. A and B.
Whole sponge (A) and cross section (B) showing how strips were cut from the part of the body
with fused (f) spicules to the osculum lip, where spicules were not fused (u). C. Microscleres
and megascleres labeled with PDMPO. Clockwise from top left: oxyhexaster (microsclere),
pinular hexactin (megasclere), scopule (microsclere). D and D’. The unfused region of the
skeleton, showing microscleres and megascleres labeled with the fluorescent dye PDMPO (D:
PDMPO label. D’: PDMPO label overlaid onto a bright-field view of all spicules.) E and E’.
PDMPO labelling of fusion on the dictyonine skeleton in the transitional area between the
fused and unfused skeleton. (E: PDMPO label. E.’: PDMPO label overlaid onto a bright-field
view of all spicules.) Scale bars: A. 5 cm; B. 5 mm; C. 250 µm; D. and D.’ 1 mm; E. and E’. 500
µm.

94
Figure 6.2. Spicule production in the growing edge of a glass sponge.

95
Figure 6.3. Proposed steps in formation of flagellated chambers. A. Clusters of
choanoblasts in the unfused region of the sponge showed signs of replication (new nuclei
labeled with EdU, pink) in a band through the tissue after incubation in EdU for 3 d. Nuclei
were counterstained with Hoechst 33342 (blue). B. and C. Similar clusters of choanoblasts
(pseudocolored purple in B, otherwise labeled chb) that resembled the clusters observed with
EdU labelling were visible using SEM (B) and thick sections (C). Clusters of microvilli
(arrows) were visible interspersed among choanoblasts. D. Clusters of microvilli and flagella
(arrowheads) were found interspersed between choanoblasts. E. Slightly larger chambers still
contained clusters of choanoblasts but with visible secondary reticulum (2R). F. Magnified
view of a cluster of choanoblasts and one collar body (cb) connected to the cluster. Scale bars:
A. 100 µm; B. 10 µm; C. 10 µm; D. 1 µm; E. 25 µm; F. 2 µm.

96
Figure 6.3. Proposed steps in formation of flagellated chambers

97
Figure 6.4. Proposed stages of enlargement of flagellated chambers. A. Newly
produced choanoblasts (Labeled with EdU, pink) were arranged lining the sides of large,
mature chambers after a 3 d pulse, 1 d chase procedure. Nuclei were counterstained with
Hoechst 33342 (blue). B. and C. Similar rows of choanoblasts (pseudocolored purple in B,
otherwise labeled chb) that resembled the rows observed with EdU labelling were visible using
SEM (B) and thick sections (C). D. Choanoblasts had a regular arrangement of collars and
flagella above them. E. The secondary reticulum (2R) was well formed by the time
choanoblasts were in rows around the edges of the chamber. Other labels: cb, collar body.
Scale bars: A. 100 µm; B. 20 µm; C. 10 µm; D. 25 µm; E. 2 µm.

98
Figure 6.4. Proposed stages of enlargement of flagellated chambers.

99
Figure 6.5. Proposed steps of formation of the reticula around the microvilli and
flagella. All images examined are from the tip area of the sponge, taken at the same time
point. A. and B. Tissue projecting down among the collars of microvilli and around the
flagella (f). C. A top-down view of a similar area showing tissue surrounding the flagellum and
the collars. D. Wider spaces around the flagella while collars of microvilli were still
surrounded by tissue. E. All tissue surrounding the flagella is gone but the collars of microvilli
are still surrounded by tissue. F. The secondary reticulum (2R) above the primary reticulum
(1R) with only a thin tissue layer above the collars remaining. Other labels: chb, choanoblasts;
cb, collar body. Scale bars: 1 µm.

100
Figure 6.5. Proposed steps of formation of the reticula around the microvilli and flagella.

101
reticulum with tissue near either collar microvilli or flagellum (Figure 6.5E). In these only the
secondary reticulum surrounded the microvilli (Figure 6.5F).
6.4. Discussion
Tissue and spicule production in the glass sponge Aphrocallistes vastus both occur at the
uppermost edges – the tips of the oscula – of the mature sponge. Spicules are formed
throughout the sponge, but megascleres only form and secondarily fuse near the growing tips of
the sponge. Flagellated chambers appear to form by division of choanoblasts first into clusters,
then those choanoblasts are arranged into a string, and then expansion of the chamber and
separation of the choanoblasts to lie around it through production of collar bodies and the
primary and secondary reticula. It is still unclear how new syncytial tissues form elsewhere in
the body and how the smaller nuclei in the syncytium form. It would appear that no chambers
form as the sponge tube widens, however that should be confirmed with additional studies of
regions closer to the middle and base of the sponge.
6.4.1. Spicule growth
The silicification process is thought to be the same between mega- and microscleres
(Uriz 2006) so both types were expected to take up PDMPO label if they were depositing new
silica, and indeed new silica deposition was seen on megascleres and microscleres. Complete
labeling of spicules by PDMPO during a short incubation period supports the prevailing model
of silicification, that siliceous spicules grow in layers around an axial filament (reviewed by Uriz
2006, Schröder et al. 2007, Wang et al. 2011). This differs from calcareous sponges in which
spicules grow from a seed nucleus either from the center to the tips or from discrete calcification
sites (Ilan et al. 1996, Sethmann and Wörheide 2008).
That different regions of the sponge produce different spicule complements
demonstrates regionalization across the body. Sponges with fused (dictyonine) skeletons cannot
change their shape as other sponges can so growth would be expected to occur only in regions
without fused skeletons. One interpretation of the stages of spicule production is spicules are
produced first in the unfused tip of the sponge and then, as the sponge grows, they are then
fused together to form the scaffold, now further away from the growing lip. If this were the case,
most spicule-forming activity would occur in tissue that lies at the unfused tips of the sponges,
with both microscleres and megascleres being produced. Once they have grown for some time
and reached terminal size, megascleres would then be fused into the rigid scaffolding (as
previously described in Leys et al. 2007). In this case, it is expected that more mature regions of
the sponge already have the megascleres needed for structure so only microscleres would be

102
produced. Not all microscleres labeled, so in the future one may be able to quantify the amount
of spicules deposited, and surface area of spicule deposition, by incubating the sponge in
PDMPO for different lengths of time.
6.4.2. Growth of flagellated chambers
Flagellated chambers were also found forming in the unfused tips of the sponge, where
they formed a surprisingly discrete band of new growth. That growth is directed and confined to
one area suggests ontogenetic processes which merit further study. In the growth zone,
chambers began as clusters of choanoblasts that first replicated and then produced collar bodies
to expand into a fully sized chamber. The organization and arrangement of collar bodies and the
primary and secondary reticula may occur in the order described here; however, it is possible
that the stages of reticulum formation are reversed, such that what we describe is in fact the
degradation and loss of a chamber over time. In earlier work on the glass sponge
Rhabdocalyptus dawsoni, flagellated chambers were thought to be resorbed after being kept in
a tank for several days (Leys 1999); while that may be possible here too, all of our current
observations came from the growth zone of the sponge and were never observed elsewhere in
the tissue. Flagellated chambers may be lost over time, either because they are resorbed back
into the body or because that region of the body has a different function, such as when
archaeocyte congeries adjacent to the chambers produce spermatocysts (Figure S5.1) (Boury-
Esnault et al. 1999, reviewed by Leys et al. 2007).
Flagellated chambers that form by expansion of enucleate collar bodies is unique to glass
sponges. Other sponges produce chambers through transdifferentiation of larval ciliated cells
with a possible archaeocyte intermediate (Amano and Hori 1996, Leys and Degnan 2002), by
immigration of stem cells from the mesohyl (Chapter 4), or by 4-5 mitotic divisions of a
founding archaeocyte into smaller and smaller cells until all choanocytes are made (Tanaka and
Watanabe 1984). The rosettes of choanoblasts that appear in early stages of chamber formation
in glass sponges match closely to the small, new chambers described from cellular sponges.
What is interesting is that while flagellated chambers of cellular sponges expand to full size
through mitosis, transdifferentiation, or stem cell immigration, the flagellated chambers of glass
sponges expand without producing any more choanoblasts at all by creating collar bodies
instead. Using a limited number of choanoblasts to produce a chamber may be an energy-
efficient strategy of living in food-poor deep water.
Different growth forms can also confer energetic advantages depending on flow
conditions. The hydrozoan Millepora alcicornis, scleractinian coral Pocillopora damicornis,
and the sponges Haliclona oculata and Halichondria panicea all have thin, branching

103
morphologies in areas with low flow and are more compact in areas with higher flow (Palumbi
1984, 1986, Kaandorp 1999). Mathematical models of accretive growth in a sponge or stony
coral show that a branching, upward growth becomes a dominant morphology for suspension
feeders in areas with flow and high nutrients (Kaandorp and Sloot 2001). High flow and high
nutrient conditions are what reef sponges are exposed to and so might explain the directional
growth observed for both their tissue and their spicule skeletons.
6.5. Acknowledgements
We thank Pinnacle Divers of Victoria, S. Freisen, P. Gill, the Canadian Scientific Submersible
Facility, and the CCGS Vector for their facilities and expertise in the field. We also thank G.
Braybrook, N. Gerein, A. Oatway, and D. Rollins for microscopy support. This research was
supported by the following scholarships to ASK: Vanier Canada Graduate Student Scholarship,
BMSC Scholarship, Donald M. Ross Scholarship, and the Bank of Montreal Graduate Student
Scholarship. Funding was also provided by NSERC Discovery and Ship time grants to SPL.

104
Chapter 7. General Discussion: Insights into the ecophysiology of glass sponge reefs
In the ocean pelagic-benthic coupling has long been known to connect food energy from
the water column to benthic biota, but details of its functions and additional complexity
continue to be discovered. Sponge reefs have already been considered as important foundation
species that produce three-dimensional habitat for other animals and sequester silica, but their
role in pelagic-benthic coupling and carbon flow to the seafloor was not known.
The research in this thesis addressed how glass sponges affect the surrounding
ecosystem. The five research chapters each investigated different aspects and different scales of
food flow into, within, and out of individuals and the reefs themselves, and all five combine to
offer insights into the ecology of glass sponge reefs. My coauthors and I found that sponge reefs
altered the surrounding water by consuming microbial carbon and excreting microbial nitrogen
as ammonium, with the strongest grazing rates of any suspension feeding community measured
to date (Chapter 2). Strong feeding by the reefs was supported by food from both terrestrial and
oceanic sources in the Strait of Georgia, with fecal pellets released by the sponges as aggregates
of the particles that were consumed (Chapter 5). Fecal pellets may be a way that sponges
concentrate bacterial carbon into a usable form for other animals. Repeat visits to the same
sites across three years of ship cruises revealed dynamic, changing populations, with sponges
growing and dying over the course of a few years at rates similar to those of shallower sponge
species (Chapter 3). Given the many ecosystem functions that sponge reefs perform, the
chapters that followed focused the mechanisms behind those fluxes at several scales.
Measurements of cell turnover rates of four species of sponges showed that sponges controlled
and limited the rate of cell proliferation depending on species and conditions (season and life
history stage, but not feeding activity) (Chapter 4). We found that the reef sponges grow both
new spicules and new flagellated chambers in specific growth zones (Chapter 6), and that
choanoblast turnover rate in the growing region of the glass sponge was comparable to
choanocyte turnover in non-growing regions of cellular sponges (Chapter 4). Growth in general
contributed to the ecosystem functions of sponges identified elsewhere in this thesis, as new
spicules provided habitat and substrate for other animals and as tissue sequestered carbon and
contributed to nutrient cycling through feeding activity.
7.1. Importance of marine technology in advancing deep-sea biology
Studying biology in deep water presents more technical challenges in accessibility than
with other marine habitats. Advances in knowledge of deep-water biology are therefore tightly

105
linked to advances in technology. Ijima (1901) and other early sponge scientists characterized
the basic morphology and taxonomy of hexactinellids by opportunistically using specimens
collected by fishermen through trawls, dredges, tangles, and ‘dabo-lines’ (longlines), as “objects
perhaps of great value to naturalists but which to their [the fishermen’s] eyes are all unwelcome
‘filths,’ ‘weeds’ or ‘useless cottons.’” However, Ijima (1901) noted the limitations of trawling,
stating that “specimens obtained…were always in a sorely mutilated condition, caused partly by
the manner in which they were rooted out but more especially by their having been dragged
along in the bag with so many other things.” Free vehicles, deployed with a weight and then
recovered by dropping that weight to become positively buoyant, were the first technological
advance that moved beyond trawling and allowed specimens to be collected undisturbed along
with the sediments upon which they rested (Smith et al. 1979b). They were also used in
pioneering in situ studies of ecophysiology and benthic-pelagic coupling (Smith et al. 1976,
Smith et al. 1979a).
The emergence of human-operated and remotely operated vehicles (ROVs) resulted in a
radiation of the types of in situ studies that could be done (Robison 1999). The in situ
experiments undertaken in the course of this dissertation were only possible because of
precision navigation systems that allowed us to return to the same sites across several days and
years and a powerful ROV that could hold its position in strong currents but still had the
dexterity to serve as both eyes and hands underwater.
Just as research progressed with technological advances in the past, future work will
benefit from other advances in instrumentation, coupling different deep submergence
technologies (Fornari et al. 1997), and especially combining the fine dexterity and long working
times of remotely operated vehicles with the long-term deployment and abilities of autonomous
underwater vehicles (Robison 1999). Time is the biggest limit for data collection during ROV
deployments on our trips, and AUVs might help relieve that time limitation by doing necessary
but time-consuming menial tasks such as mapping and measuring water properties.
7.2. Ecology of glass sponge reefs
7.2.1. Conditions needed to form reefs
In general, glass sponges need low light, cold temperatures (<12°C for optimal
propagation of action potentials, Leys et al. 1999), high concentrations of silica, low levels of
sedimentation (<35 mg/L, Tompkins-MacDonald and Leys 2008), and hard substrates to settle
on to grow (Leys et al. 2004). There are many fjords in other parts of the world and even within
western Canada that satisfy these requirements, yet reefs do not form there. Glass sponge reefs

106
have the largest grazing rate of any suspension feeding community measured to date (Chapter
2), so surplus food energy may be an additional requirement for sponges to form reefs. We
hypothesized that the extra food energy is brought in by strong water currents and resuspended
sediments (Chapter 5).
Water flow is of course important to any suspension feeder – it has been shown to induce
morphological changes in demosponges and corals (Palumbi 1984, 1986, Kaandorp and Sloot
2001) – but this need is amplified in sponge reefs because they live in such high densities. Like
deep-water corals (Genin et al. 1986, Davies et al. 2009), glass sponge reefs in Hecate Strait,
Queen Charlotte Sound, and the Strait of Georgia form on bumps and ridges that accelerate flow
over them (Bedard 2011). Growth was directional in A. vastus (Chapter 6), which may suggest
that sponges were in a race to outgrow their neighbors to project farther out of the boundary
layer. Growing upward out of the boundary layer would expose sponges to stronger currents,
and therefore more food, where greater volumes of water can wash over them than in areas of
weaker currents. Another possible advantage might be that when higher, the sponges could take
advantage of current-induced flow to take up more food energy without working harder during
feeding (suggested by Leys et al. 2011).
Glass sponges grow in fjords throughout the west coast of British Columbia so whereas
sediment is needed for reef formation (Conway et al. 2005a), outside of the reef setting the
distribution of Aphrocallistes vastus was inversely related to sedimentation load (Leys et al.
2004). Skeletons are the settlement substrate for later generations of recruits (Chapter 3,
Krautter et al. 2006). Moderate levels of sediment are necessary to cement the spicule skeletons
in the reefs (Krautter et al. 2006). However, too much sediment in the water can cause glass
sponges to arrest pumping (Tompkins-MacDonald and Leys 2008) so there are clear minimum
and maximum concentrations of sediments needed for reef formation and continued health.
The effect of sediment was the topic of a Canadian Scientific Secretariat report (Leys 2013) and
the narrow window of sedimentation required by the reefs is something that requires further
study.
Most interesting to me was another effect of sediments: that they may be a source of
food, in the form of attached bacteria, for the reef sponges. Based on estimates of particulate
organic carbon (POC) flux from the sea surface (Johannessen et al. 2003) that were seven times
smaller than the amount of bacterial carbon consumed by a 1-m2 patch of sponge reef, the reefs
would be in a food deficit if fed by POC flux alone (Chapter 2). Lateral currents are likely partly
responsible for balancing that deficit, but bacterial concentrations in sediments (108 and 109
cells ml-1) are also much higher than in the water column (106 cells ml-1) (Kuwae and Hosokawa

107
1999). Sediment resuspension has also been implicated for causing dense aggregations of the
sponge Pheronema carpenteri near the Porcupine Seabight (Rice et al. 1990, Barthel et al.
1996). Resuspension resulting from fish activity has been found to be important for carbon
remineralization in shallow habitats (Yahel et al. 2008). The degree to which bacteria from the
water column and bacteria from sediments contribute to the diet of reef sponges is not known
and is an important next step to understanding the role of sponges in carbon cycling on the
seafloor.
7.2.2. Pelagic-benthic coupling by glass sponge reefs
Glass sponge reefs are already known to be foundation species that create habitat for fish
and invertebrates (Cook 2005, Cook et al. 2008, Marliave et al. 2009). They are now also
known to serve ecosystem functions through their feeding activity (Chapter 2) like shallower
sponge species (Jimenez and Ribes 2007). As part of the biological pump, sponges have an
analogous role to that of zooplankton in surface waters: their fecal pellets concentrate bacterial
carbon into larger aggregates (Chapter 5). These aggregates could sink to the seafloor and be
sequestered into the benthos, or they may become large enough to be edible by deposit feeders.
The role of sponges in connecting the microbial loop with the biological pump, which was
reviewed in Chapter 1, is revised here to include their suggested roles in pelagic-benthic
coupling (Figure 7.1).
The three species that make reefs on the continental shelf are also found throughout the
waters of British Columbia, sometimes at densities as great as those found in the reefs (Leys et
al. 2004) and throughout the Northern Pacific below 1000 m depth at lower densities. Food
availability in general is lower in the deep sea (prokaryote concentrations are 5 x 10⁴ cells ml-1
compared to 5 x 10⁵ cells ml-1 in ocean depths <200 m) (Whitman et al. 1998) and that could be
the reason why dense aggregations do not form there. Other deep regions where there are dense
aggregations of suspension feeders have a food supply that is thought to be enhanced by
allochthonous inputs (food imported from elsewhere). Deep-water coral reefs of Lophelia
pertusa (Cnidaria) in the Sea of Hebrides experience intense bouts of downwelling and rapidly
imported currents from other deep areas (Davies et al. 2009), beds of Sericolophus hawaiicus
(Porifera) in Hawaii are suggested to be fed by downwelling along the slope of the island (Pile
and Young 2006), and Pheronema carpenteri (Porifera) populations on the slope of the
Porcupine Seabight are thought to be supported by sediment resuspension through internal
waves (Rice et al. 1990). Nevertheless, the average individual of Aphrocallistes vastus removes
bacteria from over 9,000 L water d-1 (Chapter 2), so its feeding activity can have the same
ecosystem functions in deep water as in the reefs through excretion of ammonia and fecal
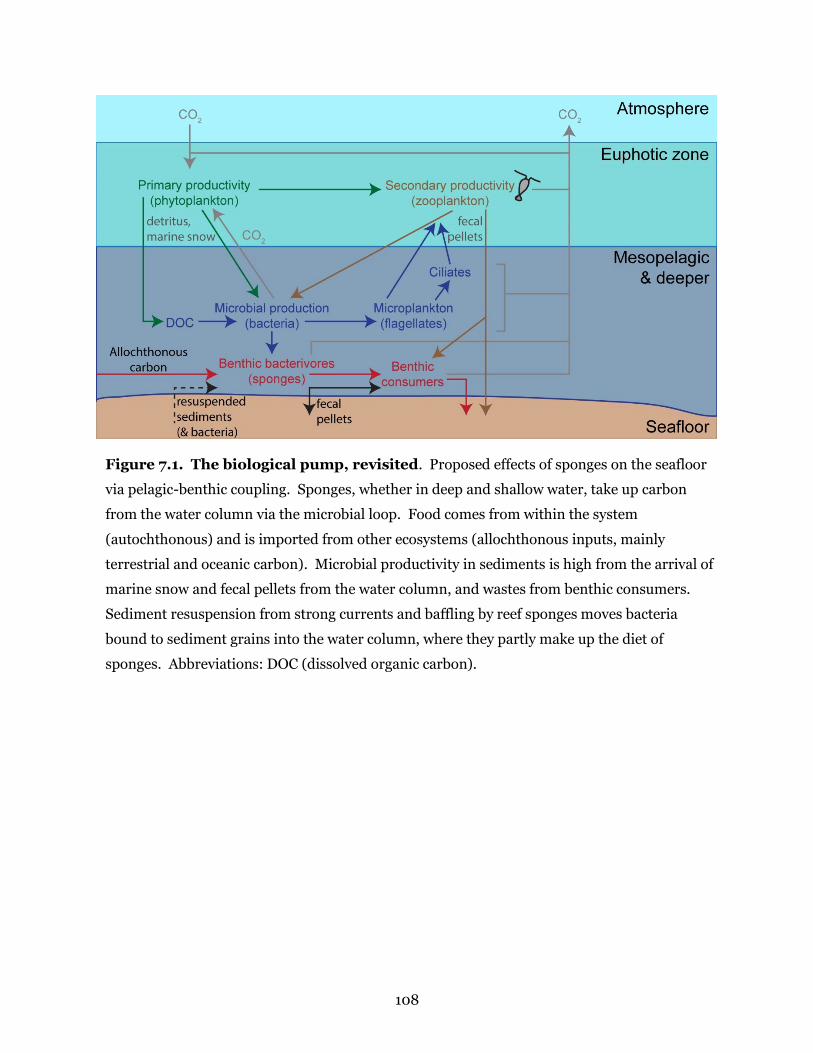
108
Figure 7.1. The biological pump, revisited. Proposed effects of sponges on the seafloor
via pelagic-benthic coupling. Sponges, whether in deep and shallow water, take up carbon
from the water column via the microbial loop. Food comes from within the system
(autochthonous) and is imported from other ecosystems (allochthonous inputs, mainly
terrestrial and oceanic carbon). Microbial productivity in sediments is high from the arrival of
marine snow and fecal pellets from the water column, and wastes from benthic consumers.
Sediment resuspension from strong currents and baffling by reef sponges moves bacteria
bound to sediment grains into the water column, where they partly make up the diet of
sponges. Abbreviations: DOC (dissolved organic carbon).

109
pellets but at a smaller scale. The research presented here suggests that deep-sea sponges may
be important contributors to closing the ‘food deficit’ for other benthic animals when
insufficient marine snow and aggregates rain from above (Smith 1987, Smith et al. 2001, Druffel
and Robison 2007).
A clear next step is to measure the nutrient fluxes from other abundant sponge species
and other suspension feeders in deep water to estimate their impact on nutrient cycling and
further study into whether they can ameliorate food-limited conditions for other animals in the
deep sea. For that work, studies could focus on other deep water sponges common in the
northeastern Pacific such as Heterochone calyx and Farrea occa, and Rhabdocalyptus
dawsoni; cold-water corals such as Primnoa sp. and Lophelia pertusa; glass sponges in
Antarctica, such as Rossella racovitzae and Rossella nuda; demosponge species from the north
Atlantic shelf such as Geodia spp., Mycale spp., and Vazella pourtalesii; and those species
found in other deep-sea monitoring sites, Hyalonema spp. and Pheronema carpenteri. In those
locations, sponge abundance and sizes can be surveyed in detail to allow measurement of fluxes
per m2, as was done for the glass sponge reefs
7.2.3. Waste excretion as a mechanism behind the sponge loop
Excretion of mucus and other waste products is a common mechanism identified for how
other filter feeders affect their surroundings. Mucus and material trapped in it was found to be
a major pathway of organic carbon release from warm- and cold-water corals and has been
suggested to fuel bacterioplankton blooms (Wild et al. 2004, Wild et al. 2008). Carbon and
nitrogen from the feces and pseudofeces released by bivalves are thought to remineralize and
enrich the water column and sediments (Smaal and Prins 1993). Discarded mucus houses of
larvaceans are major contributors to deep-sea carbon cycling (Alldredge 1972, Robison et al.
2005). Excretion of mucus and waste is a very likely mechanism for sponges too given the
considerable detritus (Reiswig 1971b, Alexander et al. 2014) and fecal pellets they produce
(Chapter 5, Wolfrath and Barthel 1989), and the low rates of cell proliferation observed (Chapter
4).
7.2.4. Conservation considerations
Glass sponge reefs are being considered for protection through Canada’s Oceans Act and
Fisheries Act because of their role as habitat-forming communities for commercially important
fisheries (Jamieson and Chew 2002). Current protections proposed by the Department of
Fisheries and Oceans place core protection zones (CPZ) around the reefs themselves but allow
fishing activity in adaptive management zones (AMZ) surrounding the CPZ as long as the fishing
activity “is not likely to result in the damage, destruction or removal of any part of the glass

110
sponge reefs” and is carried out following regulations of various fisheries acts (Department of
Fisheries and Oceans 2015).
Reef sponges can withstand grazing by their natural predators, which include
nudibranchs (Chu and Leys 2012), sea stars, and many fish (personal observation). They
cannot, however, recover from large-scale damage such as trawling (Chapter 3). Sponges did
not grow back following removal down to the sediments after three years, highlighting the
destructive impact of trawling activity on sponge reefs. Trawl scars have been found throughout
reefs in Hecate Strait and fisheries have been known to fish through reef areas with large
amounts of sponge bycatch (Krautter et al. 2001, Ardron and Jamieson 2006, Ardron et al.
2007). Not only would reef sponges be removed by trawls, but also the substrate that juveniles
settle upon would disappear so sponges would not be able to regrow (Chapter 3). Sponge
habitats elsewhere in the world have shown negligible recovery from trawling as well (Van Dolah
et al. 1987, Freese et al. 1999, Freese 2001, Wassenberg et al. 2002, Heifetz et al. 2009) and field
manipulations of sponges living in fjords suggest that reef species are equally unlikely to recover
from large-scale damage, given growth rates of 1-7 cm year-1 (Austin et al. 2007). The delicate
glass foundations of glass sponge reefs can easily be damaged, and although they have some
capacity for recovery - biannual transects across sponge reefs damaged by newly laid submarine
power transmission cables showed some recruitment and regrowth – they did not recover to the
abundance they had before disturbance, even after four years (Dunham et al. 2015).
Trawl fishing activity does occur in areas around the reefs and the sediment that is
kicked up from the trawls has long been known to have lethal and sublethal effects on sponges
(Tompkins-MacDonald and Leys 2008) with projected negative effects on reefs (Leys 2013).
The distance of the AMZ in some areas is less than 1 km from the borders of the reefs themselves
(Figure 1.4) so trawl fishing nearby could potentially raise levels of sediment above a tolerable
threshold. Reefs require a narrow range of sediments for a variety of needs: they contain a
source of food (Chapter 5), cement skeletons for more reef to form (Krautter et al. 2006), and
must be finely balanced between deposition and erosion (Chapter 3). Sediments can also cause
glass sponges to stop flagellar beating (Leys et al. 1999), which means sponges could spend less
time feeding. The effect can be substantial – the pumping rate for the tropical demosponge
Tethya crypta was effectively reduced to 51% of its maximum in response to disturbance from
winter storms (Reiswig 1971a). A change in sediment exposure from nearby trawling could
move levels outside of an acceptable range and could affect pelagic-benthic coupling and other
ecosystem functions by the reefs.

111
7.3. Cell turnover: methodological considerations
The effect of filter feeding by sponges on their surroundings is undeniable. The ‘sponge
loop’ was originally presented as a model to explain how dissolved organic carbon is moved into
the food web by sponges (with the help of symbionts) in oligotrophic coral reefs (De Goeij et al.
2013), and can apply to other forms of carbon that are unusable by other animals as well
(bacterioplankton in the case of many other sponges including those in the sponge reefs).
However, the original mechanism suggested to power the sponge loop, rapid cell shedding (De
Goeij et al. 2009, Alexander et al. 2014), has been continually assumed without being critically
evaluated and is not well supported. The core assumption that cell proliferation equates to cell
shedding has never been confirmed. Detritus has been found in canals of H. caerulea and
others (De Goeij et al. 2009, Alexander et al. 2014, Maldonado 2015) but it has never been
ascertained whether choanocytes make up a large part of it. Autophagy and recycling of cellular
contents is a more common mechanism used in tissues to limit cell populations in Hydra (Bosch
and David 1984) and was suggested previously for sponges (Reiswig 1971b).
Even if cells are shed, three main criticisms of this mechanism arise: 1) quantification of
the sponge loop was calculated based on the cell turnover rate of a single species at one moment
in time, 2) there are several concerns with the methodology involved in measuring cell turnover,
and 3) the energetics of frequently replacing cells are untenable for a sponge.
7.3.1. Variable cell proliferation between and within species
Halisarca caerulea is a tropical sponge that grows in crevices of coral reefs where flow
and space are limited (Richter et al. 2001, De Goeij et al. 2008a, De Goeij et al. 2008b), yet its
cell turnover rate (5.4 h) was thought to be constant and representative of other sponges and
was used to justify cell shedding as the mechanism behind the sponge loop. Cell turnover rates
were much slower for five other species studied (Chapter 4, Shore 1971) and were even slower in
a developing sponge (Efremova and Efremov 1977). Repeat measurements of proliferation in H.
caerulea suggested differences in proliferation even occurred within that species in separate
years (De Goeij et al. 2009, Alexander et al. 2014). Turnover rates differed again when H.
caerulea had been wounded and was regenerating tissue (Alexander et al. 2015). A
standardized approach to measuring cell turnover, reproducible rates by another researcher,
and the range of possible turnover rates within and between species, is needed before any larger
assumptions can be made from those data, including being incorporated into quantification of
the sponge loop.

112
7.3.2. Methodological considerations
Approach and methodology can affect cell turnover. The uridine analog BrdU was used
to measure cell turnover in H. caerulea instead of EdU, but it is known to have toxic effects
which include being teratogenic, mutagenic, and a trigger of cell death (reviewed by Taupin
2007). It is possible that incubation in BrdU might kill cells and result in a rapid increase in cell
proliferation; a comparison between BrdU and EdU labeling in sponges needs to be tested.
Recovery time after preparing tissue pieces for incubation could also affect cell
proliferation. For H. caerulea, which typically lives in flow-restricted crevices, the move to
aquaria for a week could have triggered new growth after being moved to a large aquarium with
plenty of food and water flow from intake pipes. We chose to incubate sponges in EdU 24 h
after cutting pieces to minimize the time elapsed between sponge collection and measurement of
cell turnover rates so that estimates would reflect turnover rates in the field rather than
whatever changes might have occurred from keeping them in the laboratory. There was no way
to know whether the choanocyte populations in a sponge were still growing or had reached a
steady state except in the case where growth was known to be occurring: for example, from the
gemmules of Spongilla lacustris and the growing region of Aphrocallistes vastus (Chapter 4).
Whether the 5.4-h turnover rate of H. caerulea really reflected steady state populations or a
growing sponge cannot be known. Assumption of a population of cells that is in a steady state is
a difficult one to satisfy in general for a sponge; I propose using proliferation rates for
comparison between sponge species, since they are unaffected by whether the choanocyte
chamber is growing or in a steady state. Other methods than continuous incubations, such as
pulse-chase labelling or using multiple labels (EdU, BrdU, IdU) should also be considered to
determine the relative contribution of stem cell immigration and direct proliferation by
choanocytes in maintaining choanocyte chambers.
Several time points must be collected to calculate and compare cell turnover rates
between species. An attempt to broaden sampling beyond H. caerulea in the tropics
unfortunately assumed turnover rates could be compared between a single time point (6 h,
Alexander et al. 2014), but as outlined in Figure 4.1 cell populations with different turnover rates
could have the same proportion of cells label at a single time point. Future study of cell turnover
is certainly warranted but measurements will require a standardized method of cutting sponges,
allowing them to recover, and selecting the number of time points necessary to measure cell
turnover rates (at least three).

113
7.3.3. Energetic costs of rapid cell shedding
Cells are energetically expensive and shedding that occurs as quickly as proposed for H.
caerulea would involve replacing about 1/3 of its body per day. A study testing whether coral
mucus is a source of carbon into the ‘sponge loop’ cited a similar number, that sponges are
“effectively turning over up to 35% of their body C per day” (Rix et al. 2016). This by itself is an
expensive proposition, especially since roughly 28% of food energy consumed by a sponge is put
toward filter feeding (Leys et al. 2011). If 35% of energy is also put toward choanocyte turnover
as they suggest (assuming that energy is equal to the amount of carbon consumed, which is
likely a substantial underestimate), then only 37% of the total energy eaten by the sponge
remains for all other processes including growth, reproduction, producing spicules, and myriad
others. Cells in any phase of the mitotic cycle are effectively removed from the cell population
for the moment. “…When the cell is no longer quite one individual nor yet quite two, it might be
confused as well as preoccupied” and so may not carry out its needed functions while
undergoing mitosis (Mazia 1961). For choanocytes this could mean time spent not feeding, and
for archaeocyte stem cells this would pull them away from their many other functions, including
as food transporters and being able to differentiate into other cell types.
7.4. Fine control of turnover rates in sponges
It is clear that sponges are sensitive animals that respond to changes in their
environment to optimize their energetics. This was recently shown with their ability to sense
water flow in their environment (Ludeman et al. 2014), their behavioral response to increase
pumping rates to maximize feeding in stronger currents (Ludeman 2015), and now with their
ability to modify their energetic investment in cell proliferation (Chapter 4). I hypothesize that
more or less effort could be put into cell proliferation as feeding conditions become less
favorable in winter or as reproduction or growth takes precedence over maintenance. The next
logical step is performing manipulative experiments that change conditions such as
temperature, oxygen concentrations, or crowding with other sponges. This will allow us
eventually to understand the various factors that cause sponges to change their investment in
choanocyte proliferation.
The ability to regulate cell proliferation is shared with unicellular protists and with all
multicellular life. The dinoflagellates Alexandrium fundyense and Amphidinium carteri were
both found to change their rates of proliferation in different light, phosphorus, or nitrogen
conditions (Chisholm et al. 1984, Olson and Chisholm 1986, Taroncher-Oldenburg et al. 1999).
What differs in multicellular life is a finer control of proliferation for different cell populations.
While a single-celled culture could grow unchecked and likely eventually overshoot the carrying

114
capacity of environmental conditions, cell populations in a multicellular organism must be
tightly regulated so that no one population outgrows the others, otherwise it would hurt the
fitness of the whole organism (Grosberg and Strathmann 2007). It is interesting, then, that
choanocytes proliferated both by mitosis and through differentiation of stem cells from the
mesohyl. It would be informative to determine whether rates of both processes change in
response to conditions or if one is constant and the other is the rate limiting, or rate modifying,
process.
7.5. Economy in glass sponge tissue structure
The tissue of glass sponges appears to be centered around economy –tissue makes up
only 10-20% of dry weight (Chu et al. 2011) and cell turnover rates of choanoblasts were one of
the slowest rates measured among choanoblasts and choanocytes (Chapter 4). Since one
choanoblast can create several collar bodies (Chapter 6), they may not need to be replenished as
frequently as choanocytes do in other sponges, further reducing the energetic cost for building
chambers by not undergoing DNA synthesis. Growth is also localized into a growing zone (at
least for Aphrocallistes vastus), which could also involve lower investment in energy than radial
growth (Sipkema et al. 2006). Further investigation into the production of new structures will
help in understanding how syncytium form and function differs from that of analogous
structures in cellular tissue and may indicate what drove the transition from clusters of cells to
syncytial tissues in the glass sponges.
7.5.1. Archaeocytes in cellular and glass sponges
Archaeocytes in cellular sponges are active cells that move, differentiate into other cell
types, and transport phagocytized food to other cells in the body (Simpson 1984). In contrast,
archaeocytes (including choanoblasts) in glass sponges are thought to be nonmotile (Mackie and
Singla 1983), an idea supported by observations from this research. Choanoblasts were not
observed undergoing any of the same tasks that archaeocytes perform in cellular sponges except
for mitosis. Choanoblasts had a characteristic round shape with no pseudopodia stretched out
(Chapter 6) unlike archaeocytes which are highly mobile and have pseudopodia stretched in
many directions for movement (Chapter 4, Simpson 1984).
The lack of mobile archaeocytes in glass sponges may explain several differences in the
way a glass sponge functions compared to a cellular sponge, originally put forth by Mackie and
Singla (1983), and Leys (1995). Phagocytized food appeared to be transported by the trabecular
syncytium (Chapter 5) via cytoplasmic streaming instead of by archaeocytes, as also observed by
Leys (1995). Archaeocyte congeries may differentiate into spermatic cysts or oocytes (Ijima

115
1901, Boury-Esnault et al. 1999) and possibly cystencytes (Ijima 1901) but they otherwise do not
work in the same capacity as mobile, active stem cells that can migrate to regions for repair
(Alexander et al. 2015). Being syncytial may ameliorate this lack of migratory stem cells because
stem cells would not be needed to produce new syncytium through mitosis. Archaeocytes are
full of rough endoplasmic reticulum and so likely generate plenty of new tissue (Mackie and
Singla 1983) – for instance the way that choanoblasts produce collar bodies – but they do so by
producing new organelles and cell membrane rather than moving to a region and dividing.
Smaller nuclei that were scattered throughout the trabecular reticulum never took up the
EdU label (Chapter 4), confirming the hypothesis of Reiswig and Mehl (1991) and Leys (2003b)
that they were not proliferative and so do not have stem cell properties like archaeocytes. The
function of these small nuclei is not known; perhaps they are necessary for specialization of the
syncytium through localized transcription and/or translation, as has been hypothesized for
coenocytes of green algae (Coneva and Chitwood 2015 and references therein). Localization of
RNA expression through in situ hybridization would be one way to test that hypothesis,
although complications have arisen from such attempts in other sponges, especially nonspecific
labeling (Windsor 2014), so this is not a straightforward task.
An interesting puzzle that arises from the differences between archaeocytes of cellular
and syncytial sponges is what the stem cells were like in the ancestor to all sponges (given the
cellular ancestry of hexactinellid sponges; Leys 2006), or in the last common ancestor to
animals. Choanocytes that made up the chambers were thought to be pluripotent (Funayama
2010, 2013), but the finding that stem cells from the mesohyl replenish choanocyte chambers
suggests they are not (Chapter 4). Indeed, recent transcriptome analyses comparing choanocyte
populations with archaeocyte populations in the sponge Ephydatia fluviatilis further support
that archaeocytes, but not choanocytes, are stem cells in sponges. Archaeocytes had 9.5-fold
greater expression over choanocytes of 180 orthology groups associated with stem cells of the
cnidarian Hydra vulgaris and the flatworm Schmidtea mediterranea (Alié et al. 2015).
7.5.2. Flagellated chambers
Choanocyte chambers form in diverse ways in all cellular sponges. Chambers can arise
following dedifferentiation of ciliated cells from the larval surface (Leys and Degnan 2002),
from a founding archaeocyte that divides 4-5 times to produce all the cells in a chamber (Tanaka
and Watanabe 1984), through fusion of separate chambers (Tanaka and Watanabe 1984), or in
mature chambers, from stem cells migrating into chambers, which we found occurring in
Spongilla lacustris (Chapter 4). The initial stages of flagellated chamber formation in the glass
sponge, with choanoblasts replicating to form clusters and rosettes, resembled that of a

116
founding archaeocyte dividing several times to produce cells of a chamber in a cellular sponge.
In the glass sponge, the chambers then expanded to their full size in a different way from
cellular sponges, through production of many collar bodies (Chapter 6).
The many different ways that flagellated chambers could develop hints at the importance
of conservation of form in chambers. Filter feeding requires precise hydrodynamics to enable
efficient particle capture (Jørgensen 1955). The origin of flagellated chambers and their
construction differs between syncytial and cellular sponges but is constrained by the same needs
to maintain proper hydrodynamics in the aquiferous system. What could not be determined
from the morphological investigation of chamber formation investigated here were the
molecular underpinnings: did the collars and flagella arise using the same molecular
mechanisms, even though their origin and the construction of chambers differed? A very
precise method such as single-cell RNA-Seq, or targeted antibody labeling using Ef annexin,
which has been shown to label choanocytes (Funayama et al. 2005, Funayama et al. 2010), may
be a way to begin investigating the similarities and differences between how cellular and
syncytial chambers are constructed.
The other logical next step to understanding how glass sponge tissue works, and how it
evolved from a cellular ancestor, is to understand how syncytial tissue undergoes repair. EdU
labeling of proliferating nuclei primarily occurred in the growing region of Aphrocallistes vastus
(Chapter 4). Whether archaeocytes elsewhere in the tissue can be activated to proliferate and
rebuild chambers would be important to understand the potential plasticity of these stem cells.
Do choanoblasts only produce new collar bodies in mature chambers or are they latent stem
cells, awaiting a cue to become proliferative? EdU labeling on wounded Aphrocallistes vastus
would be a good way to test this, especially if done using sandwich cultures that could be
followed under a microscope in real-time (Wyeth et al. 1996).
7.6. General conclusions
Knowing the processes that feed energy into and out of both an organism and an
ecosystem is vital to understanding their function. These studies of the glass sponge reefs
demonstrate their important ecosystem functions as filter feeders but also the precise
combination of conditions necessary for a reef to form. The ecosystem functions of glass sponge
reefs are driven by their efficient particle capture and feeding and their excretion of wastes. The
anatomy and evolution of syncytial glass sponges reflects adaptations to a low-food environment
that could also reflect the conditions in which sponges and other early animals evolved.

117
Bibliography
Ackerman, J. D., M. R. Loewen, and P. F. Hamblin. 2001. Benthic-pelagic coupling over a zebra
mussel reef in western Lake Erie. Limnology and Oceanography 46:892-904.
Adams, K. J., C. S. Weiler, and L. N. Edmunds Jr. 1984. Photoperiodic control of cell division in
Euglena and Ceratium. Pages 395-430 in L. N. Edmunds Jr., editor. Cell Cycle Clocks.
Marcel Dekker, Inc., New York.
Al-Kofahi, O., R. J. Radke, S. K. Goderie, Q. Shen, S. Temple, and B. Roysam. 2006. Automated
cell lineage construction: a rapid method to analyze clonal development with murine
neural progenitor cells. Cell Cycle 5:327-335.
Albright, L. J. 1983. Influence of river-ocean plumes upon bacterioplankton production of the
Strait of Georgia, British Columbia. Marine Ecology Progress Series 12:107-113.
Alexander, B. E., M. Achlatis, R. Osinga, H. G. van der Geest, J. P. M. Cleutjens, B. Schutte, and
J. M. de Goeij. 2015. Cell kinetics during regeneration in the sponge Halisarca caerulea:
how local is the response to tissue damage? PeerJ 3:e820.
Alexander, B. E., K. Liebrand, R. Osinga, H. G. van der Geest, W. Admiraal, J. P. M. Cleutjens, B.
Schutte, F. Verheyen, M. Ribes, E. van Loon, and J. M. de Goeij. 2014. Cell turnover and
detritus production in marine sponges from tropical and temperate benthic ecosystems.
PLoS ONE 9:e109486.
Alexiades, M. R., and C. Cepko. 1996. Quantitative analysis of proliferation and cell cycle length
during development of the rat retina. Developmental Dynamics 205:293-307.
Alié, A., T. Hayashi, I. Sugimura, M. Manuel, W. Sugano, A. Mano, N. Satoh, K. Agata, and N.
Funayama. 2015. The ancestral gene repertoire of animal stem cells. Proceedings of the
National Academy of Sciences 112:E7093-E7100.
Alldredge, A. L. 1972. Abandoned larvacean houses: a unique food source in the pelagic
environment. Science 177:885-887.
Amano, S., and I. Hori. 1996. Transdifferentiation of larval flagellated cells to choanocytes in the
metamorphosis of the demosponge Haliclona permollis. Biological Bulletin 190:161-172.
Antcliffe, J. B., R. H. T. Callow, and M. D. Brasier. 2014. Giving the early fossil record of sponges
a squeeze. Biological Reviews 89:972-1004.
Ardron, J. A., and G. S. Jamieson. 2006. Reducing bycatch of corals and sponges in British
Columbia's groundfish trawl fishery through trawl fishery closures. DFO Canadian
Science Advisory Secretariat Research Document 2006/0061:ii + 23p.
Ardron, J. A., G. S. Jamieson, and D. Hangaard. 2007. Spatial identification of closures to
reduce the by-catch of corals and sponges in the groundfish trawl fishery, British

118
Columbia, Canada. Pages 157-167 in R. Y. George and S. D. Cairns, editors. Conservation
and adaptive management of seamount and deep-sea coral ecosystems. Rosenstiel
School of Marine and Atmospheric Science, University of Miami.
Arzul, G., M. Seguel, and A. Clement. 2001. Effect of marine animal excretions on differential
growth of phytoplankton species. ICES Journal of Marine Science 58:386-390.
Austin, W. C., K. W. Conway, J. V. Barrie, and M. Krautter. 2007. Growth and morphology of a
reef-forming glass sponge, Aphrocallistes vastus (Hexactinellida), and implications for
recovery from widespread trawl damage. Pages 139-145 in M. R. Custódio, G. Lôbo-
Hajdu, E. Hajdu, and G. Muricy, editors. Porifera Research - Biodiversity, Innovation
and Sustainability. Museu Nacional, Rio de Janeiro.
Bambach, R. K., A. M. Bush, and D. H. Erwin. 2007. Autecology and the filling of ecospace: key
metazoan radiations. Palaeontology 50:1-22.
Bambach, R. K., A. H. Knoll, and J. J. Sepkoski. 2002. Anatomical and ecological constraints on
Phanerozoic animal diversity in the marine realm. Proceedings of the National Academy
of Sciences of the United States of America 99:6854-6859.
Barthel, D., and J. Gutt. 1992. Sponge associations in the eastern Weddell Sea. Antarctic Science
4:137-150.
Barthel, D., and O. S. Tendal. 1994. Antarctic Hexactinellida. Koeltz Scientific Books,
Champaign, Illinois.
Barthel, D., O. S. Tendal, and H. Thiel. 1996. A wandering population of the hexactinellid
sponge Pheronema carpenteri on the continental slope off Morocco, Northwest Africa.
Marine Ecology 17:603-616.
Beaulieu, S. E. 2001a. Colonization of habitat islands in the deep sea: recruitment to glass
sponge stalks. Deep Sea Research I 48:1121-1137.
Beaulieu, S. E. 2001b. Life on glass houses: sponge stalk communities in the deep sea. Marine
Biology 138:803-817.
Becker, K. A., P. N. Ghule, J. A. Therrien, J. B. Lian, J. L. Stein, A. J. van Wijnen, and G. S. Stein.
2006. Self-renewal of human embryonic stem cells is supported by a shortened G1 cell
cycle phase. Journal of Cellular Physiology 209:883-893.
Bedard, J. 2011. Tidal interactions with local topography above a sponge reef. MSc thesis.
University of Victoria, Victoria, British Columbia, Canada.
Bell, J. J. 2002. Regeneration rates of a sublittoral demosponge. Journal of the Marine
Biological Association of the United Kingdom 82:169-170.
119
Bergen, L. G., and N. R. Morris. 1983. Kinetics of the nuclear division cycle of Aspergillus
nidulans. Journal of Bacteriology 156:155-160.
Bett, B. J., and A. L. Rice. 1992. The influence of hexactinellid sponge (Pheronema carpenteri)
spicules on the patchy distribution of macrobenthos in the Porcupine Seabight (bathyal
NE Atlantic). Ophelia 36:217-226.
Birky, C. W., R. Z. Bignami, and M. J. Bentfeld. 1967. Nuclear and cytoplasmic DNA synthesis in
adult and embryonic rotifers. Biological Bulletin 133:502-509.
Bissen, S. T., and D. A. Weisblat. 1989. The durations and compositions of cell cycles in leech,
Helobdella triserialis. Development 106:105-118.
Bosch, T. C., and C. N. David. 1984. Growth regulation in Hydra: relationship between epithelial
cell cycle length and growth rate. Developmental Biology 104:161-171.
Boury-Esnault, N., S. Efremova, C. Bézac, and J. Vacelet. 1999. Reproduction of a hexactinellid
sponge: first description of gastrulation by cellular delamination in the Porifera.
Invertebrate Reproduction & Development 35:187-201.
Brewer, B. J., E. Chlebowicz-Sledziewska, and F. W. L. 1984. Cell cycle phases in the unequal
mother/daughter cell cycles of Saccharomyces cerevisiae. Molecular and Cellular
Biology 4:2529-2531.
Brien, P. 1976. La croissance des Spongillidae. Formation des choanocytes et des spicules.
Bulletin Biologique de la France et de la Belgique 110:211-252.
Cao, H., X. Cao, X. Guan, S. Xue, and W. Zhang. 2012. High temporal variability in bacterial
community, silicatein and hsp70 expression during the annual life cycle of
Hymeniacidon sinapium (Demospongiae) in China's Yellow Sea. Aquaculture 358–
359:262-273.
Cheng, H., and C. P. Leblond. 1974. Origin, differentiation and renewal of the four main
epithelial cell types in the mouse small intestine. I. Columnar cell. American Journal of
Anatomy 141:461-479.
Cherel, Y., K. A. Hobson, F. Bailleul, and R. Groscolas. 2005. Nutrition, physiology, and stable
isotopes: new information from fasting and molting penguins. Ecology 86:2881-2888.
Chisholm, S. W., D. Vaulot, and R. J. Olson. 1984. Cell cycle controls in phytoplankton. Pages
365-394 in L. N. Edmunds Jr., editor. Cell Cycle Clocks. Marcel Dekker, Inc., New York.
Chu, J. W. F. 2010. Biological patterns and processes of glass sponge reefs. MSc thesis.
University of Alberta, Edmonton, Alberta, Canada.
Chu, J. W. F., and S. P. Leys. 2010a. Data from: High resolution mapping of community
structure in three glass sponge reefs (Porifera, Hexactinellida). Dryad Data Repository.

120
Chu, J. W. F., and S. P. Leys. 2010b. High resolution mapping of community structure in three
glass sponge reefs (Porifera, Hexactinellida). Marine Ecology Progress Series 417:97-113.
Chu, J. W. F., and S. P. Leys. 2012. The dorid nudibranchs Peltodoris lentiginosa and
Archidoris odhneri as predators of glass sponges. Invertebrate Biology 131:75-81.
Chu, J. W. F., M. Maldonado, G. Yahel, and S. P. Leys. 2011. Glass sponge reefs as a silicon sink.
Marine Ecology Progress Series 441:1-14.
Clark, M. R., A. A. Rowden, T. Schlacher, A. Williams, M. Consalvey, K. I. Stocks, A. D. Rogers,
T. D. O'Hara, M. White, T. M. Shank, and J. M. Hall-Spencer. 2010. The ecology of
seamounts: structure, function, and human impacts. Annual Review of Marine Science
2:253-278.
Coen, L. D., R. D. Brumbaugh, D. Bushek, R. Grizzle, M. W. Luckenbach, M. H. Posey, S. P.
Powers, and S. G. Tolley. 2007. Ecosystem services related to oyster restoration. Marine
Ecology Progress Series 341:303-307.
Coneva, V., and D. H. Chitwood. 2015. Plant architecture without multicellularity: quandaries
over patterning and the soma-germline divide in siphonous algae. Frontiers in Plant
Science 6:287.
Conway, K. W., J. V. Barrie, P. R. Hill, W. C. Austin, and K. Picard. 2007. Mapping sensitive
benthic habitats in the Strait of Georgia, coastal British Columbia: deep-water sponge
and coral reefs. Geological Survey of Canada, Current Research A2:6 pp.
Conway, K. W., J. V. Barrie, and M. Krautter. 2005a. Geomorphology of unique reefs on the
western Canadian shelf: sponge reefs mapped by multibeam bathymetry. Geo-Marine
Letters 25:205-213.
Conway, K. W., M. Krautter, J. V. Barrie, and M. Neuweiler. 2001. Hexactinellid sponge reefs on
the Canadian continental shelf: a unique "living fossil". Geoscience Canada 28:71-78.
Conway, K. W., M. Krautter, J. V. Barrie, F. Whitney, R. E. Thomson, H. M. Reiswig, H. Lehnert,
G. Mungov, and M. Bertram. 2005b. Sponge reefs in the Queen Charlotte Basin, Canada:
controls on distribution, growth, and development. Pages 605-621 in A. Freiwald and J.
M. Roberts, editors. Springer-Verlag, Berlin Heidelberg.
Cook, S. E. 2005. Ecology of the hexactinellid sponge reefs on the western Canadian continental
shelf. MSc thesis. University of Victoria, Victoria, British Columbia, Canada.
Cook, S. E., K. W. Conway, and B. Burd. 2008. Status of the glass sponge reefs in the Georgia
Basin. Marine Environmental Research 66 Supplem:S80-S86.
David, C. N. 1983. Cell cycle analysis of Hydra cells. Pages 157-164 in H. M. Lenhoff, editor.
Hydra: Research Methods. Plenum Press, New York.

121
Davies, A. J., G. C. A. Duineveld, M. S. S. Lavaleye, M. J. N. Bergman, H. van Haren, and J. M.
Roberts. 2009. Downwelling and deep-water bottom currents as food supply
mechanisms to the cold-water coral Lophelia pertusa (Scleractinia) at the Mingulay Reef
Complex. Limnology and Oceanography 54:620-629.
Dayton, P. K. 1979. Observations of growth, dispersal, and population dynamics of some
sponges in McMurdo Sound, Antarctica. Colloques Internationaux du C. N. R. S.
291:271-282.
Dayton, P. K., S. Kim, S. C. Jarrell, J. S. Oliver, K. Hammerstrom, J. L. Fisher, K. O'Connor, J. S.
Barber, G. Robilliard, J. Barry, A. R. Thurber, and K. Conlan. 2013. Recruitment, growth
and mortality of an Antarctic hexactinellid sponge, Anoxycalyx joubini. PLoS ONE
8:e56939.
Dayton, P. K., G. A. Robilliard, R. T. Paine, and L. B. Dayton. 1974. Biological accommodation in
the benthic community at McMurdo Sound, Antarctica. Ecological Monographs 44:105-
128.
De Goeij, J. M., A. De Kluijver, F. C. Van Duyl, J. Vacelet, R. H. Wijffels, A. F. P. M. De Goeij, J.
P. M. Cleutjens, and B. Schutte. 2009. Cell kinetics of the marine sponge Halisarca
caerulea reveal rapid cell turnover and shedding. Journal of Experimental Biology
212:3892-3900.
De Goeij, J. M., L. Moodley, M. Houtekamer, and F. C. van Duyl. 2008a. Tracing 13C-enriched
dissolved and particulate organic carbon in the bacteria-containing coral reef sponge
Halisarca caerulea: Evidence for DOM feeding. Limnology and Oceanography 53:1376-
1386.
De Goeij, J. M., H. Van Den Berg, M. M. van Oostveen, E. E. H. G. Epping, and F. C. F. van Duyl.
2008b. Major bulk dissolved organic carbon (DOC) removal by encrusting coral reef
cavity sponges. Marine Ecology Progress Series 357:139-151.
De Goeij, J. M., D. van Oevelen, M. J. A. Vermeij, R. Osinga, J. J. Middelburg, A. F. P. M. de
Goeij, and W. Admiraal. 2013. Surviving in a marine desert: the sponge loop retains
resources within coral reefs. Science 342:108-110.
Department of Fisheries and Oceans. 2015. Hecate Strait and Queen Charlotte Sound Glass
Sponge Reefs Marine Protected Areas Regulations. Canada Gazette.
Dohrmann, M., D. Janussen, J. Reitner, A. G. Collins, and G. Worheide. 2008. Phylogeny and
evolution of glass sponges (Porifera, Hexactinellida). Systematic Biology 57:388-405.

122
Donadey, C. 1978. Origine choanocytaire des cellules à inclusions de l'éponge Plakina trilopha
Schulze (Démosponge Homosclèrophoride). Comptes Rendus hebdomadaires des
séances de l'Académie des sciences. Série D, Sciences naturelles 286:519-521.
Druffel, E. R. M., and B. H. Robison. 2007. Is the deep sea on a diet? Science 284:1139-1140.
Du Preez, C., and V. Tunnicliffe. 2011. Shortspine thornyhead and rockfish (Scorpaenidae)
distribution in response to substratum, biogenic structures and trawling. Marine Ecology
Progress Series 425:217-231.
Dunham, A., J. R. Pegg, W. Carolsfeld, S. Davies, I. Murfitt, and J. Boutillier. 2015. Effects of
submarine power transmission cables on a glass sponge reef and associated megafaunal
community. Marine Environmental Research 107:50-60.
Dunn, C. W., A. Hejnol, D. Q. Matus, K. Pang, W. E. Browne, S. A. Smith, E. Seaver, G. W.
Rouse, M. Obst, G. D. Edgecombe, M. V. Sorensen, S. H. D. Haddock, A. Schmidt-
Rhaesa, A. Okusu, R. M. Kristensen, W. C. Wheeler, M. Q. Martindale, and G. Giribet.
2008. Broad phylogenomic sampling improves resolution of the animal tree of life.
Nature 452:745-749.
Eerkes-Medrano, D. I., and S. P. Leys. 2006. Ultrastructure and embryonic development of a
syconoid calcareous sponge. Invertebrate Biology 125:177-194.
Efremova, S. M., and V. I. Efremov. 1977. Proliferation cellulaire chez la larve nageante de
l'éponge d'eau douce: Baikalospongia bacillifera (Dybowski). Colloques Internationaux
du C. N. R. S. 291:59-65.
Ehrlich, H., E. Brunner, P. Simon, V. V. Bazhenov, J. P. Botting, K. R. Tabachnick, A. Springer,
K. Kummer, D. V. Vyalikh, S. L. Molodtsov, D. Kurek, M. Kammer, R. Born, A. Kovalev,
S. N. Gorb, P. G. Koutsoukos, and A. Summers. 2011. Calcite Reinforced Silica-Silica
Joints in the Biocomposite Skeleton of Deep-Sea Glass Sponges. Advanced Functional
Materials 21:3473-3481.
Ehrlich, H., R. Deutzmann, E. Brunner, E. Cappellini, H. Koon, C. Solazzo, Y. Yang, D. Ashford,
J. Thomas-Oates, M. Lubeck, C. Baessmann, T. Langrock, R. Hoffmann, G. Wörheide, J.
Reitner, P. Simon, M. Tsurkan, A. V. Ereskovsky, D. Kurek, V. V. Bazhenov, S. Hunoldt,
M. Mertig, D. V. Vyalikh, S. L. Molodtsov, K. Kummer, H. Worch, V. Smetacek, and M. J.
Collins. 2010. Mineralization of the metre-long biosilica structures of glass sponges is
templated on hydroxylated collagen. Nature Chemistry 2:1084-1088.
El-Sabaawi, R. W., A. R. Sastri, J. F. Dower, and A. Mazumder. 2010. Deciphering the seasonal
cycle of copepod trophic dynamics in the Strait of Georgia, Canada, using stable isotopes
and fatty acids. Estuaries and Coasts 33:738-752.

123
Elliott, G. R. D., and S. P. Leys. 2007. Coordinated contractions effectively expel water from the
aquiferous system of a freshwater sponge. Journal of Experimental Biology 210:3736-
3748.
Elvin, D. 1971. Growth rates of the siliceous spicules of the fresh-water sponge Ephydatia
muelleri (Lieberkuhn). Transactions of the American Microscopical Society 90:219-224.
Elvin, D. W. 1976. Seasonal growth and reproduction of an intertidal sponge, Haliclona
permollis (Bowerbank). Biological Bulletin 151:108-125.
Ermak, T. H. 1975. Cell proliferation in the digestive tract of Styela clava (Urochordata:
Ascidiacea) as revealed by autoradiography with tritiated thymidine. Journal of
Experimental Zoology 194:449-465.
Ettinger-Epstein, P., S. Whalan, C. N. Battershill, and R. de Nys. 2008. A hierarchy of settlement
cues influences larval behaviour in a coral reef sponge. Marine Ecology Progress Series
365:103-113.
Fallon, S. J., K. James, R. Norman, M. Kelly, and M. J. Ellwood. 2010. A simple radiocarbon
dating method for determining the age and growth rate of deep-sea sponges. Nuclear
Instruments and Methods in Physics Research Section B 268:1241-1243.
Fenchel, T. 1984. Suspended marine bacteria as a food source. Pages 301-315 in M. J. R.
Fasham, editor. Flows of Energy and Materials in Marine Ecosystems. Plenum Press,
New York.
Fenolio, D. B., G. O. Graening, B. A. Collier, and J. F. Stout. 2006. Coprophagy in a cave-
adapted salamander; the importance of bat guano examined through nutritional and
stable isotope analyses. Proceedings of the Royal Society of London B: Biological
Sciences 273:439-443.
Fillinger, L., D. Janussen, T. Lundälv, and C. Richter. 2013. Rapid glass sponge expansion after
climate-induced antarctic ice shelf collapse. Current Biology 23:1330-1334.
Fjerdingstad, E. J. 1961. The ultrastructure of choanocyte collars in Spongilla lacustris (L.).
Zeitschrift für Zellforschung 53:645-657.
Fornari, D. J., S. E. Humphris, and M. R. Perfit. 1997. Deep submergence science takes a new
approach. Eos, Transactions American Geophysical Union 78:402-408.
Freese, J. L. 2001. Trawl-induced damage to sponges observed from a research submersible.
Maritime Fisheries Review 63:7-13.
Freese, L., P. J. Auster, J. Heifetz, and B. L. Wing. 1999. Effects of trawling on seafloor habitat
and associated invertebrate taxa in the Gulf of Alaska. Marine Ecology Progress Series
182:119-126.

124
Frost, T. M. 1982. Population dynamics and standing biomass of the freshwater sponge
Spongilla lacustris. Ecology 63:1203-1210.
Frost, T. M., and C. E. Williamson. 1980. In situ determination of the effect of symbiotic algae
on the growth of the fresh water sponge Spongilla lacustris. Ecology 61:1361-1370.
Fukuda, R., H. Ogawa, T. Nagata, and I. Koike. 1998. Direct determination of carbon and
nitrogen contents of natural bacterial assemblages in marine environments. Applied and
Environmental Microbiology 64:3352-3358.
Funayama, N. 2010. The stem cell system in demosponges: Insights into the origin of somatic
stem cells. Development, Growth & Differentiation 52:1-14.
Funayama, N. 2013. The stem cell system in demosponges: suggested involvement of two types
of cells: archeocytes (active stem cells) and choanocytes (food-entrapping flagellated
cells). Development Genes and Evolution 223:23-38.
Funayama, N., M. Nakatsukasa, T. Hayashi, and K. Agata. 2005. Isolation of the choanocyte in
the fresh water sponge, Ephydatia fluviatilis and its lineage marker, Ef annexin.
Development, growth & differentiation 47:243-253.
Funayama, N., M. Nakatsukasa, K. Mohri, Y. Masuda, and K. Agata. 2010. Piwi expression in
archeocytes and choanocytes in demosponges: insights into the stem cell system in
demosponges. Evolution & Development 12:275-287.
Futuyma, D. J., and G. Moreno. 1988. The evolution of ecological specialization. Annual Review
of Ecology and Systematics 19:207-233.
Gannes, L. Z., D. M. O’Brien, and C. M. del Rio. 1997. Stable isotopes in animal ecology:
Assumptions, caveats, and a call for more laboratory experiments. Ecology 78:1271-1276.
Genin, A., P. K. Dayton, P. F. Lonsdale, and F. N. Spiess. 1986. Corals on seamount peaks
provide evidence of current acceleration over deep-sea topography. Nature 322:59-61.
Genin, A., S. G. Monismith, M. A. Reidenbach, G. Yahel, and J. R. Koseff. 2009. Intense benthic
grazing of phytoplankton in a coral reef. Limnology and Oceanography 54:938-951.
Ghiold, J. 1991. The sponges that spanned Europe. New Scientist 129:58-62.
Gili, J.-M., and R. Coma. 1998. Benthic suspension feeders: their paramount role in littoral
marine food webs. Trends in Ecology & Evolution 13:316-321.
Gilis, M., P. Gosselin, P. Dubois, and P. Willenz. 2011. Seasonal modifications and
morphogenesis of the hypercalcified sponge Petrobiona massiliana (Calcarea,
Calcaronea). Invertebrate Biology 130:193-210.
Gillooly, J. F., J. H. Brown, G. B. West, V. M. Savage, and E. L. Charnov. 2001. Effects of size
and temperature on metabolic rate. Science 293:2248-2251.

125
Gillooly, J. F., A. Hayward, C. Hou, and J. G. Burleigh. 2012. Explaining differences in the
lifespan and replicative capacity of cells: a general model and comparative analysis of
vertebrates. Proceedings of the Royal Society B: Biological Sciences 279:3976-3980.
Gobel, Y. 1993. Gibt es Unterschiede in den Grobenspektren der von verschiedenen
Schwammarten aufgenommenen Partikel? MSc thesis. Christian-Albrechts-Universitat,
Kiel, Germany.
Goodman, L. A. 1962. The variance of the product of K random variables. Journal of the
American Statistical Association 57:54-60.
Grosberg, R. K., and R. R. Strathmann. 2007. The evolution of multicellularity: a minor major
transition? Annual Review of Ecology, Evolution, and Systematics 38:621-654.
Guiguet, M., J.-J. Kupiec, and J. Valleron. 1984. A systematic study of the variability of cell cycle
phase durations in experimental mammalian systems. Pages 97-112 in L. N. Edmunds
Jr., editor. Cell Cycle Clocks. Marcel Dekker, Inc., New York.
Hadas, E., M. Shpigel, and M. Ilan. 2009. Particulate organic matter as a food source for a coral
reef sponge. Journal of Experimental Biology 212:3643-3650.
Harris, P., and G. Shaw. 1984. Intermediate filaments, microtubules and microfilaments in
epidermis of sea urchin tube foot. Cell and Tissue Research 236:27-33.
Harrison, F. W. 1974. Histology and histochemistry of developing outgrowths of Corvomeyenia
carolinensis Harrison (Porifera: Spongillidae). Journal of Morphology 144:185-194.
Heifetz, J., R. P. Stone, and S. K. Shotwell. 2009. Damage and disturbance to coral and sponge
habitat of the Aleutian Archipelago. Marine Ecology Progress Series 397:295-303.
Hobson, K. A., R. T. Alisauskas, and R. G. Clark. 1993. Stable-nitrogen isotope enrichment in
avian tissues due to fasting and nutritional stress: implications for isotopic analyses of
diet. The Condor 95:388-394.
Hogg, M. M., O. S. Tendal, K. W. Conway, S. A. Pomponi, R. W. M. van Soest, J. Gutt, M.
Krautter, and J. M. Roberts. 2010. Deep-sea Sponge Grounds: Reservoirs of Biodiversity.
UNEP-WCMC Biodiversity Series No. 32. UNEP-WCMC, Cambridge, UK.
Holstein, T. W., and C. N. David. 1990. Cell cycle length, cell size, and proliferation rate in
Hydra stem cells. Developmental Biology 142:392-400.
Hutchinson, G. E. 1957. Concluding remarks. Cold Spring Harbor Symposia on Quantitative
Biology 22:415-427.
Ijima, I. 1901. Studies on the Hexactinellida. Contribution 1 (Euplectellidae). The Journal of the
College of Science, Imperial University of Tokyo, Japan 15:1-299.

126
Iken, K., T. Brey, U. Wand, J. Voigt, and P. Junghans. 2001. Food web structure of the benthic
community at the Porcupine Abyssal Plain (NE Atlantic): a stable isotope analysis.
Progress in Oceanography 50:383-405.
Ilan, M., J. Aizenberg, and O. Gilor. 1996. Dynamics and Growth Patterns of Calcareous Sponge
Spicules. Proceedings of the Royal Society B: Biological Sciences 263:133-139.
Jamieson, G. S., and L. Chew. 2002. Hexactinellid sponge reefs: Areas of interest as marine
protected areas in the north and central coast areas.
Jimenez, E., and M. Ribes. 2007. Sponges as a source of dissolved inorganic nitrogen :
Nitrification mediated by temperate sponges. Limnology and Oceanography 52:948-
958.
Jimenez Tejero, E. 2011. Nutrient fluxes in marine sponges: methodology, geographical
variability and the role of associated microorganisms.
Johannessen, S. C., R. W. Macdonald, and D. W. Paton. 2003. A sediment and organic carbon
budget for the greater Strait of Georgia. Estuarine, Coastal and Shelf Science 56:845-
860.
Johannessen, S. C., M. C. O'Brien, K. L. Denman, and R. W. Macdonald. 2005. Seasonal and
spatial variations in the source and transport of sinking particles in the Strait of Georgia,
British Columbia, Canada. Marine Geology 216:59-77.
Johannessen, S. C., G. Potentier, C. A. Wright, D. Masson, and R. W. Macdonald. 2008. Water
column organic carbon in a Pacific marginal sea (Strait of Georgia, Canada). Marine
Environmental Research 66 Supplem:S49-S61.
Jones, C. G., J. H. Lawton, and M. Shachak. 1994. Organisms as ecosystem engineers. Oikos
69:373-386.
Jones, N. L., J. K. Thompson, K. R. Arrigo, and S. G. Monismith. 2009. Hydrodynamic control
of phytoplankton loss to the benthos in an estuarine environment. Limnology and
Oceanography 54:952-969.
Jørgensen, C. B. 1955. Quantitative aspects of filter feeding in invertebrates. Biological Reviews
30:391-453.
Kaandorp, J. A. 1999. Morphological analysis of growth forms of branching marine sessile
organisms along environmental gradients. Marine Biology 134:295-306.
Kaandorp, J. A., and P. M. A. Sloot. 2001. Morphological models of radiate accretive growth and
the influence of hydrodynamics. Journal of Theoretical Biology 209:257-274.

127
Kahn, A. S., H. A. Ruhl, and K. L. Smith Jr. 2012. Temporal changes in deep-sea sponge
populations are correlated to changes in surface climate and food supply. Deep-Sea
Research I 70:36-41.
Kahn, A. S., G. Yahel, J. W. F. Chu, V. Tunnicliffe, and S. P. Leys. 2015. Benthic grazing and
carbon sequestration by deep-water glass sponge reefs. Limnology and Oceanography
60:78-88.
Katz, S., W. Klepal, and M. Bright. 2011. The Osedax trophosome: organization and
ultrastructure. Biological Bulletin 220:128-139.
King, N. 2004. The unicellular ancestry of animal development. Developmental Cell 7:313-325.
King, N., C. T. Hittinger, and S. B. Carroll. 2003. Evolution of key cell signaling and adhesion
protein families predates animal origins. Science 301:361-363.
Krautter, M., K. W. Conway, and J. V. Barrie. 2006. Recent hexactinosidan sponge reefs (silicate
mounds) off British Columbia, Canada: frame-building processes. Journal of
Paleontology 80:38-48.
Krautter, M., K. W. Conway, J. V. Barrie, and M. Neuweiler. 2001. Discovery of a “living
dinosaur”: globally unique modern hexactinellid sponge reefs off British Columbia,
Canada. Facies 44:265-282.
Kuwae, T., and Y. Hosokawa. 1999. Determination of abundance and biovolume of bacteria in
sediments by dual staining with 4′,6-diamidino-2-phenylindole and acridine orange:
relationship to dispersion treatment and sediment characteristics. Applied and
Environmental Microbiology 65:3407-3412.
Legendre, L., and J. Le Fèvre. 1995. Microbial food webs and the export of biogenic carbon in
oceans. Aquatic Microbial Ecology 9:69-77.
Lehnert, H., K. W. Conway, J. V. Barrie, and M. Krautter. 2005. Desmacella austini sp. nov.
from sponge reefs off the Pacific coast of Canada. Contributions to Zoology 74:265-270.
Leibson, N. L., and L. T. Frolova. 1994. Winter-spring essential reorganization of cell
proliferation in the digestive tract epithelia in the mussel Crenomytilus grayanus.
Marine Biology 118:471-477.
Leinfelder, R. R., M. Krautter, R. Laternser, M. Nose, D. U. Schmid, W. Werner, H. Keupp, H.
Brugger, R. Herrrnann, U. Rehfeld-Kiefer, J. H. Schroeder, C. Reinhold, R. Koch, A.
Zeiss, V. Schweizer, H. Christmann, G. Menges, and H. Luterbacher. 1994. The origin of
Jurassic reefs: current research and developments and results. Facies 31:1-56.
Leinfelder, R. R., W. Werner, M. Nose, D. U. Schmid, M. Krautter, R. Laternser, M. Takacs, and
D. Hartmann. 1996. Paleoecology, growth parameters and dynamics of coral, sponge and

128
microbolite reefs from the Late Jurassic. Research Reports. - Gottinger Arb. Geol.
Palaont. Sb2:227-248.
Leys, S. P. 1995. Cytoskeletal architecture and organelle transport in giant syncytia formed by
fusion of hexactinellid sponge tissues. Biological Bulletin 188:241.
Leys, S. P. 1999. The choanosome of hexactinellid sponges. Invertebrate Biology 118:221-235.
Leys, S. P. 2003a. Comparative study of spiculogenesis in demosponge and hexactinellid larvae.
Microscopy Research and Technique 62:300-311.
Leys, S. P. 2003b. The significance of syncytial tissues for the position of the Hexactinellida in
the Metazoa. Integrative and Comparative Biology 43:19-27.
Leys, S. P. 2006. Embryogenesis in the glass sponge Oopsacas minuta: Formation of syncytia by
fusion of blastomeres. Integrative and Comparative Biology 46:104-117.
Leys, S. P. 2013. Effects of sediment on glass sponges (Porifera, Hexactinellida) and projected
effects on glass sponge reefs. Canadian Science Advisory Secretariat 2013/074:29 pp.
Leys, S. P., and B. M. Degnan. 2002. Embryogenesis and metamorphosis in a haplosclerid
demosponge: gastrulation and transdifferentiation of larval ciliated cells to choanocytes.
Invertebrate Biology 121:171-189.
Leys, S. P., and D. I. Eerkes-Medrano. 2006. Feeding in a calcareous sponge: particle uptake by
pseudopodia. Biological Bulletin 211:157-171.
Leys, S. P., and N. R. J. Lauzon. 1998. Hexactinellid sponge ecology: growth rates and
seasonality in deep water sponges. Journal of Experimental Marine Biology and Ecology
230:111-129.
Leys, S. P., and G. O. Mackie. 1997. Electrical recording from a glass sponge. Nature 387:29-30.
Leys, S. P., G. O. Mackie, and R. W. Meech. 1999. Impulse conduction in a sponge. Journal of
Experimental Biology 202:1139-1150.
Leys, S. P., G. O. Mackie, and H. M. Reiswig. 2007. The biology of glass sponges. Advances in
Marine Biology 52:1-145.
Leys, S. P., and H. M. Reiswig. 1998. Transport pathways in the neotropical sponge Aplysina.
Biological Bulletin 195:30-42.
Leys, S. P., K. Wilson, C. Holeton, H. M. Reiswig, W. C. Austin, and V. Tunnicliffe. 2004.
Patterns of glass sponge (Porifera, Hexactinellida) distribution in coastal waters of
British Columbia, Canada. Marine Ecology Progress Series 283:133-149.
Leys, S. P., G. Yahel, M. A. Reidenbach, V. Tunnicliffe, U. Shavit, and H. M. Reiswig. 2011. The
sponge pump: the role of current induced flow in the design of the sponge body plan.
PLoS ONE 6:e27787.

129
Lösekann, T., A. Robador, H. Niemann, K. Knittel, A. Boetius, and N. Dubilier. 2008.
Endosymbioses between bacteria and deep-sea siboglinid tubeworms from an Arctic
Cold Seep (Haakon Mosby Mud Volcano, Barents Sea). Environmental Microbiology
10:3237-3254.
Lucas, L. V., J. E. Cloern, J. K. Thompson, and N. E. Monsen. 2002. Functional variability of
habitats within the Sacramento-San Joaquin delta: restoration implications. Ecological
Applications 12:1528-1547.
Ludeman, D. A. 2015. Sponges as sensitive animals: sensory systems and energetics of filtration
in demosponges. MSc thesis. University of Alberta, Edmonton, AB.
Ludeman, D. A., N. Farrar, A. Riesgo, and S. P. Leys. 2014. Evolutionary origins of sensation in
metazoans: functional evidence for a new sensory organ in sponges. BMC Evolutionary
Biology 14.
Mackie, G. 1981. Plugged syncytial interconnections in hexactinellid sponges. Journal of Cell
Biology 91:A103-A103.
Mackie, G. O., I. D. Lawn, and M. Pavans De Ceccatty. 1983. Studies on hexactinellid sponges.
II. Excitability, conduction and coordination of responses in Rhabdocalyptus dawsoni
(Lambe, 1873). Philosophical Transactions of the Royal Society of London Series B,
Biological Sciences 301:401-418.
Mackie, G. O., and C. L. Singla. 1983. Studies on hexactinellid sponges. I. Histology of
Rhabdocalyptus dawsoni (Lambe, 1873). Philosophical Transactions of the Royal
Society of London. Series B. Biological Sciences 301:365-400.
Mah, J. L., K. K. Christensen-Dalsgaard, and S. P. Leys. 2014. Choanoflagellate and choanocyte
collar-flagellar systems and the assumption of homology. Evolution and Development
16:25-37.
Maldonado, M. 2015. Sponge waste that fules marine oligotrophic food webs: a re-assessment of
its origin and nature. Marine Ecology.
Maldonado, M., L. Navarro, A. Grasa, A. Gonzalez, and I. Vaquerizo. 2011. Silicon uptake by
sponges: a twist to understanding nutrient cycling on continental margins. Scientific
Reports 1:30.
Maldonado, M., M. Ribes, and F. C. Van Duyl. 2012. Nutrient fluxes through sponges: biology,
budgets, and ecological implications. Advances in Sponge Science: Physiology, Chemical
and Microbial Diversity, Biotechnology 62:113-182.

130
Marliave, J. B., K. W. Conway, D. M. Gibbs, A. Lamb, and C. Gibbs. 2009. Biodiversity and
rockfish recruitment in sponge gardens and bioherms of southern British Columbia,
Canada. Marine Biology 156:2247-2254.
Martínez-Expósito, M. J., J. J. Pasantes, and J. Méndez. 1994. Proliferation kinetics of mussel
(Mytilus galloprovincialis) gill cells. Marine Biology 120:41-45.
Masson, D. 2002. Deep water renewal in the Strait of Georgia. Estuarine, Coastal and Shelf
Science 54:115-126.
Masson, D. 2006. Seasonal water mass analysis for the Straits of Juan de Fuca and Georgia.
Atmosphere-Ocean 44:1-15.
Mazia, D. 1961. Mitosis and the Physiology of Cell Division. Pages 77-412 in J. Mirsky and A. E.
Brachet, editors. The Cell. Academic Press.
McClain, C. R., A. P. Allen, D. P. Tittensor, and M. A. Rex. 2012. Energetics of life on the deep
seafloor. Proceedings of the National Academy of Sciences of the United States of
America 109:15366-15371.
McClelland, J. W., I. Valiela, and R. H. Michener. 1997. Nitrogen-stable isotope signatures in
estuarine food webs: A record of increasing urbanization in coastal watersheds.
Limnology and Oceanography 42:930-937.
McClintock, J. B. 1987. Investigation of the relationship between invertebrate predation and
biochemical composition, energy content, spicule armament and toxicity of benthic
sponges at McMurdo Sound, Antarctica. Marine Biology 94:479-487.
McClintock, J. B., C. D. Amsler, B. J. Baker, and R. W. M. van Soest. 2005. Ecology of Antarctic
marine sponges: An overview. Integrative and Comparative Biology 45:359-368.
McDonald, S. A., and A. J. Durston. 1984. The cell cycle and sorting behaviour in Dictyostelium
discoideum. Journal of Cell Science 66:195-204.
Mehl, D., I. Müller, and W. E. G. Müller. 1998. Molecular biological and paleontological
evidence that Eumetazoa, including Porifera (sponges), are of monophyletic origin.
Pages 133-156 in Y. Watanabe and N. Fusetani, editors. Sponge Sciences:
Multidisciplinary Perspectives. Springer-Verlag, Tokyo.
Miller, R. J., J. Hocevar, R. P. Stone, and D. V. Fedorov. 2012. Structure-forming corals and
sponges and their use as fish habitat in Bering Sea submarine canyons. PLoS ONE
7:e33885-e33885.
Moroz, L. L. 2015. Convergent evolution of neural systems in ctenophores. Journal of
Experimental Biology 218:598-611.
131
Newmark, P. A., and A. Sánchez Alvarado. 2000. Bromodeoxyuridine specifically labels the
regenerative stem cells of planarians. Developmental Biology 220:142-153.
Nowakowski, R. S., S. B. Lewin, and M. W. Miller. 1989. Bromodeoxyuridine
immunohistochemical determination of the lengths of the cell cycle and the DNA-
synthetic phase for an anatomically defined population. Journal of Neurocytology
18:311-318.
Odum, E. P. 1968. Energy flow in ecosystems: A historical review. American Zoologist 8:11-18.
Odum, H. T. 1956. Efficiencies, size of organisms, and community structure. Ecology 37:592-
597.
Odum, H. T., and E. P. Odum. 1955. Trophic structure and productivity of a windward coral reef
community on Eniwetok Atoll. Ecological Monographs 25:291-320.
Ogawa, M., T. Kuramochi, S. Takayama, D. Tanimoto, and T. Naganuma. 2005. Inferring the
feeding habit of the deep-sea ‘big mouth’ ascidian tunicate, Megalodicopia hians, by
fatty acid analysis. Aquatic Ecosystem Health & Management 8:185-193.
Okuyama, M., Y. Saito, M. Ogawa, A. Takeuchi, Z. Jing, T. Naganuma, and E. Hirose. 2002.
Morphological studies on the bathyal ascidian, Megalodicopia hians Oka 1918
(Octacnemidae, Phlebobranchia), with remarks on feeding and tunic morphology.
Zoological Science 19:1181-1189.
Olson, R. J., and S. W. Chisholm. 1986. Effects of light and nitrogen limitation on the cell cycle
of the dinoflagellate Amphidinium carteri. Journal of Plankton Research 8:785-793.
Otto, J. J., and R. D. Campbell. 1977. Tissue economics of Hydra: regulation of cell cycle, animal
size and development by controlled feeding rates. Journal of Cell Science 28:117-132.
Palumbi, S. R. 1984. Tactics of acclimation: morphological changes of sponges in an
unpredictable environment. Science 225:1478-1480.
Palumbi, S. R. 1986. How body plans limit acclimation: Responses of a demosponge to wave
force. Ecology 67:208-214.
Pellettieri, J., and A. S. Alvarado. 2007. Cell turnover and adult tissue homeostasis: from
humans to planarians. Annual Review of Genetics 41:83-105.
Perez, T. 1996. La rétention de particules par une éponge hexactinellide, Oopsacas minuta
(Leucopsacidae): Le rôle du réticulum. Comptes Rendus de l'Academie de Sciences Paris,
Sciences de la Vie 319:385-391.
Petrovic, A. G., C. L. Oudet, and J. J. Stutzmann. 1984. Temporal organization of rat and human
skeletal cells: Circadian frequency and quantization of cell generation time. Pages 325-
350 in L. N. Edmunds Jr., editor. Cell Cycle Clocks. Marcel Dekker, Inc., New York.

132
Pflugfelder, B., S. C. Cary, and M. Bright. 2009. Dynamics of cell proliferation and apoptosis
reflect different life strategies in hydrothermal vent and cold seep vestimentiferan
tubeworms. Cell and Tissue Research 337:149-165.
Philippe, H., R. Derelle, P. Lopez, K. Pick, C. Borchiellini, N. Boury-Esnault, J. Vacelet, E.
Renard, E. Houliston, E. Quéinnec, C. Da Silva, P. Wincker, H. Le Guyader, S. P. Leys, D.
J. Jackson, F. Schreiber, D. Erpenbeck, B. Morgenstern, G. Wörheide, and M. Manuel.
2009. Phylogenomics revives traditional views on deep animal relationships. Current
Biology 19:706-712.
Pietsch, T. W. 1976. Dimorphism, parasitism and sex: reproductive strategies among deepsea
ceratioid anglerfishes. Copeia 1976:781-793.
Pile, A., and C. Young. 2006. The natural diet of a hexactinellid sponge: Benthic–pelagic
coupling in a deep-sea microbial food web. Deep Sea Research Part I: Oceanographic
Research Papers 53:1148-1156.
Pile, A. J., M. R. Patterson, M. Savarese, V. I. Chernykh, and V. A. Fialkov. 1997. Trophic effects
of sponge feeding within Lake Baikal's littoral zone. 2. Sponge abundance, diet, feeding
efficiency, and carbon flux. Limnology and Oceanography 42:178-184.
Pisani, D., W. Pett, M. Dohrmann, R. Feuda, O. Rota-Stabelli, H. Philippe, N. Lartillot, and G.
Wörheide. 2015. Genomic data do not support comb jellies as the sister group to all other
animals. Proceedings of the National Academy of Sciences 112:15402-15407.
Polis, G. A., and S. D. Hurd. 2011. Linking marine and terrestrial food webs: allochthonous input
from the ocean supports high secondary productivity on small islands and coastal land
communities. American Naturalist 147:396-423.
Poole, R. K. 1984. Is energy metabolism in the prokaryotic cell cycle manifestly coupled to a
clock? Pages 193-208 in L. N. Edmunds Jr., editor. Cell Cycle Clocks. Marcel Dekker,
Inc., New York.
Post, D. M. 2002. Using stable isotopes to estimate trophic position: models, methods, and
assumptions. Ecology 83:703-718.
Prescott, D. M., R. F. Kimball, and R. F. Carrier. 1962. Comparison between the timing of
micronuclear and macronuclear DNA synthesis in Euplotes eurystomus. The Journal of
Cell Biology 13:175-176.
Puig, P., M. Canals, J. B. Company, J. Martín, D. Amblas, G. Lastras, A. Palanques, and A. M.
Calafat. 2012. Ploughing the deep sea floor. Nature 489:286-289.
Rasmont, R. 1961. Une technique de culture des éponges d'eau douce en milieu contrôlé.
Annales de la Societe Royale Zoologique de Belgique 91:149-155.

133
Reid, R. E. H. 2003. Hexactinellida: General morphology and classification. Pages 127-134 in R.
L. Kaesler, editor. Treatise on Invertebrate Paleontology, Part E, Porifera, Revised, Vol.
2: Introduction to the Porifera. The Geological Society of America, Boulder, Colorado.
Reiswig, H. M. 1971a. In situ pumping activities of tropical Demospongiae. Marine Biology 9:38-
50.
Reiswig, H. M. 1971b. Particle feeding in natural populations of three marine demosponges.
Biological Bulletin 141:568-591.
Reiswig, H. M. 1973. Population dynamics of three Jamaican demospongiae. Bulletin of Marine
Science 23:191-226.
Reiswig, H. M. 1974. Water transport, respiration and energetics of three tropical marine
sponges. Journal of Experimental Marine Biology and Ecology 14:231-249.
Reiswig, H. M. 1975a. The aquiferous systems of three marine Demospongiae. Journal of
Morphology 145:493-502.
Reiswig, H. M. 1975b. Bacteria as food for temperate-water marine sponges. Canadian Journal
of Zoology 53:582-589.
Reiswig, H. M. 1981. Partial carbon and energy budgets of the bacteriosponge Verongia
fistularis (Porifera: Demospongiae) in Barbados. Marine Ecology 2:273-293.
Reiswig, H. M. 1990. In situ feeding in two shallow-water hexactinellid sponges. Pages 504-510
in K. Rützler, editor. New Perspectives in Sponge Biology. Smithsonian Institution Press,
Washington, D.C.
Reiswig, H. M., and M. Kelly. 2011. The marine fauna of New Zealand: Hexasterophoran glass
sponges of New Zealand (Porifera: Hexactinellida: Hexasterophora): Orders
Hexactinosida, Aulocaycoida, and Lychniscosida. NIWA Biodiversity Memoir 124:176.
Reiswig, H. M., and D. Mehl. 1991. Tissue organization of Farrea occa (Porifera,
Hexactinellida). Zoomorphology 110:301-311.
Rice, A. L., M. H. Thurston, and A. L. New. 1990. Dense aggregations of a hexactinellid sponge,
Pheronema carpenteri, in the Porcupine Seabight (northeast Atlantic Ocean), and
possible causes. Progress In Oceanography 24:179-196.
Richardson, J. S., and R. J. Mackay. 1991. Lake outlets and the distribution of filter feeders: An
assessment of hypotheses. Oikos 62:370-380.
Richardson, K., L. Jarett, and E. Finke. 1960. Embedding in epoxy resins for ultrathin sectioning
in electron microscopy. Stain Technology 35:313-323.

134
Richter, C., M. Wunsch, M. Rasheed, I. Kötter, and M. I. Badran. 2001. Endoscopic exploration
of Red Sea coral reefs reveals dense populations of cavity-dwelling sponges. Nature
413:726-730.
Riisgård, H. U., and P. S. Larsen. 2000. Comparative ecophysiology of active zoobenthic filter
feeding, essence of current knowledge. Journal of Sea Research 44:169-193.
Rivin, C. J., and W. L. Fangman. 1980. Cell cycle phase expansion in nitrogen-limited cultures of
Saccharomyces cerevisiae. The Journal of Cell Biology 85:96-107.
Rix, L., J. M. de Goeij, C. E. Mueller, U. Struck, J. J. Middelburg, F. C. van Duyl, F. A. Al-Horani,
C. Wild, M. S. Naumann, and D. van Oevelen. 2016. Coral mucus fuels the sponge loop in
warm- and cold-water coral reef ecosystems. Scientific Reports 6:18715.
Robison, B. H. 1999. The coevolution of undersea vehicles and deep-sea research. Marine
Technology Society Journal 33:65-73.
Robison, B. H., K. R. Reisenbichler, and R. E. Sherlock. 2005. Giant larvacean houses: rapid
carbon transport to the deep sea floor. Science 308:1609-1611.
Rouse, G. W., S. K. Goffredi, and R. C. Vrijenhoek. 2004. Osedax: bone-eating marine worms
with dwarf males. Science 305:668-671.
Savarese, M., M. R. Patterson, V. I. Chernykh, and V. A. Fialkov. 1997. Trophic effects of sponge
feeding within Lake Baikal's littoral zone. 1. In situ pumping rates. Limnology and
Oceanography 42:171-178.
Schindelin, J., I. Arganda-Carreras, E. Frise, V. Kaynig, M. Longair, T. Pietzsch, S. Preibisch, C.
Rueden, S. Saalfeld, B. Schmid, J.-Y. Tinevez, D. J. White, V. Hartenstein, K. Eliceiri, P.
Tomancak, and A. Cardona. 2012. Fiji: an open-source platform for biological-image
analysis. Nature Methods 9:676-682.
Schneider, C. A., W. S. Rasband, and K. W. Eliceiri. 2012. NIH Image to ImageJ: 25 years of
image analysis. Nature Methods 9:671-675.
Schröder, H. C., F. Natalio, I. Shukoor, W. Tremel, U. Schlossmacher, X. Wang, and W. E. G.
Müller. 2007. Apposition of silica lamellae during growth of spicules in the demosponge
Suberites domuncula: biological/biochemical studies and chemical/biomimetical
confirmation. Journal of Structural Biology 159:325-334.
Sethmann, I., and G. Wörheide. 2008. Structure and composition of calcareous sponge spicules:
A review and comparison to structurally related biominerals. Micron 39:209-228.
Shore, R. E. 1971. Growth and renewal studies of the choanocyte population in Hymeniacidon
sinapium (Porifera: Demospongiae) using Colcemid and 3-H thymidine. Journal of
Experimental Biology 177:359-364.

135
Simpson, T. L. 1984. The Cell Biology of Sponges. Springer Verlag, New York.
Simpson, T. L., and C. A. Vaccaro. 1974. An ultrastructural study of silica deposition in the
freshwater sponge Spongilla lacustris. Journal of Ultrastructure Research 47:296-309.
Sipkema, D., N. a. M. Yosef, M. Adamczewski, R. Osinga, D. Mendola, J. Tramper, and R. H.
Wijffels. 2006. Hypothesized kinetic models for describing the growth of globular and
encrusting demosponges. Marine Biotechnology 8:40-51.
Smaal, A. C., and T. C. Prins. 1993. The uptake of organic matter and the release of inorganic
nutrients by bivalve suspension feeder beds. Pages 271-298 in R. F. Dame, editor. Bivalve
Filter Feeders: in Estuarine and Coastal Ecosystem Processes. Springer Berlin
Heidelberg, Berlin, Heidelberg.
Smith, K., C. Clifford, A. Eliason, B. Walden, G. Rowe, and J. Teal. 1976. A free vehicle for
measuring benthic community metabolism. Limnology and Oceanography 21:164-170.
Smith, K., G. White, and M. Laver. 1979a. Oxygen uptake and nutrient exchange of sediments
measured in situ using a free vehicle grab respirometer. Deep Sea Research Part A.
Oceanographic Research Papers 26:337-346.
Smith, K., G. White, M. Laver, R. McConnaughey, and J. Meador. 1979b. Free vehicle capture of
abyssopelagic animals. Deep Sea Research Part A. Oceanographic Research Papers
26:57-64.
Smith, K. L. 1987. Food energy supply and demand: A discrepancy between particulate organic
carbon flux and sediment community oxygen consumption in the deep ocean. Limnology
and Oceanography 32:201-220.
Smith, K. L., R. S. Kaufmann, R. J. Baldwin, and A. F. Carlucci. 2001. Pelagic-benthic coupling
in the abyssal Eastern North Pacific: an 8-year time-series study of food supply and
demand. Limnology and Oceanography 46:543-556.
Stone, R. P., K. W. Conway, D. J. Csepp, and J. V. Barrie. 2014. The Boundary Reefs: glass
sponge (Porifera: Hexactinellida) reefs on the international border between Canada and
the USA. U.S. Department of Commerce, NOAA Technical Memorandum NMFS-AFSC-
264:31.
Strathmann, R. R., J. M. Staver, and J. R. Hoffman. 2002. Risk and the evolution of cell-cycle
durations of embryos. Evolution 56:708-720.
Sutton, J. N., S. C. Johannessen, and R. W. Macdonald. 2013. A nitrogen budget for the Strait of
Georgia, British Columbia. Biogeosciences Discussions 10:7135-7169.

136
Takahashi, T., R. Nowakowski, and V. Caviness. 1993. Cell cycle parameters and patterns of
nuclear movement in the neocortical proliferative zone of the fetal mouse. The Journal of
Neuroscience 13:820-833.
Tanaka, K., and Y. Watanabe. 1984. Choanocyte differentiation and morphogenesis of
choanocyte chambers in the fresh-water sponge, Ephydatia fluviatilis, after reversal of
developmental arrest caused by hydroxyurea. Zoological Science 1:561-570.
Taroncher-Oldenburg, G., D. M. Kulis, and D. M. Anderson. 1999. Coupling of saxitoxin
biosynthesis to the G1 phase of the cell cycle in the dinoflagellate Alexandrin fundyense:
temperature and nutrient effects. Natural Toxins 7:207-219.
Taupin, P. 2007. BrdU immunohistochemistry for studying adult neurogenesis: Paradigms,
pitfalls, limitations, and validation. Brain Research Reviews 53:198-214.
Taylor, J. R. 1997. An introduction to error analysis. 2nd edition. University Science Books.
Thurber, A. R. 2007. Diets of Antarctic sponges: links between the pelagic microbial loop and
benthic metazoan food web. Marine Ecology Progress Series 351:77-89.
Tompkins-MacDonald, G. J., and S. P. Leys. 2008. Glass sponges arrest pumping in response to
sediment: implications for the physiology of the hexactinellid conduction system. Marine
Biology 154:973-984.
Turner, J. T. 2015. Zooplankton fecal pellets, marine snow, phytodetritus and the ocean’s
biological pump. Progress in Oceanography 130:205-248.
Tyson, J. J., and W. Sachsenmaier. 1984. The control of nuclear division in Physarum
polycephalum. Pages 253-270 in L. N. Edmunds Jr., editor. Cell Cycle Clocks. Marcel
Dekker, Inc., New York.
Underwood, A. J. 1994. On beyond BACI: Sampling designs that might reliably detect
environmental disturbances. Ecological Applications 4:3-15.
Uriz, M.-J. 2006. Mineral skeletogenesis in sponges. Canadian Journal of Zoology 84:322-356.
Uriz, M.-J., X. Turon, M. A. Becerro, and G. Agell. 2003. Siliceous spicules and skeleton
frameworks in sponges: origin, diversity, ultrastructural patterns, and biological
functions. Microscopy Research and Technique 62:279-299.
Uriz, M. J., M. Maldonado, X. Turon, and R. Marti. 1998. How do reproductive output, larval
behaviour, and recruitment contribute to adult spatial patterns in Mediterranean
encrusting sponges? Marine Ecology Progress Series 167:137-148.
Vacelet, J., and N. Boury-Esnault. 1995. Carnivorous sponges. Nature 373:333-335.

137
Vacelet, J., N. Boury-Esnault, and J.-G. Harmelin. 1994. Hexactinellid cave, a unique deep-sea
habitat in the scuba zone. Deep Sea Research Part I: Oceanographic Research Papers
41:965-973.
Vacelet, J., A. Fiala-Medioni, C. R. Fisher, and N. Boury-Esnault. 1996. Symbiosis between
methane-oxidizing bacteria and a deep-sea carnivorous cladorhizid sponge. Marine
Ecology Progress Series 145:77-85.
Van'T Hof, J. 1965. Relationships between mitotic cycle duration, S period duration and the
average rate of DNA synthesis in the root meristem cells of several plants. Experimental
Cell Research 39:48-58.
Van Dolah, R. F., P. H. Wendt, and N. Nicholson. 1987. Effects of a research trawl on a hard-
bottom assemblage of sponges and corals. Fisheries Research 5:39-54.
Van Soest, R. W. M., N. Boury-Esnault, J. Vacelet, M. Dohrmann, D. Erpenbeck, N. J. De Voogd,
N. Santodomingo, B. Vanhoorne, M. Kelly, and J. N. a. Hooper. 2012. Global Diversity of
Sponges (Porifera). PLoS ONE 7:e35105.
Wang, X., M. Wiens, H. C. Schröder, K. P. Jochum, U. Schlossmacher, H. Götz, H. Duschner,
and W. E. G. Müller. 2011. Circumferential spicule growth by pericellular silica
deposition in the hexactinellid sponge Monorhaphis chuni. Journal of Experimental
Biology 214:2047-2056.
Wassenberg, T. J., G. Dews, and S. D. Cook. 2002. The impact of fish trawls on megabenthos
(sponges) on the north-west shelf of Australia. Fisheries Research 58:141-151.
Weaver, J. C., J. Aizenberg, G. E. Fantner, D. Kisailus, A. Woesz, P. Allen, K. Fields, M. J. Porter,
F. W. Zok, P. K. Hansma, P. Fratzl, and D. E. Morse. 2007. Hierarchical assembly of the
siliceous skeletal lattice of the hexactinellid sponge Euplectella aspergillum. Journal of
Structural Biology 158:93-106.
Whelan, N. V., K. M. Kocot, L. L. Moroz, and K. M. Halanych. 2015. Error, signal, and the
placement of Ctenophora sister to all other animals. Proceedings of the National
Academy of Sciences 112:5773-5778.
Whitehouse, M. J., A. Atkinson, and A. P. Rees. 2011. Close coupling between ammonium
uptake by phytoplankton and excretion by Antarctic krill, Euphausia superba. Deep Sea
Research Part I: Oceanographic Research Papers 58:725-732.
Whitman, W. B., D. C. Coleman, and W. J. Wiebe. 1998. Prokaryotes: The unseen majority.
Proceedings of the National Academy of Sciences 95:6578-6583.

138
Whitney, F., K. Conway, R. Thomson, V. Barrie, M. Krautter, and G. Mungov. 2005.
Oceanographic habitat of sponge reefs on the Western Canadian Continental Shelf.
Continental Shelf Research 25:211-226.
Wild, C., M. Huettel, A. Klueter, S. G. Kremb, M. Y. Rasheed, and B. B. Jørgensen. 2004. Coral
mucus functions as an energy carrier and particle trap in the reef ecosystem. Nature
428:66-70.
Wild, C., C. Mayr, L. Wehrmann, S. Schöttner, M. Naumann, F. Hoffmann, and H. T. Rapp.
2008. Organic matter release by cold water corals and its implication for fauna–microbe
interaction. Marine Ecology Progress Series 372:67-75.
Willenz, P., and G. van de Vyver. 1986. Ultrastructural evidence of extruding exocytosis of
residual bodies in the freshwater sponge Ephydatia fluviatilis. Journal of Morphology
190:307-318.
Windsor, P. J. 2014. Evolution of the sponge body plan: Wnt and the development of polarity in
freshwater sponges. PhD thesis. University of Alberta, Edmonton.
Wolfrath, B., and D. Barthel. 1989. Production of faecal pellets by the marine sponge
Halichondria panicea Pallas (1766). Journal of Experimental Marine Biology and
Ecology 129:81-94.
Wyeth, R. C. 1999. Video and electron microscopy of particle feeding in sandwich cultures of the
hexactinellid sponge, Rhabdocalyptus dawsoni. Invertebrate Biology 118:236-242.
Wyeth, R. C., S. P. Leys, and G. O. Mackie. 1996. Use of sandwich cultures for the study of
feeding in the hexactinellid sponge Rhabdocalyptus dawsoni (Lambe, 1892). Acta
Zoologica 77:227-232.
Yahel, G., D. I. Eerkes-Medrano, and S. P. Leys. 2006. Size independent selective filtration of
ultraplankton by hexactinellid glass sponges. Aquatic Microbial Ecology 45:181-194.
Yahel, G., F. Whitney, H. M. Reiswig, D. I. Eerkes-Medrano, and S. P. Leys. 2007. In situ feeding
and metabolism of glass sponges (Hexactinellida, Porifera) studied in a deep temperate
fjord with a remotely operated submersible. Limnology and Oceanography 52:428-440.
Yahel, G., R. Yahel, T. Katz, B. Lazar, B. Herut, and V. Tunnicliffe. 2008. Fish activity: a major
mechanism for sediment resuspension and organic matter remineralization in coastal
marine sediments. Marine Ecology Progress Series 372:195-209.
Yin, K., P. J. Harrison, R. H. Goldblatt, M. a. St.John, and R. J. Beamish. 1997. Factors
controlling the timing of the spring bloom in the Strait of Georgia estuary, British
Columbia, Canada. Canadian Journal of Fisheries and Aquatic Sciences 54:1985-1995.

139
Zachleder, V., and H. Van Den Ende. 1992. Cell cycle events in the green alga Chlamydomonas
eugametos and their control by environmental factors. Journal of Cell Science 102:469-
474.
Zaldibar, B., I. Cancio, and I. Marigómez. 2004. Circatidal variation in epithelial cell
proliferation in the mussel digestive gland and stomach. Cell and Tissue Research
318:395-402.

140
Appendix 1
This supplemental table accompanies Chapter 2. Benthic grazing and carbon sequestration by
deep-water glass sponge reefs.
Table S1.7.1. Geographical regions with high densities of glass sponges.
Taxa Location
Density
(sponges m-2) Source
Glass sponge reefs NE Pacific 23-46 (Conway et al. 2005a)
Fjord glass sponges NE Pacific fjords 24 (Leys et al. 2004)
Antarctic demosponges Weddell Sea 2 (Barthel and Gutt 1992)
Pheronema carpenteri Porcupine Seabight 1.5 (Rice et al. 1990)
Various glass sponges Pribilof Canyon, Bering Sea 0.4 (Miller et al. 2012)
Rossella racovitzae Weddell Sea 0.23 (Barthel and Tendal 1994)
Hyalonema sp. Station M 0.02-0.03 (Beaulieu 2001b)
Various glass sponges Eastern Gulf of Alaska 0-0.12 (Miller et al. 2012)

141
Appendix 2
These figures accompany Chapter 3. Dynamic change, recruitment, and resilience in reef-
forming glass sponges.
Figure S2.1. Two putative embryos found in tissue of a single specimen of
Aphrocallistes vastus collected in November 1995. A. Two putative embryos amongst
flagellated chambers of the sponge. B. Closer view of one of the possible embryos, showing a
pointed anterior end and a yolk-filled posterior end. C. Cilia lining the outside of the embryos.
Scale bars: A: 10 cm, B: 10 cm, C: 5 µm.
Figure S2.2. Mean (± SE) changes in sediment height were measured using sediment
poles surveyed between 2005 and 2013. Not all poles could be visited during each research
cruise. Changes in sediment height were compared between poles deployed at Fraser or
Galiano reefs (A), and between poles deployed among or outside of patches of reef (B).
Supplemental Material S2.3. High-definition videos of structure-from-motion 3D
models of BACI experiments are available on ERA. Each video file is named depending on
site [impacted site either before (BI) or after (AI) damage, and two control sites, C1 and C2]
and year surveyed (2011, 2013, and 2014).

142
Appendix 3
These figures accompany Chapter 4. Cell replacement in sponges sheds light on stem cell
origins in Metazoa.
Figure S3.1. Choanocytes move as a unit and in this instance a choanocyte chamber
(pseudocolored orange) was being pulled by a cell from the mesohyl that attached to it with
two pseudopodia (pseudocolored green). Scale bar: 25 µm.
Figure S3.2. Sponges incubated in bacteria-enriched seawater produced brown
detritus in their tanks whereas those in filtered seawater produced less detritus.
A. Haliclona permollis, an intertidal demosponge. B. Haliclona mollis, a subtidal
demosponge. Arrows point to the brown detritus, which was often found near the oscula of the
sponges. Scale bars: 1 cm.

143
Table S3.1. Cell cycle lengths harvested from the literature for a variety of cell types from mature and
larval/embryonic animals, plants, unicellular eukaryotes, bacteria, and syncytial tissues. Relevant notes are listed in the notes
section. References match those listed in Figure 4.6.
Species Kingdom group cell type Tc (h) Notes Reference
Mature animal tissue
Spongilla lacustris Animalia Porifera choanocyte 159 this study
Sycon coactum Animalia Porifera choanocyte 30.2 this study
Haliclona mollis Animalia Porifera choanocyte 176 this study
Aphrocallistes vastus Animalia Porifera choanoblast 170 this study
Spongilla lacustris
(gemmule)
Animalia Porifera choanocyte 34.3 this study
Hymeniacidon sinapium Animalia Porifera choanocyte 20-40 (Shore 1971)
Halisarca caerulea Animalia Porifera choanocyte 5.4 (De Goeij et al.
2009)
Hydra attenuata Animalia Cnidaria epithelial cell 96-168 Longer cell cycle during food-poor or
starved conditions.
(Bosch and David
1984)
Hydra oligactis Animalia Cnidaria interstitial stem cells 43.2-96 (Holstein and David
1990)
Mytilus
galloprovincialis
Animalia Mollusca,
Bivalvia
gill cell 24-30 (Martínez-Expósito
et al. 1994)
Mytilus
galloprovincialis
Animalia Mollusca,
Bivalvia
epithelia (stomach &
digestive gland)
12 Tides drive rhythm of cell cycle. (Zaldibar et al.
2004)
Riftia pachyptila Animalia Annelida epidermis 6 Hydrothermal vent worm (Pflugfelder et al.
2009)

144
Species Kingdom group cell type Tc (h) Notes Reference
Riftia pachyptila Animalia Annelida peripheral
trophosome
6 Hydrothermal vent worm (Pflugfelder et al.
2009)
Riftia pachyptila Animalia Annelida median trophosome 3 Hydrothermal vent worm (Pflugfelder et al.
2009)
Riftia pachyptila Animalia Annelida central trophosome 1 Hydrothermal vent worm (Pflugfelder et al.
2009)
Lamellibrachia luymesi Animalia Annelida epidermis 3 Cold seep worm (Pflugfelder et al.
2009)
Lamellibrachia luymesi Animalia Annelida peripheral
trophosome
3 Cold seep worm (Pflugfelder et al.
2009)
Lamellibrachia luymesi Animalia Annelida median trophosome 3 Cold seep worm (Pflugfelder et al.
2009)
Lamellibrachia luymesi Animalia Annelida central trophosome 3 Cold seep worm (Pflugfelder et al.
2009)
Styela clava Animalia Chordata,
Tunicata
epithelial cells of
stomach &
esophagus
420 Funnel epithelium of dorsal tubercle,
lip epithelium of dorsal tubercle,
mucus cells of esophagus, crest
population of stomach, groove
population of stomach
(Ermak 1975)
Styela clava Animalia Chordata,
Tunicata
intestinal & rectal
epithelia
840 Intestinal epithelium, rectal
epithelium
(Ermak 1975)
Styela clava Animalia Chordata,
Tunicata
Cells of endostyle &
esophagus
several
months
Zone 1 of endostyle, band cells of
esophagus
(Ermak 1975)
Mus musculus Animalia Chordata, mouse duodenal crypt 10.4-13.5 Reviewed by
(Guiguet et al. 1984)

145
Species Kingdom group cell type Tc (h) Notes Reference
Mus musculus Animalia Chordata, mouse colon 20.9-21.8 Reviewed by
(Guiguet et al. 1984)
Mus musculus Animalia Chordata, mouse jejunal mucosa 18.75 Reviewed by (Van'T
Hof 1965)
Mus musculus Animalia Chordata, mouse colon mucosa 16 Reviewed by (Van'T
Hof 1965)
Mus musculus Animalia Chordata, mouse periodontal
fibroblasts
33.9-42.4 Reviewed by
(Guiguet et al. 1984)
Mus musculus Animalia Chordata, mouse thymus 9.4-9.6 Reviewed by
(Guiguet et al. 1984)
Mus musculus Animalia Chordata, mouse uterine cervix 22.8 Reviewed by
(Guiguet et al. 1984)
Mus musculus Animalia Chordata, mouse erythroblasts 5.3-7.3 Reviewed by
(Guiguet et al. 1984)
Mus musculus Animalia Chordata, mouse hair follicle 13 Reviewed by (Van'T
Hof 1965)
Mus musculus Animalia Chordata, mouse esophagus 181 Reviewed by (Van'T
Hof 1965)
Rattus norvegicus Animalia Chordata, rat jejunal crypt 10.0-15.5 Reviewed by
(Guiguet et al. 1984)
Rattus norvegicus Animalia Chordata, rat bone 38.1 Reviewed by
(Guiguet et al. 1984)
Rattus norvegicus Animalia Chordata, rat cartilage cells 23 Reviewed by
(Guiguet et al. 1984)
Rattus norvegicus Animalia Chordata, rat tibia cartilage 54.2 Reviewed by
(Guiguet et al. 1984)
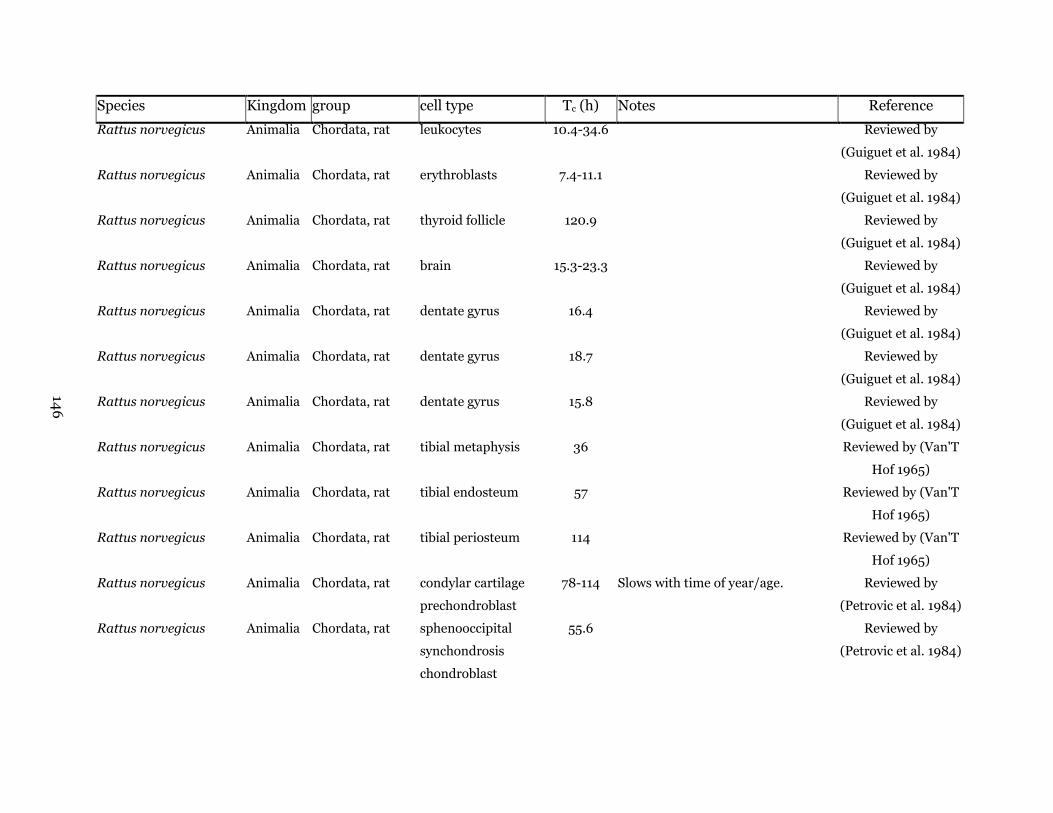
146
Species Kingdom group cell type Tc (h) Notes Reference
Rattus norvegicus Animalia Chordata, rat leukocytes 10.4-34.6 Reviewed by
(Guiguet et al. 1984)
Rattus norvegicus Animalia Chordata, rat erythroblasts 7.4-11.1 Reviewed by
(Guiguet et al. 1984)
Rattus norvegicus Animalia Chordata, rat thyroid follicle 120.9 Reviewed by
(Guiguet et al. 1984)
Rattus norvegicus Animalia Chordata, rat brain 15.3-23.3 Reviewed by
(Guiguet et al. 1984)
Rattus norvegicus Animalia Chordata, rat dentate gyrus 16.4 Reviewed by
(Guiguet et al. 1984)
Rattus norvegicus Animalia Chordata, rat dentate gyrus 18.7 Reviewed by
(Guiguet et al. 1984)
Rattus norvegicus Animalia Chordata, rat dentate gyrus 15.8 Reviewed by
(Guiguet et al. 1984)
Rattus norvegicus Animalia Chordata, rat tibial metaphysis 36 Reviewed by (Van'T
Hof 1965)
Rattus norvegicus Animalia Chordata, rat tibial endosteum 57 Reviewed by (Van'T
Hof 1965)
Rattus norvegicus Animalia Chordata, rat tibial periosteum 114 Reviewed by (Van'T
Hof 1965)
Rattus norvegicus Animalia Chordata, rat condylar cartilage
prechondroblast
78-114 Slows with time of year/age. Reviewed by
(Petrovic et al. 1984)
Rattus norvegicus Animalia Chordata, rat sphenooccipital
synchondrosis
chondroblast
55.6 Reviewed by
(Petrovic et al. 1984)

147
Species Kingdom group cell type Tc (h) Notes Reference
Rattus norvegicus Animalia Chordata, rat cultured
skeletoblasts
72-187 Reviewed by
(Petrovic et al. 1984)
Rattus norvegicus Animalia Chordata, rat cultured
prechondroblasts
19-55 Slowed with age. Reviewed by
(Petrovic et al. 1984)
Embryonic/larval animal tissue
Baikalospongia
bacillifera
Animalia Porifera choanocyte in larva 13-15 (Efremova and
Efremov 1977)
Tectura scutum Animalia Mollusca,
Gastropoda
2-4 cell stage
embryo
0.87-0.55 Reared in 10°C and 14°C (Strathmann et al.
2002)
Calliostoma ligatum Animalia Mollusca,
Gastropoda
2-4 cell stage
embryo
1.57-1.03 Reared in 10°C and 14°C (Strathmann et al.
2002)
Littorina scutulata Animalia Mollusca,
Gastropoda
2-4 cell stage
embryo
3-1.68 Reared in 10°C and 14°C (Strathmann et al.
2002)
Littorina sitkana Animalia Mollusca,
Gastropoda
2-4 cell stage
embryo
4.13-2.8 Reared in 10°C and 14°C (Strathmann et al.
2002)
Lacuna vincta or
variegata
Animalia Mollusca,
Gastropoda
2-4 cell stage
embryo
3.85-2.6 Reared in 10°C and 14°C (Strathmann et al.
2002)
Haminaea vesicula Animalia Mollusca,
Gastropoda
2-4 cell stage
embryo
3.77-1.98 Reared in 10°C and 14°C (Strathmann et al.
2002)
Haminaea callidegenita Animalia Mollusca,
Gastropoda
2-4 cell stage
embryo
10.17-4.8 Reared in 10°C and 14°C (Strathmann et al.
2002)
Helobdella triserialis Animalia Annelida,
Hirudinea
embryonic cells 4-9 From Table 1, page 112 (Bissen and Weisblat
1989)
Asplanchna brightwelli Animalia Rotifera Embryo (first 10
cleavages)
0.25-0.50 Lifespan ~4 d (Birky et al. 1967)

148
Species Kingdom group cell type Tc (h) Notes Reference
Asplanchna brightwelli Animalia Rotifera Adult/post-mitotic 0 Lifespan ~4 d (Birky et al. 1967)
Asplanchna brightwelli Animalia Rotifera Syncytial vitellarium 0 Lifespan ~4 d (Birky et al. 1967)
Terebratalia transversa Animalia Brachiopoda,
Articulata
2-4 cell stage
embryo
1.03-0.63 Reared in 10°C and 14°C (Strathmann et al.
2002)
Terebratulina unguicula Animalia Brachiopoda,
Articulata
2-4 cell stage
embryo
1.43-0.8 Reared in 10°C and 14°C (Strathmann et al.
2002)
Phoronis pallida Animalia Phoronida 2-4 cell stage
embryo
1.25-0.68 Reared in 10°C and 14°C (Strathmann et al.
2002)
Phoronis
vancouverensis
Animalia Phoronida 2-4 cell stage
embryo
2.88-2.02 Reared in 10°C and 14°C (Strathmann et al.
2002)
Luidia foliolata Animalia Echinoderm,
asteroid
2-4 cell stage
embryo
1.93 Reared in 10°C (Strathmann et al.
2002)
Evasterias troschelii Animalia Echinoderm,
asteroid
2-4 cell stage
embryo
1.5 Reared in 10°C (Strathmann et al.
2002)
Orthasterias koehleri Animalia Echinoderm,
asteroid
2-4 cell stage
embryo
2 Reared in 10°C (Strathmann et al.
2002)
Pisaster ochraceus Animalia Echinoderm,
asteroid
2-4 cell stage
embryo
1.57 Reared in 10°C (Strathmann et al.
2002)
Leptasterias hexactis Animalia Echinoderm,
asteroid
2-4 cell stage
embryo
6.55 Reared in 10°C (Strathmann et al.
2002)
Crossaster papposus Animalia Echinoderm,
asteroid
2-4 cell stage
embryo
2.03 Reared in 10°C (Strathmann et al.
2002)
Pteraster tesselatus Animalia Echinoderm,
asteroid
2-4 cell stage
embryo
1.68 Reared in 10°C (Strathmann et al.
2002)
Henricia leviuscula Animalia Echinoderm,
asteroid
2-4 cell stage
embryo
1.98 Reared in 10°C (Strathmann et al.
2002)

149
Species Kingdom group cell type Tc (h) Notes Reference
Henricia sp. (gray
armpit)
Animalia Echinoderm,
asteroid
2-4 cell stage
embryo
1.73 Reared in 10°C (Strathmann et al.
2002)
Henricia sp. (brooder) Animalia Echinoderm,
asteroid
2-4 cell stage
embryo
2.93 Reared in 10°C (Strathmann et al.
2002)
Oikopleura dioica Animalia Chordata,
Tunicata
2-4 cell stage
embryo
0.33-0.23 Reared in 10°C and 14°C (Strathmann et al.
2002)
Corella inflata Animalia Chordata,
Tunicata
2-4 cell stage
embryo
0.87-0.58 Reared in 10°C and 14°C (Strathmann et al.
2002)
Ascidia paratropa Animalia Chordata,
Tunicata
2-4 cell stage
embryo
1.08-0.7 Reared in 10°C and 14°C (Strathmann et al.
2002)
Boltenia villosa Animalia Chordata,
Tunicata
2-4 cell stage
embryo
0.92-0.59 Reared in 10°C and 14°C (Strathmann et al.
2002)
Mus musculus Animalia Chordata, mouse neural progenitor
cell
8-18 (Al-Kofahi et al.
2006)
Mus musculus Animalia Chordata, mouse fetal neocortex
(cerebral wall)
15.1 (Takahashi et al.
1993)
Rattus norvegicus Animalia Chordata, rat retina during
development
14-55 (Alexiades and
Cepko 1996)
Homo sapiens Animalia Chordata, human embryonic stem cell 15-16 (Becker et al. 2006)
Homo sapiens Animalia Chordata, human normablast 15-18 Reviewed by (Van'T
Hof 1965)
Unicellular Eukaryotes
Amphidinium carteri Protista dinoflagellate Whole cell 27 (Olson and
Chisholm 1986)

150
Species Kingdom group cell type Tc (h) Notes Reference
Amphidinium carteri Protista dinoflagellate Light-limited 82 Cell volume also decreased with light
limitation.
(Olson and
Chisholm 1986)
Amphidinium carteri Protista dinoflagellate N-limited 139 (Olson and
Chisholm 1986)
Alexandrium fundyense Protista dinoflagellate Whole (strain
GtCA29)
60-150 Varies depending on temperature &
phosphorus.
(Taroncher-
Oldenburg et al.
1999)
Chlamydomonas
eugametos
Plantae unicellular green
algae
Whole cell 20-48 High temperatures = longer cell cycle
& larger cells
(Zachleder and Van
Den Ende 1992)
Saccharomyces
cerevisiae
Fungiae yeast Whole cell 1.65-2.37 (Brewer et al. 1984)
Saccharomyces
cerevisiae
Fungiae yeast Whole cell 2.1 Good N source (ammonia) (Rivin and Fangman
1980)
Saccharomyces
cerevisiae
Fungiae yeast Whole cell 1.8 Good N source (glutamine) (Rivin and Fangman
1980)
Saccharomyces
cerevisiae
Fungiae yeast Whole cell 6.7 Poor N source (proline) (Rivin and Fangman
1980)
Aspergillus nidulans Fungiae ascomycete
(filamentous
fungus)
Whole cell 1.5-2 (Bergen and Morris
1983)
Euglena gracilis Protista euglena Whole cell 24-30 Reviewed by (Adams
et al. 1984)
Monosiga brevicollis Protista Choanoflagellata Whole cell 6 (King et al. 2003)
Physarum
polycephalum
Fungiae Myxomycete
(slime mold)
syncytial
plasmodium
8-12 Reviewed by (Tyson
and Sachsenmaier
1984)

151
Species Kingdom group cell type Tc (h) Notes Reference
Dictyostelium
discoideum
Fungiae slime mold cell 9 (McDonald and
Durston 1984)
Euplotes eurystomus Protista ciliated protozoan syncytial
macronuclei
14 Divides amitotically. (Prescott et al. 1962)
Euplotes eurystomus Protista ciliated protozoan syncytial
micronuclei
14 Divides while macronucleus is also
dividing.
(Prescott et al. 1962)
Bacteria
Salmonella Bacteria bacterium Whole cell 0.42 Reviewed by (Van'T
Hof 1965)
Escherichia coli Bacteria bacterium Whole cell 0.67-1.5 Reviewed by (Poole
1984)
Alcaligenes eutrophus Bacteria bacterium Whole cell 1.267 Reviewed by (Poole
1984)
Bacillus subtilis Bacteria bacterium Whole cell 1.33 Reviewed by (Poole
1984)

152
Appendix 4
These supplemental tables accompany Chapter 5. Feeding and excretion by the glass sponge
Aphrocallistes vastus.
Table S4.1. Results of post-hoc Bonferroni tests comparing δ13C and δ15N values
from sponge tissue collected from (A) Fraser and (B) Galiano reefs in 2007, 2009, 2011, and
2014. (C) Bonferroni post-hoc tests were also used to compare δ13C and δ15N values between
different sampling locations (Fraser Reef; Howe Reef, Galiano Reef, and outside of the SoG
(Non-SoG). Statistically significant p-values (α=0.05) are in bold.
A.
Fraser Reef: overall p=0.000 2007 2009 2011 2014
2007 - 1.00
0 0.00
1 0.091
15N 2009
0.000 -
0.000
0.035
2011 0.00
0 0.59
8 - 0.60
4
2014 0.00
0 1.00
0 0.713 - 13C
B.
Galiano Reef: overall p=0.000 2007 2009 2011 2014 2007 - 0.000 0.000 0.001
15N 2009 0.025 - 0.015 0.002 2011 1.000 0.000 - 0.870 2014 0.000 0.073 0.000 - 13C
C.
By reef (sponge tissue): overall p=0.000
Fraser Galiano Howe Non-SoG
Fraser - 0.000 1.000 0.002 15N Galiano 0.000 - 0.000 1.000
Howe 0.569 0.000 - 0.020 Non-SoG 0.000 1.000 0.002 - 13C

153
Appendix 5
This figure accompanies Chapter 6. Spicule and flagellated chamber formation in a growth zone
of Aphrocallistes vastus.
Figure S5.1. Sperm found near a flagellated chamber. A. Sperm (sp) were visible
extruding out of a spermatocysts near a chamber. B. Closer view shows that collar bodies (cb)
were surrounding the area that sperm were extruded into. Scale bars: A. 10 µm; B. 5 µm.