Sumaiya Farzana - ERA
102
Dynamics of spontaneous initial spreading and spreading of a hydrodynamically driven droplet under the influence of surrounding pressure by Sumaiya Farzana A thesis submitted in partial fulfillment of the requirements for the degree of Master of Science Department of Mechanical Engineering University of Alberta © Sumaiya Farzana, 2021
-
Upload
khangminh22 -
Category
Documents
-
view
0 -
download
0
Transcript of Sumaiya Farzana - ERA
Dynamics of spontaneous initial spreading and spreading of a hydrodynamically driven droplet
under the influence of surrounding pressure
by
Sumaiya Farzana
A thesis submitted in partial fulfillment of the requirements for the degree of
Master of Science
Department of Mechanical Engineering
University of Alberta
© Sumaiya Farzana, 2021
ii
Abstract
We investigate experimentally the early time dynamics of spontaneous spreading of silicone oils
with various viscosities at elevated surrounding pressures. The surrounding medium pressure is
increased in a monotone fashion starting from atmospheric pressure to a maximum value of 30
megapascal (MPa) above atmospheric conditions in 10 MPa increments. We conduct our analysis
using four grades of silicone oils namely: D10, N35, S60, and D500 and study their spreading
behavior on Polytetrafluoroethylene (PTFE) substrates. Once contact with the substrate is
established, the three-phase contact lines which form at the intersection of the solid, liquid, and
gas phases advance rapidly to reduce the droplet’s surface energy. Experimental observations
which are conducted using a high-speed camera and a drop shape analyzer reveal three distinct
regimes of spreading: an initial spreading regime, a short but intermediate transition regime
followed by a late-stage viscous regime. The results from these experiments are analyzed in terms
of the temporal evolution of the contact radius, contact line velocities, and droplet contact angle.
In addition, we analyze the pressure effects on the onset of the transition regime and the empirically
obtained spreading exponent. Our observations show that the early time spreading dynamics
conform themselves to a power law where the empirically obtained exponent concomitant to
spreading is a strong function of pressure. More specifically, a rise in pressure decreases the
spreading exponent in the inertial regime. Additionally, an increase of pressure reduces the onset
time of the transition regime as well as spreading velocities. This is due to increased viscous
dissipation at the contact line which enables a quick conversion to the transition regime. We also
propose a theoretical model for investigating the spreading behavior of hydrodynamically driven
droplets on a solid substrate under various surrounding pressures. By combining the extended
Overall Energy Balance (OEB) approach and the Lucas empirical model for estimating drop
iii
viscosity at elevated pressures, we predict the advancement of a liquid droplet on a solid substrate
as it undergoes constant mass flux addition while maintaining a spherical cap. For validation, we
conduct an experimental investigation on a spreading droplet while considering the addition of
mass over time in atmospheric pressure and surrounding gauge pressures of 10 and 20 MPa. We
analyze the results of the pressure effects on the spreading droplet whose primary driving force is
hydrodynamic in terms of the advancing contact angle, increase of volume over time, and
spreading radius of water on four different substrates namely: Polytetrafluoroethylene (PTFE),
Aluminium (Al), Copper (Cu), and Poly (methyl methacrylate) (PMMA). The results show that an
increase in pressure during the advancing stage lowers the spreading radius and simultaneously
increases the contact angle.
iv
Preface
All work summarized in this thesis is an original work by Sumaiya Farzana under the supervision
of Dr. Prashant R Waghmare. Sumaiya Farzana was responsible for the experimental design,
conducting experiments, data analysis, data interpretation, developing the theoretical framework
and analysis, and writing the manuscripts. Dr. Prashant R Waghmare supervised all the works
presented by Sumaiya Farzana and was involved with conceptualization and editing the
manuscripts. A version of Chapter 2 of this thesis has been published to peer-reviewed journal:
Journal of Experimental Thermal and Fluid science, as “Sumaiya Farzana, Ryan Baily, Prashant
R. Waghmare, Study of Early Time Dynamics of Drop Spreading in Different Surrounding
Pressure”. For the study of Chapter 2, Ryan Baily was involved with the necessary revisions of the
manuscript and was involved in providing assistance in the experimental setup. Chapter 3 of this
thesis has been submitted to peer-reviewed journal: Physics of Fluids, for publication as “Sumaiya
Farzana, Prashant R. Waghmare, Dynamics of spreading of a hydrodynamically driven droplet
under the influence of surrounding pressure”. Dr. Aleksey Baldygin was involved with the
development of the dosing system (Syringe pump, 100DM, ISCO) used in conducting the
experiments of Chapter 3 and was also involved with the necessary revisions of the manuscript.
v
Acknowledgement
First and foremost, praises and thanks to the one and only Almighty for guiding me through all the
difficulties and without whom I would not be able to reach this point in life. I would like to express
the deepest appreciation to my supervisor, Dr. Prashant R. Waghmare for giving me the
opportunity to conduct research and for providing invaluable guidance and advice throughout my
research project. It is my privilege to thank Dr. Waghmare, Dr. Morris Flynn, and Dr. Alexandra
Komrakova for the knowledge I gained during the coursework of my master’s degree. I would like
to thank my thesis defense committee examiners, Dr. Chun Il Kim, Dr. Lindsey Westover, and Dr.
Japan Trivedi for devoting time for my master defense and reviewing my thesis.
In addition, I would like to thank all the members of the interfacial Science and Surface
Engineering Lab. Special thanks to Dr. Aleksey Baldygin, Ryan Baily, and Eileen Santos in
training me on the High-pressure unit and other instruments for doing the experiments. A special
thanks goes to Abrar Ahmed for his inspiration and support during my research. I would like to
extend my special thanks to Raviraj Gajbhiye and Palak Jain for making my journey memorable.
I am extremely grateful to my parents Md Ishaque Dewan and Hosneara Begum for their love,
prayers and sacrifices they made for me and my success. I am very much thankful to my elder
brothers- Md. Ali Asraf Dewan, Dr. Ali Akber Dewan, my elder sister Kamrun Nahar, sister-in-
laws, my nieces and nephews for their continuous support, prayers, and inspiration. I am very
much thankful to my husband Md. Imran Khan for his constant encouragement and support
throughout my master’s degree.
vi
Table of Contents
1. Introduction ..................................................................................................................................... 1
1.1 Aim of the present work ........................................................................................................... 4
1.2 Influence of pressure on early time dynamics of drop spreading................................................ 5
1.2.1 Literature review .............................................................................................................. 5
1.2.2 Applications ..................................................................................................................... 8
1.3 Influence of surrounding pressure on the dynamics of spreading of a hydrodynamically driven
droplet 9
1.3.1 Literature review .............................................................................................................. 9
1.3.2 Applications ................................................................................................................... 13
1.4 Thesis outline ......................................................................................................................... 14
References ......................................................................................................................................... 16
2 Study of Early Time Dynamics of Drop Spreading in Different Surrounding Pressure .................... 21
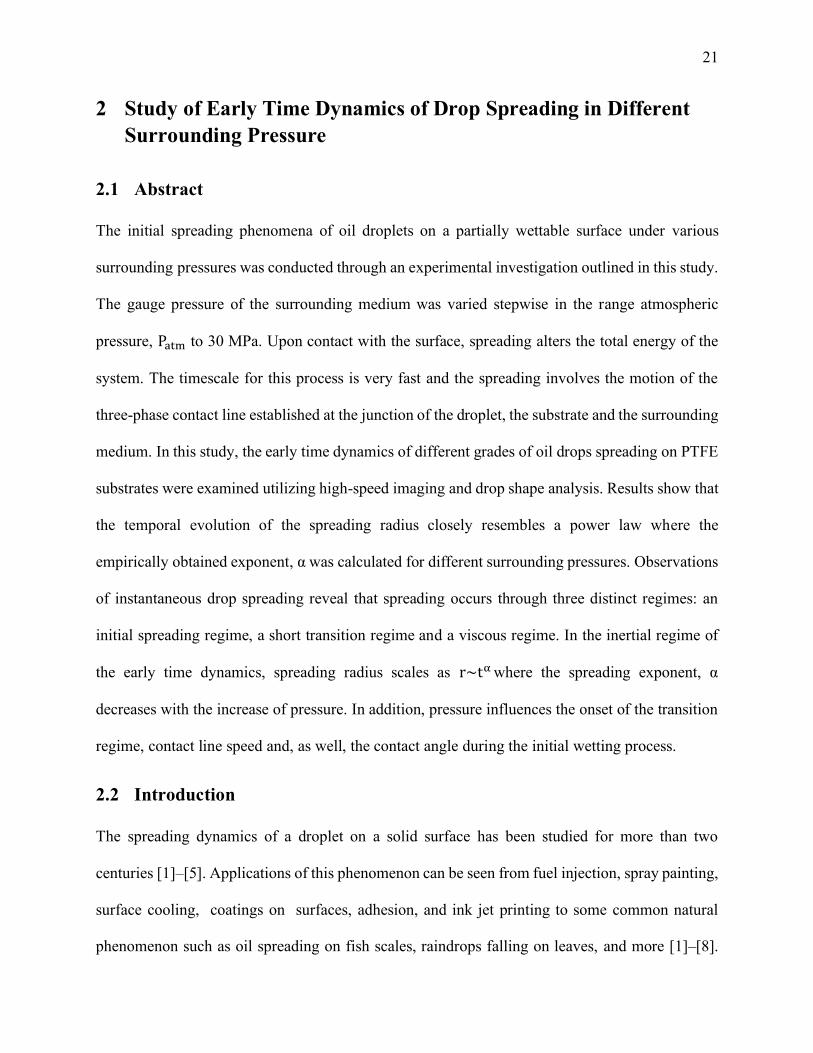
2.1 Abstract ................................................................................................................................. 21
2.2 Introduction ........................................................................................................................... 21
2.3 Materials and experimental configuration ............................................................................... 25
2.3.1 Substrate and experimental liquids .................................................................................. 26
2.3.2 Experimental setup (pressurization and manual dosing system) ....................................... 27
2.3.3 Imaging system of the setup............................................................................................ 28
2.4 Results and discussion ............................................................................................................ 29
2.4.1 Surrounding pressure effects on the spreading radius ...................................................... 32
2.4.2 Spreading coefficient, α .................................................................................................. 37
2.4.3 Transition time, 𝜏𝑡, and transition radius, 𝑟𝑡 .................................................................... 38
2.4.4 Role of viscosity on spreading kinetics ........................................................................... 39
2.4.5 Contact line velocity ....................................................................................................... 41
2.4.6 Contact angle during the early stage of spreading ............................................................ 43
2.5 Conclusion ............................................................................................................................. 46
References ......................................................................................................................................... 47
3 Dynamics of spreading of a hydrodynamically driven droplet under the influence of surrounding
pressure ................................................................................................................................................. 51
3.1 Abstract ................................................................................................................................. 51
3.2 Introduction ........................................................................................................................... 51
3.3 Theoretical model .................................................................................................................. 54
3.3.1 Energy entered to the system .......................................................................................... 55
vii
3.3.2 Internal energy of the system .......................................................................................... 56
3.3.3 Surface potential energy ................................................................................................. 57
3.3.4 Gravitational potential energy ......................................................................................... 59
3.3.5 Viscous dissipation work ................................................................................................ 59
3.3.6 Boundary movement work .............................................................................................. 60
3.4 Experimental setup and procedure .......................................................................................... 62
3.5 Results and discussion ............................................................................................................ 65
3.6 Conclusion ............................................................................................................................. 75
References ......................................................................................................................................... 77
4 Conclusion and future remarks ....................................................................................................... 80
4.1 Summary ............................................................................................................................... 80
4.2 Limitations and future recommendations ................................................................................ 82
4.3 Challenges and learning opportunities .................................................................................... 83
4.4 Scope of the future work ........................................................................................................ 85
Bibliography ......................................................................................................................................... 86

viii
List of Figures
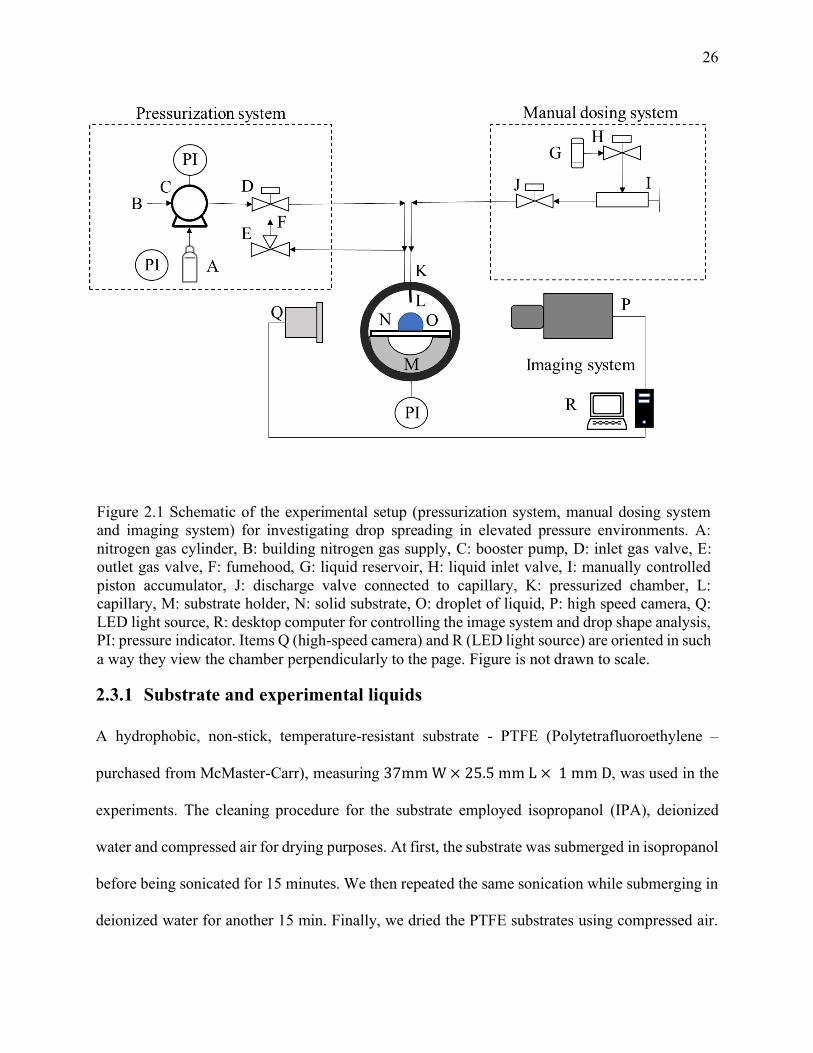
Figure 2.1 Schematic of the experimental setup (pressurization system, manual dosing system and
imaging system) for investigating drop spreading in elevated pressure environments. A: nitrogen
gas cylinder, B: building nitrogen gas supply, C: booster pump, D: inlet gas valve, E: outlet gas
valve, F: fumehood, G: liquid reservoir, H: liquid inlet valve, I: manually controlled piston
accumulator, J: discharge valve connected to capillary, K: pressurized chamber, L: capillary, M:
substrate holder, N: solid substrate, O: droplet of liquid, P: high speed camera, Q: LED light
source, R: desktop computer for controlling the image system and drop shape analysis, PI: pressure
indicator. Items Q (high-speed camera) and R (LED light source) are oriented in such a way they
view the chamber perpendicularly to the page. Figure is not drawn to scale. .............................. 26
Figure 2.2 Snapshots of droplet spreading on PTFE substrate at 𝑃𝑎𝑡𝑚 and 30 MPa: Depicting the
temporal evolution of the N35 (73.16 mPa.s) droplet spreading until it attains equilibrium. ....... 31
Figure 2.3 Effect of surrounding pressure on spreading dynamics: (a) D10 (12.09 mPa.s) and the
inset depicts the equilibrium radius as a function of pressure for four different viscosities (i.e.,
D10, N35, S60 and D500) (b) N35 (73.16 mPa.s) (c) S60 (136.1 mPa.s) and (d) D500 (713.4
mPa.s). ...................................................................................................................................... 34
Figure 2.4 Dynamics of droplet spreading under various surrounding chamber pressures: Evolution
of dimensionless spreading radius, r*= r/R as a function of non-dimensional time, t*=
t/(𝜌𝑅3/𝛾)0.5 for (a) D10 (12.09 mPa.s) (b) N35 (73.16 mPa.s) (c) S60 (136.1 mPa.s) and (d) D500
(713.4 mPa.s) droplets at gauge pressure of 𝑃𝑎𝑡𝑚, 10 MPa, 20 MPa and 30 MPa. .................... 36
Figure 2.5 Spreading exponent α for D10, N35, S60 and D500 at various gauge chamber pressures:
𝑃𝑎𝑡𝑚, 10, 20, 30 MPa. The dimensionless spreading radius 𝑟/𝑅 ∝ (𝑡/𝜏)𝛼 where τ is the inertial
time scale. ................................................................................................................................. 38
Figure 2.6 Dynamics of spreading: (a) transition time, 𝝉𝒕/𝝉𝒄 and (b) transition radius, 𝑟𝑡/R for
D10, N35, S60 and D500 at various gauge pressures: 𝑃𝑎𝑡𝑚, 10, 20, and 30 MPa. ...................... 39
Figure 2.7 Dynamics of spreading of the droplet in elevated pressure environments: evolution of
dimensional spreading radius as a function of time for D10 (12.09 mPa.s), N35 (73.16 mPa.s), S60
(136.1 mPa.s) and D500 (713.4 mPa.s) droplets at (a) 𝑃𝑎𝑡𝑚, (b) 10 MPa, (c) 20 MPa and (d) 30
MPa. ......................................................................................................................................... 40
Figure 2.8 Spreading dynamics for different grades of silicone oil (a) D10 (b) N35 (c) S60 and (d)
D500 at various chamber pressures. .......................................................................................... 43
ix
Figure 2.9 Initial contact angle as a function of time for different grades of silicone oil droplets at
various chamber pressures. (a) D10 (b) N35 (c) S60 (d) D500 ................................................... 45
Figure 3.1 Schematic of the experimental setup to investigate the spreading of hydrodynamically
driven droplets at high pressure. The figure is not drawn to scale. ............................................. 63
Figure 3.2 Advancing contact angle measurement with the evolution of radius of water droplet on
(a) PTFE, (b) Al, (c) Cu, and (d) PMMA at P= 𝑃𝑎𝑡𝑚, 10 MPa and 20 MPa. ............................... 67
Figure 3.3 Change of initial contact angle (a) and minimum spreading ratio, ξ (b) as a function of
the surrounding pressure ........................................................................................................... 68
Figure 3.4 Comparison between advancing contact angle and equilibrium contact angle with
different surrounding pressure for four different substrates. ....................................................... 70
Figure 3.5 Change of the (a) Reynold number (Re) and (b) Weber number (We) as a function of
reduced pressure (∆𝑃𝑟). ............................................................................................................ 71
Figure 3.6 Temporal evolution of non-dimensional experimental and theoretical spreading factor
(β) of water on PTFE, Al, Cu, and PMMA substrate at (a) ∆𝑃𝑟= 0, (b) ∆𝑃𝑟= 0.4521 and (c) ∆𝑃𝑟=
0.9042. The model prediction is performed at a reduced temperature, 𝑇𝑟 = 0.4604 and ascentric
factor, ω = 0.344 for water with an influx flow rate of 1.67 × 10 − 10 𝑚3 𝑠⁄ . ........................ 74
List of Tables
Table 1-1: Viscosity dependency on surrounding pressure ..................................................................... 13
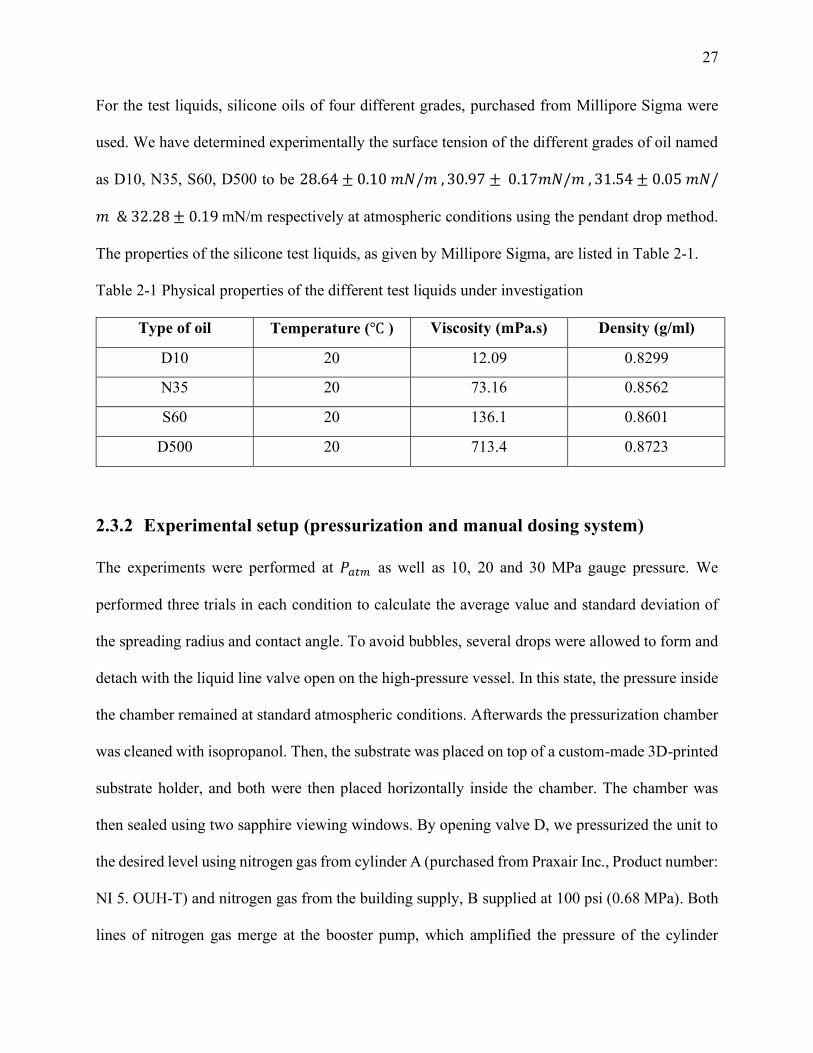
Table 2-1 Physical properties of the different test liquids under investigation ......................................... 27
Table 2-2 Change of the equilibrium contact angle with pressure ........................................................... 33
1
1. Introduction
The dynamics of droplet spreading on a solid surface has been studied extensively to characterize
the wettability of a surface. Wetting and spreading play a significant role not only in oil recovery
but also in the process of drainage water from highways, the efficiency of applying pesticides on
plants, cooling of reactors, etc [1]–[3]. Whether a liquid will wet a surface or not is determined by
the surface forces such as van der Waals and electrostatic forces [4]. These are important for
determining the way fluids spread on solid surfaces and are also responsible for establishing the
equilibrium thickness of wetting films.
For short ranges, wetting and thus the interaction between a fluid and a corresponding substrate
plays a dynamically significant role, which impacts a wide variety of technological breakthroughs
namely microfluidics, inkjet printing and nano printing [5]. These applications are largely
controlled by interfacial forces being exerted at very small length scales usually which are in the
order of a few nm such as the one for van der Waals force [4]. At present, these tiny length scales
are being investigated experimentally using various approaches that permit a new look into physics
previously unseen. Wetting phenomena involves the forward motion of the contact line as the
droplet spreads and is primarily governed by two parameters which are surface roughness and the
chemical composition of the substrate. The former causes friction or adhesive interactions between
the substrate and the liquid.
In compliance with the hydrodynamic concept and molecular kinetic theory, the drag force
associated with the adhesion interaction mentioned above serve to reduce the kinetic energy of the
spreading droplet [6]. On a theoretical level, the drag can be thought of to be made of numerous
energy barriers that hinders the contact line from advancing further. At these barricades, kinetic
2
energy is exhausted and when all the kinetic energy of the droplet is depleted, the contact line
halts. In this state, the droplet is said to be pinned at the advancing interface. The only way to get
unpinned from this position would be an influx of adequate momentum and kinetic energy and
once all the energy barriers are prevailed over, the droplet will achieve a stable equilibrium state.
[6].
Wetting, in general, can be subdivided into two types: spontaneous wetting which occurs without
any external input to the system and forced spreading that involves a driving force. Considering
the first type, spontaneous spreading during its later stages has been extensively researched and is
now considered to be well understood as discussed in detail from the publications of [7], [8].
However, many aspects of the early time dynamics associated with full and particularly partial
wetting has garnered little attention and is largely unexplored. The primary challenge that has
plagued many researchers in the past was the limited frame rates of experimental imaging systems.
With the advent of high-speed imaging and advanced image processing software packages, we are
now able to look deeper into the nuanced dynamics during the first few milliseconds of wetting.
In recent years, researchers have identified the presence of two distinct regimes in characterizing
early spontaneous wetting. The first is an inertia dominated regime or ‘inviscid’ regime where the
primary resistive force to capillary driven spreading is the drop inertia [9], [10]. We use the term
inviscid to imply that the effect of drop viscosity on the initial dynamics is negligible. The second
regime is a viscous dominated late regime that soon terminates in the drop achieving a
thermodynamic equilibrium position [9], [10]. In the inviscid regime, the spreading dynamics
follows a power law that scales in time. Although the duration of this regime has been investigated
with respect to drop size [11] and surface chemistry [10], the impact of outer medium pressure on
the spreading exponent and the interplay between capillary, inertia and viscous forces at high
3
pressure remains unanswered. This poses a rich experimental research challenge that has been
systematically delved into in the current study.
Forced spreading on the other hand is more commonplace in industrial applications. Here, the
primary driving force is usually hydrodynamic in nature although in some applications, the initial
kinetic energy of a falling droplet can also serve as the unbalanced driving force for spreading
[12]. The term hydrodynamic signifies the continual delivery of mass to the droplet in the form of
mass influx. The spreading dynamics associated with this phenomena has been modeled previously
by a few researchers [13]–[15]. The approach involves the use of the Overall Energy Balance
(OEB) equation to predict the time varying radius of the advancing droplet as it evolves on a solid
surface. However, the model does not take into account the impact of outer medium pressure on
the long-term spreading behavior has not been investigated theoretically and experimentally and
thus the study of this phenomena at elevated surrounding pressures requires careful consideration.
One such application that bears similarity to this problem is the injection of pollutant CO2 into
deep saline aquifers in an effort to combat global climate change [16]. These large-scale geological
sequestration projects result in post-injection dynamics that are complex and somewhat unknown.
At reservoir depths, the outside temperatures and pressures are very high and as a result the CO2
that is being pumped exists in its supercritical state and thus behaves like a liquid. The interfacial
tension (IFT) and the contact angle (CA) between the sc-CO2 and the porous rock surface impacts
the trapping effectiveness and the storage security of the trapped injectate inside a brine filled
aquifer. Further, the wettability of the rock surface changes with pressure. Because monitoring this
activity visually at the reservoir level is very challenging, the need for simple yet robust analytical
models that are experimentally validated to predict the long-term spreading mechanics of
sequestered injectate becomes quite imperative. Although, the quantitative terms in a simplified
4
model might differ somewhat from the realistic scenario, the objective instead would be to gather
insights into the underlying physics of the flow so that up scaled models can be built as a result.
In other words, experimental insights into the early time dynamics using high speed imaging
coupled with a theoretical and experimental analysis on the long-term spreading behavior of
advancing droplets at elevated pressures have been studied in this thesis. Pressure plays a major
role not only in the initial dynamics of spontaneous droplets but also on the spreading phenomenon
of droplets whose prime motive force is hydrodynamic in nature.
1.1 Aim of the present work
Droplet spreading on a solid substrate has numerous applications. In high-pressure engineering
such as refining, extraction, refrigeration, etc., it is important to understand the wetting behavior
under the influence of surrounding pressure [17]. The droplet starts to spread after coming into
contact with the solid surface and continues spreading until it reaches its equilibrium state. The
later stages of spreading have been investigated extensively by many researchers but the different
aspects of the early stages of wetting need to be investigated further. Also, to have a better
understanding on the spreading behavior and wettability of the substrate, it is important to study
the hydrodynamic spreading behavior by considering the advancing contact angle and
advancement of drop spreading by adding volume at a constant rate. Considering all these aspects
we have presented a detailed investigation of the role of pressure on the early stage of drop
spreading and on the spreading of hydro-dynamically driven droplets under similar conditions
from a theoretical and experimental standpoint. In summary, the aim of the present work is as
follows:
5
▪ To characterize the influence of pressure on the early time spreading behaviors of sessile
droplets
▪ To analyze the pressure dependence on the transition time & transition radius to
intermediate and late-stage regimes.
▪ To establish a power law relationship of the spreading radius as a function of the
empirically obtained spreading exponent and its consequent dependence on pressure.
▪ Using the extended OEB equation to develop a new model to predict hydrodynamically
driven spreading in different surrounding pressures
▪ Perform experiments on liquid advancing to validate the effectiveness of the new approach
using various substrates at different surrounding pressures.
▪ Conduct a parametric study investigating pressure effects of various non-dimensional
numbers pertinent to spreading
The background of the investigations and their applications are discussed in the later sections of
this chapter. Firstly, the idea about early time spreading, investigation procedure, the importance
of investigating the early time spreading considering different pressure conditions, and the
applications of this study are presented in detail. Afterwards, a theoretical and experimental study
of hydrodynamically driven advancing is then discussed. The background investigation,
theoretical model and the importance and applications of this study are also presented.
1.2 Influence of pressure on early time dynamics of drop spreading
1.2.1 Literature review
Early time spreading dynamics involve the first milliseconds of spreading after a droplet
establishes contact on a solid surface. It is important to understand the whole spreading
phenomenon. The later stage of spreading which is close to equilibrium has been studied
6
extensively [7], [8]. In [18]–[20], early stage of drop spreading has been investigated on a partially
wettable surface and soft surface and under liquid medium respectively. Effects of pressure,
temperature, etc on initial spreading dynamics yet need to be investigated. In our first investigation,
we have conducted our analysis considering the effect of pressure on the early stage of spreading.
The gradient of curvature and corresponding Laplace pressure gets balanced with resistive
momentum which controls the spreading momentum [21]. Two temporal regime- inertial and
viscous regime is considered in the entire spreading process. The later stage of spreading
momentum is balanced by viscous friction. The visco-capillary balance near the moving triple line
defines the shape of the droplet. On the other hand, the bulk droplet resistive inertia force at the
early stage of spreading gets balanced with capillary force.
The total spreading procedure is dominated by initial inertia dominated regime and viscosity
dominated regime [18]. For low viscosity liquid, early time spreading is dominated by inertia while
at the later stage of spreading close to equilibrium is dominated by viscous dissipation. In the
inertial regime of low viscosity liquid, the contact radius r follows a scaling, 𝑟~(𝜎𝐷𝐴𝑅 𝜌𝐷⁄ )1 4⁄
where 𝜎𝐷𝐴 is the surface tension, R is the radius of the droplet and 𝜌𝐷 is the density of the droplet
In the later stage of spreading, the drop spreads following Tanner’s law 𝑟~(𝜎𝐷𝐴𝑅9 𝜇𝐷⁄ )1 10⁄ 𝑡1 10⁄
(here 𝜇𝐷 is the dynamic viscosity of the droplet) [8]. For high viscosity liquid, the whole spreading
is viscosity dominated and follows a power law 𝑟~𝑡𝛼. Here α is defined as 𝛼 = 𝑑 𝑙𝑜𝑔 𝑟 𝑑 log 𝑡 ⁄ .
Initial spreading dynamics is similar to drop coalescing with a wet film for fully wetting substrate
and spreading follows power law that depends on the type of force (inertia or viscous force)
resisting drop deformation [10]. This scenario is different for partially wetting substrate where the
spreading follows a power law 𝑟~𝑡𝛼 with nonuniversal exponent 𝛼 [20].
7
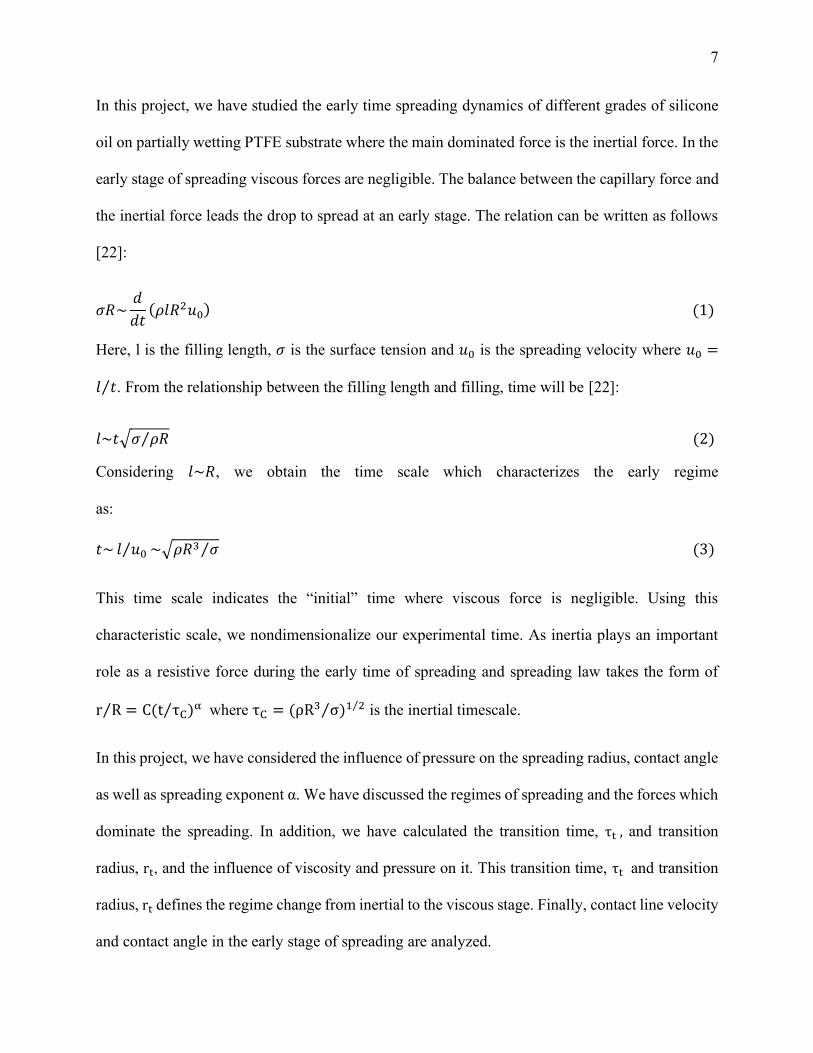
In this project, we have studied the early time spreading dynamics of different grades of silicone
oil on partially wetting PTFE substrate where the main dominated force is the inertial force. In the
early stage of spreading viscous forces are negligible. The balance between the capillary force and
the inertial force leads the drop to spread at an early stage. The relation can be written as follows
[22]:
𝜎𝑅~𝑑
𝑑𝑡(𝜌𝑙𝑅2𝑢0) (1)
Here, l is the filling length, 𝜎 is the surface tension and 𝑢0 is the spreading velocity where 𝑢0 =
𝑙 𝑡⁄ . From the relationship between the filling length and filling, time will be [22]:
𝑙~𝑡√𝜎 𝜌𝑅⁄ (2)
Considering 𝑙~𝑅, we obtain the time scale which characterizes the early regime
as:
𝑡~ 𝑙 𝑢0⁄ ~√𝜌𝑅3 𝜎⁄ (3)
This time scale indicates the “initial” time where viscous force is negligible. Using this
characteristic scale, we nondimensionalize our experimental time. As inertia plays an important
role as a resistive force during the early time of spreading and spreading law takes the form of
r R⁄ = C(t τC⁄ )α where τC = (ρR3 σ⁄ )1 2⁄ is the inertial timescale.
In this project, we have considered the influence of pressure on the spreading radius, contact angle
as well as spreading exponent α. We have discussed the regimes of spreading and the forces which
dominate the spreading. In addition, we have calculated the transition time, τt , and transition
radius, rt, and the influence of viscosity and pressure on it. This transition time, τt and transition
radius, rt defines the regime change from inertial to the viscous stage. Finally, contact line velocity
and contact angle in the early stage of spreading are analyzed.
8
1.2.2 Applications
Drop spreading on a smooth and dry surface has a wide range of applications [4], [23]–[26]. In
icing of aircraft wings, spray painting, fuel injection, surface cooling, and so forth, the result of
the spreading procedure defines its effectiveness [27][10][19]. The efficiency of this kind of
operation depends on the size of the droplet, spreading behavior, and the interaction between the
droplet and the surface. The impact behavior of a droplet on the cylinder and piston surface
associates with the formation of combustion chamber deposits (CCD) in internal combustion
engines [27]. The cooling of a heated slab depends on the rate and extent of spreading of the water
droplet hitting the heated slab [27]. The spreading of a droplet depends on the nature and roughness
of the substrate, liquid density, viscosity, and surface tension. Temperature, surrounding air
pressure, and wettability have a significant effect on the spreading behavior as well. In a reservoir
system, the efficiency of trapping 𝐶𝑂2 depends on the wettability that changes with pressure. To
have a better understanding of these, it is important to investigate the spreading of a droplet. More
specifically the initial stage of spreading at different surrounding pressure need more attention.
The knowledge of this study is useful in the spreading mechanics of supercritical 𝐶𝑂2 in deep
porous reservoirs for curbing atmospheric emissions [16][28]. The study of the early time
dynamics reveals the time droplet when the droplet switches to the viscous dominated spreading
regime from the inertial dominated spreading regime. If the drop transitions to the viscous
dominated regime faster, further spreading will be curtailed. Studying the influence of pressure on
this transition time will give valuable insight as to how fast the drop will spread and the extent to
which the transition time and radius is pressure dependent.
9
1.3 Influence of surrounding pressure on the dynamics of spreading of a
hydrodynamically driven droplet
1.3.1 Literature review
Understanding the spreading of a droplet is important to know about the wetting characteristics of
a liquid droplet on a solid substrate. The spreading phenomenon involves a three-phase contact
line. The angle measured at the three-phase contact line is called the equilibrium contact angle and
is also widely termed as “Young’s angle” [6]. Young’s contact angle, θ, of a liquid drop on a solid
substrate can be presented as:
𝜎𝑙𝑣 𝑐𝑜𝑠 𝜃 = 𝜎𝑠𝑣 − 𝜎𝑠𝑙 (4)
where 𝜎𝑙𝑣 is the liquid-vapor surface tension, 𝜎𝑠𝑣 is the solid-vapor surface tension, and 𝜎𝑠𝑙 is the
solid-liquid surface tension.
According to Young’s equation, the solid substrate is assumed to be smooth, homogeneous, and
rigid. It should also be chemically and physically inert concerning the liquids to be employed [29].
But in a real scenario, solid surface cannot be found in an ideal condition and because of that liquid
drop on it behave differently, and it cannot be determined by Young’s equation. Though in ideal
conditions, a unique contact angle is expected for a given system according to Young’s equation,
but in a real scenario, a range of contact angles is observed. The upper limit of the range (or the
angle measured during the advancement of a contact line or the wetting of the surface) is referred
to as the advancing contact angle 𝜃𝑎, and the lower limit (or the angle measured during the de-
wetting of the surface) is referred as the receding contact angle 𝜃𝑟 [29]. The difference between
𝜃𝑎 and 𝜃𝑟 is known as contact angle hysteresis 𝜃ℎ𝑦𝑠𝑡 which is presented as follows:
10
𝜃ℎ𝑦𝑠𝑡 = 𝜃𝑎 − 𝜃𝑟 (5)
In [30], it is stated that contact angle on a rough surfaces cannot be considered as Young’s contact
angle. In [31]–[33], the authors gives this same argument for the heterogeneous and porous
surfaces. The concept of metastable state was introduced in 1946 by Derjaguin and developed by
other researchers [29]. In an ideal system, the free energy of the system is global minimum and
only one contact angle can be obtained according to Young's equation which represents the stable
equilibrium state. According to metastable states, the free energy of the system is a local minimum
and it exists on heterogeneous and rough surfaces. The imperfections of the solid surface,
mechanically more than one stable contact angle can be observed. So, contact angle hysteresis can
be understood in respect of metastable states [30]. Among those studies, in [34] the authors
discussed contact angle hysteresis more in the sense of a true hysteresis, but, not in terms of
metastable states. The advancing and receding contact angle values to decrease with the time of
contact between solid and liquid [34]. Detail explanation on measuring advancing and receding
contact angles was first provided in [29]. During the advancement of drop volume in advancing
contact angle measurement, the drop spreads gradually. This hydrodynamic spreading of a drop
depends on several factors which were discussed by some other researchers in their research
studies [13], [14]. The spreading of a droplet can be investigated by fluid mechanics approach or
through a surface physics approach [13]. In fluid mechanics approach, the main difficulty is to
model the slip at a three-phase contact line. Also, determining the relationship between the
dynamic contact angle and the velocity of the advancing contact radius is difficult [35]. According
to the surface physics approach, the spreading process is dependent largely on the interfacial
tensions and contact angles. But various chemical, physical and quantum mechanical parameters
11
may or may not be possible to determine [36]. The combination of these two approaches is more
accepted as they dependent on empiricism to quantify the solution.
Many researchers have studied the relationship between dynamic contact angle and the advancing
speed of the three-phase line. By relating the dynamic contact angle to the capillary number plus
a ‘shift factor’ simple and semi-empirical equations were developed [37]. The first general
theoretical model on the dynamic spreading of droplets was proposed in [15] which is called the
overall energy balance model (OEB). In [13][12], the authors adopted the approach of [15] to
model the spontaneous and low-speed impact drop spreading. The initial kinetic energy of a fixed
mass droplet was considered as a primary driving force. But for industrial coating processes,
polymer processing technologies, and welding, drop spreading by adding liquid to the system is
essential. In these cases, the primary driving force is considered to be hydrodynamic in nature. In
[14], a model to study drop spreading driven by hydrodynamic forces was successfully developed
by extending the OEB model where adding mass and energy to the system was considered. The
equation is a non-linear first-order ordinary differential equation. Here, the drop is considered to
be spherical and having a constant dynamic contact angle.
In this project, experiments on spreading of droplet considering the addition of mass is observed
in different surrounding pressures (Patm, 10 MPa and 20 MPa). Experiments were performed on
four different substrates - PTFE (Polytetrafluoroethylene), 6061-grade Aluminium, Copper, UV-
Resistant Acrylic Sheet (PMMA) substrates. To explain the hydrodynamic spreading
phenomenon, we used the OEB model [14] and combine it with the equation of viscosity proposed
in [38]. The OEB approach in [14], describes the spreading of the drop with the addition of mass
until it attains the equilibrium. In the system of drop spreading, the energy entered is balanced with
the change in internal energy of the system, increase or decrease in surface and gravitational
12
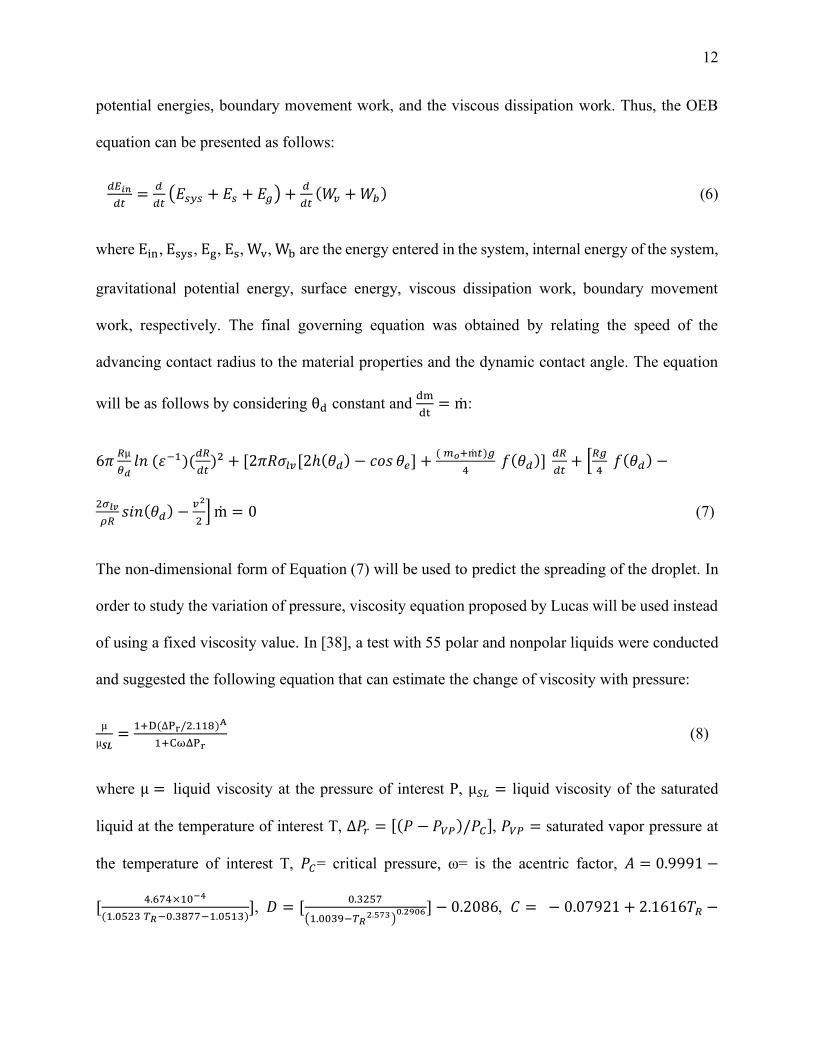
potential energies, boundary movement work, and the viscous dissipation work. Thus, the OEB
equation can be presented as follows:
𝑑𝐸𝑖𝑛
𝑑𝑡=
𝑑
𝑑𝑡(𝐸𝑠𝑦𝑠 + 𝐸𝑠 + 𝐸𝑔) +
𝑑
𝑑𝑡(𝑊𝑣 + 𝑊𝑏) (6)
where Ein, Esys, Eg, Es, Wv, Wb are the energy entered in the system, internal energy of the system,
gravitational potential energy, surface energy, viscous dissipation work, boundary movement
work, respectively. The final governing equation was obtained by relating the speed of the
advancing contact radius to the material properties and the dynamic contact angle. The equation
will be as follows by considering θd constant and dm
dt= ṁ:
6𝜋𝑅µ
𝜃𝑑𝑙𝑛 (𝜀−1)(
𝑑𝑅
𝑑𝑡)2 + [2𝜋𝑅𝜎𝑙𝑣[2ℎ(𝜃𝑑) − 𝑐𝑜𝑠 𝜃𝑒] +
( 𝑚𝑜+ṁ𝑡)𝑔
4 𝑓(𝜃𝑑)]
𝑑𝑅
𝑑𝑡+ [
𝑅𝑔
4 𝑓(𝜃𝑑) −
2𝜎𝑙𝑣
𝜌𝑅𝑠𝑖𝑛(𝜃𝑑) −
𝑣2
2] ṁ = 0 (7)
The non-dimensional form of Equation (7) will be used to predict the spreading of the droplet. In
order to study the variation of pressure, viscosity equation proposed by Lucas will be used instead
of using a fixed viscosity value. In [38], a test with 55 polar and nonpolar liquids were conducted
and suggested the following equation that can estimate the change of viscosity with pressure:
µ
µ𝑺𝑳=
1+D(∆Pr/2.118)A
1+CωΔPr (8)
where µ = liquid viscosity at the pressure of interest P, µ𝑆𝐿 = liquid viscosity of the saturated
liquid at the temperature of interest T, ∆𝑃𝑟 = [(𝑃 − 𝑃𝑉𝑃)/𝑃𝐶], 𝑃𝑉𝑃 = saturated vapor pressure at
the temperature of interest T, 𝑃𝐶= critical pressure, ω= is the acentric factor, 𝐴 = 0.9991 −
[4.674×10⁻⁴
(1.0523 𝑇𝑅−0.3877−1.0513)], 𝐷 = [
0.3257
(1.0039−𝑇𝑅2.573)
0.2906] − 0.2086, 𝐶 = − 0.07921 + 2.1616𝑇𝑅 −
13
13.4040𝑇𝑅2 + 44.1706𝑇𝑅
3 − 84.8291𝑇𝑅4 + 96.1209 𝑇𝑅
5 − 59.8127 𝑇𝑅6 + 15.6719 𝑇𝑅
7 and
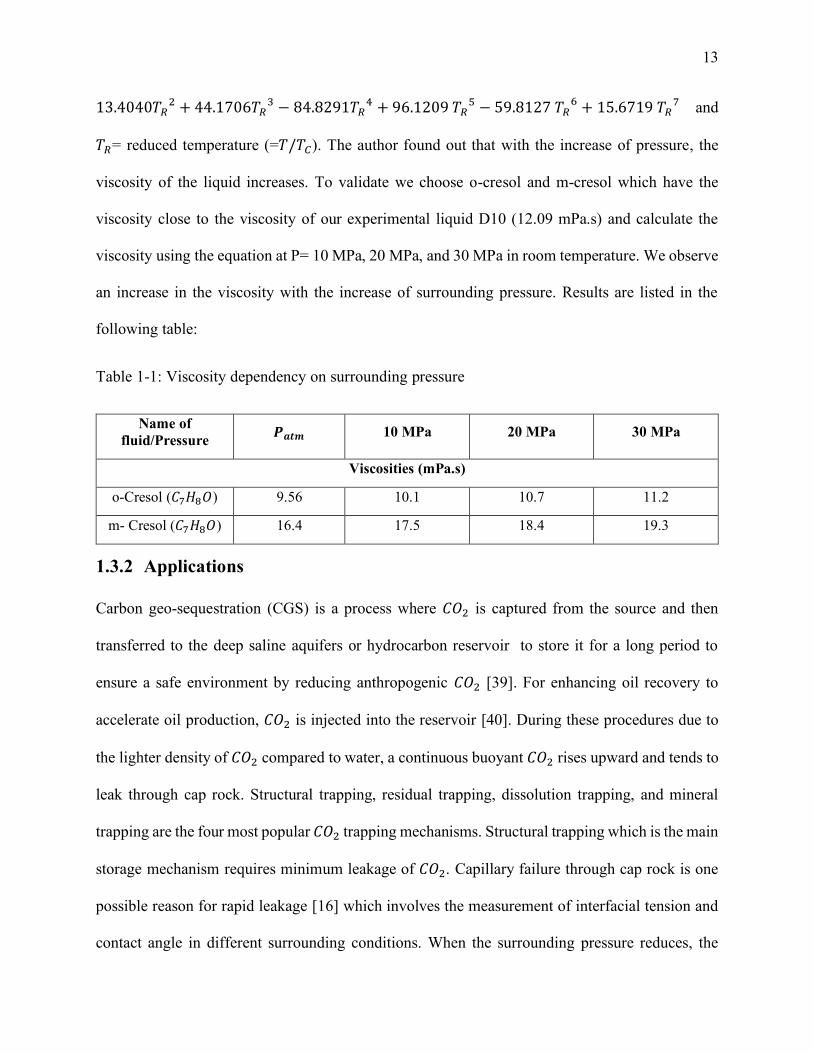
𝑇𝑅= reduced temperature (=𝑇/𝑇𝐶). The author found out that with the increase of pressure, the
viscosity of the liquid increases. To validate we choose o-cresol and m-cresol which have the
viscosity close to the viscosity of our experimental liquid D10 (12.09 mPa.s) and calculate the
viscosity using the equation at P= 10 MPa, 20 MPa, and 30 MPa in room temperature. We observe
an increase in the viscosity with the increase of surrounding pressure. Results are listed in the
following table:
Table 1-1: Viscosity dependency on surrounding pressure
Name of
fluid/Pressure 𝑷𝒂𝒕𝒎 10 MPa 20 MPa 30 MPa
Viscosities (mPa.s)
o-Cresol (𝐶7𝐻8𝑂) 9.56 10.1 10.7 11.2
m- Cresol (𝐶7𝐻8𝑂) 16.4 17.5 18.4 19.3
1.3.2 Applications
Carbon geo-sequestration (CGS) is a process where 𝐶𝑂2 is captured from the source and then
transferred to the deep saline aquifers or hydrocarbon reservoir to store it for a long period to
ensure a safe environment by reducing anthropogenic 𝐶𝑂2 [39]. For enhancing oil recovery to
accelerate oil production, 𝐶𝑂2 is injected into the reservoir [40]. During these procedures due to
the lighter density of 𝐶𝑂2 compared to water, a continuous buoyant 𝐶𝑂2 rises upward and tends to
leak through cap rock. Structural trapping, residual trapping, dissolution trapping, and mineral
trapping are the four most popular 𝐶𝑂2 trapping mechanisms. Structural trapping which is the main
storage mechanism requires minimum leakage of 𝐶𝑂2. Capillary failure through cap rock is one
possible reason for rapid leakage [16] which involves the measurement of interfacial tension and
contact angle in different surrounding conditions. When the surrounding pressure reduces, the
14
wettability of cap rock changes and this affect the design and planning of 𝐶𝑂2 injection and storage
project. On the other hand, for capillary trapping which governs by relative permeability and
capillary pressure, careful measurement of interfacial tension and contact angle in reservoir
pressure, temperature, and fluid composition help to increase the storage efficiency. As a result,
the measurement of contact angle and wettability of a solid surface has become important. In this
project, we have measured the advancing contact angle by adding volume with constant flow rate
and spreading radius to observe the changes of wettability with pressure to understand the
phenomenon that can be seen in reservoir conditions. We use 𝑁2 as a surrounding medium to avoid
contamination at interfaces.
1.4 Thesis outline
The background knowledge and the opportunities of the topics in the succeeding chapters are
discussed briefly in this section. The investigation is focused on analyzing the influence of pressure
on the spreading dynamics of a droplet on a solid substrate. We tried to explain the influence of
pressure on the early time spreading dynamics using four different grades of silicone oil (D10,
N35, S60, D500) on PTFE (Polytetrafluoroethylene) substrate (chapter 2) and after that, we did a
detailed investigation on the hydrodynamic spreading of a water droplet on four different
substrates - PTFE (Polytetrafluoroethylene), 6061 grade Aluminium, Copper, UV-Resistant
Acrylic Sheet (PMMA) substrates experimentally (chapter 3). Detail of the theoretical model is
also presented in chapter 3 which can predict the hydrodynamic spreading of a droplet in different
surrounding pressure. Summary of the analysis presented in chapter 2 and chapter 3 of the thesis
are as follows:
▪ In chapter 2, an experimental investigation is outlined for early time spreading dynamics
of oil droplets on a partially wettable surface under various surrounding pressures. We
15
observe the change of droplet shape of intermediate viscosity liquid with the increase of
pressure. Also, instantaneous spreading radius and equilibrium radius is investigated with
the rise in viscosity. We have identified two regimes in this study- a slow starting regime
(Phase I) that is found after the drop makes contact with the substrate and the fast-paced
dynamics which materialize before the transition regime (Phase I,I). Exponent, α has been
investigated for each case and change of α is presented with rising pressure. We have also
discussed the effect of pressure and viscosity on the transition time and transition radius.
In the later section we investigated the effect of pressure on contact line velocities and
contact angle as well.
▪ In chapter 3, a theoretical model is developed for the hydrodynamic spreading of water
droplets under the influence of pressure. In addition, the experimental result of spreading
of droplet and advancing contact angle of water on four different substrates is presented in
this study. Comparison between the advancing to equilibrium contact angle at different
surrounding pressure conditions is also shown. Moreover, effects of pressure on the
Reynold number and Weber number have also been investigated. Later on, the theoretical
model is validated with an experimental investigation of a droplet with the addition of mass
overtime for different surrounding pressure at the end of this chapter.
A brief discussion of the whole thesis work is given in the final chapter. The major findings are
presented shortly in this chapter with the future scopes of this work. Also, in this chapter, we have
mentioned the areas which can be further investigated in the future.
16
References
[1] C. Janus et al., “A$β$ peptide immunization reduces behavioural impairment and plaques
in a model of Alzheimer’s disease,” Nature, vol. 408, no. 6815, pp. 979–982, 2000.
[2] E. Bertrand et al., “Wetting of alkanes on water,” J. Pet. Sci. Eng., vol. 33, no. 1–3, pp.
217–222, 2002.
[3] N. Shahidzadeh, E. Bertrand, J. P. Dauplait, J. C. Borgotti, P. Vié, and D. Bonn, “Effect of
wetting on gravity drainage in porous media,” Transp. porous media, vol. 52, no. 2, pp.
213–227, 2003.
[4] D. Bonn, J. Eggers, J. Indekeu, J. Meunier, and E. Rolley, “Wetting and spreading,” Rev.
Mod. Phys., vol. 81, no. 2, p. 739, 2009.
[5] P. Tabeling, M. Chabert, A. Dodge, C. Jullien, and F. Okkels, “Chaotic mixing in cross-
channel micromixers,” Philos. Trans. R. Soc. London. Ser. A Math. Phys. Eng. Sci., vol.
362, no. 1818, pp. 987–1000, 2004.
[6] K. Law, Kock-Yee, and H. Zhao. Surface wetting: characterization, contact angle, and
fundamentals. Basel, Switzerland: Springer International Publishing, 2016.
[7] O. V. Voinov, “Hydrodynamics of wetting,” Fluid Dyn., vol. 11, no. 5, pp. 714–721,
1976.
[8] L. H. Tanner, “The spreading of silicone oil drops on horizontal surfaces.,” J. Phys.-D.,
vol. 12, no. 9, Sep.14, 1979, pp.1473-1484., 1979.
[9] K. G. Winkels, J. H. Weijs, A. Eddi, and J. H. Snoeijer, “Initial spreading of low-viscosity
drops on partially wetting surfaces,” Phys. Rev. E - Stat. Nonlinear, Soft Matter Phys., vol.
17
85, no. 5, pp. 1–4, 2012.
[10] J. C. Bird, S. Mandre, and H. A. Stone, “Short-time dynamics of partial wetting,” Phys.
Rev. Lett., vol. 100, no. 23, pp. 1–4, 2008.
[11] A. Eddi, K. G. Winkels, and J. H. Snoeijer, “Short time dynamics of viscous drop
spreading,” Phys. Fluids, vol. 25, no. 1, 2013.
[12] Y. Gu and D. Li, “Liquid drop spreading on solid surfaces at low impact speeds,” Colloids
Surfaces A Physicochem. Eng. Asp., vol. 163, no. 2–3, pp. 239–245, 2000.
[13] Y. Gu and D. Li, “A model for liquid drop spreading on solid surfaces,” Colloids Surfaces
A Physicochem. Eng. Asp., vol. 163, no. 2–3, pp. 239–245, 2000.
[14] D. Li, D. Erickson, and B. Blackmore, “An energy balance approach to modeling the
hydrodynamically driven spreading of a liquid drop,” Colloids Surfaces A Physicochem.
Eng. Asp., vol. 182, no. 1–3, pp. 109–122, 2001.
[15] J. Madejski, “Solidification of droplets on a cold surface,” Int. J. Heat Mass Transf., vol.
19, no. 9, pp. 1009–1013, 1976.
[16] S. Saraji, L. Goual, M. Piri, and H. Plancher, “Wettability of supercritical carbon
dioxide/water/quartz systems: Simultaneous measurement of contact angle and interfacial
tension at reservoir conditions,” Langmuir, vol. 29, no. 23, pp. 6856–6866, 2013.
[17] Y. Sutjiadi-Sia, P. Jaeger, and R. Eggers, “Interfacial phenomena of aqueous systems in
dense carbon dioxide,” J. Supercrit. Fluids, vol. 46, no. 3, pp. 272–279, 2008.
[18] S. Mitra and S. K. Mitra, “Understanding the Early Regime of Drop Spreading,”
Langmuir, vol. 32, no. 35, pp. 8843–8848, 2016.
18
[19] L. Chen, G. K. Auernhammer, and E. Bonaccurso, “Short time wetting dynamics on soft
surfaces,” Soft Matter, vol. 7, no. 19, pp. 9084–9089, 2011.
[20] K. G. Winkels, J. H. Weijs, A. Eddi, and J. H. Snoeijer, “Initial spreading of low-viscosity
drops on partially wetting surfaces,” Phys. Rev. E - Stat. Nonlinear, Soft Matter Phys., vol.
85, no. 5, pp. 1–4, 2012.
[21] S. Kim, U. Park, and H. Kim, “Early stage of liquid drop spreading on tunable
nanostructured surfaces,” Exp. Therm. Fluid Sci., vol. 116, no. March, p. 110126, 2020.
[22] S. Das, P. R. Waghmare, and S. K. Mitra, “Early regimes of capillary filling,” Phys. Rev.
E - Stat. Nonlinear, Soft Matter Phys., vol. 86, no. 6, pp. 1–5, 2012.
[23] P.-G. De Gennes, “Wetting: statics and dynamics,” Rev. Mod. Phys., vol. 57, no. 3, p. 827,
1985.
[24] H. Wijshoff, “The dynamics of the piezo inkjet printhead operation,” Phys. Rep., vol. 491,
no. 4–5, pp. 77–177, 2010.
[25] P. G. Simpkins and V. J. Kuck, “On air entrainment in coatings,” J. Colloid Interface Sci.,
vol. 263, no. 2, pp. 562–571, 2003.
[26] V. Bertola and K. Sefiane, “Controlling secondary atomization during drop impact on hot
surfaces by polymer additives,” Phys. Fluids, vol. 17, no. 10, p. 108104, 2005.
[27] N. K. Mishra, Y. Zhang, and A. Ratner, “Effect of chamber pressure on spreading and
splashing of liquid drops upon impact on a dry smooth stationary surface,” Exp. Fluids,
vol. 51, no. 2, pp. 483–491, 2011.
[28] M. Arif, A. Z. Al-Yaseri, A. Barifcani, M. Lebedev, and S. Iglauer, “Impact of pressure
19
and temperature on CO2-brine-mica contact angles and CO2-brine interfacial tension:
Implications for carbon geo-sequestration,” J. Colloid Interface Sci., vol. 462, pp. 208–
215, 2016.
[29] C. N. C. Lam, N. Kim, D. Hui, D. Y. Kwok, M. L. Hair, and A. W. Neumann, “The effect
of liquid properties to contact angle hysteresis,” Colloids Surfaces A Physicochem. Eng.
Asp., vol. 189, no. 1–3, pp. 265–278, 2001.
[30] R. N. Wenzel, “Resistance of solid surfaces to wetting by water,” Ind. Eng. Chem., vol.
28, no. 8, pp. 988–994, 1936.
[31] . A. B. D Cassie, “Contact angles,” J. Chem. Inf. Model., vol. 53, no. 9, pp. 1689–1699,
2019.
[32] A. B. D. Cassie, S. Baxter “Wettability of porous surfaces,” Transactions of the Faraday
society, no. 5, pp. 546–551, 1944.
[33] S. Baxter and A. B. D. Cassie, “8—The water repellency of fabrics and a new water
repellency test,” J. Text. Inst. Trans., vol. 36, no. 4, pp. T67–T90, 1945.
[34] R. V. Sedev, J. G. Petrov, and A. W. Neumann, “Effect of swelling of a polymer surface
on advancing and receding contact angles,” J. Colloid Interface Sci., vol. 180, no. 1, pp.
36–42, 1996.
[35] P. J. Haley and M. J. Miksis, “The effect of the contact line on droplet spreading,” J. Fluid
Mech., vol. 223, pp. 57–81, 1991.
[36] F. T. Dodge, “The spreading of liquid droplets on solid surfaces,” J. Colloid Interface Sci.,
vol. 121, no. 1, pp. 154–160, 1988.
20
[37] R. L. Hoffman, “A study of the advancing interface. I. Interface shape in liquid-gas
systems,” J. Colloid Interface Sci., vol. 50, no. 2, pp. 228–241, 1975.
[38] K. Lucas, “Die Druckabhangigkeit der Viskositat von Fliissigkeiten - eine einfache
Abschatzung,” Chem.-Ing.-Tech., vol. 53, no. 12, pp. 959–960, 1981.
[39] P. Wadsworth, “A Guide to CO2 Sequestration,” Science (80-. )., vol. 300, no. June, pp.
1677–1678, 2003.
[40] S. Iglauer, A. Paluszny, and M. J. Blunt, “Simultaneous oil recovery and residual gas
storage: A pore-level analysis using in situ X-ray micro-tomography,” Fuel, vol. 103, pp.
905–914, 2013.
21
2 Study of Early Time Dynamics of Drop Spreading in Different
Surrounding Pressure
2.1 Abstract
The initial spreading phenomena of oil droplets on a partially wettable surface under various
surrounding pressures was conducted through an experimental investigation outlined in this study.
The gauge pressure of the surrounding medium was varied stepwise in the range atmospheric
pressure, Patm to 30 MPa. Upon contact with the surface, spreading alters the total energy of the
system. The timescale for this process is very fast and the spreading involves the motion of the
three-phase contact line established at the junction of the droplet, the substrate and the surrounding
medium. In this study, the early time dynamics of different grades of oil drops spreading on PTFE
substrates were examined utilizing high-speed imaging and drop shape analysis. Results show that
the temporal evolution of the spreading radius closely resembles a power law where the
empirically obtained exponent, α was calculated for different surrounding pressures. Observations
of instantaneous drop spreading reveal that spreading occurs through three distinct regimes: an
initial spreading regime, a short transition regime and a viscous regime. In the inertial regime of
the early time dynamics, spreading radius scales as r~tα where the spreading exponent, α
decreases with the increase of pressure. In addition, pressure influences the onset of the transition
regime, contact line speed and, as well, the contact angle during the initial wetting process.
2.2 Introduction
The spreading dynamics of a droplet on a solid surface has been studied for more than two
centuries [1]–[5]. Applications of this phenomenon can be seen from fuel injection, spray painting,
surface cooling, coatings on surfaces, adhesion, and ink jet printing to some common natural
phenomenon such as oil spreading on fish scales, raindrops falling on leaves, and more [1]–[8].
22
Drops of different sizes, speeds and materials have an impact on the surfaces which defines the
effectiveness and efficiency of a particular operation. For example, heat transfer in spray cooling
process of a steel slab depends on the amount and speed of the liquid droplets spreading on a solid
surface. For this reason, the entire spreading procedure, from start to finish, is very important to
understand. Several factors have an impact on the spreading of a droplet. To have a better
understanding the role of these factors, it is important to segregate each parameter of interest and
study its effect. The effect of one such factor is pressure surrounding the droplet. In order to
estimate the effects of pressure on wetting dynamics, several studies have been carried out in
relation to oil recovery systems to evaluate the geo-storage of CO2 in porous aquifers. A number
of studies [9], [10], [11] have been conducted to investigate the effects of surrounding pressure on
the wettability and surface free energy of surface coatings. The wettability of water was found to
be poor on Polytetrafluoroethylene (PTFE), intermediate on stainless steel and good for glass
substrates in a pressure range of 0.1-27 MPa and 40℃ [11]. However, these studies do not consider
pressure effects on the initial spreading and the associated transition to later regimes. Initial
spreading dictates the final contour of the drop as well as the equilibrium contact angle. In this
paper, we investigate experientially the early time spreading dynamics on a solid substrate while
considering a change in surrounding pressure, the results from which can be used to improve high
pressure engineering processes such as refining, extraction, refrigeration, polymer foaming,
polymerisation , pressing of oil seeds, etc [11].
The entire spreading phenomena is broadly made up of three distinct regimes namely, an inertia
dominated early regime, a short transition regime, and a viscous dominated late regime. Extensive
studies have been conducted on the later stage of spreading droplets [12]–[14]. The later stage of
spreading dynamics, whose onset time varies between different fluids, is slow and the wetting
23
radius grows as r~t1 10⁄ [13] close to the contact line where the surface tension and viscous forces
balance; in this relation, r is the wetting radius and t is the evolution of time. Compared to the later
stage, the dynamics of the early stage of drop spreading is much faster. With new technical
developments in recent years, such as high-speed video cameras for capturing the first milliseconds
of drop spreading, researchers are now able to study the early stage of droplet spreading.
In droplet spreading, a drop with a specific radius is gently brought into contact with a substrate.
After the deposition of the drop on a solid substrate, the unbalanced horizontal force
σ (cos θ − cos θeq) drives the droplet to spread until it reaches a final equilibrium contact angle
(θeq). Here, σ is the surface tension at the liquid-vapor interface and θ is the contact angle at a
particular instant. At the instant of contact, the curvature of the interface is infinite which leads to
a diverging Laplace pressure jump. This generates a rapid flow in the drop that refills the liquid
neck causing the wetted area to grow over time [15]. This Laplace pressure is the surface tension,
which balances the bulk droplet resistive inertia motion in the early stage of spreading.
The entire spreading regime can be characterized by an early inertia dominated regime followed
by a viscosity dominated regime close to the equilibrium condition for low viscosity liquids [16]–
[19]. For high viscosity liquids, the entire process is viscosity dominated [12]–[14], [16], [18]–
[21]. For the intermediate class of liquids, both the early viscous and the inertial regimes have the
possibility to exist [22]; In this paper, liquids of intermediate viscosity to high viscosity (i.e. 12.09,
73.16, 136.1 and 713.4 mPa.s) were chosen to observe the early stage of spreading in different
surrounding pressure conditions.
For completely wetting surfaces (equilibrium contact angle, θeq = 0), the presence of a precursor
film caused the initial dynamics to be nearly identical to the coalescence of droplets with a wet
24
film [19]. Initial dynamic wetting is driven by capillarity and is averse to viscous dissipation of
the liquid for completely wetting surfaces [3], [13], [23], [24]. For spreading on completely wetting
surfaces, droplets grow as r~t(1 2⁄ ) [19] and for partially wetting surfaces the spreading radius, r,
follows a power law, r = Ctα (where C is a constant value and α is the spreading exponent). The
power law depends on the magnitude of force that resists drop deformation. To identify whether
our study displays power-law regimes, we determine the exponent as α = d ln r d lnt⁄ [19]. For
partially- and completely-wetting scenarios, inertia dominates spreading in the early stage, but the
duration of spreading for a particular drop depends on the characteristics of the surface and the
surrounding medium. In addition, theoretical and experimental studies have shown that an inertial
regime occurs before the viscous regime [19] [25]. Although the inertial regime is short lived as
compared to the viscous regime, inertia plays a significant role as a resistive force to spreading
during its early stages. As a result, the non-dimensional spreading law takes the form r R⁄ =
C(t τc⁄ )α where τc = (ρR3 σ⁄ )1 2⁄ is the inertial timescale. In the early stage of spreading, inertia
resists drop deformation, and the spreading radius scales as (Rσ/ρ)1 2⁄ t1 2⁄ , where ρ is the density
of drop, R is the drop radius and σ is the surface tension. In the later stage, where viscosity
dominates spreading, the radius follows a scale, r~ σt μ⁄ , where μ is the dynamic viscosity [20].
In addition, it was also shown that the spreading of a droplet is independent of drop size and surface
wettability in the first regime of spreading [15].
As discussed in this paper, we conducted the experimental investigation of early time dynamics of
microscale droplet spreading using high-speed imaging and drop shape analysis at elevated
pressure environments. Specifically, we observe the initial spreading phenomena of spreading
droplets on a partially wetting surface under various surrounding pressures using nitrogen gas. The
results from our experiments have shed light on interesting phenomena occurring at early
25
timescales that was previously unknown to researchers. Here, we have varied the pressure of the
surrounding medium stepwise in 10 MPa increments within the range between atmospheric
pressure, Patm to 30 MPa (gauge). In the following sections, the experimental setup to capture the
dynamics; the pressure effects on the droplet radius; the spreading velocities; the transition times;
and the contact angles are discussed in detail.
Results show that the temporal evolution of the spreading radius closely resembles a power law
where we calculate the empirically obtained exponent at different surrounding pressures.
Observations of spontaneous drop spreading reveal that spreading occurs through three distinct
regimes, namely: initial spreading regime, a short transition regime and a viscous regime. In this
study, we show that the spreading radius in the inertia-dominated early time dynamics scales as
r~tα where the exponent varies moderately with pressure. In addition, high pressure affects
contact line velocities and contact angle at the three-phase contact line. This work shows that high
values of spreading velocity and contact angle characterize the early regime of spreading.
2.3 Materials and experimental configuration
Experiments were carried out using a DSA100HP (KRÜSS GmbH - Germany) and a Phantom
V711 camera. Figure 2.1 shows the schematic of the experimental setup used. Information of the
substrate and experimental liquids used, experimental setup and the imaging system and also the
procedure of the experiment have been described in detail in the following three subsections.
26
Figure 2.1 Schematic of the experimental setup (pressurization system, manual dosing system
and imaging system) for investigating drop spreading in elevated pressure environments. A:
nitrogen gas cylinder, B: building nitrogen gas supply, C: booster pump, D: inlet gas valve, E:
outlet gas valve, F: fumehood, G: liquid reservoir, H: liquid inlet valve, I: manually controlled
piston accumulator, J: discharge valve connected to capillary, K: pressurized chamber, L:
capillary, M: substrate holder, N: solid substrate, O: droplet of liquid, P: high speed camera, Q:
LED light source, R: desktop computer for controlling the image system and drop shape analysis,
PI: pressure indicator. Items Q (high-speed camera) and R (LED light source) are oriented in such
a way they view the chamber perpendicularly to the page. Figure is not drawn to scale.
2.3.1 Substrate and experimental liquids
A hydrophobic, non-stick, temperature-resistant substrate - PTFE (Polytetrafluoroethylene –
purchased from McMaster-Carr), measuring 37mm W × 25.5 mm L × 1 mm D, was used in the
experiments. The cleaning procedure for the substrate employed isopropanol (IPA), deionized
water and compressed air for drying purposes. At first, the substrate was submerged in isopropanol
before being sonicated for 15 minutes. We then repeated the same sonication while submerging in
deionized water for another 15 min. Finally, we dried the PTFE substrates using compressed air.
27
For the test liquids, silicone oils of four different grades, purchased from Millipore Sigma were
used. We have determined experimentally the surface tension of the different grades of oil named
as D10, N35, S60, D500 to be 28.64 ± 0.10 𝑚𝑁/𝑚 , 30.97 ± 0.17𝑚𝑁/𝑚 , 31.54 ± 0.05 𝑚𝑁/
𝑚 & 32.28 ± 0.19 mN/m respectively at atmospheric conditions using the pendant drop method.
The properties of the silicone test liquids, as given by Millipore Sigma, are listed in Table 2-1.
Table 2-1 Physical properties of the different test liquids under investigation
Type of oil Temperature (℃ ) Viscosity (mPa.s) Density (g/ml)
D10 20 12.09 0.8299
N35 20 73.16 0.8562
S60 20 136.1 0.8601
D500 20 713.4 0.8723
2.3.2 Experimental setup (pressurization and manual dosing system)
The experiments were performed at 𝑃𝑎𝑡𝑚 as well as 10, 20 and 30 MPa gauge pressure. We
performed three trials in each condition to calculate the average value and standard deviation of
the spreading radius and contact angle. To avoid bubbles, several drops were allowed to form and
detach with the liquid line valve open on the high-pressure vessel. In this state, the pressure inside
the chamber remained at standard atmospheric conditions. Afterwards the pressurization chamber
was cleaned with isopropanol. Then, the substrate was placed on top of a custom-made 3D-printed
substrate holder, and both were then placed horizontally inside the chamber. The chamber was
then sealed using two sapphire viewing windows. By opening valve D, we pressurized the unit to
the desired level using nitrogen gas from cylinder A (purchased from Praxair Inc., Product number:
NI 5. OUH-T) and nitrogen gas from the building supply, B supplied at 100 psi (0.68 MPa). Both
lines of nitrogen gas merge at the booster pump, which amplified the pressure of the cylinder
28
nitrogen to a desired value before the gas was sent to the chamber. Afterwards, the system was left
to stabilize for 10 minutes.
A sequence of steps was followed to deposit the drop. Initially, the liquid reservoir, G, is filled
with the test liquid. Valve H was then opened, and piston I was moved to the opening position to
allow liquid to advance from the reservoir. After valve H is closed, and piston I is moved to the
closed position, valve J is opened to allow the test liquid to flow to the 1.1 mm diameter
capillary/needle for drop formation. Test liquids were discharged at a minimum outflow rate and
the drop is created using a quasi-static process for growth at the tip of the needle, which is always
kept at a fixed height above the substrate. Once the pendent drop was formed, valve J was closed,
and 2 minutes were then allowed for the interface of the droplet inside the pressurized chamber to
stabilize. Later, valve J was opened slightly and by moving piston I to the left, the drop detaches
from the needle and at the same time, the high-speed camera was triggered in order to record the
video of the initial spreading dynamics. After a trial was completed, the system was depressurized
by opening valve E by releasing pressurized gas to the fume hood. Finally, the substrate and
substrate holder were removed. The experiments were repeated after cleaning the needle, substrate
holder, pressurization chamber and by using a new PTFE substrate in each case.
2.3.3 Imaging system of the setup
We utilized a high-speed camera (Vision research, Phantom V711) for observing the initial
dynamics of the droplet. A tripod mount which consists of a tripod base (Manfrotto model 475B
Pro Geared Tripod) and a tripod head (Manfrotto 229 3D Super-Pro Head) was used to keep the
camera in position, and the camera was coupled to a macro lens to capture the front of the droplet
undergoing spreading. An LED light source (Nila Zaila - Daylight v2) was used as the backlight
to enhance image quality and contrast. For the camera settings, a frame rate of 20,000 fps and
29
exposure time of 40 µs were used with a 512 𝑝𝑥 × 384 𝑝𝑥 resolution for all the experiments. The
precision in measuring the spreading radius is ± 0.01 mm and contact angle is ± 0.1° in all cases.
The magnification of the lens was adjusted until two-thirds of the sensor’s field of view is covered
by the droplet.
Image calibration was performed before each repetition of the experiment using the capillary outer
diameter. Contact angles were measured using the ADVANCE software (KRŰSS GmbH) coupled
with the DSA (Drop Shape Analyser) 100 HP unit (KRŰSS GmbH); The base radius is, in turn,
measured from the raw video of the experiments processed in a separate image processing software
package (Image-Pro 10 Media Cybernetics). At high pressures, the surface tension was measured
from the experiment utilizing the Pendant Drop Technique.
2.4 Results and discussion
The effect of pressure on the initial spreading of droplet was investigated in this study. A pendent
drop, of volume 10 μL, was generated and was allowed to detach completely from the needle.
When the drop touches the PTFE substrate, it starts to spread. The capillary force works as the
driving force and the inertia force works as the resistive force during the initial stage of spreading
[26]. But if the substrate has wettability gradient we have to consider the instantaneous difference
in the contact angle that causes the spreading due to the unbalanced interfacial tension along the
three phase contact line [22]. Important parameters which affects the spreading behavior are
viscosity of the liquid, 𝜇𝐿 and interfacial tension of the liquid, 𝜎𝐿𝐺 [15], [27]. In our study we have
used the Nitrogen gas (𝑁2) as surrounding medium and by increasing the surrounding medium
pressure, the cohesive energy of the nitrogen gas (𝑁2) increases and thus the density of the medium
increases [28]. Unlike gas molecules, the molecules of a liquid are packed together tightly with
fixed intermolecular distance and can be marginally compressed with surrounding pressure [29].
30
Therefore, the density of the liquid (𝜌𝐿) is assumed to be constant with respect to pressures applied
in these experiments [30]. As the surrounding pressure is increased, the density difference between
the liquid phase and gas phase also decreases. By increasing the surrounding pressure, the viscosity
of the test liquids increases. Lucas [31], [32] performed tests with 55 polar and nonpolar liquids.
The author suggested an empirical equation that can estimate the change of viscosity with pressure
with errors less than 10%. The reduced fluidity or increased viscosity at the macro level can be
explained by an increased degree of intermolecular entanglement when the surrounding pressure
is raised [33].
Snapshots of the silicone oil N35 (73.16 mPa.s) droplet on the PTFE substrate, at different time
steps, in 𝑃𝑎𝑡𝑚 and in 30 MPa pressure conditions, are shown in Figure 2.2. At 𝑡 =
796.85 𝑚𝑠 droplets from both cases reach the equilibrium state. We observe that the drop has a
more spherical shape at 30 MPa pressure compared to the drop at 𝑃𝑎𝑡𝑚; thus, an increase in
surrounding pressure appears to produce a more pronounced spherical shape. This clearly suggests
that at a given time step, the N35 (73.16 mPa.s) droplet spreads more at 𝑃𝑎𝑡𝑚 compared to a higher-
pressure surrounding condition (e.g. 30 MPa) and this difference is more prominent in the later
stage of spreading. The surrounding pressure generates a resistive force against the spreading of
droplet which causes the drop to spread less in higher surrounding pressures compared to
atmospheric conditions. This indicates that the wetting area and wetting radius is higher in
atmospheric pressure conditions than at elevated chamber pressures and it reduces gradually with
the increase of pressure. We also observe that in case of low viscous liquids such as D10 (12.09
mPa.s), the drop completely detaches from the needle before touching the substrate. However for
highly viscous liquids such as D500 (713.4 mPa.s) a neck is observed to form between the droplet
and the needle during drop deposition. In addition, the viscosity of the test liquid increases with
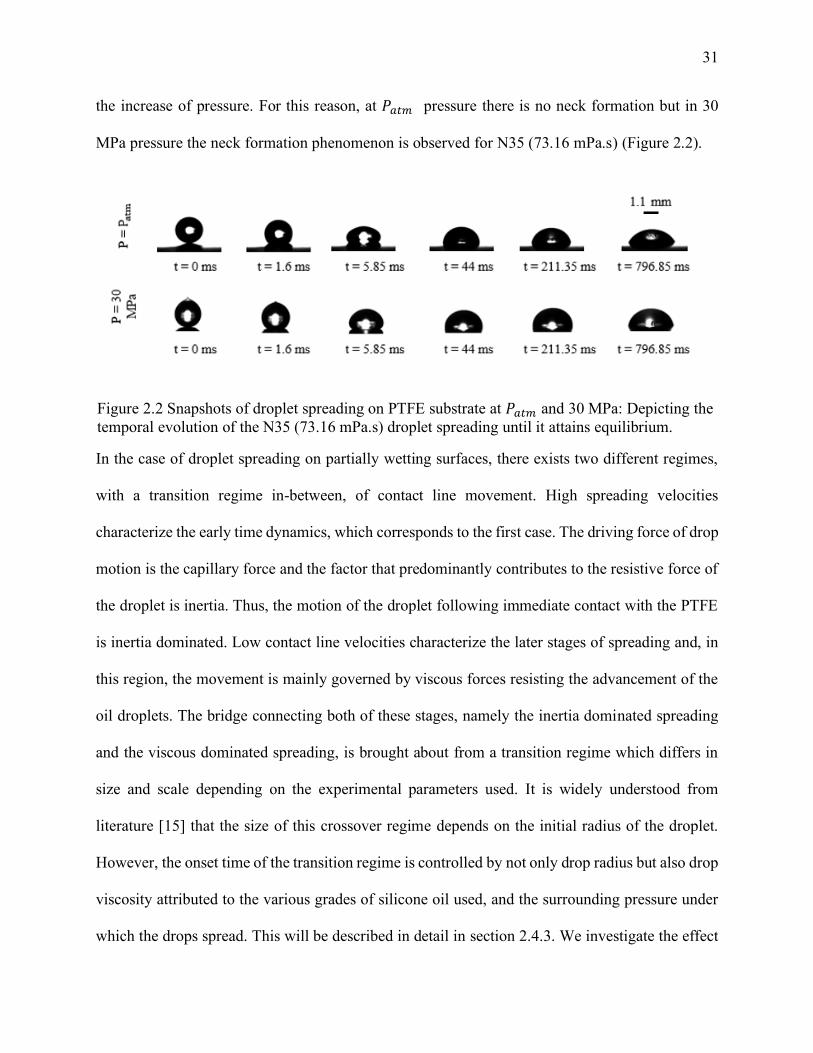
31
the increase of pressure. For this reason, at 𝑃𝑎𝑡𝑚 pressure there is no neck formation but in 30
MPa pressure the neck formation phenomenon is observed for N35 (73.16 mPa.s) (Figure 2.2).
Figure 2.2 Snapshots of droplet spreading on PTFE substrate at 𝑃𝑎𝑡𝑚 and 30 MPa: Depicting the
temporal evolution of the N35 (73.16 mPa.s) droplet spreading until it attains equilibrium.
In the case of droplet spreading on partially wetting surfaces, there exists two different regimes,
with a transition regime in-between, of contact line movement. High spreading velocities
characterize the early time dynamics, which corresponds to the first case. The driving force of drop
motion is the capillary force and the factor that predominantly contributes to the resistive force of
the droplet is inertia. Thus, the motion of the droplet following immediate contact with the PTFE
is inertia dominated. Low contact line velocities characterize the later stages of spreading and, in
this region, the movement is mainly governed by viscous forces resisting the advancement of the
oil droplets. The bridge connecting both of these stages, namely the inertia dominated spreading
and the viscous dominated spreading, is brought about from a transition regime which differs in
size and scale depending on the experimental parameters used. It is widely understood from
literature [15] that the size of this crossover regime depends on the initial radius of the droplet.
However, the onset time of the transition regime is controlled by not only drop radius but also drop
viscosity attributed to the various grades of silicone oil used, and the surrounding pressure under
which the drops spread. This will be described in detail in section 2.4.3. We investigate the effect
32
of these experimental parameters in detail. Furthermore, the dynamics of the droplets, for the four
different grades of oil used, is characterized by the instantaneous spreading velocity in both the
early regime, as well as the late regime, of spreading. In addition to the spreading velocity plots,
the temporal evolution of the contact angle was used to characterize the spreading dynamics in
these regimes with special emphasis on the early time dynamics that appear before the transition
regime.
2.4.1 Surrounding pressure effects on the spreading radius
Figure 2.3 illustrates the time evolution of the spreading radius experimental values during the
early stage of spreading, as well as the later stages of wetting, for different grades of silicone oils.
For a select silicone oil, the surrounding ambient chamber pressure surrounding the droplet
distinguishes the four curves from one another. Specifically, we plot, on a cartesian axis, the results
for four different gauge pressure conditions: Patm, 10 MPa, 20 MPa and 30 MPa. Here, we observe
that the curves splinter into four distinct sets quickly after making contact with the PTFE substrate.
In Figure 2.3, four different viscosity liquids were used to characterize the spreading of droplets
with the variation of pressure. Considering D10 at atmospheric conditions, the starting radius is
0.5 ± 0.1 mm. It is 0.25 ± 0.1 mm for N35 and for S60 and D500 it is 0.1 ± 0.1 mm. This variation
is due to the effect of viscosity of the liquid. With the increase of viscosity, a smaller wetting
perimeter of the droplet is generated at the point when the drop touches the substrate. The effect
of viscosity on the wetting perimeter remains for elevated pressures as well. Furthermore, pressure
has a significant influence on the spreading radius for intermediate and high viscosity silicone oil
in the later stages of wetting. Although, in the later stages of wetting, pressure has larger effect on
the spreading radius for intermediate viscosity liquids than for high viscosity liquids; In the latter
case, pressure effects are significantly less pronounced. The inset plot of Figure 2.3 depicts values
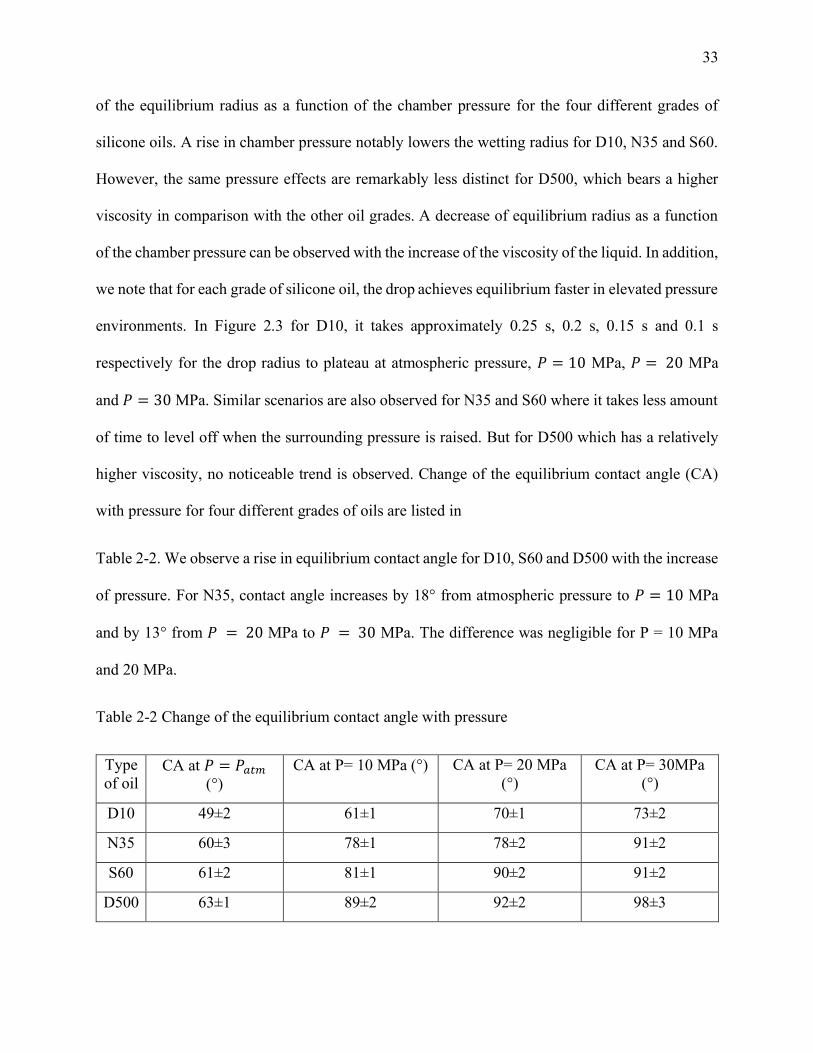
33
of the equilibrium radius as a function of the chamber pressure for the four different grades of
silicone oils. A rise in chamber pressure notably lowers the wetting radius for D10, N35 and S60.
However, the same pressure effects are remarkably less distinct for D500, which bears a higher
viscosity in comparison with the other oil grades. A decrease of equilibrium radius as a function
of the chamber pressure can be observed with the increase of the viscosity of the liquid. In addition,
we note that for each grade of silicone oil, the drop achieves equilibrium faster in elevated pressure
environments. In Figure 2.3 for D10, it takes approximately 0.25 s, 0.2 s, 0.15 s and 0.1 s
respectively for the drop radius to plateau at atmospheric pressure, 𝑃 = 10 MPa, 𝑃 = 20 MPa
and 𝑃 = 30 MPa. Similar scenarios are also observed for N35 and S60 where it takes less amount
of time to level off when the surrounding pressure is raised. But for D500 which has a relatively
higher viscosity, no noticeable trend is observed. Change of the equilibrium contact angle (CA)
with pressure for four different grades of oils are listed in
Table 2-2. We observe a rise in equilibrium contact angle for D10, S60 and D500 with the increase
of pressure. For N35, contact angle increases by 18° from atmospheric pressure to 𝑃 = 10 MPa
and by 13° from 𝑃 = 20 MPa to 𝑃 = 30 MPa. The difference was negligible for P = 10 MPa
and 20 MPa.
Table 2-2 Change of the equilibrium contact angle with pressure
Type
of oil CA at 𝑃 = 𝑃𝑎𝑡𝑚
(°)
CA at P= 10 MPa (°) CA at P= 20 MPa
(°)
CA at P= 30MPa
(°)
D10 49±2 61±1 70±1 73±2
N35 60±3 78±1 78±2 91±2
S60 61±2 81±1 90±2 91±2
D500 63±1 89±2 92±2 98±3
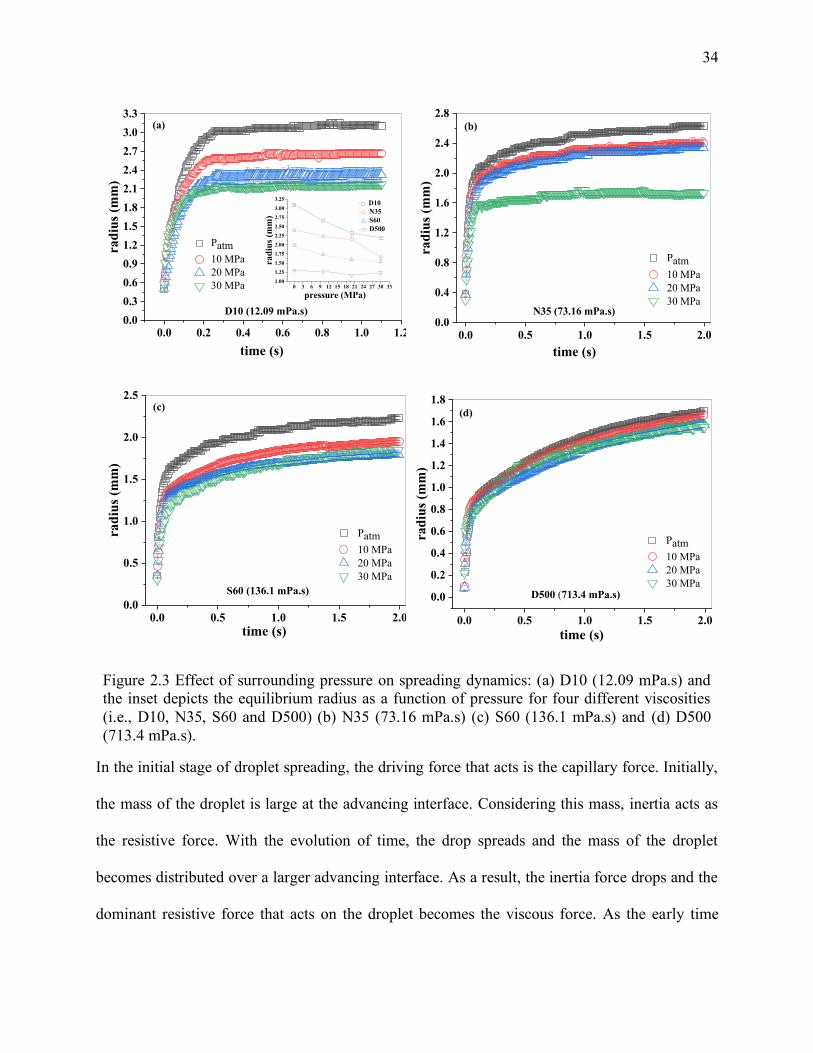
34
In the initial stage of droplet spreading, the driving force that acts is the capillary force. Initially,
the mass of the droplet is large at the advancing interface. Considering this mass, inertia acts as
the resistive force. With the evolution of time, the drop spreads and the mass of the droplet
becomes distributed over a larger advancing interface. As a result, the inertia force drops and the
dominant resistive force that acts on the droplet becomes the viscous force. As the early time
Figure 2.3 Effect of surrounding pressure on spreading dynamics: (a) D10 (12.09 mPa.s) and
the inset depicts the equilibrium radius as a function of pressure for four different viscosities
(i.e., D10, N35, S60 and D500) (b) N35 (73.16 mPa.s) (c) S60 (136.1 mPa.s) and (d) D500
(713.4 mPa.s).
0.0 0.2 0.4 0.6 0.8 1.0 1.20.0
0.3
0.6
0.9
1.2
1.5
1.8
2.1
2.4
2.7
3.0
3.3(a)
Patm
10 MPa
20 MPa
30 MPa
rad
ius
(mm
)
time (s)
D10 (12.09 mPa.s)
0 3 6 9 12 15 18 21 24 27 30 331.00
1.25
1.50
1.75
2.00
2.25
2.50
2.75
3.00
3.25 D10
N35
S60
D500
rad
ius
(mm
)
pressure (MPa)
0.0 0.5 1.0 1.5 2.00.0
0.4
0.8
1.2
1.6
2.0
2.4
2.8(b)
Patm
10 MPa
20 MPa
30 MPa
ra
diu
s (m
m)
time (s)
N35 (73.16 mPa.s)
0.0 0.5 1.0 1.5 2.00.0
0.5
1.0
1.5
2.0
2.5(c)
Patm
10 MPa
20 MPa
30 MPa
rad
ius
(mm
)
time (s)
S60 (136.1 mPa.s)
0.0 0.5 1.0 1.5 2.0
0.0
0.2
0.4
0.6
0.8
1.0
1.2
1.4
1.6
1.8(d)
Patm
10 MPa
20 MPa
30 MPa
rad
ius
(mm
)
time (s)
D500 (713.4 mPa.s)
35
dynamics are inertia dominated, we normalize the time axis by the inertial time scale and radius
by initial radius, R. This is shown in the logarithmic plots of Figure 2.4. Here, log-log plots were
generated to show the effect of pressure at the initial stage of spreading, which effectively
emphasizes the early time dynamics. Evolution of dimensionless spreading radius r/R as a function
of dimensionless time 𝑡∗ = 𝑡/(𝜌𝑅3/σ)0.5 for D10, N35, S60 and D500 droplets at gauge pressure
of 𝑃𝑎𝑡𝑚, 10 MPa, 20 MPa and 30 MPa has been shown.

36
Figure 2.4 Dynamics of droplet spreading under various surrounding chamber pressures:
Evolution of dimensionless spreading radius, r*= r/R as a function of non-dimensional time, t*=
t/(𝜌𝑅3/σ)0.5 for (a) D10 (12.09 mPa.s) (b) N35 (73.16 mPa.s) (c) S60 (136.1 mPa.s) and (d)
D500 (713.4 mPa.s) droplets at gauge pressure of 𝑃𝑎𝑡𝑚, 10 MPa, 20 MPa and 30 MPa.
As evident from Figure 2.4, pressure has a strong influence on the early time dynamics for D10.
Two parts of initial spreading are identified based on the spreading radius, namely: Phase I –
which takes place at very early times immediately following contact of the drop with the
substrate, and Phase II – faster paced dynamics before the onset of transition (Figure 2.4). Both
of these regimes are influenced by pressure. Although few data points exist because of the fast
dynamics involved, the conventional inertial regime is preceded by another regime characterized
10-1 100 101 102
0.50
1.00
1.50
2.00
2.50
Phase I
Phase II
Patm
10 MPa
20 MPa
30 MPa
t*
r*
(a) D10 (12.09 mPa.s)
10-1 100 101 102
0.5
1
1.5
2
Patm
10 MPa
20 MPa
30 MPa
r*
t*
(b) N35 (73.16 mPa.s)
10-1 100 101 102
0.3
0.6
0.9
1.2
1.5
Patm
10 MPa
20 MPa
30 MPa
r*
t*
(c) S60 (136.1 mPa.s)
10-1 100 101 102
0.1
1
Patm
10 MPa
20 MPa
30 MPa
(d) D500 (713.4 mPa.s)
r*
t*
37
by slightly slower dynamics for intermediate viscosity oils such as D10, N35 and S60. This
Phase I spreading regime is heavily influenced by pressure. However, this new early regime of
dynamics is non-existent for high viscosity oil such as D500 as evident from its monotone climb
in spreading radius immediately following contact with the substrate. The viscosity ratio of
D500 to air is very high (𝜇𝐷500/𝜇𝑎𝑖𝑟 = 38835.05). This high viscosity ratio gives evidence that
inertial spreading for D500 is viscosity dominated which is similar to the study found in [16] for
high viscosity liquids. Moreover, this early regime splintering is observable for all cases with
varying degree of intensity. N35 and D500 shows little influence of pressure on the early stage
of spreading except when the pressure rose to 30 MPa for D500.
2.4.2 Spreading coefficient, α
The dimensionless spreading radius scales as 𝑟/𝑅 ∝ (𝑡/𝜏𝐶)𝛼 where 𝜏𝐶 is the inertial time scale
and α is the experimentally derived spreading exponent. The spreading exponent, α, for D10,
N35, S60 and D500 at various gauge chamber pressures (𝑃𝑎𝑡𝑚, 10, 20, 30 MPa) has been
calculated and is plotted in Figure 2.5 We observe that with the increase of pressure, exponent
α decreases for the four different grades of liquid with D10 showing the highest decrease in α
between 20 and 30 MPa. In addition, exponent α increases with the increase of the viscosity of
the liquids.
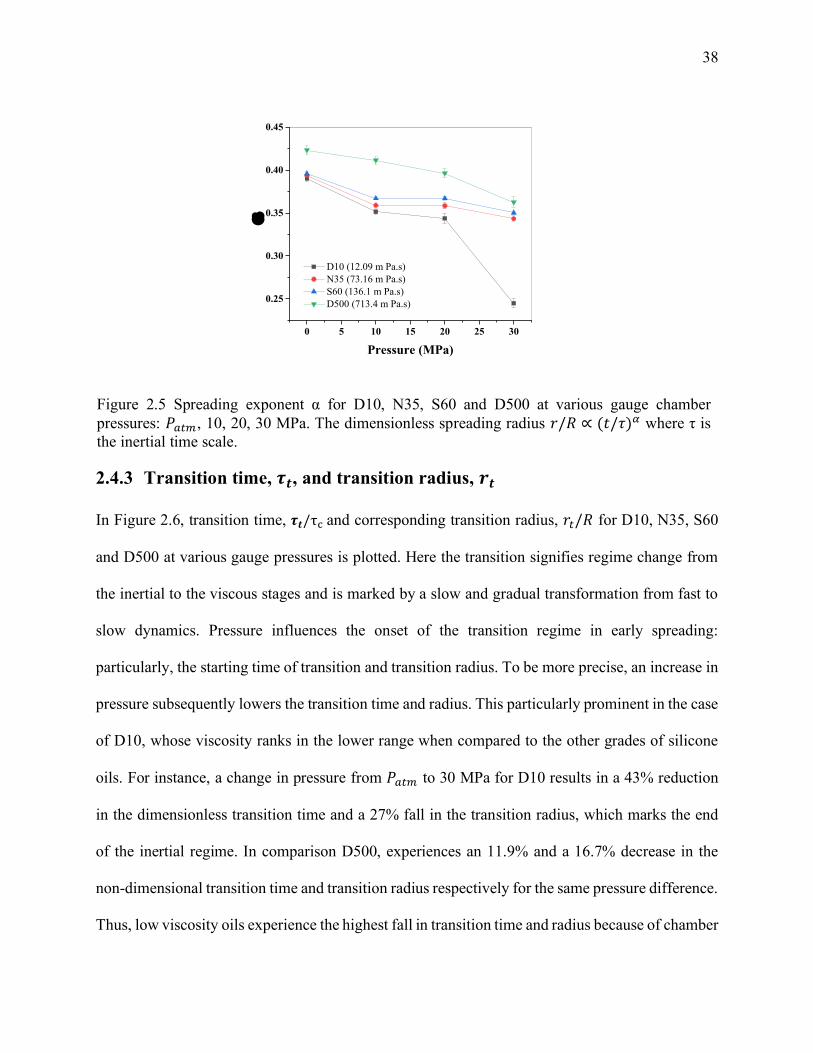
38
0 5 10 15 20 25 30
0.25
0.30
0.35
0.40
0.45
Pressure (MPa)
D10 (12.09 m Pa.s)
N35 (73.16 m Pa.s)
S60 (136.1 m Pa.s)
D500 (713.4 m Pa.s)
a
Figure 2.5 Spreading exponent α for D10, N35, S60 and D500 at various gauge chamber
pressures: 𝑃𝑎𝑡𝑚, 10, 20, 30 MPa. The dimensionless spreading radius 𝑟/𝑅 ∝ (𝑡/𝜏)𝛼 where τ is
the inertial time scale.
2.4.3 Transition time, 𝝉𝒕, and transition radius, 𝒓𝒕
In Figure 2.6, transition time, 𝝉𝒕/τc and corresponding transition radius, 𝑟𝑡/𝑅 for D10, N35, S60
and D500 at various gauge pressures is plotted. Here the transition signifies regime change from
the inertial to the viscous stages and is marked by a slow and gradual transformation from fast to
slow dynamics. Pressure influences the onset of the transition regime in early spreading:
particularly, the starting time of transition and transition radius. To be more precise, an increase in
pressure subsequently lowers the transition time and radius. This particularly prominent in the case
of D10, whose viscosity ranks in the lower range when compared to the other grades of silicone
oils. For instance, a change in pressure from 𝑃𝑎𝑡𝑚 to 30 MPa for D10 results in a 43% reduction
in the dimensionless transition time and a 27% fall in the transition radius, which marks the end
of the inertial regime. In comparison D500, experiences an 11.9% and a 16.7% decrease in the
non-dimensional transition time and transition radius respectively for the same pressure difference.
Thus, low viscosity oils experience the highest fall in transition time and radius because of chamber
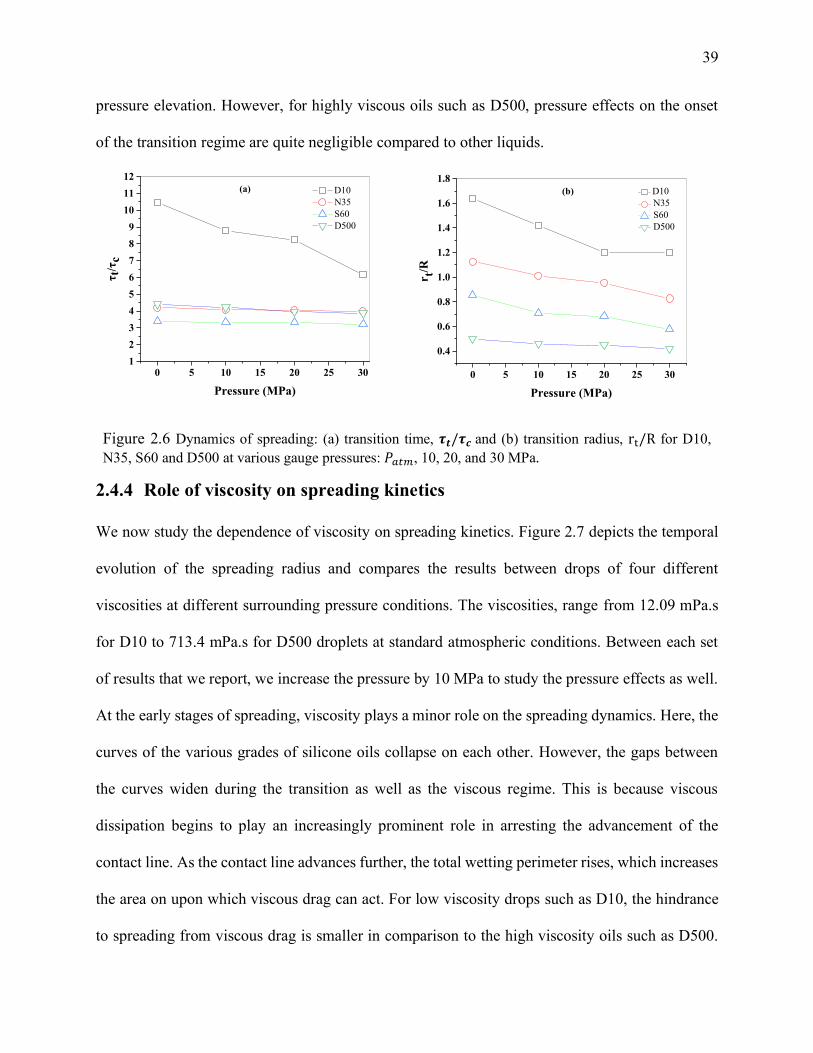
39
pressure elevation. However, for highly viscous oils such as D500, pressure effects on the onset
of the transition regime are quite negligible compared to other liquids.
Figure 2.6 Dynamics of spreading: (a) transition time, 𝝉𝒕/𝝉𝒄 and (b) transition radius, rt/R for D10,
N35, S60 and D500 at various gauge pressures: 𝑃𝑎𝑡𝑚, 10, 20, and 30 MPa.
2.4.4 Role of viscosity on spreading kinetics
We now study the dependence of viscosity on spreading kinetics. Figure 2.7 depicts the temporal
evolution of the spreading radius and compares the results between drops of four different
viscosities at different surrounding pressure conditions. The viscosities, range from 12.09 mPa.s
for D10 to 713.4 mPa.s for D500 droplets at standard atmospheric conditions. Between each set
of results that we report, we increase the pressure by 10 MPa to study the pressure effects as well.
At the early stages of spreading, viscosity plays a minor role on the spreading dynamics. Here, the
curves of the various grades of silicone oils collapse on each other. However, the gaps between
the curves widen during the transition as well as the viscous regime. This is because viscous
dissipation begins to play an increasingly prominent role in arresting the advancement of the
contact line. As the contact line advances further, the total wetting perimeter rises, which increases
the area on upon which viscous drag can act. For low viscosity drops such as D10, the hindrance
to spreading from viscous drag is smaller in comparison to the high viscosity oils such as D500.
0 5 10 15 20 25 301
2
3
4
5
6
7
8
9
10
11
12
D10
N35
S60
D500
τt/
τc
Pressure (MPa)
(a)
0 5 10 15 20 25 30
0.4
0.6
0.8
1.0
1.2
1.4
1.6
1.8
D10
N35
S60
D500
r t/R
Pressure (MPa)
(b)
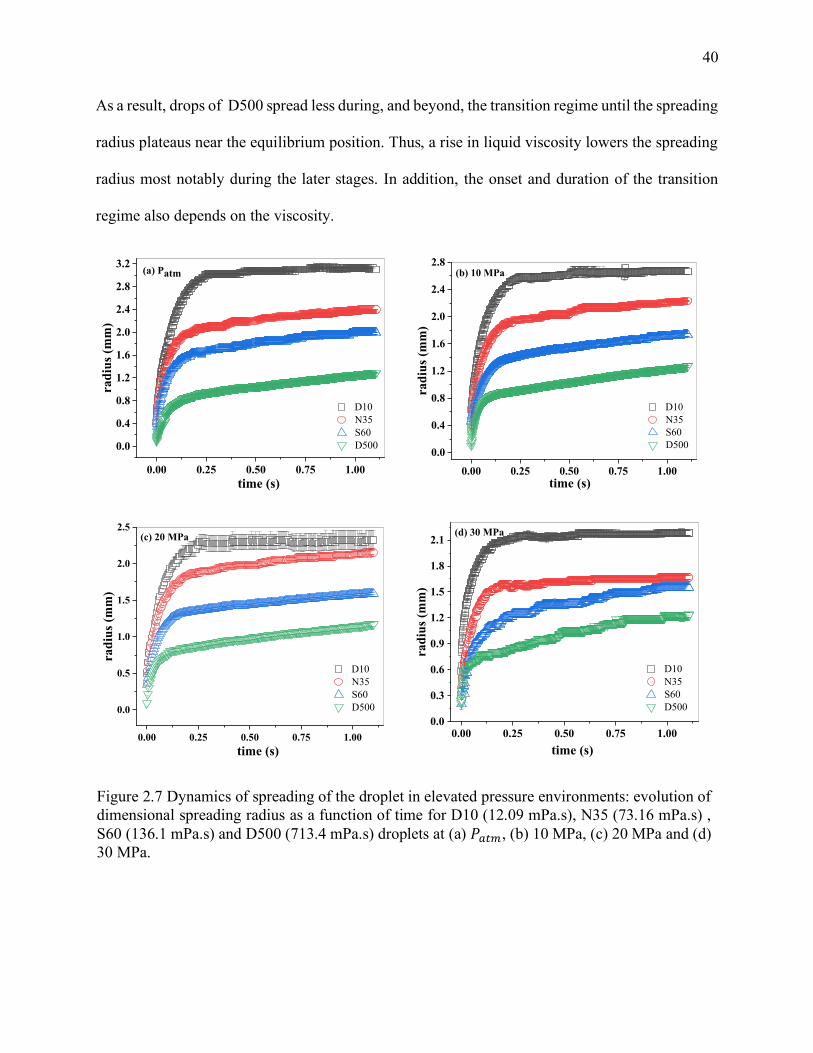
40
As a result, drops of D500 spread less during, and beyond, the transition regime until the spreading
radius plateaus near the equilibrium position. Thus, a rise in liquid viscosity lowers the spreading
radius most notably during the later stages. In addition, the onset and duration of the transition
regime also depends on the viscosity.
Figure 2.7 Dynamics of spreading of the droplet in elevated pressure environments: evolution of
dimensional spreading radius as a function of time for D10 (12.09 mPa.s), N35 (73.16 mPa.s) ,
S60 (136.1 mPa.s) and D500 (713.4 mPa.s) droplets at (a) 𝑃𝑎𝑡𝑚, (b) 10 MPa, (c) 20 MPa and (d)
30 MPa.
0.00 0.25 0.50 0.75 1.00
0.0
0.4
0.8
1.2
1.6
2.0
2.4
2.8
3.2
D10
N35
S60
D500
rad
ius
(mm
)
time (s)
(a) Patm
0.00 0.25 0.50 0.75 1.00
0.0
0.4
0.8
1.2
1.6
2.0
2.4
2.8
D10
N35
S60
D500
rad
ius
(mm
)
time (s)
(b) 10 MPa
0.00 0.25 0.50 0.75 1.00
0.0
0.5
1.0
1.5
2.0
2.5
D10
N35
S60
D500
rad
ius
(mm
)
time (s)
(c) 20 MPa
0.00 0.25 0.50 0.75 1.000.0
0.3
0.6
0.9
1.2
1.5
1.8
2.1
D10
N35
S60
D500
rad
ius
(mm
)
time (s)
(d) 30 MPa
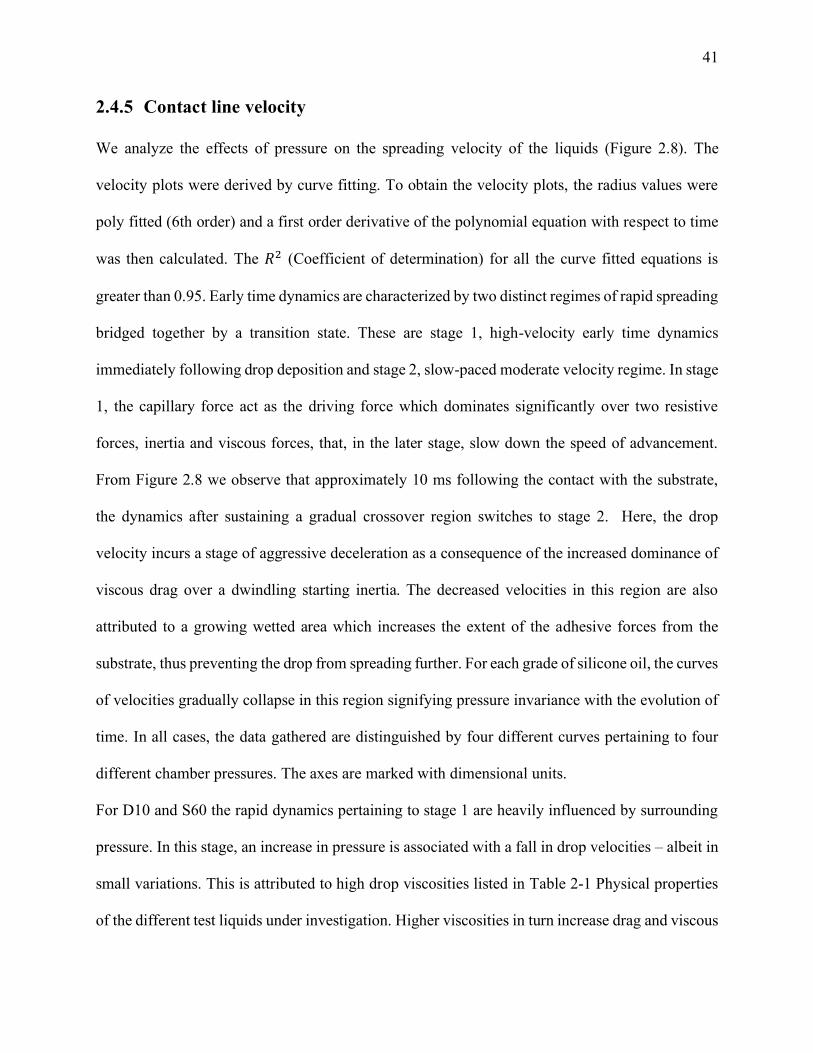
41
2.4.5 Contact line velocity
We analyze the effects of pressure on the spreading velocity of the liquids (Figure 2.8). The
velocity plots were derived by curve fitting. To obtain the velocity plots, the radius values were
poly fitted (6th order) and a first order derivative of the polynomial equation with respect to time
was then calculated. The 𝑅2 (Coefficient of determination) for all the curve fitted equations is
greater than 0.95. Early time dynamics are characterized by two distinct regimes of rapid spreading
bridged together by a transition state. These are stage 1, high-velocity early time dynamics
immediately following drop deposition and stage 2, slow-paced moderate velocity regime. In stage
1, the capillary force act as the driving force which dominates significantly over two resistive
forces, inertia and viscous forces, that, in the later stage, slow down the speed of advancement.
From Figure 2.8 we observe that approximately 10 ms following the contact with the substrate,
the dynamics after sustaining a gradual crossover region switches to stage 2. Here, the drop
velocity incurs a stage of aggressive deceleration as a consequence of the increased dominance of
viscous drag over a dwindling starting inertia. The decreased velocities in this region are also
attributed to a growing wetted area which increases the extent of the adhesive forces from the
substrate, thus preventing the drop from spreading further. For each grade of silicone oil, the curves
of velocities gradually collapse in this region signifying pressure invariance with the evolution of
time. In all cases, the data gathered are distinguished by four different curves pertaining to four
different chamber pressures. The axes are marked with dimensional units.
For D10 and S60 the rapid dynamics pertaining to stage 1 are heavily influenced by surrounding
pressure. In this stage, an increase in pressure is associated with a fall in drop velocities – albeit in
small variations. This is attributed to high drop viscosities listed in Table 2-1 Physical properties
of the different test liquids under investigation. Higher viscosities in turn increase drag and viscous
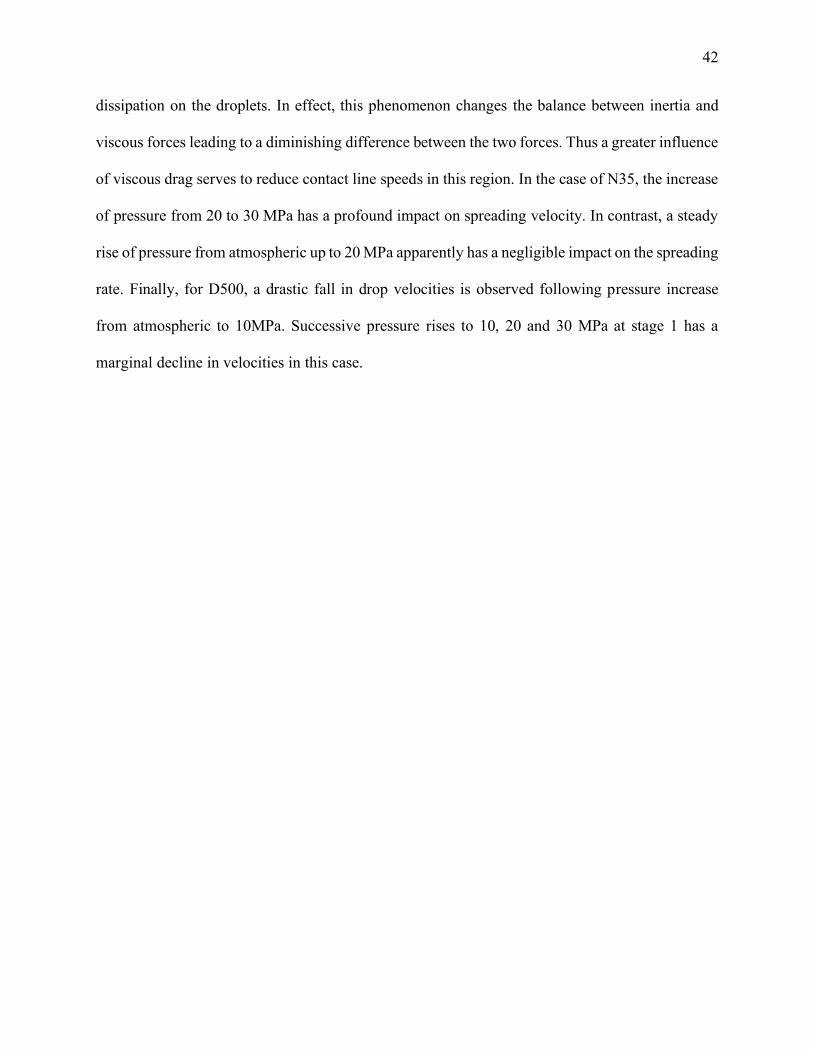
42
dissipation on the droplets. In effect, this phenomenon changes the balance between inertia and
viscous forces leading to a diminishing difference between the two forces. Thus a greater influence
of viscous drag serves to reduce contact line speeds in this region. In the case of N35, the increase
of pressure from 20 to 30 MPa has a profound impact on spreading velocity. In contrast, a steady
rise of pressure from atmospheric up to 20 MPa apparently has a negligible impact on the spreading
rate. Finally, for D500, a drastic fall in drop velocities is observed following pressure increase
from atmospheric to 10MPa. Successive pressure rises to 10, 20 and 30 MPa at stage 1 has a
marginal decline in velocities in this case.
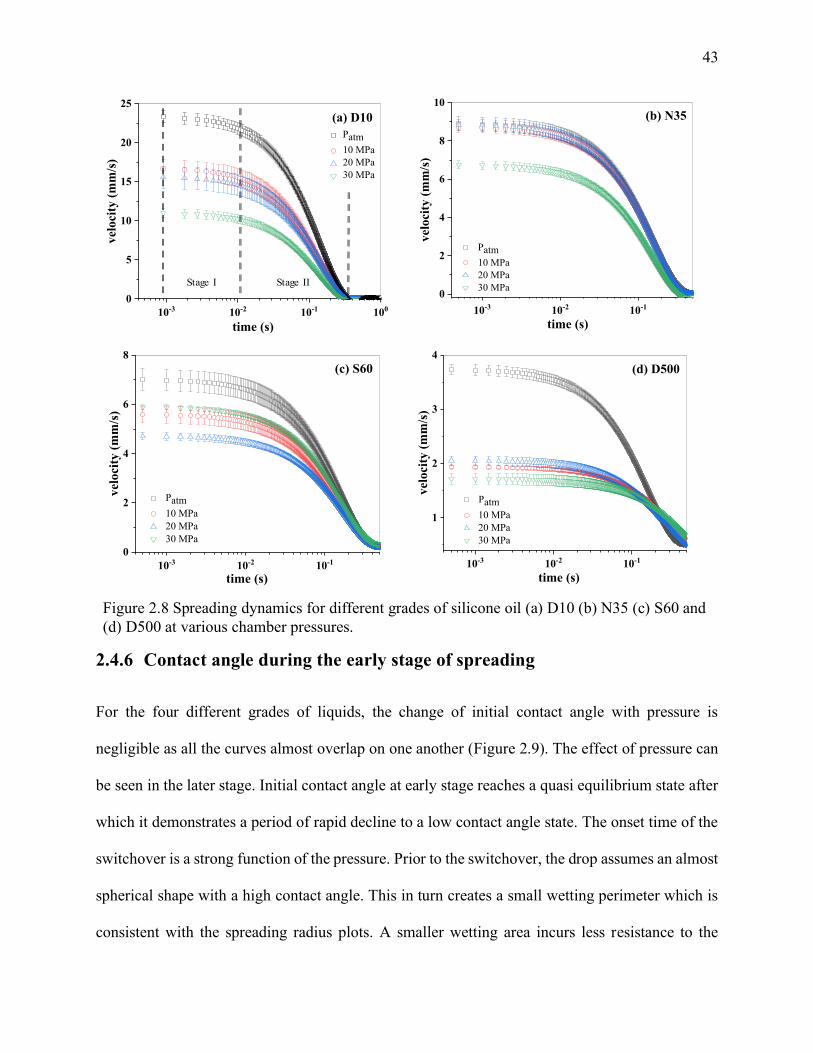
43
Figure 2.8 Spreading dynamics for different grades of silicone oil (a) D10 (b) N35 (c) S60 and
(d) D500 at various chamber pressures.
2.4.6 Contact angle during the early stage of spreading
For the four different grades of liquids, the change of initial contact angle with pressure is
negligible as all the curves almost overlap on one another (Figure 2.9). The effect of pressure can
be seen in the later stage. Initial contact angle at early stage reaches a quasi equilibrium state after
which it demonstrates a period of rapid decline to a low contact angle state. The onset time of the
switchover is a strong function of the pressure. Prior to the switchover, the drop assumes an almost
spherical shape with a high contact angle. This in turn creates a small wetting perimeter which is
consistent with the spreading radius plots. A smaller wetting area incurs less resistance to the
10-3 10-2 10-1 100
0
5
10
15
20
25
Stage I Stage II
Patm
10 MPa
20 MPa
30 MPa
vel
oci
ty (
mm
/s)
time (s)
(a) D10
10-3 10-2 10-1
0
2
4
6
8
10
Patm
10 MPa
20 MPa
30 MPa
vel
oci
ty (
mm
/s)
time (s)
(b) N35
10-3 10-2 10-1
0
2
4
6
8
Patm
10 MPa
20 MPa
30 MPa
vel
oci
ty (
mm
/s)
time (s)
(c) S60
10-3 10-2 10-1
1
2
3
4
Patm
10 MPa
20 MPa
30 MPa
vel
oci
ty (
mm
/s)
time (s)
(d) D500
44
advancement of the contact line which is in line with lower retardation and higher velocities in this
regime as opposed to the slower dynamics post switchover. Thus, pressure has a greater influence
on the start of the switchover than on the contact angle values themselves which seems to be
pressure invariant on account of the fact that the curves collapse on one another. Hence, the Phase
I dynamics, which depend largely on pressure, are characterized by high contact angle and high
velocities.
In contrast, the influence of pressure is heightened during the rapid transition period and this is
especially apparent for N35, S60 and D500. The splintering due to high pressure is further
amplified in the post switchover regime with curves of N35 and S60 increasingly digressing from
one another showing a strong pressure dependence is this region. For D10 however the curves
gradually converge with the evolution of time. This shows that for liquids with low viscosity, the
post switchover to slower dynamics is largely independent of pressure.

45
Figure 2.9 Initial contact angle as a function of time for different grades of silicone oil droplets
at various chamber pressures. (a) D10 (b) N35 (c) S60 (d) D500
The findings of this study can be applied to the spreading mechanics of supercritical CO2 in deep
porous reservoirs used for curbing atmospheric emissions [34]. At these reservoirs depths, the CO2
in its supercritical state behaves like a liquid with the laws of fluid mechanics governing its motion.
In addition, the spreading phenomenon takes place with an exceedingly high pressure being
applied by the surrounding brine, which is typically found in depleted reservoirs. Since capillarity
effects play a large role at the pore scale of these aquifers, our research findings can thus be used
in estimating the timescales for both lateral and vertical spreading of the injectate at high pressure.
10-3 10-2 10-1 100
50
75
100
125
150
175
Patm
10 MPa
20 MPa
30 MPa
con
tact
an
gle
(°)
time (s)
(a) D10
10-3 10-2 10-1 100
70
105
140
175
Patm
10 MPa
20 MPa
30 MPa
con
tact
an
gle
(°)
time (s)
(b) N35
10-3 10-2 10-1 100
105
140
175
Patm
10 MPa
20 MPa
30 MPa
con
tact
an
gle
(°)
time (s)
(c) S60
10-3 10-2 10-1 100
105
140
175
Patm
10 MPa
20 MPa
30 MPa
con
tact
an
gle
(°)
time (s)
(d) D500
46
It would be interesting to further investigate the initial spreading using CO2 or in a viscous outer
medium at different surrounding pressure condition.
2.5 Conclusion
In this study, we investigate the early time spreading dynamics of different grades of silicone oils
on PTFE at various surrounding pressures. Experiments show that the drops of intermediate
viscosity cover a smaller wetting area and attains a pronounced spherical shape with the increase
of ambient pressure although pressure effects are less prominent on the advancement of the contact
line in spreading for high viscosity oils. In addition, a rise in viscosity produces similar effects on
the spreading dynamics: the instantaneous spreading radius and equilibrium radius both fall on
account of higher viscous dissipation. We observe that the inertia dominated early-stage spreading
consists of two regions: a slow starting regime that occurs at Phase I after the drops make contact
with the substrate and Phase II is the fast-paced dynamics which materializes before the
transition regime. In the first region, the curves of spreading radius are splintered and the degree
of this splintering is largely dependent on pressure. As time passes, the splintered curves collapse
onto a master curve with varying levels of magnitude. High velocity and a large empirically
obtained exponent characterize the cross over to the second regime at the early stages. The
exponent, α, falls with rising pressure and exhibits the largest change for low viscosity oils. With
increasing pressure and viscosity, the transition time and transition radius both fall, again with
noteworthy significance for the lowest viscosity silicone oil used. Similar to the results of α,
pressure effects on the transition time, are negligible for highest viscous liquid (D500) whose entire
spreading regime is viscosity dominated. We also conclude that contact line velocity is highly
influenced by pressure, particularly in the first stage of the early time dynamics where a rise in
pressure significantly lowers the spreading velocity. In the second stage of the early inertial
47
regime, the curves of velocities collapse upon each other. The fall in velocities is due to increased
viscous drag stemming from contact line dissipation. Finally, the contact line dynamics at the early
stages are distinguished by high values of the contact angle and spreading velocities. For future
work, initial spreading studies can be further investigated to include a high viscosity liquid
surrounding medium and can be conducted at elevated substrate or surrounding temperatures.
References
[1] C. Yu, C. Bin Zhang, Y. P. Chen, and M. H. Shi, “Spreading of droplet on a rough solid
surface,” K. Cheng Je Wu Li Hsueh Pao/Journal Eng. Thermophys., vol. 35, no. 1, pp.
145–147, 2014.
[2] P.G. De Gennes, F. Brochard- Wyart, D. Quere, “Capillarity and Wetting Phenomena:
Drops, Bubbles, Pearls, Waves,” Springer Science & Business Media, 2013.
[3] P. G. De Gennes, “Wetting: Statics and dynamics,” Rev. Mod. Phys., vol. 57, no. 3, pp.
827–863, 1985.
[4] B. Shen, M. Leman, M. Reyssat, and P. Tabeling, “Dynamics of a small number of
droplets in microfluidic Hele-Shaw cells,” Exp. Fluids, vol. 55, no. 5, 2014.
[5] K. Ishigaki, “An Essay on Performance-Reproduction,” J. Philos. Sport Phys. Educ., vol.
17, no. 1, pp. 39–55, 1995.
[6] D. Bonn, J. Eggers, J. Indekeu, and J. Meunier, “Wetting and spreading,” Rev. Mod. Phys.,
vol. 81, no. 2, pp. 739–805, 2009.
[7] E. Villermaux and B. Bossa, “Single-drop fragmentation determines size distribution of
raindrops,” Nat. Phys., vol. 5, no. 9, pp. 697–702, 2009.
[8] P. R. Waghmare, N. S. K. Gunda, and S. K. Mitra, “Under-water superoleophobicity of
fish scales,” Sci. Rep., vol. 4, pp. 1–5, 2014.
48
[9] N. Shojai Kaveh, E. S. J. Rudolph, P. Van Hemert, W. R. Rossen, and K. H. Wolf,
“Wettability evaluation of a CO2/water/bentheimer sandstone system: Contact angle,
dissolution, and bubble size,” Energy and Fuels, vol. 28, no. 6, pp. 4002–4020, 2014.
[10] J. L. Dickson, G. Gupta, T. S. Horozov, B. P. Binks, and K. P. Johnston, “Wetting
phenomena at the CO2//water/glass interface,” Langmuir, vol. 22, no. 5, pp. 2161–2170,
2006.
[11] Y. Sutjiadi-Sia, P. Jaeger, and R. Eggers, “Interfacial phenomena of aqueous systems in
dense carbon dioxide,” J. Supercrit. Fluids, vol. 46, no. 3, pp. 272–279, 2008.
[12] O. V. Voinov, “Hydrodynamics of wetting,” Fluid Dyn., vol. 11, no. 5, pp. 714–721,
1976.
[13] L. H. Tanner, “The spreading of silicone oil drops on horizontal surfaces.,” J. Phys.-D.,
vol. 12, no. 9, Sep.14, 1979, pp.1473-1484., 1979.
[14] R. G. Cox, “The dynamics of the spreading of liquids on a solid surface. Part 2.
Surfactants,” J. Fluid Mech., vol. 168, pp. 195–220, 1986.
[15] A. Eddi, K. G. Winkels, and J. H. Snoeijer, “Short time dynamics of viscous drop
spreading,” Phys. Fluids, vol. 25, no. 1, 2013.
[16] K. G. Winkels, J. H. Weijs, A. Eddi, and J. H. Snoeijer, “Initial spreading of low-viscosity
drops on partially wetting surfaces,” Phys. Rev. E - Stat. Nonlinear, Soft Matter Phys., vol.
85, no. 5, pp. 1–4, 2012.
[17] L. Chen, E. Bonaccurso, and M. E. R. Shanahan, “Inertial to viscoelastic transition in
early drop spreading on soft surfaces,” Langmuir, vol. 29, no. 6, pp. 1893–1898, 2013.
[18] A. Carlson, G. Bellani, and G. Amberg, “Universality in dynamic wetting dominated by
contact-line friction,” Phys. Rev. E - Stat. Nonlinear, Soft Matter Phys., vol. 85, no. 4, pp.
49
1–5, 2012.
[19] A. L. Biance, C. Clanet, and D. Quéré, “First steps in the spreading of a liquid droplet,”
Phys. Rev. E - Stat. Physics, Plasmas, Fluids, Relat. Interdiscip. Top., vol. 69, no. 1, p. 4,
2004.
[20] J. C. Bird, S. Mandre, and H. A. Stone, “Short-time dynamics of partial wetting,” Phys.
Rev. Lett., vol. 100, no. 23, pp. 1–4, 2008.
[21] M. J. De Ruijter, J. De Coninck, and G. Oshanin, “Droplet spreading: Partial wetting
regime revisited,” Langmuir, vol. 15, no. 6, pp. 2209–2216, 1999.
[22] S. Mitra and S. K. Mitra, “Understanding the Early Regime of Drop Spreading,”
Langmuir, vol. 32, no. 35, pp. 8843–8848, 2016.
[23] A. Marmur and M. D. Lelah, “The spreading of aqueous surfactant solutions on glass,”
Chem. Eng. Commun., vol. 13, no. 1–3, pp. 133–143, 1981.
[24] M. D. Lelah and A. Marmur, “Spreading kinetics of drops on glass,” J. Colloid Interface
Sci., vol. 82, no. 2, pp. 518–525, 1981.
[25] L. Chen, G. K. Auernhammer, and E. Bonaccurso, “Short time wetting dynamics on soft
surfaces,” Soft Matter, vol. 7, no. 19, pp. 9084–9089, 2011.
[26] S. Das, P. R. Waghmare, and S. K. Mitra, “Early regimes of capillary filling,” Phys. Rev.
E - Stat. Nonlinear, Soft Matter Phys., vol. 86, no. 6, pp. 1–5, 2012.
[27] P. Kavehpour, B. Ovryn, and G. H. McKinley, “Evaporatively-driven Marangoni
instabilities of volatile liquid films spreading on thermally conductive substrates,”
Colloids Surfaces A Physicochem. Eng. Asp., vol. 206, no. 1–3, pp. 409–423, 2002.
[28] R. Span, E. W. Lemmon, R. T. Jacobsen, W. Wagner, and A. Yokozeki, “A reference
equation of state for the thermodynamic properties of nitrogen for temperatures from
50
63.151 to 1000 K and pressures to 2200 MPa,” J. Phys. Chem. Ref. Data, vol. 29, no. 6,
pp. 1361–1401, 2000.
[29] J. M. Kay, R.M. Nedderman, "An Introduction to Fluid Mechanics and transfer processes"
CUP Archive; 1985.
[30] J. N. K. Rao, “On double sampling for stratification and analytical surveys,” Biometrika,
vol. 60, no. 1, pp. 125–133, 1973.
[31] K. Lucas, “Die Druckabhangigkeit der Viskositat von Fliissigkeiten - eine einfache
Abschatzung,” Chem.-Ing.-Tech., vol. 53, no. 12, pp. 959–960, 1981.
[32] R. C. Reid, J. M. Prausnitz, and B. E. Poling, “The properties of gases and liquids,” 1987.
[33] T. G. Mezger, “The Rheology Handbook. 3-rd Revised Edition,” Hanover Vincentz Netw.
Publ, 2011.
[34] S. Saraji, L. Goual, M. Piri, and H. Plancher, “Wettability of supercritical carbon
dioxide/water/quartz systems: Simultaneous measurement of contact angle and interfacial
tension at reservoir conditions,” Langmuir, vol. 29, no. 23, pp. 6856–6866, 2013.
51
3 Dynamics of spreading of a hydrodynamically driven droplet
under the influence of surrounding pressure
3.1 Abstract
The dynamics of hydrodynamically driven water droplet is studied on four different substrates at
elevated surrounding pressures experimentally and theoretically. By combining the extended
Overall Energy Balance (OEB) approach and the Lucas empirical model for estimating drop
viscosity at elevated pressures, the advancement of a liquid droplet on a solid substrate is predicted
as it undergoes constant mass flux addition while maintaining a spherical cap. Theoretical model
is validated with an experimental investigation of a droplet with the addition of mass overtime at
atmospheric pressure and elevated pressures of 10 and 20 megapascal (MPa) above atmospheric
pressure. The results of the pressure effects on the spreading droplet in terms of the advancing
contact angle and spreading radius of water droplet are analyzed on four different substrates
namely: Polytetrafluoroethylene (PTFE), Aluminium (Al), Copper (Cu), and Poly (methyl
methacrylate) (PMMA). The results show that an increase in surrounding pressure lowers the
spreading radius and simultaneously increases the advancing contact angle. In addition, the
influence of pressure on the minimum spreading ratio, ξ is investigated for four different
substrates. It is also observed that the average Reynolds number of the spreading droplet decreases
in a monotone fashion while the Weber number demonstrates a rapid increase.
3.2 Introduction
Refining, extraction, refrigeration, polymer foaming, oil seeds pressing, polymerization, free
meniscus coating, processing of dairy products, are some examples of high-pressure engineering
[1]–[3]. Especially in the context of mitigating global climate change, high pressure wetting plays
52
a significant role in the large scale geological sequestration of supercritical CO2 in geological
reservoirs [1], [4]–[6]. Regardless of the application considered, the spreading behavior of various
liquid droplets on chemically treated or naturally occurring substrates, such as porous rock, is
important to analyze and understand in order to generate significant gains in efficiency in these
processes. To know about the wetting characteristics of a liquid droplet on a solid surface,
understanding the spreading behavior is crucial. Axisymmetric drop shape analysis (ADSA) is
used to record a profile of a droplet placed on a given solid or semi-solid substrate [7]. The output
parameters of this technique are drop volume, contact angle, and drop radius. Contact angle defines
the limit of intermolecular interactions at the three different interfaces (solid-liquid, liquid-vapor
and solid-vapor) and surface tension of a fluid and surface energy of a solid represent the
magnitude of interactions [8]. Motivated by the concept of Young’s equation, many techniques
have been developed to measure contact angle. This thermodynamically established Young’s
equation relates the contact angle with the three interfacial tensions [9]. The model assumes that
solid surfaces are homogeneous, smooth, chemically and physically inert. A unique contact angle
is expected for a given system [10]. In a non-ideal case, the contact angle depends on the liquid
advancing or receding on the solid surface instead of having a unique contact angle [11]. Contact
angle measured at the advancing and the receding edges of a liquid droplet is the advancing contact
angle (𝜃𝑎) and the receding contact angle (𝜃𝑟), respectively [12]. By dosing or aspirating the
volume of a droplet in the sessile drop method, dynamic advancing and receding contact angles
are measured.
A theoretical model to predict the spreading during the advancement of the contact line by adding
mass was developed through a series of iterations [7]. The relationship between dynamic contact
angle and the advancing speed of the three-phase contact line (TPCL) was established [13]–[16].
53
A number of studies have put forward simple and semi- empirical equations. It was carried out by
relating the dynamic contact angle to the capillary number with the addition of a ‘shift factor’ [17].
The first general theoretical model on dynamic spreading of a droplet was proposed in [18] which
is called the overall energy balance model (OEB). The author suggests that the internal viscous
dissipation balances the change in the total surface and kinetic energy of the drop [18]. Using this
model, the spontaneous and low speed drop spreading was studied at a later date, where the initial
kinetic energy of a fixed mass droplet was considered as the primary driving force [19], [20]. The
spreading of a droplet with a fixed volume can be described by the power law [21]. The power law
is based on the assumption that the volume and radius of the droplet is smaller than the capillary
length scale. For industrial processes though, e.g., polymer processing technologies and welding,
the study of a drop spreading by adding liquid to the system is essential since the primary driving
force is hydrodynamic in nature. Erickson et al. [7] successfully developed a model to study drop
spreading driven by hydrodynamic forces by extending the OEB model by adding mass and energy
to the system. The authors developed a non-linear first-order ordinary differential equation and
used previous development in this area [19], [20] to show the drop spreading phenomenon using
a numerical solution to an ordinary differential equation. Spreading behavior of a spherical droplet
with a constant dynamic contact angle and constant mass flow rate for a given system can be
predicted by this model [7]. To model the hydrodynamic spreading phenomenon under elevated
pressure, we use the extended model of OEB [7] and combine it with the Lucas empirical equation
of viscosity [22].
In this investigation, we observe the phenomenon of hydrodynamic spreading of a drop at different
surrounding pressure conditions, such as atmospheric and 10 megapascal (MPa), and 20 MPa
above atmospheric condition. In particular, the spreading phenomenon is analyzed and discussed
54
during the time of advancement of a drop. Advancing contact angle, increase of volume over time,
and spreading radius of water on four different substrates, i.e., Polytetrafluoroethylene (PTFE),
Poly (methyl methacrylate) (PMMA), Copper (Cu) and Aluminum (Al), is investigated
experimentally. Furthermore, by analyzing the variation of different non-dimensional numbers
with pressure we study the influence of the drag force and cohesive force during spreading at
variable pressure points. We also propose a theoretical model to predict the spreading behavior of
a hydrodynamically driven droplet and compare it with the experimental values to investigate the
validity of the model. We investigate theoretically and experimentally the combined effects of
changes in physical properties of advancing droplets and the equally nuanced changes in wetting
behavior of various solid substrates on spreading dynamics with respect to elevated surrounding
pressures.
3.3 Theoretical model
The OEB approach describes the spreading of a droplet while considering the continual addition
of mass until it reaches the equilibrium position. During the spreading process, the steady addition
of liquid to the system serves as the primary driving force. The energy influx to the droplet is
transformed into the internal energy of the system, surface and gravitational potential energies,
boundary movement work, and work done against viscous dissipation. Thus, the OEB equation
can be presented as follows [7]:
𝑑𝐸𝑖𝑛
𝑑𝑡=
𝑑
𝑑𝑡(𝐸𝑠𝑦𝑠 + 𝐸𝑠 + 𝐸𝑔) +
𝑑
𝑑𝑡(𝑊𝑣 + 𝑊𝑏) (1)
where Ein is the energy entered to the system, Esys is the internal energy of the system, Eg is the
gravitational potential energy, Es is the surface energy, Wv is the viscous dissipation work, and
Wb is the boundary movement work. This is the generic form of the governing equation to describe
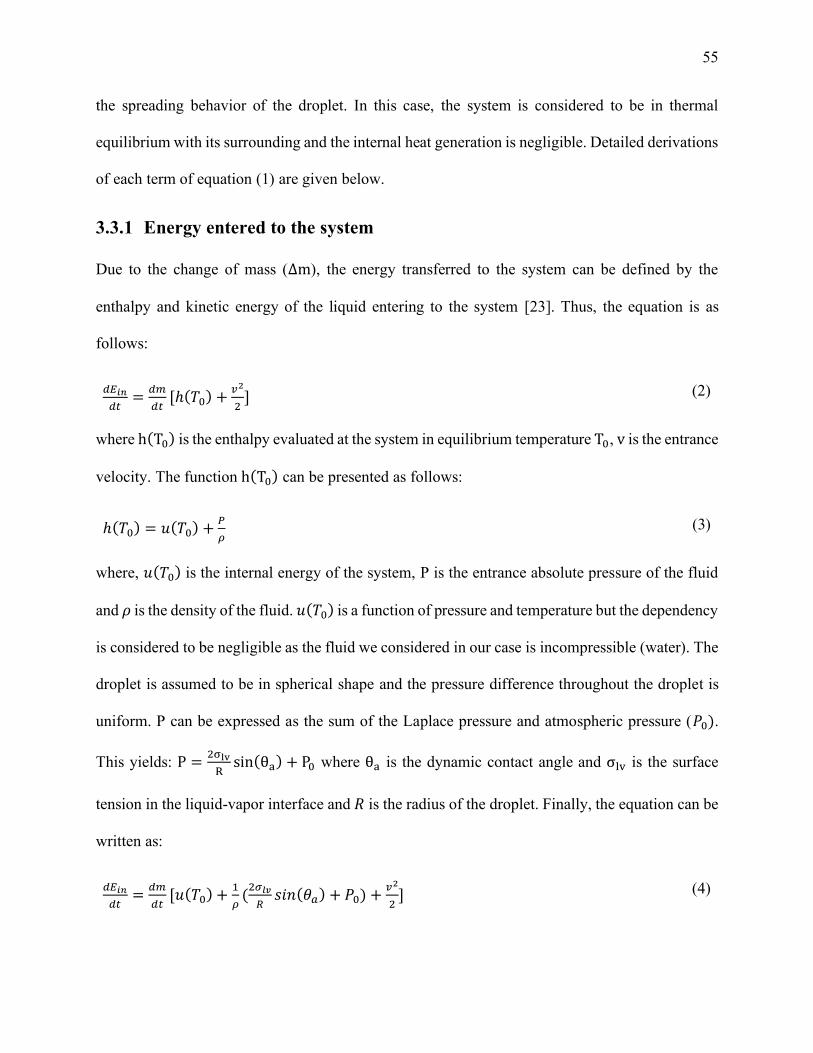
55
the spreading behavior of the droplet. In this case, the system is considered to be in thermal
equilibrium with its surrounding and the internal heat generation is negligible. Detailed derivations
of each term of equation (1) are given below.
3.3.1 Energy entered to the system
Due to the change of mass (∆m), the energy transferred to the system can be defined by the
enthalpy and kinetic energy of the liquid entering to the system [23]. Thus, the equation is as
follows:
𝑑𝐸𝑖𝑛
𝑑𝑡=
𝑑𝑚
𝑑𝑡[ℎ(𝑇0) +
𝑣2
2] (2)
where h(T0) is the enthalpy evaluated at the system in equilibrium temperature T0, v is the entrance
velocity. The function h(T0) can be presented as follows:
ℎ(𝑇0) = 𝑢(𝑇0) +𝑃
𝜌 (3)
where, 𝑢(𝑇0) is the internal energy of the system, P is the entrance absolute pressure of the fluid
and 𝜌 is the density of the fluid. 𝑢(𝑇0) is a function of pressure and temperature but the dependency
is considered to be negligible as the fluid we considered in our case is incompressible (water). The
droplet is assumed to be in spherical shape and the pressure difference throughout the droplet is
uniform. P can be expressed as the sum of the Laplace pressure and atmospheric pressure (𝑃0).
This yields: P =2σlv
Rsin(θa) + P0 where θa is the dynamic contact angle and σlv is the surface
tension in the liquid-vapor interface and 𝑅 is the radius of the droplet. Finally, the equation can be
written as:
𝑑𝐸𝑖𝑛
𝑑𝑡=
𝑑𝑚
𝑑𝑡[𝑢(𝑇0) +
1
𝜌(
2𝜎𝑙𝑣
𝑅𝑠𝑖𝑛(𝜃𝑎) + 𝑃0) +
𝑣2
2] (4)
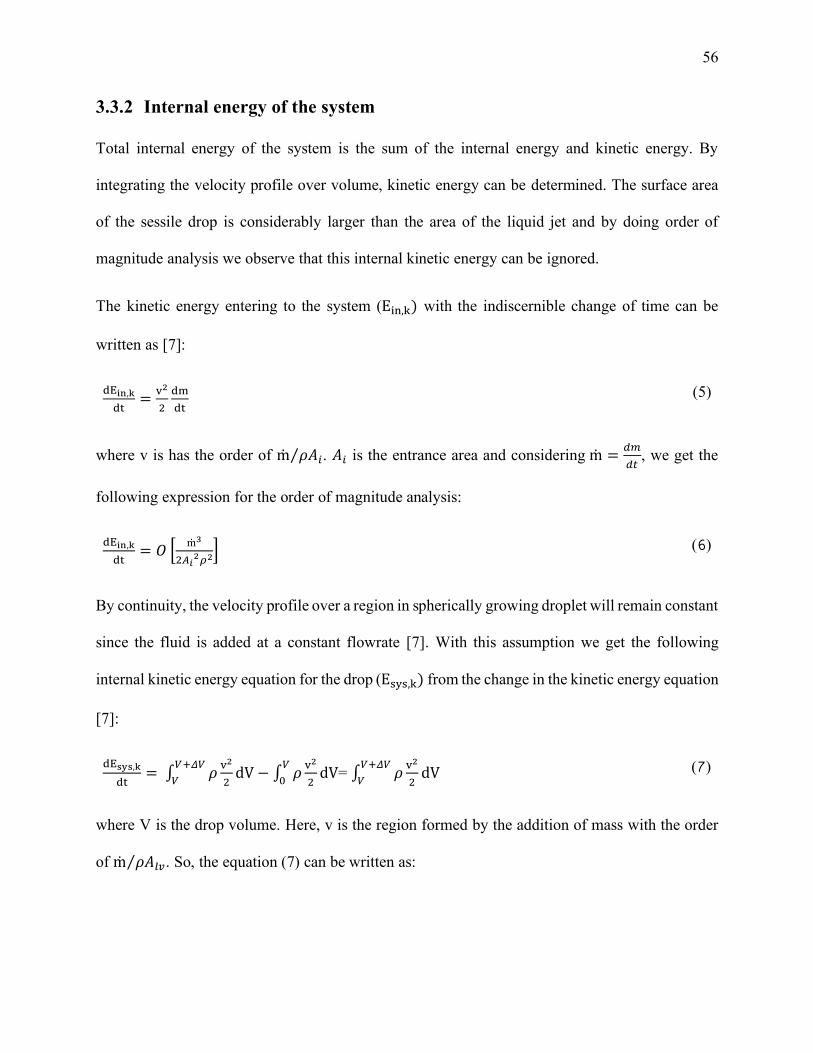
56
3.3.2 Internal energy of the system
Total internal energy of the system is the sum of the internal energy and kinetic energy. By
integrating the velocity profile over volume, kinetic energy can be determined. The surface area
of the sessile drop is considerably larger than the area of the liquid jet and by doing order of
magnitude analysis we observe that this internal kinetic energy can be ignored.
The kinetic energy entering to the system (Ein,k) with the indiscernible change of time can be
written as [7]:
dEin,k
dt=
v2
2
dm
dt (5)
where v is has the order of ṁ 𝜌𝐴𝑖⁄ . 𝐴𝑖 is the entrance area and considering ṁ =𝑑𝑚
𝑑𝑡, we get the
following expression for the order of magnitude analysis:
dEin,k
dt= 𝑂 [
ṁ3
2𝐴𝑖2𝜌2
] (6)
By continuity, the velocity profile over a region in spherically growing droplet will remain constant
since the fluid is added at a constant flowrate [7]. With this assumption we get the following
internal kinetic energy equation for the drop (Esys,k) from the change in the kinetic energy equation
[7]:
dEsys,k
dt= ∫ 𝜌
v2
2dV
𝑉+𝛥𝑉
𝑉− ∫ 𝜌
v2
2dV
𝑉
0= ∫ 𝜌
v2
2dV
𝑉+𝛥𝑉
𝑉 (7)
where V is the drop volume. Here, v is the region formed by the addition of mass with the order
of ṁ 𝜌𝐴𝑙𝑣⁄ . So, the equation (7) can be written as:
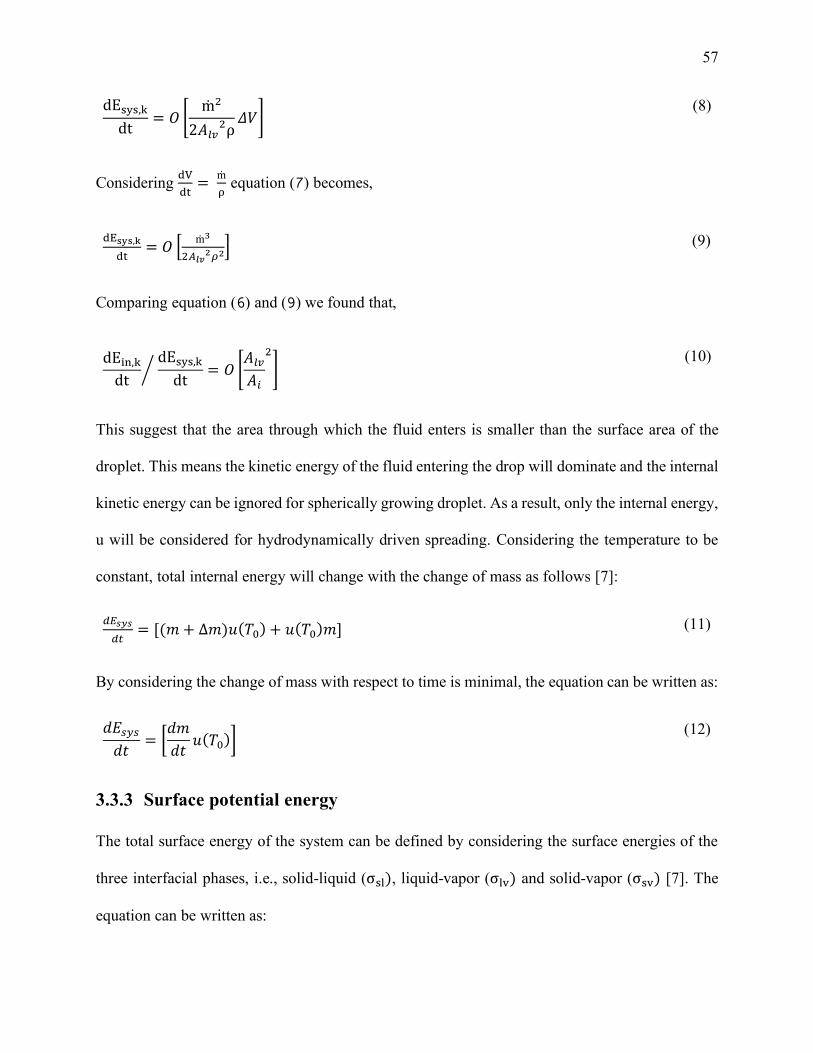
57
dEsys,k
dt= 𝑂 [
ṁ2
2𝐴𝑙𝑣2ρ
𝛥𝑉] (8)
Considering dV
dt=
ṁ
ρ equation (7) becomes,
dEsys,k
dt= 𝑂 [
ṁ3
2𝐴𝑙𝑣2𝜌2
] (9)
Comparing equation (6) and (9) we found that,
dEin,k
dt dEsys,k
dt= 𝑂 [
𝐴𝑙𝑣
𝐴𝑖
2
] ⁄ (10)
This suggest that the area through which the fluid enters is smaller than the surface area of the
droplet. This means the kinetic energy of the fluid entering the drop will dominate and the internal
kinetic energy can be ignored for spherically growing droplet. As a result, only the internal energy,
u will be considered for hydrodynamically driven spreading. Considering the temperature to be
constant, total internal energy will change with the change of mass as follows [7]:
𝑑𝐸𝑠𝑦𝑠
𝑑𝑡= [(𝑚 + ∆𝑚)𝑢(𝑇0) + 𝑢(𝑇0)𝑚] (11)
By considering the change of mass with respect to time is minimal, the equation can be written as:
𝑑𝐸𝑠𝑦𝑠
𝑑𝑡= [
𝑑𝑚
𝑑𝑡𝑢(𝑇0)]
(12)
3.3.3 Surface potential energy
The total surface energy of the system can be defined by considering the surface energies of the
three interfacial phases, i.e., solid-liquid (σsl), liquid-vapor (σlv) and solid-vapor (σsv) [7]. The
equation can be written as:
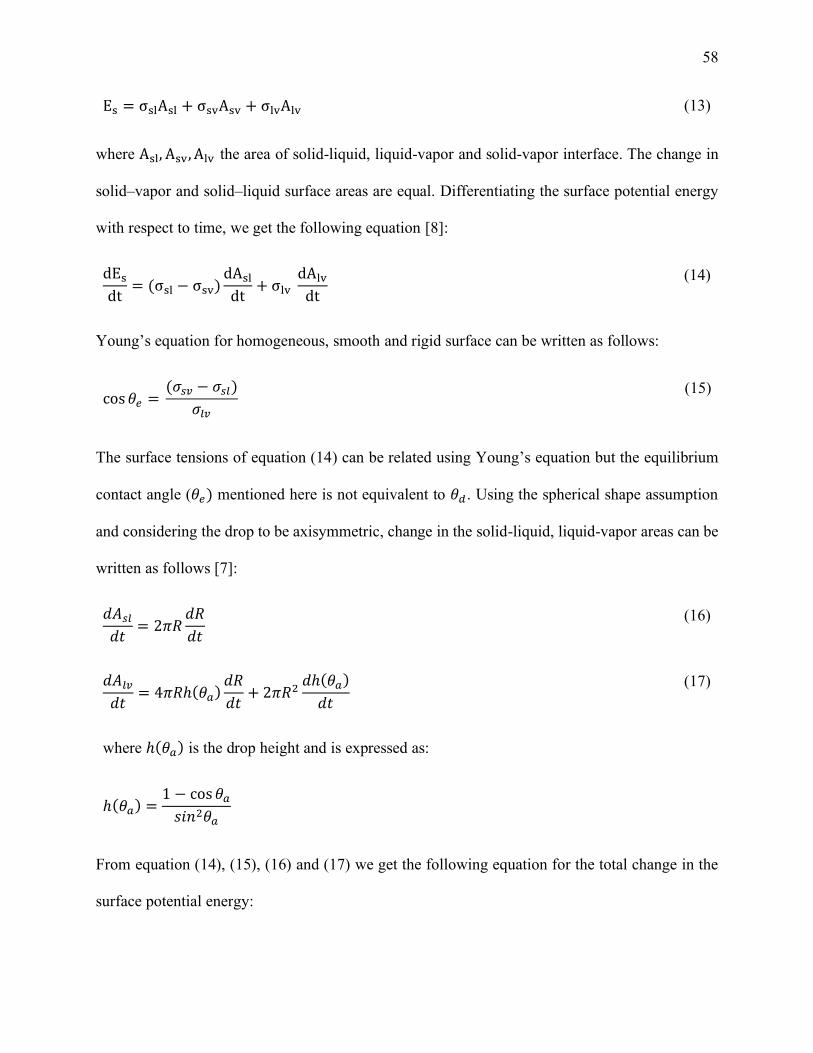
58
Es = σslAsl + σsvAsv + σlvAlv (13)
where Asl, Asv, Alv the area of solid-liquid, liquid-vapor and solid-vapor interface. The change in
solid–vapor and solid–liquid surface areas are equal. Differentiating the surface potential energy
with respect to time, we get the following equation [8]:
dEs
dt= (σsl − σsv)
dAsl
dt+ σlv
dAlv
dt
(14)
Young’s equation for homogeneous, smooth and rigid surface can be written as follows:
cos 𝜃𝑒 = (𝜎𝑠𝑣 − 𝜎𝑠𝑙)
𝜎𝑙𝑣
(15)
The surface tensions of equation (14) can be related using Young’s equation but the equilibrium
contact angle (𝜃𝑒) mentioned here is not equivalent to 𝜃𝑑. Using the spherical shape assumption
and considering the drop to be axisymmetric, change in the solid-liquid, liquid-vapor areas can be
written as follows [7]:
𝑑𝐴𝑠𝑙
𝑑𝑡= 2𝜋𝑅
𝑑𝑅
𝑑𝑡
(16)
𝑑𝐴𝑙𝑣
𝑑𝑡= 4𝜋𝑅ℎ(𝜃𝑎)
𝑑𝑅
𝑑𝑡+ 2𝜋𝑅2
𝑑ℎ(𝜃𝑎)
𝑑𝑡
(17)
where ℎ(𝜃𝑎) is the drop height and is expressed as:
ℎ(𝜃𝑎) =1 − cos 𝜃𝑎
𝑠𝑖𝑛2𝜃𝑎
From equation (14), (15), (16) and (17) we get the following equation for the total change in the
surface potential energy:
59
𝑑𝐸𝑠
𝑑𝑡= 2𝜋𝑅𝜎𝑙𝑣[2ℎ(𝜃𝑎) − cos 𝜃𝑒]
𝑑𝑅
𝑑𝑡+ 2𝜋𝑅2𝜎𝑙𝑣
𝑑ℎ(𝜃𝑎)
𝑑𝑡 (18)
3.3.4 Gravitational potential energy
Change in the gravitational potential energy for change of mass depends on the total mass of the
system and change in the height of the center of gravity (∆𝑧). From [7] we get the gravitational
potential energy equation as follows:
𝑑𝐸𝑔
𝑑𝑡= 𝑔 [𝑚
𝑑𝑧
𝑑𝑡+ 𝑧
𝑑𝑚
𝑑𝑡] (19)
Expression for the center of mass (z) for spherical shape droplet is:
𝑧 =𝑅
4𝑓(𝜃𝑎)
where 𝑓(𝜃𝑎) =6 𝑠𝑖𝑛2𝜃𝑎−3(1−cos 𝜃𝑎)2−8(1−cos 𝜃𝑎) cos 𝜃𝑎
(2−cos 𝜃𝑎) sin 𝜃𝑎
The total mass of the system (m) can be expressed by the following equation:
𝑚 = 𝑚𝑜 + ∫𝑑𝑚
𝑑𝑡𝑑𝑡
𝑡
0
𝑚𝑜 is the initial mass of the system and 𝑚𝑜 = 𝜌𝜋𝑅𝑜
3(1−𝑐𝑜𝑠𝜃𝑎)2(2+𝑐𝑜𝑠𝜃𝑎)
3𝑠𝑖𝑛3𝜃𝑎
Combining all this, equation (19) becomes,
𝑑𝐸𝑔
𝑑𝑡= 𝑚𝑔 (
1
4𝑓(𝜃𝑎)
𝑑𝑟
𝑑𝑡+
𝑅
4
𝑑𝑓(𝜃𝑎)
𝑑𝑡) +
𝑅
4𝑔𝑓(𝜃𝑎)
𝑑𝑚
𝑑𝑡 (20)
3.3.5 Viscous dissipation work
According to de Gennes [24], when hydrodynamic force is greater than the molecular force and
𝑅𝑒 is less than 1, lubrication approximation is used to model viscous dissipation work which is
60
true in our case. So, viscous force per unit length of the three-phase line in our case can be written
as:
𝐹𝑡 =3µ
𝜃𝑎𝑙𝑛(𝜀−1)
𝑑𝑅
𝑑𝑡 (21)
where 𝜀 = 𝐿1 𝐿⁄ which represents the ratio of the microscopic to macroscopic cut-off lengths and
𝜇 is the viscosity of the liquid. L is proportional to 𝑅 and 𝐿1 will vary between 1 to 5 µm [25]. The
viscous dissipation work per unit time is 2𝜋𝑅𝐹𝑡v and can be written as:
𝑑𝑊𝑣
𝑑𝑡= 6𝜋
𝑅µ
𝜃𝑎ln (𝜀−1) (
𝑑𝑅
𝑑𝑡)
2
(22)
3.3.6 Boundary movement work
Because of the change of drop volume, the drop grows. So, the work is done due to the
displacement of the atmospheric pressure. Considering the change in volume with respect to time
against the atmospheric pressure, the equation for boundary movement work (Wb) can be written
as:
dWb
dt=
P0
ρ
dm
dt (23)
By combining all this forces, the final governing equation can be obtained which relates the speed
of the advancing contact radius to the material properties and the dynamic contact angle. The
equation will be as follows:
6πRµ
θaln (ε−1) (
dR
dt)
2
+ [2πRσlv[2h(θa) − cos θe] +mg
4 f(θa)]
dR
dt+ [
Rg
4 f(θa) −
2σlv
ρRsin(θa) −
v2
2]
dm
dt+ 2πR2σlv
dh(θa)
dt+
R
4
df(θa)
dtmg = 0
(24)
Considering the 𝜃𝑎 constant and dm
dt= ṁ, equation (24) can be simplified as:
61
6𝜋𝑅µ
𝜃𝑎𝑙𝑛 (𝜀−1) (
dR
dt)
2
+ [2𝜋𝑅𝜎𝑙𝑣[2ℎ(𝜃𝑎) − 𝑐𝑜𝑠 𝜃𝑒] +( 𝑚𝑜 + ṁ𝑡)𝑔
4 𝑓(𝜃𝑎) ]
𝑑𝑅
𝑑𝑡
+ [𝑅𝑔
4 𝑓(𝜃𝑎) −
2𝜎𝑙𝑣
𝜌𝑅𝑠𝑖𝑛(𝜃𝑎) −
𝑣2
2] ṁ = 0
(25)
The non-dimensionalized form of equation (25) is obtained by considering the initial radius (𝑅𝑜)
and initial velocity (𝑣𝑜) at the first instance as the characteristic length and velocity respectively.
Considering 𝛽 = 𝑅 𝑅0⁄ and 𝑡∗ = 𝑡 (𝑅0 𝑣⁄0)⁄ the resulting equation after non-dimensional analysis
is then as follows:
12𝑅∗
𝜃𝑎𝑅𝑒C(𝜃𝑎)𝑙𝑛 (𝜀−1) (
𝑑𝑅∗
𝑑𝑡∗)
2
+ [4𝑅∗
C(𝜃𝑎)𝑊𝑒[2ℎ(𝜃𝑎)
− 𝑐𝑜𝑠 𝜃𝑒] +1
6
𝐵𝑜
C(𝜃𝑎)𝑊𝑒𝑔 (𝜃𝑎) 𝑓(𝜃𝑎) +
𝐵𝑜
2𝑊𝑒 𝑡∗𝑓(𝜃𝑎) ]
𝑑𝑅∗
𝑑𝑡∗
+ [𝑅∗
2 𝑓(𝜃𝑎)
𝐵𝑜
𝑊𝑒−
4
𝑅∗𝑊𝑒𝑠𝑖𝑛(𝜃𝑎) − 1] = 0
(26)
where 𝑔 (𝜃𝑎) = (2 − 3𝑐𝑜𝑠𝜃𝑎 + 𝑐𝑜𝑠3𝜃𝑎) 𝑠𝑖𝑛𝜃𝑎⁄ and C(𝜃𝑎) = 2(1 − 𝑐𝑜𝑠𝜃𝑎) 𝑠𝑖𝑛2(𝜃𝑎)⁄ . Here,
𝑅𝑒 = 𝜌𝑣𝑅𝑜 µ⁄ is the Reynolds number, 𝑊𝑒 = 𝜌𝑣2𝑅𝑜 𝜎𝑙𝑣⁄ is the Weber number and 𝐵𝑜 =
𝜌𝑅02𝑔 𝜎𝑙𝑣⁄ is the Bond number. To determine the change of µ with respect to pressure we use the
viscosity equation proposed by Lucas [22] which suggests that change of viscosity with increasing
pressure can be estimated using:
µ
µ𝑺𝑳=
1 + D(∆Pr/2.118)A
1 + CωΔPr
(27)
where, µ = liquid viscosity at the pressure of interest P, µ𝑆𝐿 = liquid viscosity of the saturated
liquid at the temperature of interest T, ∆𝑃𝑟 = [(𝑃 − 𝑃𝑉𝑃)/𝑃𝐶], 𝑃𝑉𝑃 = saturated vapor pressure at

62
the temperature of interest T, 𝑃𝐶= critical pressure, ω= is the acentric factor, 𝐴 = 0.9991 −
[4.674 × 10⁻⁴ (1.0523 𝑇𝑅 − 0.3877 − 1.0513)⁄ ], 𝐷 = [0.3257 (1.0039 − 𝑇𝑅2.573)
0.2906]⁄ −
0.2086, 𝐶 = − 0.07921 + 2.1616𝑇𝑅 − 13.4040𝑇𝑅2 + 44.1706𝑇𝑅
3 − 84.8291𝑇𝑅4 +
96.1209 𝑇𝑅5 − 59.8127 𝑇𝑅
6 + 15.6719 𝑇𝑅7 and 𝑇𝑟= reduced temperature (=𝑇/𝑇𝐶).
The governing equation (26) is solved numerically by using Runge–Kutta (RK-4) method with
appropriate initial conditions, such as the drop radius (𝑅𝑜) or the initial velocity (𝑣𝑜) at the first
instance of spreading. Additionally, the values of dynamic advancing contact angles (𝜃𝑎) and the
equilibrium contact angle (𝜃𝑒) are kept fixed for a specific surrounding pressure condition and are
subsequently obtained from the experiments. While solving the equation (26), the 𝜃𝑎, 𝜃𝑒 , and the
mass flux are known from the experiment. The dynamic contact angle remains unchanged during
the entire drop deposition process for a specific surrounding pressure condition. Additionally, the
mass flow rate is considered to be 1.67 × 10⁻¹⁰ 𝑚3 𝑠⁄ for the numerical results which are plotted
and described in detail in result and discussion section.
3.4 Experimental setup and procedure
The schematic of the experimental setup is shown in Figure 3.1. The essential parts of the
experimental arrangement include the pressurization unit and the imaging system, based on a
commercial goniometer (DSA100HP, KRÜSS Scientific Instruments Inc.) with additional
modifications made in-house to accommodate experimental conditions and parameters.
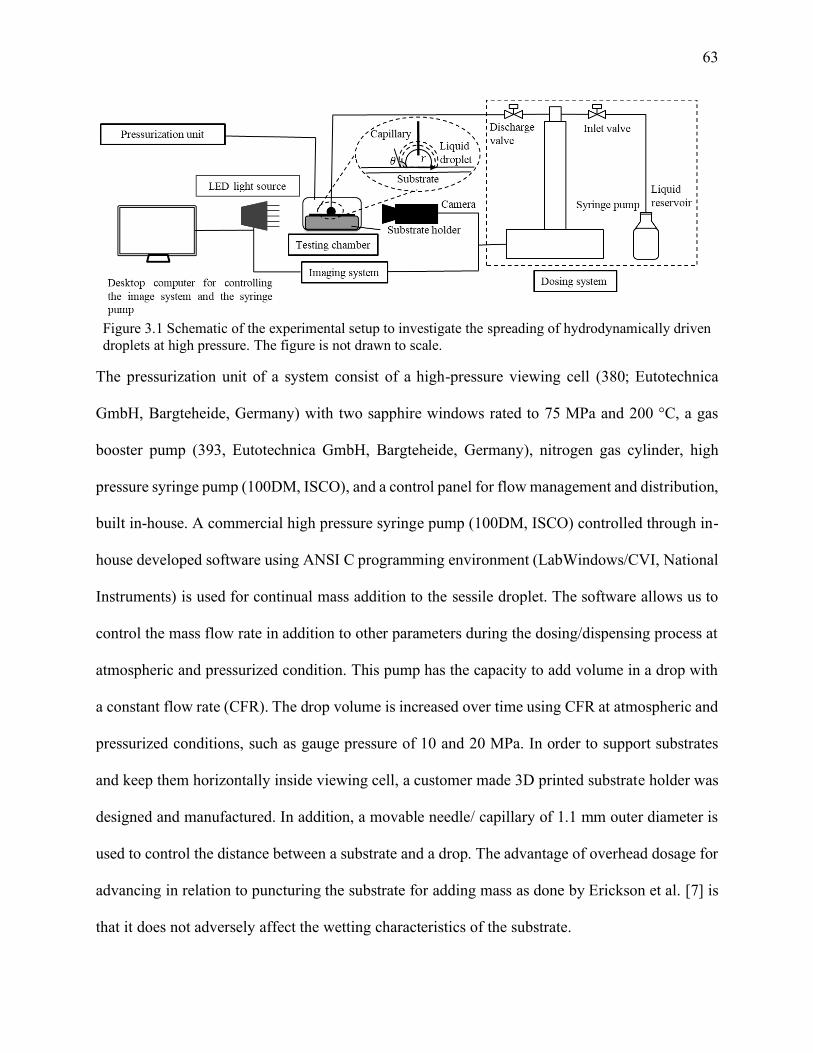
63
Figure 3.1 Schematic of the experimental setup to investigate the spreading of hydrodynamically driven
droplets at high pressure. The figure is not drawn to scale.
The pressurization unit of a system consist of a high-pressure viewing cell (380; Eutotechnica
GmbH, Bargteheide, Germany) with two sapphire windows rated to 75 MPa and 200 °C, a gas
booster pump (393, Eutotechnica GmbH, Bargteheide, Germany), nitrogen gas cylinder, high
pressure syringe pump (100DM, ISCO), and a control panel for flow management and distribution,
built in-house. A commercial high pressure syringe pump (100DM, ISCO) controlled through in-
house developed software using ANSI C programming environment (LabWindows/CVI, National
Instruments) is used for continual mass addition to the sessile droplet. The software allows us to
control the mass flow rate in addition to other parameters during the dosing/dispensing process at
atmospheric and pressurized condition. This pump has the capacity to add volume in a drop with
a constant flow rate (CFR). The drop volume is increased over time using CFR at atmospheric and
pressurized conditions, such as gauge pressure of 10 and 20 MPa. In order to support substrates
and keep them horizontally inside viewing cell, a customer made 3D printed substrate holder was
designed and manufactured. In addition, a movable needle/ capillary of 1.1 mm outer diameter is
used to control the distance between a substrate and a drop. The advantage of overhead dosage for
advancing in relation to puncturing the substrate for adding mass as done by Erickson et al. [7] is
that it does not adversely affect the wetting characteristics of the substrate.
64
Camera (Phantom V711, Vision Research Inc.) mounted on a tripod base (Manfrotto model 475B
Pro Geared Tripod) and a tripod head (Manfrotto 229 3D Super-Pro Head) is used to record
experiment at 60 fps frame rate and exposure time of 40 µs. The LED light kit (Nila Zaila -
Daylight v2) is used to provide a daylight-balanced light source and amplify the image quality.
The magnification was set in a way that two third of the sensor’s field of view is occupied by the
generated droplet. Capillary outer diameter is used to calibrate the image magnification. A 1024 x
768-pixel field of view (FOV) is used for all the experiments. Additionally, the precision in
measuring the contact angle is ± 0.1° and for the spreading radius is ± 0.01 mm in all experiments.
The commercial axisymmetric drop shape analysis software (ADVANCE, KRŰSS Scientific
Instruments Inc.) is used to determine the contact angle, volume of the droplet and change in a
drop diameter over time.
Commercially available Polytetrafluoroethylene (PTFE) (8545K201, McMaster-Carr),
6061 grade Aluminium (Al) (89015K22, McMaster-Carr), Copper (Cu) (8963K183, McMaster-
Carr), Poly (methyl methacrylate) (PMMA) (8589K11, McMaster-Carr) substrates are used as
solid substrate to conduct experiments. The substrates were cut to size of 37 x 25.5 mm with 1 mm
in thickness. Using commercial sonicator (model 1510, Branson Ultrasonics Corp., Danbury, CT,
USA), at first the substrates are sonicated in isopropanol (>98% Food Grade, Sigma-Aldrich,
Oakville, ON, Canada) for 15 minutes followed by 15 minutes in deionized distilled water sourced
from water purification system (Milli-Q A10, Millipore). At the end of the cleaning procedure they
were dried using the compressed air. Deionized water from the same source is used as a drop liquid
to study the effect of surrounding pressure on a hydrodynamically driven droplets.
Experiments were carried out at atmospheric condition and at 10 and 20 MPa above atmospheric
condition. The pump was rinsed with ethyl alcohol (99.5%, ACS reagent, ACROS Organics) and
65
then the whole system was flushed for several times. After that the pump was filled with water to
execute the experiment. Surface tension of the water (72.2 ± 0.17 mN/m) was measured prior to
each test to verify if there was any other agent present prior to each test inside the hydraulic
components of experimental setup. Substrates were placed on the substrate holder inside the
chamber. After that the chamber was closed using the sapphire windows on both sides. Needle was
positioned approximately 1 mm away from the substrate. For the experiments at atmospheric
conditions, a 20 µL volume drop was initially generated using the remote-control software. Then,
the liquid was aspirated from the pump at constant flow rate of 10 µL/min until an additional 35
µL were added to the system. During the addition of drop volume, a constant contact angle value
was recorded, named advancing angle with the evolution of base radius of the droplet. Both static
and advancing contact angles were recorded. In case of the experiments at high pressure, the testing
chamber was pressurized first to the required level and after that drop deposition process was done.
In order to generate accurate and repeatable set of data and minimize human errors, drop generation
process was carried out through software. To ensure repeatability there were at least three trials
taken at each condition of the experiment.
3.5 Results and discussion
Hydrodynamic advancing contact angle is measured in this study to characterize the wettability of
the substrates in the presence of the nitrogen gas. Four different substrates are used for measuring
contact angle and contact radius with the increase of the volume over time. The water injection is
carried out by using a syringe pump with the flow rate of 10 µL min⁄ . The main purpose of this
study is to investigate the variation in the advancing contact angle, contact line spreading with the
change of pressure on four different substrates. Contact angle and drop radius were recorded
throughout the entire injection process. Drop radius starts to increase while the contact angle
66
named advancing angle remain constant, for the entire dispensing process, as shown in Figure 3.2.
In each case study, the time was set to zero when the dispensing process was triggered. As it can
be seen, the contact angle remains fairly constant through the entire process and the difference in
advancing angles is recorded not only for between substrates but even at different set points for
pressure within the same system, i.e., PTFE, Al, Cu, and PMMA.
The small dips that are apparent in the time evolution plots of the contact angle are due to localised
surface defects which exhibit a higher degree of hydrophilic behavior than the bulk of the surface.
In these regions, the advancing interface is stretched momentarily as a result of high surface energy
which then causes the contact angle to fall. In addition to hydrophilic defects, pinning while
advancing also takes place to varying degree in certain substrates, particularly in Cu and PMMA.
Here, while the triple point is pinned, the contact angle rises until the point where the newly
established interface breaks down permitting further advance. As evident from tiles (a)-(d) in
Figure 3.2, increasing the surrounding pressure increases the contact angle in a nonlinear fashion
with the greatest change taking place for PTFE following a pressure change of 20 MPa. Stated
differently, increasing the surrounding pressure facilitates rapid dewetting of the water droplet
from the underlying substrate. By contrast, a pressure increase from 10 MPa to 20 MPa has a
weaker influence on the wetting characteristics for PMMA and consequently produces no
noticeable change in the contact angle. This suggests that the wettability remains largely unaltered,
as a result of this change in surrounding conditions. The spreading radius on the other hand
demonstrates a consistent monotone increase as time evolves. Hence the drop advancing largely
takes place with constant contact angle growth. We observe that as the surrounding pressure
increases, the contact radius falls. For Al, the spreading radius values converge near the end of the
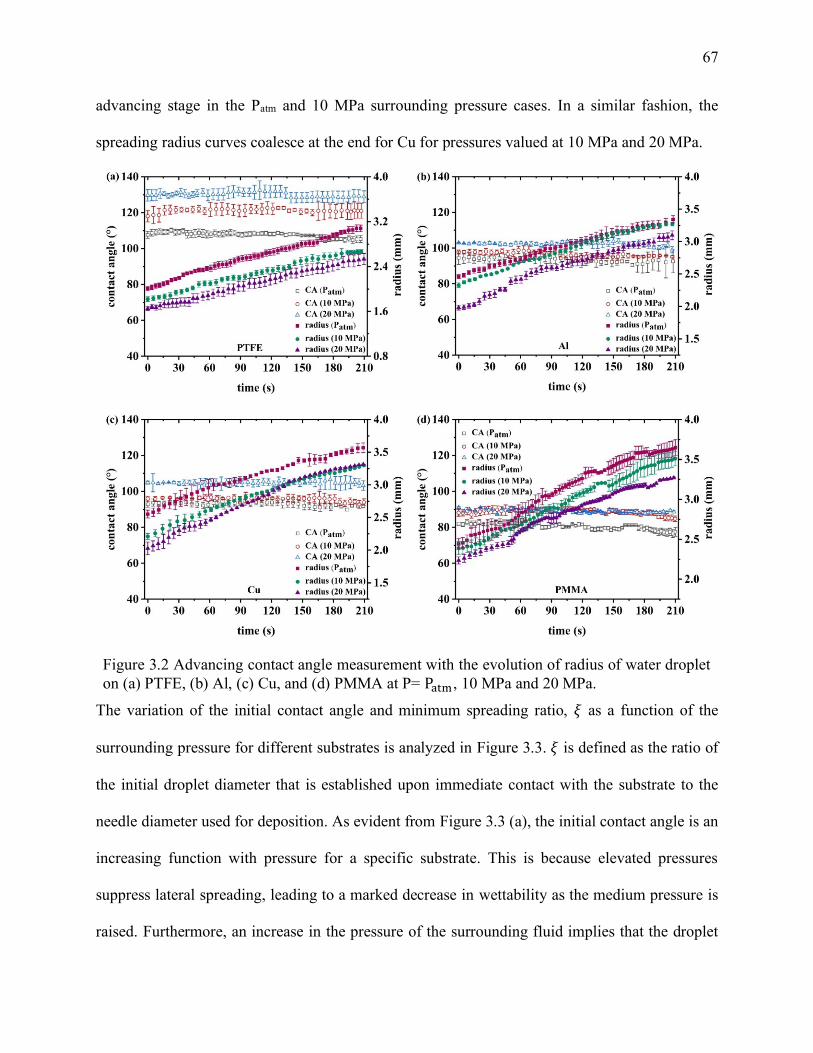
67
advancing stage in the Patm and 10 MPa surrounding pressure cases. In a similar fashion, the
spreading radius curves coalesce at the end for Cu for pressures valued at 10 MPa and 20 MPa.
Figure 3.2 Advancing contact angle measurement with the evolution of radius of water droplet
on (a) PTFE, (b) Al, (c) Cu, and (d) PMMA at P= Patm, 10 MPa and 20 MPa.
The variation of the initial contact angle and minimum spreading ratio, 𝜉 as a function of the
surrounding pressure for different substrates is analyzed in Figure 3.3. 𝜉 is defined as the ratio of
the initial droplet diameter that is established upon immediate contact with the substrate to the
needle diameter used for deposition. As evident from Figure 3.3 (a), the initial contact angle is an
increasing function with pressure for a specific substrate. This is because elevated pressures
suppress lateral spreading, leading to a marked decrease in wettability as the medium pressure is
raised. Furthermore, an increase in the pressure of the surrounding fluid implies that the droplet
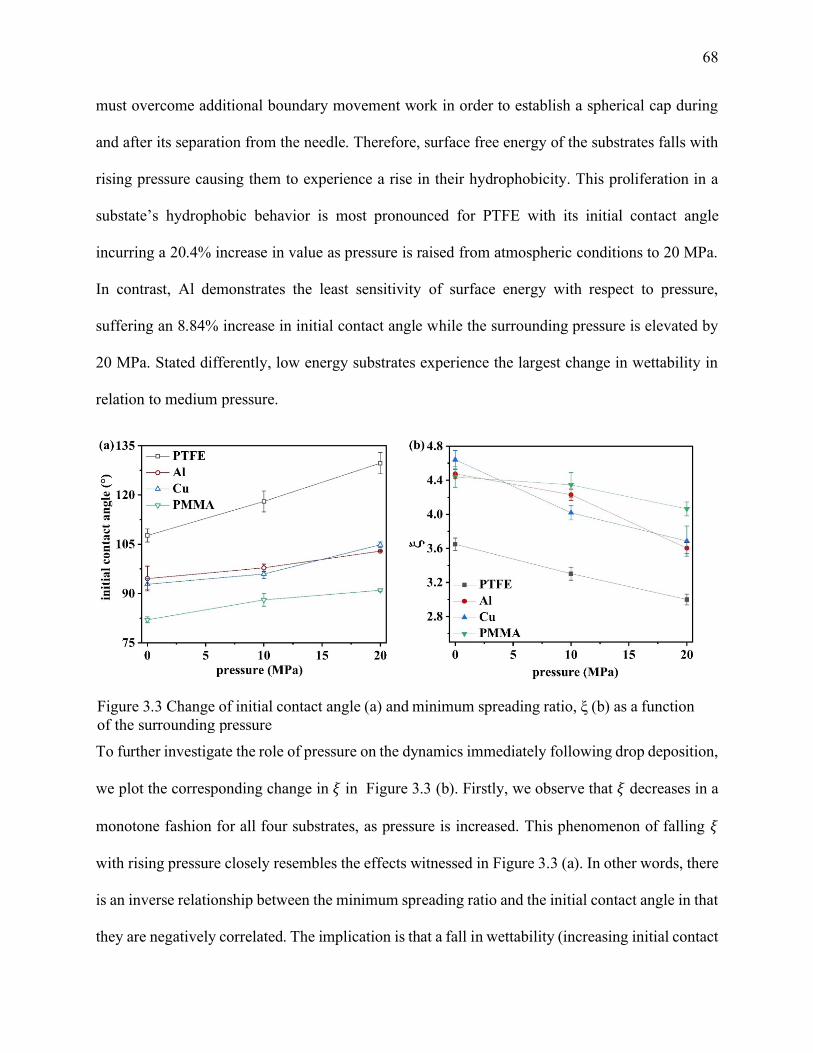
68
must overcome additional boundary movement work in order to establish a spherical cap during
and after its separation from the needle. Therefore, surface free energy of the substrates falls with
rising pressure causing them to experience a rise in their hydrophobicity. This proliferation in a
substate’s hydrophobic behavior is most pronounced for PTFE with its initial contact angle
incurring a 20.4% increase in value as pressure is raised from atmospheric conditions to 20 MPa.
In contrast, Al demonstrates the least sensitivity of surface energy with respect to pressure,
suffering an 8.84% increase in initial contact angle while the surrounding pressure is elevated by
20 MPa. Stated differently, low energy substrates experience the largest change in wettability in
relation to medium pressure.
Figure 3.3 Change of initial contact angle (a) and minimum spreading ratio, ξ (b) as a function
of the surrounding pressure
To further investigate the role of pressure on the dynamics immediately following drop deposition,
we plot the corresponding change in 𝜉 in Figure 3.3 (b). Firstly, we observe that 𝜉 decreases in a
monotone fashion for all four substrates, as pressure is increased. This phenomenon of falling 𝜉
with rising pressure closely resembles the effects witnessed in Figure 3.3 (a). In other words, there
is an inverse relationship between the minimum spreading ratio and the initial contact angle in that
they are negatively correlated. The implication is that a fall in wettability (increasing initial contact
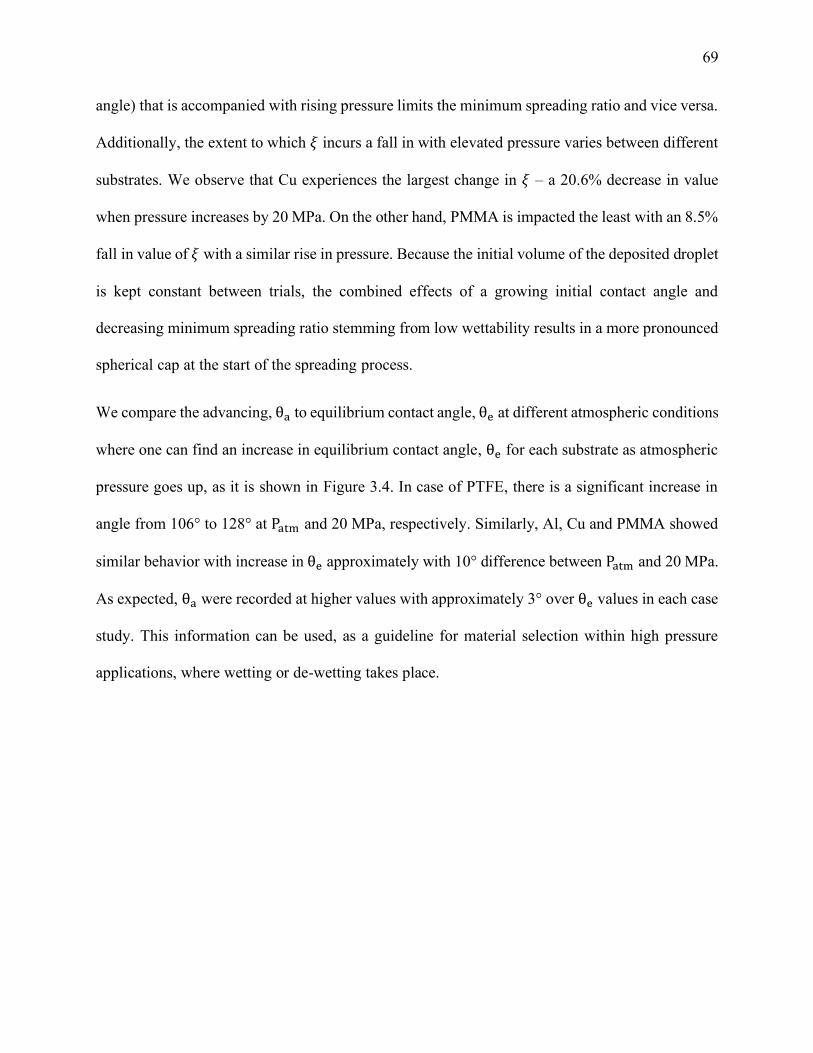
69
angle) that is accompanied with rising pressure limits the minimum spreading ratio and vice versa.
Additionally, the extent to which 𝜉 incurs a fall in with elevated pressure varies between different
substrates. We observe that Cu experiences the largest change in 𝜉 – a 20.6% decrease in value
when pressure increases by 20 MPa. On the other hand, PMMA is impacted the least with an 8.5%
fall in value of 𝜉 with a similar rise in pressure. Because the initial volume of the deposited droplet
is kept constant between trials, the combined effects of a growing initial contact angle and
decreasing minimum spreading ratio stemming from low wettability results in a more pronounced
spherical cap at the start of the spreading process.
We compare the advancing, θa to equilibrium contact angle, θe at different atmospheric conditions
where one can find an increase in equilibrium contact angle, θe for each substrate as atmospheric
pressure goes up, as it is shown in Figure 3.4. In case of PTFE, there is a significant increase in
angle from 106° to 128° at Patm and 20 MPa, respectively. Similarly, Al, Cu and PMMA showed
similar behavior with increase in θe approximately with 10° difference between Patm and 20 MPa.
As expected, θa were recorded at higher values with approximately 3° over θe values in each case
study. This information can be used, as a guideline for material selection within high pressure
applications, where wetting or de-wetting takes place.
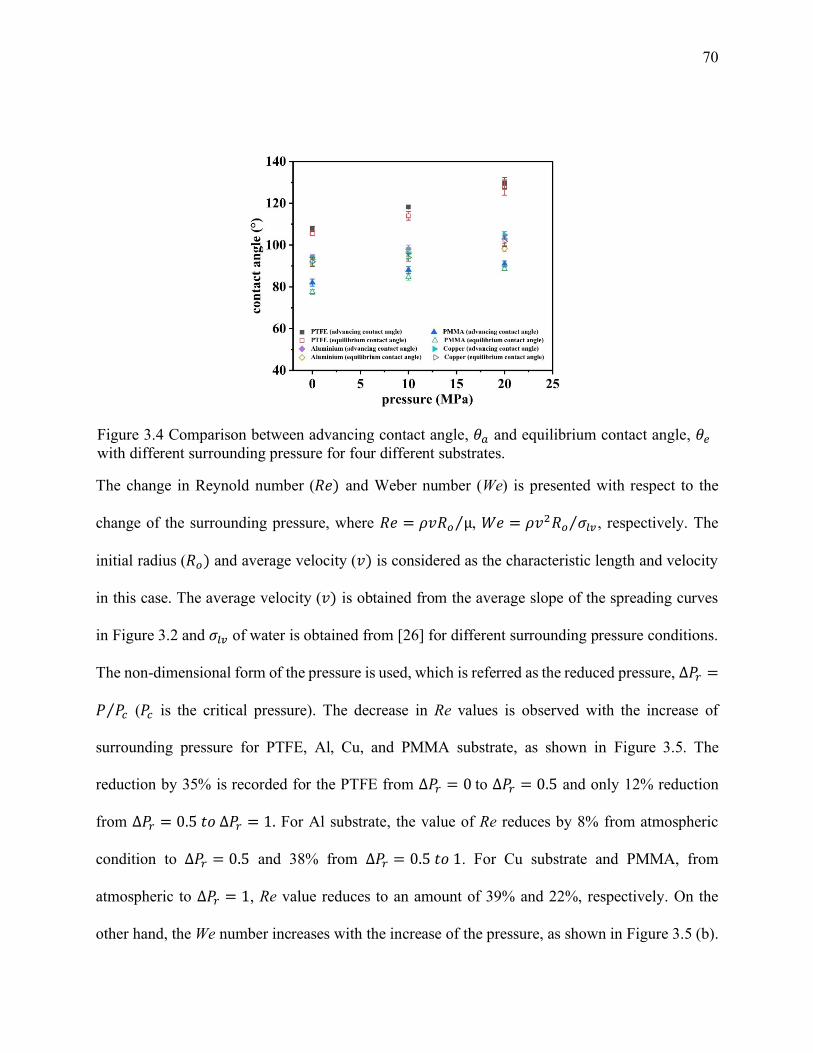
70
The change in Reynold number (𝑅𝑒) and Weber number (We) is presented with respect to the
change of the surrounding pressure, where 𝑅𝑒 = 𝜌𝑣𝑅𝑜 µ⁄ , 𝑊𝑒 = 𝜌𝑣2𝑅𝑜 𝜎𝑙𝑣⁄ , respectively. The
initial radius (𝑅𝑜) and average velocity (𝑣) is considered as the characteristic length and velocity
in this case. The average velocity (𝑣) is obtained from the average slope of the spreading curves
in Figure 3.2 and 𝜎𝑙𝑣 of water is obtained from [26] for different surrounding pressure conditions.
The non-dimensional form of the pressure is used, which is referred as the reduced pressure, ∆𝑃𝑟 =
𝑃 𝑃𝑐⁄ (𝑃𝑐 is the critical pressure). The decrease in Re values is observed with the increase of
surrounding pressure for PTFE, Al, Cu, and PMMA substrate, as shown in Figure 3.5. The
reduction by 35% is recorded for the PTFE from ∆𝑃𝑟 = 0 to ∆𝑃𝑟 = 0.5 and only 12% reduction
from ∆𝑃𝑟 = 0.5 𝑡𝑜 ∆𝑃𝑟 = 1. For Al substrate, the value of Re reduces by 8% from atmospheric
condition to ∆𝑃𝑟 = 0.5 and 38% from ∆𝑃𝑟 = 0.5 𝑡𝑜 1. For Cu substrate and PMMA, from
atmospheric to ∆𝑃𝑟 = 1, Re value reduces to an amount of 39% and 22%, respectively. On the
other hand, the We number increases with the increase of the pressure, as shown in Figure 3.5 (b).
Figure 3.4 Comparison between advancing contact angle, 𝜃𝑎 and equilibrium contact angle, 𝜃𝑒
with different surrounding pressure for four different substrates.
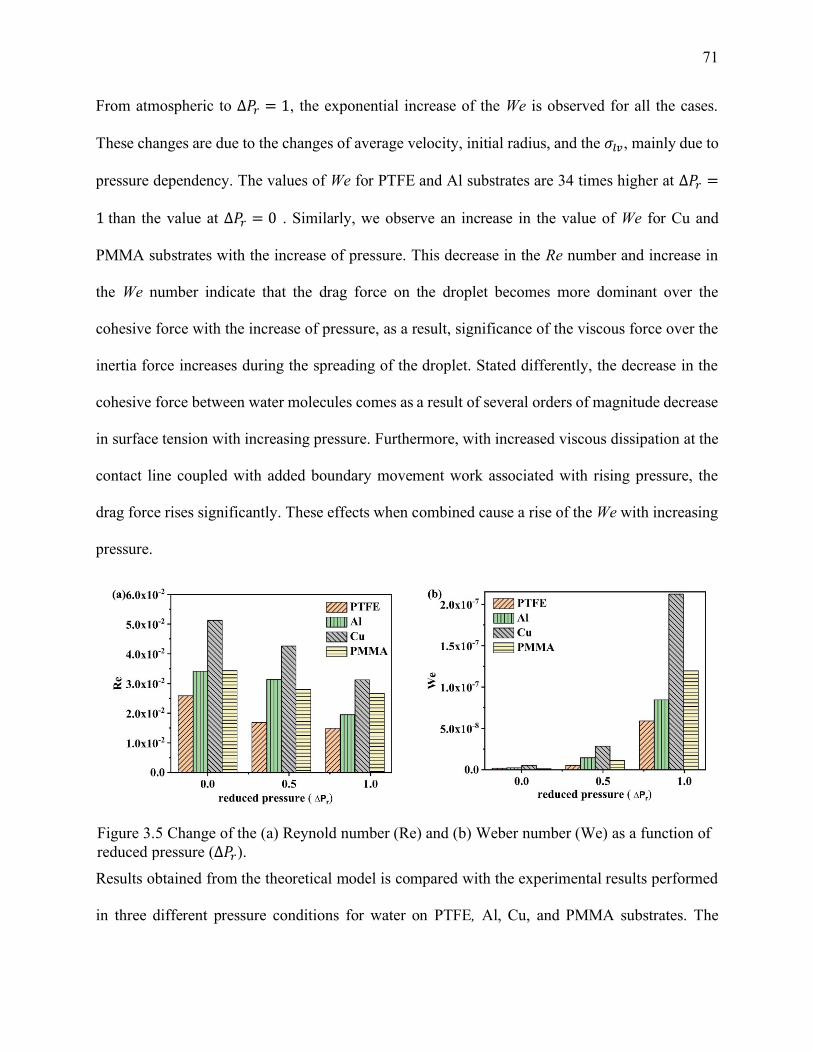
71
From atmospheric to ∆𝑃𝑟 = 1, the exponential increase of the We is observed for all the cases.
These changes are due to the changes of average velocity, initial radius, and the 𝜎𝑙𝑣, mainly due to
pressure dependency. The values of We for PTFE and Al substrates are 34 times higher at ∆𝑃𝑟 =
1 than the value at ∆𝑃𝑟 = 0 . Similarly, we observe an increase in the value of We for Cu and
PMMA substrates with the increase of pressure. This decrease in the Re number and increase in
the We number indicate that the drag force on the droplet becomes more dominant over the
cohesive force with the increase of pressure, as a result, significance of the viscous force over the
inertia force increases during the spreading of the droplet. Stated differently, the decrease in the
cohesive force between water molecules comes as a result of several orders of magnitude decrease
in surface tension with increasing pressure. Furthermore, with increased viscous dissipation at the
contact line coupled with added boundary movement work associated with rising pressure, the
drag force rises significantly. These effects when combined cause a rise of the We with increasing
pressure.
Figure 3.5 Change of the (a) Reynold number (Re) and (b) Weber number (We) as a function of
reduced pressure (∆𝑃𝑟).
Results obtained from the theoretical model is compared with the experimental results performed
in three different pressure conditions for water on PTFE, Al, Cu, and PMMA substrates. The
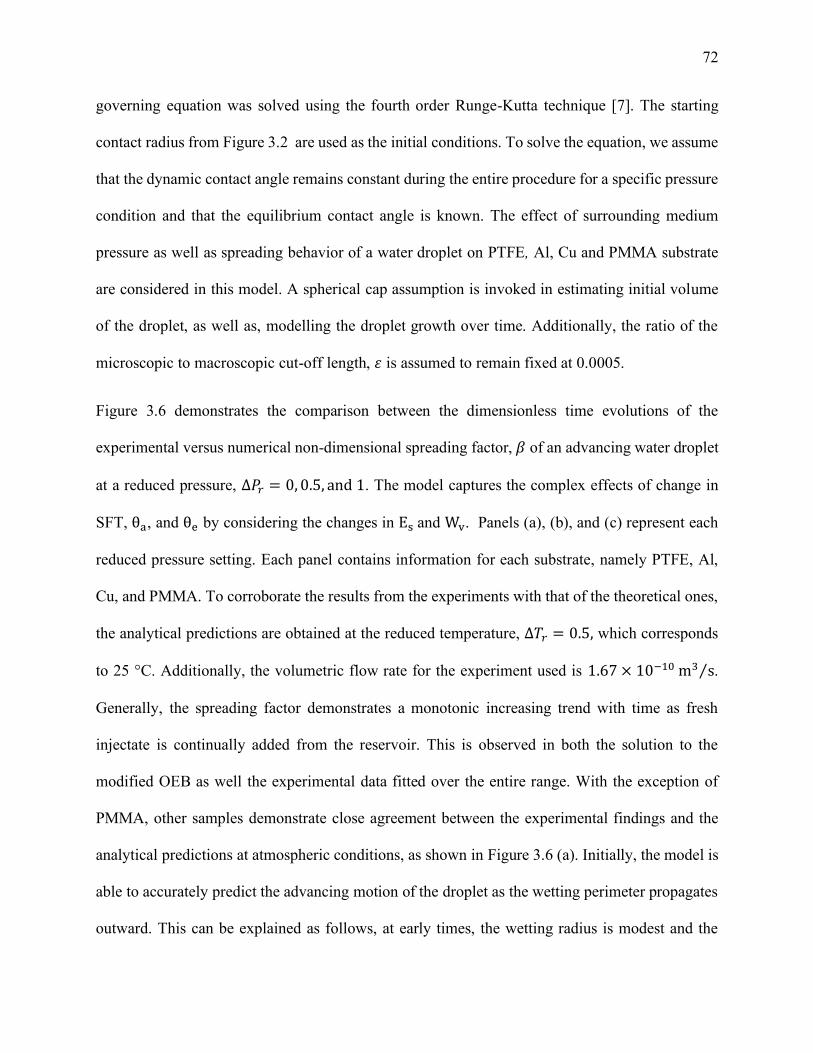
72
governing equation was solved using the fourth order Runge-Kutta technique [7]. The starting
contact radius from Figure 3.2 are used as the initial conditions. To solve the equation, we assume
that the dynamic contact angle remains constant during the entire procedure for a specific pressure
condition and that the equilibrium contact angle is known. The effect of surrounding medium
pressure as well as spreading behavior of a water droplet on PTFE, Al, Cu and PMMA substrate
are considered in this model. A spherical cap assumption is invoked in estimating initial volume
of the droplet, as well as, modelling the droplet growth over time. Additionally, the ratio of the
microscopic to macroscopic cut-off length, 𝜀 is assumed to remain fixed at 0.0005.
Figure 3.6 demonstrates the comparison between the dimensionless time evolutions of the
experimental versus numerical non-dimensional spreading factor, 𝛽 of an advancing water droplet
at a reduced pressure, Δ𝑃𝑟 = 0, 0.5, and 1. The model captures the complex effects of change in
SFT, θa, and θe by considering the changes in Es and Wv. Panels (a), (b), and (c) represent each
reduced pressure setting. Each panel contains information for each substrate, namely PTFE, Al,
Cu, and PMMA. To corroborate the results from the experiments with that of the theoretical ones,
the analytical predictions are obtained at the reduced temperature, Δ𝑇𝑟 = 0.5, which corresponds
to 25 °C. Additionally, the volumetric flow rate for the experiment used is 1.67 × 10⁻¹⁰ m3 s⁄ .
Generally, the spreading factor demonstrates a monotonic increasing trend with time as fresh
injectate is continually added from the reservoir. This is observed in both the solution to the
modified OEB as well the experimental data fitted over the entire range. With the exception of
PMMA, other samples demonstrate close agreement between the experimental findings and the
analytical predictions at atmospheric conditions, as shown in Figure 3.6 (a). Initially, the model is
able to accurately predict the advancing motion of the droplet as the wetting perimeter propagates
outward. This can be explained as follows, at early times, the wetting radius is modest and the

73
spherical cap assumption holds true. Not surprisingly, with a relatively small spreading radius, the
mass and the Bond number (Bo) of the droplet are quite small which then leads to gravitational
effects being negligible. Over time, the wetting area increases, work done against surface forces
becomes increasingly higher and consequently the spreading velocity of the drop falls.
Simultaneously, the Bo of the droplet increasingly becomes larger as the drop expands. As the size
of the drop surpasses a certain critical value, the model begins to underpredict the spreading radius
and consequently the spreading velocity. The modified OEB model makes the assumption that the
pressure field within the drop is uniform. This Laplace overpressure varies inversely with the
contact radius whereas the hydrostatic pressure resulting from gravitational forces varies
proportionately with the drop size. As the Bo increases, the Laplace pressure increasingly becomes
insignificant in comparison with the gravitational pressure. Because of this, the rate of energy input
on the left-hand side of the governing equation will be set too low in comparison with the actual
value of 𝑑𝐸𝑖𝑛 𝑑𝑡⁄ . Stated differently, the deviation from the spherical drop assumption, as the Bo
crosses a critical threshold, causes the velocities to be underestimated by the current model.
Furthermore, as Bo increases, the drop becomes flatter rather than being spherical which would
cause the surface area growth to be underestimated. This deviation of the experimental data from
the predicted findings is most prominent for PTFE in Figure 3.6 (a). Here, the fraction of time for
which the model underpredicts the experimental results is approximately 0.32. Following closely
with this deviation is PMMA, where the fraction of time spent undervaluing the empirical data is
0.23.
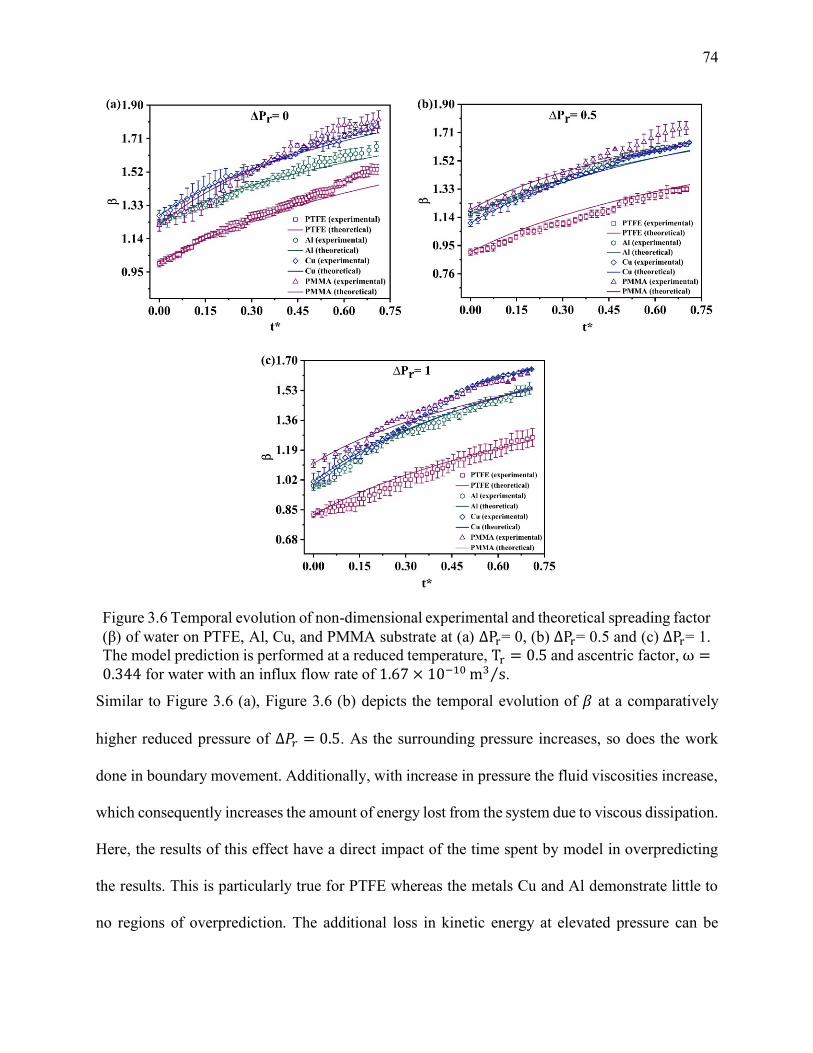
74
Similar to Figure 3.6 (a), Figure 3.6 (b) depicts the temporal evolution of 𝛽 at a comparatively
higher reduced pressure of Δ𝑃𝑟 = 0.5. As the surrounding pressure increases, so does the work
done in boundary movement. Additionally, with increase in pressure the fluid viscosities increase,
which consequently increases the amount of energy lost from the system due to viscous dissipation.
Here, the results of this effect have a direct impact of the time spent by model in overpredicting
the results. This is particularly true for PTFE whereas the metals Cu and Al demonstrate little to
no regions of overprediction. The additional loss in kinetic energy at elevated pressure can be
Figure 3.6 Temporal evolution of non-dimensional experimental and theoretical spreading factor
(β) of water on PTFE, Al, Cu, and PMMA substrate at (a) ∆Pr= 0, (b) ∆Pr= 0.5 and (c) ∆Pr= 1.
The model prediction is performed at a reduced temperature, Tr = 0.5 and ascentric factor, ω =0.344 for water with an influx flow rate of 1.67 × 10⁻¹⁰ m3 s⁄ .
75
attributed to this change when compared to the results for the same materials at atmospheric
conditions. On the other hand, for PMMA, the mean absolute deviation between the experimental
and theoretical results falls when the pressure is comparatively larger than at atmospheric
conditions whereas for PTFE the mean absolute deviation rises.
Analogous to the previous two plots, Figure 3.6 (c) illustrates the time evolution of the
experimental and theoretical spreading radius at an even higher reduced pressure, Δ𝑃𝑟 = 1. For
PTFE, as the surrounding pressure is increased to 20 MPa, the standard deviation in the
experimental results rises while the degree of overprediction in the model falls. Contrasting results
for Cu at Δ𝑃𝑟 = 0.5 and 1, a rise in pressure results in a significant degree of underprediction by
the model during the intermediate as well as the late time dynamics. This change is quite intriguing
since the previous hike in pressure from 𝑃 = 𝑃𝑎𝑡𝑚 to 10 MPa does not result in such a significant
change. Furthermore, this can be explained by an increased degree of flattening of the drop on Cu
at high pressure that results in the 𝑑𝐸𝑖𝑛 𝑑𝑡⁄ value to be underestimated.
3.6 Conclusion
In this paper, we superpose high pressure effects on the hydrodynamically driven spreading of a
water droplet that advances on a flat solid substrate. The primary contribution of this study is to
incorporate into the extended Overall Energy Balance (OEB) approach the Lucas empirical model
for estimating drop viscosity at elevated pressures. The model takes into account the changes in
substrate wettability characterized by the advancing and equilibrium contact angle along with
changes in the level of viscous dissipation work as a result of increasing pressure. The ensuing
first order ordinary differential equation is solved numerically while utilizing an explicit Runge-
Kutte formula. To validate the model results from theoretical study, an experimental investigation
is also conducted to analyze the spreading behavior of hydrodynamically driven water droplets on
76
four different substrates namely: PTFE, Aluminium, Copper and PMMA. The pressure of the
surrounding medium under these liquid-substrate combinations was varied stepwise in the range
from atmospheric pressure to 20 MPa.
Comparing the model predictions and the experimental findings, good agreement exists in general
between the two for small to intermediate drop sizes. Beyond a certain critical threshold drop
radius, the spherical cap approximation does not hold true and as the drop assumes a flat pancake
structure, the model underpredicts the actual drop size. The onset of this transition in drop shape
is a strong function of pressure and subsequently varies with substrate combinations. With the
exception of PMMA, the model effectiveness is relatively high when predicting the spreading
factor, 𝛽 at elevated pressures. For PMMA, early time stick and slip behavior which can be
attributed to localized imperfections or surface heterogeneity curbs the contact line from advancing
smoothly. This sticking effect is more pronounced at high pressure because increased viscous
forces stemming from high viscosity leads to prolonged periods of stoppage. In other words, the
model overpredicts the spreading factor at the early times for PMMA at 20 MPa. The results further
demonstrate that as the pressure increases, the drag forces takes increasing precedence over the
cohesive forces between neighbouring water molecules, causing a rise in the Weber number, We.
Additionally, as viscous forces begin to dominate over drop inertia, this in turn leads to a
corresponding fall in Reynolds number, Re. Further investigations in the future might consider the
variation of surrounding medium viscosity and substrate surface temperature on advancing
characteristics.
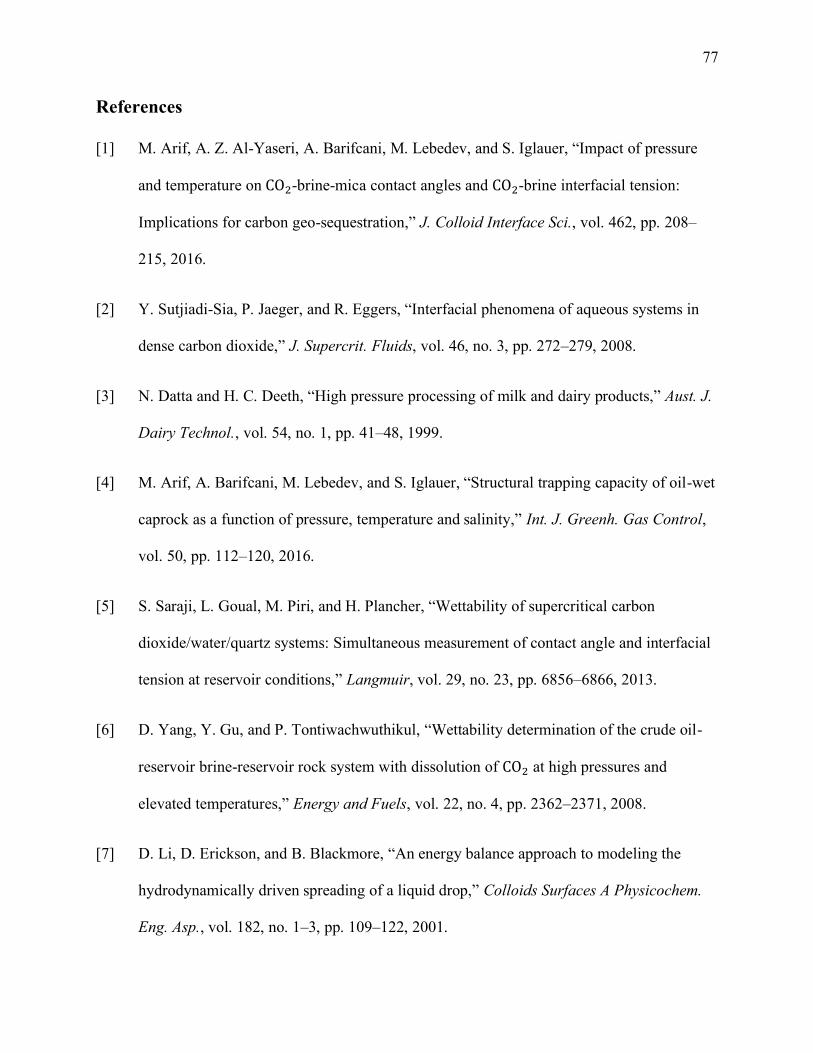
77
References
[1] M. Arif, A. Z. Al-Yaseri, A. Barifcani, M. Lebedev, and S. Iglauer, “Impact of pressure
and temperature on CO2-brine-mica contact angles and CO2-brine interfacial tension:
Implications for carbon geo-sequestration,” J. Colloid Interface Sci., vol. 462, pp. 208–
215, 2016.
[2] Y. Sutjiadi-Sia, P. Jaeger, and R. Eggers, “Interfacial phenomena of aqueous systems in
dense carbon dioxide,” J. Supercrit. Fluids, vol. 46, no. 3, pp. 272–279, 2008.
[3] N. Datta and H. C. Deeth, “High pressure processing of milk and dairy products,” Aust. J.
Dairy Technol., vol. 54, no. 1, pp. 41–48, 1999.
[4] M. Arif, A. Barifcani, M. Lebedev, and S. Iglauer, “Structural trapping capacity of oil-wet
caprock as a function of pressure, temperature and salinity,” Int. J. Greenh. Gas Control,
vol. 50, pp. 112–120, 2016.
[5] S. Saraji, L. Goual, M. Piri, and H. Plancher, “Wettability of supercritical carbon
dioxide/water/quartz systems: Simultaneous measurement of contact angle and interfacial
tension at reservoir conditions,” Langmuir, vol. 29, no. 23, pp. 6856–6866, 2013.
[6] D. Yang, Y. Gu, and P. Tontiwachwuthikul, “Wettability determination of the crude oil-
reservoir brine-reservoir rock system with dissolution of CO2 at high pressures and
elevated temperatures,” Energy and Fuels, vol. 22, no. 4, pp. 2362–2371, 2008.
[7] D. Li, D. Erickson, and B. Blackmore, “An energy balance approach to modeling the
hydrodynamically driven spreading of a liquid drop,” Colloids Surfaces A Physicochem.
Eng. Asp., vol. 182, no. 1–3, pp. 109–122, 2001.
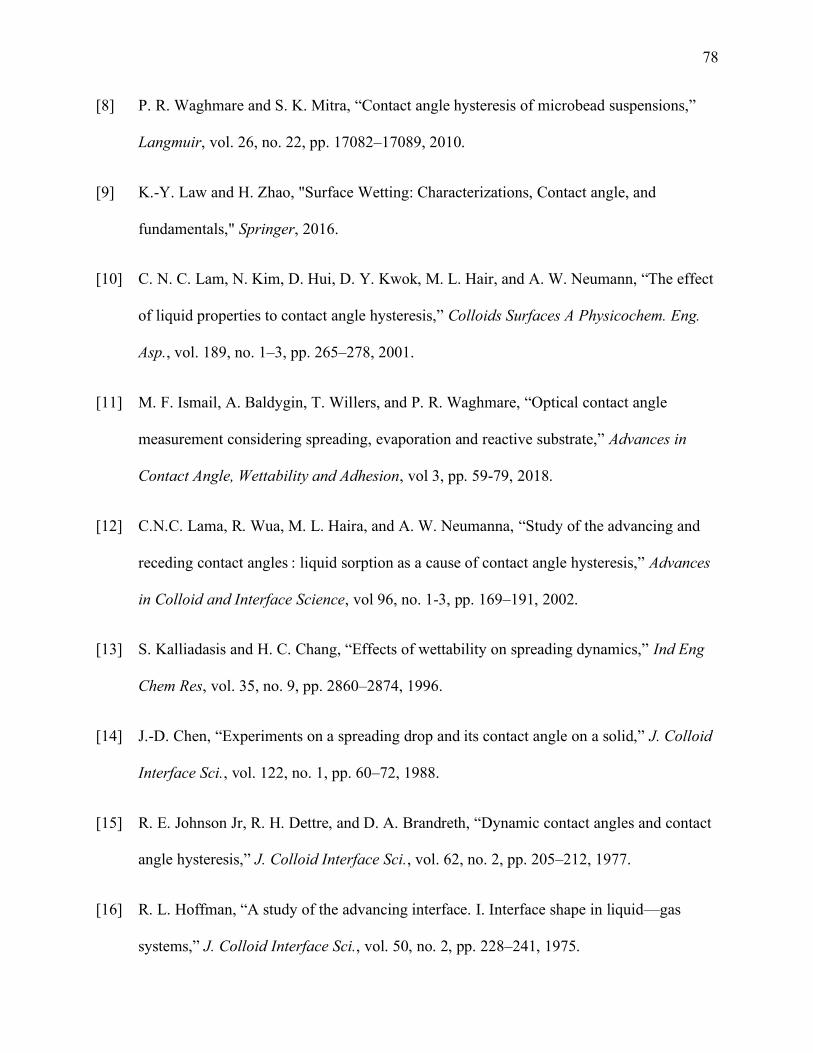
78
[8] P. R. Waghmare and S. K. Mitra, “Contact angle hysteresis of microbead suspensions,”
Langmuir, vol. 26, no. 22, pp. 17082–17089, 2010.
[9] K.-Y. Law and H. Zhao, "Surface Wetting: Characterizations, Contact angle, and
fundamentals," Springer, 2016.
[10] C. N. C. Lam, N. Kim, D. Hui, D. Y. Kwok, M. L. Hair, and A. W. Neumann, “The effect
of liquid properties to contact angle hysteresis,” Colloids Surfaces A Physicochem. Eng.
Asp., vol. 189, no. 1–3, pp. 265–278, 2001.
[11] M. F. Ismail, A. Baldygin, T. Willers, and P. R. Waghmare, “Optical contact angle
measurement considering spreading, evaporation and reactive substrate,” Advances in
Contact Angle, Wettability and Adhesion, vol 3, pp. 59-79, 2018.
[12] C.N.C. Lama, R. Wua, M. L. Haira, and A. W. Neumanna, “Study of the advancing and
receding contact angles : liquid sorption as a cause of contact angle hysteresis,” Advances
in Colloid and Interface Science, vol 96, no. 1-3, pp. 169–191, 2002.
[13] S. Kalliadasis and H. C. Chang, “Effects of wettability on spreading dynamics,” Ind Eng
Chem Res, vol. 35, no. 9, pp. 2860–2874, 1996.
[14] J.-D. Chen, “Experiments on a spreading drop and its contact angle on a solid,” J. Colloid
Interface Sci., vol. 122, no. 1, pp. 60–72, 1988.
[15] R. E. Johnson Jr, R. H. Dettre, and D. A. Brandreth, “Dynamic contact angles and contact
angle hysteresis,” J. Colloid Interface Sci., vol. 62, no. 2, pp. 205–212, 1977.
[16] R. L. Hoffman, “A study of the advancing interface. I. Interface shape in liquid—gas
systems,” J. Colloid Interface Sci., vol. 50, no. 2, pp. 228–241, 1975.
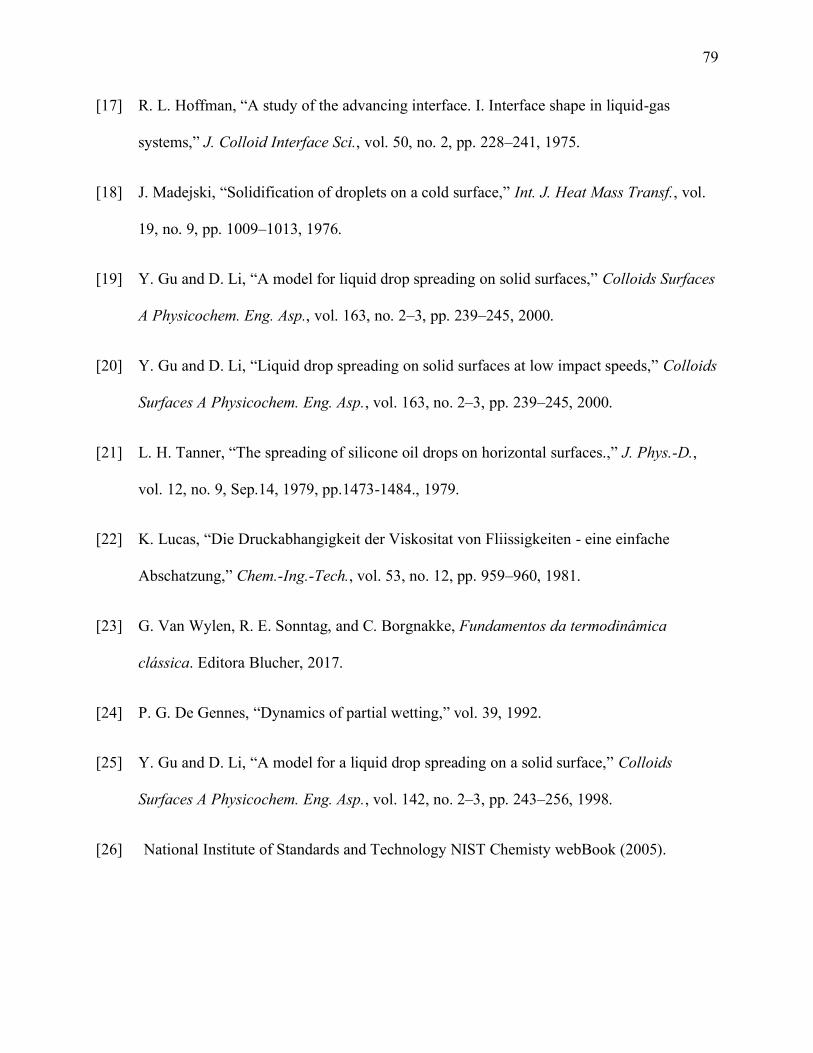
79
[17] R. L. Hoffman, “A study of the advancing interface. I. Interface shape in liquid-gas
systems,” J. Colloid Interface Sci., vol. 50, no. 2, pp. 228–241, 1975.
[18] J. Madejski, “Solidification of droplets on a cold surface,” Int. J. Heat Mass Transf., vol.
19, no. 9, pp. 1009–1013, 1976.
[19] Y. Gu and D. Li, “A model for liquid drop spreading on solid surfaces,” Colloids Surfaces
A Physicochem. Eng. Asp., vol. 163, no. 2–3, pp. 239–245, 2000.
[20] Y. Gu and D. Li, “Liquid drop spreading on solid surfaces at low impact speeds,” Colloids
Surfaces A Physicochem. Eng. Asp., vol. 163, no. 2–3, pp. 239–245, 2000.
[21] L. H. Tanner, “The spreading of silicone oil drops on horizontal surfaces.,” J. Phys.-D.,
vol. 12, no. 9, Sep.14, 1979, pp.1473-1484., 1979.
[22] K. Lucas, “Die Druckabhangigkeit der Viskositat von Fliissigkeiten - eine einfache
Abschatzung,” Chem.-Ing.-Tech., vol. 53, no. 12, pp. 959–960, 1981.
[23] G. Van Wylen, R. E. Sonntag, and C. Borgnakke, Fundamentos da termodinâmica
clássica. Editora Blucher, 2017.
[24] P. G. De Gennes, “Dynamics of partial wetting,” vol. 39, 1992.
[25] Y. Gu and D. Li, “A model for a liquid drop spreading on a solid surface,” Colloids
Surfaces A Physicochem. Eng. Asp., vol. 142, no. 2–3, pp. 243–256, 1998.
[26] National Institute of Standards and Technology NIST Chemisty webBook (2005).
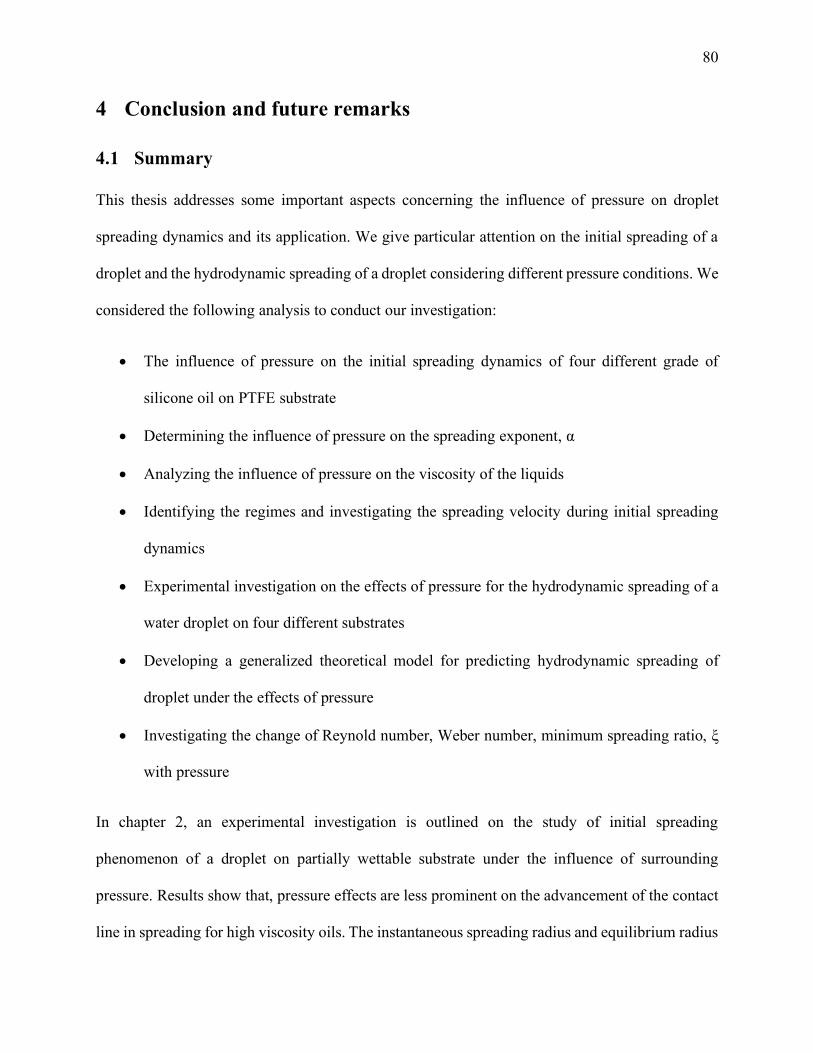
80
4 Conclusion and future remarks
4.1 Summary
This thesis addresses some important aspects concerning the influence of pressure on droplet
spreading dynamics and its application. We give particular attention on the initial spreading of a
droplet and the hydrodynamic spreading of a droplet considering different pressure conditions. We
considered the following analysis to conduct our investigation:
• The influence of pressure on the initial spreading dynamics of four different grade of
silicone oil on PTFE substrate
• Determining the influence of pressure on the spreading exponent, α
• Analyzing the influence of pressure on the viscosity of the liquids
• Identifying the regimes and investigating the spreading velocity during initial spreading
dynamics
• Experimental investigation on the effects of pressure for the hydrodynamic spreading of a
water droplet on four different substrates
• Developing a generalized theoretical model for predicting hydrodynamic spreading of
droplet under the effects of pressure
• Investigating the change of Reynold number, Weber number, minimum spreading ratio, ξ
with pressure
In chapter 2, an experimental investigation is outlined on the study of initial spreading
phenomenon of a droplet on partially wettable substrate under the influence of surrounding
pressure. Results show that, pressure effects are less prominent on the advancement of the contact
line in spreading for high viscosity oils. The instantaneous spreading radius and equilibrium radius
81
both fall on account of higher viscous dissipation with the increase of pressure. Also, for a given
viscosity, the drop reaches to its equilibrium position faster in comparison to atmospheric
conditions. We observe two regions in the inertia dominated early-stage spreading. In the first
region, the splintering of the spreading radius curves are largely dependent on the pressure. The
splintered curves collapse onto a master curve with varying levels of magnitude over time. We
observe the spreading exponent, α and transition time and radius to fall with the increase of
pressure. Pressure effects on the time taken to reach the start of the transition regime (transition
time), are negligible for highest viscous liquid (D500) whose entire spreading regime is viscosity
dominated. We also observe the similar effects on the spreading exponent, α. During the first stage
of spreading, contact line velocity lowers significantly with the increase of pressure and in the
second stage of the early inertial regime, the curves of velocities collapse upon each other. Finally,
we observe that the switchover time for contact angle depends on the pressure.
In chapter 3, we conduct a theoretical and experimental investigation on the hydrodynamic
spreading of droplet under the influence of pressure. We have done an experimental analysis by
considering continuous addition of mass with a small flowrate to the water droplet on PTFE,
PMMA, copper and aluminium substrate under the influence of pressure. We observe a change in
the wettability of the substrate with the increase of pressure. The decrement in contact radius and
increment in the contact angle was observed with the increase of the pressure. Both advancing and
equilibrium contact angle increases with the increase of pressure. We also investigate the effects
of pressure on the Reynold number and Weber number. By combining the extended Overall Energy
Balance (OEB) approach and the Lucas empirical model for estimating drop viscosity at elevated
pressures, we successfully predict the spreading behavior in different surrounding pressure. The
82
theoretical model is validated with the experimental results. The results from this model shows
close agreement between the experimental findings and the analytical predictions successfully.
The findings of this study can be applied to better the understanding of the spreading mechanics
of supercritical CO2 in deep porous reservoirs used for curbing atmospheric emissions. Injecting
the CO2 at high pressure will limit the degree of lateral spreading inside the reservoir. This will
subsequently lower the risk of leakage to overlying strata or shallow water formations. As a result,
the trapping efficiency will likely increase, ensuring the sequestered CO2 remains trapped for years
on end. In a realistic scenario, the supercritical CO2 will be encapsulated with surrounding brine
in a porous aquifer with capillary effects. Although these complexities will result in slightly values,
the underlying physics of the spreading phenomenon at high pressure should provide sufficient
insights in this system to improve storage security.
4.2 Limitations and future recommendations
Considering the early time dynamics, stage I has fewer data point than stage II. Hence the variation
of the empirically obtained exponent with pressure is conducted using the latter regime. Due to
constraints in the equipment frame rates and its relation to hardware space, a suitably high fps
value of 20,000 to adequately capture both regimes was used. In the future, this can be repeated
with an even higher frame rates to increase the empirical resolution. On the other hand, in terms
of advancing at high pressure, molecular dynamics simulations can be conducted in the future to
understand to uncover insights at the nanoscale. Additionally, the theoretical model is based on a
few assumptions which in certain cases might not hold true when compared to real spreading. The
model does not account for pinning which might take place in local hydrophilic zones on a smooth
surface. Further, the mass addition rate must be done in an adiabatic fashion to keep the
temperature constant. Otherwise, the assumption of thermal equilibrium will not be applicable. In
83
the future, the impact of temperature changes can be considered and as well as the effect of outer
medium viscosity on advancing behavior.
4.3 Challenges and learning opportunities
Repeatability and reproducibility are crucial to ensure precision while performing experiments
with the high-pressure unit and the current study presents several learning opportunities to sharpen
skills related to these criteria and avoid common pitfalls. In particular, the several preparation steps
involved in cleaning the substrates and pressurizing the unit before executing additional trials are
quite rigorous and delicate. After completing all the trials for one test liquid, the liquid lines and
reservoir must be cleaned thoroughly with isopropanol (IPA) and ethyl alcohol before forcing out
any remnant droplets with pressurized air. Next, the temperature inside the system is increased to
40℃ with all the valves and chamber kept open for at least two days so that the remaining liquid
evaporates. Then after, the unit is allowed to dry for two or three times with the pressurized air
before filling the reservoir with water to verify if there are any impurities left inside by observing
the SFT of water. After ensuring the cleanliness inside, water is flushed out and the drying
procedure is repeated before filling the system with the next test liquid. Failure to adhere to these
procedures results in test liquid contamination and a subsequent alteration in its surface tension.
The prime reason for contamination comes as a result of the test liquid mixing with the cleaning
liquids and strenuous efforts must be invested in the cleaning procedure to prevent this.
Additionally, special attention must be given to the cleaning routines of the substrates before
proceeding with a trial. This is because trace amounts of dirt or grease adversely affects the
spreading dynamics, resulting in asymmetric advance which the OEB model cannot take into
account. Furthermore, these surface impurities obscure the baseline of the droplet, thus making it
harder to detect. In fact, a slight misinterpretation of the actual baseline in the KRÜSS Advance
84
software will largely alter the contact angle made by the droplet on the substrates. Drop deposition
problems can arise as well if the needle isn’t thoroughly cleaned with IPA and ethyl alcohol.
Because of this, the drop tends to adhere to the needle which makes it difficult to ensure that the
initial volume is kept the same between trails for a specific substate and pressure combination.
This tendency to stick with the needle during the advancing stage is more pronounced at high
pressure when the drop viscosities are large.
The narrow channels in the unit in which the liquid passes need to be cleaned properly and air
bubbles should be removed before conducting the experiments. Otherwise, the air bubbles can be
observed inside the droplets which will give erroneous results. To reduce drop impact velocity, the
distance between the substrate and the needle needs to be small and fixed in every trial of the
experiment. Special attention was given on the mass flow rate while investigating the influence of
pressure on the hydrodynamically driven spreading to ensure no internal heat generation and so
that the system remains in isothermal conditions. Otherwise, the thermophysical properties will be
affected by a change in temperature. In addition, the work bench needs to be in perfect horizontal
position to reduce vibration and to prevent lopsided spreading due to gravity. Lights need to be
adjusted accordingly because excess brightness or darkness hinders the detection of the sharp
interfaces of the droplet. In the end, different kind of hazard can occur while working with the
high-pressure unit such as a gas leak in the unit itself or from the booster pump. Pieces could come
out with high velocity from high pressure unit due to explosion, chemical spill, etc. To reduce the
associated risks, protective goggles need to be used and standard operating procedures needs to be
followed while doing the experiments.

85
4.4 Scope of the future work
The findings of this thesis bring out new opportunities which can be investigated further. Size of
the droplet, speed, properties of the droplet and the interaction between the droplets to the substrate
defines the effectiveness of the impact of the droplet on the surface. Lots of aspects are yet to
analyze in the early time spreading and hydrodynamic spreading of a droplet considering the effect
of pressure. Investigation of the initial and hydrodynamic spreading dynamics under the influence
of pressure brings interest to investigate the initial spreading and the hydrodynamic spreading of
a droplet in high viscosity liquid surrounding medium. We observe a change in the spreading
exponent, α value with the increase of pressure in air medium. Effect of surrounding liquid
viscosity with the rise in pressure on the spreading exponent would be interesting to investigate.
This investigation can be conducted further in different room temperature as well since
temperature will change the viscosity of the liquid significantly. Furthermore, molecular level
interactions with molecular dynamics simulations can be investigated to understand the early time
spreading in molecular level considering the effects of pressure. Also, in case of hydrodynamic
spreading of a droplet, we use water on four different substrates and validated the theoretical model
results with water. This study can be further investigated with different liquids and substrate
combination as well.
86
Bibliography
Arif, M., Al-Yaseri, A. Z., Barifcani, A., Lebedev, M. & Iglauer, S. Impact of pressure and
temperature on CO2-brine-mica contact angles and CO2-brine interfacial tension: Implications for
carbon geo-sequestration. J. Colloid Interface Sci. 462, 208–215 (2016).
Arif, M., Barifcani, A., Lebedev, M. & Iglauer, S. Structural trapping capacity of oil-wet caprock
as a function of pressure, temperature and salinity. Int. J. Greenh. Gas Control 50, 112–120 (2016).
Baxter, S. & Cassie, A. B. D. The water repellency of fabrics and a new water repellency test. J.
Text. Inst. Trans. 36, T67–T90 (1945).
Bertola, V. & Sefiane, K. Controlling secondary atomization during drop impact on hot surfaces
by polymer additives. Phys. Fluids 17, 108104 (2005).
Bertrand, E. et al. Wetting of alkanes on water. J. Pet. Sci. Eng. 33, 217–222 (2002).
Biance, A. L., Clanet, C. & Quéré, D. First steps in the spreading of a liquid droplet. Phys. Rev. E
- Stat. Physics, Plasmas, Fluids, Relat. Interdiscip. Top. 69, 4 (2004).
Bird, J. C., Mandre, S. & Stone, H. A. Short-time dynamics of partial wetting. Phys. Rev. Lett.
100, 1–4 (2008).
Bonn, D., Eggers, J., Indekeu, J. & Meunier, J. Wetting and spreading. Rev. Mod. Phys. 81, 739–
805 (2009).
C.N.C. Lama, R. Wua, D. L., Haira, M. L. & Neumanna, A. W. Study of the advancing and
receding contact angles : Liquid sorption as a cause of contact angle hysteresis Study of the
advancing and receding contact angles : liquid sorption as a cause of contact angle hysteresis. 169–
191 (2002).

87
Carlson, A., Bellani, G. & Amberg, G. Universality in dynamic wetting dominated by contact-line
friction. Phys. Rev. E - Stat. Nonlinear, Soft Matter Phys. 85, 1–5 (2012).
Cassie, A. B. D Contact angles. J. Chem. Inf. Model. 53, 1689–1699 (2019).
Cassie, B. D. Wettability of porous surfaces. Transactions of the Faraday society. 546–551 (1944).
Chen, J.-D. Experiments on a spreading drop and its contact angle on a solid. J. Colloid Interface
Sci. 122, 60–72 (1988).
Chen, L., Auernhammer, G. K. & Bonaccurso, E. Short time wetting dynamics on soft surfaces.
Soft Matter 7, 9084–9089 (2011).
Chen, L., Bonaccurso, E. & Shanahan, M. E. R. Inertial to viscoelastic transition in early drop
spreading on soft surfaces. Langmuir 29, 1893–1898 (2013).
Cox, R. G. The dynamics of the spreading of liquids on a solid surface. Part 2. Surfactants. J. Fluid
Mech. 168, 195–220 (1986).
Das, S., Waghmare, P. R. & Mitra, S. K. Early regimes of capillary filling. Phys. Rev. E - Stat.
Nonlinear, Soft Matter Phys. 86, 1–5 (2012).
Datta, N. & Deeth, H. C. High pressure processing of milk and dairy products. Aust. J. Dairy
Technol. 54, 41–48 (1999).
De Gennes, P. G. Wetting: Statics and dynamics. Rev. Mod. Phys. 57, 827–863 (1985).
De Gennes, P.G., Brochard- Wyart, F., Quere. D. Capillarity and Wetting Phenomena: Drops,
Bubbles, Pearls, Waves. Springer Science & Business Media (2013).
88
De Ruijter, M. J., De Coninck, J. & Oshanin, G. Droplet spreading: Partial wetting regime
revisited. Langmuir 15, 2209–2216 (1999).
Dickson, J. L., Gupta, G., Horozov, T. S., Binks, B. P. & Johnston, K. P. Wetting phenomena at
the 𝐶𝑂2/water/glass interface. Langmuir 22, 2161–2170 (2006).
Dodge, F. T. The spreading of liquid droplets on solid surfaces. J. Colloid Interface Sci. 121, 154–
160 (1988).
Eddi, A., Winkels, K. G. & Snoeijer, J. H. Short time dynamics of viscous drop spreading. Phys.
Fluids 25, (2013).
Gu, Y. & Li, D. A model for liquid drop spreading on solid surfaces. Colloids Surfaces A
Physicochem. Eng. Asp. 163, 239–245 (2000).
Gu, Y. & Li, D. Liquid drop spreading on solid surfaces at low impact speeds. Colloids Surfaces
A Physicochem. Eng. Asp. 163, 239–245 (2000).
Haley, P. J. & Miksis, M. J. The effect of the contact line on droplet spreading. J. Fluid Mech. 223,
57–81 (1991).
Hoffman, R. L. A study of the advancing interface. I. Interface shape in liquid—gas systems. J.
Colloid Interface Sci. 50, 228–241 (1975).
Hoffman, R. L. A study of the advancing interface. I. Interface shape in liquid-gas systems. J.
Colloid Interface Sci. 50, 228–241 (1975).
Iglauer, S., Paluszny, A. & Blunt, M. J. Simultaneous oil recovery and residual gas storage: A
pore-level analysis using in situ X-ray micro-tomography. Fuel 103, 905–914 (2013).
89
Ishigaki, K. An Essay on Performance-Reproduction. J. Philos. Sport Phys. Educ. 17, 39–55
(1995).
Ismail, M. F., Baldygin, A., Willers, T. & Waghmare, P. R. Optical contact angle measurement
considering spreading, evaporation and reactive substrate. Advances in Contact Angle, Wettability
and Adhesion 3, 59-79 (2018).
J. M. Kay, R.M. Nedderman, "An Introduction to Fluid Mechanics and transfer processes" CUP
Archive; 1985.
Janus, C. et al. Aβ peptide immunization reduces behavioural impairment and plaques in a model
of Alzheimer’s disease. Nature 408, 979–982 (2000).
Johnson Jr, R. E., Dettre, R. H. & Brandreth, D. A. Dynamic contact angles and contact angle
hysteresis. J. Colloid Interface Sci. 62, 205–212 (1977).
Kalliadasis, S. & Chang, H. C. Effects of wettability on spreading dynamics. Ind Eng Chem Res
35, 2860–2874 (1996).
Kavehpour, P., Ovryn, B. & McKinley, G. H. Evaporatively-driven Marangoni instabilities of
volatile liquid films spreading on thermally conductive substrates. Colloids Surfaces A
Physicochem. Eng. Asp. 206, 409–423 (2002).
Kay, J. M., Nedderman, R.M. An Introduction to Fluid Mechanics and transfer processes. CUP
Archive; 1985.
Kim, S., Park, U. & Kim, H. Early stage of liquid drop spreading on tunable nanostructured
surfaces. Exp. Therm. Fluid Sci. 116, 110126 (2020).
90
Lam, C. N. C. et al. The effect of liquid properties to contact angle hysteresis. Colloids Surfaces
A Physicochem. Eng. Asp. 189, 265–278 (2001).
Law, K.-Y. & Zhao, H. Surface Wetting. Surface wetting: characterization, contact angle, and
fundamentals. Basel, Switzerland: Springer International Publishing, (2016).
Lelah, M. D. & Marmur, A. Spreading kinetics of drops on glass. J. Colloid Interface Sci. 82, 518–
525 (1981).
Li, D., Erickson, D. & Blackmore, B. An energy balance approach to modeling the
hydrodynamically driven spreading of a liquid drop. Colloids Surfaces A Physicochem. Eng. Asp.
182, 109–122 (2001).
Lucas, K. Die Druckabhangigkeit der Viskositat von Fliissigkeiten - eine einfache Abschatzung.
Chem.-Ing.-Tech. 53, 959–960 (1981).
Madejski, J. Solidification of droplets on a cold surface. Int. J. Heat Mass Transf. 19, 1009–1013
(1976).
Marmur, A. & Lelah, M. D. The spreading of aqueous surfactant solutions on glass. Chem. Eng.
Commun. 13, 133–143 (1981).
Mezger, T. G. The Rheology Handbook. 3-rd Revised Edition. Hanover Vincentz Netw. Publ
(2011).
Mishra, N. K., Zhang, Y. & Ratner, A. Effect of chamber pressure on spreading and splashing of
liquid drops upon impact on a dry smooth stationary surface. Exp. Fluids 51, 483–491 (2011).
Mitra, S. & Mitra, S. K. Understanding the Early Regime of Drop Spreading. Langmuir 32, 8843–
8848 (2016).
91
National Institute of Standards and Technology NIST Chemisty webBook (2005). Link:
https://webbook.nist.gov/cgi/cbook.cgi?ID=C7732185
Rao, J. N. K. On double sampling for stratification and analytical surveys. Biometrika 60, 125–
133 (1973).
Reid, R. C., Prausnitz, J. M. & Poling, B. E. The properties of gases and liquids. (1987).
Saraji, S., Goual, L., Piri, M. & Plancher, H. Wettability of supercritical carbon
dioxide/water/quartz systems: Simultaneous measurement of contact angle and interfacial tension
at reservoir conditions. Langmuir 29, 6856–6866 (2013).
Sedev, R. V., Petrov, J. G. & Neumann, A. W. Effect of swelling of a polymer surface on
advancing and receding contact angles. J. Colloid Interface Sci. 180, 36–42 (1996).
Shahidzadeh, N. et al. Effect of wetting on gravity drainage in porous media. Transp. porous media
52, 213–227 (2003).
Shen, B., Leman, M., Reyssat, M. & Tabeling, P. Dynamics of a small number of droplets in
microfluidic Hele-Shaw cells. Exp. Fluids 55, (2014).
Shojai Kaveh, N., Rudolph, E. S. J., Van Hemert, P., Rossen, W. R. & Wolf, K. H. Wettability
evaluation of a 𝐶𝑂2/water/bentheimer sandstone system: Contact angle, dissolution, and bubble
size. Energy and Fuels 28, 4002–4020 (2014).
Simpkins, P. G. & Kuck, V. J. On air entrainment in coatings. J. Colloid Interface Sci. 263, 562–
571 (2003).
92
Span, R., Lemmon, E. W., Jacobsen, R. T., Wagner, W. & Yokozeki, A. A reference equation of
state for the thermodynamic properties of nitrogen for temperatures from 63.151 to 1000 K and
pressures to 2200 MPa. J. Phys. Chem. Ref. Data 29, 1361–1401 (2000).
Sutjiadi-Sia, Y., Jaeger, P. & Eggers, R. Interfacial phenomena of aqueous systems in dense carbon
dioxide. J. Supercrit. Fluids 46, 272–279 (2008).
Tabeling, P., Chabert, M., Dodge, A., Jullien, C. & Okkels, F. Chaotic mixing in cross-channel
micromixers. Philos. Trans. R. Soc. London. Ser. A Math. Phys. Eng. Sci. 362, 987–1000 (2004).
Tanner, L. H. The spreading of silicone oil drops on horizontal surfaces. J. Phys.-D. 12, (1979).
Villermaux, E. & Bossa, B. Single-drop fragmentation determines size distribution of raindrops.
Nat. Phys. 5, 697–702 (2009).
Voinov, O. V. Hydrodynamics of wetting. Fluid Dyn. 11, 714–721 (1976).
Wadsworth, P. A Guide to 𝐶𝑂2 Sequestration. Science (80) 300, 1677–1678 (2003).
Waghmare, P. R. & Mitra, S. K. Contact angle hysteresis of microbead suspensions. Langmuir 26,
17082–17089 (2010).
Waghmare, P. R., Gunda, N. S. K. & Mitra, S. K. Under-water superoleophobicity of fish scales.
Sci. Rep. 4, 1–5 (2014).
Wenzel, R. N. Resistance of solid surfaces to wetting by water. Ind. Eng. Chem. 28, 988–994
(1936).
Wijshoff, H. The dynamics of the piezo inkjet printhead operation. Phys. Rep. 491, 77–177 (2010).
93
Winkels, K. G., Weijs, J. H., Eddi, A. & Snoeijer, J. H. Initial spreading of low-viscosity drops on
partially wetting surfaces. Phys. Rev. E - Stat. Nonlinear, Soft Matter Phys. 85, 1–4 (2012).
Yang, D., Gu, Y. & Tontiwachwuthikul, P. Wettability determination of the crude oil-reservoir
brine-reservoir rock system with dissolution of 𝐶𝑂2 at high pressures and elevated temperatures.
Energy and Fuels 22, 2362–2371 (2008).
Yu, C., Zhang, C. Bin, Chen, Y. P. & Shi, M. H. Spreading of droplet on a rough solid surface. K.
Cheng Je Wu Li Hsueh Pao/Journal Eng. Thermophys. 35, 145–147 (2014).