Victor Aaron Shegelski - ERA
246
Mountain pine beetle dispersal: morphology, genetics, and range expansion by Victor Aaron Shegelski A thesis submitted in partial fulfillment of the requirements for the degree of Doctor of Philosophy in Systematics and Evolution Department of Biological Sciences University of Alberta © Victor Aaron Shegelski, 2020
-
Upload
khangminh22 -
Category
Documents
-
view
5 -
download
0
Transcript of Victor Aaron Shegelski - ERA
Mountain pine beetle dispersal: morphology, genetics, and range expansion
by
Victor Aaron Shegelski
A thesis submitted in partial fulfillment of the requirements for the degree of
Doctor of Philosophy
in
Systematics and Evolution
Department of Biological Sciences
University of Alberta
© Victor Aaron Shegelski, 2020

ii
Abstract
Dispersal by flight is a complex life history phase in many insects that is essential to gene
flow and range expansion. Many elements contribute to realized dispersal, including biotic and
abiotic environmental conditions, as well as intrinsic factors such as morphology, physiology and
behavior. Dispersal is often associated with economic consequences in pest species, and
understanding its correlates can inform control efforts. In this thesis I investigate dispersal from a
micro to macro scale using the mountain pine beetle (Dendroctonus ponderosae) as a study system.
I begin by testing relationships between empirically observable flight morphology and dispersal
capacity, as measured using computer-linked flight mills. I also relate dispersal capacity to genetic
variation using RNA-seq and a targeted association study to identify genes and genetic markers
associated with a dispersal phenotype. I then shift focus to identify large scale patterns of dispersal
across the landscape, using genomic single nucleotide polymorphisms (SNPs).
In this research I found several flight-related traits and genes. Morphologically, variation
in dispersal capacity is related to wing size and body weight. These traits, however, only explained
approximately 20% of the variation, indicating that other factors, such as genetic variation, also
contribute to a “dispersal phenotype”. Analysis of gene expression by comparing beetles with
strong and weak dispersal capacity revealed over 2,700 differentially expressed genes and 4
genetic markers associated with flight performance. Many of these genes related to physiology,
hormonal control, behavior, and detoxification, which may have implications for landscape-scale
dispersal success. By investigating dispersal dynamics of mountain pine beetle across central
Alberta, I identified the sources of current outbreaks at leading-edge populations and found
evidence for long-range dispersal and high rates of gene flow between populations.

iii
This work represents a synthesis of different approaches to dispersal-related research in
which I investigated morphological, physiological and behavioral traits, as well as landscape-scale
patterns of dispersal, using empirical measurements, genetics, and flight mill-measured dispersal
capacity. I present a methodological approach to studying dispersal on several scales and
contribute to our understanding of the many factors associated with insect dispersal by flight.

iv
Preface
A version of Chapter 2 has been published as Shegelski VA, Evenden ML, Sperling FAH
(2019) “Morphological variation associated with dispersal capacity in a tree-killing bark beetle
Dendroctonus ponderosae Hopkins”, Agriculture and Forest Entomology volume 21, pages 79-
97. VAS performed the analysis and drafted the manuscript. Flight mills in the lab of MLE were
used to acquire flight data. All authors contributed to the study design and manuscript revisions.
A version of Chapter 4 has been submitted for publication, authored by Shegelski VA,
Campbell EO, Thompson KM, Whitehouse CM, and Sperling FAH. Structure analysis was
performed by EOC, and all other aspects of the analysis, as well as drafting of the manuscript,
were performed by VAS. Many samples were supplied by CMW or KMT. All authors contributed
to study design and manuscript revisions.

v
Acknowledgements
To get to this point, I have been supported by a veritable army, but I would like to start by
thanking my supervisor, who took a chance on an ex-military wildcard. Thank you, Felix. You
have been the ideal supervisor. You provided a perfect blend of direction and creative freedom. I
can understand that a student like me could not always have been easy; we have butted heads on
several occasions, but, like a true “Bayesian” intellectual, you were flexible in your thinking, and
you certainly taught me to do the same.
Thank you, Maya and Dezene, for being on my committee and supporting me through these
trials. Maya, you gave me the chance to be a part of your field research (chainsaw and shotgun
training was a blast… no pun intended), and you had some serious patience in helping me get my
first paper published. Dezene, you have provided some great theoretical insight, and your
encouragement has been invaluable.
I would also like to thank the “army” that helped with this research through sample
collection, advice and great discussion: Stephane Bordeleau, Jackson Lai, Dylan Sjolie, Caroline
Whitehouse, Bryan Brunet, Phil Batista, Sebastian Lackey, Corey Davis, Devin Letourneau,
Melodie Kunegel-Lion, Stephen Trevoy, Nils Koch, Nathan Marculis, John Haley, Tiago Simões,
Oksana Vernygora, Andrew Sperling, William Sperling, Janet Sperling, Neil Thompson, Jennifer
McCormmack, Fraser McKee, Asha Wijerathna, and the crew down at the MBSU (Troy and
Sophie). Also, Julian Dupuis, Ronald Batallas, members of the Sperling Lab, and, of course, the
wonderous “Core Four”, Tyler, Brittany, and Erin. We had some doggone good times.
Thank you, Mom, Dad, Adam, Mandy, Trevor and Lianne, for your support, and for
forging who I am today. Thank you, Kyla, my wife, for you unwavering support through the last

vi
few years. It has been an adventure having children as we simultaneously faced the constant
challenge of clawing out our respective professional niches. Regardless, with your support I have
overcome insurmountable difficulties. I love you, and I am capable of anything when I have you
by my side. Isaac, you have been amazingly patient with ‘Dah-dee’ and have made life infinitely
richer. And Hazel, welcome to the world! Thank you for being patient enough to wait until after
I wrote this thesis.
Thank you to all my in-laws. Many cringe at the thought of having one set of in-laws, but
I have two, and I love you all. In this, I know I have won the lottery. Shannon, Thank you for
your weekly help with caring for Isaac. I would not have been able to complete my work in time
if not for you.
I also thank my late wife, Michelle Shegelski (née Ernst) for setting me on this path.
Without your guidance, I never would have discovered my love of teaching and the academic
world.
This research was supported by: (1) a grant to Dr. Maya Evenden and Dr. Felix Sperling
from the Natural Science and Engineering Research Council of Canada to the TRIA Network, with
contributions from Alberta Agriculture and Forestry, fRI Research, Manitoba Conservation and
Water Stewardship, Natural Resources Canada - Canadian Forest Service, Northwest Territories
Environment and Natural Resources, Ontario Ministry of Natural Resources and Forestry,
Saskatchewan Ministry of Environment, West Fraser and Weyerhaeuser; (2) an NSERC Discovery
Grant to F. Sperling; and (3) the Government of Alberta.
vii
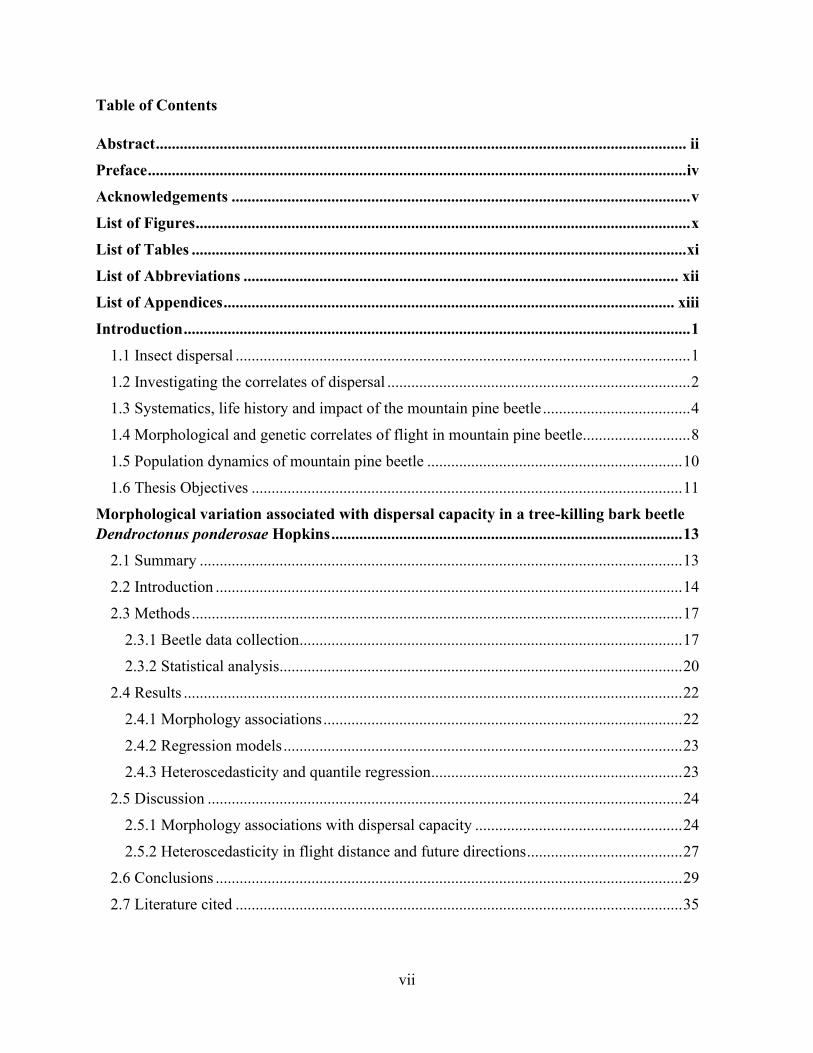
Table of Contents
Abstract ..................................................................................................................................... ii
Preface ....................................................................................................................................... iv
Acknowledgements ................................................................................................................... v
List of Figures ............................................................................................................................ x
List of Tables ............................................................................................................................ xi
List of Abbreviations ............................................................................................................. xii
List of Appendices ................................................................................................................. xiii
Introduction ............................................................................................................................... 1
1.1 Insect dispersal .................................................................................................................. 1
1.2 Investigating the correlates of dispersal ............................................................................ 2
1.3 Systematics, life history and impact of the mountain pine beetle ..................................... 4
1.4 Morphological and genetic correlates of flight in mountain pine beetle ........................... 8
1.5 Population dynamics of mountain pine beetle ................................................................ 10
1.6 Thesis Objectives ............................................................................................................ 11
Morphological variation associated with dispersal capacity in a tree-killing bark beetle
Dendroctonus ponderosae Hopkins ........................................................................................ 13
2.1 Summary ......................................................................................................................... 13
2.2 Introduction ..................................................................................................................... 14
2.3 Methods ........................................................................................................................... 17
2.3.1 Beetle data collection ................................................................................................ 17
2.3.2 Statistical analysis..................................................................................................... 20
2.4 Results ............................................................................................................................. 22
2.4.1 Morphology associations .......................................................................................... 22
2.4.2 Regression models .................................................................................................... 23
2.4.3 Heteroscedasticity and quantile regression............................................................... 23
2.5 Discussion ....................................................................................................................... 24
2.5.1 Morphology associations with dispersal capacity .................................................... 24
2.5.2 Heteroscedasticity in flight distance and future directions ....................................... 27
2.6 Conclusions ..................................................................................................................... 29
2.7 Literature cited ................................................................................................................ 35

viii
Identification of genes and gene expression associated with dispersal capacity in the
mountain pine beetle, Dendroctonus ponderosae Hopkins (Coleoptera: Curculionidae) . 45
3.1 Summary ......................................................................................................................... 45
3.2 Introduction ..................................................................................................................... 45
3.3.1 Sample collection and preparation ........................................................................... 47
3.3.2 Flight mill bioassay and sample selection ................................................................ 48
3.3.3 RNA extractions, RNA-Seq library preparation & sequencing ............................... 49
3.3.4 Sequence data mapping & differential expression analysis ..................................... 55
3.3.5 Enrichment analysis & KEGG pathway analysis ..................................................... 49
3.3.6 DNA extractions, sequencing & mapping for association study .............................. 50
3.3.7 Targeted association study........................................................................................ 51
3.4 Results ............................................................................................................................. 51
3.4.1 Flight mill bioassay .................................................................................................. 51
3.4.2 Differential expression analysis ................................................................................ 52
3.4.3 GO enrichment analysis ............................................................................................ 54
3.4.4 KEGG pathways ....................................................................................................... 55
3.4.5 Targeted association study........................................................................................ 56
3.5 Discussion ....................................................................................................................... 57
3.5.1 Metabolism ............................................................................................................... 57
3.5.2 Muscle form & function ........................................................................................... 58
3.5.3 Oxidative stress & detoxification ............................................................................. 58
3.5.4 Endocrine system ...................................................................................................... 59
3.5.5 Behavior.................................................................................................................... 60
3.5.6 Association study ...................................................................................................... 61
3.6 Conclusions ..................................................................................................................... 61
Source and spread dynamics of mountain pine beetle (Dendroctonus ponderosae) in central
Alberta, Canada ...................................................................................................................... 75
4.1 Summary ......................................................................................................................... 75
4.2 Introduction ..................................................................................................................... 76
4.3 Methods ........................................................................................................................... 77
4.3.1 Beetle sampling, DNA extraction, and sequencing .................................................. 77
4.3.2 Data filtering and SNP calling .................................................................................. 78
4.3.3 Population structure analysis .................................................................................... 79

ix
4.4 Results ............................................................................................................................. 81
4.5 Discussion ....................................................................................................................... 82
4.6 Conclusions ..................................................................................................................... 84
General Conclusions ............................................................................................................... 91
5.1 Thesis Overview .............................................................................................................. 91
5.2 Future directions .............................................................................................................. 94
5.2.1 Future work on flight-related morphology (Chapter 2) ............................................ 94
5.2.2 Future work on flight-related genetics (Chapter 3) .................................................. 95
5.2.3 Future work on landscape-scale dispersal (Chapter 4) ............................................. 96
Biography ............................................................................................................................. 98
Works Cited ....................................................................................................................... 100
Appendices ......................................................................................................................... 137

x
List of Figures
Figure 2.1 The dispersal kernel of mountain pine beetle .......................................................... 31
Figure 2.2 Morphological differences between weak and strong flight ................................... 32
Figure 2.3 Quantile regression of individual morphological traits associated with flight ........ 33
Figure 2.4 Comparison of trends in dispersal and morphology, and comparison to quantile
regression of wing loading ........................................................................................................ 34
Figure 3.1 Chapter 3 methods flowchart................................................................................... 63
Figure 3.2 Measured flight patterns of mountain pine beetle in relation to lighting conditions
and actual sunset/sunrise ........................................................................................................... 64
Figure 3.3 Principal component analysis and MA plots of differential expression analysis
comparing strong, weak and non-fliers ..................................................................................... 65
Figure 3.4 GO annotations associated with mountain pine beetle dispersal capacity .............. 66
Figure 3.5 KEGG pathways associated with dispersal capacity ............................................... 67
Figure 3.6 Results of a targeted association study comparing variant sites to flight propensity
and total distance flown ............................................................................................................ 68
Figure 4.1 Principal component analyses of Alberta mountain pine beetle populations .......... 86
Figure 4.2 Structure analysis of Alberta mountain pine beetle populations ............................. 87
Figure 4.3 Population expansion dynamics of mountain pine beetle in Alberta ...................... 88

xi
List of Tables
Table 3.1 Sequence data for RNA-Seq experiment .................................................................. 69
Table 3.2 Differentially expressed candidate genes related to flight performance ................... 70
Table 4.1 Population differentiation statistics of mountain pine beetle in Alberta .................. 90

xii
List of Abbreviations
20E – 20-hydroxyecdysone
BP – Breusch-Pagan
DAPC – discriminant analysis of principal components
FDR – false discovery rate
GLM - generalized linear model
GO – gene ontology
GST – glutathione-s-transferase
IBIS - Institut de Biologie Intégrative et des Systèmes
IGF - Insulin-like growth factor
JH – juvenile hormone
JHEH – juvenile hormone epoxide hydrolase
KEGG – Kyoto Encyclopedia of Genes and Genomes
LD – linkage disequilibrium
MBSU – Molecular Biology Service Unit
MPB – mountain pine beetle
PCA – principal component analysis
perm p – permutated p-value
SNP – single nucleotide polymorphism
VIF – variance inflation factor

xiii
List of Appendices
Appendix 2.1 ........................................................................................................................... 137
Appendix 2.2 ........................................................................................................................... 143
Appendix 3.1 ........................................................................................................................... 144
Appendix 3.2 ........................................................................................................................... 225
Appendix 4.1 ........................................................................................................................... 231
Appendix 4.2 ........................................................................................................................... 233

1
Chapter 1
Introduction
1.1 Insect dispersal
Dispersal in insects involves movement across a landscape that potentially results in gene
flow and range expansion (Saastamoinen et al. 2018). Dispersal range and complexity are
increased by the ability to fly, and this can make prediction difficult (Stinner et al. 1983; Bowler
and Benton 2005; Ward et al. 2020). Several insect species are economically disruptive (Machado
et al. 2020; Huang et al. 2020; Fettig et al. 2020) and invasive spread of insects is enhanced by
climate change and increasing globalization (Hulme 2017). Thus, the need to predict dispersal for
control measures and damage mitigation has become increasingly urgent.
Predicting insect dispersal is difficult, in part due to complex interactions that make up the
dispersal phenotype (Jones et al. 2019). Dispersal within a population can be described using a
probability density function called a dispersal kernel, which represents the distribution of dispersal
distances within a population and is used to characterize dispersal patterns (Nathan et al. 2012).
Dispersal distances are highly variable (Evenden et al. 2014), as they involve morphological,
physiological, and behavioral trait interactions (Roff and Fairbairn 2007; Saastamoinen et al. 2018;
Jones et al. 2019), and can be affected by factors such as temperature (Atkins 1959; Aukema et al.
2008), wind (Safranyik et al. 1989; Ainslie and Jackson 2011), humidity (Safranyik and Carroll
2006), chemical cues (Atkins 1966; Robertson et al. 2007), and parasitic infection (Eveleigh et al.
2007). However, intrinsic factors such as wing and body morphology (Hassall 2015; Dominguez
and Abdala 2019), joint resilin (Haas et al. 2000; Bäumler and Büsse 2019), and genetics (Jones
et al. 2015; Zhou et al. 2020) can also be influential. In this thesis I hope to improve the body of

2
knowledge surrounding insect dispersal flights by focusing on morphology and genetics, as well
as landscape-scale patterns, associated with dispersal by the destructive forest pest, mountain pine
beetle (Dendroctonus ponderosae Hopkins).
1.2 Investigating the correlates of dispersal
Some species have obvious traits that differentiate dispersal phenotypes (Zhang et al.
2019). In other species these phenotypes are not easily discerned (Shegelski et al. 2019). In such
situations individual flight capacity can be measured using computer-linked flight mills (Jones et
al. 2019; Naranjo 2019) which are capable of recording data on distance, velocity, and propensity.
However, drawing a clear relationship between natural dispersal and flight measured on mills can
be difficult. There is debate that flight mill data may be underestimated (Taylor et al. 2010) or
overestimated (Robertson and Roitberg 1998), as insects on flight mills are suspended and do not
have to carry their own weight but must overcome the inertia of the mill arm (Minter et al. 2018).
It is also possible that attempts by the insect to fly in a straight line may increase energetic costs
associated with the circular flight path of the mill (Ribak et al. 2017). Flight mills also do not
allow measurement of orientation that can be an important factor in dispersing insects (Reynolds
et al. 2016; Ribak et al. 2017). Ultimately, because of the contrast from a natural setting, flight
mill data is most useful in testing relative differences and identifying flight phenotypes based on
comparative performance (Minter et al. 2018; Naranjo 2019).
Once individuals have been characterized, dispersal data should be compared to other
variables in order to identify relationships (Minter et al. 2018). Morphological data can be
acquired through precise measurements taken by hand with calipers, ocular units on a microscope,
or through software programs such as ImageJ (Schneider et al. 2012) or Image J2 (Rueden et al.

3
2017). Once these data are collected, relationships can be identified using regression-based
analyses in programs such as R (R Core Team 2018).
Flight mill data can also be compared to genetic information (Minter et al. 2018). Many
analyses focus on pre-identification of candidate loci for testing relationships, but RNA-seq can
be used to compare the instantaneous gene expression profiles of samples to find differentially
expressed genes associated with particular conditions (Stark et al. 2019). RNA-seq technologies
have been developing rapidly; short-read technologies still remain dominant in the field, but recent
advances in long-read sequencing have reduced read ambiguity and allow complete identification
of longer transcripts that are otherwise difficult to capture (Oikonomopoulos et al. 2016).
Regardless, short-read RNA-seq remains a powerful and popular tool in identifying candidate
genes (Stark et al. 2019).
One drawback of RNA-seq is that sample acquisition and preparation is highly sensitive
and may be difficult to achieve in the field. Alternatively, DNA is comparatively easy to work
with. Association studies are one way to use DNA to test a large number of loci for variants related
to a particular trait (Visscher et al. 2017). This kind of association study can be done using
programs like TASSEL (Bradbury et al. 2007), and can account for continuous, non-normally
distributed data through permutation testing (Che et al. 2014). Statistical power for such analyses
is low due to necessary p-value corrections, but this can be countered by increasing sample sizes
(estimated at hundreds to thousands of individuals; Visscher et al. 2017), or minimizing the area
of focus in the genome, reducing the number of tested loci.

4
1.3 Systematics, life history and impact of the mountain pine beetle
The term bark beetle generally refers to the subfamily Scolytinae within the family
Curculionidae. Scolytine beetles have a shortened snout and several “stumpy” features that are
adapted to tunneling within plant tissues (Hulcr et al. 2015). Within Scolytinae, the bark beetles
sensu stricto include those that feed and breed within the inner bark of a host tree (Raffa et al.
2015), such as D. ponderosae.
The genus Dendroctonus Erichson is the sister genus to Hylurgus (Jordal and Cognato
2012; Pistone et al. 2018) and is currently within the tribe Hylurgini, although this tribe is currently
paraphyletic and will be undergoing major revisions (Pistone et al. 2018). Within the genus
Dendroctonus, D. ponderosae and D. jeffreyi Hopkins are sister species based on COI sequence
data (Victor and Zúñiga 2016), genomic SNP data (Godefroid et al. 2019), as well as
morphological features, such as similarities in elytral declivity, tubercles on the head and base of
the mandibles, and mycangia (Victor and Zúñiga 2016), which are sac-like structure on the
mouthparts used to carry symbiotic fungi. Aside from morphology, these two species have similar
life histories involving facultative predation on host trees, are sympatric, and have similar gallery
structures (Wood 1982). Differences occur in the primary female pheromone constituents (Paine
et al. 1999) and the host trees they occupy; D. jeffreyi is only found in Pinus jeffreyi Balf., and D.
ponderosae is found in every pine species within its range except P. jeffreyi (Fettig 2016).
The general life cycle of bark beetles involves (i) colonization of a host tree and
reproduction, (ii) overwintering and development under the bark of the tree, and (iii) emergence
and dispersal to find new host (Raffa et al. 2015). Although there are many variations on this life
cycle within the bark beetles, the general pattern remains the same. There are two main attack

5
strategies used by Dendroctonus bark beetles during colonization: some are true parasites that will
attack alone or in pairs around the base of the tree, and the larvae develop within the living tree;
others use pheromones to coordinate mass attacks to kill the host tree (Reeve et al. 2012; Godefroid
et al. 2019). This latter strategy is used by D. ponderosae and has the potential to develop epidemic
population outbreaks (Burke and Carroll 2017).
In order to begin colonization, the pioneering beetle must select a host tree. Three
hypotheses have been used to explain host choice and colonization behavior in mountain pine
beetle (Latty and Reid 2010; Chubaty et al. 2014; Jones et al. 2020): (a) the “safe site” hypothesis
postulates that beetles will select trees with low defenses in order to maximize the probability of
success, (b) the “desperation” hypothesis predicts that beetles with lower energy reserves will
attempt to colonize a tree regardless of its condition, and (c) the “condition matching” hypothesis
proposes that the condition of the tree and beetle are both important in such a way that fit beetles
may colonize a healthy tree. In D. ponderosae, females are the pioneering sex (Blomquist et al.
2010). They will perform the initial attack on a host tree and coordinate aggregation using the
pheromone trans-verbenol (Chiu et al. 2019). The strength of this pheromone signal increases
with dispersal distance, likely enhancing the ability to aggregate at distant attack sites (Jones et al.
2020). Males that join in the attack will produce exo-brevicomin and frontalin, both of which also
initially act as aggregation pheromones (Aw et al. 2010; Keeling et al. 2013a). Once host defenses
have been overcome, and to avoid overcrowding in the host, both sexes use antiaggregation
pheromones to signal the end of the attack; females produce verbenone (Taft et al. 2015), and a
build up of male-produced frontalin also has an anti-aggregation affect when in high
concentrations (Blomquist et al. 2010).

6
After the attack, female D. ponderosae will excavate a nuptial chamber, mate with a male
under the bark of the host tree, then bore a J-shaped vertical gallery and lay eggs, alternating along
the sides (Esch et al. 2016). In order to maximize reproductive capacity, many bark beetles,
including mountain pine beetle, degrade their flight muscles (McCambridge and Mata 1969;
Sahota 1975) to reallocate resources for reproduction (Atkins and Farris 1962; Bhakthan et al.
1970; Robertson 1998).
Development takes place under the bark of the host tree (Wertman et al.2018) and is largely
dependent on symbiotic blue stain fungi species such as Grosmannia clavigera (Rob.-Jeffr. &
R.W. Davidson) Zipfel, Z.W. de Beer & M.J. Wingf., Leptographium longiclavatum S.W. Lee,
J.J. Kim & C. Breuil, and Ophiostoma montium (Rumbold) Arx (Lee et al. 2007). Associated
fungi species vary based on geographic location (Rice et al. 2008) and may change over time (Six
and Bentz 2007). These fungi, carried in the mycangia of the beetle, inoculate the tree during
colonization and the excavation of natal galleries (Bleiker et al. 2009; Six 2020). The mutualist
fungi effectively stop the flow of phloem (Hubbard et al.2013), which ultimately kills the host tree.
These fungi also transfer nitrogen into the phloem where it can be ingested by developing larvae
(Bleiker and Six 2007; Six 2020).
Mountain pine beetles typically overwinter as larvae (Cooke 2009), as they have reduced
cold tolerance as eggs (Bleiker et al. 2017) and pupae (Bleiker and Smith 2019). Winter survival
can be difficult in the northern range of mountain pine beetle, as low temperatures can cause mass
mortality (Safranyik 1998; Bleiker and Smith 2019). To survive winter, beetles build up
cryoprotectants such as glycerol (Fraser et al.2017) and potentially other proline-related
compounds (Thompson et al. 2020).

7
Beetles that survive winter and predation while under the bark typically emerge mid-
summer to perform a dispersal flight (Wertman and Bleiker 2019). Dispersal distances can be
highly variable and may be performed above or below the forest canopy (Jackson et al. 2008;
Evenden et al. 2014). Above-canopy dispersal, also known as long range dispersal, is mostly
mediated by wind (Jackson et al. 2008) and may be influenced by strong updrafts caused by terrain
features (de la Giroday et al.2011). It is estimated that only 2.4% of beetles disperse this way
(Jackson et al. 2008), but this type of dispersal during the current outbreak led to the establishment
of populations in Alberta (Jackson et al. 2008; Janes et al. 2014).
The majority of mountain pine beetle dispersal is below the forest canopy and is more
dependent on individual flight capabilities (Steyn et al. 2016). In laboratories, beetle flight, as
measured on flight mills, is highly variable, ranging from no flight to over 30 km (Evenden et al.
2014). While these distances do not necessarily directly translate to dispersal flights in nature,
they indicate substantial variation in dispersal capacity (Jones et al. 2019), which provides short
and long-term advantages to a population. Short-distance dispersers have greater survival rates,
with more energetic resources available to colonize and reproduce, while those that fly long
distances take more risks and use more energy but may colonize new resource rich regions (Roff
and Fairbairn 2007; Latty and Reid 2010).
Bark beetles play an important ecological role in maintaining forest health (Axelson et al.
2009). Under endemic conditions, D. ponderosae generally only attack older, unhealthy trees
(Safranyik and Carroll 2006; Axelson et al. 2009); however, during epidemic conditions, mass
attacks can kill entire pine stands, which can have tremendous social and economic impact (Kurz
et al. 2008; Corbett et al. 2015). To reach epidemic population sizes there must be an abundance

8
of weak host trees (Safranyik and Carroll 2006), which can result from drought, fire suppression,
or range expansion into novel habitat due to climate change (Taylor and Carroll 2004; Safranyik
and Carroll 2006). Epidemic beetles are able to attack and overcome the defenses of healthy trees
(Lindgren and Raffa 2013), which perpetuates the outbreak as this epidemic behavior is passed
down from parent to offspring (Burke and Carroll 2017).
The current outbreak is the largest in recent history and has damaged more than 71,000
km2 of pine forest since the mid 1990’s (Hart et al. 2015). During this outbreak, MPB has spread
across the Rocky Mountains and become established in Alberta (Jackson et al. 2008; Janes et al.
2014), colonizing a novel host species, jack pine. The leading edge of mountain pine beetle
infestation is now near Lac La Biche, Alberta (Mac Cormick 2020), and its spread threatens to
continue eastward into the pine forests of eastern Canada and the USA. Understanding factors that
contribute to this spread is crucial to mitigating damage through control efforts (Safranyik and
Carroll 2006; Jackson et al. 2008).
1.4 Morphological and genetic correlates of flight in mountain pine beetle
Variation in flight-related morphology and genetics may have significant impacts on
dispersal and range expansion (Hill et al.1999a; Jones et al. 2015). Morphology may include wing
size and shape, flight muscle, and fitness (Azevedo et al. 1998; Hassall 2015). Fitness is often
measured as body size and weight, as larger, heavier bodies are generally indicative of greater
energy stores (lipids) in mountain pine beetle (Evenden et al. 2014; Wijerathna and Evenden
2019). Lipid content influences flight and dispersal of bark beetles in three main ways: heavier
beetles are more inclined to initiate flight (Atkins 1966; Jactel 1993; Evenden et al. 2014), they
have more energy stores to sustain flight (Thompson and Bennett 1971; Williams and Robertson

9
2008), and they have shown reduced response to olfactory cues (Bennett and Borden 1971; Jones
2019), which could prolong flight in the presence of susceptible hosts. Wing morphology has also
been linked to flight by influencing wing-beat frequency, which may impact flight capabilities
(Atkins 1960). Wing morphology in other insects is often correlated with flight ability; variation
in aspect ratio (ratio of wing length to chord) and wing size have been linked to improved flight
capabilities under different environmental conditions (Azvedo et al. 1998; Frazier et al. 2008;
Hassall 2015), and wing size has a positive correlation with flight muscle, as well as flight
frequency, speed, and duration (Palmer and Dingle 1989; Dudley 1990; Fairbairn and Roff 1990).
Differences in flight muscle have also been associated with flight capacity (Marden 2000) and may
influence flight capability in mountain pine beetle.
Flight has also been linked to genes under selection identified in population genetics studies
of mountain pine beetle (Janes et al. 2014; Batista et al. 2016), but these were never specifically
tested for relationships with flight. Other life phases of mountain beetle have been studied more
rigorously; genes have been identified that relate to detoxification of host defenses (Keeling et al.
2013b), pheromone biosynthesis (Huber and Robert 2016), and overwintering (Robert et al. 2016;
Fraser et al. 2017), but research on the genes influencing dispersal flight is lacking. Flight-related
genes have been identified in several other insects. These genes relate to metabolism (Niitepold
et al. 2009, Zhou et al. 2020), muscle function (Marden et al. 2012), wing morphology (Rogulja et
al. 2008), and generally improved flight capacity (Wheat et al. 2010; Jones et al. 2015).
Identification of such genes in mountain pine beetle would provide understanding of the
behavioral, physiological and morphological adaptations that contribute to its success, but also
provide insight into bark beetle and insect dispersal in general.

10
1.5 Population dynamics of mountain pine beetle
The range of mountain pine beetle extends from near the border of Yukon and B.C.,
Canada, in the north, to as far south as Mexico (Six and Bracewell 2015). Throughout this range
there are genetic patterns of isolation by distance with the exception of areas in which barriers to
dispersal occur (Mock et al. 2007). There are also indications of recent range expansion, such as
low genetic diversity, in the northern USA populations that extend into Canada (Mock et al. 2007;
Janes et al. 2018).
Historically, mountain pine beetle was native to southwestern Alberta and BC. These
populations are generally endemic and contribute to forest health (Axelson et al. 2009), but with
periodic outbreaks that do immense damage to pine stands, and, consequently, a long history of
control efforts, largely within the pine forests of BC (Alfaro et al. 2010). Such reports of beetle
outbreaks in BC occur as early as the 1900s, and subsequent outbreaks have occurred in the 1930s,
1940s, 1970s, and 1980s. The current outbreak began in the 1990s and led to the establishment of
mountain pine beetle in Alberta in the early 2000s (Alfaro et al. 2010).
The newest leading-edge populations in Alberta are found in Hinton and Lac La Biche
(Town of Hinton [accessed 2020]; Mac Cormick 2020) and both are of particular concern. Part of
the economy in Hinton relies on local forestry, and the presence of mountain pine beetle in Lac La
Biche demonstrates population establishment in the novel host species, jack pine (Pinus
banksiana).
Several studies have focused on population structure and gene flow in mountain pine
beetle (Cullingham et al. 2019), and evidence has revealed genetically distinct populations in

11
Alberta: a northern invasive population, a southern resident population (Samarasekera et al. 2012;
Janes et al. 2014; Batista et al. 2016), and a population that is a genetic intermediate that is likely
a product of admixture between the northern and southern populations (Trevoy et al. 2018b).
Identification of the north and intermediate populations also indicates that, during the recent
outbreak, mountain pine beetle entered Alberta on two fronts; one arrived near Grande Prairie in
the early 2000s, and the intermediate population entered through Jasper National Park more
recently. Speculation on the nature of the genetically intermediate population has indicated some
potentially important concerns relating to management, particularly if this admixture has produced
novel adaptive genetic elements (Trevoy et al. 2018b).
1.6 Thesis Objectives
In this thesis I investigate dispersal of mountain pine beetle on 3 scales: (i) I compare
empirically observable morphology to flight performance; (ii) I explore genetic and transcriptomic
elements related to flight and dispersal; and (iii) I look at overall population dynamics resulting
from dispersal across the landscape in Alberta.
There are many potential factors affecting dispersal (Hill et al. 1999), and identifying
morphology associated with flight of mountain pine beetle can help us understand variation in
dispersal. In Chapter 2 I compare body, wing and flight muscle morphology to identify features
related to dispersal capacity, as measured by a computer-linked flight mill bioassay.
Some variation in dispersal capacity is related to genetic factors (Minter et al. 2018), which
can involve large suites of genes (Jones et al. 2015). In Chapter 3 I survey the transcriptome for
genetic systems and candidate flight genes, and I use this data to inform a targeted association

12
study to identify genetic markers associated with differential flight performance in mountain pine
beetle.
Mountain pine beetles are expanding their range across Alberta and have recently
established in Hinton and Lac La Biche (Town of Hinton [accessed 2020], Mac Cormick 2020).
Genetic information can provide substantial insight into this movement across the landscape (Janes
et al. 2018; Cullingham et al. 2019). In Chapter 4 I use genetic variation among and between
sample sites to identify population structure of mountain pine beetle populations across central
Alberta.
Through this research, I hope to not only identify factors related to flight and dispersal in
insects, but also to draw connections between these three scales by identifying genes and
morphology linked to dispersal-related behaviors that may, in turn, affect landscape-scale dispersal
success.

13
Chapter 2
Morphological variation associated with dispersal capacity in a tree-killing bark beetle
Dendroctonus ponderosae Hopkins
A version of Chapter 2 has been published as Shegelski VA, Evenden ML, Sperling FAH (2019)
“Morphological variation associated with dispersal capacity in a tree-killing bark beetle
Dendroctonus ponderosae Hopkins”, Agriculture and Forest Entomology volume 21, pages 79-
97.
2.1 Summary
Intrinsic factors influencing the dispersal of insect pests during outbreaks are poorly
understood, yet these factors need to be quantified to parameterize dispersal in models that predict
population spread. The present study related wing and body morphology of female mountain pine
beetles (Dendroctonus ponderosae) to flight distance, as measured by flight mill bioassays.
Beetles that flew long distances (> 11 km) had a greater body weight and larger wings than beetles
that flew short distances (< 1 km). These heavier female beetles should also be more capable
pioneers because other studies have shown that body weight is positively correlated with lipid
content.
Wing and body morphology of females are significant predictors of flight distance; heavy
beetles with large wings generally flew further than smaller beetles, although this relationship is
heteroscedastic. Dispersion of flight distance values increases with wing loading (weight/wing

14
area) as a result of a cohort of ‘lazy’ individuals that fly short distances (< 1 km) regardless of
flight phenotype. The observed morphology explained less than 20% of the variation in flight
capacity, indicating a substantial contribution from other intrinsic factors that remain to be
investigated. The present study may have implications for dispersal modelling, providing estimates
of flight capacity using morphological measurements.
2.2 Introduction
Dispersal leading to range expansion can exert selective pressures on the physical traits
associated with dispersal phenotypes (Olivieri and Gouyon 1997; Hassall 2015). In many insects,
traits like wing morphology, flight muscle and body condition can influence flight capacity and
dispersal potential (Azevedo et al. 1998; Hassall 2015). Measurements of such flight-related traits
can be used to infer an individual’s ability to disperse and may also be correlated with successful
establishment after dispersal (Manning and Reid 2013; Evenden et al. 2014). Models that predict
dispersal capacity by pest species have become important tools for environmental conservation
and resource management through the refinement of damage prevention, especially in cases of
range expansion and invasion of novel habitats (Safranyik and Carroll 2006).
The mountain pine beetle (MPB) Dendroctonus ponderosae Hopkins (Coleoptera:
Curculionidae) is a tree-killing bark beetle that attacks and kills pine trees across western North
America. MPB has recently expanded its range eastward (Safranyik et al. 2010). This spread is
threatening to continue; historically, MPB distribution has been limited by climate rather than host
availability (Safranyik 1978), but climate change has made previously unsuitable regions available
to this species (Carroll et al. 2004). Milder climate and protection of large overmature trees from
natural fires have created conditions in which the beetles can thrive and reproduce to reach

15
epidemic population levels (Taylor and Carroll 2004; Safranyik and Carroll 2006). This has led
to the destruction of over 723 million m3 of merchantable pine in British Columbia and Alberta
during the last outbreak (NRCan 2017), with subsequent ecological and economic impacts (Kurz
et al. 2008; Corbett et al. 2015). These losses can be reduced through effective allocation of
management resources based on early risk detection (Safranyik and Carroll 2006). Resource
allocation is increasingly important in epidemic scenarios in which total control of MPB is not
realistic. In such scenarios, equipment and manpower must be allocated in accessible areas that
will maximize the impact on MPB spread while minimizing cost. Predictive modelling of MPB
spread is one means of risk detection, and such models need to be parameterized with variables
such as regional climate and dispersal capacity (Atkins 1961; Robertson et al. 2007; Aukema et al.
2008; Goodsman et al. 2016). Climatic data are often available, but the ability to identify MPB
dispersal phenotypes is lacking.
The variable dispersal behaviour of MPB poses a challenge for predicting its range
expansion. Beetles can utilize updrafts to disperse above the forest canopy (Jackson et al. 2008; de
la Giroday et al. 2012), but research has shown that a majority of dispersal can take place below
the canopy (Safranyik et al. 1992). In below-canopy dispersal, many beetles ignore susceptible
host trees immediately upon emergence in order to colonize new locations (Safranyik et al. 1989;
Robertson et al. 2007). Below-canopy dispersal is self-propelled and can be parameterized in vitro
with computer-linked flight mill bioassays. Many models predict MPB dispersal at both landscape
and stand levels based on spatio-temporal patterns (Robertson et al. 2007; Aukema et al. 2008;
Chen and Walton 2011), climate (Aukema et al. 2008), host vigor (Lewis et al. 2009) and other
environmental conditions (Safranyik et al. 1989; Robertson et al. 2007; Ainslie and Jackson 2011).
Inclusion of flight mill data can improve model accuracy by providing detailed data on flight

16
behavior and patterns such as stopping frequency and length of uninterrupted flight times
(Goodsman et al. 2016). Finding the relationships of MPB wing and body morphology to
measured flight capacity should improve our ability to predict bark beetle dispersal in nature.
In insects, wing morphology (e.g, shape and size) and flight muscle mass are often
correlated with dispersal capability. Factors such as variance in aspect ratio (ratio of wing length
to width) have been linked to greater dispersal in populations at higher latitudes (Azevedo et al.
1998; Hassall 2015). For example, small wing aspect ratio and large relative wing size can increase
the flight capacity of Drosophila in cool climates (Azevedo et al. 1998; Frazier et al. 2008). In
several insect species, such as milkweed bugs, neotropical butterflies and sand crickets, there are
positive relationships between wingspan and flight frequency, duration and speed (Palmer and
Dingle 1989; Dudley 1990; Fairbairn and Roff 1990). Along with wing size, thoracic muscle mass
can influence flight capability in butterflies (Dempster et al. 1976; Chai and Srygley 1990). In bark
beetles, body mass correlates with flight distance and duration (Williams and Robertson 2008;
Evenden et al. 2014). In general, body mass has been a primary factor in body condition
quantification (Elkin and Reid 2004; Elkin and Reid 2005). Body condition is considered to
represent the intrinsic resources available for growth, survival and reproduction, and is
consequently important for successful colonization (Boggs 1992).
Dispersal is necessary in MPB as adults must find a new host tree in order to reproduce
(Safranyik and Carroll 2006), and females are pioneers in host colonization. Females initiate the
attack once they arrive on a host and release aggregation pheromones to attract conspecifics
(Blomquist et al. 2010), and bark beetle body condition determines the quality and quantity of their
offspring (Kautz et al. 2016). Correlations among lipid content, attack success and reproduction

17
in bark beetles have been well documented (Elkin and Reid 2005; Reid and Purcell 2011; Manning
and Reid 2013; Kautz et al. 2016); larger, heavier beetles have greater lipid content (Evenden et
al. 2014), resulting in increased fecundity (Elkin and Reid 2005), and greater ability to resist host
defences (Reid and Purcell 2011). Larger females therefore are potentially better pioneers through
their capacity to facilitate range expansion.
As the condition of females is influential in colonizing novel regions, this study aims to
identify and quantify the morphological factors associated with female MPB dispersal capacity.
These morphological features of females could provide a way to characterize the flight potential
of individuals and dispersal capacity of populations (Hill et al. 1999b; Hassall et al. 2009). Given
that flight performance is often associated with phenotypic traits such as wing size and body
condition, larger individuals with larger wings should have greater dispersal capacity.
2.3 Methods
2.3.1 Beetle data collection
All MPB used for this study were collected near Grande Prairie, Alberta, Canada (55.17
N, 118.80 W). The sample group was reared from bolts collected in October 2015. Four lodgepole
pine trees infested by MPB were selected (3 from site 1 at 54.57 N, 119.42 W; and 1 from site 2
at 54.19 N, 118.68 W), and two 50-cm bolts were cut from each tree at 1m above ground level.
All bolts were sealed with paraffin wax on the cut ends upon felling. These bolts, containing larval
MPB, were stored at 4°C until use.
Bolts were removed from 4°C and placed in separate 136 L opaque plastic emergence
chambers at 24±1°C in April 2016. Emerged beetles were collected daily. A total of 173 females
were collected and flown; however, 49 beetles that flew less than 10 m, 44 of which did not fly at

18
all, were removed from this study in order to exclude individuals that had irregular flight
behaviours that were unlikely to be related to observed morphological features. Overall, the
experimental group consisted of 124 female beetles, including 53 collected from site 1 bolts and
71 from site 2 bolts. Individual beetles were separated by sex based on the incidence of beetle
stridulation, which is considered to be ~98% accurate for identifying males (Rosenberger et al.
2016). This was performed at 24±1°C. The beetles were then placed in 2 mL centrifuge tubes
with a small piece of paper and stored at 4°C to reduce use of metabolic resources until the flight
assay (Evenden et al. 2014), which was performed 3 to 5 days post emergence.
Flight distance, duration and frequency data was collected for female beetles using the
methods for computer-linked flight mill bioassays of Evenden et al. (2014). Flight distance was
calculated as the total distance flown over a flight period, flight duration was calculated as total
time spent in-flight, and flight frequency was calculated as the number of times flight was initiated
after a minimum 5 second period of non-flight. Females were weighed prior to flight (Mettler
Toledo, XS105 accurate to 0.01mg), and body dimensions (total length and pronotum width) were
measured using digital calipers (Pro.Point 1-150mm, accurate to 0.01mm; remeasuring of 10
randomly selected specimens verified 99.01% precision). Beetles were then attached to a 2 cm
long tether of 0.32 mm-diameter aluminum wire using LePage® Heavy Duty Contact Cement.
Tethers were carefully attached to the pronotum to ensure no interference of elytra and wing
movement. Length of the flight bioassay was 22 hours. This duration was chosen to allow for
processing of samples and switch over of specimens between flight cohorts. During the flight
assay the flight mill chamber had a photoperiod of 16:8 (L:D) h and a temperature of 22.5 °C.
Flight assays began 2 hours after initiation of the light phase of the photoperiod, which allowed
19
time to process the previous flight group, and to prepare the next group of beetles for the 22-hour
flight assay. Female beetles were flown in groups ranging from 8 to 20.
After flights were complete, beetles were weighed again and stored in 85% ethanol at -
20°C. For morphological data collection, wings were removed and suspended in a 50% ethanol
solution. Wings were unfolded using paintbrushes and positioned, then removed from the solution
by sliding a small strip of card stock below the wing and gently lifting it, maintaining the unfolded
wing shape. The wings were fixed to the card stock strip by applying a thin layer of diluted glue
with a fine paintbrush. Dried wings were scanned and measured using ImageJ version 1.51j8
(Schneider et al. 2012).
Sixty-two MPB individuals were available for muscle dissection. The metathoracis
medianus, lateralis posterior and lateralis medius flight muscles were identified for dissection
based on Reid (1958) and Chapman (1998). After removal of the wings and elytra, the metathorax
was opened by removing the dorsal tergites. Once the flight muscles were exposed, fibre length
and lateral width of the metathoracis medianus were measured using an ocular micrometer in a
dissection microscope under 50x magnification. The anterior edge of a medial segment of the
metathoracis medianis was then detached from the metathoracic prephragma and its transverse
thickness was measured. Subsequently, the transverse thickness and lateral width of the lateralis
medius and the lateralis posterior were measured. The lateralis medius was then carefully
separated from the metacoxa, extracted from the metathorax, placed flat and its length measured.
Measurements of the volume of individual muscles were then summed into 2 groups: dorsal
longitudinal flight muscle volume, which included the metathoracis medianus muscle group, and
dorsal ventral flight muscle volume, which included measurements of the lateralis medius and the

20
lateralis posterior. Individual muscle measurements were each included in preliminary models but
were not found to provide additional explanatory power individually. To simplify variables and
interactions in the presented models, these measurements were consolidated by calculating the
volume of an elliptical cylinder, representing the flight muscle volume, and this value was used
for further analyses.
2.3.2 Statistical analysis
All statistical analyses were conducted in R version 3.3.2 (R Core Team 2017). Model R2
values were obtained using the R package piecewiseSEM (Lefcheck 2015) which finds R2 values
for non-fixed effect linear models, based on Nakagawa and Schielzeth (2013) and Johnson (2014).
Flight models were created and analysed using R packages nlme (Pinheiro et al. 2017) and lme4
(Bates et al. 2015).
ANOVA hypothesis testing was used to determine whether differences exist between the
strongest and weakest fliers observed in this study. Samples were separated by quartiles based on
flight distance in order to apply the ANOVA tests. The upper quartile beetles, with flight distances
> 11.13 km (n=31), represented strong fliers. They were compared to the lower quartile beetles
that represented weak fliers, with flight distances < 1.05 km, (n=31; this number excludes any
beetles that flew less than 10 m). Muscle volume was also compared using ANOVA hypothesis
tests on the top and bottom quartiles, but with smaller sample sizes since fewer beetles with
dissected flight muscle were available. The top quartile group contained 16 beetles, with flight
distances > 8.0 km, and the bottom quartile group contained 16 beetles, with flight distances < 3.5
km. Morphological features tested included body weight, body size (calculated as ellipsoid
volume[ 4
3∗ 𝜋 ∗ 𝑏𝑜𝑑𝑦 𝑙𝑒𝑛𝑔𝑡ℎ ∗ 𝑝𝑟𝑜𝑛𝑜𝑡𝑢𝑚 𝑤𝑖𝑑𝑡ℎ2]), preflight weight, postflight weight, density

21
(𝑝𝑟𝑒𝑓𝑙𝑖𝑔ℎ𝑡 𝑤𝑒𝑖𝑔ℎ𝑡
𝑏𝑜𝑑𝑦 𝑠𝑖𝑧𝑒), absolute weight lost, proportional weight lost, wing size (measured as two-
dimensional surface area), and wing shape (calculated as aspect ratio: 𝑤𝑖𝑛𝑔 𝑙𝑒𝑛𝑔𝑡ℎ
𝑤𝑖𝑛𝑔 𝑤𝑖𝑑𝑡ℎ).
A linear mixed effects model was produced using distance flown as the dependent variable.
Each included emergence bolt and flight mill as random variables. Each full model included the
independent variables: pre-flight weight, body size, wing size, age (days since emergence) and
wing shape, as well as all two-way interactions. Stepwise model simplification was achieved by
removal of the least significant variables (highest p-values) until only significant (p<0.05)
variables remained, and reduced models were compared to previous models and the full model
using AIC and ANOVA hypothesis testing until the most parsimonious model was found.
Following model refinement methods by Crawley (2013), interactions between variables were
preferred for removal over basic variables in instances where both variables and interactions had
a p-value greater than 0.05. All models were tested for significance using F-tests, and the included
independent variables were tested with ANOVA. The residuals of each regression model were
observed for random dispersal, and a variance inflation factor test was performed on each model
before and after refinement using the R package fmsb (Nakazawa 2017)
We tested the significant regression variables of distance flown for heteroscedasticity using
Breusch-Pagan tests. When heteroscedasticity was present, quantile regressions were used to
regress the data at separate quantiles of the independent variable, using the R package quantreg
(Koenker 2017). Because variables can only be tested independently in quantile regression, a third
variable, wing loading (𝑝𝑟𝑒𝑓𝑙𝑖𝑔ℎ𝑡 𝑤𝑒𝑖𝑔ℎ𝑡
𝑤𝑖𝑛𝑔 𝑎𝑟𝑒𝑎), was introduced to combine the significant independent
variables into a single term. Tests were conducted at the quantiles of 0.12 to 0.96 in increments
of 0.12 in order to maximize resolution while retaining an adequate number of samples per

22
quantile. When heteroscedasticity was observed, ANOVA hypothesis testing was used to compare
slopes to an average quantile slope.
2.4 Results
2.4.1 Morphology associations
Variability in the following data is reported as standard error. Female MPB flew an average
distance of 7.4±0.58 km over the 22-hour flight period, with a maximum flight distance of 28.81
km. On average, beetles flew for 3.70±0.29 hours and initiated flight 176±27.52 times; 81.8% of
the total flight distance occurred during the light stage of the photoperiod. Strong fliers flew
longer, and more frequently, than weak fliers (F(1,60)=402.230, P<0.0001; and F(1,60)=7.433,
P=0.0084, respectively). Strong fliers flew an average of 7.60±0.36 hours with an average
frequency of 144.8±29.65 flights, while weak fliers flew an average of 0.170±0.03 hours with
55.5±12.67 flights. Forty-four beetles did not fly at all, while 5 flew less than 10 m. Dispersal
distance data was not normally distributed (Figure 2.1). A complete table to flight and morphology
data can be seen in Appendix 2.1.
Long distance and short distance fliers were morphologically different (Figure 2.2).
Beetles that flew longer distances had greater body weight, both preflight (F(1,60)=9.021, P=0.0039)
and postflight (F(1,60)=6.637, P=0.0125), as well as greater body density (F(1,60)=15.741, P=0.0002).
Long distance fliers also lost more absolute weight (F(1,60)=10.990, P=0.0016) and proportional
weight (F(1,60)=5.467, P=0.0227) during the flight bioassay. Long distance fliers tended to have
larger wings, but this only bordered significance (F(1,60)=3.740, P=0.0578; Figure 2.2). There was
no significant difference between long and short distance fliers in wing shape (F(1,60)=1.453,
P=0.2328), body size (F(1,60)=1.332, P=0.2530), or flight muscle volume (F(1,30)=0.1008,

23
P=0.7530). Plots containing all 124 samples showing the relationship between total distance flown
and preflight weight, postflight weight, wing area, body density, proportional weight lost, and
absolute weight lost can be seen in Appendix 2.2. The age of beetles in this study (3-5 days) had
no relationship with flight distance (F(1,60)=0.440, P=0.5095).
2.4.2 Regression models
After model refinement, flight distance of MPB was significantly related to both wing size
(F(1,121)=8.512, P=0.0042) and preflight weight (F(1,121)=12.466, P=0.0006). Heavier beetles with
larger wings flew farther than lighter beetles with smaller wings. Wing data was essential in
predicting flight performance; exclusion of wing size data resulted in a significant loss of
explanatory power in the flight distance model (F(121,122)=8.512, P=0.0042), as well as an increase
in AIC (AIC 2516.0 to 2522.4). Ultimately, these linear mixed effects models explained only a
limited amount of the flight performance in female MPB. The models predicted 19% of variation
in flight distance (R2=0.1910).
A variance inflation factor (VIF) of 10 or more indicates multicollinearity; VIF tests showed that
there was no multicollinearity before or after model refinement (VIF=1.32 and VIF=1.17,
respectively).
2.4.3 Heteroscedasticity and quantile regression
Breusch-Pagan tests showed potential heteroscedasticity in the relationship of distance
flown to preflight weight (BP(1)=10.447, P=0.0012) and wing area (BP(1)=4.028, P=0.0447), which
were more prevalent when both variables were tested simultaneously as wing loading
(BP(1)=16.811, P<0.0001).

24
Preflight weight and wing area were first tested with quantile regression separately (Figure
2.3). Distance flown had a significantly different response to preflight weight at the 96% quantile
(F(1,247)=5.399, P=0.0210), but showed no significant difference at the 12% quantile (F(1,247)=3.369,
P=0.0676). Preflight weight had a significantly stronger effect on flight distance when it was
greater, with an increase of 1.63 km in flight distance per 1 mg increase in beetle weight, while it
otherwise had an average increase of 0.67 km per 1 mg increase in preflight weight.
When both variables were combined into wing loading, the tests for heteroscedasticity
revealed a general trend in which the dispersion of distance flown values increased with wing
loading. Distance flown had a significantly different response from the average at both the 12%
quantile (F(1,247)=12.132, P=0.0006; Figure 2.4 and the 96% quantile (F(1,247)=4.495, P=0.0350;
Figure 2.4). At the 96% quantile, the predicted distance flown increases by 38.5 km per 1 mg/mm2
increase wing loading, while at the 12% quantile this relationship was reduced to an increase of
1.6 km per 1 mg/mm2. Otherwise, the average increase was 19.3 km per 1 mg/mm2 wing loading.
2.5 Discussion
2.5.1 Morphology associations with dispersal capacity
We found that heavier beetles with larger wings flew farther than lighter beetles with
smaller wings. After simplification, linear mixed effects models showed that the primary variables
explaining distance flown were wing size and preflight body weight. Increased dispersal capacity
by heavier individuals has also been found in other studies (Hill et al. 1999a; Williams and
Robertson 2008; Evenden et al. 2014). Although body weight was a significant predictor of
dispersal in this study, body size was not related to flight distance. Reid and Purcell (2011) found
no relationship between body size and fat content but demonstrated that relative body weight is

25
correlated with fat content. Other research has also shown the relationship between weight and
lipid content (Williams and Robertson 2008; Evenden et al. 2014), implying that denser beetles
have a greater store of flight fuel per unit of body size that allows them to fly further. This is also
supported by our findings of increased density in long distance fliers.
An increase in stored lipids can also influence dispersal behaviour in bark beetles through
behavioural responses to olfactory stimuli. Some newly emerged beetles will ignore both visual
and chemical cues from susceptible hosts (Shepherd 1966; Safranyik et al. 1989; Eidson et al.
2017). In the Douglas-fir beetle, Dendroctonus pseudotsugae, beetles with higher fat content are
less responsive to aggregation pheromones and spend more time selecting a host to colonize
(Atkins 1966; Bennett and Borden 1971), thereby increasing dispersal; depletion of fat reserves
through flight initiates a behavioural response in which the beetles are more responsive to olfactory
cues. Fat content likely has a similar effect on dispersal in MPB, as well as impacting colonization
success (Seybold et al. 2006; Reid and Purcell 2011) and reproduction (Manning and Reid 2013)
after dispersal.
We have shown that long range dispersing beetles not only have higher preflight weight,
but postflight weight as well, which can influence the success of pioneers. Successful colonization
requires large amounts of stored fat to detoxify monoterpenes produced by the host tree (Reid and
Purcell 2011), and to produce offspring (Elkin and Reid 2005; Manning and Reid 2013). Greater
postflight weight provides a substantial advantage to MPB, since the heaviest individuals are most
likely to disperse long distances and also have the greatest chance of succeeding in host
colonization.

26
While weight is important in dispersal capacity of MPB (Evenden et al. 2014), the inclusion
of wing morphology significantly increased the predictive power of the regression models tested
in this study. Wing size is often important for flight performance in insects (Betts and Wootton
1988; Taylor and Merriam 1995; Hill 1999a), and larger wings increase lift and carrying capacity
(Wootton 1992), allowing longer distance travel with a greater load of resources for dispersal and
colonization, such as lipids. Large wings are also important for flight capacity in cold climates;
cold temperatures can reduce flight muscle function and wing beat frequency, but larger wings
allow for increased lift generation with lower input power (Azevedo et al. 1998; Frazier et al.
2008). Individuals with such an advantage could have contributed to the recent range expansion
of MPB north into the Northwest Territories (NRCan 2017), and eastward across the Rocky
Mountains, although this hypothesis remains to be tested.
The ability to predict range expansion can be challenged by difficulties in acquiring data
for predicting dispersal phenotype; however, morphological data related to dispersal capacity can
be obtained from specimens that are already available from population monitoring. Currently, 4-
inch diameter disks are collected from infested trees in many mass attack regions, and larvae are
observed under the bark to determine the reproductive success of a population (Alberta Agriculture
and Forestry 2016). Quantification of the relationship between larval instars and adult size is
needed, but, with some modification of sampling procedure, collected data, such as larval weight,
could be incorporated into this data collection and subsequently used in dispersal models that
distinguish between regional populations.
Although not investigated in this study, wing size may also affect above-canopy passive
dispersal. Range expansion in MPB can also occur through long distance dispersal events in which

27
beetles are caught in updrafts and carried up to 300 km (Cerezke 1989; Jackson et al. 2008).
Certain behaviours exhibited by MPB hint at adaptations to passive dispersal: 44 of the beetles
that were tethered to flight mills did not actually fly, but many of these displayed a “drifting”
behaviour in which they would open the elytra and spread their wings fully, without flapping.
Similar behaviors have been documented by Atkins (1959) when testing flight preparation and
response in the Douglas-fir beetle, D. pseudotsugae. They found that some beetles fully extended
their wings, but did not vibrate them, when tossed in the air. We suggest that such behaviour,
when caught in an updraft, could maximize the exposed wing area while minimizing energy
consumption. Associations between stationary wing size and passive dispersal distance occur in
winged seeds of plants, (Augspurger 1986) and this relationship could be similar in insects
dispersed by the wind.
2.5.2 Heteroscedasticity in flight distance and future directions
Many factors can affect flight performance, and although the morphological variation
observed in our study follows a normal distribution, the distribution of flight capacities follow a
well-known non-normal pattern of dispersal, the dispersal kernel (Figure 2.1; Bateman 1950;
Chapman et al. 2006). We found that many individuals fly only short distances on the flight mill
while very few fly long distances. There are population-wide advantages to this distribution of
dispersal behaviours, as it gives the greatest survivorship in the largest portion of the population
while still allowing some risk for colonization. Beetles that fly short distances use less lipid
(Williams and Robertson 2008; Evenden et al. 2014) and tend to be more successful in colonizing
host trees than similarly sized beetles that burn more of their lipid reserves to disperse (Reid and
Purcell 2011; Manning and Reid 2013; Kautz et al. 2016). In our study, we found that body weight
and wing size were associated with flight distance and, consequently, a population of larger

28
individuals with larger wings is likely to have a greater proportion of long distance dispersers;
however, the strong positive skew in the dispersal kernel of MPB causes inconsistencies with
predictions based on linear relationships with morphology.
Even with both wing and body morphology included, the power of these models to predict
flight distance remains relatively low. Part of the weakness in the relationship of morphology with
flight distance is due to heteroscedasticity in the coefficients of the variables. Quantile regression
shows that preflight weight and wing area, when considered separately, do not show a clear
relationship with flight distance (Figure 2.3); however, when combined as wing loading, the
heteroscedastic nature of the relationship becomes evident (Figure 2.4). When wing loading is
low, morphology has little power to predict dispersal, but the relationship at high wing loading
values has a significantly higher slope, indicating that small increases can have a significant
positive impact on dispersal capacity (Figure 2.4). This inconsistent relationship is caused by an
increase in the dispersion of flight distance at different quantiles of wing loading and is likely due
to the large cohort of ‘lazy’ individuals that fly only short distances regardless of high wing loading
(Figure 2.4). These ‘lazy’ beetles increase the disparity between individuals with low and high
wing loading within each quantile, which subsequently increases the quantile slope coefficient.
This creates difficulties in predicting the relationship between morphology and flight capacity and
indicates that there is more than morphology associated with dispersal capacity. The natural
tendency to disperse is an important contributor to flight distance in other insects (Steyn et al.
2016), and further research should focus on identifying factors that contribute to variation in
dispersal behaviour, such as the ‘lazy’ dispersal phenotype seen in our study.

29
Other factors involved in dispersal capacity in the natural environment that could not be
tested in this lab study include abiotic conditions such as temperature (Atkins 1959; Aukema et al.
2008), wind (Safranyik et al. 1989; Ainslie and Jackson 2011), and humidity (Safranyik and
Carroll 2006). Biotic factors that can influence dispersal include host presence, density and
distance from the beetle (Atkins 1966; Robertson et al. 2007), wing flexibility (Mountcastle and
Combes 2013), joint resilin content (Haas et al. 2000), as well as parasitic infections (Everleigh et
al. 2007). Some of the variation in the relationship between beetle morphology and flight
performance may be mediated by behaviour. Atkins (1966) has shown that different female
dispersal behavioural types exist within Douglas-fir beetle populations, but the behaviours
exhibited by these types did not appear to have a strong correlation with body weight. Our results
similarly reveal that some ‘lazy’ individuals do not fly to their capacity as indicated by wing size
and body weight. Although morphological characteristics demonstrably have an impact on flight
capacity in MPB, other factors that govern dispersal-related behaviour, such as gene expression,
should also be investigated.
2.6 Conclusions
Body weight and wing size contribute to dispersal capacity in mountain pine beetle, and
such data can potentially be useful in improving dispersal model quality (Goodsman et al. 2016).
Although many other factors must also be considered in the parameterization of dispersal models,
we have shown that large female beetles with large wings generally have increased dispersal
capacity, flying farther than smaller beetles with smaller wings; autonomous populations in
dispersal models can be assigned flight capacities based on morphology observed in situ through
use of samples already being collected for monitoring purposes.

30
As large females are better colonizers (Seybold et al. 2006; Reid and Purcell 2011;
Manning and Reid 2013), our study expands understanding of the mechanisms by which MPB
establish new populations and increase their range; however, due to the heteroscedasticity of the
data, morphological variation alone provides limited power to predict flight capacity; many
individuals fly short distances despite having the morphology of long distance dispersers. This
suggests that, even in a controlled laboratory setting, other intrinsic factors also influence flight
and dispersal behaviour. Further research should target these intrinsic influences so that we can
better understand the elements governing dispersal-related behaviours of MPB and other
economically significant insect species.

31
Figure 2.1. The positive skew in the distribution of flight distances for 124 female mountain pine
beetles. Beetles that flew less than 10 m were excluded from this study; the minimum flight
distance is 0.01 km.
0 10 20 30 40 50 Frequency
0 5 10 15 20 25 30
Flight distance (km)

32
Figure 2.2. Morphological differences between 31 longest distance (> 11.13 km) and 31 shortest
distance (< 1.05 km) dispersing female mountain pine beetles. Long distance dispersers have
greater preflight and post flight weight, wing size, proportional and absolute weight loss. Points
represent group averages and bars show standard error. Comparisons were done using ANOVA.
All graphs depict significant results.

33
Figure 2.3. Quantile regressions showing the relationships of (A) preflight weight and (B) wing
size with flight distance at 12% quantiles of 124 female mountain pine beetles. The solid horizontal
line is the average relationship between flight distance and wing loading (dashed line is standard
error). Grey shaded area represents the 90 percent confidence band for the quantile estimates.
Preflight weight shows a significant deviation from the average relationship at the 96% quantile,
showing that higher preflight weight has an increasing effect on flight distance. Although other
potential sources of heteroscedasticity may exist, no other significant differences in slope
coefficients were found. The asterisk in (A) indicates a significantly different quantile from the
average.

34
Figure 2.4. (A) Wing loading vs flight distance of 124 mountain pine beetles, with regression lines
of the lowest 12% of dispersers (i) shown as a dotted trendline, and the highest 12% of dispersers
(ii) shown as a dashed trendline. (B) Regression at each 12% quantile shows a significant change
in the relationship, resulting in heteroscedasticity. The solid horizontal line is the average
relationship between flight distance and wing loading (dashed line is standard error). Grey shaded
area represents the 90 percent confidence band for the quantile estimates. At lower quantiles of
wing loading (i) the relationship approaches 0; at higher quantiles (ii) the relationship becomes
more pronounced. All strong fliers show high wing loading ((A), box ‘a’), but many “lazy”
individuals have high wing loading and do not fly long distances ((A), box ‘b’), causing
heteroscedasticity in the relationship. Asterisks in (B) indicate quantiles with significantly
different coefficients from the average.

35
2.7 Literature cited
Ainslie B, Jackson PL. 2011. Investigation into mountain pine beetles above canopy dispersion
using weather radar and an atmospheric dispersion model. Aerobiologia, 27: 51-65.
Alberta Agriculture and Forestry. 2016. Mountain pine beetle detection and management in
Alberta (Blue Book). Government of Alberta. Available at:
<https://www1.agric.gov.ab.ca/$department
/deptdocs.nsf/all/formain15619/$FILE/MPB%20Blue%20Book%20-
%20Complete%20Guide %202016.pdf> [Accessed 17 April 2018]
Atkins MD. 1959. A study of the flight of the Douglas-fir beetle, Dendroctonus pseudotsugae.
Hopk. (Coleoptera: Scolytidae). I. Flight preparation and response. The Canadian
Entomologist 91: 283-291.
Atkins MD. 1961. A study of the flight of the Douglas-fir beetle Dendroctonus pseudotsugae
Hopk. (Coleoptera: Scolytidae). III. Flight Capacity. The Canadian Entomologist, 93:
467-474.
Atkins MD. 1966. Laboratory Studies on the Behaviour of the Douglas-fir Beetle, Dendroctonus
pseudotsugae Hopkins. Canadian Entomologist, 98: 953-991.
Augspurger, CK. 1986. Morphology and Dispersal Potential of Wind-Dispersed Diaspores of
Neotropical Trees. American Journal of Botany, 73: 353-363.

36
Aukema BH, Carroll AL, Zheng Y, Zhu J, Raffa KF, Moore RD, Stahl K, Taylor SW. 2008.
Movement of outbreak populations of mountain pine beetle: influences of spatiotemporal
patterns of climate. Ecography, 31: 348-358.
Azevedo RBR, James AC, McCabe J, Partridge L. 1998. Latitudinal variation of wing: thorax
size ratio and wing-aspect ratio in Drosophila melanogaster. Evolution, 52: 1353-1362.
Bateman AJ. 1950. Is gene dispersion normal? Heredity, 4: 353–363.
Bates D, Maechler M, Bolker B, Walker S. 2015. Fitting Linear Mixed Effects Models Using
lme4. Journal of Statistical Software, 67: 1-48.
Bennett RB, Borden JH. 1971. Flight Arrestment of Tethered Dendroctonus
pseudotsugae and Trypodendron lineatum (Coleoptera: Scolytidae) in Response to
Olfactory Stimuli. Annals of the Entomological Society of America, 64: 1273-1286.
Betts CR, Wootton RJ. 1988. Wing shape and flight behaviour in butterflies (Lepidoptera:
Papilionoidea and Hesperioidea): A preliminary analysis. Journal of Experimental
Biology, 138: 271-288.
Blomquist GJ, Figueroa-Teran R, Aw M, Song M, Gorzalski A, Abbott NL, Chang E, Tittiger C.
2010. Pheromone production in bark beetles. Insect Biochemistry and Molecular
Biology, 40: 699-712.
Boggs CL. 1992. Resource Allocation: exploring connections between foraging and life history.
Functional Ecology, 6: 508-518.

37
Carroll AL, Taylor SW, Régnière J, Safranyik L. 2004. Effects of climate and climate change on
the mountain pine beetle (pp 221-230) in Shore TL, Brooks JE, Stone JE (eds)
Challenges and Solutions: Proceedings of the Mountain Pine Beetle Symposium.
Kelowna, British Columbia, Canada October 30 - 31, 2003. Canadian Forest Services.
Cerezke HF. 1989. Mountain pine beetle aggregation semiochemical use in Alberta and
Saskatchewan, 1983-1987. In Amman GD. (Compiler). Proceedings-Symposium on the
management of lodgepole pine to minimize losses to the mountain pine beetle, July 12-14,
1988, Kalispell, Montana (pp 108-113). Ogden, Utah: USDA Forest Service,
Intermountain Research Station.
Chai P, Srygley RB. 1990. Predation and the flight, morphology, and temperature of neotropical
rain-forest butterflies. American Naturalist. 135: 748-765.
Chapman DS, Dytham C, Oxford GS. 2006. Modelling population redistribution in a leaf beetle:
an evaluation of alternative dispersal functions. Journal of Animal Ecology, 76: 36-44.
Chapman RF. 1998. The Insects: Structure and function (4th ed.). Cambridge: Cambridge
University Press.
Chen H, Walton A. 2011. Mountain pine beetle dispersal: spatiotemporal patterns and role in the
spread and expansion of the present outbreak. Ecosphere, 2: 1-17.
Corbett LJ, Withey P, Lantz VA, Ochuodho TO. 2015. The economic impact of the mountain
pine beetle infestation in British Columbia: provincial estimates from a CGE analysis.
Forestry, 89: 100-105.

38
Crawley MJ. 2013. Regression (Chapter 10). In The R book (2nd ed) (pp 449-497). West Sussex,
United Kingdom: John Wiley & Sons, Ltd.
de la Giroday HC, Carroll AL, Aukema BH. 2012. Breach of the northern Rocky Mountain
geoclimatic barrier: initiation of range expansion by the mountain pine beetle.
Biogeography, 39: 1112-1123.
Dempster JP, King ML, Lakhani KH. 1976. The status of the swallowtail butterfly in Britain.
Ecological Entomology, 1: 71-84.
Dudley R. 1990. Biomechanics of flight in neotropical butterflies: morphometrics and
kinematics. Journal of Experimental biology, 150: 37-53.
Eidson EL, Mock KE, Bentz BJ. 2017. Mountain pine beetle host selection behavior confirms
high resistance in Great Basin bristlecone pine. Forest Ecology and Management, 402:
12-20.
Elkin CM, Reid ML. 2004. Attack and reproductive success of mountain pine beetles
(Coleoptera: Scolytidae) in fire-damaged lodgepole pines. Environmental Entomology,
33: 1070-1080.
Elkin CM, Reid ML. 2005. Low energy reserves and energy allocation decisions affect
reproduction by mountain pine beetles, Dendroctonus ponderosae. Functional Ecology,
19: 102-109.

39
Eveleigh ES, Lucarotti CJ, McCarthy PC, Morin B, Royama T, Thomas AW. 2007. Occurrence
and effects of Nosema fumiferanae infections on adult spruce budworm caught above and
within the forest canopy. Agriculture and Forest Entomology, 9: 247-258.
Evenden ML, Whitehouse CM, Sykes J. 2014. Factors influencing flight capacity of the
mountain pine beetle (Coleoptera: Curculionidae: Scolytinae). Environmental
Entomology, 43: 187-196.
Fairbairn DJ, Roff DA. 1990. Genetic correlations among traits determining migratory tendency
in sand cricket Gryllus firmus. Evolution, 44: 1787-1795.
Frazier MR, Harrison JF, Kirkton SD, Roberts SP. 2008. Cold rearing improves cold-flight
performance in Drosophila via changes in wing morphology. The Journal of
Experimental Biology, 211: 2116-2122.
Goodsman DW, Koch D, Whitehouse C, Evenden ML, Cooke BJ, Lewis MA. 2016.
Aggregation and a strong Allee effect in a cooperative outbreak insect. Ecological
Applications, 26: 2623-2636.
Haas F, Gorb S, Blickhan R. 2000. The function of resilin in beetle wings. Proceedings of the
Royal Society of London B, 267: 1375-1381.
Hassall C. 2015. Strong geographical variation in wing aspect ratio of a damselfly, Calopteryx
maculate (Odonata: Zygoptera). PeerJ, 3: e1219.

40
Hassall C, Thompson DJ, Harvey IF. 2009. Variation in morphology between core and marginal
populations of three British damselflies. International Journal of Freshwater Entomology,
31: 187-197.
Hill JK, Thomas CD, Blakeley DS. 1999a. Evolution of flight morphology in a butterfly that has
recently expanded its geographic range. Oecologia, 121: 165-170.
Hill JK, Thomas CD, Lewis OT. 1999b. Flight morphology in fragmented populations of a rare
British butterfly, Hesperia comma. Biological Conservation, 87: 277-283.
Jackson PL, Straussfogel D, Lindgren BS, Mitchell S, Murphy B. 2008. Radar observation and
aerial capture of mountain pine beetle, Dendroctonus ponderosae Hopk. (Coleoptera:
Scolytidae) above the forest canopy. Canadian Journal of Forest Research, 38: 2313-
2327.
Johnson PCD. 2014. Extension of Nakagawa Schielzeth’s R2GLMM to random slopes models.
Methods in Ecology and Evolution, 5: 944-946.
Kautz M, Imron MA, Dworschak K, Schopf R. 2016. Dispersal variability and associated
population-level consequences in tree-killing bark beetles. Movement Ecology, 4: 9.
Koenker R. 2017. Quantreg: Quantile Regression. R package version 5.29. URL
https://CRAN.R-project.org/package=quantreg
Kurz WA, Dymond CC, Stinson G, Rampley GJ, Neilson ET, Carroll AL, Ebata T, Safranyik L.
2008. Mountain pine beetle and forest carbon feedback to climate change. Nature, 452:
987-990.

41
Lefcheck JS. 2015 piecewiseSEM: Piecewise structural equation modeling in R for ecology,
evolution, and systematics. Methods in Ecology and Evolution, 7: 573-579.
Lewis MA, Nelson W, Xu C. 2009. A structured threshold model for mountain pine beetle
outbreak. Bulletin of Mathematical Biology, 72: 565-589.
Manning CG, Reid ML. 2013. Sub-lethal effects of monoterpenes on reproduction by mountain
pine beetles. Agriculture and Forest Entomology, 15: 262-271
Mountcastle AM, Combes SA. 2013. Wing flexibility enhances load-lifting capacity in
bumblebees. Proceedings of the Royal Society B, 280: 23536604.
Nakagawa S, Schielzeth H. 2013. A general and simple method for obtaining R2 from
generalized linear mixed-effects models. Methods in Ecology and Evolution, 4: 133-142.
Nakazawa M. 2017. fmsb: Functions for Medical Statistics Book with some Demographic Data.
R package version 0.6.1. URL https://cran.r-project.org/web/packages/fmsb/index.html
NRCan (Natural Resources Canada). 2017 [accessed February 21]. Mountain pine beetle
(factsheet). Retrieved from http://www.nrcan.gc.ca/forests/fire-insects-disturbances/top-
insects/13397
Olivieri I, Gouyon P-H. 1997. Evolution of migration rate and other traits: the metapopulation
effect (pp 293–323) In Hanski IA, Gilpin ME. (eds), Metapopulation biology: ecology,
genetics, and evolution. San Diego, California: Academic Press.

42
Palmer JO, Dingle H. 1989. Responses of selection on flight behaviour in a migratory population
of milkweed bugs (Oncopeltus fasciatus). Evolution, 43: 1805-1808.
Pinheiro J, Bates D, DebRoy S, Sarkar D, R Core Team. 2017. nlme: Linear and Nonlinear
Mixed Effects Models. R package version 3.1-131. URL: https://CRAN.R-
project.org/package=nlme
R Core Team. 2017. R: A language and environment for statistical computing. R Foundation for
Statistical Computing, Vienna, Austria. URL https://www.R-project.org/.
Reid ML, Purcell JRC. 2011. Condition-dependent tolerance of monoterpenes in an insect
herbivore. Arthropod-Plant Interactions, 5: 331-337.
Reid RW. 1958. Internal changes in female mountain pine beetle Dendroctonus monticolae
Hopk., Associated with Egg Laying and Flight. The Canadian Entomologist, 90: 464-468.
Robertson C, Nelson TA, Boots B. 2007. Mountain pine beetle dispersal: the spatial-temporal
interaction of infestations. Forest Science, 53: 395-405.
Rosenberger DW, Venette RC, Aukema BH. 2016. Sexing live mountain pine beetles
Dendroctonus ponderosae: refinement of a behavioral method for Dendroctonus spp..
Entomologia Experimentalis et Applicata, 160: 195-199.
Safranyik L. Carroll AL. 2006. The biology and epidemiology of the mountain pine beetle in
lodgepole pine forests (Chapter 1). In Safranyik, L. Wilson, W.R. (Eds.), The mountain
pine beetle: a synthesis of biology, management, and impacts on lodgepole pine (pp. 3-

43
66). Victoria, British Columbia: Natural Resources Canada, Canadian Forest Service,
Pacific Forestry Centre.
Safranyik L, Carroll AL, Régnière J, Langor DW, Riel WG, Shore TL, Peter B, Cooke BJ,
Nealis VG, Taylor SW. 2010. Potential for range expansion of mountain pine beetle into
the boreal forest of North America. The Canadian Entomologist, 142: 415-442.
Safranyik L, Silversides R, McMullen LH, Linton DA. 1989. An empirical approach to modeling
the local dispersal of the mountain pine beetle (Dendroctonus ponderosae Hopk.) (Col.,
Scolytidae) in relation to sources of attraction, wind direction and speed. Journal of
Applied Entomology, 108: 498-511.
Schneider CA, Rasband WS, Eliceiri KW. 2012. NIH Image to ImageJ: 25 years of image
analysis. Nature Methods, 9: 671-675.
Seybold SJ, Huber DPW, Lee JC, Graves AD, Bohlmann J. 2006. Pine monoterpenes and pine
bark beetles: a marriage of convenience for defense and chemical communication.
Phytochemistry Reviews, 5: 143-178.
Shepherd RF. 1966. Factors influencing the orientation and rates of activity of Dendroctonus
ponderosae Hopkins (Coleoptera: Scolytidae). The Canadian Entomologist, 98: 507-518.
Steyn VM, Mitchell KA, Terblanche JS. 2016. Dispersal propensity, but not flight performance,
explains variation in dispersal ability. Proceedings of the Royal Society B, 283:
20160905.

44
Taylor S, Carroll AL. 2004. Disturbance, forest age, and mountain pine beetle outbreak
dynamics in BC: A historical perspective (pp 41-51). In Shore, T.L., Brooks, J.E. Stone,
J.E. (eds). Mountain Pine Beetle Symposium: Challenges and Solutions. Kelowna, British
Columbia: Natural Resources Canada, Canadian Forest Service, Pacific Forestry Centre,
Information Report BC-X-399, Victoria, BC. 298 p.
Taylor PD, Merriam G. 1995. Wing morphology of a forest damselfly is related to landscape
structure. Oikos, 73: 43-48.
Williams WI, Robertson IC. 2008. Using automated flight mills to manipulate fat reserves in
Douglas-fir beetles (Coleoptera: Curculionidae). Environmental Entomology, 37: 850-
856.
Wootton RJ. 1992. Functional morphology of insect wings. Annual Review of Entomology, 37:
113-140.

45
Chapter 3
Identification of genes and gene expression associated with dispersal capacity in the
mountain pine beetle, Dendroctonus ponderosae Hopkins (Coleoptera: Curculionidae)
3.1 Summary
Range expansion of the mountain pine beetle has caused significant damage in pine stands
of Western Canada, but their dispersal flights are poorly understood. We examined the genetic
basis of mountain pine beetle dispersal capacity, measured with flight mills, using RNA-seq and a
targeted association study. There were no differentially expressed genes between non-fliers and
weak flying beetles, but nearly 3000 differentially expressed genes between strong and weak fliers.
These genes related to lipid metabolism, muscle maintenance, oxidative stress response,
detoxification, hormones, and behavior, among others. We also found 4 genetic variant sites
associated with flight capacity, although no specific link to flight is currently known for these
genes. Our research shows that several systems are important for sustained flight, while others are
downregulated to conserve energy before colonization. The candidate genes and SNPs identified
here will inform further studies and contribute to our understanding of the mechanisms of insect
dispersal flights.
3.2 Introduction
Insect dispersal flights are not well understood, largely because they are affected by many
biotic and abiotic factors (Stinner et al. 1983; Bowler and Benton 2005; Jones et al. 2019).
Intrinsically, there are physiological, morphological, and behavioral adaptations that determine
insect flight capabilities (Roff and Fairbairn 2007; Jones et al. 2019), and these can be influenced

46
by large suites of genes (Jones et al. 2015). Understanding the genetic mechanisms of flight can
provide valuable insight into the dispersal and spread of economically important insect species
(Kristensen et al. 2013).
Mountain pine beetles (D. ponderosae) contribute to the maintenance of healthy pine
forests under endemic conditions (Safranyik and Carroll 2006), but periodic outbreaks can cause
significant damage (Hart et al. 2015). The most recent outbreak in western Canada expanded the
range of the mountain pine beetle to a novel host tree with a distribution that extends toward
economically important forests in eastern Canada and USA.
Morphology plays a significant role in predicting flight capacity of D. ponderosae
(Shegelski et al. 2019); however, many beetles with strong flight-related morphology fly very
little, indicating a large amount of unexplained variation in flight performance. Genetic factors
constitute a plausible component of this variation. Genes have been identified relating to several
life phases of mountain pine beetle, including pheromone biosynthesis (Keeling et al. 2013a;
Nadeau et al. 2017), detoxification of host defenses, reproduction (Robert et al. 2013; Huber and
Robert 2016), and overwintering cold tolerance (Robert et al. 2016; Fraser et al. 2017). However,
the dispersal phase remains relatively unexplored.
In this study we aim to identify the genetic correlates of dispersal capacity in D.
ponderosae. Dispersal-related genes in other insects have been linked to regulation of metabolic
rate (Wheat et al. 2010; Jones et al. 2015; Zhou et al. 2020), muscle tracheation (Marden et al.
2012), generally improved flight capability (Niitepold et al. 2009; Wheat et al. 2010), and
increased dispersal behavior (Zhou et al. 2020). We expect to find suites of genes associated with
several flight and dispersal-related functions such as metabolism, muscle form and function,

47
oxidative stress and detoxification, hormonal control, and behavior. To achieve this, we combine
a computer-linked flight mill bioassay with differential gene expression analysis using RNA-Seq
and a targeted association study. The identification of flight-related genes is intended to allow a
better understanding of the mechanisms associated with flight and dispersal in insects.
3.3 Methods
A flowchart of the methods used for this study constitutes Figure 3.1.
3.3.1 Sample collection and preparation
Four lodgepole pine trees infested with mountain pine beetles were selected from sites near
Grande Prairie, Alberta, Canada (3 from site 1 at 54.57 N, 119.42 W; and 1 from site 2 at 54.19 N,
118.68 W) in October 2015. Two 50-cm bolts were cut from each tree at 1m above ground level.
The cut ends of the bolts were sealed with paraffin wax upon felling, and bolts were stored at 4°C
for 6 months until use.
For beetle emergence, bolts were placed in separate 136 L opaque plastic emergence
chambers at 24±1°C in April 2016, and emerged beetles were collected daily. Individual beetles
were separated by sex based on the incidence of beetle stridulation, according to methods by
Rosenberger et al. (2016), which was performed at 24±1°C. In order to reduce the use of metabolic
resources before the flight assay, individual beetles were stored at 4°C in 2 mL centrifuge tubes
with a small piece of paper until the flight bioassay (Evenden et al. 2014), which was performed 3
to 5 days post emergence.

48
3.3.2 Flight mill bioassay and sample selection
Prior to flight bioassay, female beetles were weighed and measured at 24 ± 1°C for separate
morphological analysis (published under Shegelski et al. 2019). Beetles were then attached to
individual 2-cm long aluminum wire tethers with a diameter of 0.32mm. LePage® Heavy Duty
Contact Cement was used to adhere the tether to the pronotum of the specimen. Care was taken
so tethering would not interfere with wing or elytra movement.
Data was recorded on flight distance, duration (time spent in flight), and propensity (the
number of times flight was initiated after a minimum 5 second period of no flight), using methods
for computer-linked flight mill bioassays described by Evenden et al. (2014). The flight bioassays
were 22 hours long, which allowed a 2-hour period for specimen processing and turn-over.
Conditions in the flight chamber involved a light:dark photoperiod of 16:8, and temperature was
kept at 22.5°C. Flights began 2 hours after the initiation of the photoperiod’s light phase, giving
specimens a total of 14 hours of flight time in light, and 8 in dark.
Samples for RNA-seq were selected based on total distance flown during the 22 hr assay.
All beetles that flew <1km and > 10 km were flash frozen in liquid nitrogen and stored at -80°C.
From these beetles, the 8 beetles with the highest and lowest total distances flown were used to
represent the strongest and the weakest fliers, and four Beetles that did not fly, but demonstrated
a full range of motion in the elytra and wings, were also selected to represent non-fliers. All other
flown beetles were stored at -20°C in 85% EtOH until DNA extraction.

49
3.3.3 RNA extractions, RNA-Seq library preparation & sequencing
Total RNA extractions used direct-zol RNA MiniPrep kits, with a DNase I treatment and
TRIzol as a medium for specimen homogenization. RNA was checked for quality using an Agilent
2100 Bioanalyzer system and quantified using Qubit. cDNA synthesis and RNA-seq library
preparation used a TruSeq Stranded RNA LT Kit following recommended protocol, which
included poly-A selection for mRNA purification. Prior to sequencing, quality and quantity of
cDNA was checked again using an Agilent 2100 Bioanalyzer. Library sequencing was performed
on an Illumina NextSeq 500 platform at the Molecular Biology Service Unit (MBSU) at the
University of Alberta. Sample groups were evenly split between two NextSeq 500 runs for optimal
number of reads.
3.3.5 Enrichment analysis & KEGG pathway analysis
In order to find trends in gene ontology (GO) annotations and Kyoto Encyclopedia of
Genes and Genomes (KEGG; Kanehisa and Goto 2000) pathways for the differentially expressed
gene transcripts we used Blast2GO version 5.2.5 (Götz et al. 2008). The nucleotide sequences of
the transcripts were blasted against the NCBI nr database using blastx, scanned with interpro, and
were then mapped and annotated with GO terms. Interpro and GO annotations were then merged
to validate GO annotations, and an enrichment analysis using Fisher’s exact test (FDR < 0.05) was
used to test upregulated and downregulated genes separately for significant overrepresentation of
GO terms between the strong and weak flight phenotypes. Also using Blast2GO, a KEGG pathway
analysis was performed on all differentially expressed transcripts to identify flight-related
pathways.

50
3.3.6 DNA extractions, sequencing & mapping for association study
DNA extractions used a Qiagen DNEasy Blood & Tissue kit, following standard protocol
with an optional RNAse A treatment. Library preparation involved the ddRAD protocol of
Peterson et al. (2012). Single-end sequencing was performed at the University of Alberta MBSU
using the Illumina NextSeq500 platform. Initial data processing and quality checking of the raw
sequence data followed protocols by Campbell et al. (2017).
A common weakness of association studies is the large number of comparisons (Visscher
et al. 2017); to increase statistical power, we reduced the number of tested loci by focusing on
candidate regions identified through our RNA-seq experiment. Alignment for the association
study used a subset of scaffolds from the mountain pine beetle genome (Keeling et al. 2013b) that
contained 1 or more flight-related genes. This alignment used the BWT-SW algorithm in BWA
version 0.7.17 (Li and Durbin 2009), and alignment quality was checked using SAMtools version
1.9 (Li et al. 2009).
Stacks 2.0 ref_map.pl (Rochette et al. 2019) was used to identify single nucleotide
polymorphism (SNP) sites. We allowed a minor allele frequency of 1%, and loci were initially
retained if present in at least 80% of the specimens (Paris et al. 2017). Further filtering used
vcftools version 0.1.14 (Danecek et al. 2011), with reads with a genotype quality score below 30,
and SNP sites with more than 2% missing data among individuals being excluded from the final
data set.
51
3.3.7 Targeted association study
We used TASSEL version 5.2.54 (Bradbury et al. 2007) to perform an association study in
which we tested SNP sites for associations with total flight distance and flight propensity. The
study included 59 female beetles (31 strong and 28 weak fliers) that were randomly selected from
the upper and lower quartiles based on total flight distance. We used a principal component
analysis (PCA) to account for population structure and stratification, and a generalized linear
model (GLM) with permutation test (1000 permutations) to account for non-normal distributions
in the phenotypic data and FDR (Che et al. 2014). The permutated p-value (perm p) was used to
determine significance at α=0.05.
3.4 Results
3.4.1 Flight mill bioassay
Excluding non-fliers, beetles used for the differential expression analysis flew an average
of 10.08 km, ranging 0.04-28.81 km, and initiated flight an average of 72.8 times, ranging 2-327.
There was a significant difference in total flight distance between strong (n=7) and weak (n=7)
flight phenotypes (t stat=8.2, df=6, P<0.0001), but there was no significant difference in flight
propensity (t stat=-0.45, df=10, p=0.333). Beetles selected to represent the strong flight phenotype
had an average flight distance of 19.9 km, ranging 9.9-22.8 km, and initiated flight an average of
83.9 times, ranging from 5-327 times. Average flight distance in the group representing the weak
flight phenotype was 0.231 km, ranging 0.040-0.689 km, and initiated flight an average of 61.7
times, ranging 2-210 times. Although the majority (88.5%) of flight by beetles took place during
the light period, beetles with a strong flight capacity flew significantly more in the dark than weak
fliers (t stat=2.253, df=12, p=0.0218; Figure 3.2). On average, strong fliers flew 84.4% of their

52
total flight time in the light, and 15.6% in the dark. This compared to weak fliers that on average
flew 95.6% of their total flight time in the light, and 4.4% in the dark.
The 59 beetles used for the association study flew an average of 6.4 km, ranging 0.01-24.6
km, and initiated flight an average of 229.8 times, ranging 4-2806. The strong fliers used for the
association study flew significantly farther than the weak fliers (t stat=12.3, df=57, p<0.001). The
31 strong flight beetles in this data set flew an average of 11.4 km, ranging from 5.2-24.6 km, and
the 28 weak fliers flew an average of 0.8 km, ranging from 10 m to 3.7 km.
There was no significant difference in flight propensity between the strong and weak fliers
used for the association study (t stat = 1.1, df=57, p=0.297). The strong fliers initiated flight an
average of 289.0 times, ranging from 23 to 2806, while the weak fliers initiated flight 164.4 times
on average, ranging from 4 to 1968 instances.
3.4.2 Differential expression analysis
A total of 1.735 billion reads were sequenced via RNA-Seq, and 1.283 billion reads were
> Q30. On average, there were 65.5 million reads per sample, and this ranged from 25.2 million
to 108.8 million (Table 3.1). Principal component analysis of all 3 phenotypes (strong, weak &
non fliers) showed a clear separation of strong fliers from weak and non-fliers. It also showed that
non-fliers are nested within weak fliers, and that weak fliers have the highest variation in gene
expression (Figure 3.3A). There were no significantly differentially expressed genes in the
comparison between weak fliers and non-fliers (Figure 3.3B); therefore, further analyses focused
on the differences between strong and weak fliers.

53
In comparisons of strong to weak fliers, differential expression analysis using DESeq2
revealed 2741 differentially expressed genes (Figure 3.3C). Of these, 1486 (54.2%) of the genes
were upregulated and 1255 (45.8%) were downregulated. Of the differentially expressed genes,
387 were uncharacterized. In this study we focused on genes that could be broadly categorized as
relating to metabolism, muscle form and function, oxidative stress and detoxification, endocrine
system, and behavior (Table 3.2). A complete list of differentially expressed genes can be found
in Appendix 3.1. 1,282,664,688
We identified 20 genes related to various stages of lipid metabolism, and all but 3 were
upregulated (Table 3.2). The majority of these were lipases, although there were also reductases
and dehydrogenases, among others.
We found 15 differentially expressed genes relating to muscle form and function (Table
3.2), including 4 collagen alpha chains (all upregulated), and 5 related to myosin (2 up and 3
downregulated), including paramyosin, which is structurally integral to indirect flight muscle (Liu
et al. 2003). We also found 6 differentially expressed myotubularin transcripts (3 up and 3
downregulated), which relate to muscle maintenance (Laporte et al. 2001).
We also identified 10 differentially expressed genes involved in oxidative stress
management (Table 3.2), including 5 glutathione-s-transferases (GST; 1 theta, 3 sigma, 1
ambiguous Delta/Epsilon), 1 microsomal GST, and 4 antioxidants (2 phospholipid hydroperoxide
glutathione peroxidases, and 2 peroxiredoxins). We also found 23 differentially expressed
cytochrome P450 genes, including 7 CYP4s, 9 CYP6s and 3 CYP9s, as well as 2 CYP307 genes,
1 CYP 302 and 1 CYP 28. Also related to stress response, we identified 7 heat shock protein
transcripts that were differentially expressed.

54
There were 10 transcripts related to endocrine function, including 4 related to juvenile
hormone (JH) and ecdysone, and 6 related to insulin and insulin-like growth factor (IGF; Table
3.2). All JH-related genes were upregulated; however, these were both for juvenile hormone
epoxide hydrolase (JHEH), which deactivates JH. There was upregulation of ecdysone 20-
monooxygenase, which catalyzes production of the hormone, 20-hydroxyecdysone (20E), but
ecdysone-inducible protein E75, an orphan hormone receptor (Segraves and Hogness 1990), was
downregulated. Insulin is involved in metabolism, growth, and development (Nässel et al. 2015),
and of the 6 insulin family-related genes, there were 4 upregulated receptors (2 insulin receptors
and 2 insulin-like growth factor receptors), 1 downregulated insulin-degrading enzyme, and 1
downregulated insulin-like growth factor-binding protein.
Some potential behavioral genes that were differentially expressed included 2 isoforms of
nocturnin, which relates to light-mediated behavioral response, a circadian clock-controlled
protein, and protein alan shepard, which is related to gravitaxis (Armstrong et al. 2006; Table 3.2).
There were 9 differentially expressed transcripts related to olfaction (Table 3.2). Of these,
2 chemosensory proteins, 3 odorant receptors, and 2 odorant binding proteins were downregulated,
and 2 odorant binding proteins were upregulated.
3.4.3 GO enrichment analysis
Of the 2741 differentially expressed gene transcripts, 2,556 (93.3%) of the transcripts had
InterPro hits, and 1,358 (49.5%) had one or more GO annotations. Enrichment analysis of
upregulated GO terms was performed in the 2 categories, biological process and molecular
function. The 100 significantly overrepresented GO terms (89 biological processes and 11
molecular functions; FDR=0.05), were reduced to 25 more specific GO terms. These included 8
55
molecular functions and 17 biological processes relating to oxidoreductase activity, coenzyme
binding, oxidation-reduction processes, mitochondrial transport and organization, and coenzyme
metabolic processes (Figure 3.4).
Enrichment analysis of the downregulated GO terms revealed 28 overrepresented terms
(24 biological processes and 4 molecular functions; FDR=0.05), which were reduced to 4 more
specific GO terms, including 2 molecular functions and 2 biological processes related to DNA
transcription and signal transduction (Figure 3.4).
3.3.4 Sequence data mapping & differential expression analysis
Our experiment included 18 samples belonging to 3 flight phenotypes (7 strong fliers, 7
weak fliers and 4 non fliers). We began with 8 strong, 8 weak and 4 non fliers, but one strong flier
sequenced poorly, and a weak flier was removed because it was in a bout of strong flight when it
was collected, which was made apparent in downstream analysis of the beetle flight data.
Sequence data was aligned to the male mountain pine beetle draft genome (Keeling et al.
2013b) using Bowtie2 version 2.1.1.3 (Langmead and Salzberg 2012) and Tophat2 version 2.1.1
(Kim et al. 2013), with a maximum of 5 alignment sites, and otherwise default settings. This data
was then sorted and indexed using SAMtools version 1.5 (Li et al. 2009).
Differential expression analysis was performed using the R package DESeq2 (Love et al.
2014), in R version 3.3.3 (R Core Team 2017). We chose to use DESeq2 for its stringency
(Rajkumar et al. 2015), risking higher false negatives rather than false positives. BAM files were
read using RSamtools (Morgan et al. 2017) and annotated read count tables were produced using
the packages GenomicFeatures and GenomicAlignments (Lawrence et al. 2013). Differentially

56
expressed genes with a false discovery rate (FDR) < 0.01 were considered candidate genes related
to flight. A principal component analysis (PCA) was performed on regularized-logarithm
transformed gene expression data to visualize relationships between the specimens based on gene
expression without bias towards highly expressed genes (Love et al. 2014).
3.4.4 KEGG pathways
KEGG pathway analysis of all differentially expressed genes revealed 52 pathways
represented by at least 2 enzymes (Appendix 3.2), 42 of which were represented by at least 3
enzymes (Figure 3.5). Several metabolic pathways included: the metabolism of glycerolipids,
purine, pyruvate, and sphingolipids, pantothenate and coenzyme A biosynthesis, glycolysis, and
the citric acid cycle. Detoxification and stress response were also represented in the KEGG
pathways, including detoxification, biosynthesis of antibiotics, drug metabolism, and metabolism
of xenobiotics by P450s. We also found pathways associated with glutathione metabolism, which
may relate to oxidative stress. The steroid hormone biosynthesis pathway, which may relate to
hormone-mediated flight behaviors, was also represented, but only by 3 sequences that all coded
for the same enzyme.
3.4.5 Targeted association study
We identified 714 scaffolds containing differentially expressed flight genes, and these
contained 7781 SNP sites that passed filtering. Of these, 4 SNPs were significantly associated
with flight performance: 1 SNP was found to be associated with flight distance (Figure 3.6A), and
3 were found to be associated with flight propensity (Figure 3.6B). The SNP associated with flight
distance is located at position 3148638 on scaffold NW_017852012 (perm p=0.041). This is
located in an exon (XM_019902532) of the gene LOC109536350 (Protein Brunelleschi). Of the

57
SNPs found to be associated with flight propensity, the first is located at position 642895 on
scaffold NW_017852258 (perm p=0.009), which is an intron of the uncharacterized gene
LOC109542038. The second SNP is located at position 193112 on scaffold NW_017852115
(perm p=0.021). This is located in an exon of the gene LOC109540157 (probable E3 ubiquitin-
protein ligase HERC1). The third SNP is located at position 188406 on scaffold NW_017851689
(perm p=0.046), and this is located in an intron of the gene LOC109534071 (WD repeat-containing
protein 55 homolog).
3.5 Discussion
Dispersal by flight is one of the most important phases in the life history of many insects
(Roff and Fairbairn 2007). Our research shows that there are several genetic systems related to
strong flight; gene expression profiles between flight-avid (strong fliers) and flight-averse (weak
fliers and non-fliers) beetles are significantly different. However, no significant differences were
found among the flight-averse weak and non-fliers (Figure 3.3), indicating that the physiological
change between non-fliers and weak fliers is relatively minimal. Based on this, we focus on 2
main flight modes, a “dispersal” and “non-dispersal” mode, with clear differences in dispersal
capacity and gene expression.
3.5.1 Metabolism
Upregulated metabolic activity is expected in response to insect flight, as it is one of the
most physiologically demanding activities known (Wegener 1996). Several GO terms and KEGG
pathways indicate the importance of metabolic processes, such as glycolysis, citric acid cycle, and
serine metabolism. Serine, in particular, is associated with the metabolism of lipids (Gao et al.
2018), a known energy source in insects and the primary fuel source for sustained flight in D.

58
ponderosae (Evenden et al. 2014; Wijerathna and Evenden 2019). This is further supported by
several upregulated lipid metabolism-related genes and pathways (Table 3.2; Figure 3.5).
3.5.2 Muscle form & function
Several differentially expressed genes indicate the importance of muscle function and
maintenance in flight. We identified differentially expressed collagen genes, which are important
for muscle development and function (Zhan et al. 2014) and have been linked to migratory
behavior in insects (Zhan et al. 2014; Jones et al. 2015). Some myosins were also related to flight;
in particular, paramyosin was upregulated in strong fliers, and is known to be structurally integral
to thick filaments in indirect flight muscle (Liu et al. 2003). These genes may act in concert with
differentially expressed myotubularin genes in order to maintain muscle structure and function
during bouts of sustained flight (Laporte et al. 2001).
3.5.3 Oxidative stress & detoxification
Our data suggests several mechanisms are used by D. ponderosae to mitigate stress-
induced damage during flight, including DNA repair pathways and GSTs. In strong fliers, DNA
repair GO terms are upregulated and would mitigate genetic damage caused by oxidative stress
(Figure 3.4). GSTs are also antioxidants (Pompella et al. 2003; Yamamoto et al. 2011; Yamamoto
et al. 2016) and prevent build-up of potentially harmful lipid metabolism in flight muscle (Singh
et al. 2001). Upregulated GSTs and glutathione-related pathways in strong female fliers may play
other roles in successful dispersal and establishment, as females are the pioneering sex in mountain
pine beetle (Blomquist et al. 2010). GSTs are involved in detoxification of host defenses during
colonization (Robert et al. 2013; Keeling et al. 2013b); however, this process often involves

59
precursor steps that rely on reactions with other enzymes, such as cytochrome P450s (Sheehan et
al. 2001).
Several P450s are differentially expressed during flight, and these are found mostly in 3
cytochrome P450 families that are believed to be adaptive in D. ponderosae (CYP4, CYP6, and
CYP9 in the CYP4 clade; Keeling et al. 2013b). Many of these are likely involved in host defense
detoxification (Sandstrom et al. 2006; Nadeau et al. 2017; Chiu et al. 2018). Others, in particular
members of the CYP6 family, may be involved in pheromone biosynthesis (Chiu et al. 2019),
which may relate to variation in pheromone production observed in different mountain pine beetle
flight phenotypes (Jones et al. 2020). We also found 3 differentially expressed CYP9s; many
CYP9 functions have not yet been characterized (Keeling et al. 2013b), and these may relate to
dispersal. Other differentially expressed P450s in the CYP302 and CYP307 families may be
related to the biosynthesis of hormones like 20E (Iga and Kataoka 2012), which may impact
dispersal-related behaviors.
3.5.4 Endocrine system
Trends in gene expression indicate reduced levels of JH, and increases in 20E, insulin, and
IGF; these are important hormones linked to dispersal and colonization in D. ponderosae. During
flight, JH epoxide hydrolase (JHEH), an enzyme that deactivates JH, is upregulated, theoretically
reducing overall JH levels. In other insects, decreases in JH have been linked to dispersal (Roff
and Fairbairn 2007); however, increases in JH are linked to reproductive behavior (Gruntenko and
Rauschenbach 2008), biosynthesis of sex and aggregation pheromones (Bridges 1982; Conn et al.
1984; Tillman et al. 2004), and degradation and reallocation of flight muscle resources (Borden
and Slater 1969; Sahota 1975). Similar phenomena occur in D. ponderosae (McCambridge and

60
Mata 1969) and may also be mediated by JH; reduced levels of JH in strong fliers may act to
maintain “dispersal mode” by preventing the onset of several colonization-associated behaviors.
Increased interactions of insulin and insulin-like growth factors (IGF) were differentially
expressed and may be associated with metabolism and growth. In many bark beetles, including
D. ponderosae, strong dispersers tend to be larger (Evenden et al. 2014; Shegelski et al. 2019).
This may be influenced by increased IGF receptors (Nässel et al. 2015) and reduced IGF binding
protein levels (Nazif and Partridge 2008). Insulin, which shares structural similarities with IGF,
affects carbohydrate and lipid metabolism (Erion and Sehgal 2013) and is likely one of the
metabolic hormones that increases metabolism in strong fliers.
We also identified upregulation of ecdysone 20-monooxygenase, which catalyzes the
production of 20E (Nigg et al. 1976; Johnson and Rees 1977), and may affect flight behavior as it
has links to lipid metabolism (Wang et al. 2010), reproduction (Gruntenko and Rauschenbach
2008; Sieber and Spradling 2015), and regulation of the circadian clock (Kumar et al. 2014).
3.5.5 Behavior
Several differentially expressed genes may mediate response to abiotic and biotic cues,
affecting behavior. Strong fliers flew relatively more in the dark than weak fliers (Figure 3.2)
which may be linked to differential expression of light-response and circadian clock genes (Table
3.2). Nocturnin, which is downregulated in strong fliers, may affect response to environmental
light cues (Nagoshi et al. 2010). Flight patterns in strong fliers also appeared to be more aligned
with actual day and night (Figure 3.2), which may be associated with differential response to a
synchronized internal clock (Wertman and Bleiker 2019). Also, circadian clock-controlled protein
has circadian-controlled expression (Lorenz and Rosbash 1989), and its upregulation in strong
61
fliers, coupled with differential temporal flight performance, indicates potential differences in
circadian synchronization that may affect dispersal capacity.
Differentially expressed olfaction genes may also be important in determining dispersal
behavior. In Dendroctonus pseudotsugae, larger, stronger dispersers will often ignore chemical
cues (Bennet and Borden 1971), and this has similarly been observed in D. ponderosae (Jones
2019). Several differentially expressed chemosensory proteins, odorant receptors, and odorant-
binding proteins, most of which are downregulated in strong fliers, are potentially related to altered
response to host volatiles (Zhang et al. 2016), and these may be of interest in understanding the
role chemical cues play in flight and dispersal behavior.
3.5.6 Association study
For the 4 SNPs that we found to be associated with dispersal capacity (Figure 3.6), one
protein has no known function and may provide an interesting avenue of investigation, and 3 other
genes involve cell functions that are not directly linked to flight, but are associated with flight
propensity, which may be a better predictor of realized dispersal in the natural environment (Steyn
et al. 2016). Regardless, sequence data associated with flight potentially provides a management
tool. Current mountain pine beetle surveying methods involve collecting disks from the surface
of infested trees to determine reproductive success of a population. These disks are often rife with
specimens that could be sequenced to also provide dispersal potential data for that population
based on prevalence of flight phenotypes.
3.6 Conclusions
We identified genetic distinctions between mountain pine beetles with strong and weak
flight capacity but found no significant difference between weak and non-fliers in the flight-averse

62
grouping. The genetic systems associated with sustained flight appear to be involved in meeting
the physiological demands of flight, while downregulated systems may represent mechanisms to
conserve resources for post-flight host colonization. This demonstrates a level of genetic
coordination between dispersal and colonization. Our research has also identified genes that may
contribute to the “dispersal” phenotype behaviors, as well as genetic variants associated with flight
performance that may be useful in predicting flight capacity through genetic testing. Our research
sheds some light on the physiological nature of dispersal by flight and indicates several potential
avenues for future research.

63
Figure 3.1: Flowchart of methods used for this study. Shaded boxes represent data endpoints that
were used to determine differentially expressed genes and gene systems related to flight.

64
Figure 3.2: Flight patterns of strong fliers (A) and weak fliers (B). The dashed red line indicates
the time at which the lights were switched off in the flight room to simulate night, and the shaded
box indicates actual night based on June 20th (dusk at 22:00, dawn at 05:00).

65
Figure 3.3: (A) rlog principal component analysis of the 3 flight groups based on variation in gene
expression. (B) MA plot showing the results of a differential expression analysis between weak
and non-fliers. There were no significantly differentially expressed genes at α=0.01. (C) MA plot
showing the results of a differential expression analysis between strong and weak fliers.
Significantly differentially expressed genes (α=0.01) are shown in red.

66
Figure 3.4: Results of GO enrichment analysis reduced to most specific terms where possible. All
GO annotations shown were significantly different between strong and weak fliers (FDR=0.05).
Pie charts are based on proportion of representation among the total number of sequences relating
to differentially expressed GO terms.

67
Figure 3.5: All KEGG pathways with more than 3 represented enzymes in the differentially
expressed genes. Blue shows number of enzymes in the pathway represented in the data, and
orange shows the total number of sequences related to enzymes in the pathway.

68
Figure 3.6: Manhattan plots showing -Log10 permutation test p-values for each SNP based on
testing for association with (A) total distance flown during the flight mill assay and (B) flight
propensity. SNPs are shaded by scaffold, alternating between black and white, and a purple circle
indicates the SNP is significantly associated with the tested trait.
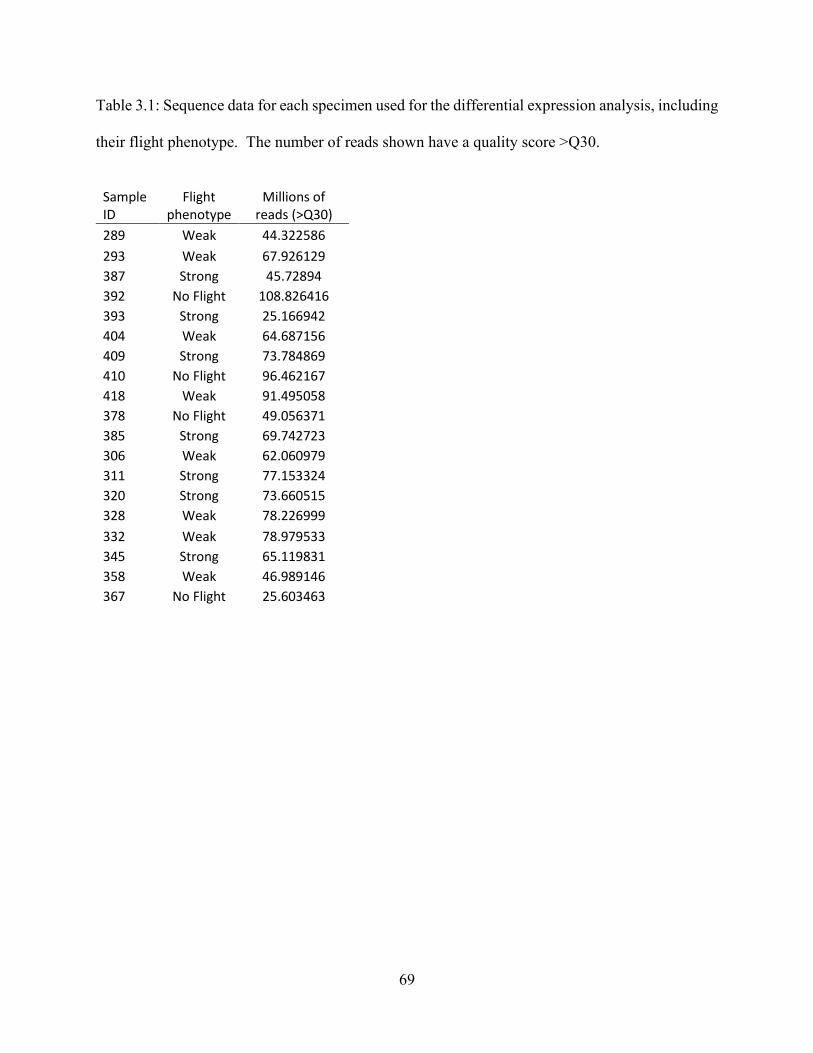
69
Table 3.1: Sequence data for each specimen used for the differential expression analysis, including
their flight phenotype. The number of reads shown have a quality score >Q30.
Sample ID
Flight phenotype
Millions of reads (>Q30)
289 Weak 44.322586
293 Weak 67.926129
387 Strong 45.72894
392 No Flight 108.826416
393 Strong 25.166942
404 Weak 64.687156
409 Strong 73.784869
410 No Flight 96.462167
418 Weak 91.495058
378 No Flight 49.056371
385 Strong 69.742723
306 Weak 62.060979
311 Strong 77.153324
320 Strong 73.660515
328 Weak 78.226999
332 Weak 78.979533
345 Strong 65.119831
358 Weak 46.989146
367 No Flight 25.603463

70
Table 3.2: Differentially expressed candidate genes. This table lists the Genbank accession number, annotation based on the mountain
pine beetle draft genome (Keeling et al. 2013b), Log2 fold change (positive values are upregulated and negative values are
downregulated in strong fliers), and the adjusted p-value based on a Benjamini-Hochberg correction for false discovery rate.
Accession Annotation log2
Fold
Change
padj Role
XM_019899335.1 nocturnin isoform X1 -1.43 8.8E-10 Behavior
XM_019907230.1 nocturnin isoform X2 -1.20 2.7E-06 Behavior
XM_019914674.1 protein alan shepard isoform X8 -0.72 6.5E-05 Behavior
XM_019911839.1 circadian clock-controlled protein-like 1.99 1.0E-05 Behavior
XM_019917055.1 probable cytochrome P450 9f2 -1.57 4.2E-04 Detoxification
XM_019909987.1 cytochrome P450 9e2-like -1.55 3.1E-04 Detoxification
XM_019909983.1 cytochrome P450 9e2-like -1.39 5.4E-04 Detoxification
XM_019906180.1 cytochrome P450 9e2-like -1.26 2.1E-03 Detoxification
XM_019915611.1 probable cytochrome P450 28d1 -0.87 6.6E-03 Detoxification
XM_019904514.1 cytochrome P450 307a1-like -0.84 7.6E-03 Detoxification
XM_019904602.1 cytochrome P450 307a1-like -0.83 8.5E-03 Detoxification
XM_019916691.1 cytochrome P450 4d2-like isoform X1 -0.78 3.0E-03 Detoxification
XM_019916694.1 cytochrome P450 4d2-like -0.78 5.0E-03 Detoxification
XM_019913251.1 cytochrome P450 6B1-like 0.37 5.5E-03 Detoxification
XM_019917741.1 cytochrome P450 302a1, mitochondrial-
like 0.53 6.4E-05 Detoxification
XM_019917605.1 multidrug resistance-associated protein 4-
like 0.73 1.3E-04 Detoxification
XM_019917607.1 multidrug resistance-associated protein 4-
like 0.74 6.5E-03 Detoxification
XM_019898552.1 cytochrome P450 4g15-like 0.79 4.1E-03 Detoxification

71
XM_019917604.1 multidrug resistance-associated protein 4-
like 0.85 8.6E-06 Detoxification
XM_019901159.1 probable cytochrome P450 4aa1 0.87 3.7E-05 Detoxification
XM_019898650.1 cytochrome P450 CYP6BW1 0.89 1.4E-03 Detoxification
XM_019913238.1 cytochrome P450 6B1-like 1.00 1.2E-03 Detoxification
XM_019918001.1 cytochrome P450 4C1-like 1.23 1.9E-03 Detoxification
XM_019915536.1 cytochrome P450 6k1-like 1.31 2.0E-03 Detoxification
XM_019901126.1 cytochrome P450 4g1-like 1.32 1.3E-04 Detoxification
XM_019908046.1 multidrug resistance-associated protein 4-
like 1.32 2.1E-06 Detoxification
XM_019914207.1 probable cytochrome P450 6a13 1.36 1.4E-04 Detoxification
XR_002171627.1 cytochrome P450 6a2-like 1.46 6.8E-04 Detoxification
XM_019910044.1 cytochrome P450 6k1-like 1.53 2.1E-04 Detoxification
XM_019898560.1 cytochrome P450 6a2-like 1.71 3.6E-07 Detoxification
XM_019898558.1 cytochrome P450 6A1-like 1.89 4.1E-12 Detoxification
XM_019917057.1 cytochrome P450 4c3-like isoform X1 2.01 1.0E-06 Detoxification
XM_019902592.1 glutathione S-transferase theta-1-like
isoform X1 -0.79 4.9E-06
Detoxification -
antioxidant
XM_019915413.1 microsomal glutathione S-transferase 1-
like -0.52 1.2E-03
Detoxification -
antioxidant
XM_019905169.1 glutathione S-transferase-like -0.29 8.5E-03 Detoxification -
antioxidant
XM_019899571.1 glutathione S-transferase 1-like 0.53 3.8E-04 Detoxification -
antioxidant
XM_019916272.1 PREDICTED: peroxiredoxin-2-like 0.65 4.7E-05 Detoxification -
antioxidant
XM_019905168.1 glutathione S-transferase-like 0.89 3.6E-05 Detoxification -
antioxidant
XM_019909039.1 PREDICTED: peroxiredoxin-6 0.89 4.7E-07 Detoxification -
antioxidant

72
XM_019915687.1
probable phospholipid hydroperoxide
glutathione peroxidase%2C transcript
variant X1
0.94 3.1E-04 Detoxification -
antioxidant
XM_019906204.1
probable phospholipid hydroperoxide
glutathione peroxidase%2C transcript
variant X1
0.94 3.1E-04 Detoxification -
antioxidant
XM_019899020.1 glutathione S-transferase-like 0.99 3.2E-03 Detoxification -
antioxidant
XM_019907423.1 ecdysone-inducible protein E75 isoform
X1 -0.80 2.7E-11 Endocrine
XM_019898632.1 ecdysone 20-monooxygenase isoform X1 0.57 6.5E-05 Endocrine
XM_019911438.1 juvenile hormone epoxide hydrolase 1-like 0.85 1.7E-03 Endocrine
XM_019906207.1 juvenile hormone epoxide hydrolase 1-like 0.99 5.8E-05 Endocrine
XM_019900280.1 putative molluscan insulin-related
peptide(s) receptor 1.04 3.2E-06 Endocrine
XM_019900281.1 insulin receptor-like 1.02 4.3E-06 Endocrine
XM_019898016.1 insulin receptor-like 0.99 4.7E-05 Endocrine
XM_019913890.1 insulin-degrading enzyme -0.33 1.3E-04 Endocrine
XM_019912320.1 insulin-like growth factor 1 receptor 0.96 1.4E-05 Endocrine
XM_019913102.1
insulin-like growth factor-binding protein
complex acid labile subunit transcript
variant X1
-1.11 1.1E-05 Endocrine
XM_019905105.1 heat shock protein 70 A1-like isoform X1 -1.39 3.2E-04 Heat Shock Proteins
XM_019905101.1 heat shock protein 68-like -1.02 4.1E-03 Heat Shock Proteins
XM_019899536.1 heat shock 70 kDa protein II-like isoform
X2 -0.68 2.1E-03 Heat Shock Proteins
XM_019904181.1 heat shock protein 83 -0.51 1.2E-03 Heat Shock Proteins
XM_019901242.1 heat shock 70 kDa protein 4 isoform X1 -0.49 1.3E-03 Heat Shock Proteins
XM_019905254.1 heat shock protein 75 kDa, mitochondrial -0.45 5.5E-05 Heat Shock Proteins
XM_019899225.1 heat shock 70 kDa protein-like isoform X2 0.80 1.1E-04 Heat Shock Proteins
XM_019914951.1 pancreatic triacylglycerol lipase -1.29 7.6E-03 Metabolism - Lipid
XM_019901458.1 putative fatty acyl-CoA reductase CG5065 -0.75 6.7E-03 Metabolism - Lipid

73
XM_019908951.1 abhydrolase domain-containing protein 2 -0.28 1.5E-03 Metabolism - Lipid
XM_019900381.1 acyl-CoA dehydrogenase family member
9, mitochondrial 0.47 1.9E-03 Metabolism - Lipid
XM_019915250.1 monoacylglycerol lipase ABHD12-like
isoform X1 0.59 2.2E-04 Metabolism - Lipid
XM_019916253.1 pancreatic triacylglycerol lipase-like
isoform X1 0.66 2.7E-03 Metabolism - Lipid
XM_019911517.1 lipase member H-A-like 0.67 2.8E-03 Metabolism - Lipid
XM_019903342.1 2-hydroxyacyl-CoA lyase 1 0.74 3.7E-03 Metabolism - Lipid
XM_019905050.1 very-long-chain 3-oxoacyl-CoA reductase 0.84 2.5E-03 Metabolism - Lipid
XM_019908494.1 short/branched chain specific acyl-CoA
dehydrogenase, mitochondrial 0.87 5.1E-05 Metabolism - Lipid
XM_019908288.1 phospholipase B1, membrane-associated-
like 0.96 5.0E-05 Metabolism - Lipid
XM_019899282.1 phospholipase DDHD2 isoform X1 1.03 2.4E-04 Metabolism - Lipid
XM_019906151.1 lipase 3-like 1.03 2.2E-04 Metabolism - Lipid
XM_019908331.1 fatty acyl-CoA reductase wat-like 1.08 1.4E-03 Metabolism - Lipid
XM_019899377.1 lipoprotein lipase-like 1.18 2.0E-03 Metabolism - Lipid
XM_019901196.1 lipase 3-like 1.37 3.6E-05 Metabolism - Lipid
XM_019917332.1 pancreatic lipase-related protein 3-like 1.49 1.1E-03 Metabolism - Lipid
XM_019899299.1 pancreatic triacylglycerol lipase-like 1.82 2.8E-05 Metabolism - Lipid
XM_019918004.1 putative fatty acyl-CoA reductase CG5065
isoform X1 1.99 1.8E-05 Metabolism - Lipid
XM_019915053.1 group XV phospholipase A2-like 2.28 3.9E-11 Metabolism - Lipid
XM_019906965.1 collagen alpha chain CG42342-like
transcript variant X1 0.62 2.5E-04
Muscle form and
function
XM_019912643.1 collagen alpha-1(XI) chain-like 0.71 1.4E-03 Muscle form and
function
XM_019916633.1 collagen alpha-2(XI) chain-like 0.83 1.7E-03 Muscle form and
function
XM_019905926.1 collagen alpha-5(IV) chain 0.80 1.3E-03 Muscle form and
function

74
XM_019906403.1 myosin heavy chain non-muscle transcript
variant X1 -0.49 2.1E-03
Muscle form and
function
XM_019907520.1 paramyosin-like 0.83 4.9E-04 Muscle form and
function
XM_019916148.1 myosin-10-like 1.00 5.8E-06 Muscle form and
function
XM_019915840.1 myosin-IA transcript variant X1 -1.03 1.7E-05 Muscle form and
function
XM_019899155.1 myosin-VIIa transcript variant X1 -0.47 7.3E-04 Muscle form and
function
XM_019908500.1 myotubularin-related protein 10-A 0.40 9.3E-09 Muscle form and
function
XM_019898786.1 myotubularin-related protein 13-like -0.53 5.9E-05 Muscle form and
function
XM_019898787.1 myotubularin-related protein 13-like -0.49 7.5E-03 Muscle form and
function
XM_019910219.1 myotubularin-related protein 13-like -0.46 2.0E-03 Muscle form and
function
XM_019903766.1 myotubularin-related protein 14%2C
transcript variant X1 1.17 2.0E-07
Muscle form and
function
XM_019908753.1 myotubularin-related protein 8 -0.40 6.9E-03 Muscle form and
function
XM_019910296.1 odorant receptor 49b -1.45 1.9E-03 Olfaction
XM_019902425.1 chemosensory protein 2 -1.17 2.7E-06 Olfaction
XM_019902670.1 chemosensory protein 4 -1.04 1.7E-03 Olfaction
XM_019902486.1 odorant-binding protein 4 -1.00 6.3E-03 Olfaction
XM_019915903.1 odorant receptor 63a-like isoform X1 -0.96 1.7E-03 Olfaction
XM_019902493.1 odorant-binding protein 28 -0.88 7.6E-03 Olfaction
XM_019901389.1 odorant receptor 67c-like isoform X2 -0.77 1.1E-04 Olfaction
XM_019913381.1 odorant-binding protein 26 0.80 5.0E-03 Olfaction
XM_019911214.1 odorant-binding protein 27 1.30 1.7E-03 Olfaction

75
Chapter 4
Source and spread dynamics of mountain pine beetle (Dendroctonus ponderosae) in central
Alberta, Canada
A version of Chapter 4 has been submitted for publication, authored by Shegelski VA, Campbell
EO, Thompson KM, Whitehouse CM, and Sperling FAH.
4.1 Summary
Mountain pine beetles (Dendroctonus ponderosae Hopkins; Coleoptera: Curculionidae)
are a significant destructive force in the pine forests of western Canada and have the capacity to
spread east into a novel host tree species. New populations have been documented in central
Alberta, but the source populations for these outbreaks have yet to be identified. In this study we
use genetic data to identify parent populations for recent outbreak sites near Slave Lake, Lac La
Biche and Hinton. We found the northern population cluster that entered Alberta near Grande
Prairie was the source of the most eastern established population near Lac La Biche, and the range
expansion to this leading-edge population has been too rapid to establish evidence of population
structure. However, some dispersal from a population in the Jasper and Hinton areas has been
detected as far north and east as Slave Lake. We also identified two potential source populations
for the current outbreak in Hinton; most beetles appear to be from Jasper National Park, but some
also originated from the northern population cluster. These findings demonstrate the dynamic
dispersal capabilities of mountain pine beetle across the Alberta landscape and the potential hazard
of increased dispersal to newly established leading-edge populations.

76
4.2 Introduction
The mountain pine beetle, Dendroctonus ponderosae Hopkins (Coleoptera:
Curculionidae), is a tree-killing bark beetle that is one of the most significant destructive forest
pests in western North America (NRCan 2017). Historically, mountain pine beetle populations in
Canada have largely been confined to British Columbia and southwestern Alberta within the range
of their primary host, lodgepole pine (Safranyik et al. 2010). However, in the early 2000s
populations expanded and established in northwestern Alberta (NRCan 2017), aided by wind
updrafts (Jackson et al. 2008, Janes et al. 2014). Its eastward spread has continued, resulting in
more than 500 million dollars being spent on mitigating damage in Alberta alone (Whittaker 2018).
Northeastern Alberta is of particular concern as this is where lodgepole pine transitions to jack
pine, a naive host species that provides a potential entry point into the boreal pine forests of eastern
Canada and the northern United States (Cullingham et al. 2011; Bleiker et al. 2014).
Various genetic markers have been used to map mountain pine beetle population structure
and range expansions in BC and Alberta (Langor and Spence 1991; Mock et al. 2007; Cullingham
et al. 2012; Samarasekera et al. 2012; Janes et al. 2014; Batista et al. 2016; Janes et al. 2016; Janes
et al. 2018). These studies have shown that MPB spread into Alberta was composed of two
genetically distinct incursions (Samarasekera et al. 2012; Janes et al. 2014; Batista et al. 2016),
and a third that is genetically intermediate (Trevoy et al. 2018b). The southern resident population
has ranged as far north as Banff and Canmore (Hopping and Mathers 1945), and a more recently
established northern population extends eastward past Grande Prairie (Janes et al. 2014). The
intermediate population recently entered Alberta via Jasper National Park, and its genetic
similarity to lab-produced hybrids between the northern and southern populations suggests that it
resulted from admixture between them (Trevoy et al. 2018b).

77
Epidemic populations have been identified in Hinton, west-central Alberta, and Slave
Lake, indicating continued northeastern range expansion in Alberta. Mountain pine beetle has now
also been detected at very low densities on the eastern edge of Alberta toward the Saskatchewan
border in novel jack pine habitat (Mac Cormick 2020). It is uncertain if beetles detected near
Saskatchewan came from low-density, locally established populations from previous long-range
dispersal events, or directly from larger outbreak populations to the west. These recently detected
populations have not yet been included in demographic studies on mountain pine beetle spread.
Determining their sources would allow optimisation of pheromone monitoring (Miller et al. 2005),
guide forest management practices to limit localised population increases (Safranyik and Carroll
2006), and better inform assessments of outbreak risk (Bleiker 2019). In our study, we use genome-
wide SNPs (single nucleotide polymorphisms) to characterize population structure and identify
dispersal and spread of mountain pine beetle in northern Alberta, particularly in newly detected
northeastern populations.
4.3 Methods
4.3.1 Beetle sampling, DNA extraction, and sequencing
A total of 306 specimens were collected at 44 different sites from 10 locations during 2014
to 2018, and specimens were assigned to populations based on proximity to other collection
localities (Appendix 4.1). Beetles were preferentially taken from different trees or egg galleries
to reduce the influence of genetic structuring due to the inclusion of siblings from single families.
Once collected, beetles were preserved in 90-95% ethanol and placed in a freezer at -20°C until
DNA extraction.

78
DNA extraction used the Qiagen DNEasy Blood & Tissue kit with an optional RNAse A
treatment. Library preparation for samples collected in 2014-2015 followed the two-enzyme GBS
protocol of Poland et al. (2012) , and the ddRAD protocol of Peterson et al. (2012) for samples
collected in 2016-2018, following the general procedure outlined in Campbell et al. (2017); single-
end sequencing of 2014-2015 samples was performed on an Illumina HiSeq2000 at the Institut de
biologie intégrative et des systèmes (IBIS) at Université Laval, and single-end sequencing of 2016-
2018 samples was done on an Illumina NextSeq500 at the University of Alberta Molecular Biology
Service Unit (MBSU).
4.3.2 Data filtering and SNP calling
Initial data demultiplexing was conducted in Stacks version 2.0b (Rochette et al. 2019) on
the Graham cluster of Compute Canada. PstI restriction sites on the 5’ end of each sequence read
were trimmed using cutadapt version 1.9.1 (Martin 2011). Samples sequenced on a NextSeq 500
had a final read length of 67 base pairs after trimming. Following Campbell et al. (2017), longer
reads produced on a HiSeq 2000 were additionally truncated on the 3’ end to match the length of
the NextSeq-generated data. The trimmed sequence reads were then aligned to the female
mountain pine beetle draft genome (Keeling et al. 2013b) using BWA version 0.7.17 (Li and
Durbin 2009) with the BWT-SW algorithm. Alignment quality was checked using SAMtools
version 1.9 (Li et al. 2009).
SNPs were identified using the ref_map.pl script in Stacks (Catchen et al. 2011; Rochette
et al. 2019). We specified a minimum minor allele frequency of 0.01 and adhered to the r80
principle recommended by Paris et al. (2017), which requires a locus to be present in at least 80%
of the individuals in a population in order to be retained in the final dataset. At each locus only a

79
single random SNP was retained. Further filtering of SNP data and samples was done using
vcftools version 0.1.14 (Danecek et al. 2011). Reads were dropped if they had a genotype quality
score below 30 or if a SNP locus had more than 5% missing data globally. Further filtering for
linkage disequilibrium (LD) was conducted following Abdellaoui et al. (2013) and was calculated
for all pairwise SNP combinations using the dartR package (Gruber and Georges 2019) in R (R
Core Team 2018). For any groups of SNPs that were in LD (R2 > 0.5), we retained only one random
SNP from each to reduce the impact of LD on population clustering analyses.
Although we tried to reduce the incidence of sampling multiple specimens from a single
family, preliminary data visualization using principal components analysis (PCA) indicated
clustering patterns for 10 individuals that were consistent with family-level structure. To reduce
the influence of such family structure in population-level analyses, all but one individual in each
set of closely related specimens were removed from the dataset.
4.3.3 Population structure analysis
To explore and identify potential signs of population structure across northern Alberta, we
used several approaches. A PCA was performed in adegenet (Jombart 2008; Jombart and Ahmed
2011) based on all samples that passed filtering. This was used to detect SNP covariance between
specimens and identify population structure among the specimens without a priori population
assignment. PCA plots were made using ggplot2 (Wickham 2016). We also used this set of
samples to calculate observed heterozygosity, expected heterozygosity, and pairwise population
Fst in dartR, and population differentiation based on genetic diversity using an exact G test of
genic differentiation in the R package genepop (Raymond and Rousset 1995; Rousset 2008) with
a Bonferroni correction based on the 36 pairwise tests.

80
To assess fine-scale population structure across the northernmost locations, we created a
northern dataset by removing all southern and intermediate-cluster population samples, including
any putative dispersers. We performed a PCA on this northern data set, then used discriminant
analysis of principal components (DAPC, Jombart et al. 2010) in adegenet to detect potential weak
signals of population structure using a priori population assignments. We then performed isolation
by distance analysis using the R packages geosphere (Hijmans 2019) and sna (Butts 2016), and a
Mantel test was calculated in adegenet.
The program Structure version 2.3.4 (Pritchard et al. 2000; Falush et al. 2003; Falush et al.
2007; Hubisz et al. 2009) was used to infer genetic population structure among all populations.
We subsampled the full dataset to 125 individuals that were arbitrarily selected to represent
potential sample site variation (10 to 16 individuals per location) in order to reduce bias due to
differences in sampled population sizes (Appendix 4.1). In this data set, we attempted to include
as many samples as possible per population while maintaining a roughly equal sample size among
many sampling locations. We used the admixture model without specifying a priori population
or location information, and tested values of K from 1 to 10 with 1 million MCMC generations
and a burn-in period of 250,000. We replicated the analysis for each value of K a total of 10 times,
and then used CLUMPAK (Kopelman et al. 2015) to average the ten independent replicates for
each value of K. The optimal value of K was assessed using both the Evanno method, using the
ΔK statistic (Evanno et al. 2005), and ln(PrK) (Pritchard et al. 2000). We then ran a PCA using
this subset of data to ensure our Structure results were comparable to the PCA of the full dataset
described above.

81
4.4 Results
After filtering, 294 individuals and 2872 genomic SNPs were retained for data analysis.
Pairwise Fst between populations ranged from ~0 to 0.13 (Table 4.1), with Canmore as the most
distinct. Tests for differences in pairwise population genetic differentiation also identified
Canmore as having significantly different allelic distributions from all other tested populations and
found some significant differences between intermediate and northern locations (Table 4.1).
Observed heterozygosity was similar among populations, ranging from 0.14 – 0.19, and
differences between expected and observed heterozygosity were minimal (Table 4.1). Some of
the most recently detected populations, such as Battle Lake and Lac La Biche, had higher
heterozygosity than some older, established populations, such as Grande Prairie and Edson, but no
clear trend was evident (Table 4.1).
In the PCA for the full dataset of 294 individuals (Figure 4.1A), the first principal
component, which often relates to geographic population location (Abdellaoui et al. 2013),
explained 3.6% of the variation in the SNP data and distinguished northern and southern
populations, as well as a distinct intermediate group between the two; for this study we used PC1
= -5.5 and -0.06 to delimit the intermediate cluster. The second principal component explained
1.0% of the remaining variance, and related to variation within, rather than between, populations.
No population structure was detected in either PCA or DAPC analyses when we focused
on a northern dataset that comprised a total of 201 specimens, after removing individuals from the
intermediate and southern clusters (Figure 4.1B; Appendix 4.2). IBD analysis of the northern
locations likewise did not indicate any patterns of population differentiation based on geographic
distances (Mantel test: p=0.75).

82
ΔK and Ln(PrK) from the Structure results indicated an optimal K of 2 that distinguished
northern and southern population clusters (Figure 4.2). No additional separation of populations
was provided by K = 3 and subsequent K values, in contrast to the distinct grouping of the
intermediate population cluster in the first PCA axis (Figure 4.1A). There was also no population
structure among the northern locations. All Battle Lake specimens and most Hinton specimens
had intermediate population assignments. Structure analysis also indicated individuals that did not
cluster according to the locations in which they were collected; one individual collected near Edson
and one from near Slave Lake grouped with the intermediate population. A PCA using this subset
of 125 samples also produced similar divisions to the Structure analysis, and closely resembled
patterns seen in Figure 4.1A, indicating that the results of the Structure analysis were comparable
to the population structure identified using PCA of the full data set.
Based on the full data set PCA (n=294), we identified several additional individuals that
were collected in the northern populations but grouped with the intermediate population cluster,
bringing the totals to 3 beetles from Slave lake, 5 from Whitecourt, and 1 from Edson (Appendix
4.1). We also identified 11 specimens collected in Hinton and 1 from Jasper that grouped with the
northern cluster. The presence of these geographically mismatched individuals is consistent with
expectations for recent dispersal events (Figure 4.3). No putative dispersers from the intermediate
population were found among the newly established Lac La Biche specimens.
4.5 Discussion
Our study used population structure to investigate the dispersal dynamics of mountain pine
beetle in central Alberta, identifying primary source populations as well as fine-scale dispersal
from other regions. We found the same distinct north-south genetic population structure previously

83
described in Alberta (Janes et al. 2014; Batista et al. 2016; Trevoy et al. 2018b; Figs. 1 and 2).
When we focused on individuals from northern locations, however, we found no evidence of
population structure (Figure 4.1B) or isolation by distance. This is consistent with a high rate of
dispersal and gene flow between these regions. The long-range dispersal capability of mountain
pine beetle (Jackson et al. 2008) likely promotes genetic admixture, particularly from west to east,
and may have inhibited the further development of genetically distinct populations in this region.
The extensive dispersal of mountain pine beetle also applies to mixing of population
clusters. While we saw no admixture involving the southern cluster, there was mingling among
the north and intermediate populations. We identified several putative dispersers with affinities to
Jasper and Hinton in sites across the northern locations, as far northeast as Slave Lake (Figure 4.3;
Appendix 4.1). This illustrates the considerable dispersal capability of these populations, and their
potential contribution to range expansion in the north. Hinton, and one specimen at Jasper, had the
reverse pattern, with some beetles having affinities to the northern cluster, indicating that several
individuals likely came from a northern source (Figure 4.3). This highlights the importance of
considering multiple source populations when determining infestation origins in newly established
regions.
High dispersal rates from the north and intermediate populations toward the northeast and
admixture among populations may have important genetic ramifications. In particular, dispersal
from the genetically intermediate Jasper and Hinton region is likely to increase genetic diversity
in the currently expanding eastern range of mountain pine beetle, which would otherwise be solely
composed of the genetically homogenous northern population. While this introduces the
possibility of potential benefits from increased genetic diversity in the leading-edge populations,

84
high rates of dispersal and gene flow may also prevent local adaptation (Lenormand 2002).
Regardless, genetic differences between regions allow us to monitor new populations and to
identify the magnitude and composition of northeastward spread from different genetic sources.
Currently, the leading edge of the mountain pine beetle range is found in jack pine forests
near Lac La Biche (Mac Cormick 2020), and this population is genetically indistinguishable from
other northern populations as far west as Grande Prairie. This uniformity can be explained by high
rates of dispersal and regular waves of reinforcing conspecifics from other populations. In another
forest pest, the spruce budworm (Choristoneura fumiferana Clemens), reinforcing waves of
dispersers from neighboring populations may allow endemic populations to become epidemic
(Larroque et al. 2020). Although their life histories differ, mountain pine beetle and spruce
budworm have similar overall dynamics with large increases in population size causing epidemic
conditions (Royama 1984; Larroque et al. 2020). In jack pine forests, mountain pine beetle can
face intense competition from heterospecifics, such as wood-boring beetles (Klutsch et al. 2016).
This may serve to mediate local population growth, but populations near Slave Lake likely make
contributions to the Lac La Biche infestation. Continued recruitment in this region risks
establishing large, potentially epidemic populations in the eastern jack pine forests.
4.6 Conclusions
Mountain pine beetle dispersal has been difficult to predict, but our study has helped to
identify large-scale dispersal patterns in central Alberta. We demonstrated that the current Hinton
infestation was derived from two sources, these likely being Jasper and, to a lesser degree, Grande
Prairie. Although there was no evidence of any dispersal from the southern population cluster,
there was a general trend of population expansion from the Jasper region toward the northeast,

85
with occasional dispersal as far northeast as Slave Lake. To date, control efforts in Alberta have
been largely successful at slowing its spread, but mountain pine beetle nonetheless remains capable
of extensive and rapid range expansion. Long range dispersal may limit population structure
within the northernmost regions, but it also may contribute to epidemic population development.
Continued focus on reducing current outbreaking populations may be necessary to minimize long-
range dispersal and reinforcement of populations at the leading-edge.

86
Figure 4.1: Principal component analyses (PCA) for (A) all sampling locations and individuals
(n=294), and (B) northern locations (Edson, Grande Prairie, Lac La Biche, Slave Lake, and
Whitecourt), with all intermediate-cluster individuals removed (n=201). In (A), ellipses were
added to emphasize the south, intermediate and north clusters. These genetic population clusters
were divided at PC1 = -5.5 and PC1 = -0.06 for assignment of individuals in Appendix 4.1.

87
Figure 4.2: Structure analysis for equivalently sized population subsets, totaling 125 individuals.
Structure assignments are shown individually. K=2 was the best supported number of populations.
Based on individual assignments, Edson and Slave Lake populations each include a single admixed
individual with a roughly equal assignment to both the northern and southern genetic clusters.

88
Figure 4.3: Population expansion dynamics inferred from genetic evidence based on 294
specimens collected from sites across Alberta. Pie charts for each sampling location are colored

89
by proportion of individuals assigned to the north (blue), intermediate (brown), and south (grey)
population clusters, as determined using PCA (Figure 4.1A).

90
Table 4.1: Pairwise population differentiation p-values (above diagonal), Fst (below diagonal), and
observed (Ho) and expected (He) population heterozygosity. Statistics were calculated using n
individuals for each population group. Significantly differentiated population pairs (in bold) had
genic differentiation values of p<0.001 after Bonferroni correction.

91
Chapter 5
General Conclusions
5.1 Thesis Overview
The largest dispersals in insects involve flight that is inherently dangerous (Gatehouse
1997), energetically demanding (Wegener 1996; Wijerathna and Evenden 2019), and often
involves trade-offs with capacity to colonize (Jones et al. 2020) and reproduce (Wijerathna et al.
2019). Variation in flight behavior can be an evolutionary stable strategy between different flight
phenotypes (Kaitala et al. 1989; Jones et al 2020); short-range dispersers ensure continuation of
the local population, but long-range dispersers may colonize new regions, reducing intraspecific
competition for resources in their source population and potentially founding new populations.
This pattern of dispersal behavior can be seen in other insects (Kaitala et al. 1989), plants (Clark
1998) and fungi (Rieux et al. 2014). The research in this thesis has shown that the flight pattern
of mountain pine beetle involves multiple dispersal phenotypes that are consistent with a stable
dispersal strategy (Ohms et al. 2019), and there are genetic and morphological elements that
influence this.
In Chapter 2, I characterized the general dispersal kernel (distribution of dispersal
behaviors) of mountain pine beetle based on flight mill data. Although we do not capture the
complete range of the dispersal kernel (Nathan et al. 2012), which would be attained by flying
beetles to expiration, I showed that the majority of beetles conduct shorter distance flights, with a
smaller proportion of the population flying longer distances. Several morphological factors are
associated with long-range flight capacity, such as increased wing size and total weight (Shegelski
et al. 2019). Many large beetles do not perform long flights, however, and this variation in flight

92
range could be considered an evolutionary stable strategy, as it reduces competition between flight
phenotypes while providing population-wide benefits (Ohms et al. 2019; Jones et al. 2020). The
lipids used to fuel flight are also important for successful host colonization (Reid and Purcell 2011;
Jones et al. 2020) and reproduction (Manning and Reid 2013; Wijerathna et al. 2019); short-range
dispersers, especially larger beetles with ample lipid stores, have more of such resources, as well
as nearby conspecifics to assist in overcoming host defenses, ensuring a significant portion of the
population succeeds in colonizing new hosts. Under most conditions, this is the most cost-
effective behavior, but populations could become overcrowded, inbreeding could become
detrimental, and local events (e.g.: forest fires, local host tree depletion) could cause extirpation.
Beetles that succeed in long-range dispersal and colonization will experience less competition
from non-dispersers, and are potentially able to outbreed due to a stronger pheromone signal (Jones
et al. 2020). Maintenance of these dispersal types may be a product of different forms of selection;
short range dispersers have fitness and reproductive advantages because less energy is used for
dispersal, but they may have substantial competition for trees, or may face declining habitat
quality, whereas long-range dispersers use more energy reserves for dispersal but may compete
less for local resources upon arrival and may have better habitat quality than the site they left.
In Chapter 3 I identified genes that may contribute to the dispersal strategy of mountain
pine beetle. Many of these genes are related to increases in metabolism, but there were also several
downregulated olfaction-related genes in strong fliers. In Dendroctonus pseudotsugae Hopkins
and D. ponderosae, some large beetles that perform strong flights ignore important chemical cues
(Bennet and Borden 1971, Jones 2019). Variable responses to olfactory cues may be a key
difference in beetles that disperse long-distances, and this certainly warrants more in-depth

93
investigation. Further, we also identified several behavioral and endocrine system-related genes
that likely also contribute to this variation in flight behavior.
Current epidemic conditions may cause a shift in the evolutionary stable dispersal strategy
of mountain pine beetle. Aside from energetic costs, long distance dispersal brings the inherent
risks in locating a host and conspecifics to assist in colonization. Mountain pine beetle, however,
are ubiquitous across some regions, and, because of its current epidemic state, most pine trees are
susceptible to mass attack. This increases the probability of finding conspecifics and a suitable
host tree after a long-range dispersal flight. In Chapter 4, I identified several dispersers close to
Slave Lake that originated from Alberta’s genetically intermediate population, which could mean
a dispersal distance of nearly 300 km. These dispersers likely succeeded because distant
populations are already established in the Slave Lake area. Successful long-range dispersals
increase genetic diversity through admixture but may also make the genetic basis of long-distance
dispersal more prevalent within populations (Danchin et al. 2011), causing a shift in the
equilibrium that promotes their dispersal strategy (Zhang et al. 2020). Expanded mountain pine
beetle populations may signify a shift to include more long-distance dispersal phenotypes. These
consequences, however, are largely dependent on a continuation of the current epidemic
population state. Once populations shift back to an endemic state, population densities will reduce,
and healthy trees will no longer be appropriate hosts (Burke and Carroll 2017), drastically reducing
the number of susceptible hosts along with the probability of coordinating mass attacks with distant
conspecifics. This would make conditions less favorable for long range dispersers.
In this thesis, I provide a methodological framework that characterizes dispersal on several
scales, from geographic expansion to flight-related genetics, and this can be applied to other insect

94
systems. The identification of flight morphology and genetics highlights the importance of
considering multiple systems and how they may interact to influence flight and potential dispersal
across the landscape.
5.2 Future directions
5.2.1 Future work on flight-related morphology (Chapter 2)
We noted a “drifting behavior” in some of the beetles; such behaviors have also been noted
in other Dendroctonus species (Atkins 1959) and may be related to long range dispersal events in
which beetles can disperse hundreds of kilometers using updrafts of wind (Jackson et al. 2008).
Beetles that perform “drifting behavior” during wind-mediated long-range dispersal events would
conserve a significant amount of energy that would otherwise be used for active flight (Wijerathna
and Evenden 2019). The duration of this “drifting behavior” may be observable in an updraft wind
tunnel and quantified within a population. If a significant number of individuals show this
behavior, it may have important ramifications as a long-range dispersal energy conservation
strategy, and models used to predict passive seed dispersal may also be partially applicable to this
form of spread. Future research on bark beetle flight morphology should thus include a broader
variety of characters. There are several interesting candidates for future work, such as joint resilin
(Bäumler and Büsse 2019) and wing flexibility (Mountcastle and Combes 2013), but there could
be other less obvious factors involved. Perhaps the weight, angle or streamlining of the elytra are
important in long flights, or the distribution of weight throughout the wing could affect wing pitch
(Norberg 1972).

95
5.2.2 Future work on flight-related genetics (Chapter 3)
The discovery of a large set of differentially expressed flight genes is only the beginning
of this research. While we identified nearly 3000 candidate flight genes, approximately 400 of
these remain uncharacterized and would make interesting subjects for future studies. I am
currently working with a group of researchers to produce a detailed mountain pine beetle genome,
based on the Keeling et al. (2013b) draft genome, with near-chromosome-level location data.
There is prominent linkage in the mountain pine beetle genome (Trevoy et al. 2018a), and, with
this large group of candidate genes, we can now explore the potential relationships of dispersal
capacity with genetic architecture and linkage.
There is also evidence that ketones may be involved in sustained flight in female D.
ponderosae. Ketone bodies are found in flight muscle and fatty tissues in moths and locusts
(Bailey et al. 1972; Candy et al. 1997), and we identified 3 upregulated ketone metabolism genes
in females. In particular, the upregulated gene succinyl-CoA: 3-ketoacid coenzyme A transferase
1 has been linked to the use of ketones as flight fuel in another dispersing insect (Jones et al. 2015).
In males, such genes may be related to the production of exo-brevicomin, an aggregation
pheromone (Song et al. 2014), but this pheromone is not produced by females (Pierce et al. 1987).
More work is needed on potential ketone bodies in these tissues in D. ponderosae.
Now that candidate genes have been identified, it is possible to validate and test effects of
specific genes. I verified the differential expression analysis results with supporting GO trends
and KEGG pathways. However, qPCR validation of some of the more independent genes would
further verify the results and allow more in-depth focus of specific genes and their functions. To
then test the effects of these genes in mountain pine beetle would be a challenge; they are difficult

96
to breed and rear in the laboratory, and they spend the majority of their lives below the bark of a
host tree, making them difficult to access during development. Other model organisms such as
Tribolium or Drosophila may be a plausible next step in investigating these genes through RNAi
or CRISPR (Wu et al. 2020; Song et al. 2020).
For Chapter 3, I focused on total flight distance as a measure for flight capacity, but it has
been argued that flight propensity is actually more translatable to realized dispersal in a natural
environment (Steyn et al. 2016; Minter et al. 2018), and my association study results also support
the importance of flight propensity. In future, an RNA-seq experiment using propensity as a
measure to define dispersal phenotype could be informative.
During alignment to the mountain pine beetle genome for RNA-seq, millions of reads are
lost either due to poor quality or because they are not represented in the draft genome. These reads
are normally considered contaminants and are ignored; however, D. ponderosae has many known
symbionts (Six and Bracewell 2015) and these unaligned reads may be from symbiotic organisms
linked to flight capacity. This can be tested using a differential expression analysis. I am currently
exploring this with other researchers, and we have had mixed results. This is an ongoing
investigation.
5.2.3 Future work on landscape-scale dispersal (Chapter 4)
My sampling for Chapter 4 involved many samples from several locations collected over
the course of 4 years. For increased detail on the population dynamics of mountain pine beetle, a
more robust annual sampling regimen would be required, but would provide an excellent snapshot
of the current state of infection. If this were to be achieved over several years, it would provide

97
relatively detailed information on population movement, mixing, and the prevalence of long-
distance dispersal events.
Extensive, recent dispersal and high rates of admixture in mountain pine beetle are
preventing the development of strong population structure (Janes et al. 2018); however, this
provides an exceptional opportunity to watch selection and adaptation in real time. Mountain pine
beetle in Grande Prairie are in different ecological conditions than those in Lac La Biche, but, due
to high rates of dispersal, they are currently genetically homogenous. Once the current outbreak
is over and dispersal slows, these populations can be observed and assessed for adaptation in their
respective environments and host trees (assuming the populations persist in an endemic state).
Identifying these adaptations, and the time it takes for them to develop, could help us understand
genetic mechanisms and adaptations associated with insect-plant evolutionary relationships, and
how these contribute to the success of this tree-killing bark beetle.
In conclusion, I hope that I have contributed to our understanding of several correlates of
dispersal by flight. I now understand this is a Sisyphean pursuit, as the web of factors contributing
to realized dispersal is potentially endless. Regardless, the study of dispersal is an enlightening
challenge. I believe that this research has filled some gaps in the literature, but also, more
importantly, shown others we didn’t know existed.

98
Biography
I was born in Timmins, Ontario on March 17, 1986, to Henrietta and Roy Shegelski. I was
a middle child, having an older brother, older sister, younger brother and younger sister. Needless
to say, I learned to navigate the politics of life in a moderately large family. My parents always
had a deep appreciation for nature, and they made sure we, the children, also saw the beauty in the
natural world and its uncountable wonders, even when we had to move several times to
accommodate my father’s work. In time, I found I too enjoyed the changing scenery and the thrill
of discovering “new lands”.
When I finished high school, I joined the Canadian Armed Forces. As a young adult I had
a sense that spending some time serving my country was appropriate, but I also wanted to
experience the world as it really is. Canada is an amazing country, but you can’t truly appreciate
it until you’ve seen just how rough the world can be. I became an armored crewman and trained
on various vehicles, but I spent most of my time on the leopard tanks (C2 & A6M), which I used
in my two deployments to Afghanistan (winter ‘06 and summer ’08). In that time, I got more life
experience than I bargained for, but I also gained a profound appreciation for my home country
and the security that so many of its citizens take for granted. While overseas, however, I also
began to recognize just how diverse and amazing the “bug” world can be. Scorpions, sun spiders,
praying mantises, and the weird, giant, spiny thing I caught, and subsequently lost right beside my
sleeping space one evening (needless to say, “sleeping” space was not an appropriate term that
night) all contributed to my growing interest for what my mother would call “creepy crawlies”
(aka invertebrates).

99
Once I finished my contract with the army, I was relatively content with my life, doing
mundane things at mundane jobs, but I eventually met my first wife, Michelle. She was a brilliant,
philosophical woman that constantly challenged me, eventually convincing me to pursue a post-
secondary education. After she passed away, with the much-appreciated support of friends and
family I was able to see my education through. I spent a term after my undergrad teaching labs at
Concordia University of Edmonton, and that is when I realized I have a passion for teaching. I
then contacted Dr. Felix Sperling, an interesting professor at the University of Alberta, that
happens to enjoy betting on students with odd histories. And so, I began my foray into the thick
of the academic realm. My Master’s project with mountain pine beetle eventually developed into
a PhD, and during this time I got married to Kyla, an amazing, beautiful and strong-willed woman.
Together we have two children, a brilliant boy named Isaac, and a new baby girl, Hazel, that was
born only hours after this thesis was written.

100
Works Cited
Abdellaoui A, Hottenga J, de Knijff P, Nivard MG, Xiao X, Scheet P, Brooks A, Ehli EA, Hu Y,
Davies GE, Hudziak JJ, Sullivan PF, van Beijsterveldt T, Willemsen G, de Geus EJ,
Penninx BWJH, Boomsma DI. 2013. Population structure, migration, and diversifying
selection in the Netherlands. European Journal of Human Genetics, 21: 1277-1285.
Ainslie B, Jackson PL. 2011. Investigation into mountain pine beetles above canopy dispersion
using weather radar and an atmospheric dispersion model. Aerobiologia, 27: 51-65.
Alberta Agriculture and Forestry. 2016. Mountain pine beetle detection and management in
Alberta (Blue Book). Government of Alberta. Available at:
<https://www1.agric.gov.ab.ca/$department
/deptdocs.nsf/all/formain15619/$FILE/MPB%20Blue%20Book%20-
%20Complete%20Guide %202016.pdf> [Accessed 17 April 2018]
Alfaro RI, Campbell E, Hawkes BC. 2010. Historical frequency, intensity and extent of
mountain pine beetle disturbance in British Columbia. Natural Resources Canada,
Canadian Forest Service, Pacific Forestry Centre, Victoria, BC. Mountain Pine Beetle
Working Paper. 52 p
Armstrong JD, Texada MJ, Munjaal R, Baker DA, Beckingham KM. 2006. Gravitaxis in
Drosophila melanogaster: a forward genetic screen. Genes, Brain and Behavior, 5: 222-
239.

101
Atkins MD. 1959. A study of the flight of the Douglas-fir beetle, Dendroctonus pseudotsugae.
Hopk. (Coleoptera: Scolytidae). I. Flight preparation and response. The Canadian
Entomologist 91: 283-291.
Atkins MD. 1961. A study of the flight of the douglas-fir beetle Dendroctonus pseudotsugae
Hopk. (Coleoptera: Scolytidae). III. Flight Capacity. The Canadian Entomologist, 93:
467-474.
Atkins MD. 1966. Laboratory Studies on the Behaviour of the Douglas-fir Beetle, Dendroctonus
pseudotsugae Hopkins. The Canadian Entomologist, 98: 953-991.
Atkins MD. 1960. A study on the flight of the Douglas-fir beetle, Dendroctonus pseudotsugae
Hopk. (Scolytidae). University of British Columbia.
Atkins MD, Farris SH. 1962. A contribution to the knowledge of flight muscle changes in the
Scolytidae (Coleoptera). The Canadian Entomologist, 94: 25–32.
Augspurger, CK. 1986. Morphology and Dispersal Potential of Wind-Dispersed Diaspores of
Neotropical Trees. American Journal of Botany, 73: 353-363.
Aukema BH, Carroll AL, Zheng Y, Zhu J, Raffa KF, Moore RD, Stahl K, Taylor SW. 2008.
Movement of outbreak populations of mountain pine beetle: influences of spatiotemporal
patterns of climate. Ecography, 31: 348-358.
Aw T, Schlauch K, Keeling CI, Young S, Bearfield JC, Blomquist GJ, Tittiger C. 2010.
Functional genomics of mountain pine beetle (Dendroctonus ponderosae) midguts and
fat bodies. BMC Genomics, 11: 1165-1188.

102
Axelson JN, Alfaro RI, Hawkes B. 2009. Influence of fire and mountain pine beetle on the
dynamics of lodgepole pine stands in British Columbia, Canada. Forest Ecology and
Management, 257: 1874-1882.
Azevedo RBR, James AC, McCabe J, Partridge L. 1998. Latitudinal variation of wing: thorax
size ratio and wing-aspect ratio in Drosophila melanogaster. Evolution, 52: 1353-1362.
Bailey E, Horne JA, Izatt MEG, Hill L. 1972. Role of ketone bodies in the metabolism of the
adult desert locust. Biochemical Journal, 128: 79.
Bateman AJ. 1950. Is gene dispersion normal? Heredity, 4: 353–363.
Bates D, Maechler M, Bolker B, Walker S. 2015. Fitting Linear Mixed Effects Models Using
lme4. Journal of Statistical Software, 67: 1-48.
Batista PD, Janes JK, Boone CK, Murray BW, Sperling FAH. 2016. Adaptive and neutral
markers both show continent-wide population structure of mountain pine beetle
(Dendroctonus ponderosae). Ecology and Evolution, 6: 6292–6300.
Bäumler F, Büsse S. 2019. Resilin in the flight apparatus of Odonata (Insecta)-cap tendons and
their biomechanical importance for flight. Biology Letters, 15: 20190127.
Bennett RB, Borden JH. 1971. Flight Arrestment of Tethered Dendroctonus
pseudotsugae and Trypodendron lineatum (Coleoptera: Scolytidae) in Response to
Olfactory Stimuli. Annals of the Entomological Society of America, 64: 1273-1286.

103
Betts CR, Wootton RJ. 1988. Wing shape and flight behaviour in butterflies (Lepidoptera:
Papilionoidea and Hesperioidea): A preliminary analysis. Journal of Experimental
Biology, 138: 271-288.
Bhakthan NMG, Borden JH, Nair KK. 1970. Fine structure of degenerating and regenerating
flight muscles in a bark beetle, Ips confusus. Journal of Cell Science, 6: 807–819.
Bleiker KP, Smith GD, Humble LM. 2017. Cold tolerance of mountain pine beetle (Coleoptera:
Curculionidae) eggs from historic and expanded ranges. Environmental Entomology, 46:
1165-1170.
Bleiker KP, Smith GD. 2019. Cold tolerance of mountain pine beetle (Coleoptera:
Curculionidae) Pupae. Environmental Entomology, 48: 1412-1417.
Bleiker K, Six DL. 2007. Dietary benefits of fungal associates to an eruptive herbivore: potential
implications of multiple associates on host population dynamics. Environmental
Entomology, 36: 1384–1396.
Bleiker KP. 2019. Risk assessment of the threat of mountain pine beetle to Canada’s boreal and
eastern pine forests. In Canadian Council of Forest Ministers Report Fo79-14/2014E-
PDF.
Bleiker KP, O’Brien MR, Smith GD, Carroll AL. 2014. Characterisation of attacks made by the
mountain pine beetle (Coleoptera: Curculionidae) during its endemic population phase.
The Canadian Entomologist, 146: 271–284.

104
Bleiker KP, Potter SE, Lauzon CR, Six DL. 2009. Transport of fungal symbionts by mountain
pine beetle. The Canadian Entomologist, 141: 503–514.
Blomquist GJ, Figueroa-Teran R, Aw M, Song M, Gorzalski A, Abbott NL, Chang E, Tittiger C.
2010. Pheromone production in bark beetles. Insect Biochemistry and Molecular
Biology, 40: 699-712.
Boggs CL. 1992. Resource Allocation: exploring connections between foraging and life history.
Functional Ecology, 6: 508-518.
Borden JH, Slater CE. 1969. Flight muscle volume changes in Ips confuses (Coleoptera:
Scolytidae). Canadian Journal of Zoology, 47: 29–32.
Bowler DE, Benton TG. 2005. Causes and consequences of animal dispersal strategies: Relating
individual behaviour to special dynamics. Biological Reviews of the Cambridge
Philosophical Society, 80: 205-22.
Bradbury PJ, Zhang Z, Kroon DE, Casstevens TM, Ramdoss Y, Buckler ES. 2007. TASSEL:
software for association mapping of complex traits in diverse samples. Bioinformatics,
23: 2633-2635.
Bridges JR, 1982. Effects of juvenile hormone on pheromone synthesis in Dendroctonus
frontalis. Environmental Entomology, 11: 417e420.
Burke JL, Carroll AL. 2017. Breeding matters: natal experience influences population state-
dependent host acceptance by an eruptive insect herbivore. PLoS ONE, 12: e0172448.

105
Campbell EO, Davis CS, Dupuis JR, Muirhead K, Sperling FAH. 2017. Cross-platform
compatibility of de novo-aligned SNPs in a nonmodel butterfly genus. Molecular
Ecology Resources, 17: e84-e93.
Candy DJ, Becker A, Wegener G. 1997. Coordination and integration of metabolism in insect
flight. Comparative Biochemistry & Physiology B, 117: 497-512
Carroll AL, Taylor SW, Régnière J, Safranyik L. 2004. Effects of climate and climate change on
the mountain pine beetle (pp 221-230) in Shore TL, Brooks JE, Stone JE (eds)
Challenges and Solutions: Proceedings of the Mountain Pine Beetle Symposium.
Kelowna, British Columbia, Canada October 30 - 31, 2003. Canadian Forest Services.
Catchen JM, Amores A, Hohenlohe P, Cresko W, Postlethwait JH. 2011. Stacks: building and
genotyping loci de novo from short-read sequences. G3: Genes, Genomes, Genetics, 1:
171-182.
Cerezke HF. 1989. Mountain pine beetle aggregation semiochemical use in Alberta and
Saskatchewan, 1983-1987. In Amman GD. (Compiler). Proceedings-Symposium on the
management of lodgepole pine to minimize losses to the mountain pine beetle, July 12-14,
1988, Kalispell, Montana (pp 108-113). Ogden, Utah: USDA Forest Service,
Intermountain Research Station.
Chai P, Srygley RB. 1990. Predation and the flight, morphology, and temperature of neotropical
rain-forest butterflies. American Naturalist. 135: 748-765.

106
Chapman DS, Dytham C, Oxford GS. 2006. Modelling population redistribution in a leaf beetle:
an evaluation of alternative dispersal functions. Journal of Animal Ecology, 76: 36-44.
Chapman RF. 1998. The Insects: Structure and function (4th ed.). Cambridge: Cambridge
University Press.
Che R, Jack JR, Motsinger-Reif AA, Brown CC. 2014. An adaptive permutation approach for
genome-wide association study: evaluation and recommendations for use. BioData
Mining, 7: 9.
Chen H, Walton A. 2011. Mountain pine beetle dispersal: spatiotemporal patterns and role in the
spread and expansion of the present outbreak. Ecosphere, 2: 1-17.
Chiu CC, Keeling CI, Bohlmann J. 2018. Cytochromes P450 preferentially expressed in
antennae of the mountain pine beetle. Journal of Chemical Ecology. 45:178-186.
Chiu CC, Keeling CI, Bohlmann J. 2019. The cytochrome P450 CYP6DE1 catalyzes the
conversion of α-pinene into the mountain pine beetle aggregation pheromone trans-
verbenol. Scientific Reports, 9: 1477.
Chubaty AM, Hart M, Rotiberg D. 2014. ‘To tree or not to tree’: the role of energy limitation on
host tree acceptance in a bark beetle. Evolutionary Ecology Research, 16: 337-349.
Clark JS. 1998. Why trees migrate so fast: confronting theory with dispersal biology and the
paleorecord. American Naturalist, 152: 204–224.

107
Conn JE, Borden JH, Hunt DW, Holman J, Whittney HS, Spanier OJ, Pierce HD Jr,
Oehlschlager AC. 1984. Pheromone production by axenically reared Dendroctonus
ponderosae and Ips paraconfusus (Coleoptera: Scolytidae). Journal of Chemical Ecology,
10: 281-290.
Cooke BJ. 2009. Forecasting mountain pine beetle-overwintering mortality in a variable
environment. Natural Resources Canada, Canadian Forest Service, Pacific Forestry
Centre, Victoria, BC. Mountain Pine Beetle Working Paper 2009-03.
Corbett LJ, Withey P, Lantz VA, Ochuodho TO. 2015. The economic impact of the mountain
pine beetle infestation in British Columbia: provincial estimates from a CGE analysis.
Forestry, 89: 100-105.
Crawley MJ. 2013. Regression (Chapter 10). In The R book (2nd ed) (pp 449-497). West Sussex,
United Kingdom: John Wiley & Sons, Ltd.
Cullingham, CI, Cooke JEK, Dang S, Cooke BJ, Coltman DW. 2011. Mountain Pine Beetle
host-range expansion threatens the boreal forest. Molecular Ecology, 20: 2157-2171.
Cullingham CI, Janes JK, Hamelin RC, James PMA, Murray BW, Sperling FAH. 2019. The
contribution of genetics and genomics to understanding the ecology of the mountain pine
beetle system. Canadian Journal of Forest Research. 49: 721–730.
Cullingham CI, Roe AD, Sperling FAH, Coltman DW. 2012. Phylogeographic insights into an
irruptive pest outbreak. Ecology and Evolution, 2: 908–919.

108
Danchin E, Charmantier A, Champagne FA, Mesoudi A, Pujol B, Blanchet S. 2011. Beyond
DNA: integrating inclusive inheritance into an extended theory of evolution. Nature
Reviews Genetics, 12: 475-486.
Danecek P, Auton A, Abecasis G, Albers CA, Banks E, DePristo MA, Handsaker R, Lunter G,
Marth G, Sherry ST, McVean G, Durbin R, 1000 Genomes Project Analysis Group.
2011. The variant call format and VCFtools. Bioinformatics, 27: 2156-2158.
de la Giroday HC, Carroll AL, Aukema BH. 2012. Breach of the northern Rocky Mountain
geoclimatic barrier: initiation of range expansion by the mountain pine beetle.
Biogeography, 39: 1112-1123.
de la Giroday HMC, Carroll AL, Lindgren BS, Aukema BH. 2011. Incoming! Association of
landscape features with dispersing mountain pine beetle populations during a range
expansion event in western Canada. Landscape Ecology. 26: 1097–1110.
Dempster JP, King ML, Lakhani KH. 1976. The status of the swallowtail butterfly in Britain.
Ecological Entomology, 1: 71-84.
Dominguez E, Abdala V. 2019. Morphology and evolution of the wing bullae in South American
Leptophlebiidae (Ephemeroptera). Journal of Morphology, 280: 95-102.
Dudley R. 1990. Biomechanics of flight in neotropical butterflies: morphometrics and
kinematics. Journal of Experimental biology, 150: 37-53.

109
Eidson EL, Mock KE, Bentz BJ. 2017. Mountain pine beetle host selection behavior confirms
high resistance in Great Basin bristlecone pine. Forest Ecology and Management, 402:
12-20.
Elkin CM, Reid ML. 2004. Attack and reproductive success of mountain pine beetles
(Coleoptera: Scolytidae) in fire-damaged lodgepole pines. Environmental Entomology,
33: 1070-1080.
Elkin CM, Reid ML. 2005. Low energy reserves and energy allocation decisions affect
reproduction by mountain pine beetles, Dendroctonus ponderosae. Functional Ecology,
19: 102-109.
Erion R., Sehgal A. 2013. Regulation of insect behavior via the insulin-signaling
pathway. Frontiers in Physiology, 4: 353.
Esch ED, Langor DW, Spence JR. 2016. Gallery success, brood production, and condition of
mountain pine beetle (Coleoptera: Curculionidae) reared in whitebark and lodgepole pine
from Alberta, Canada. Canadian Journal of Forest Research, 46: 557-563.
Eveleigh ES, Lucarotti CJ, McCarthy PC, Morin B, Royama T, Thomas AW. 2007. Occurrence
and effects of Nosema fumiferanae infections on adult spruce budworm caught above and
within the forest canopy. Agriculture and Forest Entomology, 9: 247-258.
Evenden ML, Whitehouse CM, Sykes J. 2014. Factors influencing flight capacity of the
mountain pine beetle (Coleoptera: Curculionidae: Scolytinae). Environmental
Entomology, 43: 187-196.

110
Fairbairn DJ, Roff DA. 1990. Genetic correlations among traits determining migratory tendency
in sand cricket Gryllus firmus. Evolution, 44: 1787-1795.
Falush D, Stephens M, Pritchard JK. 2003. Inference of population structure using multilocus
genotype data: linked loci and correlated allele frequencies. Genetics, 164: 1567-1587.
Falush D, Stephens M, Pritchard JK. 2007. Inference of population structure using multilocus
genotype data: dominant markers and null alleles. Molecular Ecology Notes, 7: 574-578.
Fettig CJ, Steed BE, Munson AS, Progar RA, Mafra-Neto A. 2020. Evaluating doses of
SPLAT®verb to protect lodgepole pine trees and stands from mountain pine beetle. Crop
Protection, 136: 105228.
Fettig CJ. 2016. Native bark beetles and wood borers in Mediterranean forests of California. In
Insects and Diseases of Mediterranean Forest Systems. Edited by Paine T, Lieutier F.
Springer, Cham.
Fraser JD, Bonnett TR, Keeling CI, Huber DPW. 2017. Seasonal shifts in accumulation of
glycerol biosynthetic gene transcripts in mountain pine beetle, Dendroctonus ponderosae
Hopkins (Coleoptera: Curculionidae), larvae. PeerJ. 5: e3284.
Frazier MR, Harrison JF, Kirkton SD, Roberts SP. 2008. Cold rearing improves cold-flight
performance in Drosophila via changes in wing morphology. The Journal of
Experimental Biology, 211: 2116-2122.

111
Gao X, Lee K, Reid MA, Sanderson SM, Qiu C, Li S, Liu J, Locasale J. 2018. Serine
Availability influences mitochondrial dynamics and function through lipid metabolism.
Cell Reports, 22: 3507-3520.
Gatehouse AG. 1997. Behavior and ecological genetics of wind-borne migration by insects.
Annual Review of Entomology 42: 475–502.
Godefroid M, Meseguer AS, Sauné L, Genson G, Streito, J-C, Rossi J-P, Riverón AZ, Mayer F,
Cruaud A, Rasplus J-Y. 2019. Molecular Phylogenetics and Evolution, 139: 106528.
Goodsman DW, Koch D, Whitehouse C, Evenden ML, Cooke BJ, Lewis MA. 2016.
Aggregation and a strong Allee effect in a cooperative outbreak insect. Ecological
Applications, 26: 2623-2636.
Götz S, Garcia-Gomez JM, Terol J, Williams TD, Nagaraj SH, Nueda MJ, Robles M, Talon M,
Dopazo J, Conesa A. 2008. High-throughput functional annotation and data mining with
the Blast2GO suite. Nucleic Acids Research, 36: 3420-3435.
Gruber B, Georges A. 2019. dartR: Importing and analysing SNP and silicodart data generated
by genome-wide restriction fragment analysis. R package version 1.1.11 [online].
Available from https://CRAN.R-project.org/package=dartR [accessed 27 November
2019]
Gruntenko NE, Rauschenbach IY . 2008. Interplay of JH, 20E and biogenic amines under normal
and stress conditions and its effect on reproduction. Journal of Insect Physiology, 54:
902-908.

112
Haas F, Gorb S, Blickhan R. 2000. The function of resilin in beetle wings. Proceedings of the
Royal Society of London B, 267: 1375-1381.
Hart SJ, Schoennagel T, Veblen TT, Chapman TB. 2015. Area burned in the western United
States is unaffected by recent mountain pine beetle outbreaks. Proceedings of the
National Academy of Sciences of the United States of America, 112: 4375-4380.
Hassall C, Thompson DJ, Harvey IF. 2009. Variation in morphology between core and marginal
populations of three British damselflies. International Journal of Freshwater Entomology,
31: 187-197.
Hassall C. 2015. Strong geographical variation in wing aspect ratio of a damselfly, Calopteryx
maculate (Odonata: Zygoptera). PeerJ, 3: e1219.
Hijmans RJ. 2019. geosphere: Spherical Trigonometry. R package version 1.5-10 [online].
Available from https://CRAN.R-project.org/package=geosphere [accessed 16 August
2019]
Hill JK, Thomas CD, Blakeley DS. 1999a. Evolution of flight morphology in a butterfly that has
recently expanded its geographic range. Oecologia, 121: 165-170.
Hill JK, Thomas CD, Lewis OT. 1999b. Flight morphology in fragmented populations of a rare
British butterfly, Hesperia comma. Biological Conservation, 87: 277-283.
Hopping GR, Mathers WG. 1945. Observations on outbreaks and control of the mountain pine
beetle in the lodge-pole pine stands of western Canada. The Forestry Chronicle, 21: 98-
108.

113
Huang Y, Gu X, Peng X, Tao M, Chen G, Zhang X. 2020. Effect of short-term high-
temperatures on the growth, development and reproduction in the fruit fly, Bactrocera
tau (Diptera: Tephritidae). Scientific Reports, 10: 6418.
Hubbard RM, Rhoades CC, Elder K, Negron J. 2013. Changes in transpiration and foliage
growth in lodgepole pine trees following mountain pine beetle attack and mechanical
girdling. Forest Ecology and Management, 289: 312-317.
Huber DPW, Robert JA. 2016. The proteomics and transcriptomics of early host colonization
and overwintering physiology in the mountain pine beetle, Dendroctonus ponderosae
Hopkins (Coleoptera: Curculionidae). Advances in Insect Physiology, 50: 101-128.
Hubisz MJ, Falush D, Stephens M, Pritchard JK. 2009. Inferring weak population structure with
the assistance of sample group information. Molecular Ecology Resources, 9: 1322-1332.
Hulcr J, Atkinson TH, Cognato AI, Jordal BH, McKenna DD. 2015. Morphology, taxonomy,
and phylogenetics of bark beetles. In Bark Beetles: Biology and Ecology of Native and
Invasive Species. Edited by Vega FE, Hofstetter RW. Academic Press, Elsevier. pp. 41–
81.
Hulm PE. 2017. Climate change and biological invasions: evidence, expectations, and response
options. Biological reviews, 92: 1297-1313.
Iga M, Kataoka H. 2012. Recent studies on insect hormone metabolic pathways mediated by
cytochrome P450 enzymes. Biological and Pharmaceutical Bulletin, 35: 838-843.

114
Jackson PL, Straussfogel D, Lindgren BS, Mitchell S, Murphy B. 2008. Radar observation and
aerial capture of mountain pine beetle, Dendroctonus ponderosae Hopk. (Coleoptera:
Scolytidae) above the forest canopy. Canadian Journal of Forest Research, 38: 2313-
2327.
Jactel H. 1993. Individual variability of the flight potential of Ips sexdentatus Boern.
(Coleoptera: Scolytidae) in relation to day of emergence, sex, size, and lipid content. Can.
Entomol. 125: 919–930.
Janes JK, Roe AD, Rice AV, Gorrell JC, Coltman DW, Langor DW, Sperling FAH. 2016.
Polygamy and an absence of fine‐scale structure in Dendroctonus ponderosae (Hopk.)
(Coleoptera: Curcilionidae) confirmed using molecular markers. Heredity, 116: 68–74.
Janes JK, Li Y, Keeling CI, Yuen MMS, Boone CK, Cooke JEK, Bohlmann J, Huber DPW,
Murray BW, Coltman DW, Sperling FAH. 2014. How the mountain pine beetle
(Dendroctonus ponderosae) breached the Canadian Rocky Mountains. Molecular
Biology and Evolution, 31: 1803–1815.
Janes JK, Worth JRP, Batista PD, Sperling FAH. 2018. Inferring ancestry and divergence events
in a forest pest using low-density single-nucleotide polymorphisms. Insect Systematics
and Diversity, 2: 1-9.
Johnson P, Rees HH. 1977. The mechanism of C-20 hydroxylation of alpha-ecdysone in the
desert locust, Schistocerca gregaria. Biochemical Journal, 168: 513–520.

115
Johnson PCD. 2014. Extension of Nakagawa Schielzeth’s R2GLMM to random slopes models.
Methods in Ecology and Evolution, 5: 944-946.
Jombart T. 2008. adegenet: a R package for the multivariate analysis of genetic markers.
Bioinformatics, 24: 1403-1405.
Jombart T, Ahmed I. 2011. adegenet 1.3-1: new tools for the analysis of genome-wide SNP data.
Bioinformatics, 27: 3070-3071.
Jombart T, Devillard S, Balloux F. 2010. Discriminant analysis of principle components: a new
method for the analysis of genetically structured populations. BMC Genetics, 11: 94.
Jones CM, Papanicolaou A, Mironidis GK, Vontas J, Yang Y, Lim KS, Oakshott JG, Bass C,
Chapman JW. 2015. Genomewide transcriptional signatures of migratory flight activity
in a globally invasive insect pest. Molecular Ecology, 24: 4901-4911.
Jones KL, Rajabzadeh R, Ishangulyyeva G, Erbilgin N, Evenden ML. 2020. Mechanisms and
consequences of flight polyphenisms in an outbreaking bark beetle species. Journal of
Experimental Biology, 223: jeb219642.
Jones KL, Shegelski VA, Marculis NG, Wijerathna AN, Evenden ML. 2019. Factors influencing
dispersal by flight in bark beetles (Coleoptera: Curculionidae: Scolytinae): from genes to
landscapes. Canadian Journal of Forest Research, 49: 1024-1041.
Jones KL. 2019. Influence of semiochemical cues on mountain pine beetle flight and subsequent
effect of flight on host colonization process [Master’s Thesis]. Edmonton (AB):
University of Alberta. 110p.

116
Jordal BH, Cognato AI. 2012. Molecular phylogeny of bark and ambrosia beetles reveals
multiple origins of fungus and farming during periods of global warming. BMC
Evolutionary Biology, 12: 133.
Kaitala V, Kaitala A, Getz W. 1989. Evolutionary stable dispersal of a waterstrider in a
temporally and spatially heterogeneous environment. Evolutionary Ecology, 3: 283-298.
Kanehisa M, Goto S. 2000. KEGG: Kyoto Encyclopedia of Genes and Genomes. Nucleic Acids
Research, 28: 27-30.
Kautz M, Imron MA, Dworschak K, Schopf R. 2016. Dispersal variability and associated
population-level consequences in tree-killing bark beetles. Movement Ecology, 4: 9.
Keeling CI, Chiu CC, Aw T, Li M, Henderson H, Tittiger C, Weng H-B, Blomquist GJ,
Bohlman J. 2013a. Frontalin pheromone biosynthesis in the mountain pine beetle,
Dendroctonus ponderosae, and the role of isoprenyl diphosphate synthases. PNAS, 110:
18838-18843.
Keeling CI, Yuen MM, Liao NY, et al. 2013b. Draft genome of the mountain pine beetle,
Dendroctonus ponderosae Hopkins, a major forest pest. Genome Biology, 14: R27
Kim D, Pertea G, Trapnell C, Pimentel H, Kelley R, Salzberg S. 2013. Tophat2: accurate
alignment of transcriptomes in the presence of insertions, deletions and gene fusions.
Genome Biology, 14: R36.

117
Klutsch JG, Najar A, Cale JA, Erbilgin N. 2016. Direction of interaction between mountain pine
beetle (Dendroctonus ponderosae) and resource-sharing wood-boring beetles depends on
plant parasite infection. Oecologia, 182: 1-12.
Koenker R. 2017. Quantreg: Quantile Regression. R package version 5.29. URL
https://CRAN.R-project.org/package=quantreg
Kopelman NM, Mayzel J, Jakobsson M, Rosenberg NA, Mayrose I. 2015. CLUMPAK: a
program for identifying clustering models and packaging population structure inferences
across K. Molecular Ecology Resources, 15: 1179-1191.
Kristensen NP, De Barro PJ, Schellhorn. 2013. The initial dispersal and spread of an
international invader at three spatial scales. PLoS ONE, 8: e62407.
Kumar S, Chen D, Jang C, Nall A, Zheng X, Sehgal A. 2014 An ecdysone-responsive nuclear
receptor regulates circadian rhythms in Drosophila. Nature Communications, 5: 5697.
Kurz WA, Dymond CC, Stinson G, Rampley GJ, Neilson ET, Carroll AL, Ebata T, Safranyik L.
2008. Mountain pine beetle and forest carbon feedback to climate change. Nature, 452:
987-990.
Langmead B, Salzberg S. 2012. Fast gapped-read alignment with Bowtie 2. Nature Methods, 9:
357-359.
Langor DW, Spence JR. 1991. Host effects on allozyme and morphological variation of the
mountain pine beetle, Dendroctonus ponderosae Hopkins (Coleoptera: Scolytidae). The
Canadian Entomologist, 123: 395-410.

118
Laporte J, Blondeau F, Buj-Bello A, Mandel JL. 2001. The myotubularin family: from genetic
disease to phosphoinositide metabolism. Trends in Genetics, 17: 221-228.
Larroque J, Johns R, Canape J, Morin B, James PMA. 2020. Spatial genetic structure at the
leading edge of a spruce budworm outbreak: the role of dispersal in outbreak spread.
Forest Ecology and Management, 461: 117965.
Latty TM, Reid ML. 2010. Who goes first? Condition and danger dependent pioneering in a
group-killing bark beetle (Dendroctonus ponderosae). Behavioral Ecology and
Sociobiology, 64: 639-646.
Lawrence M, Huber W, Pagés H, Aboyoun P, Carlson M, Gentleman R, Morgan MT, Carey VJ.
2013. Software for computing and annotating genomic ranges. PLoS Comput Biol, 9:
e1003118.
Lee S, Hamelin RC, Six DL, Breuil C. 2007. Genetic diversity and the presence of two distinct
groups in Ophiostom clavigerum associated with Dendroctonus ponderosae in BC and
the northern Rocky Mountains. Phytopathology, 97: 1177–1185.
Lefcheck JS. 2015 piecewiseSEM: Piecewise structural equation modeling in R for ecology,
evolution, and systematics. Methods in Ecology and Evolution, 7: 573-579.
Lenormand T. 2002. Gene flow and the limits to natural selection. Trends in Ecology &
Evolution. 17: 183-189.
Lewis MA, Nelson W, Xu C. 2009. A structured threshold model for mountain pine beetle
outbreak. Bulletin of Mathematical Biology, 72: 565-589.

119
Li H, Durbin R. 2009. Fast and accurate short read alignment with Burrows-Wheeler Transform.
Bioinformatics, 25: 1754-60.
Li H, Handsaker B, Wysoker A, Fennell T, Ruan J, Homer N, Marth G, Abecasis G, Durbin R,
1000 Genome Project Data Processing Subgroup. 2009. The Sequence Alignment/Map
format and SAMtools. Bioinformatics, 25: 2078-2079.
Lindgren BS, Raffa KF. 2013. Evolution of tree-killing in bark beetles (Coleoptera,
Curculionidae): trade-offs between the maddening crowds and a sticky situation. The
Canadian Entomologist, 145: 471–495.
Liu H, Mardahl-Dumesnil M, Sweeney ST, O’Kane CJ, Bernstein SI. 2003. Drosophila
paramyosin is important for myoblast fusion and essential for myofibril formation.
Journal of Cell Biology, 160: 899-908.
Lorenz LJ, Hall JC, Rosbash M. 1989. Expression of a Drosophila mRNA is under circadian
clock control during pupation. Development, 107: 869-880.
Love MI, Huber W, Anders S. 2014. Moderated estimation of fold change and dispersion for
RNA-Seq data with DESeq2. Genome Biology, 15: 550.
Mac Cormick J. 2020. Spread management action collaborative. Bugs and Diseases, 31: 6.
Machado DN, Costa EC, Guedes JVC, Barbosa LR, Martínez G, Mayorga SI, Ramos SO,
Branco M, Garcia A, Vanegas-Rico JM, Jiménez-Quiroz E, Laudonia S, Novoselsky T,
Hodel DR, Arakelin G, Silva H, Perini CR, Valmorbida I, Ugalde GA, Arnemann JA.
2020. One maternal lineage leads the expansion of Thaumastocoris peregrinus

120
(Hemiptera: Thaumastocoridae) in the New and Old Worlds. Scientific Reports, 10:
3487.
Manning CG, Reid ML. 2013. Sub-lethal effects of monoterpenes on reproduction by mountain
pine beetles. Agriculture and Forest Entomology, 15: 262-271.
Marden JH, Fescemyer HW, Schilder RJ, Doerfler WR, Vera JC, Wheat CW. 2012. Genetic
variation in HIF signalling underlies quantitative variation in physiological and life-
history traits within lowland butterfly populations. Evolution, 67: 1105-1115.
Martin M. 2011. Cutadapt removed adapter sequences from high-throughput sequencing reads.
EMBnet.journal, 17: 10-11.
McCambridge WF, Mata SA Jr. 1969. Flight muscle changes in black hills beetles,
Dendroctonus ponderosae (Coleoptera: Scolytidae), during emergence and egg laying.
The Canadian Entomologist, 101: 507–512.
Miller DR, Lindgren BS, Borden JH. 2005. Dose-dependent pheromone responses of mountain
pine beetle in stands of lodgepole pine. Environmental. Entomology. 34: 1019–1027.
Minter M, Pearson A, Lim KS, Wilson K, Chapman JW, Jones CM. 2018. The tethered flight
technique as a tool for studying life-history strategies associated with migration in
insects. Ecological Entomology, 43: 397-411
Mock KE, Bentz BJ, O’Neill EM, Chong JP, Orwin J, Pfrender ME. 2007. Landscape-scale
genetic variation in a forest outbreak species, the mountain pine beetle (Dendroctonus
ponderosae). Molecular Ecology, 16: 553–568.

121
Morgan M, Pagées H, Obenchain V, Hayden N. 2017. Rsamtools: Binary alignment (BAM),
FASTA, variant call (BCF), and tabix file import. R package version 1.26.2.
http://bioconductor.org/packages/release/bioc/html/Rsamtools.html
Mountcastle AM, Combes SA. 2013. Wing flexibility enhances load-lifting capacity in
bumblebees. Proceedings of the Royal Society B, 280: 23536604.
Nadeau JA, Petereit J, Tillett RL, Jung K, Fotoohi M, MacLean M, Young S, Schlauch K,
Blomquist GJ, Tittiger C. 2017. Comparative transcriptomics of mountain pine beetle
pheromone-biosynthetic tissues and functional analysis of CYP6DE3. BMC Genomics,
18: 311.
Nagoshi E., Sugino K., Kula E., Okazaki E., Tachibana T., Nelson S., Rosbash M. 2010.
Dissecting differential gene expression within the circadian neuronal circuit of
Drosophila. Nature Neuroscience, 13: 60-68.
Nakagawa S, Schielzeth H. 2013. A general and simple method for obtaining R2 from
generalized linear mixed-effects models. Methods in Ecology and Evolution, 4: 133-142.
Nakazawa M. 2017. fmsb: Functions for Medical Statistics Book with some Demographic Data.
R package version 0.6.1. URL https://cran.r-project.org/web/packages/fmsb/index.html
Naranjo SE. 2019. Assessing insect flight behavior in the laboratory: a primer on flight mill
methodology and what can be learned. Annals of the Entomological Society of America,
112: 182-199.
122
Nässel DR, Liuy Y, Luo J. 2015. Insulin/IGF signaling and its regulation in Drosophila. General
and Comparative Endocrinology, 221: 255-266.
Nathan R, Klein E, Robledo-Arnuncio JJ, Revilla E. Chapter 15 Dispersal kernels: review. In
Dispersal Ecology and Evolution. Edited by Clobert J, Baguette M, Benton TG, Bullock
JM. Oxford University Press, Oxford. pp. 187-210.
Nazif A, Partridge L. 2008. Stage debut for the elusive Drosophila insulin-like growth factor
binding protein. Journal of Biology, 7: 18.
Nigg HN, Svoboda JA, Thompson MJ, Dutky SR, Kaplanis JN, Robbins WE. 1976. Ecdysome
20-hydroxylase from the midgut of the tobacco hornworm (Manduca sexta L.).
Experientia, 32: 438–439.
Niitepold K, Smith AD, Osborne JL, Reynolds DR, Carreck NL, Martin AP, Marden JH,
Ovaskainen O, Hanski I. 2009. Flight metabolic rate and Pgi genotype influence butterfly
dispersal rate in the field. Ecology. 90: 2223-2232.
Norberg RÅ. 1972. The pterostigma of insect wings an inertial regulator of wing pitch. Journal
of Comparative Physiology, 81: 9-22.
NRCan (Natural Resources Canada). (2017, February 21). Mountain pine beetle (factsheet).
Retrieved from http://www.nrcan.gc.ca/forests/fire-insects-disturbances/top-
insects/13397

123
NRCan (Natural Resources Canada). 2017 [accessed February 21]. Mountain pine beetle
(factsheet). Retrieved from http://www.nrcan.gc.ca/forests/fire-insects-disturbances/top-
insects/13397
Ohms HA, Mohapatra A, Lytle DA, De Leenheer P. 2019. The evolutionary stability of partial
migration under different forms of competition. Theoretical Ecology, 12: 347-363.
Oikonomopoulos S, Wang YC, Djambazian H, Badescu D, Ragoussis J. 2016. Benchmarking of
the Oxford Nanopore MinION sequencing for quantitative and qualitative assessment of
cDNA populations. Scientific Reports, 6: 31602 (2016).
Olivieri I, Gouyon P-H. 1997. Evolution of migration rate and other traits: the metapopulation
effect (pp 293–323) In Hanski IA, Gilpin ME. (eds), Metapopulation biology: ecology,
genetics, and evolution. San Diego, California: Academic Press.
Paine TD, Millar JG, Hanlon CC, Hwang J-S. 1999. Identification of semiochemichals
associated with Jeffrey pine beetle, Dendroctonus jeffreyi. Journal of Chemical Ecology,
25: 433-453.
Palmer JO, Dingle H. 1989. Responses of selection on flight behaviour in a migratory population
of milkweed bugs (Oncopeltus fasciatus). Evolution, 43: 1805-1808.
Paris JR, Stevens JR, Catchen JM. 2017. Lost in parameter space: a road map for STACKS.
Methods in Ecology and Evolution, 8: 1360-1373.

124
Peterson BK, Weber JN, Kay EH, Fisher HS, Hoekstra HE. 2012. Double Digest RADseq: An
inexpensive method for de novo SNP discovery and genotyping in model and non-model
species. PLoS ONE, 7: e37135.
Pierce HD Jr, Conn JE, Oehlschlager AC, Borden JH. 1987. Monoterpene metabolism in female
mountain pine beetles, Dendroctonus ponderosae Hopkins, attacking ponderosa pine.
Journal of Chemical Ecology, 13: 1455-1480.
Pinheiro J, Bates D, DebRoy S, Sarkar D, R Core Team. 2017. nlme: Linear and Nonlinear
Mixed Effects Models. R package version 3.1-131. URL: https://CRAN.R-
project.org/package=nlme
Pistone D, Gohli J, Jordal BH. 2018. Molecular phylogeny of bark and ambrosia beetles
(Curculionidae: Scolytinae) based on 18 molecular markers. Systematic Entomology, 43:
387-406.
Poland JA, Brown PJ, Sorrells ME, Jannink JL. 2012. Development of high-density genetic maps
for barley and wheat using a novel two-enzyme genotyping-by-sequencing approach.
PLoS ONE, 7: e32253.
Pompella A, Visvikis A, Paolicchi A, De Tata V, Casini AF. 2003. The changing faces of
glutathione, a cellular protagonist. Biochemical Pharmacology, 66: 1499–503.
Pritchard JK, Stephens M, Donnelly P. 2000. Inference of population structure using multilocus
genotype data. Genetics, 155: 945-959.

125
R Core Team. 2017. R: A Language and Environment for Statistical Computing. R Foundation
for Statistical Computing, Austria [online]. Available from https://www.R-project.org/
[accessed 3 October 2017]
R Core Team. 2018. R: A Language and Environment for Statistical Computing. R Foundation
for Statistical Computing, Austria [online]. Available from https://www.R-project.org/
[accessed 13 September 2018]
Raffa KF, Grégoire J-C, Lindgren BS. 2015. Natural history and ecology of bark beetles. In Bark
Beetles: Biology and Ecology of Native and Invasive Species. Edited by Vega FE,
Hofstetter RW. Academic Press, Elsevier. pp. 1–40.
Rajkumar AP, Qvist P, Lazarus R, Lescai F, Ju J, Nyegaard M, Mors O, Børglum D, Li Q,
Christensen JH. 2015. Experimental validation of methods for differential gene
expression analysis and sample pooling in RNA-seq. BMC Genomics, 16: 548.
Raymond M, Rousset F. 1995. GENEPOP (version 1.2): population genetics software for exact
tests and ecumenicism. Journal of Heredity, 86: 248-249.
Reeve JD, Anderson FE, Kelley ST. 2012. Ancestral state reconstruction for Dendroctonus bark
beetles: evolution of a tree killer. Environmental Entomology, 41: 723-730.
Reid ML, Purcell JRC. 2011. Condition-dependent tolerance of monoterpenes in an insect
herbivore. Arthropod-Plant Interactions, 5: 331-337.
Reid RW. 1958. Internal changes in female mountain pine beetle Dendroctonus monticolae
Hopk., Associated with Egg Laying and Flight. The Canadian Entomologist, 90: 464-468.

126
Reynolds AM, Reynolds DR, Sanjay PS, Gao H, Chapman JW. 2016. Orientation in high-flying
migrant insects in relation to flows: mechanisms and strategies. Philosophical
Transactions of the Royal Society B, 371: 20150392.
Ribak G, Barkan S, Soroker V. 2017. The aerodynamics of flight in an insect flight-mill. PLoS
ONE, 12: e0186441.
Rice AV, Thormann MN, Langor DW. 2008. Mountain pine beetle-associated blue-stain fungi
are differentially adapted to boreal temperatures. Forest Pathology, 38: 113–123.
Rieux A, Soubeyrand S, Bonnot F, Klein EK, Ngando JE, Mehl A, et al. 2014. Long-distance
wind-dispersal of spores in a fungal plant pathogen: estimation of anisotropic dispersal
kernels from an extensive field experiment. PLoS ONE, 9: e103225.
Robert JA, Bonnett T, Pitt C, Spooner LJ, Fraser J, Yuen MMS, Keeling CI, Bohlmann J, Huber
DPW. 2016. Gene expression analysis of overwintering mountain pine beetle larvae
suggests multiple systems involved in overwintering stress, cold hardinaess, and
preparation for spring development. PeerJ, 4: e2109.
Robert JA, Pitt C, Bonnett TR, Yuen MMS, Keeling CI, Bohlmann J, Huber DPW. 2013.
Disentangling detoxification: gene expression analysis of feeding mountain pine beetle
illuminates molecular-level host chemical defense detoxification mechanisms. PLoS
ONE, 8: e77777.
Robertson C, Nelson TA, Boots B. 2007. Mountain pine beetle dispersal: the spatial-temporal
interaction of infestations. Forest Science, 53: 395-405.

127
Robertson IC. 1998. Flight muscle changes in male pine engraver beetles during reproduction:
the effects of body size, mating status and breeding failure. Physiological Entomology,
23: 75-80.
Robertson IC, Roitberg BD. 1998. Duration of paternal care in pine engraver beetles: Why do
larger males care less? Behav. Ecol. Sociobiol. 43: 379–386.
Rochette NC, Rivera-Colón AG, Catchen, JM. 2019. Stacks 2: Analytical methods for paired-
end sequencing improve RADseq-based population genomics. Molecular Ecology, 28:
4737-4754.
Roff DA, Fairbairn DJ. 2007. The evolution and genetics of migration in insects. BioScience, 57:
155–164.
Rogulja D, Rauskolb C, Irvine KD. 2008. Morphogen Control of wing growth through the Fat
signalling pathway. Developmental Cell, 15: 309-321.
Rosenberger DW, Venette RC, Aukema BH. 2016. Sexing live mountain pine beetles
Dendroctonus ponderosae: refinement of a behavioral method for Dendroctonus spp..
Entomologia Experimentalis et Applicata, 160: 195-199.
Rousset F. 2008. Genepop'007: a complete reimplementation of the Genepop software for
Windows and Linux. Molecular Ecology Resources, 8: 103-106.
Royama T. 1984. Population dynamics of the spruce budworm Choristoneura fumiferana.
Ecological Monographs, 54: 429-462.

128
Rueden CT, Schindelin J, Hiner MC, DeZonia BE, Walter AE, Arena ET, Eliceiri KW. 2017.
ImageJ2: ImageJ for the next generation of scientific image data. BMC Bioinformatics,
18: 529.
Saastamoinen M, Bocedi G, Cote J, Legrand D, Guillaume F, Wheat CW, Fronhofer EA, Garcia
C, Henry R, Husby A, Baguette M, Bonte D, Coulon A, Kokko H, Matthysen E,
Niitepõld, Nonaka E, Stevens VM, Travis JMJ, Donohue K, Bullock JM, Delgado MM.
2018. Genetics of dispersal. Biological Reviews, 93: 574-599.
Safranyik L, Carroll AL, Régnière J, Langor DW, Riel WG, Shore TL, Peter B, Cooke BJ,
Nealis VG, Taylor SW. 2010. Potential for range expansion of mountain pine beetle into
the boreal forest of North America. The Canadian Entomologist, 142: 415-442.
Safranyik L, Silversides R, McMullen LH, Linton DA. 1989. An empirical approach to modeling
the local dispersal of the mountain pine beetle (Dendroctonus ponderosae Hopk.) (Col.,
Scolytidae) in relation to sources of attraction, wind direction and speed. Journal of
Applied Entomology, 108: 498-511.
Safranyik L. 1998. Mortality of mountain pine beetle larvae, Dendroctonus ponderosae
(Coleoptera: Scolytidae) in logs of lodgepole pine (Pinus contorta var. latifolia) at
constant low temperatures. Journal of the Entomological Society of British Columbia. 95:
81-87.
Safranyik L. Carroll AL. 2006. The biology and epidemiology of the mountain pine beetle in
lodgepole pine forests (Chapter 1). In Safranyik, L. Wilson, W.R. (Eds.), The mountain
pine beetle: a synthesis of biology, management, and impacts on lodgepole pine (pp. 3-

129
66). Victoria, British Columbia: Natural Resources Canada, Canadian Forest Service,
Pacific Forestry Centre.
Sahota TS. 1975. Effect of juvenile hormone on acid phosphatases in the degenerating flight
muscles of the Douglas-fir beetle, Dendroctonus pseudotsugae. Journal of Insect
Physiology, 21: 471-475, 477-478.
Samarasekera GDNG, Bartell NV, Lindgren BS, Cooke JEK, Davis CS, James PMA, Coltman,
DW, Mock KE, Murray BW. 2012. Spatial genetic structure of the mountain pine beetle
(Dendroctonus ponderosae) outbreak in western Canada: Historical patterns and
contemporary dispersal. Molecular Ecology, 21: 2931–2948.
Sandstrom P, Welch WH, Blomquist GJ, Tittiger C. 2006. Functional expression of a bark beetle
cytochrome P450 that hydroxylates myrcene to ipsdienol. Insect Biochemistry and
Molecular Biology, 36: 835-845.
Schneider CA, Rasband WS, Eliceiri KW. 2012. NIH Image to ImageJ: 25 years of image
analysis. Nature Methods, 9: 671-675.
Segraves WA, Hogness DS. 1990. The E75 ecdysone-inducible gene responsible for the 75B
early puff in Drosophila encodes two new members of the steroid receptor superfamily.
Genes & Development, 4: 204-219.
Seybold SJ, Huber DPW, Lee JC, Graves AD, Bohlmann J. 2006. Pine monoterpenes and pine
bark beetles: a marriage of convenience for defense and chemical communication.
Phytochemistry Reviews, 5: 143-178.

130
Sheehan D, Meade G, Foley VM, Dowd CA. 2001. Structure, function and evolution of
glutathione transferases: implications for classification of non-mammalian members of an
ancient enzyme superfamily. Biochemical Journal, 360: 1-16.
Shegelski VA, Evenden ML, Sperling FAH. 2019. Morphological variation associated with
dispersal capacity in a tree-killing bark beetle Dendroctonus ponderosae Hopkins.
Agriculture and Forest Entomology, 21: 79-97.
Shepherd RF. 1966. Factors influencing the orientation and rates of activity of Dendroctonus
ponderosae Hopkins (Coleoptera: Scolytidae). The Canadian Entomologist, 98: 507-518.
Sieber MH, Spradling AC. 2015. Steroid signaling establishes a female metabolic state and
regulates SREBP to control oocyte lipid accumulation. Current Biology, 25: 993-1004.
Singh SP, Coronella JA, Benes H, Cochrane BJ, Zimniak P. 2001. Catalytic function of
Drosophila melanogaster glutathione S-transferase DmGSTS1-1 (GST-2) in conjugation
of lipid peroxidation end products. European Journal of Biochemistry, 268: 2912–2923.
Six DL, Bracewell R. 2015. Dendroctonus. In Bark Beetles: Biology and Ecology of Native and
Invasive Species. Edited by Vega FE, Hofstetter RW. Academic Press, Elsevier. pp. 305–
350.
Six DL. 2020. A major symbiont shift supports a major niche shift in a clade of tree-killing bark
beetles. Ecological Entomology, 45: 190-201.
Six DL, Bentz BJ. 2007. Temperature determines the relative abundance of symbionts in a
multipartite bark beetle-fungus symbiosis. Microbial Ecology, 54: 112–118.
131
Song M, Gorzalski A, Nguyen TT, Liu X, Jeffrey C, Blomquist GJ, Tittiger C. 2014. Exo-
brevicomin biosynthesis in the fat body of the mountain pine beetle, Dendroctonus
ponderosae. Journal of Chemical Ecology, 40: 181-189.
Song X, Zhang Y, Zhong Q, Zhan, Bi J, Tang J, Xie J, Li B. 2020. Identification and functional
characterization of methyl-CpG binding domain protein from Tribolium castaneum.
Genomics, 112: 2223-2232.
Stark R, Grzelak M, Hadfield J. 2019. RNA sequencing: the teenage years. Nature Reviews
Genetics, 20: 631-656.
Steyn VM, Mitchell KA, Terblanche JS. 2016. Dispersal propensity, but not flight performance,
explains variation in dispersal ability. Proceedings of the Royal Society B, 283:
20160905.
Stinner RE, Barfield CS, Stimac JL, Dohse L. 1983. Dispersal and movement of insect pests.
Annual Review of Entomology, 28: 319-335.
Taft S, Najar A, Erbilgin N. 2015. Pheromone production by an invasive bark beetle varies with
monoterpene composition of its naïve host. Journal of Chemical Ecology, 41: 540–549.
Taylor PD, Merriam G. 1995. Wing morphology of a forest damselfly is related to landscape
structure. Oikos, 73: 43-48.
Taylor S, Carroll AL. 2004. Disturbance, forest age, and mountain pine beetle outbreak
dynamics in BC: A historical perspective (pp 41-51). In Shore, T.L., Brooks, J.E. Stone,
J.E. (eds). Mountain Pine Beetle Symposium: Challenges and Solutions. Kelowna, British

132
Columbia: Natural Resources Canada, Canadian Forest Service, Pacific Forestry Centre,
Information Report BC-X-399, Victoria, BC. 298 p.
Taylor RAJ, Bauer LS, Poland TM, Windell KN. 2010. Flight performance of Agrilus
planipennis (Coleoptera: Buprestidae) on a flight mill and in free flight. Journal of Insect
Behavior, 23: 128–148.
Thompson KM, Huber DPW, Murray BW. 2020. Autumn shifts in cold tolerance metabolites in
overwintering mountain pine beetles. PLoS ONE, 15: e0227203.
Thompson SN, Bennett RB. 1971. Oxidation of fat during flight of male Douglas-fir beetles,
Dendroctonus pseudotsugae. Journal of Insect Physiology, 17: 1555–1563.
Tillman JA, Lu F, Goodard LM, Donaldson Z, Dwinell SC, Tittiger C, Hall GM, Storer AJ,
Blomquist GJ, Seybold SJ. 2004. Juvenile hormone regulates de novo isoprenoid
aggregation pheromone biosynthesis in pine bark beetles, Ips spp. (Coleoptera:
Scolytidae), through transcriptional control of HMG-CoA reductase. Journal of Chemical
Ecology, 30: 2459-2494.
Town of Hinton. [date unknown]. Program work updates: mountain pine beetle [accessed 2020
Jun 03]. https://www.hinton.ca/898/Mountain-Pine-Beetle
Trevoy SAL, Janes JK, Muirhead K, Sperling FAH. 2018a. Repurposing population genetics
data to discern genomic architecture: a case study of linkage cohort detection in mountain
pine beetle (Dendroctonus ponderosae). Ecology and Evolution, 9: 1147-1159.

133
Trevoy SAL, Janes JK, Sperling FAH. 2018b. Where did mountain pine beetle populations in
Jasper Park come from? Tracking beetles with genetics. The Forestry Chronicle, 94: 20-
24.
Victor J, Zúñiga G. 2016. Phylogeny of Dendroctonus bark beetles (Coleoptera: Curculionidae:
Scolytinae) inferred from morphological and molecular data. Systematic Entomology, 41:
162-177.
Visscher PM, Wray NR, Zhang Q, Sklar P, McCarthy MI, Brown MA, Yang J. 2017. 10 years of
GWAS discovery: biology, function, and translation. The American Journal of Human
Genetics, 101: 5-22.
Wang S, Liu S, Wang J, Zhou S, Jiang RJ, Bendena WG, Li S. 2010. 20-hydroxyecdysone
reduces insect food consumption resulting in fat body lipolysis during molting and
pupation. Journal of Molecular Cell Biology, 2: 128-138.
Ward SF, Fei S, Liebhold AM. 2020. Temporal dynamics and drivers of landscape-level spread
by emerald ash borer. Journal of Applied Ecology, 57: 1020-1030.
Wegener G. 1996. Flying insects: Model systems in exercise physiology. Experientia, 52: 404-
412.
Wertman DL, Bleiker KP, Perlman SJ. 2018. The light at the end of the tunnel: Photosensativity
in larvae of the mountain pine beetle (Coleoptera: Curculionidae: Scolytinae). The
Canadian Entomologist, 150: 622-631.

134
Wertman DL, Bleiker KP. 2019. Shedding new light upon circadian emergence rhythmicity in
the mountain pine beetle (Coleoptera: Curculionidae: Scolytinae). The Canadian
Entomologist, 151: 273-277.
Wheat CW, Haag CR, Marden JH, Hanski I, Frilander MJ. 2010. Nucleotide polymorphism at a
gene (Pgi) under balancing selection in a butterfly metapopulation. Molecular Biology
Evolution, 27: 267-281.
Whittaker P. 2018. Federal government must act on national pine beetle problem [online]. CBC
News. Available from: https://www.cbc.ca/news/canada/edmonton/pine-beetle-column-
alberta-forest-products-association-1.4895576 [accessed 24 February 2020]
Wickham H. 2016. ggplot2: Elegant Graphics for Data Analysis. Springer-Verlag New York
[online]. Available from https://CRAN.R-project.org/package=ggplot2 [accessed 13
August 2019].
Wijerathna A, Evenden M. 2019. Energy use by the mountain pine beetle (Coleoptera:
Curculionidae: Scolytinae) for dispersal by flight. Physiological Entomology, 44: 200-
208.
Wijerathna A, Whitehouse C, Proctor H, Evenden M. 2019. Testing for trade-offs between flight
and reproduction in the mountain pine beetle (Coleoptera: Curculionidae) on two pine
(Pinacea) hosts. The Canadian Entomologist, 151: 298-310.

135
Williams WI, Robertson IC. 2008. Using automated flight mills to manipulate fat reserves in
Douglas-fir beetles (Coleoptera: Curculionidae). Environmental Entomology, 37: 850-
856.
Wood SL. 1982. The bark and ambrosia beetles of North and Central America (Coleoptera:
Scolytidae), a taxonomic monograph. Great Basin Naturalist Memoirs, 6: 1–1359.
Wootton RJ. 1992. Functional morphology of insect wings. Annual Review of Entomology, 37:
113-140.
Wu M, Zhang X, Wei W, Long L, An S, Gao G. 2020. CRISPR/Cas9 mediated genetic resource
for unknown kinase and phosphatase genes in Drosophila. Scientific Reports, 10: 7383.
Yamamoto K, Hirowatari A, Shiotsuki T, Yamada N. 2016. Biochemical characterization of an
unclassified glutathione S-transferase of Plutella xylostella. Journal of Pesticide Science,
41: 145-151.
Yamamoto K, Ichinose H, Aso Y, Banno Y, Kimura M, Nakashima T. 2011. Molecular
characterization of an insecticide-induced novel glutathione transferase in silkworm.
Biochemica et Biophysica Acta – General Subjects, 1810: 420-426.
Zhan S, Zhang W, Niitepold K, Hsu J, Haeger JF, Zalucki MP, Altizer S, de Roode JC, Reppert
SM, Kronforst MR. 2014. The genetics of monarch butterfly migration and warning
colouration. Nature, 514: 317–321.

136
Zhang R, Gao G, Chen, H. 2016. Silencing of the olfactory co-receptor gene in Dendroctonus
armandi leads to EAG response declining to major host volatiles. Scientific
Reports, 6: 23136.
Zhang R-J, Chen J, Jiang L-Y, Qiao G-X. 2019. The genes expression difference between
winged and wingless bird cherry-oat aphid Rhopalosiphum padi based on transcriptomic
data. Scientific Reports, 9: 4754.
Zhang S, Clark R, Huang Y. 2020. Frequency-dependent strategy selection in a hunting game
with a finite population. Applied Mathematics and Computation, 382: 125355.
Zhou C, Wang L, Price M, Li J, Meng Y, Yue B-S. 2020. Genomic features of the fall
armyworm (Spodoptera frugiperda) (J.E. Smith) yield insights into its defense system
and flight capability. Entomological Research, 50: 100-112.

137
Appendices
Appendix 2.1 Measured morphology and data collected from flight mills, as well as data on number of days specimens were stored
after emergence before being flown, mill number for flight, emergence bolt, and natal tree. Dashes indicate specimens that did not
have muscle measurements taken.
ID
preflight
weight
(mg)
postflight
weight
(mg)
wing
area
(mm2)
wing
length
(mm)
wing
chord
(mm)
pronotal
width
(mm)
body
length
(mm)
muscle
volume
(mm3)
total
flight
dura-
tion (s)
rota-
tions
days
stored
before
flight
flight
mill
#
Tree
#
Emer-
gence
bolt #
G253 9.86 9.27 8.97 5.69 1.8 2.17 4.96 16.17 7.27 11 5 18 1 18
G260 15.66 13.44 11.74 6.7 2.07 2.5 5.92 - 9.09 12 5 17 1 16
G300 11.58 9.04 10.1 6.24 1.84 2.1 5.1 - 14.75 12 3 22 1 16
G388 10.42 9.67 9.2 6.1 1.77 2.17 5.15 - 29.06 18 4 7 1 18
G350 16.28 15.43 13.4 6.98 2.15 2.6 5.99 - 10.34 25 4 8 1 18
G298 15.94 14.24 12.05 6.75 2.15 2.3 5.65 - 40.84 40 3 21 2 20
G306 19.84 18.45 14.44 7.26 2.26 2.38 6.41 - 22.23 43 5 17 2 20
G418 11.69 11.1 10.91 6.35 1.99 2.03 5.45 - 75.91 45 4 21 1 18
G375 12.87 11.54 11.35 6.72 2.04 2.35 5.82 19.99 72.61 59 5 8 1 18
G377 11.16 10 9.09 6.14 1.75 2.15 5.05 - 112.34 60 5 22 1 18
G293 17.12 16.06 14.26 7.24 2.24 2.44 5.85 - 97.83 97 3 8 2 20
G246 12.4 12 10.47 6.34 1.96 2.13 5.41 25.64 236.59 104 5 2 3 14
G254 11.76 10.78 10.04 6.27 1.91 2.52 5.18 - 129.58 104 5 2 3 14
G404 10.09 9.51 8.88 5.82 1.83 1.9 4.88 - 91.75 106 4 2 1 16
G328 17.3 15.66 12.88 7.12 2.08 2.37 5.85 - 177.06 127 4 23 1 16
G338 14.02 13.91 10.53 6.28 1.98 2.38 5.25 - 468.56 273 3 6 2 21
G289 18.89 16.24 12.36 6.65 2.2 2.43 5.88 - 562.2 292 3 12 2 20
G259 17.22 14.97 13.1 6.99 2.12 2.58 6.19 27.37 828.73 317 5 16 1 16

138
G332 9.58 8.49 9.44 6.01 1.77 2 5.24 - 1035.91 387 4 14 1 16
G386 13.97 12.88 11.31 6.6 1.96 2.32 5.45 - 324.42 414 4 5 1 18
G271 17.83 15.61 13.61 6.9 2.29 2.52 5.96 - 917.88 418 5 17 1 18
G335 19.91 18.73 13.87 6.94 2.32 2.38 6.66 23.74 578.27 451 3 2 2 20
G359 13.1 12.38 11 6.43 2.06 2.15 5.59 - 861.52 510 5 16 1 16
G407 16.03 14.55 10.85 6.37 1.95 2.39 5.62 - 1133.58 632 4 16 1 18
G358 10.65 9.8 9.64 5.92 1.91 2.01 5.3 - 1148.72 732 5 17 1 16
G376 11.8 10.92 9.43 6.3 1.75 2.26 5.29 - 1313.83 767 5 23 1 18
G414 12.81 11.44 11.48 6.69 1.98 2.29 5.41 - 2501.19 871 4 11 1 18
G285 11.3 10.36 10.39 6.12 1.95 1.8 5.05 19.74 1810.47 895 3 2 2 20
G400 16.6 15.72 12 6.58 2.02 2.51 5.68 - 1222.81 902 4 4 1 18
G362 15.81 14.71 12.55 6.54 2.09 2.41 5.63 - 1377.73 911 5 8 1 16
G302 14.8 13.02 12.63 6.88 2.16 2.43 5.67 18.35 1722.45 1055 3 23 2 21
G401 16.97 15.9 13.28 7.07 2.14 2.43 5.76 23.8 1519 1135 4 2 1 18
G284 19.47 17.41 12.7 6.98 2.13 2.25 5.93 24.12 1368.33 1201 3 1 2 20
G257 10.48 9.97 9.4 5.86 1.87 2.19 4.95 18.9 5613.41 1637 5 10 3 14
G360 15.76 14.63 12.86 6.82 2.18 2.42 5.87 26.41 3389.52 1666 5 11 1 16
G268 11.96 11.89 9.92 6.19 1.92 2.23 5.45 24.02 2628.5 1920 5 11 4 19
G272 18.22 14.03 13.09 6.77 2.21 2.39 5.78 22.2 5082.89 2101 5 18 1 18
G331 17.08 15.12 12.54 6.87 2.12 2.04 5.75 29.91 4775.78 2877 4 20 1 16
G327 14.86 13.4 12.16 6.74 2.11 2.23 5.41 23.89 56434.8 3358 4 10 2 20
G261 16.81 14 12.7 6.92 2.11 2.57 6.12 23.67 7182.95 3702 5 18 1 16
G356 18.86 17.15 13.95 7.16 2.24 2.54 5.92 17.01 5924.8 3767 5 19 2 20
G398 14.66 12.51 11.99 6.81 1.99 2.25 5.31 24.91 9098.3 3867 4 21 1 18
G363 17.4 16.42 12.08 6.71 2.08 2.24 5.75 24.8 4073.81 3892 5 23 1 18
G389 11.65 10.51 9.94 6.27 1.83 2.07 5.18 25.02 5252.27 3900 4 19 1 16
G408 10.43 9.05 9.35 5.91 1.91 2.09 5.08 22.11 6968.92 3969 4 17 1 18
G264 18.84 16.92 13.85 6.9 2.4 2.36 5.93 21.44 5626.88 4086 5 2 2 20
G344 10.26 9.42 9.88 5.85 1.91 2.22 5.1 20.87 8126.41 4618 4 23 1 16
G361 17.26 15.08 12.59 6.94 2.14 2.31 5.81 21 7071.78 5040 5 10 1 16
G336 17.69 16.4 13.21 6.91 2.24 2.64 5.97 26.59 10276.1 5171 3 1 2 20

139
G266 12.8 11.45 10.64 6.21 1.93 2.19 5.2 21.11 14791.9 5215 5 8 3 14
G343 15.7 14.56 12.46 6.78 2.08 2.24 5.89 24.12 8375.3 5256 4 16 1 16
G364 12.5 10.82 10.32 6.24 1.93 2.13 5.27 20.49 14374.5 5381 5 22 1 18
G369 12.47 11.12 9.99 6.28 1.88 2.03 5.15 18.92 8187.84 5432 5 19 1 16
G307 21.2 17.84 14.7 7.41 2.28 2.51 6.44 30.34 8498 5484 5 16 2 20
G290 17.88 15.82 13.17 6.96 2.16 2.59 6.09 26.89 13268.7 5551 3 13 2 20
G251 15.65 14.11 12.18 6.71 2.08 2.35 5.65 26.06 10845.5 5748 5 16 4 19
G417 16.63 15.35 11.68 6.84 2.03 2.22 5.59 21.58 9585.47 5869 4 16 1 18
G301 13.87 11.34 11.16 6.52 1.91 2.28 5.38 20.75 12055.2 5901 3 18 1 16
G326 17.4 15.14 13.2 6.87 2.09 2.32 6.8 25.11 10939.3 6148 4 11 2 20
G373 16.24 14.78 12.91 6.96 2.17 2.4 5.76 19.55 8682.27 6362 5 11 1 18
G419 15.59 14.34 12.88 6.85 2.18 2.35 5.87 19.5 14344.4 6421 4 20 1 18
G250 7.92 7.01 8.08 5.62 1.69 1.7 4.32 15.01 13556.3 6868 5 11 4 15
G315 15.74 13.27 12.1 6.63 2.1 2.46 5.79 25.73 15583.1 7268 4 22 1 18
G371 14.66 12.83 11.5 6.57 2.02 2.26 5.44 19.32 17752.5 7705 5 17 1 18
G416 14.75 13.71 11.93 6.78 2.04 2.37 5.66 18.33 12202.8 7870 4 23 1 18
G368 13.44 11.97 10.39 6.25 1.94 1.86 4.78 14.12 17734.8 7897 5 2 1 18
G263 14.93 13.42 12.02 6.72 2.08 2.46 5.64 26.55 13967.3 8034 1 17 1 18
G287 18.37 16.51 14.1 7.21 2.34 2.74 5.69 33.06 10926.6 8120 3 6 2 20
G247 11.86 11.43 8.84 5.88 1.76 2.13 5.15 22.47 11774.2 8126 5 4 3 14
G329 13.86 11.38 11.52 6.45 2.05 2.5 5.43 17.85 17326.1 8435 4 22 1 16
G308 19.86 18.01 13.76 7.12 2.26 2.51 6.18 26.41 12983.6 8516 5 11 2 20
G391 18.26 15.32 13.22 7.08 2.2 2.41 5.78 27.97 13874.9 8612 4 17 1 18
G255 15.73 14.98 11.86 6.67 2.06 2.33 5.63 20.18 11551.7 8803 5 4 3 14
G382 11.48 10.3 10.48 6.22 1.95 2.1 5.08 19.55 17246 8892 4 12 2 20
G340 13.97 12.74 10.81 6.25 2.01 2.41 5.24 17.63 17829.4 8955 4 19 2 21
G322 19.32 17.98 13.89 7.19 2.22 2.47 6.06 23.28 11245 9147 4 19 2 20
G383 14.87 13.64 13.1 6.94 2.23 2.33 5.78 18.9 11303.3 9296 4 4 1 16
G323 15.51 14.59 12.81 6.89 2.19 2.25 5.7 22.79 10752.4 9359 4 18 2 20
G381 12.13 10.88 10.83 6.51 1.95 2.16 5.29 17.13 15743 9712 4 13 2 20
G305 22.09 19.64 14.42 7.26 2.23 2.53 6.38 27.14 11501.6 9721 5 18 2 20
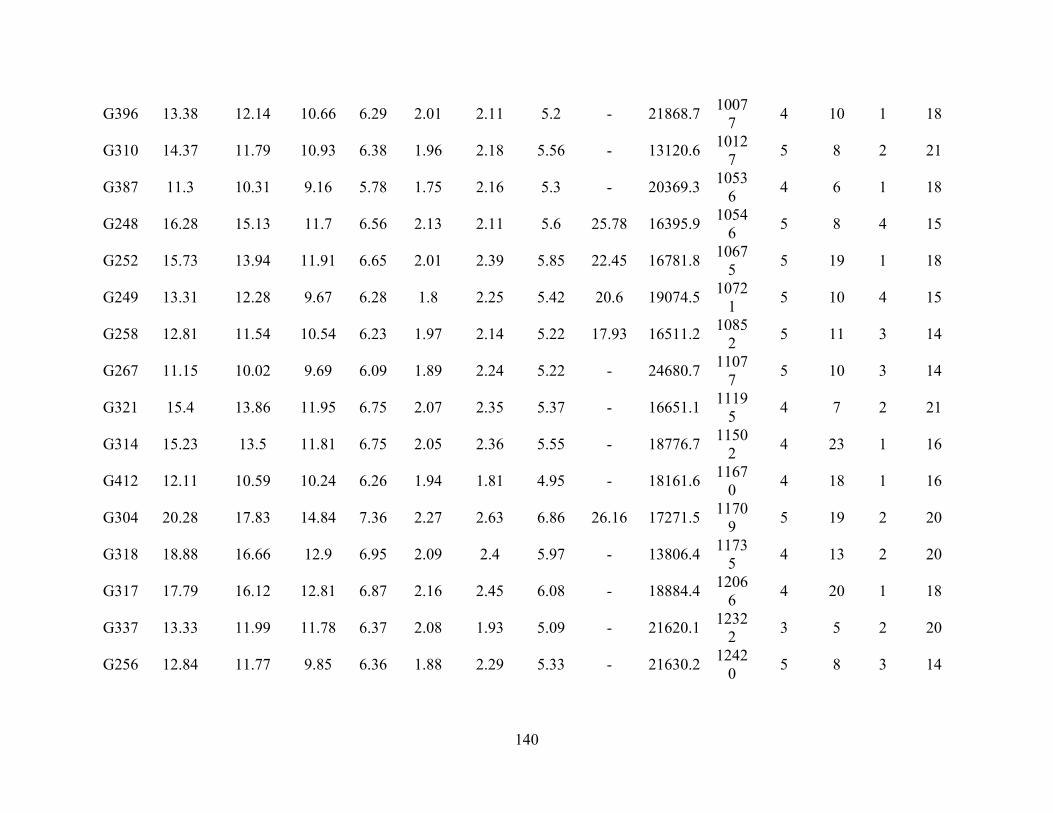
140
G396 13.38 12.14 10.66 6.29 2.01 2.11 5.2 - 21868.7 1007
7 4 10 1 18
G310 14.37 11.79 10.93 6.38 1.96 2.18 5.56 - 13120.6 1012
7 5 8 2 21
G387 11.3 10.31 9.16 5.78 1.75 2.16 5.3 - 20369.3 1053
6 4 6 1 18
G248 16.28 15.13 11.7 6.56 2.13 2.11 5.6 25.78 16395.9 1054
6 5 8 4 15
G252 15.73 13.94 11.91 6.65 2.01 2.39 5.85 22.45 16781.8 1067
5 5 19 1 18
G249 13.31 12.28 9.67 6.28 1.8 2.25 5.42 20.6 19074.5 1072
1 5 10 4 15
G258 12.81 11.54 10.54 6.23 1.97 2.14 5.22 17.93 16511.2 1085
2 5 11 3 14
G267 11.15 10.02 9.69 6.09 1.89 2.24 5.22 - 24680.7 1107
7 5 10 3 14
G321 15.4 13.86 11.95 6.75 2.07 2.35 5.37 - 16651.1 1119
5 4 7 2 21
G314 15.23 13.5 11.81 6.75 2.05 2.36 5.55 - 18776.7 1150
2 4 23 1 16
G412 12.11 10.59 10.24 6.26 1.94 1.81 4.95 - 18161.6 1167
0 4 18 1 16
G304 20.28 17.83 14.84 7.36 2.27 2.63 6.86 26.16 17271.5 1170
9 5 19 2 20
G318 18.88 16.66 12.9 6.95 2.09 2.4 5.97 - 13806.4 1173
5 4 13 2 20
G317 17.79 16.12 12.81 6.87 2.16 2.45 6.08 - 18884.4 1206
6 4 20 1 18
G337 13.33 11.99 11.78 6.37 2.08 1.93 5.09 - 21620.1 1232
2 3 5 2 20
G256 12.84 11.77 9.85 6.36 1.88 2.29 5.33 - 21630.2 1242
0 5 8 3 14

141
G380 12.56 11.15 11.18 6.52 2 2.46 5.47 - 28012.7 1250
2 5 14 1 18
G324 20.67 17.63 13.13 6.85 2.21 2.5 5.91 - 21772.7 1282
8 4 17 2 20
G291 17.26 14.92 13.06 6.76 2.14 2.34 5.9 - 52462.5 1301
3 3 14 2 20
G365 17.06 15.2 11.34 6.49 2.15 2.52 5.49 - 28923.4 1359
4 5 21 1 18
G399 15.32 13.58 11.84 6.57 2.07 2.32 5.5 - 24624.4 1380
2 4 20 1 18
G411 15.23 14.71 11.96 6.67 2.13 2.08 5.35 - 17229.1 1406
4 4 19 1 16
G370 11.97 10.77 10.88 6.27 2.03 2.11 5.18 - 18781.8 1412
6 5 18 1 16
G405 11.31 10.14 9.2 5.93 1.76 1.94 5.15 - 33874.5 1472
7 4 10 1 18
G334 15.75 14.26 12.22 6.74 2.15 2.21 5.57 - 18135.1 1497
1 3 4 2 20
G372 13.75 13.25 10.9 6.55 1.96 2.17 5.62 - 22569.8 1507
3 5 16 1 18
G299 20.1 16.67 13.64 7.21 2.16 2.48 6 - 21212.2 1565
0 3 17 2 20
G406 12.1 10.79 9.63 6 1.86 2.06 5.27 - 32096 1569
2 4 11 1 18
G342 15.05 13.39 10.71 6.3 1.97 2.37 5.48 - 24240.3 1598
5 4 17 1 16
G319 22.28 19.27 14.76 7.51 2.28 2.5 6.14 - 19725.2 1670
4 4 5 2 20
G384 16.61 14.7 11.76 6.68 2.01 2.41 5.76 - 24584.6 1717
9 4 2 1 16
G262 16.08 13.68 11.6 6.62 2.04 2.4 5.75 - 25984.3 1729
0 5 19 1 18

142
G409 18.2 16.96 13.78 7.06 2.25 2.5 5.66 - 29481.5 1738
6 4 18 1 18
G295 17.76 15.72 13.41 6.93 2.2 2.51 5.83 27.33 31798.2 1800
0 3 11 2 20
G346 13.45 12.36 10.89 6.24 1.95 2.11 5.32 - 29751 1822
2 4 21 1 18
G385 20.12 18.14 14.79 7.43 2.34 2.58 6.37 - 26066.5 1843
1 4 1 1 18
G390 15.2 13.61 11.5 6.51 2.04 2.26 5.46 - 31295.1 1924
6 4 18 1 16
G357 16.18 14.68 12.07 6.77 2.09 2.44 5.5 - 23038.2 1985
7 5 18 1 16
G345 18.56 16.96 12.92 7.16 2.09 2.41 5.98 - 27914.1 2018
6 4 22 1 16
G393 14.69 13.12 10.6 6.29 2.01 2.28 5.63 - 31962 2276
8 4 11 1 18
G286 18.76 16.67 13.45 7.2 2.19 2.51 5.86 - 30457.7 2434
3 3 4 2 20
G297 21.2 18.28 13.68 7.07 2.26 2.52 6.11 - 37807.4 2608
1 3 16 2 20
G311 18.15 15.68 12.86 6.67 2.16 2.73 6.02 - 34651.8 2815
8 5 4 2 21
G320 20.71 17.27 13.32 7.02 2.18 2.35 6.13 - 37560.7 3058
3 4 6 2 20

143
Appendix 2.2 Plots showing all 124 specimens relating morphological features to the distance
flown (m), as measured on 22‐h computer‐linked flight mill bioassays.

144
Appendix 3.1 Table containing the results of the differential expression analysis, including Genbank accession #, scaffold, mean
number of reads, log2 fold change, adjusted p-value, and annotation.
Accession Scaffold baseMean log2Fold Change
B-H adjusted p-value Gene Annotation
XM_019901506.1 NW_017844745.1 535.1 0.37 0.007 melanization protease 1-like
XM_019897720.1 NW_017851231.1 449.6 0.86 0.000 DNA mismatch repair protein Msh2-like
XM_019897721.1 NW_017851231.1 934.4 0.29 0.005 leucine--tRNA ligase%2C cytoplasmic
XR_002171432.1 NW_017851232.1 25.1 -0.97 0.001 uncharacterized LOC109532710
XR_002171435.1 NW_017851236.1 153.0 0.93 0.006 uncharacterized LOC109532713
XM_019897734.1 NW_017851239.1 1789.4 -0.99 0.001 uncharacterized LOC109532725
XM_019897741.1 NW_017851239.1 1052.1 0.53 0.009 metaxin-2-like
XM_019897749.1 NW_017846330.1 972.8 -0.86 0.000 REST corepressor 2-like
XM_019897755.1 NW_017851239.1 1452.1 0.52 0.001 protein prune homolog 2
XM_019897760.1 NW_017851239.1 6744.2 -0.52 0.002 phosphatidylinositol 4-phosphate 5-kinase type-1 alpha%2C transcript variant X1
XM_019897778.1 NW_017851239.1 870.0 0.61 0.000 poly(A) RNA polymerase%2C mitochondrial
XM_019897779.1 NW_017851239.1 4859.2 0.41 0.005 thioredoxin-like protein 1
XM_019897781.1 NW_017851239.1 4161.8 -0.38 0.009 myb-related protein B%2C transcript variant X1
XM_019897788.1 NW_017851239.1 3800.5 1.91 0.000 senecionine N-oxygenase-like%2C transcript variant X1
XM_019897792.1 NW_017851239.1 193.8 1.43 0.000 uracil-DNA glycosylase-like
XM_019897797.1 NW_017851239.1 1705.8 0.74 0.002 uncharacterized LOC109532756
XM_019897816.1 NW_017851241.1 2851.2 -0.32 0.008 phosphatidylinositol 4-kinase beta
XM_019897824.1 NW_017851241.1 137.8 -1.45 0.001 homeotic protein proboscipedia-like%2C transcript variant X1
XM_019897828.1 NW_017851242.1 2150.0 -0.45 0.000 probable ATP-dependent RNA helicase DDX56
XM_019897848.1 NW_017851256.1 10612.6 -0.53 0.008 microtubule-associated serine/threonine-protein kinase 3%2C transcript variant X1
XM_019897867.1 NW_017851256.1 155.1 -0.61 0.009 gamma-1-syntrophin
XM_019897872.1 NW_017851260.1 1441.6 0.27 0.001 uncharacterized LOC109532808
XM_019897904.1 NW_017845006.1 1677.9 0.60 0.000 acylglycerol kinase%2C mitochondrial
XM_019897882.1 NW_017846400.1 1004.0 -0.69 0.002 ATP-sensitive inward rectifier potassium channel 11-like
XM_019897880.1 NW_017851268.1 1990.2 -0.52 0.000 ras-related protein Rab-39B-like
XM_019897898.1 NW_017851276.1 320.3 1.54 0.000 probable beta-hexosaminidase fdl
XM_019897909.1 NW_017851281.1 5221.5 -0.64 0.000 WD repeat and FYVE domain-containing protein 3

145
XM_019897932.1 NW_017851282.1 5615.4 0.29 0.004 small glutamine-rich tetratricopeptide repeat-containing protein beta-like%2C transcript variant X1
XM_019897937.1 NW_017846420.1 1257.2 -0.67 0.003 uncharacterized LOC109532859
XM_019897947.1 NW_017851282.1 1558.8 -0.26 0.002 guanylate kinase-like
XM_019897951.1 NW_017851282.1 744.2 -0.35 0.001 putative Dol-P-Glc:Glc(2)Man(9)GlcNAc(2)-PP-Dol alpha-1%2C2-glucosyltransferase
XM_019897952.1 NW_017851282.1 3631.2 -0.23 0.002 protein MON2 homolog
XM_019897953.1 NW_017851282.1 8584.4 -0.56 0.000 rho GTPase-activating protein 28-like%2C transcript variant X1
XM_019897963.1 NW_017851282.1 9892.2 0.71 0.000 epidermal growth factor receptor kinase substrate 8-like protein 2%2C transcript variant X1
XM_019897977.1 NW_017851282.1 11920.7 1.00 0.000 uncharacterized LOC109532875%2C transcript variant X1
XM_019898011.1 NW_017851282.1 1708.6 0.50 0.000 putative tyrosine-protein kinase Wsck%2C transcript variant X1
XM_019898016.1 NW_017846438.1 239.9 0.99 0.000 insulin receptor-like
XM_019898017.1 NW_017851282.1 3592.8 0.54 0.002 5'-nucleotidase domain-containing protein 3%2C transcript variant X1
XM_019898021.1 NW_017851282.1 4921.2 -0.47 0.007 chromodomain-helicase-DNA-binding protein 1%2C transcript variant X1
XM_019898023.1 NW_017851282.1 6762.2 -0.68 0.000 SHC-transforming protein 4%2C transcript variant X1
XM_019898035.1 NW_017851282.1 1079.4 0.47 0.006 neurofibromin%2C transcript variant X1
XM_019898044.1 NW_017851282.1 2610.2 -0.29 0.003 uncharacterized LOC109532906
XM_019898051.1 NW_017851282.1 7889.7 -0.84 0.005 tyrosine-protein kinase shark%2C transcript variant X1
XM_019898056.1 NW_017851282.1 1152.6 0.40 0.000 DNA repair protein complementing XP-A cells homolog
XM_019898066.1 NW_017851282.1 320.5 0.68 0.002 exonuclease 1
XM_019898073.1 NW_017846446.1 1331.7 0.38 0.000 uncharacterized LOC109532926
XM_019898084.1 NW_017851282.1 195.4 -0.76 0.002 tyrosine-protein kinase RYK-like%2C transcript variant X1
XM_019898096.1 NW_017851282.1 475.9 -0.58 0.000 RNA pseudouridylate synthase domain-containing protein 1-like
XM_019898098.1 NW_017851282.1 7496.8 1.09 0.000 prion-like-(Q/N-rich) domain-bearing protein 25%2C transcript variant X1
XM_019898113.1 NW_017851283.1 3602.2 1.38 0.000 alanine--glyoxylate aminotransferase 2-like
XM_019898114.1 NW_017851287.1 127.9 -0.85 0.000 kinesin-like protein CG14535
XM_019898118.1 NW_017851291.1 2811.1 -0.31 0.007 cyclin-K-like
XM_019898129.1 NW_017851291.1 1209.6 -0.85 0.006 monocarboxylate transporter 7-like%2C transcript variant X1
XM_019898138.1 NW_017851300.1 776.7 0.24 0.005 zinc finger protein 287-like%2C transcript variant X1
XR_002171474.1 NW_017851300.1 199.6 -0.63 0.007 uncharacterized LOC109532980
XM_019898151.1 NW_017851313.1 3370.9 -0.50 0.000 ikaros family zinc finger protein%2C transcript variant X1
XR_002171476.1 NW_017851315.1 1010.2 -0.89 0.000 uncharacterized LOC109532994
XM_019898188.1 NW_017851322.1 770.3 -0.80 0.001 platelet-derived growth factor receptor alpha-like
XM_019898189.1 NW_017851322.1 2771.1 -0.77 0.002 vascular endothelial growth factor receptor kdr-like

146
XM_019898191.1 NW_017851322.1 3906.0 -0.98 0.000 ATP-binding cassette sub-family G member 1-like%2C transcript variant X1
XM_019898194.1 NW_017851323.1 718.5 0.47 0.002 probable DNA-directed RNA polymerases I and III subunit RPAC2
XM_019898202.1 NW_017851323.1 1890.6 1.11 0.000 45 kDa calcium-binding protein%2C transcript variant X1
XM_019898213.1 NW_017851326.1 6.4 1.37 0.000 keratin%2C type II cytoskeletal 1-like
XR_002171477.1 NW_017846491.1 177.0 -0.55 0.002 uncharacterized LOC109533025%2C transcript variant X1
XM_019898225.1 NW_017851351.1 729.4 -0.74 0.000 zinc finger SWIM domain-containing protein 8-like
XM_019898226.1 NW_017851351.1 632.3 -0.71 0.000 zinc finger SWIM domain-containing protein 8-like
XR_002171480.1 NW_017851351.1 155.9 -0.67 0.002 uncharacterized LOC109533040
XM_019898234.1 NW_017851365.1 21.4 -0.87 0.005 uncharacterized LOC109533048%2C transcript variant X1
XR_002171482.1 NW_017851368.1 533.7 -2.04 0.000 uncharacterized LOC109533050
XM_019898241.1 NW_017851370.1 764.8 -0.58 0.003 uncharacterized LOC109533051
XM_019898245.1 NW_017851375.1 742.0 0.57 0.002 uncharacterized protein C7orf50 homolog
XM_019898252.1 NW_017851379.1 829.8 0.37 0.000 TATA-box-binding protein
XM_019898320.1 NW_017851382.1 662.7 0.52 0.005 uncharacterized LOC109533090
XM_019898321.1 NW_017851382.1 498.4 0.96 0.000 uncharacterized LOC109533091%2C transcript variant X1
XR_002171484.1 NW_017851388.1 543.0 0.25 0.003 uncharacterized LOC109533097
XM_019898338.1 NW_017846528.1 2032.0 -0.38 0.000 uncharacterized LOC109533104%2C transcript variant X1
XR_002171486.1 NW_017851395.1 121.6 -0.75 0.007 uncharacterized LOC109533105
XM_019898353.1 NW_017851403.1 640.8 0.40 0.000 cell division cycle protein 23 homolog
XM_019898358.1 NW_017846528.1 1041.7 -0.64 0.000 DNA mismatch repair protein Mlh1-like%2C transcript variant X1
XM_019898356.1 NW_017851403.1 10041.2 -0.31 0.005 repressor of RNA polymerase III transcription MAF1 homolog
XM_019898375.1 NW_017851403.1 1003.7 0.60 0.000 condensin complex subunit 1
XM_019898377.1 NW_017851403.1 1455.7 0.40 0.000 RNA-binding protein 45
XM_019898395.1 NW_017851403.1 1059.3 0.56 0.001 uncharacterized LOC109533145%2C transcript variant X1
XM_019898408.1 NW_017851407.1 141.9 0.92 0.000 carboxy-terminal kinesin 2-like
XM_019898410.1 NW_017851410.1 7595.1 -0.79 0.000 protein FAM46C
XM_019898415.1 NW_017851411.1 1620.7 -0.50 0.009 SCY1-like protein 2
XM_019898418.1 NW_017851413.1 2462.1 -0.85 0.000 acyl-CoA:lysophosphatidylglycerol acyltransferase 1-like
XR_002171495.1 NW_017851413.1 348.0 -1.02 0.000 uncharacterized LOC109533169
XM_019898423.1 NW_017851422.1 981.0 0.53 0.002 protein lethal(2)denticleless-like
XM_019898427.1 NW_017851424.1 8815.1 -1.23 0.000 melanization protease 1-like
XM_019898432.1 NW_017846541.1 75.0 -0.77 0.000 rap guanine nucleotide exchange factor 4-like
XM_019898436.1 NW_017851434.1 310.6 0.95 0.000 bombesin receptor subtype-3-like
XM_019898437.1 NW_017851434.1 1369.1 1.12 0.000 endothelin-converting enzyme 1-like
XM_019898438.1 NW_017851435.1 61.8 0.85 0.004 helix-loop-helix protein delilah-like

147
XM_019898453.1 NW_017851439.1 3512.3 0.22 0.006 ubiquitin carboxyl-terminal hydrolase 5
XM_019898463.1 NW_017851439.1 9671.1 -0.65 0.000 heterogeneous nuclear ribonucleoprotein U-like protein 2
XM_019898468.1 NW_017851439.1 810.8 -0.95 0.000 uncharacterized LOC109533208%2C transcript variant X1
XM_019898479.1 NW_017851439.1 39.9 -1.10 0.001 cytosol aminopeptidase-like
NW_017851442.1_c3724-1145 NW_017851442.1 6172.3 1.40 0.001 #N/A
XM_019898489.1 NW_017851445.1 2608.4 -0.42 0.000 vacuolar protein sorting-associated protein 18 homolog%2C transcript variant X1
XM_019898493.1 NW_017851445.1 777.9 0.35 0.009 translation initiation factor eIF-2B subunit epsilon%2C transcript variant X1
XM_019898502.1 NW_017851452.1 1842.5 -0.33 0.001 negative elongation factor D%2C transcript variant X1
XM_019898506.1 NW_017851452.1 917.6 0.49 0.000 mediator of RNA polymerase II transcription subunit 22
XM_019898509.1 NW_017851452.1 376.6 0.41 0.000 protein UXT homolog%2C transcript variant X1
XM_019898511.1 NW_017851452.1 923.8 -1.04 0.001 toll-like receptor 7
XM_019898542.1 NW_017851453.1 177.9 -1.68 0.000 uncharacterized LOC109533259
XM_019898544.1 NW_017851453.1 908.4 -0.85 0.001 uncharacterized LOC109533262%2C transcript variant X1
XM_019898547.1 NW_017851453.1 939.9 0.32 0.002 uncharacterized LOC109533264
XM_019898552.1 NW_017851453.1 157.3 0.79 0.004 cytochrome P450 4g15-like
XM_019898553.1 NW_017851453.1 876.3 -0.68 0.001 zinc finger protein Elbow
XM_019898558.1 NW_017851465.1 38081.7 1.89 0.000 cytochrome P450 6A1-like
XM_019898560.1 NW_017851465.1 7664.5 1.71 0.000 cytochrome P450 6a2-like
XM_019898565.1 NW_017851470.1 1152.7 1.35 0.000 mitochondrial ornithine transporter 1%2C transcript variant X1
XM_019898568.1 NW_017851470.1 374.4 0.81 0.000 THAP domain-containing protein 2-like%2C transcript variant X1
XM_019898581.1 NW_017846595.1 158.9 -0.85 0.005 piggyBac transposable element-derived protein 3-like
XR_002171509.1 NW_017851481.1 8404.9 0.85 0.003 aldose reductase-like
XM_019898613.1 NW_017851488.1 557.0 0.41 0.008 transforming growth factor beta regulator 1-like
XM_019898615.1 NW_017851488.1 1039.0 0.20 0.009 actin-related protein 10-like
XM_019898619.1 NW_017851489.1 8013.2 -1.19 0.000 uncharacterized LOC109533325
XM_019898630.1 NW_017851504.1 951.5 0.63 0.002 RNA-binding protein MEX3B-like
XM_019898631.1 NW_017851505.1 6571.5 -0.48 0.000 serine/threonine-protein kinase 10-like
XM_019898632.1 NW_017851505.1 2559.3 0.57 0.000 ecdysone 20-monooxygenase%2C transcript variant X1
XM_019898650.1 NW_017851509.1 7236.0 0.89 0.001 uncharacterized LOC109533356
XM_019898666.1 NW_017851513.1 1889.6 -1.54 0.000 kielin/chordin-like protein
XM_019898685.1 NW_017851515.1 417.7 -0.64 0.007 1-phosphatidylinositol 4%2C5-bisphosphate phosphodiesterase classes I and II-like
XM_019898689.1 NW_017851515.1 5198.3 -1.22 0.000 nose resistant to fluoxetine protein 6-like%2C transcript variant X1
XM_019898694.1 NW_017851515.1 5627.7 -1.17 0.000 nose resistant to fluoxetine protein 6-like
XM_019898697.1 NW_017851516.1 3482.0 -0.22 0.007 glycogen synthase kinase-3 beta-like

148
XM_019898703.1 NW_017851520.1 970.7 -0.58 0.007 B-cell lymphoma/leukemia 11A
XM_019898705.1 NW_017851522.1 40066.2 -1.50 0.000 ATP-binding cassette sub-family G member 4-like
XM_019898706.1 NW_017851523.1 24765.2 1.40 0.001 uncharacterized LOC109533401
XM_019898720.1 NW_017851525.1 1274.7 0.47 0.000 39S ribosomal protein L22%2C mitochondrial
NW_017846633.1_2849-3465 NW_017846633.1 299.1 0.97 0.000 #N/A
XM_019898727.1 NW_017851531.1 572.3 0.75 0.003 anillin%2C transcript variant X1
XM_019898730.1 NW_017851531.1 6012.3 -1.52 0.000 calcium/calmodulin-dependent protein kinase kinase 1%2C transcript variant X1
XM_019898733.1 NW_017851531.1 1800.4 0.48 0.001 uncharacterized LOC109533418
XM_019898735.1 NW_017851531.1 11779.9 0.96 0.001 protein I'm not dead yet%2C transcript variant X1
XM_019898741.1 NW_017851531.1 1479.3 0.67 0.001 disks large-associated protein 5%2C transcript variant X1
XM_019898747.1 NW_017851531.1 842.4 0.55 0.000 mitochondrial import inner membrane translocase subunit Tim22
XM_019898758.1 NW_017846640.1 2471.4 -1.01 0.001 L-lactate dehydrogenase-like
XM_019898760.1 NW_017851538.1 27493.5 -0.48 0.005 AN1-type zinc finger protein 6%2C transcript variant X1
XM_019898780.1 NW_017851546.1 4240.0 -1.20 0.000 uncharacterized LOC109533453
XM_019898786.1 NW_017851551.1 372.6 -0.53 0.000 myotubularin-related protein 13-like
XM_019898787.1 NW_017851551.1 90.8 -0.49 0.008 myotubularin-related protein 13-like
XM_019898807.1 NW_017851552.1 1917.0 -1.00 0.001 probable multidrug resistance-associated protein lethal(2)03659
XM_019898808.1 NW_017851552.1 196.5 0.98 0.008 soluble guanylate cyclase 89Db-like
XM_019898811.1 NW_017851554.1 2665.3 1.05 0.000 chorion peroxidase
XM_019898840.1 NW_017851564.1 283.7 -1.41 0.000 uncharacterized LOC109533501
XM_019898842.1 NW_017851565.1 166.1 1.38 0.001 uncharacterized LOC109533505%2C transcript variant X1
XR_002171531.1 NW_017851565.1 34.5 1.38 0.004 uncharacterized LOC109533508
XM_019898846.1 NW_017851569.1 40305.1 1.28 0.001 pectinesterase B-like
XM_019898853.1 NW_017851570.1 3614.0 -1.81 0.000 hemicentin-2-like
XM_019898861.1 NW_017851577.1 3018.2 0.35 0.005 caprin homolog%2C transcript variant X1
XM_019898868.1 NW_017851577.1 1491.1 -0.61 0.002 protein shuttle craft-like
XM_019898875.1 NW_017851578.1 105.3 0.79 0.009 uncharacterized LOC109533536%2C transcript variant X1
XM_019898879.1 NW_017851583.1 544.0 0.77 0.004 uncharacterized LOC109533542
XM_019898885.1 NW_017851587.1 1065.1 1.00 0.000 E3 ubiquitin-protein ligase SINAT2-like%2C transcript variant X1
XM_019898897.1 NW_017851590.1 1945.3 0.90 0.001 mitochondrial amidoxime reducing component 2-like%2C transcript variant X1
XM_019898910.1 NW_017851598.1 2029.5 -0.61 0.004 uncharacterized LOC109533567
XM_019898912.1 NW_017851599.1 2018.4 -0.34 0.002 tyrosine-protein kinase PR2%2C transcript variant X1
XM_019898920.1 NW_017851599.1 1163.3 0.81 0.000 39S ribosomal protein L20%2C mitochondrial
XM_019898925.1 NW_017851601.1 906.9 -0.94 0.000 DNA-binding protein D-ETS-4%2C transcript variant X1

149
XM_019898928.1 NW_017851601.1 2173.3 -0.54 0.001 tumor necrosis factor receptor superfamily member wengen-like%2C transcript variant X1
XM_019898936.1 NW_017851601.1 1262.9 0.41 0.006 mitochondrial import inner membrane translocase subunit TIM44
XM_019898945.1 NW_017851604.1 56.1 -0.74 0.008 uncharacterized LOC109533590
XM_019898950.1 NW_017851605.1 113.2 -0.64 0.001 serum response factor homolog
XM_019898952.1 NW_017851611.1 416.2 -0.36 0.007 tetratricopeptide repeat protein 5-like
XM_019898956.1 NW_017851612.1 76.2 -0.80 0.000 rap guanine nucleotide exchange factor 4-like
XM_019898962.1 NW_017851612.1 2763.4 -0.37 0.003 multidrug resistance-associated protein 1%2C transcript variant X1
XM_019898967.1 NW_017851612.1 14259.5 -2.05 0.000 facilitated trehalose transporter Tret1-like%2C transcript variant X1
XM_019898970.1 NW_017851612.1 14.4 -1.50 0.001 uncharacterized LOC109533612
XM_019898982.1 NW_017851612.1 2880.7 -0.38 0.000 superkiller viralicidic activity 2-like 2
XM_019898995.1 NW_017851612.1 709.1 0.91 0.002 ankyrin-3-like
XM_019898996.1 NW_017851612.1 582.8 1.02 0.000 putative ankyrin repeat protein RF_0381
XM_019898999.1 NW_017851612.1 5225.8 0.47 0.000 troponin C-like
XM_019899002.1 NW_017851612.1 80.2 -1.26 0.002 cuticle protein 18.7-like
XM_019899013.1 NW_017851617.1 1152.2 -0.81 0.000 REST corepressor 3-like
XM_019899020.1 NW_017851618.1 4541.3 0.99 0.003 glutathione S-transferase-like%2C transcript variant X1
XM_019899033.1 NW_017851618.1 45.4 1.11 0.002 venom carboxylesterase-6-like
XM_019899035.1 NW_017851619.1 1042.2 0.78 0.000 uncharacterized LOC109533654
XM_019899036.1 NW_017851619.1 796.0 0.25 0.006 DNA-directed RNA polymerase III subunit RPC2-like
XM_019899042.1 NW_017851628.1 30059.8 0.88 0.005 phosphoenolpyruvate carboxykinase [GTP]-like
XM_019899063.1 NW_017851632.1 645.8 -0.41 0.000 threonine aspartase 1
XM_019899064.1 NW_017851632.1 182.7 0.69 0.000 uncharacterized LOC109533687
XM_019899066.1 NW_017851632.1 1117.6 0.65 0.000 histone-lysine N-methyltransferase NSD2
XM_019899073.1 NW_017851633.1 35936.2 0.96 0.002 bifunctional purine biosynthesis protein PURH%2C transcript variant X1
XM_019899085.1 NW_017851633.1 7437.4 -0.48 0.010 protein diaphanous
XM_019899086.1 NW_017851633.1 1789.8 0.84 0.000 uncharacterized LOC109533701%2C transcript variant X1
XM_019899095.1 NW_017851633.1 39.0 -1.01 0.003 estrogen sulfotransferase-like
XM_019899101.1 NW_017851633.1 16931.3 0.85 0.002 uncharacterized LOC109533709%2C transcript variant X1
XM_019899117.1 NW_017851637.1 916.3 0.56 0.002 apoptosis-stimulating of p53 protein 2-like
XM_019899118.1 NW_017851637.1 2078.0 0.49 0.000 vacuolar ATPase assembly integral membrane protein VMA21 homolog
XM_019899120.1 NW_017851638.1 247.3 -1.04 0.000 muscarinic acetylcholine receptor DM1%2C transcript variant X1
XM_019899123.1 NW_017851640.1 2737.3 -0.29 0.000 gastrula zinc finger protein XlCGF57.1-like
XM_019899130.1 NW_017851640.1 1001.7 0.74 0.000 kinesin-like protein KIF11-B
XM_019899143.1 NW_017851644.1 829.1 0.50 0.007 putative glutathione-specific gamma-glutamylcyclotransferase 2

150
XM_019899155.1 NW_017851647.1 5088.3 -0.47 0.001 myosin-VIIa%2C transcript variant X1
XM_019899163.1 NW_017851647.1 2030.6 -0.38 0.000 uncharacterized LOC109533758%2C transcript variant X1
XM_019899165.1 NW_017851647.1 1041.5 -0.64 0.000 DNA mismatch repair protein Mlh1-like%2C transcript variant X1
XM_019899169.1 NW_017846795.1 350.9 -1.04 0.000 protein dachsous-like
XM_019899182.1 NW_017851649.1 796.2 1.00 0.000 uncharacterized LOC109533777
XM_019899188.1 NW_017846800.1 17.7 -0.86 0.005 gamma-aminobutyric acid receptor subunit beta-like
XM_019899191.1 NW_017851651.1 82.5 -1.35 0.000 zinc finger protein 423 homolog
XM_019899194.1 NW_017851651.1 14648.2 -0.52 0.000 plasma membrane calcium-transporting ATPase 1%2C transcript variant X1
XM_019899207.1 NW_017851651.1 17035.0 -0.39 0.003 E3 ubiquitin-protein ligase HUWE1%2C transcript variant X1
XM_019899212.1 NW_017851651.1 3588.4 -0.37 0.007 latrophilin Cirl%2C transcript variant X1
XM_019899222.1 NW_017851651.1 4873.4 -0.29 0.003 uncharacterized LOC109533799%2C transcript variant X1
XM_019899225.1 NW_017851651.1 702.2 0.80 0.000 heat shock 70 kDa protein-like%2C transcript variant X1
XM_019899241.1 NW_017851651.1 3107.4 0.45 0.002 uroporphyrinogen decarboxylase
XM_019899246.1 NW_017851651.1 4308.9 -0.95 0.000 leucine-rich repeats and immunoglobulin-like domains protein 3
XM_019899247.1 NW_017851651.1 5500.8 0.55 0.008 glucose-6-phosphate 1-dehydrogenase%2C transcript variant X1
XM_019899282.1 NW_017851651.1 35813.6 1.03 0.000 SEC23-interacting protein%2C transcript variant X1
XM_019899286.1 NW_017851651.1 7801.1 -0.99 0.010 uncharacterized LOC109533822
XM_019899299.1 NW_017851651.1 6426.5 1.82 0.000 pancreatic triacylglycerol lipase-like
XM_019899310.1 NW_017846821.1 1198.6 -1.23 0.000 G-protein coupled receptor moody-like
XM_019899316.1 NW_017851651.1 18069.9 0.79 0.000 cytokine receptor%2C transcript variant X1
XM_019899321.1 NW_017851651.1 2334.6 -0.57 0.001 uncharacterized LOC109533839
XM_019899330.1 NW_017851651.1 52.0 -0.85 0.007 protein tyrosine phosphatase domain-containing protein 1-like
XM_019899335.1 NW_017846824.1 5786.8 -1.43 0.000 uncharacterized LOC109533846%2C transcript variant X1
XM_019899333.1 NW_017851651.1 2125.1 0.29 0.008 5'-nucleotidase domain-containing protein 1
XM_019899346.1 NW_017851651.1 3793.0 -0.32 0.000 potential E3 ubiquitin-protein ligase ariadne-1-like
XM_019899377.1 NW_017851651.1 1358.0 1.18 0.002 lipoprotein lipase-like
XM_019899378.1 NW_017851651.1 403.0 -0.60 0.003 protein trachealess%2C transcript variant X1
XM_019899382.1 NW_017851651.1 1071.2 0.51 0.002 putative GTP-binding protein 6%2C transcript variant X1
XM_019899385.1 NW_017851651.1 9580.3 1.09 0.003 transmembrane protein 205
XM_019899393.1 NW_017851651.1 4000.8 0.52 0.001 cytochrome c oxidase subunit 5A%2C mitochondrial-like
XM_019899394.1 NW_017851651.1 1583.2 -0.58 0.002 uncharacterized LOC109533886
XM_019899395.1 NW_017851651.1 585.3 0.48 0.007 mono [ADP-ribose] polymerase PARP16-like%2C transcript variant X1
XM_019899407.1 NW_017851651.1 362.6 0.89 0.000 M-phase inducer phosphatase-like%2C transcript variant X1
XM_019899415.1 NW_017851654.1 2857.3 0.43 0.001 glucosamine-6-phosphate isomerase-like
XM_019899427.1 NW_017851655.1 549.5 0.80 0.003 gamma-interferon-inducible-lysosomal thiol reductase-like
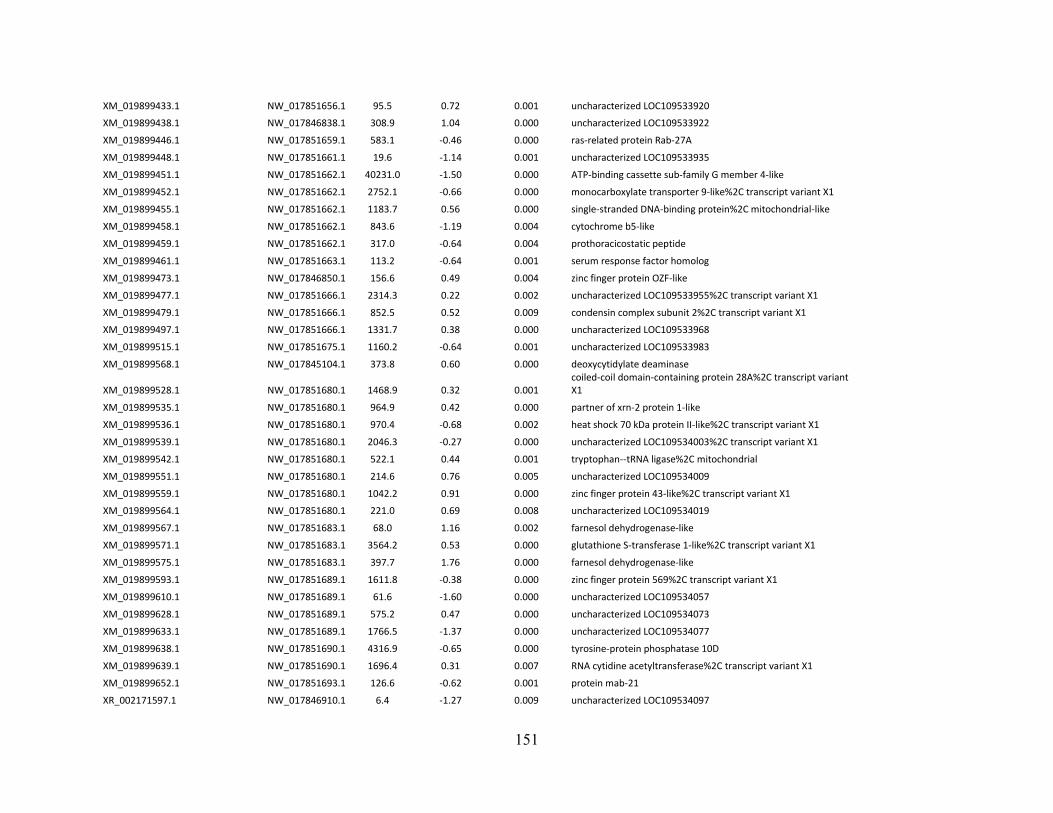
151
XM_019899433.1 NW_017851656.1 95.5 0.72 0.001 uncharacterized LOC109533920
XM_019899438.1 NW_017846838.1 308.9 1.04 0.000 uncharacterized LOC109533922
XM_019899446.1 NW_017851659.1 583.1 -0.46 0.000 ras-related protein Rab-27A
XM_019899448.1 NW_017851661.1 19.6 -1.14 0.001 uncharacterized LOC109533935
XM_019899451.1 NW_017851662.1 40231.0 -1.50 0.000 ATP-binding cassette sub-family G member 4-like
XM_019899452.1 NW_017851662.1 2752.1 -0.66 0.000 monocarboxylate transporter 9-like%2C transcript variant X1
XM_019899455.1 NW_017851662.1 1183.7 0.56 0.000 single-stranded DNA-binding protein%2C mitochondrial-like
XM_019899458.1 NW_017851662.1 843.6 -1.19 0.004 cytochrome b5-like
XM_019899459.1 NW_017851662.1 317.0 -0.64 0.004 prothoracicostatic peptide
XM_019899461.1 NW_017851663.1 113.2 -0.64 0.001 serum response factor homolog
XM_019899473.1 NW_017846850.1 156.6 0.49 0.004 zinc finger protein OZF-like
XM_019899477.1 NW_017851666.1 2314.3 0.22 0.002 uncharacterized LOC109533955%2C transcript variant X1
XM_019899479.1 NW_017851666.1 852.5 0.52 0.009 condensin complex subunit 2%2C transcript variant X1
XM_019899497.1 NW_017851666.1 1331.7 0.38 0.000 uncharacterized LOC109533968
XM_019899515.1 NW_017851675.1 1160.2 -0.64 0.001 uncharacterized LOC109533983
XM_019899568.1 NW_017845104.1 373.8 0.60 0.000 deoxycytidylate deaminase
XM_019899528.1 NW_017851680.1 1468.9 0.32 0.001 coiled-coil domain-containing protein 28A%2C transcript variant X1
XM_019899535.1 NW_017851680.1 964.9 0.42 0.000 partner of xrn-2 protein 1-like
XM_019899536.1 NW_017851680.1 970.4 -0.68 0.002 heat shock 70 kDa protein II-like%2C transcript variant X1
XM_019899539.1 NW_017851680.1 2046.3 -0.27 0.000 uncharacterized LOC109534003%2C transcript variant X1
XM_019899542.1 NW_017851680.1 522.1 0.44 0.001 tryptophan--tRNA ligase%2C mitochondrial
XM_019899551.1 NW_017851680.1 214.6 0.76 0.005 uncharacterized LOC109534009
XM_019899559.1 NW_017851680.1 1042.2 0.91 0.000 zinc finger protein 43-like%2C transcript variant X1
XM_019899564.1 NW_017851680.1 221.0 0.69 0.008 uncharacterized LOC109534019
XM_019899567.1 NW_017851683.1 68.0 1.16 0.002 farnesol dehydrogenase-like
XM_019899571.1 NW_017851683.1 3564.2 0.53 0.000 glutathione S-transferase 1-like%2C transcript variant X1
XM_019899575.1 NW_017851683.1 397.7 1.76 0.000 farnesol dehydrogenase-like
XM_019899593.1 NW_017851689.1 1611.8 -0.38 0.000 zinc finger protein 569%2C transcript variant X1
XM_019899610.1 NW_017851689.1 61.6 -1.60 0.000 uncharacterized LOC109534057
XM_019899628.1 NW_017851689.1 575.2 0.47 0.000 uncharacterized LOC109534073
XM_019899633.1 NW_017851689.1 1766.5 -1.37 0.000 uncharacterized LOC109534077
XM_019899638.1 NW_017851690.1 4316.9 -0.65 0.000 tyrosine-protein phosphatase 10D
XM_019899639.1 NW_017851690.1 1696.4 0.31 0.007 RNA cytidine acetyltransferase%2C transcript variant X1
XM_019899652.1 NW_017851693.1 126.6 -0.62 0.001 protein mab-21
XR_002171597.1 NW_017846910.1 6.4 -1.27 0.009 uncharacterized LOC109534097

152
XM_019899663.1 NW_017851694.1 1326.4 0.60 0.000 39S ribosomal protein L37%2C mitochondrial
XM_019899664.1 NW_017851694.1 185.4 -0.66 0.000 two pore potassium channel protein sup-9%2C transcript variant X1
XM_019899668.1 NW_017851694.1 2823.4 0.63 0.007 isopentenyl-diphosphate Delta-isomerase 1
XM_019899670.1 NW_017851694.1 7782.3 -0.41 0.000 ran-binding protein 9
XM_019899671.1 NW_017851694.1 3553.2 0.21 0.007 28S ribosomal protein S5%2C mitochondrial
XM_019899677.1 NW_017851694.1 4904.2 0.40 0.000 transient receptor potential cation channel trpm%2C transcript variant X1
XM_019899689.1 NW_017851694.1 981.9 0.24 0.007 WD repeat-containing protein 20
XM_019899698.1 NW_017851694.1 1366.5 0.39 0.008 retinol dehydrogenase 12-like%2C transcript variant X1
XM_019899706.1 NW_017851694.1 1083.4 0.39 0.001 39S ribosomal protein L39%2C mitochondrial
XM_019899742.1 NW_017851697.1 139.8 1.13 0.000 UDP-glucuronosyltransferase 2B15-like
XM_019899743.1 NW_017851699.1 1089.7 1.10 0.000 angiotensin-converting enzyme-like
XM_019899744.1 NW_017851699.1 763.2 1.08 0.000 angiotensin-converting enzyme-like
XM_019899749.1 NW_017846929.1 1638.2 -0.67 0.000 activating transcription factor 3-like
XM_019899763.1 NW_017851702.1 12058.3 1.05 0.000 uncharacterized LOC109534191
XM_019899772.1 NW_017851704.1 5617.0 0.27 0.001 CDGSH iron-sulfur domain-containing protein 2 homolog
XM_019899773.1 NW_017851704.1 2192.9 0.70 0.003 major facilitator superfamily domain-containing protein 9-like%2C transcript variant X1
XM_019899775.1 NW_017851704.1 457.8 0.55 0.002 protein PET100 homolog%2C mitochondrial
XM_019899779.1 NW_017851704.1 3951.2 -0.51 0.000 PH and SEC7 domain-containing protein 1%2C transcript variant X1
XR_002171612.1 NW_017846932.1 407.1 -1.13 0.000 uncharacterized LOC109534206
XM_019899787.1 NW_017851704.1 3092.4 1.29 0.000 acyl-CoA Delta(11) desaturase
XM_019899788.1 NW_017851704.1 328.1 1.08 0.003 UDP-glucuronosyltransferase 2B10-like
XM_019899789.1 NW_017851704.1 62.4 1.03 0.000 UDP-glucuronosyltransferase 2B10-like
XM_019899791.1 NW_017851704.1 4700.0 -0.53 0.005 uncharacterized LOC109534210
XM_019899794.1 NW_017851704.1 2209.1 0.54 0.000 J domain-containing protein CG6693
XM_019899802.1 NW_017851710.1 3628.5 0.24 0.001 uncharacterized LOC109534221
XM_019899806.1 NW_017851711.1 329.1 -0.61 0.000 angiotensin-converting enzyme-like
XM_019899814.1 NW_017851713.1 1524.3 0.34 0.002 probable small nuclear ribonucleoprotein Sm D2
XM_019899821.1 NW_017851713.1 2891.3 -0.19 0.005 zinc finger CCCH domain-containing protein 10-like%2C transcript variant X1
XM_019899835.1 NW_017851713.1 771.7 0.35 0.007 pyridoxal phosphate phosphatase PHOSPHO2-like
XM_019899836.1 NW_017851713.1 2462.0 -0.46 0.001 schwannomin-interacting protein 1 homolog%2C transcript variant X1
XM_019899842.1 NW_017851713.1 255.0 -1.52 0.000 facilitated trehalose transporter Tret1-like
XM_019899859.1 NW_017851716.1 718.7 0.35 0.003 ubiquinol-cytochrome-c reductase complex assembly factor 1-like
XM_019899878.1 NW_017851723.1 4292.8 2.53 0.000 tryptophan 2%2C3-dioxygenase-like

153
XM_019899880.1 NW_017851724.1 344.0 0.88 0.000 uncharacterized LOC109534281
XM_019899885.1 NW_017846956.1 473.7 0.67 0.005 neutral and basic amino acid transport protein rBAT-like
XM_019899900.1 NW_017851724.1 62782.0 -0.65 0.002 gelsolin
XM_019899904.1 NW_017851724.1 3255.5 -0.36 0.001 putative leucine-rich repeat-containing protein DDB_G0290503
XM_019899906.1 NW_017851724.1 3497.6 1.26 0.000 4-coumarate--CoA ligase 1-like
XM_019899913.1 NW_017851724.1 2990.3 1.19 0.000 4-coumarate--CoA ligase 1-like
XM_019899917.1 NW_017851724.1 20763.3 -1.00 0.000 uncharacterized LOC109534306
XM_019899921.1 NW_017851724.1 2620.4 0.39 0.000 AFG3-like protein 2
XM_019899926.1 NW_017851724.1 14361.6 -0.66 0.000 proton-coupled amino acid transporter-like protein pathetic%2C transcript variant X1
XM_019899941.1 NW_017851724.1 11039.0 -0.46 0.000 rho guanine nucleotide exchange factor 12%2C transcript variant X1
XM_019899961.1 NW_017851724.1 644.6 -1.08 0.000 potassium channel subfamily T member 1
XM_019899968.1 NW_017851724.1 24667.0 -0.33 0.006 serine/threonine-protein kinase MARK2-like%2C transcript variant X1
XM_019899997.1 NW_017851724.1 3617.7 -0.62 0.004 pyrimidodiazepine synthase-like
XM_019900002.1 NW_017846981.1 791.4 -0.58 0.007 B-cell lymphoma/leukemia 11A-like
XM_019900000.1 NW_017851724.1 1253.4 0.91 0.000 targeting protein for Xklp2%2C transcript variant X1
XM_019900015.1 NW_017851724.1 562.8 0.45 0.001 origin recognition complex subunit 2
XM_019900021.1 NW_017851724.1 963.3 0.50 0.000 WASH complex subunit strumpellin%2C transcript variant X1
XM_019900030.1 NW_017851724.1 380.5 -0.52 0.004 uncharacterized LOC109534372
XM_019900031.1 NW_017851724.1 3925.8 -0.34 0.008 rap guanine nucleotide exchange factor 6
XR_002171627.1 NW_017846997.1 5.2 1.46 0.001 uncharacterized LOC109534375
XM_019900045.1 NW_017851724.1 8445.8 -1.49 0.001 cathepsin L-like proteinase
XM_019900049.1 NW_017851724.1 1041.0 0.44 0.000 retinoblastoma-binding protein 5 homolog%2C transcript variant X1
XM_019900053.1 NW_017851724.1 211.7 1.16 0.000 angiopoietin-2
XM_019900059.1 NW_017851724.1 492.8 0.46 0.003 uncharacterized LOC109534392
XM_019900060.1 NW_017851724.1 3365.4 0.48 0.000 NADH dehydrogenase [ubiquinone] 1 alpha subcomplex assembly factor 8-like%2C transcript variant X1
XM_019900063.1 NW_017851724.1 1381.9 0.50 0.000 transmembrane protein 70 homolog%2C mitochondrial
XM_019900064.1 NW_017851724.1 1285.0 0.61 0.008 protein abnormal spindle-like
XM_019900075.1 NW_017851724.1 434.1 -0.56 0.002 cathepsin B-like%2C transcript variant X1
XM_019900077.1 NW_017851724.1 927.4 1.00 0.000 histone-lysine N-methyltransferase SMYD3-like
XM_019900078.1 NW_017851724.1 394.3 1.00 0.000 uncharacterized LOC109534405
XR_002171629.1 NW_017851724.1 70.5 1.07 0.000 uncharacterized LOC109534406
XR_002171630.1 NW_017851724.1 67.2 1.05 0.000 uncharacterized LOC109534407
XM_019900082.1 NW_017851724.1 1286.9 0.55 0.000 surfeit locus protein 1

154
XM_019900097.1 NW_017851729.1 898.6 0.60 0.000 TELO2-interacting protein 1 homolog%2C transcript variant X1
XM_019900100.1 NW_017851729.1 615.2 -0.36 0.006 zinc finger protein 678-like
XM_019900102.1 NW_017851731.1 220.8 2.09 0.000 protein cycle
XM_019900106.1 NW_017851731.1 922.6 -1.03 0.000 propionyl-CoA carboxylase beta chain%2C mitochondrial-like%2C transcript variant X1
XM_019900126.1 NW_017851737.1 10395.7 -0.49 0.000 transmembrane protein 184B%2C transcript variant X1
XM_019900136.1 NW_017851737.1 3981.2 1.49 0.001 lysozyme C-1-like
XM_019900149.1 NW_017851737.1 1613.7 0.42 0.003 uridine diphosphate glucose pyrophosphatase-like
XM_019900150.1 NW_017851737.1 1445.5 -0.42 0.000 bladder cancer-associated protein
XM_019900152.1 NW_017851737.1 10067.6 -0.30 0.002 CCR4-NOT transcription complex subunit 1%2C transcript variant X1
XM_019900159.1 NW_017851737.1 6312.7 -0.56 0.006 heparan-alpha-glucosaminide N-acetyltransferase-like
XM_019900167.1 NW_017851737.1 3604.1 -0.86 0.000 uncharacterized LOC109534480%2C transcript variant X1
XM_019900192.1 NW_017851737.1 2037.4 -0.61 0.009 ankyrin-3-like%2C transcript variant X1
XM_019900201.1 NW_017851737.1 799.0 0.37 0.001 nuclear nucleic acid-binding protein C1D-like
XM_019900202.1 NW_017851737.1 1702.0 -0.53 0.000 NF-X1-type zinc finger protein NFXL1
XM_019900205.1 NW_017851737.1 5547.5 0.65 0.000 ras-specific guanine nucleotide-releasing factor RalGPS1-like%2C transcript variant X1
XM_019900228.1 NW_017851737.1 914.4 0.93 0.000 small ubiquitin-related modifier 3-like
XM_019900229.1 NW_017851737.1 638.8 -0.68 0.003 leukocyte tyrosine kinase receptor%2C transcript variant X1
XM_019900232.1 NW_017851737.1 1505.8 0.57 0.004 inactive peptidyl-prolyl cis-trans isomerase shutdown
XR_002171640.1 NW_017851737.1 113.0 -1.43 0.001 uncharacterized LOC109534517
XM_019900254.1 NW_017851737.1 279.8 1.04 0.000 tRNA-specific adenosine deaminase 1%2C transcript variant X1
XM_019900262.1 NW_017847028.1 541.7 -0.46 0.003 cyclic AMP response element-binding protein A-like%2C transcript variant X1
XM_019900263.1 NW_017851737.1 486.0 0.42 0.003 probable ATP-dependent RNA helicase DDX20
XM_019900265.1 NW_017851737.1 1408.1 0.45 0.001 immunoglobulin-binding protein 1
XM_019900280.1 NW_017851743.1 1131.5 1.04 0.000 putative molluscan insulin-related peptide(s) receptor
XM_019900281.1 NW_017851743.1 2999.2 1.02 0.000 insulin receptor-like
NW_017851743.1_c628-13 NW_017851743.1 299.1 0.97 0.000 #N/A
XM_019900285.1 NW_017851743.1 800.4 0.63 0.003 gephyrin%2C transcript variant X1
XM_019900299.1 NW_017851748.1 625.5 0.55 0.002 PCI domain-containing protein 2 homolog
XM_019900300.1 NW_017851749.1 2405.3 0.47 0.000 eukaryotic translation initiation factor 3 subunit K-like
XM_019900301.1 NW_017851749.1 1524.9 0.26 0.008 polyphosphoinositide phosphatase-like
XM_019900302.1 NW_017851749.1 15.6 -1.55 0.000 uncharacterized LOC109534583
XM_019900304.1 NW_017851751.1 5479.3 -0.40 0.003 dmX-like protein 2
XM_019900305.1 NW_017851751.1 27654.9 1.26 0.007 sorbitol dehydrogenase-like
XM_019900306.1 NW_017851751.1 2082.3 -0.57 0.000 U11/U12 small nuclear ribonucleoprotein 48 kDa protein-like

155
XM_019900307.1 NW_017851751.1 1255.2 -0.65 0.000 uncharacterized LOC109534589%2C transcript variant X1
XM_019900311.1 NW_017851751.1 191.8 1.05 0.001 uncharacterized LOC109534591
XM_019900317.1 NW_017851753.1 5508.7 -0.43 0.000 maternal protein tudor-like%2C transcript variant X1
XR_002171650.1 NW_017851753.1 352.8 1.67 0.000 uncharacterized LOC109534601
XM_019900326.1 NW_017851754.1 16370.9 -0.63 0.000 baculoviral IAP repeat-containing protein 2-like
XM_019900327.1 NW_017851754.1 2715.7 0.31 0.000 baculoviral IAP repeat-containing protein 7-B-like%2C transcript variant X1
XM_019900332.1 NW_017851755.1 4957.0 -0.42 0.004 ubiquitin-like protein 3
XM_019900345.1 NW_017851758.1 23848.5 0.96 0.008 myrosinase 1-like
XM_019900363.1 NW_017851758.1 2212.7 0.59 0.000 cystathionine beta-synthase%2C transcript variant X1
XM_019900378.1 NW_017847130.1 72.4 1.74 0.000 farnesol dehydrogenase-like
XM_019900381.1 NW_017851760.1 1990.0 0.47 0.002 acyl-CoA dehydrogenase family member 9%2C mitochondrial
XM_019900395.1 NW_017851760.1 28370.9 1.07 0.001 venom acid phosphatase Acph-1-like
XM_019900404.1 NW_017851760.1 2289.9 0.90 0.005 venom carboxylesterase-6-like
XM_019900418.1 NW_017851768.1 353.9 -1.03 0.000 protein dachsous
XM_019900421.1 NW_017847141.1 2137.6 0.97 0.000 anaphase-promoting complex subunit 4-like
XM_019900424.1 NW_017851769.1 10443.3 -0.31 0.001 spectrin beta chain-like
XM_019900426.1 NW_017851769.1 698.2 1.04 0.000 uncharacterized LOC109534680
XM_019900427.1 NW_017851769.1 1040.2 1.06 0.000 monocarboxylate transporter 3-like
XM_019900435.1 NW_017851773.1 1324.3 0.35 0.007 nucleoporin Nup37
XM_019900441.1 NW_017851775.1 3120.6 -0.98 0.000 protein hunchback-like
XM_019900463.1 NW_017851775.1 2000.1 -0.87 0.000 UPF0598 protein CG30010
XM_019900466.1 NW_017851775.1 1968.9 0.79 0.000 uncharacterized LOC109534711%2C transcript variant X1
XM_019900474.1 NW_017851775.1 2590.1 0.48 0.000 probable RNA polymerase II nuclear localization protein SLC7A6OS
XM_019900479.1 NW_017851775.1 2041.7 0.28 0.006 RE1-silencing transcription factor-like
XM_019900487.1 NW_017851775.1 3225.6 0.23 0.006 small nuclear ribonucleoprotein-associated protein B
XM_019900493.1 NW_017851775.1 4748.3 -1.24 0.000 RNA binding protein fox-1 homolog 3
XM_019900500.1 NW_017847165.1 10092.8 -0.30 0.002 spectrin beta chain-like
XM_019900501.1 NW_017851775.1 4356.5 -0.87 0.000 protein unzipped%2C transcript variant X1
XM_019900503.1 NW_017851775.1 966.6 0.42 0.000 probable dimethyladenosine transferase
XM_019900513.1 NW_017847169.1 246.0 1.31 0.000 regucalcin-like
XM_019900512.1 NW_017851775.1 701.9 0.81 0.000 hydroxysteroid dehydrogenase-like protein 1
XM_019900516.1 NW_017851775.1 966.9 0.52 0.001 rRNA methyltransferase 3%2C mitochondrial
XM_019900520.1 NW_017851775.1 12.1 -1.99 0.000 uncharacterized LOC109534747
XM_019900527.1 NW_017851775.1 1845.7 0.73 0.000 uncharacterized LOC109534753%2C transcript variant X1
XM_019900531.1 NW_017851775.1 11836.7 -0.70 0.001 protein slowmo

156
XM_019900533.1 NW_017851775.1 13885.1 -0.34 0.000 tetratricopeptide repeat protein 14 homolog%2C transcript variant X1
XM_019900554.1 NW_017851775.1 22620.8 -1.25 0.000 protein hunchback-like
XM_019900555.1 NW_017851775.1 667.8 -0.67 0.000 MPN domain-containing protein CG4751-like%2C transcript variant X1
XM_019900562.1 NW_017851775.1 2783.6 -0.89 0.000 POU domain protein CF1A
XM_019900563.1 NW_017851775.1 3445.8 -0.83 0.000 uncharacterized LOC109534775%2C transcript variant X1
XM_019900571.1 NW_017851775.1 338.5 0.93 0.005 endocuticle structural glycoprotein SgAbd-4-like
XR_002171663.1 NW_017851775.1 6012.7 0.81 0.000 uncharacterized LOC109534782
XM_019900574.1 NW_017851775.1 1264.3 -0.33 0.004 sphingomyelin synthase-related 1-like
XR_002171666.1 NW_017847180.1 188.0 -0.65 0.000 uncharacterized LOC109534798
XM_019900587.1 NW_017851776.1 575.0 -0.56 0.007 uncharacterized LOC109534805%2C transcript variant X1
XM_019900605.1 NW_017851783.1 749.2 -0.52 0.002 uncharacterized LOC109534826
XR_002171668.1 NW_017851783.1 941.9 -0.87 0.000 uncharacterized LOC109534842
XM_019900626.1 NW_017851783.1 2273.2 0.48 0.000 cyclin-related protein FAM58A
XM_019900633.1 NW_017851783.1 6238.1 -0.63 0.000 adipocyte plasma membrane-associated protein-like
XM_019900637.1 NW_017851783.1 93.7 -0.50 0.001 cilia- and flagella-associated protein 36
XM_019900638.1 NW_017851783.1 2069.1 -0.37 0.000 serine/threonine-protein phosphatase 4 regulatory subunit 3%2C transcript variant X1
XR_002171670.1 NW_017851783.1 6260.1 -0.66 0.001 uncharacterized LOC109534862
XM_019900648.1 NW_017851783.1 800.4 0.96 0.000 bone morphogenetic protein 7-like
XM_019900663.1 NW_017851783.1 864.7 0.37 0.009 ATP-dependent RNA helicase Ddx1
XM_019900695.1 NW_017851783.1 1676.1 -1.36 0.003 uncharacterized LOC109534899
NW_017851802.1_c28234-24 NW_017851802.1 35062.3 -1.07 0.000 #N/A
XM_019900731.1 NW_017851809.1 41.3 -0.92 0.003 protein ovo-like
XM_019900746.1 NW_017851813.1 1810.4 0.52 0.005 probable nucleoporin Nup58%2C transcript variant X1
XM_019900770.1 NW_017851813.1 9465.9 -0.90 0.000 activating transcription factor 3-like
NW_017847245.1_c782-7 NW_017847245.1 61.6 1.83 0.000 #N/A
XM_019900783.1 NW_017851814.1 11425.1 -0.47 0.000 E3 ubiquitin-protein ligase UBR2
XM_019900795.1 NW_017851815.1 231.6 0.52 0.003 apoptosis-stimulating of p53 protein 2-like
XM_019900797.1 NW_017851815.1 226.7 0.52 0.002 apoptosis-stimulating of p53 protein 2-like
XM_019900816.1 NW_017851816.1 1715.9 0.48 0.002 surfeit locus protein 6 homolog
XM_019900820.1 NW_017851816.1 146.3 -0.54 0.001 uncharacterized LOC109535008
XM_019900821.1 NW_017851816.1 26386.9 -0.59 0.010 transferrin-like%2C transcript variant X1
XM_019900823.1 NW_017851816.1 4535.2 -0.83 0.000 von Willebrand factor D and EGF domain-containing protein-like%2C transcript variant X1
XM_019900825.1 NW_017851816.1 148.8 -1.46 0.000 uncharacterized LOC109535015%2C transcript variant X1
NW_017847275.1_1312-2163 NW_017847275.1 100.1 0.52 0.001 #N/A

157
XM_019900850.1 NW_017851819.1 3600.4 -0.52 0.000 liprin-beta-1%2C transcript variant X1
XM_019900860.1 NW_017847278.1 2531.4 -1.14 0.001 uncharacterized LOC109535044
XM_019900862.1 NW_017851820.1 1121.3 0.54 0.003 OTU domain-containing protein 6B
XM_019900869.1 NW_017851820.1 2641.8 0.44 0.000 bystin
XM_019900888.1 NW_017851821.1 3445.2 -0.99 0.002 probable multidrug resistance-associated protein lethal(2)03659
XM_019900889.1 NW_017851821.1 143.5 -1.24 0.000 uncharacterized LOC109535069%2C transcript variant X1
XM_019900899.1 NW_017851823.1 1292.5 0.38 0.001 protein AATF
XM_019900918.1 NW_017851823.1 487.8 0.41 0.002 putative transferase CAF17 homolog%2C mitochondrial
XM_019900921.1 NW_017851823.1 1128.8 0.36 0.002 tubulin--tyrosine ligase-like protein 12
XM_019900922.1 NW_017851823.1 1272.8 0.47 0.001 trafficking protein particle complex subunit 13
XM_019900926.1 NW_017851823.1 2445.0 -0.42 0.007 protein fork head
XM_019900930.1 NW_017847288.1 1116.6 -0.66 0.009 uncharacterized LOC109535102
XM_019900929.1 NW_017851823.1 2231.4 -0.37 0.000 high mobility group protein 20A-like
XM_019900941.1 NW_017847288.1 838.8 1.53 0.000 acyl-CoA synthetase family member 2%2C mitochondrial-like%2C transcript variant X1
XM_019900951.1 NW_017851824.1 1134.4 0.28 0.006 WD repeat-containing protein mio
XM_019900952.1 NW_017851824.1 774.8 0.42 0.000 WD repeat-containing protein 24
XM_019900953.1 NW_017851824.1 500.7 -0.84 0.001 somatostatin receptor type 2-like%2C transcript variant X1
XM_019900961.1 NW_017851824.1 999.7 -1.14 0.000 uncharacterized LOC109535133%2C transcript variant X1
XM_019901011.1 NW_017851824.1 2991.6 -0.26 0.001 cell cycle control protein 50A%2C transcript variant X1
XM_019901016.1 NW_017851824.1 5047.2 -0.77 0.005 transmembrane protein 47%2C transcript variant X1
XM_019901048.1 NW_017851824.1 1199.0 0.95 0.000 protein aurora borealis
XM_019901049.1 NW_017851824.1 1010.8 0.45 0.001 E3 ubiquitin-protein ligase Hakai
XM_019901062.1 NW_017851824.1 12137.6 1.22 0.003 alcohol dehydrogenase [acceptor]-like%2C transcript variant X1
XM_019901074.1 NW_017851824.1 6137.6 0.92 0.000 uncharacterized LOC109535199
XM_019901075.1 NW_017851824.1 1172.3 0.30 0.001 protein MTO1 homolog%2C mitochondrial%2C transcript variant X1
XM_019901084.1 NW_017847344.1 43.3 -1.07 0.007 uncharacterized LOC109535205
XM_019901094.1 NW_017851824.1 36.9 -1.05 0.004 WD repeat-containing protein on Y chromosome%2C transcript variant X1
XM_019901101.1 NW_017851824.1 227.2 1.01 0.001 uncharacterized LOC109535222
XM_019901106.1 NW_017851824.1 9930.1 3.79 0.000 phosphoglycolate phosphatase 2-like
XM_019901108.1 NW_017851824.1 376.5 0.54 0.000 methionine--tRNA ligase%2C mitochondrial
XM_019901118.1 NW_017851824.1 602.0 -0.99 0.003 tyrosine decarboxylase-like
XM_019901120.1 NW_017851824.1 289.3 -0.70 0.004 neuropeptide F receptor%2C transcript variant X1
XM_019901126.1 NW_017851824.1 716.3 1.32 0.000 cytochrome P450 4g1-like
XM_019901134.1 NW_017851824.1 473.7 0.67 0.005 neutral and basic amino acid transport protein rBAT-like

158
XM_019901139.1 NW_017851824.1 20.1 -1.66 0.000 alpha-amylase-like
XR_002171690.1 NW_017851824.1 27.4 1.15 0.003 uncharacterized LOC109535258%2C transcript variant X1
XM_019901144.1 NW_017851824.1 3.6 1.31 0.006 uncharacterized LOC109535259
XM_019901157.1 NW_017851827.1 1254.4 0.87 0.002 uncharacterized LOC109535268
XM_019901159.1 NW_017851827.1 178.7 0.87 0.000 probable cytochrome P450 4aa1
XM_019901171.1 NW_017851830.1 1137.3 0.46 0.000 cleavage stimulation factor subunit 2 tau variant
XM_019901196.1 NW_017851837.1 27.9 1.37 0.000 lipase 3-like
XM_019901207.1 NW_017851841.1 257.3 0.57 0.009 uncharacterized LOC109535320
XM_019901208.1 NW_017851842.1 473.4 0.62 0.000 tetraspanin-7-like
XM_019901211.1 NW_017851842.1 52.5 -1.88 0.000 cuticle protein 21-like
XM_019901213.1 NW_017851842.1 1739.0 -0.36 0.003 uncharacterized LOC109535327%2C transcript variant X1
XM_019901218.1 NW_017851842.1 931.1 0.32 0.002 histone deacetylase complex subunit SAP30 homolog
XM_019901227.1 NW_017851843.1 4.6 -2.02 0.000 uncharacterized LOC109535337
XM_019901230.1 NW_017851843.1 8424.7 -0.60 0.000 serine protease 42-like%2C transcript variant X1
XM_019901232.1 NW_017851843.1 23077.0 -1.12 0.000 tryptase-2
XR_002171702.1 NW_017851843.1 306.4 -0.68 0.004 uncharacterized LOC109535343
XR_002171703.1 NW_017851843.1 205.7 -0.76 0.004 uncharacterized LOC109535344
XM_019901242.1 NW_017851850.1 11967.5 -0.49 0.001 heat shock 70 kDa protein 4%2C transcript variant X1
XM_019901275.1 NW_017851853.1 2539.3 -0.37 0.007 zinc finger protein 587-like
XM_019901281.1 NW_017851856.1 878.6 0.34 0.001 centromere/kinetochore protein zw10 homolog
XM_019901295.1 NW_017851859.1 3981.7 -0.42 0.000 protein pangolin%2C isoforms A/H/I/S%2C transcript variant X1
XM_019901306.1 NW_017851859.1 6575.8 0.59 0.000 pyruvate dehydrogenase E1 component subunit alpha%2C mitochondrial-like%2C transcript variant X1
XM_019901308.1 NW_017851859.1 72322.3 -1.38 0.000 annexin B9%2C transcript variant X1
XM_019901312.1 NW_017851859.1 3082.7 -3.46 0.000 uncharacterized LOC109535405
XM_019901314.1 NW_017851859.1 1272.4 0.30 0.002 histone acetyltransferase KAT8
XM_019901316.1 NW_017851859.1 1454.4 -0.52 0.001 queuine tRNA-ribosyltransferase accessory subunit 2%2C transcript variant X1
XM_019901324.1 NW_017851859.1 1899.8 -2.72 0.000 uncharacterized LOC109535412
XM_019901327.1 NW_017851859.1 1836.0 -1.89 0.000 uncharacterized LOC109535416%2C transcript variant X1
XR_002171716.1 NW_017851859.1 28.3 -2.55 0.000 uncharacterized LOC109535417
XM_019901336.1 NW_017851860.1 7626.0 -0.61 0.001 carbonic anhydrase 2%2C transcript variant X1
XM_019901340.1 NW_017851860.1 1464.6 0.42 0.000 putative RNA exonuclease NEF-sp
XM_019901341.1 NW_017851860.1 8660.0 -0.81 0.001 fructose-1%2C6-bisphosphatase 1
XM_019901344.1 NW_017851860.1 6861.2 0.28 0.007 T-complex protein 1 subunit eta-like
XM_019901345.1 NW_017851860.1 951.1 0.63 0.002 RNA-binding protein MEX3B-like
XM_019901356.1 NW_017851863.1 266.3 1.28 0.000 transmembrane and TPR repeat-containing protein CG4341-like

159
XM_019901359.1 NW_017851866.1 4524.8 2.54 0.000 tryptophan 2%2C3-dioxygenase-like
XM_019901369.1 NW_017851870.1 3173.6 -1.40 0.000 glycine-rich cell wall structural protein-like
XM_019901378.1 NW_017851876.1 2636.3 -0.38 0.003 phosphatidylinositol phosphatase PTPRQ-like%2C transcript variant X1
XM_019901386.1 NW_017851876.1 446.2 0.53 0.000 centrosomal protein of 135 kDa-like
XM_019901387.1 NW_017851876.1 125.6 -1.22 0.001 uncharacterized LOC109535470
XM_019901388.1 NW_017851876.1 1179.0 -0.45 0.001 protein lap4-like
XM_019901389.1 NW_017851876.1 98.5 -0.77 0.000 odorant receptor 67c-like%2C transcript variant X1
XM_019901398.1 NW_017851876.1 2327.9 0.52 0.001 zinc finger CCCH domain-containing protein 11A-like
XM_019901400.1 NW_017851876.1 206.9 1.07 0.000 separin NW_017851876.1_c115857-112911 NW_017851876.1 141.4 0.77 0.001 #N/A
XM_019901410.1 NW_017851882.1 281.7 -1.20 0.009 bombyxin B-8-like
XM_019901411.1 NW_017851883.1 697.8 0.46 0.000 glycerol-3-phosphate phosphatase-like
XM_019901412.1 NW_017851883.1 6844.4 -0.27 0.005 CREB-binding protein%2C transcript variant X1
XM_019901418.1 NW_017851883.1 2098.5 -0.38 0.002 probable phospholipid-transporting ATPase VD
XM_019901419.1 NW_017851883.1 651.0 0.40 0.001 probable asparagine--tRNA ligase%2C mitochondrial
XM_019901420.1 NW_017851883.1 1847.7 0.43 0.000 glycerol-3-phosphate phosphatase
XM_019901421.1 NW_017851883.1 883.7 -0.73 0.000 polyprenol reductase-like
XR_002171728.1 NW_017847442.1 618.6 -1.37 0.001 uncharacterized LOC109535518
XM_019901431.1 NW_017851888.1 4737.5 -0.41 0.002 sorting nexin lst-4%2C transcript variant X1
XM_019901433.1 NW_017851888.1 632.3 0.52 0.007 CD151 antigen-like
XM_019901438.1 NW_017851889.1 79.5 -0.77 0.001 kinesin-like protein CG14535
XR_002171729.1 NW_017847443.1 605.7 -1.39 0.001 uncharacterized LOC109535524
XM_019901444.1 NW_017851893.1 920.8 1.14 0.001 retinol dehydrogenase 14-like
XM_019901456.1 NW_017851898.1 7359.9 -0.50 0.000 oxysterol-binding protein 1%2C transcript variant X1
XM_019901458.1 NW_017851898.1 2299.0 -0.75 0.007 putative fatty acyl-CoA reductase CG5065
XM_019901462.1 NW_017851898.1 121.2 0.99 0.000 CUE domain-containing protein 2
NW_017851903.1_c17061-2059 NW_017851903.1 1092.1 0.46 0.002 #N/A
XM_019901475.1 NW_017851907.1 2648.0 0.62 0.000 replication protein A 70 kDa DNA-binding subunit-like
XM_019901488.1 NW_017851909.1 133.4 -0.86 0.003 vang-like protein 2-B
XM_019901492.1 NW_017851912.1 3723.4 -0.57 0.008 uncharacterized LOC109535575%2C transcript variant X1
XM_019901503.1 NW_017851913.1 774.1 0.38 0.003 UPF0415 protein C7orf25 homolog
XM_019901504.1 NW_017851913.1 504.1 0.62 0.000 tRNA (adenine(58)-N(1))-methyltransferase catalytic subunit TRMT61A-like
XM_019901512.1 NW_017851914.1 1357.7 0.96 0.000 anaphase-promoting complex subunit 4-like
XM_019901525.1 NW_017851920.1 929.0 0.37 0.001 uncharacterized LOC109535608

160
XM_019901534.1 NW_017851921.1 1651.1 -0.70 0.009 15-hydroxyprostaglandin dehydrogenase [NAD(+)]-like
XM_019901536.1 NW_017851923.1 4670.5 -0.49 0.000 striatin-3
XM_019901540.1 NW_017851923.1 24431.3 0.64 0.000 putative ATP-dependent RNA helicase me31b%2C transcript variant X1
XM_019901548.1 NW_017851923.1 5255.0 2.52 0.000 tryptophan 2%2C3-dioxygenase-like
XM_019901549.1 NW_017851923.1 287.7 2.41 0.000 tryptophan 2%2C3-dioxygenase-like
XM_019901552.1 NW_017851924.1 689.4 0.58 0.000 uncharacterized LOC109535627
XM_019901555.1 NW_017851924.1 7259.1 -0.47 0.001 eukaryotic translation initiation factor 4 gamma 2-like
XM_019901561.1 NW_017851924.1 755.8 0.43 0.000 7-methylguanosine phosphate-specific 5'-nucleotidase%2C transcript variant X1
XM_019901566.1 NW_017851926.1 1491.0 0.50 0.009 SH3 and multiple ankyrin repeat domains protein 3-like
XM_019901568.1 NW_017851926.1 4128.0 -0.57 0.003 anoctamin-1-like%2C transcript variant X1
XM_019901577.1 NW_017851926.1 2196.2 0.73 0.000 sphingomyelin phosphodiesterase-like
XR_002171740.1 NW_017851926.1 10986.6 1.03 0.000 uncharacterized LOC109535649
XM_019901595.1 NW_017851928.1 1725.3 -1.40 0.002 esterase FE4-like
XM_019901598.1 NW_017851928.1 887.6 0.61 0.004 sodium/hydrogen exchanger 9B1-like%2C transcript variant X1
XM_019901617.1 NW_017851930.1 3593.7 -0.40 0.006 tubulin-specific chaperone cofactor E-like protein
XM_019901626.1 NW_017851931.1 3265.6 -0.31 0.003 TBC1 domain family member 23
XM_019901632.1 NW_017851931.1 1909.2 -0.29 0.006 transmembrane protein 87A
XM_019901633.1 NW_017851931.1 973.1 0.31 0.002 general transcription factor IIH subunit 1
XM_019901635.1 NW_017851932.1 167.1 -0.44 0.007 tyrosine-protein kinase Fer-like
XR_002171745.1 NW_017851936.1 786.7 -1.02 0.000 uncharacterized LOC109535706%2C transcript variant X1
XR_002171748.1 NW_017851937.1 430.2 1.02 0.000 uncharacterized LOC109535711%2C transcript variant X1
XM_019901645.1 NW_017851937.1 1470.9 -0.41 0.003 dosage compensation regulator
XM_019901655.1 NW_017851937.1 1256.4 0.45 0.002 protein SMG8
XM_019901676.1 NW_017851937.1 755.3 0.62 0.000 NADH dehydrogenase [ubiquinone] 1 alpha subcomplex assembly factor 3%2C transcript variant X1
XM_019901678.1 NW_017851937.1 1854.7 -0.59 0.004 pre-mRNA-splicing factor CWC25 homolog
XM_019901682.1 NW_017851937.1 1999.6 -0.43 0.005 protein patched homolog 1-like
XM_019901684.1 NW_017851937.1 2641.6 -0.30 0.000 zinc finger protein 569-like%2C transcript variant X1
XM_019901688.1 NW_017851937.1 1564.8 -0.34 0.000 zinc finger protein 2 homolog
XM_019901696.1 NW_017851937.1 366.1 -0.63 0.000 uncharacterized LOC109535742%2C transcript variant X1
XM_019901700.1 NW_017851937.1 2318.9 0.34 0.006 39S ribosomal protein L10%2C mitochondrial
XM_019901716.1 NW_017851937.1 6624.2 0.89 0.000 ankyrin-3%2C transcript variant X1
XM_019901737.1 NW_017851937.1 2431.9 -0.40 0.000 rho GTPase-activating protein 190
XM_019901742.1 NW_017851937.1 5344.6 1.01 0.000 kidney mitochondrial carrier protein 1%2C transcript variant X1
XM_019901766.1 NW_017851937.1 190.5 1.29 0.001 toll-like receptor 3

161
XM_019901776.1 NW_017851937.1 3736.0 0.48 0.001 sodium/potassium-transporting ATPase subunit beta-1-like
XM_019901802.1 NW_017851937.1 17.0 0.98 0.004 cuticle protein CP14.6-like
XM_019901807.1 NW_017851937.1 24.0 -0.88 0.000 twist-related protein 2-like
XM_019901812.1 NW_017851939.1 3480.7 -0.57 0.001 uncharacterized LOC109535807
XM_019901816.1 NW_017847550.1 676.0 -1.16 0.005 cytochrome b5-like
XM_019901817.1 NW_017851939.1 13940.4 -0.68 0.000 WD repeat-containing protein 26%2C transcript variant X1
XR_002171764.1 NW_017851940.1 395.2 1.14 0.000 uncharacterized LOC109535821
XM_019901830.1 NW_017851943.1 7.7 1.61 0.001 uncharacterized LOC109535823
XM_019901868.1 NW_017851946.1 651.7 -0.72 0.000 E3 SUMO-protein ligase RanBP2-like
XR_002171770.1 NW_017851948.1 53.4 -1.13 0.000 uncharacterized LOC109535854
XM_019901903.1 NW_017851949.1 443.7 -0.74 0.007 uncharacterized LOC109535883
XM_019901906.1 NW_017851949.1 1988.8 -0.32 0.000 GRAM domain-containing protein 1B-like
XM_019901913.1 NW_017851949.1 1921.1 0.34 0.000 28S ribosomal protein S2%2C mitochondrial
XM_019901914.1 NW_017851949.1 7126.2 -0.33 0.002 E3 ubiquitin-protein ligase znrf1%2C transcript variant X1
XM_019901916.1 NW_017851949.1 2775.2 -0.55 0.003 uncharacterized LOC109535893%2C transcript variant X1
XM_019901929.1 NW_017851949.1 2610.9 -0.25 0.007 brain protein I3-like
XM_019901941.1 NW_017851949.1 213.5 -1.19 0.001 myrosinase 1-like
XM_019901944.1 NW_017851949.1 291.7 0.61 0.000 probable RNA helicase armi
XM_019901965.1 NW_017851951.1 18568.9 -1.01 0.000 ATP-binding cassette sub-family G member 1-like
XM_019901970.1 NW_017847637.1 39.8 -1.09 0.002 cytosol aminopeptidase-like
XM_019901968.1 NW_017851952.1 90.5 -0.58 0.007 uncharacterized LOC109535928
XM_019901972.1 NW_017851955.1 1119.9 -0.43 0.001 uncharacterized LOC109535930
XM_019901973.1 NW_017851955.1 615.8 -0.36 0.007 zinc finger protein 678-like
XM_019901974.1 NW_017851955.1 1053.3 0.62 0.000 TELO2-interacting protein 1 homolog
XM_019901981.1 NW_017847637.1 824.8 -0.94 0.000 uncharacterized LOC109535936%2C transcript variant X1
XM_019901986.1 NW_017851962.1 300.4 -1.08 0.000 cathepsin B-like
XM_019901991.1 NW_017851963.1 15208.4 1.14 0.000 cytosolic purine 5'-nucleotidase
XM_019902018.1 NW_017851975.1 15666.3 -0.88 0.000 uncharacterized LOC109535974
XR_002171783.1 NW_017851975.1 4176.1 -0.95 0.000 uncharacterized LOC109535975
XM_019902034.1 NW_017847645.1 1530.1 -0.43 0.000 probable phospholipid-transporting ATPase VD
XM_019902050.1 NW_017851980.1 1663.1 1.15 0.000 uncharacterized LOC109535989%2C transcript variant X1
XM_019902060.1 NW_017851984.1 2770.3 1.06 0.000 uncharacterized LOC109535998
XM_019902070.1 NW_017851984.1 2632.5 0.98 0.001 endothelin-converting enzyme 1-like
XM_019902072.1 NW_017851984.1 792.6 0.81 0.006 neprilysin-1-like
XM_019902073.1 NW_017851984.1 3963.7 1.12 0.000 uncharacterized LOC109536009%2C transcript variant X1
XM_019902075.1 NW_017851984.1 3551.2 1.08 0.000 neprilysin-2-like

162
XM_019902076.1 NW_017851984.1 1227.0 1.31 0.000 membrane metallo-endopeptidase-like 1
XM_019902078.1 NW_017851987.1 53.1 0.82 0.000 protein timeless homolog
XM_019902079.1 NW_017851987.1 138.7 0.77 0.000 protein timeless homolog
XM_019902081.1 NW_017851988.1 1590.0 0.35 0.000 centromere/kinetochore protein zw10 homolog
XM_019902086.1 NW_017851990.1 153048.5 0.94 0.010 pectinesterase B-like
XM_019902087.1 NW_017851990.1 65308.7 1.23 0.002 pectinesterase B-like
XM_019902095.1 NW_017851993.1 3195.0 -1.07 0.000 tyrosine-protein kinase transmembrane receptor Ror-like
XM_019902097.1 NW_017851993.1 2155.7 1.06 0.000 serine/threonine-protein kinase polo%2C transcript variant X1
NW_017847678.1_12805-15631 NW_017847678.1 7.1 -1.32 0.005 #N/A
XM_019902101.1 NW_017851993.1 2515.3 0.39 0.002 28S ribosomal protein S22%2C mitochondrial
XM_019902102.1 NW_017851993.1 18447.5 1.89 0.000 D-3-phosphoglycerate dehydrogenase
XM_019902117.1 NW_017851993.1 672.2 0.45 0.000 peptidyl-prolyl cis-trans isomerase NIMA-interacting 4
XM_019902119.1 NW_017851993.1 8020.6 0.37 0.001 extracellular sulfatase SULF-1 homolog
XM_019902177.1 NW_017852003.1 3947.9 0.64 0.007 kinesin-like protein KIN-7L
XR_002171794.1 NW_017852003.1 49.7 -0.92 0.001 uncharacterized LOC109536101
XM_019902191.1 NW_017847728.1 3574.4 1.38 0.001 lysosomal aspartic protease-like
XM_019902198.1 NW_017852003.1 1917.7 0.24 0.009 nurim homolog
XR_002171799.1 NW_017852003.1 97.1 -0.39 0.008 uncharacterized LOC109536116
XM_019902203.1 NW_017852003.1 554.9 0.50 0.003 ribonuclease H2 subunit C
XM_019902208.1 NW_017852003.1 5320.5 -0.57 0.001 protein dopey-1 homolog%2C transcript variant X1
XR_002171801.1 NW_017847728.1 2910.6 1.42 0.001 uncharacterized LOC109536127
XM_019902210.1 NW_017852003.1 6660.1 -0.36 0.002 pre-mRNA-processing-splicing factor 8
XM_019902211.1 NW_017852003.1 9221.6 -0.70 0.000 protein transport protein Sec24C
XM_019902215.1 NW_017852003.1 4143.4 -0.56 0.000 suppressor of cytokine signaling 5%2C transcript variant X1
XM_019902229.1 NW_017852003.1 3123.9 -0.53 0.002 transcription initiation factor TFIID subunit 1%2C transcript variant X1
XM_019902234.1 NW_017852003.1 1771.7 0.26 0.009 protein FAM98A
XM_019902237.1 NW_017852003.1 15.1 -1.52 0.001 sphingomyelin phosphodiesterase-like%2C transcript variant X1
XM_019902243.1 NW_017852003.1 668.9 0.45 0.003 anaphase-promoting complex subunit 2
XM_019902244.1 NW_017852003.1 497.7 0.77 0.000 spindle pole body component 110-like
XM_019902258.1 NW_017852003.1 934.0 0.32 0.006 dr1-associated corepressor
XM_019902259.1 NW_017852003.1 490.8 0.61 0.000 condensin complex subunit 3-like
XM_019902261.1 NW_017852003.1 1375.7 0.49 0.000 proteasome assembly chaperone 2
XM_019902271.1 NW_017852003.1 1246.4 -0.62 0.000 thyroid hormone receptor-associated protein 3-like
XM_019902282.1 NW_017852003.1 690.8 -0.68 0.000 zinc finger BED domain-containing protein 1-like%2C transcript variant X1
XM_019902287.1 NW_017847751.1 235.6 0.80 0.008 proclotting enzyme-like

163
XM_019902286.1 NW_017852003.1 924.1 0.60 0.000 threonylcarbamoyladenosine tRNA methylthiotransferase%2C transcript variant X1
XM_019902289.1 NW_017852003.1 1163.3 0.45 0.000 uncharacterized LOC109536182%2C transcript variant X1
XM_019902293.1 NW_017852003.1 367.3 -0.53 0.006 protein lines%2C transcript variant X1
XM_019902296.1 NW_017852003.1 915.0 0.57 0.005 borealin%2C transcript variant X1
XM_019902304.1 NW_017852003.1 712.9 0.51 0.002 DNA-directed RNA polymerase III subunit RPC8
XM_019902313.1 NW_017852003.1 5513.4 1.56 0.000 uncharacterized LOC109536201
XM_019902322.1 NW_017852007.1 519.9 0.46 0.008 meiosis-specific nuclear structural protein 1-like
XM_019902334.1 NW_017852008.1 694.0 -1.01 0.000 uncharacterized LOC109536219%2C transcript variant X1
XM_019902336.1 NW_017852008.1 1133.2 -1.00 0.000 uncharacterized LOC109536220
XM_019902337.1 NW_017852009.1 2025.4 0.47 0.009 protein ELYS
XM_019902338.1 NW_017852009.1 1349.9 0.30 0.002 DNA-directed RNA polymerase III subunit RPC2
XM_019902339.1 NW_017852009.1 887.9 0.49 0.000 uncharacterized LOC109536224
XM_019902352.1 NW_017852012.1 40.9 -1.76 0.000 RNA polymerase II degradation factor 1-like
XM_019902360.1 NW_017852012.1 1420.5 -0.37 0.002 uncharacterized LOC109536244%2C transcript variant X1
XM_019902369.1 NW_017852012.1 5758.7 -0.57 0.001 protein phosphatase 1A-like%2C transcript variant X1
XM_019902392.1 NW_017852012.1 902.2 0.80 0.000 suppressor protein of bem1/bed5 double mutants-like
XM_019902400.1 NW_017847751.1 2280.4 0.31 0.001 gametocyte-specific factor 1 homolog
XM_019902403.1 NW_017852012.1 232.5 0.80 0.000 uncharacterized LOC109536268%2C transcript variant X1
XM_019902406.1 NW_017852012.1 1014.6 0.33 0.002 protoheme IX farnesyltransferase%2C mitochondrial%2C transcript variant X1
XM_019902409.1 NW_017852012.1 5740.9 -0.68 0.000 uncharacterized LOC109536273%2C transcript variant X1
XM_019902425.1 NW_017852012.1 2643.4 -1.17 0.000 ejaculatory bulb-specific protein 3-like
XM_019902427.1 NW_017852012.1 3315.5 -0.35 0.003 bromodomain adjacent to zinc finger domain protein 2B%2C transcript variant X1
XM_019902432.1 NW_017852012.1 3483.6 -0.51 0.005 WD repeat%2C SAM and U-box domain-containing protein 1-like%2C transcript variant X1
XM_019902436.1 NW_017852012.1 3940.7 0.61 0.003 nucleolin 1-like
XM_019902437.1 NW_017852012.1 3178.6 0.51 0.002 transcription initiation factor TFIID subunit 11-like
XM_019902438.1 NW_017852012.1 6608.8 1.07 0.000 deoxyuridine 5'-triphosphate nucleotidohydrolase
XM_019902444.1 NW_017852012.1 4156.2 -0.38 0.001 uncharacterized LOC109536289
XM_019902453.1 NW_017852012.1 745.7 0.43 0.001 asparagine synthetase domain-containing protein CG17486
XM_019902478.1 NW_017852012.1 3776.0 0.27 0.001 armadillo repeat-containing protein 6 homolog
XM_019902481.1 NW_017852012.1 250.3 0.96 0.000 paired box protein Pax-5
XM_019902483.1 NW_017852012.1 1483.5 0.31 0.000 HD domain-containing protein 2
XR_002171826.1 NW_017852012.1 282.6 1.42 0.001 histidine decarboxylase%2C transcript variant X1
XM_019902489.1 NW_017847776.1 5127.0 -0.59 0.006 ATP-binding cassette sub-family G member 1-like
XM_019902486.1 NW_017852012.1 253.6 -1.00 0.006 uncharacterized LOC109536320

164
XM_019902487.1 NW_017852012.1 1325.2 -0.61 0.000 calbindin-32%2C transcript variant X1
XM_019902493.1 NW_017852012.1 575369.6 -0.88 0.008 uncharacterized LOC109536324
XM_019902494.1 NW_017852012.1 86.7 -1.22 0.000 B2 protein-like
XR_002171828.1 NW_017852012.1 30.5 -1.63 0.000 uncharacterized LOC109536330
XM_019902506.1 NW_017852012.1 11125.8 -0.29 0.001 RNA-binding protein Nova-1%2C transcript variant X1
XM_019902540.1 NW_017852012.1 66.8 -1.09 0.000 intracellular protein transport protein USO1-like
XM_019902546.1 NW_017852012.1 1312.9 0.47 0.001 sulfide:quinone oxidoreductase%2C mitochondrial
XM_019902550.1 NW_017852012.1 681.9 0.41 0.000 neuralized-like protein 2
XM_019902551.1 NW_017852012.1 13875.3 0.36 0.000 nascent polypeptide-associated complex subunit alpha
XM_019902553.1 NW_017852012.1 2461.1 -0.33 0.009 RE1-silencing transcription factor-like
XM_019902555.1 NW_017852012.1 671.8 0.48 0.000 nucleoporin seh1
XM_019902566.1 NW_017852012.1 898.1 0.33 0.003 uncharacterized LOC109536378%2C transcript variant X1
XM_019902569.1 NW_017852012.1 2357.2 0.21 0.003 TM2 domain-containing protein almondex
XM_019902573.1 NW_017852012.1 32570.3 -1.91 0.000 putative transcription factor SOX-14
XM_019902585.1 NW_017852012.1 5297.6 -0.34 0.008 atlastin
XM_019902592.1 NW_017852012.1 3980.6 -0.79 0.000 glutathione S-transferase theta-1-like%2C transcript variant X1
XM_019902595.1 NW_017852012.1 3521.2 -0.33 0.002 transmembrane protein 192
XM_019902598.1 NW_017852012.1 244.8 -0.70 0.003 sodium/calcium exchanger 3
XM_019902608.1 NW_017852012.1 475.3 -1.49 0.000 ninjurin-2-like%2C transcript variant X1
XM_019902615.1 NW_017847812.1 222.0 -0.64 0.008 1-phosphatidylinositol 4%2C5-bisphosphate phosphodiesterase classes I and II-like
XM_019902616.1 NW_017852012.1 1071.4 -0.54 0.004 trichohyalin
XM_019902627.1 NW_017847815.1 34861.1 -1.06 0.000 ATP-binding cassette sub-family G member 1-like
XM_019902624.1 NW_017852012.1 416.7 0.54 0.000 dnaJ homolog subfamily C member 17
XM_019902625.1 NW_017852012.1 933.9 -1.50 0.000 integrin alpha-PS5-like
XM_019902653.1 NW_017852012.1 115.4 0.48 0.000 uncharacterized LOC109536437
XM_019902667.1 NW_017852012.1 1903.6 0.56 0.001 DNA repair protein RAD51 homolog 1
XM_019902668.1 NW_017852012.1 1753.5 -0.51 0.000 RNA polymerase II subunit A C-terminal domain phosphatase
XM_019902669.1 NW_017852012.1 1110.9 0.41 0.005 28S ribosomal protein S17%2C mitochondrial
XM_019902670.1 NW_017852012.1 99.9 -1.04 0.002 uncharacterized LOC109536446
XM_019902676.1 NW_017852012.1 672.0 0.44 0.003 vesicle transport protein USE1
XM_019902677.1 NW_017852012.1 2244.8 0.57 0.000 protein NEDD1%2C transcript variant X1
XM_019902685.1 NW_017852012.1 904.6 0.47 0.000 nuclear transcription factor Y subunit gamma%2C transcript variant X1
XM_019902692.1 NW_017852012.1 534.7 0.76 0.000 serine/threonine-protein kinase VRK1-like
XM_019902696.1 NW_017852012.1 10676.2 1.11 0.000 putative vitellogenin receptor%2C transcript variant X1
XR_002171838.1 NW_017852012.1 224.9 -1.33 0.001 uncharacterized LOC109536482

165
XM_019902740.1 NW_017852013.1 3574.5 0.27 0.005 serine/threonine-protein kinase RIO1
XM_019902741.1 NW_017852013.1 702.0 0.73 0.000 protein SMG9%2C transcript variant X1
XM_019902768.1 NW_017847848.1 873.3 0.60 0.000 DNA replication licensing factor Mcm7-like
XM_019902797.1 NW_017847848.1 903.8 0.38 0.001 mitotic checkpoint protein BUB3-like
XR_002171851.1 NW_017852014.1 99.5 0.88 0.007 uncharacterized LOC109536532
XM_019902798.1 NW_017852014.1 3034.0 -0.58 0.001 phosphoinositide 3-kinase adapter protein 1%2C transcript variant X1
XM_019902809.1 NW_017852014.1 572.3 0.65 0.000 prolyl 4-hydroxylase subunit alpha-1-like
XM_019902815.1 NW_017852015.1 151.2 -0.89 0.006 A disintegrin and metalloproteinase with thrombospondin motifs 7-like
XM_019902817.1 NW_017852015.1 3391.1 -0.84 0.001 zinc metalloproteinase-disintegrin-like EoMP06
XM_019902818.1 NW_017852015.1 4191.2 -0.73 0.007 glucose-6-phosphate exchanger SLC37A2
XM_019902845.1 NW_017852016.1 4999.6 -0.52 0.000 tyrosine-protein phosphatase non-receptor type 9
XM_019902867.1 NW_017852016.1 1320.3 0.51 0.000 39S ribosomal protein L51%2C mitochondrial
XM_019902876.1 NW_017852016.1 695.5 0.56 0.001 centromere/kinetochore protein zw10-like
XM_019902880.1 NW_017852017.1 20.3 -1.52 0.000 FACT complex subunit SSRP1-like
XM_019902882.1 NW_017852017.1 54.9 1.68 0.000 choline dehydrogenase%2C mitochondrial-like
XM_019902883.1 NW_017852017.1 83.1 1.60 0.000 uncharacterized LOC109536598
XR_002171855.1 NW_017852017.1 439.6 0.79 0.007 uncharacterized LOC109536604
XM_019902891.1 NW_017852017.1 2479.7 0.26 0.000 rab GTPase-binding effector protein 1%2C transcript variant X1
XM_019902895.1 NW_017852017.1 6745.2 -0.54 0.000 autophagy-related protein 101%2C transcript variant X1
XM_019902898.1 NW_017852017.1 5119.3 -0.61 0.001 fibrous sheath CABYR-binding protein-like
XM_019902900.1 NW_017852017.1 395.8 0.54 0.000 nucleoside diphosphate-linked moiety X motif 8
XM_019902903.1 NW_017852017.1 1027.9 1.09 0.005 uncharacterized LOC109536617
XM_019902923.1 NW_017852017.1 2974.8 -0.45 0.000 synaptogyrin-1
XM_019902925.1 NW_017852017.1 1154.1 -0.73 0.005 sarcoplasmic calcium-binding protein 1
XM_019902935.1 NW_017852017.1 853.0 0.47 0.000 cytosolic Fe-S cluster assembly factor NUBP2 homolog
XM_019902937.1 NW_017852017.1 2042.7 -0.71 0.000 cytokine-inducible SH2-containing protein-like
XM_019902938.1 NW_017852017.1 214.0 -0.70 0.008 uncharacterized LOC109536639%2C transcript variant X1
XM_019902961.1 NW_017852017.1 690.0 0.50 0.001 caseinolytic peptidase B protein homolog%2C transcript variant X1
XM_019902972.1 NW_017852017.1 4105.5 0.69 0.000 superoxide dismutase [Mn] 1%2C mitochondrial
XM_019902974.1 NW_017852017.1 799.7 0.41 0.002 anaphase-promoting complex subunit 15-like%2C transcript variant X1
XM_019902981.1 NW_017852017.1 618.7 0.42 0.010 uncharacterized LOC109536667
XM_019902991.1 NW_017852017.1 1632.5 0.79 0.001 uncharacterized LOC109536676
XM_019902994.1 NW_017852017.1 5747.2 -0.36 0.006 transcription elongation factor SPT6
XM_019903002.1 NW_017852017.1 239.3 1.75 0.000 glucose dehydrogenase [FAD%2C quinone]-like

166
XM_019903029.1 NW_017852017.1 827.4 0.74 0.002 uncharacterized LOC109536707%2C transcript variant X1
XM_019903042.1 NW_017852017.1 3229.0 -0.44 0.005 zinc finger protein 665-like%2C transcript variant X1
XM_019903047.1 NW_017852017.1 3002.3 -0.61 0.002 uncharacterized LOC109536715%2C transcript variant X1
XM_019903054.1 NW_017852017.1 22692.1 -0.53 0.005 6-phosphofructo-2-kinase/fructose-2%2C6-bisphosphatase-like
XM_019903078.1 NW_017852017.1 2010.5 0.37 0.001 28S ribosomal protein S33%2C mitochondrial
XM_019903086.1 NW_017852017.1 487.6 -0.70 0.003 neo-calmodulin-like%2C transcript variant X1
XM_019903093.1 NW_017852017.1 297.4 0.85 0.007 uncharacterized LOC109536742
XM_019903104.1 NW_017852017.1 1106.7 0.63 0.002 innexin inx2-like
XR_002171863.1 NW_017852017.1 343.3 -0.85 0.000 uncharacterized LOC109536754
XM_019903132.1 NW_017852021.1 2166.0 0.34 0.000 uncharacterized LOC109536774
XM_019903153.1 NW_017847924.1 2280.3 0.31 0.001 gametocyte-specific factor 1 homolog
XM_019903151.1 NW_017852021.1 383.3 0.66 0.000 enoyl-CoA hydratase domain-containing protein 3%2C mitochondrial%2C transcript variant X1
XM_019903155.1 NW_017852021.1 872.1 0.39 0.006 COX assembly mitochondrial protein homolog
XM_019903157.1 NW_017852021.1 4180.2 -1.14 0.001 broad-complex core protein%2C transcript variant X1
XM_019903168.1 NW_017847924.1 235.4 0.80 0.008 proclotting enzyme-like
XM_019903192.1 NW_017852021.1 6360.1 -0.39 0.003 derlin-2
XM_019903196.1 NW_017852021.1 3008.2 -1.37 0.000 uncharacterized LOC109536806%2C transcript variant X1
XM_019903205.1 NW_017852021.1 11214.6 -0.52 0.000 fatty aldehyde dehydrogenase-like%2C transcript variant X1
XM_019903221.1 NW_017852021.1 1103.1 0.66 0.000 NFU1 iron-sulfur cluster scaffold homolog%2C mitochondrial-like
XM_019903229.1 NW_017852021.1 379.3 0.42 0.003 rRNA methyltransferase 2%2C mitochondrial
XM_019903247.1 NW_017852026.1 4726.7 0.29 0.006 serine/threonine-protein phosphatase 2A 56 kDa regulatory subunit epsilon isoform%2C transcript variant X1
XM_019903259.1 NW_017852026.1 450.5 0.35 0.007 uncharacterized LOC109536846
XM_019903260.1 NW_017852026.1 893.9 -0.87 0.000 diacylglycerol kinase 1%2C transcript variant X1
XM_019903274.1 NW_017852026.1 26.8 0.81 0.006 NEDD8-like
XM_019903277.1 NW_017852026.1 11389.2 -0.23 0.002 protein transport protein Sec23A%2C transcript variant X1
XM_019903284.1 NW_017852026.1 8503.1 -0.83 0.000 hepatocyte nuclear factor 4-gamma%2C transcript variant X1
XM_019903313.1 NW_017852026.1 2773.9 0.35 0.009 tudor domain-containing protein 1-like%2C transcript variant X1
XM_019903320.1 NW_017852026.1 1240.4 0.45 0.006 uncharacterized LOC109536876%2C transcript variant X1
XM_019903326.1 NW_017852026.1 10.3 1.65 0.000 uncharacterized LOC109536879
XM_019903327.1 NW_017852026.1 102.8 -1.24 0.000 patj homolog
XM_019903332.1 NW_017852026.1 383.2 0.41 0.007 D-beta-hydroxybutyrate dehydrogenase%2C mitochondrial-like
XM_019903334.1 NW_017852026.1 183.7 -0.97 0.006 uncharacterized LOC109536887
XM_019903336.1 NW_017852028.1 66.0 -1.64 0.000 perlucin-like
XM_019903342.1 NW_017852028.1 759.6 0.74 0.004 2-hydroxyacyl-CoA lyase 1

167
XM_019903347.1 NW_017852028.1 5788.6 -1.26 0.002 putative inorganic phosphate cotransporter%2C transcript variant X1
XM_019903350.1 NW_017852028.1 353.2 1.88 0.000 putative inorganic phosphate cotransporter
XM_019903352.1 NW_017852028.1 4.5 -1.46 0.001 putative inorganic phosphate cotransporter%2C transcript variant X1
XM_019903357.1 NW_017852028.1 7298.4 1.10 0.000 transducin beta-like protein 2%2C transcript variant X1
XR_002171879.1 NW_017852028.1 3757.4 -0.57 0.001 uncharacterized LOC109536905
XM_019903366.1 NW_017852028.1 8732.8 0.59 0.000 protein gustavus%2C transcript variant X1
XM_019903374.1 NW_017852028.1 539.6 0.45 0.004 target of rapamycin complex subunit lst8%2C transcript variant X1
XM_019903393.1 NW_017852028.1 8113.5 -0.97 0.000 sorting nexin-8-like%2C transcript variant X1
XM_019903413.1 NW_017852028.1 347.4 1.44 0.000 uncharacterized LOC109536931
XM_019903414.1 NW_017852028.1 6913.1 1.88 0.000 cytoglobin-1-like
XM_019903416.1 NW_017852028.1 1090.7 0.30 0.000 nuclear pore complex protein Nup85
XM_019903417.1 NW_017852028.1 500.2 0.37 0.002 deoxyhypusine hydroxylase
XM_019903419.1 NW_017852028.1 321.4 0.94 0.000 G1/S-specific cyclin-E
XM_019903422.1 NW_017852028.1 1369.8 -0.48 0.003 nudC domain-containing protein 3
XM_019903429.1 NW_017852028.1 913.9 1.25 0.000 polypeptide N-acetylgalactosaminyltransferase 3-like%2C transcript variant X1
XM_019903435.1 NW_017852028.1 440.2 -1.03 0.006 cyclin-dependent kinase 5 activator 1
XM_019903443.1 NW_017852028.1 1191.3 1.02 0.000 bone morphogenetic protein receptor type-1B-like
XM_019903464.1 NW_017848006.1 93.2 -0.56 0.001 uncharacterized G-patch domain protein DDB_G0278987-like
XM_019903460.1 NW_017852029.1 1967.8 0.36 0.002 H/ACA ribonucleoprotein complex subunit 3
XM_019903473.1 NW_017852029.1 20.5 -0.99 0.006 uncharacterized LOC109536973
XM_019903474.1 NW_017852029.1 4268.1 0.27 0.002 DNA damage-binding protein 1%2C transcript variant X1
XM_019903476.1 NW_017852029.1 1550.4 0.30 0.001 complex I intermediate-associated protein 30%2C mitochondrial
XM_019903480.1 NW_017852029.1 1047.8 -1.67 0.000 gonadotropin-releasing hormone II receptor-like
XM_019903487.1 NW_017848008.1 1638.5 -0.41 0.001 probable phospholipid-transporting ATPase VA
XM_019903489.1 NW_017852030.1 29.1 -1.39 0.001 potassium/sodium hyperpolarization-activated cyclic nucleotide-gated channel 1-like
XM_019903491.1 NW_017852030.1 33.2 -1.15 0.004 uncharacterized LOC109536990
XM_019903499.1 NW_017848011.1 627.3 -0.26 0.010 putative U5 small nuclear ribonucleoprotein 200 kDa helicase
XM_019903501.1 NW_017852030.1 9088.9 0.63 0.001 phosphoglucomutase
XR_002171888.1 NW_017848018.1 77.0 -0.68 0.000 uncharacterized LOC109537014
XM_019903520.1 NW_017852030.1 9218.1 -1.44 0.001 protein lethal(2)essential for life-like
XM_019903523.1 NW_017852030.1 1797.9 -0.47 0.000 intersectin-1-like%2C transcript variant X1
XM_019903544.1 NW_017848023.1 1122.6 -0.46 0.000 probable cation-transporting ATPase 13A3
XM_019903551.1 NW_017852030.1 2348.3 0.77 0.000 macrophage migration inhibitory factor homolog
XR_002171890.1 NW_017848033.1 157.6 -0.83 0.001 uncharacterized LOC109537034

168
XM_019903556.1 NW_017852030.1 579.6 0.32 0.008 protein arginine methyltransferase NDUFAF7 homolog%2C mitochondrial
XM_019903564.1 NW_017852030.1 3286.9 0.23 0.003 mitochondrial import inner membrane translocase subunit Tim23%2C transcript variant X1
XM_019903569.1 NW_017852030.1 4685.6 -0.55 0.000 myelin regulatory factor-like protein%2C transcript variant X1
XM_019903581.1 NW_017852030.1 2018.6 0.51 0.001 39S ribosomal protein L12%2C mitochondrial
XM_019903590.1 NW_017852030.1 2222.0 0.26 0.003 uncharacterized protein C6orf136 homolog
XM_019903625.1 NW_017852030.1 6840.9 0.75 0.004 acetyl-CoA carboxylase%2C transcript variant X1
XM_019903627.1 NW_017852030.1 184.0 -0.61 0.001 hyaluronidase-like
XM_019903632.1 NW_017852030.1 1294.0 0.66 0.001 uncharacterized LOC109537078%2C transcript variant X1
XM_019903644.1 NW_017852030.1 2615.0 -1.26 0.000 zinc finger protein 761-like
XM_019903654.1 NW_017852030.1 1699.2 0.72 0.000 uncharacterized aarF domain-containing protein kinase 5%2C transcript variant X1
XM_019903665.1 NW_017852030.1 2898.8 -0.50 0.001 golgin subfamily A member 4%2C transcript variant X1
XM_019903684.1 NW_017852030.1 1619.9 0.27 0.002 zinc finger HIT domain-containing protein 2
XM_019903693.1 NW_017852030.1 1847.7 -0.35 0.000 ankyrin repeat domain-containing protein 50%2C transcript variant X1
XM_019903700.1 NW_017852030.1 3322.3 -0.39 0.000 protein PAT1 homolog 1
XM_019903710.1 NW_017852030.1 3831.8 -0.76 0.000 breast cancer anti-estrogen resistance protein 1%2C transcript variant X1
XM_019903713.1 NW_017852030.1 2249.7 -0.75 0.000 uncharacterized LOC109537128%2C transcript variant X1
XM_019903720.1 NW_017852030.1 1467.6 -0.45 0.004 homeobox protein cut%2C transcript variant X1
XM_019903731.1 NW_017852030.1 1456.1 -0.45 0.001 kelch-like protein 5%2C transcript variant X1
XM_019903737.1 NW_017852030.1 8746.3 2.01 0.000 neural/ectodermal development factor IMP-L2%2C transcript variant X1
XM_019903741.1 NW_017848127.1 210.2 -1.97 0.000 uncharacterized LOC109537138
XM_019903739.1 NW_017852030.1 66.3 -1.30 0.002 potassium/sodium hyperpolarization-activated cyclic nucleotide-gated channel 2-like
XM_019903766.1 NW_017852032.1 14956.0 1.17 0.000 myotubularin-related protein 14%2C transcript variant X1
XM_019903768.1 NW_017852032.1 17328.6 1.69 0.000 calcium/calmodulin-dependent protein kinase type 1-like
XM_019903769.1 NW_017852032.1 1948.7 0.36 0.002 coiled-coil domain-containing protein R3HCC1L-like%2C transcript variant X1
XM_019903772.1 NW_017852032.1 972.0 0.63 0.000 elongation factor-like GTPase 1%2C transcript variant X1
XM_019903775.1 NW_017852032.1 677.1 2.93 0.000 protein giant-lens
XM_019903777.1 NW_017852032.1 1260.8 0.82 0.000 ATP-dependent Clp protease proteolytic subunit
XR_002171902.1 NW_017848143.1 41.8 1.09 0.006 uncharacterized LOC109537179
XM_019903783.1 NW_017852032.1 988.7 0.43 0.001 NEDD8-conjugating enzyme UBE2F-like%2C transcript variant X1
XM_019903789.1 NW_017848143.1 1195.0 -0.90 0.000 uncharacterized protein DDB_G0283697-like%2C transcript variant X1
XM_019903785.1 NW_017852032.1 2063.6 0.41 0.000 protein phosphatase methylesterase 1%2C transcript variant X1

169
XM_019903790.1 NW_017852032.1 2334.8 -0.33 0.003 G protein alpha i subunit
XM_019903794.1 NW_017852032.1 229.3 -0.89 0.003 hemicentin-2-like
XR_002171904.1 NW_017852033.1 54.2 1.63 0.000 uncharacterized LOC109537196
XM_019903805.1 NW_017852034.1 422.6 0.89 0.003 uncharacterized LOC109537199
XM_019903834.1 NW_017848150.1 1600.2 0.97 0.000 anaphase-promoting complex subunit 4-like
XM_019903841.1 NW_017852034.1 3027.8 -0.42 0.000 AT-rich interactive domain-containing protein 4B%2C transcript variant X1
XR_002171905.1 NW_017852034.1 48.4 -1.10 0.004 uncharacterized LOC109537224
XM_019903844.1 NW_017852034.1 318.1 -1.29 0.000 protein FAM161A-like%2C transcript variant X1
XM_019903853.1 NW_017852034.1 2729.2 0.27 0.002 ATP-dependent RNA helicase DHX36-like
XM_019903865.1 NW_017852034.1 1007.4 0.34 0.003 conserved oligomeric Golgi complex subunit 1%2C transcript variant X1
XR_002171908.1 NW_017845339.1 70.7 -0.70 0.001 uncharacterized LOC109537246
XM_019903903.1 NW_017852037.1 9300.8 -0.66 0.000 long-chain-fatty-acid--CoA ligase 4%2C transcript variant X1
XM_019903917.1 NW_017852037.1 1642.7 0.59 0.001 uncharacterized LOC109537282%2C transcript variant X1
XM_019903925.1 NW_017852037.1 2259.7 0.36 0.000 39S ribosomal protein L15%2C mitochondrial
XM_019903931.1 NW_017852037.1 1351.2 0.36 0.000 cleavage stimulation factor subunit 1
XM_019903935.1 NW_017852037.1 429.3 0.69 0.000 GPI transamidase component PIG-S
XM_019903951.1 NW_017852037.1 2933.1 0.34 0.006 28S ribosomal protein S15%2C mitochondrial
XM_019903982.1 NW_017852037.1 5759.3 0.33 0.005 eukaryotic translation initiation factor 4E-1A-like
XM_019903984.1 NW_017852037.1 3153.0 -0.57 0.000 GTPase-activating protein%2C transcript variant X1
XM_019904001.1 NW_017852037.1 5330.9 -0.74 0.000 piezo-type mechanosensitive ion channel component
XM_019904002.1 NW_017852037.1 4874.8 -0.81 0.000 acyl-coenzyme A thioesterase 9%2C mitochondrial-like
XM_019904003.1 NW_017852037.1 260.8 -0.80 0.000 piezo-type mechanosensitive ion channel component-like%2C transcript variant X1
XM_019904007.1 NW_017852037.1 10705.7 -0.80 0.000 dolichyldiphosphatase 1-like
XM_019904008.1 NW_017852037.1 1654.8 -0.46 0.000 zinc finger protein 665-like
XM_019904010.1 NW_017852037.1 1835.4 -0.36 0.004 uncharacterized LOC109537347%2C transcript variant X1
XM_019904015.1 NW_017852037.1 2825.9 0.41 0.001 ubiquitin-like-conjugating enzyme ATG3
XM_019904030.1 NW_017852037.1 450.1 0.41 0.001 phosphatidate cytidylyltransferase%2C mitochondrial
XM_019904049.1 NW_017852037.1 1671.2 -1.77 0.000 alpha-tocopherol transfer protein-like%2C transcript variant X1
XM_019904062.1 NW_017852037.1 10743.9 -1.48 0.000 clavesin-1
XM_019904063.1 NW_017852037.1 1847.2 -0.92 0.000 annulin-like
XM_019904068.1 NW_017852037.1 1924.8 0.43 0.000 uncharacterized protein C18orf19 homolog A
XM_019904085.1 NW_017848199.1 697.0 0.46 0.000 glycerol-3-phosphate phosphatase-like
XM_019904099.1 NW_017848199.1 56.8 -0.85 0.000 polyprenol reductase-like%2C transcript variant X1
XM_019904111.1 NW_017852037.1 65.3 -0.84 0.001 uncharacterized LOC109537401

170
XM_019904114.1 NW_017852037.1 21.6 -1.17 0.001 coiled-coil domain-containing protein 39%2C transcript variant X1
XM_019904133.1 NW_017852037.1 2331.7 -0.51 0.001 serine/threonine-protein phosphatase 2A regulatory subunit B'' subunit beta-like%2C transcript variant X1
XM_019904139.1 NW_017852037.1 1232.6 -0.55 0.000 histone acetyltransferase KAT2B
XM_019904140.1 NW_017852037.1 4678.4 -0.25 0.003 multiple epidermal growth factor-like domains protein 8
XM_019904141.1 NW_017852037.1 8538.0 -0.57 0.001 uncharacterized LOC109537418%2C transcript variant X1
XM_019904144.1 NW_017852037.1 1542.4 0.73 0.000 plexin domain-containing protein 2-like
XM_019904146.1 NW_017852037.1 1663.2 0.40 0.001 39S ribosomal protein L47%2C mitochondrial
XM_019904154.1 NW_017852037.1 2631.8 -0.18 0.002 F-box/WD repeat-containing protein 5%2C transcript variant X1
XM_019904167.1 NW_017852037.1 1050.9 -1.26 0.000 protein vein-like%2C transcript variant X1
XM_019904174.1 NW_017852037.1 313.9 0.93 0.001 mitotic spindle assembly checkpoint protein MAD2A
XM_019904175.1 NW_017852037.1 5276.7 -0.37 0.009 tyrosine-protein phosphatase non-receptor type 23
XM_019904176.1 NW_017852037.1 610.7 1.07 0.006 clavesin-2-like
XM_019904178.1 NW_017852037.1 3069.0 0.36 0.000 kelch-like protein diablo
XM_019904181.1 NW_017852037.1 94572.6 -0.51 0.001 heat shock protein 83
XM_019904215.1 NW_017852037.1 160.4 1.06 0.003 calcitonin receptor-like%2C transcript variant X1
XM_019904219.1 NW_017852037.1 1992.5 -0.31 0.002 sorting nexin-20%2C transcript variant X1
XM_019904232.1 NW_017852037.1 814.5 0.27 0.006 presenilins-associated rhomboid-like protein%2C mitochondrial
XM_019904236.1 NW_017852037.1 36.7 1.38 0.000 uncharacterized LOC109537474%2C transcript variant X1
XM_019904255.1 NW_017852037.1 1477.6 0.43 0.000 DCN1-like protein 1
XM_019904265.1 NW_017852037.1 2478.2 0.27 0.000 F-box-like/WD repeat-containing protein TBL1XR1%2C transcript variant X1
XM_019904272.1 NW_017852037.1 153.3 1.24 0.001 uncharacterized LOC109537499
XM_019904292.1 NW_017852037.1 2210.8 0.35 0.003 uncharacterized LOC109537517%2C transcript variant X1
XM_019904300.1 NW_017852037.1 2065.4 0.68 0.001 kinesin-like protein KIF18A%2C transcript variant X1
XM_019904305.1 NW_017852037.1 680.7 1.12 0.000 probable multidrug resistance-associated protein lethal(2)03659%2C transcript variant X1
XM_019904308.1 NW_017852037.1 102.6 -0.52 0.009 T-box transcription factor TBX20-like
XM_019904354.1 NW_017845362.1 88.7 -0.53 0.004 uncharacterized LOC109537537
XM_019904342.1 NW_017852038.1 2607.7 0.53 0.008 uncharacterized LOC109537562
XM_019904358.1 NW_017848296.1 12292.4 -1.36 0.000 lipid storage droplets surface-binding protein 1-like
XM_019904359.1 NW_017852038.1 26929.1 -0.25 0.002 profilin%2C transcript variant X1
XM_019904372.1 NW_017852038.1 2151.5 0.42 0.006 ubiquitin-conjugating enzyme E2 N-like
XM_019904387.1 NW_017852038.1 4330.4 -0.59 0.000 protein tramtrack%2C alpha isoform-like%2C transcript variant X1
XM_019904398.1 NW_017852038.1 3594.6 -0.53 0.004 uncharacterized LOC109537597%2C transcript variant X1
XM_019904417.1 NW_017852038.1 716.7 1.03 0.005 follicle cell protein 3C-1
XM_019904427.1 NW_017848330.1 881.2 -0.71 0.000 beta-1%2C4-glucuronyltransferase 1-like

171
XM_019904429.1 NW_017852040.1 1301.1 0.28 0.001 golgin-45%2C transcript variant X1
XM_019904514.1 NW_017848363.1 48.0 -0.84 0.008 cytochrome P450 307a1-like
XM_019904512.1 NW_017852043.1 994.6 0.38 0.002 zinc finger and SCAN domain-containing protein 12-like
XM_019904515.1 NW_017852043.1 2438.3 0.33 0.004 chromobox protein homolog 5
XM_019904524.1 NW_017852043.1 18685.4 -0.34 0.002 puromycin-sensitive aminopeptidase
XM_019904538.1 NW_017852043.1 602.1 0.34 0.001 THUMP domain-containing protein 1 homolog
XM_019904540.1 NW_017852043.1 2258.1 -1.04 0.000 zinc finger protein 2 homolog%2C transcript variant X1
XM_019904543.1 NW_017852043.1 46.4 -1.38 0.001 enkurin
XM_019904553.1 NW_017852043.1 550.8 0.41 0.001 U6 snRNA-associated Sm-like protein LSm5%2C transcript variant X1
XM_019904572.1 NW_017852046.1 3329.1 -1.43 0.000 proton-coupled amino acid transporter-like protein pathetic%2C transcript variant X1
XM_019904602.1 NW_017848364.1 47.6 -0.83 0.009 cytochrome P450 307a1-like
XM_019904601.1 NW_017852049.1 2531.5 0.31 0.003 leucine-rich repeat-containing protein 40-like%2C transcript variant X1
XM_019904604.1 NW_017852049.1 20250.4 -0.64 0.001 alcohol dehydrogenase class-3%2C transcript variant X1
XM_019904606.1 NW_017852049.1 6798.8 -0.46 0.003 SH3 domain-binding protein 5 homolog%2C transcript variant X1
XM_019904608.1 NW_017852049.1 4502.3 0.36 0.006 protein l(2)37Cc
XM_019904612.1 NW_017852049.1 3129.6 0.53 0.009 dnaJ homolog subfamily C member 8
XM_019904616.1 NW_017852049.1 173.2 0.72 0.001 uncharacterized LOC109537746%2C transcript variant X1
XM_019904632.1 NW_017852049.1 13392.5 0.98 0.000 ornithine aminotransferase%2C mitochondrial%2C transcript variant X1
XM_019904647.1 NW_017852049.1 5975.3 -0.50 0.000 phosphoacetylglucosamine mutase
XM_019904703.1 NW_017845370.1 1440.7 1.35 0.001 prostaglandin reductase 1-like
XM_019904670.1 NW_017852052.1 1388.2 -0.49 0.003 protein son of sevenless
XM_019904671.1 NW_017852052.1 1280.0 0.67 0.000 116 kDa U5 small nuclear ribonucleoprotein component
XM_019904674.1 NW_017852052.1 414.3 0.74 0.000 zinc finger protein rotund-like%2C transcript variant X1
XM_019904682.1 NW_017852052.1 189.1 0.77 0.001 flocculation protein FLO11-like
XM_019904683.1 NW_017852052.1 9450.6 0.40 0.004 46 kDa FK506-binding nuclear protein
XM_019904698.1 NW_017852055.1 711.5 1.00 0.000 uncharacterized LOC109537806
XM_019904704.1 NW_017852055.1 65.7 -1.49 0.000 histidine-rich glycoprotein-like
XM_019904715.1 NW_017852055.1 1213.1 0.65 0.000 uncharacterized LOC109537816%2C transcript variant X1
XM_019904733.1 NW_017852055.1 7958.9 -0.37 0.002 dyslexia-associated protein KIAA0319-like protein
XM_019904734.1 NW_017852055.1 780.5 0.55 0.000 erlin-1-like
XM_019904743.1 NW_017852055.1 9998.8 -1.13 0.000 uncharacterized LOC109537831%2C transcript variant X1
XR_002171975.1 NW_017852055.1 11.4 -1.24 0.001 uncharacterized LOC109537834
XM_019904761.1 NW_017852055.1 771.6 -0.94 0.002 calcium-activated chloride channel regulator 4-like
XM_019904767.1 NW_017852055.1 6380.6 -0.48 0.007 dihydropteridine reductase

172
XM_019904781.1 NW_017852055.1 1324.6 0.41 0.001 cyclin-dependent kinase 2-associated protein 1-like%2C transcript variant X1
XM_019904790.1 NW_017852055.1 55.5 -0.88 0.003 uncharacterized LOC109537861
XR_002171981.1 NW_017852056.1 1677.0 0.98 0.000 uncharacterized LOC109537880
XM_019904804.1 NW_017852056.1 10149.9 -1.01 0.001 DE-cadherin
XM_019904809.1 NW_017852056.1 5036.9 -1.02 0.000 transforming acidic coiled-coil-containing protein 1%2C transcript variant X1
XM_019904814.1 NW_017852056.1 3301.3 -0.51 0.001 HEAT repeat-containing protein 5B%2C transcript variant X1
XM_019904822.1 NW_017848453.1 348.5 0.34 0.009 WD and tetratricopeptide repeats protein 1-like
XM_019904826.1 NW_017852056.1 4916.1 -0.47 0.007 solute carrier family 12 member 8
XM_019904827.1 NW_017852056.1 8285.3 -0.89 0.000 rab11 family-interacting protein 1%2C transcript variant X1
XM_019904829.1 NW_017852056.1 2276.8 0.81 0.009
lipoamide acyltransferase component of branched-chain alpha-keto acid dehydrogenase complex%2C mitochondrial%2C transcript variant X1
XM_019904838.1 NW_017852056.1 4587.8 -0.49 0.008 endophilin-A%2C transcript variant X1
XM_019904849.1 NW_017848457.1 3082.2 -0.64 0.004 serine protease 7-like
XM_019904883.1 NW_017852056.1 1174.5 0.32 0.002 leishmanolysin-like peptidase
XM_019904896.1 NW_017852056.1 7453.4 -0.61 0.000 transcriptional coactivator YAP1-A%2C transcript variant X1
XM_019904902.1 NW_017852056.1 7523.8 -0.81 0.000 neuroglian%2C transcript variant X1
XM_019904930.1 NW_017852056.1 3391.8 -0.56 0.000 dual specificity tyrosine-phosphorylation-regulated kinase 2%2C transcript variant X1
XM_019904932.1 NW_017852056.1 1146.8 0.30 0.009 protein SHQ1 homolog
XM_019904933.1 NW_017852056.1 975.7 -0.55 0.001 BTB/POZ domain-containing protein 7%2C transcript variant X1
XM_019904937.1 NW_017848485.1 775.0 0.36 0.002 N-alpha-acetyltransferase 15%2C NatA auxiliary subunit-like
XM_019904944.1 NW_017852056.1 2680.1 -0.74 0.002 steroid receptor seven-up%2C isoforms B/C%2C transcript variant X1
XM_019904951.1 NW_017848485.1 591.8 0.34 0.001 DNA-directed RNA polymerase III subunit RPC3-like
XM_019904949.1 NW_017852056.1 5017.8 -1.61 0.000 protein windpipe
XM_019904956.1 NW_017852056.1 6662.2 0.70 0.004 5-aminolevulinate synthase%2C erythroid-specific%2C mitochondrial
XR_002171987.1 NW_017852056.1 1153.7 -0.55 0.000 uncharacterized LOC109537964%2C transcript variant X1
XM_019904971.1 NW_017852056.1 5315.4 -0.45 0.000 PRA1 family protein 3
XM_019904979.1 NW_017852056.1 935.3 1.04 0.000 uncharacterized LOC109537971
XM_019904980.1 NW_017852056.1 646.7 1.06 0.000 actin-like protein 6B%2C transcript variant X1
XM_019904982.1 NW_017852056.1 1431.3 0.51 0.005 battenin%2C transcript variant X1
XM_019904987.1 NW_017852056.1 764.5 0.54 0.001 protein patched
XM_019904991.1 NW_017852056.1 5139.1 -0.36 0.000 ubiquitin-conjugating enzyme E2 H%2C transcript variant X1
XM_019905003.1 NW_017852056.1 681.9 -0.43 0.001 mothers against decapentaplegic homolog 4
XM_019905005.1 NW_017852056.1 12831.0 -0.51 0.002 translocon-associated protein subunit gamma

173
XM_019905006.1 NW_017852056.1 28073.7 1.02 0.001 uncharacterized LOC109537989
XM_019905013.1 NW_017852056.1 3552.1 -0.82 0.000 caspase-3-like%2C transcript variant X1
XM_019905021.1 NW_017852056.1 1010.2 -0.81 0.001 protein limb expression 1 homolog%2C transcript variant X1
XM_019905038.1 NW_017852056.1 2588.1 0.40 0.000 UDP-xylose and UDP-N-acetylglucosamine transporter-like%2C transcript variant X1
XM_019905050.1 NW_017852056.1 928.3 0.84 0.003 very-long-chain 3-oxoacyl-CoA reductase
XM_019905052.1 NW_017852056.1 1242.4 1.03 0.001 protein eiger
XM_019905062.1 NW_017852056.1 444.7 1.00 0.000 protein rolling stone-like%2C transcript variant X1
XR_002171995.1 NW_017852056.1 31.2 1.38 0.000 uncharacterized LOC109538034
XM_019905074.1 NW_017852056.1 325.1 0.45 0.006 protein RRNAD1-like
XM_019905077.1 NW_017852056.1 99.8 -0.68 0.001 uncharacterized LOC109538037
XM_019905078.1 NW_017852056.1 11.1 -1.12 0.001 uncharacterized LOC109538038
XM_019905080.1 NW_017852057.1 580.9 1.01 0.000 uncharacterized LOC109538041
XM_019905081.1 NW_017852057.1 1368.1 1.01 0.000 uncharacterized LOC109538042%2C transcript variant X1
XM_019905083.1 NW_017852058.1 114.8 0.49 0.002 zinc finger protein 878-like
XM_019905084.1 NW_017852058.1 72.3 0.70 0.001 zinc finger protein OZF-like
XM_019905085.1 NW_017852058.1 115.3 0.42 0.008 zinc finger protein 268-like
XM_019905086.1 NW_017852058.1 120.1 0.61 0.000 zinc finger protein 184-like
XM_019905088.1 NW_017852058.1 100.4 0.50 0.006 zinc finger protein 678-like
XM_019905089.1 NW_017852058.1 44.0 0.68 0.001 zinc finger protein 883-like
XM_019905090.1 NW_017852058.1 205.4 0.71 0.000 zinc finger protein 37-like
XM_019905094.1 NW_017852058.1 9171.2 0.27 0.000 uncharacterized LOC109538054
XM_019905096.1 NW_017852058.1 1105.6 0.52 0.000 protein arginine N-methyltransferase 7%2C transcript variant X1
XM_019905101.1 NW_017852058.1 15237.1 -1.02 0.004 heat shock protein 68-like
XM_019905105.1 NW_017852058.1 6958.2 -1.39 0.000 heat shock protein 70 A1-like%2C transcript variant X1
XM_019905107.1 NW_017852058.1 90.9 0.53 0.009 zinc finger protein OZF-like
XM_019905108.1 NW_017852058.1 279.1 0.34 0.005 zinc finger protein 182-like
XM_019905109.1 NW_017852058.1 57.8 0.59 0.001 zinc finger protein 62-like
XM_019905111.1 NW_017852058.1 274.7 0.40 0.001 zinc finger protein OZF-like
XM_019905112.1 NW_017852058.1 116.6 0.72 0.002 zinc finger protein 525-like
XM_019905113.1 NW_017852058.1 34703.9 0.91 0.000 actin%2C muscle-like
XM_019905114.1 NW_017852058.1 190.5 0.45 0.006 gastrula zinc finger protein XlCGF8.2DB-like
XM_019905116.1 NW_017852058.1 93.6 0.54 0.000 oocyte zinc finger protein XlCOF19-like
XM_019905117.1 NW_017852058.1 45.5 0.73 0.001 zinc finger protein 525-like
XM_019905119.1 NW_017852058.1 13.0 1.21 0.001 zinc finger protein 660-like
XM_019905136.1 NW_017852058.1 2174.6 -0.37 0.003 RING finger and SPRY domain-containing protein 1-like

174
XM_019905138.1 NW_017852058.1 1165.0 -0.39 0.005 nuclear hormone receptor FTZ-F1%2C transcript variant X1
XM_019905147.1 NW_017848551.1 438.6 0.64 0.001 uncharacterized LOC109538087
XR_002171997.1 NW_017845408.1 21235.4 -1.92 0.000 uncharacterized LOC109538091
XM_019905168.1 NW_017852058.1 2649.3 0.89 0.000 glutathione S-transferase-like
XM_019905169.1 NW_017852058.1 10186.5 -0.29 0.009 glutathione S-transferase-like
XM_019905177.1 NW_017852058.1 1047.8 0.33 0.003 serine/threonine-protein phosphatase 4 regulatory subunit 4-like%2C transcript variant X1
XM_019905183.1 NW_017852058.1 331.3 0.91 0.000 haloacid dehalogenase-like hydrolase domain-containing protein 2
XM_019905191.1 NW_017852058.1 2469.0 0.40 0.001 DNA topoisomerase 2
XM_019905198.1 NW_017848559.1 1705.3 -1.80 0.000 uncharacterized LOC109538113
XM_019905206.1 NW_017852058.1 724.0 0.47 0.000 tctex1 domain-containing protein 2-like
XM_019905209.1 NW_017852059.1 275.5 -0.92 0.001 paired box protein Pax-6-like
XM_019905217.1 NW_017848565.1 3261.8 -0.57 0.000 fasciculation and elongation protein zeta-2-like
XM_019905270.1 NW_017845415.1 56.4 -1.32 0.001 E3 ubiquitin-protein ligase MARCH3-like
XM_019905236.1 NW_017852059.1 10378.3 1.07 0.000 alcohol dehydrogenase [NADP(+)]-like
XM_019905252.1 NW_017852059.1 338.0 2.03 0.000 rhamnogalacturonate lyase-like
XM_019905254.1 NW_017852059.1 5787.3 -0.45 0.000 heat shock protein 75 kDa%2C mitochondrial
XM_019905260.1 NW_017852060.1 11601.3 0.60 0.004 prostaglandin reductase 1-like
XM_019905264.1 NW_017852060.1 1584.5 -1.29 0.000 leucine-zipper-like transcriptional regulator 1%2C transcript variant X1
XM_019905280.1 NW_017852061.1 2201.1 -0.41 0.002 rap1 GTPase-GDP dissociation stimulator 1-B
XM_019905295.1 NW_017852061.1 2460.2 -0.32 0.000 uncharacterized protein CG5098%2C transcript variant X1
XM_019905303.1 NW_017852061.1 1356.7 1.41 0.000 protein bfr2-like%2C transcript variant X1
XM_019905321.1 NW_017852061.1 4177.1 1.24 0.002 sodium-independent sulfate anion transporter-like%2C transcript variant X1
XM_019905327.1 NW_017852061.1 493.3 0.29 0.006 lethal(3)malignant brain tumor-like protein 3%2C transcript variant X1
XR_002172008.1 NW_017852061.1 29.1 -1.02 0.002 uncharacterized LOC109538197
XM_019905347.1 NW_017852061.1 27.2 -0.81 0.003 uncharacterized LOC109538205
XM_019905350.1 NW_017852062.1 27.0 -1.49 0.000 homeotic protein proboscipedia-like
XM_019905351.1 NW_017852062.1 4511.3 1.00 0.000 homeobox protein Hox-B3a-like%2C transcript variant X1
XM_019905353.1 NW_017852062.1 279.6 -0.96 0.000 homeotic protein antennapedia-like%2C transcript variant X1
XM_019905375.1 NW_017852064.1 407.4 0.57 0.001 diphthine methyltransferase
XM_019905381.1 NW_017852064.1 24.9 1.24 0.002 uncharacterized LOC109538238
XM_019905387.1 NW_017852064.1 7102.8 -0.29 0.008 ubiquitin carboxyl-terminal hydrolase 7
XM_019905389.1 NW_017852064.1 2361.5 -0.90 0.000 protein asunder%2C transcript variant X1
XR_002172015.1 NW_017848626.1 86.7 0.65 0.001 uncharacterized LOC109538248
XM_019905398.1 NW_017852064.1 1622.4 0.37 0.006 dynein assembly factor 5%2C axonemal%2C transcript variant X1

175
XM_019905402.1 NW_017852064.1 208.9 0.75 0.000 PI-PLC X domain-containing protein 3-like%2C transcript variant X1
XM_019905407.1 NW_017852064.1 8648.1 0.61 0.000 GMP synthase [glutamine-hydrolyzing]%2C transcript variant X1
XM_019905415.1 NW_017852064.1 502.1 2.00 0.000 uncharacterized LOC109538260
XM_019905416.1 NW_017852064.1 480.8 0.39 0.008 centrosomal protein of 162 kDa%2C transcript variant X1
XM_019905419.1 NW_017852064.1 22013.6 1.95 0.000 serine hydroxymethyltransferase%2C cytosolic%2C transcript variant X1
XM_019905421.1 NW_017852064.1 175.7 -0.73 0.000 carboxypeptidase B-like
XR_002172018.1 NW_017852064.1 831.3 1.99 0.000 protein KIAA0556-like%2C transcript variant X1
XM_019905427.1 NW_017852064.1 3005.5 -0.56 0.000 class A basic helix-loop-helix protein 15-like%2C transcript variant X1
XM_019905459.1 NW_017852064.1 13883.3 1.09 0.000 galactokinase-like
XM_019905461.1 NW_017852064.1 19096.8 1.13 0.002 trifunctional purine biosynthetic protein adenosine-3
XM_019905473.1 NW_017852064.1 481.6 -0.27 0.000 triokinase/FMN cyclase-like
XM_019905483.1 NW_017848653.1 931.0 0.39 0.000 N-alpha-acetyltransferase 15%2C NatA auxiliary subunit-like
XM_019905485.1 NW_017852064.1 257.7 -1.11 0.006 perlucin-like protein
XM_019905486.1 NW_017852064.1 1951.1 0.28 0.004 monocarboxylate transporter 10-like%2C transcript variant X1
XM_019905490.1 NW_017852064.1 10248.2 -0.88 0.000 dual specificity mitogen-activated protein kinase kinase 4%2C transcript variant X1
XM_019905493.1 NW_017852064.1 2399.2 -0.74 0.000 ankyrin repeat domain-containing protein 13D%2C transcript variant X1
XM_019905500.1 NW_017852064.1 24447.5 0.20 0.007 eukaryotic translation initiation factor 5A%2C transcript variant X1
XM_019905512.1 NW_017852064.1 1866.2 1.00 0.000 tolloid-like protein 1%2C transcript variant X1
XM_019905515.1 NW_017852064.1 574.1 -1.09 0.000 glycine receptor subunit alpha-2-like
XM_019905525.1 NW_017852064.1 1202.0 0.44 0.003 septin-2%2C transcript variant X1
XM_019905531.1 NW_017852064.1 44.5 -1.09 0.007 uncharacterized LOC109538333
XM_019905539.1 NW_017852064.1 1556.2 0.29 0.006 E3 ubiquitin-protein ligase CHIP
XM_019905542.1 NW_017852064.1 4372.4 -0.63 0.000 retinal dehydrogenase 1
XM_019905553.1 NW_017852064.1 664.9 0.97 0.000 ovarian-specific serine/threonine-protein kinase Lok-like
XM_019905567.1 NW_017852064.1 9.4 1.40 0.003 uncharacterized LOC109538355%2C transcript variant X1
XM_019905572.1 NW_017852064.1 1156.7 -0.79 0.000 putative inorganic phosphate cotransporter%2C transcript variant X1
XM_019905586.1 NW_017852064.1 1435.4 0.34 0.006 GTP-binding protein 128up
XM_019905589.1 NW_017852064.1 412.9 -0.50 0.000 polycomb group protein Pc-like
XM_019905599.1 NW_017848681.1 463.5 0.83 0.001 retinol dehydrogenase 13-like
NW_017852067.1_75595-89820 NW_017852067.1 31.9 1.10 0.005 #N/A
XM_019905610.1 NW_017852067.1 3196.9 -0.33 0.004 uncharacterized LOC109538396%2C transcript variant X1
XM_019905621.1 NW_017852067.1 541.2 0.40 0.002 translation initiation factor IF-3%2C mitochondrial
XM_019905629.1 NW_017852068.1 2326.0 -0.46 0.000 sex determination protein fruitless%2C transcript variant X1

176
XM_019905645.1 NW_017852068.1 7744.1 -0.79 0.000 vacuolar protein sorting-associated protein 13C%2C transcript variant X1
XM_019905653.1 NW_017852068.1 5320.3 0.37 0.001 T-complex protein 1 subunit beta
XM_019905658.1 NW_017848706.1 18.7 -1.44 0.000 iodotyrosine deiodinase 1-like
XR_002172040.1 NW_017852068.1 1462.8 0.24 0.009 pleiotropic regulator 1%2C transcript variant X1
XM_019905672.1 NW_017852068.1 701.5 0.49 0.000 peptidyl-prolyl cis-trans isomerase-like 3%2C transcript variant X1
XM_019905679.1 NW_017852068.1 873.3 0.60 0.000 DNA replication licensing factor Mcm7-like
XM_019905682.1 NW_017852068.1 951.1 0.36 0.001 mitotic checkpoint protein BUB3-like
XM_019905688.1 NW_017852068.1 1447.2 0.33 0.003 probable ATP-dependent RNA helicase YTHDC2%2C transcript variant X1
XM_019905691.1 NW_017852068.1 597.3 0.55 0.000 uncharacterized LOC109538449%2C transcript variant X1
XM_019905694.1 NW_017852068.1 1305.3 0.51 0.001 nucleoporin NDC1
XM_019905706.1 NW_017852070.1 980.8 0.56 0.009 polyamine-modulated factor 1-binding protein 1-like
XM_019905707.1 NW_017852070.1 874.9 1.10 0.004 prostaglandin reductase 1-like
XM_019905708.1 NW_017852070.1 3895.4 -0.56 0.005 charged multivesicular body protein 2a
XM_019905709.1 NW_017852070.1 2519.7 0.84 0.000 protein Smaug homolog 1
XM_019905719.1 NW_017852070.1 3456.4 -0.32 0.001 DENN domain-containing protein 5B
XM_019905720.1 NW_017852070.1 510.5 1.08 0.003 UDP-glucuronosyltransferase 2B17-like
XM_019905723.1 NW_017852070.1 666.6 -1.12 0.000 uncharacterized LOC109538479
XM_019905724.1 NW_017852070.1 184.6 -0.85 0.004 uncharacterized LOC109538480
XM_019905728.1 NW_017852070.1 1233.4 0.93 0.000 lysoplasmalogenase-like protein TMEM86A
XM_019905730.1 NW_017852070.1 141.7 -0.95 0.001 uncharacterized LOC109538486%2C transcript variant X1
XM_019905734.1 NW_017852071.1 53.5 0.79 0.004 uncharacterized LOC109538489
XM_019905736.1 NW_017852071.1 384.7 0.80 0.000 carboxy-terminal kinesin 2-like
XM_019905739.1 NW_017852071.1 1147.3 0.45 0.003 tail-anchored protein insertion receptor WRB-like
XM_019905740.1 NW_017852071.1 2215.6 0.95 0.000 kinesin-like protein subito%2C transcript variant X1
XM_019905744.1 NW_017852072.1 4595.4 0.44 0.000 modifier of mdg4-like%2C transcript variant X1
XM_019905758.1 NW_017848723.1 695.4 0.35 0.000 death-associated inhibitor of apoptosis 2-like
XM_019905755.1 NW_017852072.1 1186.9 0.25 0.001 cyclin-dependent kinase 2-like
XM_019905761.1 NW_017852072.1 4767.4 1.37 0.000 alanine--glyoxylate aminotransferase 2-like
XM_019905774.1 NW_017852073.1 136.2 1.01 0.002 uncharacterized LOC109538522
XM_019905782.1 NW_017848744.1 951.1 0.63 0.002 RNA-binding protein MEX3B-like
XM_019905796.1 NW_017852073.1 2783.9 0.29 0.000 cysteine protease ATG4B
XM_019905798.1 NW_017852073.1 1505.7 0.28 0.001 protein CWC15 homolog%2C transcript variant X1
XM_019905800.1 NW_017852073.1 5779.2 -0.19 0.004 ras-related protein Rab-14%2C transcript variant X1
NW_017848745.1_5706-7006 NW_017848745.1 457.4 0.35 0.008 #N/A
XM_019905803.1 NW_017852073.1 1392.5 1.86 0.000 cytochrome b5-like

177
XM_019905804.1 NW_017852073.1 432.1 1.03 0.007 acyl-CoA synthetase family member 2%2C mitochondrial-like
XM_019905808.1 NW_017852073.1 2884.9 0.40 0.008 probable histone-lysine N-methyltransferase CG1716
XM_019905814.1 NW_017852073.1 474.3 0.92 0.000 kinesin-like protein KIF14
XM_019905827.1 NW_017852073.1 567.8 0.45 0.002 N-terminal Xaa-Pro-Lys N-methyltransferase 1
XM_019905833.1 NW_017852073.1 952.5 0.55 0.001 H/ACA ribonucleoprotein complex subunit 2-like protein
XM_019905837.1 NW_017848746.1 951.1 0.63 0.002 RNA-binding protein MEX3B-like
XM_019905845.1 NW_017852073.1 1136.6 1.52 0.000 acyl-CoA synthetase family member 2%2C mitochondrial-like%2C transcript variant X1
XM_019905869.1 NW_017852073.1 1347.6 -0.66 0.007 uncharacterized LOC109538578%2C transcript variant X1
XM_019905900.1 NW_017852073.1 1451.4 0.37 0.000 pre-mRNA 3' end processing protein WDR33
XM_019905910.1 NW_017852073.1 9652.5 -0.61 0.000 serine/threonine-protein kinase mig-15%2C transcript variant X1
XM_019905923.1 NW_017852073.1 1264.7 0.48 0.000 probable 28S ribosomal protein S25%2C mitochondrial%2C transcript variant X1
XM_019905926.1 NW_017852073.1 11973.5 0.80 0.001 collagen alpha-5(IV) chain
XM_019905945.1 NW_017852073.1 106424.2 0.50 0.000 Y-box factor homolog%2C transcript variant X1
XM_019905948.1 NW_017852073.1 368.9 0.36 0.000 uncharacterized LOC109538628
XM_019905954.1 NW_017852073.1 1725.9 0.72 0.001 uncharacterized LOC109538632
XM_019905971.1 NW_017852073.1 478.3 0.43 0.006 WD repeat domain-containing protein 83
XR_002172056.1 NW_017848758.1 69.7 -1.36 0.000 uncharacterized LOC109538642
XM_019905988.1 NW_017852073.1 1589.8 -0.47 0.001 putative Polycomb group protein ASXL3%2C transcript variant X1
XM_019905992.1 NW_017852073.1 489.3 0.54 0.001 phosphatidylinositol N-acetylglucosaminyltransferase subunit C
XM_019906012.1 NW_017852073.1 1661.8 -0.74 0.001 aromatic-L-amino-acid decarboxylase%2C transcript variant X1
XM_019906018.1 NW_017852073.1 2776.9 0.38 0.000 calcium uptake protein 1 homolog%2C mitochondrial-like%2C transcript variant X1
XM_019906021.1 NW_017852073.1 14311.2 -1.23 0.000 ras-associated and pleckstrin homology domains-containing protein 1
XR_002172059.1 NW_017852073.1 209.8 -0.95 0.000 uncharacterized LOC109538667
XM_019906030.1 NW_017852073.1 49.3 -1.09 0.010 protein artichoke
XM_019906033.1 NW_017852073.1 1992.7 -0.63 0.000 uncharacterized LOC109538678
XM_019906037.1 NW_017852073.1 2802.7 -0.30 0.004 division abnormally delayed protein
XM_019906049.1 NW_017852073.1 1984.4 0.43 0.000 COP9 signalosome complex subunit 6
XM_019906085.1 NW_017852073.1 1102.1 1.04 0.000 E3 ubiquitin-protein ligase SINAT2-like%2C transcript variant X1
XM_019906098.1 NW_017852074.1 2709.0 -0.41 0.003 zinc/cadmium resistance protein-like
XM_019906099.1 NW_017852074.1 3885.6 -0.37 0.001 zinc/cadmium resistance protein-like
XM_019906110.1 NW_017852075.1 24.6 -1.50 0.000 MORN repeat-containing protein 3-like
XM_019906113.1 NW_017852075.1 388.0 -0.38 0.008 uncharacterized LOC109538740
XM_019906123.1 NW_017852075.1 3206.4 -0.75 0.001 inositol hexakisphosphate kinase 1%2C transcript variant X1
XM_019906136.1 NW_017852075.1 435.7 1.17 0.000 growth/differentiation factor 11
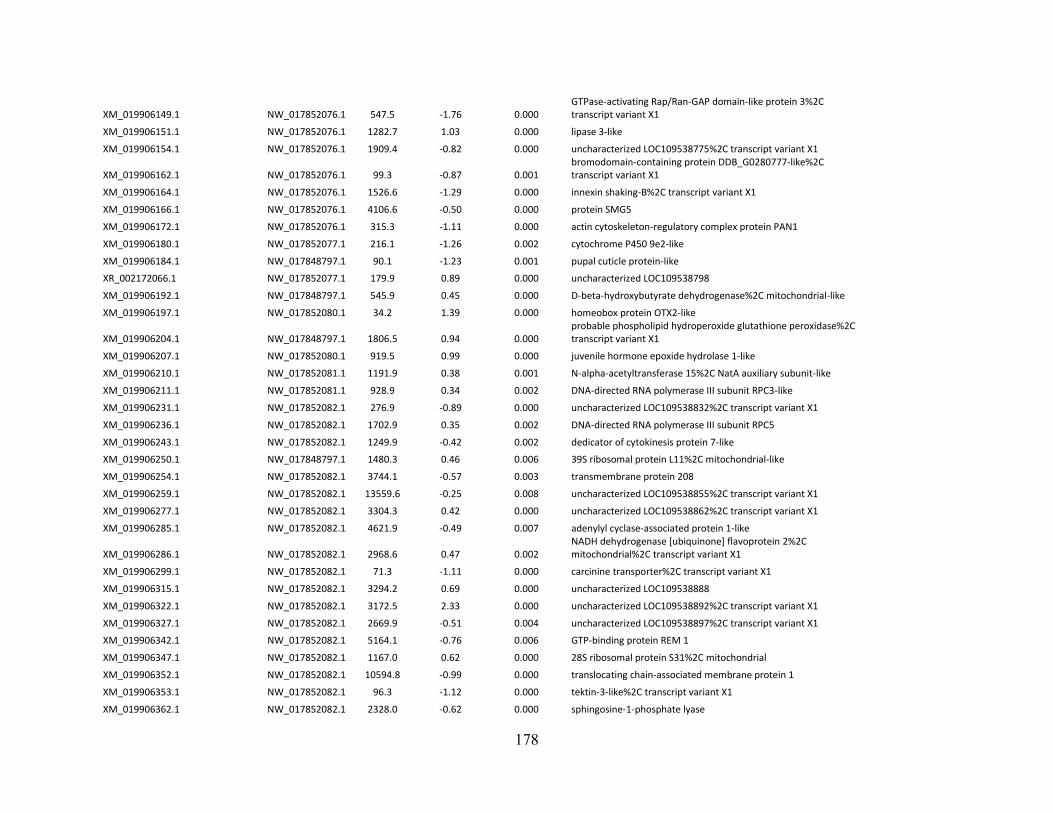
178
XM_019906149.1 NW_017852076.1 547.5 -1.76 0.000 GTPase-activating Rap/Ran-GAP domain-like protein 3%2C transcript variant X1
XM_019906151.1 NW_017852076.1 1282.7 1.03 0.000 lipase 3-like
XM_019906154.1 NW_017852076.1 1909.4 -0.82 0.000 uncharacterized LOC109538775%2C transcript variant X1
XM_019906162.1 NW_017852076.1 99.3 -0.87 0.001 bromodomain-containing protein DDB_G0280777-like%2C transcript variant X1
XM_019906164.1 NW_017852076.1 1526.6 -1.29 0.000 innexin shaking-B%2C transcript variant X1
XM_019906166.1 NW_017852076.1 4106.6 -0.50 0.000 protein SMG5
XM_019906172.1 NW_017852076.1 315.3 -1.11 0.000 actin cytoskeleton-regulatory complex protein PAN1
XM_019906180.1 NW_017852077.1 216.1 -1.26 0.002 cytochrome P450 9e2-like
XM_019906184.1 NW_017848797.1 90.1 -1.23 0.001 pupal cuticle protein-like
XR_002172066.1 NW_017852077.1 179.9 0.89 0.000 uncharacterized LOC109538798
XM_019906192.1 NW_017848797.1 545.9 0.45 0.000 D-beta-hydroxybutyrate dehydrogenase%2C mitochondrial-like
XM_019906197.1 NW_017852080.1 34.2 1.39 0.000 homeobox protein OTX2-like
XM_019906204.1 NW_017848797.1 1806.5 0.94 0.000 probable phospholipid hydroperoxide glutathione peroxidase%2C transcript variant X1
XM_019906207.1 NW_017852080.1 919.5 0.99 0.000 juvenile hormone epoxide hydrolase 1-like
XM_019906210.1 NW_017852081.1 1191.9 0.38 0.001 N-alpha-acetyltransferase 15%2C NatA auxiliary subunit-like
XM_019906211.1 NW_017852081.1 928.9 0.34 0.002 DNA-directed RNA polymerase III subunit RPC3-like
XM_019906231.1 NW_017852082.1 276.9 -0.89 0.000 uncharacterized LOC109538832%2C transcript variant X1
XM_019906236.1 NW_017852082.1 1702.9 0.35 0.002 DNA-directed RNA polymerase III subunit RPC5
XM_019906243.1 NW_017852082.1 1249.9 -0.42 0.002 dedicator of cytokinesis protein 7-like
XM_019906250.1 NW_017848797.1 1480.3 0.46 0.006 39S ribosomal protein L11%2C mitochondrial-like
XM_019906254.1 NW_017852082.1 3744.1 -0.57 0.003 transmembrane protein 208
XM_019906259.1 NW_017852082.1 13559.6 -0.25 0.008 uncharacterized LOC109538855%2C transcript variant X1
XM_019906277.1 NW_017852082.1 3304.3 0.42 0.000 uncharacterized LOC109538862%2C transcript variant X1
XM_019906285.1 NW_017852082.1 4621.9 -0.49 0.007 adenylyl cyclase-associated protein 1-like
XM_019906286.1 NW_017852082.1 2968.6 0.47 0.002 NADH dehydrogenase [ubiquinone] flavoprotein 2%2C mitochondrial%2C transcript variant X1
XM_019906299.1 NW_017852082.1 71.3 -1.11 0.000 carcinine transporter%2C transcript variant X1
XM_019906315.1 NW_017852082.1 3294.2 0.69 0.000 uncharacterized LOC109538888
XM_019906322.1 NW_017852082.1 3172.5 2.33 0.000 uncharacterized LOC109538892%2C transcript variant X1
XM_019906327.1 NW_017852082.1 2669.9 -0.51 0.004 uncharacterized LOC109538897%2C transcript variant X1
XM_019906342.1 NW_017852082.1 5164.1 -0.76 0.006 GTP-binding protein REM 1
XM_019906347.1 NW_017852082.1 1167.0 0.62 0.000 28S ribosomal protein S31%2C mitochondrial
XM_019906352.1 NW_017852082.1 10594.8 -0.99 0.000 translocating chain-associated membrane protein 1
XM_019906353.1 NW_017852082.1 96.3 -1.12 0.000 tektin-3-like%2C transcript variant X1
XM_019906362.1 NW_017852082.1 2328.0 -0.62 0.000 sphingosine-1-phosphate lyase

179
XM_019906367.1 NW_017848819.1 379.5 0.38 0.009 post-GPI attachment to proteins factor 2-like
XM_019906385.1 NW_017852083.1 104.8 1.72 0.000 SUN domain-containing protein 3-like
XM_019906390.1 NW_017848840.1 9832.9 -1.16 0.000 nose resistant to fluoxetine protein 6-like%2C transcript variant X1
XM_019906403.1 NW_017852083.1 13561.7 -0.49 0.002 myosin heavy chain%2C non-muscle%2C transcript variant X1
XM_019906406.1 NW_017852083.1 2646.1 -0.58 0.001 mediator of RNA polymerase II transcription subunit 13%2C transcript variant X1
XM_019906437.1 NW_017852083.1 2716.2 -0.40 0.001 uncharacterized protein CG7065-like%2C transcript variant X1
XM_019906458.1 NW_017852083.1 1129.4 -0.88 0.000 switch-associated protein 70-like%2C transcript variant X1
XM_019906460.1 NW_017852083.1 560.5 0.52 0.005 tRNA (cytosine-5-)-methyltransferase%2C transcript variant X1
XM_019906467.1 NW_017852083.1 17582.2 1.80 0.000
bifunctional methylenetetrahydrofolate dehydrogenase/cyclohydrolase%2C mitochondrial%2C transcript variant X1
XM_019906479.1 NW_017848844.1 265.1 -0.89 0.000 sine oculis-binding protein homolog
XM_019906487.1 NW_017852083.1 2145.8 -0.64 0.007 sodium-independent sulfate anion transporter-like%2C transcript variant X1
XM_019906498.1 NW_017852083.1 922.0 -0.85 0.005 sialin%2C transcript variant X1
XM_019906503.1 NW_017852083.1 2156.5 1.21 0.002 uncharacterized LOC109539000
XM_019906507.1 NW_017852083.1 733.7 1.11 0.000 uncharacterized LOC109539002
XM_019906512.1 NW_017852083.1 3495.6 0.83 0.002 alkaline phosphatase%2C tissue-nonspecific isozyme-like%2C transcript variant X1
XM_019906522.1 NW_017852083.1 798.1 0.47 0.000 uncharacterized LOC109539013
XM_019906527.1 NW_017852083.1 1266.7 0.44 0.001 coiled-coil domain-containing protein 115
XM_019906531.1 NW_017852083.1 2571.1 1.05 0.000 cyclin-A2-like
XM_019906532.1 NW_017852083.1 130.1 -1.14 0.000 uncharacterized LOC109539021%2C transcript variant X1
XM_019906540.1 NW_017852084.1 352.4 -0.39 0.007 rho GTPase-activating protein 26-like
XM_019906541.1 NW_017852085.1 851.9 0.88 0.000 anoctamin-5
XM_019906546.1 NW_017852085.1 2069.3 0.49 0.000 NFX1-type zinc finger-containing protein 1-like
XM_019906564.1 NW_017852085.1 1908.9 0.43 0.007 platelet-activating factor acetylhydrolase IB subunit beta homolog
XM_019906568.1 NW_017852085.1 313.3 0.84 0.000 xyloside xylosyltransferase 1-like
XM_019906570.1 NW_017852085.1 101.9 -1.13 0.000 transmembrane protein 189
XM_019906574.1 NW_017852086.1 35.3 -0.85 0.002 protein glass-like
XM_019906639.1 NW_017852086.1 28125.2 -0.64 0.001 CAP-Gly domain-containing linker protein 2%2C transcript variant X1
XM_019906660.1 NW_017852086.1 4590.2 -0.29 0.001 cyclin-G-associated kinase%2C transcript variant X1
XM_019906683.1 NW_017852086.1 678.6 0.59 0.010 lymphokine-activated killer T-cell-originated protein kinase
XM_019906686.1 NW_017852086.1 7506.5 0.58 0.000 proteasome activator complex subunit 3%2C transcript variant X1
XM_019906689.1 NW_017852086.1 9065.4 0.37 0.007 nucleoplasmin-like protein%2C transcript variant X1
XM_019906696.1 NW_017852086.1 3279.9 -0.40 0.001 regulator of G-protein signaling 11%2C transcript variant X1

180
XM_019906708.1 NW_017852086.1 1627.9 0.26 0.002 mitochondrial assembly of ribosomal large subunit protein 1
XM_019906710.1 NW_017852086.1 7080.8 0.52 0.000 cyclic AMP-dependent transcription factor ATF-1
XM_019906711.1 NW_017852086.1 2909.7 0.39 0.001 histone H2A deubiquitinase MYSM1-like%2C transcript variant X1
XM_019906720.1 NW_017852086.1 196.6 1.25 0.000 argininosuccinate lyase
XM_019906737.1 NW_017852087.1 1692.2 0.34 0.006 DNA-directed RNA polymerase I subunit RPA43
XM_019906739.1 NW_017852087.1 678.4 0.79 0.000 protein gone early
XM_019906753.1 NW_017852087.1 84.7 -0.56 0.002 fork head domain-containing protein crocodile
XM_019906761.1 NW_017852088.1 1663.9 0.22 0.008 probable peroxisomal membrane protein PEX13
XM_019906769.1 NW_017852088.1 5510.7 1.25 0.000 zinc finger protein 385B-like
XM_019906771.1 NW_017852089.1 2409.4 -0.45 0.002 nuclear factor related to kappa-B-binding protein
XM_019906776.1 NW_017848892.1 4485.6 -0.89 0.000 uncharacterized LOC109539164
XM_019906783.1 NW_017852091.1 355.6 -0.70 0.001 roundabout homolog 1-like
XM_019906786.1 NW_017852091.1 710.8 0.64 0.002 uncharacterized LOC109539177%2C transcript variant X1
XM_019906803.1 NW_017852091.1 977.1 0.34 0.009 polycomb protein EED
XM_019906808.1 NW_017852091.1 1141.6 0.26 0.005 mitochondrial folate transporter/carrier-like
XM_019906814.1 NW_017852091.1 1575.5 0.63 0.000 PHD finger protein 19%2C transcript variant X1
XM_019906826.1 NW_017852091.1 829.9 0.37 0.002 nuclear pore complex protein Nup160 homolog
XM_019906840.1 NW_017852091.1 502.5 -0.69 0.002 uncharacterized LOC109539220
XM_019906853.1 NW_017852091.1 642.0 -0.91 0.000 UPF0565 protein C2orf69 homolog%2C transcript variant X1
XM_019906856.1 NW_017852091.1 1085.6 1.71 0.000 beta-galactosidase-1-like protein 3
XM_019906859.1 NW_017852091.1 3046.0 1.61 0.000 probable U2 small nuclear ribonucleoprotein A'%2C transcript variant X1
XM_019906875.1 NW_017848910.1 418.5 0.42 0.002 protein arginine N-methyltransferase 3-like
XM_019906871.1 NW_017852091.1 577.8 0.37 0.004 DNA replication complex GINS protein PSF1-like
XM_019906876.1 NW_017852091.1 8503.0 -0.70 0.000 probable JmjC domain-containing histone demethylation protein 2C
XM_019906883.1 NW_017852091.1 15441.2 1.03 0.001 protein henna%2C transcript variant X1
XM_019906885.1 NW_017852091.1 39.1 1.04 0.005 tryptase beta-2-like
XM_019906894.1 NW_017852091.1 2286.7 -0.34 0.002 pre-mRNA-splicing factor 38B%2C transcript variant X1
XM_019906902.1 NW_017852091.1 1885.5 -0.37 0.007 D-glucuronyl C5-epimerase%2C transcript variant X1
XM_019906903.1 NW_017852091.1 1218.0 0.32 0.002 nuclear envelope integral membrane protein 1
XM_019906916.1 NW_017852091.1 1665.8 0.28 0.004 stomatin-like protein 2%2C mitochondrial
XM_019906918.1 NW_017852091.1 2361.7 0.35 0.000 39S ribosomal protein L9%2C mitochondrial
XM_019906924.1 NW_017852091.1 110.0 0.47 0.009 zinc finger protein 239-like
XM_019906934.1 NW_017852091.1 2939.0 -0.62 0.000 uncharacterized LOC109539281%2C transcript variant X1
XM_019906948.1 NW_017852091.1 797.1 0.71 0.005 single-minded homolog 1
XR_002172104.1 NW_017852091.1 66.1 -0.97 0.001 uncharacterized LOC109539300

181
XM_019906962.1 NW_017852092.1 272.4 0.41 0.000 transducin-like enhancer protein 4
XM_019906965.1 NW_017852093.1 991.0 0.62 0.000 collagen alpha chain CG42342-like%2C transcript variant X1
XM_019906987.1 NW_017852094.1 7748.6 2.67 0.000 lysosome membrane protein 2-like%2C transcript variant X1
XM_019906992.1 NW_017852095.1 1143.9 -0.63 0.000 rho GTPase-activating protein 21-like
XM_019906993.1 NW_017852095.1 371.2 -0.77 0.001 uncharacterized LOC109539319%2C transcript variant X1
XM_019906998.1 NW_017852095.1 5038.9 -0.45 0.006 X-box-binding protein 1%2C transcript variant X1
XM_019907014.1 NW_017848912.1 791.6 -0.58 0.006 B-cell lymphoma/leukemia 11A-like
XM_019907015.1 NW_017852096.1 678.6 0.60 0.007 dnaJ homolog subfamily C member 22
XM_019907028.1 NW_017852096.1 841.0 0.49 0.002 28S ribosomal protein S9%2C mitochondrial
XM_019907029.1 NW_017852096.1 2828.5 0.85 0.006 diphosphomevalonate decarboxylase%2C transcript variant X1
XM_019907049.1 NW_017852096.1 500.8 0.43 0.009 TFIIH basal transcription factor complex helicase XPD subunit
XM_019907053.1 NW_017852096.1 528.1 0.61 0.000 RNA-binding protein 40
XM_019907058.1 NW_017852096.1 8157.2 1.02 0.009 uncharacterized LOC109539363%2C transcript variant X1
XR_002172109.1 NW_017848915.1 465.1 -0.70 0.001 uncharacterized LOC109539364
XM_019907065.1 NW_017852096.1 1552.4 0.61 0.000 uncharacterized LOC109539367
XM_019907066.1 NW_017852096.1 1225.5 -0.59 0.001 coiled-coil domain-containing protein 102A%2C transcript variant X1
XM_019907069.1 NW_017852096.1 9115.0 -0.46 0.002 protein lifeguard 1-like%2C transcript variant X1
XM_019907074.1 NW_017852096.1 54.6 -1.14 0.000 cingulin-like protein 1
XM_019907086.1 NW_017852096.1 25348.4 0.37 0.007 protein disulfide-isomerase
XM_019907088.1 NW_017852096.1 922.9 0.33 0.009 epimerase family protein SDR39U1%2C transcript variant X1
XM_019907093.1 NW_017852096.1 733.1 0.57 0.000 ankyrin repeat domain-containing protein SOWAHC%2C transcript variant X1
XM_019907095.1 NW_017852096.1 3078.6 -0.54 0.002 arf-GAP with Rho-GAP domain%2C ANK repeat and PH domain-containing protein 1%2C transcript variant X1
XM_019907107.1 NW_017852096.1 1375.2 0.48 0.006 enoyl-CoA delta isomerase 2%2C mitochondrial
XM_019907112.1 NW_017848922.1 1378.6 -0.46 0.002 ras-related protein Rab-39B-like
XM_019907109.1 NW_017852096.1 967.0 -0.51 0.007 dual specificity protein phosphatase 22-like%2C transcript variant X1
XM_019907118.1 NW_017852096.1 968.5 -0.93 0.002 ankyrin repeat and SAM domain-containing protein 4B-like
XM_019907119.1 NW_017852097.1 545.5 1.23 0.000 coiled-coil domain-containing protein 8 homolog
XR_002172113.1 NW_017852097.1 164.1 1.03 0.000 uncharacterized LOC109539402
XM_019907129.1 NW_017852098.1 6176.2 2.04 0.000 serine hydrolase-like protein
XM_019907157.1 NW_017852099.1 612.4 0.74 0.001 pro-interleukin-16-like%2C transcript variant X1
XM_019907170.1 NW_017852100.1 2656.4 -0.72 0.000 F-actin-uncapping protein LRRC16A%2C transcript variant X1
XM_019907191.1 NW_017852100.1 2303.6 0.33 0.001 DNA/RNA-binding protein KIN17
XM_019907193.1 NW_017852100.1 1072.8 0.35 0.000 adenylate kinase isoenzyme 6
XR_002172124.1 NW_017852100.1 82.7 -1.36 0.000 uncharacterized LOC109539449

182
XM_019907230.1 NW_017852100.1 15052.4 -1.20 0.000 nocturnin%2C transcript variant X1
XM_019907237.1 NW_017848929.1 958.9 -0.70 0.000 zinc finger protein 143-like
XM_019907259.1 NW_017852100.1 6974.4 -0.69 0.000 MOG interacting and ectopic P-granules protein 1
XM_019907274.1 NW_017848929.1 1321.3 -1.43 0.000 ferritin%2C heavy subunit-like
XM_019907271.1 NW_017852100.1 629.9 0.47 0.001 lariat debranching enzyme NW_017852100.1_920979-921493 NW_017852100.1 19.8 -1.46 0.001 #N/A
XM_019907278.1 NW_017852100.1 857.7 -1.01 0.000 uncharacterized LOC109539499%2C transcript variant X1
XM_019907281.1 NW_017852100.1 3080.0 0.23 0.002 protein IWS1 homolog
XM_019907285.1 NW_017848929.1 4009.3 -0.75 0.005 soma ferritin-like
XM_019907283.1 NW_017852100.1 26.2 -0.93 0.002 pro-resilin-like
XM_019907284.1 NW_017852100.1 1676.7 -2.22 0.000 keratin-associated protein 5-11-like
XM_019907288.1 NW_017852100.1 43.7 -1.13 0.000 uncharacterized LOC109539509
XM_019907295.1 NW_017852102.1 1939.7 -0.30 0.003 CD82 antigen-like%2C transcript variant X1
XM_019907299.1 NW_017852102.1 204.9 -0.61 0.000 progestin and adipoQ receptor family member 4%2C transcript variant X1
XM_019907321.1 NW_017848930.1 273.0 0.49 0.002 DNA polymerase delta catalytic subunit-like
XM_019907325.1 NW_017852103.1 4229.0 -0.82 0.000 uncharacterized LOC109539534%2C transcript variant X1
XM_019907330.1 NW_017852103.1 1282.4 0.56 0.002 uncharacterized LOC109539537%2C transcript variant X1
XM_019907333.1 NW_017848930.1 1521.6 -0.66 0.000 zinc finger protein 143-like
XM_019907335.1 NW_017852103.1 321.9 0.70 0.001 UPF0545 protein C22orf39 homolog
XM_019907338.1 NW_017852103.1 10543.4 -0.33 0.000 kinesin heavy chain%2C transcript variant X1
XM_019907350.1 NW_017852103.1 6138.9 -0.37 0.003 histone-lysine N-methyltransferase 2E%2C transcript variant X1
XM_019907367.1 NW_017852103.1 4060.8 0.22 0.004 aminoacyl tRNA synthase complex-interacting multifunctional protein 2%2C transcript variant X1
XM_019907369.1 NW_017852103.1 712.3 -0.75 0.004 cullin-4-like%2C transcript variant X1
XM_019907373.1 NW_017848930.1 1298.0 -1.42 0.000 ferritin%2C heavy subunit-like%2C transcript variant X1
XM_019907372.1 NW_017852103.1 5729.3 -0.98 0.000 nuclear receptor-binding protein homolog%2C transcript variant X1
XM_019907393.1 NW_017852103.1 3876.7 0.47 0.000 RNA-binding protein cabeza-like%2C transcript variant X1
NW_017848930.1_c12289-10686 NW_017848930.1 4122.3 -0.76 0.005 #N/A
XM_019907407.1 NW_017852103.1 2601.2 -1.21 0.000 uncharacterized LOC109539575%2C transcript variant X1
XM_019907414.1 NW_017852103.1 2177.8 0.29 0.006 importin-13
XM_019907422.1 NW_017852103.1 900.6 0.49 0.000 pre-mRNA-splicing factor ISY1 homolog
XM_019907423.1 NW_017852103.1 13295.4 -0.80 0.000 ecdysone-inducible protein E75%2C transcript variant X1
XM_019907429.1 NW_017852103.1 3938.8 -0.76 0.002 integrin alpha-PS2-like%2C transcript variant X1
XM_019907445.1 NW_017852103.1 39.0 -0.82 0.010 venom allergen 3-like%2C transcript variant X1
XM_019907453.1 NW_017852103.1 3801.1 -0.38 0.003 dnaJ homolog dnj-5

183
XM_019907456.1 NW_017852103.1 538.5 0.36 0.004 DNA polymerase epsilon subunit 4
XM_019907458.1 NW_017852103.1 45994.0 -0.71 0.000 uncharacterized LOC109539606
XM_019907477.1 NW_017852103.1 3748.3 -0.43 0.004 TBC1 domain family member 9
XM_019907481.1 NW_017852103.1 10963.2 1.11 0.000 alpha-aminoadipic semialdehyde synthase%2C mitochondrial
XM_019907483.1 NW_017852103.1 1068.7 -0.64 0.000 rap guanine nucleotide exchange factor 4%2C transcript variant X1
XM_019907486.1 NW_017852103.1 5607.0 0.41 0.000 elongation factor Tu-like
XM_019907496.1 NW_017848934.1 790.9 0.49 0.008 39S ribosomal protein L14%2C mitochondrial
XM_019907492.1 NW_017852103.1 1386.5 1.03 0.000 phosphoglucomutase-2-like%2C transcript variant X1
XM_019907504.1 NW_017852103.1 23344.3 0.76 0.001 mitochondrial enolase superfamily member 1-like
XM_019907509.1 NW_017852103.1 3238.3 -0.45 0.000 sorting nexin-29-like
XM_019907511.1 NW_017852103.1 1090.6 0.47 0.007 transcription factor RFX3%2C transcript variant X1
XM_019907520.1 NW_017852103.1 685.6 0.83 0.000 paramyosin-like
XM_019907522.1 NW_017852103.1 1221.0 -0.50 0.001 zinc finger BED domain-containing protein 1-like%2C transcript variant X1
XM_019907536.1 NW_017852103.1 74.1 -1.33 0.004 ras-related protein Rab-34-like
XM_019907538.1 NW_017852103.1 1879.7 0.65 0.000 cytochrome c-type heme lyase
XM_019907545.1 NW_017852103.1 558.2 0.71 0.000 uncharacterized LOC109539658
XM_019907549.1 NW_017852104.1 210.8 -2.48 0.000 glutamate receptor U1-like
XM_019907603.1 NW_017852104.1 1108.9 0.34 0.003 ribosomal RNA small subunit methyltransferase NEP1
XM_019907610.1 NW_017852104.1 928.9 0.58 0.000 coiled-coil domain-containing protein 58
XM_019907615.1 NW_017852104.1 89.0 -0.82 0.001 ionotropic receptor 25a
XM_019907635.1 NW_017852104.1 7235.3 -0.34 0.008 WD repeat-containing protein 44%2C transcript variant X1
XM_019907649.1 NW_017852104.1 32.4 1.31 0.006 aminopeptidase N-like%2C transcript variant X1
XM_019907652.1 NW_017852104.1 32570.8 -0.77 0.003 membrane alanyl aminopeptidase-like
XM_019907689.1 NW_017852104.1 233.2 -0.75 0.004 POU domain%2C class 6%2C transcription factor 1-like%2C transcript variant X1
XM_019907693.1 NW_017852104.1 646.1 -0.88 0.006 cystinosin homolog
XM_019907695.1 NW_017852104.1 1009.6 0.53 0.000 ATP-dependent RNA helicase SUV3 homolog%2C mitochondrial%2C transcript variant X1
XM_019907701.1 NW_017852104.1 840.5 0.80 0.000 centrobin%2C transcript variant X1
XM_019907707.1 NW_017852104.1 928.7 -0.42 0.000 splicing regulator RBM11
XM_019907717.1 NW_017852104.1 5639.7 -1.00 0.000 lysophospholipid acyltransferase 1%2C transcript variant X1
XM_019907722.1 NW_017852104.1 2354.3 0.28 0.004 serine-arginine protein 55-like%2C transcript variant X1
XM_019907734.1 NW_017852104.1 1671.2 0.60 0.003 aminopeptidase N-like
XM_019907741.1 NW_017852104.1 1836.1 0.48 0.004 NADH dehydrogenase [ubiquinone] 1 beta subcomplex subunit 7
XM_019907750.1 NW_017852104.1 160.6 -1.52 0.001 uncharacterized LOC109539770
XM_019907754.1 NW_017852104.1 679.5 0.76 0.003 T-box-containing protein TBX6L-like%2C transcript variant X1

184
XM_019907771.1 NW_017852106.1 5361.9 -0.37 0.003 protein crumbs%2C transcript variant X1
XM_019907774.1 NW_017852106.1 9959.9 -0.25 0.008 regulator of nonsense transcripts 1 homolog
XM_019907777.1 NW_017852106.1 1509.8 0.40 0.000 39S ribosomal protein L30%2C mitochondrial
XM_019907778.1 NW_017852106.1 49.2 -0.80 0.001 TPPP family protein CG45057-like
XM_019907782.1 NW_017852106.1 1203.4 0.40 0.001 nuclear pore complex protein Nup107%2C transcript variant X1
XM_019907793.1 NW_017852106.1 832.7 0.50 0.000 uncharacterized LOC109539802
XM_019907802.1 NW_017852106.1 1354.6 0.33 0.000 RING finger protein 37
XM_019907806.1 NW_017848968.1 58.5 -1.12 0.001 uncharacterized LOC109539807%2C transcript variant X1
XM_019907805.1 NW_017852106.1 1048.3 0.64 0.000 prolyl 4-hydroxylase subunit alpha-1-like%2C transcript variant X1
XM_019907814.1 NW_017852106.1 4674.4 -0.52 0.000 serine/threonine-protein kinase Warts%2C transcript variant X1
XM_019907820.1 NW_017852106.1 17140.9 0.95 0.000 synaptic vesicle glycoprotein 2B-like%2C transcript variant X1
XM_019907834.1 NW_017852107.1 133.5 1.70 0.000 cuticle protein 7-like
XM_019907835.1 NW_017852107.1 786.4 1.55 0.001 multidrug resistance-associated protein 4-like%2C transcript variant X1
XM_019907858.1 NW_017852107.1 3293.5 0.54 0.001 neuroguidin
XM_019907860.1 NW_017852107.1 596.9 -0.51 0.008 inosine triphosphate pyrophosphatase
XM_019907874.1 NW_017852107.1 10010.0 -0.42 0.000 FERM%2C RhoGEF and pleckstrin domain-containing protein 2%2C transcript variant X1
XM_019907878.1 NW_017852107.1 29270.8 -0.67 0.000 5'-AMP-activated protein kinase subunit gamma-2%2C transcript variant X1
XM_019907889.1 NW_017852107.1 2430.0 0.52 0.000 SUN domain-containing ossification factor
XM_019907891.1 NW_017852107.1 1743.1 0.27 0.007 methyltransferase-like protein 13
XM_019907898.1 NW_017852107.1 547.5 0.38 0.001 probable RNA methyltransferase CG11342
XM_019907910.1 NW_017852107.1 2641.2 -0.38 0.008 zinc finger protein OZF-like%2C transcript variant X1
XM_019907922.1 NW_017852107.1 1497.2 -0.49 0.000 zinc finger protein 335-like
XM_019907933.1 NW_017852107.1 634.4 -1.10 0.002 probable nuclear hormone receptor HR38%2C transcript variant X1
XM_019907949.1 NW_017852107.1 1376.4 0.86 0.001 T-related protein
XM_019907950.1 NW_017852107.1 1663.1 0.46 0.000 SUMO-activating enzyme subunit 1
XM_019907994.1 NW_017849008.1 1667.0 -0.63 0.006 1-phosphatidylinositol 4%2C5-bisphosphate phosphodiesterase classes I and II-like
XM_019907992.1 NW_017852108.1 2677.4 -0.58 0.001 peptidoglycan-recognition protein SC2-like%2C transcript variant X1
XM_019908004.1 NW_017852108.1 2999.5 -0.39 0.005 uncharacterized LOC109539922%2C transcript variant X1
XM_019908014.1 NW_017849009.1 1526.9 -0.62 0.006 1-phosphatidylinositol 4%2C5-bisphosphate phosphodiesterase classes I and II-like
XM_019908017.1 NW_017852108.1 743.7 0.43 0.008 forkhead box protein F2-like
XM_019908018.1 NW_017852108.1 1407.9 0.45 0.006 U1 small nuclear ribonucleoprotein A
XR_002172151.1 NW_017852108.1 1895.7 -1.49 0.001 uncharacterized LOC109539940

185
XM_019908034.1 NW_017852109.1 1968.4 1.07 0.000 L-galactose dehydrogenase-like%2C transcript variant X1
XM_019908037.1 NW_017852109.1 4100.5 0.63 0.002 stress response protein NST1%2C transcript variant X1
XM_019908046.1 NW_017852109.1 1972.1 1.32 0.000 multidrug resistance-associated protein 4-like
XM_019908049.1 NW_017852109.1 3112.4 -0.23 0.008 calcium channel flower%2C transcript variant X1
XM_019908055.1 NW_017852109.1 120.3 -0.84 0.007 protein commissureless 2 homolog%2C transcript variant X1
XM_019908090.1 NW_017852110.1 970.6 0.77 0.000 chymotrypsin-C-like%2C transcript variant X1
XM_019908103.1 NW_017852110.1 1382.2 -0.81 0.003 rhomboid-related protein 2-like
XM_019908107.1 NW_017852110.1 339.1 0.31 0.000 uncharacterized LOC109539997
XM_019908117.1 NW_017852110.1 2299.0 -0.49 0.009 Krueppel-like factor 3%2C transcript variant X1
XM_019908130.1 NW_017852110.1 1415.6 0.27 0.007 low molecular weight phosphotyrosine protein phosphatase 1-like
XM_019908142.1 NW_017849021.1 506.4 0.35 0.001 N-alpha-acetyltransferase 15%2C NatA auxiliary subunit-like
XM_019908169.1 NW_017852110.1 666.5 0.28 0.008 DNA replication licensing factor Mcm6
XM_019908207.1 NW_017852110.1 9541.1 -0.44 0.008 uncharacterized LOC109540050
XM_019908212.1 NW_017852110.1 333.0 0.59 0.005 uncharacterized LOC109540053%2C transcript variant X1
XM_019908216.1 NW_017852110.1 878.8 0.28 0.005 6-pyruvoyl tetrahydrobiopterin synthase%2C transcript variant X1
XM_019908219.1 NW_017852110.1 2132.8 0.81 0.000 citron Rho-interacting kinase-like%2C transcript variant X1
XM_019908237.1 NW_017852110.1 544.0 -0.60 0.000 alpha-tocopherol transfer protein-like
XM_019908247.1 NW_017852110.1 8071.0 -0.61 0.005 programmed cell death protein 10-like%2C transcript variant X1
XM_019908265.1 NW_017852110.1 7379.1 -0.67 0.008 uncharacterized LOC109540078%2C transcript variant X1
XM_019908288.1 NW_017852110.1 160.4 0.96 0.000 phospholipase B1%2C membrane-associated-like
XM_019908289.1 NW_017852110.1 383.1 0.81 0.001 purine nucleoside phosphorylase-like
XM_019908294.1 NW_017849039.1 627.5 0.58 0.001 tetraspanin-7-like%2C transcript variant X1
XM_019908312.1 NW_017852111.1 2486.7 0.53 0.001 fork-head transcriptional regulator FHL1-like
XM_019908331.1 NW_017852111.1 1370.3 1.08 0.001 fatty acyl-CoA reductase wat-like
XR_002172161.1 NW_017849039.1 1104.7 -0.46 0.000 uncharacterized LOC109540124
XM_019908357.1 NW_017849040.1 808.7 1.52 0.000 aldose reductase-like
XM_019908372.1 NW_017852115.1 10.3 -1.19 0.003 potassium/sodium hyperpolarization-activated cyclic nucleotide-gated channel 4-like
XM_019908374.1 NW_017852115.1 2368.8 0.54 0.001 uncharacterized LOC109540154
XM_019908376.1 NW_017852115.1 3014.7 0.58 0.000 uncharacterized LOC109540156
NW_017849041.1_6-3419 NW_017849041.1 430.9 1.57 0.000 #N/A
XM_019908402.1 NW_017852115.1 3136.6 -0.50 0.003 ARF GTPase-activating protein GIT2
XM_019908406.1 NW_017852115.1 1854.8 0.53 0.000 uncharacterized LOC109540174%2C transcript variant X1
XM_019908408.1 NW_017852115.1 1389.4 -0.86 0.002 octopamine receptor-like%2C transcript variant X1
XR_002172168.1 NW_017852115.1 106.5 0.66 0.000 uncharacterized LOC109540178
XM_019908414.1 NW_017852115.1 329.7 -0.55 0.008 ATP-binding cassette sub-family G member 8
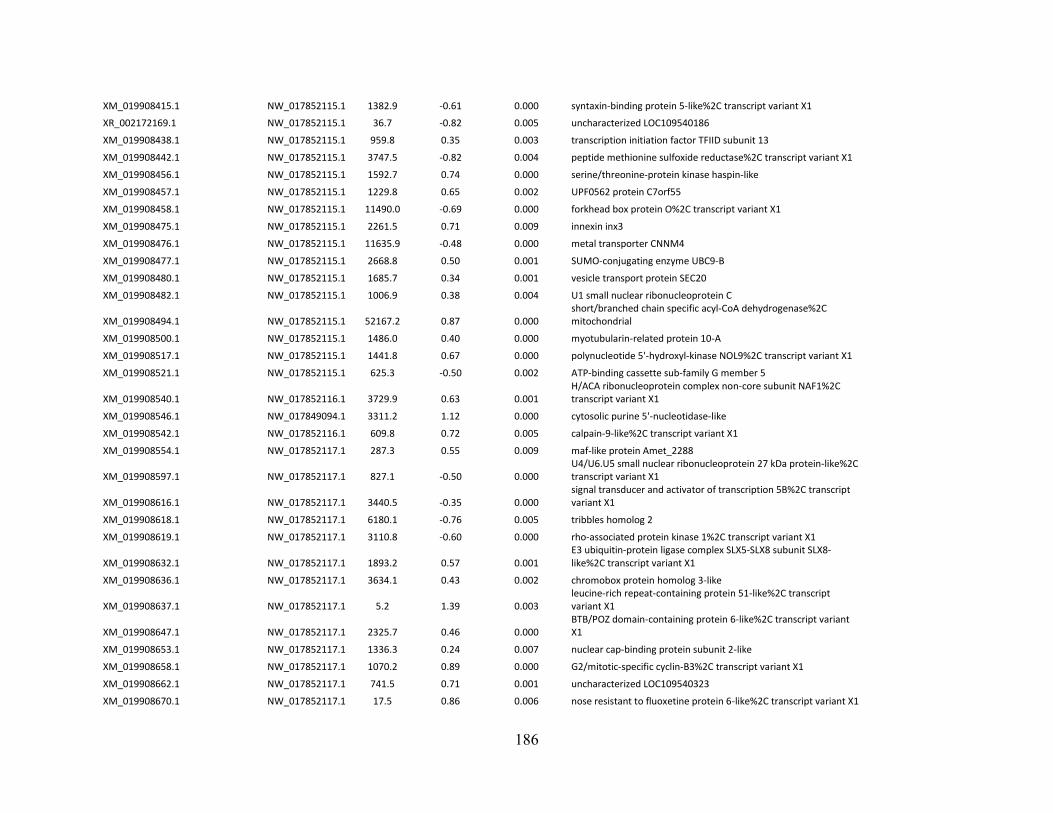
186
XM_019908415.1 NW_017852115.1 1382.9 -0.61 0.000 syntaxin-binding protein 5-like%2C transcript variant X1
XR_002172169.1 NW_017852115.1 36.7 -0.82 0.005 uncharacterized LOC109540186
XM_019908438.1 NW_017852115.1 959.8 0.35 0.003 transcription initiation factor TFIID subunit 13
XM_019908442.1 NW_017852115.1 3747.5 -0.82 0.004 peptide methionine sulfoxide reductase%2C transcript variant X1
XM_019908456.1 NW_017852115.1 1592.7 0.74 0.000 serine/threonine-protein kinase haspin-like
XM_019908457.1 NW_017852115.1 1229.8 0.65 0.002 UPF0562 protein C7orf55
XM_019908458.1 NW_017852115.1 11490.0 -0.69 0.000 forkhead box protein O%2C transcript variant X1
XM_019908475.1 NW_017852115.1 2261.5 0.71 0.009 innexin inx3
XM_019908476.1 NW_017852115.1 11635.9 -0.48 0.000 metal transporter CNNM4
XM_019908477.1 NW_017852115.1 2668.8 0.50 0.001 SUMO-conjugating enzyme UBC9-B
XM_019908480.1 NW_017852115.1 1685.7 0.34 0.001 vesicle transport protein SEC20
XM_019908482.1 NW_017852115.1 1006.9 0.38 0.004 U1 small nuclear ribonucleoprotein C
XM_019908494.1 NW_017852115.1 52167.2 0.87 0.000 short/branched chain specific acyl-CoA dehydrogenase%2C mitochondrial
XM_019908500.1 NW_017852115.1 1486.0 0.40 0.000 myotubularin-related protein 10-A
XM_019908517.1 NW_017852115.1 1441.8 0.67 0.000 polynucleotide 5'-hydroxyl-kinase NOL9%2C transcript variant X1
XM_019908521.1 NW_017852115.1 625.3 -0.50 0.002 ATP-binding cassette sub-family G member 5
XM_019908540.1 NW_017852116.1 3729.9 0.63 0.001 H/ACA ribonucleoprotein complex non-core subunit NAF1%2C transcript variant X1
XM_019908546.1 NW_017849094.1 3311.2 1.12 0.000 cytosolic purine 5'-nucleotidase-like
XM_019908542.1 NW_017852116.1 609.8 0.72 0.005 calpain-9-like%2C transcript variant X1
XM_019908554.1 NW_017852117.1 287.3 0.55 0.009 maf-like protein Amet_2288
XM_019908597.1 NW_017852117.1 827.1 -0.50 0.000 U4/U6.U5 small nuclear ribonucleoprotein 27 kDa protein-like%2C transcript variant X1
XM_019908616.1 NW_017852117.1 3440.5 -0.35 0.000 signal transducer and activator of transcription 5B%2C transcript variant X1
XM_019908618.1 NW_017852117.1 6180.1 -0.76 0.005 tribbles homolog 2
XM_019908619.1 NW_017852117.1 3110.8 -0.60 0.000 rho-associated protein kinase 1%2C transcript variant X1
XM_019908632.1 NW_017852117.1 1893.2 0.57 0.001 E3 ubiquitin-protein ligase complex SLX5-SLX8 subunit SLX8-like%2C transcript variant X1
XM_019908636.1 NW_017852117.1 3634.1 0.43 0.002 chromobox protein homolog 3-like
XM_019908637.1 NW_017852117.1 5.2 1.39 0.003 leucine-rich repeat-containing protein 51-like%2C transcript variant X1
XM_019908647.1 NW_017852117.1 2325.7 0.46 0.000 BTB/POZ domain-containing protein 6-like%2C transcript variant X1
XM_019908653.1 NW_017852117.1 1336.3 0.24 0.007 nuclear cap-binding protein subunit 2-like
XM_019908658.1 NW_017852117.1 1070.2 0.89 0.000 G2/mitotic-specific cyclin-B3%2C transcript variant X1
XM_019908662.1 NW_017852117.1 741.5 0.71 0.001 uncharacterized LOC109540323
XM_019908670.1 NW_017852117.1 17.5 0.86 0.006 nose resistant to fluoxetine protein 6-like%2C transcript variant X1

187
XM_019908674.1 NW_017852117.1 2829.0 -0.23 0.001 uncharacterized LOC109540328%2C transcript variant X1
XM_019908686.1 NW_017852117.1 385.3 0.82 0.004 transcription factor sox-2
XM_019908687.1 NW_017852117.1 14484.9 0.80 0.000 uncharacterized LOC109540339%2C transcript variant X1
XM_019908689.1 NW_017852117.1 50465.2 0.98 0.000 uncharacterized LOC109540340%2C transcript variant X1
XM_019908696.1 NW_017852117.1 1402.5 0.64 0.000 elongation factor Ts%2C mitochondrial
XM_019908700.1 NW_017852117.1 31.0 -0.80 0.002 uncharacterized LOC109540350%2C transcript variant X1
XM_019908702.1 NW_017852117.1 1177.7 1.05 0.000 transcription factor Sox-14
XM_019908711.1 NW_017852117.1 4226.3 1.24 0.000 uncharacterized LOC109540358
XM_019908715.1 NW_017852117.1 2276.9 1.25 0.000 uncharacterized LOC109540361%2C transcript variant X1
XM_019908718.1 NW_017852117.1 4019.7 1.16 0.000 uncharacterized LOC109540362
XM_019908722.1 NW_017852117.1 3803.8 1.18 0.000 ankyrin-2-like
XM_019908725.1 NW_017852118.1 342.0 0.66 0.001 RNA-binding protein Musashi homolog 2-like
XM_019908726.1 NW_017852118.1 1759.6 0.38 0.003 WD and tetratricopeptide repeats protein 1-like
XM_019908728.1 NW_017852118.1 289.8 0.53 0.001 5-demethoxyubiquinone hydroxylase%2C mitochondrial%2C transcript variant X1
XM_019908731.1 NW_017852120.1 7389.8 -0.39 0.001 autophagy-related protein 9A%2C transcript variant X1
XM_019908751.1 NW_017852121.1 324.7 0.59 0.008 DNA replication ATP-dependent helicase/nuclease DNA2
XM_019908753.1 NW_017852121.1 2476.5 -0.40 0.007 myotubularin-related protein 8
XM_019908755.1 NW_017852121.1 1368.0 0.51 0.000 39S ribosomal protein L19%2C mitochondrial
XM_019908756.1 NW_017852121.1 623.3 0.32 0.001 39S ribosomal protein L48%2C mitochondrial
XM_019908768.1 NW_017852122.1 2264.0 0.35 0.000 basic salivary proline-rich protein 1-like
XM_019908774.1 NW_017852122.1 16.0 1.35 0.001 alpha-soluble NSF attachment protein-like
XM_019908782.1 NW_017849146.1 7900.4 -1.08 0.008 uncharacterized LOC109540417
XM_019908780.1 NW_017852123.1 923.6 0.40 0.000 poly(ADP-ribose) glycohydrolase
XM_019908802.1 NW_017852126.1 44181.8 -0.55 0.001 microtubule-actin cross-linking factor 1%2C transcript variant X1
XM_019908829.1 NW_017852126.1 73.7 0.86 0.002 venom serine protease-like
XM_019908831.1 NW_017852126.1 377.4 1.42 0.001 venom serine protease-like
XM_019908838.1 NW_017852126.1 3011.1 0.31 0.004 polyadenylate-binding protein 2%2C transcript variant X1
XM_019908855.1 NW_017852126.1 3690.2 -0.56 0.000 CCAAT/enhancer-binding protein gamma
XM_019908857.1 NW_017852126.1 694.2 0.41 0.003 polyribonucleotide nucleotidyltransferase 1%2C mitochondrial
XM_019908859.1 NW_017852126.1 7998.2 -0.29 0.009 dynein heavy chain%2C cytoplasmic%2C transcript variant X1
XM_019908862.1 NW_017852126.1 372.1 0.62 0.002 dystrophin-like
XM_019908873.1 NW_017852126.1 1074.9 -0.36 0.000 lysM and putative peptidoglycan-binding domain-containing protein 3
XM_019908882.1 NW_017852126.1 72195.0 -1.80 0.000 uncharacterized LOC109540475%2C transcript variant X1
XR_002172198.1 NW_017852126.1 323.7 -3.32 0.000 uncharacterized LOC109540477
XM_019908900.1 NW_017852126.1 6121.7 -0.47 0.001 DNA-directed RNA polymerase II subunit RPB1
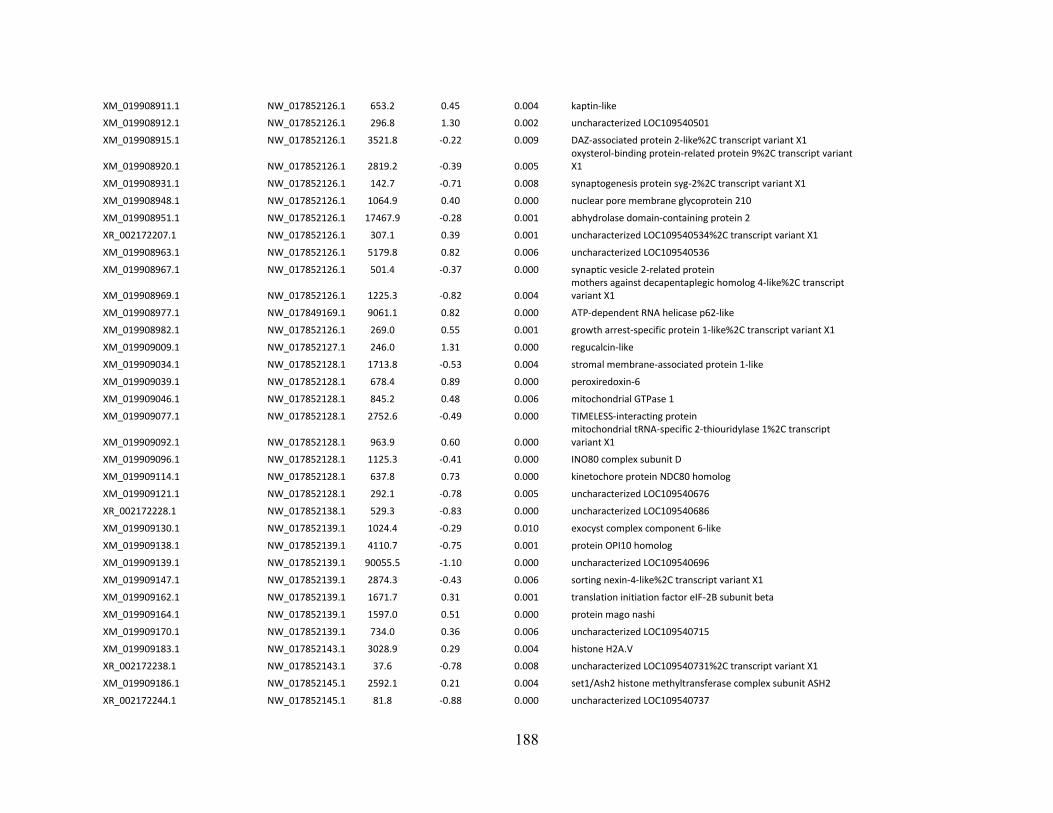
188
XM_019908911.1 NW_017852126.1 653.2 0.45 0.004 kaptin-like
XM_019908912.1 NW_017852126.1 296.8 1.30 0.002 uncharacterized LOC109540501
XM_019908915.1 NW_017852126.1 3521.8 -0.22 0.009 DAZ-associated protein 2-like%2C transcript variant X1
XM_019908920.1 NW_017852126.1 2819.2 -0.39 0.005 oxysterol-binding protein-related protein 9%2C transcript variant X1
XM_019908931.1 NW_017852126.1 142.7 -0.71 0.008 synaptogenesis protein syg-2%2C transcript variant X1
XM_019908948.1 NW_017852126.1 1064.9 0.40 0.000 nuclear pore membrane glycoprotein 210
XM_019908951.1 NW_017852126.1 17467.9 -0.28 0.001 abhydrolase domain-containing protein 2
XR_002172207.1 NW_017852126.1 307.1 0.39 0.001 uncharacterized LOC109540534%2C transcript variant X1
XM_019908963.1 NW_017852126.1 5179.8 0.82 0.006 uncharacterized LOC109540536
XM_019908967.1 NW_017852126.1 501.4 -0.37 0.000 synaptic vesicle 2-related protein
XM_019908969.1 NW_017852126.1 1225.3 -0.82 0.004 mothers against decapentaplegic homolog 4-like%2C transcript variant X1
XM_019908977.1 NW_017849169.1 9061.1 0.82 0.000 ATP-dependent RNA helicase p62-like
XM_019908982.1 NW_017852126.1 269.0 0.55 0.001 growth arrest-specific protein 1-like%2C transcript variant X1
XM_019909009.1 NW_017852127.1 246.0 1.31 0.000 regucalcin-like
XM_019909034.1 NW_017852128.1 1713.8 -0.53 0.004 stromal membrane-associated protein 1-like
XM_019909039.1 NW_017852128.1 678.4 0.89 0.000 peroxiredoxin-6
XM_019909046.1 NW_017852128.1 845.2 0.48 0.006 mitochondrial GTPase 1
XM_019909077.1 NW_017852128.1 2752.6 -0.49 0.000 TIMELESS-interacting protein
XM_019909092.1 NW_017852128.1 963.9 0.60 0.000 mitochondrial tRNA-specific 2-thiouridylase 1%2C transcript variant X1
XM_019909096.1 NW_017852128.1 1125.3 -0.41 0.000 INO80 complex subunit D
XM_019909114.1 NW_017852128.1 637.8 0.73 0.000 kinetochore protein NDC80 homolog
XM_019909121.1 NW_017852128.1 292.1 -0.78 0.005 uncharacterized LOC109540676
XR_002172228.1 NW_017852138.1 529.3 -0.83 0.000 uncharacterized LOC109540686
XM_019909130.1 NW_017852139.1 1024.4 -0.29 0.010 exocyst complex component 6-like
XM_019909138.1 NW_017852139.1 4110.7 -0.75 0.001 protein OPI10 homolog
XM_019909139.1 NW_017852139.1 90055.5 -1.10 0.000 uncharacterized LOC109540696
XM_019909147.1 NW_017852139.1 2874.3 -0.43 0.006 sorting nexin-4-like%2C transcript variant X1
XM_019909162.1 NW_017852139.1 1671.7 0.31 0.001 translation initiation factor eIF-2B subunit beta
XM_019909164.1 NW_017852139.1 1597.0 0.51 0.000 protein mago nashi
XM_019909170.1 NW_017852139.1 734.0 0.36 0.006 uncharacterized LOC109540715
XM_019909183.1 NW_017852143.1 3028.9 0.29 0.004 histone H2A.V
XR_002172238.1 NW_017852143.1 37.6 -0.78 0.008 uncharacterized LOC109540731%2C transcript variant X1
XM_019909186.1 NW_017852145.1 2592.1 0.21 0.004 set1/Ash2 histone methyltransferase complex subunit ASH2
XR_002172244.1 NW_017852145.1 81.8 -0.88 0.000 uncharacterized LOC109540737

189
XM_019909190.1 NW_017852148.1 28.5 -0.97 0.007 uncharacterized LOC109540740
XM_019909217.1 NW_017852154.1 4683.8 0.53 0.006 galectin-8-like%2C transcript variant X1
XR_002172245.1 NW_017852155.1 476.9 -0.69 0.001 uncharacterized LOC109540766
XM_019909243.1 NW_017852156.1 1579.9 0.40 0.001 ribosome biogenesis protein WDR12 homolog
XM_019909244.1 NW_017852156.1 11096.9 0.66 0.000 6-phosphogluconate dehydrogenase%2C decarboxylating
XM_019909252.1 NW_017852156.1 2360.8 0.61 0.000 serine/threonine-protein kinase OSR1%2C transcript variant X1
XM_019909259.1 NW_017852156.1 1001.8 0.41 0.007 COP9 signalosome complex subunit 8
XM_019909271.1 NW_017852156.1 1004.2 -0.38 0.002 gamma-secretase subunit Aph-1
XM_019909275.1 NW_017852158.1 49433.8 -0.91 0.000 ATP-binding cassette sub-family G member 4
XM_019909282.1 NW_017852158.1 36.0 -1.22 0.001 uncharacterized LOC109540799%2C transcript variant X1
XR_002172250.1 NW_017852158.1 302.5 -1.31 0.000 uncharacterized LOC109540801%2C transcript variant X1
XM_019909294.1 NW_017852160.1 512.1 -0.87 0.000 angiotensin-converting enzyme-like
XM_019909307.1 NW_017852160.1 925.8 -0.45 0.001 uncharacterized LOC109540816
XM_019909311.1 NW_017852162.1 20057.7 -0.51 0.002 sortilin-related receptor-like
XM_019909329.1 NW_017852162.1 1338.5 -0.54 0.000 uncharacterized LOC109540838
XM_019909337.1 NW_017849221.1 292.2 0.83 0.000 sodium channel protein 60E-like
XM_019909346.1 NW_017849221.1 7925.3 0.94 0.000 uncharacterized LOC109540853
XM_019909347.1 NW_017852166.1 1719.4 0.99 0.000 uncharacterized LOC109540857
XM_019909348.1 NW_017852166.1 398.8 -0.63 0.002 major facilitator superfamily domain-containing protein 6-like
XM_019909350.1 NW_017852166.1 8600.8 -0.55 0.001 kinesin-like protein KIF13A
XM_019909360.1 NW_017852166.1 1149.8 -0.26 0.001 pyruvate dehydrogenase phosphatase regulatory subunit%2C mitochondrial-like%2C transcript variant X1
XM_019909367.1 NW_017852166.1 3363.5 -0.41 0.000 SAFB-like transcription modulator
XM_019909368.1 NW_017852166.1 4772.0 0.35 0.009 uncharacterized LOC109540869
XM_019909370.1 NW_017852166.1 35.6 -0.73 0.003 NGFI-A-binding protein homolog%2C transcript variant X1
XM_019909373.1 NW_017852166.1 1046.8 -0.41 0.000 protein DENND6A%2C transcript variant X1
XM_019909399.1 NW_017852166.1 4583.1 -0.66 0.001 venom protease-like
XM_019909401.1 NW_017852166.1 213.8 1.13 0.001 cathepsin L1%2C transcript variant X1
XM_019909421.1 NW_017852166.1 971.2 -0.62 0.002 uncharacterized LOC109540896%2C transcript variant X1
XR_002172263.1 NW_017852166.1 6522.1 -0.77 0.002 uncharacterized LOC109540898
XM_019909426.1 NW_017852166.1 3945.6 -0.45 0.000 trafficking protein particle complex subunit 8
XM_019909439.1 NW_017849234.1 2373.1 -0.45 0.007 tubulin-specific chaperone cofactor E-like protein
XM_019909453.1 NW_017852166.1 124.1 -0.87 0.000 protein tipE
XM_019909454.1 NW_017852166.1 3054.9 1.09 0.000 uncharacterized LOC109540914%2C transcript variant X1
XR_002172266.1 NW_017852166.1 1171.1 1.11 0.000 uncharacterized LOC109540917
XM_019909474.1 NW_017852166.1 4168.0 -0.34 0.000 uncharacterized LOC109540928%2C transcript variant X1

190
XM_019909478.1 NW_017852166.1 4403.3 -0.32 0.002 cytoplasmic FMR1-interacting protein
XM_019909488.1 NW_017849248.1 270.5 -0.81 0.000 uncharacterized LOC109540933
XM_019909493.1 NW_017852166.1 485.7 0.89 0.006 uncharacterized LOC109540938
XM_019909494.1 NW_017852166.1 4056.6 -0.52 0.000 tetratricopeptide repeat protein 39B-like%2C transcript variant X1
XM_019909498.1 NW_017852166.1 276.3 0.71 0.001 uncharacterized LOC109540942%2C transcript variant X1 NW_017852166.1_1751943-1753407 NW_017852166.1 271.6 0.80 0.004 #N/A
XM_019909505.1 NW_017852166.1 4980.8 -0.42 0.004 plexin A3%2C transcript variant X1
XM_019909534.1 NW_017852166.1 9675.1 -0.83 0.000 mid1-interacting protein 1-like%2C transcript variant X1
XM_019909550.1 NW_017852166.1 1993.2 -0.68 0.003 dual serine/threonine and tyrosine protein kinase-like%2C transcript variant X1
XM_019909552.1 NW_017852166.1 2872.3 -1.27 0.000 membrane-associated guanylate kinase%2C WW and PDZ domain-containing protein 1
XM_019909553.1 NW_017852166.1 11256.4 -0.44 0.005 dnaJ protein homolog 1
XM_019909555.1 NW_017852166.1 3996.0 -0.46 0.002 histone-lysine N-methyltransferase%2C H3 lysine-79 specific-like%2C transcript variant X1
XM_019909560.1 NW_017852166.1 4773.5 -0.68 0.000 CSC1-like protein 2
XM_019909576.1 NW_017852166.1 8529.1 -0.70 0.000 UPF0518 protein GK23746%2C transcript variant X1
XM_019909578.1 NW_017852166.1 3849.6 -0.53 0.000 GTP-binding protein 2%2C transcript variant X1
XM_019909582.1 NW_017852166.1 3483.5 -0.35 0.000 ADP-ribosylation factor 6
XM_019909585.1 NW_017852166.1 1682.0 -0.69 0.004 uncharacterized LOC109540977
XM_019909587.1 NW_017852166.1 1627.2 -1.28 0.000 formin-like protein 20
XM_019909588.1 NW_017852166.1 959.7 -1.38 0.000 uncharacterized LOC109540979%2C transcript variant X1
XM_019909590.1 NW_017852166.1 4438.3 -0.30 0.004 lysine-specific demethylase lid%2C transcript variant X1
XM_019909637.1 NW_017852166.1 5604.8 -0.44 0.000 phospholipid scramblase 2%2C transcript variant X1
XM_019909660.1 NW_017852166.1 6404.6 -0.35 0.000 IQ motif and SEC7 domain-containing protein 1%2C transcript variant X1
XM_019909690.1 NW_017852166.1 2464.0 -0.64 0.001 uncharacterized LOC109541025%2C transcript variant X1
XM_019909700.1 NW_017849275.1 325.4 0.74 0.007 retinol dehydrogenase 13-like
XM_019909702.1 NW_017852166.1 15547.7 -1.10 0.000 dual specificity protein phosphatase 10-like%2C transcript variant X1
XM_019909706.1 NW_017852166.1 15117.8 -0.68 0.000 RING finger protein 11
XM_019909709.1 NW_017852166.1 1284.9 0.65 0.000 uncharacterized LOC109541038
XM_019909710.1 NW_017852166.1 8367.0 -0.80 0.001 serine protease inhibitor 77Ba
XM_019909712.1 NW_017852166.1 5356.2 -0.57 0.000 alpha-soluble NSF attachment protein%2C transcript variant X1
XM_019909736.1 NW_017852166.1 17333.1 -0.71 0.000 23 kDa integral membrane protein-like
XM_019909743.1 NW_017852166.1 12736.1 -0.63 0.000 syndecan%2C transcript variant X1
XM_019909746.1 NW_017852166.1 4919.8 -0.27 0.000 AP-2 complex subunit alpha%2C transcript variant X1
XM_019909754.1 NW_017852166.1 1918.4 -0.79 0.000 muscle calcium channel subunit alpha-1%2C transcript variant X1

191
XM_019909766.1 NW_017852166.1 13804.6 -1.04 0.000 monocarboxylate transporter 13-like
XM_019909777.1 NW_017849286.1 1386.4 -0.75 0.000 zinc finger SWIM domain-containing protein 8-like
XM_019909779.1 NW_017852166.1 2919.8 -0.76 0.000 nuclear factor 1 C-type%2C transcript variant X1
XM_019909801.1 NW_017852166.1 31543.2 -0.44 0.000 BCL2/adenovirus E1B 19 kDa protein-interacting protein 3%2C transcript variant X1
XM_019909805.1 NW_017852166.1 237.9 -0.76 0.001 potassium voltage-gated channel protein Shal
XM_019909811.1 NW_017852166.1 981.5 0.40 0.002 facilitated trehalose transporter Tret1-like
XM_019909818.1 NW_017852166.1 2273.9 -0.70 0.003 semaphorin-5B
XM_019909851.1 NW_017852166.1 3385.1 -0.35 0.001 uncharacterized LOC109541114
XM_019909857.1 NW_017852166.1 343.6 -0.80 0.001 zinc finger protein 449-like
XM_019909860.1 NW_017852166.1 3227.3 0.33 0.004 mitochondrial import inner membrane translocase subunit TIM50-C-like
XM_019909868.1 NW_017852166.1 5001.3 0.96 0.000 protein-serine O-palmitoleoyltransferase porcupine%2C transcript variant X1
XM_019909872.1 NW_017852166.1 2297.5 -1.53 0.000 zinc finger protein basonuclin-2-like%2C transcript variant X1
XM_019909877.1 NW_017852166.1 2500.6 0.34 0.001 sodium/hydrogen exchanger 7%2C transcript variant X1
XM_019909886.1 NW_017852166.1 2573.7 -0.65 0.005 neuroligin-2%2C transcript variant X1
XM_019909889.1 NW_017852166.1 2101.3 -0.51 0.000 vinexin-like
XM_019909891.1 NW_017852166.1 19986.2 -0.66 0.000 translocon-associated protein subunit beta
XM_019909896.1 NW_017852166.1 455.5 -0.68 0.006 SRSF protein kinase 3-like
XM_019909908.1 NW_017852166.1 1115.0 -1.26 0.000 uncharacterized LOC109541144
XM_019909909.1 NW_017852166.1 91.8 -2.11 0.000 bone morphogenetic protein 2
XM_019909916.1 NW_017852166.1 299.8 -0.47 0.002 uncharacterized LOC109541150%2C transcript variant X1
XM_019909918.1 NW_017852166.1 2015.9 -0.25 0.006 mesoderm induction early response protein 1-like
XM_019909923.1 NW_017852166.1 115.8 -0.70 0.007 atrial natriuretic peptide-converting enzyme%2C transcript variant X1
XM_019909936.1 NW_017852166.1 474.3 0.77 0.001 F-box/LRR-repeat protein 7-like
XM_019909939.1 NW_017852166.1 71.8 -0.77 0.005 bone morphogenetic protein 2%2C transcript variant X1
XM_019909955.1 NW_017852166.1 553.8 -0.77 0.000 transcription initiation factor IIA subunit 1-like
XM_019909956.1 NW_017852166.1 1319.7 1.09 0.000 protein cortex-like
XM_019909966.1 NW_017852166.1 301.8 -0.65 0.006 protein bunched%2C class 2/F/G isoform-like
XM_019909968.1 NW_017852166.1 2078.6 1.03 0.002 uncharacterized LOC109541182%2C transcript variant X1
XM_019909970.1 NW_017852166.1 1776.3 0.89 0.002 trichohyalin-like
XM_019910013.1 NW_017845629.1 1326.2 -1.43 0.000 ferritin%2C heavy subunit-like%2C transcript variant X1
XM_019909979.1 NW_017852166.1 13.5 -1.15 0.004 uncharacterized LOC109541192
XM_019909980.1 NW_017852166.1 1851.8 1.17 0.000 uncharacterized LOC109541194
XM_019909983.1 NW_017852167.1 968.3 -1.39 0.001 cytochrome P450 9e2-like
XM_019909987.1 NW_017852167.1 1047.8 -1.55 0.000 cytochrome P450 9e2-like

192
XR_002172288.1 NW_017852168.1 5621.2 0.48 0.003 alpha-aminoadipic semialdehyde dehydrogenase%2C transcript variant X1
XM_019909998.1 NW_017852168.1 12570.1 -0.32 0.001 thymosin beta%2C transcript variant X1
XM_019910016.1 NW_017852168.1 1266.0 -0.74 0.000 zinc finger SWIM domain-containing protein 8-like
XR_002172291.1 NW_017852168.1 1261.4 -0.67 0.000 uncharacterized LOC109541218
XM_019910017.1 NW_017852168.1 60133.2 0.29 0.004 60S ribosomal protein L5-like
XM_019910019.1 NW_017852168.1 3081.2 1.14 0.000 angiotensin-converting enzyme-like
XM_019910021.1 NW_017852168.1 1065.5 0.29 0.003 oligoribonuclease-like
XM_019910027.1 NW_017852168.1 1844.4 0.27 0.002 ribosomal protein S6 kinase 2 beta
XM_019910029.1 NW_017852168.1 2855.0 0.40 0.000 RISC-loading complex subunit tarbp2-like
XM_019910030.1 NW_017852168.1 23375.4 0.27 0.003 60S ribosomal protein L18a
XM_019910042.1 NW_017852170.1 174.9 0.97 0.000 neurotrimin-like%2C transcript variant X1
XM_019910044.1 NW_017852171.1 271.9 1.53 0.000 cytochrome P450 6k1-like
XM_019910046.1 NW_017852172.1 447.6 -0.45 0.004 uncharacterized LOC109541246
XM_019910050.1 NW_017852172.1 21190.4 -0.96 0.000 NADP-dependent malic enzyme-like
XM_019910054.1 NW_017852173.1 606.5 0.45 0.000 COMM domain-containing protein 3%2C transcript variant X1
XM_019910090.1 NW_017852173.1 5677.7 -0.88 0.000 brachyurin-like
XM_019910109.1 NW_017852173.1 4947.0 -0.39 0.000 ankyrin repeat domain-containing protein 12%2C transcript variant X1
XM_019910115.1 NW_017852173.1 860.0 -0.47 0.000 transcriptional repressor protein YY1-like%2C transcript variant X1
XM_019910121.1 NW_017849321.1 1137.1 0.39 0.004 prefoldin subunit 3-like
XM_019910119.1 NW_017852173.1 654.0 0.76 0.000 spindle assembly abnormal protein 6 homolog
XM_019910123.1 NW_017852175.1 9489.7 -0.42 0.001 protein TIS11-like%2C transcript variant X1
XM_019910125.1 NW_017852175.1 898.0 0.35 0.002 probable asparagine--tRNA ligase%2C mitochondrial
XM_019910130.1 NW_017852176.1 9686.6 -0.46 0.002 dnaJ homolog subfamily B member 6%2C transcript variant X1
XM_019910140.1 NW_017852176.1 4240.7 -0.71 0.000 formin-like protein CG32138
XM_019910148.1 NW_017852176.1 68.2 -1.25 0.007 retinol dehydrogenase 13-like
XM_019910150.1 NW_017852176.1 260.4 0.69 0.001 uncharacterized LOC109541323%2C transcript variant X1
XM_019910159.1 NW_017852178.1 3451.7 -0.46 0.000 Golgi-specific brefeldin A-resistance guanine nucleotide exchange factor 1%2C transcript variant X1
XR_002172312.1 NW_017852178.1 464.3 -0.81 0.000 uncharacterized LOC109541334
XM_019910175.1 NW_017852178.1 10539.4 0.94 0.002 spermatogenesis-associated protein 20%2C transcript variant X1
XM_019910188.1 NW_017852178.1 2267.3 -0.33 0.002 uncharacterized LOC109541342%2C transcript variant X1
XM_019910206.1 NW_017852178.1 534.4 0.58 0.000 uncharacterized LOC109541353
XM_019910208.1 NW_017852178.1 2001.6 -0.49 0.001 zinc finger protein 878-like
XM_019910213.1 NW_017852179.1 599.7 0.74 0.000 disheveled-associated activator of morphogenesis 1
XM_019910214.1 NW_017852179.1 570.0 -0.79 0.000 ras association domain-containing protein 10-like

193
XM_019910219.1 NW_017852180.1 258.8 -0.46 0.002 myotubularin-related protein 13-like
XM_019910220.1 NW_017852180.1 5920.8 0.68 0.001 2-oxoisovalerate dehydrogenase subunit alpha%2C mitochondrial
XR_002172317.1 NW_017852180.1 2580.7 -0.46 0.001 uncharacterized LOC109541368
XM_019910225.1 NW_017852181.1 110.0 -0.72 0.000 gamma-aminobutyric acid receptor subunit alpha-2-like
XM_019910226.1 NW_017852181.1 8124.3 -0.23 0.006 programmed cell death 6-interacting protein
XM_019910236.1 NW_017852181.1 2257.8 0.86 0.000 geranylgeranyl pyrophosphate synthase%2C transcript variant X1
NW_017845629.1_c12910-11307 NW_017845629.1 4124.0 -0.76 0.004 #N/A
XM_019910281.1 NW_017852190.1 6649.8 -1.05 0.000 uncharacterized LOC109541423
XM_019910282.1 NW_017852190.1 3759.2 -0.80 0.000 vacuolar protein sorting-associated protein 16 homolog
XM_019910290.1 NW_017852191.1 5210.7 -0.30 0.001 putative U5 small nuclear ribonucleoprotein 200 kDa helicase
XM_019910292.1 NW_017852191.1 412.0 0.69 0.001 glutaredoxin domain-containing cysteine-rich protein CG31559-like
XM_019910296.1 NW_017852192.1 3.2 -1.45 0.002 odorant receptor 49b-like
XR_002172334.1 NW_017852192.1 593.8 -0.74 0.000 uncharacterized LOC109541445%2C transcript variant X1
XM_019910316.1 NW_017852192.1 1161.4 1.66 0.000 putative protein TPRXL%2C transcript variant X1
XM_019910318.1 NW_017852192.1 1995.6 -0.97 0.000 D-amino-acid oxidase-like%2C transcript variant X1
XR_002172338.1 NW_017852198.1 24.0 -0.69 0.009 uncharacterized LOC109541480
XM_019910340.1 NW_017852199.1 979.6 -1.15 0.000 organic cation transporter protein-like%2C transcript variant X1
XM_019910343.1 NW_017852199.1 2194.4 -0.28 0.001 ras association domain-containing protein 4-like
XM_019910353.1 NW_017852201.1 2378.0 -0.59 0.009 proto-oncogene tyrosine-protein kinase ROS
XM_019910355.1 NW_017852201.1 1790.4 -0.39 0.001 histone-lysine N-methyltransferase 2C-like
XM_019910361.1 NW_017852201.1 1652.3 0.59 0.001 cell division cycle protein 20 homolog
XR_002172340.1 NW_017852201.1 83.8 -0.75 0.000 uncharacterized LOC109541503%2C transcript variant X1
XM_019910375.1 NW_017852201.1 13496.8 -0.55 0.004 monocarboxylate transporter 3-like
XM_019910396.1 NW_017852201.1 1141.7 2.30 0.000 argininosuccinate synthase
XM_019910397.1 NW_017852201.1 347.1 0.96 0.000 ribonuclease H2 subunit A
XM_019910403.1 NW_017852201.1 241.6 -0.65 0.000 toll-like receptor Tollo
XM_019910423.1 NW_017852214.1 27.5 1.04 0.001 uncharacterized LOC109541546
XM_019910424.1 NW_017852214.1 1646.7 -0.45 0.006 acyl-CoA Delta(11) desaturase-like%2C transcript variant X1
XM_019910446.1 NW_017852220.1 1719.2 -0.41 0.000 slit homolog 3 protein-like
XR_002172348.1 NW_017852224.1 647.0 -0.79 0.001 uncharacterized LOC109541576%2C transcript variant X1
XR_002172350.1 NW_017852224.1 99.4 -0.51 0.007 uncharacterized LOC109541578
XM_019910464.1 NW_017852228.1 1597.1 0.40 0.000 prefoldin subunit 3-like
XM_019910470.1 NW_017852228.1 1932.6 0.38 0.000 prefoldin subunit 3-like
XM_019910492.1 NW_017852233.1 379.3 0.38 0.009 post-GPI attachment to proteins factor 2-like
XM_019910493.1 NW_017852233.1 379.4 0.38 0.009 post-GPI attachment to proteins factor 2-like

194
XR_002172359.1 NW_017852234.1 143.7 -0.86 0.005 uncharacterized LOC109541625
XM_019910525.1 NW_017852235.1 1050.5 0.56 0.000 protein maelstrom 1
XM_019910545.1 NW_017852238.1 713.4 1.29 0.001 phosphoglycolate phosphatase 1B%2C chloroplastic-like
XM_019910552.1 NW_017852238.1 2413.8 -0.83 0.007 1-acyl-sn-glycerol-3-phosphate acyltransferase alpha-like%2C transcript variant X1
XM_019910557.1 NW_017852238.1 2357.9 -0.26 0.001 zinc finger protein 358-like
XM_019910559.1 NW_017852239.1 812.7 -0.65 0.006 biotinidase-like
XM_019910569.1 NW_017852239.1 151.0 0.63 0.009 uncharacterized LOC109541671%2C transcript variant X1
XM_019910584.1 NW_017849390.1 10561.9 -0.55 0.000 transmembrane protein 53%2C transcript variant X1
XM_019910581.1 NW_017852241.1 2600.3 0.34 0.004 apoptosis-inducing factor 1%2C mitochondrial%2C transcript variant X1
XM_019910589.1 NW_017852242.1 514.0 1.01 0.003 synaptotagmin-11-like
XM_019910598.1 NW_017852243.1 445.3 -0.80 0.000 voltage-gated potassium channel subunit beta-2%2C transcript variant X1
XM_019910626.1 NW_017849390.1 1256.0 0.43 0.000 39S ribosomal protein L21%2C mitochondrial%2C transcript variant X1
XM_019910627.1 NW_017852245.1 36470.0 0.29 0.006 longitudinals lacking protein%2C isoforms J/P/Q/S/Z%2C transcript variant X1
XM_019910644.1 NW_017849390.1 1992.7 0.28 0.001 FGFR1 oncogene partner 2 homolog NW_017852245.1_c576586-566924 NW_017852245.1 468.4 -1.60 0.000 #N/A
XM_019910647.1 NW_017852245.1 207.4 -0.85 0.008 uncharacterized LOC109541719
XR_002172365.1 NW_017852245.1 2598.2 -0.81 0.002 uncharacterized LOC109541720%2C transcript variant X1
XM_019910664.1 NW_017852245.1 489.2 1.11 0.001 zinc finger and SCAN domain-containing protein 10-like
XM_019910667.1 NW_017852245.1 1560.3 0.43 0.001 PQ-loop repeat-containing protein 3
XM_019910679.1 NW_017852245.1 5128.1 -0.45 0.000 cyclin-dependent kinase 14%2C transcript variant X1
XR_002172373.1 NW_017852245.1 2.8 -1.25 0.009 uncharacterized LOC109541754
XM_019910689.1 NW_017852245.1 14297.1 -0.65 0.003 triple functional domain protein-like%2C transcript variant X1
XM_019910723.1 NW_017852245.1 29.7 0.73 0.003 uncharacterized LOC109541766
XM_019910731.1 NW_017852245.1 5654.3 0.23 0.004 ras-related protein Rac1
XM_019910733.1 NW_017852245.1 1802.5 -0.61 0.000 trimethylguanosine synthase
XM_019910737.1 NW_017852245.1 465.5 0.80 0.001 serine/threonine-protein kinase greatwall
XM_019910738.1 NW_017852245.1 633.7 0.87 0.000 mini-chromosome maintenance complex-binding protein
XM_019910751.1 NW_017852245.1 1930.4 0.32 0.009 beta-parvin
XM_019910769.1 NW_017852245.1 184.4 -0.58 0.005 Krueppel-like factor luna
XM_019910770.1 NW_017852245.1 902.4 0.65 0.000 uncharacterized LOC109541803%2C transcript variant X1
XM_019910773.1 NW_017852245.1 354.6 0.47 0.000 methyltransferase-like protein 22%2C transcript variant X1
XM_019910777.1 NW_017852245.1 565.8 0.56 0.000 uncharacterized LOC109541809%2C transcript variant X1

195
XM_019910783.1 NW_017852245.1 3867.1 -0.79 0.000 sodium- and chloride-dependent neutral and basic amino acid transporter B(0+)-like%2C transcript variant X1
XM_019910787.1 NW_017852245.1 794.8 0.35 0.001 probable malonyl-CoA-acyl carrier protein transacylase%2C mitochondrial
XM_019910790.1 NW_017852245.1 9024.3 -0.48 0.000 phosphatidylinositol-binding clathrin assembly protein LAP%2C transcript variant X1
XM_019910793.1 NW_017852245.1 844.7 0.97 0.000 COP9 signalosome complex subunit 1-like%2C transcript variant X1
XM_019910795.1 NW_017852245.1 1556.7 0.56 0.000 retinol dehydrogenase 11-like
XM_019910798.1 NW_017852245.1 4138.6 -0.55 0.001 transcriptional repressor CTCF-like%2C transcript variant X1
XM_019910807.1 NW_017852245.1 14799.1 -0.62 0.000 aryl hydrocarbon receptor nuclear translocator-like protein 1
XM_019910817.1 NW_017852245.1 1716.9 0.43 0.000 ran GTPase-activating protein 1
XM_019910818.1 NW_017852245.1 311.3 0.67 0.000 uncharacterized LOC109541831
XM_019910821.1 NW_017852245.1 3750.7 0.80 0.000 glycine cleavage system H protein%2C mitochondrial
XM_019910832.1 NW_017852245.1 1057.2 0.43 0.001 prostaglandin E synthase 2
XM_019910844.1 NW_017849417.1 7177.7 -0.39 0.003 protein TIS11-like
XM_019910841.1 NW_017852245.1 1575.4 -0.93 0.000 putative uncharacterized protein DDB_G0277255%2C transcript variant X1
XM_019910845.1 NW_017852245.1 136.9 -1.24 0.002 uncharacterized LOC109541849
XM_019910846.1 NW_017852245.1 27806.1 -0.45 0.007 stress-associated endoplasmic reticulum protein 2
XM_019910851.1 NW_017852245.1 1284.3 0.37 0.005 probable small nuclear ribonucleoprotein Sm D1
XM_019910855.1 NW_017849418.1 1495.5 -0.86 0.000 uncharacterized LOC109541856
XM_019910863.1 NW_017852247.1 999.8 0.40 0.002 ribonucleases P/MRP protein subunit POP1
XM_019910868.1 NW_017852247.1 1025.7 0.98 0.000 uncharacterized LOC109541875%2C transcript variant X1
XM_019910875.1 NW_017849423.1 1743.0 -0.55 0.000 E3 ubiquitin-protein ligase UBR1-like
XM_019910874.1 NW_017852247.1 422.5 -1.16 0.001 superoxide dismutase [Cu-Zn]%2C chloroplastic-like
XM_019910877.1 NW_017852247.1 2358.7 0.55 0.005 glucose 1-dehydrogenase-like
XM_019910884.1 NW_017849431.1 277.0 0.85 0.000 sodium channel protein 60E-like
XR_002172380.1 NW_017852248.1 103.0 -0.70 0.000 uncharacterized LOC109541893
XM_019910887.1 NW_017852248.1 2365.2 0.79 0.007 putative sodium-dependent multivitamin transporter%2C transcript variant X1
XM_019910894.1 NW_017849431.1 7924.3 0.94 0.000 uncharacterized LOC109541897
XR_002172385.1 NW_017849433.1 23.5 -1.52 0.000 uncharacterized LOC109541917
XM_019910917.1 NW_017852254.1 5109.5 0.73 0.007 ATP-binding cassette sub-family A member 3-like
XM_019910918.1 NW_017852254.1 2750.9 -0.73 0.003 uncharacterized LOC109541922%2C transcript variant X1
XM_019910922.1 NW_017852254.1 837.7 0.74 0.000 protein MMS22-like
XM_019910936.1 NW_017852254.1 9649.8 0.75 0.001 glycerol kinase-like%2C transcript variant X1
XR_002172388.1 NW_017849443.1 125.9 0.56 0.002 uncharacterized LOC109541938
XM_019910941.1 NW_017852254.1 86.9 -0.57 0.004 protein FAM234B-like

196
XM_019910947.1 NW_017852254.1 11730.2 0.94 0.005 ATP-binding cassette sub-family A member 3-like
XM_019910962.1 NW_017852254.1 455.8 0.70 0.000 V-type proton ATPase 21 kDa proteolipid subunit%2C transcript variant X1
XR_002172389.1 NW_017852254.1 1051.5 1.01 0.000 uncharacterized LOC109541959
XM_019910984.1 NW_017849449.1 114.4 0.82 0.000 RNA-binding protein Musashi homolog Rbp6-like
XM_019910980.1 NW_017852254.1 32272.0 -0.43 0.000 activating transcription factor of chaperone%2C transcript variant X1
XM_019910983.1 NW_017852254.1 89.4 -0.92 0.008 EF-hand calcium-binding domain-containing protein 2-like%2C transcript variant X1
XM_019910995.1 NW_017852254.1 12008.6 -0.69 0.001 C3 and PZP-like alpha-2-macroglobulin domain-containing protein 8
XM_019911002.1 NW_017852254.1 100.8 -1.52 0.000 uncharacterized LOC109541982
XM_019911003.1 NW_017852255.1 4015.8 -0.50 0.001 coiled-coil and C2 domain-containing protein 1-like
XM_019911033.1 NW_017852256.1 1597.5 0.41 0.000 ubiquitin-conjugating enzyme E2 S
XM_019911037.1 NW_017852257.1 917.9 -0.87 0.000 low-density lipoprotein receptor-related protein 1-like
XM_019911038.1 NW_017852257.1 918.5 -0.99 0.000 prolow-density lipoprotein receptor-related protein 1-like
XM_019911045.1 NW_017849453.1 1299.3 1.04 0.000 uncharacterized LOC109542017
XM_019911047.1 NW_017852257.1 1460.0 -0.92 0.000 prolow-density lipoprotein receptor-related protein 1-like
XM_019911056.1 NW_017849455.1 1800.4 0.53 0.004 probable nucleoporin Nup58
XM_019911053.1 NW_017852257.1 276.2 -1.01 0.000 low-density lipoprotein receptor-related protein 1B-like
XM_019911059.1 NW_017852257.1 388.1 -0.90 0.000 prolow-density lipoprotein receptor-related protein 1-like
XM_019911064.1 NW_017852258.1 411.4 -0.98 0.006 uncharacterized LOC109542038
XM_019911089.1 NW_017852258.1 1964.7 0.52 0.000 sorting nexin-7-like
XM_019911105.1 NW_017852258.1 3317.1 0.27 0.010 zinc finger Ran-binding domain-containing protein 2%2C transcript variant X1
XM_019911107.1 NW_017852258.1 1236.9 0.53 0.000 probable small nuclear ribonucleoprotein G
XM_019911108.1 NW_017852258.1 9938.8 1.02 0.001 zinc transporter ZIP13-like
XM_019911119.1 NW_017852258.1 1306.3 0.37 0.003 treacle protein-like%2C transcript variant X1
XM_019911125.1 NW_017852258.1 864.6 0.27 0.010 mitochondrial ubiquitin ligase activator of NFKB 1
XM_019911132.1 NW_017852258.1 39363.9 0.88 0.001 sterol O-acyltransferase 1
XM_019911143.1 NW_017852258.1 7453.0 0.94 0.000 equilibrative nucleoside transporter 1%2C transcript variant X1
XM_019911149.1 NW_017852258.1 1841.8 -1.21 0.000 muscle segmentation homeobox
XM_019911152.1 NW_017852258.1 3218.1 -1.21 0.000 homeobox protein MSX-3-like
XM_019911158.1 NW_017852259.1 5153.0 -0.30 0.001 uncharacterized LOC109542101
XM_019911163.1 NW_017852260.1 181.8 -0.92 0.004 uncharacterized LOC109542105
XM_019911166.1 NW_017852262.1 1854.2 -0.60 0.002 protein-methionine sulfoxide oxidase Mical-like
XM_019911167.1 NW_017852262.1 714.2 -0.61 0.001 protein-methionine sulfoxide oxidase MICAL2-like
XM_019911171.1 NW_017852263.1 1147.0 -0.71 0.005 uncharacterized LOC109542113

197
XM_019911185.1 NW_017852263.1 208.1 -0.61 0.008 putative metabolite transport protein HI_1104
XM_019911204.1 NW_017852263.1 916.6 0.46 0.001 uncharacterized LOC109542133%2C transcript variant X1
XM_019911214.1 NW_017852263.1 1822.0 1.30 0.002 uncharacterized LOC109542137
XM_019911217.1 NW_017852263.1 2632.4 -0.59 0.001 uncharacterized LOC109542141
XM_019911219.1 NW_017852263.1 1236.1 0.84 0.000 voltage-dependent calcium channel subunit alpha-2/delta-3%2C transcript variant X1
XM_019911244.1 NW_017852263.1 11715.0 0.57 0.001 eukaryotic translation initiation factor 4E transporter-like%2C transcript variant X1
XM_019911261.1 NW_017852263.1 3962.3 -0.30 0.001 septin-1
XM_019911268.1 NW_017852263.1 649.4 -1.46 0.000 farnesol dehydrogenase-like
XM_019911269.1 NW_017852263.1 366.1 0.40 0.010 DNA repair and recombination protein RAD54-like
XM_019911274.1 NW_017852264.1 1102.0 0.54 0.000 YEATS domain-containing protein 4%2C transcript variant X1
XR_002172401.1 NW_017852264.1 1641.2 -0.49 0.007 uncharacterized LOC109542172
XM_019911277.1 NW_017852265.1 1602.7 0.37 0.003 evolutionarily conserved signaling intermediate in Toll pathway%2C mitochondrial-like
XM_019911281.1 NW_017852265.1 5796.9 -0.48 0.000 WW domain-binding protein 2
XM_019911287.1 NW_017852265.1 1769.9 0.47 0.005 S-adenosylmethionine mitochondrial carrier protein homolog%2C transcript variant X1
XM_019911300.1 NW_017852265.1 824.5 -0.48 0.001
phosphatidylinositol 3%2C4%2C5-trisphosphate 3-phosphatase and dual-specificity protein phosphatase PTEN%2C transcript variant X1
XM_019911320.1 NW_017852265.1 401.6 0.81 0.000 deoxynucleoside kinase-like
XM_019911327.1 NW_017852267.1 2617.4 -0.71 0.000 uncharacterized LOC109542202
XM_019911354.1 NW_017852267.1 872.1 -1.16 0.000 glycine-rich protein 5-like
XM_019911358.1 NW_017852267.1 9071.6 -0.56 0.000 supervillin-like%2C transcript variant X1
XM_019911362.1 NW_017852267.1 467.4 0.45 0.006 leukocyte receptor cluster member 1 homolog
XM_019911369.1 NW_017852267.1 1948.0 -0.53 0.002 ubiquitin-conjugating enzyme E2 J1-like
XM_019911389.1 NW_017852267.1 1053.4 0.67 0.001 zinc finger homeobox protein 3
XM_019911417.1 NW_017852269.1 1830.9 0.35 0.004 mediator of RNA polymerase II transcription subunit 23
XM_019911424.1 NW_017852269.1 364.0 0.53 0.000 mismatch repair endonuclease PMS2
XM_019911438.1 NW_017852269.1 4319.3 0.85 0.002 juvenile hormone epoxide hydrolase 1-like
XM_019911441.1 NW_017852269.1 1698.1 0.38 0.001 28S ribosomal protein S35%2C mitochondrial
XM_019911463.1 NW_017852269.1 1842.8 0.72 0.000 protein FAM60A%2C transcript variant X1
XM_019911481.1 NW_017852269.1 279.3 -0.77 0.004 BAI1-associated protein 3
XM_019911482.1 NW_017852269.1 405.0 0.79 0.000 mitochondrial inner membrane protease ATP23 homolog
XM_019911498.1 NW_017852270.1 1496.8 0.75 0.000 uncharacterized LOC109542314
XM_019911499.1 NW_017852270.1 862.6 -0.51 0.002 activating signal cointegrator 1
XM_019911517.1 NW_017852270.1 1497.0 0.67 0.003 lipase member H-A-like

198
XM_019911546.1 NW_017852272.1 967.9 0.47 0.001 PRKR-interacting protein 1 homolog
XM_019911556.1 NW_017852278.1 2006.6 0.38 0.002 protein mini spindles
XM_019911563.1 NW_017852278.1 2641.5 -0.48 0.001 RNA polymerase II elongation factor Ell
XM_019911592.1 NW_017852279.1 4315.2 -0.96 0.000 protein ECT2%2C transcript variant X1
XM_019911595.1 NW_017852279.1 4406.0 -0.74 0.000 GATA-binding factor 5-B-like%2C transcript variant X1
XM_019911597.1 NW_017852279.1 1580.5 -0.46 0.000 sorting nexin-13-like%2C transcript variant X1
XM_019911599.1 NW_017852279.1 10630.7 -0.68 0.000 MLX-interacting protein%2C transcript variant X1
XM_019911605.1 NW_017852279.1 2939.5 0.29 0.000 nuclear migration protein nudC
XM_019911614.1 NW_017852279.1 13336.3 0.20 0.005 importin subunit alpha-3
XM_019911620.1 NW_017852279.1 3244.4 -0.82 0.001 matrix metalloproteinase-14
XM_019911623.1 NW_017852279.1 37.2 -0.86 0.001 beta-galactoside alpha-2%2C6-sialyltransferase 1
XM_019911627.1 NW_017849532.1 201.7 0.77 0.003 kinesin-like protein 2
XM_019911631.1 NW_017852279.1 1363.1 0.50 0.002 nuclear pore complex protein Nup93-like
XM_019911633.1 NW_017852279.1 1139.8 -0.68 0.001 MAGUK p55 subfamily member 6%2C transcript variant X1
XM_019911640.1 NW_017852279.1 675.2 0.53 0.000 uncharacterized LOC109542416%2C transcript variant X1
XM_019911646.1 NW_017852279.1 3554.1 1.28 0.000 protein bicaudal C homolog 1-B
XM_019911654.1 NW_017852283.1 2685.3 -0.46 0.003 cell surface glycoprotein 1-like
XM_019911663.1 NW_017852286.1 1173.6 0.80 0.000 translation factor GUF1 homolog%2C mitochondrial
XM_019911686.1 NW_017852287.1 1708.9 0.35 0.003 serine/threonine-protein kinase D1%2C transcript variant X1
XM_019911688.1 NW_017852287.1 2628.4 -0.45 0.007 low-density lipoprotein receptor-related protein 2-like
XM_019911690.1 NW_017852287.1 385.0 0.53 0.009 origin recognition complex subunit 4%2C transcript variant X1
XM_019911704.1 NW_017852288.1 720.7 0.38 0.001 tudor domain-containing protein 3-like
XM_019911716.1 NW_017852289.1 2484.0 -0.47 0.003 uncharacterized LOC109542474
XM_019911719.1 NW_017852290.1 4.6 -1.93 0.000 uncharacterized LOC109542478
XM_019911720.1 NW_017852290.1 2617.2 -0.97 0.000 mitogen-activated protein kinase kinase kinase 4
XM_019911727.1 NW_017852290.1 3147.6 -0.55 0.001 probable enoyl-CoA hydratase echA8%2C transcript variant X1
XM_019911734.1 NW_017852291.1 2633.5 -0.48 0.002 dynamin-like
XM_019911745.1 NW_017852294.1 799.5 -0.38 0.000 transient receptor potential channel pyrexia
XM_019911758.1 NW_017852296.1 380.6 0.76 0.000 GDP-fucose protein O-fucosyltransferase 1%2C transcript variant X1
XM_019911761.1 NW_017852296.1 12706.4 -0.85 0.001 immediate early response gene 5-like protein
XM_019911776.1 NW_017852296.1 4716.9 -0.64 0.000 uncharacterized LOC109542526%2C transcript variant X1
XM_019911781.1 NW_017852296.1 3587.0 -0.85 0.000 uncharacterized LOC109542527%2C transcript variant X1
XM_019911783.1 NW_017852296.1 2958.9 0.30 0.004 uncharacterized LOC109542528
XM_019911787.1 NW_017852296.1 967.5 0.39 0.001 serine/threonine-protein phosphatase 2A activator-like
XM_019911792.1 NW_017849548.1 71.8 0.70 0.002 protein lethal(2)denticleless-like%2C transcript variant X1
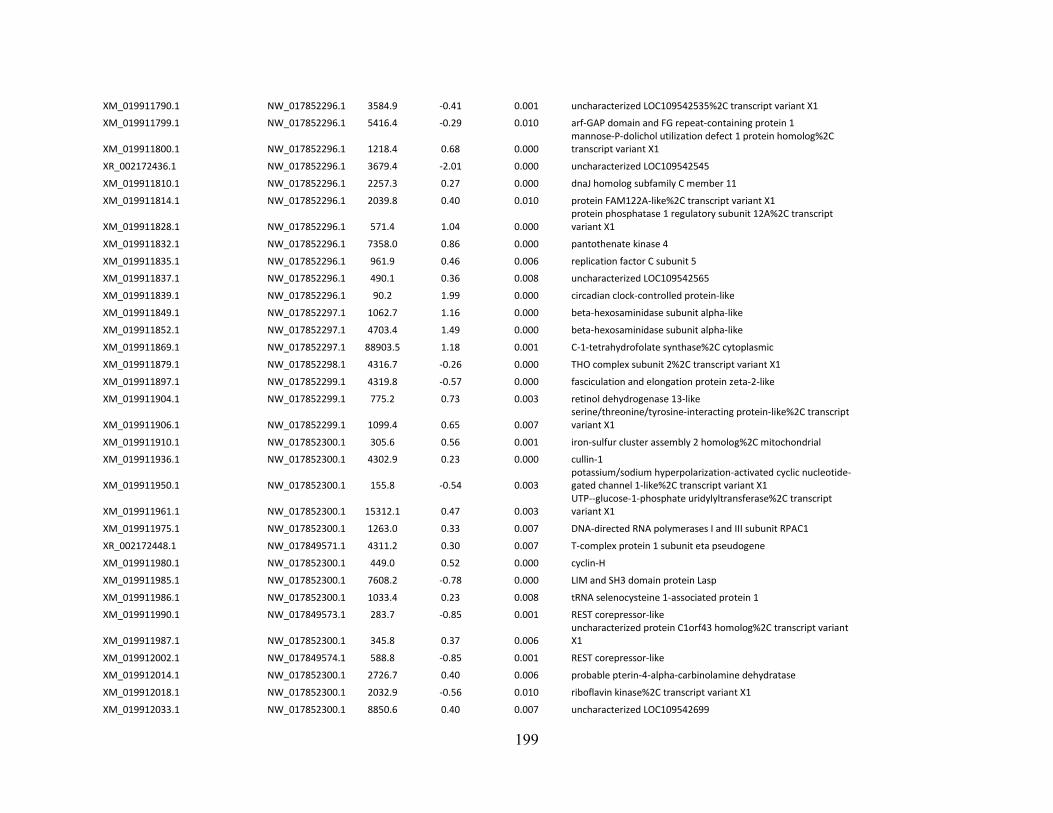
199
XM_019911790.1 NW_017852296.1 3584.9 -0.41 0.001 uncharacterized LOC109542535%2C transcript variant X1
XM_019911799.1 NW_017852296.1 5416.4 -0.29 0.010 arf-GAP domain and FG repeat-containing protein 1
XM_019911800.1 NW_017852296.1 1218.4 0.68 0.000 mannose-P-dolichol utilization defect 1 protein homolog%2C transcript variant X1
XR_002172436.1 NW_017852296.1 3679.4 -2.01 0.000 uncharacterized LOC109542545
XM_019911810.1 NW_017852296.1 2257.3 0.27 0.000 dnaJ homolog subfamily C member 11
XM_019911814.1 NW_017852296.1 2039.8 0.40 0.010 protein FAM122A-like%2C transcript variant X1
XM_019911828.1 NW_017852296.1 571.4 1.04 0.000 protein phosphatase 1 regulatory subunit 12A%2C transcript variant X1
XM_019911832.1 NW_017852296.1 7358.0 0.86 0.000 pantothenate kinase 4
XM_019911835.1 NW_017852296.1 961.9 0.46 0.006 replication factor C subunit 5
XM_019911837.1 NW_017852296.1 490.1 0.36 0.008 uncharacterized LOC109542565
XM_019911839.1 NW_017852296.1 90.2 1.99 0.000 circadian clock-controlled protein-like
XM_019911849.1 NW_017852297.1 1062.7 1.16 0.000 beta-hexosaminidase subunit alpha-like
XM_019911852.1 NW_017852297.1 4703.4 1.49 0.000 beta-hexosaminidase subunit alpha-like
XM_019911869.1 NW_017852297.1 88903.5 1.18 0.001 C-1-tetrahydrofolate synthase%2C cytoplasmic
XM_019911879.1 NW_017852298.1 4316.7 -0.26 0.000 THO complex subunit 2%2C transcript variant X1
XM_019911897.1 NW_017852299.1 4319.8 -0.57 0.000 fasciculation and elongation protein zeta-2-like
XM_019911904.1 NW_017852299.1 775.2 0.73 0.003 retinol dehydrogenase 13-like
XM_019911906.1 NW_017852299.1 1099.4 0.65 0.007 serine/threonine/tyrosine-interacting protein-like%2C transcript variant X1
XM_019911910.1 NW_017852300.1 305.6 0.56 0.001 iron-sulfur cluster assembly 2 homolog%2C mitochondrial
XM_019911936.1 NW_017852300.1 4302.9 0.23 0.000 cullin-1
XM_019911950.1 NW_017852300.1 155.8 -0.54 0.003 potassium/sodium hyperpolarization-activated cyclic nucleotide-gated channel 1-like%2C transcript variant X1
XM_019911961.1 NW_017852300.1 15312.1 0.47 0.003 UTP--glucose-1-phosphate uridylyltransferase%2C transcript variant X1
XM_019911975.1 NW_017852300.1 1263.0 0.33 0.007 DNA-directed RNA polymerases I and III subunit RPAC1
XR_002172448.1 NW_017849571.1 4311.2 0.30 0.007 T-complex protein 1 subunit eta pseudogene
XM_019911980.1 NW_017852300.1 449.0 0.52 0.000 cyclin-H
XM_019911985.1 NW_017852300.1 7608.2 -0.78 0.000 LIM and SH3 domain protein Lasp
XM_019911986.1 NW_017852300.1 1033.4 0.23 0.008 tRNA selenocysteine 1-associated protein 1
XM_019911990.1 NW_017849573.1 283.7 -0.85 0.001 REST corepressor-like
XM_019911987.1 NW_017852300.1 345.8 0.37 0.006 uncharacterized protein C1orf43 homolog%2C transcript variant X1
XM_019912002.1 NW_017849574.1 588.8 -0.85 0.001 REST corepressor-like
XM_019912014.1 NW_017852300.1 2726.7 0.40 0.006 probable pterin-4-alpha-carbinolamine dehydratase
XM_019912018.1 NW_017852300.1 2032.9 -0.56 0.010 riboflavin kinase%2C transcript variant X1
XM_019912033.1 NW_017852300.1 8850.6 0.40 0.007 uncharacterized LOC109542699

200
XM_019912044.1 NW_017852300.1 1278.2 0.52 0.000 protein will die slowly
XM_019912052.1 NW_017849592.1 279.8 0.38 0.007 uncharacterized LOC109542713
XM_019912059.1 NW_017852300.1 1380.8 0.73 0.000 flap endonuclease 1
XM_019912062.1 NW_017849592.1 2024.4 0.35 0.000 periodic tryptophan protein 1 homolog
XM_019912086.1 NW_017852301.1 17.5 -1.66 0.000 uncharacterized LOC109542737%2C transcript variant X1
XM_019912109.1 NW_017852301.1 1161.3 0.63 0.000 pre-rRNA-processing protein ESF2-like
XM_019912147.1 NW_017852302.1 558.7 1.78 0.000 nuclear receptor subfamily 2 group E member 1
XM_019912148.1 NW_017852302.1 261.3 -0.63 0.003 protein unc-13 homolog C
XM_019912155.1 NW_017852302.1 565.1 0.96 0.000 serine/threonine-protein kinase mos
XM_019912158.1 NW_017852302.1 1241.6 0.50 0.001 modifier of mdg4-like%2C transcript variant X1
XM_019912170.1 NW_017849621.1 909.5 0.36 0.006 putative E3 ubiquitin-protein ligase UBR7
XM_019912174.1 NW_017852302.1 2032.2 2.90 0.000 kynurenine formamidase-like
XM_019912184.1 NW_017852302.1 6062.2 -0.44 0.001 cytoplasmic dynein 1 intermediate chain%2C transcript variant X1
XM_019912205.1 NW_017852302.1 6627.8 -0.48 0.002 formin-binding protein 1-like%2C transcript variant X1
XM_019912227.1 NW_017852302.1 674.4 0.51 0.004 cytochrome c oxidase assembly protein COX15 homolog%2C transcript variant X1
XM_019912230.1 NW_017852302.1 1231.3 -0.54 0.000 protein spindle-F%2C transcript variant X1
XM_019912238.1 NW_017852302.1 5955.4 -0.56 0.004 uncharacterized LOC109542828
XM_019912274.1 NW_017852302.1 5592.2 -0.95 0.007 protein Malvolio-like
XM_019912275.1 NW_017852302.1 395.4 -1.38 0.000 beta-1%2C4-glucuronyltransferase 1%2C transcript variant X1
XM_019912285.1 NW_017852302.1 189.1 -1.43 0.001 spore wall protein 2-like
XM_019912320.1 NW_017849639.1 289.1 0.96 0.000 insulin-like growth factor 1 receptor
XM_019912321.1 NW_017852302.1 9178.7 -0.66 0.000 receptor-type tyrosine-protein phosphatase gamma
XM_019912325.1 NW_017852302.1 1834.7 0.62 0.001 protein prenyltransferase alpha subunit repeat-containing protein 1
XM_019912327.1 NW_017852302.1 2138.9 1.07 0.007 synaptic vesicle glycoprotein 2B-like
XM_019912330.1 NW_017852302.1 1829.9 0.47 0.000 glutaredoxin-3
XM_019912339.1 NW_017852302.1 617.4 0.39 0.009 integrator complex subunit 10
XR_002172463.1 NW_017852302.1 73.1 -1.14 0.000 uncharacterized LOC109542887
XM_019912344.1 NW_017852302.1 651.2 -0.43 0.000 protein NRDE2 homolog
XR_002172464.1 NW_017852302.1 52.1 -1.20 0.003 uncharacterized LOC109542891
XM_019912349.1 NW_017852302.1 2217.0 0.93 0.000 GPI mannosyltransferase 3
XM_019912353.1 NW_017852302.1 504.3 0.77 0.000 ADP-ribosylation factor-like protein 6-interacting protein 4
XM_019912354.1 NW_017852302.1 2551.3 0.86 0.000 uncharacterized LOC109542898%2C transcript variant X1
XM_019912358.1 NW_017852302.1 409.1 0.84 0.000 U7 snRNA-associated Sm-like protein LSm11
XM_019912359.1 NW_017852302.1 94.1 0.98 0.007 protein artichoke-like
XR_002172465.1 NW_017852302.1 119.1 -0.89 0.000 uncharacterized LOC109542907

201
XM_019912366.1 NW_017852302.1 3573.5 0.89 0.002 uncharacterized LOC109542908
XM_019912369.1 NW_017852304.1 5641.3 -0.58 0.000 apoptosis-resistant E3 ubiquitin protein ligase 1%2C transcript variant X1
XM_019912385.1 NW_017852305.1 3.6 -1.33 0.004 uncharacterized LOC109542925
XM_019912391.1 NW_017852305.1 89.1 -1.44 0.000 T-box transcription factor TBX3-like
XM_019912397.1 NW_017849649.1 257.7 0.57 0.009 uncharacterized LOC109542933
XM_019912400.1 NW_017852305.1 1364.2 1.04 0.000 high mobility group protein HMGI-C
XM_019912404.1 NW_017852305.1 1565.3 0.26 0.002 ubiquitin carboxyl-terminal hydrolase FAM188A homolog%2C transcript variant X1
XM_019912407.1 NW_017852305.1 1861.0 0.58 0.002 UBA-like domain-containing protein 2
XM_019912411.1 NW_017852305.1 17738.3 -0.35 0.008 clathrin heavy chain
XM_019912417.1 NW_017852305.1 2640.9 0.43 0.006 histone acetyltransferase type B catalytic subunit
XM_019912419.1 NW_017852305.1 5831.9 -1.06 0.000 probable cation-transporting ATPase 13A3
XM_019912431.1 NW_017852305.1 422.9 0.83 0.001 rac GTPase-activating protein 1%2C transcript variant X1
XM_019912433.1 NW_017852305.1 311.4 1.44 0.000 glucose dehydrogenase [FAD%2C quinone]-like
XM_019912442.1 NW_017852305.1 375.3 0.71 0.000 sex-lethal homolog%2C transcript variant X1
XM_019912447.1 NW_017852305.1 3386.8 -0.41 0.004 protein retinal degeneration B
XM_019912448.1 NW_017852305.1 4411.3 -0.54 0.000 integral membrane protein GPR155
XM_019912449.1 NW_017852305.1 2362.2 -0.31 0.005 ATP-dependent RNA helicase dbp2-like
XM_019912461.1 NW_017852305.1 8269.5 -0.52 0.002 microtubule-associated protein 1B-like
XM_019912473.1 NW_017852305.1 4573.8 0.42 0.009 NADH dehydrogenase [ubiquinone] iron-sulfur protein 8%2C mitochondrial
XM_019912509.1 NW_017852305.1 11078.1 1.46 0.001 scavenger receptor class B member 1-like%2C transcript variant X1
XM_019912511.1 NW_017852305.1 1562.8 1.47 0.000 scavenger receptor class B member 1-like%2C transcript variant X1
XM_019912520.1 NW_017852305.1 95.1 -0.51 0.007 T-box transcription factor TBX10
XM_019912530.1 NW_017852305.1 2123.7 -0.51 0.001 activating signal cointegrator 1 complex subunit 1-like
XM_019912567.1 NW_017852305.1 222025.2 -1.07 0.000 uncharacterized LOC109543047
XM_019912568.1 NW_017852305.1 2696.6 0.88 0.000 APOBEC1 complementation factor-like%2C transcript variant X1
XM_019912593.1 NW_017852308.1 664.1 0.51 0.001 uncharacterized LOC109543071
XM_019912609.1 NW_017852309.1 692.1 0.80 0.000 rho GTPase-activating protein 19
XM_019912614.1 NW_017852309.1 3666.9 -0.27 0.001 uncharacterized LOC109543087%2C transcript variant X1
XM_019912622.1 NW_017849664.1 419.1 0.42 0.001 protein arginine N-methyltransferase 3-like
XM_019912620.1 NW_017852309.1 1937.9 0.44 0.000 uncharacterized LOC109543091%2C transcript variant X1
XM_019912629.1 NW_017852310.1 1875.0 0.46 0.000 E3 ubiquitin-protein ligase TRIM33
XM_019912679.1 NW_017845697.1 10468.3 -0.45 0.008 sortilin-related receptor-like
XM_019912643.1 NW_017852311.1 491.2 0.71 0.001 collagen alpha-1(XI) chain-like
XM_019912645.1 NW_017852311.1 4727.2 -0.44 0.000 structural maintenance of chromosomes protein 3

202
XM_019912650.1 NW_017852311.1 2379.1 -0.42 0.001 E3 ubiquitin-protein ligase RFWD2-like
XM_019912661.1 NW_017852311.1 2939.0 -0.47 0.000 peroxisomal membrane protein 11C
XM_019912666.1 NW_017852312.1 54.8 -1.35 0.001 A disintegrin and metalloproteinase with thrombospondin motifs 12-like
XM_019912672.1 NW_017852312.1 292.6 0.65 0.000 ankyrin repeat%2C SAM and basic leucine zipper domain-containing protein 1
XM_019912676.1 NW_017852312.1 1319.1 1.07 0.001 uncharacterized LOC109543129
XM_019912687.1 NW_017852312.1 7683.0 -0.63 0.001 uncharacterized LOC109543138%2C transcript variant X1
XM_019912706.1 NW_017852312.1 1636.8 0.47 0.000 ubiquitin-like protein 5
XM_019912713.1 NW_017852312.1 5388.3 1.21 0.000 uncharacterized LOC109543152
XM_019912718.1 NW_017852312.1 797.2 0.82 0.000 RE1-silencing transcription factor B-like
XM_019912719.1 NW_017852312.1 1575.0 -1.22 0.000 cell division control protein 42 homolog
XM_019912726.1 NW_017852312.1 710.8 0.82 0.000 Y+L amino acid transporter 2%2C transcript variant X1
XM_019912733.1 NW_017852312.1 445.0 0.64 0.001 poly [ADP-ribose] polymerase 14-like
XM_019912744.1 NW_017852312.1 1489.8 0.55 0.003 2-acylglycerol O-acyltransferase 1-like%2C transcript variant X1
XM_019912771.1 NW_017852312.1 3563.0 1.51 0.000 putative serine protease F56F10.1
XM_019912772.1 NW_017852312.1 2275.8 0.68 0.000 thioredoxin domain-containing protein 5 homolog
XM_019912776.1 NW_017849691.1 5003.6 -0.98 0.000 ATP-binding cassette sub-family G member 4-like
XM_019912773.1 NW_017852312.1 5027.3 1.03 0.000 mucin-2-like
XM_019912784.1 NW_017852312.1 2024.2 1.07 0.000 uncharacterized LOC109543198
XM_019912785.1 NW_017852312.1 2577.9 1.23 0.000 uncharacterized LOC109543199
XM_019912789.1 NW_017852312.1 1959.5 1.00 0.000 uncharacterized LOC109543204
XM_019912791.1 NW_017852312.1 1718.6 0.91 0.005 uncharacterized LOC109543206
XM_019912792.1 NW_017852312.1 6256.8 1.09 0.001 uncharacterized LOC109543207
XM_019912793.1 NW_017852312.1 2174.4 1.11 0.000 uncharacterized LOC109543208
XM_019912795.1 NW_017852312.1 1251.8 1.13 0.001 uncharacterized LOC109543211
XM_019912796.1 NW_017852312.1 3876.4 1.23 0.000 uncharacterized LOC109543212
XM_019912799.1 NW_017852312.1 2054.7 1.04 0.000 uncharacterized LOC109543214
XM_019912806.1 NW_017852313.1 1720.9 -0.22 0.010 dual specificity mitogen-activated protein kinase kinase 7-like%2C transcript variant X1
XM_019912824.1 NW_017852313.1 7236.7 -0.33 0.010 protein phosphatase 1 regulatory subunit 15B%2C transcript variant X1
XM_019912842.1 NW_017852313.1 4355.2 0.60 0.000 putative tricarboxylate transport protein%2C mitochondrial%2C transcript variant X1
XM_019912864.1 NW_017852313.1 8200.5 0.40 0.003 NADH dehydrogenase [ubiquinone] flavoprotein 1%2C mitochondrial
XM_019912872.1 NW_017852315.1 2897.0 0.51 0.001 calcium-transporting ATPase type 2C member 1
XM_019912873.1 NW_017852315.1 1763.6 0.35 0.002 periodic tryptophan protein 1 homolog
XM_019912874.1 NW_017852315.1 1831.3 0.42 0.000 alpha- and gamma-adaptin-binding protein p34-like

203
XM_019912892.1 NW_017852320.1 1778.7 -0.30 0.005 UV radiation resistance-associated gene protein%2C transcript variant X1
XM_019912897.1 NW_017852320.1 2259.6 0.28 0.004 pyruvate dehydrogenase [acetyl-transferring]-phosphatase 1%2C mitochondrial
XM_019912910.1 NW_017852320.1 596.7 0.45 0.001 mediator of RNA polymerase II transcription subunit 29
XM_019912911.1 NW_017852320.1 1613.1 0.65 0.000 uncharacterized LOC109543289%2C transcript variant X1
XM_019912927.1 NW_017849725.1 110.9 -0.85 0.003 protein ovo-like%2C transcript variant X1
XM_019912926.1 NW_017852320.1 984.0 -0.70 0.000 ataxin-1%2C transcript variant X1
XM_019912934.1 NW_017852320.1 1734.5 -0.65 0.003 BTB/POZ domain-containing protein 6-like%2C transcript variant X1
XM_019912944.1 NW_017852320.1 5370.3 -0.88 0.001 facilitated trehalose transporter Tret1-like
XM_019912962.1 NW_017852320.1 3076.0 -0.99 0.000 uncharacterized LOC109543313
XM_019912968.1 NW_017852320.1 5557.2 -0.79 0.000 transmembrane and coiled-coil domains protein 2%2C transcript variant X1
XM_019912995.1 NW_017852320.1 5608.4 0.51 0.000 mitochondrial import receptor subunit TOM20 homolog B-like
XM_019912996.1 NW_017852320.1 609.2 -1.16 0.008 organic cation transporter protein-like
XM_019913002.1 NW_017852320.1 442.1 -0.76 0.004 discoidin domain-containing receptor tyrosine kinase B-like
XR_002172485.1 NW_017849730.1 339.4 -1.16 0.000 uncharacterized LOC109543333
XM_019913023.1 NW_017849741.1 29.9 -1.29 0.002 histidine-rich glycoprotein-like
XM_019913020.1 NW_017852324.1 10365.2 1.20 0.000 uncharacterized LOC109543346
XM_019913022.1 NW_017852324.1 3487.4 -0.36 0.007 disintegrin and metalloproteinase domain-containing protein 10
XM_019913039.1 NW_017852326.1 750.0 0.70 0.000 serine/threonine-protein kinase Aurora-2-like
XM_019913050.1 NW_017852326.1 2435.2 0.50 0.000 mitochondrial inner membrane protein OXA1L%2C transcript variant X1
XM_019913058.1 NW_017852326.1 810.4 -0.94 0.000 uncharacterized LOC109543373%2C transcript variant X1
XM_019913062.1 NW_017852326.1 36.6 -1.03 0.003 cytosol aminopeptidase-like
XM_019913063.1 NW_017852327.1 37342.5 -1.36 0.000 uncharacterized LOC109543375
XM_019913066.1 NW_017852327.1 4324.0 -1.80 0.000 putative uncharacterized protein DDB_G0290989
XM_019913067.1 NW_017852327.1 21758.0 -1.18 0.000 leucine-rich repeat-containing protein 40
XM_019913069.1 NW_017852328.1 110.3 -1.22 0.002 cathepsin L-like
XM_019913072.1 NW_017852328.1 907.4 -0.72 0.000 beta-1%2C4-glucuronyltransferase 1-like
XM_019913074.1 NW_017852328.1 82.1 -1.08 0.010 cathepsin L1-like
XM_019913092.1 NW_017849749.1 131.8 0.73 0.003 uncharacterized protein C19orf52-like
XM_019913090.1 NW_017852328.1 1995.0 -0.69 0.007 glutamate receptor ionotropic%2C kainate 2-like%2C transcript variant X1
XM_019913094.1 NW_017852328.1 2330.8 -1.41 0.000 protein toll-like%2C transcript variant X1
XM_019913096.1 NW_017852328.1 21.9 -1.48 0.000 tyrosine-protein kinase receptor torso
XM_019913097.1 NW_017852328.1 4195.4 0.69 0.000 double-stranded RNA-specific editase Adar%2C transcript variant X1

204
XM_019913102.1 NW_017852328.1 912.9 -1.11 0.000 insulin-like growth factor-binding protein complex acid labile subunit%2C transcript variant X1
XM_019913106.1 NW_017852328.1 1991.3 0.25 0.009 probable nucleoporin Nup54
XM_019913113.1 NW_017852328.1 52.0 -1.78 0.000 serine proteinase stubble
XM_019913116.1 NW_017852328.1 6045.5 -0.35 0.000 F-box only protein 28-like%2C transcript variant X1
XM_019913123.1 NW_017852328.1 11490.2 -0.91 0.000 glycerol-3-phosphate acyltransferase 4
XM_019913125.1 NW_017852328.1 1691.8 -0.73 0.000 beta-1%2C4-glucuronyltransferase 1-like
XM_019913134.1 NW_017852328.1 1269.6 -0.77 0.000 lactosylceramide 4-alpha-galactosyltransferase-like
XM_019913139.1 NW_017852328.1 640.8 0.42 0.002 metaxin-1
XM_019913145.1 NW_017852328.1 428.5 -0.40 0.005 uncharacterized LOC109543432
XM_019913153.1 NW_017852328.1 547.3 0.39 0.000 non-structural maintenance of chromosomes element 1 homolog
XM_019913157.1 NW_017852328.1 682.1 0.36 0.000 trafficking protein particle complex subunit 5
XM_019913170.1 NW_017852328.1 2482.9 0.37 0.002 mitochondrial pyruvate carrier 2-like
XM_019913186.1 NW_017852328.1 3865.9 -0.39 0.002 heterogeneous nuclear ribonucleoprotein A1%2C A2/B1 homolog%2C transcript variant X1
XM_019913188.1 NW_017852328.1 4397.2 -0.54 0.000 tolloid-like protein 1
XM_019913196.1 NW_017852329.1 1897.0 0.87 0.003 endothelin-converting enzyme 1-like
XM_019913215.1 NW_017852329.1 784.2 0.63 0.006 peptidoglycan-recognition protein 2-like
XM_019913216.1 NW_017852329.1 9520.0 0.87 0.000 fatty acid-binding protein%2C liver
XM_019913228.1 NW_017852332.1 94.9 1.06 0.002 glucose dehydrogenase [FAD%2C quinone]-like
XM_019913234.1 NW_017852335.1 624.6 -1.36 0.000 uncharacterized LOC109543498%2C transcript variant X1
XM_019913238.1 NW_017852336.1 676.5 1.00 0.001 uncharacterized LOC109543501
XM_019913249.1 NW_017852336.1 257.8 1.09 0.003 O-acyltransferase like protein-like
XM_019913251.1 NW_017852336.1 1556.7 0.37 0.006 cytochrome P450 6B1-like
XM_019913255.1 NW_017849790.1 1518.3 0.99 0.000 mitochondrial amidoxime reducing component 2-like%2C transcript variant X1
XM_019913260.1 NW_017852336.1 1973.0 0.30 0.002 epidermal growth factor receptor substrate 15-like 1%2C transcript variant X1
XM_019913266.1 NW_017852336.1 582.3 0.35 0.002 sister chromatid cohesion protein DCC1
XM_019913271.1 NW_017849791.1 1517.9 0.99 0.000 mitochondrial amidoxime reducing component 2-like%2C transcript variant X1
XM_019913269.1 NW_017852336.1 502.5 0.50 0.000 cysteine-rich protein 2-binding protein%2C transcript variant X1
XM_019913278.1 NW_017852336.1 2553.8 -0.41 0.000 rho guanine nucleotide exchange factor 18%2C transcript variant X1
XM_019913301.1 NW_017852336.1 446.1 -0.95 0.001 adhesion G-protein coupled receptor G4-like
XM_019913310.1 NW_017852336.1 417.5 0.47 0.000 carnosine N-methyltransferase
XM_019913311.1 NW_017852336.1 929.9 0.24 0.001 tRNA (adenine(37)-N6)-methyltransferase-like%2C transcript variant X1
XM_019913317.1 NW_017852336.1 1346.2 0.75 0.010 calcium and integrin-binding protein 1-like
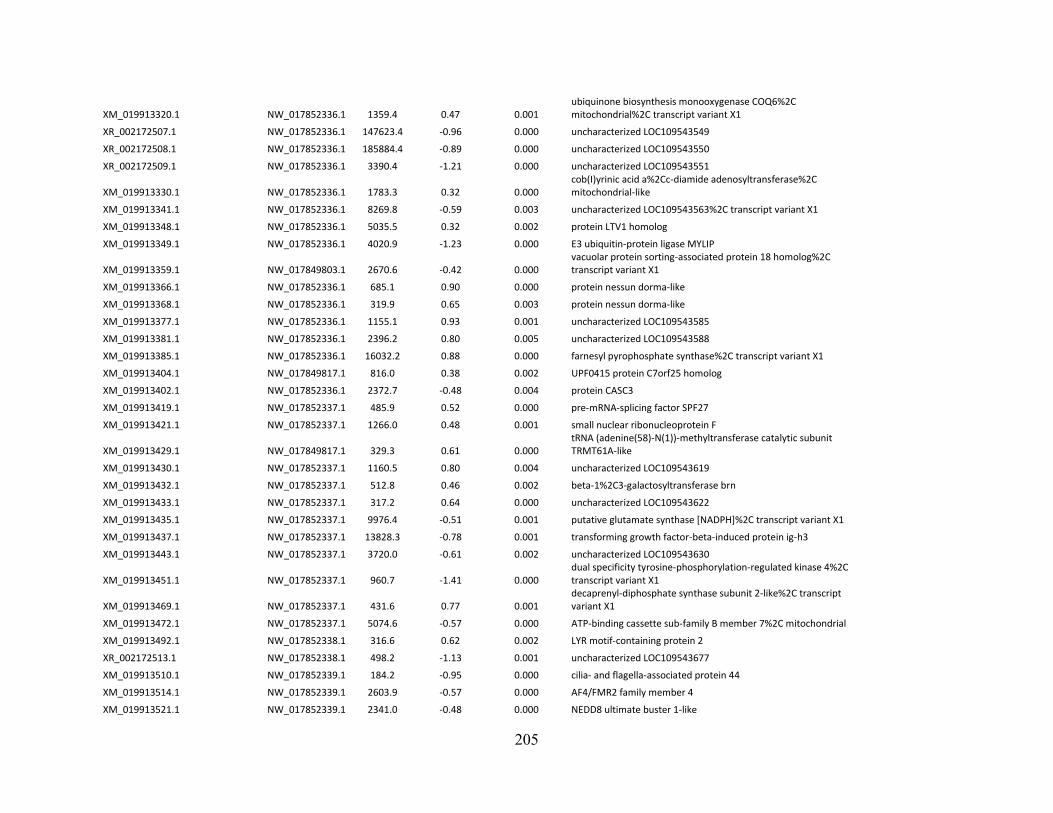
205
XM_019913320.1 NW_017852336.1 1359.4 0.47 0.001 ubiquinone biosynthesis monooxygenase COQ6%2C mitochondrial%2C transcript variant X1
XR_002172507.1 NW_017852336.1 147623.4 -0.96 0.000 uncharacterized LOC109543549
XR_002172508.1 NW_017852336.1 185884.4 -0.89 0.000 uncharacterized LOC109543550
XR_002172509.1 NW_017852336.1 3390.4 -1.21 0.000 uncharacterized LOC109543551
XM_019913330.1 NW_017852336.1 1783.3 0.32 0.000 cob(I)yrinic acid a%2Cc-diamide adenosyltransferase%2C mitochondrial-like
XM_019913341.1 NW_017852336.1 8269.8 -0.59 0.003 uncharacterized LOC109543563%2C transcript variant X1
XM_019913348.1 NW_017852336.1 5035.5 0.32 0.002 protein LTV1 homolog
XM_019913349.1 NW_017852336.1 4020.9 -1.23 0.000 E3 ubiquitin-protein ligase MYLIP
XM_019913359.1 NW_017849803.1 2670.6 -0.42 0.000 vacuolar protein sorting-associated protein 18 homolog%2C transcript variant X1
XM_019913366.1 NW_017852336.1 685.1 0.90 0.000 protein nessun dorma-like
XM_019913368.1 NW_017852336.1 319.9 0.65 0.003 protein nessun dorma-like
XM_019913377.1 NW_017852336.1 1155.1 0.93 0.001 uncharacterized LOC109543585
XM_019913381.1 NW_017852336.1 2396.2 0.80 0.005 uncharacterized LOC109543588
XM_019913385.1 NW_017852336.1 16032.2 0.88 0.000 farnesyl pyrophosphate synthase%2C transcript variant X1
XM_019913404.1 NW_017849817.1 816.0 0.38 0.002 UPF0415 protein C7orf25 homolog
XM_019913402.1 NW_017852336.1 2372.7 -0.48 0.004 protein CASC3
XM_019913419.1 NW_017852337.1 485.9 0.52 0.000 pre-mRNA-splicing factor SPF27
XM_019913421.1 NW_017852337.1 1266.0 0.48 0.001 small nuclear ribonucleoprotein F
XM_019913429.1 NW_017849817.1 329.3 0.61 0.000 tRNA (adenine(58)-N(1))-methyltransferase catalytic subunit TRMT61A-like
XM_019913430.1 NW_017852337.1 1160.5 0.80 0.004 uncharacterized LOC109543619
XM_019913432.1 NW_017852337.1 512.8 0.46 0.002 beta-1%2C3-galactosyltransferase brn
XM_019913433.1 NW_017852337.1 317.2 0.64 0.000 uncharacterized LOC109543622
XM_019913435.1 NW_017852337.1 9976.4 -0.51 0.001 putative glutamate synthase [NADPH]%2C transcript variant X1
XM_019913437.1 NW_017852337.1 13828.3 -0.78 0.001 transforming growth factor-beta-induced protein ig-h3
XM_019913443.1 NW_017852337.1 3720.0 -0.61 0.002 uncharacterized LOC109543630
XM_019913451.1 NW_017852337.1 960.7 -1.41 0.000 dual specificity tyrosine-phosphorylation-regulated kinase 4%2C transcript variant X1
XM_019913469.1 NW_017852337.1 431.6 0.77 0.001 decaprenyl-diphosphate synthase subunit 2-like%2C transcript variant X1
XM_019913472.1 NW_017852337.1 5074.6 -0.57 0.000 ATP-binding cassette sub-family B member 7%2C mitochondrial
XM_019913492.1 NW_017852338.1 316.6 0.62 0.002 LYR motif-containing protein 2
XR_002172513.1 NW_017852338.1 498.2 -1.13 0.001 uncharacterized LOC109543677
XM_019913510.1 NW_017852339.1 184.2 -0.95 0.000 cilia- and flagella-associated protein 44
XM_019913514.1 NW_017852339.1 2603.9 -0.57 0.000 AF4/FMR2 family member 4
XM_019913521.1 NW_017852339.1 2341.0 -0.48 0.000 NEDD8 ultimate buster 1-like

206
XM_019913522.1 NW_017852339.1 1910.4 -0.69 0.001 beta-1%2C4-mannosyltransferase egh-like
XM_019913523.1 NW_017852339.1 3717.2 -0.71 0.001 beta-1%2C4-mannosyltransferase egh-like
XM_019913524.1 NW_017852339.1 3263.2 0.42 0.006 proteasome inhibitor PI31 subunit-like%2C transcript variant X1
XM_019913526.1 NW_017852339.1 374.1 0.54 0.000 mitochondrial inner membrane protease subunit 1-like
XR_002172514.1 NW_017852339.1 29.3 -0.93 0.003 uncharacterized LOC109543705
XM_019913529.1 NW_017852339.1 2473.1 -0.25 0.003 SH3 domain-containing RING finger protein 3%2C transcript variant X1
XM_019913538.1 NW_017852339.1 919.8 -0.60 0.001 RNA-binding protein 33-like%2C transcript variant X1
XM_019913546.1 NW_017852339.1 979.9 -1.24 0.000 G-protein coupled receptor moody-like
XM_019913583.1 NW_017849874.1 201.9 -0.43 0.004 rho GTPase-activating protein 42-like
XM_019913589.1 NW_017852340.1 4193.7 0.68 0.004 phosphoglycerate kinase
XM_019913608.1 NW_017852340.1 7944.2 1.37 0.002 D-arabinitol dehydrogenase 1-like
XM_019913619.1 NW_017852340.1 1035.5 -0.44 0.003 mediator of RNA polymerase II transcription subunit 31%2C transcript variant X1
XM_019913634.1 NW_017852340.1 1859.8 0.60 0.000 histone-lysine N-methyltransferase pr-set7
XM_019913639.1 NW_017852340.1 568.5 0.44 0.006 uncharacterized LOC109543774
XM_019913651.1 NW_017849902.1 24989.2 0.30 0.007 60S ribosomal protein L5-like
XM_019913655.1 NW_017852341.1 29688.9 -0.79 0.006 electron transfer flavoprotein-ubiquinone oxidoreductase%2C mitochondrial
XM_019913663.1 NW_017852342.1 918.8 0.44 0.005 uncharacterized LOC109543795%2C transcript variant X1
XR_002172528.1 NW_017852342.1 384.1 0.82 0.000 uncharacterized LOC109543804
XM_019913675.1 NW_017852342.1 1641.6 -0.49 0.009 phosphofurin acidic cluster sorting protein 1
XM_019913676.1 NW_017852342.1 796.5 0.53 0.000 BRCA1-associated RING domain protein 1-like
XM_019913680.1 NW_017852342.1 643.2 0.63 0.000 exosome complex component RRP46
XM_019913696.1 NW_017852342.1 2745.3 0.43 0.002 protein lin-52 homolog
XM_019913745.1 NW_017852342.1 3008.2 0.49 0.000 polycomb group protein FERTILIZATION-INDEPENDENT SEED 2-like%2C transcript variant X1
XM_019913757.1 NW_017852342.1 1068.4 0.46 0.002 kelch-like protein 30%2C transcript variant X1
XM_019913763.1 NW_017852342.1 243.8 2.07 0.000 proton-coupled folate transporter-like
XM_019913768.1 NW_017852342.1 599.9 0.38 0.002 uncharacterized LOC109543853%2C transcript variant X1
XM_019913776.1 NW_017852342.1 158.6 1.15 0.000 Werner Syndrome-like exonuclease
XM_019913783.1 NW_017852342.1 515.4 0.83 0.001 POC1 centriolar protein homolog A-like
XM_019913784.1 NW_017852343.1 5766.3 -0.47 0.001 nuclear receptor coactivator 2%2C transcript variant X1
XM_019913812.1 NW_017849935.1 2029.4 -0.61 0.004 uncharacterized LOC109543883
XM_019913823.1 NW_017849936.1 2030.5 -0.61 0.004 uncharacterized LOC109543893
XM_019913826.1 NW_017852346.1 524.3 0.38 0.006 pre-mRNA-splicing factor 18-like
XM_019913837.1 NW_017852348.1 572.0 -0.68 0.000 tubby-related protein 4
XM_019913853.1 NW_017852348.1 2619.9 0.99 0.000 polyadenylate-binding protein 4-like%2C transcript variant X1

207
XM_019913860.1 NW_017852348.1 922.0 0.46 0.000 uncharacterized LOC109543925
XM_019913862.1 NW_017852348.1 1353.5 0.46 0.000 protein Star%2C transcript variant X1
XM_019913867.1 NW_017852348.1 1463.7 0.29 0.001 probable U3 small nucleolar RNA-associated protein 11
XM_019913878.1 NW_017852348.1 3060.5 -0.36 0.000 protein TAPT1 homolog%2C transcript variant X1
XM_019913887.1 NW_017852348.1 269.3 -1.01 0.001 uncharacterized LOC109543944
XM_019913888.1 NW_017852348.1 77.1 1.42 0.000 probable histone-lysine N-methyltransferase set-23
XM_019913890.1 NW_017852348.1 4095.7 -0.33 0.000 insulin-degrading enzyme
XM_019913894.1 NW_017852348.1 1610.6 -0.66 0.000 stress-activated map kinase-interacting protein 1%2C transcript variant X1
XM_019913909.1 NW_017852348.1 97.2 -0.77 0.001 phosphatase and actin regulator 4-B%2C transcript variant X1
XM_019913911.1 NW_017852348.1 6010.8 0.69 0.000 phosphoserine phosphatase
XM_019913912.1 NW_017852348.1 2507.7 -0.87 0.000 histone deacetylase complex subunit SAP18
XM_019913933.1 NW_017852348.1 1186.4 0.44 0.000 NEDD8-activating enzyme E1 catalytic subunit
XM_019913945.1 NW_017852348.1 133.3 -1.22 0.003 uncharacterized LOC109543982
XM_019913946.1 NW_017852349.1 8408.1 1.53 0.000 probable methylmalonate-semialdehyde dehydrogenase [acylating]%2C mitochondrial%2C transcript variant X1
XM_019913958.1 NW_017852350.1 3586.3 -0.35 0.008 transcription-associated protein 1%2C transcript variant X1
XM_019914004.1 NW_017852350.1 413.3 0.41 0.006 zinc finger protein OZF-like
XM_019914026.1 NW_017852350.1 10743.3 0.86 0.000 uncharacterized LOC109544033%2C transcript variant X1
XM_019914030.1 NW_017852350.1 5021.8 -0.59 0.000 putative inorganic phosphate cotransporter%2C transcript variant X1
XM_019914046.1 NW_017852350.1 621.5 0.66 0.000 nitrogen permease regulator 3-like protein
XM_019914091.1 NW_017845758.1 37863.5 -1.50 0.000 ATP-binding cassette sub-family G member 4-like
XM_019914057.1 NW_017852350.1 1226.6 0.93 0.000 cyclin-dependent kinase 1
XM_019914080.1 NW_017852350.1 514.6 0.71 0.008 DNA replication factor Cdt1-like
XM_019914088.1 NW_017852350.1 363.2 0.63 0.000 tRNA (adenine(58)-N(1))-methyltransferase non-catalytic subunit TRM6
XM_019914093.1 NW_017852350.1 751.0 0.60 0.000 WW domain-containing oxidoreductase
XM_019914118.1 NW_017852350.1 768.1 1.67 0.000 rutC family protein UK114
XM_019914124.1 NW_017852350.1 1861.9 0.39 0.001 probable prefoldin subunit 4
XM_019914138.1 NW_017852350.1 846.8 0.48 0.000 nuclear pore complex protein Nup88
XM_019914153.1 NW_017852351.1 2076.4 -0.36 0.002 uncharacterized LOC109544113%2C transcript variant X1
XM_019914159.1 NW_017852352.1 2180.9 0.73 0.006 uncharacterized LOC109544118
XM_019914160.1 NW_017852352.1 720.2 -0.59 0.001 protein lap4-like
XM_019914164.1 NW_017852353.1 2189.5 -0.40 0.000 male-specific lethal 1 homolog
XM_019914168.1 NW_017852353.1 572.2 0.69 0.000 ubiquinone biosynthesis O-methyltransferase%2C mitochondrial%2C transcript variant X1
XM_019914172.1 NW_017852353.1 3554.1 -0.35 0.000 prefoldin subunit 2

208
XM_019914175.1 NW_017852353.1 29.1 -0.82 0.007 sal-like protein 4
XM_019914180.1 NW_017850005.1 156.8 1.08 0.005 uncharacterized LOC109544136
XM_019914181.1 NW_017852355.1 2108.2 0.92 0.003 5-oxoprolinase
XM_019914185.1 NW_017852355.1 3542.7 -0.48 0.008 transmembrane protein 245%2C transcript variant X1
XM_019914201.1 NW_017852355.1 337.5 0.53 0.001 DNA polymerase epsilon subunit 2
XM_019914202.1 NW_017852355.1 182.7 -1.00 0.003 tubulin beta chain-like
XM_019914203.1 NW_017852355.1 281.2 -1.03 0.002 dual specificity protein phosphatase CDC14B-like%2C transcript variant X1
XM_019914207.1 NW_017852355.1 19610.0 1.36 0.000 probable cytochrome P450 6a13
XM_019914221.1 NW_017852355.1 6992.6 0.50 0.000 microtubule-associated protein RP/EB family member 1%2C transcript variant X1
XM_019914230.1 NW_017852355.1 299.1 1.32 0.000 uncharacterized LOC109544171%2C transcript variant X1
XM_019914234.1 NW_017852355.1 9803.1 -0.29 0.006 eukaryotic translation initiation factor 3 subunit J
XM_019914243.1 NW_017850018.1 532.1 0.46 0.005 CMP-sialic acid transporter 1-like
XM_019914242.1 NW_017852355.1 13535.0 1.01 0.001 esterase B1-like
XM_019914249.1 NW_017852355.1 819.5 0.90 0.001 m-AAA protease-interacting protein 1%2C mitochondrial
XM_019914262.1 NW_017852355.1 667.7 0.64 0.000 DNA replication licensing factor Mcm5
XM_019914275.1 NW_017850019.1 562.9 0.47 0.003 CMP-sialic acid transporter 1-like
XM_019914279.1 NW_017852358.1 1970.1 -0.99 0.000 uncharacterized LOC109544210
XM_019914280.1 NW_017852358.1 348.6 0.90 0.009 uncharacterized LOC109544211
XM_019914288.1 NW_017852358.1 917.2 -0.84 0.003 glucose dehydrogenase [FAD%2C quinone]-like
XM_019914295.1 NW_017852358.1 997.9 0.34 0.005 uncharacterized LOC109544226
XM_019914296.1 NW_017852358.1 2588.1 0.79 0.000 flotillin-2%2C transcript variant X1
XM_019914303.1 NW_017852358.1 3353.7 0.14 0.008 serine/threonine-protein phosphatase 4 catalytic subunit%2C transcript variant X1
XR_002172552.1 NW_017852358.1 38.6 1.23 0.001 uncharacterized LOC109544233%2C transcript variant X1
XM_019914314.1 NW_017852358.1 304.1 1.15 0.000 NAD-dependent protein deacylase Sirt4
XM_019914315.1 NW_017852358.1 1746.9 0.42 0.001 serine/threonine-protein phosphatase Pgam5%2C mitochondrial-like%2C transcript variant X1
XM_019914321.1 NW_017850023.1 4040.5 -0.31 0.001 putative U5 small nuclear ribonucleoprotein 200 kDa helicase
XM_019914336.1 NW_017852358.1 4332.1 -0.49 0.004 ceramide synthase 6
XM_019914337.1 NW_017852358.1 727.4 0.41 0.006 mediator of RNA polymerase II transcription subunit 30
XM_019914340.1 NW_017852358.1 2827.1 0.52 0.007 ecto-NOX disulfide-thiol exchanger 2
XM_019914342.1 NW_017852358.1 473.2 -0.37 0.000 uncharacterized LOC109544253
XM_019914351.1 NW_017852358.1 777.0 0.45 0.005 mitochondrial import inner membrane translocase subunit TIM16-like
XM_019914353.1 NW_017852358.1 445.5 0.54 0.000 diphthamide biosynthesis protein 1%2C transcript variant X1
XM_019914356.1 NW_017852358.1 2415.0 0.34 0.000 regulation of nuclear pre-mRNA domain-containing protein 1B

209
XM_019914360.1 NW_017852358.1 389.6 0.60 0.000 ankyrin repeat domain-containing protein 49-like%2C transcript variant X1
XM_019914363.1 NW_017852358.1 1213.7 0.46 0.004 uncharacterized LOC109544270%2C transcript variant X1
XM_019914375.1 NW_017852358.1 555.3 1.17 0.006 glucose dehydrogenase [FAD%2C quinone]-like
XM_019914383.1 NW_017852358.1 165.8 0.89 0.001 mannose-binding protein C
XM_019914389.1 NW_017852359.1 463.5 0.69 0.000 uncharacterized protein C19orf52-like
XM_019914406.1 NW_017852359.1 4146.8 0.28 0.004 chromatin assembly factor 1 subunit A-like%2C transcript variant X1
XR_002172561.1 NW_017852359.1 1920.6 0.59 0.000 uncharacterized LOC109544319
XM_019914434.1 NW_017852360.1 2785.4 -0.22 0.008 guanine nucleotide-binding protein G(s) subunit alpha%2C transcript variant X1
XM_019914441.1 NW_017852360.1 18329.8 -1.76 0.000 dystroglycan%2C transcript variant X1
XM_019914459.1 NW_017852362.1 1434.5 -0.60 0.000 homeodomain-interacting protein kinase 2-like%2C transcript variant X1
XM_019914463.1 NW_017850048.1 1960.1 0.41 0.003 glucosamine-6-phosphate isomerase-like%2C transcript variant X1
XR_002172564.1 NW_017852362.1 362.0 -0.57 0.000 uncharacterized LOC109544346
XM_019914468.1 NW_017852363.1 614.2 0.71 0.003 myelin transcription factor 1
XM_019914486.1 NW_017852363.1 655.8 1.15 0.000 protein abnormal spindle-like%2C transcript variant X1
XM_019914495.1 NW_017850060.1 1345.5 0.97 0.000 anaphase-promoting complex subunit 4-like
XM_019914500.1 NW_017852363.1 9305.6 1.33 0.001 glucose 1%2C6-bisphosphate synthase%2C transcript variant X1
XM_019914505.1 NW_017852363.1 451.0 0.45 0.008 ribonuclease P/MRP protein subunit POP5%2C transcript variant X1
XM_019914507.1 NW_017852363.1 9523.3 -0.35 0.000 armadillo segment polarity protein%2C transcript variant X1
XM_019914524.1 NW_017852363.1 476.6 0.73 0.000 peptidyl-prolyl cis-trans isomerase H
XM_019914527.1 NW_017852363.1 1579.3 -0.79 0.000 zinc finger protein 33A-like
XM_019914552.1 NW_017852366.1 2775.1 -0.58 0.001 matrix metalloproteinase-2-like
XM_019914558.1 NW_017852366.1 7108.3 -0.37 0.005 protein split ends%2C transcript variant X1
XR_002172582.1 NW_017852366.1 13.1 1.65 0.000 uncharacterized LOC109544438
XM_019914620.1 NW_017852366.1 2373.0 0.91 0.000 cytochrome b5-related protein
XR_002172584.1 NW_017852366.1 1742.8 0.86 0.002 uncharacterized LOC109544447
XM_019914649.1 NW_017850082.1 1597.1 0.40 0.000 prefoldin subunit 3-like
XM_019914654.1 NW_017852366.1 1595.5 0.31 0.005 protein-associating with the carboxyl-terminal domain of ezrin
XM_019914659.1 NW_017852366.1 7071.9 -0.57 0.000 autism susceptibility gene 2 protein-like%2C transcript variant X1
XM_019914667.1 NW_017852366.1 304.0 0.91 0.001 uncharacterized LOC109544472
XM_019914674.1 NW_017852366.1 8392.4 -0.72 0.000 protein alan shepard%2C transcript variant X1
XM_019914688.1 NW_017852366.1 4572.9 0.42 0.009 WD repeat domain phosphoinositide-interacting protein 2-like%2C transcript variant X1
XM_019914694.1 NW_017852366.1 14785.8 -0.72 0.000 Niemann-Pick C1 protein%2C transcript variant X1
XM_019914701.1 NW_017852366.1 39.2 1.35 0.001 titin-like
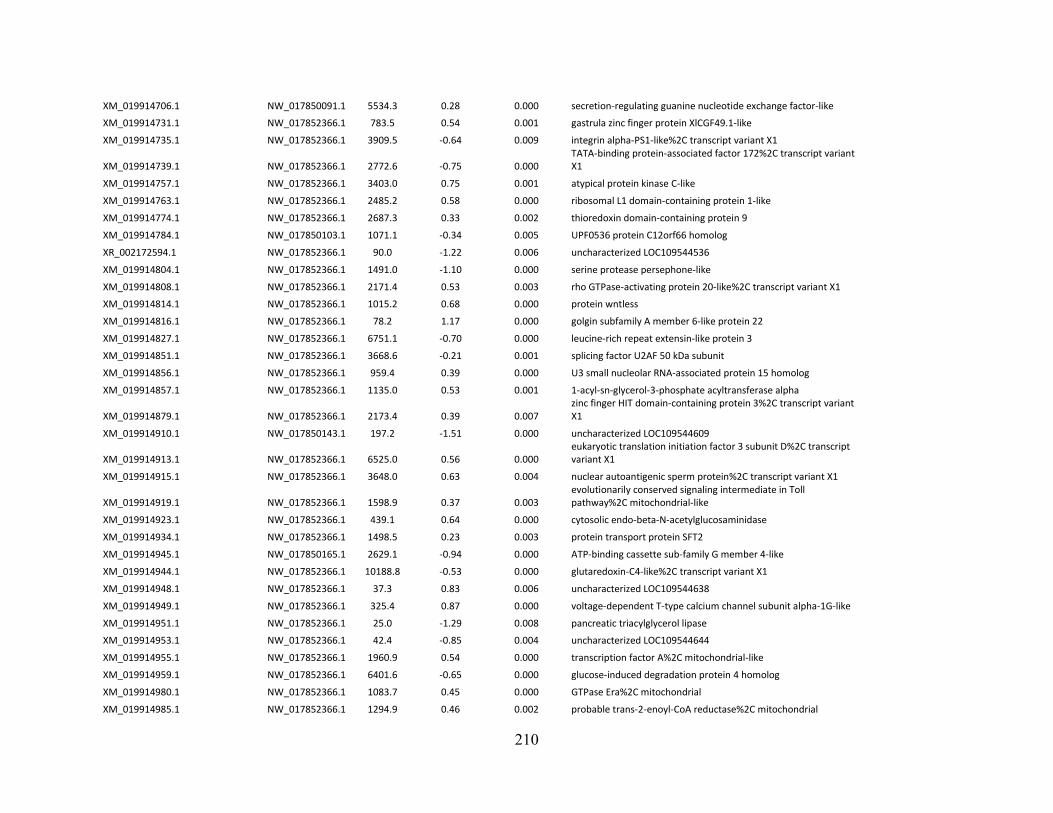
210
XM_019914706.1 NW_017850091.1 5534.3 0.28 0.000 secretion-regulating guanine nucleotide exchange factor-like
XM_019914731.1 NW_017852366.1 783.5 0.54 0.001 gastrula zinc finger protein XlCGF49.1-like
XM_019914735.1 NW_017852366.1 3909.5 -0.64 0.009 integrin alpha-PS1-like%2C transcript variant X1
XM_019914739.1 NW_017852366.1 2772.6 -0.75 0.000 TATA-binding protein-associated factor 172%2C transcript variant X1
XM_019914757.1 NW_017852366.1 3403.0 0.75 0.001 atypical protein kinase C-like
XM_019914763.1 NW_017852366.1 2485.2 0.58 0.000 ribosomal L1 domain-containing protein 1-like
XM_019914774.1 NW_017852366.1 2687.3 0.33 0.002 thioredoxin domain-containing protein 9
XM_019914784.1 NW_017850103.1 1071.1 -0.34 0.005 UPF0536 protein C12orf66 homolog
XR_002172594.1 NW_017852366.1 90.0 -1.22 0.006 uncharacterized LOC109544536
XM_019914804.1 NW_017852366.1 1491.0 -1.10 0.000 serine protease persephone-like
XM_019914808.1 NW_017852366.1 2171.4 0.53 0.003 rho GTPase-activating protein 20-like%2C transcript variant X1
XM_019914814.1 NW_017852366.1 1015.2 0.68 0.000 protein wntless
XM_019914816.1 NW_017852366.1 78.2 1.17 0.000 golgin subfamily A member 6-like protein 22
XM_019914827.1 NW_017852366.1 6751.1 -0.70 0.000 leucine-rich repeat extensin-like protein 3
XM_019914851.1 NW_017852366.1 3668.6 -0.21 0.001 splicing factor U2AF 50 kDa subunit
XM_019914856.1 NW_017852366.1 959.4 0.39 0.000 U3 small nucleolar RNA-associated protein 15 homolog
XM_019914857.1 NW_017852366.1 1135.0 0.53 0.001 1-acyl-sn-glycerol-3-phosphate acyltransferase alpha
XM_019914879.1 NW_017852366.1 2173.4 0.39 0.007 zinc finger HIT domain-containing protein 3%2C transcript variant X1
XM_019914910.1 NW_017850143.1 197.2 -1.51 0.000 uncharacterized LOC109544609
XM_019914913.1 NW_017852366.1 6525.0 0.56 0.000 eukaryotic translation initiation factor 3 subunit D%2C transcript variant X1
XM_019914915.1 NW_017852366.1 3648.0 0.63 0.004 nuclear autoantigenic sperm protein%2C transcript variant X1
XM_019914919.1 NW_017852366.1 1598.9 0.37 0.003 evolutionarily conserved signaling intermediate in Toll pathway%2C mitochondrial-like
XM_019914923.1 NW_017852366.1 439.1 0.64 0.000 cytosolic endo-beta-N-acetylglucosaminidase
XM_019914934.1 NW_017852366.1 1498.5 0.23 0.003 protein transport protein SFT2
XM_019914945.1 NW_017850165.1 2629.1 -0.94 0.000 ATP-binding cassette sub-family G member 4-like
XM_019914944.1 NW_017852366.1 10188.8 -0.53 0.000 glutaredoxin-C4-like%2C transcript variant X1
XM_019914948.1 NW_017852366.1 37.3 0.83 0.006 uncharacterized LOC109544638
XM_019914949.1 NW_017852366.1 325.4 0.87 0.000 voltage-dependent T-type calcium channel subunit alpha-1G-like
XM_019914951.1 NW_017852366.1 25.0 -1.29 0.008 pancreatic triacylglycerol lipase
XM_019914953.1 NW_017852366.1 42.4 -0.85 0.004 uncharacterized LOC109544644
XM_019914955.1 NW_017852366.1 1960.9 0.54 0.000 transcription factor A%2C mitochondrial-like
XM_019914959.1 NW_017852366.1 6401.6 -0.65 0.000 glucose-induced degradation protein 4 homolog
XM_019914980.1 NW_017852366.1 1083.7 0.45 0.000 GTPase Era%2C mitochondrial
XM_019914985.1 NW_017852366.1 1294.9 0.46 0.002 probable trans-2-enoyl-CoA reductase%2C mitochondrial

211
XM_019914997.1 NW_017852366.1 381.2 0.95 0.005 amyloid protein-binding protein 2
XM_019915004.1 NW_017852366.1 337.8 1.80 0.000 sulfotransferase 1C4%2C transcript variant X1
XM_019915008.1 NW_017852366.1 966.6 0.49 0.000 U6 snRNA-associated Sm-like protein LSm3
XM_019915010.1 NW_017852366.1 207.0 0.73 0.001 DNA polymerase delta small subunit
XM_019915022.1 NW_017852366.1 19.3 -1.15 0.006 coiled-coil domain-containing protein 96-like
XM_019915035.1 NW_017852368.1 779.8 0.38 0.000 coiled-coil domain-containing protein 134-like
XM_019915047.1 NW_017852368.1 460.7 0.71 0.000 origin recognition complex subunit 3
XM_019915048.1 NW_017852368.1 1093.2 0.28 0.008 beta-catenin-like protein 1
XM_019915053.1 NW_017852368.1 11271.8 2.28 0.000 group XV phospholipase A2-like
XM_019915062.1 NW_017852369.1 1313.7 -0.46 0.000 tyrosine-protein kinase Abl-like
XM_019915063.1 NW_017852369.1 2795.4 -0.62 0.000 protein Shroom
XM_019915070.1 NW_017852369.1 10467.3 0.45 0.000 clustered mitochondria protein homolog%2C transcript variant X1
XM_019915072.1 NW_017852369.1 6711.5 0.65 0.000 ATP-dependent RNA helicase DHX36-like%2C transcript variant X1
XM_019915078.1 NW_017852369.1 1383.7 0.36 0.000 tRNA dimethylallyltransferase%2C mitochondrial
XR_002172607.1 NW_017852369.1 348.8 0.56 0.005 uncharacterized LOC109544769%2C transcript variant X1
XM_019915105.1 NW_017852369.1 971.8 -1.28 0.000 caspase-1-like
XM_019915116.1 NW_017852369.1 1043.3 0.48 0.001 uncharacterized protein C16orf52 homolog A
XM_019915117.1 NW_017852369.1 2648.7 0.53 0.004 NHP2-like protein 1 homolog
XR_002172610.1 NW_017845819.1 674.2 0.42 0.002 THAP domain-containing protein 4-like%2C transcript variant X1
XM_019915146.1 NW_017852369.1 3810.7 -0.37 0.009 calpain-A-like%2C transcript variant X1
XR_002172609.1 NW_017850202.1 71.6 -1.35 0.000 uncharacterized LOC109544800
XM_019915159.1 NW_017852369.1 515.6 0.58 0.008 uncharacterized LOC109544807
XM_019915162.1 NW_017852369.1 5489.9 -0.25 0.001 poly(A) polymerase type 3
XM_019915172.1 NW_017852369.1 5816.6 -0.65 0.003 uncharacterized LOC109544820%2C transcript variant X1
XM_019915178.1 NW_017852369.1 1296.2 0.75 0.000 nardilysin-like%2C transcript variant X1
XM_019915181.1 NW_017852369.1 543.5 0.57 0.000 CWF19-like protein 2 homolog
XM_019915183.1 NW_017852369.1 1223.1 0.76 0.002 uncharacterized LOC109544827%2C transcript variant X1
XM_019915193.1 NW_017852369.1 4475.4 -0.66 0.001 uncharacterized LOC109544832%2C transcript variant X1
XM_019915197.1 NW_017852369.1 1474.6 0.52 0.005 serine/threonine-protein kinase VRK1-like
XM_019915204.1 NW_017850216.1 1632.4 -0.36 0.000 ragulator complex protein LAMTOR1
XM_019915203.1 NW_017852369.1 9169.5 -0.49 0.005 uncharacterized LOC109544838%2C transcript variant X1
XM_019915210.1 NW_017852369.1 2469.4 0.47 0.000 uncharacterized LOC109544841
XM_019915211.1 NW_017852369.1 214.8 0.81 0.000 zinc transporter ZIP3-like%2C transcript variant X1
XM_019915221.1 NW_017852369.1 3853.5 -0.71 0.000 protein enabled%2C transcript variant X1
XM_019915242.1 NW_017852369.1 486.4 0.62 0.001 uncharacterized LOC109544861%2C transcript variant X1
XM_019915244.1 NW_017852369.1 3672.4 -0.57 0.006 band 7 protein AGAP004871-like%2C transcript variant X1

212
XM_019915250.1 NW_017852369.1 3717.4 0.59 0.000 monoacylglycerol lipase ABHD12-like%2C transcript variant X1
XM_019915278.1 NW_017850235.1 587.3 1.02 0.000 uncharacterized LOC109544872
XM_019915275.1 NW_017852369.1 312.8 0.79 0.007 paired box protein Pax-8%2C transcript variant X1
XM_019915286.1 NW_017852369.1 3182.3 1.85 0.000 sphingomyelin phosphodiesterase-like%2C transcript variant X1
XM_019915326.1 NW_017845823.1 859.9 0.42 0.000 cleavage stimulation factor subunit 2-like
NW_017850235.1_1947-2566 NW_017850235.1 299.5 0.97 0.000 #N/A
XM_019915292.1 NW_017852369.1 4747.4 -1.00 0.002 L-lactate dehydrogenase-like%2C transcript variant X1
XM_019915295.1 NW_017852369.1 15717.1 -0.66 0.000 translocon-associated protein subunit alpha
XM_019915316.1 NW_017852369.1 236.3 -0.49 0.002 dendritic arbor reduction protein 1-like%2C transcript variant X1
XM_019915318.1 NW_017852369.1 586.1 0.63 0.004 otoferlin-like
XR_002172619.1 NW_017852369.1 1990.8 -0.71 0.000 uncharacterized LOC109544905%2C transcript variant X1
XM_019915334.1 NW_017852369.1 17.7 -0.96 0.008 uncharacterized LOC109544910%2C transcript variant X1
XM_019915338.1 NW_017850244.1 1715.0 -1.40 0.002 esterase FE4-like
XM_019915339.1 NW_017852369.1 558.2 1.01 0.000 maternal embryonic leucine zipper kinase-like
XM_019915346.1 NW_017852369.1 45.8 -1.25 0.002 L-lactate dehydrogenase B chain-like
XM_019915353.1 NW_017852370.1 1519.1 0.60 0.003 uncharacterized LOC109544931%2C transcript variant X1
XR_002172622.1 NW_017850246.1 370.5 -0.85 0.000 uncharacterized LOC109544932
XM_019915359.1 NW_017852370.1 1299.3 1.11 0.000 serine/threonine-protein kinase SIK2-like%2C transcript variant X1
XM_019915367.1 NW_017852371.1 1716.3 1.01 0.000 nucleoprotein TPR-like
XM_019915368.1 NW_017852371.1 12063.6 -0.38 0.004 transmembrane protease serine 9-like
XM_019915381.1 NW_017852371.1 4185.9 0.82 0.000 protein regulator of cytokinesis 1-like%2C transcript variant X1
XM_019915387.1 NW_017852371.1 1048.4 0.33 0.001 transcription initiation factor TFIID subunit 8-like
XM_019915396.1 NW_017852371.1 3186.9 0.57 0.000 serine-arginine protein 55-like
XM_019915397.1 NW_017852371.1 1594.4 0.47 0.000 intron-binding protein aquarius%2C transcript variant X1
XM_019915446.1 NW_017845826.1 654.7 0.82 0.000 uncharacterized LOC109544968
XM_019915405.1 NW_017852371.1 1329.4 0.40 0.000 protein SDE2 homolog
XM_019915406.1 NW_017852371.1 7735.1 -0.47 0.002 autophagy-related protein 2 homolog B
XM_019915408.1 NW_017852371.1 2377.9 0.45 0.000 tryptophan--tRNA ligase%2C cytoplasmic
XM_019915409.1 NW_017852371.1 1098.3 0.38 0.002 m7GpppN-mRNA hydrolase
XM_019915411.1 NW_017852371.1 773.4 0.56 0.001 zinc finger protein 16-like
XM_019915413.1 NW_017852371.1 8533.8 -0.52 0.001 microsomal glutathione S-transferase 1-like
XM_019915414.1 NW_017852371.1 2724.2 -0.32 0.000 protein daughterless%2C transcript variant X1
XM_019915442.1 NW_017852371.1 2078.0 0.35 0.006 uncharacterized LOC109544988%2C transcript variant X1
XM_019915451.1 NW_017852371.1 3229.9 1.03 0.000 G2/mitotic-specific cyclin-B
XM_019915471.1 NW_017852371.1 1485.7 0.43 0.000 integrator complex subunit 9
XM_019915481.1 NW_017852371.1 5655.5 -0.36 0.000 transmembrane emp24 domain-containing protein bai

213
XM_019915491.1 NW_017852371.1 611.6 0.85 0.000 NADPH oxidase 5%2C transcript variant X1
XM_019915495.1 NW_017852371.1 1082.1 0.42 0.000 ADP-ribosylation factor-like protein 2
XM_019915502.1 NW_017852371.1 1716.2 0.66 0.000 UPF0160 protein
XM_019915507.1 NW_017852371.1 282.9 -1.69 0.000 paired box pox-meso protein
XM_019915517.1 NW_017852372.1 2429.9 -0.66 0.000 septin-interacting protein 1
XM_019915518.1 NW_017852372.1 2179.8 0.43 0.000 histone-lysine N-methyltransferase setd3-like
XM_019915523.1 NW_017852372.1 408.4 0.68 0.000 mitochondrial import inner membrane translocase subunit Tim9-like
XM_019915536.1 NW_017852373.1 230.1 1.31 0.002 cytochrome P450 6k1-like%2C transcript variant X1
XM_019915540.1 NW_017852374.1 8046.6 -0.53 0.000 chromodomain-helicase-DNA-binding protein Mi-2 homolog%2C transcript variant X1
XM_019915555.1 NW_017852374.1 1715.2 0.74 0.000 exodeoxyribonuclease-like
XR_002172637.1 NW_017850264.1 71.8 0.62 0.004 uncharacterized LOC109545080
XM_019915578.1 NW_017852375.1 2076.4 0.98 0.000 mitochondrial amidoxime reducing component 2-like%2C transcript variant X1
XM_019915582.1 NW_017852375.1 917.5 0.65 0.000 protein-L-isoaspartate(D-aspartate) O-methyltransferase%2C transcript variant X1
XM_019915591.1 NW_017852375.1 1073.6 0.68 0.001 glycerate kinase
XM_019915595.1 NW_017852376.1 7168.5 -0.57 0.000 23 kDa integral membrane protein-like%2C transcript variant X1
XM_019915604.1 NW_017850268.1 1797.2 0.42 0.000 centromere/kinetochore protein zw10 homolog
XM_019915610.1 NW_017852377.1 932.8 0.34 0.007 uncharacterized LOC109545114
XM_019915611.1 NW_017852377.1 1686.3 -0.87 0.007 probable cytochrome P450 28d1
XM_019915626.1 NW_017852377.1 1247.4 0.40 0.000 probable phenylalanine--tRNA ligase%2C mitochondrial
XM_019915630.1 NW_017852377.1 774.9 0.56 0.000 WD repeat-containing protein 89%2C transcript variant X1
XM_019915639.1 NW_017852377.1 8645.2 -0.42 0.002 endoplasmic reticulum metallopeptidase 1%2C transcript variant X1
XM_019915642.1 NW_017852377.1 20.4 -0.93 0.001 cuticle protein 8-like
XM_019915661.1 NW_017852377.1 1709.8 0.52 0.000 probable ATP-dependent RNA helicase Dbp73D
XM_019915663.1 NW_017852377.1 994.0 0.80 0.000 uncharacterized LOC109545149%2C transcript variant X1
XM_019915667.1 NW_017852377.1 4958.9 -0.61 0.001 basic salivary proline-rich protein 1-like%2C transcript variant X1
XM_019915685.1 NW_017852377.1 545.9 0.45 0.000 D-beta-hydroxybutyrate dehydrogenase%2C mitochondrial-like
XM_019915686.1 NW_017852377.1 93.4 -1.13 0.004 transcription elongation factor spt5-like
XM_019915687.1 NW_017852377.1 1806.5 0.94 0.000 probable phospholipid hydroperoxide glutathione peroxidase%2C transcript variant X1
XM_019915693.1 NW_017852377.1 1480.0 0.46 0.006 39S ribosomal protein L11%2C mitochondrial-like
XM_019915706.1 NW_017852377.1 6159.5 -1.45 0.000 spatacsin%2C transcript variant X1
XM_019915709.1 NW_017852377.1 395.9 0.33 0.002 actin-related protein 8-like
XM_019915710.1 NW_017852377.1 587.1 0.50 0.000 leucine-rich repeat protein 1
XM_019915711.1 NW_017852377.1 1957.2 0.42 0.002 WD repeat-containing protein 74

214
XM_019915712.1 NW_017852377.1 2260.0 0.46 0.000 DDB1- and CUL4-associated factor 5%2C transcript variant X1
XM_019915727.1 NW_017852377.1 2079.7 -0.84 0.000 GTP-binding protein Rit2-like
XM_019915736.1 NW_017850281.1 1906.2 0.82 0.000 ATP-dependent RNA helicase DBP2-like
XM_019915735.1 NW_017852377.1 5514.1 0.95 0.000 serine/threonine-protein kinase Nek8-like
XM_019915737.1 NW_017852377.1 250.6 0.66 0.008 protein dead ringer%2C transcript variant X1
XM_019915743.1 NW_017852377.1 18.8 -1.01 0.009 paternally-expressed gene 3 protein-like
XM_019915746.1 NW_017852378.1 1830.4 -0.45 0.000 probable cation-transporting ATPase 13A3
XM_019915748.1 NW_017852378.1 789.4 -0.47 0.001 probable cation-transporting ATPase 13A4
XM_019915749.1 NW_017852378.1 1102.7 -0.48 0.000 probable cation-transporting ATPase 13A3
XM_019915750.1 NW_017852378.1 333.5 -0.48 0.000 uncharacterized LOC109545207
XM_019915752.1 NW_017852378.1 1336.8 -0.72 0.000 histone deacetylase 11%2C transcript variant X1
XM_019915758.1 NW_017852380.1 600.8 0.49 0.008 unconventional myosin-VIIa-like
XM_019915759.1 NW_017852380.1 109.9 -0.68 0.006 coiled-coil domain-containing protein 65-like
XM_019915763.1 NW_017852380.1 294.2 0.64 0.000 dimethyladenosine transferase 2%2C mitochondrial
XM_019915765.1 NW_017852380.1 17.3 -1.49 0.000 enhancer of split malpha protein-like
XM_019915766.1 NW_017852380.1 19302.9 -0.69 0.000 UDP-N-acetylglucosamine--peptide N-acetylglucosaminyltransferase 110 kDa subunit
XM_019915767.1 NW_017852380.1 3176.9 -0.38 0.000 E3 ubiquitin-protein ligase SMURF1%2C transcript variant X1
XM_019915776.1 NW_017850281.1 6559.1 0.85 0.000 ATP-dependent RNA helicase p62-like
XM_019915777.1 NW_017852380.1 628.4 -1.37 0.001 runt-related transcription factor 2-like
XM_019915778.1 NW_017852380.1 1908.6 0.26 0.007 U5 small nuclear ribonucleoprotein 40 kDa protein
XM_019915795.1 NW_017852380.1 6955.2 0.76 0.006 L-xylulose reductase-like
XM_019915796.1 NW_017852380.1 580.7 -0.95 0.000 uncharacterized LOC109545241%2C transcript variant X1
XM_019915825.1 NW_017852380.1 1626.5 0.49 0.006 protein BUD31 homolog
XM_019915826.1 NW_017852380.1 5101.8 0.26 0.000 phosphoribosyl pyrophosphate synthase-associated protein 2%2C transcript variant X1
XM_019915840.1 NW_017852380.1 12781.9 -1.03 0.000 myosin-IA%2C transcript variant X1
XM_019915842.1 NW_017852380.1 2558.2 -0.20 0.009 testis-expressed sequence 2 protein
XM_019915845.1 NW_017852380.1 1386.9 0.47 0.001 bifunctional coenzyme A synthase-like
XM_019915852.1 NW_017852380.1 708.3 -0.36 0.004 protein aveugle
XM_019915856.1 NW_017852380.1 1146.4 -0.62 0.002 cytochrome b5 reductase 4%2C transcript variant X1
XM_019915861.1 NW_017852380.1 5402.6 -0.28 0.002 fatty-acid amide hydrolase 2
XM_019915887.1 NW_017852380.1 3355.8 -0.36 0.000 uncharacterized LOC109545289%2C transcript variant X1
XM_019915891.1 NW_017852380.1 5314.7 0.84 0.000 androgen-induced gene 1 protein-like
XM_019915900.1 NW_017852380.1 1491.2 0.42 0.002 cAMP-regulated phosphoprotein 19
XM_019915903.1 NW_017852380.1 46.8 -0.96 0.002 odorant receptor 46a-like%2C transcript variant X1
XM_019915911.1 NW_017852380.1 5228.6 -0.60 0.000 kinesin-like protein unc-104%2C transcript variant X1

215
XM_019915925.1 NW_017852380.1 7439.2 -0.23 0.002 putative RNA-binding protein Luc7-like 2%2C transcript variant X1
XM_019915939.1 NW_017852380.1 1430.3 1.44 0.000 uncharacterized LOC109545321%2C transcript variant X1
XM_019915944.1 NW_017852380.1 2099.5 1.57 0.000 uncharacterized LOC109545322%2C transcript variant X1
XM_019915946.1 NW_017852380.1 11975.1 1.58 0.000 adenylosuccinate lyase
XM_019915947.1 NW_017852380.1 15.5 1.02 0.007 uncharacterized LOC109545324%2C transcript variant X1
XM_019915956.1 NW_017850342.1 601.6 0.34 0.001 uncharacterized LOC109545327
XM_019915962.1 NW_017852380.1 2648.2 1.02 0.000 inositol-3-phosphate synthase%2C transcript variant X1
XM_019915965.1 NW_017852380.1 5544.8 -1.15 0.000 major royal jelly protein 3-like
XM_019915981.1 NW_017852380.1 14694.6 -0.82 0.001 speckle-type POZ protein-like%2C transcript variant X1
XM_019915989.1 NW_017852380.1 15765.3 -1.20 0.000 sialin%2C transcript variant X1
XM_019915994.1 NW_017852380.1 19080.5 2.54 0.000 probable low-specificity L-threonine aldolase 2%2C transcript variant X1
XM_019915997.1 NW_017852380.1 6857.7 -0.77 0.000 protein tweety%2C transcript variant X1
XM_019916002.1 NW_017852380.1 927.9 0.85 0.000 uncharacterized LOC109545349%2C transcript variant X1
XM_019916004.1 NW_017852380.1 2006.6 -1.10 0.000 uncharacterized LOC109545350%2C transcript variant X1
XM_019916012.1 NW_017852380.1 9506.4 -0.64 0.000 ubiquitin carboxyl-terminal hydrolase 31
XM_019916026.1 NW_017852380.1 419.7 0.65 0.000 M-phase phosphoprotein 6
XM_019916030.1 NW_017852380.1 23789.0 -1.09 0.000 protein charybde-like%2C transcript variant X1
XM_019916034.1 NW_017852380.1 3446.8 -0.86 0.002 uncharacterized LOC109545370
XM_019916037.1 NW_017852380.1 6595.6 -0.72 0.000 protein charybde-like
XM_019916040.1 NW_017852380.1 272.3 -1.20 0.000 homeobox protein unc-4-like%2C transcript variant X1
XM_019916047.1 NW_017852380.1 1046.0 -0.87 0.000 B9 domain-containing protein 1-like
XM_019916048.1 NW_017852380.1 542.0 -0.68 0.004 protein charybde-like
XM_019916049.1 NW_017852380.1 511.6 0.83 0.007 enhancer of split mbeta protein-like
XM_019916050.1 NW_017852380.1 854.5 0.69 0.004 uncharacterized LOC109545386%2C transcript variant X1
XR_002172664.1 NW_017852380.1 130.0 -0.50 0.006 uncharacterized LOC109545387
XM_019916053.1 NW_017852380.1 641.7 1.11 0.000 zinc finger and BTB domain-containing protein 8A-like%2C transcript variant X1
XM_019916057.1 NW_017852380.1 24.7 -1.34 0.002 protein gooseberry-neuro-like
XM_019916059.1 NW_017852381.1 1302.6 -0.43 0.000 calmodulin-binding transcription activator 2-like
XM_019916067.1 NW_017852381.1 15.1 1.67 0.000 probable E3 ubiquitin-protein ligase makorin-1
XR_002172666.1 NW_017852381.1 106.7 -1.16 0.002 uncharacterized LOC109545411
XM_019916077.1 NW_017852381.1 3330.9 -0.33 0.008 rho guanine nucleotide exchange factor 5%2C transcript variant X1
XM_019916081.1 NW_017852381.1 2816.2 -0.30 0.000 DNA-directed RNA polymerase II subunit RPB2%2C transcript variant X1
XM_019916083.1 NW_017852381.1 1288.7 0.30 0.006 calcium homeostasis endoplasmic reticulum protein%2C transcript variant X1
XM_019916090.1 NW_017852381.1 5900.8 1.04 0.000 solute carrier family 25 member 35-like%2C transcript variant X1

216
XM_019916092.1 NW_017852381.1 710.5 0.80 0.000 tRNA methyltransferase 10 homolog A%2C transcript variant X1
XM_019916099.1 NW_017852381.1 6035.3 -0.38 0.007 dual specificity testis-specific protein kinase 2%2C transcript variant X1
XM_019916106.1 NW_017852381.1 1119.3 -0.88 0.000 BMP and activin membrane-bound inhibitor homolog
XM_019916107.1 NW_017852381.1 1743.4 0.37 0.001 B-cell CLL/lymphoma 7 protein family member A
XM_019916116.1 NW_017852381.1 279.0 0.74 0.005 aminopeptidase M1-A-like%2C transcript variant X1
XM_019916128.1 NW_017850378.1 38926.9 -1.52 0.000 ATP-binding cassette sub-family G member 4-like
XM_019916142.1 NW_017850384.1 447.1 -1.03 0.000 acyl-CoA:lysophosphatidylglycerol acyltransferase 1-like
XM_019916148.1 NW_017852381.1 589.4 1.00 0.000 myosin-10-like
XM_019916153.1 NW_017852381.1 20938.7 -0.51 0.001 protein transport protein Sec61 subunit alpha
XM_019916163.1 NW_017852381.1 247.5 0.47 0.001 zinc finger protein 664-like
XM_019916173.1 NW_017852381.1 6252.4 0.74 0.000 upstream activation factor subunit spp27
XM_019916189.1 NW_017852381.1 1296.1 0.54 0.000 G protein-coupled receptor kinase 2%2C transcript variant X1
XM_019916197.1 NW_017852381.1 530.9 0.72 0.000 protocadherin-like wing polarity protein stan
XM_019916221.1 NW_017852381.1 1684.9 0.61 0.000 histone RNA hairpin-binding protein
XM_019916222.1 NW_017852381.1 3917.8 -0.65 0.004 glycerol-3-phosphate acyltransferase 1%2C mitochondrial%2C transcript variant X1
XM_019916228.1 NW_017852381.1 839.6 0.50 0.000 tRNA-splicing ligase RtcB homolog
XM_019916230.1 NW_017852381.1 1645.6 0.37 0.006 TBC1 domain family member 7
XM_019916231.1 NW_017852381.1 1306.9 0.65 0.000 uncharacterized LOC109545491
XM_019916233.1 NW_017852381.1 1205.6 0.73 0.000 uncharacterized LOC109545494
XM_019916234.1 NW_017852381.1 9675.6 0.27 0.005 MICOS complex subunit Mic60%2C transcript variant X1
XR_002172671.1 NW_017852381.1 84.3 -2.20 0.000 uncharacterized LOC109545496
XM_019916250.1 NW_017852381.1 889.3 0.48 0.002 probable receptor-like protein kinase At5g18500
XM_019916253.1 NW_017852381.1 170.2 0.66 0.003 pancreatic triacylglycerol lipase-like%2C transcript variant X1
XM_019916255.1 NW_017852381.1 1000.6 0.45 0.001 quinone oxidoreductase-like protein 2 homolog
XM_019916256.1 NW_017852381.1 591.4 0.37 0.008 THO complex subunit 6 homolog
XM_019916258.1 NW_017852381.1 2774.8 -0.40 0.001 uncharacterized LOC109545511
NW_017850402.1_948-1527 NW_017850402.1 120.4 1.80 0.000 #N/A
XM_019916272.1 NW_017852381.1 2643.4 0.65 0.000 peroxiredoxin-2-like
XM_019916278.1 NW_017852381.1 70.5 -1.02 0.000 cilia- and flagella-associated protein 58-like
XM_019916279.1 NW_017852381.1 1201.4 -0.52 0.000 lateral signaling target protein 2 homolog
XM_019916280.1 NW_017852381.1 518.5 0.55 0.000 copper homeostasis protein cutC homolog
XM_019916284.1 NW_017852381.1 12301.4 1.23 0.004 glycine dehydrogenase (decarboxylating)%2C mitochondrial
XM_019916297.1 NW_017852381.1 2642.9 0.24 0.005 COP9 signalosome complex subunit 7b%2C transcript variant X1
XM_019916313.1 NW_017850408.1 288.0 0.58 0.000 mitochondrial inner membrane protease subunit 1-like
XM_019916315.1 NW_017852381.1 428.2 0.53 0.000 cell cycle checkpoint control protein RAD9A-like

217
XM_019916320.1 NW_017852381.1 13.7 -1.02 0.008 uncharacterized LOC109545555
NW_017850408.1_c8738-1508 NW_017850408.1 3567.7 -0.75 0.001 #N/A
XM_019916328.1 NW_017852381.1 2180.7 0.72 0.001 patched domain-containing protein 3%2C transcript variant X1
XM_019916331.1 NW_017852381.1 1601.0 0.76 0.001 uncharacterized LOC109545562%2C transcript variant X1
XM_019916334.1 NW_017852381.1 1091.8 0.30 0.009 TGF-beta-activated kinase 1 and MAP3K7-binding protein 1-like
XM_019916335.1 NW_017852381.1 168.9 0.87 0.000 DNA repair protein RAD51 homolog 4-like
XM_019916347.1 NW_017852381.1 5991.1 -0.38 0.004 NECAP-like protein CG9132
XM_019916364.1 NW_017852381.1 3724.5 1.04 0.001 elongation of very long chain fatty acids protein 7-like
XM_019916367.1 NW_017852381.1 1154.0 -0.83 0.006 TWiK family of potassium channels protein 18-like
XM_019916368.1 NW_017852381.1 79.5 0.94 0.002 glutamate receptor ionotropic%2C kainate 2-like
XM_019916374.1 NW_017852381.1 66.5 -0.74 0.002 homeotic protein empty spiracles-like
XM_019916375.1 NW_017852381.1 126.0 0.82 0.000 DNA helicase MCM9-like%2C transcript variant X1
XM_019916394.1 NW_017852381.1 1683.9 0.93 0.000 anillin-like
XM_019916405.1 NW_017852382.1 7247.7 -0.24 0.003 pre-mRNA-processing factor 39
XM_019916409.1 NW_017852382.1 1833.8 -1.22 0.000 A disintegrin and metalloproteinase with thrombospondin motifs 16%2C transcript variant X1
XM_019916414.1 NW_017852382.1 7420.2 0.24 0.003 ATP-dependent zinc metalloprotease YME1L1
XM_019916425.1 NW_017852382.1 10418.0 -0.48 0.001 transmembrane protein 214-A
XM_019916435.1 NW_017852382.1 580.7 0.65 0.000 glycosaminoglycan xylosylkinase homolog%2C transcript variant X1
XM_019916437.1 NW_017852382.1 7870.2 -0.42 0.006 peptidyl-prolyl cis-trans isomerase FKBP8%2C transcript variant X1
XM_019916450.1 NW_017852382.1 3295.7 -0.39 0.002 BSD domain-containing protein 1-A-like%2C transcript variant X1
XM_019916454.1 NW_017852382.1 691.2 0.49 0.002 probable cardiolipin synthase (CMP-forming)
XM_019916464.1 NW_017852382.1 2347.7 -0.41 0.003 DNA-directed RNA polymerase III subunit RPC7
XM_019916470.1 NW_017852382.1 1886.6 0.55 0.002 probable ubiquitin-conjugating enzyme E2 C
XM_019916505.1 NW_017852382.1 263.8 -1.35 0.000 coiled-coil and C2 domain-containing protein 2A
XM_019916506.1 NW_017852382.1 3178.9 -0.28 0.000 BTB/POZ domain-containing protein 9%2C transcript variant X1
XM_019916511.1 NW_017850438.1 3124.6 -0.82 0.007 1-acyl-sn-glycerol-3-phosphate acyltransferase alpha-like
XM_019916508.1 NW_017852382.1 25967.4 -0.81 0.002 23 kDa integral membrane protein-like
XM_019916525.1 NW_017850439.1 1721.4 -0.83 0.007 1-acyl-sn-glycerol-3-phosphate acyltransferase alpha-like
XM_019916528.1 NW_017852382.1 2921.7 -0.60 0.000 CREB-regulated transcription coactivator 1-like%2C transcript variant X1
XM_019916532.1 NW_017852382.1 5132.7 0.75 0.003 aldose reductase-like
XM_019916533.1 NW_017852382.1 167.6 1.66 0.000 dynein regulatory complex subunit 7
XM_019916542.1 NW_017852383.1 7658.0 -0.36 0.002 RB1-inducible coiled-coil protein 1%2C transcript variant X1
XM_019916549.1 NW_017852383.1 1029.4 -1.00 0.003 integrin beta-PS-like
XM_019916571.1 NW_017852384.1 2153.2 -0.74 0.001 serine protease easter-like

218
XM_019916572.1 NW_017852385.1 1033.2 -0.79 0.000 piezo-type mechanosensitive ion channel component-like
XM_019916578.1 NW_017852408.1 559.5 0.75 0.001 plexin domain-containing protein 2-like
XM_019916601.1 NW_017852555.1 59.7 0.81 0.002 tubulin epsilon chain-like
XM_019916604.1 NW_017852582.1 2658.7 0.99 0.000 uncharacterized LOC109545762
XM_019916607.1 NW_017852599.1 250.7 -0.71 0.003 disco-interacting protein 2
XR_002172695.1 NW_017852715.1 879.6 -0.70 0.000 uncharacterized LOC109545787
XM_019916633.1 NW_017852745.1 78.4 0.83 0.002 collagen alpha-2(XI) chain-like
XM_019916658.1 NW_017852893.1 192.2 0.81 0.001 protein SDE2 homolog
XM_019916667.1 NW_017850500.1 1251.5 0.27 0.005 polyphosphoinositide phosphatase-like
XM_019916668.1 NW_017850500.1 3268.8 0.44 0.001 eukaryotic translation initiation factor 3 subunit K-like
XM_019916672.1 NW_017850502.1 3806.1 -0.49 0.000 serine/threonine-protein kinase 10-like
XM_019916673.1 NW_017850503.1 4816.8 -0.50 0.000 serine/threonine-protein kinase 10-like
XM_019916674.1 NW_017850504.1 526.1 -0.37 0.007 uncharacterized LOC109545832
XM_019916678.1 NW_017850520.1 5533.8 0.28 0.000 secretion-regulating guanine nucleotide exchange factor-like
XM_019916692.1 NW_017845860.1 301.2 -0.48 0.003 uncharacterized LOC109545848
XM_019916691.1 NW_017850547.1 86.5 -0.78 0.003 cytochrome P450 4d2-like%2C transcript variant X1
XM_019916694.1 NW_017850548.1 63.4 -0.78 0.005 cytochrome P450 4d2-like
XM_019916696.1 NW_017850552.1 72.4 0.64 0.001 disheveled-associated activator of morphogenesis 2-like
XM_019916701.1 NW_017845861.1 310.4 -0.50 0.001 uncharacterized LOC109545859
XM_019916699.1 NW_017850558.1 945.6 -0.47 0.009 serine/threonine-protein kinase 3-like
XM_019916704.1 NW_017850561.1 376.5 -0.34 0.009 signal-induced proliferation-associated 1-like protein 2
XM_019916714.1 NW_017845862.1 3550.6 0.32 0.001 T-complex protein 1 subunit eta-like
XM_019916717.1 NW_017850575.1 1222.4 -0.69 0.000 monocarboxylate transporter 12-like
XM_019916721.1 NW_017850592.1 30.3 -1.30 0.004 homeotic protein proboscipedia-like
XM_019916736.1 NW_017850625.1 77.9 1.03 0.009 proline-rich nuclear receptor coactivator 2-like
XR_002172707.1 NW_017850625.1 89.3 1.18 0.009 uncharacterized LOC109545894
XM_019916746.1 NW_017850652.1 7526.0 0.85 0.003 aldose reductase-like
XM_019916751.1 NW_017850658.1 405.2 0.51 0.000 DNA polymerase delta catalytic subunit-like
XM_019916756.1 NW_017850661.1 35.8 -1.33 0.003 homeotic protein proboscipedia-like
XM_019916757.1 NW_017850662.1 36.0 -1.34 0.003 homeotic protein proboscipedia-like
XM_019916763.1 NW_017850671.1 8401.1 -0.29 0.002 spectrin beta chain-like
XM_019916770.1 NW_017850687.1 861.4 0.42 0.000 cleavage stimulation factor subunit 2-like
XM_019916776.1 NW_017845868.1 680.2 -0.40 0.005 uncharacterized LOC109545931
XM_019916773.1 NW_017850703.1 2782.5 -0.48 0.002 dynamin-like
XM_019916778.1 NW_017850708.1 870.9 -0.57 0.004 ATP-binding cassette sub-family G member 4-like
XR_002172714.1 NW_017850709.1 661.3 1.18 0.000 uncharacterized LOC109545936

219
XM_019916790.1 NW_017850717.1 263.3 0.57 0.008 uncharacterized LOC109545945
XM_019916798.1 NW_017850731.1 646.7 1.06 0.005 sideroflexin-1-like
XM_019916799.1 NW_017850733.1 33.7 0.80 0.000 dnaJ homolog subfamily C member 24-like
XM_019916805.1 NW_017850746.1 1140.0 0.30 0.007 RNA polymerase II-associated factor 1 homolog
XM_019916806.1 NW_017850747.1 2146.0 0.29 0.003 RNA polymerase II-associated factor 1 homolog
XR_002172717.1 NW_017850753.1 661.2 1.18 0.000 uncharacterized LOC109545966
XM_019916809.1 NW_017850761.1 1335.5 0.27 0.004 polyphosphoinositide phosphatase-like
XM_019916810.1 NW_017850761.1 2369.7 0.49 0.000 eukaryotic translation initiation factor 3 subunit K-like
XM_019916816.1 NW_017850775.1 3018.2 0.35 0.005 caprin homolog%2C transcript variant X1
XM_019916818.1 NW_017850775.1 1519.6 -0.60 0.002 protein shuttle craft-like
XR_002172719.1 NW_017850780.1 302.8 0.35 0.010 uncharacterized LOC109545979
XM_019916820.1 NW_017850780.1 1049.4 0.55 0.004 apoptosis-stimulating of p53 protein 2-like
XM_019916821.1 NW_017850781.1 877.5 0.56 0.005 apoptosis-stimulating of p53 protein 2-like
XR_002172720.1 NW_017850781.1 303.4 0.34 0.010 uncharacterized LOC109545983
XM_019916828.1 NW_017850802.1 1476.7 -0.85 0.000 GTP-binding protein Rit1-like
XM_019916831.1 NW_017850811.1 35.3 1.07 0.001 uncharacterized LOC109545992
XM_019916835.1 NW_017850821.1 19.1 -1.03 0.004 uncharacterized LOC109545998
XM_019916839.1 NW_017850822.1 19.1 -1.03 0.004 uncharacterized LOC109546002
XM_019916840.1 NW_017850823.1 19.1 -1.03 0.004 homeobox protein OTX-like
XM_019916860.1 NW_017850846.1 532.1 0.52 0.000 uncharacterized LOC109546024
XR_002172724.1 NW_017850888.1 1282.8 -0.74 0.000 uncharacterized LOC109546042%2C transcript variant X1
XM_019916882.1 NW_017845920.1 49.8 1.02 0.003 carbohydrate sulfotransferase 1-like
XM_019916881.1 NW_017850890.1 131.4 -1.00 0.000 organic cation transporter-like protein
XR_002172726.1 NW_017850892.1 643.4 -0.89 0.000 uncharacterized LOC109546046
XM_019916886.1 NW_017850913.1 12058.2 1.05 0.000 uncharacterized LOC109546052
XM_019916896.1 NW_017850933.1 518.3 1.11 0.000 uncharacterized LOC109546061
XM_019916905.1 NW_017850947.1 1861.4 0.92 0.000 poly(A) RNA polymerase gld-2 homolog A-like
XM_019916916.1 NW_017850948.1 3454.1 -1.62 0.000 uncharacterized LOC109546080
XM_019916917.1 NW_017850949.1 2469.9 -1.60 0.000 uncharacterized LOC109546081
XR_002172729.1 NW_017850963.1 12.6 -1.46 0.002 uncharacterized LOC109546083%2C transcript variant X1
XM_019916923.1 NW_017850979.1 56094.1 1.22 0.002 pectinesterase B-like
XM_019916927.1 NW_017850986.1 2045.4 0.35 0.006 ribosome production factor 2 homolog
XM_019916931.1 NW_017851001.1 64.7 1.11 0.007 serine protease snake-like
XM_019916933.1 NW_017851006.1 637.3 -1.01 0.000 uncharacterized LOC109546099%2C transcript variant X1
XM_019916936.1 NW_017851008.1 456.0 0.38 0.001 oligoribonuclease%2C mitochondrial-like
XR_002172733.1 NW_017851035.1 481.8 -0.70 0.001 uncharacterized LOC109546115%2C transcript variant X1

220
XM_019916950.1 NW_017851049.1 1345.7 0.97 0.000 anaphase-promoting complex subunit 4-like
XR_002172736.1 NW_017851065.1 463.2 -0.73 0.007 uncharacterized LOC109546124
XR_002172737.1 NW_017851065.1 205.7 -0.76 0.004 uncharacterized LOC109546126
XM_019916962.1 NW_017851077.1 1040.9 0.65 0.000 protein farnesyltransferase subunit beta%2C transcript variant X1
XM_019916973.1 NW_017851084.1 24.1 1.28 0.006 uncharacterized LOC109546141
XM_019916990.1 NW_017851084.1 41896.3 1.69 0.000 amidophosphoribosyltransferase-like
XM_019916995.1 NW_017851084.1 651.9 0.55 0.000 exosome complex component RRP4
XM_019916998.1 NW_017851084.1 18065.4 -0.35 0.003 spectrin alpha chain%2C transcript variant X1
XM_019917010.1 NW_017851084.1 397.0 0.55 0.007 protein ARV1
XM_019917028.1 NW_017851084.1 13110.2 2.08 0.000 branched-chain-amino-acid aminotransferase%2C cytosolic
XM_019917055.1 NW_017845975.1 62.9 -1.57 0.000 probable cytochrome P450 9f2
XM_019917057.1 NW_017851084.1 873.5 2.01 0.000 cytochrome P450 4c3-like%2C transcript variant X1
XM_019917081.1 NW_017851087.1 2962.3 -0.31 0.000 centrosome-associated zinc finger protein CP190
XM_019917088.1 NW_017851087.1 1315.1 0.36 0.003 splicing factor 3A subunit 3
XM_019917091.1 NW_017851087.1 3638.5 -0.24 0.000 protein YIPF5
XM_019917100.1 NW_017851087.1 12732.3 -2.13 0.000 uncharacterized LOC109546220
XM_019917106.1 NW_017851087.1 1634.5 0.33 0.003 nitric oxide-associated protein 1
XM_019917120.1 NW_017851087.1 7988.6 -0.40 0.004 actin-binding LIM protein 1
XM_019917129.1 NW_017851087.1 1717.6 -0.55 0.004 disintegrin and metalloproteinase domain-containing protein 10-like
XM_019917134.1 NW_017851087.1 51024.0 1.50 0.000 probable phosphoserine aminotransferase
XM_019917145.1 NW_017851087.1 610.5 0.36 0.001 uncharacterized LOC109546250
XM_019917146.1 NW_017851087.1 8782.7 0.67 0.008 succinyl-CoA:3-ketoacid coenzyme A transferase 1%2C mitochondrial
XM_019917150.1 NW_017851087.1 14880.2 1.30 0.000 putative inorganic phosphate cotransporter
XM_019917154.1 NW_017851087.1 137.7 0.80 0.001 hexosaminidase D-like
XM_019917157.1 NW_017851087.1 405.0 -1.08 0.002 chondroitin proteoglycan-2-like
XM_019917159.1 NW_017851087.1 245.1 -1.06 0.000 glutamate receptor-interacting protein 1%2C transcript variant X1
XM_019917173.1 NW_017851087.1 563.1 0.53 0.008 methionine synthase reductase-like
XM_019917202.1 NW_017851087.1 1375.7 0.55 0.003 U3 small nucleolar RNA-interacting protein 2
XR_002172754.1 NW_017846000.1 590.3 -0.70 0.000 uncharacterized LOC109546291%2C transcript variant X1
XR_002172757.1 NW_017851105.1 8406.7 0.85 0.003 aldose reductase-like
XM_019917221.1 NW_017851106.1 4208.5 -0.56 0.000 uncharacterized LOC109546301
XM_019917224.1 NW_017851114.1 721.7 1.88 0.000 uncharacterized LOC109546305
XM_019917227.1 NW_017851115.1 5910.9 0.48 0.000 transcription factor Dp-1%2C transcript variant X1
XM_019917232.1 NW_017851115.1 1384.5 0.92 0.000 GATA-binding factor A-like%2C transcript variant X1
XM_019917237.1 NW_017851121.1 190.3 1.37 0.003 uncharacterized LOC109546318

221
XM_019917240.1 NW_017851122.1 808.5 0.79 0.000 WD repeat-containing protein 46
XM_019917246.1 NW_017851125.1 578.6 0.35 0.001 crossover junction endonuclease MUS81
XM_019917247.1 NW_017851125.1 703.4 0.44 0.001 60S ribosome subunit biogenesis protein NIP7 homolog
XM_019917248.1 NW_017851125.1 651.9 0.48 0.000 SET and MYND domain-containing protein 5
XM_019917251.1 NW_017851125.1 2045.0 0.33 0.001 formin-binding protein 4-like
XM_019917252.1 NW_017851125.1 1109.9 -0.25 0.005 uncharacterized LOC109546337
XM_019917254.1 NW_017851125.1 3932.8 1.06 0.000 uncharacterized LOC109546339
XM_019917256.1 NW_017851125.1 3711.5 1.12 0.000 uncharacterized LOC109546340
XM_019917258.1 NW_017851131.1 5054.5 -0.23 0.001 cytosolic carboxypeptidase-like protein 5
XM_019917259.1 NW_017851131.1 751.3 -0.24 0.002 GA-binding protein subunit beta-2%2C transcript variant X1
XM_019917261.1 NW_017851131.1 983.6 0.45 0.000 8-oxo-dGDP phosphatase NUDT18%2C transcript variant X1
XM_019917284.1 NW_017851136.1 1.8 1.25 0.010 proton-coupled amino acid transporter 1-like
XM_019917285.1 NW_017851136.1 8598.5 -0.54 0.002 uncharacterized LOC109546363%2C transcript variant X1
XM_019917297.1 NW_017851136.1 1065.2 0.61 0.000 cleavage and polyadenylation specificity factor subunit 1%2C transcript variant X1
XM_019917301.1 NW_017851136.1 6267.6 -0.51 0.000 EH domain-binding protein 1%2C transcript variant X1
XM_019917321.1 NW_017851136.1 1370.2 0.43 0.002 OCIA domain-containing protein 1
XM_019917322.1 NW_017851136.1 969.7 -0.84 0.003 capon-like protein%2C transcript variant X1
XM_019917326.1 NW_017851136.1 12190.0 -1.51 0.000 vasoactive intestinal polypeptide receptor 2-like%2C transcript variant X1
XM_019917332.1 NW_017851136.1 120.1 1.49 0.001 pancreatic lipase-related protein 3-like
XM_019917333.1 NW_017851136.1 1295.1 1.03 0.006 laminin subunit gamma-1
XM_019917336.1 NW_017851136.1 958.7 1.17 0.000 sialin%2C transcript variant X1
XR_002172772.1 NW_017851137.1 92.5 0.55 0.005 uncharacterized LOC109546390
XM_019917344.1 NW_017851138.1 5365.4 1.01 0.000 uncharacterized LOC109546393
XM_019917345.1 NW_017851138.1 825.6 -0.38 0.006 uncharacterized LOC109546394%2C transcript variant X1
XM_019917351.1 NW_017851139.1 1004.7 0.41 0.004 1%2C2-dihydroxy-3-keto-5-methylthiopentene dioxygenase-like
XM_019917355.1 NW_017851142.1 1861.3 0.92 0.000 poly(A) RNA polymerase gld-2 homolog A
XM_019917381.1 NW_017851142.1 761.5 0.61 0.000 uncharacterized LOC109546422
XM_019917396.1 NW_017851149.1 7868.3 -0.44 0.009 sortilin-related receptor-like
XM_019917402.1 NW_017851152.1 28358.0 -1.02 0.000 choline/ethanolamine kinase
XM_019917415.1 NW_017851153.1 18.6 -1.41 0.000 iodotyrosine deiodinase 1-like
XM_019917424.1 NW_017851153.1 738.2 0.42 0.000 cyclin-dependent kinase 7
XM_019917426.1 NW_017851153.1 11126.0 1.34 0.000 uncharacterized LOC109546460
XM_019917447.1 NW_017851153.1 2285.9 0.27 0.005 prefoldin subunit 1
XM_019917449.1 NW_017851153.1 800.8 0.69 0.000 uncharacterized LOC109546472%2C transcript variant X1
XM_019917469.1 NW_017851157.1 6413.4 -0.38 0.001 translation initiation factor IF-2-like

222
XM_019917472.1 NW_017851157.1 40747.8 -0.55 0.001 uncharacterized LOC109546494
XR_002172784.1 NW_017851157.1 622.4 0.65 0.002 uncharacterized LOC109546498%2C transcript variant X1
XM_019917482.1 NW_017851159.1 5593.1 -0.78 0.000 uncharacterized LOC109546505
XM_019917484.1 NW_017851159.1 67.9 0.92 0.003 zinc finger and BTB domain-containing protein 8A.2
XM_019917490.1 NW_017851159.1 585.3 0.40 0.004 rhomboid-related protein 2
XM_019917499.1 NW_017851160.1 186.5 1.00 0.000 kinesin-like protein KLP2
XM_019917500.1 NW_017851160.1 96.3 0.82 0.001 uncharacterized LOC109546521
XM_019917515.1 NW_017851160.1 12859.9 -0.58 0.000 BAG domain-containing protein Samui%2C transcript variant X1
XM_019917517.1 NW_017851160.1 756.8 0.81 0.000 zinc finger and BTB domain-containing protein 24-like%2C transcript variant X1
XM_019917524.1 NW_017851160.1 3953.8 0.54 0.000 importin subunit alpha-1-like
XM_019917533.1 NW_017851160.1 588.7 -0.71 0.000 multiple inositol polyphosphate phosphatase 1
XM_019917534.1 NW_017851160.1 170.5 -0.57 0.006 uncharacterized LOC109546544
XM_019917535.1 NW_017851160.1 1336.1 -0.27 0.007 PEST proteolytic signal-containing nuclear protein-like%2C transcript variant X1
XM_019917541.1 NW_017851160.1 899.1 0.44 0.007 5-methylcytosine rRNA methyltransferase NSUN4
XM_019917542.1 NW_017851160.1 1488.9 0.94 0.000 uncharacterized LOC109546550
XM_019917544.1 NW_017851160.1 20.2 1.20 0.009 uncharacterized LOC109546552
XM_019917547.1 NW_017851162.1 2110.1 0.29 0.002 protein ABHD4-like
XM_019917555.1 NW_017851162.1 1346.5 0.64 0.000 U3 small nucleolar RNA-associated protein 4 homolog%2C transcript variant X1
XM_019917577.1 NW_017851165.1 1501.3 0.42 0.000 peptidyl-prolyl cis-trans isomerase-like 2
XM_019917579.1 NW_017851165.1 5455.6 0.50 0.000 ubiquitin-conjugating enzyme E2-24 kDa%2C transcript variant X1
XM_019917584.1 NW_017851165.1 1398.2 1.74 0.000 regucalcin-like%2C transcript variant X1
XM_019917604.1 NW_017851169.1 811.5 0.85 0.000 multidrug resistance-associated protein 4-like
XM_019917605.1 NW_017851169.1 529.3 0.73 0.000 multidrug resistance-associated protein 4-like
XM_019917607.1 NW_017851169.1 150.7 0.74 0.007 multidrug resistance-associated protein 4-like
XM_019917608.1 NW_017851169.1 191.5 0.92 0.000 probable multidrug resistance-associated protein lethal(2)03659
XM_019917619.1 NW_017851170.1 2099.1 0.29 0.000 inositol polyphosphate 5-phosphatase OCRL-1%2C transcript variant X1
XM_019917641.1 NW_017851170.1 453.6 -0.52 0.007 GTP-binding protein Di-Ras2
XM_019917661.1 NW_017846163.1 812.2 -1.60 0.000 gonadotropin-releasing hormone receptor-like
XM_019917696.1 NW_017851171.1 119.5 1.01 0.006 facilitated trehalose transporter Tret1-like
XM_019917697.1 NW_017851171.1 120.3 1.13 0.000 protein spaetzle-like
XM_019917699.1 NW_017851171.1 2264.0 0.25 0.004 MOB kinase activator-like 4
XM_019917705.1 NW_017851173.1 2225.7 -0.51 0.009 actin cytoskeleton-regulatory complex protein PAN1-like%2C transcript variant X1
XM_019917728.1 NW_017851174.1 13.9 1.00 0.002 cuticle protein 7-like

223
XM_019917737.1 NW_017851174.1 1056.7 -0.62 0.003 sodium/potassium/calcium exchanger 3%2C transcript variant X1
XM_019917741.1 NW_017851174.1 1894.4 0.53 0.000 cytochrome P450 302a1%2C mitochondrial-like
XM_019917742.1 NW_017851174.1 29021.2 1.07 0.000 fumarate hydratase%2C mitochondrial-like
XM_019917745.1 NW_017851174.1 8483.9 0.83 0.003 arginase-1
XM_019917746.1 NW_017851174.1 2006.2 -0.64 0.000 RB-associated KRAB zinc finger protein-like%2C transcript variant X1
XM_019917752.1 NW_017851174.1 141.8 0.77 0.005 protein CROWDED NUCLEI 1-like
XM_019917764.1 NW_017846193.1 965.5 0.36 0.001 N-alpha-acetyltransferase 15%2C NatA auxiliary subunit-like
XM_019917777.1 NW_017846193.1 929.8 0.34 0.002 DNA-directed RNA polymerase III subunit RPC3-like
XM_019917784.1 NW_017851174.1 2313.2 0.29 0.001 ubiquitin-protein ligase E3C
XM_019917791.1 NW_017851174.1 5317.4 -0.34 0.003 1-acyl-sn-glycerol-3-phosphate acyltransferase gamma-like
XM_019917820.1 NW_017851174.1 477.9 1.56 0.000 pseudouridine-5'-phosphatase-like%2C transcript variant X1
XM_019917840.1 NW_017851174.1 4118.9 -0.69 0.001 UMP-CMP kinase 2%2C mitochondrial-like
XM_019917841.1 NW_017851174.1 2459.0 -1.05 0.000 voltage-dependent L-type calcium channel subunit beta-2%2C transcript variant X1
XM_019917861.1 NW_017846219.1 3712.4 0.32 0.003 T-complex protein 1 subunit eta-like
XM_019917858.1 NW_017851174.1 1783.4 0.56 0.000 FACT complex subunit Ssrp1
XM_019917890.1 NW_017851181.1 315.5 0.62 0.000 zinc finger CCHC-type and RNA-binding motif-containing protein 1-like
XM_019917892.1 NW_017851181.1 373745.5 -1.30 0.000 apolipophorins%2C transcript variant X1
XM_019917912.1 NW_017851181.1 16254.4 0.70 0.000 malate dehydrogenase%2C mitochondrial
XR_002172815.1 NW_017844965.1 571.5 -0.69 0.006 uncharacterized LOC109546798
XM_019917917.1 NW_017851181.1 5853.4 -0.31 0.010 protein zyg-11 homolog
XM_019917921.1 NW_017851181.1 2668.1 0.35 0.006 histone chaperone asf1
XM_019917926.1 NW_017851181.1 8181.3 -1.15 0.000 solute carrier family 26 member 10-like%2C transcript variant X1
XM_019917934.1 NW_017851181.1 1909.8 -0.69 0.000 carbohydrate sulfotransferase 11%2C transcript variant X1
XM_019917936.1 NW_017851181.1 9395.6 2.39 0.000 inositol oxygenase
XM_019917956.1 NW_017851181.1 394.7 0.78 0.000 low-density lipoprotein receptor-related protein 1-like
XM_019917959.1 NW_017851181.1 3617.7 -0.50 0.001 jmjC domain-containing histone demethylation protein 1%2C transcript variant X1
XM_019917971.1 NW_017851181.1 184.8 0.99 0.009 uncharacterized LOC109546834
XM_019917991.1 NW_017846261.1 33.7 0.80 0.000 dnaJ homolog subfamily C member 24-like
XM_019917990.1 NW_017851181.1 19125.3 -1.32 0.001 apolipoprotein D-like
XM_019917996.1 NW_017851181.1 1148.2 0.69 0.000 tubulin gamma-1 chain-like
XM_019918001.1 NW_017851181.1 252.1 1.23 0.002 cytochrome P450 4C1-like%2C transcript variant X1
XM_019918004.1 NW_017851181.1 187.7 1.99 0.000 putative fatty acyl-CoA reductase CG5065%2C transcript variant X1
XM_019918018.1 NW_017851185.1 343.6 0.63 0.000 uncharacterized LOC109546865

224
XM_019918019.1 NW_017851185.1 738.7 0.65 0.008 aurora kinase B
XM_019918020.1 NW_017851185.1 2635.7 0.46 0.000 proline-rich protein PRCC%2C transcript variant X1
XM_019918045.1 NW_017851187.1 4595.3 0.60 0.000 chromosome-associated kinesin KIF4%2C transcript variant X1
XM_019918051.1 NW_017851187.1 19228.3 -0.57 0.000 receptor expression-enhancing protein 5-like%2C transcript variant X1
XM_019918053.1 NW_017851187.1 840.1 0.63 0.000 probable 28S ribosomal protein S16%2C mitochondrial
XM_019918059.1 NW_017851187.1 123.4 1.30 0.000 tetratricopeptide repeat protein 30A
XM_019918060.1 NW_017851187.1 1900.1 0.37 0.000 neutral and basic amino acid transport protein rBAT%2C transcript variant X1
XM_019918068.1 NW_017851187.1 1532.9 0.78 0.001 cyclin-dependent kinases regulatory subunit-like
XM_019918071.1 NW_017851187.1 2689.9 -0.45 0.000 activin receptor type-1%2C transcript variant X1
XM_019918082.1 NW_017851187.1 536.6 -0.37 0.007 zinc finger Y-chromosomal protein 2-like%2C transcript variant X1
XM_019918083.1 NW_017851187.1 7552.5 -0.45 0.000 protein bicaudal D
XM_019918085.1 NW_017851187.1 732.7 0.69 0.005 uncharacterized LOC109546913%2C transcript variant X1
XM_019918090.1 NW_017851187.1 1661.8 -1.56 0.000 uncharacterized LOC109546919
XR_002172826.1 NW_017851187.1 78.5 -1.24 0.009 uncharacterized LOC109546921
XM_019918104.1 NW_017851190.1 157.5 -0.88 0.007 piggyBac transposable element-derived protein 3-like
XM_019918105.1 NW_017851192.1 3502.7 -0.31 0.009 ADP-ribosylation factor GTPase-activating protein 2%2C transcript variant X1
XM_019918113.1 NW_017851192.1 8444.0 -0.96 0.000 ATP-binding cassette sub-family G member 4-like
XM_019918124.1 NW_017851196.1 5003.7 -0.58 0.000 beta-TrCP%2C transcript variant X1
XR_002172831.1 NW_017851201.1 7.3 1.33 0.005 uncharacterized LOC109546961
XM_019918150.1 NW_017851201.1 682.8 0.41 0.001 ubiquitin carboxyl-terminal hydrolase calypso%2C transcript variant X1
XM_019918174.1 NW_017851204.1 761.8 0.58 0.000 cytochrome c oxidase assembly factor 5
XM_019918175.1 NW_017851204.1 27553.5 0.45 0.002 calmodulin
XM_019918196.1 NW_017846291.1 9744.7 -0.58 0.002 baculoviral IAP repeat-containing protein 2-like
XM_019918194.1 NW_017851209.1 636.6 -0.98 0.001 histamine H2 receptor-like
XM_019918212.1 NW_017851209.1 2477.1 -1.34 0.000 peptidoglycan-recognition protein LE-like%2C transcript variant X1
XM_019918218.1 NW_017851209.1 2879.4 -0.28 0.009 TATA element modulatory factor%2C transcript variant X1
XM_019918236.1 NW_017851216.1 692.0 -1.17 0.005 cytochrome b5-like
XM_019918243.1 NW_017851217.1 1094.6 1.04 0.000 uncharacterized LOC109547027
XM_019918244.1 NW_017851217.1 1011.6 0.91 0.000 protein ovarian tumor locus-like
XM_019918255.1 NW_017851223.1 4553.7 -0.34 0.006 AMMECR1-like protein%2C transcript variant X1
XM_019918258.1 NW_017851223.1 547.3 0.39 0.000 non-structural maintenance of chromosomes element 1 homolog
XM_019918260.1 NW_017851223.1 2482.5 0.37 0.002 mitochondrial pyruvate carrier 2-like
XM_019918261.1 NW_017851223.1 733.6 0.77 0.003 toll-like receptor Tollo
XM_019918262.1 NW_017851223.1 600.7 0.49 0.000 lysine-specific histone demethylase 1A%2C transcript variant X1

225
Appendix 3.2 Table containing all KEGG pathways with 2 or more enzymes associated with differentially expressed flight genes
identified using a differential expression analysis.
Pathway Pathway
ID
number of
representative
enzymes
Enzyme sequence accession numbers
Biosynthesis of antibiotics map01130 37
XM_019899042.1, XM_019915292.1,
XM_019915346.1, XM_019898758.1,
XM_019901306.1, XM_019913589.1,
XM_019901341.1
Purine metabolism map00230 14 XM_019917912.1, XM_019915591.1,
XM_019905419.1
Pyruvate metabolism map00620 8
XM_019899143.1, XM_019905168.1,
XM_019902592.1, XM_019899997.1,
XM_019909244.1, XM_019909039.1,
XM_019916272.1, XM_019906204.1,
XM_019915687.1, XM_019899247.1,
XM_019899143.1
Glycine, serine and threonine metabolism map00260 8 XM_019899878.1
Glutathione metabolism map00480 7
XM_019917912.1, XM_019899042.1,
XM_019915292.1, XM_019915346.1,
XM_019898758.1, XM_019901306.1,
XM_019903625.1, XM_019910050.1,
XM_019917742.1, XM_019910050.1
Amino sugar and nucleotide sugar
metabolism map00520 6 XM_019906902.1
Cysteine and methionine metabolism map00270 6 XM_019905419.1
Glycerolipid metabolism
map00561
6
XM_019912417.1, XM_019899639.1,
XM_019901314.1, XM_019904139.1

226
Methane metabolism map00680 6
XM_019915946.1, XM_019904632.1,
XM_019917028.1, XM_019917912.1,
XM_019899042.1, XM_019915292.1,
XM_019915346.1, XM_019898758.1,
XM_019899073.1, XM_019910396.1,
XM_019901306.1, XM_019913911.1,
XM_019899073.1, XM_019915591.1,
XM_019900363.1, XM_019903625.1,
XM_019913435.1, XM_019916990.1,
XM_019907193.1, XM_019909244.1,
XM_019917134.1, XM_019913385.1,
XM_019910318.1, XM_019907029.1,
XM_019915826.1, XM_019905419.1,
XM_019911961.1, XM_019913589.1,
XM_019899668.1, XM_019917742.1,
XM_019902406.1, XM_019916962.1,
XM_019913385.1, XM_019899247.1,
XM_019915962.1, XM_019911961.1,
XM_019904647.1, XM_019917742.1,
XM_019901341.1
Terpenoid backbone biosynthesis map00900 6 XM_019905992.1
Glycolysis / Gluconeogenesis map00010 5 XM_019917146.1
Drug metabolism - other enzymes map00983 5 XM_019904099.1, XM_019901421.1
Alanine, aspartate and glutamate
metabolism map00250 5 XM_019917028.1
Porphyrin and chlorophyll metabolism map00860 5 XM_019916315.1, XM_019916364.1
Carbon fixation pathways in prokaryotes map00720 5 XM_019906856.1, XM_019897898.1,
XM_019911852.1, XM_019911849.1
Valine, leucine and isoleucine degradation map00280 4 XM_019917028.1, XM_019910290.1,
XM_019913946.1, XM_019917146.1

227
Galactose metabolism map00052 4 XM_019912417.1, XM_019899639.1,
XM_019901314.1, XM_019904139.1
Sphingolipid metabolism map00600 4 XM_019906856.1, XM_019911961.1,
XM_019905459.1, XM_019911961.1
Aminoacyl-tRNA biosynthesis map00970 4
XM_019914463.1, XM_019897898.1,
XM_019911852.1, XM_019911849.1,
XM_019911961.1, XM_019905459.1,
XM_019911961.1, XM_019904647.1
Folate biosynthesis map00790 4 XM_019916315.1, XM_019916364.1,
XM_019910424.1
Pyrimidine metabolism map00240 4 XM_019897951.1, XM_019904007.1,
XM_019913894.1
Nicotinate and nicotinamide metabolism map00760 4
XM_019905168.1, XM_019902592.1,
XM_019899997.1, XM_019906207.1,
XM_019905720.1, XM_019899788.1,
XM_019899789.1
One carbon pool by folate map00670 4 XM_019906883.1
Pentose and glucuronate interconversions map00040 4 XM_019914336.1, XM_019901577.1,
XM_019906362.1, XM_019906856.1
Carbon fixation in photosynthetic
organisms map00710 4 XM_019910318.1
Pentose phosphate pathway map00030 4
XM_019901419.1, XM_019910125.1,
XM_019899542.1, XM_019915408.1,
XM_019915181.1, XM_019915626.1
Citrate cycle (TCA cycle) map00020 4 XM_019912864.1, XM_019907741.1
Propanoate metabolism map00640 4 XM_019903766.1, XM_019908753.1,
XM_019911686.1, XM_019904030.1
Glyoxylate and dicarboxylate metabolism map00630 3
XM_019917028.1, XM_019917912.1,
XM_019915292.1, XM_019915346.1,
XM_019898758.1, XM_019900363.1,
XM_019917134.1, XM_019917351.1
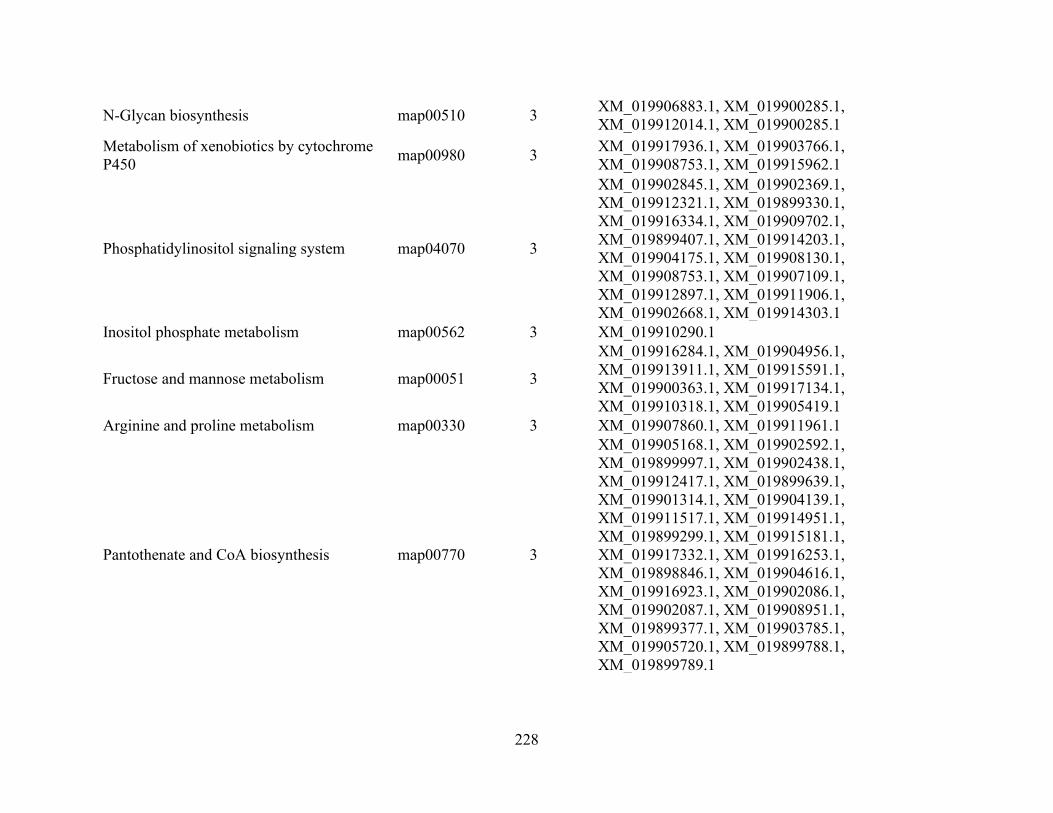
228
N-Glycan biosynthesis map00510 3 XM_019906883.1, XM_019900285.1,
XM_019912014.1, XM_019900285.1
Metabolism of xenobiotics by cytochrome
P450 map00980 3
XM_019917936.1, XM_019903766.1,
XM_019908753.1, XM_019915962.1
Phosphatidylinositol signaling system map04070 3
XM_019902845.1, XM_019902369.1,
XM_019912321.1, XM_019899330.1,
XM_019916334.1, XM_019909702.1,
XM_019899407.1, XM_019914203.1,
XM_019904175.1, XM_019908130.1,
XM_019908753.1, XM_019907109.1,
XM_019912897.1, XM_019911906.1,
XM_019902668.1, XM_019914303.1
Inositol phosphate metabolism map00562 3 XM_019910290.1
Fructose and mannose metabolism map00051 3
XM_019916284.1, XM_019904956.1,
XM_019913911.1, XM_019915591.1,
XM_019900363.1, XM_019917134.1,
XM_019910318.1, XM_019905419.1
Arginine and proline metabolism map00330 3 XM_019907860.1, XM_019911961.1
Pantothenate and CoA biosynthesis map00770 3
XM_019905168.1, XM_019902592.1,
XM_019899997.1, XM_019902438.1,
XM_019912417.1, XM_019899639.1,
XM_019901314.1, XM_019904139.1,
XM_019911517.1, XM_019914951.1,
XM_019899299.1, XM_019915181.1,
XM_019917332.1, XM_019916253.1,
XM_019898846.1, XM_019904616.1,
XM_019916923.1, XM_019902086.1,
XM_019902087.1, XM_019908951.1,
XM_019899377.1, XM_019903785.1,
XM_019905720.1, XM_019899788.1,
XM_019899789.1
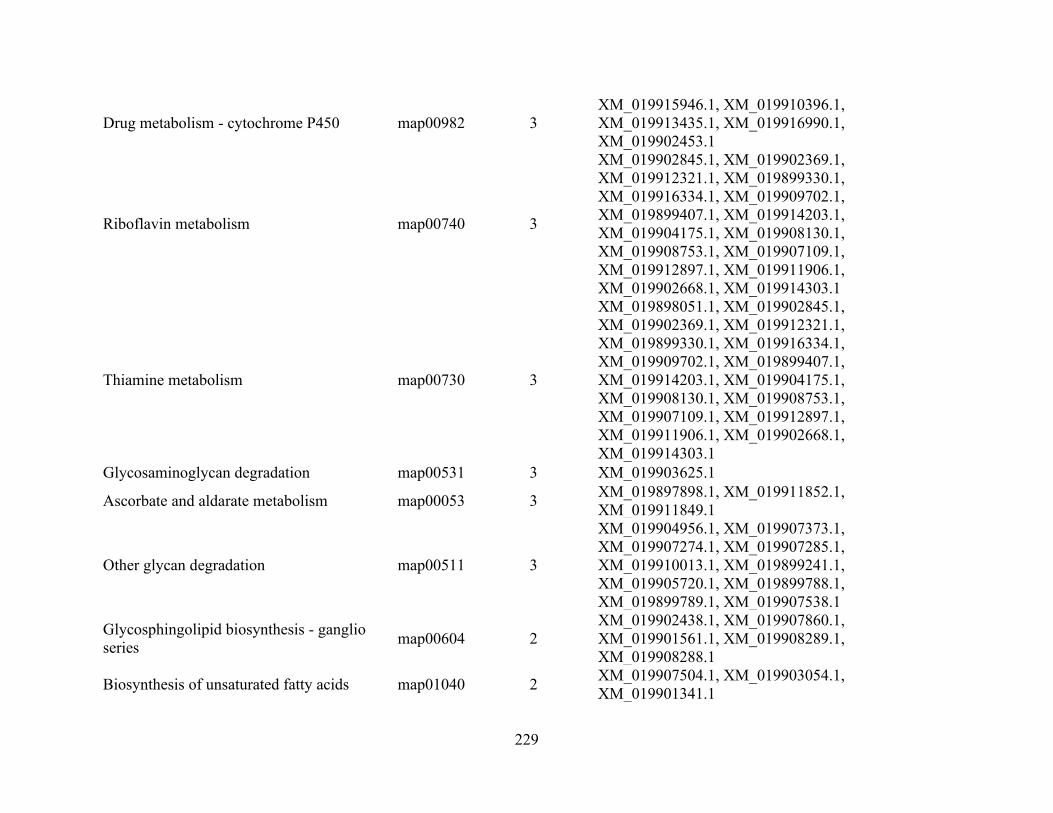
229
Drug metabolism - cytochrome P450 map00982 3
XM_019915946.1, XM_019910396.1,
XM_019913435.1, XM_019916990.1,
XM_019902453.1
Riboflavin metabolism map00740 3
XM_019902845.1, XM_019902369.1,
XM_019912321.1, XM_019899330.1,
XM_019916334.1, XM_019909702.1,
XM_019899407.1, XM_019914203.1,
XM_019904175.1, XM_019908130.1,
XM_019908753.1, XM_019907109.1,
XM_019912897.1, XM_019911906.1,
XM_019902668.1, XM_019914303.1
Thiamine metabolism map00730 3
XM_019898051.1, XM_019902845.1,
XM_019902369.1, XM_019912321.1,
XM_019899330.1, XM_019916334.1,
XM_019909702.1, XM_019899407.1,
XM_019914203.1, XM_019904175.1,
XM_019908130.1, XM_019908753.1,
XM_019907109.1, XM_019912897.1,
XM_019911906.1, XM_019902668.1,
XM_019914303.1
Glycosaminoglycan degradation map00531 3 XM_019903625.1
Ascorbate and aldarate metabolism map00053 3 XM_019897898.1, XM_019911852.1,
XM_019911849.1
Other glycan degradation map00511 3
XM_019904956.1, XM_019907373.1,
XM_019907274.1, XM_019907285.1,
XM_019910013.1, XM_019899241.1,
XM_019905720.1, XM_019899788.1,
XM_019899789.1, XM_019907538.1
Glycosphingolipid biosynthesis - ganglio
series map00604 2
XM_019902438.1, XM_019907860.1,
XM_019901561.1, XM_019908289.1,
XM_019908288.1
Biosynthesis of unsaturated fatty acids map01040 2 XM_019907504.1, XM_019903054.1,
XM_019901341.1
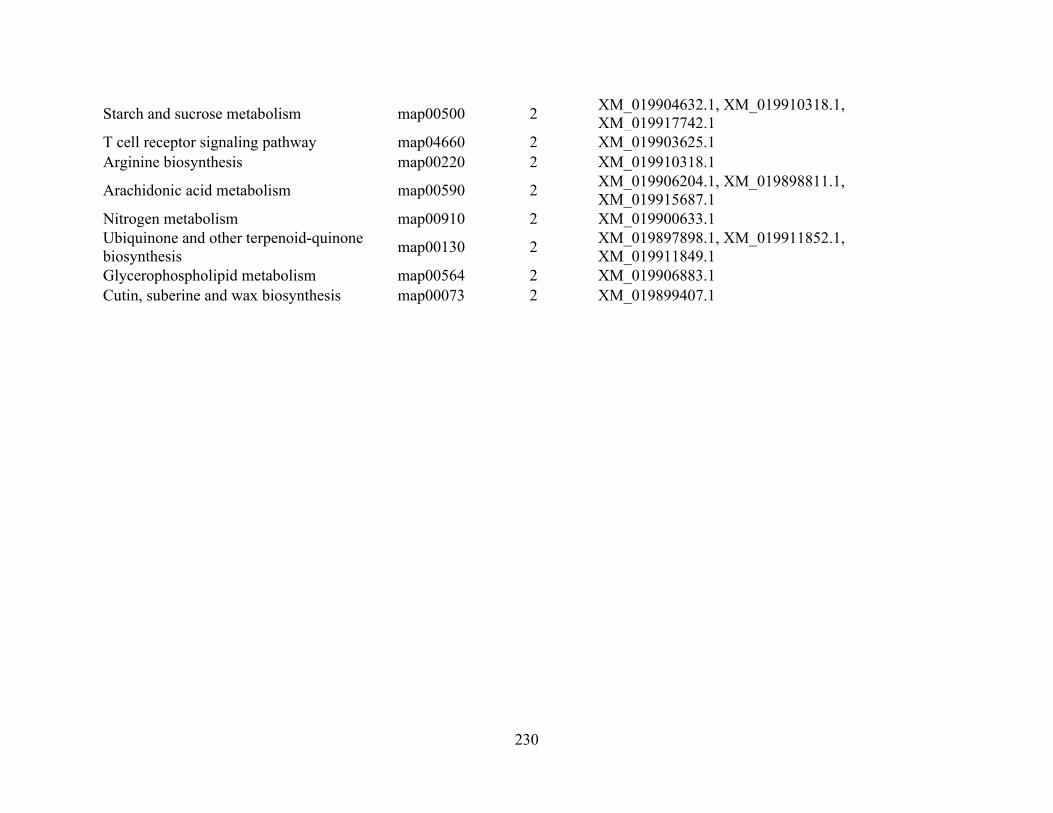
230
Starch and sucrose metabolism map00500 2 XM_019904632.1, XM_019910318.1,
XM_019917742.1
T cell receptor signaling pathway map04660 2 XM_019903625.1
Arginine biosynthesis map00220 2 XM_019910318.1
Arachidonic acid metabolism map00590 2 XM_019906204.1, XM_019898811.1,
XM_019915687.1
Nitrogen metabolism map00910 2 XM_019900633.1
Ubiquinone and other terpenoid-quinone
biosynthesis map00130 2
XM_019897898.1, XM_019911852.1,
XM_019911849.1
Glycerophospholipid metabolism map00564 2 XM_019906883.1
Cutin, suberine and wax biosynthesis map00073 2 XM_019899407.1

231
Appendix 4.1 Populations, regions, site locations, and beetle numbers. Sample sizes are given
for the full data set after filtering (n), the number of specimens in the south (Cs), intermediate
(Ci) and north (Cn) genetic clusters at each sample location, and the number in the 125-specimen
subsampled dataset (ns). Individual cluster assignments were determined based on principal
component 1 (PC1) values for the full data set (n=294) as follows: PC1 < -5.5 = south cluster;
PC1 >-0.6 = north; and PC1 of -5.5 to -0.6 = intermediate.
Population Region Site Latitude Longitude Collection
year n Os Oi On nS
Edson North 1 53.702 -116.847 2014 3 0 0 3 2
Edson North 2 53.770 -116.961 2014 2 0 0 2 1
Edson North 3 53.777 -116.686 2014 4 0 0 4 1
Edson North 4 53.833 -116.992 2014 3 0 0 3 1
Edson North 5 53.398 -115.850 2016 17 0 1 16 5
Edson North 6 53.831 -116.569 2016 20 0 0 20 5
Battle
Lake Intermediate 1 52.941 -114.284 2018 11
0 11 0 10
Canmore South 1 51.067 -115.287 2014 10 10 0 0 10
Grande
Prairie North 1 54.570 -119.420 2015 8
0 0 8 0
Grande
Prairie North 2 54.190 -118.680 2015 6
0 0 6 5
Grande
Prairie North 3 54.656 -119.007 2016 20
0 0 20 5
Grande
Prairie North 4 54.606 -118.224 2016 19
0 0 19 5
Hinton Intermediate 1 53.380 -117.543 2017 22 0 22 0 8
Hinton Intermediate 2 53.344 -117.583 2016 30 0 19 11 8
Jasper Intermediate 1 53.463 -118.237 2015 2 0 2 0 2
Jasper Intermediate 2 53.160 -117.530 2015 3 0 3 0 3
Jasper Intermediate 3 53.208 -117.348 2015 3 0 3 0 1
Jasper Intermediate 4 53.400 -117.247 2015 1 0 1 0 3
Jasper Intermediate 5 53.503 -117.734 2015 3 0 2 1 3
Lac La
Biche North 1 55.622 -112.881 2018 6
0 0 6 2
Lac La
Biche North 2 55.389 -112.976 2018 3
0 0 3 3
Lac La
Biche North 3 55.382 -112.990 2018 4
0 0 4 2

232
Lac La
Biche North 4 55.397 -112.972 2018 4
0 0 4 0
Lac La
Biche North 5 55.395 -112.972 2018 3
0 0 3 1
Lac La
Biche North 6 55.390 -112.989 2018 1
0 0 1 1
Lac La
Biche North 7 55.431 -112.072 2018 1
0 0 1 1
Lac La
Biche North 8 55.413 -112.005 2018 5
0 0 5 5
Slave Lake North 1 54.863 -115.163 2017 13 0 0 13 0
Slave Lake North 2 55.139 -115.343 2018 5 0 0 5 4
Slave Lake North 3 54.933 -115.452 2018 4 0 1 3 4
Slave Lake North 4 54.744 -115.798 2018 7 0 0 7 0
Slave Lake North 5 55.613 -114.326 2016 19 0 2 17 8
Whitecourt North 1 54.393 -116.286 2018 5 0 2 3 2
Whitecourt North 2 54.354 -115.782 2018 5 0 0 5 4
Whitecourt North 3 54.493 -115.538 2018 5 0 3 2 2
Whitecourt North 4 54.376 -115.691 2016 17 0 0 17 8

233
Appendix 4.2 Discriminant analysis of principal components (DAPC) of 201 individuals from
five northern populations, excluding intermediate-cluster individuals as in Figure 4.1B.