Maha Alsaif - ERA
152
The Impact of Dietary Protein on Appetite-Regulating Hormones and Energy Metabolism in Children with Prader-Willi Syndrome by Maha Alsaif A thesis submitted in partial fulfillment of the requirements for the degree of Doctor of Philosophy in Nutrition and Metabolism Department of Agricultural, Food and Nutritional Science University of Alberta © Maha Alsaif, 2020
-
Upload
khangminh22 -
Category
Documents
-
view
0 -
download
0
Transcript of Maha Alsaif - ERA
The Impact of Dietary Protein on Appetite-Regulating Hormones and Energy Metabolism in
Children with Prader-Willi Syndrome
by
Maha Alsaif
A thesis submitted in partial fulfillment of the requirements for the degree of
Doctor of Philosophy
in
Nutrition and Metabolism
Department of Agricultural, Food and Nutritional Science
University of Alberta
© Maha Alsaif, 2020
ii
Abstract
Prader-Willi syndrome (PWS) is a unique model of childhood obesity characterized
by disordered satiety. The excessive weight gain caused by an imbalance between energy
intake and expenditure associated with PWS is of concern to healthcare professionals and
caregivers who acknowledge that weight management is an essential but challenging aspect
of care for these children. To improve the effectiveness of treatments to curb the development
of obesity in PWS, a more comprehensive understanding of the underlying mechanisms
associated with altered energy balance in these children is needed. Therefore, the overall
objective of this research was (1) to determine the impact of food intake (FI), higher protein
(HP) meals and standard meals (SM) on postprandial regulation of ghrelin and asprosin; (2)
other satiety factor concentrations; and (3) energy balance in children with PWS.
In study 1, two test meals were compared to a SM meal in 10 children with PWS and
7 body mass index (BMI) z-score matched children in a randomized, crossover study design.
The first test meal had a higher protein–lower carbohydrate (HP-LC) content and the second
test meal had a higher protein–lower fat (HP-LF) content. Under fasting conditions, the PWS
group had higher concentrations of both acyl ghrelin (AG) (p = 0.02) and desacyl ghrelin
(DAG) than controls, but a comparable ratio of AG:DAG. AG and DAG were reduced in
both groups following all meals, but concentrations of AG and DAG remained higher in PWS
across all postprandial time points (p = 0.002 and p < 0.001, respectively). Glucagon-like
peptide 1 (GLP-1) concentrations were higher after the HP-LC meal than the SM at 2 and 4
hours (p = 0.027 and p = 0.044, respectively) and at hour 4 (p = 0.02) following the HP-LF in
the PWS group only; peptide tyrosine tyrosine (PYY) responses were comparable.
In study 2, fasting and 1 hour post-meal serum concentrations of asprosin were
measured in 52 children, 23 with PWS, 8 with obesity, and 21 healthy weights. The decrease
in serum asprosin relative to baseline was not different between children with PWS and BMI-
iii
z score matched children. In children with PWS, fasting asprosin was positively correlated
with AG and 1-hour postprandial asprosin was negatively correlated with insulin.
Additionally, fasting asprosin was negatively correlated with age and insulin in children with
obesity and with age in healthy weight children. After adjusting for age, sex and BMI z-score,
asprosin showed a positive correlation with glucose in children with obesity but not in
children with PWS or healthy weight children. In study 3, in a randomized, crossover study
design, 5 youth with PWS were randomly allocated to two isocaloric arms: a) standard diet
(SD); b) high-protein (HP) diet. Participants received the prescribed diets (three meals plus
two snacks per day accompanied by either a powder supplement (HP) or an extra snack (SD)
for one day prior to each study visit and a breakfast meal inside a whole-body calorimetry
unit (WBCU). Resting energy expenditure (REE), postprandial energy expenditure (PEE) and
respiratory exchange ratio (RER) were assessed. PEE calculated as “fixed REE” was higher
after the HP meal compared to SM. A lower RER was observed after the HP diet in
comparison to the SD (0.80 ± 0.2 vs 0.86 ± 0.2; p < 0.009). However, no significant
difference in subjective appetite assessment between the HP meal and the SM was found.
The major findings of this research were that higher concentrations of total ghrelin in
children with PWS were due to higher concentrations in both AG and DAG, with no change
in the AG:DAG ratio. Meal consumption also suppressed both forms of ghrelin to a greater
extent in children with PWS. Higher protein meals stimulated greater increases in GLP-1 and
PYY in PWS children compared to controls. RER after the HP diet was significantly lower
compared to SD. In addition, this research highlights the heterogeneity in PEE in youth with
PWS in response to HP diet and will contribute to the conceptualization of further research
exploring PEE; considering, sex, puberty statues and body composition factors that influence
response to energy metabolism in children with and without PWS.
iv
Preface
This preface is an overview of the work completed in partial fulfillment of the
requirements of a Ph.D.; it is complemented by more detailed and extensive prefaces at the
beginning of each chapter. Some of the research conducted for this thesis uses data that was
previously collected by other researchers.
Data from the dietary macronutrient regulation of acyl and desacyl ghrelin
concentrations in children with Prader-Willi Syndrome at the Pediatric Endocrinology clinic,
Stollery Children's Hospital, Pediatric Centre for Weight and Health, and Edmonton General
Continuing Care Centre (Edmonton, Alberta, Canada) was used in several chapters (‘Study 1’
in Chapter 3; ‘Study 2’ in Chapter 4). Research from that study was approved by the
University of Alberta's Health Research Ethics Board: ‘Dietary macronutrient regulation of
active ghrelin levels in children with Prader-Willi Syndrome (PWS)’ (ID: RES0003532 ).
Drs. Andrea Haqq and Michelle MacKenzie [Research Associate, Haqq’s lab] wrote
the grant that was funded by the Women Children Health Research Institute (WCHRI).
Recruitment and data collection for Chapter 3 was completed by Dr. Michelle MacKenzie
and other members of the research team before I joined. I was responsible for data entry of
assayed blood samples from this research and also wrote the first draft of the manuscript.
Plasma samples for acyl ghrelin and desacyl ghrelin were assayed using a specific two-site
assay in the lab of Dr. Gaylinn at the Department of Medicine, University of Virginia Health
System (Charlottesville, Virginia, United States).
Data from ‘Study 2’ in Chapter 4 was collected as part of several investigations led
by Dr. Andrea Haqq and approved by the University of Alberta's Health Research Ethics
Board: ‘Autonomic nervous system activity and metabolic profiling in children with Prader-
Willi Syndrome compared to controls’ (ID: Pro00009903): ‘Relationship between brain-
derived neurotrophic factor (BDNF) concentration, BDNF haplotypes and neurocognitive
performance in children with Prader-Willi Syndrome (PWS)’ (ID: Pro00011653).
Participants were recruited from the Pediatric Endocrinology clinic, Stollery Children's
Hospital (Edmonton, Alberta, Canada), National Institutes of Health, Bethesda, (Bethesda,
Maryland, United State) and the Pediatric Centre for Weight and Health, Edmonton General
Continuing Care Centre, Child Health Clinic, Misericordia Hospital (Edmonton, Alberta,
Canada). Data was collected by other individuals as part of an investigation I designed in
consultation with my supervisor Dr. Andrea Haqq.
v
I conducted the research that generated data on resting energy expenditure,
postprandial energy expenditure, subjective appetite assessment, body composition and
anthropometrics used in Chapter 5. Research from this study was approved by the University
of Alberta's Health Research Ethics Board: ‘Assessing the impact of dietary protein on
energy metabolism and appetite in children with Prader-Willi Syndrome: a pilot project’ (ID:
Pro00066276).
I wrote the first draft of the grant that was funded by WCHRI with ongoing discussion
with Drs Michelle Mackenzie, Sarah Elliott, Carla Prado and Andrea Haqq (PI). Research
from this study was used in Chapters 3 and 4 (‘Study 2 and Study 3’) combined with
research collected by other individuals.
All work presented in this thesis was critically assessed for intellectual content by my
supervisors, Drs. Andrea Haqq and Carla Prado, supervisory committee member, Dr.
Catherine Field, and external committee members, Dr. Sarah Cawsey and Dr.
Nick Bellissimo. Versions of some chapters have led to submitted or published journal
articles:
Alsaif, M., Elliot, S. A., MacKenzie, M. L., Prado, C. M., Field, C. J., & Haqq, A. M. (2017).
Energy Metabolism Profile in Individuals with Prader-Willi Syndrome and
Implications for Clinical Management: A Systematic Review. Adv Nutr, 8(6), 905-
915. doi:10.3945/an.117.016253. Published Nov 7, 2017 Located in Chapter 2.
Alsaif, M., Pakseresht, M., Mackenzie, M. L., Gaylinn, B.,Thorner, M.O., Michael
Freemark, M., Field, C. J., Prado, C. M & Haqq A. H. (2019). Dietary
macronutrient regulation of acyl and desacyl ghrelin concentrations in children
with Prader-Willi syndrome. Submitted to Clinical Endocrinology. Located in
chapter 3.
vi
Acknowledgements
Undertaking this Ph.D has been a true life-changing pursuit for me and it would not
have been possible to do without the support and guidance that I received from many people.
Firstly, I would like to express my sincere gratitude to my supervisors, Drs. Andrea
Haqq and Carla Prado for their continuous support through every step of this Ph.D and
related research. From their constructive feedback, patience, motivation, and immense
knowledge at every step of the way, I am grateful for your guidance and to have had the
opportunity to complete this Ph.D under your supervision. I cannot imagine having better
supervisors and mentors.
Besides my supervisors, I am also grateful to Dr. Catherine Field for her insightful
comments and encouragement, but also for asking the hard questions that encouraged me to
widen my research from various perspectives.
Thank you to Dr. Nick Bellissimo and Dr. Sarah Cawsey for taking the time to serve
on my defense committee. Also to Drs. Justine Turner and Donna Vine for serving on my
candidacy exam committee and for helping me throughout the process. Thank you Dr. Rene
Jacobs for serving as my candidacy exam chair and Dr. Noreen Willows for serving as my
defense chair.
I cannot thank Dr. Michelle MacKenzie enough for her invaluable advice. Her vision,
encouragement, availability, and support have been invaluable to my academic journey and in
developing my professional skill. I am grateful for her mentorship.
Thank you to Dr. Mohammadreza Pakseresht for your statistical advice and for
answering my questions.
Susan Goruk and Kunimasa Suzuki, I really appreciate your laboratory assistance. It
was an absolute pleasure to work with and to learn from you both. I would also thank all of
the support staff, especially Tracy Anstey for helping facilitate our research.
I would also like to thank all of the individuals within Dr. Haqq’s group: Khushmol
Dhaliwal, Shima Afhami, Camila Estefani Orsso and Qiming Tan and within Dr. Prado’s
group: Dr. Jingjie Xiao, Dr. Joao Felipe Mota, Dr. Sarah Purcell, Dr. Sarah Elliott, Dr Leticia
Cristina Radin Pereira, Camila Lemos Pinto Oliveira, Katherine Ford, Carlene Johnson
Stoklossa, Claire Trottier, Amanda Purkiss, Reena Duke, Sherin Fernandes, and all of the
visiting students I had the pleasure of working with during my Ph.D. Khushmol Dhaliwal and
Shima Afhami deserve a special thank you for stimulating discussions, working together
through the sleepless nights before deadlines, and for all the fun we had in between.

vii
Dhruvesh Patel, thank you so much for always being around when I needed you. A big thank
you to Lucila Triador for holding Dr. Haqq’s lab together. Thank you for always being so
helpful and for providing me with assistance (and for remembering everyone’s birthday!!).
I was very fortunate to receive the King Abdullah scholarship and am grateful for the
generous funding it provided. I believe that God rewarded my hard work. I feel very fortunate
for the opportunity to study abroad and pursue an advanced degree. A special thank you to all
the staff at the Saudi Arabian Cultural Bureau in Canada, specifically my advisors Dr. Samia
Osman and Dr. Yousef Abu-Nada, as they facilitated all of my educational arrangements and
provided continuous support.
I am hugely indebted to the phenomenal team of endocrinologists and nurses in the
Pediatric Endocrinology at the Stollery Children's Hospital, without whom none of this would
have been possible. Thank you to all of the children participants and their parents who
generously completed my study with interest and enthusiasm in my research.
There are several other people who are a part of my Canadian family and who
deserves a special thank you for supporting and loving me: Travis Rogers, Dr. David
Redekopp, Cathy Hodgson and Kim Franklin.
Last but not least, I would like to thank my wonderful family for their unconditional
love and support: my parents and to my brothers, sisters, nieces and nephews for supporting
me spiritually and ensuring I had the best education and life in general. Special thank you to
my Mom and Dad your prayers--they are what have sustained me thus far.
viii
Table of Contents
Chapter 1 Introduction............................................................................................................ 1
1.1 Thesis Organization .................................................................................................... 1
1.2 Rationale ...................................................................................................................... 1
1.3 Purpose ......................................................................................................................... 5
1.4 Objectives and Hypotheses ......................................................................................... 5 1.4.1 Dietary Macronutrient Regulation of Acyl and Desacyl Ghrelin Concentrations in
Children with Prader-Willi Syndrome (Chapter 3) ............................................................ 5
1.4.2 Serum Concentrations of Asprosin in Children Prader-Willi Syndrome:
Association with Glucose and Insulin Resistance (Chapter 4) .......................................... 6
1.4.3 Effect of High Protein Diet on Diet-Induced Thermogenesis in Children with
Prader-Willi Syndrome (Chapter 5) ................................................................................... 6
Chapter 2 Literature Review .................................................................................................. 8
2.1 Preface ............................................................................................................................. 8
2.2 Regulation of Food Intake and Energy Expenditure ................................................. 9 2.2.1 Peripheral Signals Modulating Appetite ................................................................... 9
2.3 Fasting and Postprandial Hormonal Response in Prader-Willi Syndrome ........... 11
2.4 Energy Metabolism in Prader-Willi Syndrome ........................................................ 12 2.4.1 Total Energy Expenditure (TEE) ............................................................................ 13
2.4.2 Resting Energy Expenditure (REE) and Basal Energy Expenditure (BEE) ........... 14
2.4.3 Sleeping Energy Expenditure (SEE) ....................................................................... 17
2.4.4 Activity Energy Expenditure (AEE) ....................................................................... 18
2.4.5 Diet-Induced Thermogenesis (DIT) ........................................................................ 19
2.5 Methodological Considerations in the Measurement of DIT ................................... 19 2.5.1 Measurement Protocol ............................................................................................ 19
2.5.2 Duration of the DIT Measurement .......................................................................... 21
2.5.3 Minimizing Variability Arising from Movement in Children during the DIT
Measurements .................................................................................................................. 22
2.6 Contribution of Body Composition to Lower Energy Expenditure ........................ 23
2.7 Contribution of Endocrine Dysfunction to Lower Energy Expenditure ................ 25
2.8 Summary and Gaps in Understanding of Energy Expenditure in PWS ................ 25
Chapter 3 Dietary Macronutrient Regulation of Acyl and Desacyl Ghrelin
Concentrations in Children with Prader-Willi Syndrome ................................................. 36
3.1 Preface ........................................................................................................................... 36
3.2 Introduction .................................................................................................................. 37
3.3 Materials and Methods ................................................................................................ 38 3.3.1 Population ............................................................................................................... 38
3.3.2 Experimental Design ............................................................................................... 38
3.3.3 Preparation of Samples ........................................................................................... 39
3.3.4 Hormone and Adipocytokine Assays...................................................................... 39
3.3.4 Statistical Analysis .................................................................................................. 39
3.4 Results ........................................................................................................................... 40 3.4.1 Baseline Anthropometric and Metabolic Characteristics ....................................... 40
3.4.2 Acyl Ghrelin, Desacyl Ghrelin and Acyl Ghrelin:Desacyl Ghrelin Ratio Responses
to SM, HP-LC and HP-LF meals ..................................................................................... 41
3.4.3 Glucose, Insulin, and Gut-peptide Responses to SM, HP-LC and HP-LF meals ... 42
3.4.4 GLP-1 ...................................................................................................................... 43
3.4.5 PYY......................................................................................................................... 44
3.4.6 Appetite Assessment using Visual Analog Scale ................................................... 44
ix
3.5 Discussion...................................................................................................................... 44
Chapter 4 Serum Asprosin Concentrations in Children with Prader-Willi Syndrome:
Correlations with Adiposity-Related Parameters ............................................................... 58
4.1 Preface ........................................................................................................................... 58
4.2 Introduction .................................................................................................................. 59
4.3 Materials and Methods ................................................................................................ 60 4.3.1 Population ............................................................................................................... 60
4.3.2 Anthropometry and Body Composition .................................................................. 60
4.3.3 Experimental Design ............................................................................................... 61
4.3.4 Preparation of Samples ........................................................................................... 61
4.3.5 Hormone and Adipocytokine Assays...................................................................... 61
4.3.6 Statistical Analysis .................................................................................................. 61
4.4 Results ........................................................................................................................... 62 4.4.1 Baseline Anthropometric and Metabolic Characteristics ....................................... 62
4.4.2 Postprandial Asprosin ............................................................................................. 63
4.4.3 Correlation Between Asprosin and Metabolic Parameters ..................................... 63
4.5 Discussion...................................................................................................................... 64
Chapter 5 Effect of High Protein Diet on Postprandial Energy Expenditure in Children
with Prader-Willi Syndrome ................................................................................................. 74
5.1 Preface ........................................................................................................................... 74
5.2 Introduction .................................................................................................................. 75
5.3 Materials and methods ................................................................................................ 76 5.3.1 Population ............................................................................................................... 76
5.3.2 Experimental design and testing procedure ............................................................ 77
5.3.3 Test meals ............................................................................................................... 77
5.3.4 Anthropometry and body composition ................................................................... 78
5.3.5 Satiety and appetite ................................................................................................. 78
5.3.6 Blood samples ......................................................................................................... 79
5.3.7 Measurement of postprandial energy expenditure .................................................. 79
5.4 Calculation of postprandial energy expenditure ....................................................... 80
5.5 Statistical analysis ........................................................................................................ 80
5.6 Results ........................................................................................................................... 81 5.6.1 Baseline anthropometric and metabolic characteristics .......................................... 81
5.6.2 Resting energy expenditure..................................................................................... 81
5.6.3 Postprandial energy expenditure using same day resting energy expenditure
measurements ................................................................................................................... 81
5.6.3 Postprandial energy expenditure using (‘fixed REE’) measurements .................... 81
5.6.4 Respiratory exchange ratio ..................................................................................... 81
5.6.5 Subjective appetite response ................................................................................... 82
5.6.6 Correlation between PEE and subjective appetite sensations ................................. 82
5.7 Discussion...................................................................................................................... 82
Chapter 6 ................................................................................................................................ 97
Discussion and Conclusions .................................................................................................. 97
6.1 Introduction .................................................................................................................. 97
6.2 Summary of the Studies’ Aims and Results .............................................................. 98
6.3 Hormonal Regulation ................................................................................................ 100
6.4 Diet-Induced Thermogenesis Measurements .......................................................... 100
6.5 Measures of Subjective Appetite Assessment .......................................................... 101
x
6.6 Energy Metabolism and Requirements ................................................................... 103
6.7 Limitations and Challenges ....................................................................................... 104
6.8 Translation and Future Research Directions .......................................................... 106
6.9 Conclusion .................................................................................................................. 108
Bibliography ......................................................................................................................... 110
Appendices ............................................................................................................................ 130 Appendix A. Example for the puberty assessment ........................................................... 130
Appendix B. Meals menu: example for the test meal ....................................................... 132
Appendix C. Food intake track ......................................................................................... 133
Appendix D. Visual analog scale ...................................................................................... 137
xi
List of Tables
Table 2.1. Relevant Terms and Definitions Related to Energy Metabolism
28
Table 2.2. Summary of Studies Investigating Differences in the Components of
Energy Expenditure in Individuals with or without Prader-Willi Syndrome (PWS)
29
Table 3.1. Study meals
50
Table 3.2. Baseline characteristics of Prader-Willi syndrome (PWS) and (body
mass index) BMI z-score matched children
51
Table 3.3. Summary of the key differences between children with (PWS) and the
controls
52
Table 4.1. Baseline characteristics of children with Prader-Willi syndrome (PWS),
children with obesity and children with healthy weight
66
Table 4.2. Baseline characteristics of children with Prader-Willi syndrome (PWS)
and body mass index (BMI) z-score matched children
67
Table 4.3. Spearman correlations of fasting asprosin to other metabolic parameters
in children with Prader-Willi syndrome (PWS), children with obesity and children
with healthy weight
68
Table 4.4. Partial correlations of fasting asprosin to other metabolic parameters
adjusting for age, sex and BMI z-score in children with Prader-Willi syndrome
(PWS), children with obesity and healthy weight children
69
Table 4.5. Spearman correlations of fasting asprosin to other metabolic parameters
in children with Prader-Willi syndrome (PWS), and children with body mass index
(BMI) z-score matched children
70
Table 4.6. Partial correlation of fasting asprosin to other metabolic parameters
adjusting for age, sex and BMI z-score in children with Prader-Willi syndrome
(PWS), and children with body mass index (BMI) z-score matched children
71
Table 5.1. Study diets
86
Table 5.2. Study meals
87
Table 5.2. Baseline Characteristics of Prader-Willi syndrome (PWS)
88
xii
List of Figures
Figure 2.1. Hormonal Regulation of Energy Homeostasis 34
Figure 2.2. A flowchart of Literature Review Process 35
Figure 3.1. Acyl ghrelin, desacyl ghrelin and acyl ghrelin:desacyl ghrelin ratio
response to isocaloric standard, high protein-low carbohydrate and high protein-
low fat breakfast meals
53
Figure 3.2. Glucose and Insulin response to isocaloric standard, high protein-low
carbohydrate and high protein-low fat breakfast meals
55
Figure 3.3. Glucagon-like peptide 1 (GLP-1) and peptide tyrosine tyrosine (PYY)
response to isocaloric standard, high protein-low carbohydrate and high protein-
low fat breakfast meals
56
Figure 3.4. Visual analog scale (VAS) response to isocaloric standard, high
protein-low carbohydrate and high protein-low fat breakfast meals
57
Figure 4.1. Fasting and 1-hour post-meal asprosin in children with Prader-Willi
syndrome (PWS) and body mass index (BMI) z-score matched children
73
Figure 5.1. Trial design 90
Figure 5.2. Protocol visits 2 and 3 91
Figure 5.3. Resting energy expenditure (REE) measurements 92
Figure 5.4. Postprandial energy expenditure (PEE) response 93
Figure 5.5. Postprandial energy expenditure (PEE) response using ‘fixed REE’ 94
Figure 5.6. Respiratory exchange ratio (RER) 95
Figure 5.7. Subjective appetite response 96
Figure 6.1. The role of protein intake in the regulation of food intake and energy
metabolism
99
xiii
List of Abbreviations
AEBSF: esterase inhibitor 4-(2-aminoethyl) benzenesulfonyl fluoride
AEE: activity energy expenditure
AG: acylated ghrelin
AgRP: agouti-related peptide
ARC: hypothalamic arcuate
BC: body composition
BEE: basal energy expenditure
BIA: bioelectrical impedance analysis
BMI: body mass index
BodPod: air displacement plethysmography
CO2: carbon dioxide
DAG: desacyl ghrelin
DEL: deletion
DIT: diet-induced thermogenesis
DLW: doubly labeled water
DXA: dual-energy x-ray absorptiometry
EE: energy expenditure
EI: energy intake
FFM: fat-free mass
FM: fat mass
GH: growth hormone
GLP-1: glucagon-like peptide 1
HD: hypothalamic damage
HMW: high molecular weight
HO: hypothalamic obesity
HOMA-IR: homeostatic model assessment insulin resistance
HP: high protein
HP-LC: higher protein-lower carbohydrate
HP-LF: higher protein-lower fat
IC: indirect calorimetry
kcal: kilocalorie
kg: kilogram
xiv
M: methylation
Magel2: MAGE-like 2
MRI: magnetic resonance imaging
NPY: neuropeptide tyrosine
O2: oxygen
PEE: postprandial energy expenditure
POMC: proopiomelanocortin
PWS: Prader-Willi syndrome
PYY: peptide tyrosine tyrosine
REE: resting energy expenditure
RER: respiratory exchange ratio
SD: standard diet
SEE: sleeping energy expenditure
SM: standard meal
T2D: type 2 diabetes
TBK: total body potassium
TEE: total energy expenditure
TSH: thyroid-stimulating hormone
UPD: uniparental disomy
WBCU: whole-body calorimetry unit
WHO: World Health Organization
y: year
1
Chapter 1 Introduction
1.1 Thesis Organization
This thesis has been prepared as a paper format according to specifications provided by the
Faculty of Graduate Studies and Research at the University of Alberta. Following Chapter 1,
Chapter 2 provides a literature review, and Chapters 3, 4 and 5 are individual manuscripts.
Parts of Chapter 2 have been published in Advances in Nutrition (Alsaif et al., 2017;
15;8(6):905-915.doi:10.3945/an.117.016253.). Chapter 3 is being submitted to the journal
Clinical Endocrinology. Chapter 4 is being prepared for submission to Pediatric Obesity.
Chapter 5 is being prepared for submission to Metabolism: Clinical and Experimental, with a
brief description of each study. Chapter 6 is a summary and final discussion of the thesis.
1.2 Rationale
As a growing global epidemic, childhood obesity is a major health concern (WHO,
2019). According to the World Health Organization (WHO, 2019), in 2016, the worldwide
number of children with overweight under the age of 5 was estimated to be over 41 million,
and over 340 million children and adolescents aged 5 to 19 years presented with overweight
or obesity. Overall, the prevalence of overweight and obesity among children and adolescents
aged 5 to 19 years has risen dramatically from just 4% in 1975 to over 18% in 2016. Both
boys and girls are similarly affected: in 2016, 18% of girls and 19% of boys presented with
overweight (WHO, 2019). In Canada, one in seven 6- to 17-year-olds presented with
overweight or obesity (Rao, Kropac, Do, Roberts, & Jayaraman, 2016). Children with
overweight and obesity are likely to remain as adults with obesity and are more likely to
develop non-communicable diseases such as diabetes and cardiovascular diseases at a
younger age (Nadeau, Maahs, Daniels, & Eckel, 2011).
Treatments for childhood obesity have had limited success. To improve the
effectiveness of treatment, a greater understanding of the interaction between environmental
factors (e.g., sleep duration, sedentary behaviors, exercise, availability and cost of food and
hedonic eating) and the genetic and neuroendocrine underpinnings of the disease is required.
As obesity defined as unbalance between energy intake (EI) and energy expenditure (EE);
currently, the critical underlying neuroendocrine factors that regulate energy balance are not
fully understood (Hill, Wyatt, & Peters, 2012).
2
Genetic mutations or chromosomal abnormalities can lead to syndromic obesity
(Haqq, 2010). One of the most well described forms of syndromic obesity is Prader-Willi
syndrome (PWS). First described in 1956 and formerly known as Prader-Labhart-Willi
syndrome, PWS is a rare genetic disorder in which multiple genes on the paternal
chromosome 15 (q 11-13) are deleted or unexpressed (Bekx, Carrel, Shriver, Li, & Allen,
2003a). Prader-Willi syndrome occurs in 1 in 10,000 to 16,000 live-born infants, and is
characterized by dysmorphic features, muscular hypotonia, short stature, low fat-free mass
(FFM), cognitive delay, and behavioral abnormalities (Cassidy & Driscoll, 2009), which
develops insidiously and is often the catalyst for the development of obesity in this
population (Burman, Ritzen, & Lindgren, 2001). Excessive weight gain can be observed by
the age of 2 years; and at ~3–5 years, obesity becomes conspicuous (Bekx, Carrel, Shriver,
Li, & Allen, 2003b). Furthermore, as a result of profound obesity (many individuals weigh >
200% of their ideal body weight), obesity-related morbidity and mortality are high in this
population (Coplin, Hine, & Gormican, 1976; Haqq, 2010; Schoeller, Levitsky, Bandini,
Dietz, & Walczak, 1988).
Children with PWS have a different metabolic profile compared to children with other
forms of obesity. Lower fasting insulin, lower homeostasis model assessment of insulin
resistance (HOMA-IR) scores, and higher concentrations of fasting total and high molecular
weight (HMW) adiponectin have been reported in children with PWS when compared to
body mass index (BMI) z-scores and leptin concentrations of matched children (Haqq et al.,
2007). In addition, children with PWS showed significantly higher fasting ghrelin
concentrations and total peptide tyrosine tyrosine (PYY), an anorexigenic peptide secreted
primarily from the intestinal mucosa of the ileum and large intestine, compared to children
with non-syndromic obesity (Haqq et al., 2007). Therefore, children with PWS exhibit a
surprisingly different endocrine profile than BMI z-score matched children.
Children with PWS have high fasting and postprandial concentrations of total ghrelin
(Bizzarri et al., 2010). Ghrelin is an orexigenic peptide produced primarily in the
enteroendocrine cells of the stomach (Levin et al., 2006). In contrast, total ghrelin l
concentrations are suppressed in children with “exogenous” obesity or with obesity caused by
mutations in leptin or the melanocortin-4 receptor (Cummings et al., 2002; DelParigi et al.,
2002; Haqq et al., 2003). Serum ghrelin concentrations were negatively correlated with BMI
z-scores in children with healthy weight and children with other forms of obesity, but not in
children with PWS (Haqq, Farooqi, et al., 2003). Ghrelin was also negatively correlated with
insulin concentrations in all control groups (Haqq, Farooqi, et al., 2003). Infants with PWS
3
who have not yet developed hyperphagia or obesity have median fasting total ghrelin
concentrations similar to age- and sex-matched individuals; however, one-third of PWS
subjects had ghrelin concentrations greater than the 95th
percentile for ghrelin values in the
control individuals (Haqq et al., 2008).
Ghrelin administration to humans or rodents stimulates food intake, leading to weight
gain in a dose-dependent manner (Toshinai et al., 2007). In humans, circulating ghrelin
concentrations demonstrate a diurnal rhythm, increasing during fasting and decreasing after
meals; these findings suggest that ghrelin plays a role in meal initiation in humans and in
long-term regulation of energy storage (Atalayer, Gibson, Konopacka, & Geliebter, 2013).
Circulating ghrelin concentrations in humans also correlate inversely with BMI and are,
therefore, low in individuals with obesity and high in individuals with healthy weight (Haqq,
Farooqi, et al., 2003). During weight loss or in conditions associated with anorexia or
cachexia, ghrelin concentrations rise as a counter-regulatory mechanism, presumably to
increase food intake and restore body weight (Blauwhoff-Buskermolen et al., 2017). In
addition, asprosin, a newly discovered hormone produced by the white adipose tissue,
stimulates glucose production and is correlated with insulin resistance (Greenhill, 2016). Like
ghrelin, asprosin acts as an orexigenic hormone, increasing after fasting and decreasing with
food intake and using the same signalling pathways—namely, neuropeptide tyrosine
(NPY)/agouti-related peptide (AgRP) (Beutler & Knight, 2018). Concentrations of asprosin
have been reported to be higher in individuals with obesity, individuals with type 2 diabetes
mellitus and women with polycystic ovary syndrome (Acara, Bolatkale, Kiziloglu, Ibisoglu,
& Can, 2018; Li et al., 2018; Zhang, Chen, Zhou, Fu, & Cheng, 2019). To date, the
concentrations of asprosin have not been elucidated in individuals with PWS.
The excessive weight gain associated with PWS is of concern to health-care
professionals and caregivers who acknowledge that weight management is an essential but
challenging aspect of care for individuals with PWS. To improve the effectiveness of
treatments to curb the development of obesity in PWS, a more complete understanding of the
underlying mechanisms associated with altered energy balance in these individuals is needed.
Excess energy intake associated with insatiable hyperphagia would contribute to energy
imbalance. However, the reported lower energy requirements of individuals with PWS to
prevent excessive weight gain (Butler, 2006) suggests that their energy expenditure (EE) is
lower than predicted. Therefore, weight maintenance in individuals with PWS typically
requires ~60% of the recommended intake in the general population (Cassidy & Driscoll,
2009; Mihalache et al., 2016).
4
The weight gain and subsequent obesity associated with this condition is caused by a
chronic imbalance between energy intake and EE (Coplin et al., 1976; Holm & Pipes, 1976).
A number of factors are responsible for this imbalance in children with PWS, including
hyperphagia, decreased physical activity, lower FFM, reduced metabolic rate and hormonal
dysregulation (Butler, 2011). Consequently, energy metabolism in these individuals is likely
to be altered, when compared to other obesity states. Currently, knowledge surrounding the
impact of altered energy metabolism on total energy expenditure (TEE) and its components is
conflicting. There is evidence to suggest that individuals with PWS have a lower resting
energy expenditure (REE), the primary determinant of TEE (Davies & Joughin, 1993; Hill,
Kaler, Spetalnick, Reed, & Butler, 1990). However, research groups report inconsistent
findings regarding a lower REE in PWS when compared to healthy weight and obese
individuals, which highlights the need for further research using state-of-the art techniques to
address these discrepancies (Alsaif et al., 2017). The varied results may be due to the control
groups being not matched for age, sex and BMI z-score to individuals with PWS, and
discrepancies in methods used to measure body composition. Also, an inconsistency in
statistical methods may be responsible for conflicting results between studies that adjusted
REE for FFM (Baum, Gray, & Binns, 2015; Maffeis et al., 2001; Maffeis, Schutz, Zoccante,
Micciolo, & Pinelli, 1993).
An additional component of TEE that may be altered in individuals with PWS is diet-
induced thermogenesis (DIT). This component of EE accounts for approximately 10% to
15% of a person’s TEE and is reflective of the amount of energy expended during the
processing and storage of food (Blasco Redondo, 2015). It has been hypothesized that
increased body temperature, caused by heat released during the digestion of food (e.g., DIT),
could result in a reduced food intake (Strominger & Brobeck, 1953). It has previously been
documented that individuals with obesity have lower DIT compared to healthy weight
individuals; this reduction in EE could explain the weight gain (De Palo et al., 1989; Maffeis
et al., 2001; Marrades, Martinez, & Moreno-Aliaga, 2007; Schutz, Bessard, & Jequier, 1984;
Segal, Edano, & Tomas, 1990; Steiniger, Karst, Noack, & Steglich, 1987). However, there is
a paucity of information on DIT in children with PWS. To date, no study has assessed DIT in
children with PWS. Therefore, it is important to determine if there is a mismatch in DIT
between children with PWS and children with healthy weight that could explain the
progressive weight gain in children with PWS. Only a few studies have measured DIT in
children with healthy-weight and obesity, but they have also yielded conflicting results
(Baum et al., 2015; Maffeis et al., 2001; Maffeis et al., 1993). These findings suggest that
5
adiposity and macronutrient composition may have an influence on DIT response. However,
the varied results may be due to inconsistencies in methods used to obtain DIT values
(including duration of measurement) and meal size. Other reasons for these inconsistencies
remain unclear.
To improve the effectiveness of obesity treatment in children with PWS, a more
complete understanding of the interaction between energy intake and EE as well as hormonal
dysregulation is required. Therefore, suppression of ghrelin concentrations and increase DIT
may be an effective treatment in the regulation of appetite and body weight in individuals
with PWS. To develop future strategies that employ specific ghrelin antagonists, leading to
sustained ghrelin suppression and weight loss in this population, it is essential to better
understand the physiologic and nutritional regulation of active ghrelin in individuals with
PWS. As well, it has been challenging to accurately measure the amount of acyltated (active)
ghrelin in plasma. However, the development of an assay validation method that measures
active ghrelin (Liu et al., 2008), which is used in this study, is exciting. The postprandial
suppression of ghrelin and DIT in response depends on the total caloric content, as well as the
macronutrient composition (fat, carbohydrates and protein) of the meal. It is possible that
meals of similar caloric content but different macronutrient composition may impact DIT,
potentially influencing TEE. Previous research has suggested that carbohydrate-based meals
generally have a larger impact on the DIT than fat; however, protein has recently been found
to have the greatest impact on DIT in both healthy weight and obese cohorts (Crowder,
Neumann, & Baum, 2016; Maffeis et al., 2001).
1.3 Purpose
The overall objective of this research was to determine and compare the impact of
higher protein versus standard meals on postprandial regulation of ghrelin and asprosin; (2)
other satiety factor concentrations1; and (3) DIT in children with PWS.
1.4 Objectives and Hypotheses
1.4.1 Dietary Macronutrient Regulation of Acyl and Desacyl Ghrelin Concentrations in
Children with Prader-Willi Syndrome (Chapter 3)
The objective of this chapter is as follows:
1 Glucose, insulin, leptin, glucagon-like peptide 1[GLP-1] and peptide tyrosine tyrosine [PYY].
6
i. To determine the acute postprandial impact of lower and higher protein meals on
plasma active ghrelin and insulin sensitivity in children with PWS compared to BMI
z-score matched children.
The primary hypotheses of this chapter are as follows:
i. Fasting and postprandial active ghrelin will be higher in children with PWS.
ii. The meal-related decline in plasma active ghrelin will be greater in children with
PWS, but the rebound in plasma active ghrelin back to baseline after a meal will be
more rapid in children with PWS.
iii. A higher protein/lower fat meal will suppress plasma active ghrelin to a greater
degree and increase insulin concentrations in both study groups compared to the
higher protein/lower carbohydrate meal.
1.4.2 Serum Concentrations of Asprosin in Children Prader-Willi Syndrome:
Association with Glucose and Insulin Resistance (Chapter 4)
The objectives of this chapter are as follows:
i. To determine if there is a difference in serum asprosin concentrations between
children with PWS and BMI z-score matched children.
ii. To determine the impact of a meal on postprandial asprosin.
iii. To examine the association between serum asprosin and parameters of glucose,
insulin resistance, ghrelin, leptin, and percentage of body fat.
The primary hypotheses of this chapter are as follows:
i. Fasting and postprandial asprosin will be higher in children with PWS.
ii. A breakfast meal will suppress asprosin concentrations in both groups.
iii. Serum asprosin will be positively and significantly associated with glucose and
insulin resistance.
1.4.3 Effect of High Protein Diet on Diet-Induced Thermogenesis in Children with
Prader-Willi Syndrome (Chapter 5)
The objectives of this chapter are as follows:
i. To determine the impact of a higher protein intake compared to a lower protein intake
on DIT in children with PWS.
ii. To examine the association between a higher protein intake compared to a lower
protein intake on subjective appetite sensations in children with PWS.
The primary hypotheses of this chapter are as follows:

7
i. A higher protein intake will result in higher DIT and satiety compared to a lower
protein intake.
ii. A higher protein intake will result in reduced and prolonged appetite compared to a
lower protein intake.
8
Chapter 2 Literature Review
2.1 Preface
Sections of this chapter that describe energy metabolism in children with Prader-Willi
syndrome have been adapted from a published article in Advances in Nutrition (Alsaif et al.,
2017; 15;8(6):905-915. doi: 10.3945/an.117.016253.).
9
2.2 Regulation of Food Intake and Energy Expenditure
In healthy individuals, energy homeostasis is regulated by food intake (FI) and energy
expenditure (EE) to maintain energy balance (Woods, Schwartz, Baskin, & Seeley, 2000).
Homeostasis of energy balance requires the brain to maintain energy levels by regulating
metabolites, fuel stores or hormone secretion (Woods et al., 2000). These requirements
demand first the ability to detect metabolic changes in the body energy by sensing the
concentrations of plasma metabolic hormones and nutrients to integrate information from
afferent signals projecting to the brain (Roh, Song, & Kim, 2016). The brain, particularly the
hypothalamus, is responsible for this regulation (Morton, Meek, & Schwartz, 2014). The
hypothalamic arcuate (ARC) is a hypothalamic area that primarily regulates food intake and
metabolism by acting on different types of neurons, including orexigenic neuropeptide
tyrosine (NPY)/agouti-related peptide (AgRP) and anorexigenic proopiomelanocortin
(POMC) neurons (Roh et al., 2016). Adaptive changes in metabolic response and energy
expenditure are regulated by neuronal network signals the brain to maintain body weight
(Roh et al., 2016). Those signals include adiposity signals (e.g., leptin, insulin), metabolites
(e.g., glucose, fatty acids, amino acids) or hormones satiety signals (e.g., glucagon-like
peptide 1[GLP-1], peptide tyrosine tyrosine [PYY]) and hunger signals (e.g., ghrelin)
(Kampe, Tschop, Horvath, & Widmer, 2000). Hormonal regulation of energy homeostasis is
shown in (Figure 2.1).
2.2.1 Peripheral Signals Modulating Appetite
The modulation of food intake and glucose metabolism is controlled by pre- and
postprandial physiological responses, regulated by orexigenic (ghrelin) and anorexigenic
(leptin, insulin, GLP-1 and PYY) hormones (Steinert et al., 2017). Ghrelin is a 28-amino acid
peptide hormone with an octanoyl group on the serine in position 3, which accounts for its
biological function. It is produced mainly by the stomach and circulates as acylated (AG) and
desacyl (DAG) forms (Date et al., 2000; Kojima et al., 1999). Acylated ghrelin is an active
form that stimulates appetite and induces a positive energy balance, which can lead to weight
gain (Yang, Brown, Liang, Grishin, & Goldstein, 2008). Desacyl ghrelin is an inactive form
of ghrelin and can improve glycemic control (Allas & Abribat, 2013). This suggests that the
ratio of AG and DAG concentrations (AG:DAG) plays an important role in maintaining
weight balance and metabolic control. Circulating ghrelin consists of less than 10% AG and
more than 90% DAG. Acylated ghrelin is unstable and is rapidly deacylated to DAG by
esterases, which makes it more difficult to measure the active form of ghrelin (Date et al.,
10
2000; De Vriese et al., 2004; Delhanty et al., 2015). Therefore, the immediate addition of an
esterase inhibitor 4-(2-aminoethyl) benzenesulfonyl fluoride (AEBSF) is needed at the time
of blood collection to determine reliable active ghrelin concentrations (Kuppens et al., 2015).
Leptin is a protein hormone secreted by adipocytes, and plasma leptin concentration
increases in proportion to body fat mass (Campfield, Smith, Guisez, Devos, & Burn, 1995;
Halaas et al., 1995; Pelleymounter et al., 1995). Insulin is produced by pancreatic islets and
plays an important role in glucose regulation (Fu, Gilbert, & Liu, 2013). Both leptin and
insulin regulate long-term food intake and energy expenditure to maintain body fat storage
(Paz-Filho, Mastronardi, Wong, & Licinio, 2012). Glucagon-like peptide 1 and PYY
hormones are secreted by the gut and act on other tissues/organs to reduce food intake (Zhou
et al., 2015).
The postprandial suppression of these hormones is dependent on the macronutrient
(fat, carbohydrates, protein) composition and distribution of the particular meal ingested.
Meals high in carbohydrates (≥ 65% of total energy intake) are generally more potent than
meals high in fat in suppressing ghrelin concentrations (Erdmann, Lippl, & Schusdziarra,
2003; Erdmann, Topsch, Lippl, Gussmann, & Schusdziarra, 2004; Monteleone, Bencivenga,
Longobardi, Serritella, & Maj, 2003; Tannous dit El Khoury, Obeid, Azar, & Hwalla, 2006),
while meals high in protein (≥ 30% of total energy) produce variable effects (Foster-Schubert
et al., 2008; Leidy, Mattes, & Campbell, 2007). Meals with a mixed macronutrient
composition stimulate an increase in plasma GLP-1 concentrations, which peak after 1 to 2
hours (Carr et al., 2010; Elliott et al., 1993). By contrast, oral glucose raises plasma GLP-1
concentrations after 5 to 15 minutes (Carr et al., 2010; Elliott et al., 1993; Hojberg et al.,
2009; Kong et al., 1999), while protein- and fat-based meals produce slower and more
sustained increases in plasma GLP-1 (Bowen, Noakes, & Clifton, 2006; Calbet & Holst,
2004; Carr et al., 2008). Plasma PYY increases 15 to 30 minutes after mixed macronutrient
composition meals, peaking at approximately 1 to 1.5 hours (Ballantyne, 2006; Batterham et
al., 2003; Degen et al., 2005). Meals high in fat (≥ 30% of total energy) increase PYY
secretion more effectively than carbohydrates (Adrian et al., 1985; Brennan et al., 2012;
Gumus Balikcioglu et al., 2015). However, the effect of dietary protein on postprandial PYY
secretion is not fully understood (Adrian et al., 1985; Ballantyne, 2006; Heden et al., 2013).
Understanding the role of the macronutrients on the regulation of ghrelin and other satiety
factors will help guide the design of optimal diets for individuals with PWS and obesity in
general.
11
2.3 Fasting and Postprandial Hormonal Response in Prader-Willi Syndrome
Fasting comparable leptin and higher fasting ghrelin, total adiponectin and high molecular
weight adiponectin concentrations and insulin sensitivity have been reported in children with
Prader-Willi syndrome (PWS) when compared to children with non-syndromic obesity
(Eiholzer et al., 1998; Haqq, Muehlbauer, Newgard, Grambow, & Freemark, 2011; Krochik,
Ozuna, Torrado, Chertkoff, & Mazza, 2006; Sohn et al., 2010; Talebizadeh & Butler, 2005).
Goldstone et al., (2004) reported comparable fasting GLP-1 concentrations in adults with
PWS and adults with and without obesity. Purtell et al., (2011) found comparable
concentrations of GLP-1 and PYY in adults with PWS when compared to adults with obesity
and healthy weight. In contrast, Butler et al., (2004) reported lower PYY concentrations in
infants and children with PWS compared to previously published literature on infants and
children without PWS. However, their study has several limitations that could affect their
results, including the lack of a control group to compare their result to and differences in
blood collection and processing methods, as well as the timing of the blood draws.
Postprandial response to feeding has been reported in handful of studies and has
yielded conflicting results (Bizzarri et al., 2010; Butler, Bittel, & Talebizadeh, 2004; Gumus
Balikcioglu et al., 2015; Purtell et al., 2011). Gumus Balikcioglu et al., (2015) found that
high-carbohydrates and high-fat meals suppressed ghrelin concentrations in children with
PWS as well as in BMI z-score-, age- and sex-matched controls. These findings correspond
to those of Bizzarri et al., (2010), who showed that a mixed liquid meal suppressed plasma
ghrelin more in children with PWS than in children with obesity.
Several reports have described the role of PYY in PWS, but again with conflicting
results. Butler et al., (Butler et al., 2004) reported lower PYY concentrations in infants and
children with PWS and a higher plasma PYY response to meals in children with PWS
compared to children with and without obesity (Bizzarri et al., 2010). Gumus Balikcioglu et
al., (2015) reported higher fasting PYY and a blunted postprandial response to high-fat meals
in children with PWS compared to BMI z-score-matched children. In adults, Purtell et al.,
(2011) found comparable fasting and postprandial PYY concentrations in PWS subjects when
compared to adults with obesity. Similarly, Purtell et al., (2011) reported comparable fasting
GLP-1 and postprandial GLP-1 concentrations in adults with PWS following high-
carbohydrates and high-fat meals (50% carbohydrates, 35% fat, 15% protein) compared to
adults with and without obesity.
The exact role of macronutrients in regulating appetite and metabolic function in
children with PWS is poorly understood. Individuals with PWS have preference for sweet
12
food, which could explain the weight gain (Hinton, Holland, Gellatly, Soni, & Owen, 2006;
Martinez Michel, Haqq, & Wismer, 2016), suggesting that a high-carbohydrates diet could
influence hyperphagia and weight gain (Irizarry et al., 2019). A high-protein diet has been
shown to increase satiety hormones, reduce hunger, decrease energy intake and improve
weight loss and glycemic control in individuals with non-syndromic obesity (Paddon-Jones et
al., 2008; Pasiakos, 2015; Pesta & Samuel, 2014). High-protein diets stimulate the secretion
of satiety hormones GLP-1 and reduce orexigenic hormone secretion of ghrelin as well as
improve glycemic control through increases in hepatic gluconeogenesis (Pesta & Samuel,
2014). Therefore, we postulate that high-protein diets might reduce orexigenic and increase
anorexigenic drive, increase satiety and improve glucose homeostasis in children with PWS.
2.4 Energy Metabolism in Prader-Willi Syndrome
In order to further explore the topic on energy metabolism in individuals with PWS a
literature searches were performed on Pubmed, Web of Science, SCOPUS and Medline using
the following keywords: “energy metabolism,” “energy expenditure,” “resting energy
expenditure,” “resting metabolic rate,” “basal metabolic rate,” “basal energy expenditure,”
“activity energy expenditure,” “total energy expenditure,” “daily energy expenditure,” “diet-
induced thermogenesis,” “thermic effect of food,” “postprandial thermogenesis,” “indirect
calorimetry,” “doubly labeled water,” and “Prader-Willi syndrome.” Studies published
between time of inception and February 2017 were included in this review. Studies were
included if they measured energy expenditure (EE) in individuals with PWS compared to
matched controls using indirect calorimetry (IC) or doubly labeled water (DLW) Methods of
EE measurement will be explained later in section 2.5.1 Measurement Protocol. A total of
1,310 articles were found. After excluding duplicates (N=899), irrelevant articles (not related
to the aim of this review) (N=393), and articles that did not meet the inclusion criteria (N=8),
a total of 10 articles were included in this review.
A flowchart of the literature review process is given in (Figure 2.2) and relevant
terms related to energy metabolism are defined in (Table 2.1). As explained elsewhere,
(Carneiro et al., 2016), multiple terms to describe specific components of energy expenditure
are used interchangeably in the literature (e.g., resting and basal energy expenditure [BEE]).
However, differences in the specific measurement conditions for obtaining REE and BEE
exist, and should be used to clarify which component (REE or BEE) is actually being
assessed (Table 2.1). These components were hereby classified as either BEE or REE
according to their measurement conditions as described in the methodology sections of the
13
reviewed papers, even if the study authors chose different terms. Additionally, to ensure
consistency in reporting and ease of comparison, all energy expenditure values were
expressed in kcal/day. Study details, including the population investigated and methods
employed to assess the specific components of TEE, are presented in (Table 2.2).
2.4.1 Total Energy Expenditure (TEE)
Despite the concerns for weight management in the PWS population, very few studies
investigate the energy expenditure of individuals with PWS. To date, only a handful of
studies have examined TEE and it is components among this cohort (Bekx et al., 2003a;
Butler, Theodoro, Bittel, & Donnelly, 2007b; Davies & Joughin, 1993; Goldstone et al.,
2002; Hill et al., 1990; Lloret-Linares et al., 2013; Purtell et al., 2015; Schoeller et al., 1988;
van Mil, Westerterp, Kester, et al., 2000) and few have investigated differences between
PWS and healthy weight subjects or individuals with obesity to understand the propensity for
development of obesity in persons with PWS.
In the 1980s, evidence to suggest that there was a reduction in energy expenditure in
PWS first emerged with studies showing that the TEE expenditure in PWS was
approximately 30% lower than control subjects. To date, five studies measured TEE in
individuals with PWS. All studies found a lower TEE (kcal/day) compared to matched (for
either age or BMI) individuals ranging from 20 to 46% lower in individuals with PWS.
Differences in the magnitude of reduction may be related to the methods employed and/or the
control group used for comparison.
The majority of studies assessed “free-living” energy expenditure using the gold
standard method, DLW (Bekx et al., 2003a; Davies & Joughin, 1993; Schoeller et al., 1988;
van Mil, Westerterp, Kester, et al., 2000). The use of DLW allows all components of energy
expenditure (REE/BEE, AEE, SEE, DIT) to be captured over a 7- to 14-day period. The
highest reduction in TEE was reported by Schoeller and colleagues (Schoeller et al., 1988) in
the late 1980s using DLW (under free-living conditions) for 7 days in adolescents with PWS
(1980 ± 580 kcal/day). Energy expenditure in PWS was 47% lower compared to age-and sex-
matched individuals (3700 ± 820 kcal/day, p < 0.05). However, mean body mass index (BMI)
was higher in the control group, with a measured BMI of 36 compared to a BMI of 29 in
individuals with PWS. This finding would lead one to expect a higher TEE based on higher
body weight in the controls, assuming a higher amount of fat-free mass (FFM); thus, reported
differences between the cohorts might have been exaggerated. Another study conducted by
van Mil et al., (2000) measured TEE using DLW for 14 days, and reported a 28% lower TEE
14
in PWS children/adolescents (1705 ± 411 kcal/day) compared to the control group matched
for age, sex, bone age and BMI (2374 ± 631 kcal/day, p < 0.01). Furthermore, a 28% lower in
TEE was reported by Davies and Joughin (1993) using DLW (duration not provided) in PWS
children/adolescents (1758 ± 569 kcal/day) compared to age- and sex-matched individuals
(2474 ± 724 kcal/day, p < 0.01). Interestingly, Bekx et al. (2003b) measured TEE in infants
with PWS using DLW for 7 days and reported results that were 24% lower in PWS infants
(587 ± 189 kcal/day) compared to normative data for age and sex (775 ± 150 kcal/day, p <
0.001). These latter findings suggest that changes in the energy metabolism profile in PWS
originate early on in development. To date, only one study has measured TEE using whole-
body calorimetry unit (WBCU). TEE was measured for only 8 hours, and the results
extrapolated to a full day (Butler et al., 2007b). Under these “controlled environment”
conditions the authors also reported that PWS adults had a 20% lower TEE (2346 ± 465
kcal/day) compared to age-matched adults; however, BMI was not matched in this study
(2973 ± 708 kcal/day, p < 0.001).
The overall impact of this lower TEE in individuals with PWS, compared to both
healthy age-matched and BMI-matched individuals, is that they would be expected to have
reduced energy requirements. Available energy recommendations and published predictive
equations are not specific for PWS and would therefore overestimate the energy requirement
needs of individuals with PWS. A 30 to 40% reduction in overall energy requirements is the
clinical recommendation for individuals with PWS (Miller, Lynn, Shuster, & Driscoll, 2013);
however; the lack of precise energy recommendations for individuals with PWS makes it
difficult to establish baseline values from which adjustments can be made. The current energy
requirement recommendation for individuals with PWS is to lower energy intake to maintain
a healthy body weight. However, this strategy does not take into consideration hyperphagia,
dysfunction in satiety, body composition and food-seeking behaviors that are inherent to
PWS (Martinez Michel et al., 2016). Considering these additional factors is crucial when
deriving energy needs and assessing satiety to facilitate the development of optimal diets for
weight maintenance in children with PWS.
2.4.2 Resting Energy Expenditure (REE) and Basal Energy Expenditure (BEE)
The majority of studies captured in this review examined differences in REE using IC
via a ventilated hood system (Davies & Joughin, 1993; Hill et al., 1990; Lloret-Linares et al.,
2013; Purtell et al., 2015) or via a WBCU system (Butler, Theodoro, Bittel, & Donnelly,
2007a; Goldstone et al., 2002) with measurement periods ranging from 10 to 30 minutes.
15
Ventilated hood systems are used to determine REE, a process that involves using a face
mask, mouthpiece or hood to measure oxygen (O2) and carbon dioxide (CO2) (Psota & Chen,
2013). The quantity of CO2 gas is measured and connects to a gas analyzer system (Psota &
Chen, 2013). Open-circuit ventilated hood systems can provide rapid estimates when
correctly calibrated and positioned on the participants (Psota & Chen, 2013). The smaller
“dead spaces” in the ventilation system improves response times compared to open-circuit IC
system (Levine, 2005). Even though the set up and use of open-circuit ventilated hood
systems is readily comparable to an open-circuit IC system, participants still have limited
mobility, the procedure is uncomfortable, and this method makes communication and eating
impossible (Duffield, Dawson, Pinnington, & Wong, 2004; McLaughlin, King, Howley,
Bassett, & Ainsworth, 2001). These systems are therefore only appropriate for studies that
last from 20 minutes to six hours (Psota & Chen, 2013).
Comparable results to the open-circuit ventilated hood systems can be achieved using
portable open-circuit spirometry systems (Duffield et al., 2004; McLaughlin et al., 2001).
However, participants must also wear a face mask and mouthpiece (Psota & Chen, 2013).
The gas analyzer and the power supply are in a backpack, which must be worn during the
measurement process (Brychta, Wohlers, Moon, & Chen, 2010). The increased portability of
this system allows for greater mobility and more flexibility to be used in free-living
conditions. However, the equipment remains cumbersome due to the added weight of the
analyzers (Brychta et al., 2010). The majority of the portable devices, such as the MedGem
and Fitmate devices, are not equipped with a CO2 analyzer; instead, they only measure O2
and assume that respiratory exchange ratio (RER) is equal to 0.85 (Hipskind, Glass, Charlton,
Nowak, & Dasarathy, 2011). In addition, the power supply limits the recording time to
approximately four hours (Brychta et al., 2010).
Measurements in a WBCU system work in a similar manner. They are designed as
airtight rooms that allow for all of the gases respired by a person to be captured (Levine,
2005). The room is ventilated with a constant or known gas composition to facilitate accurate
measurements, using paramagnetic analyzers to analyze O2 concentrations, infrared analyzers
to analyze CO2 concentrations and a mass spectrometer to measure the gas concentrations
(Levine, 2005). Energy expenditure is calculated from the net flow rate of O2, CO2 and
respiratory gas exchange within the room (Eknoyan, 1999). Open-circuit IC systems provide
measurements of all components of the energy metabolism, such as REE, DIT and activity
energy expenditure (AEE) (Brychta et al., 2010). The open-circuit IC system consists of a
large comfortable room that interferes less often with typical physical activity, thus allowing
16
continuous measurements of TEE up to several days (Smith et al., 2000). Open-circuit IC
systems are considered the gold standard for measuring TEE and its components, owing to
their high accuracy and precision (<2% error) (Rising, Whyte, Albu, & Pi-Sunyer, 2015).
However, there are still several challenges to achieve accurate measurements of human
metabolism using open-circuit IC systems. First, only a few institutions in the world have
access to an open-circuit IC system; therefore, the large majority of researchers do not have
access to this state-of-the-art technique due to the high cost and skills required for operation
(Brychta et al., 2010). Given the strict conditions associated with its measurements, such as
fasting and remaining at rest during measurements, accommodating children under the age of
eight years is difficult (Brychta et al., 2010). Studies have reported that children become
restless during the measurement period; therefore, the use of shorter protocols has been
suggested to decrease fidgeting and boredom (Compher, Frankenfield, Keim, & Roth-
Yousey, 2006; Ventham & Reilly, 1999).
All studies found lower REE or BEE (kcal/day) in PWS compared to controls,
ranging from 3 to 37%. Differences in the magnitude of reduction may be related to the
varied methods of measuring REE compared to BEE (which is measured under standard
conditions), length of the measurement and/or the characteristics of the control group to
which it was compared.
Two studies used the IC hood system to determine REE. Hill et al. (1990) measured
REE for 15 to 20 minutes in PWS children/adolescents (1104 kcal/day), and found REE was
37% lower compared to individuals with obesity (1752 kcal/day) and 20% lower compared to
healthy weight individuals (1392 kcal/day, p < 0.05). Davies and Joughin (1993) also
assessed REE for 20 minutes and reported an 18% difference between PWS
children/adolescents (1324 ± 408 kcal/day) and age- and weight-matched individuals (1615 ±
376 kcal/day, p < 0.05). However, studies measuring REE using IC hood systems in adults
reported different findings. Lloret-Linares et al. (2013) measured REE in adults with PWS
compared to lesional genetic hypothalamic obesity (HO) and healthy individuals with
obesity. Measured REE in PWS women (1758 ± 360) was comparable to that seen in HO and
BMI-matched control individuals; however, REE in PWS men (1946 ± 428 kcal/day) was
reported to be 19% lower compared to BMI-matched individuals (2405 ± 423 kcal/day, p <
0.05), yet similar to the HO group (Lloret-Linares et al., 2013). PWS had 25% lower lean
mass compared to BMI-matched individuals, but comparable to the HO group. Purtel et al.
(2015) measured REE for 30 minutes in adults with PWS compared to individuals with
obesity and healthy-weight and also reported that REE was comparable to age-matched
17
individuals. In contrast to studies that utilized an IC hood system, studies measuring REE
using a WBCU system reported a reduced REE in adults with PWS (Butler et al., 2007a;
Goldstone et al., 2002). Goldstone et al., (2002) measured REE and reported an 8% reduction
in REE in PWS individuals (1584 ± 108 kcal/day) compared to BMI-matched individuals
(1716 ± 69 kcal/day p < 0.01). Butler et al. (2007a) reported a 16% lower REE in PWS
individuals (2074 ± 360 kcal/day), compared to age-matched individuals (2448 ± 475
kcal/day, p < 0.05). It is important to highlight that Butler et al. (2007a) measured REE while
participants were seated (due to feasibility issues for PWS patients). Therefore, this approach
may have incorrectly elevated the reported readings since standardized REE protocols require
the patient to be supine, with minimal body motion, and to remain awake during testing. It is
also not clear if this adapted seated REE protocol was applied to individuals without PWS as
well. Finally, differences in REE might exist between children with PWS as compared to
adults with the syndrome. Two studies have assessed BEE using an IC hood system. One
study by van Mill et al. (2000a) measured BEE using an IC hood system. They reported
results for only 10 minutes of measurement, and concluded that BEE was reduced by up to
16% in PWS children/adolescents (1280 ± 282 kcal/day) compared to age-, sex- and BMI-
matched controls (1524 ± 370 kcal/day, p < 0.05). Another study conducted by Schoeller et
al. (1988) measured BEE in PWS and found that measured BEE values in PWS
adolescence/adults (1160 ± 95 kcal/day) were 3 to 12% lower than values obtained from
various predictive equations: Harris-Benedict (1310 ± 82 kcal/day); Passmore (1400 ± 120
kcal/day); and Cunningham (1200 ± 78 kcal/day, p < 0.05). However, Schoeller et al. (1988)
did not compare measured BEE in PWS individuals to matched controls.
2.4.3 Sleeping Energy Expenditure (SEE)
Excessive sleepiness, daytime hypersomnolence and sleep apnea (both central and
obstructive) have been reported in individuals with PWS (Camfferman, McEvoy,
O'Donoghue, & Lushington, 2008; Gillett & Perez, 2016; Weselake et al., 2014), possibly
leading to alterations in sleeping metabolic rate (SMR). Only one study has measured SEE in
PWS using WBCU. Van Mil et al. (2000b) reported that SEE was significantly lower in
individuals with PWS than in controls (1103 ± 257 kcal/day vs. 1337 ± 63 kcal/day, p <
0.05). This finding is in agreement with TEE and REE findings, which are reported to be
lower in PWS compared to their counterparts. In summary, absolute values of REE, BEE and
SEE were found to be lower in PWS individuals when PWS was compared to obese
individuals. This finding might be explained by their abnormal body composition (reduction

18
in FFM), which could impact energy expenditure values. Appropriately adjusting for
variability in FFM between PWS and controls, and the impact this adjustment has on the
inferences drawn from these studies is discussed in detail in section 2.6 Contribution of
Body Composition to Lower Energy Expenditure
2.4.4 Activity Energy Expenditure (AEE)
Four studies measured AEE in individuals with PWS and all reported a lower AEE
(13–66%) in PWS compared to controls. Three of these studies assess TEE in “free-living”
conditions using DLW and derived AEE. Van Mil et al. (van Mil, Westerterp, Kester, et al.,
2000) estimated AEE by subtracting BEE and DIT from TEE; Davies and Joughin (1993)
estimated AEE by dividing TEE by REE; and Schoeller et al. (1988) estimated AEE based on
a predictive equation that included FFM based on Ravussin et al. (1986) methods, with daily
energy expenditure calculated as (667 + 20.5 FFM). The greatest difference in AEE was
reported by Schoeller et al. (1988). In individuals with PWS, AEE (650 ± 310 kcal/day) was
66% less than AEE measured in age- and sex-matched controls (1940 ± 640 kcal/day, p <
0.05). A similar difference of 58% in AEE was reported by van Mil et al. (van Mil,
Westerterp, Kester, et al., 2000). AEE was reported to be (256 ± 165 kcal/day) in individuals
with PWS compared to age-, sex- and BMI-matched controls (611 ± 246 kcal/day, p <
0.001). Furthermore, Davies and Joughin (1993) reported daily activity to be 13% lower in
individuals with PWS compared to age- and weight- matched individuals, p < 0.05. Physical
activity levels were reported to be lower (1.33 ± 0.21) in individuals with PWS compared to
age- and weight-matched individuals (1.53 ± 0.23, p < 0.05). The data for AEE was not given
and estimated based on total mean given for TEE and REE. The estimated AEE was found to
be lower (526 kcal/day) in individuals with PWS compared to age- and weight-matched
individuals (859 kcal/day).
Only one study measured AEE directly using a whole-body calorimetry unit (Butler et
al., 2007a); the energy expended during physical activity during the eight hours was 38%
lower in individuals with PWS (1.9 ± 0.61 vs 3 ± 0.99 kcal/minute, p < 0.001). Also, standing
energy expenditure was reported to be lower in PWS (1.5 ± 0.3 kcal/minute) compared to
age-matched subjects (1.8 ± 0.4 kcal/minute), p < 0.001. In summary, the literature to date
suggests that adults and children with PWS tend to have lower absolute AEE. Again, these
differences may be explained by muscle hypotonia and lower skeletal muscle mass, leading
to lower values of FFM (Butler et al., 2007a).
19
2.4.5 Diet-Induced Thermogenesis (DIT)
Only one study has investigated DIT in 11 adults with PWS were compared with 12
individuals with BMI matched and 10 with healthy-weight. Purtell et al. (2015) found no
difference in DIT between PWS and control groups after consumption of a breakfast meal
high in carbohydrates and fat (600 kcal, 50% carbohydrates, 35% fat, 15% protein). As
examination of DIT was not the primary objective of the aforementioned study, details
concerning the measurement protocol for DIT were not reported. Therefore, it is unclear how
these differences were assessed, and whether or not baseline adjustments for body
composition were made.
Exploring the impact of DIT on PWS is important because dietary macronutrient
manipulation may have an impact on energy metabolism in PWS. It is well known that meals
of similar energy content but different macronutrient composition will impact DIT, which
could influence the overall estimates of TEE. Protein has the greatest impact on DIT in both
normal-weight and obese cohorts (Baum et al., 2015; Maffeis et al., 2001).
Studies have now demonstrated that higher-protein diets are able to increase satiety
hormones, decrease hunger and increase DIT, and thereby promote maintenance of FFM in
the setting of low energy intake (Nguo et al., 2019; Westerterp-Plantenga, Nieuwenhuizen,
Tome, Soenen, & Westerterp, 2009) (Austin, Ogden, & Hill, 2011; Buchholz & Schoeller,
2004; Gosby, Conigrave, Raubenheimer, & Simpson, 2014; Pesta & Samuel, 2014; Quatela,
Callister, Patterson, & MacDonald-Wicks, 2016; Simpson & Raubenheimer, 2005). We
speculate that DIT is lower in individuals with PWS, which also contributes to their lower
REE. The hierarchy of macronutrients with respect to their impact on DIT is protein, then
carbohydrates, and, lastly, fat. It has been documented that protein plays an important role in
body weight regulation through satiety related to DIT (Westerterp, 2004a). In conclusion,
macronutrient composition should be taken into consideration when estimating the energy
needs of individuals with PWS. Although DIT contributes to only 5 to 15% of daily energy
expenditure, alterations in DIT could translate into energy imbalance, leading to significant
excessive weight gain over the longer term. Future research should clarify additional means
to favourably manipulate DIT to improve overall energy balance.
2.5 Methodological Considerations in the Measurement of DIT
2.5.1 Measurement Protocol
The measurement of DIT is performed in three steps: 1) a baseline measure of energy
expenditure (resting energy expenditure; REE), measured during fasting state, 2) the
20
ingestion of a test meal, and 3) measurement of postprandial energy expenditure rate for
several hours after the meal (Dabbech, Aubert, Apfelbaum, & Boulier, 1994; Weststrate,
1993). DIT is then calculated as postprandial EE minus fasting EE, and can be further
expressed as a percentage of meal energy content (Houde-Nadeau, de Jonge, & Garrel, 1993;
Nguo, Huggins, Truby, Brown, & Bonham, 2018; Piers, Soares, Makan, & Shetty, 1992;
Westerterp, 2004a). Measurements of REE and DIT are generally performed using IC with a
mouthpiece or mask, a ventilated hood, or a WBCU system (Brychta et al., 2010; Granata &
Brandon, 2002).
Energy expenditure can be estimated from predictive equations or it can be measured
using calorimetry (Brychta et al., 2010). Calorimetry is an approach to directly and indirectly
measure EE (Gupta et al., 2017; Scott, 2005). Direct calorimetry measures changes in body
temperature (heat production) (Jequier, 1986), whereas IC estimates heat production by
measuring the amount of O2 uptake and CO2 production by the body (Gupta et al., 2017;
Scott, 2005). However, despite being accurate, the application of direct calorimeter methods
remains scant because this technique is both expensive and difficult to obtain due to the strict
experimental conditions required for accurate results (Brychta et al., 2010; Levine, 2005).
Indirect calorimetry techniques have been proven a more accessible and cost-efficient
alternative (Brychta et al., 2010; Levine, 2005).
Protein, carbohydrates and fat produce different amount of CO2 in relation to their
required O2 consumption during their oxidative process, and the total CO2 produced in
relation to the O2 consumed is termed the RER (Albouaini, Egred, Alahmar, & Wright, 2007;
Gupta et al., 2017). During carbohydrate oxidation, CO2 produced equals O2 consumed,
resulting in a RER value of 1.0. During the oxidization of pure fat, less CO2 is produced for a
given amount of O2 consumed, leading to RER being reduced to 0.7. The RER for a mixed
diet, proteins and alcohol are approximately 0.85, 0.82 and 0.67, respectively (McClave et al.,
2003).
The majority of studies examined differences in DIT using indirect calorimetry via a
hood canopy system (Nguo et al., 2018; Reed & Hill, 1996) or via a WBCU system (Acheson
et al., 2011; Kassis et al., 2019). In some of the ventilated hood systems studies, DIT
measurements are 30 minutes, with 30 minutes intervals allowing for sanitary activities
(Nguo et al., 2018). Studies using a WBCU to measure DIT generally average the DIT
response from a number of meals provided over periods often up to and exceeding 24 hours.
Studies that measured DIT using a ventilated hood system reported shorter
measurements of DIT showed a higher early peak of DIT in healthy weight adults compared
21
to adults with obesity following a meal that contained 15% of total energy from protein,
suggesting that a measurement lasting an additional 2 hours may wipe out that difference;
therefore, they recommended that measurements last ≥ 5 hours (Reed & Hill, 1996). Another
study of adolescents with obesity and healthy weight measured DIT for 4 hours after high-
protein (whey) (55% protein, 30% carbohydrate and 15% fat) or high-carbohydrate
(maltodextrin) (79% carbohydrate, 5% protein, and 16% fat) liquid meals (Nguo et al., 2018).
They reported no differences in DIT between adolescents with obesity and healthy weight;
however, DIT was significantly greater after the high protein compared with the high-
carbohydrates meal (p < 0.001) (Nguo et al., 2018).
Among the studies that measured DIT using WBCU systems, Acheson et al. (2011)
measured DIT for 5.5 hours to determine the differential effects of three protein sources in
healthy weight adults. Three meals consisting of 50% protein (whey, casein or soy), 40%
carbohydrates and 10% fat were compared to a meal consisting of 95.5% carbohydrates.
They reported that the DIT effect was greater after the whey than after the casein or soy
meals and was greater after the whey, casein and soy meals than after the high-carbohydrates
meal (Acheson et al., 2011). More recently, Kassis et al. (2019) aimed to evaluate the
efficacy of two different doses and types of protein 30 g of whey protein, 50 g of whey or 50
g of casein where protein and carbohydrates were exchanged on DIT for 7 hours in
overweight adults. They reported that the 50 g of whey protein resulted in greater DIT than
30 g of whey protein and 50 g of casein (Kassis et al., 2019).
The variation in methodological approaches for measuring DIT may explain the
conflicting findings between studies. Even within studies, thermogenic responses to meals are
highly variable between individuals and subgroups of populations. For example, differences
in the thermogenic response of healthy weight adults compared to adults with obesity are
commonly reported (Reed & Hill, 1996). In contrast, Nguo et al. (2018) did not find a
significant difference in DIT between adolescents with obesity and healthy weight, but found
that a high-protein meal has a greater effect on DIT than a carbohydrate meal. The latter
observation is consistent with Acheson et al. (2011) and Kassis et al. (2019) findings, both of
which found that both the protein source (e.g., whey protein) and the dose affected DIT
response. In summary, the DIT response is highly variable, depending on meal composition
and duration of measurement as well as variation between people.
2.5.2 Duration of the DIT Measurement
The majority of studies measured DIT response between 3 and 6 hours (D'Alessio et
al., 1988; Davies et al., 1989; Katzeff & Danforth, 1989; Schutz, Golay, Felber, & Jequier,
22
1984; Tentolouris et al., 2008; Welle & Campbell, 1983). However, the total DIT response
may take between 8 to 10 hours for complete digestion (D'Alessio et al., 1988; Melanson,
Saltzman, Vinken, Russell, & Roberts, 1998). The duration of the DIT response may be
affected by individual differences in the rate of gastric emptying, nutrient digestion and
storage, meal size and macronutrients distribution of test meal (Scott, Fernandes, & Lehman,
2007). However, given that the long duration of measurement can be burdensome to
participants, Ruddick-Collins et al. (2013) sought to determine whether shorter measures of
DIT correlate with the total DIT response, and reported that the three-hour measures provide
sufficient information about the magnitude of the DIT response and may be applicable for
testing individuals’ response.
2.5.3 Minimizing Variability Arising from Movement in Children during the DIT
Measurements
The DIT measurement requires participants to remain still in the same position
throughout the duration of the pre-meal REE and DIT (Dietz, Bandini, Morelli, Peers, &
Ching, 1994; Weststrate, Van der Kooy, Deurenberg, & Hautvast, 1990). The measurements
of DIT assume that postprandial REE over the baseline REE remains constant throughout the
entire duration of its measurement. However, movement and activities during the REE and
DIT measurement could influence the overall measurements and result in incorrectly higher
or lower REE or DIT. Therefore, the majority of studies that assess DIT allowed their
participants to watch movies, listen to music, play games or read books (den Besten, Vansant,
Weststrate, & Deurenberg, 1988; Scott & Devore, 2005; Vasilaras, Raben, & Astrup, 2001).
Weststrate et al. (1990) reported a significant increase in DIT measurements after
watching a horror movie compared to a romance, which indicated that stress can increase
energy expenditure and cause a falsely elevated DIT. Koepp et al. (2016) compared energy
expenditure using an under-the-table leg-fidget bar or a fidget-promoting chair, compared to
the standard office chair. They found that energy expenditure increased by ~20 to 30% using
chairs and devices that promote fidgeting (Koepp, Moore, & Levine, 2016). Another study
measured REE in children as they watched television, read or sat quietly for 15 minutes
(Dietz et al., 1994). Movement was assessed using activity monitors, and a manual count of
movements was observed on videotape. The researchers found that children were fidgeted
more when sitting quietly than when they read or watched television, which suggests that
television viewing does not alter REE (Dietz et al., 1994).
23
These findings highlight that the possibility that an individual’s level of fidgeting and
his or her postural position may affect energy expenditure measurements, which could
produce discrepancies in the energy expenditure measurements between days and throughout
the baseline REE and DIT measurements. An increase in baseline REE may unfavourably
influence DIT response, making it appear lower; fidgeting during postprandial REE
measurement, on the other hand, may falsely increase DIT measurement. Therefore, it is
important to control participants’ activities, reduce fidgeting, facilitate a calm emotional state,
and have them maintain a consistent sitting position during the baseline REE and DIT
measurements and between days to minimize variability.
2.6 Contribution of Body Composition to Lower Energy Expenditure
A unique altered body composition consisting of higher fat mass (FM) and a lower
FFM for body weight is described in PWS infants, even before hyperphagia manifests (Bekx
et al., 2003a). This suggests a possible genetic or developmental origin to the altered body
composition phenotype documented in PWS. As mentioned previously, a major determinant
of energy expenditure is body composition, specifically, the metabolically active tissues that
make up the FFM compartment. The amount of FFM (kg) can vary considerably between
PWS, obese and non-obese individuals (Bedogni, Grugni, Tringali, Agosti, & Sartorio, 2015).
Overall, PWS individuals tend to have lower FFM. Therefore, the absolute value of REE
tends to be lower in PWS individuals due to their reduced FFM; however, once FFM is taken
into consideration, these differences between PWS and controls mainly disappear (Bekx et
al., 2003a; Davies & Joughin, 1993; Hill et al., 1990; Lloret-Linares et al., 2013; Purtell et al.,
2015; Schoeller et al., 1988; van Mil, Westerterp, Kester, et al., 2000; van Mil, Westerterp,
Gerver, et al., 2000), which suggests that there might not be a major disruption to energy
metabolism at a cellular level in PWS.
In most studies included in this review, the adjustment method was performed by
simply dividing REE/BEE by FFM. However, this method is not optimal, since FFM
includes bone, skeletal mass and highly metabolically active organs such as the brain, heart,
liver, kidney and gastrointestinal tract (Carneiro et al., 2016; Heymsfield et al., 2002). When
body weight instead of FFM is used to calculate BEE and SEE, these remained significantly
lower in PWS compared to age, sex and BMI (Colditz, 2010). However, the use of body
weight for adjustment might not be ideal due to unique differences in body composition in
PWS (Orsso et al., 2017). Finally, Butler et al. (2007a) (Butler et al., 2007a) reported that
REE remained significantly (p < 0.001) lower when adjusting for FM between the two
24
groups. The justification for expressing energy expenditure data adjusted for FM is
questionable and the authors offer no rationale for choice of their adjustment methods.
Additionally, a major limitation of the above study is that PWS individuals were not
compared to a BMI-matched group.
Instead, it has been suggested that the adjustment of energy expenditure for FFM
should be carried out by calculating residuals from regression models, including other
covariates (sex, age, FM, height) as described by Carneiro et al. (2016). Such an adjustment
method using multiple liner regression analysis was employed in the study by Goldstone et
al. (2002), which reported REE to be lower in PWS individuals in comparison to normal
weight and BMI-matched individuals, after adjustment for FFM and age; REE was higher
after adjustment for age and FFM. These findings highlight the importance of correctly
accounting for differences in FFM when comparing groups with different body composition,
because, without proper adjustment, results may be misinterpreted. Another study conducted
by Hill et al. (1990) using multiple linear regression analysis reported no difference in REE
adjusted for FFM in PWS compared to controls. A limitation of this study was the use of
bioelectrical impedance analysis (BIA) to measure FFM. BIA assesses total body water and
then estimates FFM and fat mass using algorithms. These algorithms may not be suitable for
use in subjects with PWS since they have not been validated in this clinical population.
Additionally, BIA assumes a constant FFM hydration factor (Deurenberg, 1996), which
varies considerably with age and clinical condition (Wang et al., 1999). Specifically, as body
composition is altered in individuals with PWS, alterations in body water distribution (van
Mil et al., 2001), the underlying assumptions the BIA technique relies upon, may be violated.
This would result in an overestimation of the amount of FFM and an underestimation of fat
mass in PWS (Bedogni et al., 2015; Deurenberg, 1996). Therefore, REE may be
overestimated in PWS, which would lead to the erroneous conclusion that obese individuals
have a lower REE than PWS individuals due to the inadequate normalization for FFM.
It is important to highlight the importance of the use of adequate body composition
tools in PWS to better account for FFM in analysis. The use of total body potassium (TBK) to
estimated whole-body cell mass/metabolically active tissue (Wang et al., 2007) has not yet
been utilized to examine body composition in PWS, but this would provide a more accurate
measure of metabolically active lean tissue, without the adverse impact of potential hydration
changes.
25
Overall, these studies suggest that PWS individuals have lower absolute REE than
obese individuals due to their lower FFM. Efforts to increase FFM in PWS may therefore be
an effective strategy to increase overall EE in PWS individuals.
2.7 Contribution of Endocrine Dysfunction to Lower Energy Expenditure
The hormonal abnormalities observed in PWS, such as growth hormone (GH), and
thyroid-stimulating hormone (TSH) deficiencies, and testosterone insufficiency, would
contribute to lower EE due to their effects on FFM (Aycan & Bas, 2014). The altered body
composition (e.g., lower FFM values) observed in individuals with PWS has been a point of
interest for clinicians and has resulted in the increased use of GH therapy and thyroid and
testosterone supplementation (Haqq, Stadler, Jackson, et al., 2003; Kido et al., 2013). Growth
hormone treatment during childhood and in adults with PWS has been shown to increase
FFM (Carrel et al., 2004; Haqq, Stadler, Jackson, et al., 2003; Hoybye, 2004). In addition,
testosterone supplementation in adults with PWS has been shown to increase the amount of
FFM (Kido et al., 2013). The resultant increased FFM likely increases energy expenditure
and may help individuals with PWS obtain and maintain a healthy body weight. GH has
potent protein anabolic and lipid and carbohydrates metabolic effects. In general, GH
stimulates lipolysis, hyperinsulinemia, and stimulation of insulin-like growth factor 1
activity. This results in potent protein anabolic effects, increased amino acid uptake,
increased protein synthesis, and decreased protein oxidation (Moller et al., 1995). Finally,
controlled studies have reported significant increases in REE with the use of GH in PWS
(Haqq, Stadler, Jackson, et al., 2003). Of the previous studies reviewed, only two reported the
use of GH (Bekx et al., 2003a; Lloret-Linares et al., 2013) in the assessed subjects with PWS.
Lloret-Linares et al. (2013) reported that 22% of individuals (6 out of 27 subjects) with PWS
were receiving GH therapy. Bekx et al. (2003b) reported that 87.5% of individuals (14 out of
16 subjects) with PWS were receiving GH treatment. The use of GH in the remainder of the
examined studies is unknown due to a lack of reporting. Additionally, details as to whether
GH status was considered as a covariate in the final analysis are unknown, which may also
explain the inconsistent findings between studies.
2.8 Summary and Gaps in Understanding of Energy Expenditure in PWS
From the literature to date, the findings suggest that PWS individuals have lower
absolute energy expenditure than age-, sex-, and BMI-matched controls as a consequence of
reduced REE, SEE and AEE; these differences may be secondary to altered body
26
composition and hormone dysfunction. However, due to the paucity of information on DIT in
individuals with PWS, the relative contribution of specific components of TEE to the altered
metabolism in PWS is not clear. Once body composition is taken into consideration, many
differences disappear, which suggests that there might, in fact, be no overall disturbance in
whole-body energy metabolism.
However, these results should be interpreted with caution because of the inherent
limitations in the use of adjustment methods and the discrepancies in the methods used to
measure body composition in PWS. Additionally, DIT needs to be assessed in individuals
with PWS and compared with individuals with non-syndromic obesity, whereas differences
in energy expenditure estimates according to genetic subtype and impact of hormonal
therapies need further study. The mechanism of action for the significant overall reduction in
energy expenditure in individuals with PWS is likely multifactorial. Approximately one-third
of children with PWS have hypothyroidism due to hypothalamic-pituitary dysfunction,
resulting in low or low-normal concentrations of thyroid-stimulating hormone and low
concentrations of total or free thyroxine. Therefore, central hypothyroidism may play a role
in the reduced energy expenditure demonstrated in children with PWS (Emerick & Vogt,
2013). A PWS mouse model [mice lacking MAGE-like 2 (Magel2)] demonstrated normal
leptin sensitivity in proopiomelanocortin neurons into the early post-weaning period;
however, thereafter, the mice demonstrated progressive leptin insensitivity, which is
predicted to impair the release of the melanocortin receptor agonist a-melanocyte stimulating
hormone, with downstream effects to reduce energy expenditure (Pravdivyi, Ballanyi,
Colmers, & Wevrick, 2015). It is speculated that a similar reduction in leptin responsiveness
occurs over time in children with PWS; this would account for a reduction in energy
expenditure in individuals with PWS, which would worsen with aging. Previous research has
examined whether individuals with PWS exhibit reduced fat oxidation. One study by Purtell
et al. (2015) did not detect metabolic defect in respiratory quotient or fat oxidation in
individuals with PWS after a mixed high-carbohydrates and high-fat meal. However, Rubin
et al. (2017) examined the effect of PWS on the hormonal and metabolic response to
resistance exercise; individuals with PWS demonstrated earlier increases in fatty acids during
recovery and exhibited higher glycerol and ketone concentrations than controls, suggesting
incomplete fat oxidation (Rubin et al., 2017). Previous longitudinal studies in Pima Indians
report that low fat oxidizers (90th percentile for respiratory quotient) had a 2.5 times greater
risk of gaining 5 kg of body weight than high fat oxidizers (Zurlo et al., 1990). Furthermore,
those successful at maintaining weight loss tend to have higher fat oxidation rates than those
27
experiencing weight relapse (Froidevaux, Schutz, Christin, & Jequier, 1993). Thus, lower fat
oxidation in individuals with PWS might also contribute to the imbalance between intake and
energy expenditure. Finally, lower spontaneous physical activity and sympathetic activity
have been reported in individuals with PWS (Butler et al., 2007a; Rubin et al., 2017).
Children with PWS demonstrated no exercise-induced increase in catecholamines and a 40%
lower heart rate elevation in response to exercise compared with controls. These findings
suggest a sympathetic autonomic deficit in PWS (Castner, Rubin, Judelson, & Haqq, 2013;
DiMario, Dunham, Burleson, Moskovitz, & Cassidy, 1994; Richer et al., 2011).
In summary, altered endocrine function (thyroid and leptin deficits) and lower fat
oxidation, sympathetic activity and spontaneous physical activity are multiple factors that
might play an etiologic role in the reduction in energy expenditure that is characteristic of
individuals with PWS. Further longitudinal studies are required to determine if this defect in
EE progressively worsens with age. Finally, it is important to highlight that although no
metabolic differences have been documented to date, accurate assessments of FM and FFM
could certainly affect the calculation of energy requirements for those with PWS compared
with healthy controls. Currently, energy requirements are based on predictive equations used
to assess REE. These equations incorporate the use of body weight and assume a “healthy or
reference” body composition, which is problematic in this clinical cohort in which
disturbances in body composition have been clearly documented (Orsso et al., 2017). The
abnormal body composition in individuals with PWS (characterized by reduced FFM and
increased FM) would lower EE and thus lower energy requirements compared with healthy
individuals. Thus, assessing body composition accurately with the use of a valid techniques
and determining energy requirements taking body composition into consideration are integral
parts of dietary management in individuals with PWS. Increasing FFM and maximizing
physical activity should be considered to increase energy expenditure in PWS.
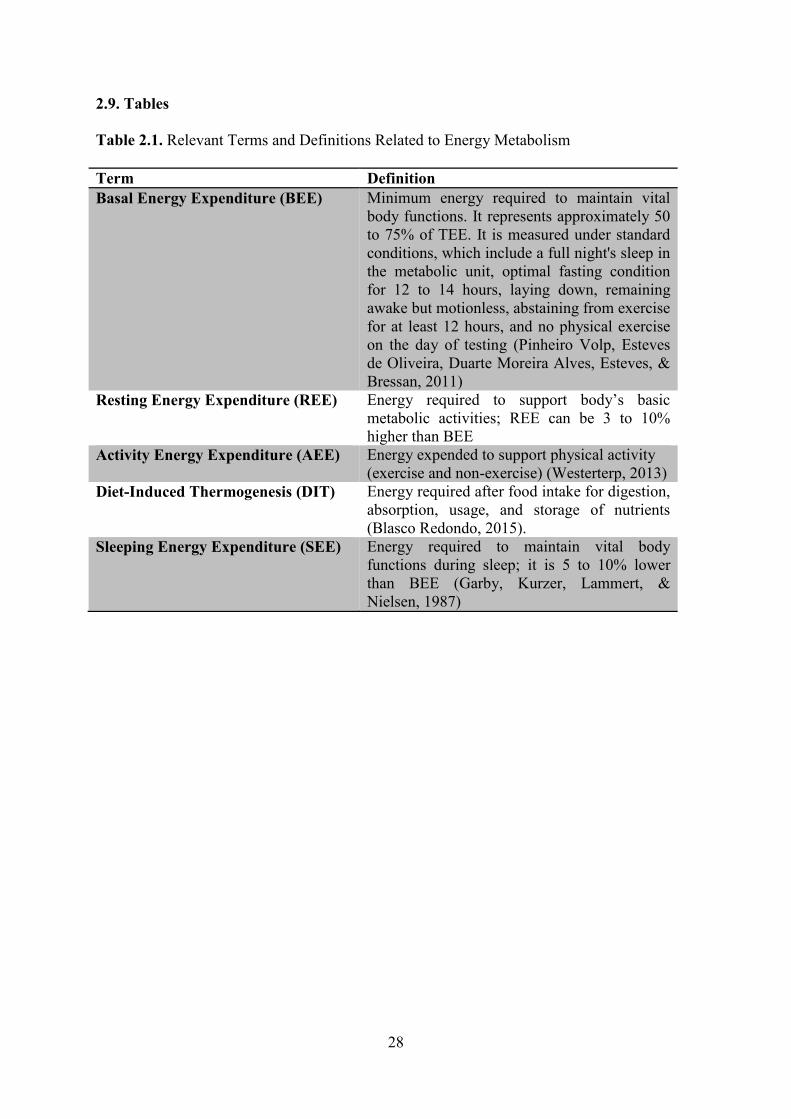
28
2.9. Tables
Table 2.1. Relevant Terms and Definitions Related to Energy Metabolism
Term Definition
Basal Energy Expenditure (BEE) Minimum energy required to maintain vital
body functions. It represents approximately 50
to 75% of TEE. It is measured under standard
conditions, which include a full night's sleep in
the metabolic unit, optimal fasting condition
for 12 to 14 hours, laying down, remaining
awake but motionless, abstaining from exercise
for at least 12 hours, and no physical exercise
on the day of testing (Pinheiro Volp, Esteves
de Oliveira, Duarte Moreira Alves, Esteves, &
Bressan, 2011)
Resting Energy Expenditure (REE) Energy required to support body’s basic
metabolic activities; REE can be 3 to 10%
higher than BEE
Activity Energy Expenditure (AEE) Energy expended to support physical activity
(exercise and non-exercise) (Westerterp, 2013)
Diet-Induced Thermogenesis (DIT) Energy required after food intake for digestion,
absorption, usage, and storage of nutrients
(Blasco Redondo, 2015).
Sleeping Energy Expenditure (SEE) Energy required to maintain vital body
functions during sleep; it is 5 to 10% lower
than BEE (Garby, Kurzer, Lammert, &
Nielsen, 1987)
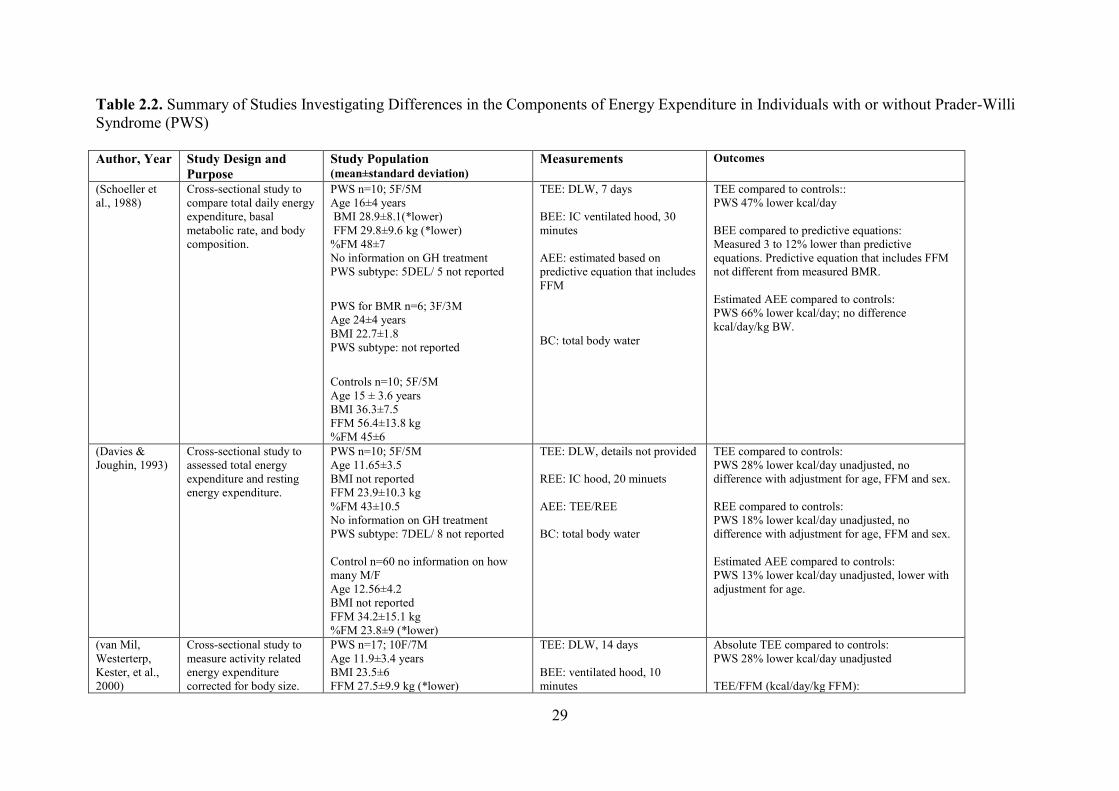
29
Table 2.2. Summary of Studies Investigating Differences in the Components of Energy Expenditure in Individuals with or without Prader-Willi
Syndrome (PWS)
Author, Year Study Design and
Purpose
Study Population (mean±standard deviation)
Measurements Outcomes
(Schoeller et
al., 1988)
Cross-sectional study to
compare total daily energy
expenditure, basal
metabolic rate, and body
composition.
PWS n=10; 5F/5M
Age 16±4 years
BMI 28.9±8.1(*lower)
FFM 29.8±9.6 kg (*lower)
%FM 48±7
No information on GH treatment
PWS subtype: 5DEL/ 5 not reported
PWS for BMR n=6; 3F/3M
Age 24±4 years
BMI 22.7±1.8
PWS subtype: not reported
Controls n=10; 5F/5M
Age 15 ± 3.6 years
BMI 36.3±7.5
FFM 56.4±13.8 kg
%FM 45±6
TEE: DLW, 7 days
BEE: IC ventilated hood, 30
minutes
AEE: estimated based on
predictive equation that includes
FFM
BC: total body water
TEE compared to controls::
PWS 47% lower kcal/day
BEE compared to predictive equations:
Measured 3 to 12% lower than predictive
equations. Predictive equation that includes FFM
not different from measured BMR.
Estimated AEE compared to controls:
PWS 66% lower kcal/day; no difference
kcal/day/kg BW.
(Davies &
Joughin, 1993)
Cross-sectional study to
assessed total energy
expenditure and resting
energy expenditure.
PWS n=10; 5F/5M
Age 11.65±3.5
BMI not reported
FFM 23.9±10.3 kg
%FM 43±10.5
No information on GH treatment
PWS subtype: 7DEL/ 8 not reported
Control n=60 no information on how
many M/F
Age 12.56±4.2
BMI not reported
FFM 34.2±15.1 kg
%FM 23.8±9 (*lower)
TEE: DLW, details not provided
REE: IC hood, 20 minuets
AEE: TEE/REE
BC: total body water
TEE compared to controls:
PWS 28% lower kcal/day unadjusted, no
difference with adjustment for age, FFM and sex.
REE compared to controls:
PWS 18% lower kcal/day unadjusted, no
difference with adjustment for age, FFM and sex.
Estimated AEE compared to controls:
PWS 13% lower kcal/day unadjusted, lower with
adjustment for age.
(van Mil,
Westerterp,
Kester, et al.,
2000)
Cross-sectional study to
measure activity related
energy expenditure
corrected for body size.
PWS n=17; 10F/7M
Age 11.9±3.4 years
BMI 23.5±6
FFM 27.5±9.9 kg (*lower)
TEE: DLW, 14 days
BEE: ventilated hood, 10
minutes
Absolute TEE compared to controls:
PWS 28% lower kcal/day unadjusted
TEE/FFM (kcal/day/kg FFM):
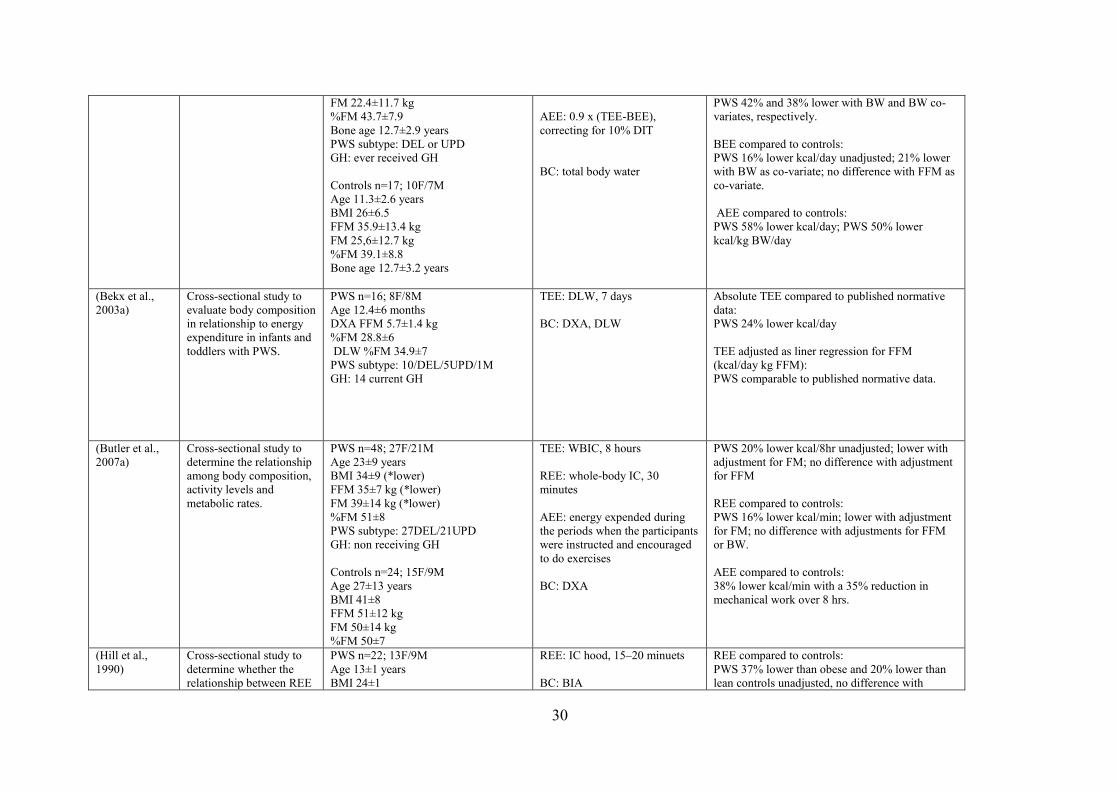
30
FM 22.4±11.7 kg
%FM 43.7±7.9
Bone age 12.7±2.9 years
PWS subtype: DEL or UPD
GH: ever received GH
Controls n=17; 10F/7M
Age 11.3±2.6 years
BMI 26±6.5
FFM 35.9±13.4 kg
FM 25,6±12.7 kg
%FM 39.1±8.8
Bone age 12.7±3.2 years
AEE: 0.9 x (TEE-BEE),
correcting for 10% DIT
BC: total body water
PWS 42% and 38% lower with BW and BW co-
variates, respectively.
BEE compared to controls:
PWS 16% lower kcal/day unadjusted; 21% lower
with BW as co-variate; no difference with FFM as
co-variate.
AEE compared to controls:
PWS 58% lower kcal/day; PWS 50% lower
kcal/kg BW/day
(Bekx et al.,
2003a)
Cross-sectional study to
evaluate body composition
in relationship to energy
expenditure in infants and
toddlers with PWS.
PWS n=16; 8F/8M
Age 12.4±6 months
DXA FFM 5.7±1.4 kg
%FM 28.8±6
DLW %FM 34.9±7
PWS subtype: 10/DEL/5UPD/1M
GH: 14 current GH
TEE: DLW, 7 days
BC: DXA, DLW
Absolute TEE compared to published normative
data:
PWS 24% lower kcal/day
TEE adjusted as liner regression for FFM
(kcal/day kg FFM):
PWS comparable to published normative data.
(Butler et al.,
2007a)
Cross-sectional study to
determine the relationship
among body composition,
activity levels and
metabolic rates.
PWS n=48; 27F/21M
Age 23±9 years
BMI 34±9 (*lower)
FFM 35±7 kg (*lower)
FM 39±14 kg (*lower)
%FM 51±8
PWS subtype: 27DEL/21UPD
GH: non receiving GH
Controls n=24; 15F/9M
Age 27±13 years
BMI 41±8
FFM 51±12 kg
FM 50±14 kg
%FM 50±7
TEE: WBIC, 8 hours
REE: whole-body IC, 30
minutes
AEE: energy expended during
the periods when the participants
were instructed and encouraged
to do exercises
BC: DXA
PWS 20% lower kcal/8hr unadjusted; lower with
adjustment for FM; no difference with adjustment
for FFM
REE compared to controls:
PWS 16% lower kcal/min; lower with adjustment
for FM; no difference with adjustments for FFM
or BW.
AEE compared to controls:
38% lower kcal/min with a 35% reduction in
mechanical work over 8 hrs.
(Hill et al.,
1990)
Cross-sectional study to
determine whether the
relationship between REE
PWS n=22; 13F/9M
Age 13±1 years
BMI 24±1
REE: IC hood, 15–20 minuets
BC: BIA
REE compared to controls:
PWS 37% lower than obese and 20% lower than
lean controls unadjusted, no difference with
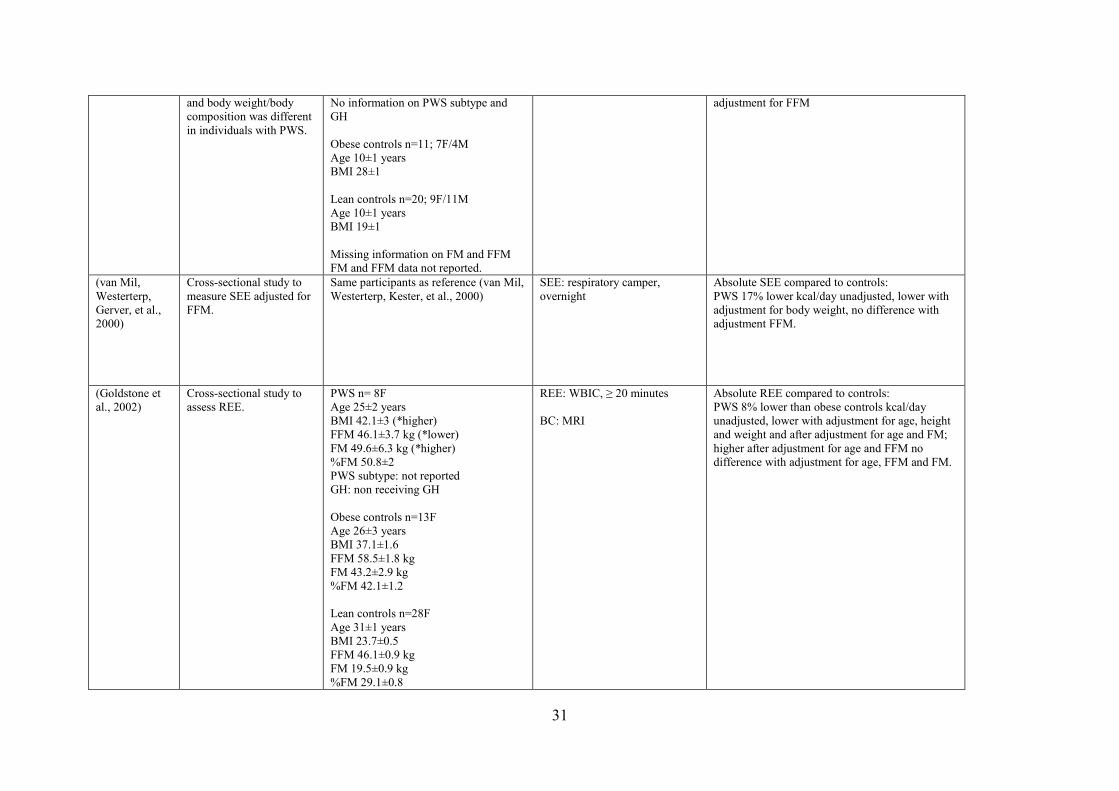
31
and body weight/body
composition was different
in individuals with PWS.
No information on PWS subtype and
GH
Obese controls n=11; 7F/4M
Age 10±1 years
BMI 28±1
Lean controls n=20; 9F/11M
Age 10±1 years
BMI 19±1
Missing information on FM and FFM
FM and FFM data not reported.
adjustment for FFM
(van Mil,
Westerterp,
Gerver, et al.,
2000)
Cross-sectional study to
measure SEE adjusted for
FFM.
Same participants as reference (van Mil,
Westerterp, Kester, et al., 2000)
SEE: respiratory camper,
overnight
Absolute SEE compared to controls:
PWS 17% lower kcal/day unadjusted, lower with
adjustment for body weight, no difference with
adjustment FFM.
(Goldstone et
al., 2002)
Cross-sectional study to
assess REE.
PWS n= 8F
Age 25±2 years
BMI 42.1±3 (*higher)
FFM 46.1±3.7 kg (*lower)
FM 49.6±6.3 kg (*higher)
%FM 50.8±2
PWS subtype: not reported
GH: non receiving GH
Obese controls n=13F
Age 26±3 years
BMI 37.1±1.6
FFM 58.5±1.8 kg
FM 43.2±2.9 kg
%FM 42.1±1.2
Lean controls n=28F
Age 31±1 years
BMI 23.7±0.5
FFM 46.1±0.9 kg
FM 19.5±0.9 kg
%FM 29.1±0.8
REE: WBIC, ≥ 20 minutes
BC: MRI
Absolute REE compared to controls:
PWS 8% lower than obese controls kcal/day
unadjusted, lower with adjustment for age, height
and weight and after adjustment for age and FM;
higher after adjustment for age and FFM no
difference with adjustment for age, FFM and FM.
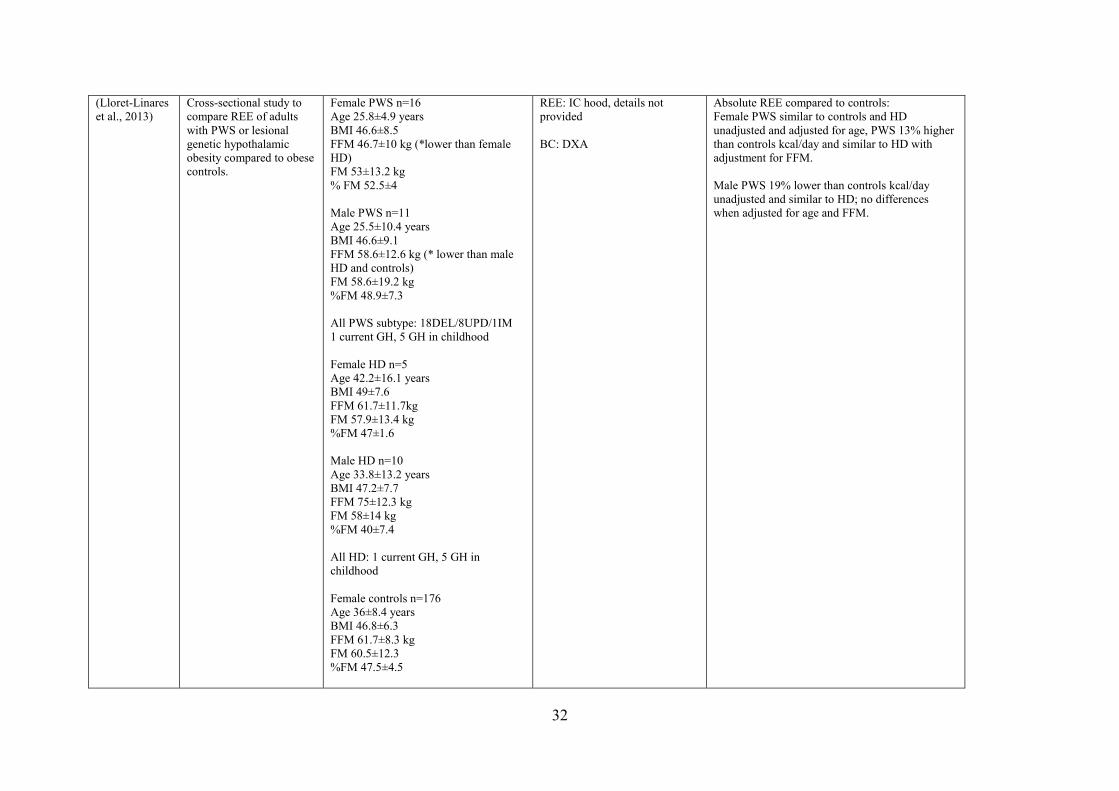
32
(Lloret-Linares
et al., 2013)
Cross-sectional study to
compare REE of adults
with PWS or lesional
genetic hypothalamic
obesity compared to obese
controls.
Female PWS n=16
Age 25.8±4.9 years
BMI 46.6±8.5
FFM 46.7±10 kg (*lower than female
HD)
FM 53±13.2 kg
% FM 52.5±4
Male PWS n=11
Age 25.5±10.4 years
BMI 46.6±9.1
FFM 58.6±12.6 kg (* lower than male
HD and controls)
FM 58.6±19.2 kg
%FM 48.9±7.3
All PWS subtype: 18DEL/8UPD/1IM
1 current GH, 5 GH in childhood
Female HD n=5
Age 42.2±16.1 years
BMI 49±7.6
FFM 61.7±11.7kg
FM 57.9±13.4 kg
%FM 47±1.6
Male HD n=10
Age 33.8±13.2 years
BMI 47.2±7.7
FFM 75±12.3 kg
FM 58±14 kg
%FM 40±7.4
All HD: 1 current GH, 5 GH in
childhood
Female controls n=176
Age 36±8.4 years
BMI 46.8±6.3
FFM 61.7±8.3 kg
FM 60.5±12.3
%FM 47.5±4.5
REE: IC hood, details not
provided
BC: DXA
Absolute REE compared to controls:
Female PWS similar to controls and HD
unadjusted and adjusted for age, PWS 13% higher
than controls kcal/day and similar to HD with
adjustment for FFM.
Male PWS 19% lower than controls kcal/day
unadjusted and similar to HD; no differences
when adjusted for age and FFM.
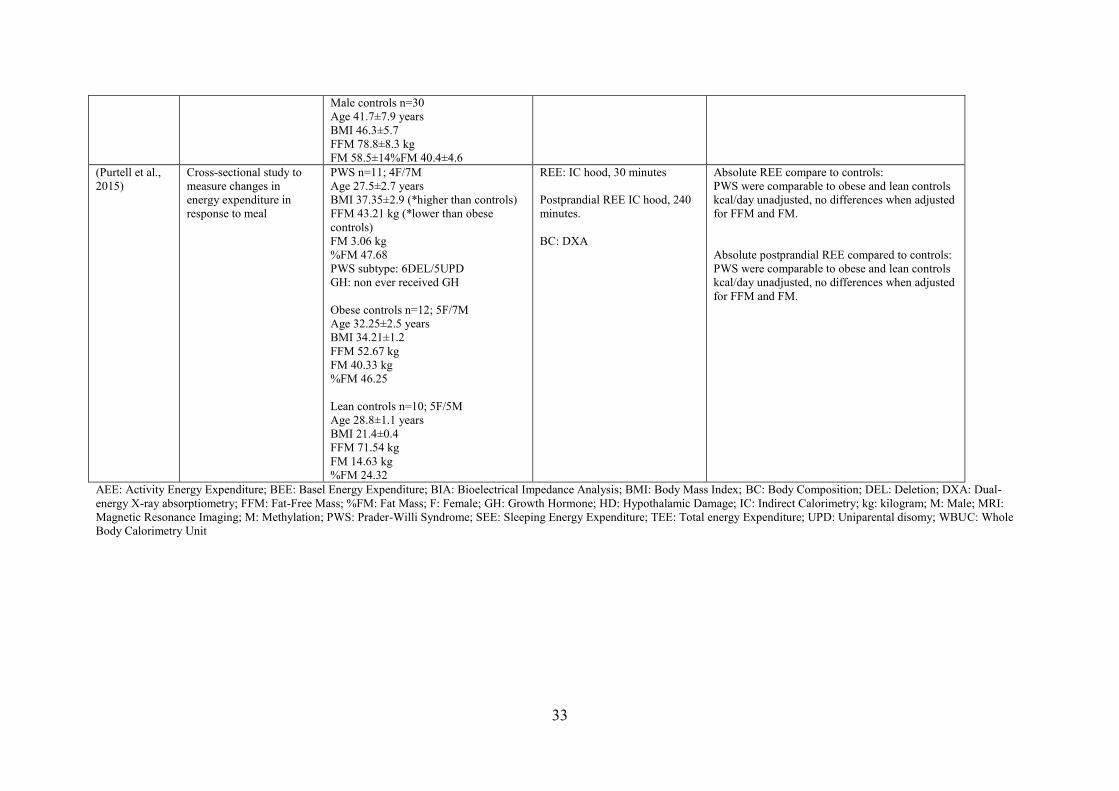
33
Male controls n=30
Age 41.7±7.9 years
BMI 46.3±5.7
FFM 78.8±8.3 kg
FM 58.5±14%FM 40.4±4.6
(Purtell et al.,
2015)
Cross-sectional study to
measure changes in
energy expenditure in
response to meal
PWS n=11; 4F/7M
Age 27.5±2.7 years
BMI 37.35±2.9 (*higher than controls)
FFM 43.21 kg (*lower than obese
controls)
FM 3.06 kg
%FM 47.68
PWS subtype: 6DEL/5UPD
GH: non ever received GH
Obese controls n=12; 5F/7M
Age 32.25±2.5 years
BMI 34.21±1.2
FFM 52.67 kg
FM 40.33 kg
%FM 46.25
Lean controls n=10; 5F/5M
Age 28.8±1.1 years
BMI 21.4±0.4
FFM 71.54 kg
FM 14.63 kg
%FM 24.32
REE: IC hood, 30 minutes
Postprandial REE IC hood, 240
minutes.
BC: DXA
Absolute REE compare to controls:
PWS were comparable to obese and lean controls
kcal/day unadjusted, no differences when adjusted
for FFM and FM.
Absolute postprandial REE compared to controls:
PWS were comparable to obese and lean controls
kcal/day unadjusted, no differences when adjusted
for FFM and FM.
AEE: Activity Energy Expenditure; BEE: Basel Energy Expenditure; BIA: Bioelectrical Impedance Analysis; BMI: Body Mass Index; BC: Body Composition; DEL: Deletion; DXA: Dual-
energy X-ray absorptiometry; FFM: Fat-Free Mass; %FM: Fat Mass; F: Female; GH: Growth Hormone; HD: Hypothalamic Damage; IC: Indirect Calorimetry; kg: kilogram; M: Male; MRI:
Magnetic Resonance Imaging; M: Methylation; PWS: Prader-Willi Syndrome; SEE: Sleeping Energy Expenditure; TEE: Total energy Expenditure; UPD: Uniparental disomy; WBUC: Whole
Body Calorimetry Unit
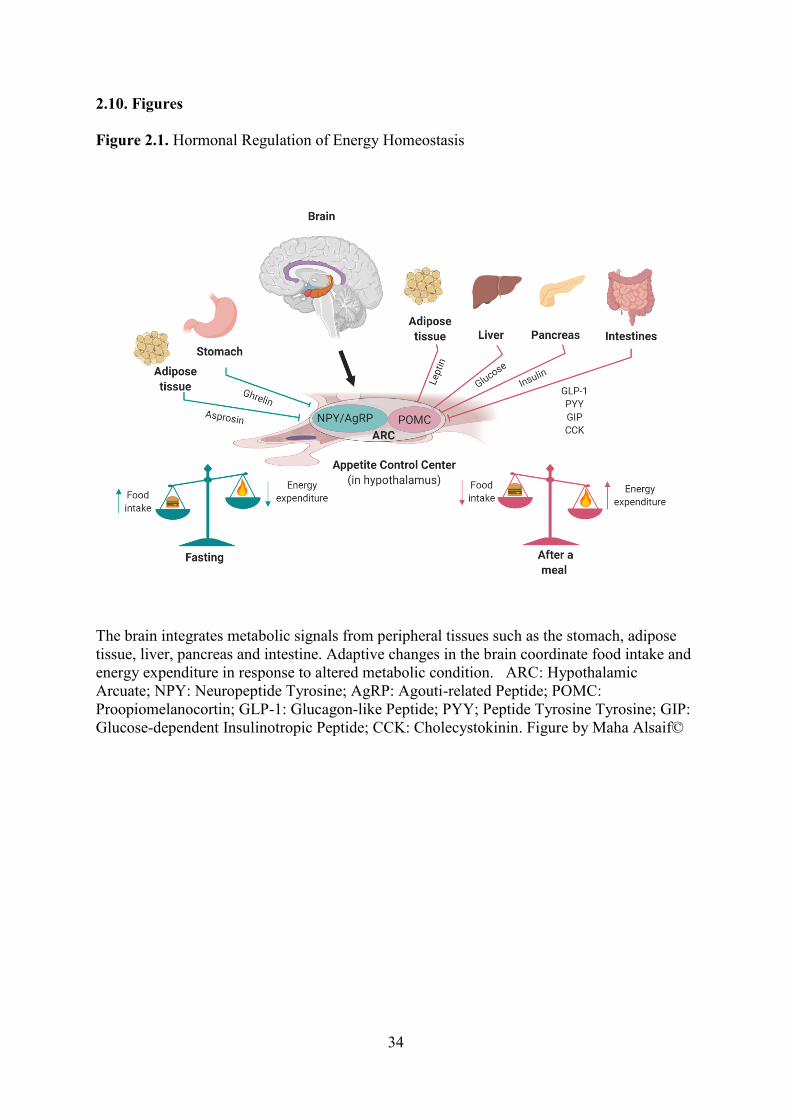
34
2.10. Figures
Figure 2.1. Hormonal Regulation of Energy Homeostasis
The brain integrates metabolic signals from peripheral tissues such as the stomach, adipose
tissue, liver, pancreas and intestine. Adaptive changes in the brain coordinate food intake and
energy expenditure in response to altered metabolic condition. ARC: Hypothalamic
Arcuate; NPY: Neuropeptide Tyrosine; AgRP: Agouti-related Peptide; POMC:
Proopiomelanocortin; GLP-1: Glucagon-like Peptide; PYY; Peptide Tyrosine Tyrosine; GIP:
Glucose-dependent Insulinotropic Peptide; CCK: Cholecystokinin. Figure by Maha Alsaif©

35
Figure 2.2. A flowchart of Literature Review Process
Records identified through
search of databases
(n = 1310)
Additional records identified
through other sources
(n = 0)
Records after duplicates removed
(n = 410)
Records screened
(n = 410)
Records excluded
(n = 393) because not
related to the aim of this
review
Full-text articles
assessed for eligibility
(n = 17)
Full-text articles
excluded, did not meet
the inclusion criteria
(n = 6)
Full text not in English
(n = 1)
Studies included in
qualitative synthesis
(n = 10)
Iden
tifi
cati
on
In
clu
ded
E
ligib
ilit
y
Scr
een
ing
36
Chapter 3 Dietary Macronutrient Regulation of Acyl and Desacyl Ghrelin
Concentrations in Children with Prader-Willi Syndrome
3.1 Preface
The following chapter is based on data from 17 children, 10 with Prader-Willi
syndrome (PWS) and 7 BMI z-score matched children at University of Alberta. The
study aimed to compare the effects of variation in protein content in meals matched
for calorie content on the concentrations of acyl ghrelin (AG), desacyl ghrelin (DAG),
glucose, insulin, glucagon-like peptide 1 (GLP-1), and peptide tyrosine tyrosine
(PYY). Ms. Maha Alsaif was responsible for assaying the blood samples, analyzing
the data and writing the first draft of the manuscript, supported by ongoing
discussions with Dr. Andrea Haqq. Dr. Mohammadreza Pakseresht performed the
statistical analysis and contributed to the data interpretation. Dr. Michelle Mackenzie
recruited the data. Drs. Haqq and Mackenzie conceived the study design. Dr. Michael
Thorner contributed to interpretation and critical review of the manuscript. Drs.
Andrea Haqq, Michelle Mackenzie, Carla Prado, Mohammadreza Pakseresht, Bruce
Gaylinn, Michael Thorner, Michael Freemark and Catherine Field contributed to
concept of formation, interpretation and editing of the final manuscript. This
manuscript is being submitted for publication to Clinical Endocrinology.
37
3.2 Introduction
Prader-Willi syndrome (PWS) is a clinical model of severe childhood obesity
with a prevalence approximating 1 in 10,000 to 16,000 live births (Nicholls, Knoll,
Butler, Karam, & Lalande, 1989). Infants with PWS present with hypotonia and
failure to thrive, and tube feeding is often required. This is followed by hyperphagia
and progressive weight gain in childhood. Relative to children with obesity, children
with PWS have elevated fasting and postprandial concentrations of ghrelin (Haqq et
al., 2008). The high circulating concentrations of ghrelin may be critical for the
pathogenesis of obesity in PWS because ghrelin stimulates food intake and weight
gain (Atalayer et al., 2013). Thus, studies of the regulation of ghrelin secretion may
provide important insights into the control of appetite and weight gain in children
with PWS.
In a recent study, by Irizarry et al. (2019) compared the effects of low-fat, high
carbohydrate (LF-HC) and low carbohydrate, high-fat (LC-HF) intake in children
with PWS using meals matched for calorie and protein content. They found that the
LC-HF diet resulted in lower postprandial insulin concentration, increased fasting and
postprandial glucagon-like peptide 1 (GLP-1) concentrations, and increased fatty acid
oxidation compared to LF-HC diet (Irizarry et al., 2019).
In the current investigation, we enrolled children with PWS and BMI z-score
matched controls in a randomized crossover study and compared the effects of
variation in protein content in meals matched for calorie content. Two test diets were
compared to a standard meal (SM) containing 55% carbohydrate, 30% fat, and 15%
animal protein. The first test meal (HP-LC) contained higher concentrations of animal
protein (30%), lower concentrations of carbohydrate (40%), and equivalent
concentration of fat (30%); this allowed us to test the effect of substituting protein for
carbohydrate in a calorie and fat-balanced meal. The second (HP-LF) contained
higher concentrations of animal protein (30%), lower concentrations of fat (15%), and
equivalent concentrations of carbohydrate (55%); this allowed us to test the effect of
substituting protein for fat in a calorie and carbohydrate-balanced meal. We
compared the effects of the three meals on the concentrations of acyl ghrelin (AG),
desacyl ghrelin (DAG), glucose, insulin, GLP-1, and peptide tyrosine tyrosine (PYY),
all of which regulate food intake in humans and experimental animals. Understanding
38
the role of the macronutrients on the regulation of ghrelin and other satiety factors
will help guide the design of more optimal diets for individuals with PWS and obesity
in general.
3.3 Materials and Methods
3.3.1 Population
We studied ten children with PWS (9 females, 1 male; mean age, 8.5±4.2
years; BMI z-score, 0.93±0.5) and seven BMI z-score matched children (1 female, 6
male, mean age 12.1±3.6 years; BMI z-score, 1.14±0.89). We excluded individuals
with a medical condition known to affect body composition, such as diabetes mellitus,
chronic inflammatory bowel disease, chronic severe liver or kidney disease or
neurologic disorders, and those who were taking an investigational drug in the past
year.
The diagnosis of PWS was confirmed by DNA methylation and
fluorescence in situ hybridization genetic analysis. The control group was comprised
of otherwise healthy individuals with BMI z-score comparable to the PWS children.
Some controls were siblings or friends of the participants with PWS, while others
were recruited from the local Pediatric Centre for Weight and Health. The study was
approved by the University of Alberta's Health Research Ethics Board.
Written informed consent and assent was obtained from all participants and parents.
3.3.2 Experimental Design
In a randomized crossover study design, patients were asked to arrive after an
8-hour fast. At each of three study visits, fasting blood samples and anthropometric
measurements (height and weight) were obtained. Participants were randomly
selected to consume one of the three breakfast meals at each visit. The macronutrient
content of the SM, HP-LC, and HP-LF meals is shown in (Table 3.1).
Blood samples were obtained every hour for 4 hours after the meal. Samples
were assayed for AG and DAG, glucose, insulin, GLP-1, and PYY. Additional
analysis of leptin, total and high-molecular weight (HMW) adiponectin were done in
fasting samples only. No physical exercise was allowed until testing was complete.
The period between test meals was two weeks. Subjective appetite was assessed
39
immediately before every blood draw using visual analog scales (VAS) (100mm). The
assessment contained six questions that required the participant to rate their level of
hunger, fullness, desire to eat, amount of food they could eat, urge to eat, and
preoccupation with food (Stubbs et al., 2000) (Appendix D. Example for VAS).
3.3.3 Preparation of Samples
Blood samples for the determination of AG and DAG concentrations were
collected into polypropylene tubes containing K2 EDTA (3.6 mg) and AEBSF (4mM
final), and centrifuged. The separated plasma was immediately treated with 1N HCl
(200uL 1N HCl per 1mL plasma) and stored at -80°C until analysis. The remaining
blood samples were collected into polypropylene tubes containing K2 EDTA (3.6 mg)
or serum separator tubes supplemented with aprotinin (10 uL per 1mL plasma or
serum). Following centrifugation, plasma and serum were stored at -80°C until
assayed. All analyses were measured in duplicate.
3.3.4 Hormone and Adipocytokine Assays
Plasma samples were assayed using a novel sensitive and specific two-site
assay for AG and DAG, in the lab of Dr. Gaylinn (Liu et al., 2008). Glucose was
measured by AHS (Alberta Health Serves lab) total and HMW adiponectin, GLP-1,
leptin and insulin were measured using RIAs (Millipore), total PYY was measured
using MSD (MesoScale Discovery), and proinsulin was measured using EMD
(Millipore), according to manufacturer’s instructions. Total and HMW adiponectin,
GLP-1 leptin and insulin had coefficients of variation (CVs) <10%. The total PYY
had intra- and inter-assay CVs < 9%. Proinsulin had CV < 15%. Glucose had CVs
<10%. Homeostatic model assessment insulin resistance (HOMA-IR) was calculated
as fasting glucose (mg/dL) × fasting insulin (μIU/mL) ÷ 405 (Conwell, Trost, Brown,
& Batch, 2004).
3.3.4 Statistical Analysis
Baseline demographic and biomarker data were described as median and
interquartile range (IQR). All null hypotheses for between-group comparisons at
baseline were examined using Two-sample Wilcoxon Rank-Sum test Sum (Mann-
40
Whitney). Repeated measures were performed for each participant in the PWS and
control groups for three types of diets at four time points after meal intake. An
independent linear mixed model was used to assess changes in each postprandial
biomarker outcome (AG and DAG, insulin, glucose, PYY, and GLP-1) over time and
examine for group differences and dietary effects. The relative change of biomarker
values after meal intake was calculated as a logarithm (base 2) of the fold change of
values with respect to the baseline; changes were reported as percentages. Meal types
and times were included as fixed effects in linear mixed models. For each model, an
appropriate covariance structure was selected to fit the data while keeping models
parsimonious. All models were adjusted for age, sex, and BMI z-score. Null
hypotheses were rejected at p value ≤ 0.05. All statistical analyses were performed
using Stata 13.1 software (College Station, TX: StataCorp LP.) and GraphPad Prism 7
software (GraphPad Software Inc.).
3.4 Results
3.4.1 Baseline Anthropometric and Metabolic Characteristics
The baseline characteristics of study individuals are shown in (Table 3.2). The PWS
and control groups were not different in BMI z-scores; however, the PWS group
included more females and was younger (p = 0.05). One PWS participant had
uniparental disomy; all others had a chromosome 15 deletion. All PWS individuals
had free thyroxine (T4) and thyroid stimulating hormone (TSH) concentrations in the
normal range. Eight patients were taking growth hormone (GH) treatment prior to
study enrollment; no changes in GH treatment were made during the course of the
study. Of the other two patients, one had been previously treated with GH, but was
not taking GH at the time of the study; one patient was never treated with GH.
Under fasting conditions, the PWS group had higher concentrations of total and
HMW adiponectin (p = 0.005 and p = 0.02, respectively), AG (p = 0.02), and DAG (p
= 0.01) than the BMI z-score matched controls. The ratio of fasting AG:DAG was
similar in both groups. The PWS group had lower fasting concentrations of glucose (p
= 0.04) and HOMA-IR (p = 0.05) than the control group but fasting concentrations of
insulin, proinsulin, GLP-1, PYY and leptin were comparable. The fasting proinsulin
to insulin ratio was higher in the PWS group (p = 0.05).
41
3.4.2 Acyl Ghrelin, Desacyl Ghrelin and Acyl Ghrelin:Desacyl Ghrelin Ratio
Responses to SM, HP-LC and HP-LF meals
3.4.2.1 Acyl Ghrelin and Desacyl Ghrelin—PWS vs. control Group
Absolute concentrations of AG and DAG were higher in PWS than in BMI z-score
matched children across all postprandial time points (p = 0.002 and p < 0.001
respectively) (Figure 3.1, A and B). AG and DAG concentrations decreased in both
groups following the SM, HP-LC and HP-LF meals. The time course and magnitude
of AG and DAG suppression, as assessed by change relative to baseline, were
comparable following SM, HP-LC and HP-LF meals in the PWS group at one (p =
0.31, ns and p = 0.24, ns), two (p = 0.4, ns and p = 0.26. ns), three (p = 0.35, ns and p
= 0.30, ns) and four hours (p = 0.99, ns and p = 0.13, ns) and in the control group at
one (p = 0.46, ns and p = 0.67, ns), two (p = 0.28, ns and p = 0.74. ns), three (p =
0.50, ns and p = 0.35, ns) and four hours (p = 0.67, ns and p = 0.61, ns) (Figure 3.1, C
and D). However, the magnitude of AG and DAG suppression following all three
meals was more pronounced in children with PWS at one (p = 0.012 and p = 0.15, ns),
two (p = 0.001 and p = 0.002), three (p = 0.001 and p < 001) and four hours (p =
0.001 and p = 0.001) and the time return to baseline to recovery was delayed (Figure
3.1, C and D).
3.4.2.2 Acyl Ghrelin and Desacyl Ghrelin—PWS Group
The rate and magnitude of return to baseline of ghrelin in children with PWS was
similar following all three meals.
3.4.2.3 Acyl Ghrelin and Desacyl Ghrelin—Control Group
The rate and magnitude of return to baseline of ghrelin in control group was similar
following all three meals.
3.4.2.4 Acyl Ghrelin:Desacyl Ghrelin Ratio—PWS vs. control Group
The ratio of AG:DAG was higher in the PWS group than in the control group at hour
2 after the SM (p = 0.03) (Figure 3.1, E).
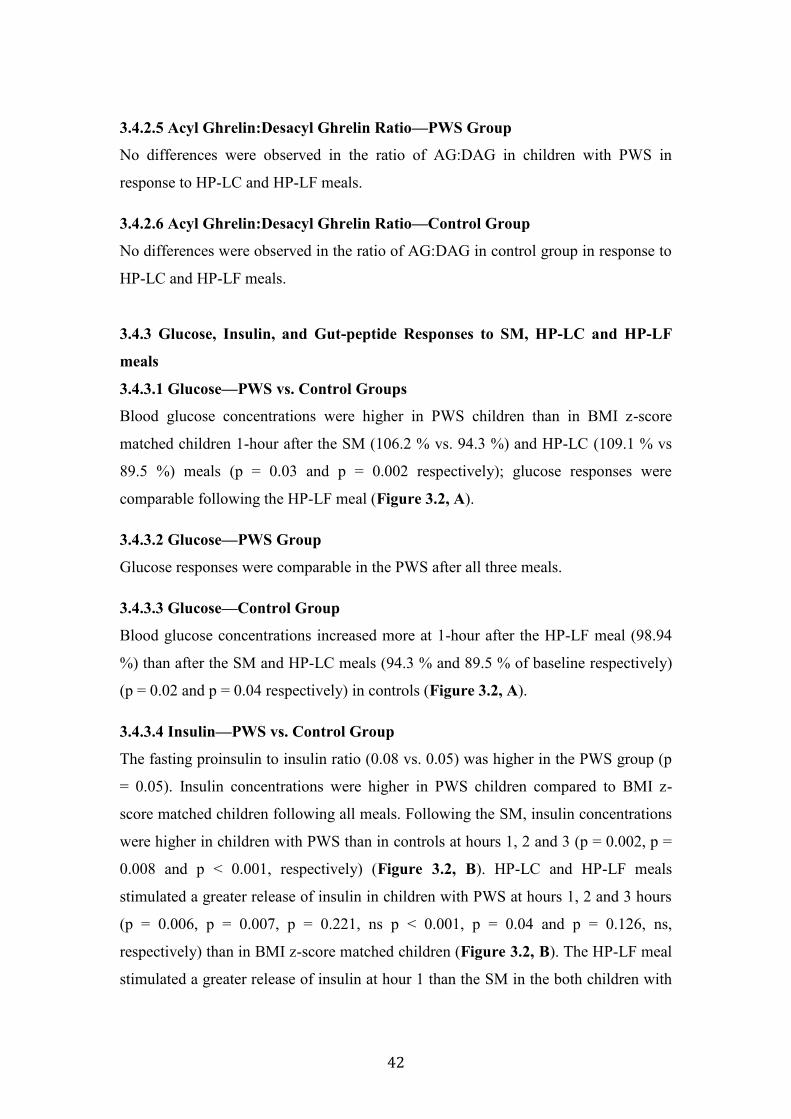
42
3.4.2.5 Acyl Ghrelin:Desacyl Ghrelin Ratio—PWS Group
No differences were observed in the ratio of AG:DAG in children with PWS in
response to HP-LC and HP-LF meals.
3.4.2.6 Acyl Ghrelin:Desacyl Ghrelin Ratio—Control Group
No differences were observed in the ratio of AG:DAG in control group in response to
HP-LC and HP-LF meals.
3.4.3 Glucose, Insulin, and Gut-peptide Responses to SM, HP-LC and HP-LF
meals
3.4.3.1 Glucose—PWS vs. Control Groups
Blood glucose concentrations were higher in PWS children than in BMI z-score
matched children 1-hour after the SM (106.2 % vs. 94.3 %) and HP-LC (109.1 % vs
89.5 %) meals (p = 0.03 and p = 0.002 respectively); glucose responses were
comparable following the HP-LF meal (Figure 3.2, A).
3.4.3.2 Glucose—PWS Group
Glucose responses were comparable in the PWS after all three meals.
3.4.3.3 Glucose—Control Group
Blood glucose concentrations increased more at 1-hour after the HP-LF meal (98.94
%) than after the SM and HP-LC meals (94.3 % and 89.5 % of baseline respectively)
(p = 0.02 and p = 0.04 respectively) in controls (Figure 3.2, A).
3.4.3.4 Insulin—PWS vs. Control Group
The fasting proinsulin to insulin ratio (0.08 vs. 0.05) was higher in the PWS group (p
= 0.05). Insulin concentrations were higher in PWS children compared to BMI z-
score matched children following all meals. Following the SM, insulin concentrations
were higher in children with PWS than in controls at hours 1, 2 and 3 (p = 0.002, p =
0.008 and p < 0.001, respectively) (Figure 3.2, B). HP-LC and HP-LF meals
stimulated a greater release of insulin in children with PWS at hours 1, 2 and 3 hours
(p = 0.006, p = 0.007, p = 0.221, ns p < 0.001, p = 0.04 and p = 0.126, ns,
respectively) than in BMI z-score matched children (Figure 3.2, B). The HP-LF meal
stimulated a greater release of insulin at hour 1 than the SM in the both children with
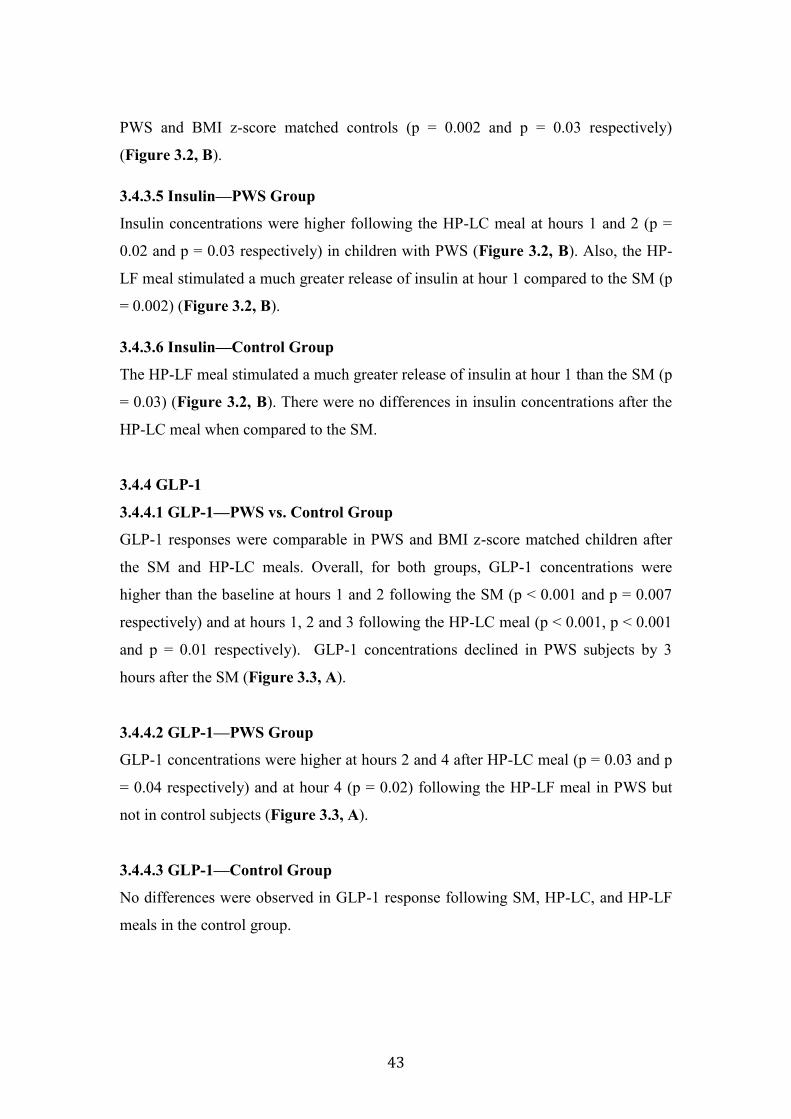
43
PWS and BMI z-score matched controls (p = 0.002 and p = 0.03 respectively)
(Figure 3.2, B).
3.4.3.5 Insulin—PWS Group
Insulin concentrations were higher following the HP-LC meal at hours 1 and 2 (p =
0.02 and p = 0.03 respectively) in children with PWS (Figure 3.2, B). Also, the HP-
LF meal stimulated a much greater release of insulin at hour 1 compared to the SM (p
= 0.002) (Figure 3.2, B).
3.4.3.6 Insulin—Control Group
The HP-LF meal stimulated a much greater release of insulin at hour 1 than the SM (p
= 0.03) (Figure 3.2, B). There were no differences in insulin concentrations after the
HP-LC meal when compared to the SM.
3.4.4 GLP-1
3.4.4.1 GLP-1—PWS vs. Control Group
GLP-1 responses were comparable in PWS and BMI z-score matched children after
the SM and HP-LC meals. Overall, for both groups, GLP-1 concentrations were
higher than the baseline at hours 1 and 2 following the SM (p < 0.001 and p = 0.007
respectively) and at hours 1, 2 and 3 following the HP-LC meal (p < 0.001, p < 0.001
and p = 0.01 respectively). GLP-1 concentrations declined in PWS subjects by 3
hours after the SM (Figure 3.3, A).
3.4.4.2 GLP-1—PWS Group
GLP-1 concentrations were higher at hours 2 and 4 after HP-LC meal (p = 0.03 and p
= 0.04 respectively) and at hour 4 (p = 0.02) following the HP-LF meal in PWS but
not in control subjects (Figure 3.3, A).
3.4.4.3 GLP-1—Control Group
No differences were observed in GLP-1 response following SM, HP-LC, and HP-LF
meals in the control group.
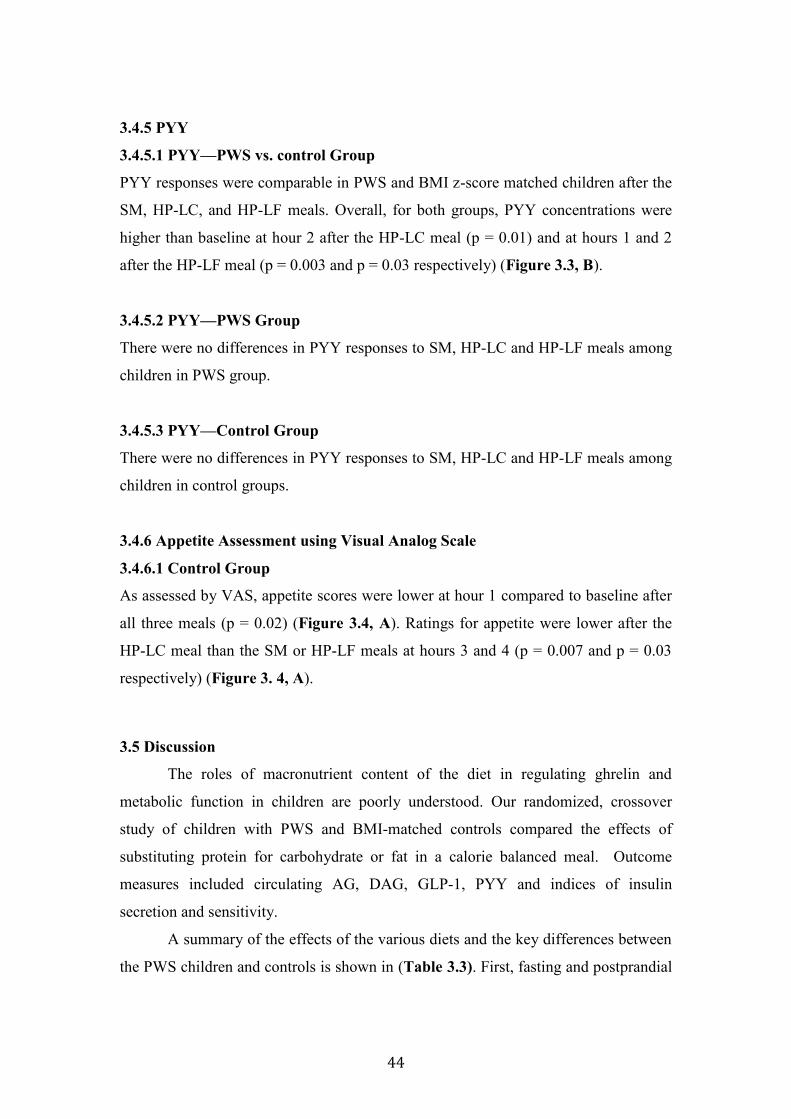
44
3.4.5 PYY
3.4.5.1 PYY—PWS vs. control Group
PYY responses were comparable in PWS and BMI z-score matched children after the
SM, HP-LC, and HP-LF meals. Overall, for both groups, PYY concentrations were
higher than baseline at hour 2 after the HP-LC meal (p = 0.01) and at hours 1 and 2
after the HP-LF meal (p = 0.003 and p = 0.03 respectively) (Figure 3.3, B).
3.4.5.2 PYY—PWS Group
There were no differences in PYY responses to SM, HP-LC and HP-LF meals among
children in PWS group.
3.4.5.3 PYY—Control Group
There were no differences in PYY responses to SM, HP-LC and HP-LF meals among
children in control groups.
3.4.6 Appetite Assessment using Visual Analog Scale
3.4.6.1 Control Group
As assessed by VAS, appetite scores were lower at hour 1 compared to baseline after
all three meals (p = 0.02) (Figure 3.4, A). Ratings for appetite were lower after the
HP-LC meal than the SM or HP-LF meals at hours 3 and 4 (p = 0.007 and p = 0.03
respectively) (Figure 3. 4, A).
3.5 Discussion
The roles of macronutrient content of the diet in regulating ghrelin and
metabolic function in children are poorly understood. Our randomized, crossover
study of children with PWS and BMI-matched controls compared the effects of
substituting protein for carbohydrate or fat in a calorie balanced meal. Outcome
measures included circulating AG, DAG, GLP-1, PYY and indices of insulin
secretion and sensitivity.
A summary of the effects of the various diets and the key differences between
the PWS children and controls is shown in (Table 3.3). First, fasting and postprandial
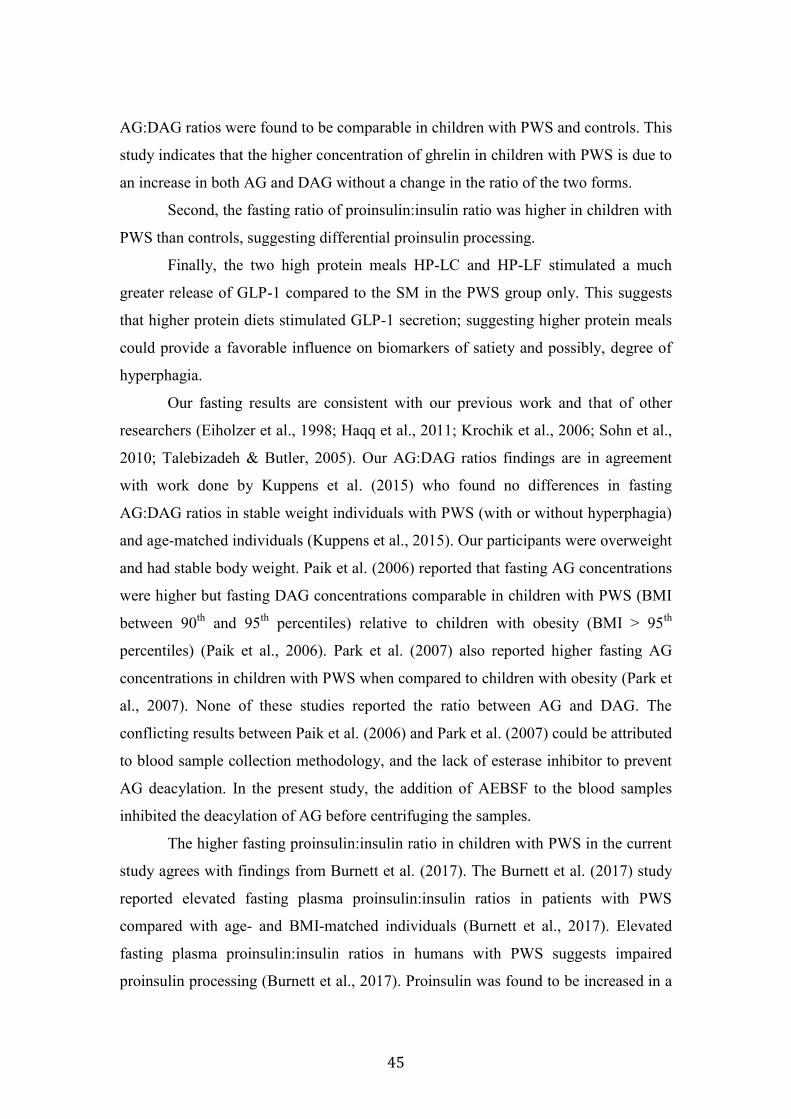
45
AG:DAG ratios were found to be comparable in children with PWS and controls. This
study indicates that the higher concentration of ghrelin in children with PWS is due to
an increase in both AG and DAG without a change in the ratio of the two forms.
Second, the fasting ratio of proinsulin:insulin ratio was higher in children with
PWS than controls, suggesting differential proinsulin processing.
Finally, the two high protein meals HP-LC and HP-LF stimulated a much
greater release of GLP-1 compared to the SM in the PWS group only. This suggests
that higher protein diets stimulated GLP-1 secretion; suggesting higher protein meals
could provide a favorable influence on biomarkers of satiety and possibly, degree of
hyperphagia.
Our fasting results are consistent with our previous work and that of other
researchers (Eiholzer et al., 1998; Haqq et al., 2011; Krochik et al., 2006; Sohn et al.,
2010; Talebizadeh & Butler, 2005). Our AG:DAG ratios findings are in agreement
with work done by Kuppens et al. (2015) who found no differences in fasting
AG:DAG ratios in stable weight individuals with PWS (with or without hyperphagia)
and age-matched individuals (Kuppens et al., 2015). Our participants were overweight
and had stable body weight. Paik et al. (2006) reported that fasting AG concentrations
were higher but fasting DAG concentrations comparable in children with PWS (BMI
between 90th
and 95th
percentiles) relative to children with obesity (BMI > 95th
percentiles) (Paik et al., 2006). Park et al. (2007) also reported higher fasting AG
concentrations in children with PWS when compared to children with obesity (Park et
al., 2007). None of these studies reported the ratio between AG and DAG. The
conflicting results between Paik et al. (2006) and Park et al. (2007) could be attributed
to blood sample collection methodology, and the lack of esterase inhibitor to prevent
AG deacylation. In the present study, the addition of AEBSF to the blood samples
inhibited the deacylation of AG before centrifuging the samples.
The higher fasting proinsulin:insulin ratio in children with PWS in the current
study agrees with findings from Burnett et al. (2017). The Burnett et al. (2017) study
reported elevated fasting plasma proinsulin:insulin ratios in patients with PWS
compared with age- and BMI-matched individuals (Burnett et al., 2017). Elevated
fasting plasma proinsulin:insulin ratios in humans with PWS suggests impaired
proinsulin processing (Burnett et al., 2017). Proinsulin was found to be increased in a
46
Snord116 mouse model that mimics a number of neuroendocrine phenotypes of PWS,
such as hyperphagia, impaired motor learning, hypoinsulinemia, and
hyperghrelinemia (Ding et al., 2008; Skryabin et al., 2007).
Fasting and postprandial AG and DAG concentrations were higher in children
with PWS than in BMI z-score matched children. However, meal intake suppressed
both forms of ghrelin in both groups. AG and DAG suppression was more
pronounced in children with PWS, delaying the return to baseline of ghrelin
concentrations. There were no effects of HP-LC or HP-LF meals on AG, DAG, the
AG:DAG ratio within or between groups. Our finding is consistent with those of
Gumus Balikcioglu et al. (2015) who found that both high-carbohydrate and high-fat
meals suppressed ghrelin concentrations in children with PWS as well as BMI-, age-
and sex-matched children (Gumus Balikcioglu et al., 2015). These findings also
concord with those of Bizzarri et al. (2010) who showed that a mixed liquid meal
suppressed plasma ghrelin more in children with PWS than in children with obesity
(Bizzarri et al., 2010). In our study, the delayed recovery to baseline in AG and DAG
ghrelin in children with PWS compared to BMI z-score matched children may be
attributed to the interrelationship between ghrelin and insulin. Several studies showed
that insulin reduces circulating concentrations of ghrelin independent of glucose
(Chabot, Caron, Laplante, & St-Pierre, 2014; Flanagan et al., 2003; Mohlig et al.,
2002; Paik et al., 2007; Saad et al., 2002). Suppression of AG and DAG ghrelin is
associated with insulin sensitivity in children with PWS (Broglio et al., 2004; Saad et
al., 2002). In the current study, postprandial glucose and insulin concentrations were
higher in children with PWS across all the postprandial time points. However, the
exact mechanism of suppression ghrelin by insulin is not fully understood. Gumus
Balikcioglu et al. (2015) speculated that insulin might modulate neuroendocrine
inputs that regulate ghrelin secretion or have an impact on the ghrelin-secretion cells
of the stomach (Gumus Balikcioglu et al., 2015).
In the present study, postprandial glucose and insulin concentrations were
higher in children with PWS across all postprandial time points. The prolonged
insulin and glucose response in PWS implies lower tissue uptake, possible due to
lower muscle mass (Alsaif et al., 2017). Another explanation could be due to the GH
treatment; previous studies have shown that GH suppresses glucose uptake in the
47
adipose tissue (Kim & Park, 2017); In the present study, 9 out of 10 children with
PWS were on GH treatment; which may explain prolonged insulin and glucose
response. As insulin sensitivity reported to be higher in individuals with PWS (Haqq
et al., 2011). Blood glucose concentrations were higher in PWS children when
compared to controls following SM and HP-LC meal but showed little difference after
the HP-LF meal. Studies have shown that GH treatment stimulates glucose release
through gluconeogenesis and glycogenolysis from the liver and kidney (Kim & Park,
2017), which may explain the higher blood glucose concentrations in children with
PWS. This observation suggests reduced insulin sensitivity and glucose tolerance in
the children with PWS group. Yet HMW adiponectin, a marker of insulin sensitivity
(Haqq et al., 2011; Irizarry et al., 2019) was higher in children with PWS compared to
controls. There were no effects of variations in meal protein content on glucose in
children with PWS and no effect of HP-LC meal on glucose and insulin in control
group. However, blood glucose concentration increased after HP-LF in the control
group meal due to higher carbohydrate content.
Goldstone et al. (2004) reported comparable fasting GLP-1 concentrations in
adults with PWS and adults with and without obesity (Goldstone et al., 2004);
however, they did not measure postprandial GLP-1. Similarly, Purtell et al. (2011)
reported comparable fasting GLP-1 and postprandial GLP-1 concentrations in adults
with PWS following high carbohydrate and high fat diet meals (50% carbohydrate,
35% fat, 15% protein) compared to adults with and without obesity (Purtell et al.,
2011). The latter observation is consistent with our SM findings. However, the two
high protein meals in the current study stimulated much greater increases in the
concentrations of GLP-1 in children with PWS. Since GLP-1 inhibits food intake
through effects on vagal and CNS function (Dailey & Moran, 2013), this finding
suggests that substitution of protein for carbohydrate or protein for fat might limit
food intake in children with PWS.
Several reports have described the role of PYY in PWS, but with conflicting
results. Our findings regarding PYY differ from previous work. Butler et al. (2004)
reported lower PYY concentrations in infants and children with PWS and a higher
plasma PYY response to meals in children with PWS compared to children with and
without obesity (Butler et al., 2004). Gumus Balikcioglu et al. (2015) reported higher
48
fasting PYY and a blunted postprandial response to high fat meals in children with
PWS compared to BMI z-score matched children (Gumus Balikcioglu et al., 2015). In
adults, Purtell et al. (2011) found comparable fasting and postprandial PYY
concentrations in PWS individuals when compared to adults with obesity (Purtell et
al., 2011). This is in agreement with our findings, where fasting and postprandial
PYY were comparable among children with PWS and BMI z-score matched children.
However, postprandial PYY concentrations were higher in both groups at hour 2
following the HP-LC meal and at hours 1 and 2 following the HP-LF meals. This
suggests that higher protein diets stimulated PYY secretion. Thus higher protein
meals might promote satiety in PWS through effects on PYY as well as GLP-1.
Major strengths of our study include its randomized crossover design in which
all participants served as their own controls, and its use of specific assays to measure
AG and DAG concentrations; however, there might be cross reactivity in the
assay that potentially may recognize proghrelin, the precursor of AG and DAG.
Limitations of our study include the size and relative heterogeneity of the cohort.
There were more females in the PWS group and more males in the control group; we
also did not collect pubertal data, which could have influenced some of our hormone
findings in the PWS group. Haqq et al. (Haqq et al., 2008) reported that ghrelin
concentrations are lower in older children with PWS and control compared to younger
children. The control group in the current study was older than the children with
PWS. Other studies have shown that ghrelin concentrations are higher in healthy
females than in males, and that the concentration decreases with puberty (Whatmore,
Hall, Jones, Westwood, & Clayton, 2003). Subjective appetite assessment was not
assessed in children with PWS in this study. The use of VAS depends on age and
cognitive development (Shields, Palermo, Powers, Grewe, & Smith, 2003), which
limited its use in the current study. The children with PWS were younger than those in
the control group and lacked the understanding and communication ability to
complete VAS questionnaires. We, therefore, used VAS ratings only for the control
group.
In the control group, the VAS ratings paralleled our ghrelin suppression
findings; appetite was lower at one-hour post-meal compared to baseline for all three
meals. Also, appetite was lower after the HP-LC meal compared to the SM at hours 3
49
and 4. In other studies, adults with PWS rated high hunger scores and high satiety
scores immediately after a meal (Purtell et al., 2011). Such results, when compared to
our results for VAS ratings, bring into question the reliability of using subjective
appetite assessment in PWS individuals. Furthermore, our study meal was 350 kcal
and was not personalized to meet each individual’s energy needs. It is possible that
the young children were overfed and the older children underfed in this study.
Despite these limitations, present study’s findings suggest that the higher
concentration of total ghrelin in children with PWS was due to an increase in both AG
and DAG, with no change in the ratio. Meal consumption also suppresses both forms
of ghrelin to a greater extent in children with PWS. An elevated fasting plasma
proinsulin:insulin ratio in PWS children suggests impaired processing of proinsulin.
Higher protein meals stimulated greater increases in GLP-1 and PYY in children with
PWS than in controls. This could provide a favorable influence on biomarkers of
satiety and, possibly, degree of hyperphagia. Testing this hypothesis will require long-
term studies of the effects of high protein intake on food intake and weight gain.
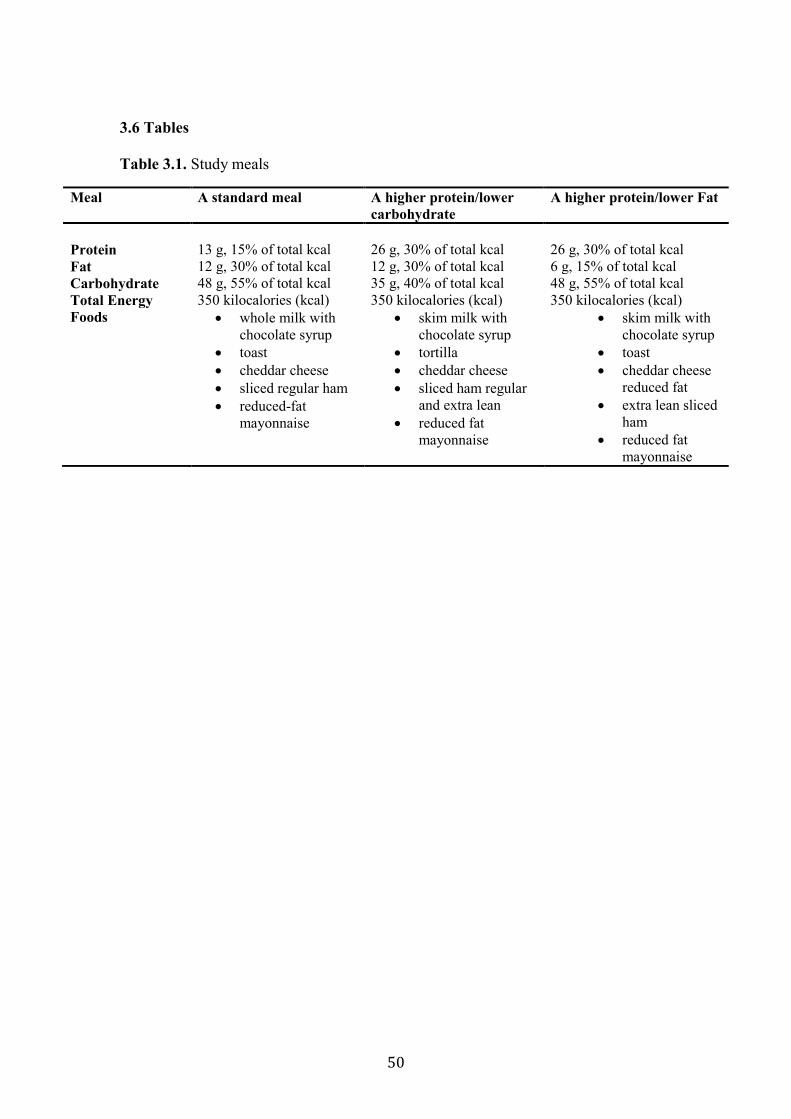
50
3.6 Tables
Table 3.1. Study meals
Meal A standard meal A higher protein/lower
carbohydrate
A higher protein/lower Fat
Protein
13 g, 15% of total kcal
26 g, 30% of total kcal
26 g, 30% of total kcal
Fat 12 g, 30% of total kcal 12 g, 30% of total kcal 6 g, 15% of total kcal
Carbohydrate 48 g, 55% of total kcal 35 g, 40% of total kcal 48 g, 55% of total kcal
Total Energy 350 kilocalories (kcal) 350 kilocalories (kcal) 350 kilocalories (kcal)
Foods whole milk with
chocolate syrup
toast
cheddar cheese
sliced regular ham
reduced-fat
mayonnaise
skim milk with
chocolate syrup
tortilla
cheddar cheese
sliced ham regular
and extra lean
reduced fat
mayonnaise
skim milk with
chocolate syrup
toast
cheddar cheese
reduced fat
extra lean sliced
ham
reduced fat
mayonnaise
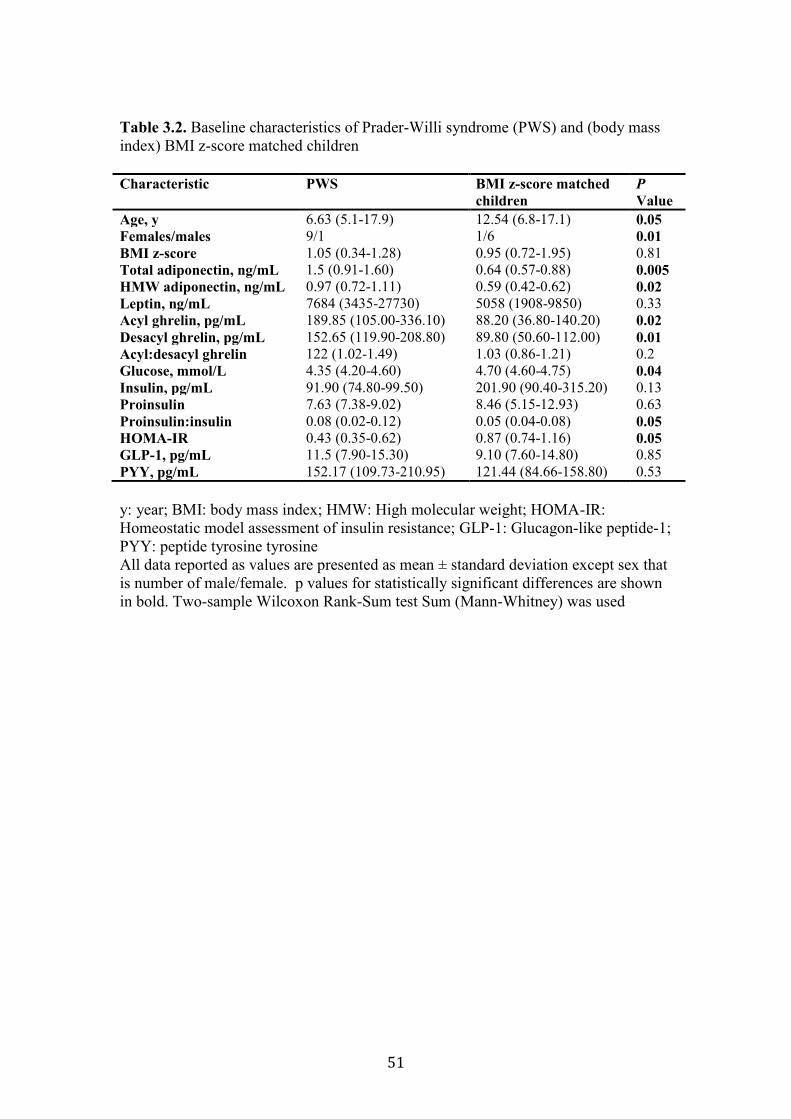
51
Table 3.2. Baseline characteristics of Prader-Willi syndrome (PWS) and (body mass
index) BMI z-score matched children
Characteristic PWS BMI z-score matched
children
P
Value
Age, y 6.63 (5.1-17.9) 12.54 (6.8-17.1) 0.05
Females/males 9/1 1/6 0.01
BMI z-score 1.05 (0.34-1.28) 0.95 (0.72-1.95) 0.81
Total adiponectin, ng/mL 1.5 (0.91-1.60) 0.64 (0.57-0.88) 0.005
HMW adiponectin, ng/mL 0.97 (0.72-1.11) 0.59 (0.42-0.62) 0.02
Leptin, ng/mL 7684 (3435-27730) 5058 (1908-9850) 0.33
Acyl ghrelin, pg/mL 189.85 (105.00-336.10) 88.20 (36.80-140.20) 0.02
Desacyl ghrelin, pg/mL 152.65 (119.90-208.80) 89.80 (50.60-112.00) 0.01
Acyl:desacyl ghrelin 122 (1.02-1.49) 1.03 (0.86-1.21) 0.2
Glucose, mmol/L 4.35 (4.20-4.60) 4.70 (4.60-4.75) 0.04
Insulin, pg/mL 91.90 (74.80-99.50) 201.90 (90.40-315.20) 0.13
Proinsulin 7.63 (7.38-9.02) 8.46 (5.15-12.93) 0.63
Proinsulin:insulin 0.08 (0.02-0.12) 0.05 (0.04-0.08) 0.05
HOMA-IR 0.43 (0.35-0.62) 0.87 (0.74-1.16) 0.05
GLP-1, pg/mL 11.5 (7.90-15.30) 9.10 (7.60-14.80) 0.85
PYY, pg/mL 152.17 (109.73-210.95) 121.44 (84.66-158.80) 0.53
y: year; BMI: body mass index; HMW: High molecular weight; HOMA-IR:
Homeostatic model assessment of insulin resistance; GLP-1: Glucagon-like peptide-1;
PYY: peptide tyrosine tyrosine
All data reported as values are presented as mean ± standard deviation except sex that
is number of male/female. p values for statistically significant differences are shown
in bold. Two-sample Wilcoxon Rank-Sum test Sum (Mann-Whitney) was used
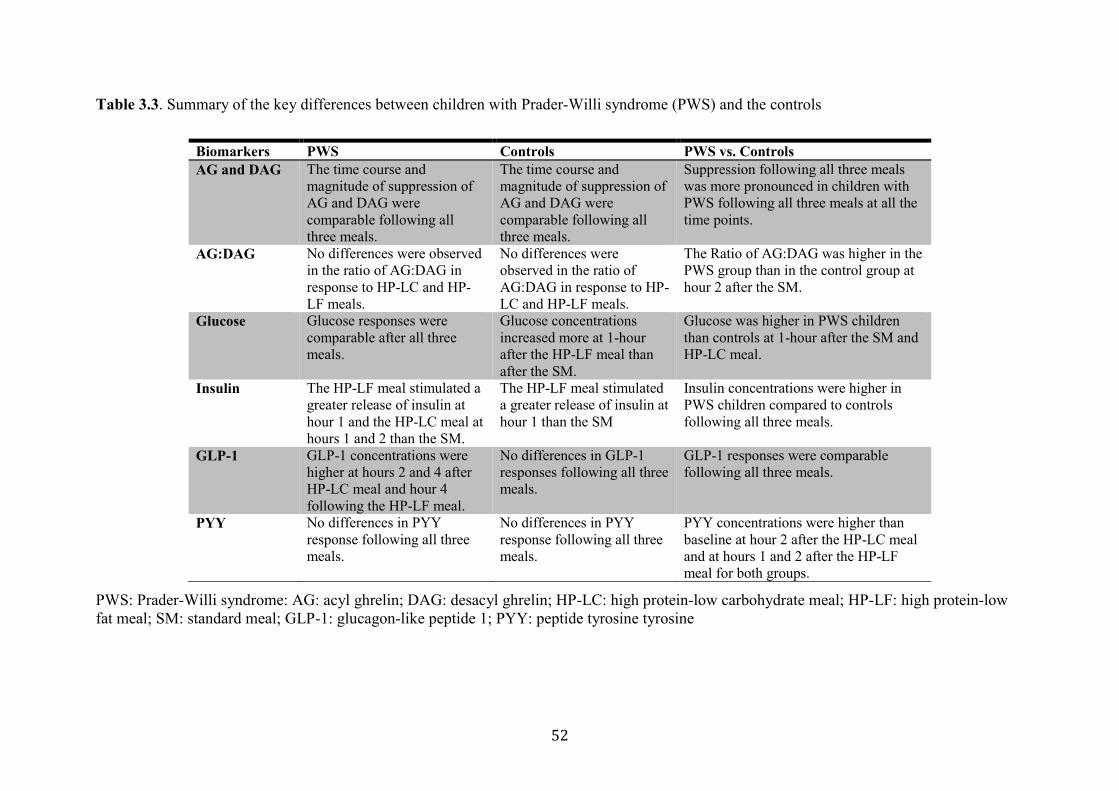
52
Table 3.3. Summary of the key differences between children with Prader-Willi syndrome (PWS) and the controls
PWS: Prader-Willi syndrome: AG: acyl ghrelin; DAG: desacyl ghrelin; HP-LC: high protein-low carbohydrate meal; HP-LF: high protein-low
fat meal; SM: standard meal; GLP-1: glucagon-like peptide 1; PYY: peptide tyrosine tyrosine
Biomarkers PWS Controls PWS vs. Controls
AG and DAG
The time course and
magnitude of suppression of
AG and DAG were
comparable following all
three meals.
The time course and
magnitude of suppression of
AG and DAG were
comparable following all
three meals.
Suppression following all three meals
was more pronounced in children with
PWS following all three meals at all the
time points.
AG:DAG No differences were observed
in the ratio of AG:DAG in
response to HP-LC and HP-
LF meals.
No differences were
observed in the ratio of
AG:DAG in response to HP-
LC and HP-LF meals.
The Ratio of AG:DAG was higher in the
PWS group than in the control group at
hour 2 after the SM.
Glucose Glucose responses were
comparable after all three
meals.
Glucose concentrations
increased more at 1-hour
after the HP-LF meal than
after the SM.
Glucose was higher in PWS children
than controls at 1-hour after the SM and
HP-LC meal.
Insulin The HP-LF meal stimulated a
greater release of insulin at
hour 1 and the HP-LC meal at
hours 1 and 2 than the SM.
The HP-LF meal stimulated
a greater release of insulin at
hour 1 than the SM
Insulin concentrations were higher in
PWS children compared to controls
following all three meals.
GLP-1 GLP-1 concentrations were
higher at hours 2 and 4 after
HP-LC meal and hour 4
following the HP-LF meal.
No differences in GLP-1
responses following all three
meals.
GLP-1 responses were comparable
following all three meals.
PYY No differences in PYY
response following all three
meals.
No differences in PYY
response following all three
meals.
PYY concentrations were higher than
baseline at hour 2 after the HP-LC meal
and at hours 1 and 2 after the HP-LF
meal for both groups.
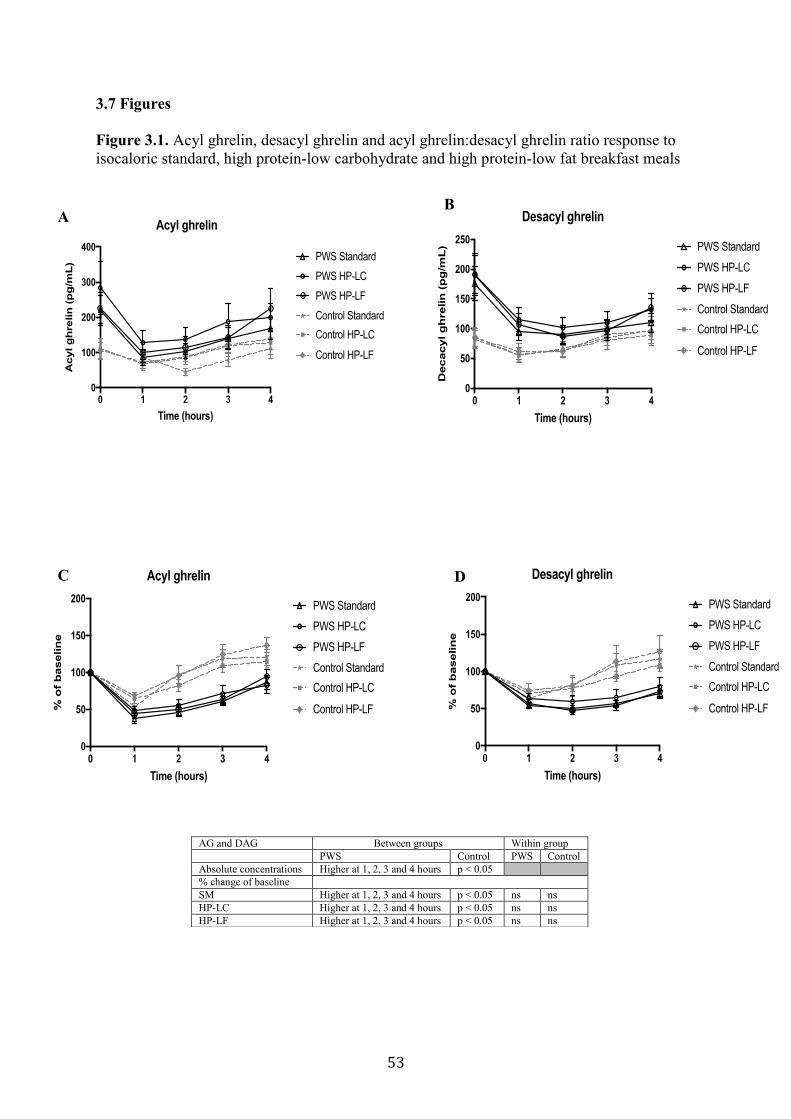
53
3.7 Figures
Figure 3.1. Acyl ghrelin, desacyl ghrelin and acyl ghrelin:desacyl ghrelin ratio response to
isocaloric standard, high protein-low carbohydrate and high protein-low fat breakfast meals
AG and DAG Between groups Within group
PWS Control PWS Control
Absolute concentrations Higher at 1, 2, 3 and 4 hours p < 0.05
% change of baseline
SM Higher at 1, 2, 3 and 4 hours p < 0.05 ns ns
HP-LC Higher at 1, 2, 3 and 4 hours p < 0.05 ns ns
HP-LF Higher at 1, 2, 3 and 4 hours p < 0.05 ns ns
0 1 2 3 40
100
200
300
400
Time (hours)
Acyl g
hre
lin
(p
g/m
L)
Acyl ghrelin
PWS Standard
PWS HP-LC
PWS HP-LF
Control Standard
Control HP-LC
Control HP-LF
A
0 1 2 3 40
50
100
150
200
250
Time (hours)
Decacyl g
hrelin
(p
g/m
L)
Desacyl ghrelin
PWS Standard
PWS HP-LC
PWS HP-LF
Control Standard
Control HP-LC
Control HP-LF
B
0 1 2 3 40
50
100
150
200
Time (hours)
% o
f b
aselin
e
Acyl ghrelin
PWS Standard
PWS HP-LC
PWS HP-LF
Control Standard
Control HP-LC
Control HP-LF
C
0 1 2 3 40
50
100
150
200
Time (hours)
% o
f b
aselin
e
Desacyl ghrelin
PWS Standard
PWS HP-LC
PWS HP-LF
Control Standard
Control HP-LC
Control HP-LF
D
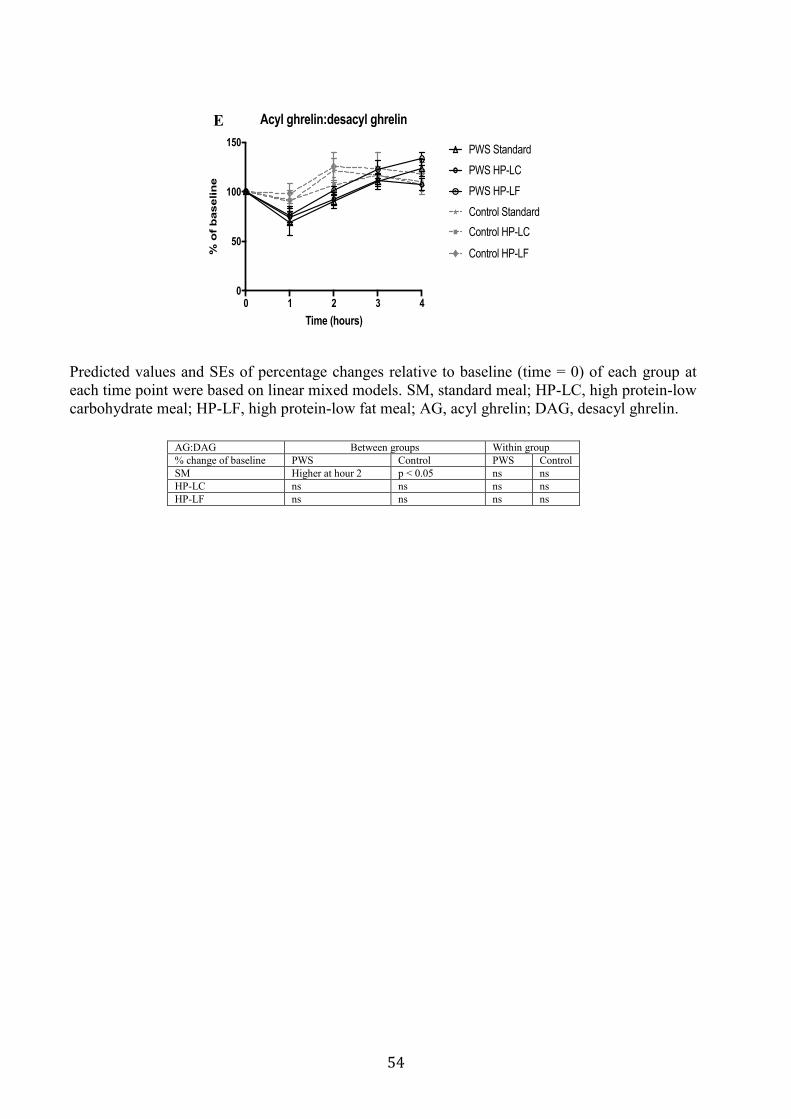
54
0 1 2 3 40
50
100
150
Time (hours)
% o
f b
aselin
e
Acyl ghrelin:desacyl ghrelin
PWS Standard
PWS HP-LC
PWS HP-LF
Control Standard
Control HP-LC
Control HP-LF
E
AG:DAG Between groups Within group
% change of baseline PWS Control PWS Control
SM Higher at hour 2 p < 0.05 ns ns
HP-LC ns ns ns ns
HP-LF ns ns ns ns
Predicted values and SEs of percentage changes relative to baseline (time = 0) of each group at
each time point were based on linear mixed models. SM, standard meal; HP-LC, high protein-low
carbohydrate meal; HP-LF, high protein-low fat meal; AG, acyl ghrelin; DAG, desacyl ghrelin.
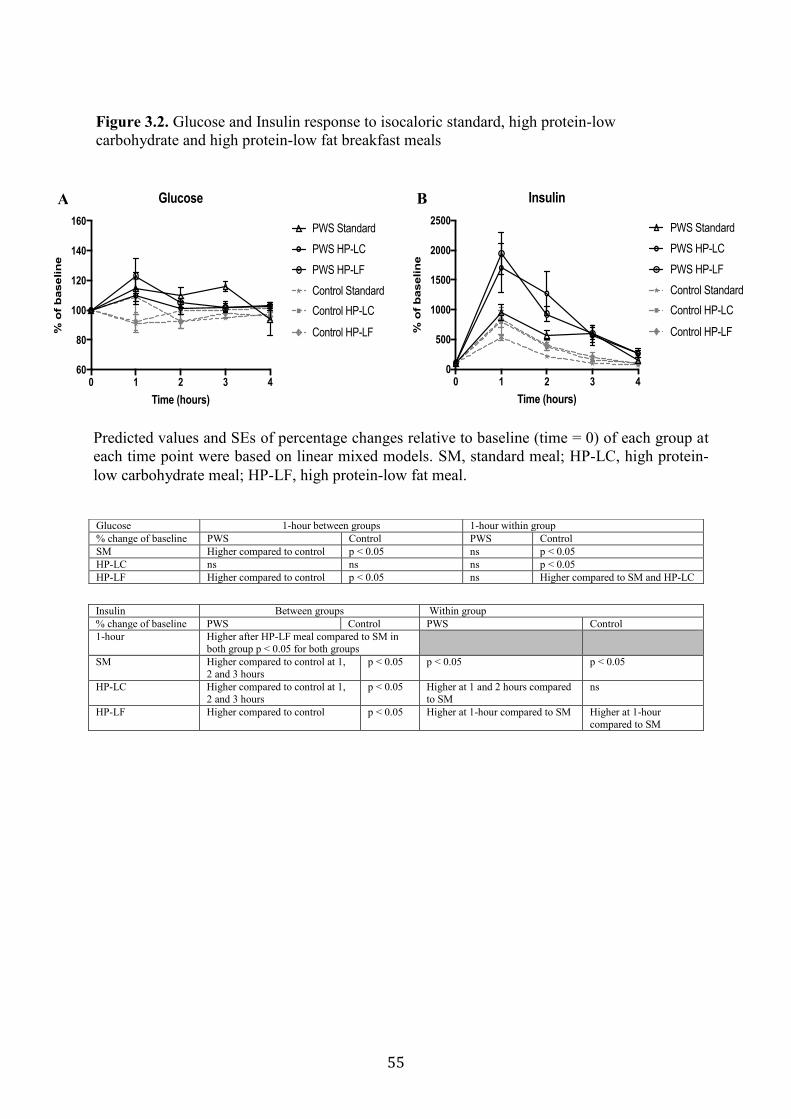
55
Figure 3.2. Glucose and Insulin response to isocaloric standard, high protein-low
carbohydrate and high protein-low fat breakfast meals
Glucose 1-hour between groups 1-hour within group
% change of baseline PWS Control PWS Control
SM Higher compared to control p < 0.05 ns p < 0.05
HP-LC ns ns ns p < 0.05
HP-LF Higher compared to control p < 0.05 ns Higher compared to SM and HP-LC
Insulin Between groups Within group
% change of baseline PWS Control PWS Control
1-hour Higher after HP-LF meal compared to SM in
both group p < 0.05 for both groups
SM Higher compared to control at 1,
2 and 3 hours
p < 0.05 p < 0.05 p < 0.05
HP-LC Higher compared to control at 1,
2 and 3 hours
p < 0.05 Higher at 1 and 2 hours compared
to SM
ns
HP-LF Higher compared to control p < 0.05 Higher at 1-hour compared to SM Higher at 1-hour
compared to SM
0 1 2 3 460
80
100
120
140
160
Time (hours)
% o
f b
aselin
e
Glucose
PWS Standard
PWS HP-LC
PWS HP-LF
Control Standard
Control HP-LC
Control HP-LF
A
0 1 2 3 40
500
1000
1500
2000
2500
Time (hours)
% o
f b
aselin
e
Insulin
PWS Standard
PWS HP-LC
PWS HP-LF
Control Standard
Control HP-LC
Control HP-LF
B
Predicted values and SEs of percentage changes relative to baseline (time = 0) of each group at
each time point were based on linear mixed models. SM, standard meal; HP-LC, high protein-
low carbohydrate meal; HP-LF, high protein-low fat meal.
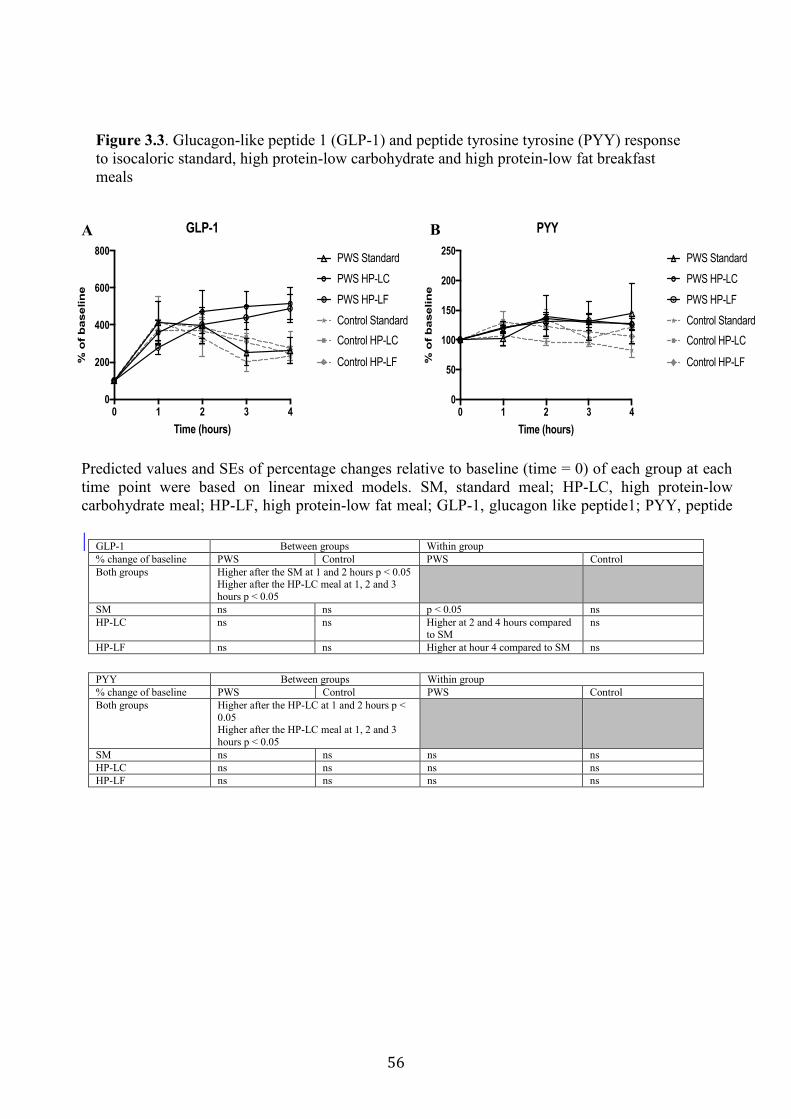
56
Figure 3.3. Glucagon-like peptide 1 (GLP-1) and peptide tyrosine tyrosine (PYY) response
to isocaloric standard, high protein-low carbohydrate and high protein-low fat breakfast
meals
GLP-1 Between groups Within group
% change of baseline PWS Control PWS Control
Both groups Higher after the SM at 1 and 2 hours p < 0.05 Higher after the HP-LC meal at 1, 2 and 3
hours p < 0.05
SM ns ns p < 0.05 ns
HP-LC ns ns Higher at 2 and 4 hours compared to SM
ns
HP-LF ns ns Higher at hour 4 compared to SM ns
PYY Between groups Within group
% change of baseline PWS Control PWS Control
Both groups Higher after the HP-LC at 1 and 2 hours p <
0.05 Higher after the HP-LC meal at 1, 2 and 3
hours p < 0.05
SM ns ns ns ns
HP-LC ns ns ns ns
HP-LF ns ns ns ns
0 1 2 3 40
200
400
600
800
Time (hours)
% o
f b
aselin
e
GLP-1
PWS Standard
PWS HP-LC
PWS HP-LF
Control Standard
Control HP-LC
Control HP-LF
A
0 1 2 3 40
50
100
150
200
250
Time (hours)%
of
baselin
e
PYY
PWS Standard
PWS HP-LC
PWS HP-LF
Control Standard
Control HP-LC
Control HP-LF
B
Predicted values and SEs of percentage changes relative to baseline (time = 0) of each group at each
time point were based on linear mixed models. SM, standard meal; HP-LC, high protein-low
carbohydrate meal; HP-LF, high protein-low fat meal; GLP-1, glucagon like peptide1; PYY, peptide
tyrosine tyrosine.
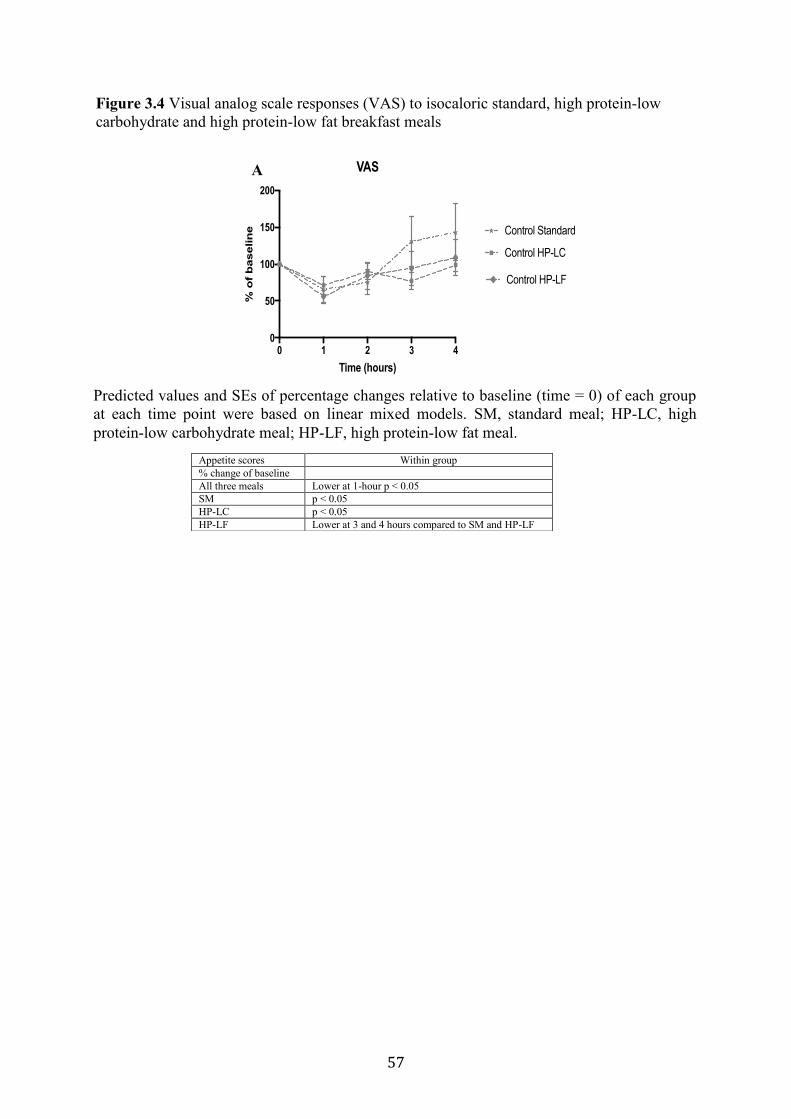
57
0 1 2 3 40
50
100
150
200
Time (hours)
% o
f b
aselin
e
VAS
Control Standard
Control HP-LC
Control HP-LF
A
Figure 3.4 Visual analog scale responses (VAS) to isocaloric standard, high protein-low
carbohydrate and high protein-low fat breakfast meals
Appetite scores Within group
% change of baseline
All three meals Lower at 1-hour p < 0.05
SM p < 0.05
HP-LC p < 0.05
HP-LF Lower at 3 and 4 hours compared to SM and HP-LF
Predicted values and SEs of percentage changes relative to baseline (time = 0) of each group
at each time point were based on linear mixed models. SM, standard meal; HP-LC, high
protein-low carbohydrate meal; HP-LF, high protein-low fat meal.
58
Chapter 4 Serum Asprosin Concentrations in Children with Prader-Willi Syndrome:
Correlations with Adiposity-Related Parameters
4.1 Preface
The following chapter is based on data collected from 52 children [23 children with Prader-
Willi syndrome (PWS) and 29 children with obesity and healthy weight]. Children with PWS
were recruited from the Pediatric Endocrinology clinic, Stollery Children's Hospital
(Edmonton, Alberta, Canada) and National Institutes of Health, Bethesda, (Bethesda,
Maryland, United State). Controls were recruited from the Pediatric Centre for Weight and
Health, Edmonton General Continuing Care Centre, Child Health Clinic, Misericordia
Hospital (Edmonton, Alberta, Canada). The orexigenic hormone ghrelin was reported to be
higher in individuals with PWS at fasting and postprandially, which Chapter 3 also confirms.
Asprosin is a newly discovered hormone, considered a second orexigenic hormone. Asprosin
use the same neuropeptide tyrosine (NPY)/agouti-related peptide (AgRP) pathway as ghrelin
to stimulate appetite. Therefore, this chapter aimed to measure serum asprosin concentrations
in children with PWS compared to children with obesity and healthy weight. In a subgroup
analysis, we matched children with PWS with body mass index (BMI) z-score-matched
children and measured the correlation to glucose, insulin, insulin resistance, percentage of
body fat, acyl ghrelin (AG) and leptin. Ms. Maha Alsaif contributed to the study design
formation, data analysis, performed the statistical analysis, and was responsible for data
interpretation and writing the initial manuscript. She was supported by ongoing discussions
with Drs. Andrea Haqq and Carla Prado. This manuscript is being prepared for submission to
Pediatric Obesity.
59
4.2 Introduction
Prader-Willi syndrome (PWS) is a unique clinical model of disordered satiety and
paradoxical fasting and postprandial hyperghrelinemia (Haqq et al., 2008). PWS is
characterized by a failure to thrive and low muscle tone during infancy, followed by severe
obesity in childhood (Cassidy, Schwartz, Miller, & Driscoll, 2012; Curfs & Fryns, 1992). The
pathogenesis of obesity in children with PWS has been ascribed to several factors, including
high circulating concentrations of ghrelin because ghrelin stimulates food intake and weight
gain (Atalayer et al., 2013).
Asprosin is a newly-discovered protein hormone produced by the white adipose tissue
discovered by identifying two patients with neonatal progeroid syndrome (NPS) who were
insulin sensitive despite having lipodystrophy (Romere et al., 2016). In addition, they
consumed less food than age matched controls. These findings raised the question of why
these NPS patients do not display a typical lipodystophic phenotype. To address this
question, Romere et al. (2016) performed genetic analysis of the two NPS patients. These
patients had a truncating mutation in FBN1 (which encodes profibrillin). This mutation
resulted in the loss of the C-terminal cleavage product of profibrillin, which later named
asprosin (Romere et al., 2016). Romere et al., (2016) observed that FBN1 mRNA expression
levels were highest in adipose tissue across all tissues, which suggests that adipose tissue is
the source of asprosin. Immunoblotting techniques have previously shown Asprosin to be a
single protein (found to be around 30 kDa when run on SDS-PAGE). This hormone is
predicted to have three N-linked glycosylation sites in humans (Romere et al., 2016). It
stimulates hepatic glucose production via the G protein-coupled receptor (GPCR)-activated
cAMP signaling pathway and is correlated with insulin resistance (Romere et al., 2016). This
explains why NPS patients lacking this hormone appear to be protected from insulin
resistance. Additionally, circulating asprosin concentrations increased with fasting in mice,
rats, and humans, and decreases with food intake (Beutler & Knight, 2018). This suggested
that asprosin may act as a circulating orexigenic signal that stimulates appetite and food
intake similar to ghrelin (Beutler & Knight, 2018). Asprosin interacts with the neuropeptide
tyrosine (NPY)/agouti-related peptide (AgRP) pathway to exert its effects on appetite
(Beutler & Knight, 2018).
Fasting asprosin has been measured only in one study in adults with obesity and in
one study in children with obesity (Long et al., 2019; Wang et al., 2018). Wang et al., (2018)
reported significantly higher concentrations of fasting asprosin in adults with obesity than in
healthy weight participants (Wang et al., 2018). By contrast, in children with obesity, fasting
60
asprosin is lower than in children with healthy weight (Long et al., 2019). However, it is not
clear whether asprosin concentrations are altered in children with PWS and children with
non-syndromic obesity and healthy weight. Therefore, the current study measured the
concentrations of serum asprosin in children with PWS, children with obesity and children
with healthy weight, and assessed the relationship of asprosin concentrations to glucose,
insulin, insulin resistance, acyl ghrelin (AG), leptin, and percentage of body fat.
4.3 Materials and Methods
4.3.1 Population
The study population consisted of 52 children (23 children with PWS and 29 children with
obesity and healthy weight). Seventeen participants (10 children with PWS and 7 body mass
index (BMI) z-score matched children) had participated in the previously described study of
dietary macronutrient regulation of AG and desacyl ghrelin concentrations in children with
PWS (Chapter 3). Three participants (1 child with PWS and 2 controls) had participated in
the study of the effect of high protein diet on diet-induced thermogenesis in children with
PWS (Chapter 5). Thirty-two children (12 children with PWS and 20 controls) were
recruited from the Pediatric Endocrinology Clinics, Stollery Children's Hospital, Pediatric
Centre for Weight and Health, Edmonton General Continuing Care Centre, Child Health
Clinic, Misericordia Hospital, and National Institutes of Health, Bethesda, Maryland. We
excluded individuals with medical conditions known to affect body composition, such as
diabetes mellitus, chronic inflammatory bowel disease, chronic severe liver, kidney disease or
neurologic disorders, and those individuals who have been taking an investigational drug in
the past year. The diagnosis of PWS was confirmed by DNA methylation and fluorescence in
situ hybridization genetic analysis. The University of Alberta’s Health Research Ethics Board
and National Institutes of Health research ethics board approved the study. Written informed
consent and assent were obtained from all participants and parents.
4.3.2 Anthropometry and Body Composition
Weight was measured to the nearest 0.1kg using the same calibrated scale. Height was
measured to the nearest 0.1cm using a wall-mounted stadiometer for children. BMI standard
deviation (SD) score was calculated using EpiInfo (CDC, Atlanta, GA). Body composition
(percentage of body fat) was measured by air displacement plethysmography (BOD POD,
Life Measurement Inc.) Waist circumference (WC) was measured in centimetre (cm) at the
top of the iliac crest using standardized techniques.
61
4.3.3 Experimental Design
In a cross-sectional study design, participants arrived to the research unit following an 8-hour
fast; weight and height were recorded. Body composition was measured in 17 participants (10
children with PWS and 7 controls). Blood samples were collected at baseline. In a subgroup
of participants (10 children with PWS and 7 controls), blood samples were collected 60
minutes after consuming a 350 kcal standard meal (SM) breakfast containing 55%
carbohydrate, 30% fat and 15% protein, which represents a typical Canadian diet (Garriguet,
2007).
4.3.4 Preparation of Samples
Blood samples for the determination of asprosin concentrations were collected into serum
separator tubes supplemented with aprotinin (10 uL per 1mL serum). Following
centrifugation, serum was stored at -80°C until assayed. Blood samples for the determination
of glucose, insulin, AG and leptin were described elsewhere (see Chapter 3, section 3.3.3:
Preparation of Samples). All analyses were measured in duplicate.
4.3.5 Hormone and Adipocytokine Assays
Fasting and 1-hour post-meal serum concentrations of asprosin were measured in duplicate
using an enzyme-linked immunosorbent assay kit, with intra-assay coefficients of variation
(CVs) < 10% and inter-assay CVs < 12% (Catalogue No. abx257694; Abbexa, Cambridge,
UK). Asprosin was assayed concurrently on previously unthawed frozen serum. The serum
samples were diluted to 1:2 with the diluent (0.01 mol/L PBS). Data from additional
hormones (glucose, insulin, AG and leptin) were described in (Chapter 3 section 3.3.4:
Hormone and Adipocytokine Assays) and have been included here. Homeostatic model
assessment insulin resistance (HOMA-IR) was calculated as fasting glucose (mg/dL) ×
fasting insulin (μIU/mL) ÷ 405.
4.3.6 Statistical Analysis
Data are presented as median and interquartile range, because of the non-normal distribution
for many variables. The Shapiro-Wilk Test was used to test for normality. All null hypotheses
for between-group comparisons for age, sex, BMI z-score, fasting asprosin, glucose, insulin,
HOMA-IR and WC were examined using Kruskal-Wallis H test (for three group
62
comparisons). In the subgroups analysis, between-group comparisons for percentage of body
fat, asprosin, 1-hour post-meal asprosin, and AG were examined using the nonparametric.
Two-sample Wilcoxon Rank-Sum test Sum (Mann-Whitney) (for two group comparisons).
The Wilcoxon Signed-Rank Test was used for within-group comparison of fasting asprosin
and 1-hour post-meal asprosin. The correlation between age, BMI z-score, percentage of
body fat, glucose, insulin, HOMA-IR, WC, leptin and AG, and fasting were determined using
a Spearman’s Rank-Order correlation. Partial correlation analyses were performed to evaluate
the relationships between fasting asprosin and 1-hour postprandial asprosin and percentage of
body fat, glucose, insulin, HOMA-IR, WC, leptin and AG adjusted for potential confounders
(age, sex and BMI z-score). All statistical analyses were performed using SPSS version 24
for Windows (SPSS Inc., Chicago, IL) and GraphPad Prism 7 software (GraphPad Software
Inc.). A value of p ≤ 0.05 was considered statistically significant.
4.4 Results
4.4.1 Baseline Anthropometric and Metabolic Characteristics
Baseline characteristics of study participants are shown in (Table 4.1). We studied a total of
52 children—23 with PWS, 8 with obesity, and 21 with healthy weight. Groups were
comparable for sex distribution, asprosin, glucose, insulin and HOMA-IR. Median age values
were comparable among children with obesity and children with healthy weight, but lower in
children with PWS (p = 0.05). Median BMI z-score values were lower in children with PWS
compared to children with obesity (p = 0.008) and lower in children with healthy weight
compared to children with PWS and obesity (p = 0.007 and p < 0.001, respectively). Waist
circumference values were comparable between children with PWS, children with obesity,
and children with healthy weight. However, WC was lower in children with healthy weight
when compared to children with obesity (p = 0.008). Five participants with PWS had
uniparental disomy; all others had a chromosome 15 deletion. All PWS individuals had free
thyroxine (T4) and thyroid stimulating hormone (TSH) concentrations in the normal range.
Eighteen participants with PWS were taking growth hormone (GH) treatment prior to study
enrollment; no changes in GH treatment were made during the course of the study. Of the
other five participants, three had been previously treated with GH, but were not taking GH at
the time of the study; two participants had never been treated with GH. In the subgroups of
study participants, there were 10 children with PWS and 7 BMI z-matched children;
characteristics of study participants are shown in (Table 4.2). The children with PWS group
included more females and were younger (p = 0.002 and p = 0.05, respectively) and had
63
lower fasting concentrations of glucose (p = 0.04) and showed a lower HOMA-IR (p = 0.05)
compared to BMI z-matched children. Fasting asprosin, insulin, percentage of body fat, WC
and leptin were comparable between groups. However, children with PWS had higher fasting
concentrations of AG (p = 0.02) compared to BMI z-matched children.
4.4.2 Postprandial Asprosin
Fasting serum asprosin and 1-hour post-meal serum asprosin did not differ between children
with PWS and BMI-z matched children (p = 0.60 and p = 0.87, respectively) (Figure 4.1 A
and B). The decrease in serum asprosin relative to baseline was not different between
children with PWS and BMI-z matched children (p = 0.80).
4.4.3 Correlation Between Asprosin and Metabolic Parameters
Correlation analyses were performed between asprosin concentration and clinical and
biochemical parameters in children with PWS, children with obesity and healthy weight
children (Table 4.3). The analyses showed a negative correlation of asprosin concentration
with age and insulin and HOMA-IR (rs = -0.71, p = 0.05, rs = -0.95, p = 0.001 and rs = -0.95,
p = 0.001) in children with obesity and with age in healthy weight children (rs = -0.45, p =
0.04) (Table 4.3). No significant correlations were found between asprosin and age, BMI z-
score, WC, glucose, insulin and HOMA-IR in children with PWS. After adjusting for age,
sex and BMI z-score, asprosin showed a positive correlation with glucose (rs = 0.92, p =
0.02) in children with obesity but not in children with PWS or healthy weight children (Table
4.4).
In the subgroup analyses, children with PWS and BMI z-matched children correlation
analyses were performed between fasting asprosin and body composition (BMI z-score, WC
and percentage of body fat), and clinical and biochemical parameters (age, glucose, insulin,
HOMA-IR, leptin and AG) (Table 4.5). Fasting asprosin was positively correlated with AG
(rs = 0.62, p = 0.05) in children with PWS, but not in BMI z-matched children (Table 4.5).
Furthermore, 1-hour postprandial asprosin was negatively correlated with insulin (rs = -0.62,
p = 0.05) in children with PWS but not in BMI z-matched children (Table 4.5). However,
when adjusting for age, sex and BMI z-score, the correlation between fasting asprosin and
AG and 1-hour postprandial asprosin and insulin were no longer existed (Table 4.6).
64
4.5 Discussion
This is the first study to compare fasting asprosin in children with PWS, children with
obesity, and healthy weight children, and to analyze its relationship to glucose, insulin,
HOMA-IR, and WC. In the subgroup of study participants, we assessed fasting and 1-hour
postprandial asprosin in children with PWS and BMI z -score matched children and its
relationship to glucose, insulin, HOMA-IR, ghrelin, leptin, WC and percentage of body fat.
In children with PWS, fasting asprosin was positively correlated with AG and 1-hour
postprandial asprosin was negatively correlated with insulin. Both asprosin and ghrelin are
orexigenic hormones that stimulate appetite and food intake (Beutler & Knight, 2018).
Additionally, fasting asprosin was negatively correlated with age and insulin in children with
obesity and with age in healthy weight children. After adjusting for age, sex and BMI z-score,
asprosin showed a positive correlation with glucose in children with obesity but not in
children with PWS or healthy weight children. This is in disagreement with Long et al.
(2019) who reported that fasting asprosin was negatively correlated with BMI z-score,
insulin, and HOMA-IR in children with obesity and healthy weight.
Excessive adiposity leads to dysfunction of adipokines and metabolic disorders (Clark
& Hoenig, 2016; Czech, 2017). This present study indicated that serum asprosin was
positively correlated with insulin and glucose in children with obesity. Following the
increased in asprosin concentrations, glucose was gradually increased. Children with obesity
are at higher risk of developing type 2 diabetes (T2D) compared to healthy weight children
(Abbasi, Juszczyk, van Jaarsveld, & Gulliford, 2017). This finding is in agreement with
Zhang et al. (2019) who found a positive correlation between serum asprosin and glucose in
adults with T2D (Zhang et al., 2019). These findings suggest that asprosin might be a risk
factor associated with the development of T2D.
There is a relationship between increased adiposity and insulin resistance (Mokdad et
al., 2003). In adults with insulin resistance, asprosin concentrations were higher and
positively correlated with insulin resistance (Li et al., 2018). The insulin and HOMA-IR
concentrations in children with PWS and control children in the current study were low,
suggesting they are metabolically healthy (Iacobini, Pugliese, Blasetti Fantauzzi, Federici, &
Menini, 2019). It has been well documented that children with PWS are insulin sensitive
(Haqq et al., 2011; Irizarry et al., 2019). This may explain why a relationship between
asprosin and HOMA-IR was not observed.
We did not detect significant difference in fasting asprosin concentrations among
children with PWS, children with obesity, and healthy weight children, or in the subgroup
65
analysis between children with PWS and BMI z-score matched children. However, a previous
study of 117 adults with obesity (BMI 41.6 ± 6.3 kg/m2) and 57 healthy weight adults (BMI
= 25.3 ± 3.6 kg/m2) reported that fasting asprosin concentrations were significantly higher in
adults with obesity when compared to healthy weight participants (2360 ± 5094 ng/ml vs.
307 ± 833 ng/ml, p < 0.000) (Wang et al., 2018). The finding of higher asprosin
concentrations in adults with obesity is in disagreement with Long et al. (2019) who reported
lower fasting asprosin concentrations in 47 children with obesity (BMI z-score = 2.09 ±0.47
for boys and 2.22 ± 1.08 for girls) than in the 40 children with healthy weight (BMI z-score =
–0.52 ± 0.84 for boys and –0.27 ± 0.95 for girls) (9.24 ± 4.11 ng/mL vs. 12.33 ± 4.18 ng/mL,
p < 0.001) (Long et al., 2019).
This discrepancy can be attributed to the degree of obesity, and may also be an
important factor affecting asprosin concentrations. In Wang et al. (2018) the average BMI for
adults with obesity was > 35 kg/m2, which is 3 SD higher than in the Long et al. (2019)
study. Another possibility may be that the discrepancies are due to the use of BMI and BMI
z-score to define obesity; however, BMI and BMI z-scores do not accurately measure fat
mass or muscle mass (Prado & Heymsfield, 2014). It has been reported that asprosin is
secreted from adipocytes (Romere et al., 2016); it is not clear whether the high BMI and BMI
z-score in previous studies is due to increase in fat mass or fat-free mass. In the current study,
in the subgroup analysis, children with PWS and children with BMI z-score matched children
had a comparable percentage of fat mass, which could explain why we did not observe any
differences in fasting asprosin between the two groups.
Also, the difference between our findings and those of Wang et al. (2018) and Long et
al. (2019) may due to the inconsistency of the methods used to obtain asprosin measurement.
Wang et al. (2018) diluted serum samples in 1:4 with the diluent (2% non-fat milk, 0.05%
Tween 20, PBS) and used an in-house assay. In Long et al. (2019) it was not clear whether
the samples were diluted and the asprosin concentrations were determined by a commercial
ELISA kit according to the manufacturer’s instructions (Human ELISA Kit; Wuhan EIAab
Science Co. Ltd., China).
In the current study, serum samples were diluted to 1:2 with the diluent (0.01 mol/L
PBS) and measured in duplicate using an enzyme-linked immunosorbent assay kit (Catalogue
No. abx257694; abbexa, Cambridge, UK). Therefore, differences in blood collection and
processing methods, as well as the timing of the blood draw may explain the conflicting
findings between studies
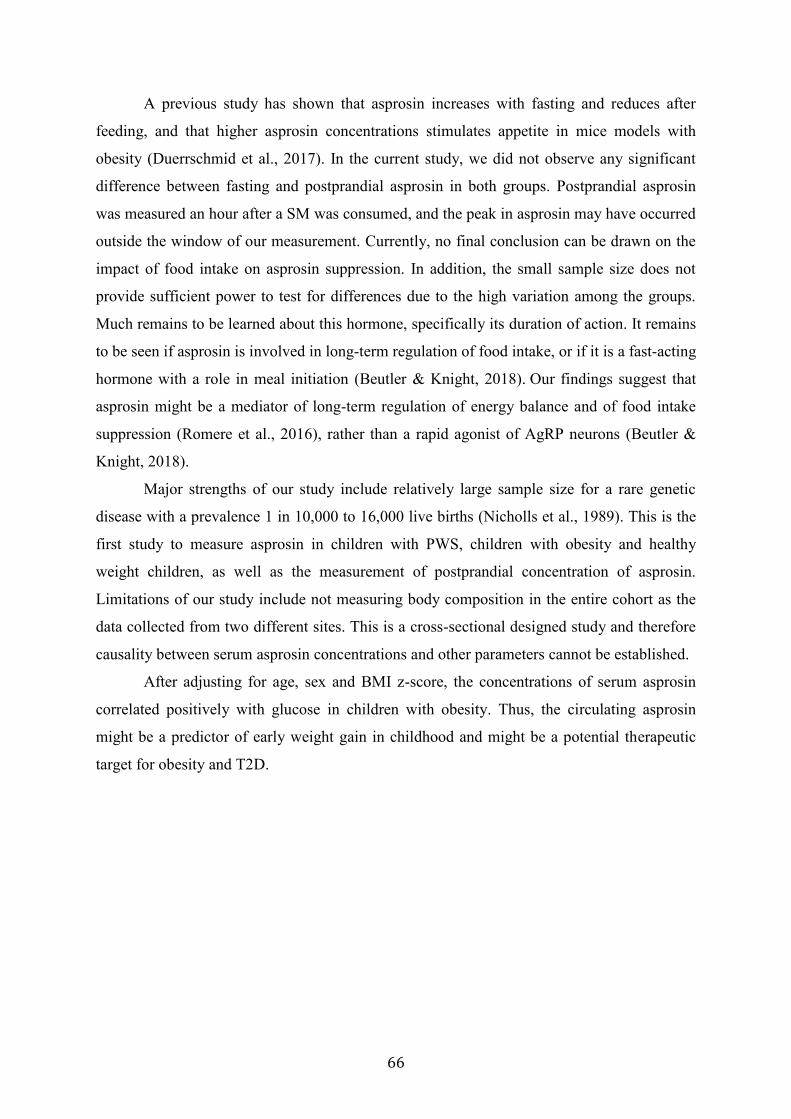
66
A previous study has shown that asprosin increases with fasting and reduces after
feeding, and that higher asprosin concentrations stimulates appetite in mice models with
obesity (Duerrschmid et al., 2017). In the current study, we did not observe any significant
difference between fasting and postprandial asprosin in both groups. Postprandial asprosin
was measured an hour after a SM was consumed, and the peak in asprosin may have occurred
outside the window of our measurement. Currently, no final conclusion can be drawn on the
impact of food intake on asprosin suppression. In addition, the small sample size does not
provide sufficient power to test for differences due to the high variation among the groups.
Much remains to be learned about this hormone, specifically its duration of action. It remains
to be seen if asprosin is involved in long-term regulation of food intake, or if it is a fast-acting
hormone with a role in meal initiation (Beutler & Knight, 2018). Our findings suggest that
asprosin might be a mediator of long-term regulation of energy balance and of food intake
suppression (Romere et al., 2016), rather than a rapid agonist of AgRP neurons (Beutler &
Knight, 2018).
Major strengths of our study include relatively large sample size for a rare genetic
disease with a prevalence 1 in 10,000 to 16,000 live births (Nicholls et al., 1989). This is the
first study to measure asprosin in children with PWS, children with obesity and healthy
weight children, as well as the measurement of postprandial concentration of asprosin.
Limitations of our study include not measuring body composition in the entire cohort as the
data collected from two different sites. This is a cross-sectional designed study and therefore
causality between serum asprosin concentrations and other parameters cannot be established.
After adjusting for age, sex and BMI z-score, the concentrations of serum asprosin
correlated positively with glucose in children with obesity. Thus, the circulating asprosin
might be a predictor of early weight gain in childhood and might be a potential therapeutic
target for obesity and T2D.
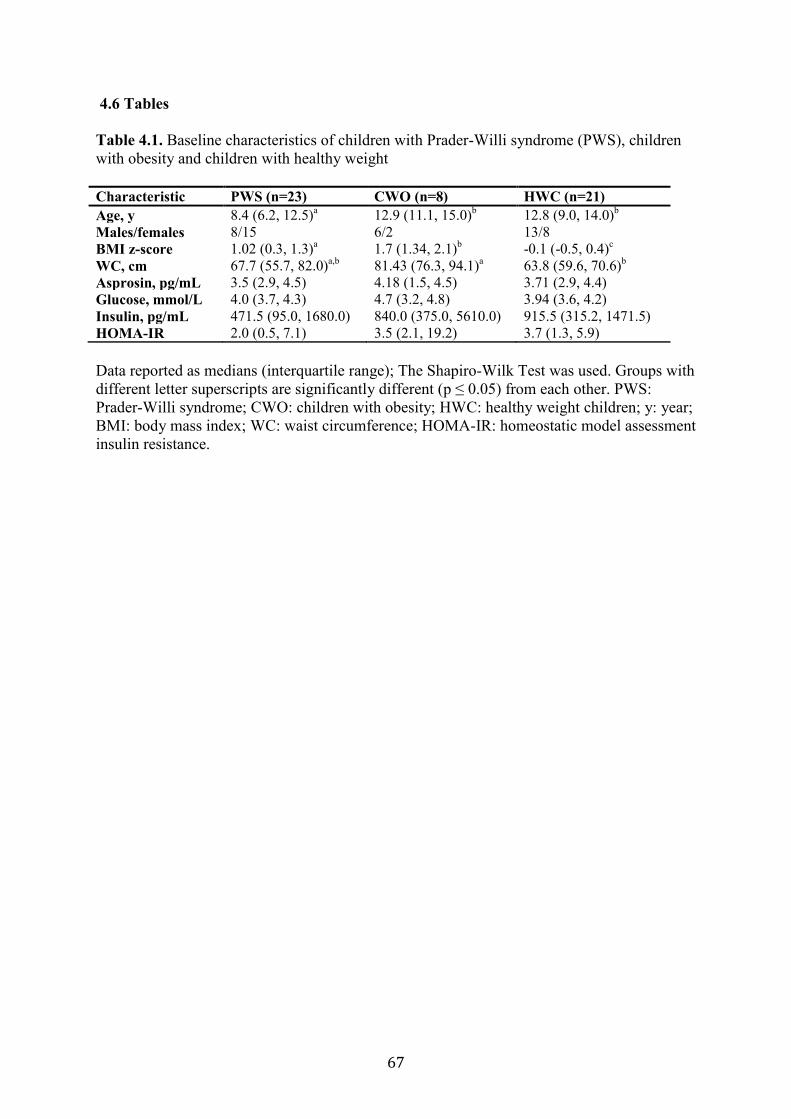
67
4.6 Tables
Table 4.1. Baseline characteristics of children with Prader-Willi syndrome (PWS), children
with obesity and children with healthy weight
Characteristic PWS (n=23) CWO (n=8) HWC (n=21)
Age, y 8.4 (6.2, 12.5)a 12.9 (11.1, 15.0)
b 12.8 (9.0, 14.0)
b
Males/females 8/15 6/2 13/8
BMI z-score 1.02 (0.3, 1.3)a 1.7 (1.34, 2.1)
b -0.1 (-0.5, 0.4)
c
WC, cm 67.7 (55.7, 82.0)a,b
81.43 (76.3, 94.1)a 63.8 (59.6, 70.6)
b
Asprosin, pg/mL 3.5 (2.9, 4.5) 4.18 (1.5, 4.5) 3.71 (2.9, 4.4)
Glucose, mmol/L 4.0 (3.7, 4.3) 4.7 (3.2, 4.8) 3.94 (3.6, 4.2)
Insulin, pg/mL 471.5 (95.0, 1680.0) 840.0 (375.0, 5610.0) 915.5 (315.2, 1471.5)
HOMA-IR 2.0 (0.5, 7.1) 3.5 (2.1, 19.2) 3.7 (1.3, 5.9)
Data reported as medians (interquartile range); The Shapiro-Wilk Test was used. Groups with
different letter superscripts are significantly different (p ≤ 0.05) from each other. PWS:
Prader-Willi syndrome; CWO: children with obesity; HWC: healthy weight children; y: year;
BMI: body mass index; WC: waist circumference; HOMA-IR: homeostatic model assessment
insulin resistance.
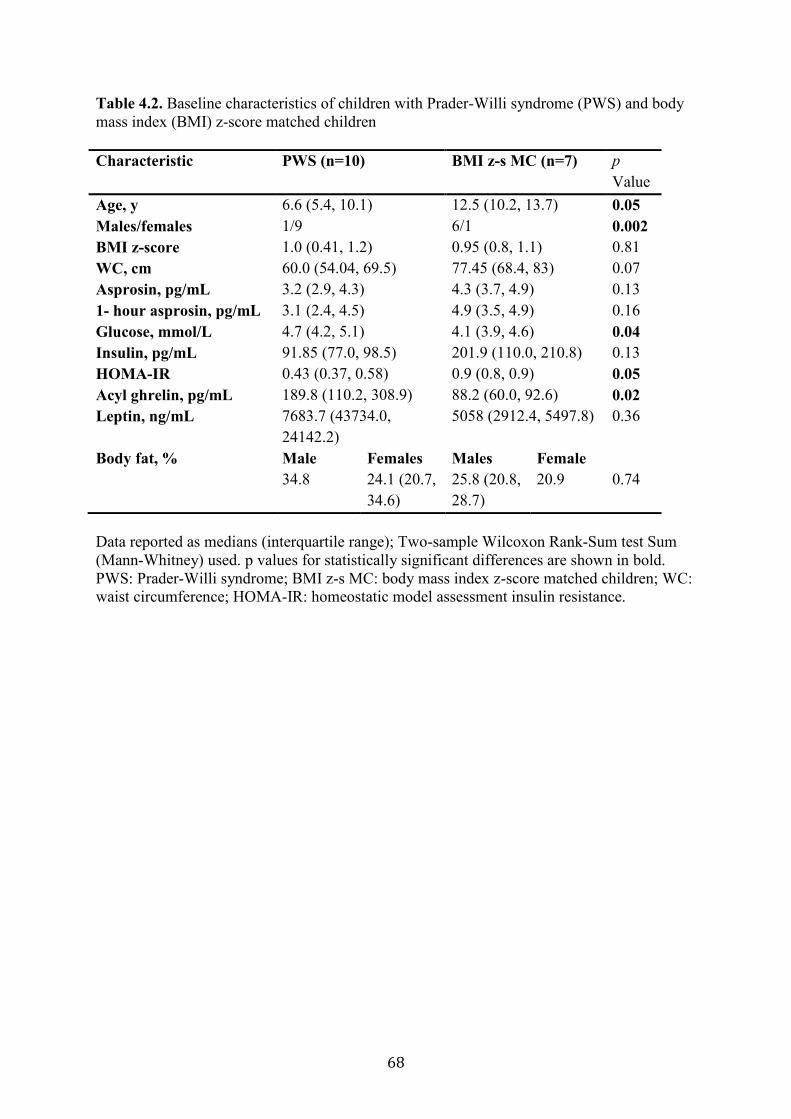
68
Table 4.2. Baseline characteristics of children with Prader-Willi syndrome (PWS) and body
mass index (BMI) z-score matched children
Characteristic PWS (n=10) BMI z-s MC (n=7) p
Value
Age, y 6.6 (5.4, 10.1) 12.5 (10.2, 13.7) 0.05
Males/females 1/9 6/1 0.002
BMI z-score 1.0 (0.41, 1.2) 0.95 (0.8, 1.1) 0.81
WC, cm 60.0 (54.04, 69.5) 77.45 (68.4, 83) 0.07
Asprosin, pg/mL 3.2 (2.9, 4.3) 4.3 (3.7, 4.9) 0.13
1- hour asprosin, pg/mL 3.1 (2.4, 4.5) 4.9 (3.5, 4.9) 0.16
Glucose, mmol/L 4.7 (4.2, 5.1) 4.1 (3.9, 4.6) 0.04
Insulin, pg/mL 91.85 (77.0, 98.5) 201.9 (110.0, 210.8) 0.13
HOMA-IR 0.43 (0.37, 0.58) 0.9 (0.8, 0.9) 0.05
Acyl ghrelin, pg/mL 189.8 (110.2, 308.9) 88.2 (60.0, 92.6) 0.02
Leptin, ng/mL 7683.7 (43734.0,
24142.2)
5058 (2912.4, 5497.8) 0.36
Body fat, % Male Females Males Female
34.8 24.1 (20.7,
34.6)
25.8 (20.8,
28.7)
20.9 0.74
Data reported as medians (interquartile range); Two-sample Wilcoxon Rank-Sum test Sum
(Mann-Whitney) used. p values for statistically significant differences are shown in bold.
PWS: Prader-Willi syndrome; BMI z-s MC: body mass index z-score matched children; WC:
waist circumference; HOMA-IR: homeostatic model assessment insulin resistance.
69
Table 4.3. Spearman correlations of fasting asprosin to other metabolic parameters in
children with Prader-Willi syndrome (PWS), children with obesity and children with healthy
weight
PWS CWO HWC
r p r p r p
Age 0.17 0.45 -0.71 0.05 -0.45 0.04
BMI z-score 0.32 0.14 -0.71 0.87 -019 0.34
WC, cm 0.24 0.26 -0.33 0.42 -0.32 0.16
Glucose, mmol/L 0.04 0.85 0.18 0.67 -0.70 0.76
Insulin, pg/mL 0.29 0.18 -0.95 0.001 -0.36 0.10
HOMA-IR 0.32 0.13 -0.95 0.001 -0.38 0.08
PWS: Prader-Willi syndrome; CWO: children with obesity; HWC: healthy weight children;
BMI: body mass index; WC: waist circumference; HOMA-IR: homeostatic model assessment
insulin resistance. p values for statistically significant differences are shown in bold.
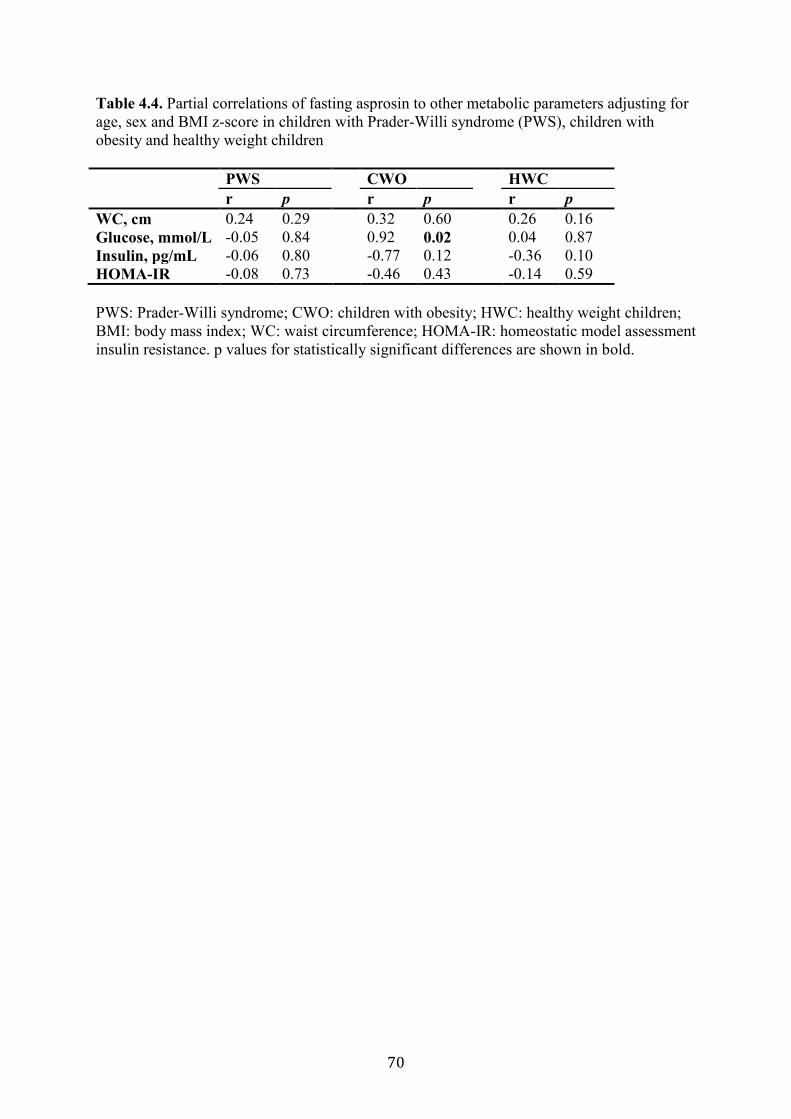
70
Table 4.4. Partial correlations of fasting asprosin to other metabolic parameters adjusting for
age, sex and BMI z-score in children with Prader-Willi syndrome (PWS), children with
obesity and healthy weight children
PWS CWO HWC
r p r p r p
WC, cm 0.24 0.29 0.32 0.60 0.26 0.16
Glucose, mmol/L -0.05 0.84 0.92 0.02 0.04 0.87
Insulin, pg/mL -0.06 0.80 -0.77 0.12 -0.36 0.10
HOMA-IR -0.08 0.73 -0.46 0.43 -0.14 0.59
PWS: Prader-Willi syndrome; CWO: children with obesity; HWC: healthy weight children;
BMI: body mass index; WC: waist circumference; HOMA-IR: homeostatic model assessment
insulin resistance. p values for statistically significant differences are shown in bold.
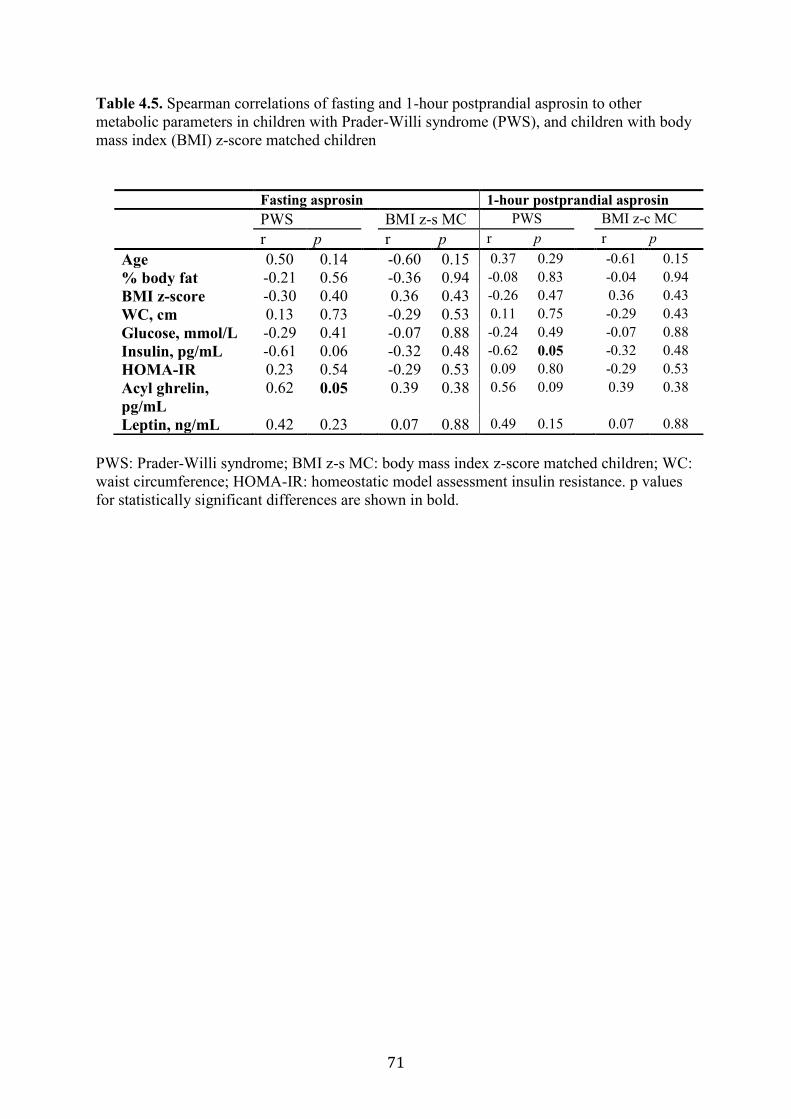
71
Table 4.5. Spearman correlations of fasting and 1-hour postprandial asprosin to other
metabolic parameters in children with Prader-Willi syndrome (PWS), and children with body
mass index (BMI) z-score matched children
PWS: Prader-Willi syndrome; BMI z-s MC: body mass index z-score matched children; WC:
waist circumference; HOMA-IR: homeostatic model assessment insulin resistance. p values
for statistically significant differences are shown in bold.
Fasting asprosin 1-hour postprandial asprosin
PWS BMI z-s MC PWS BMI z-c MC
r p r p r p r p
Age 0.50 0.14 -0.60 0.15 0.37 0.29 -0.61 0.15
% body fat -0.21 0.56 -0.36 0.94 -0.08 0.83 -0.04 0.94
BMI z-score -0.30 0.40 0.36 0.43 -0.26 0.47 0.36 0.43
WC, cm 0.13 0.73 -0.29 0.53 0.11 0.75 -0.29 0.43
Glucose, mmol/L -0.29 0.41 -0.07 0.88 -0.24 0.49 -0.07 0.88
Insulin, pg/mL -0.61 0.06 -0.32 0.48 -0.62 0.05 -0.32 0.48
HOMA-IR 0.23 0.54 -0.29 0.53 0.09 0.80 -0.29 0.53
Acyl ghrelin,
pg/mL
0.62 0.05 0.39 0.38 0.56 0.09 0.39 0.38
Leptin, ng/mL 0.42 0.23 0.07 0.88 0.49 0.15 0.07 0.88
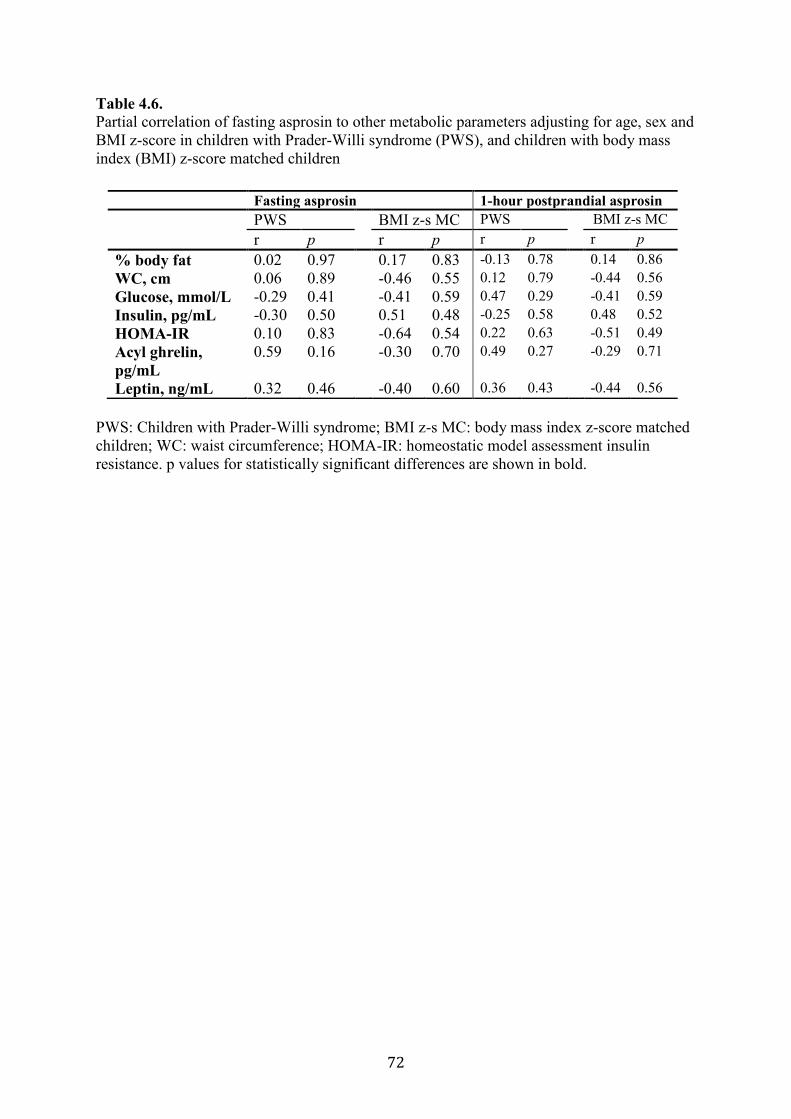
72
Table 4.6.
Partial correlation of fasting asprosin to other metabolic parameters adjusting for age, sex and
BMI z-score in children with Prader-Willi syndrome (PWS), and children with body mass
index (BMI) z-score matched children
PWS: Children with Prader-Willi syndrome; BMI z-s MC: body mass index z-score matched
children; WC: waist circumference; HOMA-IR: homeostatic model assessment insulin
resistance. p values for statistically significant differences are shown in bold.
Fasting asprosin 1-hour postprandial asprosin
PWS BMI z-s MC PWS BMI z-s MC
r p r p r p r p
% body fat 0.02 0.97 0.17 0.83 -0.13 0.78 0.14 0.86
WC, cm 0.06 0.89 -0.46 0.55 0.12 0.79 -0.44 0.56
Glucose, mmol/L -0.29 0.41 -0.41 0.59 0.47 0.29 -0.41 0.59
Insulin, pg/mL -0.30 0.50 0.51 0.48 -0.25 0.58 0.48 0.52
HOMA-IR 0.10 0.83 -0.64 0.54 0.22 0.63 -0.51 0.49
Acyl ghrelin,
pg/mL
0.59 0.16 -0.30 0.70 0.49 0.27 -0.29 0.71
Leptin, ng/mL 0.32 0.46 -0.40 0.60 0.36 0.43 -0.44 0.56
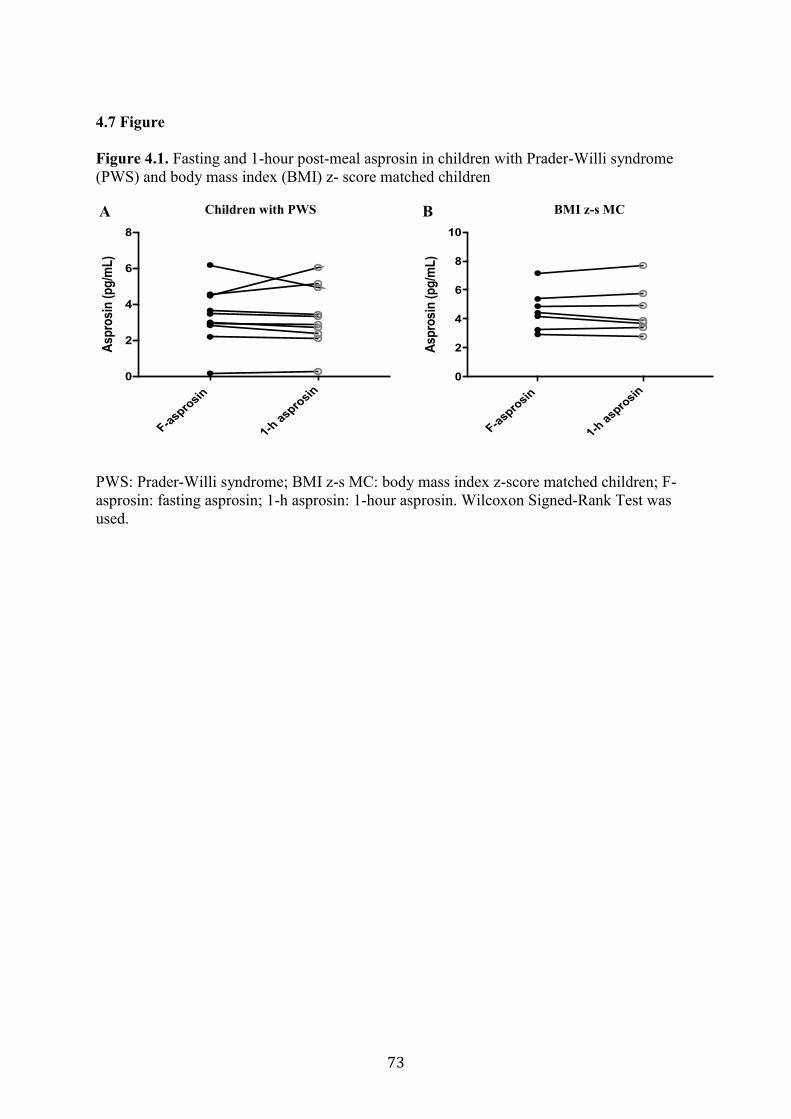
73
4.7 Figure
Figure 4.1. Fasting and 1-hour post-meal asprosin in children with Prader-Willi syndrome
(PWS) and body mass index (BMI) z- score matched children
PWS: Prader-Willi syndrome; BMI z-s MC: body mass index z-score matched children; F-
asprosin: fasting asprosin; 1-h asprosin: 1-hour asprosin. Wilcoxon Signed-Rank Test was
used.
F-aspro
sin
1-h a
sprosin
0
2
4
6
8
Asp
rosi
n (
pg
/mL
)
F-asp
rosin
1-h a
sprosin
0
2
4
6
8
10
Asp
rosin
(p
g/m
L)
A B Children with PWS BMI z-s MC
74
Chapter 5 Effect of High Protein Diet on Postprandial Energy Expenditure in Children
with Prader-Willi Syndrome
5.1 Preface
The following chapter is based on data collected from five youth with Prader-Willi syndrome
(PWS), at the University of Alberta. The study aimed to determine the impact of a high
protein (HP) intake compared to low protein intake on postprandial energy expenditure (PEE)
in children with PWS. This study also examined the correlation between PEE and subjective
appetite sensations in children and youth with PWS. Ms. Maha Alsaif was responsible for
designing the study, recruiting the participants and acquiring the data, performing the
statistical analysis, analyzing the data and writing the first draft of the chapter. She had
discussions and support from Drs. Andrea Haqq and Carla Prado. Ms. Maha Alsaif, Drs.
Michelle Mackenzie, Sarah Elliott, Carla Prado and Andrea Haqq developed the study
design. Drs. Andrea Haqq, Michelle Mackenzie, Sarah Elliott and Carla Prado contributed to
concept of formation, interpretation and editing of the final chapter. This manuscript is being
prepared for submission to Metabolism: Clinical and Experimental.
75
5.2 Introduction
Diet-induced thermogenesis (DIT) is the energy expended through digestion,
absorption and storage of nutrients (Westerterp, 2004b). DIT contributes to approximately 10
– 15% of total energy expenditure (TEE) and this value varies within and between individuals
(Donahoo, Levine, & Melanson, 2004; Scott & Devore, 2005). Even though DIT represents a
small component of TEE, the cumulative impact of altered DIT over time could have a
measurable influence on energy metabolism and metabolic health (Westerterp, 2004b).
Individuals with obesity have lower DIT compared to healthy weight individuals; this
reduction in TEE could explain the weight gain (De Palo et al., 1989; Maffeis et al., 2001;
Marrades et al., 2007; Schutz, Bessard, et al., 1984; Segal et al., 1990; Steiniger et al., 1987).
The weight gain and subsequent obesity in children with Prader-Willi syndrome
(PWS) (as described in Chapter 1) is thought to be caused by a chronic imbalance between
energy intake (EI) and energy expenditure (EE) (Coplin et al., 1976; Holm & Pipes, 1976).
However, there is a paucity of information on DIT in youth with PWS. Attempts to increase
EE by increasing physical activity or DIT has been studied in healthy individuals (children
and adults) (Hill et al., 2012; Nguo et al., 2019; Ruddick-Collins, King, Byrne, & Wood,
2013; Westerterp, 2004b) but not in youth with PWS.
Meals of similar caloric content but different macronutrient composition may impact
DIT, potentially through TEE (Quatela et al., 2016). Substitution of one macronutrient,
particularly protein, for another can positively impact both EI and EE (Austin et al., 2011;
Buchholz & Schoeller, 2004). For example, protein is the most satiating macronutrient and
promotes appetite control, which could help regulate food intake (FI), body-weight loss and
body-weight maintenance (Austin et al., 2011; Gosby et al., 2014; Simpson & Raubenheimer,
2005). Also, higher protein intake is associated with a 50 % increase in fat oxidation
(Labayen, Diez, Parra, Gonzalez, & Martinez, 2004), which could lead to a reduction in body
fat. Studies have reported that increased dietary protein while maintaining energy balance
produced a prolonged DIT, which contributed to a greater TEE (Westerterp-Plantenga et al.,
2009).
However, the DIT measurements are inconsistent among studies (Bessard, Schutz, & Jequier,
1983; Granata & Brandon, 2002; Laville et al., 1993; Leibel, Rosenbaum, & Hirsch, 1995;
Melanson et al., 1998; Nelson et al., 1992; Schutz, Golay, et al., 1984; Segal et al., 1992).
Discrepancy in study protocols contributes to these inconsistencies, such as meal size,
amount of protein, the duration of the post-meal measurement period and the methods used to
76
obtain data. Previous studies have demonstrated an increase in DIT when a meal consisting of
≥ 50% energy from protein was consumed (Johnston, Day, & Swan, 2002; Nguo et al., 2018).
Discrepancies in DIT study measurement protocols is a challenge for interpretation of
findings in healthy-individuals (Westerterp, 2004b). The reported day-to-day in intra-
individual coefficients of variation (CV) of DIT measurements ranges from 15% to 29%
(Armellini et al., 2000; Dabbech et al., 1994; Houde-Nadeau et al., 1993; Piers et al., 1992;
Weststrate, 1993). In addition, the method used to calculate DIT may contribute to the high
variability. Various methods were used to obtained DIT values: calculating the difference
between postprandial and fasting EE (Baum et al., 2015; Dabbech, Boulier, Apfelbaum, &
Aubert, 1996; De Palo et al., 1989; Lloret-Linares et al., 2013; Maffeis et al., 2001; Maffeis
et al., 1993; Purtell et al., 2015; Schutz, Bessard, et al., 1984; Segal et al., 1990; Tentolouris
et al., 2011), subtracting activity energy expenditure (AEE) from TEE (Schutz, Bessard, et
al., 1984), or by assessing the incremental increase in caloric expenditure over resting energy
expenditure (REE) after a meal is ingested (D'Alessio et al., 1988). The majority of studies
calculated DIT as the differences between postprandial energy expenditure (PEE) subtracted
from REE. REE is measured in a fasted state immediately before meal intake (Katzeff &
Danforth, 1989; Laville et al., 1993; Nelson et al., 1992; Schutz, Golay, et al., 1984;
Tentolouris et al., 2008; Welle & Campbell, 1983) as these measurements are affected by FI.
Therefore, differences in dietary intake in the day prior to the REE measurement can affect
the calculated value for DIT (Ruddick-Collins et al., 2013). To minimize the effects of day-
to-day variability in REE measurements in the current study, a baseline value for REE
measured at baseline visit is being used to calculate PEE and articulated as (‘fixed REE’).
There are two aims of the present study: (1) to determine the impact of a high protein (HP)
intake compared to a lower protein (standard) intake on PEE in children with PWS, and (2) to
examine the correlation between a protein meal and subjective appetite sensations in children
with PWS.
5.3 Materials and methods
5.3.1 Population
We recruited five youth with PWS (four females and one male). We excluded individuals
with medical conditions known to affect body composition, such as diabetes mellitus, chronic
inflammatory bowel disease, chronic severe liver, kidney disease or neurologic disorders, and
those individuals who have been taking an investigational drug in the past year. The
diagnosis of PWS was confirmed by DNA methylation and fluorescence in situ hybridization
77
genetic analysis. The study was approved by the University of Alberta's Health Research
Ethics Board. Written informed consent and assent were obtained from all participants and
parents.
5.3.2 Experimental design and testing procedure
A randomized, not blinded crossover study, in youth with PWS, was performed over 3 study
visits at the University of Alberta. The impact of a HP meal contains 50% of total energy
form protein was compared to a standard protein meal contains 15% of total energy on PEE.
Study visits were separated by a two to four-week washout period to control for menstrual
cycle (Bisdee, James, & Shaw, 1989). Each participant served as his/her own comparison.
Trial design for study visits 1, 2 and 3 is shown in (Figure 5.1 Trial design). On the first
visit (baseline) the participants were asked to come to the Human Nutrition Research Unit
(HNRU) at University of Alberta between 0700 and 0800 after an 8-hour fast. Pubertal status
was self-assessed using the Tanner Stage scale. (Appendix A. example for the puberty
assessment). REE was measured continuously for 60 minutes in a whole-body calorimetry
unit (WBCU). Values recorded during this measurement period were used to calculate each
participant’s REE, and 24-hour energy requirements were estimated using the factorial
method (REE x activity factor). A physical activity factor of 1 was used to reflect a
“sedentary lifestyle” commonly observed and previously documented in children with PWS
(Butler et al., 2007a; Eiholzer et al., 2003; Morales et al., 2019).
On test days visit 2 and visit 3 (Figure 5.1. Trial design), anthropometric measurements
were recorded; REE and 6 hours of PEE were measured. All testing was conducted in the
morning after an 8-hour fast.
5.3.3 Test meals
Food consumed by participants was prepared at the HNRU metabolic kitchen by trained staff
and designed with the use of the Food Processor Nutrition Analysis Software (ESHA
Research, Inc., version 10.6.0). The same menu was used for all participants. All food and
beverage servings were weighed so that calorie levels met the individual energy requirements
to maintain current body weight. One day prior to visits 2 and 3, participants were asked to
come the HNRU facility to consume breakfast [standard diet (SD) or HP diet a combined
with whey protein] and received 2 meals (lunch and dinner) and 2 snacks (morning and
evening snacks) to take with them (Appendix B. Diet menu). Two experimental diets were
assessed in randomized order. The SD represents a typical Canadian diet of approximately
78
55% carbohydrate, 30% fat and 15% protein (Garriguet, 2007) and the HP diet consisted of
20% carbohydrate, 30% fat and 50% protein; diets were matching in total energy and fibre
content. Bottled water was provided ad libitum. The macronutrient content of the SD and HP
diet shown in (Table 5.1). To assess adherence with the study diet, participants were asked to
complete a FI track form (Appendix C. Food intake track).
On each of the two test mornings, participants consumed one of the isoenergetic standard
meal (SM) (containing 55% carbohydrate, 30% fat and 15% protein or HP breakfast meal
containing 20% carbohydrate, 30% fat and 50% protein). The breakfast meal with morning
snack was calculated to provide 35% of each participant’s 24-h energy requirements (Gibney
et al., 2018; O'Neil et al., 2014). The morning snack was provided with their breakfast to
reduce hyperphagia associated with PWS (Miller, Strong, & Heinemann, 2015); see (Table
5.2) for meal composition.
5.3.4 Anthropometry and body composition
Weight was measured at each visit to the nearest 0.1kg using the same calibrated scale.
Height was measured to the nearest 0.1cm using a wall-mounted stadiometer for children.
Body mass index (BMI) percentile was calculated using EpiInfo (CDC, Atlanta, GA). Waist
circumference was measured at the top of the iliac crest using standardized techniques. Body
composition (total fat-free mass (FFM), total body fat mass (FM) and percent body fat was
assessed via the air displacement plethysmography (BodPod) measured at baseline visit.
5.3.5 Satiety and appetite
To assess subjective appetite, a motivation to eat visual analog scales (VAS) (100mm) was
used (Stubbs et al., 2000). The VAS collects information through the following six questions:
(1) thinking about food (“no thoughts of food” to “very preoccupied with thought of food and
is difficult to concentrate on anything else”), (2) hunger (“not hungry at all” to “as hungry as
I’ve ever been”), (3) fullness (“not full at all” to “full as I’ve ever been”), (4) desire to eat
(“very little” to “very strong”), (5) prospective consumption (“nothing at all” to “a large
amount”), and urge to eat (“no urge to eat” to “very strong urge to eat”). The following
formula was used to calculate subjective average appetite [(desire to eat) + (hunger) + (100 −
fullness) + (desire to eat) + (prospective food consumption) + (urge to eat)/6]. This appetite
score indicates the overall perceived appetite sensation, as used in other studies (Anderson,
Catherine, Woodend, & Wolever, 2002; Bellissimo, Pencharz, Thomas, & Anderson, 2007;
Belza et al., 2013; Panahi, El Khoury, Luhovyy, Goff, & Anderson, 2013; Samra &

79
Anderson, 2007). VAS questionnaires were assessed in a fasted state, at 15, 30 minutes and
every hour for 4 hours on test visits 2 and 3 (Figure 5.2. Protocol visits 2 and 3) (Appendix
D. Example for VAS).
5.3.6 Blood samples
Blood samples (10 ml per sample) were drawn through an indwelling catheter immediately
prior to meal consumption (after 8 hours of fasting) and at 15, 30 minutes and 1-hour
intervals for 4 hours following consumption of the breakfast meal (Figure 5.2. Protocol
visits 2 and 3) in order to determine the nutrient regulation of plasma active ghrelin and other
hormones. Sample preparation has been described elsewhere (see Chapter 3, section 3.3.3:
Preparation of Samples).
5.3.7 Measurement of postprandial energy expenditure
5.3.7.1 Baseline (visit 1). REE was measured for 60 minutes in a WBCU, with the first 30
min excluded from analyses to account for acclimatization after fasting for ≥8 hour and
refraining from exercise for 24 h prior to the test. Participants were in a standardized semi-
reclined position to avoid them falling asleep and were allowed to watch movies to avoid
fidgeting (Dietz et al., 1994). Participants were requested to have only minimal physical
activity on the morning of the test (e.g., get dressed; drive from home to the HNRU; and take
the short walk from the parking lot to the HNRU).
5.3.7.2 Postprandial energy expenditure (test visits 2 and 3). The measurement of DIT is
strict, and requires that participants remain supine but awake during 6 hours of measurements
(Reed & Hill, 1996). Therefore, PEE was measured instead of DIT. Participants were in a
standardized semi-reclined position and were allowed to watch movies (Dietz et al., 1994;
Weststrate et al., 1990). An overview of the protocol is included (Figure 5.2. Protocol visits
2 and 3). Upon arrival at the HNRU, anthropometric measurements and fasting blood sample
were taken and a catheter was inserted into an antecubital vein. The participants transferred to
the WBCU and positioned in a semirecumbent state. The venous catheter was connected, via
a small airtight connecting compartment in the chamber, to a physiologic saline line. REE
(described above) and respiratory exchange ratio (RER) (ratio of carbon dioxide production
(VCO2) produced and oxygen consumption (VO2) consumed) were measured in a fasted state
for 1-hour. This REE measurement served as the ‘baseline’ energy expenditure for the

80
calculation of PEE. Immediately after this baseline REE measurement, participants consumed
a test meal within 30 minutes. The metabolic measurement was resumed, and PEE was
measured for a total of 6 hours, with two 10 minutes ‘comfort breaks’ at 2 and 4 hours. For
all metabolic measurements, participants were in a semi-reclined position which was kept
consistent between the test days. PEE was also expressed as a percentage of the total energy
of the test meal.
To facilitate adherence to the test conditions, participants were allowed to watch movies, play
video games or read during the metabolic measurement period (den Besten et al., 1988; Scott
& Devore, 2005; Vasilaras et al., 2001). Subjective appetite was assessed in a fasted state and
15, 30 minutes and every hour for 4 hours using visual analog scales VAS.
5.4 Calculation of postprandial energy expenditure
PEE was calculated as the difference between 6-hour total energy measured after the
breakfast consumed subtracted from REE, using REE measured in a fasted state immediately
before meal intake. In the current study, participants consumed a SD one day prior to the SM
test and HP diet one day prior to the HP meal test. Therefore, differences in the prior day diet
can affect REE and alter the calculated value for PEE. To minimize the effect of prior day
diet variability in REE on the calculation of PEE, PEE also calculated as the difference
between 6-hour total energy measured after the breakfast consumed subtracted from REE
measured at baseline visit and called as (‘fixed REE’).
5.5 Statistical analysis
All statistical analyses were performed using SPSS version 24 for Windows (SPSS Inc.,
Chicago, IL) and GraphPad Prism 7 software (GraphPad Software Inc.). A value of P ≤ 0.05
was considered statistically significant. All values are reported as mean and standard
deviation (SD). Data were verified as normally distributed using Shapiro–Wilk tests of
normality before the analysis. A paired sample t-test was used to compare the mean of the
RER, pre-meal REE and PEE (SM or HP) between two occasions for each participant in the
study. Change from baseline subjective average appetite scores was analyzed using a two-
factor repeated measure ANOVA to assess the effects of meal and time. Area under the curve
for VAS was calculated taking into account areas above and below fasting baseline.
Correlation between PEE and VASAUC was determined using Spearman’s Rank-Order
correlation.
81
5.6 Results
5.6.1 Baseline anthropometric and metabolic characteristics
The baseline characteristics of the study participants are shown in (Table 5.3). Five
participants (four females and one male) completed both arms of the study; mean age: 15 ±
3.7 (11–20 years) BMI percentile: 85.7 ± 10.5 (70.2–98.3). One PWS participant had
uniparental disomy; all others had a chromosome 15 deletion. All PWS individuals had free
thyroxine (T4) and thyroid stimulating hormone (TSH) concentrations in the normal range.
All participants were taking growth hormone (GH) treatment prior to study enrollment; no
changes in GH treatment were made during the course of the study. Self-assessed pubertal
status ranged from Tanner stage II–V.
5.6.2 Resting energy expenditure
REE was measured at baseline, visit study 1 and visit study 2. Mean REE value measured at
baseline was 1686.1 ± 233.5 kcal. Mean REE measured at the following day after the intake
of SM was 1590.3 ± 168 kcal and mean REE value measured the following day after the
intake of HP diet was 1650.6 ± 188.4 kcal (Figure 5.3).
5.6.3 Postprandial energy expenditure using same day resting energy expenditure
measurements
No differences were detected in mean PEE calculated using REE measured in a fasted state
immediately before meal intake between the SM 184 ± 148 kcal and HP meal 200 ± 188 kcal
(p = 0.74) (Figure 5.4 A). Mean PEE (% energy intake) were similar between the SM 9.8 ±
7.2% and HP meal 10.5 ± 9.2% (p = 0.8) (Figure 5.4 B).
5.6.3 Postprandial energy expenditure using (‘fixed REE’) measurements
No difference in mean PEE calculated as ‘fixed REE’ between the SM 89 ± 149 kcal and HP
meal 165 ± 146 kcal (p = 0.2) were seen (Figure 5.5 A). Mean PEE (% energy intake) was
5.5 ± 9.7% after the SM and 10.4 ± 9.6% after HP meal (p = 0.18) (Figure 5.5 B).
5.6.4 Respiratory exchange ratio
Mean RER value was lower following the HP meal 0.80 ± 0.01 vs the SM 0.87 ± 0.02 (p =
0.009) (Figure 5.6).
82
5.6.5 Subjective appetite response
Change from baseline average appetite score was affected by time (p = 0.02), but the change
from baseline was unaffected by type of meal (p = 0.44) and there was no meal/time
interaction (p = 0.99) (Figure 5.7). Average appetite decreased after SM and HP meals
consumed at 15 minutes (p = 0.02) and returned to baseline levels at 180 minutes (p = 0.02).
Average appetite was higher than baseline after SM and HP meals at 240 minutes (p = 0.04).
5.6.6 Correlation between PEE and subjective appetite sensations
No correlation between PEE and VAS as expressed as the incremental area under the curve
(VASAUC it) (rs = 0.286, p = 0.64 for SM and rs = 0.005, p = 0.99 for HP meal) was observed.
5.7 Discussion
The impact of macronutrient content of the diet on PEE in youth with PWS is poorly
understood. This is the first study aimed at assessing PEE in youth with PWS. Our
randomized, crossover study aimed to determine the impact of a high versus a low protein
intake on PEE in youth with PWS. Outcome measurements included REE, PEE, RER. We
examined the correlation between protein intake and subjective appetite sensations in youth
with PWS.
DIT measurements depend on the meal size and macronutrient composition as well as
the duration of the measurement (Quatela et al., 2016). We did not detect differences in PEE
between the SM and HP meals calculated using REE measured in a fasted state immediately
before meal intake. REE measured in a fasted state is affected by the prior day diet (Agus,
Swain, Larson, Eckert, & Ludwig, 2000; Katzeff & Danforth, 1989; Laville et al., 1993;
Nelson et al., 1992; Schutz, Bessard, et al., 1984; Schutz, Golay, et al., 1984; Tentolouris et
al., 2008; Welle & Campbell, 1983). Johnston et al. (2000) measured postprandial
thermogenesis following a high protein diet versus high carbohydrate diet. Participants
consumed a SD providing (50% carbohydrate, 15% protein and 25% as fat) for two days
prior to each test day to assure similar baseline measures (Johnston et al., 2002). Ruddick-
Collins et al. (2013) measured DIT following a standard fixed breakfast meal contains (54 %
carbohydrate, 14% protein and 32% fat) on two occasions and no standardized diet before
each test day was provided. They used the lowest REE measured on both test days as defined
as (‘fixed REE’) to calculate DIT (Ruddick-Collins et al., 2013). To minimize the effects of
the prior day diet in REE measurements in the current study, a value for REE measured at
baseline visit (‘fixed REE’) was used to calculate PEE for HP meal and SM. PEE calculated,
83
as ‘fixed REE’ was double after HP meal compared to SM; however, was not statistically
significant.
This, however, does not necessarily indicate that no difference exists in PEE between
a SM and HP meal. Previous studies have shown significant differences in PEE comparing
healthy children and adults using a standardized diet previous to the test day (Johnston et al.,
2002) or with no change on the habitual diet occurring before the tests days (Nguo et al.,
2018). Nguo et al, (2018) reported that the mean DIT (% of energy intake) was higher after a
high protein diet (8.19 ± 0.709%) compared with the high carbohydrate meal (4.36 ± 0.48%)
(p < 0.001) in an acute crossover study in adolescents with obesity and healthy-weight aged
11–19 years. Participants consumed either a high protein (whey) (55% protein, 30%
carbohydrate, and 15% fat) or high carbohydrate (79% carbohydrate, 5% protein, and 16%
fat) liquid meal in a random order (Nguo et al., 2018). Differences in findings between Nguo
et al. (2018) and our study could be attributed to differences in meal composition. Nguo et al.
(2018) provided a high carbohydrate meal containing almost 80% of total energy from
carbohydrate and only 5% of total energy from protein, therefore a much higher carbohydrate
and lower protein content compared to our diet. Importantly, 5% of total energy content from
protein is very low and does not represent usual protein content of a meal (Garriguet, 2007).
In healthy adults, a high protein diet produces a greater DIT effect than a higher
carbohydrate or fat content diet (Halton & Hu, 2004; Westerterp-Plantenga, Lemmens, &
Westerterp, 2012). Only one study has investigated DIT in individuals with PWS compared
with BMI-matched and healthy-weight individuals (Purtell et al., 2015). They found no
difference in DIT between the two groups after consumption of a breakfast meal of moderate
protein content (600 kcal, 50% carbohydrate, 35% fat, 15% protein) (Purtell et al., 2015). As
examination of DIT was not the primary objective of their study, details concerning DIT’s
measurement protocol were not described.
Following consumption of large meals (>1000 kcal), total DIT response may take
between 8 to 10 hours (D'Alessio et al., 1988; Melanson et al., 1998). However, the majority
of studies used meals with energy content range between 400 and 1000 kcal, and measured
DIT until 3 and 6 hours; DIT response is often incomplete at the end of < 5 hours
measurement period (D'Alessio et al., 1988; Jebb, 1995; Nelson et al., 1992; Schutz, Golay,
et al., 1984; Tentolouris et al., 2008). Differences in gastric emptying, nutrient absorption and
storage between individuals may affect the duration of the DIT response (Scott et al., 2007).
Therefore, a general recommendation is for the measurement to last for > 5 hours to capture
the complete DIT response (Reed & Hill, 1996; Ruddick-Collins et al., 2013). Therefore, in
84
the current study we measured PEE for 6-hour period following a 500 kcal meal; as a longer
measurement period would have substantially increased participant burden. However, it is
possible a 6-hour measurement was not sufficient to capture total DIT response due to a delay
in gastric emptying previously reported in individuals with PWS (Arenz, Schwarzer, Pfluger,
Koletzko, & Schmidt, 2010). Peak in DIT may have occurred outside the window of indirect
calorimetry measurement.
We found no relationship between PEE and appetite measures using VASAUC it.
Previous studies in healthy adults examined the relationship between DIT and subjective
appetite assessment using VAS (Crovetti, Porrini, Santangelo, & Testolin, 1998; Westerterp-
Plantenga, Rolland, Wilson, & Westerterp, 1999). Westerterp-Plantenga et al. (1999) reported
that differences between satiety or hunger AUC (between high-protein high-carbohydrate diet
and a high-fat diet) in women with healthy weight was correlated to differences in DIT
between the two macronutrient compositions. Another study by Crovetti et al. (1998)
reported a positive correlation in women with healthy weight between fullness sensation and
DIT.
Protein intake and PEE were not found to relate to subjective measures of satiety.
Previous studies in healthy adults and children have shown a relationship between satiety and
DIT when a meal consisting of ≥ 50% energy from protein was consumed (Acheson et al.,
2011; Nguo et al., 2019). In the current study, no difference in satiety was found between the
SM and HP meal as assessed by VAS. Satiety scores were similar after the 2 meals, with a
rapid return to fasting levels after meal termination. We found no evidence of impaired
postprandial satiety hormone responses in children with PWS compared to BMI z-score
matched children in study 1 (Chapter 3). The secretion of anorexigenic hormones PYY and
GLP-1 was not reduced compared to BMI z-score match children. This is an agreement with
Purtell et al. (2011) who found no differences in the secretion of PYY and GLP-1 in adult
with PWS compared to control (Purtell et al., 2011). In study 1 (Chapter 3) we found that
fasting and postprandial ghrelin concentrations were significantly higher in children with
PWS compared to BMI z- score matched children. Ghrelin findings have been confirmed by
previous studies (DelParigi et al., 2002; Goldstone, 2004; Goldstone et al., 2005; Haqq,
Farooqi, et al., 2003; Purtell et al., 2011; Tauber et al., 2004). However, meal intake
suppressed ghrelin concentrations in individuals with PWS (Haqq, Farooqi, et al., 2003; Paik
et al., 2006; Purtell et al., 2011).
Blood withdrawn in individuals with PWS is difficult and quite invasive procedure
due to low muscle tone and increased subcutaneous fat (Kuppens et al., 2015; Orsso et al.,
85
2017). In the current study, we were not able to collect blood samples from all the
participants as the venous catheter was connected, via a small airtight connecting
compartment in the chamber, to a physiologic saline line. We lost access to the venous
catheter in some participants and due to the limited access we were not able to reinsert the
venous catheter. Therefore, blood samples results are not available.
Satiety scores were similar after the two meals, with a rapid return to fasting levels
after meal termination. In other studies, adults with PWS rated high hunger scores and high
satiety scores immediately after a meal (Purtell et al., 2011). In healthy adults and typically
developing children, hunger and satiety response to VAS is in balance; when satiety is high,
hunger is low (Bennett et al., 2018; Lee, Brett, Chang, de Zepetnek, & Bellissimo, 2019;
Purtell et al., 2011). In the current study, some participants rated high hunger scores and high
satiety scores at the same time. Purtell el., (2011) reported a normal satiety response in adults
with PWS as determine by an increase in postprandial VAS fullness scores with a rise in
PYY and GLP-1 concentrations and a drop in plasma ghrelin concentrations. However, high
VAS hunger scores were also rated immediately after a large meal was consumed. They
suggested that the observed higher postprandial ghrelin concentration (compared to the
control group) might be sufficient to stimulate appetite and lead to hyperphagia (Purtell et al.,
2011). The similar VAS ratings following the HP meal or SM in the current study bring into
question the impact of HP meal in suppressing appetite in individuals with PWS.
The major finding of this study was that RER was lower after the HP diet compared
with the SD; suggesting a shift towards fat rather than carbohydrate as a fuel source. RER is
affected by the availability of dietary and stored macronutrients. RER rises with a high
carbohydrate meal and falls during fasting or after a high fat meal. During carbohydrate
oxidation, the amount of CO2 produced equals O2 consumed, resulting in a RER value of 1.0.
During fat oxidation, less CO2 is produced for a given amount of O2 consumed, leading to a
RER of 0.7. The RER for a mixed diet, protein and alcohol, is approximately 0.85, 0.82 and
0.67, respectively (McClave et al., 2003). The transition from carbohydrate to fat oxidation
(e.g. drop in RER) during an overnight fast or in response to nutritional state has been called
metabolic flexibility (Galgani, Moro, & Ravussin, 2008). In contrast, Purtell et al. (2015)
found no differences in RER between 11 adults with PWS and 12 BMI-matched individuals
with healthy-weight in response to a standardized breakfast of mixed high carbohydrate and
high fat content (600 kcal, 50% carbohydrate, 35% fat, 15% protein) (Purtell et al., 2015).
However, the adaption to adjust fuel oxidation to fuel availability occurs between 1 to 7 days,
may help to explain the differences in findings (Coyle, Jeukendrup, Wagenmakers, & Saris,
86
1997; el-Khoury et al., 1997; Forslund et al., 1999; Galgani & Ravussin, 2008; Galgani et al.,
2008; Schrauwen, van Marken Lichtenbelt, Saris, & Westerterp, 1997).
Major strengths of our study include its randomized crossover design in which all
participants served as their own controls. This is one of the first studies to comprehensively
examine REE and PEE using a state-of-the-art technique of WBCU in children with PWS.
Limitations of our study include the limited sample size due to the rarity of this disease and
the lack of a control group. The sample size of the current study was calculated based on
changes in PEE 22 ± 16 in high carbohydrate diet 69 % of total energy and 62 ± 14 kcal in a
HP group up 68% of energy from protein over 7 hours PEE measurement from a previously
published study (Crovetti et al., 1998) and accounted for a 20% attrition rate.
In conclusion, this study found that RER was lower after the HP meal than the SM
meal in children with PWS. No difference in PEE was found between the SM and HP meals.
This study highlights the heterogeneity in PEE in youth with PWS. The high variation in PEE
metabolism response could be attributed to factors such as variability in pubertal maturation,
difference in age ranges from 11 to 20 years within our study, body composition, and sex.
Future studies are required to compare low protein-high carbohydrate and standard fat,
standard/typical Canadian intake and high protein-low carbohydrate and standard fat in
children with and without PWS; considering factors that influence response to energy
metabolism (e.g., early puberty status to adult, body composition and sex).
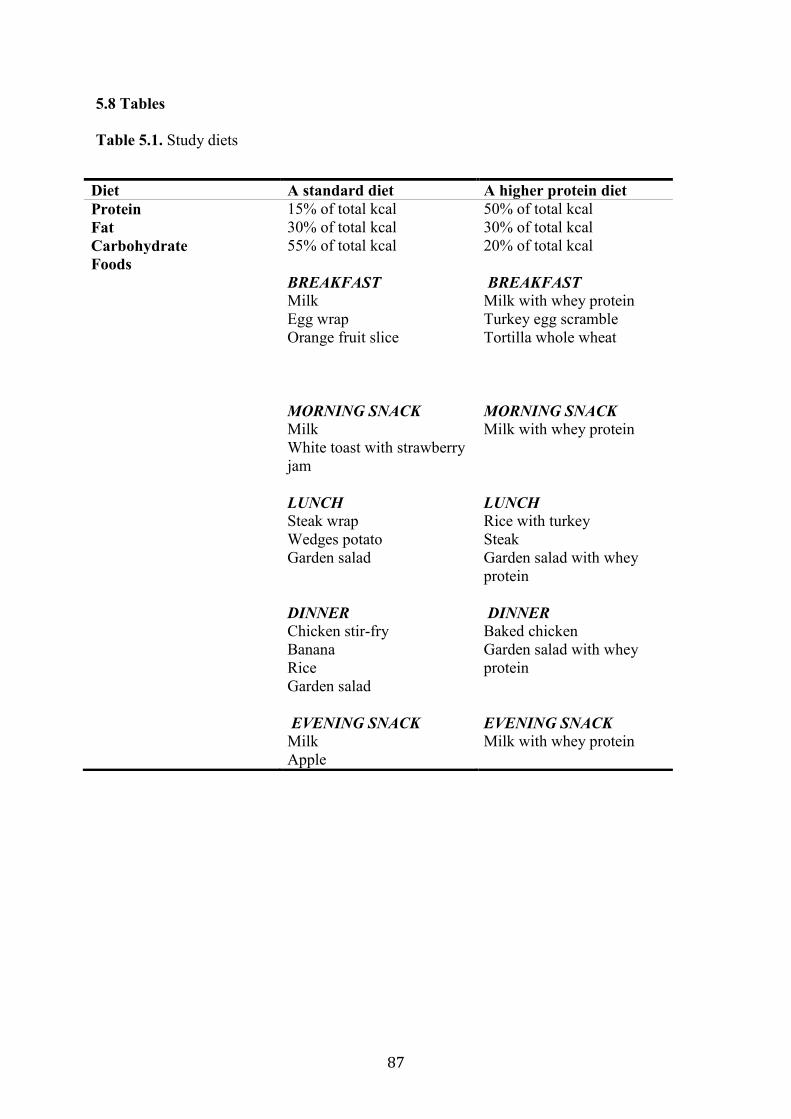
87
5.8 Tables
Table 5.1. Study diets
Diet A standard diet A higher protein diet
Protein 15% of total kcal 50% of total kcal
Fat 30% of total kcal 30% of total kcal
Carbohydrate 55% of total kcal 20% of total kcal
Foods
BREAKFAST Milk
Egg wrap
Orange fruit slice
MORNING SNACK Milk
White toast with strawberry
jam
LUNCH Steak wrap
Wedges potato
Garden salad
DINNER Chicken stir-fry
Banana
Rice
Garden salad
EVENING SNACK Milk
Apple
BREAKFAST Milk with whey protein
Turkey egg scramble
Tortilla whole wheat
MORNING SNACK Milk with whey protein
LUNCH Rice with turkey
Steak
Garden salad with whey
protein
DINNER Baked chicken
Garden salad with whey
protein
EVENING SNACK Milk with whey protein
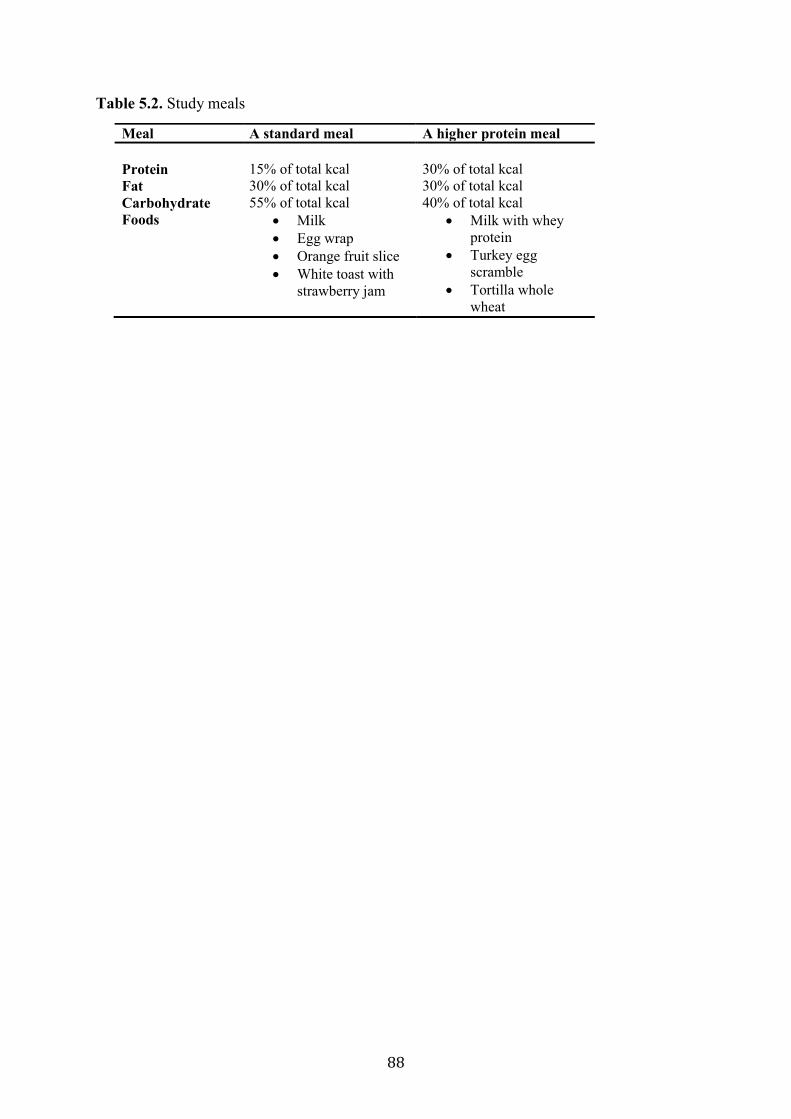
88
Table 5.2. Study meals
Meal A standard meal A higher protein meal
Protein
15% of total kcal
30% of total kcal
Fat 30% of total kcal 30% of total kcal
Carbohydrate 55% of total kcal 40% of total kcal
Foods Milk
Egg wrap
Orange fruit slice
White toast with
strawberry jam
Milk with whey
protein
Turkey egg
scramble
Tortilla whole
wheat
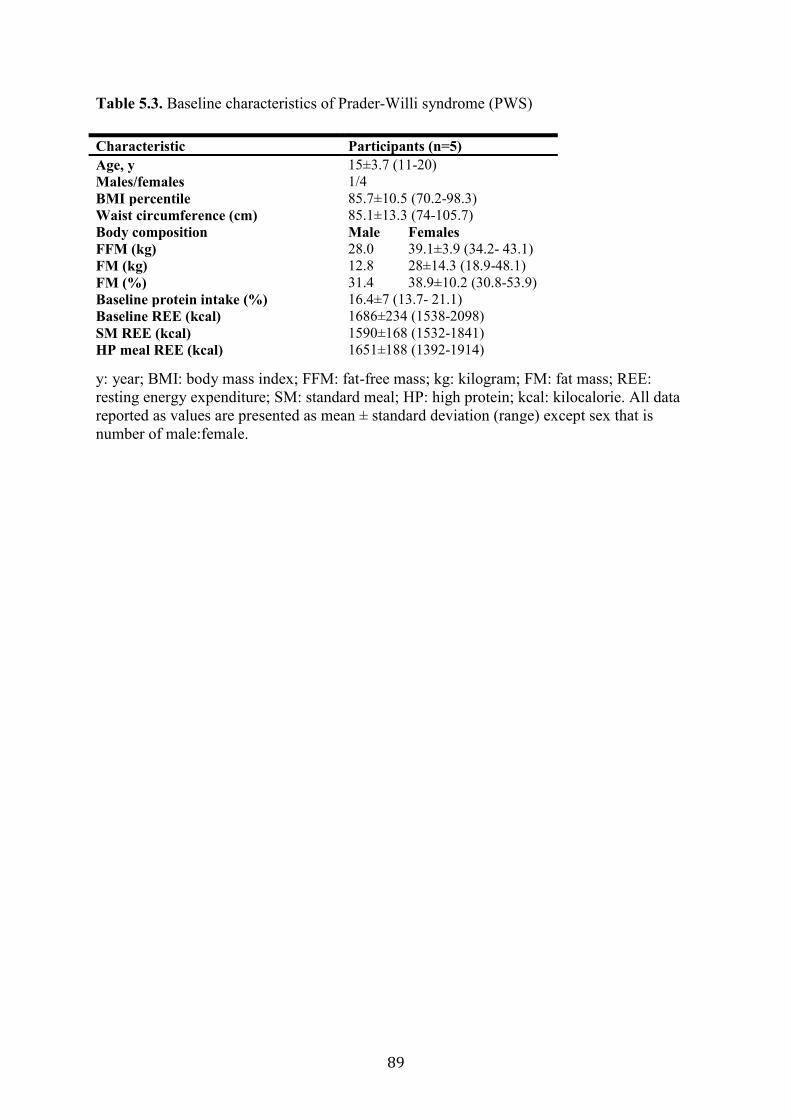
89
Table 5.3. Baseline characteristics of Prader-Willi syndrome (PWS)
y: year; BMI: body mass index; FFM: fat-free mass; kg: kilogram; FM: fat mass; REE:
resting energy expenditure; SM: standard meal; HP: high protein; kcal: kilocalorie. All data
reported as values are presented as mean ± standard deviation (range) except sex that is
number of male:female.
Characteristic Participants (n=5)
Age, y 15±3.7 (11-20)
Males/females 1/4
BMI percentile 85.7±10.5 (70.2-98.3)
Waist circumference (cm) 85.1±13.3 (74-105.7)
Body composition Male Females
FFM (kg) 28.0 39.1±3.9 (34.2- 43.1)
FM (kg) 12.8 28±14.3 (18.9-48.1)
FM (%) 31.4 38.9±10.2 (30.8-53.9)
Baseline protein intake (%) 16.4±7 (13.7- 21.1)
Baseline REE (kcal) 1686±234 (1538-2098)
SM REE (kcal) 1590±168 (1532-1841)
HP meal REE (kcal) 1651±188 (1392-1914)

90
5.9 Figures
Figure 5.1. Trial design
REE: resting energy expenditure; PEE: postprandial energy expenditure; VAS: visual analog
scale; SD: standard meal; HP: high protein
Baseline visit
Visit 3 Visit 2
Informed consent
Anthropometric
measurements
REE measurement
Body composition
Self-puberty
assessment
Anthropometric
measurement
REE measurement
PEE measurement
VAS
SM meal
Anthropometric
measurement
REE measurement
PEE measurement
VAS
HP meal
Randomized
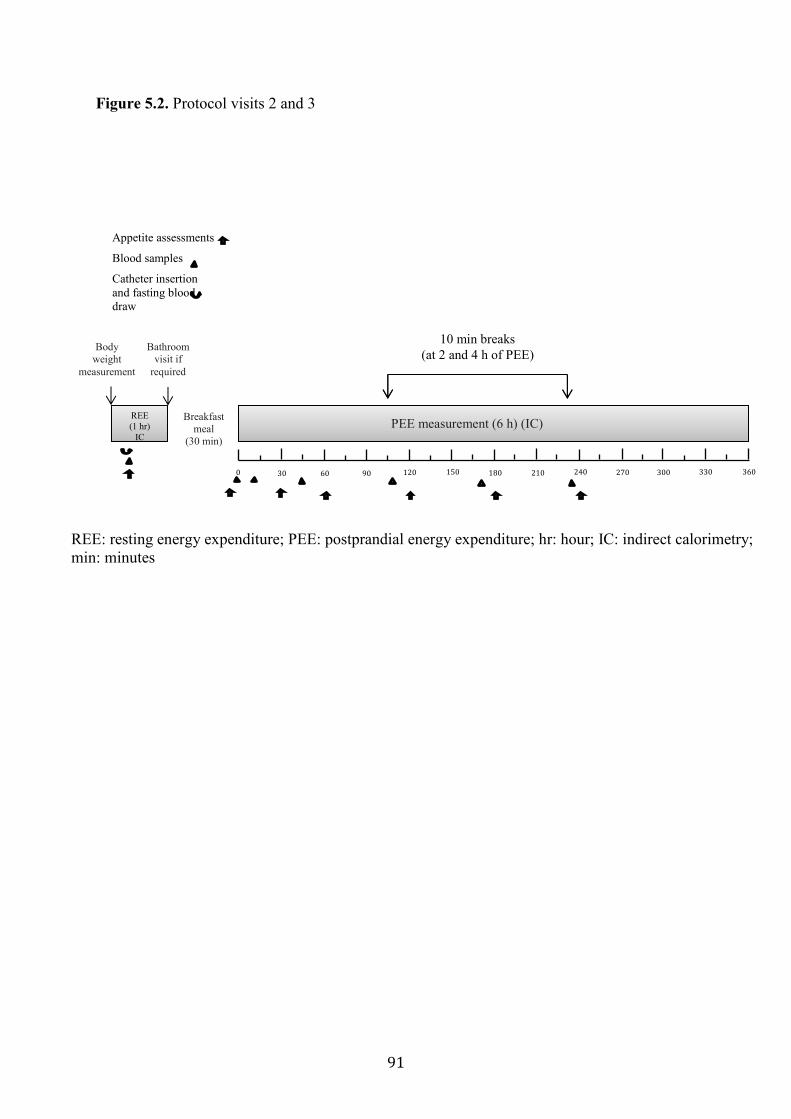
91
Figure 5.2. Protocol visits 2 and 3
Body
weight
measurement
Bathroom visit if
required
Breakfast
meal
(30 min)
REE
(1 hr)
IC
0 30 60 90 120 150 180 210 360 330 300 270 240
PEE measurement (6 h) (IC)
Appetite assessments
Blood samples
Catheter insertion
and fasting blood
draw
10 min breaks
(at 2 and 4 h of PEE)
REE: resting energy expenditure; PEE: postprandial energy expenditure; hr: hour; IC: indirect calorimetry;
min: minutes

92
Figure 5.3. Resting energy expenditure (REE) measurements
REE: resting energy expenditure; kcal: kilocalorie; m: minutes; SD: standard diet; HP: high
protein
Bas
elin
eSD
HP
1400
1600
1800
2000
2200
RE
E (
kcal/30m
)
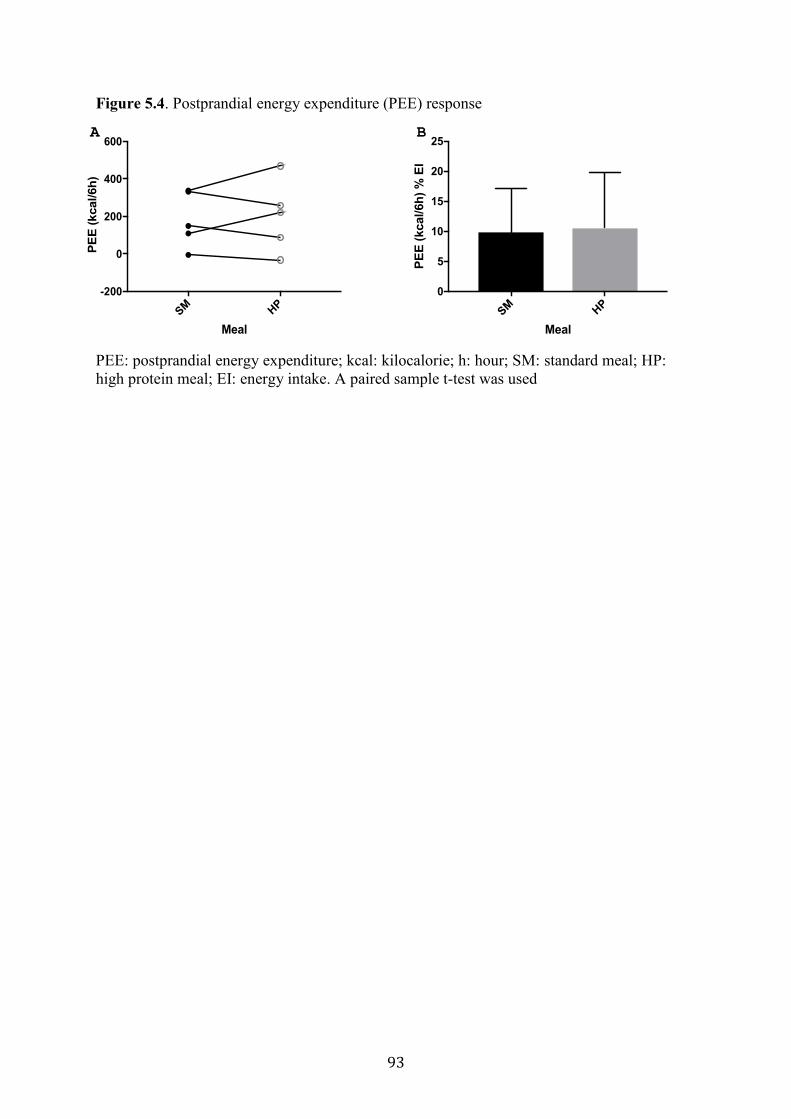
93
SM H
P
-200
0
200
400
600
Meal
PE
E (
kcal/6h
)
A
SM H
P
0
5
10
15
20
25
Meal
PE
E (
kcal/6h
) %
EI
B
Figure 5.4. Postprandial energy expenditure (PEE) response
PEE: postprandial energy expenditure; kcal: kilocalorie; h: hour; SM: standard meal; HP:
high protein meal; EI: energy intake. A paired sample t-test was used
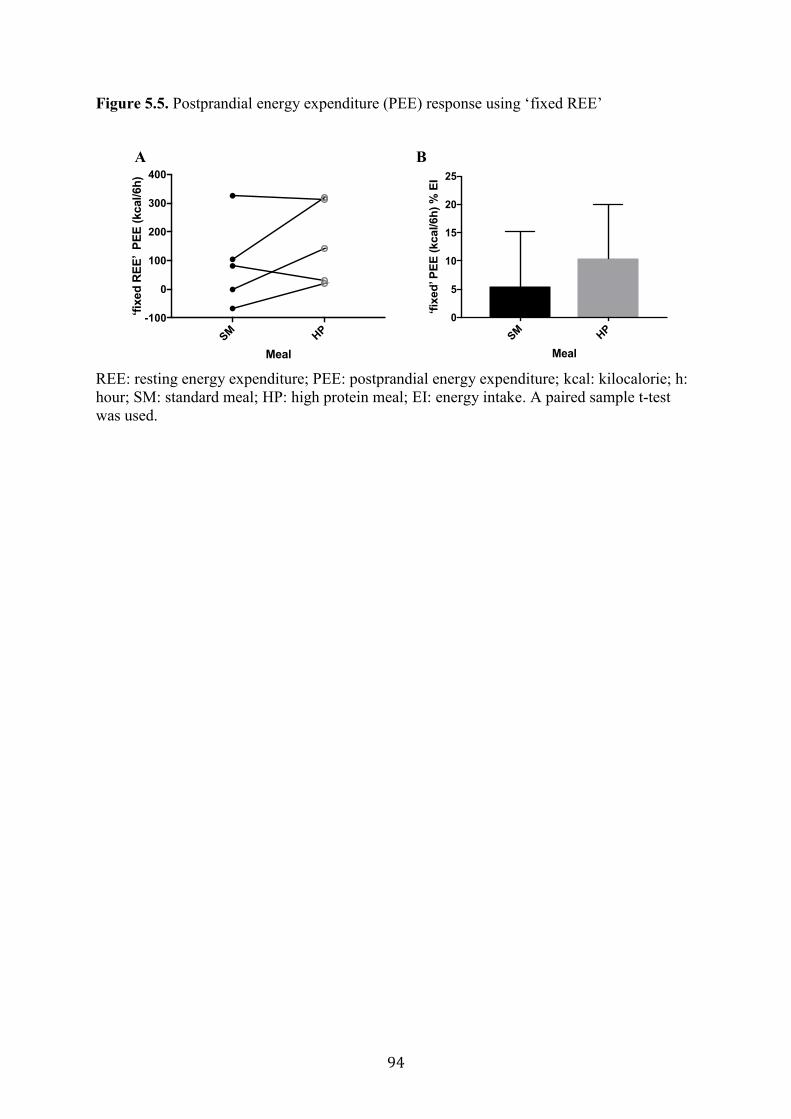
94
Figure 5.5. Postprandial energy expenditure (PEE) response using ‘fixed REE’
REE: resting energy expenditure; PEE: postprandial energy expenditure; kcal: kilocalorie; h:
hour; SM: standard meal; HP: high protein meal; EI: energy intake. A paired sample t-test
was used.
SM H
P
-100
0
100
200
300
400
Meal
‘fix
ed
RE
E’ P
EE
(kcal/6h
)
A
SM H
P
0
5
10
15
20
25
Meal
‘fix
ed’ P
EE
(kcal/6h
) %
EI
B
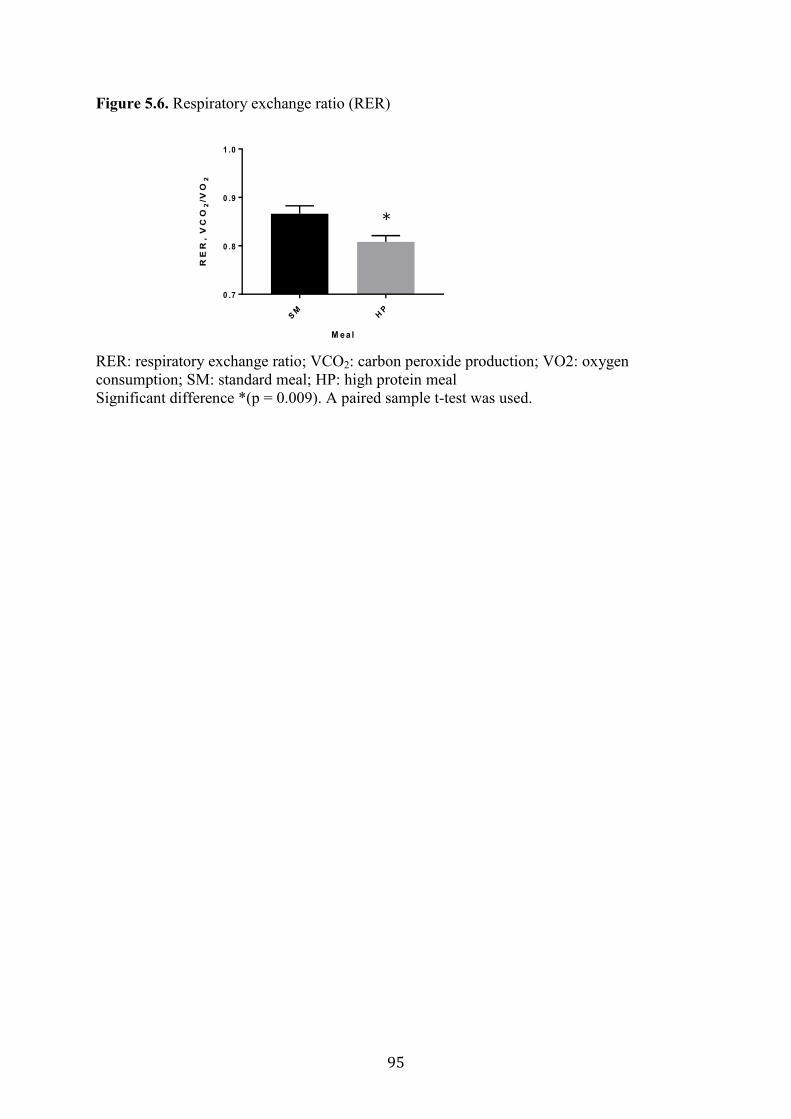
95
Figure 5.6. Respiratory exchange ratio (RER)
RER: respiratory exchange ratio; VCO2: carbon peroxide production; VO2: oxygen
consumption; SM: standard meal; HP: high protein meal
Significant difference *(p = 0.009). A paired sample t-test was used.
SM
HP
0 .7
0 .8
0 .9
1 .0
M ea l
RE
R,
VC
O2
/VO
2
*
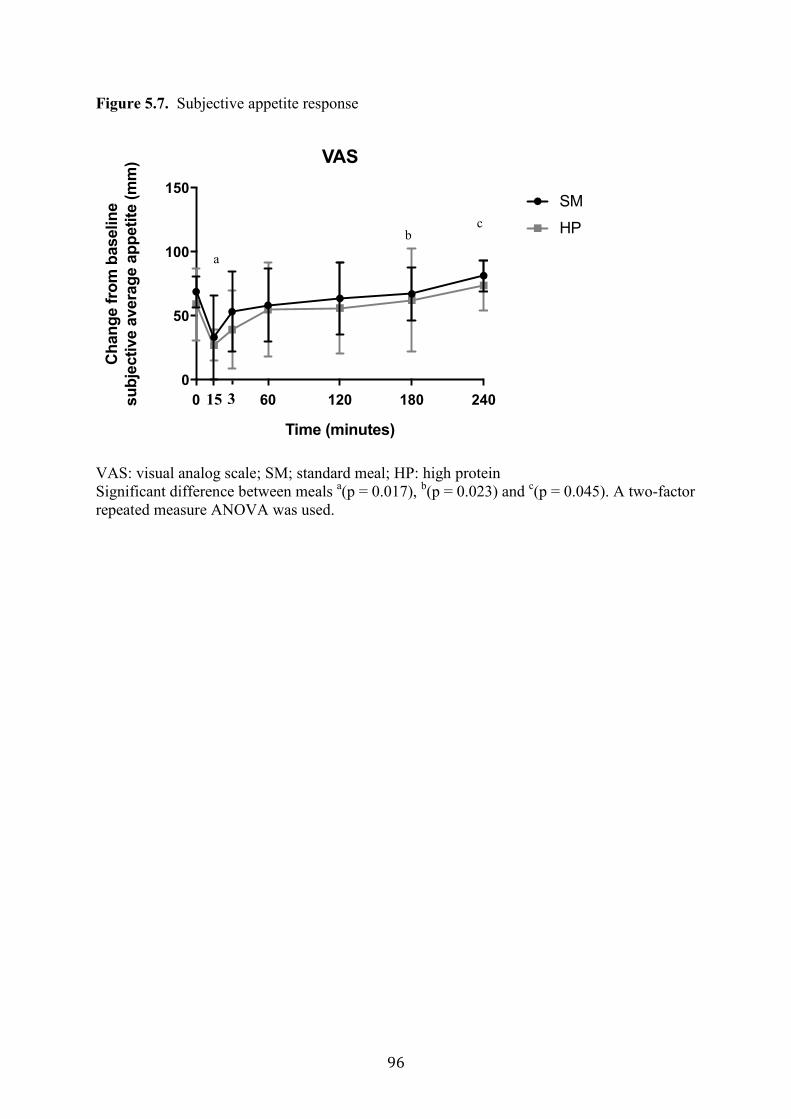
96
Figure 5.7. Subjective appetite response
VAS: visual analog scale; SM; standard meal; HP: high protein
Significant difference between meals a(p = 0.017),
b(p = 0.023) and
c(p = 0.045). A two-factor
repeated measure ANOVA was used.
0 60 120 180 240
0
50
100
150
VAS
Time (minutes)
Ch
an
ge f
rom
baselin
e
su
bje
cti
ve a
vera
ge a
pp
eti
te (
mm
)
SM
HP
15 3
a
c b
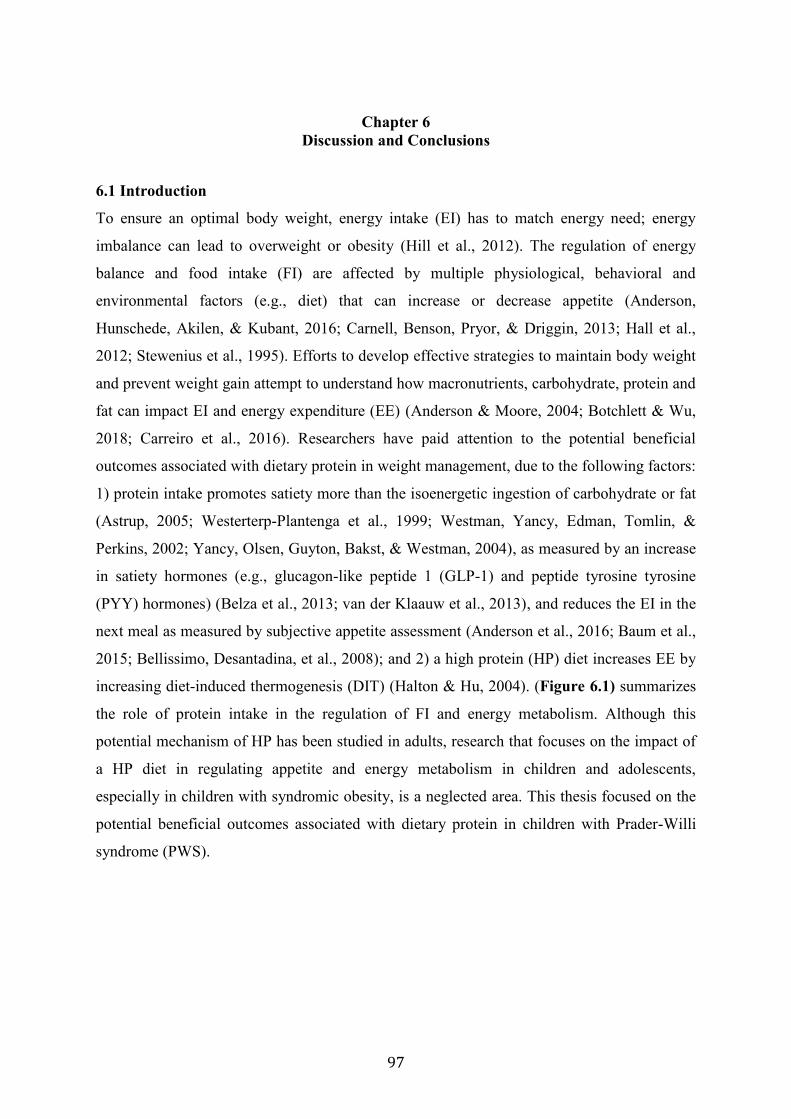
97
Chapter 6
Discussion and Conclusions
6.1 Introduction
To ensure an optimal body weight, energy intake (EI) has to match energy need; energy
imbalance can lead to overweight or obesity (Hill et al., 2012). The regulation of energy
balance and food intake (FI) are affected by multiple physiological, behavioral and
environmental factors (e.g., diet) that can increase or decrease appetite (Anderson,
Hunschede, Akilen, & Kubant, 2016; Carnell, Benson, Pryor, & Driggin, 2013; Hall et al.,
2012; Stewenius et al., 1995). Efforts to develop effective strategies to maintain body weight
and prevent weight gain attempt to understand how macronutrients, carbohydrate, protein and
fat can impact EI and energy expenditure (EE) (Anderson & Moore, 2004; Botchlett & Wu,
2018; Carreiro et al., 2016). Researchers have paid attention to the potential beneficial
outcomes associated with dietary protein in weight management, due to the following factors:
1) protein intake promotes satiety more than the isoenergetic ingestion of carbohydrate or fat
(Astrup, 2005; Westerterp-Plantenga et al., 1999; Westman, Yancy, Edman, Tomlin, &
Perkins, 2002; Yancy, Olsen, Guyton, Bakst, & Westman, 2004), as measured by an increase
in satiety hormones (e.g., glucagon-like peptide 1 (GLP-1) and peptide tyrosine tyrosine
(PYY) hormones) (Belza et al., 2013; van der Klaauw et al., 2013), and reduces the EI in the
next meal as measured by subjective appetite assessment (Anderson et al., 2016; Baum et al.,
2015; Bellissimo, Desantadina, et al., 2008); and 2) a high protein (HP) diet increases EE by
increasing diet-induced thermogenesis (DIT) (Halton & Hu, 2004). (Figure 6.1) summarizes
the role of protein intake in the regulation of FI and energy metabolism. Although this
potential mechanism of HP has been studied in adults, research that focuses on the impact of
a HP diet in regulating appetite and energy metabolism in children and adolescents,
especially in children with syndromic obesity, is a neglected area. This thesis focused on the
potential beneficial outcomes associated with dietary protein in children with Prader-Willi
syndrome (PWS).
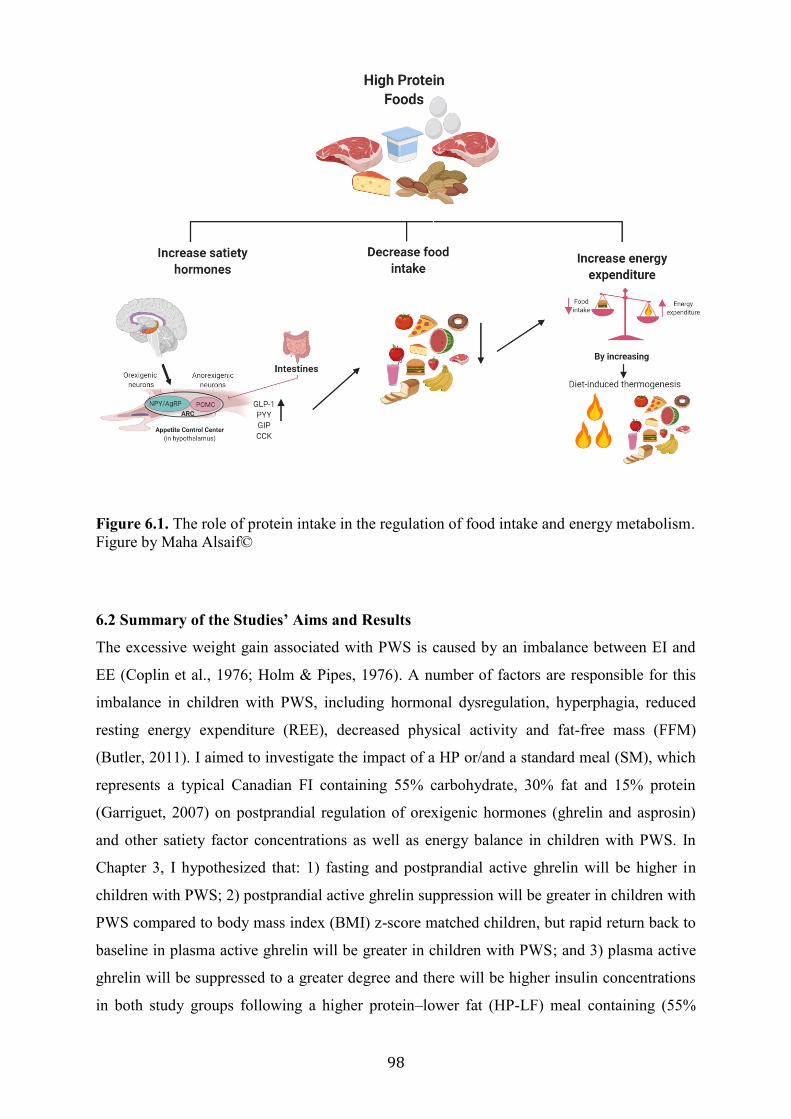
98
Figure 6.1. The role of protein intake in the regulation of food intake and energy metabolism.
Figure by Maha Alsaif©
6.2 Summary of the Studies’ Aims and Results
The excessive weight gain associated with PWS is caused by an imbalance between EI and
EE (Coplin et al., 1976; Holm & Pipes, 1976). A number of factors are responsible for this
imbalance in children with PWS, including hormonal dysregulation, hyperphagia, reduced
resting energy expenditure (REE), decreased physical activity and fat-free mass (FFM)
(Butler, 2011). I aimed to investigate the impact of a HP or/and a standard meal (SM), which
represents a typical Canadian FI containing 55% carbohydrate, 30% fat and 15% protein
(Garriguet, 2007) on postprandial regulation of orexigenic hormones (ghrelin and asprosin)
and other satiety factor concentrations as well as energy balance in children with PWS. In
Chapter 3, I hypothesized that: 1) fasting and postprandial active ghrelin will be higher in
children with PWS; 2) postprandial active ghrelin suppression will be greater in children with
PWS compared to body mass index (BMI) z-score matched children, but rapid return back to
baseline in plasma active ghrelin will be greater in children with PWS; and 3) plasma active
ghrelin will be suppressed to a greater degree and there will be higher insulin concentrations
in both study groups following a higher protein–lower fat (HP-LF) meal containing (55%
99
carbohydrate, 15% fat and 30% protein) compared to the higher protein–lower carbohydrate
(HP-LC) meal containing (40% carbohydrate, 30% fat and 30% protein). Children with PWS
had higher fasting concentrations of both acyl ghrelin (AG) (p = 0.02) and desacyl ghrelin
(DAG) (p = 0.01) than BMI z-score matched children. Absolute concentrations of AG and
DAG were higher in PWS than in BMI z- score matched children across all post-prandial
time points (p = 0.002 and p < 0.001 respectively). Thus, SM, HP-LC and HP-LF meals
reduced AG and DAG in both groups, but the magnitude of AG and DAG suppression
following all three meals was more pronounced in children with PWS at one (p = 0.012 and p
= 0.15, ns), two (p = 0.001 and p = 0.002), three (p = 0.001 and p < 001) and four hours (p =
0.001 and p = 0.001) and the time return to baseline to recovery was delayed. No effects of
HP-LC or HP-LF meals on AG, DAG and the AG:DAG ratio within or between groups were
observed. Postprandial glucose concentrations were higher in PWS children than in BMI z-
score matched children 1 hour after the SM (106.2 % vs. 94.3 %) and HP-LC (109.1 % vs
89.5 %) meals (p = 0.03 and p = 0.002 respectively); glucose responses were comparable
following the HP-LF meal. Following the SM, insulin concentrations were higher in children
with PWS than in controls at hours 1, 2 and 3 (p = 0.002, p = 0.008 and p < 0.001,
respectively). HP-LC and HP-LF meals stimulated a greater release of insulin in children
with PWS at hours 1, 2 and 3 hours (p = 0.006, p = 0.007, p = 0.221, ns p < 0.001, p = 0.04
and p = 0.126, ns, respectively) than in BMI z-score matched children. The HP-LF meal
stimulated a greater release of insulin at hour 1 than the SM in the both children with PWS
and BMI z-score matched children (p = 0.002 and p = 0.03 respectively). In Chapter 4, I
hypothesized that: 1) fasting and postprandial asprosin will be higher in children with PWS
than in children without the syndrome; 2) following a breakfast meal, asprosin concentrations
will be decreased in both groups; and 3) a positive correlation between serum asprosin and
glucose and asprosin and insulin resistance will be observed. No difference in fasting
asprosin in children with PWS compared to BMI z-score matched children was observed.
In children with PWS, fasting asprosin was positively correlated with AG (rs = 0.62, p =
0.05), and 1-hour postprandial asprosin was negatively correlated with insulin (rs = -0.62, p =
0.05). In Chapter 5, I hypothesized that 1) a HP intake containing (20% carbohydrate, 30%
fat and 50% protein) will result in higher postprandial energy metabolism (PEE) and satiety
compared to a lower protein SM intake in children and youth with PWS; and 2) a HP intake
will result in reduced and prolonged appetite compared to a lower protein intake as measured
by subjective appetite assessment. The respiratory exchange ratio (RER) after the HP diet
100
was significantly lower compared to standard diet (p = 0.009). No significant difference in
PEE and subjective appetite assessment were found between the HP meal and SM.
Collectively, these results can be used to inform future evidence-based nutrition
guidelines for patients with PWS and have the potential to change the dietetic care that these
individuals receive. The following sections discuss the implications and limitations of the
present findings and provide suggestions for future research.
6.3 Hormonal Regulation
Findings from Chapter 3 confirmed previous reports that individuals with PWS have higher
fasting and postprandial hyperghrelinemia compared to individuals with obesity and healthy
weight (DelParigi et al., 2002; Goldstone et al., 2004; Gumus Balikcioglu et al., 2015; Haqq,
Farooqi, et al., 2003; Rigamonti et al., 2017; Tauber et al., 2004). However, despite having
overall higher concentrations of ghrelin, children with PWS exhibited normal postprandial
suppression of AG and DAG (Chapter 3). This finding is consistent with the results of two
studies in adults (Gimenez-Palop et al., 2007; Rigamonti et al., 2017) and four in children
who have PWS (Gumus Balikcioglu et al., 2015; Haqq, Stadler, Rosenfeld, et al., 2003; Paik
et al., 2006; Paik et al., 2007). Degrees of AG and DAG suppression in Chapter 3 were not
affected by the type of meal ingested—SM, HP-LC or HP-LF. However, following the HP-
LC and HP-LF meals, there was an increase in PYY in both children with PWS and BMI z-
score matched children. The increase in GLP-1 secretion occurred after the higher protein
meals in the PWS group only. Despite ghrelin suppression after meal intake, the
concentrations of AG and DAG remained higher in children with PWS compared to children
with BMI z-score children across all postprandial time points, and that may be sufficient to
drive appetite leading to hyperphagia. Future trials are needed to elucidate the role of ghrelin
in children with PWS using specific ghrelin antagonists. Current clinical trials are
investigating the safety and efficacy of AZP-53 (Livoletide), a peptide analog of DAG, for
the treatment of hyperphagia in adults with PWS (Allas et al., 2018).
6.4 Diet-Induced Thermogenesis Measurements
While DIT might be altered in children with PWS as described in this thesis, our
understanding of DIT to date has been informed primarily by studies in adults and children
without the syndrome. The measurement of DIT is strict, and requires that participants
remain supine but awake during 6 hours of measurements (Reed & Hill, 1996). In Chapter 5,
instead of measuring DIT, we measured PEE while participants were in a semi-reclined
101
position. (Therefore, we articulated our findings as PEE instead of DIT.) To facilitate
adherence to the test conditions, participants were allowed to watch movies, play video
games or read during the metabolic measurement period (den Besten et al., 1988; Scott &
Devore, 2005; Vasilaras et al., 2001). Nguo et al. (2018) measured PEE for 30 minutes of
every hour; between the measurements, non-strenuous sedentary activities were permitted. In
their study, Purtell et al. (2015) did not report the measurement protocol for DIT, which
makes it difficult to compare findings. Furthermore, multiple terms to describe specific
components of EE have been used interchangeably in the literature (e.g., DIT/thermic effect
of food (TEF)/meal-induced thermogenesis (MIT) thermic effect of meal (TEM) and PEE).
DIT is the total energy expended throughout the day in digestive processes to a number of
meals measured in a whole-body calorimetry unit (Verboeket-van de Venne et al., 1996;
Westerterp, 2004b). MIT, TEF and TEM are a representation of an individual’s thermogenic
response to acute meal intake (Komai et al., 2016; Reed & Hill, 1996; Ruddick-Collins et al.,
2013). The majority of studies measured thermogenesis in response to a single meal due to
feasibility and cost of the measurements. However, differences in the specific measurement
conditions for obtaining DIT/TEF/MIT/TEM and PEE exist and should be used to clarify
which component (DIT/TEF/MIT/TEM or PEE) is actually being assessed.
6.5 Measures of Subjective Appetite Assessment
Developed by (Hill & Blundell, 1982), the subjective appetite assessment visual analog scale
(VAS) is a 100 mm line affixed with contrasting statements at both ends. The assessment
contains six questions that require the participant to rate their level of hunger, fullness, desire
to eat, amount of food they could eat, urge to eat and preoccupation with food (Stubbs et al.,
2000). Previous research studies have used the VAS to assess subjective appetite in children
(Bellissimo, Thomas, Pencharz, Goode, & Anderson, 2008; Bennett et al., 2018; Gheller et
al., 2019; Lee, Brett, Chang, et al., 2019; Lee, Brett, Wong, et al., 2019; Poirier et al., 2019;
Vien et al., 2017) and adults (Bodinham, Hitchen, Youngman, Frost, & Robertson, 2011;
Horner, Byrne, & King, 2014; Law, Lee, Vien, Luhovyy, & Anderson, 2017).
Reproducibility of the VAS in measuring subjective appetite rating in adults and children has
been reported (Bellissimo, Thomas, et al., 2008; Horner et al., 2014). In boys aged 9 to 14
years, subjective appetite rating before the test meal was strongly correlated with FI
(Bellissimo, Thomas, et al., 2008). This finding indicates that children are able to understand
the scales and rate their hunger (Bellissimo, Thomas, et al., 2008). However, the use of VAS
depends on age and cognitive development. Generally, VAS can be used with children aged 7
102
and older (Shields et al., 2003). Findings from Chapters 3 and 5 are discussed below within
this context.
In Chapter 3, the children with PWS were younger (5.1 to 17.9 years) than those in
the control group and lacked the understanding and communication skills to complete the
VAS questionnaire, which limited its use. Except for one child, who was not able to complete
the assessment due to their young age (6.7 years), children in the control group were able to
evaluate their level of hunger and satiety. We found that in the control group, the VAS ratings
paralleled our ghrelin suppression findings; appetite was lower at one-hour post-meal
compared to baseline for all three meals.
In Chapter 5, surprisingly, no differences were found between the HP meal combined
with whey protein supplement and SM in subjective appetite response in children and youth
with PWS. Protein is the most satiating macronutrient (Anderson & Moore, 2004). Studies in
both healthy adults and children with obesity and healthy weight supported this hypothesis
(Anderson & Moore, 2004; Baum et al., 2015; Marmonier, Chapelot, & Louis-Sylvestre,
2000; Paddon-Jones et al., 2008; Pasiakos, 2015). Baum et al. (2015) reported that a protein-
based breakfast [344 kcal, 21% protein (18 g), 52% carbohydrate, and 27% fat] increased
satiety and reduced hunger when compared with a carbohydrate-based breakfast [327 kcal,
4% protein (3 g), 67% carbohydrate, and 29% fat] among children (male and female) aged 8
to 12 years with obesity and healthy weight (Baum et al., 2015). Bellissimo et al. (2008)
reported that FI was suppressed more after consumption of whey protein compared to a
glucose drink in children with healthy weight. Moreover, a 200 kcal whey protein drink
suppressed FI in boys with healthy weight (age 12.2 ± 0.3 years), but not in boys with obesity
(age 11.4 ± 0.3 years) (Bellissimo, Desantadina, et al., 2008). These findings suggest that the
impact of HP in children on satiety and subsequent FI is weight dependent (Anderson et al.,
2016).
In their study, Marmonier et al. (2000) studied young adults with healthy body weight
(age 20±26 years) consumed a high fat (58% of energy from fat), a HP (77%) or a high
carbohydrate (84%) snack. They found that a HP snack delayed the request for dinner by 60
minutes, while the high-fat snack delayed dinner request by 25 minutes and the high-
carbohydrate snack delayed dinner request by 34 minutes (Marmonier et al., 2000). The HP
meal with whey protein supplement was expected to increase satiety for the following
reasons. First, whey protein digests quickly compared to casein (Boirie et al., 1997), resulting
in a fast release and sustained increase of plasma amino acid, which leads to increased satiety
(Anderson, 1979). However, it possible that due to a delay in gastric emptying, which has
103
been reported in individuals with PWS (Arenz et al., 2010), the increase in plasma amino
acids was delayed (Boirie et al., 1997). Also, whey protein stimulates the release of satiety
hormones, including PYY and GLP-1 (Belza et al., 2013; van der Klaauw et al., 2013). This
latter observation is in agreement with our findings in Chapter 3. Higher protein meals
stimulated greater increases in GLP-1 and PYY in children with PWS than in controls.
However, postprandial AG and DAG were higher in children with PWS than in BMI z-score
matched children, which might be sufficient to stimulate appetite and lead to hyperphagia. No
differences in the VAS rating following the HP meal and SM were observed.
6.6 Energy Metabolism and Requirements
While REE might be altered in children with PWS as described in this thesis, dietary energy
requirements ultimately relate to total energy expenditure (TEE). To date, only five studies
have examined TEE and its components among this cohort (Bekx et al., 2003a; Butler et al.,
2007a; Davies & Joughin, 1993; Schoeller et al., 1988; van Mil, Westerterp, Kester, et al.,
2000); three have investigated differences between PWS and healthy weight subjects or
individuals with obesity and found lower absolute values (ranging from 20 to 46% lower) of
TEE (kcal/day) compared to matched (for either age or BMI) individuals (Davies & Joughin,
1993; Schoeller et al., 1988; van Mil, Westerterp, Kester, et al., 2000). The overall impact of
this lower TEE in individuals with PWS, compared to both healthy age-matched and BMI-
matched individuals, is that they would be expected to have reduced energy requirements. In
fact, current clinical energy recommendations for individuals with PWS suggest an estimated
30 to 40% reduction in overall energy requirements (Miller et al., 2013). This
recommendation is based on energy metabolism predictive equations that are not specific to
PWS and therefore may overestimate the energy needs in these individuals.
Energy needs are estimated by assessing REE. In clinical practice, REE is estimated
based on individual characteristics (age, sex, weight, and height) using predictive equations
when measurement of REE cannot be directly performed (Cancello et al., 2018). Henes et al.
(2013) compare measured REE with estimated REE using published predictive equations
with the Harris Benedict, Lazzer and Molnar equations in 80 youth with obesity aged 7 to 18
years. They found that the mean difference between measured REE and equation-estimated
REE varied from 198 kcal/day to 308 kcal/day (Henes et al., 2013). Large discrepancies
between measured and predicted REE could have significant negative implications if such
equations are used, especially in children with PWS given their non-specificity.
104
Underestimation might lead to weight loss, while overestimation might contribute to weight
gain.
Additionally, this strategy does not take into consideration hyperphagia, dysfunction
in satiety, body composition (lower FFM) and food-seeking behaviors that are inherent to
PWS (Martinez Michel et al., 2016). Considering these additional factors is crucial when
deriving energy needs and assessing satiety to facilitate the development of optimal diets for
weight maintenance in children with PWS. The results presented in Chapter 5 add to the
small body of literature that investigates REE and demonstrate that non-specific predictive
equations cannot be used to make energy intake recommendations for individuals with PWS.
Furthermore, REE and PEE were highly variable within individual with PWS. These results
collectively suggest the need for individualized energy requirements for individuals with
PWS.
6.7 Limitations and Challenges
This research is highly novel and has shed light on the effect of macronutrient composition
on orexigenic (ghrelin and asprosin) and an anorexigenic GLP-1 and PYY, subjective
appetite assessment, and PEE in children with PWS compared to children without PWS.
However, some limitations must be considered, in addition to those mentioned in Chapters 3,
4 and 5. First, findings presented in Chapter 4 are from a cross-sectional study; causation
cannot be determined. Chapter 5 presented data on children and youth with PWS only; thus,
findings should only be applied to individuals with PWS. Furthermore, the addition of a
control group of children without the syndromic matching for age, sex and BMI z-score
would have provided information about whether children with PWS metabolize food
differently. In this thesis, the control group was not matched for sex with the PWS group.
Recruiting adolescents with overweight and obesity is challenging (Nguyen et al., 2012).
There are a number of complexities in adolescents with overweight and obesity research that
create additional challenges for clinical research. These include retention, compliance with
protocols, issues around consent and confidentiality, and participants’ motivation to support
the research (Nguyen et al., 2012). Our studies required participants to attend 3 to 5 visits of
between 3 and 7 hours each; this significant time commitment is a barrier to the participation
of control participants. Our controls were mainly boys, and siblings or friends of the
participants with PWS. Another limitation of the study is that dietary intake was not
standardized prior to each DIT measurement. DIT is calculated by subtracting PEE from
REE. Differences in dietary intake the day prior to the REE measurement can affect the
105
calculated value for DIT (Ruddick-Collins et al., 2013). Therefore, to minimize the effects of
day-to-day variability in REE measurements a run-in diet period may be appropriate. This
could be achieved through the provision of a standardize diet prior to each test day to assure
similar baseline measures. However, one of the advantages of providing the test diet prior to
the test visit, as we did in our study (one day prior to visits 2 and 3, participants received
[standard diet (SD) or HP diet a combined with whey protein] and received 3 meals
[breakfast, lunch and dinner] and 2 snacks [morning and evening snacks]), was to allow for
adaption to adjust fuel oxidation to fuel availability, which usually occurs between 1 to 7
days (Coyle et al., 1997; el-Khoury et al., 1997; Forslund et al., 1999; Galgani & Ravussin,
2008; Galgani et al., 2008; Schrauwen et al., 1997). Additionally, long-term feeding would
have a measurable influence on metabolic hormones compared to acute meal challenge
(Havel, 2001). The choice of methods should be specific to the particular research question,
with practicality and quality of data as priorities for consideration. For example, measurement
of REE, especially comparing two different diets, may be preferable under similar conditions
by standardizing the diet prior to each study visits (Johnston et al., 2002).
In Chapters 4 and 5, air displacement plethysmography (BodPod) was used to
measure body composition, which may also present some limitations. The BodPod uses age-
and sex-specific prediction formulas to estimate FFM based on body density (Gómez-
Ambrosi et al., 2012). However, most of the predictive formulas do not take into
consideration puberty status; given that puberty is largely reported to be delayed or absent in
individuals with PWS (Crino et al., 2003), body composition measured using the BodPod in
children should be interpreted with caution as the FFM could be under- or overestimated.
Another limitation of using the BodPod is its sensitivity to hydration levels and fluid
distribution (Hames, Anthony, Thornton, Gallagher, & Goodpaster, 2014; Le Carvennec et
al., 2007). Body composition is altered in individuals with PWS and that there are alterations
in body water distribution (van Mil et al., 2001). Thus, the assumptions made for this method
may not be true for individuals with PWS.
I faced challenges in working with rare disease research as PWS occurs in 1 in 10,000
to 16,000 live-born infants (Cassidy & Driscoll, 2009). The most frequent problem was the
recruitment of the required number of study participants for a research study. Recruitment
was limited to Edmonton and surrounding areas due to limited funding to cover participants’
travel expenses. PWS is also associated with cognitive delay (borderline to mild/moderate)
and behavioral abnormalities, including temper outbursts and obsessive and compulsive
behaviors such as hoarding, picking at the skin, ordering and arranging objects, insistence on
106
routines, and repetitive speech (Cassidy & Driscoll, 2009). Participants’ cognitive
impairment and limited communication skills affected their ability to complete the study
tasks and limited our final sample size. In addition, males with the deletion subtype (the most
common phenotype) are at greater risk for aggressive behavior, depression, dependent
personality disorder, and overall severity of psychopathology than females with PWS
deletion (Hartley, Maclean, Butler, Zarcone, & Thompson, 2005). Thus, the majority of our
participants were female. Multicenter and international collaborations would help provide
greater support for clinical investigations of rare diseases such as PWS. These recruitment
challenges and reduced study sample sizes also lead to the need for the adoption of
specialized study designs, such as a randomized crossover design in which all participants
serve as their own controls, as well as the use of biostatistical techniques to maximize data
from a small numbers of participants (Griggs et al., 2009). Additionally, reporting
participants’ data on rare diseases requires greater vigilance in protecting the privacy of
participants as publishing of family pedigree information or detailed clinical descriptions can
lead to identification of specific individuals (Griggs et al., 2009).
Despite the challenges of working with a rare disease, knowledge and experience
obtained from this opportunity increased our understanding of the impact of protein meals on
regulating appetite hormones and energy metabolism on this population. Additionally, these
results may shed light on personalized dietary interventions designed to curb hyperphagia and
maintain body weight in individuals with PWS.
6.8 Translation and Future Research Directions
Understanding the role of dietary protein on appetite-regulating hormones, subjective satiety
and energy metabolism in children with PWS is important for clinical translation and can
direct future research aimed at developing an optimal diet for weight maintenance among
children with PWS. There is evidence to suggest that REE, the main determinant of TEE, is
lower in individuals with PWS (Alsaif et al., 2017). Alterations in FFM, lower muscle mass
(Orsso et al., 2017) and lower physical activity appears to be responsible for the lower EE in
children with PWS, rather than metabolic differences (Alsaif et al., 2017). Regardless of the
underlying mechanism for lower TEE, the estimation of energy requirements with the use of
equations derived for the general population would result in weight gain in individuals with
PWS (Alsaif et al., 2017). The research presented in Chapter 5 suggests that there is a short-
term impact of a HP diet on REE. In addition, PEE calculated as “fixed REE” (explained in
Chapter 5) promoted approximately double the EE after the HP meal compared to the SM
107
(164.5 ± 146 vs 88.5 ± 149 kcal). An eight-week randomized controlled feeding trial among
weight-stable males and females, aged 18 to 35 years, found that 25% of total energy from
protein (high-protein intervention) resulted in an increase in REE, as measured by ventilated
hood, and lean soft tissue, as measured by dual-energy x-ray absorptiometry, compared to 5%
of total energy from protein (low-protein intervention) (Bray et al., 2012). Future research on
long-term, HP intake interventions combined with exercise in children with PWS will shed
light on the impact of high-protein intake on REE and FFM, and will help to facilitate the
development of optimal diets for weight maintenance in children with PWS.
Chapter 3 highlights a current gap in the ability to assess appetite (the desire to eat) in
young children. The development of this ability generally occurs at around age seven and is
dependent on cognitive ability (Shields et al., 2003). Therefore, current validated tools to
assess appetite do not provide accurate estimations in young children. Future research on
validating tools to assess appetite in young children will facilitate researchers’ ability to the
investigation of the role of appetite in the regulation of FI and the impact of interventions on
appetite. Ongoing study in our lab aims to validate a tool to assess appetite in children ages 4
to 10 years using a dual-component, picture-based appetite assessment tool. The first component
assesses motivation to eat, while the second component assesses level of hunger or fullness.
Chapter 4 measured the suppression of asprosin one hour after a SM that represented a
typical Canadian diet (Garriguet, 2007). Future studies on the impact of macronutrients
distribution on asprosin regulation postprandial shortly after a meal and a few hours later will
help us understand the role of asprosin in regulating FI.
Results from Chapter 3 demonstrated that higher protein meals stimulated greater
increases in GLP-1 and PYY in PWS children. Results from Chapter 5 proved that average
appetite was lower at 15 minutes after breakfast consumption. Previous studies revealed
associations between protein intake and body composition. Dietary protein is needed for
muscle anabolism and it occurs when protein synthesis exceeds its breakdown rate (Mitchell
et al., 2016). Jen et al. (2018) showed that a higher protein intake in children is associated
with a higher FFM (Jen, Karagounis, Jaddoe, Franco, & Voortman, 2018). Body weight
might also change frequently and rapidly in children as they grow—hence the need for
improved early nutritional interventions in these individuals. Based on results from this thesis
and previous published studies (Acheson et al., 2011; Miller et al., 2013; Nguo et al., 2018),
we recommend frequent, high quality protein meals and snacks as the optimal approach for
children with PWS to curb hunger and improve body composition. Ideally, a total energy
intake based on the individual’s REE is recommended, with high quality protein
108
approximately every 2 to 3 hours. Miller et al. (2013) measured REE in children with PWS
using a metabolic cart and recommended a total energy intake based on each individual’s
REE. Participants, who followed the recommendation for 5 years saw improvements in
weight control, body composition (lower body fat) and lower RER (Miller et al., 2013).
Additionally, studies in healthy adults and children have shown a relationship between satiety
and PEE when a meal consisting of ≥ 50% energy from protein was consumed (Acheson et
al., 2011; Nguo et al., 2018).
It is important to consider not only protein quantity but also the source of protein.
Consumption of animal protein (especially red meat) was related to higher FFM in the
pediatric population and young adults (Assmann et al., 2013; Harris et al., 2016). In men with
overweight and obesity, animal protein (pork protein) increased EE compared to (plant
protein) soy protein (Mikkelsen, Toubro, & Astrup, 2000). In a study of individuals with
overweight and obesity who consumed supplemental whey protein, soy protein, and an
isoenergetic amount of carbohydrate for 23 weeks, those consuming whey protein showed
decreased body weight, fat mass, waist circumference and fasting ghrelin (Baer et al., 2011).
Regarding appetite and energy intake, no differences between animal (beef) vs. plant (soy)
source of protein on hunger, fullness, PYY, or GLP-1 responses in healthy adults were
observed (Douglas, Lasley, & Leidy, 2015). These findings suggest that high quality protein,
regardless of the source, has similar effects on appetite. Findings from this thesis revealed
that average appetite decreased at 15 minutes (p = 0.02) after the meal was consumed and
returned to baseline level at 3 hours (p = 0.02). Furthermore, average appetite was higher than
baseline at 4 hours (p = 0.04). Findings from this thesis showed that an acute intake of HP
diet was beneficial to these individuals. However, to help design targeted nutritional
strategies to curb hunger drives, future studies must determine the impact of longer-term
intake of HP diet of different macronutrient ratios, and its respective impact of frequent meals
and snack consumption on subjective appetite, and satiety hormones, among others.
Nonetheless, this thesis is an initial step in facilitating the development of optimal diets for
weight maintenance in children with PWS.
6.9 Conclusion
The major findings of this research were that a higher concentration of total ghrelin in
children with PWS was due to higher concentrations of both AG and DAG, with no change in
the ratio. Meal consumption also suppresses both forms of ghrelin to a greater extent in
109
children with PWS. An elevated fasting plasma proinsulin:insulin ratio in PWS children
suggests an impaired processing of proinsulin. Higher protein meals stimulated greater
increases in GLP-1 and PYY in children with PWS than in controls. In addition, the RER
after the HP diet was significantly lower compared to standard diet; and PEE, calculated as
“fixed REE,” was double after the HP meal compared to SM. Therefore, a HP diet could
provide a favorable influence on biomarkers of satiety and, possibly, the degree of
hyperphagia in children with PWS. Testing this hypothesis will require long-term studies of
the effects of HP intake on FI and weight gain.

110
Bibliography
Abbasi, A., Juszczyk, D., van Jaarsveld, C. H. M., & Gulliford, M. C. (2017). Body Mass
Index and Incident Type 1 and Type 2 Diabetes in Children and Young Adults: A
Retrospective Cohort Study. J Endocr Soc, 1(5), 524-537. doi:10.1210/js.2017-00044
Acara, A. C., Bolatkale, M., Kiziloglu, I., Ibisoglu, E., & Can, C. (2018). A novel
biochemical marker for predicting the severity of ACS with unstable angina pectoris:
Asprosin. Am J Emerg Med, 36(8), 1504-1505. doi:10.1016/j.ajem.2017.12.032
Acheson, K. J., Blondel-Lubrano, A., Oguey-Araymon, S., Beaumont, M., Emady-Azar, S.,
Ammon-Zufferey, C., . . . Bovetto, L. (2011). Protein choices targeting thermogenesis
and metabolism. Am J Clin Nutr, 93(3), 525-534. doi:10.3945/ajcn.110.005850
Adrian, T. E., Ferri, G. L., Bacarese-Hamilton, A. J., Fuessl, H. S., Polak, J. M., & Bloom, S.
R. (1985). Human distribution and release of a putative new gut hormone, peptide
YY. Gastroenterology, 89(5), 1070-1077.
Agus, M. S., Swain, J. F., Larson, C. L., Eckert, E. A., & Ludwig, D. S. (2000). Dietary
composition and physiologic adaptations to energy restriction. Am J Clin Nutr, 71(4),
901-907. doi:10.1093/ajcn/71.4.901
Albouaini, K., Egred, M., Alahmar, A., & Wright, D. J. (2007). Cardiopulmonary exercise
testing and its application. Heart, 93(10), 1285-1292. doi:10.1136/hrt.2007.121558
Allas, S., & Abribat, T. (2013). Clinical perspectives for ghrelin-derived therapeutic products.
Endocr Dev, 25, 157-166. doi:10.1159/000346065
Allas, S., Caixas, A., Poitou, C., Coupaye, M., Thuilleaux, D., Lorenzini, F., . . . Tauber, M.
(2018). AZP-531, an unacylated ghrelin analog, improves food-related behavior in
patients with Prader-Willi syndrome: A randomized placebo-controlled trial. PLoS
One, 13(1), e0190849. doi:10.1371/journal.pone.0190849
Alsaif, M., Elliot, S. A., MacKenzie, M. L., Prado, C. M., Field, C. J., & Haqq, A. M. (2017).
Energy Metabolism Profile in Individuals with Prader-Willi Syndrome and
Implications for Clinical Management: A Systematic Review. Adv Nutr, 8(6), 905-
915. doi:10.3945/an.117.016253
Anderson, G. H. (1979). Control of protein and energy intake: role of plasma amino acids and
brain neurotransmitters. Can J Physiol Pharmacol, 57(10), 1043-1057.
doi:10.1139/y79-158
Anderson, G. H., Catherine, N. L., Woodend, D. M., & Wolever, T. M. (2002). Inverse
association between the effect of carbohydrates on blood glucose and subsequent
short-term food intake in young men. Am J Clin Nutr, 76(5), 1023-1030.
doi:10.1093/ajcn/76.5.1023
Anderson, G. H., Hunschede, S., Akilen, R., & Kubant, R. (2016). Physiology of Food Intake
Control in Children. Adv Nutr, 7(1), 232s-240s. doi:10.3945/an.115.009357
Anderson, G. H., & Moore, S. E. (2004). Dietary proteins in the regulation of food intake and
body weight in humans. J Nutr, 134(4), 974s-979s. doi:10.1093/jn/134.4.974S
Arenz, T., Schwarzer, A., Pfluger, T., Koletzko, S., & Schmidt, H. (2010). Delayed gastric
emptying in patients with Prader Willi Syndrome. J Pediatr Endocrinol Metab, 23(9),
867-871. doi:10.1515/jpem.2010.140
Armellini, F., Zamboni, M., Mino, A., Bissoli, L., Micciolo, R., & Bosello, O. (2000).
Postabsorptive resting metabolic rate and thermic effect of food in relation to body
composition and adipose tissue distribution. Metabolism, 49(1), 6-10.
doi:10.1016/s0026-0495(00)90513-4
Assmann, K. E., Joslowski, G., Buyken, A. E., Cheng, G., Remer, T., Kroke, A., & Gunther,
A. L. (2013). Prospective association of protein intake during puberty with body
111
composition in young adulthood. Obesity (Silver Spring), 21(12), E782-789.
doi:10.1002/oby.20516
Astrup, A. (2005). The satiating power of protein--a key to obesity prevention? Am J Clin
Nutr, 82(1), 1-2. doi:10.1093/ajcn.82.1.1
Atalayer, D., Gibson, C., Konopacka, A., & Geliebter, A. (2013). Ghrelin and eating
disorders. Prog Neuropsychopharmacol Biol Psychiatry, 40, 70-82.
doi:10.1016/j.pnpbp.2012.08.011
Austin, G. L., Ogden, L. G., & Hill, J. O. (2011). Trends in carbohydrate, fat, and protein
intakes and association with energy intake in normal-weight, overweight, and obese
individuals: 1971-2006. Am J Clin Nutr, 93(4), 836-843.
doi:10.3945/ajcn.110.000141
Aycan, Z., & Bas, V. N. (2014). Prader-Willi syndrome and growth hormone deficiency. J
Clin Res Pediatr Endocrinol, 6(2), 62-67. doi:10.4274/Jcrpe.1228
Baer, D. J., Stote, K. S., Paul, D. R., Harris, G. K., Rumpler, W. V., & Clevidence, B. A.
(2011). Whey protein but not soy protein supplementation alters body weight and
composition in free-living overweight and obese adults. J Nutr, 141(8), 1489-1494.
doi:10.3945/jn.111.139840
Ballantyne, G. H. (2006). Peptide YY(1-36) and peptide YY(3-36): Part I. Distribution,
release and actions. Obes Surg, 16(5), 651-658. doi:10.1381/096089206776944959
Batterham, R. L., Cohen, M. A., Ellis, S. M., Le Roux, C. W., Withers, D. J., Frost, G. S., . . .
Bloom, S. R. (2003). Inhibition of food intake in obese subjects by peptide YY3-36. N
Engl J Med, 349(10), 941-948. doi:10.1056/NEJMoa030204
Baum, J. I., Gray, M., & Binns, A. (2015). Breakfasts Higher in Protein Increase Postprandial
Energy Expenditure, Increase Fat Oxidation, and Reduce Hunger in Overweight
Children from 8 to 12 Years of Age. J Nutr. doi:10.3945/jn.115.214551
Bedogni, G., Grugni, G., Tringali, G., Agosti, F., & Sartorio, A. (2015). Assessment of fat-
free mass from bioelectrical impedance analysis in obese women with Prader-Willi
syndrome. Ann Hum Biol, 42(6), 538-542. doi:10.3109/03014460.2014.990922
Bekx, M. T., Carrel, A. L., Shriver, T. C., Li, Z., & Allen, D. B. (2003a). Decreased energy
expenditure is caused by abnormal body composition in infants with Prader-Willi
Syndrome. J Pediatr, 143(3), 372-376. doi:10.1067/s0022-3476(03)00386-x
Bekx, M. T., Carrel, A. L., Shriver, T. C., Li, Z. H., & Allen, D. B. (2003b). Decreased
energy expenditure is caused by abnormal body composition in infants with Prader-
Willi syndrome. Journal of Pediatrics, 143(3), 372-376. doi:10.1067/s0022-
3476(03)00386-x
Bellissimo, N., Desantadina, M. V., Pencharz, P. B., Berall, G. B., Thomas, S. G., &
Anderson, G. H. (2008). A comparison of short-term appetite and energy intakes in
normal weight and obese boys following glucose and whey-protein drinks. Int J Obes
(Lond), 32(2), 362-371. doi:10.1038/sj.ijo.0803709
Bellissimo, N., Pencharz, P. B., Thomas, S. G., & Anderson, G. H. (2007). Effect of
television viewing at mealtime on food intake after a glucose preload in boys. Pediatr
Res, 61(6), 745-749. doi:10.1203/pdr.0b013e3180536591
Bellissimo, N., Thomas, S. G., Pencharz, P. B., Goode, R. C., & Anderson, G. H. (2008).
Reproducibility of short-term food intake and subjective appetite scores after a
glucose preload, ventilation threshold, and body composition in boys. Appl Physiol
Nutr Metab, 33(2), 326-337. doi:10.1139/h07-194
Belza, A., Ritz, C., Sorensen, M. Q., Holst, J. J., Rehfeld, J. F., & Astrup, A. (2013).
Contribution of gastroenteropancreatic appetite hormones to protein-induced satiety.
Am J Clin Nutr, 97(5), 980-989. doi:10.3945/ajcn.112.047563
112
Bennett, L. J., Totosy de Zepetnek, J. O., Brett, N. R., Poirier, K., Guo, Q., Rousseau, D., &
Bellissimo, N. (2018). Effect of Commercially Available Sugar-Sweetened Beverages
on Subjective Appetite and Short-Term Food Intake in Girls. Nutrients, 10(4).
doi:10.3390/nu10040394
Bessard, T., Schutz, Y., & Jequier, E. (1983). Energy expenditure and postprandial
thermogenesis in obese women before and after weight loss. Am J Clin Nutr, 38(5),
680-693. doi:10.1093/ajcn/38.5.680
Beutler, L. R., & Knight, Z. A. (2018). A Spotlight on Appetite. Neuron, 97(4), 739-741.
doi:10.1016/j.neuron.2018.01.050
Bisdee, J. T., James, W. P., & Shaw, M. A. (1989). Changes in energy expenditure during the
menstrual cycle. Br J Nutr, 61(2), 187-199. doi:10.1079/bjn19890108
Bizzarri, C., Rigamonti, A. E., Luce, A., Cappa, M., Cella, S. G., Berini, J., . . . Salvatoni, A.
(2010). Children with Prader-Willi syndrome exhibit more evident meal-induced
responses in plasma ghrelin and peptide YY levels than obese and lean children. Eur J
Endocrinol, 162(3), 499-505. doi:10.1530/eje-09-1033
Blasco Redondo, R. (2015). Resting energy expenditure; assessment methods and
applications. Nutr Hosp, 31 Suppl 3, 245-254. doi:10.3305/nh.2015.31.sup3.8772
Blauwhoff-Buskermolen, S., Langius, J. A., Heijboer, A. C., Becker, A., de van der
Schueren, M. A., & Verheul, H. M. (2017). Plasma Ghrelin Levels Are Associated
with Anorexia but Not Cachexia in Patients with NSCLC. Front Physiol, 8, 119.
doi:10.3389/fphys.2017.00119
Bodinham, C. L., Hitchen, K. L., Youngman, P. J., Frost, G. S., & Robertson, M. D. (2011).
Short-term effects of whole-grain wheat on appetite and food intake in healthy adults:
a pilot study. Br J Nutr, 106(3), 327-330. doi:10.1017/s0007114511000225
Boirie, Y., Dangin, M., Gachon, P., Vasson, M. P., Maubois, J. L., & Beaufrere, B. (1997).
Slow and fast dietary proteins differently modulate postprandial protein accretion.
Proc Natl Acad Sci U S A, 94(26), 14930-14935. doi:10.1073/pnas.94.26.14930
Botchlett, R., & Wu, C. (2018). Diet Composition for the Management of Obesity and
Obesity-related Disorders. J Diabetes Mellit Metab Syndr, 3, 10-25.
doi:10.28967/jdmms.2018.01.18002
Bowen, J., Noakes, M., & Clifton, P. M. (2006). Appetite regulatory hormone responses to
various dietary proteins differ by body mass index status despite similar reductions in
ad libitum energy intake. J Clin Endocrinol Metab, 91(8), 2913-2919.
doi:10.1210/jc.2006-0609
Bray, G. A., Smith, S. R., de Jonge, L., Xie, H., Rood, J., Martin, C. K., . . . Redman, L. M.
(2012). Effect of dietary protein content on weight gain, energy expenditure, and body
composition during overeating: a randomized controlled trial. JAMA, 307(1), 47-55.
doi:10.1001/jama.2011.1918
Brennan, I. M., Luscombe-Marsh, N. D., Seimon, R. V., Otto, B., Horowitz, M., Wishart, J.
M., & Feinle-Bisset, C. (2012). Effects of fat, protein, and carbohydrate and protein
load on appetite, plasma cholecystokinin, peptide YY, and ghrelin, and energy intake
in lean and obese men. Am J Physiol Gastrointest Liver Physiol, 303(1), G129-140.
doi:10.1152/ajpgi.00478.2011
Broglio, F., Gottero, C., Prodam, F., Destefanis, S., Gauna, C., Me, E., . . . Ghigo, E. (2004).
Ghrelin secretion is inhibited by glucose load and insulin-induced hypoglycaemia but
unaffected by glucagon and arginine in humans. Clin Endocrinol (Oxf), 61(4), 503-
509. doi:10.1111/j.1365-2265.2004.02121.x
Brychta, R., Wohlers, E., Moon, J., & Chen, K. (2010). Energy expenditure: measurement of
human metabolism. IEEE Eng Med Biol Mag, 29(1), 42-47.
doi:10.1109/memb.2009.935463
113
Buchholz, A. C., & Schoeller, D. A. (2004). Is a calorie a calorie? Am J Clin Nutr, 79(5),
899s-906s.
Burman, P., Ritzen, E. M., & Lindgren, A. C. (2001). Endocrine dysfunction in Prader-Willi
syndrome: a review with special reference to GH. Endocr Rev, 22(6), 787-799.
doi:10.1210/edrv.22.6.0447
Burnett, L. C., LeDuc, C. A., Sulsona, C. R., Paull, D., Rausch, R., Eddiry, S., . . . Leibel, R.
L. (2017). Deficiency in prohormone convertase PC1 impairs prohormone processing
in Prader-Willi syndrome. J Clin Invest, 127(1), 293-305. doi:10.1172/jci88648
Butler, M. G. (2006). Management of obesity in Prader-Willi syndrome. Nat Clin Pract
Endocrinol Metab, 2(11), 592-593. doi:10.1038/ncpendmet0320
Butler, M. G. (2011). Prader-Willi Syndrome: Obesity due to Genomic Imprinting. Curr
Genomics, 12(3), 204-215. doi:10.2174/138920211795677877
Butler, M. G., Bittel, D. C., & Talebizadeh, Z. (2004). Plasma peptide YY and ghrelin levels
in infants and children with Prader-Willi syndrome. J Pediatr Endocrinol Metab,
17(9), 1177-1184.
Butler, M. G., Theodoro, M. F., Bittel, D. C., & Donnelly, J. E. (2007a). Energy expenditure
and phvsical activity in Prader-Willi syndrome: Comparison with obese subjects.
American Journal of Medical Genetics Part A, 143A(5), 449-459.
doi:10.1002/ajmg.a.31507
Butler, M. G., Theodoro, M. F., Bittel, D. C., & Donnelly, J. E. (2007b). Energy expenditure
and physical activity in Prader-Willi syndrome: comparison with obese subjects. Am J
Med Genet A, 143a(5), 449-459. doi:10.1002/ajmg.a.31507
Calbet, J. A., & Holst, J. J. (2004). Gastric emptying, gastric secretion and enterogastrone
response after administration of milk proteins or their peptide hydrolysates in humans.
Eur J Nutr, 43(3), 127-139. doi:10.1007/s00394-004-0448-4
Camfferman, D., McEvoy, R. D., O'Donoghue, F., & Lushington, K. (2008). Prader Willi
Syndrome and excessive daytime sleepiness. Sleep Med Rev, 12(1), 65-75.
doi:10.1016/j.smrv.2007.08.005
Campfield, L. A., Smith, F. J., Guisez, Y., Devos, R., & Burn, P. (1995). Recombinant mouse
OB protein: evidence for a peripheral signal linking adiposity and central neural
networks. Science, 269(5223), 546-549.
Cancello, R., Soranna, D., Brunani, A., Scacchi, M., Tagliaferri, A., Mai, S., . . . Invitti, C.
(2018). Analysis of Predictive Equations for Estimating Resting Energy Expenditure
in a Large Cohort of Morbidly Obese Patients. Front Endocrinol (Lausanne), 9, 367.
doi:10.3389/fendo.2018.00367
Carneiro, I. P., Elliott, S. A., Siervo, M., Padwal, R., Bertoli, S., Battezzati, A., & Prado, C.
M. (2016). Is Obesity Associated with Altered Energy Expenditure? Adv Nutr, 7(3),
476-487. doi:10.3945/an.115.008755
Carnell, S., Benson, L., Pryor, K., & Driggin, E. (2013). Appetitive traits from infancy to
adolescence: using behavioral and neural measures to investigate obesity risk. Physiol
Behav, 121, 79-88. doi:10.1016/j.physbeh.2013.02.015
Carr, R. D., Larsen, M. O., Jelic, K., Lindgren, O., Vikman, J., Holst, J. J., . . . Ahren, B.
(2010). Secretion and dipeptidyl peptidase-4-mediated metabolism of incretin
hormones after a mixed meal or glucose ingestion in obese compared to lean,
nondiabetic men. J Clin Endocrinol Metab, 95(2), 872-878. doi:10.1210/jc.2009-2054
Carr, R. D., Larsen, M. O., Winzell, M. S., Jelic, K., Lindgren, O., Deacon, C. F., & Ahren,
B. (2008). Incretin and islet hormonal responses to fat and protein ingestion in healthy
men. Am J Physiol Endocrinol Metab, 295(4), E779-784.
doi:10.1152/ajpendo.90233.2008
114
Carreiro, A. L., Dhillon, J., Gordon, S., Higgins, K. A., Jacobs, A. G., McArthur, B. M., . . .
Mattes, R. D. (2016). The Macronutrients, Appetite, and Energy Intake. Annu Rev
Nutr, 36, 73-103. doi:10.1146/annurev-nutr-121415-112624
Carrel, A. L., Moerchen, V., Myers, S. E., Bekx, M. T., Whitman, B. Y., & Allen, D. B.
(2004). Growth hormone improves mobility and body composition in infants and
toddlers with Prader-Willi syndrome. J Pediatr, 145(6), 744-749.
doi:10.1016/j.jpeds.2004.08.002
Cassidy, S. B., & Driscoll, D. J. (2009). Prader-Willi syndrome. Eur J Hum Genet, 17(1), 3-
13. doi:10.1038/ejhg.2008.165
Cassidy, S. B., Schwartz, S., Miller, J. L., & Driscoll, D. J. (2012). Prader-Willi syndrome.
Genet Med, 14(1), 10-26. doi:10.1038/gim.0b013e31822bead0
Castner, D. M., Rubin, D. A., Judelson, D. A., & Haqq, A. M. (2013). Effects of adiposity
and Prader-Willi Syndrome on postexercise heart rate recovery. J Obes, 2013,
384167. doi:10.1155/2013/384167
Chabot, F., Caron, A., Laplante, M., & St-Pierre, D. H. (2014). Interrelationships between
ghrelin, insulin and glucose homeostasis: Physiological relevance. World J Diabetes,
5(3), 328-341. doi:10.4239/wjd.v5.i3.328
Clark, M., & Hoenig, M. (2016). Metabolic Effects of Obesity and Its Interaction with
Endocrine Diseases. Vet Clin North Am Small Anim Pract, 46(5), 797-815.
doi:10.1016/j.cvsm.2016.04.004
Colditz, G. A. (2010). Overview of the epidemiology methods and applications: strengths and
limitations of observational study designs. Crit Rev Food Sci Nutr, 50 Suppl 1, 10-12.
doi:10.1080/10408398.2010.526838
Compher, C., Frankenfield, D., Keim, N., & Roth-Yousey, L. (2006). Best practice methods
to apply to measurement of resting metabolic rate in adults: a systematic review. J Am
Diet Assoc, 106(6), 881-903. doi:10.1016/j.jada.2006.02.009
Conwell, L. S., Trost, S. G., Brown, W. J., & Batch, J. A. (2004). Indexes of insulin
resistance and secretion in obese children and adolescents: a validation study.
Diabetes Care, 27(2), 314-319. doi:10.2337/diacare.27.2.314
Coplin, S. S., Hine, J., & Gormican, A. (1976). Out-patient dietary management in the
Prader-Willi syndrome. J Am Diet Assoc, 68(4), 330-334.
Coyle, E. F., Jeukendrup, A. E., Wagenmakers, A. J., & Saris, W. H. (1997). Fatty acid
oxidation is directly regulated by carbohydrate metabolism during exercise. Am J
Physiol, 273(2 Pt 1), E268-275. doi:10.1152/ajpendo.1997.273.2.E268
Crino, A., Schiaffini, R., Ciampalini, P., Spera, S., Beccaria, L., Benzi, F., . . . Livieri, C.
(2003). Hypogonadism and pubertal development in Prader-Willi syndrome. Eur J
Pediatr, 162(5), 327-333. doi:10.1007/s00431-002-1132-4
Crovetti, R., Porrini, M., Santangelo, A., & Testolin, G. (1998). The influence of thermic
effect of food on satiety. Eur J Clin Nutr, 52(7), 482-488.
doi:10.1038/sj.ejcn.1600578
Crowder, C. M., Neumann, B. L., & Baum, J. I. (2016). Breakfast Protein Source Does Not
Influence Postprandial Appetite Response and Food Intake in Normal Weight and
Overweight Young Women. J Nutr Metab, 2016, 6265789.
doi:10.1155/2016/6265789
Curfs, L. M., & Fryns, J. P. (1992). Prader-Willi syndrome: a review with special attention to
the cognitive and behavioral profile. Birth Defects Orig Artic Ser, 28(1), 99-104.
Czech, M. P. (2017). Insulin action and resistance in obesity and type 2 diabetes. Nat Med,
23(7), 804-814. doi:10.1038/nm.4350
115
D'Alessio, D. A., Kavle, E. C., Mozzoli, M. A., Smalley, K. J., Polansky, M., Kendrick, Z.
V., . . . Owen, O. E. (1988). Thermic effect of food in lean and obese men. Journal of
Clinical Investigation, 81(6), 1781-1789.
Dabbech, M., Aubert, R., Apfelbaum, M., & Boulier, A. (1994). Reproducible measurement
of postprandial energy expenditure in young healthy males. Am J Clin Nutr, 60(6),
849-854. doi:10.1093/ajcn/60.6.849
Dabbech, M., Boulier, A., Apfelbaum, M., & Aubert, R. (1996). Thermic effect of meal and
fat mass in lean and obese men. Nutrition Research, 16(7), 1133-1141.
doi:10.1016/0271-5317(96)00117-0
Dailey, M. J., & Moran, T. H. (2013). Glucagon-like peptide 1 and appetite. Trends
Endocrinol Metab, 24(2), 85-91. doi:10.1016/j.tem.2012.11.008
Date, Y., Kojima, M., Hosoda, H., Sawaguchi, A., Mondal, M. S., Suganuma, T., . . .
Nakazato, M. (2000). Ghrelin, a novel growth hormone-releasing acylated peptide, is
synthesized in a distinct endocrine cell type in the gastrointestinal tracts of rats and
humans. Endocrinology, 141(11), 4255-4261. doi:10.1210/endo.141.11.7757
Davies, H. J., Baird, I. M., Fowler, J., Mills, I. H., Baillie, J. E., Rattan, S., & Howard, A. N.
(1989). Metabolic response to low- and very-low-calorie diets. Am J Clin Nutr, 49(5),
745-751. doi:10.1093/ajcn/49.5.745
Davies, P. S., & Joughin, C. (1993). Using stable isotopes to assess reduced physical activity
of individuals with Prader-Willi syndrome. Am J Ment Retard, 98(3), 349-353.
De Palo, C., Macor, C., Sicolo, N., Vettor, R., Scandellari, C., & Federspil, G. (1989).
Dietary-induced thermogenesis in obesity. Response to mixed and carbohydrate
meals. Acta Diabetologica Latina, 26(2), 155-162. doi:10.1007/BF02581367
De Vriese, C., Gregoire, F., Lema-Kisoka, R., Waelbroeck, M., Robberecht, P., & Delporte,
C. (2004). Ghrelin degradation by serum and tissue homogenates: identification of the
cleavage sites. Endocrinology, 145(11), 4997-5005. doi:10.1210/en.2004-0569
Degen, L., Oesch, S., Casanova, M., Graf, S., Ketterer, S., Drewe, J., & Beglinger, C. (2005).
Effect of peptide YY3-36 on food intake in humans. Gastroenterology, 129(5), 1430-
1436. doi:10.1053/j.gastro.2005.09.001
Delhanty, P. J., Huisman, M., Julien, M., Mouchain, K., Brune, P., Themmen, A. P., . . . van
der Lely, A. J. (2015). The acylated (AG) to unacylated (UAG) ghrelin ratio in
esterase inhibitor-treated blood is higher than previously described. Clin Endocrinol
(Oxf), 82(1), 142-146. doi:10.1111/cen.12489
DelParigi, A., Tschop, M., Heiman, M. L., Salbe, A. D., Vozarova, B., Sell, S. M., . . .
Tataranni, P. A. (2002). High circulating ghrelin: a potential cause for hyperphagia
and obesity in prader-willi syndrome. J Clin Endocrinol Metab, 87(12), 5461-5464.
doi:10.1210/jc.2002-020871
den Besten, C., Vansant, G., Weststrate, J. A., & Deurenberg, P. (1988). Resting metabolic
rate and diet-induced thermogenesis in abdominal and gluteal-femoral obese women
before and after weight reduction. Am J Clin Nutr, 47(5), 840-847.
doi:10.1093/ajcn/47.5.840
Deurenberg, P. (1996). Limitations of the bioelectrical impedance method for the assessment
of body fat in severe obesity. Am J Clin Nutr, 64(3 Suppl), 449s-452s.
Dietz, W H, Bandini, L G, Morelli, J A, Peers, K F, & Ching, P L H. (1994). Effect of
sedentary activities on resting metabolic rate. Am J Clin Nutr, 59(3), 556-559.
doi:10.1093/ajcn/59.3.556
DiMario, F. J., Jr., Dunham, B., Burleson, J. A., Moskovitz, J., & Cassidy, S. B. (1994). An
evaluation of autonomic nervous system function in patients with Prader-Willi
syndrome. Pediatrics, 93(1), 76-81.
116
Ding, F., Li, H. H., Zhang, S., Solomon, N. M., Camper, S. A., Cohen, P., & Francke, U.
(2008). SnoRNA Snord116 (Pwcr1/MBII-85) deletion causes growth deficiency and
hyperphagia in mice. PLoS One, 3(3), e1709. doi:10.1371/journal.pone.0001709
Donahoo, W. T., Levine, J. A., & Melanson, E. L. (2004). Variability in energy expenditure
and its components. Curr Opin Clin Nutr Metab Care, 7(6), 599-605.
Douglas, S. M., Lasley, T. R., & Leidy, H. J. (2015). Consuming Beef vs. Soy Protein Has
Little Effect on Appetite, Satiety, and Food Intake in Healthy Adults. J Nutr, 145(5),
1010-1016. doi:10.3945/jn.114.206987
Duerrschmid, C., He, Y., Wang, C., Li, C., Bournat, J. C., Romere, C., . . . Chopra, A. R.
(2017). Asprosin is a centrally acting orexigenic hormone. Nat Med, 23(12), 1444-
1453. doi:10.1038/nm.4432
Duffield, R., Dawson, B., Pinnington, H. C., & Wong, P. (2004). Accuracy and reliability of
a Cosmed K4b2 portable gas analysis system. J Sci Med Sport, 7(1), 11-22.
Eiholzer, U., Nordmann, Y., l'Allemand, D., Schlumpf, M., Schmid, S., & Kromeyer-
Hauschild, K. (2003). Improving body composition and physical activity in Prader-
Willi Syndrome. J Pediatr, 142(1), 73-78. doi:10.1067/mpd.2003.mpd0334
Eiholzer, U., Stutz, K., Weinmann, C., Torresani, T., Molinari, L., & Prader, A. (1998). Low
insulin, IGF-I and IGFBP-3 levels in children with Prader-Labhart-Willi syndrome.
Eur J Pediatr, 157(11), 890-893.
Eknoyan, G. (1999). Santorio Sanctorius (1561-1636) - founding father of metabolic balance
studies. Am J Nephrol, 19(2), 226-233. doi:10.1159/000013455
el-Khoury, A. E., Forslund, A., Olsson, R., Branth, S., Sjodin, A., Andersson, A., . . . Young,
V. R. (1997). Moderate exercise at energy balance does not affect 24-h leucine
oxidation or nitrogen retention in healthy men. Am J Physiol, 273(2 Pt 1), E394-407.
doi:10.1152/ajpendo.1997.273.2.E394
Elliott, R. M., Morgan, L. M., Tredger, J. A., Deacon, S., Wright, J., & Marks, V. (1993).
Glucagon-like peptide-1 (7-36)amide and glucose-dependent insulinotropic
polypeptide secretion in response to nutrient ingestion in man: acute post-prandial and
24-h secretion patterns. J Endocrinol, 138(1), 159-166.
Emerick, J. E., & Vogt, K. S. (2013). Endocrine manifestations and management of Prader-
Willi syndrome. Int J Pediatr Endocrinol, 2013(1), 14. doi:10.1186/1687-9856-2013-
14
Erdmann, J., Lippl, F., & Schusdziarra, V. (2003). Differential effect of protein and fat on
plasma ghrelin levels in man. Regul Pept, 116(1-3), 101-107.
Erdmann, J., Topsch, R., Lippl, F., Gussmann, P., & Schusdziarra, V. (2004). Postprandial
response of plasma ghrelin levels to various test meals in relation to food intake,
plasma insulin, and glucose. J Clin Endocrinol Metab, 89(6), 3048-3054.
doi:10.1210/jc.2003-031610
Flanagan, D. E., Evans, M. L., Monsod, T. P., Rife, F., Heptulla, R. A., Tamborlane, W. V.,
& Sherwin, R. S. (2003). The influence of insulin on circulating ghrelin. Am J Physiol
Endocrinol Metab, 284(2), E313-316. doi:10.1152/ajpendo.00569.2001
Forslund, Anders H., El-Khoury, Antoine E., Olsson, Roger M., Sjödin, Anders M.,
Hambraeus, Leif, & Young, Vernon R. (1999). Effect of protein intake and physical
activity on 24-h pattern and rate of macronutrient utilization. American Journal of
Physiology-Endocrinology and Metabolism, 276(5), E964-E976.
doi:10.1152/ajpendo.1999.276.5.E964
Foster-Schubert, K. E., Overduin, J., Prudom, C. E., Liu, J., Callahan, H. S., Gaylinn, B. D., .
. . Cummings, D. E. (2008). Acyl and total ghrelin are suppressed strongly by ingested
proteins, weakly by lipids, and biphasically by carbohydrates. J Clin Endocrinol
Metab, 93(5), 1971-1979. doi:10.1210/jc.2007-2289
117
Froidevaux, F., Schutz, Y., Christin, L., & Jequier, E. (1993). Energy expenditure in obese
women before and during weight loss, after refeeding, and in the weight-relapse
period. Am J Clin Nutr, 57(1), 35-42. doi:10.1093/ajcn/57.1.35
Fu, Z., Gilbert, E. R., & Liu, D. (2013). Regulation of insulin synthesis and secretion and
pancreatic Beta-cell dysfunction in diabetes. Curr Diabetes Rev, 9(1), 25-53.
Galgani, J. E., Moro, C., & Ravussin, E. (2008). Metabolic flexibility and insulin resistance.
Am J Physiol Endocrinol Metab, 295(5), E1009-1017.
doi:10.1152/ajpendo.90558.2008
Galgani, J., & Ravussin, E. (2008). Energy metabolism, fuel selection and body weight
regulation. Int J Obes (Lond), 32 Suppl 7, S109-119. doi:10.1038/ijo.2008.246
Garby, L., Kurzer, M. S., Lammert, O., & Nielsen, E. (1987). Energy expenditure during
sleep in men and women: evaporative and sensible heat losses. Hum Nutr Clin Nutr,
41(3), 225-233.
Garriguet, D. (2007). Canadians' eating habits. Health Rep, 18(2), 17-32.
Gheller, B. J. F., Totosy de Zepetnek, J. O., Welch, J. M., Rossiter, M. D., Luhovyy, B.,
Brett, N. R., & Bellissimo, N. (2019). Effect of video game playing and a glucose
preload on subjective appetite, subjective emotions, and food intake in overweight
and obese boys. Appl Physiol Nutr Metab, 44(3), 248-254. doi:10.1139/apnm-2018-
0281
Gibney, M. J., Barr, S. I., Bellisle, F., Drewnowski, A., Fagt, S., Hopkins, S., . . . Masset, G.
(2018). Towards an Evidence-Based Recommendation for a Balanced Breakfast-A
Proposal from the International Breakfast Research Initiative. Nutrients, 10(10).
doi:10.3390/nu10101540
Gillett, E. S., & Perez, I. A. (2016). Disorders of Sleep and Ventilatory Control in Prader-
Willi Syndrome. Diseases, 4(3). doi:10.3390/diseases4030023
Gimenez-Palop, O., Gimenez-Perez, G., Mauricio, D., Gonzalez-Clemente, J. M., Potau, N.,
Berlanga, E., . . . Caixas, A. (2007). A lesser postprandial suppression of plasma
ghrelin in Prader-Willi syndrome is associated with low fasting and a blunted
postprandial PYY response. Clin Endocrinol (Oxf), 66(2), 198-204.
doi:10.1111/j.1365-2265.2006.02707.x
Goldstone, A. P. (2004). Prader-Willi syndrome: advances in genetics, pathophysiology and
treatment. Trends Endocrinol Metab, 15(1), 12-20.
Goldstone, A. P., Brynes, A. E., Thomas, E. L., Bell, J. D., Frost, G., Holland, A., . . . Bloom,
S. R. (2002). Resting metabolic rate, plasma leptin concentrations, leptin receptor
expression, and adipose tissue measured by whole-body magnetic resonance imaging
in women with Prader-Willi syndrome. Am J Clin Nutr, 75(3), 468-475.
Goldstone, A. P., Patterson, M., Kalingag, N., Ghatei, M. A., Brynes, A. E., Bloom, S. R., . . .
Korbonits, M. (2005). Fasting and postprandial hyperghrelinemia in Prader-Willi
syndrome is partially explained by hypoinsulinemia, and is not due to peptide YY3-36
deficiency or seen in hypothalamic obesity due to craniopharyngioma. J Clin
Endocrinol Metab, 90(5), 2681-2690. doi:10.1210/jc.2003-032209
Goldstone, A. P., Thomas, E. L., Brynes, A. E., Castroman, G., Edwards, R., Ghatei, M. A., .
. . Bell, J. D. (2004). Elevated fasting plasma ghrelin in prader-willi syndrome adults
is not solely explained by their reduced visceral adiposity and insulin resistance. J
Clin Endocrinol Metab, 89(4), 1718-1726. doi:10.1210/jc.2003-031118
Gómez-Ambrosi, J., Silva, C., Catalán, V., Rodríguez, A., Galofré, J. C., Escalada, J., . . .
Frühbeck, G. (2012). Clinical usefulness of a new equation for estimating body fat.
Diabetes Care, 35(2), 383-388. doi:10.2337/dc11-1334
Gosby, A. K., Conigrave, A. D., Raubenheimer, D., & Simpson, S. J. (2014). Protein
leverage and energy intake. Obes Rev, 15(3), 183-191. doi:10.1111/obr.12131
118
Granata, G. P., & Brandon, L. J. (2002). The thermic effect of food and obesity: discrepant
results and methodological variations. Nutr Rev, 60(8), 223-233.
doi:10.1301/002966402320289359
Greenhill, C. (2016). Liver: Asprosin - new hormone involved in hepatic glucose release. Nat
Rev Endocrinol, 12(6), 312. doi:10.1038/nrendo.2016.66
Griggs, R. C., Batshaw, M., Dunkle, M., Gopal-Srivastava, R., Kaye, E., Krischer, J., . . .
Merkel, P. A. (2009). Clinical research for rare disease: opportunities, challenges, and
solutions. Mol Genet Metab, 96(1), 20-26. doi:10.1016/j.ymgme.2008.10.003
Gumus Balikcioglu, P., Balikcioglu, M., Muehlbauer, M. J., Purnell, J. Q., Broadhurst, D.,
Freemark, M., & Haqq, A. M. (2015). Macronutrient Regulation of Ghrelin and
Peptide YY in Pediatric Obesity and Prader-Willi Syndrome. J Clin Endocrinol
Metab, 100(10), 3822-3831. doi:10.1210/jc.2015-2503
Gupta, R. D., Ramachandran, R., Venkatesan, P., Anoop, S., Joseph, M., & Thomas, N.
(2017). Indirect Calorimetry: From Bench to Bedside. Indian J Endocrinol Metab,
21(4), 594-599. doi:10.4103/ijem.IJEM_484_16
Halaas, J. L., Gajiwala, K. S., Maffei, M., Cohen, S. L., Chait, B. T., Rabinowitz, D., . . .
Friedman, J. M. (1995). Weight-reducing effects of the plasma protein encoded by the
obese gene. Science, 269(5223), 543-546.
Hall, K. D., Heymsfield, S. B., Kemnitz, J. W., Klein, S., Schoeller, D. A., & Speakman, J. R.
(2012). Energy balance and its components: implications for body weight regulation.
Am J Clin Nutr, 95(4), 989-994. doi:10.3945/ajcn.112.036350
Halton, T. L., & Hu, F. B. (2004). The effects of high protein diets on thermogenesis, satiety
and weight loss: a critical review. J Am Coll Nutr, 23(5), 373-385.
Hames, Kazanna C., Anthony, Steven J., Thornton, John C., Gallagher, Dympna, &
Goodpaster, Bret H. (2014). Body composition analysis by air displacement
plethysmography in normal weight to extremely obese adults. Obesity (Silver Spring),
22(4), 1078-1084. doi:10.1002/oby.20655
Haqq, A. M., Farooqi, I. S., O'Rahilly, S., Stadler, D. D., Rosenfeld, R. G., Pratt, K. L., . . .
Purnell, J. Q. (2003). Serum ghrelin levels are inversely correlated with body mass
index, age, and insulin concentrations in normal children and are markedly increased
in Prader-Willi syndrome. J Clin Endocrinol Metab, 88(1), 174-178.
doi:10.1210/jc.2002-021052
Haqq, A. M., Grambow, S. C., Muehlbauer, M., Newgard, C. B., Svetkey, L. P., Carrel, A.
L., . . . Freemark, M. (2008). Ghrelin concentrations in Prader-Willi syndrome (PWS)
infants and children: changes during development. Clin Endocrinol (Oxf), 69(6), 911-
920. doi:10.1111/j.1365-2265.2008.03385.x
Haqq, A. M., Muehlbauer, M. J., Newgard, C. B., Grambow, S., & Freemark, M. (2011). The
metabolic phenotype of Prader-Willi syndrome (PWS) in childhood: heightened
insulin sensitivity relative to body mass index. J Clin Endocrinol Metab, 96(1), E225-
232. doi:10.1210/jc.2010-1733
Haqq, A. M., Muehlbauer, M., Svetkey, L. P., Newgard, C. B., Purnell, J. Q., Grambow, S.
C., & Freemark, M. S. (2007). Altered distribution of adiponectin isoforms in children
with Prader-Willi syndrome (PWS): association with insulin sensitivity and
circulating satiety peptide hormones. Clin Endocrinol (Oxf), 67(6), 944-951.
doi:10.1111/j.1365-2265.2007.02991.x
Haqq, A. M., Stadler, D. D., Jackson, R. H., Rosenfeld, R. G., Purnell, J. Q., & LaFranchi, S.
H. (2003). Effects of growth hormone on pulmonary function, sleep quality, behavior,
cognition, growth velocity, body composition, and resting energy expenditure in
Prader-Willi syndrome. J Clin Endocrinol Metab, 88(5), 2206-2212.
doi:10.1210/jc.2002-021536
119
Haqq, A. M., Stadler, D. D., Rosenfeld, R. G., Pratt, K. L., Weigle, D. S., Frayo, R. S., . . .
Purnell, J. Q. (2003). Circulating ghrelin levels are suppressed by meals and
octreotide therapy in children with Prader-Willi syndrome. J Clin Endocrinol Metab,
88(8), 3573-3576. doi:10.1210/jc.2003-030205
Haqq, Andrea M. (2010). Syndromic Obesity. In Michael Freemark (Ed.), Pediatric Obesity:
Etiology, Pathogenesis, and Treatment (pp. 47-64). New York, NY: Springer New
York.
Harris, C., Buyken, A., von Berg, A., Berdel, D., Lehmann, I., Hoffmann, B., . . . Standl, M.
(2016). Prospective associations of meat consumption during childhood with
measures of body composition during adolescence: results from the GINIplus and
LISAplus birth cohorts. Nutr J, 15(1), 101. doi:10.1186/s12937-016-0222-5
Hartley, S. L., Maclean, W. E., Jr., Butler, M. G., Zarcone, J., & Thompson, T. (2005).
Maladaptive behaviors and risk factors among the genetic subtypes of Prader-Willi
syndrome. Am J Med Genet A, 136(2), 140-145. doi:10.1002/ajmg.a.30771
Havel, P. J. (2001). Peripheral signals conveying metabolic information to the brain: short-
term and long-term regulation of food intake and energy homeostasis. Exp Biol Med
(Maywood), 226(11), 963-977. doi:10.1177/153537020122601102
Heden, T. D., Liu, Y., Sims, L., Kearney, M. L., Whaley-Connell, A. T., Chockalingam, A., .
. . Kanaley, J. A. (2013). Liquid meal composition, postprandial satiety hormones, and
perceived appetite and satiety in obese women during acute caloric restriction. Eur J
Endocrinol, 168(4), 593-600. doi:10.1530/eje-12-0884
Henes, S. T., Cummings, D. M., Hickner, R. C., Houmard, J. A., Kolasa, K. M., Lazorick, S.,
& Collier, D. N. (2013). Comparison of predictive equations and measured resting
energy expenditure among obese youth attending a pediatric healthy weight clinic:
one size does not fit all. Nutr Clin Pract, 28(5), 617-624.
doi:10.1177/0884533613497237
Heymsfield, S. B., Gallagher, D., Kotler, D. P., Wang, Z., Allison, D. B., & Heshka, S.
(2002). Body-size dependence of resting energy expenditure can be attributed to
nonenergetic homogeneity of fat-free mass. Am J Physiol Endocrinol Metab, 282(1),
E132-138.
Hill, A. J., & Blundell, J. E. (1982). Nutrients and behaviour: research strategies for the
investigation of taste characteristics, food preferences, hunger sensations and eating
patterns in man. J Psychiatr Res, 17(2), 203-212. doi:10.1016/0022-3956(82)90023-1
Hill, J. O., Kaler, M., Spetalnick, B., Reed, G., & Butler, M. G. (1990). RESTING
METABOLIC RATE IN PRADER-WILLI SYNDROME. Dysmorphol Clin Genet,
4(1), 27-32.
Hill, J. O., Wyatt, H. R., & Peters, J. C. (2012). Energy balance and obesity. Circulation,
126(1), 126-132. doi:10.1161/circulationaha.111.087213
Hinton, E. C., Holland, A. J., Gellatly, M. S., Soni, S., & Owen, A. M. (2006). An
investigation into food preferences and the neural basis of food-related incentive
motivation in Prader-Willi syndrome. J Intellect Disabil Res, 50(Pt 9), 633-642.
doi:10.1111/j.1365-2788.2006.00812.x
Hipskind, P., Glass, C., Charlton, D., Nowak, D., & Dasarathy, S. (2011). Do handheld
calorimeters have a role in assessment of nutrition needs in hospitalized patients? A
systematic review of literature. Nutr Clin Pract, 26(4), 426-433.
doi:10.1177/0884533611411272
Hojberg, P. V., Vilsboll, T., Rabol, R., Knop, F. K., Bache, M., Krarup, T., . . . Madsbad, S.
(2009). Four weeks of near-normalisation of blood glucose improves the insulin
response to glucagon-like peptide-1 and glucose-dependent insulinotropic polypeptide
120
in patients with type 2 diabetes. Diabetologia, 52(2), 199-207. doi:10.1007/s00125-
008-1195-5
Holm, V. A., & Pipes, P. L. (1976). Food and children with Prader-Willi syndrome. Am J Dis
Child, 130(10), 1063-1067.
Horner, K. M., Byrne, N. M., & King, N. A. (2014). Reproducibility of subjective appetite
ratings and ad libitum test meal energy intake in overweight and obese males.
Appetite, 81, 116-122. doi:10.1016/j.appet.2014.06.025
Houde-Nadeau, M., de Jonge, L., & Garrel, D. R. (1993). Thermogenic response to food:
intra-individual variability and measurement reliability. J Am Coll Nutr, 12(5), 511-
516.
Hoybye, C. (2004). Endocrine and metabolic aspects of adult Prader-Willi syndrome with
special emphasis on the effect of growth hormone treatment. Growth Horm IGF Res,
14(1), 1-15.
Iacobini, C., Pugliese, G., Blasetti Fantauzzi, C., Federici, M., & Menini, S. (2019).
Metabolically healthy versus metabolically unhealthy obesity. Metabolism, 92, 51-60.
doi:10.1016/j.metabol.2018.11.009
Irizarry, K. A., Mager, D. R., Triador, L., Muehlbauer, M. J., Haqq, A. M., & Freemark, M.
(2019). Hormonal and metabolic effects of carbohydrate restriction in children with
Prader-Willi syndrome. Clin Endocrinol (Oxf), 90(4), 553-561.
doi:10.1111/cen.13933
Jebb, Susan A. (1995). Metabolic response to slimming. In Richard Cottrell (Ed.), Weight
Control: The current perspective (pp. 48-67). Dordrecht: Springer Netherlands.
Jen, V., Karagounis, L. G., Jaddoe, V. W. V., Franco, O. H., & Voortman, T. (2018). Dietary
protein intake in school-age children and detailed measures of body composition: the
Generation R Study. Int J Obes (Lond), 42(10), 1715-1723. doi:10.1038/s41366-018-
0098-x
Jequier, E. (1986). Human whole body direct calorimetry. IEEE Eng Med Biol Mag, 5(2), 12-
14. doi:10.1109/memb.1986.5006277
Johnston, C. S., Day, C. S., & Swan, P. D. (2002). Postprandial thermogenesis is increased
100% on a high-protein, low-fat diet versus a high-carbohydrate, low-fat diet in
healthy, young women. J Am Coll Nutr, 21(1), 55-61.
Kampe, J., Tschop, M., Horvath, T. L., & Widmer, P. (2000). Neuroendocrine Integration of
Body Weight Regulation. In K. R. Feingold, B. Anawalt, A. Boyce, G. Chrousos, K.
Dungan, A. Grossman, J. M. Hershman, G. Kaltsas, C. Koch, P. Kopp, M. Korbonits,
R. McLachlan, J. E. Morley, M. New, L. Perreault, J. Purnell, R. Rebar, F. Singer, D.
L. Trence, A. Vinik, & D. P. Wilson (Eds.), Endotext. South Dartmouth (MA):
MDText.com, Inc.
Kassis, A., Godin, J. P., Moille, S. E., Nielsen-Moennoz, C., Groulx, K., Oguey-Araymon, S.,
. . . Mace, K. (2019). Effects of protein quantity and type on diet induced
thermogenesis in overweight adults: A randomized controlled trial. Clin Nutr, 38(4),
1570-1580. doi:10.1016/j.clnu.2018.08.004
Katzeff, H. L., & Danforth, E., Jr. (1989). Decreased thermic effect of a mixed meal during
overnutrition in human obesity. Am J Clin Nutr, 50(5), 915-921.
doi:10.1093/ajcn/50.5.915
Kido, Y., Sakazume, S., Abe, Y., Oto, Y., Itabashi, H., Shiraishi, M., . . . Nagai, T. (2013).
Testosterone replacement therapy to improve secondary sexual characteristics and
body composition without adverse behavioral problems in adult male patients with
Prader-Willi syndrome: an observational study. Am J Med Genet A, 161a(9), 2167-
2173. doi:10.1002/ajmg.a.36048
121
Kim, Shin-Hye, & Park, Mi-Jung. (2017). Effects of growth hormone on glucose metabolism
and insulin resistance in human. Annals of pediatric endocrinology & metabolism,
22(3), 145-152. doi:10.6065/apem.2017.22.3.145
Koepp, G. A., Moore, G. K., & Levine, J. A. (2016). Chair-based fidgeting and energy
expenditure. BMJ Open Sport Exerc Med, 2(1), e000152. doi:10.1136/bmjsem-2016-
000152
Kojima, M., Hosoda, H., Date, Y., Nakazato, M., Matsuo, H., & Kangawa, K. (1999).
Ghrelin is a growth-hormone-releasing acylated peptide from stomach. Nature,
402(6762), 656-660. doi:10.1038/45230
Komai, N., Motokubota, N., Suzuki, M., Hayashi, I., Moritani, T., & Nagai, N. (2016).
Thorough Mastication Prior to Swallowing Increases Postprandial Satiety and the
Thermic Effect of a Meal in Young Women. J Nutr Sci Vitaminol (Tokyo), 62(5),
288-294. doi:10.3177/jnsv.62.288
Kong, M. F., Chapman, I., Goble, E., Wishart, J., Wittert, G., Morris, H., & Horowitz, M.
(1999). Effects of oral fructose and glucose on plasma GLP-1 and appetite in normal
subjects. Peptides, 20(5), 545-551.
Krochik, A. G., Ozuna, B., Torrado, M., Chertkoff, L., & Mazza, C. (2006). Characterization
of alterations in carbohydrate metabolism in children with Prader-Willi syndrome. J
Pediatr Endocrinol Metab, 19(7), 911-918.
Kuppens, R. J., Diene, G., Bakker, N. E., Molinas, C., Faye, S., Nicolino, M., . . . Hokken-
Koelega, A. C. (2015). Elevated ratio of acylated to unacylated ghrelin in children and
young adults with Prader-Willi syndrome. Endocrine, 50(3), 633-642.
doi:10.1007/s12020-015-0614-x
Labayen, I., Diez, N., Parra, D., Gonzalez, A., & Martinez, J. A. (2004). Basal and
postprandial substrate oxidation rates in obese women receiving two test meals with
different protein content. Clin Nutr, 23(4), 571-578. doi:10.1016/j.clnu.2003.10.004
Laville, M., Cornu, C., Normand, S., Mithieux, G., Beylot, M., & Riou, J. P. (1993).
Decreased glucose-induced thermogenesis at the onset of obesity. Am J Clin Nutr,
57(6), 851-856. doi:10.1093/ajcn/57.6.851
Law, M., Lee, Y. T., Vien, S., Luhovyy, B. L., & Anderson, G. H. (2017). The effect of dairy
products consumed with high glycemic carbohydrate on subjective appetite, food
intake, and postprandial glycemia in older adults. Appl Physiol Nutr Metab, 42(11),
1210-1216. doi:10.1139/apnm-2017-0210
Le Carvennec, M., Fagour, C., Adenis-Lamarre, E., Perlemoine, C., Gin, H., & Rigalleau, V.
(2007). Body composition of obese subjects by air displacement plethysmography:
The influence of hydration. Obesity (Silver Spring), 15(1), 78-84.
doi:10.1038/oby.2007.533
Lee, J. J., Brett, N. R., Chang, J. T., de Zepetnek, J. O. T., & Bellissimo, N. (2019). Effects of
White Potatoes Consumed With Eggs on Satiety, Food Intake, and Glycemic
Response in Children and Adolescents. J Am Coll Nutr, 1-8.
doi:10.1080/07315724.2019.1620659
Lee, J. J., Brett, N. R., Wong, V. C. H., Totosy de Zepetnek, J. O., Fiocco, A. J., &
Bellissimo, N. (2019). Effect of potatoes and other carbohydrate-containing foods on
cognitive performance, glycemic response, and satiety in children. Appl Physiol Nutr
Metab, 44(9), 1012-1019. doi:10.1139/apnm-2018-0792
Leibel, R. L., Rosenbaum, M., & Hirsch, J. (1995). Changes in energy expenditure resulting
from altered body weight. N Engl J Med, 332(10), 621-628.
doi:10.1056/nejm199503093321001
122
Leidy, H. J., Mattes, R. D., & Campbell, W. W. (2007). Effects of acute and chronic protein
intake on metabolism, appetite, and ghrelin during weight loss. Obesity (Silver
Spring), 15(5), 1215-1225. doi:10.1038/oby.2007.143
Levin, F., Edholm, T., Schmidt, P. T., Gryback, P., Jacobsson, H., Degerblad, M., . . .
Naslund, E. (2006). Ghrelin stimulates gastric emptying and hunger in normal-weight
humans. J Clin Endocrinol Metab, 91(9), 3296-3302. doi:10.1210/jc.2005-2638
Levine, J. A. (2005). Measurement of energy expenditure. Public Health Nutr, 8(7a), 1123-
1132.
Li, X., Liao, M., Shen, R., Zhang, L., Hu, H., Wu, J., . . . Zheng, H. (2018). Plasma Asprosin
Levels Are Associated with Glucose Metabolism, Lipid, and Sex Hormone Profiles in
Females with Metabolic-Related Diseases. Mediators Inflamm, 2018, 7375294.
doi:10.1155/2018/7375294
Liu, J., Prudom, C. E., Nass, R., Pezzoli, S. S., Oliveri, M. C., Johnson, M. L., . . . Thorner,
M. O. (2008). Novel ghrelin assays provide evidence for independent regulation of
ghrelin acylation and secretion in healthy young men. J Clin Endocrinol Metab,
93(5), 1980-1987. doi:10.1210/jc.2007-2235
Lloret-Linares, C., Faucher, P., Coupaye, M., Alili, R., Green, A., Basdevant, A., . . . Poitou,
C. (2013). Comparison of body composition, basal metabolic rate and metabolic
outcomes of adults with Prader Willi syndrome or lesional hypothalamic disease, with
primary obesity. Int J Obes (Lond), 37(9), 1198-1203. doi:10.1038/ijo.2012.228
Long, W., Xie, X., Du, C., Zhao, Y., Zhang, C., Zhan, D., . . . Luo, X. (2019). Decreased
Circulating Levels of Asprosin in Obese Children. Horm Res Paediatr, 91(4), 271-
277. doi:10.1159/000500523
Maffeis, C., Schutz, Y., Grezzani, A., Provera, S., Piacentini, G., & Tato, L. (2001). Meal-
induced thermogenesis and obesity: is a fat meal a risk factor for fat gain in children?
J Clin Endocrinol Metab, 86(1), 214-219. doi:10.1210/jcem.86.1.7132
Maffeis, C., Schutz, Y., Zoccante, L., Micciolo, R., & Pinelli, L. (1993). MEAL INDUCED
THERMOGENESIS IN LEAN AND OBESE PREPUBERTAL CHILDREN.
American Journal of Clinical Nutrition, 57(4), 481-485.
Marmonier, C., Chapelot, D., & Louis-Sylvestre, J. (2000). Effects of macronutrient content
and energy density of snacks consumed in a satiety state on the onset of the next meal.
Appetite, 34(2), 161-168. doi:10.1006/appe.1999.0302
Marrades, M. P., Martinez, J. A., & Moreno-Aliaga, M. J. (2007). Differences in short-term
metabolic responses to a lipid load in lean (resistant) vs obese (susceptible) young
male subjects with habitual high-fat consumption. Eur J Clin Nutr, 61(2), 166-174.
doi:10.1038/sj.ejcn.1602500
Martinez Michel, L., Haqq, A. M., & Wismer, W. V. (2016). A review of chemosensory
perceptions, food preferences and food-related behaviours in subjects with Prader-
Willi Syndrome. Appetite, 99, 17-24. doi:10.1016/j.appet.2015.12.021
McClave, S. A., Lowen, C. C., Kleber, M. J., McConnell, J. W., Jung, L. Y., & Goldsmith, L.
J. (2003). Clinical use of the respiratory quotient obtained from indirect calorimetry.
JPEN J Parenter Enteral Nutr, 27(1), 21-26. doi:10.1177/014860710302700121
McLaughlin, J. E., King, G. A., Howley, E. T., Bassett, D. R., Jr., & Ainsworth, B. E. (2001).
Validation of the COSMED K4 b2 portable metabolic system. Int J Sports Med,
22(4), 280-284. doi:10.1055/s-2001-13816
Melanson, K. J., Saltzman, E., Vinken, A. G., Russell, R., & Roberts, S. B. (1998). The
effects of age on postprandial thermogenesis at four graded energetic challenges:
findings in young and older women. J Gerontol A Biol Sci Med Sci, 53(6), B409-414.
doi:10.1093/gerona/53a.6.b409
123
Mihalache, L., Gherasim, A., Nita, O., Ungureanu, M. C., Padureanu, S. S., Gavril, R. S., &
Arhire, L. I. (2016). Effects of ghrelin in energy balance and body weight
homeostasis. Hormones (Athens), 15(2), 186-196. doi:10.14310/horm.2002.1672
Mikkelsen, P. B., Toubro, S., & Astrup, A. (2000). Effect of fat-reduced diets on 24-h energy
expenditure: comparisons between animal protein, vegetable protein, and
carbohydrate. Am J Clin Nutr, 72(5), 1135-1141. doi:10.1093/ajcn/72.5.1135
Miller, J. L., Lynn, C. H., Shuster, J., & Driscoll, D. J. (2013). A reduced-energy intake, well-
balanced diet improves weight control in children with Prader-Willi syndrome. J Hum
Nutr Diet, 26(1), 2-9. doi:10.1111/j.1365-277X.2012.01275.x
Miller, J. L., Strong, T. V., & Heinemann, J. (2015). Medication Trials for Hyperphagia and
Food-Related Behaviors in Prader-Willi Syndrome. Diseases, 3(2), 78-85.
doi:10.3390/diseases3020078
Mitchell, W. K., Wilkinson, D. J., Phillips, B. E., Lund, J. N., Smith, K., & Atherton, P. J.
(2016). Human Skeletal Muscle Protein Metabolism Responses to Amino Acid
Nutrition. Adv Nutr, 7(4), 828s-838s. doi:10.3945/an.115.011650
Mohlig, M., Spranger, J., Otto, B., Ristow, M., Tschop, M., & Pfeiffer, A. F. (2002).
Euglycemic hyperinsulinemia, but not lipid infusion, decreases circulating ghrelin
levels in humans. J Endocrinol Invest, 25(11), Rc36-38. doi:10.1007/bf03344062
Mokdad, A. H., Ford, E. S., Bowman, B. A., Dietz, W. H., Vinicor, F., Bales, V. S., &
Marks, J. S. (2003). Prevalence of obesity, diabetes, and obesity-related health risk
factors, 2001. JAMA, 289(1), 76-79. doi:10.1001/jama.289.1.76
Moller, N., Jorgensen, J. O., Moller, J., Orskov, L., Ovesen, P., Schmitz, O., . . . Orskov, H.
(1995). Metabolic effects of growth hormone in humans. Metabolism, 44(10 Suppl 4),
33-36.
Monteleone, P., Bencivenga, R., Longobardi, N., Serritella, C., & Maj, M. (2003).
Differential responses of circulating ghrelin to high-fat or high-carbohydrate meal in
healthy women. J Clin Endocrinol Metab, 88(11), 5510-5514. doi:10.1210/jc.2003-
030797
Morales, J. S., Valenzuela, P. L., Pareja-Galeano, H., Rincon-Castanedo, C., Rubin, D. A., &
Lucia, A. (2019). Physical exercise and Prader-Willi syndrome: A systematic review.
Clin Endocrinol (Oxf), 90(5), 649-661. doi:10.1111/cen.13953
Morton, G. J., Meek, T. H., & Schwartz, M. W. (2014). Neurobiology of food intake in health
and disease. Nat Rev Neurosci, 15(6), 367-378. doi:10.1038/nrn3745
Nadeau, K. J., Maahs, D. M., Daniels, S. R., & Eckel, R. H. (2011). Childhood obesity and
cardiovascular disease: links and prevention strategies. Nat Rev Cardiol, 8(9), 513-
525. doi:10.1038/nrcardio.2011.86
Nelson, K. M., Weinsier, R. L., James, L. D., Darnell, B., Hunter, G., & Long, C. L. (1992).
Effect of weight reduction on resting energy expenditure, substrate utilization, and the
thermic effect of food in moderately obese women. Am J Clin Nutr, 55(5), 924-933.
doi:10.1093/ajcn/55.5.924
Nguo, K., Bonham, M. P., Truby, H., Barber, E., Brown, J., & Huggins, C. E. (2019). Effect
of Macronutrient Composition on Appetite Hormone Responses in Adolescents with
Obesity. Nutrients, 11(2). doi:10.3390/nu11020340
Nguo, K., Huggins, C. E., Truby, H., Brown, J., & Bonham, M. P. (2018). Effect of
macronutrient composition on meal-induced thermogenesis in adolescents with
obesity. Eur J Nutr. doi:10.1007/s00394-018-1783-1
Nguyen, B., McGregor, K. A., O'Connor, J., Shrewsbury, V. A., Lee, A., Steinbeck, K. S., . .
. Baur, L. A. (2012). Recruitment challenges and recommendations for adolescent
obesity trials. J Paediatr Child Health, 48(1), 38-43. doi:10.1111/j.1440-
1754.2011.02183.x
124
Nicholls, R. D., Knoll, J. H., Butler, M. G., Karam, S., & Lalande, M. (1989). Genetic
imprinting suggested by maternal heterodisomy in nondeletion Prader-Willi
syndrome. Nature, 342(6247), 281-285. doi:10.1038/342281a0
O'Neil, C. E., Byrd-Bredbenner, C., Hayes, D., Jana, L., Klinger, S. E., & Stephenson-Martin,
S. (2014). The role of breakfast in health: definition and criteria for a quality
breakfast. J Acad Nutr Diet, 114(12 Suppl), S8-s26. doi:10.1016/j.jand.2014.08.022
Orsso, C. E., Mackenzie, M., Alberga, A. S., Sharma, A. M., Richer, L., Rubin, D. A., . . .
Haqq, A. M. (2017). The use of magnetic resonance imaging to characterize abnormal
body composition phenotypes in youth with Prader-Willi syndrome. Metabolism, 69,
67-75. doi:10.1016/j.metabol.2017.01.020
Paddon-Jones, D., Westman, E., Mattes, R. D., Wolfe, R. R., Astrup, A., & Westerterp-
Plantenga, M. (2008). Protein, weight management, and satiety. Am J Clin Nutr,
87(5), 1558s-1561s. doi:10.1093/ajcn/87.5.1558S
Paik, K. H., Choe, Y. H., Park, W. H., Oh, Y. J., Kim, A. H., Chu, S. H., . . . Jin, D. K.
(2006). Suppression of acylated ghrelin during oral glucose tolerance test is correlated
with whole-body insulin sensitivity in children with Prader-Willi syndrome. J Clin
Endocrinol Metab, 91(5), 1876-1881. doi:10.1210/jc.2005-2168
Paik, K. H., Lee, M. K., Jin, D. K., Kang, H. W., Lee, K. H., Kim, A. H., . . . Choe, Y. H.
(2007). Marked suppression of ghrelin concentration by insulin in Prader-willi
syndrome. J Korean Med Sci, 22(2), 177-182. doi:10.3346/jkms.2007.22.2.177
Panahi, S., El Khoury, D., Luhovyy, B. L., Goff, H. D., & Anderson, G. H. (2013). Caloric
beverages consumed freely at meal-time add calories to an ad libitum meal. Appetite,
65, 75-82. doi:10.1016/j.appet.2013.01.023
Park, W. H., Oh, Y. J., Kim, G. Y., Kim, S. E., Paik, K. H., Han, S. J., . . . Jin, D. K. (2007).
Obestatin is not elevated or correlated with insulin in children with Prader-Willi
syndrome. J Clin Endocrinol Metab, 92(1), 229-234. doi:10.1210/jc.2006-0754
Pasiakos, S. M. (2015). Metabolic advantages of higher protein diets and benefits of dairy
foods on weight management, glycemic regulation, and bone. J Food Sci, 80 Suppl 1,
A2-7. doi:10.1111/1750-3841.12804
Paz-Filho, G., Mastronardi, C., Wong, M. L., & Licinio, J. (2012). Leptin therapy, insulin
sensitivity, and glucose homeostasis. Indian J Endocrinol Metab, 16(Suppl 3), S549-
555. doi:10.4103/2230-8210.105571
Pelleymounter, M. A., Cullen, M. J., Baker, M. B., Hecht, R., Winters, D., Boone, T., &
Collins, F. (1995). Effects of the obese gene product on body weight regulation in
ob/ob mice. Science, 269(5223), 540-543.
Pesta, D. H., & Samuel, V. T. (2014). A high-protein diet for reducing body fat: mechanisms
and possible caveats. Nutr Metab (Lond), 11(1), 53. doi:10.1186/1743-7075-11-53
Piers, L. S., Soares, M. J., Makan, T., & Shetty, P. S. (1992). Thermic effect of a meal. 1.
Methodology and variation in normal young adults. Br J Nutr, 67(2), 165-175.
Pinheiro Volp, A. C., Esteves de Oliveira, F. C., Duarte Moreira Alves, R., Esteves, E. A., &
Bressan, J. (2011). Energy expenditure: components and evaluation methods. Nutr
Hosp, 26(3), 430-440. doi:10.1590/s0212-16112011000300002
Poirier, K. L., Totosy de Zepetnek, J. O., Bennett, L. J., Brett, N. R., Boateng, T., Schwartz,
A., . . . Bellissimo, N. (2019). Effect of Commercially Available Sugar-Sweetened
Beverages on Subjective Appetite and Short-Term Food Intake in Boys. Nutrients,
11(2). doi:10.3390/nu11020270
Prado, C. M., & Heymsfield, S. B. (2014). Lean tissue imaging: a new era for nutritional
assessment and intervention. JPEN J Parenter Enteral Nutr, 38(8), 940-953.
doi:10.1177/0148607114550189
125
Pravdivyi, I., Ballanyi, K., Colmers, W. F., & Wevrick, R. (2015). Progressive postnatal
decline in leptin sensitivity of arcuate hypothalamic neurons in the Magel2-null
mouse model of Prader-Willi syndrome. Hum Mol Genet, 24(15), 4276-4283.
doi:10.1093/hmg/ddv159
Psota, T., & Chen, K. Y. (2013). Measuring energy expenditure in clinical populations:
rewards and challenges. Eur J Clin Nutr, 67(5), 436-442. doi:10.1038/ejcn.2013.38
Purtell, L., Sze, L., Loughnan, G., Smith, E., Herzog, H., Sainsbury, A., . . . Viardot, A.
(2011). In adults with Prader-Willi syndrome, elevated ghrelin levels are more
consistent with hyperphagia than high PYY and GLP-1 levels. Neuropeptides, 45(4),
301-307. doi:10.1016/j.npep.2011.06.001
Purtell, L., Viardot, A., Sze, L., Loughnan, G., Steinbeck, K., Sainsbury, A., . . . Campbell, L.
V. (2015). Postprandial metabolism in adults with Prader-Willi syndrome. Obesity
(Silver Spring), 23(6), 1159-1165. doi:10.1002/oby.21041
Quatela, Angelica, Callister, Robin, Patterson, Amanda, & MacDonald-Wicks, Lesley.
(2016). The Energy Content and Composition of Meals Consumed after an Overnight
Fast and Their Effects on Diet Induced Thermogenesis: A Systematic Review, Meta-
Analyses and Meta-Regressions. Nutrients, 8(11), 670. doi:10.3390/nu8110670
Rao, D. P., Kropac, E., Do, M. T., Roberts, K. C., & Jayaraman, G. C. (2016). Childhood
overweight and obesity trends in Canada. Health Promot Chronic Dis Prev Can,
36(9), 194-198.
Reed, G. W., & Hill, J. O. (1996). Measuring the thermic effect of food. Am J Clin Nutr,
63(2), 164-169. doi:10.1093/ajcn/63.2.164
Richer, LP, DeLorey, DS, Sharma, AM, Kreier, F, Freemark, M, Mackenzie, ML, & Haqq,
A. (2011). Autonomic vervous system (ANS) dysfunction in PWS and childhood
obesity: preliminary findings. Paper presented at the Proceedings of the 31st Prader-
Willi Syndrome Association (USA) Annual National Conference.
Rigamonti, A. E., Bini, S., Piscitelli, F., Lauritano, A., Di Marzo, V., Vanetti, C., . . .
Sartorio, A. (2017). Hedonic eating in Prader-Willi syndrome is associated with
blunted PYY secretion. Food Nutr Res, 61(1), 1297553.
doi:10.1080/16546628.2017.1297553
Rising, R., Whyte, K., Albu, J., & Pi-Sunyer, X. (2015). Evaluation of a new whole room
indirect calorimeter specific for measurement of resting metabolic rate. Nutr Metab
(Lond), 12, 46. doi:10.1186/s12986-015-0043-0
Roh, Eun, Song, Do Kyeong, & Kim, Min-Seon. (2016). Emerging role of the brain in the
homeostatic regulation of energy and glucose metabolism. Experimental &Amp;
Molecular Medicine, 48, e216. doi:10.1038/emm.2016.4
Romere, C., Duerrschmid, C., Bournat, J., Constable, P., Jain, M., Xia, F., . . . Chopra, A. R.
(2016). Asprosin, a Fasting-Induced Glucogenic Protein Hormone. Cell, 165(3), 566-
579. doi:10.1016/j.cell.2016.02.063
Rubin, D. A., Clark, S. J., Haqq, A. M., Castner, D. M., Ng, J., & Judelson, D. A. (2017).
Hormonal and Metabolic Responses to a Single Bout of Resistance Exercise in
Prader-Willi Syndrome. Horm Res Paediatr, 87(3), 153-161. doi:10.1159/000454805
Ruddick-Collins, L. C., King, N. A., Byrne, N. M., & Wood, R. E. (2013). Methodological
considerations for meal-induced thermogenesis: measurement duration and
reproducibility. Br J Nutr, 110(11), 1978-1986. doi:10.1017/s0007114513001451
Saad, M. F., Bernaba, B., Hwu, C. M., Jinagouda, S., Fahmi, S., Kogosov, E., & Boyadjian,
R. (2002). Insulin regulates plasma ghrelin concentration. J Clin Endocrinol Metab,
87(8), 3997-4000. doi:10.1210/jcem.87.8.8879
126
Samra, R. A., & Anderson, G. H. (2007). Insoluble cereal fiber reduces appetite and short-
term food intake and glycemic response to food consumed 75 min later by healthy
men. Am J Clin Nutr, 86(4), 972-979. doi:10.1093/ajcn/86.4.972
Schoeller, D. A., Levitsky, L. L., Bandini, L. G., Dietz, W. W., & Walczak, A. (1988).
Energy expenditure and body composition in Prader-Willi syndrome. Metabolism,
37(2), 115-120.
Schrauwen, P., van Marken Lichtenbelt, W. D., Saris, W. H., & Westerterp, K. R. (1997).
Changes in fat oxidation in response to a high-fat diet. Am J Clin Nutr, 66(2), 276-
282. doi:10.1093/ajcn/66.2.276
Schutz, Y., Bessard, T., & Jequier, E. (1984). Diet-induced thermogenesis measured over a
whole day in obese and nonobese women. American Journal of Clinical Nutrition,
40(3), 542-552.
Schutz, Y., Golay, A., Felber, J. P., & Jequier, E. (1984). Decreased glucose-induced
thermogenesis after weight loss in obese subjects: a predisposing factor for relapse of
obesity? Am J Clin Nutr, 39(3), 380-387. doi:10.1093/ajcn/39.3.380
Scott, C. B. (2005). Contribution of anaerobic energy expenditure to whole body
thermogenesis. Nutr Metab (Lond), 2(1), 14. doi:10.1186/1743-7075-2-14
Scott, C. B., & Devore, R. (2005). Diet-induced thermogenesis: variations among three
isocaloric meal-replacement shakes. Nutrition, 21(7-8), 874-877.
doi:10.1016/j.nut.2004.12.010
Scott, Christopher B., Fernandes, Jill, & Lehman, Maya. (2007). Onset of the Thermic Effect
of Feeding (TEF): a randomized cross-over trial. J Int Soc Sports Nutr, 4(1), 24.
doi:10.1186/1550-2783-4-24
Segal, K. R., Albu, J., Chun, A., Edano, A., Legaspi, B., & Pi-Sunyer, F. X. (1992).
Independent effects of obesity and insulin resistance on postprandial thermogenesis in
men. J Clin Invest, 89(3), 824-833. doi:10.1172/jci115661
Segal, K. R., Edano, A., & Tomas, M. B. (1990). Thermic effect of a meal over 3 and 6 hours
in lean and obese men. Metabolism, 39(9), 985-992.
Shields, B. J., Palermo, T. M., Powers, J. D., Grewe, S. D., & Smith, G. A. (2003). Predictors
of a child's ability to use a visual analogue scale. Child Care Health Dev, 29(4), 281-
290.
Simpson, S. J., & Raubenheimer, D. (2005). Obesity: the protein leverage hypothesis. Obes
Rev, 6(2), 133-142. doi:10.1111/j.1467-789X.2005.00178.x
Skryabin, B. V., Gubar, L. V., Seeger, B., Pfeiffer, J., Handel, S., Robeck, T., . . . Brosius, J.
(2007). Deletion of the MBII-85 snoRNA gene cluster in mice results in postnatal
growth retardation. PLoS Genet, 3(12), e235. doi:10.1371/journal.pgen.0030235
Smith, S. R., de Jonge, L., Zachwieja, J. J., Roy, H., Nguyen, T., Rood, J. C., . . . Bray, G. A.
(2000). Fat and carbohydrate balances during adaptation to a high-fat. Am J Clin Nutr,
71(2), 450-457.
Sohn, Y. B., Kwak, M. J., Kim, S. J., Park, S. W., Kim, C. H., Kim, M. Y., . . . Jin, D. K.
(2010). Correlation of adiponectin receptor expression with cytokines and insulin
sensitivity in growth hormone (GH)-treated children with Prader-Willi syndrome and
in non-GH-treated obese children. J Clin Endocrinol Metab, 95(3), 1371-1377.
doi:10.1210/jc.2009-1489
Steinert, R. E., Feinle-Bisset, C., Asarian, L., Horowitz, M., Beglinger, C., & Geary, N.
(2017). Ghrelin, CCK, GLP-1, and PYY(3-36): Secretory Controls and Physiological
Roles in Eating and Glycemia in Health, Obesity, and After RYGB. Physiol Rev,
97(1), 411-463. doi:10.1152/physrev.00031.2014

127
Steiniger, J., Karst, H., Noack, R., & Steglich, H. D. (1987). Diet-induced thermogenesis in
man: thermic effects of single protein and carbohydrate test meals in lean and obese
subjects. Ann Nutr Metab, 31(2), 117-125. doi:10.1159/000177258
Stewenius, J., Adnerhill, I., Anderson, H., Ekelund, G. R., Floren, C. H., Fork, F. T., . . .
Ogren, M. (1995). Incidence of colorectal cancer and all cause mortality in non-
selected patients with ulcerative colitis and indeterminate colitis in Malmo, Sweden.
Int J Colorectal Dis, 10(2), 117-122.
Strominger, J. L., & Brobeck, J. R. (1953). A mechanism of regulation of food intake. Yale J
Biol Med, 25(5), 383-390.
Stubbs, R. J., Hughes, D. A., Johnstone, A. M., Rowley, E., Reid, C., Elia, M., . . . Blundell,
J. E. (2000). The use of visual analogue scales to assess motivation to eat in human
subjects: a review of their reliability and validity with an evaluation of new hand-held
computerized systems for temporal tracking of appetite ratings. Br J Nutr, 84(4), 405-
415.
Talebizadeh, Z., & Butler, M. G. (2005). Insulin resistance and obesity-related factors in
Prader-Willi syndrome: comparison with obese subjects. Clin Genet, 67(3), 230-239.
doi:10.1111/j.1399-0004.2004.00392.x
Tannous dit El Khoury, D., Obeid, O., Azar, S. T., & Hwalla, N. (2006). Variations in
postprandial ghrelin status following ingestion of high-carbohydrate, high-fat, and
high-protein meals in males. Ann Nutr Metab, 50(3), 260-269.
doi:10.1159/000091684
Tauber, M., Conte Auriol, F., Moulin, P., Molinas, C., Delagnes, V., & Salles, J. P. (2004).
Hyperghrelinemia is a common feature of Prader-Willi syndrome and pituitary stalk
interruption: a pathophysiological hypothesis. Horm Res, 62(1), 49-54.
doi:10.1159/000078862
Tentolouris, N., Alexiadou, K., Kokkinos, A., Koukou, E., Perrea, D., Kyriaki, D., &
Katsilambros, N. (2011). Meal-induced thermogenesis and macronutrient oxidation in
lean and obese women after consumption of carbohydrate-rich and fat-rich meals.
Nutrition, 27(3), 310-315. doi:10.1016/j.nut.2010.02.007
Tentolouris, N., Pavlatos, S., Kokkinos, A., Perrea, D., Pagoni, S., & Katsilambros, N.
(2008). Diet-induced thermogenesis and substrate oxidation are not different between
lean and obese women after two different isocaloric meals, one rich in protein and one
rich in fat. Metabolism, 57(3), 313-320. doi:10.1016/j.metabol.2007.10.004
Toshinai, K., Mondal, M. S., Shimbara, T., Yamaguchi, H., Date, Y., Kangawa, K., &
Nakazato, M. (2007). Ghrelin stimulates growth hormone secretion and food intake in
aged rats. Mech Ageing Dev, 128(2), 182-186. doi:10.1016/j.mad.2006.10.001
van der Klaauw, A. A., Keogh, J. M., Henning, E., Trowse, V. M., Dhillo, W. S., Ghatei, M.
A., & Farooqi, I. S. (2013). High protein intake stimulates postprandial GLP1 and
PYY release. Obesity (Silver Spring), 21(8), 1602-1607. doi:10.1002/oby.20154
van Mil, E. A., Westerterp, K. R., Gerver, W. J., Curfs, L. M., Schrander-Stumpel, C. T.,
Kester, A. D., & Saris, W. H. (2000). Energy expenditure at rest and during sleep in
children with Prader-Willi syndrome is explained by body composition. Am J Clin
Nutr, 71(3), 752-756.
van Mil, E. G., Westerterp, K. R., Gerver, W. J., Van Marken Lichtenbelt, W. D., Kester, A.
D., & Saris, W. H. (2001). Body composition in Prader-Willi syndrome compared
with nonsyndromal obesity: Relationship to physical activity and growth hormone
function. J Pediatr, 139(5), 708-714. doi:10.1067/mpd.2001.118399
van Mil, E., Westerterp, K. R., Kester, A. D. M., Curfs, L. M. G., Gerver, W. J. M.,
Schrander-Stumpel, Ctrm, & Saris, W. H. M. (2000). Activity related energy
128
expenditure in children and adolescents with Prader-Willi syndrome. International
Journal of Obesity, 24(4), 429-434. doi:10.1038/sj.ijo.0801175
Vasilaras, T. H., Raben, A., & Astrup, A. (2001). Twenty-four hour energy expenditure and
substrate oxidation before and after 6 months' ad libitum intake of a diet rich in simple
or complex carbohydrates or a habitual diet. Int J Obes Relat Metab Disord, 25(7),
954-965. doi:10.1038/sj.ijo.0801630
Ventham, J. C., & Reilly, J. J. (1999). Reproducibility of resting metabolic rate measurement
in children. Br J Nutr, 81(6), 435-437.
Verboeket-van de Venne, W. P., Westerterp, K. R., Hermans-Limpens, T. J., de Graaf, C.,
van het Hof, K. H., & Weststrate, J. A. (1996). Long-term effects of consumption of
full-fat or reduced-fat products in healthy non-obese volunteers: assessment of energy
expenditure and substrate oxidation. Metabolism, 45(8), 1004-1010.
doi:10.1016/s0026-0495(96)90271-1
Vien, S., Luhovyy, B. L., Patel, B. P., Panahi, S., El Khoury, D., Mollard, R. C., . . .
Anderson, G. H. (2017). Pre- and within-meal effects of fluid dairy products on
appetite, food intake, glycemia, and regulatory hormones in children. Appl Physiol
Nutr Metab, 42(3), 302-310. doi:10.1139/apnm-2016-0251
Wang, C. Y., Lin, T. A., Liu, K. H., Liao, C. H., Liu, Y. Y., Wu, V. C., . . . Yeh, T. S. (2018).
Serum asprosin levels and bariatric surgery outcomes in obese adults. Int J Obes
(Lond). doi:10.1038/s41366-018-0248-1
Wang, Z., Deurenberg, P., Wang, W., Pietrobelli, A., Baumgartner, R. N., & Heymsfield, S.
B. (1999). Hydration of fat-free body mass: review and critique of a classic body-
composition constant. Am J Clin Nutr, 69(5), 833-841.
Wang, Z., Heshka, S., Pietrobelli, A., Chen, Z., Silva, A. M., Sardinha, L. B., . . . Heymsfield,
S. B. (2007). A new total body potassium method to estimate total body skeletal
muscle mass in children. J Nutr, 137(8), 1988-1991.
Welle, S. L., & Campbell, R. G. (1983). Normal thermic effect of glucose in obese women.
Am J Clin Nutr, 37(1), 87-92. doi:10.1093/ajcn/37.1.87
Weselake, S. V., Foulds, J. L., Couch, R., Witmans, M. B., Rubin, D., & Haqq, A. M. (2014).
Prader-Willi syndrome, excessive daytime sleepiness, and narcoleptic symptoms: a
case report. J Med Case Rep, 8, 127. doi:10.1186/1752-1947-8-127
Westerterp, K. R. (2004a). Diet induced thermogenesis. Nutr Metab (Lond), 1(1), 5.
doi:10.1186/1743-7075-1-5
Westerterp, K. R. (2013). Physical activity and physical activity induced energy expenditure
in humans: measurement, determinants, and effects. Front Physiol, 4, 90.
doi:10.3389/fphys.2013.00090
Westerterp, Klaas R. (2004b). Diet induced thermogenesis. Nutr Metab (Lond), 1(1), 5-5.
doi:10.1186/1743-7075-1-5
Westerterp-Plantenga, M. S., Lemmens, S. G., & Westerterp, K. R. (2012). Dietary protein -
its role in satiety, energetics, weight loss and health. Br J Nutr, 108 Suppl 2, S105-
112. doi:10.1017/s0007114512002589
Westerterp-Plantenga, M. S., Nieuwenhuizen, A., Tome, D., Soenen, S., & Westerterp, K. R.
(2009). Dietary protein, weight loss, and weight maintenance. Annu Rev Nutr, 29, 21-
41. doi:10.1146/annurev-nutr-080508-141056
Westerterp-Plantenga, M. S., Rolland, V., Wilson, S. A., & Westerterp, K. R. (1999). Satiety
related to 24 h diet-induced thermogenesis during high protein/carbohydrate vs high
fat diets measured in a respiration chamber. Eur J Clin Nutr, 53(6), 495-502.
Westman, E. C., Yancy, W. S., Edman, J. S., Tomlin, K. F., & Perkins, C. E. (2002). Effect
of 6-month adherence to a very low carbohydrate diet program. Am J Med, 113(1),
30-36. doi:10.1016/s0002-9343(02)01129-4
129
Weststrate, J. A. (1993). Resting metabolic rate and diet-induced thermogenesis: a
methodological reappraisal. Am J Clin Nutr, 58(5), 592-601.
doi:10.1093/ajcn/58.5.592
Weststrate, J. A., Van der Kooy, K., Deurenberg, P., & Hautvast, J. G. (1990). The effect of
psychological stress on diet-induced thermogenesis and resting metabolic rate. Eur J
Clin Nutr, 44(4), 269-275.
Whatmore, A. J., Hall, C. M., Jones, J., Westwood, M., & Clayton, P. E. (2003). Ghrelin
concentrations in healthy children and adolescents. Clin Endocrinol (Oxf), 59(5), 649-
654.
WHO. (2019). World Health Organization. (2019, August 21). Childhood overweight and
obesity. Retrieved from: https://www.who.int/dietphysicalactivity/childhood/en/.
Woods, S. C., Schwartz, M. W., Baskin, D. G., & Seeley, R. J. (2000). Food intake and the
regulation of body weight. Annu Rev Psychol, 51, 255-277.
doi:10.1146/annurev.psych.51.1.255
Yancy, W. S., Jr., Olsen, M. K., Guyton, J. R., Bakst, R. P., & Westman, E. C. (2004). A
low-carbohydrate, ketogenic diet versus a low-fat diet to treat obesity and
hyperlipidemia: a randomized, controlled trial. Ann Intern Med, 140(10), 769-777.
Yang, J., Brown, M. S., Liang, G., Grishin, N. V., & Goldstein, J. L. (2008). Identification of
the acyltransferase that octanoylates ghrelin, an appetite-stimulating peptide hormone.
Cell, 132(3), 387-396. doi:10.1016/j.cell.2008.01.017
Zhang, L., Chen, C., Zhou, N., Fu, Y., & Cheng, X. (2019). Circulating asprosin
concentrations are increased in type 2 diabetes mellitus and independently associated
with fasting glucose and triglyceride. Clin Chim Acta, 489, 183-188.
doi:10.1016/j.cca.2017.10.034
Zhou, J., Martin, R. J., Raggio, A. M., Shen, L., McCutcheon, K., & Keenan, M. J. (2015).
The importance of GLP-1 and PYY in resistant starch's effect on body fat in mice.
Mol Nutr Food Res, 59(5), 1000-1003. doi:10.1002/mnfr.201400904
Zurlo, F., Lillioja, S., Esposito-Del Puente, A., Nyomba, B. L., Raz, I., Saad, M. F., . . .
Ravussin, E. (1990). Low ratio of fat to carbohydrate oxidation as predictor of weight
gain: study of 24-h RQ. Am J Physiol, 259(5 Pt 1), E650-657.
doi:10.1152/ajpendo.1990.259.5.E650
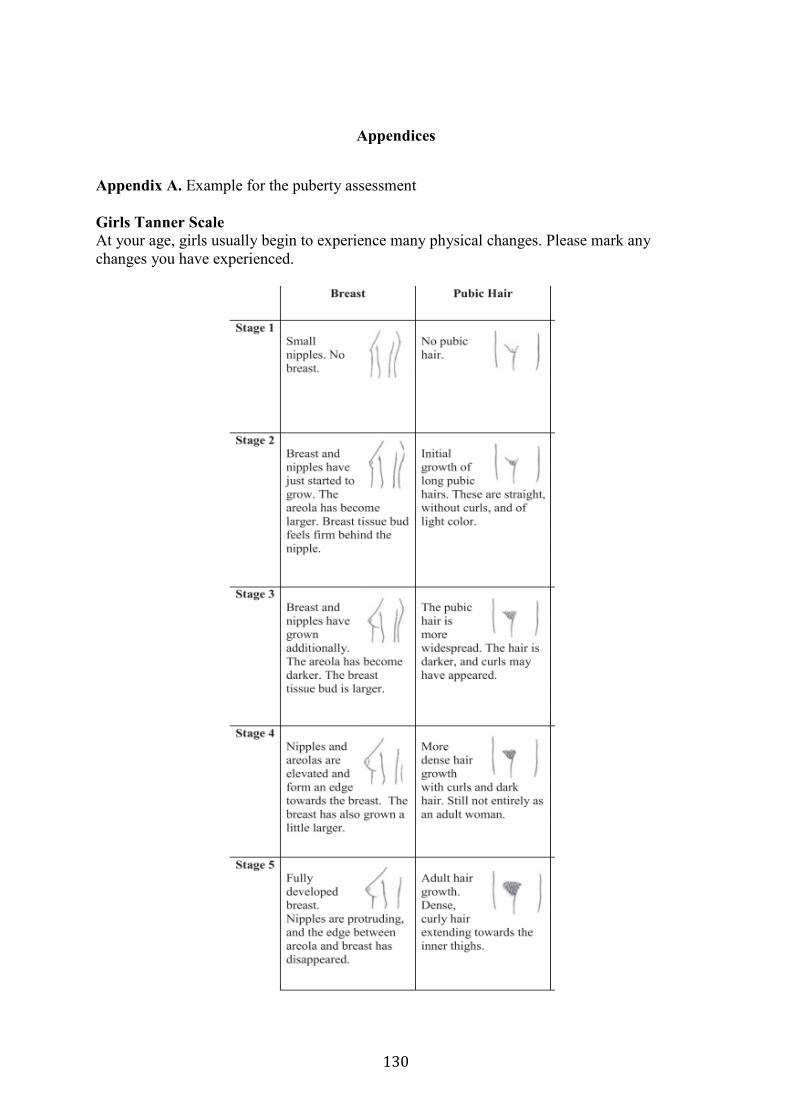
130
Appendices
Appendix A. Example for the puberty assessment
Girls Tanner Scale
At your age, girls usually begin to experience many physical changes. Please mark any
changes you have experienced.
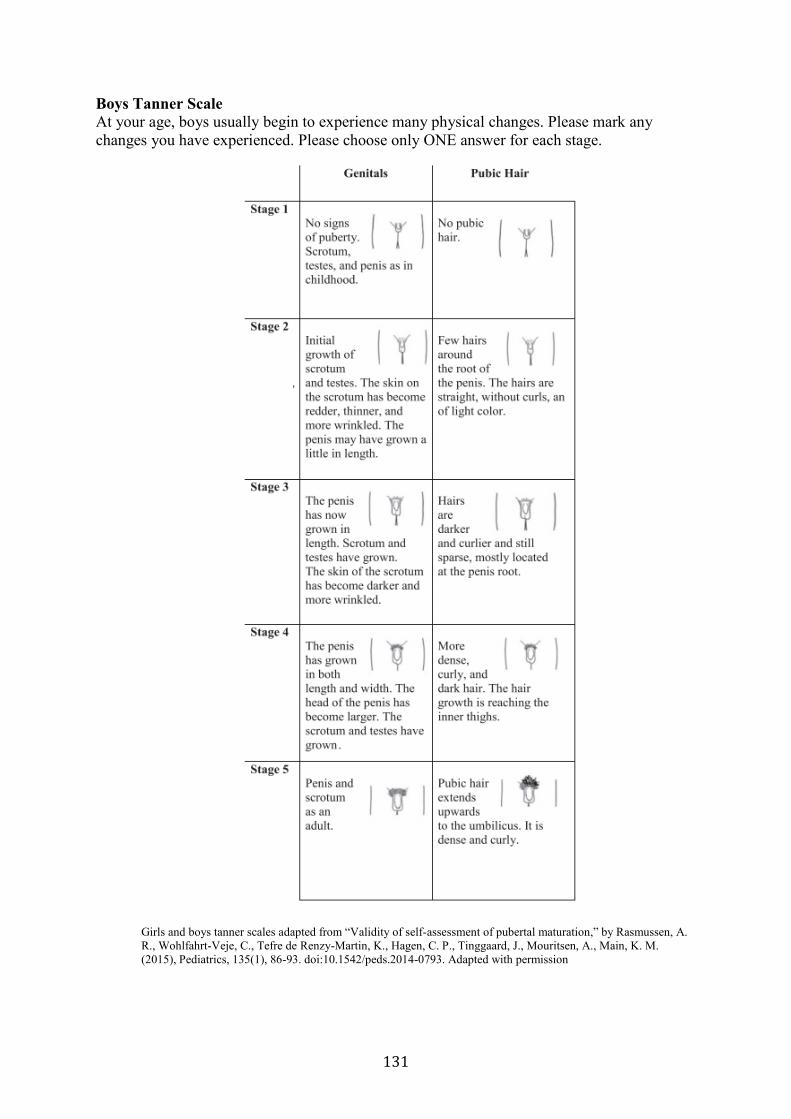
131
Boys Tanner Scale
At your age, boys usually begin to experience many physical changes. Please mark any
changes you have experienced. Please choose only ONE answer for each stage.
Girls and boys tanner scales adapted from “Validity of self-assessment of pubertal maturation,” by Rasmussen, A.
R., Wohlfahrt-Veje, C., Tefre de Renzy-Martin, K., Hagen, C. P., Tinggaard, J., Mouritsen, A., Main, K. M.
(2015), Pediatrics, 135(1), 86-93. doi:10.1542/peds.2014-0793. Adapted with permission

132
Appendix B. Meals menu: example for the test meal
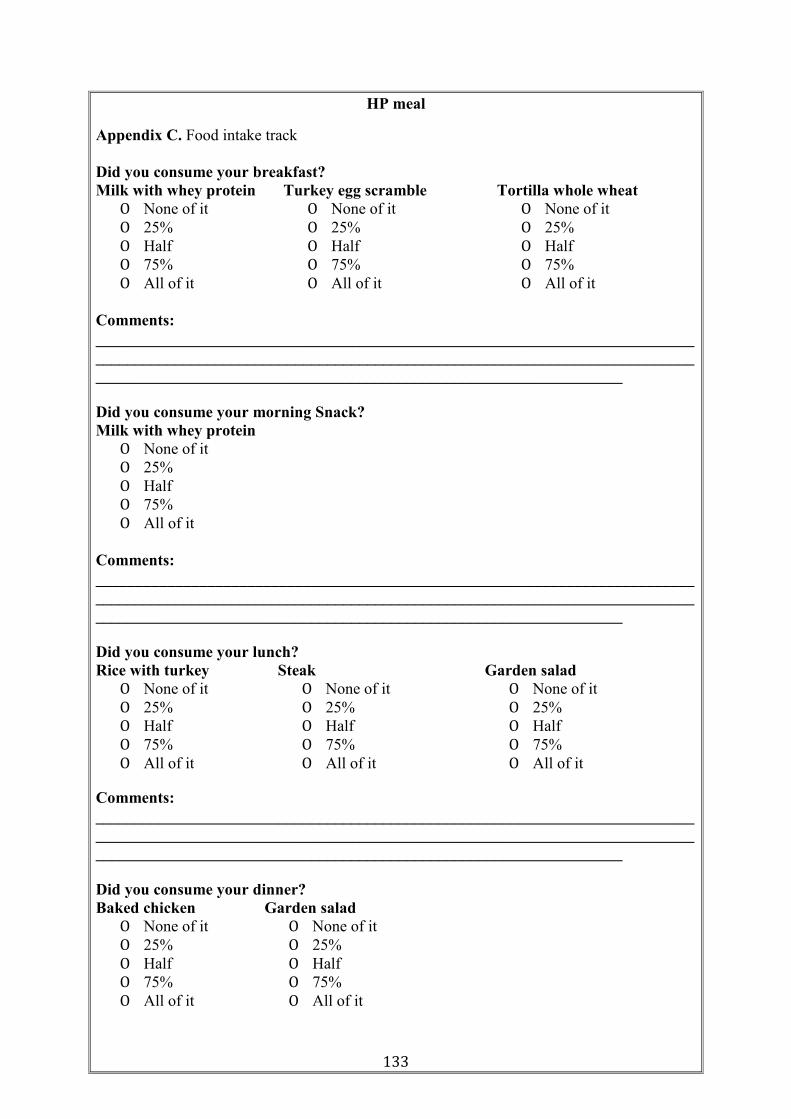
133
HP meal
Appendix C. Food intake track
Did you consume your breakfast?
Milk with whey protein Turkey egg scramble Tortilla whole wheat
O None of it O None of it O None of it
O 25% O 25% O 25%
O Half O Half O Half
O 75% O 75% O 75%
O All of it O All of it O All of it
Comments:
___________________________________________________________________________
___________________________________________________________________________
__________________________________________________________________
Did you consume your morning Snack?
Milk with whey protein
O None of it
O 25%
O Half
O 75%
O All of it
Comments:
___________________________________________________________________________
___________________________________________________________________________
__________________________________________________________________
Did you consume your lunch?
Rice with turkey Steak Garden salad
O None of it O None of it O None of it
O 25% O 25% O 25%
O Half O Half O Half
O 75% O 75% O 75%
O All of it O All of it O All of it
Comments:
___________________________________________________________________________
___________________________________________________________________________
__________________________________________________________________
Did you consume your dinner?
Baked chicken Garden salad
O None of it O None of it
O 25% O 25%
O Half O Half
O 75% O 75%
O All of it O All of it
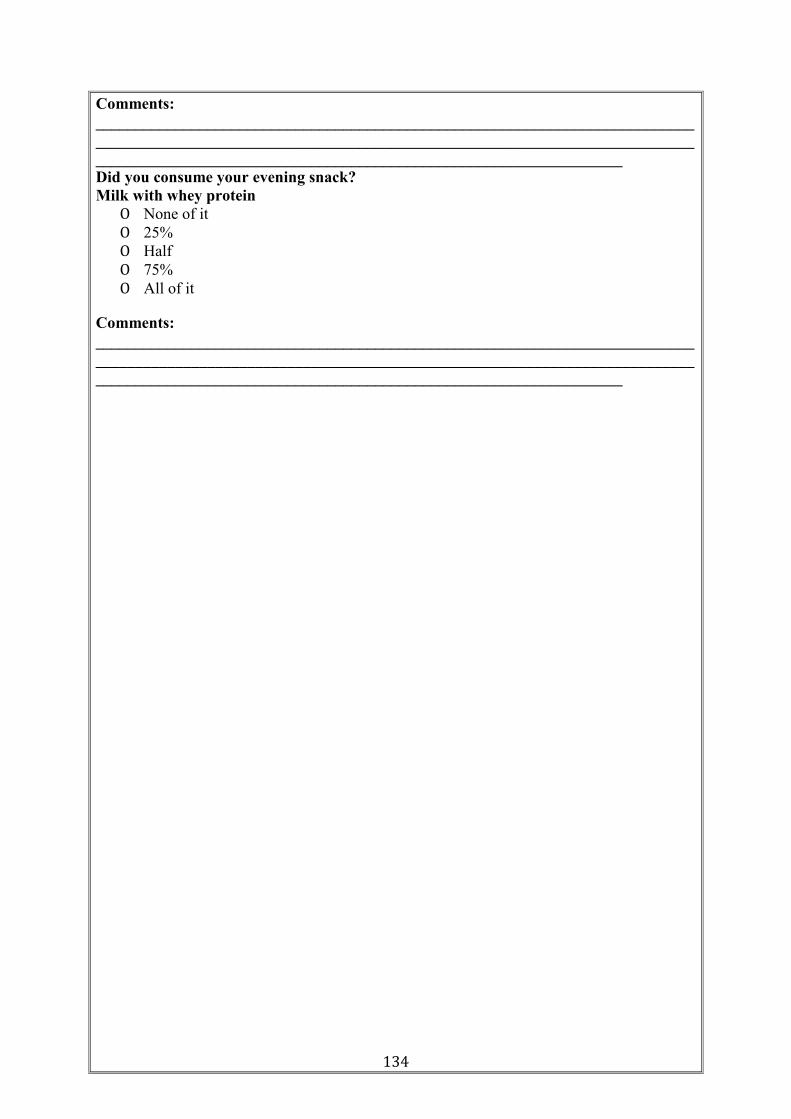
134
Comments:
___________________________________________________________________________
___________________________________________________________________________
__________________________________________________________________
Did you consume your evening snack?
Milk with whey protein
O None of it
O 25%
O Half
O 75%
O All of it
Comments:
___________________________________________________________________________
___________________________________________________________________________
__________________________________________________________________
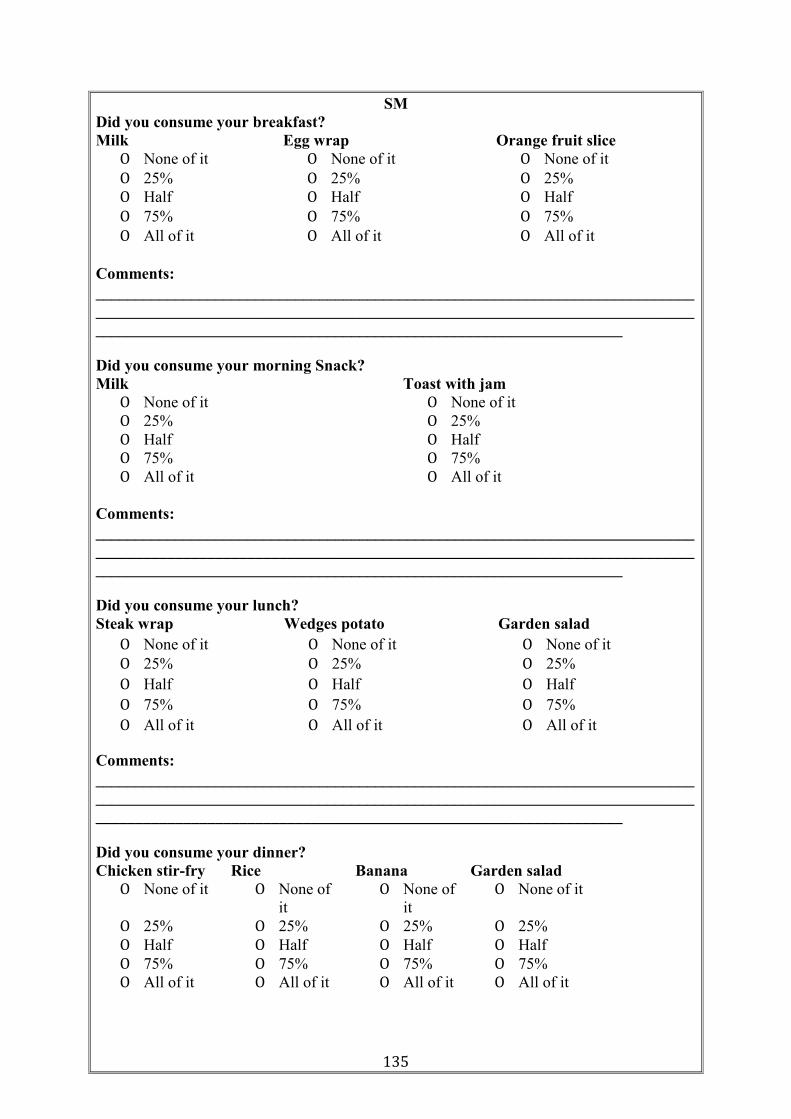
135
SM
Did you consume your breakfast?
Milk Egg wrap Orange fruit slice
O None of it O None of it O None of it
O 25% O 25% O 25%
O Half O Half O Half
O 75% O 75% O 75%
O All of it O All of it O All of it
Comments:
___________________________________________________________________________
___________________________________________________________________________
__________________________________________________________________
Did you consume your morning Snack?
Milk Toast with jam
O None of it O None of it
O 25% O 25%
O Half O Half
O 75% O 75%
O All of it O All of it
Comments:
___________________________________________________________________________
___________________________________________________________________________
__________________________________________________________________
Did you consume your lunch?
Steak wrap Wedges potato Garden salad
O None of it O None of it O None of it
O 25% O 25% O 25%
O Half O Half O Half
O 75% O 75% O 75%
O All of it O All of it O All of it
Comments:
___________________________________________________________________________
___________________________________________________________________________
__________________________________________________________________
Did you consume your dinner?
Chicken stir-fry Rice Banana Garden salad
O None of it O None of
it
O None of
it
O None of it
O 25% O 25% O 25% O 25%
O Half O Half O Half O Half
O 75% O 75% O 75% O 75%
O All of it O All of it O All of it O All of it
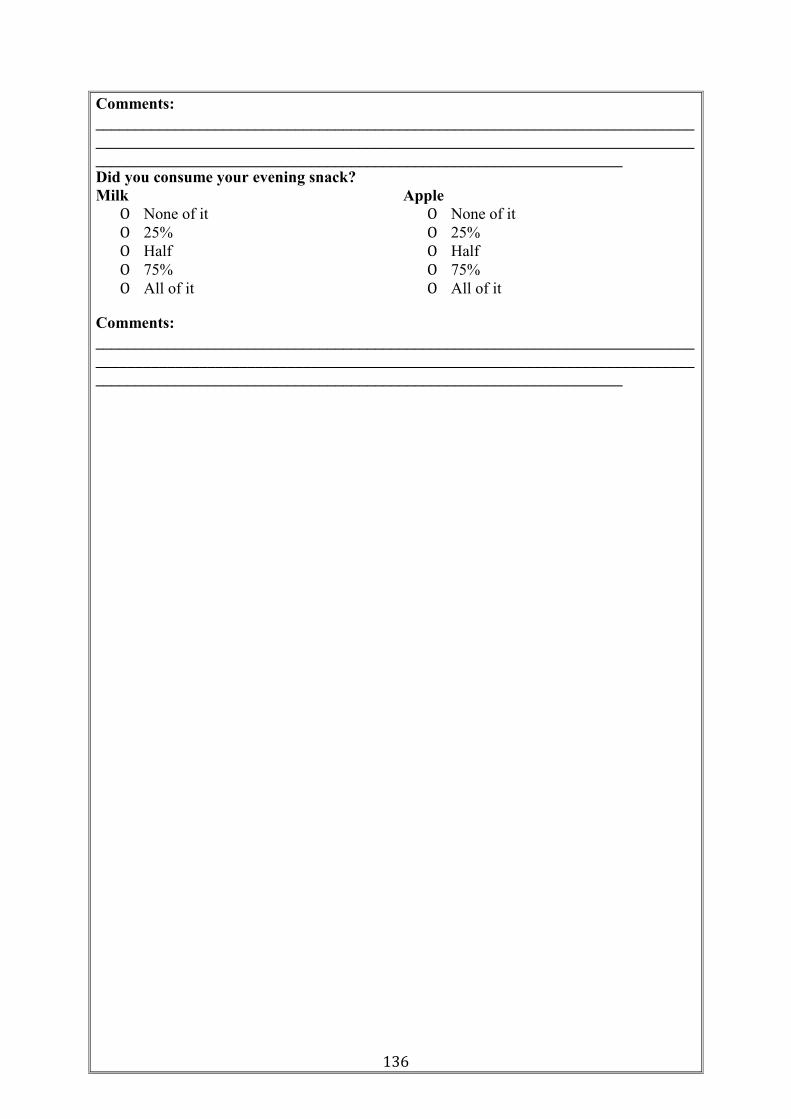
136
Comments:
___________________________________________________________________________
___________________________________________________________________________
__________________________________________________________________
Did you consume your evening snack?
Milk Apple
O None of it O None of it
O 25% O 25%
O Half O Half
O 75% O 75%
O All of it O All of it
Comments:
___________________________________________________________________________
___________________________________________________________________________
__________________________________________________________________
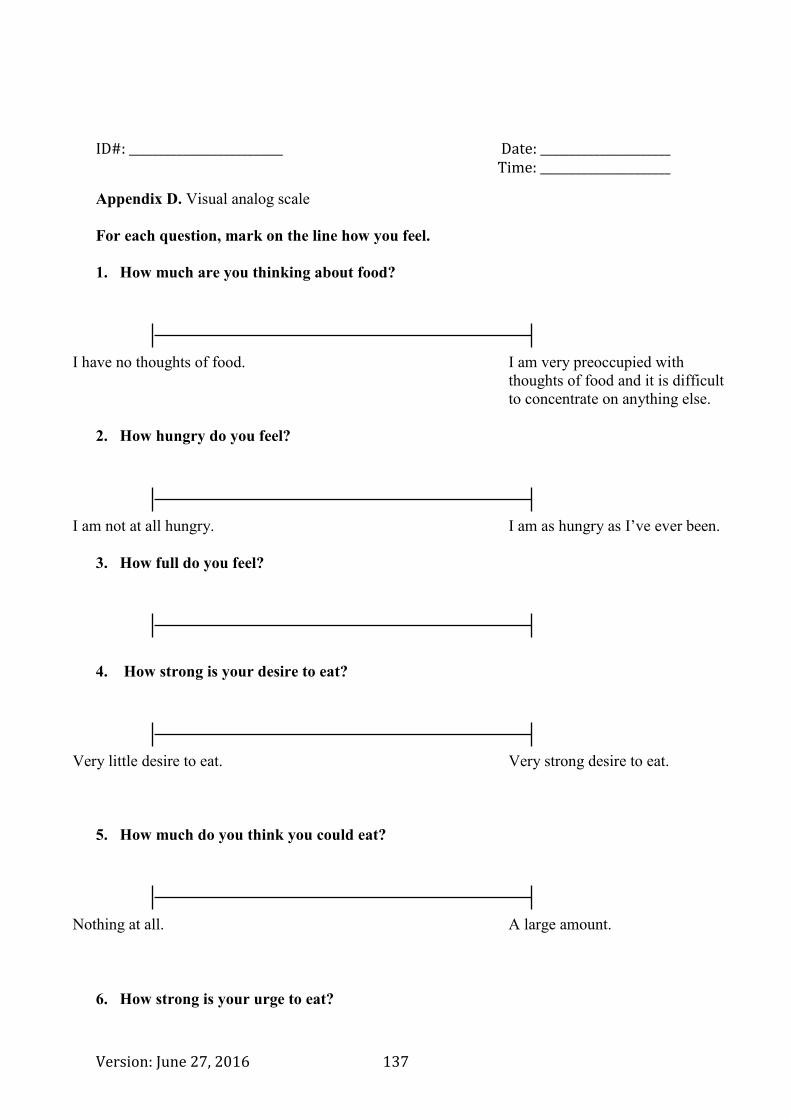
ID#: __________________________ Date: ______________________ Time: ______________________
Version: June 27, 2016 137
Appendix D. Visual analog scale
For each question, mark on the line how you feel.
1. How much are you thinking about food?
I have no thoughts of food.
I am very preoccupied with
thoughts of food and it is difficult
to concentrate on anything else.
2. How hungry do you feel?
I am not at all hungry.
I am as hungry as I’ve ever been.
3. How full do you feel?
4. How strong is your desire to eat?
Very little desire to eat.
Very strong desire to eat.
5. How much do you think you could eat?
Nothing at all. A large amount.
6. How strong is your urge to eat?
ID#: __________________________ Date: ______________________ Time: ______________________
Version: June 27, 2016 138
No urge to eat. Very strong urge to eat.